forensic analysis'. in: encyclopedia of polymer science...
TRANSCRIPT

54 FLAME RETARDANCY Vol. 10
FORENSIC ANALYSIS
Introduction
Sir Arthur Conan Doyle is believed by many to have first popularized the appli-cation of forensic analysis through his newspaper serials originally published in1887 featuring the fictional character Sherlock Holmes. This work is thought tohave inspired many of the early forensic scientists. One of these was FrenchmanEdmond Locard, who proposed that when two objects come into contact with oneanother, a cross-transfer of evidence occurs (1,2). This is the basis of Locard’s Ex-change Principle and is the foundation of how we can often use physical evidenceto link or at least associate a suspect to a crime scene or a victim. Depending onthe nature of the evidence, a wide range of analytical methods are used in forensiccasework.
A broad definition of the term forensic, according to Webster’s New WorldDictionary, is “suitable for a law court or public debate.” With the applicationof forensic science, one must demonstrate in court that the evidence analyzedhas relevance to the case in question. The significance of evidence related to acase is often determined by whether the physical evidence has individual or classcharacteristic properties. Individual characteristics are properties of evidence thatcan be attributed to a common source with an extremely high degree of certainty.Class characteristics are properties of evidence that can only be associated witha group and never with a single source. (3)
Fingerprint and DNA evidence are accepted as having individual charac-teristics. Fibers or copy toners, however, are identified by their class character-istics, and because of the large production of these materials, they cannot be
Encyclopedia of Polymer Science and Technology. Copyright John Wiley & Sons, Inc. All rights reserved.

Vol. 10 FORENSIC ANALYSIS 55
individualized. The strength of fiber evidence depends on the likelihood of thosetype fibers being randomly found on the suspect. Common fibers such as blue orwhite cotton from jeans or shirts, respectively, have little evidential value. But,blue Nylon 6,6 fibers with an unusual cross section would have more significantvalue because there are fewer in existence. Forensic scientists have thoroughlydeveloped statistical values for DNA and fingerprint data to demonstrate indi-vidual characteristics. Statistics are more difficult to apply to class evidence, butapproaches to apply them are being investigated. The information obtained dur-ing polymer analysis is usually characteristic of classes of materials, but in someinstances the identification of specific components and physical properties demon-strates an uncommon characteristic. If a contaminant found on an evidential mate-rial is identified as a rare substance specific to the crime scene, the evidence woulddemonstrate a high likelihood of originating from the crime scene. Therefore,forensic polymer analysis is used to identify chemical and physical properties thatcontribute in varying degrees to the evidential value in criminal forensic analysis.
Forensic science is a hybrid, applied science encompassing any of the natu-ral, engineering, or medical sciences that may be used in analysis for the admin-istration of criminal or civil justice. Criminalistics is a branch of forensic science.Although variously defined, it is generally thought of as utilizing the physical sci-ences, especially chemistry, physics, and biology to characterize, identify, compare,and individualize items of physical evidence. The forensic scientist may be a full-time employee of a municipal, state, federal, or private laboratory, or a specialistfrom an academic or industrial laboratory, who is called upon to conduct forensicexaminations and provide expert testimony in courts of law.
A forensic scientist must not only possess expertise in an area of specializa-tion, but must also be able to communicate with clarity, because of the importanceof conveying accurate scientific results and their interpretation to the court. Theforensic scientist, whose qualifications have been accepted by the court, is giventhe status of expert. This status allows the scientist/witness to offer opinions onthe basis of reasonable scientific certainty—an option not allowed by lay witnesses.Because a person’s property, reputation, and, very often, life may be at stake in atrial, a special burden of responsibility is placed on the scientist who testifies asan expert.
Polymers as Evidence
This article is concerned principally with the utilization of polymers as items oftrace evidence. The small size of samples usually available makes their examina-tion nonroutine. Methods such as tensile testing, fractography, and burning arerarely conducted on a microscale in forensic investigations. A significant part ofthe forensic examination of polymeric substances is concerned with factors otherthan those derived from the polymer itself. Criminalistics is distinguished fromthe other sciences by its unique attempt to individualize as opposed to most nat-ural sciences, where the emphasis is on generalization and the establishment oflaws that can be universally applied.
It has only recently become possible to identify microscopic polymer samplesby spectroscopic and other instrumental methods. Even with this advantage, and

56 FORENSIC ANALYSIS Vol. 10
in spite of the many possible modifications in polymer composition, it is the tracecomponents that serve to individualize these substances and distinguish themfrom their close relatives. The identification of low concentration additives makespolymer materials more specific, and therefore more evidentially important. How-ever, when trace elements, resulting as random constituents of polymer startingmaterials and fillers, are identified and quantified, they can render the sampleas unique. When crime scene material in question and a known material in thepossession of a suspect are analytically identical to these random trace elements,a strong link is realized. This is an area that has not been significantly exploredand is open to extensive research.
It is not only important to analyze the composition of a polymer, but to look forand identify subtle post-manufacturing changes that may have occurred. Changesresulting from mechanical or environmental effects can make a sample uniquelyidentifiable to its source.
Polymers are of interest to the forensic scientist for one or the followingreasons:
Trace Evidence. Polymers may be crushed to powder, melted, left behind orcarried away, burned, or broken. Particles—usually microscopic—of fibers,paint chips or smears, and rubber or plastic particles may be transferred tothe clothing or environment of a suspect or victim. Evidence may also be inthe form of soluble or dispersable polymers, such as gums, resins, adhesives,asphalts, etc.
Failures. Polymeric materials, like others, fail. Such failures are often studiedas a result of civil liability litigation; however, they occasionally bear im-portance in criminal cases. Examples include the failure of a suture in anoperation, peeling paint from a bridge or building, or failure of plastic partsin a prosthetic implant.
Burned Polymers. Most cases of this type are civil, but on occasion may arisein a criminal investigation. Examples include the flammability of variousfabrics or plastics and their suitability for a particular use, determinationof the quantity and identity of toxic gases that may have been given off bypolymer products in a fire, and the determination of the fiber composition ofa fabric after a fire.
Evidence Collection
Successful forensic trace evidence analysis is characterized by the ability to locate,collect, manipulate, identify, and compare microscopic particles. However, samplepoverty is common in legal investigations. The sample size is frequently limited,and oftentimes only a portion of the sample can be used, pending the need foradditional analysis. This places a further burden on the analyst, techniques, orinstruments used. Accordingly, microscopy is the first choice for most forensicexaminations.
Once particles of interest are located, they must be isolated for further studyand analysis. This may be accomplished by handpicking with fine, pointed forceps

Vol. 10 FORENSIC ANALYSIS 57
or sharpened tungsten needles while observing through a stereomicroscope. Insome cases, the evidence may be collected with sticky, transparent tape. Thiscollection method is not recommended for paint or lacquer particles because ofthe inevitable mixing of the polymeric evidence and adhesive. In other cases,vacuuming, washing, or scraping with a spatula are useful techniques. Criteriafor choosing the proper collection method are given in the literature (4–6).
It is rare that an item of trace evidence can be completely examined in situ.Since the original location of the specimen is changed and at least a portion of thespecimen is frequently altered in testing, photography at each step of the exami-nation is recommended, and often required, particularly in civil cases. Equipmentshould be available for ordinary studio photography, macrophotography, and pho-tomicrography. The recent widespread use of digital cameras has made recordingimages almost routine. These permanent records not only serve to document thecourse of the investigation, but also help to explain the examination to a jury inthe courtroom or to enhance written reports. The value of such exhibits to helpthe court understand the process cannot be overemphasized. For example, a com-parison color photomicrograph of polished cross sections of known and questionedmultiple layered paint flakes from a hit-and-run accident offers the jury a visualpresentation that is easier to understand than a statement that the paint chipshave the same layer structure. Photographs showing the colors of the coat layers,especially a repainted vehicle, can show a vivid match of two compared paints.
Alphabetical/numerical designations are used to label evidence exhibits ofknown and suspect samples for comparison. In the example cited above, the ques-tioned paint chips recovered from the victims clothing could be labeled “Q-1,” andthe street where the accident took place labeled “Q-2.” Paint samples from thesuspect vehicle would have a known origin and be designated with K-numbers,eg, K-1 “Paint from damage to the driver’s side fender.” This provided systematicreferences that are easily understood.
Analysis
In most cases, the analytical methods of the forensic chemist are different fromthose of the usual analytical, quality control, or materials chemists. The most im-portant tests are usually those that lead to identification of the substances underexamination. Tests, such as those found in compilations of standard methods ofanalysis, are rarely of use in the criminalistics laboratory, because they generallyrequire more sample than is available and are usually intended to measure somequantitative aspect of a material. For forensic purposes, initially, a qualitativeidentification is more important than a quantitative determination. Before theanalyst can compare or attempt to individualize a trace sample, it is essentialthat it be identified. Comparisons performed on traces that have not been accu-rately identified represent a fault in principle and may come back to haunt thescientist during cross-examination.
Microscopical methods are most commonly employed, because they allowthe examination of minute specimens and are usually nondestructive. Table 1describes many of the microscopes and instruments useful for the examinationof polymer microtraces. Other equipment less frequently used, because larger

58 FORENSIC ANALYSIS Vol. 10
Table 1. Methods for Examining Minute Specimens
Methods Uses Refs.
MicroscopicalStereo binocular
May be equipped for reflected andtransmitted light; a boom standis a useful accessory for studyingbulk objects, clothing, etc
Upright image and long-workingdistance are excellent for particlemanipulation and preliminaryexamination
7
ComparisonTwo microscopes joined by an
optical bridge so that imagesfrom both microscopes can beseen on either side of a finedividing line in the same field ofview
Comparison of hairs and fibers, paintchips, layer structure; physicalmatches
8,9
Polarizing (PLM)Standard petrographic microscope;
the addition of tiltingcompensators and a hot stageare useful for the study ofsynthetic fibers
Essential for the identification ofvegetable and synthetic fibers
10–12
Phase contrast and interferencecontrast
Qualitative systems allow imageenhancement; qualitativeinterference systems permit the mostaccurate measurement of refractiveindexes of synthetic fibers for patentwork
12,13
Fluorescence Autofluorescence can distinguishcertain plastics and various layers ofwhite house paints; opticalbrighteners can be detected on singlefibers; fluorochromes can be used todetect substance such as polymercoatings on fibers
14
Scanning electron microscope (SEM)Useful alone but enhanced by
energy dispersive X-ray analyzer(EDS) system
Of exceptional use in the study offractures and failure of fibers; theelemental-analysis capability assistsin identifying polymers containingcharacteristic elements, egg, silicone(Si), and neoprene (Cl)
15
Analytical electron microscopy(AEM)Transmission (TEM) and scanning
transmission electron microscopy(STEM) coupled with elementalanalysis and electron diffraction
Identification of phases in polymers,location of copolymers in blends, andidentification of inorganic pigmentsand fillers
16

Vol. 10 FORENSIC ANALYSIS 59
Table 1. (Continued)
Methods Uses Refs.
Micro-Fourier transform infraredspectroscopy (FT-IR)The addition of a microscope to an
FT-IR, especially when coupledto a mecury cadmium telluried(MCT) detector, allows thecollection of ir spectra onparticles down to ∼10 µm in size
The single most useful instrument foridentifying microtraces of polymersof all types
17–20
Micro-Raman spectroscopy Identification of polymers and pigments 21–23Ultraviolet, visible, and fluorescence
microspectrophotometry (MSP)Comparison of questioned and known
materials, especially fibers andpaints, by their spectralcharacteristics
24
Electron microprobe analyzerA more dedicated elemental
analyzer than the SEM,although the distinction betweenelectron microprobes and SEMhas lessened with time
Quantitative analysis of element insmall particles; detects elements oflow atomic number
25
Surface analyticalSecondary ion mass spectrometry
(SIMS)Provides elemental and chemical
analysis of surfaces; can reveal thinlayers of corrosion of deposition
26
Auger spectroscopyElectron spectroscopy for chemical
analysis (ESCA)SeparationPyrolysis gas chromatography
(Py-GC)Sensitive separation of components of
polymer mixtures and blends;identification by mass spectra
27–29
Pyrolysis gas chromatography/massspectrometry (Py-GC/MS)
Thin-layer chromatographyHigh performance liquid
chromatography (HPLC)
samples are required, include those used to perform other tests such as Instrontesters, thermal analysis instruments (differential thermal analysis, differentialscanning calorimetry, thermogravimetric analysis) and apparatiuses for deter-mining molecular weights, such as size exclusion chromatography. Micromodifi-cations of some of these instruments and techniques have been described and mayhave occasional significance in forensic investigations (30,31).
Separation methods such as thin layer chromatography (TLC) and pyrolysis-gas chromatography (Py-GC) are useful for comparison of questioned and knownspecimens when there is sufficient material and the destruction of the specimensis not an issue. In order to identify polymers and certain additives, numeroustrace evidence examiners have established libraries of known Py-GC. Commercial

60 FORENSIC ANALYSIS Vol. 10
libraries of Py-GC chromatograms have not successfully been established, becauseanalysts have difficulty on agreeing to standard GC conditions. Pyrolysis-gaschromatography/mass spectrometry (Py-GC/MS) can be used successfully to iden-tify materials with commercial mass spectrometry libraries.
The nature of the specimen and the question that has been raised about itdetermine the course of action and the avenue of the analysis. After considerationof all known facts, and after nondestructive observations are completed, a partic-ular test is selected in an attempt to answer a specific question. The results of thistest determine the next step chosen. Some of the methods that may be employedfor specific groups of polymers are discussed in the following sections. Microscopicand spectroscopic methods yield a great amount of information in the least amountof time, and, subsequently, are most frequently used by forensic trace examiners.Therefore, microscopy and spectroscopy are discussed in the greatest depth.
Microscopy. Visual light microscopes come in several optical configura-tions that are used for specific purposes. Low magnification stereomicroscopes(SMs) are of particular value in searching large areas for items of question andthen separating them as potential evidence. The areas could include portions ofgarments to scan for foreign debris. Pill boxes of garment scrapings are scannedwith SMs to seek potential fibers for comparisons. In addition, they are usedfor manipulation of the items that have been isolated to preparae toward moredetailed microscopical or instrumental analysis. SMs are required in virtuallyany laboratory that examines micro-traces regardless of what other microscopesor instruments are employed.
The most useful microscope in the hands of a trained microscopist is thepolarizing light microscope (PLM). Although considerable training and experienceare necessary to fully utilize the capabilities of this microscope, a relatively shortperiod of training can give a chemist the necessary skills to use the microscope toidentify both natural and synthetic fibers. With minimal training, one can utilizemorphological and optical properties to compare polymers regardless of their formor composition when received as items of trace evidence.
Additional microscopes include the comparison microscope that permits themicroscopist to look at two specimens side by side. This is a useful early step in thecomparison of two fibers or paint chips believed to have originated from the samesource. The items can be observed and photographed side by side, permitting de-tailed scrutiny by both the forensic scientist and the court. Other light microscopessuch as fluorescence, hot stage, phase contrast, and interference instruments maybe of value in certain investigations, as shown in Table 1.
The scanning electron microscope (SEM) has some value to the forensic studyof polymers, but it is principally the elemental information provided by an energydispersive X-ray spectrometer (EDS) attached to most SEMs that usually gives themost information in forensic analyses. Using an EDS, the elemental compositionof an isolated paint smear or fiber dye may be determined on even the smallestsamples. The SEM provides high magnification images of the surfaces of materials.It is less useful for the examination of the interior of a particle of evidence. Inthis case, microtomed cross sections and freeze fractures can be used to look atinteriors. A fairly recent and valuable application of the imaging capability of theSEM in the study of polymers is the examination of the ends of fibers to determinethe cause of failure. Cutting with various instruments, crushing, breaking, etc, can

Vol. 10 FORENSIC ANALYSIS 61
all be studied with the SEM and conclusions can be drawn by careful analysis of theimages. Care must be taken, however, since all of the fibers in a multistrand cordor rope may not show the same characteristics as the fibers that initially failed.For example, some of the strands may have been cut with a knife under tensionand the rest of the fibers (once there were too few to support the load) may havefailed under tension. Other scanning microscopes, such as atomic force microscope(AFM), and instruments have yet to find significant forensic applications (seeATOMIC FORCE MICROSCOPY).
Spectroscopy. The ability to obtain spectroscopic information from mi-croscopic samples has considerably increased the value of spectroscopy in theforensic study of microtraces. Vibrational Spectroscopy (qv) is applicable to awide range of physical evidence. Polymeric materials, such as fibers, paints, andadhesive tapes, are frequently analyzed to identify characteristic information re-garding the composition. Modern infrared and Raman spectrometers with mi-croscopes attached are capable of obtaining chemical information from even thesmallest samples. With the development of Fourier transform infrared (FT-IR)spectroscopy, the application of infrared to forensic analysis became more preva-lent because of the increased speed and sensitivity of FT-IR. The development ofdiffuse reflection (DR) accessories provides ease of sample introduction for sev-eral forensic applications. Samples with matte-finished surfaces can be directlyanalyzed with no sample preparation, thus avoiding difficult pellet preparationby grinding the sample and subsequent mixing in potassium bromide. Internal re-flectance spectroscopy (IRS), commonly referred to as attenuated total reflectance(ATR), has become widely used with a variety of recently developed accessories.Sample areas of less than one millimeter in diameter can be analyzed using single-reflection bench compartment accessories and diameters on the order of 10 µmcan be analyzed with microscope attachments. Raman spectroscopy requires evenless sample preparation than FT-IR, and artist’s pigments are being identifiedtoday by their Raman spectra obtained directly from a painting without removalof sample material (32).
Applications, General Polymers
Because polymers are so common and vary so widely in composition, they arefrequently found at crime scenes and subsequently play an evidentiary role incriminal cases. Polymeric materials, such as fibers, paints, and adhesive tapes, arefrequently analyzed to identify characteristic information regarding their compo-sition. Physical and chemical information on these materials is increasingly beingstored in computer databases to help determine the manufacturer or supplier, orsimply to discriminate between many similar samples of material. Some of theavailable databases will be described as a part of the analyses mentioned in thefollowing pages. Other general polymeric materials found as evidence do not fallinto a particular category and must be studied on a case-by-case basis without theaid of comparison to similar material in a database.
The following is a case example where a polymeric material became impor-tant evidence. Early one morning on a luxury cruise ship off the coast of California,a man reported to the captain that his wife had been blown overboard. Considering

62 FORENSIC ANALYSIS Vol. 10
the minimal wind conditions, the captain became suspicious and alerted the lawenforcement authorities. Several hours after the overboard report, the woman’sbody was recovered by the U.S. Coast Guard. The clothing that both the man andwoman were wearing at the time of the incident was forwarded to the FBI Lab-oratory. The woman’s running pants appeared soiled with an orange substanceon both legs. Careful examination of her pants with a stereomicroscope revealedorange colored, rubbery particles. Examination of the man’s running pants alsorevealed rubbery particles that appeared identical. On the ship’s deck, at the lo-cation of the overboard incident, there was an orange colored, rubberized runningtrack. A portion of the track material was removed from the ship and forwardedto the laboratory for analysis. The particles were removed from both pairs of run-ning pants and flattened in a compression cell to make them sufficiently thin toperform transmission analysis using an FT-IR microscope system. Particles fromthe track material were prepared in the same way and the spectra of all threesamples were compared as shown in Figure 1.
The three spectra of the rubberized material compared closely. The materialwas heavily filled with calcite (hexagonal CaCO3), identified by the intense, broadC O asymmetric stretch near 1450 cm− 1, and narrow out-of-plane and in-planebends near 880 and 710 cm− 1, respectively. To determine the force required toembed the particles in the pants, a fabric similar to that of the pants was rubbedacross the removed track piece at different degrees of pressure. The investigatorsfound that it was necessary to rub the fabric with significant pressure, such asin the case of dragging a person, to cause the transfer and embed the material inthe fabric. They determined that the transfer of particles suggested an altercation
Fig. 1. Cruise ship homicide case. Spectra of rubber particle evidence from, sweat pantsfrom both (A) victim and (B) the suspect, (C) running track and (D) calcite reference.

Vol. 10 FORENSIC ANALYSIS 63
between the individuals, and, therefore, this evidence was heavily weighed and re-sulted in a homicide conviction. The combined comparison of evidential materialsby microscopical examination, infrared analysis, and physical testing played asignificant role in this case without witnesses.
Particles of plastic or rubber are often recovered from crime scenes or fromvictim’s and suspect’s clothing. Occasionally, these have forensic significance andmust be identified and compared as described above. Rubber particles mountedon a microscope slide are recognizable because they can be compressed whenpressure is applied to the coverslip with a needle, and recover fully when thepressure is released. Plastics are more easily recognized by an experienced eyeby ruling out other types of particles. Particles of plastic are readily identifiedtoday by FT-IR analysis.
Plastics may provide evidence in determining passenger location with ve-hicles in serious accidents when questions arise as to who was driving when theaccident occurred. This question is often answered by examination of hairs embed-ded in the dashboard, sun visor, etc. It has been shown that many thermoplasticscan melt and transfer to clothing in the high energy environment that momentar-ily exists during a high impact collision. Molten plastic from clothing (eg, nylonjackets, cotton polyester shirts) can be collected from dashboards, airbags, andwindow pillars and identified. Colored polymers may sometimes be compared bylight microscopy alone, but any comparison of unknown polymers should alwaysbe confirmed by FT-IR spectroscopy.
Fiber Applications
In cases of sexual assault and homicide, the transfer of single fibers often haveimportant forensic significance. The case that most significantly impacted the real-ization of the importance of fiber evidence was the Atlanta murders that occurredbetween 1979 and 1981 (33,34). The bodies of 28 boys and young men were foundunder similar conditions. Although many of the bodies contained fiber and hairevidence that compared closely, Wayne Williams was prosecuted and convicted foronly two of the homicides. The conviction was based solely on multiple transferredhairs and fibers with an emphasis on uncommon carpet fiber found in the bedroomof Williams’s home.
In the forensic study of fibers, five questions are commonly asked:
(1) What is the polymeric composition of the fiber?(2) Could the questioned fiber have the same source as the known?(3) How was the fiber broken?(4) Who manufactured the fiber or fabric?(5) What is the commonality of the fiber?
The first question can almost always be answered by PLM, and often morespecifically by FT-IR microspectroscopy, regardless of how little fiber is available.The other four may often be more difficult.

64 FORENSIC ANALYSIS Vol. 10
In fiber examinations, the analyst receives evidence fibers from a knownsource and fibers from a suspect source that must be compared to decide whetheror not the questioned and known fibers could have a common origin. As part ofthis comparison, the fibers must be classified according to their generic type. Theforemost method of analysis for this type of evidence is light microscopy; however,IR is often valuable to further specify fiber type. Fibers from the clothing of the vic-tim and suspect are screened microscopically for similarity by closely comparingphysical and optical properties of the fibers. Laboratories that collect fibrous evi-dence on clear tape now have the option of using fiber finders that automaticallysearch for target fibers, which saves considerable time in complex cases involvingmany exhibits. The useful properties may vary significantly because of the color,shape, texture, and chemistry of the fibers. Polarized light microscopy is usedto determine the generic classification (eg, nylon, polyester, acrylic) and FT-IRmicrospectroscopy plays an important role in identifying subclasses of syntheticand regenerated fibers. A spectral library of 83 polymeric fiber types, obtained bytransmission spectroscopy on flattened single fibers, was developed to aid forensicexaminers in the identification of fiber composition (35–37). IR spectroscopy isparticularly useful for subclassifying acrylic fibers that are seen frequently as awool alternative in sweaters. These fibers are readily transferred between indi-viduals during contact. According to U.S. Federal Trade Commission rules, acrylicfibers must contain at least 85% polyacrylonitrile (38). The other 15% may becopolymers and ionic end groups that enhance the dying properties of the other-wise undyeable fibers. Figure 2 shows spectra of the three most common acrylic
Fig. 2. IR spectra of acrylic copolymer fibers: (A) poly(acrylonitrile:vinyl acetate); (B)poly(acrylonitrile:methyl acrylate); and (C) poly(acrylonitrile:methyl methacrylate).

Vol. 10 FORENSIC ANALYSIS 65
copolymers. The band shape of the C O stretch, as shown in the region between1300 and 1000 cm− 1, varies as a result of its position or environment within thedifferent comonomer structures. Over 20 variations of acrylics can be identifiedby IR (39). Thus, IR is a very useful tool in providing information that furtherdiscriminates fiber types in order to enhance the evidential value of a sample.
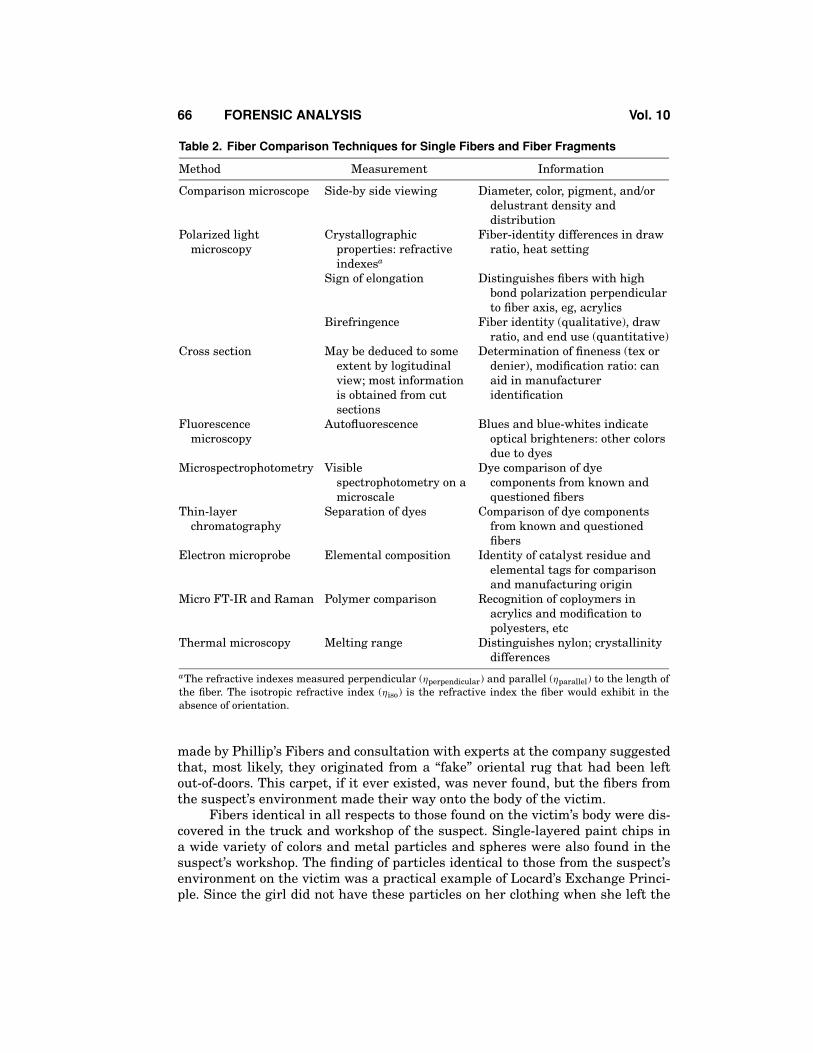
Tests designed to distinguish the fibers from each other are used to completea comparison. If the fibers cannot be distinguished at the conclusion of the tests,they are reported as nondistinguishable and it can be said that they may havea common origin. However, at best, fibers provide class-type evidence; they arenot as individual as fingerprints or body fluids. It is not the number of tests thatare performed, but the discriminating power of each test selected, as well as theindependence of each test performed from the others, that determines the com-pleteness of the examination and thus the strength of the conclusions that can bedrawn. Table 2 lists various measurements and tests that can be performed onsynthetic fibers. Most of the methods shown in Table 2 are applicable to regen-erated fibers as well as synthetics. For identification of vegetable fibers (naturalcellulose polymer), one must rely almost entirely on a detailed study of morphol-ogy for identification. Identification to the genus level of the plant from whichthe fibers originate is usually as far as a comparison can be taken. For example,having identified both known and questioned fibers as ramie (Boehmeria nivea),other tests of comparison are not possible (other than dyed or oiled cordage orrope), since the fibers consist of almost pure cellulose.
The optical and morphological properties of fibers are useful in comparisonswhen trying to determine possible end use and in manufacturer of the fiber. Theoptical properties of fibers include color (as well as pleochroism and fluorescence),refractive indices (parallel and perpendicular to the length of the fiber), birefrin-gence (the numerical difference between the two refractive indices), and sign ofelongation. The latter is determined by convention. A fiber is said to have a posi-tive sign of elongation if the higher refractive index is parallel to the length of thefiber. The possibility of determining the manufacturer of a single fiber is nearlyimpossible in most cases. However, in some cases, where the fiber possessed a verycharacteristic property and manufacturers have given assistance, it has been done.In the Atlanta murder case the manufacturer of the carpet fibers from Williams’shome was determined from the unique cross-sectional shape.
The solution of a child murder in Alaska was brought to a successful conclu-sion by a forensic examination of particles of polymeric trace evidence recoveredfrom her body, which was found lying in a secluded area, not far from her home.These included short (∼1 mm long), brittle red and blue polypropylene fibers andsingle layered particles of paint in a wide variety of colors. Iron spheres and frag-ments were also found on the victim’s clothing. The girl was freshly dressed whenshe went off to meet her friend after school. There was no source of particlessuch as these in her normal environment. A suspect developed in the case hada workshop surrounded by nonfunctioning automobiles and trucks, and he oftendid repairs on children’s bicycles.
It was possible to trace the manufacturer of the fibers by an examinationof their cross sections, which were made with difficulty, because of their brittlenature. Infrared microspectroscopy revealed that the fibers were photo-oxidized onthe basis of a significant carbonyl absorption band of ∼1730 cm− 1. The fibers were
66 FORENSIC ANALYSIS Vol. 10
Table 2. Fiber Comparison Techniques for Single Fibers and Fiber Fragments
Method Measurement Information
Comparison microscope Side-by side viewing Diameter, color, pigment, and/ordelustrant density anddistribution
Polarized lightmicroscopy
Crystallographicproperties: refractiveindexesa
Fiber-identity differences in drawratio, heat setting
Sign of elongation Distinguishes fibers with highbond polarization perpendicularto fiber axis, eg, acrylics
Birefringence Fiber identity (qualitative), drawratio, and end use (quantitative)
Cross section May be deduced to someextent by logitudinalview; most informationis obtained from cutsections
Determination of fineness (tex ordenier), modification ratio: canaid in manufactureridentification
Fluorescencemicroscopy
Autofluorescence Blues and blue-whites indicateoptical brighteners: other colorsdue to dyes
Microspectrophotometry Visiblespectrophotometry on amicroscale
Dye comparison of dyecomponents from known andquestioned fibers
Thin-layerchromatography
Separation of dyes Comparison of dye componentsfrom known and questionedfibers
Electron microprobe Elemental composition Identity of catalyst residue andelemental tags for comparisonand manufacturing origin
Micro FT-IR and Raman Polymer comparison Recognition of coploymers inacrylics and modification topolyesters, etc
Thermal microscopy Melting range Distinguishes nylon; crystallinitydifferences
aThe refractive indexes measured perpendicular (ηperpendicular) and parallel (ηparallel) to the length ofthe fiber. The isotropic refractive index (ηiso) is the refractive index the fiber would exhibit in theabsence of orientation.
made by Phillip’s Fibers and consultation with experts at the company suggestedthat, most likely, they originated from a “fake” oriental rug that had been leftout-of-doors. This carpet, if it ever existed, was never found, but the fibers fromthe suspect’s environment made their way onto the body of the victim.
Fibers identical in all respects to those found on the victim’s body were dis-covered in the truck and workshop of the suspect. Single-layered paint chips ina wide variety of colors and metal particles and spheres were also found in thesuspect’s workshop. The finding of particles identical to those from the suspect’senvironment on the victim was a practical example of Locard’s Exchange Princi-ple. Since the girl did not have these particles on her clothing when she left the

Vol. 10 FORENSIC ANALYSIS 67
house with fresh clothing and she did not move after she was murdered, the par-ticles must have been associated with the environment of the murderer. The juryconvicted the suspect of the child’s murder.
Raman spectrometry promises to complement IR analysis of textile fibers be-cause of the ease of sampling and the additional information it can provide. Lightmicroscopy analysis requires fiber samples to be mounted in a liquid medium,under coverslips, on a glass slide. Because glass absorbs strongly in the IR, thefibers must be removed and cleaned prior to IR analysis. Raman analysis, on theother hand, has been successfully performed on single fibers while mounted onglass microscope slides (21), thus omitting the need to remove the fibers fromthe slide mount. The additional sample preparation time is not required and,once mounted, the chance of fiber loss is minimal. Figure 3 illustrates the pro-cess of obtaining a Nylon 6 fiber spectrum using microscopical Raman analysis.Figure 3A includes spectral contributions from the fiber, Permount mountingmedium, and glass from the coverslip. Figure 3B shows the result of Permountsubtracted from the original spectrum. The Nylon 6 spectrum that remains afterthe glass contributions are subtracted is shown in Figure 3C. The baseline is flat-tened for the final spectrum in Figure 3D. The signal-to-noise ratio is less thanobtaining a spectrum without being mounted under a coverslip, but it is sufficientto identify the fiber by the prominent characteristic bands as labeled. The bandassignments of the major peaks are labeled in accordance with Hendra and co-workers (40). Raman spectra differ from IR spectra, because the selection rules
Fig. 3. Raman spectra of a nylon-6 fiber mounted under a coverslip on a glass microscopeslide: (A) original spectrum; (B) Permount mounting medium subtracted; and (C) baselineflattened with the major characteristic bands labeled.

68 FORENSIC ANALYSIS Vol. 10
for Raman vary from that of IR, thereby producing complementary information.The information obtained by Raman is at times more definitive in determining thepolymeric structure. Since Raman spectroscopy demonstrates spectral responsefrom dyes, the dye information can be useful. However, the dye spectral featurescan interfere with identification of the polymeric composition of fibers. To furthercharacterize the fibers, dye spectral features could provide information regardingthe dye type. Studies have been conducted using surface enhanced Raman spec-troscopy (SERS) to study dye composition using silver colloid substrates (41,42).While the spectral features are significantly enhanced by SERS, this method re-quires that the fibers are removed from the glass slides, resulting in an additionalstep and chance of fiber loss. Raman analysis has demonstrated certain advan-tages over IR, but the strengths and limitations of both are still under study todetermine where each of the methods can be used to obtain the greatest informa-tion with the most convenient analysis procedure.
Paint
Paint evidence is usually submitted to the forensic scientist for comparison withpaint from a known source. Automotive, architectural, art, marine, aircraft, tool,and other types of paints may become evidence in a variety of crime scenarios (43).Within the United States, most of these examinations involve automotive finishesas related to automotive accidents and hit-and-run cases. The question frequentlyposed is, what kind of vehicle could have contributed the paint flakes recoveredfrom the scene of a hit-and-run homicide case? Additionally, house paints may beexamined in connection with burglaries, and paint from tools in cases involvingindustrial sabotage. Rarely is it necessary to determine the manufacturer of aparticular paint.
The examination proceeds differently, depending on whether the questionedevidence is in the form of flakes or a smear. Individual spray-paint spheres areoccasionally encountered and treated in the same manner as individual particlesfrom a smear. Table 3 summarizes the comparison methods employed.
After light microscopy, IR analysis offers the most information in forensicpaint examinations. The organic binders are frequently identified by IR, and bothorganic and inorganic pigments can often be identified. Since the 1970s, scientistsfrom the Royal Canadian Mounted Police (RCMP) have been classifying automo-tive paints on the basis of chemical composition (50–52). The original analysis wasperformed with the use of high pressure diamond anvil cells in beam condenserson dispersive IR spectrometers. Since then, the RCMP and other analysts havechanged to using the less cumbersome, low pressure, compression diamond cellswith beam condensers in FT-IR systems. Inorganic pigment components in paintshave revealing spectral features at the lower wave numbers. Beam condensersare used rather than FT-IR microscopes to overcome the limited frequency rangeof liquid nitrogen cooled mercury cadmium telluride (MCT) detectors used in IRmicroscopes. For paint analysis, the extended range to near 200 cm− 1 is obtainedwith CsI optics and a standard deuterated triglycine sulfate (DTGS) detector inthe spectrometer bench.

Vol. 10 FORENSIC ANALYSIS 69
Table 3. Comparative Methods for Paint Traces
Methods Measurement Information Refs.
Color comparison Chips laid side by sideunder a stereomicroscope
Visual matching, adheringdebris, possible toautomotive-paintreference collection
Spectrophotometry Visible spectrum Nonsubjective comparison ofcolor and aid inidentifying some pigments
24,44
Cross section Layer structure Proof of similarity ordissimilarity formultilayered flakes; evenwhite house paints can bestudied by staining withrhodamine and observingwith a fluorescencemicroscope
45
Physical match Observation of fitbetween two chips ofpaint
Only positive form of paintidentification; a physicalmatch is regarded as theequivalent of a fingerprint
Polarized lightmicroscopy
Magnification, opticalproperties
Observation of properties;identification of a filler
Microchemical tests Identification ofchemical andphysical properties
Solvent tests(emperical or select)
Behavior to selected solvents
Microchemicalreaction
Identification of inorganicfillers and crystallineorganic pigments
43,46,47
X-ray diffraction Identifies crystallinephases
Identification of inorganicfillers and crystallineorganic pigments
48
Electron microprobe Elemental analysis Identification of inorganicpigments and fillers
Micro FT-IR IR spectrum Identification of polymersand copolymer comprisingvehicle; limitedidentification of pigment
19,43,49
Pyrolysis gaschromatography
Separation of pyrolysisproduct
“Fingerprint” forcomparison; some limitedchemical information onchemical type
28
Databases are maintained to search for unknown automotive paints fromhit-and-run cases. The FBI Laboratory in Quantico, Va, maintains the NationalAutomotive Paint File, which is the largest automotive paint collection in theUnited States. The largest forensic collection in the world, with over 50,000 sam-ples, is maintained at the Bundeskriminalamt Research Laboratory in Wiesbaden,

70 FORENSIC ANALYSIS Vol. 10
Germany. Scientists at the RCMP have developed a software package called PDQ,ie, Paint Data Query (53). This database uses microscopic and IR spectroscopicanalysis results to search for automotive information leading to the identity ofmake, model, and year of vehicles in question, typically from hit-and-run cases.Through the FBI-sponsored Scientific Working Group for Materials Examination(SWGMAT), this database has expanded to include entries from North American,European, Japanese, and Australian Collections. The international cooperation offorensic scientists has served to assist in casework involving paint evidence frominternational automobiles that have a global market. This worldwide effort helpseveryone that applies the PDQ database for searching an unknown automobilepaint found on a hit-and-run victim.
When two paint samples are compared, and comparison results are analyt-ically the same, the analyst may report that the two are similar in all respectsand that they may, therefore, have originated from the same source. Comparisonsof two paint specimens are made on the layer structure, elemental composition,polymer identity, fillers, and pigments. The analyst must take great care to pointout that in the case of an automotive finish, this does not mean that the paintnecessarily came from a particular car. From the scientifically determined facts,it could have originated from any of hundreds, or perhaps thousands, of vehiclespainted with the same topcoat. However, significance would be attached to the factthat the suspect car was registered and driven in the state where the accident oc-curred; that this particular car sustained damage to the front end, for example,and that evidence stuck to the bumper was in the form of fiber fragments identicalto the fibers from the victim’s trousers. If a fragment of paint from the victim’sclothing or the accident scene can be found and fits like a jigsaw puzzle in thedamaged areas of the suspect car, the association is unequivocal.
Most paints do not usually display as much diversity in chemistry, color, andlayer structure as do automotive ones. Therefore, a wider variety of analyticalinstruments are often used to characterize them. Along with microscopy and IRspectroscopy, other methods frequently used are pyrolysis GC/MS and inorganicelemental analysis by X-ray spectroscopy in the SEM. X-ray diffraction is also ofuse in the identification of crystalline pigments and fillers.
The study of coatings is also important in litigation concerning peeling paint.The examination in these cases focuses on the two surfaces that were once in con-tact with each other. Light and scanning electron microscopy of the surfaces areoften able to pinpoint the cause, usually improper or inadequate surface prepa-ration. In a very few cases, the surfaces appear to be perfectly clean and yet willstill not adhere to each other. Surface analysis techniques such as electron spec-troscopy for chemical analysis and Auger spectroscopy can reveal thin layers ofotherwise invisible coatings on the surface of the substrate. The chemical com-position of these thin coatings can be determined with these techniques, whichin turn can help assess the cause of nonadhesion. FT-IR microspectroscopy wasused to identify crystals that were implicated in a peeling paint problem. The IRspectra identified the crystals as a fungicide which had exsolved from the paintand recrystallized on the undersurface, pushing the film away from the woodsubstrate.
Paint comparisons are most often conducted in conjunction with criminalproceedings, but civil cases often arise. In one civil case, the owners of a high rise

Vol. 10 FORENSIC ANALYSIS 71
office building suspected that their building, especially the windows, was beingcoated by paint from a bridge a half-mile away that was being spray-painted. Mi-croscopical examination of the glass windows revealed the presence of tiny greenspherical particles that were compared visually and by visible microspectropho-tometry. The elemental composition was determined using energy-dispersive X-ray spectroscopy and the polymer was identified by FT-IR. These tests could allbe conducted on a single sphere and compared with spheres that had formed andfallen around the bridge. The paints from both sources were identical in all re-spects and the painting contractors were held liable for the damage to the highrise.
A criminalist in California was assigned to rework a murder investigationoriginally tried in the early 1960s in 1987 after the U.S. Supreme Court overturned
Fig. 4. IR and Raman spectra of yellow acrylic melamine enamel auto paint with pig-ments: (A) IR spectrum of the auto paint; (B) IR spectrum of chrome yellow pigment; (C)Raman spectrum of chrome yellow pigment; (D) Raman spectrum of the yellow auto paint;(E) Raman spectrum of rutile. Spectra provided by E. Suzuki, Washington State Patrol,Forensic Laboratory, Seattle, Wash.

72 FORENSIC ANALYSIS Vol. 10
the conviction of the defendant on a technical issue. The murdered 16-year-oldgirl was found in a dry drainage canal near the California desert, some distancefrom her home. The original suspect in the case was placed at the crime scene onthe basis of a partial footprint and tire track in the soil outside the victim’s home.During the reinvestigation, the criminalist was surprised to find small, pale greenfootball-shaped particles among the items of evidence associated with the victimand the suspect. Consulting a forensic microscopist, he was informed that theywere originally wet spheres of spray paint that had deformed by capillary actionbecause they had a fiber running through them. These particles, whatever theirorigin, were significant because they were associated with both the suspect andthe victim. They had been observed during the original investigation 25 yearsearlier, but the analysts involved did not feel that they could be analyzed by thetechniques available at the time. The forensic microscopist took over the investi-gation of the particles when the criminalist discovered their source. The headlinerof the suspect’s vehicle, which was still in custody, had been spray-painted green.The headliner was cotton at that time and many of the droplets dried aroundthe fibers. When the cotton became brittle, the particles broke away and dustedthe car with these green football shaped particles. Microanalysis of the parti-cles was conducted for the purpose of comparing the particles from the victim(shoelace, dust from her house, etc) and the suspect (his clothing, dust from hishotel room, etc) to the paint particles from the vehicle headliner. The analysiswas exhaustive and it was possible to say that the paint from all three sourceswas identical in elemental composition, polymer composition, color, fluorescence,and microscopical examination of the fillers and pigments in terms of size andquantity. In addition, the particles were all spray paint, and all of the particleshad been sprayed over cotton fibers. These fibers also had the same propertiesamong the three sources. The jury convicted the defendant for the murder a secondtime.
Researchers are beginning to demonstrate the usefulness of Raman analysisfor organic and inorganic pigment identification in paint (22,23). Figure 4 com-pares IR and Raman paint spectra of a yellow acrylic melamine enamel automo-tive paint. The IR spectrum in Figure 4A clearly shows the resin binder features.The N H stretch near 3350 cm− 1, the C H stretching near 3000 cm− 1, the C Ostretch near 1730 cm− 1, the C N stretch near 1540 cm− 1, and the typical C Oenvelope from 1300 to 1000 cm− 1 are observed in the IR. Of particular interestin paint analysis are any contributions by pigments. The weak, broad band at868 cm− 1 appears to be contributed by chrome yellow, as shown in the Figure 4Breference spectrum. However, because of the band’s comparatively low intensityand lack of detail in the paint spectrum, it would be difficult to positively identifychrome yellow by this method alone. The peaks labeled at 659, 425, and 357 cm− 1
are rutile, a polymorph of titanium dioxide. Figure 4D is the Raman spectrumof the yellow auto paint. The major peaks at 843 and 365 cm− 1 match up withthe Raman spectrum of chrome yellow shown in Figure 4C. Peaks at 611 and 446cm− 1 are contributed by rutile, as shown in Figure 4E. With Raman spectroscopy,the high scattering efficiency of some of the pigments, relative to those of thebinders, helps to easily determine the pigment components, as interfering binderpeaks are not a problem.

Vol. 10 FORENSIC ANALYSIS 73
BIBLIOGRAPHY
“Forensic Aspects” in EPSE 2nd ed., Vol. 7, pp. 279–289, by Skip Palenik, Walter C. McCroneAssociates, Inc.
1. E. Locard, Police J. 1, 177 (1928).2. E. Locard, Am. J. Police Sci. 1, 276 (1930).3. R. Saferstein, Criminalistics, An Introduction to Forensic Science, 7th ed., Prentice-
Hall, Upper Saddle River, N.J., 2001, p. 64.4. S. J. Palenik, in R. Saferstein, ed., Forensic Science Handbook, Vol. II, Prentice-Hall,
Inc., Englewood Cliffs, N.J., 1988, p. 161.5. M. Frei-Sulzer, Kriminalistik 19, 190 (1951).6. P. L. Kirk, Crime Investigation, Interscience Publishers, Inc., New York, 1953,
p. 83.7. A. Teetsov, in W. C. McCrone and J. G. Delly, eds., The Particle Atlas, Ann Arbor Science
Publishers, Ann Arbor, Mich., 1973, p. 204.8. Ref. 6, p. 69.9. P. R. Deforest, in R. Saferstein, ed., Forensic Science Handbook, 2nd ed., Vol. I, Prentice-
Hall, Inc., Upper Saddle River, N.J., 2002, p. 215.10. W. C. McCrone, L. B. McCrone, and J. G. Delly, Applied Polarized Light Microscopy,
Ann Arbor Science Publishers, Ann Arbor, Mich., 1978.11. N. H. Hartshorne and A. Stuart, Crystals and the Polarizing Light Microscope, Edward
Arnold, Ltd., London, 1970.12. D. A. Hemsley, The Light Microscopy of Synthetic Polymers, Oxford University Press
and the Royal Microscopical Society, London, 1984.13. O. Heuse and F. P. Adolf, J. Forensic Sci. 22(2), 103 (1982).14. F. R. Rothery and M. A. White, J. Soc. Dyers Colour 98, 11 (1983).15. L. Engel, H. Klingele, and G. W. Ehrenstein, An Atlas of Polymer Damage, Prentice-
Hall, Inc., Englewood Cliffs, N.J., 1981.16. L. C. Sawyer, Polymer Microscopy, 2nd ed., Chapman and Hall, Ltd., New York,
1995.17. H. J. Humecki and R. Z. Muggli, in K. F. J. Heinrich, ed., Microbeam Analysis, San
Francisco Press, Inc., San Francisco, Calif, 1982, p. 243.18. H. J. Humecki, Solid State Technol. 28(4), 309 (1985).19. E. M. Suzuki, in R. Saferstein, ed., Forensic Science Handbook, Vol. III, Prentice-Hall,
Inc., Englewood Cliffs., N.J., 1993, p. 71.20. E. G. Bartick and M. W. Tungol, in R. Saferstein, ed., Forensic Science Handbook,
Vol. III, Prentice-Hall, Inc., Englewood Cliffs., N.J., 1993, p. 196.21. J. V. Miller and E. G. Bartick, Appl. Spectrosc. 55, 1729 (2001).22. G. Massonnet and W. Stoecklein, Sci. Just. 39, 181 (1999).23. E. M. Suzuki and M. Carrabba, J. Forensic Sci. 46(5), 1053 (2001).24. M. E. Eyring, in R. Saferstein ed., Forensic Science Handbook, Vol. I, 2nd ed., Prentice-
Hall, Inc., Upper Saddle River, N.J., 2002, p. 321.25. V. D. Scott and G. Love, Quantitative Electron-Probe Microanalysis, John Wiley & Sons,
Inc., New York, 1983.26. P. Echlin, ed., Analysis of Organic and Biological Surfaces, John Wiley & Sons, Inc.,
New York, 1984.27. M. Blazso, J. Anal. Appl. Pyrolysis 39, 1 (1997).28. T. Wampler, J. Chromatogr. A 842, 207 (1999).29. D. Northrop, in R. Saferstein, ed., Forensic Science Handbook, Vol. I, 2nd ed., Prentice-
Hall, Inc., Upper Saddle River, N.J., 2002, p. 41.30. T. G. Rochow, Microscope 31(1), 75 (1983).

74 FORENSIC ANALYSIS Vol. 10
31. R. Breese and N. J. Street, Forensic Sci. Int. 17, 167 (1981).32. R. J. H. Clark, in J. M. Chalmers and P. R. Griffiths, eds., Handbook of Vibrational
Spectroscopy, Vol. IV, John Wiley & Sons, Inc., New York, 2002, p. 2977.33. H. A. Deadman, FBI Law Enforcement Bull. 53(3), 12 (1984).34. H. A. Deadman, FBI Law Enforcement Bull. 53(5), 10 (1984).35. M. W. Tungol, E. G. Bartick, and A. Montaser, Appl. Spectrosc. 44, 543–549
(1990).36. M. W. Tungol, E. G. Bartick, and A. Montaser, Spectrochemica Acta Electronica 46B,
1535E–1544E (1991).37. M. W. Tungol, E. G. Bartick, and A. Montaser, in H. Humecki, ed., Practical Guide to
Infrared Microspectroscopy, Marcel Decker, Inc., New York, 1995, p. 245.38. Federal Trade Commission Rules and Regulations under the Textile Products Identi-
fication Act, U.S. Code, Section 70, Title 15, et seq. 16 C.F.R. 303.7.39. M. C. Grieve, Sci. Just. 35, 179 (1995).40. P. J. Hendra, W. F. Maddams, I. A. M. Royaud, H. A. Willis, and V. Zichy, Spectrachim.
Acta 46A, 747 (1990).41. P. C. White, C. H. Munro, and W. E. Smith, Analyst 121, 835 (1996).42. P. C. White, C. Rodger, V. Rutherford, Y. Finnon, W. E. Smith, and M. Fitzgerald, SPIE
3576, 77 (1999).43. S. G. Ryland, in H. Humecki ed., Practical Guide to Infrared Microspectroscopy, Marcel
Decker, Inc., New York, 1995, p. 163.44. D. R. Cousins, C. R. Platoni, and L. W. Russell, Forensic Sci. Int. 24(3), 183
(1984).45. B. Beattle, R. J. Dudley, and K. W. Smalldon, HOCRE Report No. 259, Home Office
Central Research Establishment, Aldermaston, U.K., Jan. 1978.46. J. Thornton, in R. Saferstein, ed., Forensic Science Handbook, Vol. I, 2nd ed., Prentice-
Hall, Inc., Upper Saddle River, N.J., 2002, p. 429.47. F. Feigle, Spot Tests in Organic Analysis, Elsevier, Amsterdam, 1966.48. C. J. Curry, D. F. Rendle, and A. Rogers, J. Forensic Sci. Soc. 22, 173 (1982).49. H. K. Raaschau Nielsen, J. Coatings Technol. 56, 173 (1984).50. P. G. Rogers, R. Cameron, N. S. Cartwright, W. H. Clark, J. S. Deak, and E. W. W.
Norman, Can. Soc. Forensic Sci. J. 9, 1 (1976).51. P. G. Rogers, R. Cameron, N. S. Cartwright, W. H. Clark, J. S. Deak, and E. W. W.
Norman, Can. Soc. Forensic Sci. J. 9, 49 (1976).52. P. G. Rogers, R. Cameron, N. S. Cartwright, W. H. Clark, J. S. Deak, and E. W. W.
Norman, Can. Soc. Forensic Sci. J. 9, 103 (1976).53. J. L. Buckle, D. A. MacDougall, and R. R. Grant, Can. Soc. Forens. Sci. J. 30, 9
(1997).
EDWARD G. BARTICK
Counterterrrorism and Forensic Science Research Unit,FBI AcademySKIP PALENIK
Microtrace