forensic applications consulting technologies, inc. - home
TRANSCRIPT
Industrial Hygiene Assessment
of Indoor Environmental Quality
Preformed at: 1111 main street
Colorado Springs, CO 80919
Prepared for:
Joe smith 1111 main street
Colorado Springs, CO 80919
Prepared by:
Forensic Applications Consulting Technologies, Inc. 185 Bounty Hunters Lane
Bailey, CO 80421
August 2, 2012
Main street Lane IEQ Assessment Page 2 of 19
Table of Contents
EXECUTIVE SUMMARY .............................................................................................................. 3 INTRODUCTION .......................................................................................................................... 4
The Building.............................................................................................................................. 4 The Weather............................................................................................................................. 4 Personnel ................................................................................................................................. 4
STANDARDS................................................................................................................................ 5 METHODS.................................................................................................................................... 6
Subjective Observations ........................................................................................................... 6 Odors ................................................................................................................................... 6 Soot...................................................................................................................................... 7
Objective Observations............................................................................................................. 8 PARAMETERS ............................................................................................................................. 8
Ultrafine Particles...................................................................................................................... 8 Organic Vapors....................................................................................................................... 12
EPA Total Organic Method 15 ............................................................................................ 13 Poly Aromatic Hydrocarbons .............................................................................................. 18 Polyaromatic Compounds on Surfaces............................................................................... 18 Soot Assessment ............................................................................................................... 19
Surface wipes ............................................................................................................ 19 Microvacuuming samples........................................................................................... 19
CONCLUSIONS.......................................................................................................................... 19 RECOMMENDATIONS............................................................................................................... 19
Main street Lane IEQ Assessment Page 3 of 19
EXECUTIVE SUMMARY On Friday, July 20, 2012 personnel from Forensic Applications Consulting Technologies, Inc. (FACTs) performed an assessment of the indoor environmental quality at 1111 main street in Colorado Springs, Colorado (the subject property). The assessment was performed at the request of the owner/occupants of the property. Several of the occupants (two adults and some of the youth) reported experiencing unusual health symptoms in the house following evacuations due to a massive and catastrophic wildfire that came within one mile of the structure. The fire was identified as the Waldo Canyon Fire which burned a total of approximately 18,250 acres and resulted in the evacuation of over 32,000 residents. Approximately 346 homes were destroyed by the fire. The massive plume of smoke extended over 100 km and was upwards to 30 km in width and affected a very large area of Colorado Springs and El Paso County. Smoke is an indefinite mixture of gases and particulates – the composition of which is constantly changing. Smoke is known to contain many acutely toxic substances as well as substances that pose health threats at low level chronic doses. This discussion is not a toxicological review of smoke, but rather a discussion on the findings of our investigations. FACTs performed objective and subjective evaluations pursuant to standard recognized and validated methodologies. Based on our subjective and objective quantitative, semi-quantitative and qualitative analyses, FACTs determined the following:
• Subjectively, only the attached garage possibly had an odor of smoke (one investigator observed the odor and one investigator did not observe the odor).
• Subjectively, “streak tests” performed pursuant to ASTM International Standards Method 6602 were negative (unremarkable), and residual soot was not identified.
• Objectively, total hydrocarbon concentrations measured in the structure via the US EPA TO-15 Method were unremarkable and similar to structures not known to have been effected by indoor contaminants.
• Objectively, poly aromatic hydrocarbon concentrations measured in the air of the structure via the US Department of Health Human Services, National Institutes of Occupational Safety and Health (NIOSH) Method 5528 were unremarkable and similar to structures not known to have been effected by indoor contaminants.

Main street Lane IEQ Assessment Page 4 of 19
• Objectively the concentrations of airborne ultrafine particles in the residence were unremarkable and lower than that which would have been expected in a normal occupied structure.
The following discussion describes our methods, observations, rationale, conclusions and recommendations.
INTRODUCTION
The Building The subject building is a single family stand-alone residence, built in cir 1990 and which approximates 6,120 square feet of occupied space (including the garage). The structure has three occupied levels On the day of our visit, the subject property was furnished normally, and was in a state exactly as it would have been occupied immediately prior to the forced evacuation. Heating and cooling is maintained by a residential sized forced air system; during our assessment, FACTs activated the forced air system.
The Weather On the day of our assessment, the weather was seasonal, with an outdoor midday temperature of approximately 87°F, and no appreciable wind. On the day of our visit, upon our arrival, the station pressure was 24.15 inches of mercury and was rising steadily to 24.35 inches of mercury by the time we left the subject property in the early afternoon.
Personnel The work was performed by Caoimhín P. Connell, Forensic Industrial Hygienist with FACTs, Inc. Mr. Connell was assisted in the field by Ms. Christine Carty, FACTs Technician. Neither Mr. Connell, nor FACTs, has any other association with the client or any other interested parties. This author (Connell) has been a practicing Industrial Hygienist (IH) since 1987 and meets the conditions to use the term “Industrial Hygienist” and practice “Industrial Hygiene” as defined in Colorado Revised Statutes §24-30-1402. Prior to entering the IH field, he had approximately ten years experience in analytical and research laboratories in the United States and abroad as a chemist, research technician and laboratory technician. Mr. Connell possesses specialized knowledge in several areas of Industrial Hygiene including indoor microbiology, microbial assessments, chemical exposures, analytical chemistry, and indoor air quality (IAQ). Mr. Connell has been performing the type of work conducted at the subject property for approximately 25 years and has specifically performed chemical exposure assessments for approximately 25 years. During that time, he has performed IAQ/IEQ investigations

Main street Lane IEQ Assessment Page 5 of 19
in a number of litigious cases for such highly acclaimed organizations as the National Center for Atmospheric Research (where he currently serves as the contract Industrial Hygienist). Also, similar work has been performed in numerous cases in the capacity of an expert witness involving smoke issues1, 2, 3, 4 Regarding this type of work, our clients have included the U.S. Geological Survey (USGS), Health and Human Services (HHS), Federal Bureau of Prisons, and the National Institute of Standards and Technology (NIST). Mr. Connell currently serves on three International ASTM Standards Committees:
Committee D22.08 on Indoor Air Quality Committee E30 on Forensic Sciences Committee E50 on Environmental Assessment, Risk Management and
Corrective Action Mr. Connell is a member of the Occupational Hygiene Society of Ireland, the American Industrial Hygiene Association (AIHA), and the American Conference of Governmental Industrial Hygienists (ACGIH); is a frequent speaker on indoor air issues for professional organizations, and has lectured nationally, and internationally, on risk assessment and toxicology as well as lecturing at university level.5 Mr. Connell is a recognized authority in the development of sampling and analysis Data Quality Objectives (DQOs), and was the primary author of the Data Quality Objectives for the State of Colorado Department of Public Health Regulations 6 CCR 1014-3, 2005.6
STANDARDS As with any type of testing or sampling, as part of the data quality objectives, the investigator must have some benchmark by which they are to compare their results, evaluate bias, precision, representativeness, accuracy and completeness.
1 Kalka V. US (Civil Action No. 91-Z-753), 1995 2 Dr. Robert Powers vs. Embassy House Condominium, et al 03 CV 1766, 2004 3 Michael H. Rider and Sabrina J. Rider (Plaintiffs ) v. John H. Wagner (Defendant) Case No. 2010CV423 (2011) 4 George A. Hinshaw, PhD.; Ioana Hinshaw, MD et al v. Forest Glenn Inc., et al, District Court Arapahoe County, Colorado Case Number 99, CV 3649 (2001) 5 Lecturer at Denver University, as part of the Masters Degree in Science Program, at the invitation of Professor Rupert C. Burtan, M.D., M.P.H., D.P.H. 6 State of Colorado, State Board Of Health Department Of Public Health And Environment, Regulations Pertaining to the Cleanup of Methamphetamine Laboratories, 6 CCR 1014-3, (Appendix A and Attachment to Appendix A) Adopted January 19, 2005, effective March 30, 2005: www.forensic-applications.com/meth/coloregs.html
Main street Lane IEQ Assessment Page 6 of 19
Frequently, there are no published data against which field investigation data may be compared. Frequently, the comparison of data may be based on internal (in-house) documentation and findings. For this project, FACTs has relied on standards and guidelines from nationally recognized consensus standards organizations such as the American Society of Heating Refrigeration and Air-conditioning Engineers (ASHRAE), which publish standards7 for acceptable indoor air quality; the Occupational Safety and Health Administration (OSHA), which promulgates enforceable occupational standards; and the National Institute of Occupational Safety and Health (NIOSH), which publishes scientific methods of evaluation and information and recommendations for controlling human exposures. We have also relied on independent government research organizations such as the US Government’s National Academies Press, Institute of Medicine (IOM), and global agencies such as the World Health Organization (WHO).
METHODS During our assessment, FACTs made objective and subjective observations.
Subjective Observations Subjective observations are those made without the use of instruments and include observations of odors, subjective assessments of irritation, and other parameters of “comfort.”
Odors Subjectively, FACTs personnel were largely in agreement with regard to the odor profiles in the subject property. With the exception of the garage, we did not observe a residual odor of smoke or smoke by-products. One of the investigators, Ms. Carty, reported a tell-tale odor of smoke exclusively in the garage. Both investigators identified an odor of di- and tri- chloramines in the sub-basement (third level down). We determined that the odor was due to the presence of an hot-tub immediately located outside the back door of this level. Chloramines are the compounds responsible for the odor most pool occupants call “a chlorine smell.” The stoichiometry between the production of trichloramine and water chemistry is extremely complex, however, suffice to say that when the “smell of chlorine” is high, it is generally due to too little free chlorine in the water, and not, as generally presumed, too much. Trichloramine is produced when there is insufficient free chlorine in the water to properly oxidize nitrogenous and proteinaceous materials. When the free chlorine levels in the
7 ANSI/ASHRAE Standard 62.1-2010 (Ventilation for Acceptable Indoor Air Quality)

Main street Lane IEQ Assessment Page 7 of 19
water fall below a critical concentration, “chlorine” odors increase due to production of total chloramines. When the airborne concentrations of trichloramine exceed 0.1 ppm,8 reports of eye irritation and respiratory symptoms increase. Other authors9 have reported irritation thresholds of 0.3 ppm for total chloramines (combined mono-, di- and tri-). Based on information provided to us by the occupant, experienced symptoms were the greatest when the adult male homeowner entered the sub-basement area. We hypothesize that the owner was being exposed to chloramines associated with the hot-tub. No other odors were identified in the subject property which proved remarkable.
Soot FACTs performed “streak testing” in the subject property pursuant to Section 8.2 of the ASTM International Standard Method D6602 – 03b (2010) Standard Practice for Sampling and Testing of Possible Carbon Black Fugitive Emissions or Other Environmental Particulate, or Both. Table 1 below presents the results of this “streak testing:” Sample ID Room Location Result DF072012-28 Main floor living room Wall outside Study Negative DF072012-09 Main floor living room Fireplace mantel Negative DF072012-12 Garage Top of refrigerator Negative DF072012-15 Downstairs Recreation Room Top of south wall book case Negative DF072012-18 Downstairs Recreation Room Top of secretary's desk Negative DF072012-20 Sub-basement Top of plastic covering on pool table Negative Not archived Downstairs Recreation Room Return vent louver Negative
Table 1 ASTM Qualitative Soot Testing
At no time did we observe any location that would be indicative of a “positive” streak test. All the streak media has been archived.
8 Occupational Safety and Health Administration, Chemical Sampling Guide, referencing Gagnaire, F., Azim, S., Bonnet, P., Hecht, G. and Hery, M.: Comparison of the sensory irritation response in mice to chlorine and nitrogen trichloride. J. Appl. Toxicol. 14(6): 405-409, 1994. 9 Tom Griffiths, EdD, Director of Aquatics, Penn State University; President, Aquatic Safety Research Group, LLC – various informational leaflets.
Main street Lane IEQ Assessment Page 8 of 19
Objective Observations Objective observations are those made using a device (camera, wet chemistry readings, air monitoring equipment, etc.). Objective data, within the context of the DQOs, are those observations (results), which speak for themselves within the context of the DQOs. During our assessment, we collected data on a variety of parameters, based on various established data quality objectives. The data we collected included qualitative and semi-quantitative measurements. We performed objective monitoring of the following parameters:
• Airborne ultrafine particles using a laser condensation nephelometer • Airborne organic vapors and gases pursuant to US EPA TO-15 Method • Airborne polyaromatic hydrocarbons pursuant to NIOSH Method 5528 • Surface contact polyaromatic hydrocarbons (modified NIOSH Method 5528) • Soot pursuant to ASTM D6602 – 03b (2010) • Barometric pressure using a calibrated handheld digital barometer
PARAMETERS
Ultrafine Particles Traditionally, extremely small airborne particulate material has been termed “ultrafine particles” (UFPs). More recently, UFPs are being referred to as “nanoparticles” in some scientific and medical literature. There is no universally accepted nomenclature for various particle sizes; however, in the realm of airborne particles, it is normal convention to classify airborne particulates into three groups: “course particulates” (less than 10 micrometers (µm) but greater than 2.5 µm aerodynamic diameter), “fine particulates” (also known as PM 2.5, less than 2.5 µm but greater than 0.2 µm aerodynamic diameter) and “ultrafine particulates” (less than 200 nanometers (nm) aerodynamic diameter).10 Another source11 references UFPs as less than 100 nm aerodynamic diameter and nanoparticles as less than 10 nm aerodynamic diameter. During our assessment, we used an instrument called a laser condensing nephelometer manufactured by TSI (Model P-Trak™). The instrument we used is capable of measuring particles in the range of 1.0 µm aerodynamic diameter down to 20 nm. Therefore, for the purposes of this discussion, all particles measured by the device will be considered to be UFPs.
10 Afshari, A.; Gunnarsen, L. Review of the sources of fine and ultra fine particles in indoor air. Environmental Engineering, 2000, 13(3), 45-51 11 Prof. Michael T. Kleinman “Nanoparticles and Health,” Department of Community and Environmental Medicine, University of California, Irvine. (Personal communication May 13, 2011)

Main street Lane IEQ Assessment Page 9 of 19
Asthma has been increasing in the US for the last two decades. One report12 found a 75% increase in the prevalence of asthma from 1980 to 1994. The actual reasons for the increase are currently under investigation but adverse health effects have been positively correlated with respirable particles. Ever increasingly small respirable particles are produced by a variety of mechanisms. As the size of respirable particles decreases, the inherent toxicity of the constituents of the particulate becomes less important. Therefore, otherwise “non-toxic” materials appear to exhibit toxic properties when the inhaled particles are sufficiently small.13 For example, titanium dioxide particles, at a diameter of 5 µm and larger, are virtually non-toxic to humans and many other animals (excluding pneumoconiosis issues). However, titanium dioxide particles with an aerodynamic diameter of 20 nm cause a severe inflammatory response in the lungs and produce lung damage.14 A similar response is seen with particles as biologically inert as Teflon15 and carbon black.16 UFPs, such as those associated with soot17 are implicated in a variety of respiratory dysfunctions. There is considerable evidence that UFPs may be a significant factor in the increasing incidents of asthma. Although not all research supports the adverse effects of “non-toxic” UFPs adversely effecting humans in an equal manner,18 even those studies that question whether all UFPs are equally hazardous recognize, in principle, the potentially grave health hazards associated with UFPs.
12 “Surveillance for asthma- United States 1960-1995” Morbidity and Mortality Weekly Report, April 24, 1198; 47 (SS-1) 13 Oberdorster, G; Gelein, R.M. et al “Association of Particulate Air Pollution and Acute morbidity: Involvement of Ultrafine Particles?” Inhalation Toxicology 7:111-124. (1995) 14 Stone, V.; Donaldson, K. Small particles – Big problem, The Aerosol Society Newsletter No. 33, Sept, 1998 15 Gunter Oberdorster, Robert M. Gelein, Juraj Ferin, Bernard Weiss Association of Particulate Air Pollution and Acute Morbidity: Involvement of Ultrafine Particles? Inhalation Toxicology 7:111-124. (1995) 16 Stone, Vicki; Donaldson, Ken, 1998, "Small particles – Big problem" The Aerosol Society Newsletter No. 33, September 1998 17 Klepeis, NE, Nazaroff WW Emissions Characterizing Size-Specific ETS Particle Emissions, Proceedings: Indoor Air 2002, Monterey, California 18 Green LC; Crouch EAC; Ames MR; Lash TL What’s Wrong with the National Ambient Air Quality Standard (NAAQS) for Fine Particulate Matter (PM2.5)? Regulatory Toxicology and Pharmacology 35, 327–337 (2002)
Main street Lane IEQ Assessment Page 10 of 19
One such study19 quoted:
Before discussing some toxicologic and epidemiologic issues, we point out that positive associations from these studies, if causal, suggest that ambient PM is remarkably deadly.
Not all UFPs are the same, and although the most commonly encountered indoor air UFPs are presumed to be inert carbon particles from combustion, not all UFPs are of this source or composition. The health hazards associated with UFPs are not well understood, but several cases of illness, and even documented cases of death20 from exposures to elevated UFPs, are found in scientific and medical literature. It is difficult to establish, with confidence, a dose-response relationship with UFPs unless the actual particulate size distribution and the surface chemistry of the UFPs is known. There are studies that have included measured UFP concentrations in occupational settings and have found significant health hazards at UFP concentrations of 34,000 particles per cubic centimeter of air (34 kp/cm3).21 In this case, the UFPs were from asphalt fume generation. Sometimes the UFPs are a coalescence of source material (such as in the case of combustion products or asphalt); sometimes the UFPs are intentionally added to a product to make the material stronger and more abrasion-resistant. These inorganics include silicon nanoparticles, thin zinc oxide, titanium dioxide and other engineered nanomaterials. 22 Since the information concerning adverse health effects of UFPs is still emerging, and insufficient knowledge exists at this time to establish a general exposure limit, we cannot, with confidence, provide specific guidance on “safe” vs. “hazardous” concentrations of UFPs at the subject property. However, some authors23 have reported that at sufficiently small particles, the actual composition is not important, and when for example, they instilled UFPs of biologically inert Teflon into rats at concentrations as low as 40kp/cm3, the concentrations were sufficiently elevated to result in pulmonary hemorrhaging in the rats. This value is remarkably similar to the 34 kp/cm3 reported above (ibid, Elihn 2008).
19 Ibid 20 Song Y, Li X, and Du X Exposure to nanoparticles is related to pleural effusion, pulmonary fibrosis and granuloma, European Respiratory Journal; 34: 559–567, 2009 21 Elihn K, Ulvestad B, Hetland S, et al Exposure to Ultrafine Particles in Asphalt Work, Journal of Occupational and Environmental Hygiene, 5: 12, 771 — 779, 1/12/08 22 Song Y, Li X, and Du X Exposure to nanoparticles is related to pleural effusion, pulmonary fibrosis and granuloma, European Respiratory Journal 2009; 34: 559–567 23 Oberdorster G, Finkelstein JN, Johnston C, Gelein R, Cox C, Baggs R, Elder AC. Acute pulmonary effects of ultrafine particles in rats and mice. Res Rep Health Eff Inst. 2000 Aug;(96):5-74; disc. 75-86.
Main street Lane IEQ Assessment Page 11 of 19
As we will discuss later, we observed UFPs at the subject property at much lower concentrations than those cited in literature and we observed concentrations that were unusually low for a residence. In addition to the total particle counts, one must be cognizant that exposure duration, breathing rates, surface chemistry of the particles, and the general volume of health of the exposed individual all become factors in establishing risk. It is our understanding that some of the occupants of the subject property are at decreased volumes of health. There is insufficient information to speak to the issue of toxicology in the context of these individuals – however, the exposures during our assessment at the residence, after the Waldo Canyon fire, were confidently no greater than that normally seen and no greater than expected prior to the fire. Much of our exposure criteria initiates from exposure and risk estimates that occur in the workplace. Occupationally, the phenomenon of decreasing particle size correlating with increasing toxicity is also recognized; the Occupational Safety and Health Administration (OSHA) suspended final promulgation of a new beryllium standard when it was realized, on the verge of promulgation, that UFPs of beryllium behaved significantly differently from more traditionally recognized particle sizes. OSHA decided to study the UFP issue in greater depth before promulgating the final beryllium standard. Currently, there are no generally accepted occupational exposure standards for UFPs. Although OSHA does regulate respirable particles, the standard is based on a mass per unit volume basis and, therefore, does not take into account particle number or surface area issues which are known to play an important role in the adverse health effects of UFPs. According to OSHA, respirable particles cannot exceed 5,000 micrograms per cubic meter of air (µg/m3) based on a time weighted average. But even at 200,000 particles per cubic meter, for unit density particles, the mass of an airborne insult would only be approximately BRL4 µg/m3.24 NIOSH suggested 2.4 mg/m3 for agglomerated fine spherical TiO2, but 0.3 mg/m3 for TiO2 UFPs. NIOSH also has proposed a “Recommended Exposure Level” of 7 µg/m3 for carbon nanotubes and carbon nanofibrils; Nanocyl (a leading global manufacturer of specialty and industrial CNTs) proposed 2.5 µg/m3 for certain CNTs; Bayer Corporation suggested 50 and AIST Japan has suggested 250. Therefore, there is still considerable debate about the most appropriate exposure metric and exposure value.
24 Qualitatively calculated from the density derived from carbon/iron oxide composition of common copier toner, and an estimated nominal particle size.

Main street Lane IEQ Assessment Page 12 of 19
Below is a table stating location and results of UFP testing at the subject property:
Location Particles per cubic centimeter of air
Outside 4,000 Kitchen 400 Main living room 500 Study 350 Master Bedroom 370 Master bathroom 330 Main living room 430 Upstairs North bedroom 350 Garage 3,300 Hall and laundry room 450 Outside 2,400 Middle level living room 400 Middle level furnace room 400 Middle level South bedroom 400 Middle level bathroom 440 Middle level SW bedroom 420 Middle level storage room 430 Middle level central bedroom 380 Middle level Jack-Jill bathroom 400 Middle level North bedroom 400 Subbasement Recreation room 380 Subbasement crawlspace 410 Subbasement Weight room 390 Subbasement Ceramic workshop 390
Table 2 Ultrafine Particle Counts
We can say, with confidence and certitude, that the concentrations we observed at the subject property were extremely low and finding those concentrations in a residence is very unusual. We believe the very low levels were due to the fact that the residence has been closed and unoccupied since the evacuation.
Organic Vapors Fires can volatilize and pyrolize many substances and result in a complex mixture of organic compounds. Those compounds can have an extremely broad range of vapor pressures, and there is no one single method that is suitable for assessing all possible mixtures. During our investigation, we assessed the concentration of organic vapors by looking at two profoundly different vapor pressure ranges and molecular sizes. To breakup stratification during our assessment, we activated all ceiling fans in the structure (except bathroom exhaust fans), and we placed two large axial fans in the structure to gently mix the air, and we operated the air conditioner in a normal fashion. Also during the assessment, we shook clothing, vacuumed carpets with the homeowner’s vacuum cleaner; we shook bed clothing, fluffed pillows, and disturbed surfaces of walls
Main street Lane IEQ Assessment Page 13 of 19
and furniture using the cushion of a chair. The objective was to agitate surfaces in the structure in a manner that would be reminiscent of normal activities in the structure.
EPA Total Organic Method 15 To assess the presence of higher vapor pressures (and somewhat smaller molecules) we performed the standardized US EPA validated TO-15 method. In this method, we introduced two air samplers, known as Summa Canisters, in the residence; one placed in the top floor (in the kitchen) and one in the central sub-basement. A critical flow orifice was used to slowly collect six liters of air over the course of two hours; this independent two-hour process took place while other assessment activities were being conducted at the residence. These air samples were then submitted to a recognized laboratory for analysis. In the graph below, we have presented the results of the TO-15 method; showing the upstairs sample (Blue Bars) compared to the downstairs sample (Red Bars). We recognize that the names of the individual compounds are difficult to read. However, the purpose of this graph is to emphasize the very good correlation between the upstairs sample and the downstairs sample; demonstrating that good air mixing was achieved, and the samples are representative of the volatile organics within the residence at the time of our visit. The graph also shows that the concentration of compounds was very low and similar to that which we would expect to see in any other normal occupied residence.

Graph 1 TO-15 Analytical Results
The three highest concentrations observed are ethanol, isopropyl alcohol and acetone. The acetone and ethanol are probably due to normal bioeffluent emissions from the investigators. The isopropanol level is due to the soot wipes, and due to the laser nephelometer which gives off isopropanol gas during use. In the graph on the following page, we have removed these exogenous compounds to expand the vertical scale.
Main street Lane IEQ Assessment Page 15 of 19
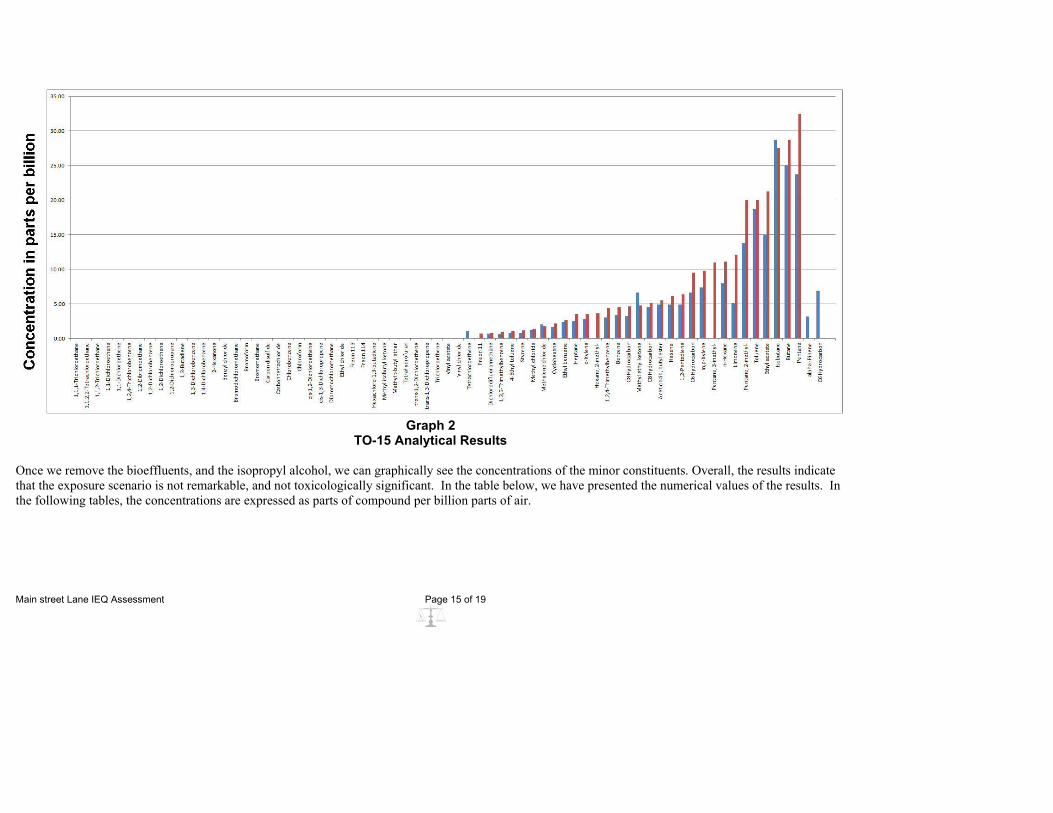
Graph 2
TO-15 Analytical Results Once we remove the bioeffluents, and the isopropyl alcohol, we can graphically see the concentrations of the minor constituents. Overall, the results indicate that the exposure scenario is not remarkable, and not toxicologically significant. In the table below, we have presented the numerical values of the results. In the following tables, the concentrations are expressed as parts of compound per billion parts of air.

Analyte Upstairs (ppb)
Downstairs (ppb)
1,1,1-Trichloroethane BRL BRL 1,1,2,2-Tetrachloroethane BRL BRL 1,1,2-Trichloroethane BRL BRL 1,1-Dichloroethane BRL BRL 1,1-Dichloroethene BRL BRL 1,2,4-Trichlorobenzene BRL BRL 1,2-Dibromoethane BRL BRL 1,2-Dichlorobenzene BRL BRL 1,2-Dichloroethane BRL BRL 1,2-Dichloropropane BRL BRL 1,3-Butadiene BRL BRL 1,3-Dichlorobenzene BRL BRL 1,4-Dichlorobenzene BRL BRL 2-Hexanone BRL BRL Benzyl chloride BRL BRL Bromodichloromethane BRL BRL Bromoform BRL BRL Bromomethane BRL BRL Carbon disulfide BRL BRL Carbon tetrachloride BRL BRL Chlorobenzene BRL BRL Chloroform BRL BRL cis-1,2-Dichloroethene BRL BRL cis-1,3-Dichloropropene BRL BRL Dibromochloromethane BRL BRL Ethyl chloride BRL BRL Freon 113 BRL BRL Freon 114 BRL BRL Hexachloro-1,3-butadiene BRL BRL Methyl isobutyl ketone BRL BRL Methyl t-butyl ether BRL BRL Tetrahydrofuran BRL BRL trans-1,2-Dichloroethene BRL BRL trans-1,3-Dichloropropene BRL BRL Trichloroethene BRL BRL Vinyl acetate BRL BRL Vinyl chloride BRL BRL Tetrachloroethene 1.06 BRL Freon 11 BRL 0.70 Dichlorodifluoromethane 0.68 0.79 1,3,5-Trimethylbenzene 0.64 0.99 4-Ethyl toluene 0.74 1.03 Styrene 0.78 1.19 Methyl chloride 1.25 1.38 Methylene chloride 2.00 1.75
BRL= Below reportable limit; the reportable limit is found on the original laboratory report Table 3
Results of TO-15 Sampling
Main street Lane IEQ Assessment Page 17 of 19
Analyte Upstairs
(ppb) Downstairs
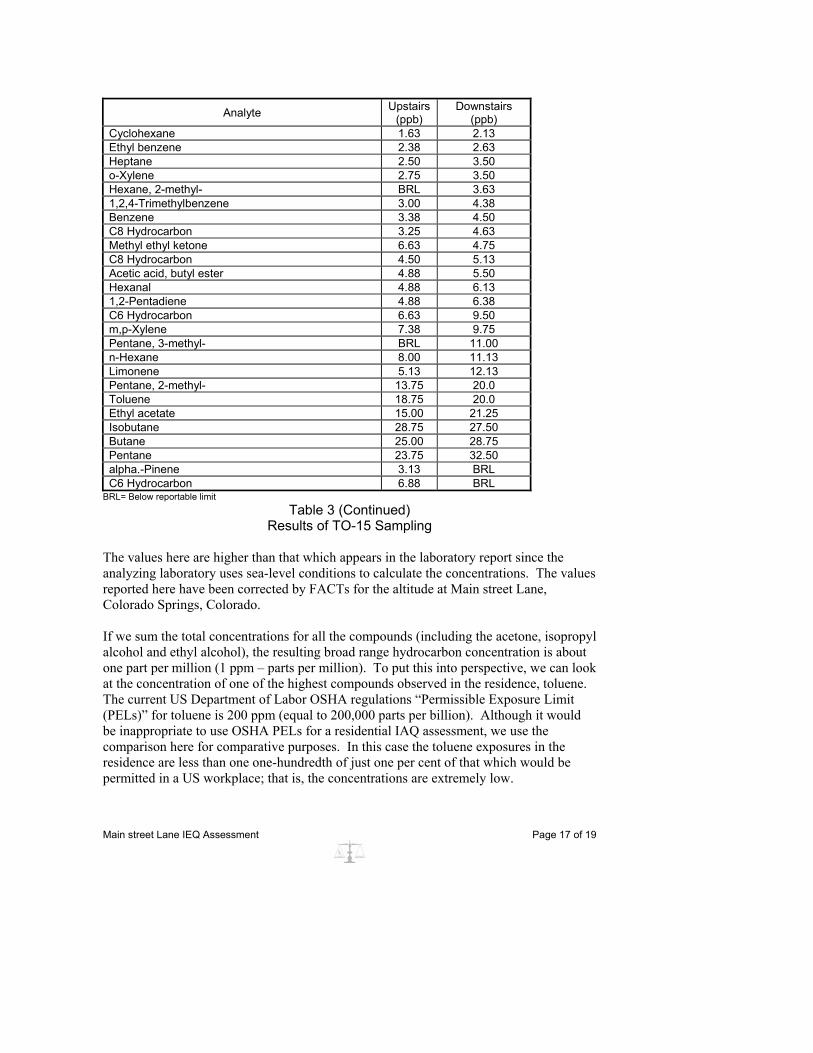
(ppb) Cyclohexane 1.63 2.13 Ethyl benzene 2.38 2.63 Heptane 2.50 3.50 o-Xylene 2.75 3.50 Hexane, 2-methyl- BRL 3.63 1,2,4-Trimethylbenzene 3.00 4.38 Benzene 3.38 4.50 C8 Hydrocarbon 3.25 4.63 Methyl ethyl ketone 6.63 4.75 C8 Hydrocarbon 4.50 5.13 Acetic acid, butyl ester 4.88 5.50 Hexanal 4.88 6.13 1,2-Pentadiene 4.88 6.38 C6 Hydrocarbon 6.63 9.50 m,p-Xylene 7.38 9.75 Pentane, 3-methyl- BRL 11.00 n-Hexane 8.00 11.13 Limonene 5.13 12.13 Pentane, 2-methyl- 13.75 20.0 Toluene 18.75 20.0 Ethyl acetate 15.00 21.25 Isobutane 28.75 27.50 Butane 25.00 28.75 Pentane 23.75 32.50 alpha.-Pinene 3.13 BRL C6 Hydrocarbon 6.88 BRL
BRL= Below reportable limit Table 3 (Continued)
Results of TO-15 Sampling The values here are higher than that which appears in the laboratory report since the analyzing laboratory uses sea-level conditions to calculate the concentrations. The values reported here have been corrected by FACTs for the altitude at Main street Lane, Colorado Springs, Colorado. If we sum the total concentrations for all the compounds (including the acetone, isopropyl alcohol and ethyl alcohol), the resulting broad range hydrocarbon concentration is about one part per million (1 ppm – parts per million). To put this into perspective, we can look at the concentration of one of the highest compounds observed in the residence, toluene. The current US Department of Labor OSHA regulations “Permissible Exposure Limit (PELs)” for toluene is 200 ppm (equal to 200,000 parts per billion). Although it would be inappropriate to use OSHA PELs for a residential IAQ assessment, we use the comparison here for comparative purposes. In this case the toluene exposures in the residence are less than one one-hundredth of just one per cent of that which would be permitted in a US workplace; that is, the concentrations are extremely low.

Main street Lane IEQ Assessment Page 18 of 19
Poly Aromatic Hydrocarbons FACTs also collected two samples for polyaromatic hydrocarbons using the NIOSH 5528 method. One sample was collected from the kitchen area and one sample was collected from the sub-basement.
Analyte Upstairs
ppb Downstairs
ppb Acenaphthene BRL BRL Acenaphthylene BRL BRL Anthracene BRL BRL Benzo(a)anthracene BRL BRL Benzo(a)pyrene BRL BRL Benzo(b)fluoranthene BRL BRL Benzo(g,h,i)perylene BRL BRL Benzo(k)fluoranthene BRL BRL Chrysene BRL BRL Dibenz(a,h)anthracene BRL BRL Fluoranthene BRL BRL Fluorene BRL BRL Indeno(1,2,3-cd)pyrene BRL BRL Naphthalene 0.3 0.2 Phenanthrene BRL BRL Pyrene BRL BRL
Table 4 Results of NIOSH 5528 Sampling
The results are expressed as parts of analyte per billion parts of air. The results are consistent with the TO-15 methodology and indicate that no unusual chemical exposures are present in the residence.
Polyaromatic Compounds on Surfaces During our assessment, we also collected surface wipe samples for the analysis of polyaromatic compounds on surfaces. In this method an hexane extracted gauze pad is dampened with deionized water (ultrapure water), and a selected area is wiped. Each sample location was identified by the Industrial Hygienist based on judgmental authoritative bias sampling theory. In this theory, samples are purposely collected from those areas which have the highest probability of containing the highest concentrations of poly aromatic hydrocarbons. Each sample was collocated with a soot test (see below). We collected samples from five locations. In an effort to control costs, we archived the surface samples pending review of the air sampling data. Based on the above data, we do not recommend analysis of the surface samples. Since the samples have been archived and not analyzed, we have not described this aspect of the investigation any further. At

Main street Lane IEQ Assessment Page 19 of 19
the request of the client, and at additional cost, we will provide details of this aspect of our assessment.
Soot Assessment
Surface wipes In addition to the subjective “streak testing” described earlier, FACTs also performed quantitative sampling consistent with the authoritative bias judgmental sampling found in Section 6.3.1 Technique I of the ASTM International Standard Method D6602 – 03b (2010) Standard Practice for Sampling and Testing of Possible Carbon Black Fugitive Emissions or Other Environmental Particulate, or Both. We collected samples from six locations. Since none of the qualitative streak tests were positive for soot, we have archived the samples collected pursuant to this standard. We do not recommend analysis of the surface soot samples. Since the samples have been archived and not analyzed, we have not described this aspect of the investigation any further. At the request of the client, and at additional cost, we will provide details of this aspect of our assessment.
Microvacuuming samples In addition to the above surface wipes, during our assessment, FACTs also performed microvacuuming of porous surfaces (bedding, clothing, carpets, etc.). Six authoritative bias judgmental samples were collected pursuant to the method described in ASTM Method D 5756-02. Based on the absence of other indicators, we archived these samples and we do not recommend analysis of the vacuum samples. Since the samples have been archived and not analyzed, we have not described this aspect of the investigation any further. At the request of the client, and at additional cost, we will provide details of this aspect of our assessment.
CONCLUSIONS Based on our objective and subjective observations, FACTs determined that there were no indicators that suggested unusual chemical exposures in the residence. FACTs concludes that the smoke and the fire did not result in any unusual deposits or residual exposures to chemicals. FACTs concludes that there was no unusual soot or smoke deposits. FACTs did not observe any conditions that were contrary to the ANSI/ASHRAE Standard 62.1-2010 (Ventilation for Acceptable Indoor Air Quality).
RECOMMENDATIONS FACTs does not find a compelling need for any further remediation. FACTs recommends immediate reoccupancy of the subject property.
--END--
Formatted: Indent: Left: 0"