forest ecology and management - us forest service · forest ecology and management 394 (2017)...
TRANSCRIPT

Forest Ecology and Management 394 (2017) 1–12
Contents lists available at ScienceDirect
Forest Ecology and Management
journal homepage: www.elsevier .com/locate / foreco
Effects of climate on competitive dynamics in mixed conifer forests of the Sierra Nevada
⇑ Corresponding author at: West Virginia University, Division of Forestry and Natural Resources, 322 Percival Hall, PO Box 6125, 26506-6125, USA.
E-mail addresses: [email protected] (C. Johnson), sophan.chhin@mail. wvu.edu (S. Chhin), [email protected] (J. Zhang).
Present address: Department of Forestry, Oregon State University, Snell Hall, 2150 SW Jefferson Way, Room 223, Corvallis, OR 97331, USA.
http://dx.doi.org/10.1016/j.foreco.2017.03.017 0378-1127/© 2017 Elsevier B.V. All rights reserved.
1
Christal Johnson a,1, Sophan Chhin a,⇑, Jianwei Zhang b
a Department of Forestry, Michigan State University, Natural Resources Building, 480 Wilson Road, Room 126, East Lansing, MI 48824-1222, USA b USDA Forest Service, Pacific Southwest Research Station, 3644 Avtech Parkway, Redding, CA, USA
a r t i c l e i n f o a b s t r a c t
Article history: Received 17 August 2016 Received in revised form 12 March 2017 Accepted 13 March 2017
Keywords: Competition Climate Dendrochronology Mixed conifer Pinus lambertiana Pinus ponderosa Sierra Nevada
Trees in more competitive environments appear to respond to climate differently than trees in less competitive environments. In turn, climate patterns may affect inter- or intra-specific competition, favoring certain individuals over others. Using dendrochronological methods, we sampled cores from dominant pine trees and their nearby competitors in 40 stands in the northern Sierra Nevada. Our dendroclimatological analyses showed complex responses to climate for the dominant pine and their competitors. Pinus lambertiana Dougl. and Pinus ponderosa Dougl. Ex P. & C. Laws benefited from cooler temperatures in the past May; all species benefited from warmer winter temperatures; Calocedrus decurrens (Torr.) Florin benefited from cooler temperatures in the past summer, while Abies concolor (Gord. & Glend.) Lindl.) and the two pine species benefited from cooler temperatures in the present summer. All species showed consistently positive effects from increased precipitation and increased moisture availability. A competition ratio calculated as the ratio between the dominant tree’s radial increments to the competitor’s indicated that climate could influence competition through one of two mechanisms. One, negative responses to climate conditions that were negative for one species but neutral for another tended to drive the competition ratios. Two, conditions that were negative for both competing trees tended to hurt competitors more than dominant trees, while conditions that were generally positive tended to help competitors more than dominant trees. These results suggest that the dominant pine trees may be more resilient to climate stress than competitors. Reducing competition via management such as thinning may increase climatic resilience for all species and possibly have positive competitive results for competitors. Increasing temperatures will tend to harm Sierra Nevada conifers in the summer and spring, but may show some benefit over the winter as long as precipitation is not reduced.
© 2017 Elsevier B.V. All rights reserved.
1. Introduction
It has been well established that competition from other nearby trees can have a limiting effect on tree growth (e.g. Gómez-Aparicio et al., 2011; Das, 2012; Ruiz-Benito et al., 2013). Although competition is often not the primary factor in the mortality of old-growth trees, old-growth trees in more competitive environments are at a higher risk of mortality (Das et al., 2011). Reduction of competition via thinning have shown to have a number of positive effects on survival. In a ponderosa pine forest of northern California, old-growth trees have significantly higher mortality in un
thinned stands versus thinned stands (Ritchie et al., 2008). Thinning treatments in addition to decreasing the risk of high-intensity fire promote the growth of the residual trees (Magruder et al., 2013; van Mantgem and Das, 2014; Pukkala et al., 2015). Thinning has also been shown to reduce mortality from Dendroctonus bark beetles without harming stand productivity (Zhang et al., 2013). Thinning treatments to reduce competition may also increase a stand’s resiliency to climate stresses (Misson et al., 2003; Linares et al., 2010; Magruder et al., 2013; Guillemot et al., 2015). Just as competition may increase a tree’s sensitivity to climate, climatic conditions may also affect competition with other trees. Temperature and precipitation have been shown to shift the competitive advantages of different species in an area (Gómez-Aparicio et al., 2011; Cavin et al., 2013). Interactions between climate and competition can be complex, and effects may vary by species, region, tree age, and tree size.
Dendrochronological analysis is the technique of measuring radial tree growth and relating this to available climate records

2 C. Johnson et al. / Forest Ecology and Management 394 (2017) 1–12
for the same time periods. Using these techniques, the response of radial growth to climatic conditions can be inferred over many years (e.g. Chhin et al., 2008a). One can form a picture of how whole forest stands have changed over time, and how they have responded to disturbances, yearly variations in climate, and changes in competition. Studies have reported some interesting and complex relationships of tree response to climate and competition. For example, Gedalof and Smith (2001) found that for mountain hemlock (Tsuga mertensiana (Bong.) Carriere), warm summer temperatures were associated with positive growth in the present year, but negative growth in the following year. They attributed this to warm summers being favorable for initiating large crops of cones, which then matured in the following year at a significant energetic cost to the tree. Other studies have found that site conditions as a surrogate for climate had dendroclimatic responses. For example, trees that are located near bodies of water showed less response to drought stress in dry years, but were more susceptible to harm from flooding in wet years (Potito and MacDonald, 2008; Chhin et al., 2013). Responses also vary by species. Hurteau et al. (2007) found that for Sierra Nevada conifers under high-density conditions, such as white fir (Abies concolor (Gord. & Glend.) Lindl.), showed the strongest and most consistent response to climate, with most species showing stronger responses under more open conditions.
Larger trees may show different responses to climate and competition than smaller trees (Castagneri et al., 2012; Rozas, 2014), because larger trees have greater non-structural carbon pools to draw on (Niinemets, 2010) and greater access to sunlight (Thomas and Winner, 2002), but are also slower growing in general. Differences in drought response between saplings and mature trees may also depend on species. In a deciduous forest, He et al. (2005) found that some species showed little difference in drought response between old trees and young ones, while other species showed greater drought-related growth reductions in older trees. Individual trees may also show different responses to climate than the population does as a whole, due to differences in microclimate, competition, and tree age and size (Rozas and Olano, 2013). To control for age and size effects, some dendrochronology studies have chosen to study even-age plantations (de Luis et al., 2009), to separate trees out into different size classes before analysis (Chhin et al., 2008b), or to focus on a particular age group such as seedlings of 0.5–2 m in height (Chhin and Wang, 2008).
While most studies in dendrochronology focus on either establishment dates or responses to climate (Chhin and Wang, 2002), there is less research on interactions between climate and competition. Studies show that competition cannot be neglected in studying tree growth over time. For example, fires that reduce competition can have a benefit to the growth of surviving trees, especially smaller trees, in spite of the cost of fire damage (Valor et al., 2013). Additionally, while trees with low competition may show strong climatic signals in their yearly growth, trees that are more suppressed due to competition do not have much sensitivity to climate (Piutti and Cescatti, 1997; Gea-Izquierdo et al., 2009; Rozas, 2014). Instead, their growth is more dependent on the previous year’s growth (Rozas and Olano, 2013). Competition can be a more important factor in tree growth than climate, although climate can influence a tree’s sensitivity to competition and can affect which species are the dominant competitors (Gómez-Aparicio et al., 2011).
Some studies have also attempted to determine which Sierra Nevada conifers give the most reliable records of climate: Hurteau et al. (2007) found that of Sierra Nevada mixed-conifer species growing in high-density conditions, white fir growth showed the closest correspondence with the Palmer drought severity index (PDSI). Incorporating lagged climate effects generally did not improve the chronology alignment with PDSI, except for Jeffrey pine (Pinus jeffreyi Grev. & Balf.). Potito and
MacDonald (2008), on the other hand, found that Jeffrey pine growth corresponded more strongly with winter (October-February) PDSI than western juniper (Juniperus occidentalis Hook.) or lodgepole pine (Pinus contorta Louden).
While many studies exist on dendrochronology in the Sierra Nevada as well as the impacts of weather patterns on growth, or the impacts of competition on growth, studies that cover interactions between these two factors are lacking. This is in spite of the fact that factors such as temperature and precipitation may influence which species are most competitive. Greater competition, in turn, may decrease sensitivity to climate but increase tree mortality in old-growth forests (Smith et al., 2005). Dendrochronology provides a method by which to study decades of growth responses, and to examine how climate and competition influences growth. In this study, dendrochronology was used to study effects of monthly and seasonal climate on growth of four common Sierra Nevada mixed-conifer species: white fir, ponderosa pine (Pinus ponderosa Dougl. ex. P. & C. Laws), sugar pine (Pinus lambertiana Dougl.), and incense cedar (Calocedrus decurrens (Torr.) Florin). We used ring width data to examine whether monthly and seasonal climate influences trees differently based on their dominance in the stand. This study has important implications towards managing and safeguarding the productivity and health of old-growth pine species. This will help ensure the resilience of old-growth pines towards the impact of climate change and the effects of competition from the encroachment of shade tolerant conifers such as white fir and incense cedar.
2. Methods
2.1. Study site
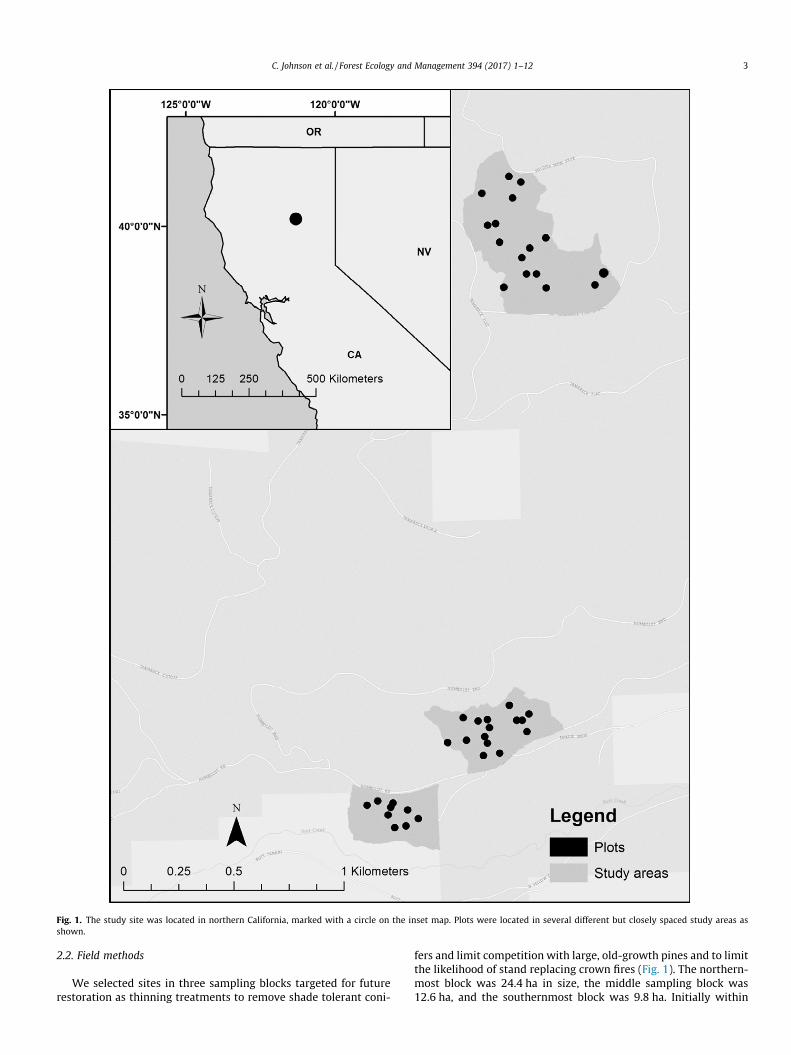
Study sites were located in Lassen National Forest at an elevation of approximately 1525 m (Fig. 1). In approximate order of abundance, the most common tree species are white fir (ABCO), sugar pine (PILA), ponderosa pine (PIPO), and incense cedar (CADE). Ponderosa pine is the least shade tolerant, followed by sugar pine; incense cedar is somewhat shade tolerant; and white fir is by far the most shade tolerant. Older trees also tend to be less shade-tolerant than young trees (Kinloch and Scheuner, 1990).
The climate is Mediterranean, with cool wet winters and hot dry summers (Grantham et al., 2010). The Sierra Nevada is a unique ecosystem in that it has very large trees and high productivity despite growth that is limited by extremely dry conditions in the summer and cold conditions in the winter. Based on data from the PRISM climate group (Daly et al., 2008), average daily temperature for December-February was 1.4 °C for 1980–2010. Average precipitation for June-August was only 1.25 cm per month. The main growing season begins in the spring but continues throughout the summer, with growth continuing to occur to a lesser extent in the fall and winter. Kelly and Goulden (2016) measured gross ecosystem productivity and found that 32% occurs in the spring, 32% in the summer, 21% in the fall, and 15% even in the winter.
The season for radial growth begins in mid-April for sugar pine, ponderosa pine, and incense cedar, and in early May for white fir. Radial growth lasts until August or September (Fowells, 1941). Shoot growth tends to begin after radial growth, in June, and needle growth begins even later in late June or early July (Royce and Barbour, 2001). Shoot growth may also begin at the same time as radial growth, but may proceed very slowly until June when rapid growth begins. Radial growth may be based on water availability, beginning with snow-melt and ending when water potentials drop with summer drought. Shoot growth instead may be based on photoperiod and temperature (Royce and Barbour, 2001).
3 C. Johnson et al. / Forest Ecology and Management 394 (2017) 1–12
Fig. 1. The study site was located in northern California, marked with a circle on the inset map. Plots were located in several different but closely spaced study areas as shown.
2.2. Field methods
We selected sites in three sampling blocks targeted for future restoration as thinning treatments to remove shade tolerant coni-
fers and limit competition with large, old-growth pines and to limit the likelihood of stand replacing crown fires (Fig. 1). The northern-most block was 24.4 ha in size, the middle sampling block was 12.6 ha, and the southernmost block was 9.8 ha. Initially within
4 C. Johnson et al. / Forest Ecology and Management 394 (2017) 1–12
each sampling block, old-growth pine trees were systematically surveyed along 40.2-m wide, belt-transects. We defined an old-growth pine as a pine with a diameter at breast height (DBH) of at least 63.5 cm and at least 200-years old. Some trees in this study were upwards of 300-years old and 120 cm in DBH. We then randomly selected a subset of the old-growth pines. A total of 40 plots were sampled, with 25 plots where sugar pine was the dominant tree and 15 plots where ponderosa pine was dominant, due to the greater relative abundance of large sugar pine in the area. Plots were centered on a focal tree, which was the largest pine in the plot. Plots were circular with varying radii: 16 plots had a fixed radius of 9.1 m, 5 plots had a radius calculated from the DBH of the focal tree x 12 (i.e. 8.8–9.1 m), and 19 plots had a radius calculated from the DBH of the focal tree x 15 (i.e. 9.5–18.1 m). While the varying plot radii are relevant to other future studies conducted in these plots, for this study they have little impact because the study focuses only on cores from the focal trees and the nearest competitors. Competitors tended to be closer to the focal tree by definition, so a larger plot radius does not imply that competitors are farther away. Plot boundaries did not overlap and were at least a plot radius apart from each other and from the site area boundary. Average basal area for the plots used in this study was 58.27 m2/ha, with a quadratic mean diameter of 50.99 cm (Table 1).
For each plot, we selected 1–3 competitors based on visual assessment of which trees in the plot were providing the most competition for the focal tree. Assessment was based on size and distance from the focal tree. Competitor trees all met at least two out of three of the following criteria: DBH that is at least 1/3 of the DBH of the focal tree; at least 1/3 of the height of the focal tree; the gap between the competitor tree’s crown and that of the focal tree is less than the crown width of the focal tree. We selected two trees when possible; however, three plots only had one acceptable competitor, while one other had three approximately equal competitors. This minor departure from selecting two competitors is a reflection of capturing the natural stand variability in terms of density of competitors. When the previous criteria were not enough to decide between several possible competitors, we used the Lorimer Competition Index. The Lorimer Competition Index quantifies competition using the following equation (Lorimer, 1983):
Dj=DiCI ¼ ð1ÞDISTij
In this equation, CI is the competition index, Dj is the diameter of the competitor tree, Di is the diameter of the focal tree, and DISTij is the distance between the two trees.
We cored the focal tree and each competitor twice at stump height (0.5 m). Dendrochronology of these cores served as the basis
Table 1 The average basal area per plot, quadratic mean diameter (QMD), height, and crown diametcolumn contains a total for BA and an average for other values.
ABCO CADE
BA (m2/ha) 18.11 5.48 QMD all (cm) 37.40 45.02QMD competitors (cm) 55.87 55.74QMD focal (cm) NA2 NA2
Competitor height (m) 26.0 21.2 Focal height (m) NA2 NA2
Competitor crown diameter (m) 6.99 6.05 Focal crown diameter (m) NA2 NA2
1 Some stands contained small numbers of Jeffrey pine (Pinus jeffreyi) or red fir (Abies mfor the species listed, and the total basal area.
2 NA = not applicable. No white fir (ABCO) or incense cedar (CADE) were selected as f
for quantifying the impacts of climate and competition on the growth of dominant pines.
2.3. Laboratory methods
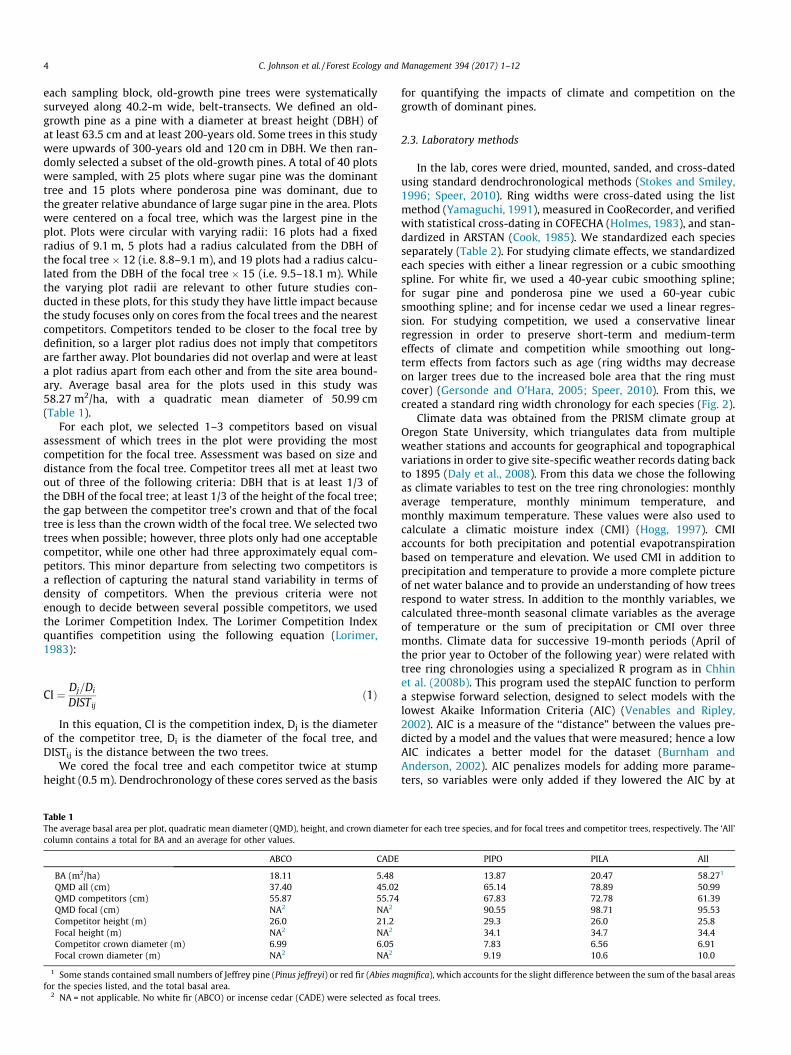
In the lab, cores were dried, mounted, sanded, and cross-dated using standard dendrochronological methods (Stokes and Smiley, 1996; Speer, 2010). Ring widths were cross-dated using the list method (Yamaguchi, 1991), measured in CooRecorder, and verified with statistical cross-dating in COFECHA (Holmes, 1983), and standardized in ARSTAN (Cook, 1985). We standardized each species separately (Table 2). For studying climate effects, we standardized each species with either a linear regression or a cubic smoothing spline. For white fir, we used a 40-year cubic smoothing spline; for sugar pine and ponderosa pine we used a 60-year cubic smoothing spline; and for incense cedar we used a linear regression. For studying competition, we used a conservative linear regression in order to preserve short-term and medium-term effects of climate and competition while smoothing out longterm effects from factors such as age (ring widths may decrease on larger trees due to the increased bole area that the ring must cover) (Gersonde and O’Hara, 2005; Speer, 2010). From this, we created a standard ring width chronology for each species (Fig. 2).
Climate data was obtained from the PRISM climate group at Oregon State University, which triangulates data from multiple weather stations and accounts for geographical and topographical variations in order to give site-specific weather records dating back to 1895 (Daly et al., 2008). From this data we chose the following as climate variables to test on the tree ring chronologies: monthly average temperature, monthly minimum temperature, and monthly maximum temperature. These values were also used to calculate a climatic moisture index (CMI) (Hogg, 1997). CMI accounts for both precipitation and potential evapotranspiration based on temperature and elevation. We used CMI in addition to precipitation and temperature to provide a more complete picture of net water balance and to provide an understanding of how trees respond to water stress. In addition to the monthly variables, we calculated three-month seasonal climate variables as the average of temperature or the sum of precipitation or CMI over three months. Climate data for successive 19-month periods (April of the prior year to October of the following year) were related with tree ring chronologies using a specialized R program as in Chhin et al. (2008b). This program used the stepAIC function to perform a stepwise forward selection, designed to select models with the lowest Akaike Information Criteria (AIC) (Venables and Ripley, 2002). AIC is a measure of the ‘‘distance” between the values predicted by a model and the values that were measured; hence a low AIC indicates a better model for the dataset (Burnham and Anderson, 2002). AIC penalizes models for adding more parameters, so variables were only added if they lowered the AIC by at
er for each tree species, and for focal trees and competitor trees, respectively. The ‘All’
PIPO PILA All
13.87 20.47 58.271
65.14 78.89 50.99 67.83 72.78 61.39
90.55 98.71 95.53 29.3 26.0 25.8 34.1 34.7 34.4 7.83 6.56 6.91 9.19 10.6 10.0
agnifica), which accounts for the slight difference between the sum of the basal areas
ocal trees.
5 C. Johnson et al. / Forest Ecology and Management 394 (2017) 1–12
Table 2 Statistics for standard tree ring chronologies for each tree species. ABCO = Abies concolor, CADE = Calocedrus decurrens, PIPO = Pinus ponderosa, PILA = Pinus lambertiana.
Species Chronology time # Mean Standard Absent rings Common interval time # trees in common Intercore span trees sensitivity deviation (%) span interval correlation
ABCO 1846–2014 34 0.1135 0.1315 0.045 1951–2013 30 0.312 CADE 1812–2014 13 0.1618 0.2680 0.207 1903–2014 8 0.385 PIPO 1718–2014 30 0.1343 0.1681 0.293 1872–2013 21 0.274 PILA 1785–2014 34 0.1067 0.1356 0.048 1902–2014 25 0.294
1.8
0.2
0.0
0.4
0.6
0.8
1.0
1.2
1.4
1.6
2010
2005
2000
1995
1990
1985
1980
1975
1970
1965
1960
1955
1950
1945
1940
1935
1930
1925
1920
1915
1910
1905
1900
1895
PIPO PILA ABCO CADE
Fig. 2. Standardized ring width chronologies for each species. PIPO = Pinus ponderosa, PILA = Pinus lambertiana, ABCO = Abies concolor, CADE = Calocedrus decurrens. This shows the ring widths for each species after a linear regression or smoothing spline has been applied to standardize growth, as described in Section 2.3 (Laboratory methods).
least 2 (Akaike, 1974). This produced species-specific results for relationships between climate and tree growth, on a monthly scale as well as a three-month seasonal scale. When models had multiple time periods that were significant to growth, they were ranked in order of importance using standardized partial regression coefficients (Zar, 1999).
To study interactions between climate and competition, we also calculated competitive chronologies between focal trees and competitor trees using the formula
Focal tree radial growth index Competition Ratio ¼ ð2Þ
Competitor radial growth index
Therefore, a competition ratio > 1 means that conditions favor the growth of the focal tree more than the growth of the competitor. A competition ratio < 1 means that conditions favor the competitor over the focal tree. These competition ratios were used as the basis for studying dendroclimatology and competition. In cases of missing rings, a value of 0.1 was substituted for the missing ring in order to avoid dividing by zero in calculating the competition ratio. We established categories of competitive chronologies based on which species were competing. The categories were: PIPO-PIPO, PIPO-ABCO, PILA-PILA, PILA-ABCO, or PILA-CADE, where the first species is the dominant focal tree. Other competition categories (PILA-PIPO, PIPO-CADE, PIPO-PILA) did not have a large enough sample size to be included. Additional categories were also created for PIPO-interspecific and PILA-interspecific, which included all interspecific competition chronologies for each focal tree species. Competitive chronologies were then averaged together with other chronologies of the same category. Competitive chronologies were created back to 1920, which ensured that all categories had a sample size of at least 8 instances of competition for the entire chronology. Competitive chronologies for each category were then related with climate data using the same methods that were applied for the species chronologies.
3. Results
3.1. Chronology characteristics
All species showed fairly high inter-core correlations, ranging from 0.274 for ponderosa pine up to 0.385 for incense cedar (Table 2). The average core was missing less than 0.3% of rings for each species. Mean sensitivity was between 0.1067 and 0.1618, with sugar pine at the low end and incense cedar at the high end.
3.2. Responses to mean temperature
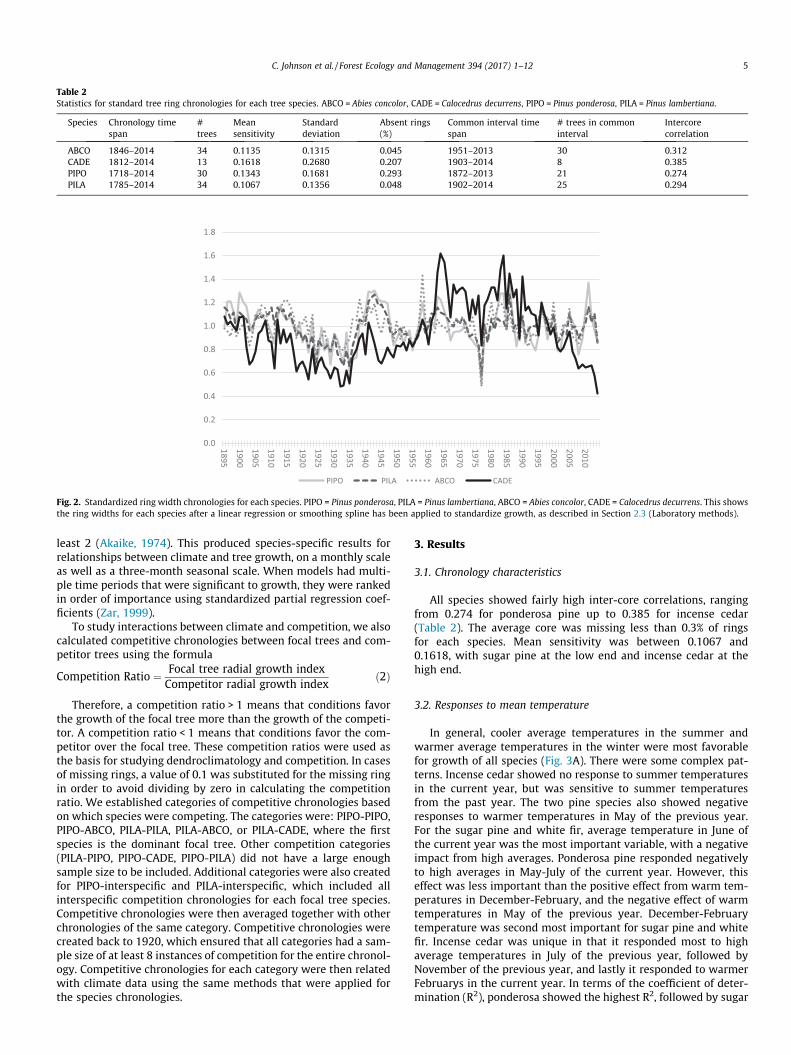
In general, cooler average temperatures in the summer and warmer average temperatures in the winter were most favorable for growth of all species (Fig. 3A). There were some complex patterns. Incense cedar showed no response to summer temperatures in the current year, but was sensitive to summer temperatures from the past year. The two pine species also showed negative responses to warmer temperatures in May of the previous year. For the sugar pine and white fir, average temperature in June of the current year was the most important variable, with a negative impact from high averages. Ponderosa pine responded negatively to high averages in May-July of the current year. However, this effect was less important than the positive effect from warm temperatures in December-February, and the negative effect of warm temperatures in May of the previous year. December-February temperature was second most important for sugar pine and white fir. Incense cedar was unique in that it responded most to high average temperatures in July of the previous year, followed by November of the previous year, and lastly it responded to warmer Februarys in the current year. In terms of the coefficient of determination (R2), ponderosa showed the highest R2, followed by sugar

6 C. Johnson et al. / Forest Ecology and Management 394 (2017) 1–12
A. Mean temperature: Individual species response Month
Group A M J J A S O N D J F M A M J J A S O R² PILA 3 2 1 0.208 PIPO 2 1 3 0.325
ABCO 2 1 0.180 CADE 1 2 3 0.148
B. Mean temperature: Competition ratio response Month
Group A M J J A S O N D J F M A M J J A S O R²
Fig. 3. Tree response to mean temperature by species (A), and competition ratio response to mean temperature by species pair (B). Dark coloring indicates a negative relationship with growth, while light coloring indicates a positive relationship according to a linear regression model. Numbers indicate order of significance (1 is the most important relationship according to standardized partial regression coefficients). All relationships that are shown are statistically significant (p < 0.05). PILA = Pinus lambertiana, PIPO = Pinus ponderosa, ABCO = Abies concolor, CADE = Calocedrus decurrens. N.S. indicates that no relationships were significant. Interspecific (IR) includes all trees of a different species from the focal tree. For competitive pairs (e.g. PILA-ABCO), the first species listed is the dominant focal tree, and the second species is the competitor.
PILA-PILA N.S. PIPO-PIPO 3 2 5 4 1 0.261
PILA-IR 0.058 PIPO-IR 1 2 0.139
PILA-ABCO 1 2 0.058 PILA-CADE 2 1 0.102 PIPO-ABCO 0.085
pine, then white fir, with incense cedar showing the weakest determination.
Average monthly temperature had somewhat different effects on competition ratios. Effects from the past year tended to be more important than effects from the current year (a trend which held for other climate variables as well). For average temperature, the most consistent effects were for temperature in the spring of the past year, and temperatures in July of the past year (Fig. 3 B). Warm spring temperatures in the past year favored competitors over focal trees for PIPO-interspecific, PIPO-ABCO, PILA-interspecific, and PILA-ABCO competition. The influence of past spring temperatures was the most significant effect for PIPO-Interspecific and PILA-ABCO; for PILA-Interspecific and PIPO-ABCO, it was the only significant effect. The second most significant effect for PIPO-Interspecific was that higher October averages in the past year favored competitors. For PILA-ABCO, the second largest effect was from October of the current year, where higher averages instead favored focal trees. For PILA-CADE competition, the number one effect was from February averages, with higher averages favoring competitors. The second most important factor was temperatures in July of the previous year, with warmer temperatures favoring focal trees. Overall, PIPO-PIPO competition showed the highest R2 value, while PILA-PILA had no significant effects at all and PILA-Interspecific, PILA-ABCO, and PIPO-ABCO all had R2 values under 0.1.
3.3. Responses to minimum temperature
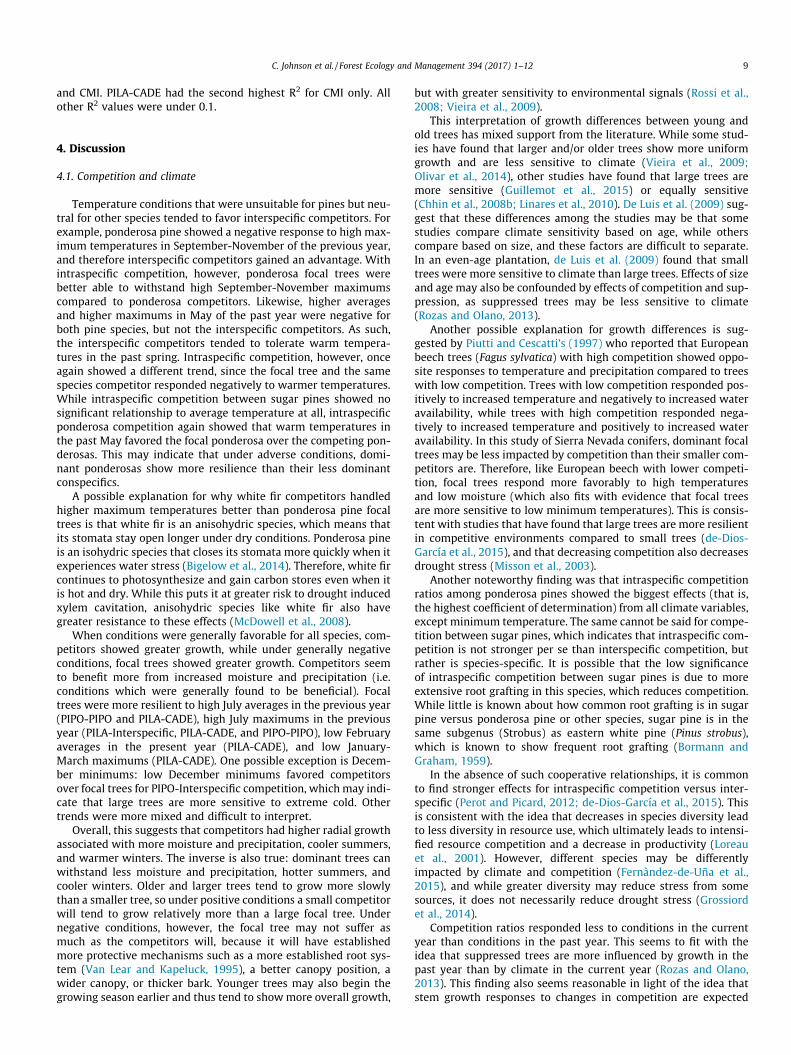
Higher minimum temperatures tended to be beneficial in the winter but harmful in the summer (Fig. 4A). Winter minimums (December-February) were more important than summer minimums for sugar pine, ponderosa, and white fir. July minimums in the current year were the second most important time for sugar pine and white fir; ponderosa pine showed an additional negative impact from high minimums in May of the previous year, which was more important than the impact from July of the current year. The chief exception to minimum temperature trends was incense cedar, which showed very little response to minimum temperatures and only responded to minimums in April of the previous
year. Higher minimums in the past April had a negative impact on incense cedar. Once again ponderosa pine showed the highest coefficient of determination and incense cedar showed the lowest.
Minimum temperatures mostly showed different trends for each competition category (Fig. 4B). Lower minimums in August (beta coefficient (b) = -0.417) and higher minimums in December (b = 0.235) benefited ponderosa focal trees over interspecific competitors (a higher beta coefficient (b) indicates a stronger relationship). Lower minimums for September-November of the previous year also benefited sugar pine focal trees over intraspecific competitors (b = -0.261). Lower minimums for May of the previous year benefited sugar pine focal trees over interspecific competitors (b = -0.229), and ponderosa pine focal trees over white fir competitors (b = -0.223) (the only minimum temperature effect that showed up in more than one category). PILA-CADE showed mixed trends, with high August minimums benefiting incense cedar competitors (b = -0.448), and high July minimums benefiting sugar pine focal trees (b = 0.297) in the current year. R2 values for minimum temperature were highest for PIPO-Interspecific, followed by PILA-CADE. Other R2 were <0.1 (PILA-PILA, PILA-Interspecific, PIPOABCO), otherwise no significant effects were found (PIPO-PIPO, PILA-ABCO).
3.4. Responses to maximum temperature
Higher maximum temperatures tended to be detrimental for growth, particularly in summer of the present year and late spring or early fall of the past year (Fig. 5A). Incense cedar again showed effects from hot summers in the previous year but not in the current year, while other species responded most to hot summers in the current year. For the two pine species, higher maximums in May of the previous year were also detrimental; ponderosa additionally showed a negative relationship with maximums in September-November, and a positive relationship with January maximums. White fir responded only to July maximums in the current year, with no impacts from the past year. Incense cedar, on the other hand, had a negative relationship to maximums in July and November both of the previous year, mirroring its negative relationship to July and November averages for the previous year.

2
7
A. Maximum temperature: Individual species response Month
A M J J A S O N D J F M A M J J A S O PILA 2 1 0.225 PIPO 2 3 4 1 0.335
ABCO 1 0.140 CADE 1 2 0.140
B. Minimum termperature: Competition ratio response Month
Fig. 4. Tree response to minimum temperature by species (A), and competition ratio response to minimum temperature by species pair (B). Conventions for labels and colors
C. Johnson et al. / Forest Ecology and Management 394 (2017) 1–12
A. Minimum temperature: Individual species response Month
Group A M J J A S O N D J F M A M J J A S O R² PILA 1 2 0.175 PIPO 2 1 3 0.312
ABCO 1 2 0.218 CADE 0.045
Group A M J J A S O N D J F M A M J J A S O R² PILA-PILA 0.068 PIPO-PIPO N.S.
PILA-IR 0.052 PIPO-IR 1 2 0.156
PILA-ABCO N.S. PILA-CADE 2 1 0.116 PIPO-ABCO 0.050
are the same as those described for Fig. 3.
Group R²
B. Maximum temperature: Competition ratio response Month
Group A M J J A S O N D J F M A M J J A S O R² PILA-PILA N.S. PIPO-PIPO 4 2 5 3 1 0.285
PILA-IR 1 2 0.131 PIPO-IR 1 2 0.103
PILA-ABCO 2 1 0.099 PILA-CADE 1 2 3 0.213 PIPO-ABCO 1 2 0.124
Fig. 5. Tree response to maximum temperature by species (A), and competition ratio response to maximum temperature by species pair (B). Conventions for labels and colors are the same as those described for Fig. 3.
Ponderosa pine had the highest R2 value and incense cedar was tied with white fir for lowest R2.
For competition ratios, maximum temperature showed some of the highest R2 values of any of the climate-competition variables (Fig. 5B), with the exception of PILA-PILA (which showed no signif-icant relationship to maximum temperature) and PIPO-Interspecific (which showed stronger determination from mini-mum and average temperature). The highest R2 value was for PIPO-PIPO, while the lowest were for PILA-PILA (no effect) and PILA-ABCO (the only one <0.1, but still the highest R2 value seen for PILA-ABCO). Higher maximum temperatures in the past July benefited focal trees for PILA-interspecific (b = 0.275) and PILA-CADE (b = 0.314), and was the top effect for both. Meanwhile, higher temperatures in the past spring tended to benefit inter-specific competitors for PIPO-interspecific (b = -0.244), PILA-ABCO (b = -0.201), and PIPO-ABCO (b = -0.305). Higher tempera-tures in the past fall seemed to benefit focal trees at sugar pine sites (#1 effect for PILA-ABCO, #2 effect for PILA-Interspecific and PILA-CADE), but benefited interspecific competitors at ponderosa sites (#2 effect for PIPO-Interspecific and PIPO-CADE). For intraspecific ponderosa competition, though, the focal tree seemed better able to withstand the warm fall temperatures (b = 0.302).
PIPO-PIPO competition showed the most effects, including a benefit to focal trees from high maximums in May of the past year (b = 0.344), and a benefit to competitors from high maximums in August (b = -0.263), April (b = -0.248), and July (b = 0.248) of the past year. Maximum temperatures in the current year showed little impact on competition ratios, other than for PILA-CADE which showed some benefit to competitors from high maximums in January-March (b = -0.245).
3.5. Responses to precipitation and CMI
More precipitation was almost always a positive for all species (Fig. 6A). Fall precipitation was generally not beneficial to growth in the current year, but did show benefits for growth in the next year. Winter precipitation from the past year and summer precip-itation in the current year tended to have the largest impact on growth, with the exception of ponderosa pine. Ponderosa responded most positively to precipitation in the late fall/early winter of the past year (October-December), followed by May of the past year, and lastly early spring of the current year (February-April). Unlike the other species, ponderosa did not show a response to summer precipitation. Sugar pine and white fir

8
PILA-PILA 0.045 PIPO-PIPO 3 1 2 0.245
PILA-IR N.S. PIPO-IR N.S.
PILA-ABCO N.S. PILA-CADE 0.044 PIPO-ABCO N.S.
C. Johnson et al. / Forest Ecology and Management 394 (2017) 1–12
A. Precipitation: Individual species response Month
Group A M J J A S O N D J F M A M J J A S O R² PILA 4 3 1 2 0.229 PIPO 2 1 3 0.193
ABCO 4 3 1 2 0.320 CADE 2 3 1 0.214
B. Precipitation: Competition ratio response Month
Group A M J J A S O N D J F M A M J J A S O R²
Fig. 6. Tree response to precipitation by species (A), and competition ratio response to precipitation by species pair (B). Conventions for labels and colors are the same as those described for Fig. 3.
precipitation: both were most responsive to precipitation in December-February, then precipitation in May-July of the current year, then September-November of the past year, and lastly May-July of the past year. Incense cedar was most responsive to August precipitation in the current year, followed by August-October of the past year, then November-January. All relationships to precipitation were positive. This time ponderosa showed the weakest coefficient of determination, followed by incense cedar. The strongest coefficient of determination
Like precipitation, a higher climate moisture index was generally positive for all species in most months and seasonal periods. This seemed to be especially true in the summer (both current and prior year) and the fall-winter of the past year, and less true in the spring and fall of the current year (Fig. 4E). Ponderosa was most responsive to CMI in July of the current year; incense cedar was most responsive to CMI in July of the past year. Sugar pine and white fir showed the greatest responses to CMI for May-July of the current year. Sugar pine had the second strongest effect from October-December, and then May-July of the previous year. Ponderosa’s second greatest effect was from May-July of the previous year, then September-November. White fir had the most effects from CMI. Its second greatest effect was for December-February,
showed identical responses to
was for white fir.
A. CMI: Individual species response Mo
Group A M J J A S O N D PILA 3 2 PIPO 2 3
ABCO 4 3 CADE 1 3
B. CMI: Competition ratio response M
Group A M J J A S O N DPILA-PILA PIPO-PIPO 2 3 1
PILA-IR PIPO-IR
PILA-ABCO PILA-CADE 1 PIPO-ABCO
Fig. 7. Tree response to CMI by species (A), and competition ratio response to CMI by spFig. 3.
then September-November, and lastly May-July of the previous year. Incense cedar had the second strongest effect for June-August of the current year, and lastly October-December. For R2
value, white fir was highest, followed by ponderosa, then sugar pine, and last of all incense cedar.
For competition ratios, competitors tended to benefit most from more moisture and precipitation, particularly in the past year (Figs. 6B and 7B). Higher precipitation in July of the past year benefited competitors for PILA-PILA competition; higher CMI in July of the past year benefited competitors for PILA-PILA competition and PILA-interspecific competition. Higher precipitation and higher CMI in May and in September-November of the past year benefited competitors in PIPO-PIPO competition, but higher precipitation and higher CMI in August of the past year benefited focal trees. Incense cedar benefited from wet summers in the current year as well as in the past year in PILA-CADE competition: incense cedar competitors benefited from more precipitation in July-September of the current year, and from higher CMI in July-September of the previous year as well as Precipitation did not affect competition PIPO-interspecific, PILA-ABCO, or PIPO-ABCO competition. PIPOinterspecific, PILA-ABCO, and PIPO-ABCO showed no impacts from CMI. The highest R2 value was for PIPO-PIPO for both precipitation
June-August of the current year. for PILA-interspecific,
nth J F M A M J J A S O R²
1 0.290 1 0.305
2 1 0.335 2 0.177
onth J F M A M J J A S O R²
0.057 0.227 0.064 N.S. N.S.
2 0.169 N.S.
ecies pair (B). Conventions for labels and colors are the same as those described for
9 C. Johnson et al. / Forest Ecology and Management 394 (2017) 1–12
and CMI. PILA-CADE had the second highest R2 for CMI only. All other R2 values were under 0.1.
4. Discussion
4.1. Competition and climate
Temperature conditions that were unsuitable for pines but neutral for other species tended to favor interspecific competitors. For example, ponderosa pine showed a negative response to high maximum temperatures in September-November of the previous year, and therefore interspecific competitors gained an advantage. With intraspecific competition, however, ponderosa focal trees were better able to withstand high September-November maximums compared to ponderosa competitors. Likewise, higher averages and higher maximums in May of the past year were negative for both pine species, but not the interspecific competitors. As such, the interspecific competitors tended to tolerate warm temperatures in the past spring. Intraspecific competition, however, once again showed a different trend, since the focal tree and the same species competitor responded negatively to warmer temperatures. While intraspecific competition between sugar pines showed no significant relationship to average temperature at all, intraspecific ponderosa competition again showed that warm temperatures in the past May favored the focal ponderosa over the competing ponderosas. This may indicate that under adverse conditions, dominant ponderosas show more resilience than their less dominant conspecifics.
A possible explanation for why white fir competitors handled higher maximum temperatures better than ponderosa pine focal trees is that white fir is an anisohydric species, which means that its stomata stay open longer under dry conditions. Ponderosa pine is an isohydric species that closes its stomata more quickly when it experiences water stress (Bigelow et al., 2014). Therefore, white fir continues to photosynthesize and gain carbon stores even when it is hot and dry. While this puts it at greater risk to drought induced xylem cavitation, anisohydric species like white fir also have greater resistance to these effects (McDowell et al., 2008).
When conditions were generally favorable for all species, competitors showed greater growth, while under generally negative conditions, focal trees showed greater growth. Competitors seem to benefit more from increased moisture and precipitation (i.e. conditions which were generally found to be beneficial). Focal trees were more resilient to high July averages in the previous year (PIPO-PIPO and PILA-CADE), high July maximums in the previous year (PILA-Interspecific, PILA-CADE, and PIPO-PIPO), low February averages in the present year (PILA-CADE), and low January-March maximums (PILA-CADE). One possible exception is December minimums: low December minimums favored competitors over focal trees for PIPO-Interspecific competition, which may indicate that large trees are more sensitive to extreme cold. Other trends were more mixed and difficult to interpret.
Overall, this suggests that competitors had higher radial growth associated with more moisture and precipitation, cooler summers, and warmer winters. The inverse is also true: dominant trees can withstand less moisture and precipitation, hotter summers, and cooler winters. Older and larger trees tend to grow more slowly than a smaller tree, so under positive conditions a small competitor will tend to grow relatively more than a large focal tree. Under negative conditions, however, the focal tree may not suffer as much as the competitors will, because it will have established more protective mechanisms such as a more established root system (Van Lear and Kapeluck, 1995), a better canopy position, a wider canopy, or thicker bark. Younger trees may also begin the growing season earlier and thus tend to show more overall growth,
but with greater sensitivity to environmental signals (Rossi et al., 2008; Vieira et al., 2009).
This interpretation of growth differences between young and old trees has mixed support from the literature. While some studies have found that larger and/or older trees show more uniform growth and are less sensitive to climate (Vieira et al., 2009; Olivar et al., 2014), other studies have found that large trees are more sensitive (Guillemot et al., 2015) or equally sensitive (Chhin et al., 2008b; Linares et al., 2010). De Luis et al. (2009) suggest that these differences among the studies may be that some studies compare climate sensitivity based on age, while others compare based on size, and these factors are difficult to separate. In an even-age plantation, de Luis et al. (2009) found that small trees were more sensitive to climate than large trees. Effects of size and age may also be confounded by effects of competition and suppression, as suppressed trees may be less sensitive to climate (Rozas and Olano, 2013).
Another possible explanation for growth differences is suggested by Piutti and Cescatti’s (1997) who reported that European beech trees (Fagus sylvatica) with high competition showed opposite responses to temperature and precipitation compared to trees with low competition. Trees with low competition responded positively to increased temperature and negatively to increased water availability, while trees with high competition responded negatively to increased temperature and positively to increased water availability. In this study of Sierra Nevada conifers, dominant focal trees may be less impacted by competition than their smaller competitors are. Therefore, like European beech with lower competition, focal trees respond more favorably to high temperatures and low moisture (which also fits with evidence that focal trees are more sensitive to low minimum temperatures). This is consistent with studies that have found that large trees are more resilient in competitive environments compared to small trees (de-Dios-García et al., 2015), and that decreasing competition also decreases drought stress (Misson et al., 2003).
Another noteworthy finding was that intraspecific competition ratios among ponderosa pines showed the biggest effects (that is, the highest coefficient of determination) from all climate variables, except minimum temperature. The same cannot be said for competition between sugar pines, which indicates that intraspecific competition is not stronger per se than interspecific competition, but rather is species-specific. It is possible that the low significance of intraspecific competition between sugar pines is due to more extensive root grafting in this species, which reduces competition. While little is known about how common root grafting is in sugar pine versus ponderosa pine or other species, sugar pine is in the same subgenus (Strobus) as eastern white pine (Pinus strobus), which is known to show frequent root grafting (Bormann and Graham, 1959).
In the absence of such cooperative relationships, it is common to find stronger effects for intraspecific competition versus inter-specific (Perot and Picard, 2012; de-Dios-García et al., 2015). This is consistent with the idea that decreases in species diversity lead to less diversity in resource use, which ultimately leads to intensified resource competition and a decrease in productivity (Loreau et al., 2001). However, different species may be differently impacted by climate and competition (Fernàndez-de-Uña et al., 2015), and while greater diversity may reduce stress from some sources, it does not necessarily reduce drought stress (Grossiord et al., 2014).
Competition ratios responded less to conditions in the current year than conditions in the past year. This seems to fit with the idea that suppressed trees are more influenced by growth in the past year than by climate in the current year (Rozas and Olano, 2013). This finding also seems reasonable in light of the idea that stem growth responses to changes in competition are expected
10 C. Johnson et al. / Forest Ecology and Management 394 (2017) 1–12
to have some lag (Vincent et al., 2009). A suppressed tree may need time to build up its root system, improve its canopy position, and increase its carbohydrate stores before it can show an increase in radial growth. Therefore, positive conditions in the previous year tend to make more of a difference for competitors than conditions in the current year.
4.2. Species specific dendroclimatology
Responses to temperature were as expected, and mostly consistent across species. Radial growth for all species tended to respond positively to warmer winters, which likely indicates that excessively cold conditions cause stress to trees. However, studies of temperature effects on Sierra Nevada mixed-conifer forests are lacking. Cold winters have been found to decrease radial growth before in dendroclimatology studies in other mountainous regions (Johnson et al., 1988; Chhin et al., 2008b). Stress may include freezing-induced embolism which can in turn lead to cavitation (Tyree and Sperry, 1989; Pittermann and Sperry, 2006). Temperatures below about 8 °C can inhibit productivity by reducing CO2
uptake (Fellows and Goulden, 2013). At a temperature of 0 °C, photosynthesis is reduced to half of maximum rates (Kelly and Goulden, 2016).
Decreases in radial growth corresponding to hot summers are a common finding (St. George, 2014). While warmer summer temperatures have positive effects in some climates, they become a negative when temperatures are high enough to increase evaporative water loss and slow photosynthesis (St. George, 2014; St. George and Ault, 2014). The Sierra Nevada tends to be very dry in the summer, so high summer temperatures can induce or compound moisture stress, as in Reichstein et al. (2007). Higher temperatures contribute to a higher vapor-pressure deficit, which in turn contributes to drought stress (Williams et al., 2012). Higher temperature also leads to increased respiration and loss of carbohydrates, which can make carbohydrate reserves from the previous year important for growth in the current year (Pallardy, 2007). This may explain why temperature in the past summer and spring are important for growth in the current year for sugar pine, ponderosa pine, and incense cedar. Spring and summer are the time when radial growth and height growth occur in California, which makes growing conditions particularly important during this time (Fowells, 1941). White fir may be less sensitive to past spring and summer temperatures because of its anisohydric characters which allows it to photosynthesize under dry conditions, while other species close their stomata and reduce carbon uptake during times of drought stress (McDowell et al., 2008).
Studies of ponderosa pine from other regions have underscored the importance of precipitation and moisture availability (especially summer precipitation and moisture) in determining growth (Watson and Luckman, 2002; Peterson et al., 1993). Growth of ponderosa pines in western Canada showed positive correlations to both precipitation and the Palmer Drought Severity Index (PDSI), with the strongest effects from yearly precipitation and July precipitation for the current year (Watson and Luckman, 2002). While the climate at Watson and Luckman’s (2002) sites were arid to semi-arid, they note that maximum precipitation tended to fall in June-July, with minimums in February-April (Watson and Luckman, 2002). This is a very different weather pattern from the one in the Sierra Nevada, which means that the monthly/seasonal results are not necessarily directly comparable, although the positive impact of precipitation and PDSI in a moisture-limited climate likely still applies. In Colorado ponderosa pines, growth also showed positive relationships to both precipitation and PDSI, particularly in the summer (Peterson et al., 1993). Growth responded negatively to spring temperature (Peterson et al., 1993) – similar to the negative relationship found here between temperature in the
past May and pine growth in the Sierra Nevada. The negative impact of warm springs may be related to snow pack. Guarín and Taylor (2005) found that April snowpack depth in Yosemite National Park had a significant negative correlation to tree mortality (i.e., more trees died in years with lower April snowpack), at sites that contained all the species present in this study. The association between mortality and low April snowpack was likely due to the reduced moisture availability later in the season. This may also explain the negative relationship that incense cedar and ponderosa pine both showed to higher minimum temperatures in the previous spring.
Growth studies of other Sierra Nevada mixed-conifer species are uncommon, probably because these species are less common outside the Sierra Nevada. After ponderosa pine, white fir has the broadest range outside the mountains of California. White fir in Utah has been shown to exhibit the best growth under cooler and wetter conditions (Shane and Harper, 1979). Dendroclimatology studies of mixed-conifer Sierra Nevada forest are rare. Bigelow et al. (2014) presents the most similar research to the work conducted here. Their research on the dendroclimatology of large Sierra Nevada conifers revealed responses to climate much like the ones found here. Namely, they found generally positive responses to precipitation from all species. They found similar responses to temperature: positive responses to winter minimums, negative responses to summer maximums, and a negative response to spring maximums in the past year. However, Bigelow et al. (2014) only found negative responses to summer temperature in white fir and incense cedar, and spring temperatures in the previous year had negative effects on ponderosa pine. The research presented here suggests that these effects may impact more species than previously thought. Bigelow et al. (2014) also limited their study only to trees >76 cm in DBH, while the average QMD for the competitor trees in this study was only 61 cm (Table 1). This suggests that these climatic effects also extend to somewhat smaller trees.
A higher CMI and higher precipitation were generally positive year-round for all species. In some moist climates, winter precipitation may have a negative effect as heavy snow loads may damage trees and persistent snowpack may delay the growing season (Chhin et al., 2008a). However, in California it is more common for winter precipitation to have a positive impact on growth because winter snowfall has the largest impact on moisture availability (St. George, 2014), most of the precipitation for the year falls in the winter (Dettinger et al., 2011), and snowmelt is an important determinant of water availability well into the warm season (Hamlet et al., 2007). Hence, winter tended to be the most important time for precipitation for sugar pine, ponderosa pine, and white fir. While winter precipitation increased the growth of incense cedar; for this species the most critical time for precipitation was August of the present year and August-October of the past year. This is consistent with research showing that shoot growth in incense cedar continues until October, and increases significantly with more watering (Harry, 1987).
Moisture availability (i.e. CMI) tended to be more critical during the summer growing season. This is consistent with a climate where most of the precipitation falls in the winter and most evapotranspiration occurs in the summer (Kelly and Goulden, 2016). In such a moisture-limited climate, more precipitation and higher CMI tend to be beneficial almost year-round. Incense cedar again tended to be most responsive to CMI in summer of the previous year, while other species were most responsive to CMI in summer of the current year. This may again be explained by the key role that summer and fall moisture play in shoot elongation for incense cedar (Harry, 1987): more shoot growth in the previous year leads to benefits in the following year as photosynthetic ability is increased.

11 C. Johnson et al. / Forest Ecology and Management 394 (2017) 1–12
Incense cedar also showed exception to the temperature trends. Compared to other species, incense cedar showed weaker relationships to temperature and seemed to be more sensitive to temperature in the previous summer than in the current year. It is not entirely surprising that incense cedar shows different trends from other Sierra Nevada conifers; while pines and firs are all part of the Pinaceae family, incense cedar is more distantly related, in the Cupressaceae family. It is also not entirely surprising that incense cedar is less sensitive to temperature, and particularly to winter minimums. In the winter, in yellow cedar (Chamaecyparis nootkatensis (D. Don) Spach) has shown the ability to quickly increase its cold tolerance, beyond that of western hemlock (Tsuga heterophylla (Raf.) Sarg.) (Schaberg et al., 2005). Yellow cedar is in the Cupressacae genus and shows indeterminate growth (i.e. leaf shoots that elongate continually rather than having a new flush of growth in the spring), making it similar to incense cedar. Hurteau et al. (2007) suggest that incense cedar is less sensitive to annual climate because it concentrates less of its growth into photosynthetic tissue, which leads to lower growth efficiency (Gersonde and O’Hara, 2005). Fowells (1941) similarly suggested that incense cedar might be slower growing than other mixed-conifer species, because it does not have an over-wintering bud but instead must continually invest in leaf elongation. Incense cedar was also unique in that it responded negatively to higher mean and maximum temperatures in November (although ponderosa was also negatively affected by high maximums in September-November). This is likely because in incense cedar, cold hardiness is developed in response to falling temperatures and not in response to decreasing photoperiod, as in most trees with determinate growth (Hawkins et al., 2001). Therefore warm temperatures in November could leave incense cedar trees particularly unprepared for cold temperatures in the winter months.
5. Conclusions
The dendroclimatic findings were consistent with the climate of the Sierra Nevada, which is moisture-limited and features cold winters and hot summers. More precipitation and more moisture availability were generally positive for growth in all seasons, and growth was favored by more mild temperatures in the winter and summer. Species responses to climate conditions influenced competitive dynamics. Conditions that tended to be harmful for pines but not for other species naturally tended to benefit other species at the expense of the pines. On the other hand, conditions that were positive for both focal trees and competitors tended to benefit competitors more, while focal trees were better able to maintain consistent growth under negative conditions. These findings imply that large pines may be resistant to future increasing temperatures and decreasing moisture, while smaller trees may fare worse. Findings also suggest that sensitivity to climate can vary with tree size, age, and/or dominance and canopy position, along with species. Not only that, but trees that are less affected by competition may even show opposite effects from trees that are heavily affected by competition, as suggested by Piutti and Cescatti (1997). There was also evidence that, while ponderosa pine shows relatively strong intraspecific competition, sugar pine shows little intraspecific competition, and suggests ameliorating effects such as the possibility of root grafting. These results should be taken into account in future dendroclimatic studies, and in making management decisions about mixed-age stands. In particular, the selection of management regime including thinning frequency and intensity to restore and safeguard the health and productivity of the old-growth pines should take into account that old-growth pines may need management attention even during suitable climate conditions when competitors have relatively higher perfor
mance. This research suggests many potential future research directions, including examining impacts of varying levels of competition, impacts of climate post-thinning compared to prethinning, impacts of tree species diversity on climate sensitivity, and studies of the extent of root grafting in Sierra Nevada species.
Acknowledgements
We thank B.-A. Breton, E. Caretti, R. Micklus, K. Minnix, C. Sodergren, and L. von der Linden for providing assistance in field sampling and sample processing. J. Zarlengo, L. Corral, E. Elliot, and H. Van Gieson from the Lassen National Forest, Almanor Ranger District provided logistical support. Thanks also go to F. Telewski and K. Mattson for providing comments on a previous version of the manuscript. Funding for this project was provided by Michigan State University (MSU) AgBioResearch (Project # MICL06016), MSU Graduate School, and a grant from the U.S. Forest Service, Pacific Southwest Research Station (Joint Venture Agreement # 14-JV-11272139-016).
References
Akaike, H., 1974. A new look at the statistical model identification. IEEE Trans. Autom. Control 19, 716–723.
Bigelow, S.W., Papaik, M.J., Caum, C., North, M.P., 2014. Faster growth in warmer winters for large trees in a Mediterranean-climate ecosystem. Clim. Change 123, 215–224.
Bormann, F.H., Graham, B.F., 1959. The occurrence of natural root grafting in eastern white pine, Pinus strobus L., and its ecological implications. Ecology 40, 677– 691.
Burnham, K.P., Anderson, D.R., 2002. Model Selection and Multimodel Inference. Springer-Verlag, New York.
Castagneri, D., Nola, P., Cherubini, P., Motta, R., 2012. Temporal variability of size– growth relationships in a Norway spruce forest: the influences of stand structure, logging, and climate. Can. J. For. Res. 42, 550–560.
Cavin, L., Mountford, E.P., Peterken, G.F., Jump, A.S., 2013. Extreme drought alters competitive dominance within and between tree species in a mixed forest stand. Funct. Ecol. 27, 1424–1435.
Chhin, S., Chumack, K., Dahl, T., David, E.T., Kurzeja, P., Magruder, M., Telewski, F.W., 2013. Growth-climate relationships of Pinus strobus in the floodway versus terrace forest along the banks of the Red Cedar River, Michigan. Tree-Ring Res. 69, 1–11.
Chhin, S., Hogg, E.H., Lieffers, V.J., Huang, S., 2008a. Influences of climate on the radial growth of lodgepole pine in Alberta. Botany 86, 167–178.
Chhin, S., Hogg, E.H., Lieffers, V.J., Huang, S., 2008b. Potential effects of climate change on the growth of lodgepole pine across diameter size classes and ecological regions. For. Ecol. Manage. 256, 1692–1703.
Chhin, S., Wang, G.G., 2002. Spatial and temporal pattern of white spruce regeneration within mixed-grass prairie in the Spruce Woods Provincial Park of Manitoba. J. Biogeogr. 29, 903–912.
Chhin, S., Wang, G.G., 2008. Climatic response of Picea glauca seedlings in a forest-prairie ecotone of western Canada. Ann. For. Sci. 65, 1–8.
Cook, E.R., 1985. A Time Series Analysis Approach to Tree Ring Standardization PhD Thesis. University of Arizona.
Daly, C., Halbleib, M., Smith, J.I., Gibson, W.P., Doggett, M.K., Taylor, G.H., Curtis, J., Pasteris, P.P., 2008. Physiographically sensitive mapping of climatological temperature and precipitation across the conterminous United States. Int. J. Climatol. 28, 2031–2064.
Das, A.J., 2012. The effect of size and competition on tree growth rate in old-growth coniferous forests. Can. J. For. Res. 42, 1983–1995.
Das, A.J., Battles, J., Stephenson, N.L., van Mantgem, P.J., 2011. The contribution of competition to tree mortality in old-growth coniferous forests. For. Ecol. Manage. 261, 1203–1213.
de-Dios-García, J., Pardos, M., Calama, R., 2015. Interannual variability in competitive effects in mixed and monospecific forests of Mediterranean stone pine. For. Ecol. Manage. 358, 230–239.
de Luis, M., Novak, K., Cufar, K., Raventós, J., 2009. Size mediated climate-growth relationships in Pinus halepensis and Pinus pinea. Trees 23, 1065–1073.
Dettinger, M.D., Ralph, F.M., Das, T., Neiman, P.J., Cayan, D.R., 2011. Atmospheric rivers, floods and the water resources of California. Water 3, 445–478.
Fellows, A.W., Goulden, M.L., 2013. Controls on gross production by a semiarid forest growing near its warm and dry ecotonal limit. Agric. For. Meteorol. 169, 51–60.
Fernàndez-de-Uña, L., Cañellas, I., Gea-Izquierdo, G., 2015. Stand competition determines how different tree species will cope with a warming climate. PLoS ONE 10, 1–18.
Fowells, H.A., 1941. The period of seasonal growth of ponderosa pine and associated species. J. For. 39, 601–608.
12 C. Johnson et al. / Forest Ecology and Management 394 (2017) 1–12
Gea-Izquierdo, G., Martín-Benito, D., Cherubini, P., Cañellas, I., 2009. Climate-growth variability in Quercus ilex L. west Iberian open woodlands of different stand density. Ann. For. Sci. 66, 802. 802–802.
Gedalof, Z., Smith, D.J., 2001. Dendroclimatic response of mountain hemlock (Tsuga mertensiana) in Pacific North America. Can. J. For. Res. 31, 322–332.
Gersonde, R.F., O’Hara, K.L., 2005. Comparative tree growth efficiency in Sierra Nevada mixed-conifer forests. For. Ecol. Manage. 219, 95–108.
Gómez-Aparicio, L., Garcia-Valdés, R., Ruiz-Benito, P., Zavala, M.A., 2011. Disentangling the relative importance of climate, size and competition on tree growth in Iberian forests: implications for forest management under global change. Glob. Chang. Biol. 17, 2400–2414.
Grantham, T.E., Merenlender, A.M., Resh, V.H., 2010. Climatic influences and anthropogenic stressors: An integrated framework for streamflow management in Mediterranean-climate California, USA. Freshwater Biol. 55, 188–204.
Grossiord, C., Granier, A., Ratcliffe, S., Bouriaud, O., Bruelheide, H., Checko, E., Forrester, D.I., Dawud, S.M., Finer, L., Pollastrini, M., Scherer-Lorenzen, M., Valladares, F., Bonal, D., Gessler, A., 2014. Tree diversity does not always improve resistance of forest ecosystems to drought. Proc. Nat. Acad. Sci. 111, 14812–14815.
Guarín, A., Taylor, A.H., 2005. Drought triggered tree mortality in mixed conifer forests in Yosemite National Park, California, USA. For. Ecol. Manage. 218, 229– 244.
Guillemot, J., Klein, E.K., Davi, H., Courbet, F., 2015. The effects of thinning intensity and tree size on the growth response to annual climate in Cedrus atlantica: a linear mixed modeling approach. Ann. For. Sci. 72, 651–663.
Hamlet, A.F., Mote, P.W., Clark, M.P., Lettenmaier, D.P., 2007. Twentieth-century trends in runoff, evapotranspiration, and soil moisture in the western United States. J. Clim. 20, 1468–1486.
Harry, D.E., 1987. Shoot elongation and growth plasticity in incense-cedar. Can. J. For. Res. 17, 484–489.
Hawkins, B.J., Russell, J.H., Arnott, J.T., 2001. Cold hardiness of yellow-cedar (Chamaecyparis nootkatensis (D. Don) Spach). In: Bigras, F.J., Colombo, S.J. (Eds.), Conifer Cold Hardiness. Springer, Dordrecht, Netherlands, pp. 281–304.
He, J.S., Zhang, Q.B., Bazzaz, F.A., 2005. Differential drought responses between saplings and adult trees in four co-occurring species of New England. Trees 19, 442–450.
Hogg, E.H., 1997. Temporal scaling of moisture and the forest-grassland boundary in western Canada. Agric. For. Meteorol. 84, 115–122.
Holmes, R.L., 1983. Computer-assisted quality control in tree-ring dating and measurement. Tree-ring Bull. 43, 69–78.
Hurteau, M.D., Zald, H., North, M.P., 2007. Species-specific response to climate reconstruction in upper-elevation mixed-conifer forests of the western Sierra Nevada, California. Can. J. For. Res. 37, 1681–1691.
Johnson, A.H., Cook, E.R., Siccama, T.G., 1988. Climate and red spruce growth and decline in the northern Appalachians. Proc. Nat. Acad. Sci. 85, 5369–5373.
Kelly, A.E., Goulden, M.L., 2016. A montane Mediterranean climate supports year-round photosynthesis and high forest biomass. Tree Physiol. 36, 459–468.
Kinloch, B.B., Jr., Scheuner, W.H., 1990. Pinus lambertiana Dougl. Sugar Pine. In: R.M. Burns R.M., and B. H. Honkala (tech coords). Silvics of North America. Volume I, Conifers. Agriculture Handbook 654. Washinglon, DC: U.S. Department of Agriculture.
Linares, J.C., Camarero, J.J., Carreira, J.A., 2010. Competition modulates the adaptation capacity of forests to climatic stress: insights from recent growth decline and death in relict stands of the Mediterranean fir Abies pinsapo. J. Ecol. 98, 592–603.
Loreau, M., Naeem, S., Inchausti, P., Bengtsson, J., Grime, J.P., Hector, A., Hooper, D.U., Huston, M.A., Raffaelli, D., Schmid, B., Tilman, D., Wardle, D.A., 2001. Biodiversity and ecosystem functioning: current knowledge and future challenges. Science 294, 804–808.
Lorimer, C.G., 1983. Tests of age-independent competition indices for individual trees in natural hardwood stands. For. Ecol. Manage. 6, 343–360.
Magruder, M., Chhin, S., Palik, B., Bradford, J.B., 2013. Thinning increases climatic resilience of red pine. Can. J. For. Res. 43, 878–889.
McDowell, N., Pockman, W.T., Allen, C.D., Breshears, D.D., Cobb, N., Kolb, T., Plaut, J., Sperry, J., West, A., Williams, D.G., Yepez, E.A., 2008. Mechanisms of plant survival and mortality during drought: why do some plants survive while others succumb to drought? New Phytol. 178, 719–739.
Misson, L., Nicault, A., Guiot, J., 2003. Effects of different thinning intensities on drought response in Norway spruce (Picea abies (L.) Karst.). For. Ecol. Manage. 183, 47–60.
Niinemets, U., 2010. Responses of forest trees to single and multiple environmental stresses from seedlings to mature plants: past stress history, stress interactions, tolerance and acclimation. For. Ecol. Manage. 260, 1623–1639.
Olivar, J., Bogino, S., Rathgeber, C., Bonnesoeur, V., Bravo, F., 2014. Thinning has a positive effect on growth dynamics and growth-climate relationships in Aleppo pine (Pinus halepensis) trees of different crown classes. Ann. For. Sci. 71, 395– 404.
Pallardy, S.G., 2007. Physiology of Woody Plants. Academic Press, San Diego, CA. Perot, T., Picard, N., 2012. Mixture enhances productivity in a two-species forest:
evidence from a modeling approach. Ecol. Res. 27, 83–94. Peterson, D.L., Arbaugh, M.J., Robinson, L.J., 1993. Effects of ozone and climate on
ponderosa pine (Pinus ponderosa) growth in the Colorado Rocky Mountains. Can. J. For. Res. 23, 1750–1759.
Pittermann, J., Sperry, J.S., 2006. Analysis of freeze-thaw embolism in conifers: the interaction between cavitation pressure and tracheid size. Plant Physiol. 140, 374–382.
Piutti, E., Cescatti, A., 1997. A quantitative analysis of the interactions between climatic response and intraspecific competition in European beech. Can. J. For. Res. 27, 277–284.
Potito, A.P., MacDonald, G.M., 2008. The effects of aridity on conifer radial growth, recruitment, and mortality patterns in the eastern Sierra Nevada, California. Arctic. Antarct. Alp. Res. 40, 129–139.
Pukkala, T., Lähde, E., Laiho, O., 2015. Which trees should be removed in thinning treatments? For. Ecosys. 2, 32.
Reichstein, M., Ciais, P., Papale, D., Valentini, R., Running, S., Viovy, N., Cramer, W., Granier, A., Ogee, J., Allard, V., Aubinet, M., Bernhofer, C., Buchmann, N., Carrara, A., Grunwald, T., Heimann, M., Heinesch, B., Knohl, A., Kutsch, W., Loustau, D., Manca, G., Matteucci, G., Miglietta, F., Ourcival, J.M., Pilegaard, K., Pumpanen, J., Rambal, S., Schaphoff, S., Seufert, G., Soussana, J.-F., Sanz, M.-J., Vesala, T., Zhao, M., 2007. Reduction of ecosystem productivity and respiration during the European summer 2003 climate anomaly: A joint flux tower, remote sensing and modelling analysis. Glob. Chang. Biol. 13, 634–651.
Ritchie, M.W., Wing, B.M., Hamilton, T.A., 2008. Stability of the large tree component in treated and untreated late-seral interior ponderosa pine stands. Can. J. For. Res. 38, 919–923.
Rossi, S., Deslauriers, A., Anfodillo, T., Carrer, M., 2008. Age-dependent xylogenesis in timberline conifers. New Phytol. 177, 199–208.
Royce, E.B., Barbour, M.B., 2001. Mediterranean climate effects. II. Conifer growth phenology across a Sierra Nevada ecotone. Am. J. Bot. 88, 919–932.
Rozas, V., 2014. Individual-based approach as a useful tool to disentangle the relative importance of tree age, size and inter-tree competition in dendroclimatic studies. IForest 8, 187–194.
Rozas, V., Olano, J.M., 2013. Environmental heterogeneity and neighbourhood interference modulate the individual response of Juniperus thurifera tree-ring growth to climate. Dendrochronologia 31, 105–113.
Ruiz-Benito, P., Lines, E.R., Gómez-Aparicio, L., Zavala, M.A., Coomes, D.A., 2013. Patterns and drivers of tree mortality in Iberian forests: climatic effects are modified by competition. PLoS ONE. http://dx.doi.org/10.1371/journal. pone.0056843.
Schaberg, P.G., Hennon, P.E., D’Amore, D.V., Hawley, G.J., Borer, C.H., 2005. Seasonal differences in freezing tolerance of yellow-cedar and western hemlock trees at a site affected by yellow-cedar decline. Can. J. For. Res. 35, 2065–2070.
Shane, J.D., Harper, K.T., 1979. Influence of precipitation and temperature on ring, annual branch increment, and needle growth of white fir and Douglas-fir in central Utah. The Great Basin Nat. 39, 219–255.
Smith, T.F., Rizzo, D.M., North, M., 2005. Patterns of mortality in an old-growth mixed-conifer forest of the southern Sierra Nevada, California. For. Sci. 51, 266– 275.
Speer, J.H., 2010. Fundamentals of Tree-Ring Research. University of Arizona Press, Tucson, AZ.
St. George, S., 2014. An overview of tree-ring width records across the Northern Hemisphere. Quat. Sci. Rev. 95, 132–150.
St. George, S., Ault, T.R., 2014. The imprint of climate within Northern Hemisphere trees. Quat. Sci. Rev. 89, 1–4.
Stokes, M.A., Smiley, T.L., 1996. An Introduction to Tree-Ring Dating. University of Arizona Press, Tucson, AZ.
Thomas, S.C., Winner, W.E., 2002. Photosynthetic differences between saplings and adult trees: an integration of field results by meta-analysis. Tree Physiol. 22, 117–127.
Tyree, M.T., Sperry, J.S., 1989. Vulnerability of xylem to cavitation and embolism. Annu. Rev. Plant Physiol. Plant Mol. Biol. 40, 19–38.
Valor, T., Piqué, M., López, B.C., González-Olabarria, J.R., 2013. Influence of tree size, reduced competition, and climate on the growth response of Pinus nigra Arn. salzmannii after fire. Ann. For. Sci. 70, 503–513.
Van Lear, D.H., Kapeluck, P.R., 1995. Above- and below-stump biomass and nutrient content of a mature loblolly pine plantation. Can. J. For. Res. 25, 361–367.
van Mantgem, P.J., Das, A.J., 2014. An individual-based growth and competition model for coastal redwood forest restoration. Can. J. For. Res. 44, 1051–1057.
Venables, W.N., Ripley, B.D., 2002. Modern Applied Statistics with S. Springer, New York.
Vieira, J., Campelo, F., Nabais, C., 2009. Age-dependent responses of tree-ring growth and intra-annual density fluctuations of Pinus pinaster to Mediterranean climate. Trees 23, 257–265.
Vincent, M., Krause, C., Zhang, S.Y., 2009. Radial growth response of black spruce roots and stems to commercial thinning in the boreal forest. Forestry 82, 557– 571.
Watson, E., Luckman, B.H., 2002. The dendroclimatic signal in Douglas-fir and ponderosa pine tree-ring chronologies from the southern Canadian Cordillera. Can. J. For. Res. 32, 1858–1874.
Williams, A.P., Allen, C.D., Macalady, A.K., Griffin, D., Woodhouse, C.A., Meko, D.M., Swetnam, T.W., Rauscher, S.A., Seager, R., Grissino-Mayer, H.D., Dean, J.S., Cook, E.R., Gangodagamage, C., Cai, M., McDowell, N.G., 2012. Temperature as a potent driver of regional forest drought stress and tree mortality. Nat. Clim. Change 3, 292–297.
Yamaguchi, D.K., 1991. A simple method for cross-dating increment cores from living trees. Can. J. For. Res. 21, 414–416.
Zar, J.H., 1999. Biostatistical Analysis. Prentice Hall, Upper Saddle River. Zhang, J., Ritchie, M.W., Maguire, D.A., Oliver, W.W., 2013. Thinning ponderosa pine
(Pinus ponderosa) stands reduces mortality while maintaining stand productivity. Can. J. For. Res. 43, 311–320.