forest statistics of the united states, 2002
TRANSCRIPT

Forest Resources of the United States, 2002
Forest Resources of the United States, 2002
U.S. DEPARTMENT OF AGRICULTURE FOREST SERVICE
A Technical Document Supporting the USDA Forest Service 2005 Update of the RPA Assessment
A Technical Document Supporting the USDA Forest Service 2005 Update of the RPA Assessment
W. BRAD SMITH, PATRICK D. MILES, JOHN S. VISSAGE, AND SCOTT A. PUGH

The U.S. Department of Agriculture (USDA) prohibits discrimination in all its programs and activities on the basis of race, color, national origin, sex, religion, age, disability, political beliefs, sexual orientation, and marital or family status. (Not all prohibited bases apply to all programs.) Persons with disabilities who require alternative means for communication of program information (Braille, large print, audiotape, etc.) should contact USDA’s TARGET Center at (202) 720-2600 (voice and TDD).
To file a complaint of discrimination, write USDA, Director, Office of Civil Rights, Room 326-W, Whitten Building, 1400 Independence Avenue, SW, Washington, DC 20250-9410 or call (202) 720-5964 (voice and TDD). USDA is an equal opportunity provider and employer.
THE AUTHORS:
W. Brad Smith is a Research Forester with theScience Policy, Planning, Inventory, andInformation Staff, Washington Office, U.S. Department of Agriculture, Forest Service,Washington, DC.
Patrick D. Miles is a Research Forester with theForest Inventory and Analysis Unit, NorthCentral Research Station, U.S. Department ofAgriculture, Forest Service, St. Paul, MN.
John S. Vissage is a Research Forester with theForest Inventory and Analysis Unit, NorthCentral Research Station, U.S. Department ofAgriculture, Forest Service, St. Paul, MN.
Scott A. Pugh is an Information TechnologySpecialist with the Forest Inventory andAnalysis Unit, North Central Research Station,U.S. Department of Agriculture, Forest Service,Houghton, MI.
Published by:
North Central Research StationForest Service - U.S. Department of Agriculture1992 Folwell AvenueSt. Paul, Minnesota 551082004
Web site: www.ncrs.fs.fed.us
IMPORTANT NOTE:The reader is cautioned that all tables in thisreport carry the nominal date of 2002. The actual data presented, however, represents thebest data available at the end of the 2001 fieldseason for each State. Table A-3 in Appendix Adisplays the actual date of data collection foreach State by data category. For example, a new inventory of North Carolina was completedafter the October 2001 cutoff date for data forthis report. As a result, the data in this report for North Carolina were based on information collected in 1990 and may not accuratelyreflect what appears in the 2002 NorthCarolina State inventory report.

Forest Resources of the United States, 2002
W. Brad Smith, Patrick D. Miles, John S. Vissage, and Scott A. Pugh

ACKNOWLEDGMENTS
The development of this report has been a team effort, involving the work and contributions ofmany people.
We greatly appreciate the help of the staffs of the Forest Inventory and Analysis Research Work Unitsat the Forest Service Research Stations and the Forest Management staffs in the regional offices ofthe National Forest System who compiled the basic resource data for entry into the 2002 RPANational Database. The following people made significant contributions and were responsible forcoordinating and submitting resource data and analytical input: Carol Alerich, Gary Boyack, DaveDarr, Dave Ellen, Jorge Negron, Bruce Hiserote, Tom Frieswyk, Jeff Hogg, Charles Keegan, DennisMay, Mel Mehl, Burt Mead, Kevin Dobbelbower, Eric Wharton, Sue Willits, Ralph Warbington, SharonWoudenberg, Ray Sheffield, Joe Glover, and Tony Johnson.
We also appreciate the efforts of the following people in reviewing the resource data: Doug Powell,Doug MacCleery, Mike Higgs, and Al Abee.

CONTENTS
PageIntroduction . . . . . . . . . . . . . . . . . . . . . . . . . . . . . . . . . . . . . . . . . . . . . . . . . . . . . . . . . . . . . . . . . . . . . . . . . . . . . . .1
Geographic Context of the United States . . . . . . . . . . . . . . . . . . . . . . . . . . . . . . . . . . . . . . . . . . . . . . . . . . . .1
Highlights . . . . . . . . . . . . . . . . . . . . . . . . . . . . . . . . . . . . . . . . . . . . . . . . . . . . . . . . . . . . . . . . . . . . . . . . . . . . . . . .3Forest Land Area . . . . . . . . . . . . . . . . . . . . . . . . . . . . . . . . . . . . . . . . . . . . . . . . . . . . . . . . . . . . . . . . . . . . . . .3Timberland Area . . . . . . . . . . . . . . . . . . . . . . . . . . . . . . . . . . . . . . . . . . . . . . . . . . . . . . . . . . . . . . . . . . . . . . . .4Timber Inventories . . . . . . . . . . . . . . . . . . . . . . . . . . . . . . . . . . . . . . . . . . . . . . . . . . . . . . . . . . . . . . . . . . . . . .4Mortality . . . . . . . . . . . . . . . . . . . . . . . . . . . . . . . . . . . . . . . . . . . . . . . . . . . . . . . . . . . . . . . . . . . . . . . . . . . . . .6Growth and Harvest . . . . . . . . . . . . . . . . . . . . . . . . . . . . . . . . . . . . . . . . . . . . . . . . . . . . . . . . . . . . . . . . . . . . .6Trends in Removals . . . . . . . . . . . . . . . . . . . . . . . . . . . . . . . . . . . . . . . . . . . . . . . . . . . . . . . . . . . . . . . . . . . . .8Ownership and Harvest . . . . . . . . . . . . . . . . . . . . . . . . . . . . . . . . . . . . . . . . . . . . . . . . . . . . . . . . . . . . . . . . . .8
References . . . . . . . . . . . . . . . . . . . . . . . . . . . . . . . . . . . . . . . . . . . . . . . . . . . . . . . . . . . . . . . . . . . . . . . . . . . . . .11
Glossary . . . . . . . . . . . . . . . . . . . . . . . . . . . . . . . . . . . . . . . . . . . . . . . . . . . . . . . . . . . . . . . . . . . . . . . . . . . . . . . .12
Appendix A: Procedures for the Update . . . . . . . . . . . . . . . . . . . . . . . . . . . . . . . . . . . . . . . . . . . . . . . . . . . . . . . .18Appendix B: Metric Equivalents for Various Units of Measure . . . . . . . . . . . . . . . . . . . . . . . . . . . . . . . . . . . . . . .23Appendix C: Accuracy of the Data . . . . . . . . . . . . . . . . . . . . . . . . . . . . . . . . . . . . . . . . . . . . . . . . . . . . . . . . . . . .24Appendix D: Common and Scientific Names of Major Tree Species . . . . . . . . . . . . . . . . . . . . . . . . . . . . . . . . .25
List of Tables . . . . . . . . . . . . . . . . . . . . . . . . . . . . . . . . . . . . . . . . . . . . . . . . . . . . . . . . . . . . . . . . . . . . . . . . . . . . .26Resource Tables . . . . . . . . . . . . . . . . . . . . . . . . . . . . . . . . . . . . . . . . . . . . . . . . . . . . . . . . . . . . . . . . . . . . . .29

1
Introduction
Forest resource growth, harvests, and land useconversion can change inventories within States,among regions, and even among countries, andcan significantly influence the future perform-ance of resources. This could affect the State,regional, and national economies that depend onthe affected resources, as well as the resourceenvironments. Periodic surveys provide informa-tion needed to assess the current status andperformance of resources, and to estimate theirfuture condition. As required by the Forest andRangeland Renewable Resources Planning Act of1974 (RPA), P.L. 93-378, 88 Stat. 4765, asamended, this report updates information onthe Nation’s forest resource.
This report updates resource statistics publishedby Smith et al. (2001). For brevity and balance inpresenting reporting periods in tabular outputs,RPA Assessment data for 1963, 1970, and 1992have been omitted from this report. To provide acontext for evaluating and interpreting changesin the forest resource, data for 1953, 1963 (sometables), 1977, 1987, and 1997 are included. Aforest type map produced from satellite imagerydisplaying the area and location of forest land inthe United States is available on the Internet athttp://www.nationalatlas.gov. A compact disk(CD) is provided in a pocket at the back of thispublication that contains the data used for thisreport and an interactive computer tool foraccessing and displaying the data in tables andmaps. A user manual with tutorials is providedon the CD.
Geographic Context of the United States
The main landmass of the United States, situatedin mid-North America (fig. 1), has a central plainwith hills and low mountains to the east andrugged mountains and wide valleys to the west.Alaska, on Canada’s western border, is domi-nated by Pacific and Arctic mountains, centralplateau, and Arctic slope. Hawaii, comprised oftops of a chain of submerged volcanic moun-tains, lies 1,600 miles west of the mainland inthe north Pacific.
Original forests were abundant throughout theEastern U.S., mountainous regions of the interiorand coastal west, Hawaii, and non-polar regions
of Alaska. Today, the forests of the UnitedStates cover 749 million acres, are split almostevenly east and west of the central plain, andcontain over 800 species of trees of which 82 arenon-native. About one-third of the pre-Europeansettlement forest has been cleared, primarily foragriculture during the 19th century. Althoughthere have been significant regional changes, thetotal area of forest land has been fairly stable fornearly 100 years.
A forest type map based on types described byEyre (1980) was produced from satellite imageryand is available to display the spatial extentand location of forest land in the UnitedStates. This map may be found online athttp://www.nationalatlas.gov/fortypem.html,and further information about the mappingprocess can be found in Zhu and Evans (1992).
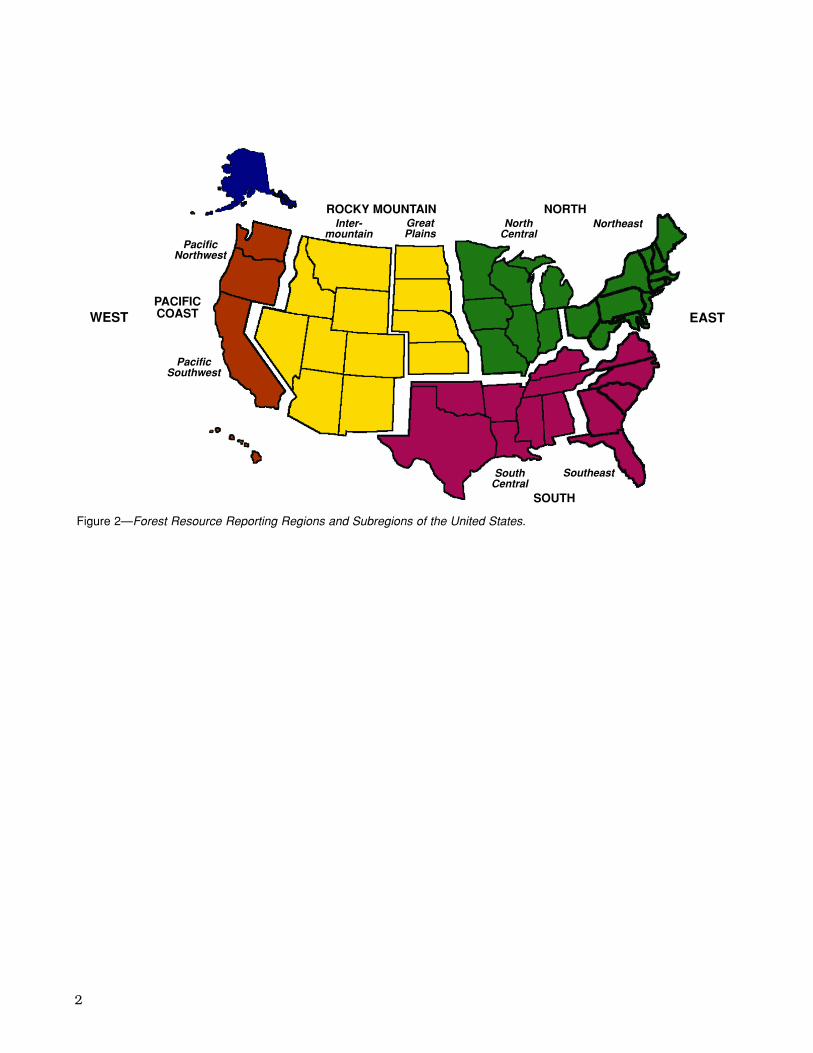
For this report, the United States is divided intofour major regions: North, South, Rocky Mountain,and Pacific Coast as shown in figure 2. Thesemajor regions are divided into subregions forfurther geographic reference. Due to a lack of his-toric field data, Alaska is frequently considered aseparate region in these highlights.
Figure 1—Geographic location of the United States in NorthAmerica.
2
Figure 2—Forest Resource Reporting Regions and Subregions of the United States.
PACIFICCOAST
PacificNorthwest
PacificSouthwest
ROCKY MOUNTAINInter-
mountainGreatPlains
NorthCentral
SouthCentral
NORTHNortheast
Southeast
SOUTH
WEST EAST

Highlights
Information compiled for this Assessment Updateindicates that the forest resources of the U.S. havecontinued improving in general condition andquality, as measured by increased average sizeand volume of trees. This trend has been evidentsince the 1960s and before. However, if qualityis measured as a function of optimum standdensity—that is, optimum number of trees peracre for stands of a given age—then the overallquality of many stands has deteriorated.
The following are some highlights from the newinformation:
Forest Land Area
• Forest land area increased from 747 to 749million acres (0.3 percent) between 1997 and2002, continuing a slight upward trend inarea beginning in the late 1980s.
• About 33 percent of the 2.3 billion acres ofland area in the U.S. is forest today (fig. 3) ascompared to about one-half in 1630 (1.0 billionacres). Some 300 million acres of forest landhave been converted to other uses since 1630,predominantly agricultural uses in the East.
3
Figure 3—Land and forest area distribution in the U.S.,1630 and 2002.
• Nearly two-thirds of the net loss of forests toother uses occurred between 1850 and 1900.By 1920, the clearing of forests for agriculturehad largely subsided (fig. 4).
Figure 4—Forest area of the United States by major region,1630-2002.
• Fifty-seven percent of all forest land isprivately owned (fig. 5). Public forest land isdominant in the western U.S. and privateforest land is dominant in the East.
• Land transfers deriving from the AlaskaNative Claims Settlement Act of 1971 andupdating of forestland survey data continue.This assessment includes updated estimatesfor approximately 185 million acres in Alaska.Current FIA plots indicate that private landowners control a minimum of 18.887 millionacres of forestland in Alaska. Actual ownershipof non-industrial private forestland in Alaska isbelieved to be as much as 35 million acres.
• About 77 million acres of forest land (10 percentof all U.S. forest land) is reserved from com-mercial timber harvest in wilderness, parks,and other legally reserved classifications

4
(fig. 6). This is more than double the area of reserved forest in 1953 with major increasesoccurring in the West. The sharp increase in the Pacific Coast region since 1997 is due to
reclassification of lands in Alaska transferredfrom the Bureau of Land Management to thePark Service and Fish and Wildlife Service.
Timberland Area
• About 504 million acres of forest land (two-thirdsof all forest land) is classed as timberland—forest land capable of producing in excessof 20 cubic feet per acre per year and notlegally withdrawn from timber production—94 percent of eastern forests are classed astimberland, 80 percent of the Pacific North-west, about 50 percent of the interior Westand Southwest, and 10 percent of Alaska.
• Since 1953, the area of timberland had a netloss of about 1 percent, or about 5 millionacres. Over the last 5 decades, losses havecome primarily from withdrawals of publictimberland as wilderness or other reservedforests that do not permit timber harvest,and conversion of timberland to nonforestland use. Most increases have come fromreclassification of marginally productiveforests and reversion of abandoned lands.
Timber Inventories
• Growing-stock volume on U.S. timberlandincreased from 616 to 856 billion cubic feet(39 percent) between 1953 and 2002 (fig. 7).Between those years, average growing-stockvolume rose by 96 percent in the North, 80percent in the South, and 42 percent in theRocky Mountain region. Volume declined inthe Pacific Coast region. The loss of timber-land in the Pacific Coast region is the resultof harvesting in older, higher volume standssince 1953 and set asides of large areas ofolder stands in reserved forests (which reclas-sifies trees in these areas as non-growingstock). The rate of loss has subsided inrecent years as harvesting has been sharplycurtailed and total volume for the region hasbegun to stabilize.
• Some 57 percent of the volume of growingstock is softwoods, with the remaining 43 per-cent is in hardwoods. However, 90 percent ofthe hardwood timber is in the Eastern United
Figure 5—Distribution of forest land by major region andownership group.
Figure 6—Trends in reserved forest land by major region,1953-2002.

5
States. About 68 percent of the softwood timber is in the Western United States and 22 percent is in the South.
• Because hardwood growth greatly exceedsharvest, the quantity of larger hardwood trees generally continues to increase. How-ever, highgrading, or removing only the largestand best trees, may create shortagesof highquality trees in some localities.
• The net growing-stock volume of U.S. hardwoodsincreased by 37 percent between 1977 and2002 and by 98 percent between 1953 and2002. This rapid increase has subsided inrecent years as changing technology hasincreased demand for hardwood species inproduct manufacture.
• The volume of hardwoods in diameter classesgreater than 20 inches has doubled since1953, from 26 to 66 billion cubic feet in 2002(fig. 8).
Figure 7—Trends in growing-stock volume on timberlandby region, 1953-2002.
Figure 8—Distribution of hardwood growing stock ontimberland by diameter class, 1953, 1977, and 2002.
• The net volume of U.S. softwoods increasedfrom 432 billion to 492 billion cubic feet (14percent) between 1953 and 2002. Volumes arehigher in all diameter classes below 25 inches(fig. 9). Lower volumes in larger trees since1953 are the result of harvesting of large treesand the increased area set aside as reservedforest (which reclassifies trees in these areasas non-growing stock).
Figure 9—Distribution of softwood growing stock ontimberland by diameter class, 1953, 1977, and 2002.

6
Growth and Harvest
• Data for the Nation as a whole indicate thatgrowth has exceeded removals for both soft-woods and hardwoods since the first nationalstatistics were reported for 1952. In 2001, forthe Nation, net growth exceeded removals by33 percent (fig. 12). That is, the Nation’s for-est inventory accrued more volume than itlost by mortality and harvest by nearly one-third. Recent declines in harvesting on publiclands in the West have significantly deviatedfrom historic growth/removals patterns andhave placed more pressure on eastern foreststhat are predominantly in private ownership.
• In the 1920s, timber growth nationally wasabout half the rate of harvest. By the 1940s,improving forest growth rates and modestlydeclining harvest rates resulted in timbergrowth and harvest coming into approximatebalance. By 1952, timber growth nationallyexceeded harvest by 17 percent. Since the1950s, timber growth has consistentlyexceeded harvest.
• Net timber growth exceeded harvest by 54percent in 1976, 36 percent in 1986, and 33 percent in 2001. Net growth rates have not been increasing as rapidly as in the past, while harvest levels have remained relatively stable since 1986. Additionalresource demands have been met byincreased imports.
• In 2001, growth exceeded removals in allregions of the country: in the North by 49percent, in the South by 12 percent, in theRocky Mountains by 74 percent, and in thePacific Coast region by 47 percent. For the
• The slower increase in standing volume forsoftwoods versus hardwoods is the result ofstronger historic demand for softwood speciesin wood product manufacture.
• For the first time since 1953, declines wereobserved for softwood inventory on privatelands and hardwood inventory on forestindustry lands in the South.
• For the South as a whole, the volume of standing softwood inventory increased by 3 percent between 1997 and 2002, reversinga decline of 0.7 percent between 1987and 1997.
Mortality
• Timber mortality increased between 1976and 2001 in all regions of the country, onall ownerships, and for both hardwoods andsoftwoods (fig. 10). Nationally, the volume ofmortality was up 54 percent from 1976 to2001, from 4.1 billion cubic feet to 6.3 billioncubic feet—0.74 percent of the growing-stockinventory in 2001 compared to 0.56 percentin 1976. Softwood mortality rose by 46 per-cent between 1976 and 2001 and hardwoodmortality rose by 66 percent. Although theseincreases are significant, there is no evidenceto suggest that they are beyond the range ofnormal variability as the rate has fluctuatedup and down since the first national statisticswere reported in 1953. Continued monitoringwill be critical in providing more information.
• Timber mortality rates in the South increasedbetween 1976 and 2001—36 percent for hard-woods and 37 percent for softwoods (fig. 11).Recent insect outbreaks in the South andWest as well as hurricane impacts in theSouth were significant factors in sharplyrising mortality rates. Regional mortalitypatterns reflect the impact of these events.
The relationship of growth and removals is acoarse-filter measure that approximates thenotion of sustainable production: If the Nationis growing more wood than it is cutting itimplies that levels of wood production andstanding volume are sustainable. Growth isassumed to be a measure of sustainable out-put. However, the relationship conveys noinformation about quality, forest types, size,and other attributes of growth and harvest.

7
Figure 10—Mortality as a percent of growing-stock volume on timberland by major owner group, 1952-2001.
Figure 11—Mortality as a percent of growing-stock volume on timberland by species group and region, 1952-2001.

8
United States, hardwood growth exceededremovals by 42 percent, and softwoods by 26 percent.
• Total timber growth increased by about 72percent between 1952 and 2001.
• In the South, softwood removals were approximately equal to growth in 2001.
Trends in Removals
• Timber harvests have remained stable since1986 but have risen by 13 percent since1976. In 2001, growing-stock removalstotaled 16 billion cubic feet.
• In 2001, about 64 percent of the volume of timber removals was softwoods and 36 percent was hardwoods, compared with 69 and 31 percent, respectively, in 1986. This reflects a trend toward rising hardwoodremovals in response to new product technologies using hardwoods.
• The South accounted for 63 percent ofgrowing-stock removals in 2001, up from51 percent in 1986.
• The predominant use of growing stockcontinues to be for lumber and plywoodmanufactured predominantly from sawlogs and veneer logs. Saw logs accounted for49 percent of growing-stock volume harvestedin 2001, veneer logs—9 percent, and pulp-wood—35 percent. The remaining 7 percentwas used for fuelwood and other products.Pulp and composite product demand continuesto rise, increasing by 25 percent since 1986(fig. 13).
Ownership and Harvest
• Seventy-one percent of timberland is privatelyowned (including forest industry), but theselands accounted for 92 percent of growing-stock removals in 2001.
• Non-industrial private ownerships made up58 percent (291 million acres) of U.S. timber-land and accounted for 63 percent of thevolume of growing-stock removals in 2001.Timber harvest on non-industrial private forest lands increased by about 46 percentbetween 1986 and 2001 as a large share ofharvesting shifted from the Pacific Northwestto the South (fig. 14).
Figure 12—Growing-stock growth and removals by major region, 1952-2001.

9
• Industrial private forests accounted for 13percent of U.S. timberland (66 million acres).Although these forests contain only 12 per-cent of the growing-stock volume, in 2001they accounted for 29 percent of the volume of growing stock harvested.
• Public forests comprise 29 percent (148 millionacres) of U.S. timberland. National forests arethe largest Federal ownership, making up 19percent of U.S. timberland but accounting foronly 2 percent of timber harvest in 2001.National forest timber harvest levels declinedby 84 percent between 1986 and 2001, afterrising by 92 percent between 1952 and 1986.
• Other public forests made up 10 percent ofU.S. timberland and accounted for 6 percentof growing-stock removals in 2001 as harvest-ing on public forests continued to decline.Harvest on other public forest lands declinedby 14 percent between 1986 and 2001.
Figure 13.—Trends in growing stock harvested for timber products output, 1952-2002.
Figure 14—Proportion of timberland area, growing-stockvolume, and harvest volume by ownership group, 2001.
10
Board Foot Tables
This document does not contain board foottables. However, recognizing an important clientbase for these tables to compare historic datafor certain products or geographic regions, thesetables may be downloaded from the FIA Web siteat http://www.fia.fs.fed.us/rpa.
Additional Analysis
Additional analysis of the 2002 data may befound in the 2003 National Report onSustainable Forests (http://www.fs.fed.us/research/sustain/data.htm). Most of the datafor Criterion 2, derived primarily from the RPAdata in this report, were provided by ForestInventory and Analysis (http://www.fia.fs.fed.us).

11
References
Butler, M.A.; Beale, C.L. 1993. Rural-urban continuum codes for metro and non-metrocounties, 1993. Staff Rep. U.S. Department ofAgriculture, Economic Research Service,Agriculture and Rural Economy Division.
Eyre, F.H., ed. 1980. Forest cover types of theUnited States and Canada. Bethesda, MD:Society of American Foresters. 148 p. 1map sheet.
Kellogg, R.S. 1909. The timber supply of theUnited States. For. Resour. Circ. 166.Washington, DC: U.S. Department ofAgriculture, Forest Service. 24 p.
Little, Elbert L., Jr. 1979. Checklist of UnitedStates trees (native and naturalized). Agric.Handb. 541. Washington, DC: U.S. Depart-ment of Agriculture, Forest Service. 375 p.
May, Dennis M. 1998. The North Central ForestInventory and Analysis timber product out-put base–a regional composite approach.Gen. Tech. Rep. NC-200. St. Paul, MN: U.S.Department of Agriculture, Forest Service,North Central Research Station. 16 p.
Smith, W. Brad. 1991. Assessing removals forNorth Central forest inventories. Res. Pap.NC-299. St. Paul, MN: U.S. Department ofAgriculture, Forest Service, North CentralForest Experiment Station. 48 p.
Smith, W. Brad; Vissage, John S.; Darr, DavidR.; Sheffield, Raymond M. 2001. Forestresources of the United States, 1997.Gen. Tech. Rep. NC-219. St. Paul, MN: U.S.Department of Agriculture, Forest Service,North Central Research Station. 190 p.
U.S. Congress. 1938. Data presented in the“Report of the Joint Committee onForestry.” 77th Congress, 1st Session.Document No. 32.
U.S. Department of Agriculture, Forest Service.1958. Timber resource for America’sfuture. For. Resour. Rep. 14. Washington,DC: U.S. Department of Agriculture, ForestService. 713 p.
U.S. Department of Agriculture, Forest Service.1965. Timber trends in the United States.For. Resour. Rep. 17. Washington, DC:U.S. Department of Agriculture, ForestService. 235 p.
U.S. Department of Agriculture, Forest Service.1982. Analysis of the timber situation inthe United States, 1952-2030. For. Resour.Rep. 23. Washington, DC: U.S. Departmentof Agriculture, Forest Service. 499 p.
U.S. Department of Agriculture, Forest Service.2001. Land areas of the National ForestSystem, as of September 30, 2000. FS-383.Washington, DC: U.S. Department ofAgriculture, Forest Service. 88 p.
Waddell, Karen L.; Oswald, Daniel D.; Powell,Douglas S. 1989. Forest statistics of theUnited States, 1987. Resour. Bull. PNW-168.Portland, OR: U.S. Department of Agriculture,Forest Service, Pacific Northwest ResearchStation. 106 p.
Zhu, Zhiliang; Evans, David L. 1992. Mappingmidsouth forest distributions with AVHRRdata. Journal of Forestry. 90(12): 27-30.
12
Glossary
Annual mortality—The average annualvolume of sound wood in growing-stock treesthat died from natural causes during theperiod between inventories.
Annual removals—The net volume of growing-stock trees removed from the inventory duringa specified year by harvesting, cultural opera-tions such as timber stand improvement, orland clearing.
Bureau of Land Management (BLM)—Anownership class of Federal lands administeredby the Bureau of Land Management, U.S.Department of the Interior.
Coarse materials—Wood residues suitable forchipping, such as slabs, edgings, and trimmings.
Commercial species—Tree species suitable forindustrial wood products.
County and municipal—An ownership class ofpublic lands owned by counties or local publicagencies, or lands leased by these governmentalunits for more than 50 years.
Cull tree—A live tree, 5.0 inches in diameter atbreast height (d.b.h.) or larger, that is unmer-chantable for saw logs now or prospectivelybecause of rot, roughness, or species. (Seedefinitions for rotten and rough trees.)
Diameter class—A classification of trees basedon diameter outside bark measured at breastheight (4-1/2 feet above ground). D.b.h. is thecommon abbreviation for diameter at breastheight. With 2-inch diameter classes, the 6-inchclass, for example, includes trees 5.0 through6.9 inches d.b.h.
Federal—An ownership class of public landsowned by the U.S. Government.
Fiber products—Products derived from woodand bark residues, such as pulp, compositionboard products, and wood chips for export.
Fine materials—Wood residues not suitable forchipping, such as planer shavings and sawdust.
Forest industry—An ownership class of privatelands owned by companies or individualsoperating wood-using plants.
Forest land—Land at least 10 percent stockedby forest trees of any size, including land thatformerly had such tree cover and that will benaturally or artificially regenerated. Forest landincludes transition zones, such as areas betweenheavily forested and nonforested lands that areat least 10 percent stocked with forest trees andforest areas adjacent to urban and built-uplands. Also included are pinyon-juniper andchaparral areas in the West and afforestedareas. The minimum area for classification offorest land is 1 acre. Roadside, streamside, andshelterbelt strips of trees must have a crownwidth of at least 120 feet to qualify as forestland. Unimproved roads and trails, streams,and clearings in forest areas are classified asforest if less than 120 feet wide.
Forest type—A classification of forest landbased on the species presently forming aplurality of the live-tree stocking.
Forest type group—A combination of foresttypes that share closely associated species orsite requirements and are generally combinedfor brevity of reporting.
Major eastern forest type groups: White-red-jack pine—Forests in whicheastern white pine, red pine, or jack pine,singly or in combination, comprise a plur-ality of the stocking. Common associatesinclude hemlock, aspen, birch, and maple.
Spruce-fir—Forests in which spruce or truefirs, singly or in combination, comprise aplurality of the stocking. Common associatesinclude white cedar, tamarack, maple, birch,and hemlock.
Longleaf-slash pine—Forests in whichlongleaf or slash pine, singly or in combina-tion, comprise a plurality of the stocking.Common associates include other southernpines, oak, and gum.
Loblolly-shortleaf pine—Forests in whichloblolly pine, shortleaf pine, or southern

13
yellow pines, except longleaf or slash pine,singly or in combination, comprise a pluralityof the stocking. Common associates includeoak, hickory, and gum.
Oak-pine—Forests in which hardwoods(usually upland oaks) comprise a plurality ofthe stocking, but in which pine or easternredcedar comprises 25-50 percent of thestocking. Common associates include gum,hickory, and yellow-poplar.
Oak-hickory—Forests in which upland oaksor hickory, singly or in combination, com-prise a plurality of the stocking except wherepines comprise 25-50 percent, in which casethe stand is classified as oak-pine. Commonassociates include yellow-poplar, elm, maple,and black walnut.
Oak-gum-cypress—Bottomland forests inwhich tupelo, blackgum, sweetgum, oaks, orsouthern cypress, singly or in combination,comprise a plurality of the stocking exceptwhere pines comprise 25-50 percent, inwhich case the stand is classified as oak-pine.Common associates include cottonwood,willow, ash, elm, hackberry, and maple.
Elm-ash-cottonwood—Forests in which elm,ash, or cottonwood, singly or in combina-tion, comprise a plurality of the stocking.Common associates include willow,sycamore, beech, and maple.
Maple-beech-birch—Forests in which maple,beech, or yellow birch, singly or in combina-tion, comprise a plurality of the stocking.Common associates include hemlock, elm,basswood, and white pine.
Aspen-birch—Forests in which aspen,balsam poplar, paper birch, or gray birch,singly or in combination, comprise a plur-ality of the stocking. Common associatesinclude maple and balsam fir.
Major western forest type groups: Douglas-fir—Forests in which Douglas-fircomprises a plurality of the stocking. Commonassociates include western hemlock, westernredcedar, the true firs, redwood, ponderosapine, and larch.
Hemlock-Sitka spruce—Forests in whichwestern hemlock and/or Sitka spruce com-prise a plurality of the stocking. Commonassociates include Douglas-fir, silver fir, andwestern redcedar.
Redwood—Forests in which redwoodcomprises a plurality of the stocking.Common associates include Douglas-fir,grand fir, and tanoak.
Ponderosa pine—Forests in which ponderosapine comprises a plurality of the stocking.Common associates include Jeffrey pine,sugar pine, limber pine, Arizona pine,Apache pine, Chihuahua pine, Douglas-fir,incense-cedar, and white fir.
Western white pine—Forests in whichwestern white pine comprises a plurality ofthe stocking. Common associates includewestern redcedar, larch, white fir, Douglas-fir,lodgepole pine, and Engelmann spruce.
Lodgepole pine—Forests in which lodgepolepine comprises a plurality of the stocking.Common associates include alpine fir, west-ern white pine, Engelmann spruce, aspen,and larch.
Larch—Forests in which western larchcomprises a plurality of the stocking.Common associates include Douglas-fir,grand fir, western redcedar, and westernwhite pine.
Fir-spruce—Forests in which true firs,Engelmann spruce, or Colorado blue spruce,singly or in combination, comprise a pluralityof the stocking. Common associates includemountain hemlock and lodgepole pine.
Western hardwoods—Forests in whichaspen, red alder, or other western hard-woods, singly or in combination, comprisea plurality of the stocking.
Chaparral—Forests of heavily branched,dwarfed trees or shrubs, usually evergreen,the crown canopy of which at maturity cov-ers more than 50 percent of the ground andwhose primary value is watershed protection.
14
The more common chaparral constituentsare species of Quercus, Cercocarpus, Garrya,Ceanothus, Arctostaphylos, and Adenostoma.Types dominated by such shrubs as Arte-misia, Chrysothamnus, Purshia, Gutierrezia,or semidesert species are not commonlyconsidered chaparral.
Pinyon-juniper—Forests in which pinyonor juniper, or both, comprise a plurality ofthe stocking.
Other softwoods—Forests in which othersoftwood species not mentioned above comprisea plurality of the stocking. These are primarilyblack spruce forests in interior Alaska.
Fuelwood—Wood used for conversion to someform of energy, primarily in residential use.
Growing stock—A classification of timberinventory that includes live trees of commercialspecies meeting specified standards of quality orvigor. Cull trees are excluded. When associatedwith volume, includes only trees 5.0 inchesd.b.h. and larger.
Hardwood—A dicotyledonous tree, usuallybroad-leaved and deciduous.
Industrial wood—All commercial roundwoodproducts except fuelwood.
Land area—The area of dry land and landtemporarily or partly covered by water, suchas marshes, swamps, and river flood plains;streams, sloughs, estuaries, and canals lessthan 200 feet wide; and lakes, reservoirs, andponds less than 4.5 acres in area.
Live cull—A classification that includes live culltrees. When associated with volume, it is the netvolume in live cull trees that are 5.0 inches d.b.h.and larger.
Logging residues—The unused portions ofgrowing-stock and non-growing-stock treescut or killed by logging and left in the woods(footnote on table 40).
Lowland forest types—Generally refers tothe elm-ash-cottonwood and oak-gum-cypressforest types.
National forest—An ownership class of Federallands, designated by Executive order or statuteas national forests or purchase units, and otherlands under the administration of the ForestService including experimental areas andBankhead-Jones Title III lands.
Native American land—(a) Lands held in trustby the United States or individual States forNative American tribes or individual NativeAmericans; (b) Lands owned in fee by NativeAmerican tribes whether subject to Federal orState restrictions against alienation or not.
Net annual growth—The average annual netincrease in the volume of trees during the periodbetween inventories. Components include theincrement in net volume of trees at the begin-ning of the specific year surviving to its end,plus the net volume of trees reaching theminimum size class during the year, minusthe volume of trees that died during the year,and minus the net volume of trees that becamecull trees during the year.
Net volume in cubic feet—The gross volumein cubic feet less deductions for rot, rough-ness, and poor form. Volume is computedfor the central stem from a 1-foot stump to aminimum 4.0-inch top diameter outside bark,or to the point where the central stem breaksinto limbs.
Noncommercial species—Tree species oftypically small size, poor form, or inferiorquality, which normally do not develop intotrees suitable for industrial wood products.
Nonforest land—Land that has never supportedforests and lands formerly forested where use oftimber management is precluded by develop-ment for other uses. (Note: Includes area usedfor crops, improved pasture, residential areas,city parks, improved roads of any width andadjoining clearings, powerline clearings of anywidth, and 1- to 4.5-acre areas of water classi-fied by the Bureau of the Census as land. Ifintermingled in forest areas, unimproved roadsand nonforest strips must be more than 120 feetwide, and clearings, etc., must be more than 1acre in area, to qualify as nonforest land.)

15
Nonindustrial private—An ownership class ofprivate lands where the owner does not operatewood-using plants.
Nonstocked areas—Timberland less than 10percent stocked with all live trees.
Other Federal—An ownership class of Federallands other than those administered by theForest Service or the Bureau of Land Manage-ment. This category includes the National ParkService, Fish and Wildlife Service, Departmentsof Defense and Energy, and miscellaneousFederal ownerships.
Other forest land—Forest land other thantimberland and reserved forest land. It includesavailable forest land, which is incapable of annu-ally producing 20 cubic feet per acre of industrialwood under natural conditions because ofadverse site conditions such as sterile soils,dry climate, poor drainage, high elevation,steepness, or rockiness.
Other land—Nonforest land less the area instreams, sloughs, estuaries, and canals between120 and 200 feet wide and lakes, reservoirs, andponds between 1 and 4.5 acres in area.
Other private—An ownership class of privatelands that are not owned by forest industryor farmers.
Other products—A miscellaneous category ofroundwood products that includes such itemsas cooperage, pilings, poles, posts, shakes,shingles, board mills, charcoal, and export logs.
Other public—An ownership class that includesall public lands except national forests. This cat-egory generally includes State, county, andmunicipal ownerships.
Other red oaks—A group of species in thegenus Quercus that includes scarlet oak, north-ern pin oak, southern red oak, bear oak, shingleoak, laurel oak, blackjack oak, water oak, pinoak, willow oak, and black oak.
Other removals—Unutilized wood volumefrom cut or otherwise killed growing stock,from cultural operations such as precommercial
thinnings, or from timberland clearing. Does notinclude volume removed from inventory throughreclassification of timberland to productivereserved forest land.
Other sources—Sources of roundwood productsthat are not growing stock. These include salv-able dead trees, rough and rotten trees, trees ofnoncommercial species, trees less than 5.0 inch-es d.b.h., tops, and roundwood harvested fromnonforest land (for example, fence rows).
Other white oaks—A group of species in thegenus Quercus that includes overcup oak,chestnut oak, and post oak.
Ownership—The property owned by oneownership unit, including all parcels of landin the United States.
Ownership unit—A classification of ownershipencompassing all types of legal entities havingan ownership interest in land, regardless of thenumber of people involved. A unit may be anindividual; a combination of persons; a legal enti-ty such as a corporation, partnership, club, ortrust; or a public agency. An ownership unit hascontrol of a parcel or group of parcels of land.
Poletimber trees—Live trees at least 5.0 inchesin d.b.h. but smaller than sawtimber trees.
Primary wood-using mill—A mill that convertsroundwood products into other wood products.Common examples are sawmills that convertsaw logs into lumber and pulpmills that convertpulpwood into wood pulp.
Productivity class—A classification of forestland in terms of potential annual cubic-foot vol-ume growth per acre at culmination of meanannual increment in fully stocked natural stands.
Pulpwood—Roundwood, whole-tree chips, orwood residues that are used for the productionof wood pulp.
Reserved forest land—Forest land withdrawnfrom timber utilization through statute, admin-istrative regulation, or designation withoutregard to productive status.

16
Residues—Bark and woody materials that aregenerated in primary wood-using mills whenroundwood products are converted to other prod-ucts. Examples are slabs, edgings, trimmings,miscuts, sawdust, shavings, veneer cores andclippings, and pulp screenings. Includes barkresidues and wood residues (both coarse andfine materials) but excludes logging residues.
Rotten tree—A live tree of commercial speciesthat does not contain a saw log now or prospec-tively primarily because of rot (that is, when rotaccounts for more than 50 percent of the totalcull volume).
Rough tree—(a) A live tree of commercial speciesthat does not contain a saw log now or prospec-tively primarily because of roughness (that is,when sound cull due to such factors as poorform, splits, or cracks accounts for more than50 percent of the total cull volume) or (b) a livetree of noncommercial species.
Roundwood products—Logs, bolts, and otherround timber generated from harvesting treesfor industrial or consumer use.
Rural-urban continuum—A classification ofU.S. counties by urban characteristic asdescribed by Butler and Beale (1993).Classes are generically defined as follows:
Major metro Major metro-Central: Central countiesof metropolitan areas of 1 millionpopulation or moreMajor metro-Fringe: Fringe countiesof metropolitan areas of 1 millionpopulation or more
Intermediate and small metroIntermediate metro: Counties inmetropolitan areas of 250,000 -1,000,000 populationSmall metro: Counties in metropolitanareas of less than 250,000 population
Large town Large town metro: Urban population of20,000 or more, adjacent to a metropoli-tan areaLarge town nonmetro: Urban populationof 20,000 or more, not adjacent to ametropolitan area
Small town Small town metro: Urban populationof 2,500 - 19,999, adjacent to a metropolitan areaSmall town nonmetro: Urban populationof 2,500 - 19,999, not adjacent to ametropolitan area
Rural Rural metro: Completely rural (no placeswith a population of 2,500 or more)adjacent to a metropolitan areaRural nonmetro: Completely rural (noplaces with a population of 2,500 ormore) not adjacent to a metropolitan area
Salvable dead tree—A downed or standing deadtree that is considered currently or potentiallymerchantable by regional standards.
Saplings—Live trees 1.0 inch through 4.9inches d.b.h.
Saw log—A log meeting minimum standards ofdiameter, length, and defect, including logs atleast 8 feet long, sound and straight, and witha minimum diameter inside bark of 6 inchesfor softwoods and 8 inches for hardwoods, ormeeting other combinations of size and defectspecified by regional standards.
Seedlings—Live trees less than 1.0 inch d.b.h.and at least 1 foot in height.
Select red oaks—A group of species in thegenus Quercus that includes cherrybark oak,northern red oak, and Shumard oak.
Select white oaks—A group of species in thegenus Quercus that includes white oak, swampwhite oak, bur oak, swamp chestnut oak, andchinkapin oak.
Softwood—A coniferous tree, usually evergreen,having needles or scale-like leaves.
Sound dead—The net volume in salvabledead trees.
17
Stand-size class—A classification of forest landbased on the size class of all live trees in thearea. The classes include:
Nonstocked stands—Forest land that isstocked with less than 10 percent of fullstocking with all live trees. Examples arerecently cut-over areas or recently revertedagricultural fields.
Seedling-sapling stands—Forest land thatis stocked with at least 10 percent of fullstocking with all live trees with half ormore of such stocking in seedlings orsaplings or both.
Poletimber stands—Forest land that isstocked with at least 10 percent of fullstocking with all live trees with half or moreof such stocking in poletimber or sawtimbertrees or both, and in which the stocking ofpoletimber exceeds that of sawtimber.
Sawtimber stands—Forest land that is stockedwith at least 10 percent of full stocking withall live trees with half or more of such stockingin poletimber or sawtimber trees or both,and in which the stocking of sawtimber isat least equal to that of poletimber.
State—An ownership class of public landsowned by States or lands leased by States formore than 50 years.
Stocking—The degree of occupancy of land bytrees, measured by basal area or number oftrees by size and spacing, or both, compared toa stocking standard; that is, the basal area ornumber of trees, or both, required to fully utilizethe growth potential of the land.
Timberland—Forest land that is producing or iscapable of producing crops of industrial woodand not withdrawn from timber utilization bystatute or administrative regulation. (Note: Areasqualifying as timberland are capable of produc-ing in excess of 20 cubic feet per acre per yearof industrial wood in natural stands. Currentlyinaccessible and inoperable areas are included.)
Tops—The wood of a tree above the merchantableheight (or above the point on the stem 4.0 inchesdiameter outside bark [d.o.b.]). It includes theusable material in the uppermost stem.
Unreserved forest land—Forest land that isnot withdrawn from harvest by statute oradministrative regulation. Includes forestlands that are not capable of producing inexcess of 20 cubic feet per acre per year ofindustrial wood in natural stands.
Veneer log—A roundwood product from whichveneer is sliced or sawn and that usually meetscertain standards of minimum diameter andlength and maximum defect.
Weight—The weight of wood and bark, oven-drybasis (approximately 12 percent moisture content).
Xerophytic plants—Plants growing where soilmoisture conditions are very dry most of the time.

18
Timing of Inventory Data
The tables in this report are dated 2002 for areaand volume and 2001 for growth, mortality, andremovals. These dates are used as nominaldates for national reporting. The actual inven-tory for a particular State is the most recentinventory available and may not have beencollected in 1996-2000. Until recently, forestinventory in the United States has been a cyclicprocess with new inventories conducted in eachState every 10-12 years. When national statis-tics are compiled, these data are updated to theextent possible. Tables in this appendix describewhen the inventories actually occurred andwhether they have been updated for this report.Future assessments will have more current dataas new data will be collected in every State everyyear. For more information on the new FIA pro-cedures, refer to the FIA Strategic Plan found inthe “Library” section at http://fia.fs.fed.us.
Adjustments to Historic Inventory Data
Historic data presented in this report for previousnational assessments may be adjusted fromthose found in the original publications. Generally,this is due to changes in data classifications,regional reporting boundaries, or occasionallywhen data are deemed to be inaccurate due toerrors in reporting.
The Database
In 1987, the first national database was developedfor the assessment. It was a summary databasethat placed all inventory data in a common for-mat at the State/owner level of resolution. In1992, the summary database was made avail-able online. For 2002, the national standard FIADatabase (FIADB) was used as a basis for acounty-level summary database.
The complete RPA logical database for 2002 iscomposed of three physical databases. The firstis the FIADB national standard database withdata available for all forest lands except interiorAlaska and Hawaii. These areas were compiledin summary format from modeled inventorydata. The second database is the national
timber products output (TPO) database composedof data from surveys of primary wood-usingfacilities (sawmills, pulpmills, veneer mills, chipmills, etc.) as well as residential fuelwood andpost producers (Smith 1991 and May 1998).This database provides county-level removalsdata for the United States. The third databaseis the national summary database that drawsupon each of the other physical databases aswell as “value-added” data from the Bureau ofthe Census such as total county land area,county latitude and longitude envelope, andpopulation. The national summary databaseis available via the Internet and can providedata at the county level for most of the UnitedStates. The exceptions to this general rule areareas of interior Alaska where data are storedin aggregate.
For more information on these databases, logon to http://fia.fs.fed.us. Further informationon data collection procedures is available fromthe USDA Forest Service Research Stations andRegions listed in tables A-1 and A-2.
Appendix A: Procedures for the Update
19
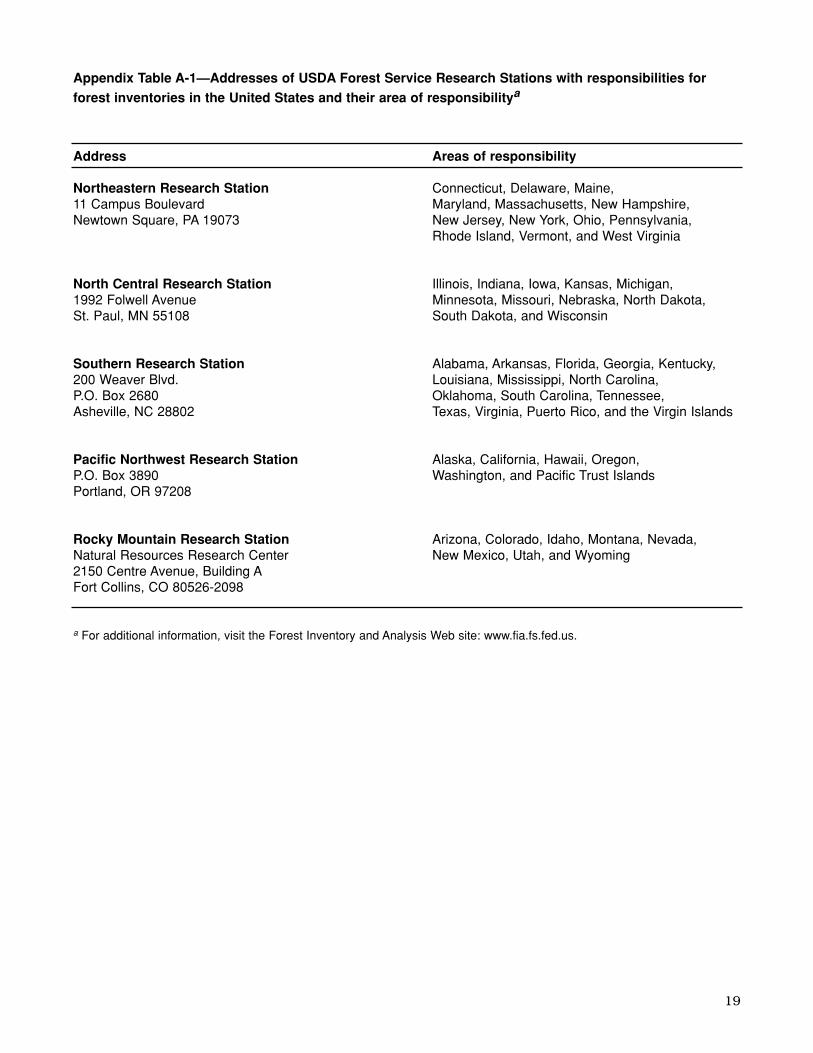
Appendix Table A-1—Addresses of USDA Forest Service Research Stations with responsibilities for forest inventories in the United States and their area of responsibilitya
Address Areas of responsibility
Northeastern Research Station Connecticut, Delaware, Maine, 11 Campus Boulevard Maryland, Massachusetts, New Hampshire,Newtown Square, PA 19073 New Jersey, New York, Ohio, Pennsylvania,
Rhode Island, Vermont, and West Virginia
North Central Research Station Illinois, Indiana, Iowa, Kansas, Michigan, 1992 Folwell Avenue Minnesota, Missouri, Nebraska, North Dakota, St. Paul, MN 55108 South Dakota, and Wisconsin
Southern Research Station Alabama, Arkansas, Florida, Georgia, Kentucky,200 Weaver Blvd. Louisiana, Mississippi, North Carolina,P.O. Box 2680 Oklahoma, South Carolina, Tennessee,Asheville, NC 28802 Texas, Virginia, Puerto Rico, and the Virgin Islands
Pacific Northwest Research Station Alaska, California, Hawaii, Oregon,P.O. Box 3890 Washington, and Pacific Trust IslandsPortland, OR 97208
Rocky Mountain Research Station Arizona, Colorado, Idaho, Montana, Nevada, Natural Resources Research Center New Mexico, Utah, and Wyoming 2150 Centre Avenue, Building AFort Collins, CO 80526-2098
a For additional information, visit the Forest Inventory and Analysis Web site: www.fia.fs.fed.us.

20
Appendix Table A-2—Addresses of National Forest System regional offices in the United States
Address Region Location of National Forests
Forest Service, USDA Region 1 Montana, northern Idaho, North Dakota,Northern Region and northwestern South DakotaFederal Building P.O. Box 7669 Missoula, MT 59807
Forest Service, USDA Region 2 Colorado, Kansas, Nebraska, South Dakota,Rocky Mountain Region and eastern Wyoming11177 West 8th AvenueP.O. Box 25127Lakewood, CO 80225
Forest Service, USDA Region 3 Arizona and New MexicoSouthwestern RegionFederal Building517 Gold Avenue S.W.Albuquerque, NM 87102
Forest Service, USDA Region 4 Southern Idaho, Nevada, Utah, andIntermountain Region western WyomingFederal Building 324 25th StreetOgden, UT 84401
Forest Service, USDA Region 5 CaliforniaPacific Southwest Region1323 Club DriveVallejo, CA 94592
Forest Service, USDA Region 6 Oregon and WashingtonPacific Northwest Region333 S.W. 1st AvenueP.O. Box 3623Portland, OR 97208
Forest Service, USDA Region 8 Alabama, Arkansas, Florida, Georgia, Kentucky,Southern Region Louisiana, Mississippi, North Carolina, Oklahoma,1720 Peachtree Road, N.W. Tennessee, Texas, Virginia, West Virginia, andAtlanta, GA 30309 Puerto Rico
Forest Service, USDA Region 9 Connecticut, Delaware, Illinois, Indiana, Iowa,Eastern Region Maine, Maryland, Massachusetts, Michigan, 626 East Wisconsin Avenue Minnesota, Missouri, New Hampshire, New Jersey,Milwaukee, WI 53202 New York, Ohio, Pennsylvania, Rhode Island,
Vermont, West Virginia, and Wisconsin
Forest Service, USDA Region 10 AlaskaAlaska RegionP.O. Box 21628Juneau, AK 99802-1628
For additional information, contact the Internet sites for the regional offices through the USDA Forest Service home page:http://www.fs.fed.us. Timber inventories are managed by the forest management staff in each regional office.
21
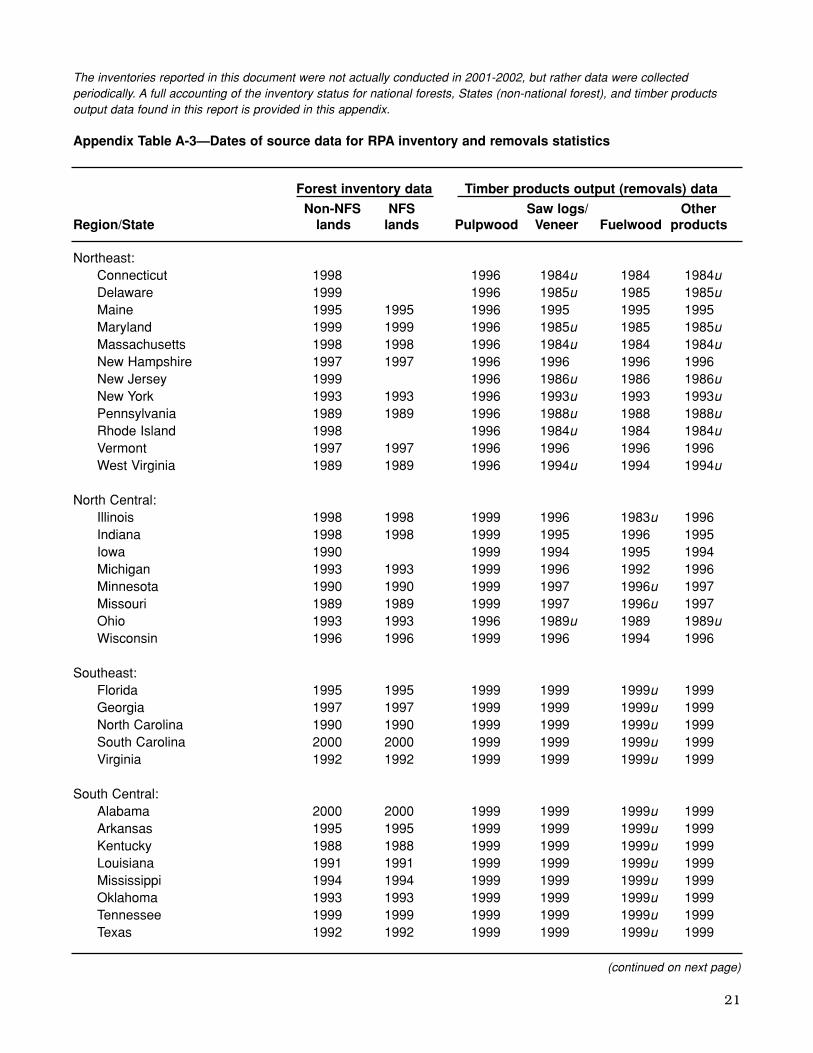
The inventories reported in this document were not actually conducted in 2001-2002, but rather data were collectedperiodically. A full accounting of the inventory status for national forests, States (non-national forest), and timber productsoutput data found in this report is provided in this appendix.
Appendix Table A-3—Dates of source data for RPA inventory and removals statistics
Forest inventory data Timber products output (removals) data
Non-NFS NFS Saw logs/ OtherRegion/State lands lands Pulpwood Veneer Fuelwood products
Northeast:Connecticut 1998 1996 1984u 1984 1984uDelaware 1999 1996 1985u 1985 1985uMaine 1995 1995 1996 1995 1995 1995Maryland 1999 1999 1996 1985u 1985 1985uMassachusetts 1998 1998 1996 1984u 1984 1984uNew Hampshire 1997 1997 1996 1996 1996 1996New Jersey 1999 1996 1986u 1986 1986uNew York 1993 1993 1996 1993u 1993 1993uPennsylvania 1989 1989 1996 1988u 1988 1988uRhode Island 1998 1996 1984u 1984 1984uVermont 1997 1997 1996 1996 1996 1996West Virginia 1989 1989 1996 1994u 1994 1994u
North Central: Illinois 1998 1998 1999 1996 1983u 1996Indiana 1998 1998 1999 1995 1996 1995Iowa 1990 1999 1994 1995 1994Michigan 1993 1993 1999 1996 1992 1996Minnesota 1990 1990 1999 1997 1996u 1997Missouri 1989 1989 1999 1997 1996u 1997Ohio 1993 1993 1996 1989u 1989 1989uWisconsin 1996 1996 1999 1996 1994 1996
Southeast:Florida 1995 1995 1999 1999 1999u 1999Georgia 1997 1997 1999 1999 1999u 1999North Carolina 1990 1990 1999 1999 1999u 1999South Carolina 2000 2000 1999 1999 1999u 1999Virginia 1992 1992 1999 1999 1999u 1999
South Central:Alabama 2000 2000 1999 1999 1999u 1999Arkansas 1995 1995 1999 1999 1999u 1999Kentucky 1988 1988 1999 1999 1999u 1999Louisiana 1991 1991 1999 1999 1999u 1999Mississippi 1994 1994 1999 1999 1999u 1999Oklahoma 1993 1993 1999 1999 1999u 1999Tennessee 1999 1999 1999 1999 1999u 1999Texas 1992 1992 1999 1999 1999u 1999
(continued on next page)

22
Forest inventory data Timber products output (removals) data
Non-NFS NFS Saw logs/ OtherRegion/State lands lands Pulpwood Veneer Fuelwood products
Great Plains:Kansas 1994 1999 1998 1994 1993Nebraska 1994 1994 1999 1993 1994 1993North Dakota 1995 1995 1999 1998 1994 1998South Dakota 1995 1986u 1999 1993 1994 1999
Intermountain:Arizona 1999 1999 1995 1995 1984 1995Colorado 1983 1981-88u 1996 1996 1982 1996Idaho 1991 1990-95u 1995 1995 1990 1995Montana 1989 1995 1993u 1993u 1989 1993uNevada 1989u 1987u 1996 1996 1996 1996New Mexico 1999 1999 1995 1995 1986 1995Utah 1995 1995 1992 1992 1992 1992Wyoming 1984 1985-93u 1996 1996 1983u 1996
Pacific Northwest:Alaska 1977-94 1998 1995 1995 1982u 1995Oregon 1992 1994-96 1994 1994 1994 1994Washington 1991 1995 1996 1996 1996 1996
Pacific Southwest:California 1994 1995 1994 1994 1994 1994Hawaii 1985 1995 1995 1995 1995
u = source data updated to 2001 for reporting.
Appendix Table A-3 (continued)

23
Appendix B: Metric Equivalents for Various Units of Measure
1 acre = 0.404686 hectares
1,000 acres = 404.686 hectares
1 board foot = 0.00348 cubic meters
1 cubic foot = 0.028317 cubic meters
1,000 cubic feet = 28.317 cubic meters
1 inch = 2.54 centimeters or 0.0254 meters
1 foot = 30.48 centimeters or 0.3048 meters
1 mile = 1.609 kilometers
1 square foot = 0.0929 square meters
1 square foot per acre basal area = 0.229568 square meters per hectare
1 ton = 0.90718 metric tons
Breast height = 1.37 meters above ground level
24
Appendix C: Accuracy of the Data
All of the data for the national assessment of forests are collected under the guidance of the USDAForest Service and compiled by the agency’s Forest Inventory and Analysis (FIA) program. All dataare collected by the FIA program in cooperation with State forestry agencies or National ForestSystem (NFS) regions.
Inventories conducted by FIA are designed to meet the following statistical guidelines for accuracywithin one standard deviation at the 67 percent level for each State:
+/- 3-5 percent per million acres of timberland+/- 10 percent per million acres of all other forest land+/- 5 percent per billion cubic feet of growing-stock volume +/- 10 percent per billion cubic feet of growing-stock growth +/- 15 percent per billion cubic feet of growing-stock mortality +/- 15 percent per billion cubic feet of growing-stock removals
Since these guidelines are applied at the State level, the accuracy of data for any national ormulti-State totals for these categories will be greater.
Inventories conducted historically on NFS lands would have similar accuracy estimates in theEastern United States and Alaska where FIA conducted these inventories. In other NFS regions,regional inventory data were converted to emulate FIA classifications and thus specific accuracyestimates are difficult to derive. Overall, historic NFS data are presumed to have similar error characteristics except where errors of omission may have occurred.

25
Common name Scientific name
Eastern Softwoods: True firs Abies Mill. Balsam fir A. balsamea (L.) Mill. Fraser fir A. fraseri (Pursh) Poir. Eastern redcedar Juniperus virginiana L. Tamarack Larix laricina (Du Roi) K. Koch Spruce Picea A. Dietr. Jack pine Pinus banksiana Lamb. Shortleaf pine P. echinata Mill. Slash pine P. elliottii Engelm. Longleaf pine P. palustris Mill. Red pine P. resinosa Ait. Eastern white pine P. strobus L. Loblolly pine P. taeda L. Baldcypress Taxodium Rich. Northern white-cedar Thuja occidentalis L. Eastern hemlock Tsuga canadensis (L.) Carr.
Eastern Hardwoods: Maple Acer L. Red (soft) maple A. rubrum L. Sugar (hard) maple A. saccharum Marsh. Birch Betula L. Yellow birch B. alleghaniensis Britton Paper birch B. papyrifera Marsh. Gray birch B. populifolia Marsh. Hackberry Celtis occidentalis L. American beech Fagus grandifolia Ehrh. Ash Fraxinus L. Black walnut Juglans nigra L. Sweetgum Liquidambar styraciflua L. Yellow-poplar Liriodendron tulipifera L. Tupelo, gum Nyssa L. Black tupelo N. sylvatica Marsh. var. sylvatica Sycamore Platanus occidentalis L. Aspen Populus L. Balsam poplar P. balsamifera L. Eastern cottonwood P. deltoides Bartr. ex Marsh. Black cherry Prunus serotina Ehrh. Oak Quercus L. White oak Q. alba L. Swamp white oak Q. bicolor Willd. Scarlet oak Q. coccinea Muenchh. Northern pin oak Q. ellipsoidalis E. J. Hill Southern red oak Q. falcata Michx.Cherrybark oak Q. falcata var. pagodifolia Ell. Bear oak Q. ilicifolia Wangenh. Shingle oak Q. imbricaria Michx. Overcup oak Q. lyrata Walt. Bur oak Q. macrocarpa Michx. Blackjack oak Q. marilandica Muenchh.Swamp chestnut oak Q. michauxii Nutt.
Common name Scientific name
Chinkapin oak Q. muehlenbergii Engelm.Water oak Q. nigra L. Pin oak Q. palustris Muenchh. Willow oak Q. phellos L. Chestnut oak Q. prinus L. Northern red oak Q. rubra L. Shumard oak Q. shumardii Buckl. Post oak Q. stellata Wangenh. var. stellataBlack oak Q. velutina Lam. Willow Salix L. Basswood Tilia L. Elm Ulmus L.
Western Softwoods: True firs Abies Mill. Pacific silver fir A. amabilis Dougl. ex Forbes White fir A. concolor (Gord. & Glend.)
Lindl. ex Hildebr. Grand fir A. grandis (Dougl. ex D. Don)
Lindl. Subalpine fir A. lasiocarpa (Hook.) Nutt. Juniper Juniperus L. Incense-cedar Libocedrus decurrens Torr. Engelmann spruce Picea engelmannii
Parry ex Engelm. Blue spruce P. pungens Engelm. Sitka spruce P. sitchensis (Bong.) Carr. Lodgepole pine Pinus contorta Dougl. ex Loud. Pinyon pine P. edulis Engelm. Apache pine P. engelmannii Carr. Limber pine P. flexilis James Jeffrey pine P. jeffreyi Grev. & Balf. Sugar pine P. lambertiana Dougl. Chihuahua pine P. leiophylla var. chihuahuana
(Engelm.) Shaw Western white pine P. monticola Dougl. ex D. Don Ponderosa pine P. ponderosa Dougl. ex Laws. Arizona pine P. ponderosa var. arizonica
(Engelm.) Shaw Douglas-fir Pseudotsuga menziesii (Mirb.)
Franco Redwood Sequoia sempervirens (D. Don)
Endl. Western redcedar Thuja plicata Donn ex D. DonWestern hemlock Tsuga heterophylla (Raf.) Sarg.Mountain hemlock T. mertensiana (Bong.) Carr.
Western Hardwoods: Red alder Alnus rubra Bong. Tanoak Lithocarpus densiflorus
(Hook & Arn.) Rehd. Cottonwood Populus L. Oak Quercus L.
Appendix D: Common and Scientific Names of Major Tree Species
Source: Little 1979.

26
Table 1.— Land area in the United States bymajor class, region, subregion, andState, 2002
Table 2.— Forest land area in the UnitedStates by ownership, region,subregion, and State, 2002
Table 3.— Forest area in the United States byregion, subregion, and State, 2002,1997, 1987, 1977, 1953, 1938,1907, and 1630.
Table 4.— Forest land area in the UnitedStates by productivity class, region,subregion, and State, 2002
Table 5.— Forest land area in the WesternUnited States by forest type group,subregion, productivity class, andownership group, 2002
Table 6.— Forest land area in the EasternUnited States by forest type group,subregion, productivity class, andownership group, 2002
Table 7.— Forest land area in the Easternand Western United States by rural-urban continuum class and foresttype group, 2002
Table 8.— Area of planted and natural forestland in the Eastern and WesternUnited States by forest type groupand major ownership group, 2002
Table 9.— Forest land area in the UnitedStates by average d.b.h. class andforest type group, 2002
Table 10.— Timberland area in the UnitedStates by ownership, region,subregion, and State, 2002, 1997,1987, 1977, and 1953
Table 11.— Timberland area in the UnitedStates by ownership group, region,subregion, and State, 2002
Table 12.— Timberland area in the EasternUnited States by forest typegroup, subregion, and stand-ageclass, 2002
Table 13.— Timberland area in the WesternUnited States by forest typegroup, subregion, and stand-ageclass, 2002
Table 14.— Timberland area in the UnitedStates by forest type group, sub-region, and stand-size class, 2002
Table 15.— Area of timberland in the UnitedStates by stand-size class, region,and subregion, 2002, 1997, 1987,1977, and 1953
Table 16.— Timberland area in the UnitedStates by major geographic regionand forest type group, 2002, 1997,1987, 1977, and 1953
Table 17.— Net volume of timber on timberlandin the United States by class oftimber, species group, region,subregion, and State, 2002
Table 18.— Net volume of softwood growingstock on timberland in the UnitedStates by ownership group, region,subregion, and State, 2002, 1997,1987, 1977, and 1953
Table 19.— Net volume of growing stock ontimberland in the Eastern UnitedStates by species, region, andsubregion, 2002, 1997, 1987, 1977, and 1963
Table 20.— Net volume of growing stock ontimberland in the WesternUnited States by species, subregion, and State, 2002
Table 21.— Net volume of softwood growingstock on timberland in theEastern United States by species,subregion, and State, 2002
List of Tables

27
Table 22.— Net volume of hardwood growingstock on timberland in theEastern United States by species,subregion, and State, 2002
Table 23.— Net volume of hardwood growingstock on timberland in the UnitedStates by ownership group, region,subregion, and State, 2002, 1997,1987, 1977, and 1953
Table 24.— Net volume of all growing stock ontimberland in the Western UnitedStates by species, region, andsubregion, 2002, 1997, 1987, 1977,and 1963
Table 25.— Net volume of all growing stock ontimberland in the United States byownership group, region, subregion,and State, 2002, 1997, 1987, 1977,and 1953
Table 26.— Net volume of hardwood growingstock on timberland in the EasternUnited States by species, sub-region, and diameter class, 2002
Table 27.— Net volume of softwood growingstock on timberland in the EasternUnited States by species, sub-region, and diameter class, 2002
Table 28.— Net volume of growing stock ontimberland in the Western UnitedStates by species, subregion, anddiameter class, 2002
Table 29.— Net volume of growing stock onplanted and natural timberland inthe Eastern and Western UnitedStates by forest type group andmajor ownership group, 2002
Table 30.— Net volume of softwood growingstock on timberland in the UnitedStates by diameter class, region, andsubregion, 2002, 1997, 1987, 1977,and 1953
Table 31.— Net volume of hardwood growingstock on timberland in the UnitedStates by diameter class, region, andsubregion, 2002, 1997, 1987, 1977,and 1953
Table 32.— Net volume of growing stock ontimberland in the United Statesby diameter class, region, andsub-region, 2002, 1997, 1987,1977, and 1953
Table 33.— Annual mortality of growing stockon timberland in the United Statesby ownership group, region, sub-region, and species group, 2001,1996, 1986, 1976, and 1952
Table 34.— Net annual growth of growing stockon timberland in the United Statesby ownership group, region, sub-region, and species group, 2001,1996, 1986, 1976, and 1952
Table 35.— Annual removals of growing stock ontimberland in the United States byownership group, region, subregion,and species group, 2001, 1996,1986, and 1976
Table 36.— Net annual growth, removals, andmortality of growing stock on tim-berland in the United States byspecies group, region, subregion,and State, 2001
Table 37.— Net all live biomass on timberland inthe Eastern and Western UnitedStates by rural-urban continuumclass and forest type group, 2002
Table 38.— Biomass on timberland in theUnited States by region, subregion,State, and tree component, 2002
Table 39.— Volume of roundwood productsharvested in the United Statesby source of material, speciesgroup, region, subregion, andproduct, 2001
28
Table 40.— Roundwood products, loggingresidues, and other removals fromgrowing stock and other sourcesby species group, region, andsubregion, 2001
Table 41.— Weight of bark and wood residuefrom primary wood-using mills by type of material, species group,region, subregion, and type of use, 2001

29
Land class___________________________________________________
Forest land___________________________________________
Region, Total Total Othersubregion, and State land area forest land Timberland Reserveda Otherb land__________________________________________________________________________________________
Thousand acresNorth:
Northeast:Connecticut 3,101 1,859 1,696 14 149 1,242 Delaware 1,251 383 376 0 7 868Maine 19,753 17,699 16,952 380 368 2,054 Maryland 6,295 2,566 2,372 180 14 3,729 Massachusetts 5,016 3,126 2,631 127 369 1,890 New Hampshire 5,740 4,818 4,503 157 158 922New Jersey 4,748 2,132 1,876 160 96 2,616 New York 30,223 18,432 15,389 2,920 123 11,791 Pennsylvania 28,685 16,905 15,853 833 219 11,780 Rhode Island 668 385 340 10 36 283Vermont 5,920 4,618 4,482 114 21 1,302 West Virginia 15,415 12,108 11,900 181 27 3,307
Total 126,815 85,031 78,370 5,076 1,587 41,784
North Central: Illinois 35,580 4,331 4,087 244 0 31,249 Indiana 22,957 4,501 4,342 159 0 18,456 Iowa 35,760 2,050 1,944 88 19 33,710 Michigan 36,359 19,281 18,616 575 90 17,078 Minnesota 50,955 16,680 14,723 1,118 840 34,275 Missouri 44,095 13,992 13,365 317 311 30,103 Ohio 26,210 7,855 7,568 140 147 18,355 Wisconsin 34,761 15,963 15,701 201 61 18,798
Total 286,677 84,653 80,346 2,842 1,468 202,024
North total: 413,492 169,684 158,716 7,918 3,055 243,808
South:Southeast:
Florida 34,520 16,285 14,636 1,121 528 18,235 Georgia 37,068 24,405 23,802 595 7 12,663 North Carolina 31,180 19,302 18,664 598 40 11,878 South Carolina 19,272 12,495 12,301 194 0 6,777 Virginia 25,343 16,074 15,371 686 16 9,269
Total 147,383 88,561 84,774 3,194 591 58,822
South Central:Alabama 32,481 22,987 22,922 65 0 9,494 Arkansas 33,328 18,771 18,373 231 167 14,557 Kentucky 25,428 12,684 12,347 305 32 12,744 Louisiana 27,883 13,812 13,722 90 0 14,071 Mississippi 30,025 18,580 18,572 8 0 11,445 Oklahoma 43,955 7,665 6,234 45 1,386 36,290 Tennessee 26,381 14,396 13,956 440 0 11,985 Texas 167,626 17,149 11,774 125 5,250 150,477
Total 387,107 126,044 117,900 1,309 6,835 261,063
South total: 534,490 214,605 202,674 4,503 7,426 319,885
Table 1—Land area in the United States by major class, region, subregion, and State, 2002 __________________________________________________________________________________________

30
Table 1—(continued).__________________________________________________________________________________________
Land class___________________________________________________
Forest land___________________________________________
Region, Total Total Othersubregion, and State land area forest land Timberland Reserveda Otherb land__________________________________________________________________________________________
Thousand acresRocky Mountain:
Great Plains:Kansas 52,367 1,545 1,491 18 37 50,822 Nebraska 49,201 947 898 32 18 48,254North Dakota 44,156 672 441 0 231 43,484 South Dakota 48,574 1,619 1,511 23 85 46,955
Total 194,298 4,783 4,341 73 371 189,515
Intermountain:Arizona 72,732 19,427 3,527 1,819 14,082 53,305 Colorado 66,387 21,637 11,607 2,712 7,318 44,750 Idaho 52,960 21,646 16,824 3,708 1,115 31,314 Montana 93,157 23,293 19,185 3,682 426 69,864 Nevada 70,276 10,204 363 568 9,273 60,072 New Mexico 77,674 16,682 4,359 1,704 10,619 60,992 Utah 52,587 15,676 4,683 771 10,223 36,911 Wyoming 62,147 10,995 5,739 3,916 1,340 51,152
Total 547,920 139,560 66,287 18,880 54,396 408,360 Rocky Mountain total: 742,218 144,343 70,628 18,953 54,767 597,875
Pacific Coast:Alaska:
Alaska 365,041 126,869 11,865 33,068 81,936 238,172 Total 365,041 126,869 11,865 33,068 81,936 238,172
Pacific Northwest:Oregon 61,442 29,651 23,831 2,482 3,337 31,791 Washington 42,612 21,790 17,347 3,483 960 20,822
Total 104,054 51,441 41,178 5,965 4,297 52,613
Pacific Southwest:California 99,824 40,233 17,781 6,453 15,998 59,591 Hawaii 4,111 1,748 700 196 853 2,363
Total 103,935 41,981 18,481 6,649 16,851 61,954 Pacific Coast total: 573,030 220,291 71,524 45,682 103,084 352,739
_________________________________________________________________
United States: 2,263,230 748,923 503,542 77,056 168,332 1,514,307 __________________________________________________________________________________________
a For 2002, reserved forest includes lands previously classified as unproductive reserved and tabulated under the otherforest category.
b For 2002, other forest no longer includes lands classified as unproductive reserved. This area, amounting to about 12 million acres in 1987, is now included in the reserved forest category.
Note: Data may not add to totals because of rounding.

31
Public Privatea__________________________________________________ _______________________Federal____________________________
Bureau of CountyAll Land and Non-
Region, owner- Total Total National Man- muni- Total Forest industrialsubregion, and State ships public Federal forest agement Other State cipal private industry private________________________________________________________________________________________________________________
Thousand acresNorth:
Northeast:Connecticut 1,859 315 7 0 0 7 168 139 1,545 0 1,545Delaware 383 32 0 0 0 0 32 0 351 26 325Maine 17,699 970 116 40 0 76 738 116 16,730 7,449 9,281Maryland 2,566 609 72 0 0 72 424 113 1,957 88 1,869 Massachusetts 3,126 743 74 0 0 74 424 245 2,383 14 2,369 New Hampshire 4,818 1,088 740 717 0 22 224 125 3,730 463 3,267 New Jersey 2,132 810 106 0 0 106 531 173 1,322 0 1,322 New York 18,432 3,977 163 5 0 157 3,486 328 14,455 1,225 13,230 Pennsylvania 16,905 4,403 587 460 0 127 3,529 287 12,502 613 11,889 Rhode Island 385 95 3 0 0 3 77 15 290 0 290Vermont 4,618 754 369 337 0 32 313 72 3,864 253 3,612 West Virginia 12,108 1,520 1,164 1,002 0 163 311 44 10,588 887 9,701
Total 85,032 15,315 3,400 2,561 0 839 10,258 1,657 69,716 11,017 58,700
North Central: Illinois 4,331 680 342 270 0 72 192 146 3,651 11 3,639 Indiana 4,501 770 425 191 0 234 323 22 3,730 17 3,713 Iowa 2,050 244 74 0 0 74 127 42 1,807 0 1,807 Michigan 19,281 7,143 2,934 2,683 0 250 3,946 264 12,138 1,520 10,618 Minnesota 16,680 9,393 2,956 2,625 29 302 3,773 2,664 7,288 759 6,528 Missouri 13,992 2,366 1,775 1,428 0 347 523 69 11,626 222 11,403 Ohio 7,855 690 241 216 0 25 294 156 7,165 174 6,990 Wisconsin 15,963 4,767 1,643 1,421 0 222 823 2,300 11,196 1,105 10,091
Total 84,653 26,053 10,389 8,834 29 1,526 10,001 5,663 58,600 3,811 54,789 North total: 169,685 41,368 13,789 11,395 29 2,365 20,259 7,320 128,317 14,827 113,489
South:Southeast:
Florida 16,285 3,893 2,378 1,126 9 1,243 1,403 111 12,392 4,016 8,377 Georgia 24,405 2,356 1,907 855 0 1,052 336 113 22,048 4,381 17,667 North Carolina 19,302 2,502 1,977 1,218 0 759 440 85 16,800 2,252 14,548 South Carolina 12,495 1,418 953 596 0 357 380 85 11,076 1,994 9,082 Virginia 16,074 2,593 2,226 1,626 0 600 267 99 13,481 1,537 11,944
Total 88,560 12,761 9,442 5,422 9 4,012 2,826 493 75,798 14,180 61,618
South Central:Alabama 22,987 1,291 928 647 0 281 241 122 21,696 3,740 17,956Arkansas 18,771 3,532 3,062 2,483 0 580 402 67 15,239 4,497 10,742Kentucky 12,684 1,316 1,103 645 0 458 213 0 11,368 205 11,164Louisiana 13,812 1,335 828 588 0 239 300 207 12,477 3,898 8,578Mississippi 18,580 1,943 1,534 1,098 0 435 310 100 16,636 3,238 13,399Oklahoma 7,665 665 499 245 0 255 139 27 7,000 1,047 5,952Tennessee 14,396 2,005 1,371 623 0 748 565 69 12,390 1,391 11,000Texas 17,149 909 794 608 0 186 68 47 16,240 3,720 12,521
Total 126,043 12,996 10,119 6,936 0 3,182 2,239 639 113,047 21,735 91,311South total: 214,603 25,758 19,561 12,358 9 7,194 5,065 1,132 188,845 35,916 152,929
Table 2—Forest land area in the United States by ownership, region, subregion, and State, 2002_____________________________________________________________________________________________________

32
Table 2—(continued)._____________________________________________________________________________________________________
Public Privatea___________________________________________________ _____________________Federal____________________________
Bureau of CountyAll Land and Non-
Region, owner- Total Total National Man- muni- Total Forest industrialsubregion, and State ships public Federal forest agement Other State cipal private industry private________________________________________________________________________________________________________________
Thousand acresRocky Mountain:
Great Plains:Kansas 1,545 109 65 0 0 65 32 13 1,436 0 1,436 Nebraska 947 133 57 47 0 10 66 10 814 0 814North Dakota 672 231 197 181 2 14 34 0 442 0 442South Dakota 1,619 1,060 1,004 979 6 19 55 1 559 0 559
Total 4,784 1,533 1,323 1,206 8 109 186 24 3,251 0 3,251
Intermountain:Arizona 19,427 11,417 10,192 8,223 1,304 666 1,185 40 8,010 0 8,010 Colorado 21,637 15,672 15,075 10,561 4,108 407 518 79 5,965 0 5,965 Idaho 21,646 18,257 17,129 16,157 893 79 1,103 25 3,389 1,284 2,106 Montana 23,293 17,240 16,512 14,587 804 1,121 721 7 6,053 1,618 4,435 Nevada 10,204 9,624 9,608 3,231 6,249 128 16 0 580 25 555New Mexico 16,682 10,351 9,522 8,092 1,120 309 825 3 6,331 0 6,331 Utah 15,676 12,932 11,913 5,605 6,073 235 1,005 14 2,744 0 2,744 Wyoming 10,995 9,109 8,832 5,858 1,004 1,970 277 0 1,886 0 1,886
Total 139,560 104,601 98,783 72,314 21,555 4,913 5,650 168 34,959 2,926 32,032 Rocky Mountain total: 144,344 106,134 100,106 73,520 21,563 5,022 5,837 192 38,209 2,926 35,283
Pacific Coast:Alaska:
Alaskab 126,869 90,994 63,423 10,455 16,954 36,014 27,469 101 35,875 0 35,875 Total 126,869 90,994 63,423 10,455 16,954 36,014 27,469 101 35,875 0 35,875
Pacific Northwest:Oregon 29,651 18,875 17,741 14,293 3,260 187 913 222 10,775 5,305 5,471 Washington 21,790 11,959 9,422 7,919 50 1,453 2,294 243 9,831 4,338 5,493
Total 51,441 30,835 27,162 22,212 3,311 1,639 3,208 465 20,606 9,643 10,963
Pacific Southwest:California 40,233 23,479 22,371 18,515 2,208 1,647 729 380 16,754 3,068 13,685 Hawaii 1,748 593 12 0 0 12 573 8 1,155 0 1,155
Total 41,981 24,073 22,383 18,515 2,208 1,659 1,302 388 17,909 3,068 14,840 Pacific Coast total: 220,291 145,901 112,968 51,183 22,472 39,313 31,979 954 74,390 12,711 61,679 ___________________________________________________________________________________
United States: 748,922 319,161 246,425 148,456 44,074 53,895 63,140 9,597 429,761 66,380 363,381_____________________________________________________________________________________________________
a Native American lands are included exclusively in the nonindustrial private owner group for 1997 only. For 1987 and earlier years, theselands may be included in the other public owner group.
b Per the Alaska Natives Claims Settlement Act of 1971, approximately 35 million forested acres expected upon update of all ownership datafor Alaska.
Note: Data may not add to totals because of rounding.

33
Region, subregion, and State 2002 1997 1987b 1977c 1963d 1953e 1938f 1907g 1630h
___________________________________________________________________________________________________________________________________________
Thousand acres
North:Northeast:
Connecticut 1,859 1,863 1,815 1,861 1,910 1,990 1,809 1,600 2,930 Delaware 383 389 398 392 392 454 423 350 1,130 Maine 17,699 17,711 17,713 17,718 17,425 17,088 16,036 14,900 18,180 Maryland 2,566 2,701 2,632 2,653 2,920 2,920 2,595 2,200 5,730 Massachusetts 3,126 3,264 3,097 2,952 3,070 3,288 3,283 2,000 4,630 New Hampshire 4,818 4,955 5,021 5,014 5,019 4,848 4,664 3,500 5,490 New Jersey 2,132 1,991 1,985 1,928 2,371 2,098 2,157 2,000 4,330 New York 18,432 18,581 18,775 18,380 15,865 14,450 13,321 12,000 27,450 Pennsylvania 16,905 16,905 16,997 16,826 16,486 14,805 13,945 9,200 27,260 Rhode Island 385 409 399 404 434 434 360 250 650Vermont 4,618 4,607 4,509 4,512 4,230 3,860 3,549 2,500 5,550 West Virginia 12,108 12,108 11,942 11,669 11,469 10,327 10,074 9,100 14,610
Total 85,031 85,484 85,283 84,309 81,591 76,562 72,216 59,600 117,940
North Central: Illinois 4,331 4,294 4,266 4,151 4,144 3,890 3,600 2,500 13,805 Indiana 4,501 4,501 4,439 3,943 4,018 4,103 3,580 4,000 19,520 Iowa 2,050 2,050 1,562 1,561 2,620 2,600 2,550 2,500 5,340 Michigan 19,281 19,335 18,220 18,691 19,699 19,592 19,073 15,500 33,110 Minnesota 16,680 16,796 16,583 16,709 17,403 17,826 19,615 15,500 31,500 Missouri 13,992 14,047 12,523 12,876 15,296 15,177 16,200 18,300 26,390 Ohio 7,855 7,855 7,309 7,037 6,091 5,500 5,110 4,800 23,470 Wisconsin 15,963 15,963 15,319 14,908 14,885 15,559 16,946 16,000 26,520
Total 84,653 84,842 80,221 79,876 84,156 84,247 86,674 79,100 179,655North total: 169,684 170,326 165,504 164,185 165,747 160,809 158,890 138,700 297,595
South:Southeast:
Florida 16,285 16,254 16,721 17,040 19,050 20,817 21,740 24,128 29,840 Georgia 24,405 24,413 24,187 24,556 26,365 24,057 21,433 22,300 35,700 North Carolina 19,302 19,298 19,281 19,913 20,662 20,113 18,400 19,600 29,630 South Carolina 12,495 12,651 12,257 12,569 12,250 11,943 10,704 12,000 17,570 Virginia 16,074 16,047 16,108 16,387 16,412 16,032 14,832 14,000 24,480
Total 88,561 88,662 88,554 90,465 94,739 92,962 87,109 92,028 137,220
South Central:Alabama 22,987 21,964 21,725 21,525 21,770 20,771 18,878 20,000 29,540 Arkansas 18,771 18,790 16,987 16,852 20,051 19,681 20,963 24,200 31,940 Kentucky 12,684 12,684 12,256 12,161 11,791 11,647 11,546 10,000 23,140 Louisiana 13,812 13,783 13,883 14,348 16,176 16,230 16,211 16,500 26,160 Mississippi 18,580 18,595 16,693 16,716 17,076 16,890 16,253 17,500 26,700 Oklahoma 7,665 7,665 7,283 8,513 9,235 10,329 10,415 10,500 13,330 Tennessee 14,396 13,603 13,258 13,184 13,629 12,808 13,000 15,000 24,010 Texas 17,149 18,354 20,505 23,279 23,954 24,708 26,949 30,000 41,980
Total 126,044 125,438 122,590 126,578 133,682 133,064 134,215 143,700 216,800 South total: 214,605 214,100 211,144 217,043 228,421 226,026 221,324 235,728 354,020
Table 3—Forest area in the United Statesa by region, subregion, and State, 2002, 1997, 1987, 1977, 1953, 1938, 1907, and 1630
_________________________________________________________________________________________________

34
Table 3—(continued)._________________________________________________________________________________________________
Region, subregion, and State 2002 1997 1987b 1977c 1963d 1953e 1938f 1907g 1630h
___________________________________________________________________________________________________________________________________________
Thousand acres
Rocky Mountain:Great Plains:
Kansas 1,545 1,545 1,358 1,344 1,351 1,668 2,408 2,648 1,570 Nebraska 947 947 722 1,029 1,162 903 1,188 1,472 1,470 North Dakota 672 674 460 422 439 473 495 384 450South Dakota 1,619 1,632 1,690 1,702 1,837 2,169 2,080 2,200 2,480
Total 4,783 4,798 4,230 4,497 4,789 5,213 6,171 6,704 5,970
Intermountain:Arizona 19,427 19,926 19,384 18,494 19,902 19,212 20,106 21,000 21,570 Colorado 21,637 21,270 21,338 22,271 22,583 22,000 21,720 21,440 21,440 Idaho 21,646 21,937 21,818 21,727 21,815 21,025 21,713 22,400 24,130 Montana 23,293 23,232 21,910 22,559 22,048 22,330 22,415 22,500 23,320 Nevada 10,204 9,928 8,928 7,683 9,000 9,500 10,750 12,000 12,000 New Mexico 16,682 15,505 15,826 15,360 15,487 15,550 15,334 15,168 15,680 Utah 15,676 15,705 16,234 15,557 14,955 16,219 16,310 16,400 17,890 Wyoming 10,995 10,944 9,966 10,028 9,777 10,513 10,757 11,000 12,490
Total 139,560 138,447 135,404 133,679 135,567 136,349 139,105 141,908 148,520 Rocky Mountain total: 144,343 143,244 139,634 138,176 140,356 141,562 145,276 148,612 154,490
Pacific Coast:Alaska:
Alaska 126,869 127,380 129,045 129,100 129,100 129,100 129,100 129,100 129,100 Total 126,869 127,380 129,045 129,100 129,100 129,100 129,100 129,100 129,100
Pacific Northwest:Oregon 29,651 29,720 28,773 29,810 30,739 30,261 30,381 30,500 30,590 Washington 21,790 21,892 22,521 23,181 23,050 23,868 24,684 25,500 25,670
Total 51,441 51,612 51,294 52,991 53,789 54,129 55,065 56,000 56,260
Pacific Southwest:California 40,233 38,547 39,381 40,152 42,541 42,541 48,159 49,000 51,970 Hawaii 1,748 1,748 1,748 1,986 1,982 2,000 2,000 2,000 2,000
Total 41,981 40,296 41,129 42,138 44,523 44,541 50,159 51,000 53,970 Pacific Coast total: 220,291 219,288 221,468 224,229 227,412 227,770 234,324 236,100 239,330
_______________________________________________________________________________
United States: 748,923 746,958 737,750 743,633 761,936 756,167 759,814 759,140 1,045,435 _________________________________________________________________________________________________
a Estimates for 1938 include forest area for regions that would become the States of Alaska and Hawaii. Estimates for 1907 includeforest area for regions that would become the States of Alaska, Arizona, Hawaii, and New Mexico. Estimates for 1630 represent theforest area in North America for regions that would become the 50 States within the current United States.
b Data for 1987 based on Waddell et al. (1989).c Data for 1977 based on USDA Forest Service (1982).d Data for 1963 based on USDA Forest Service (1965).e Data for 1953 based on USDA Forest Service (1958).f Data for 1938 based on U.S. Congress (1938).g Data for 1907 based on Kellogg (1909).h Data for 1630 were also from Kellogg (1909) as an estimate of the original forest area based on the current estimate of forest and
historic land clearing information. These data are provided here for general reference purposes only to convey the relative extent ofthe forest estate, in what is now the United States, at the time of European settlement.

35
Productivity classa_____________________________________________________
ReservedRegion, 120 + 85-119 50-84 20-49 0-19 forestsubregion, and State Total cu. ft. cu. ft. cu. ft. cu. ft. cu. ft. land________________________________________________________________________________________________
Thousand acresNorth:
Northeast:Connecticut 1,859 61 110 549 977 149 14Delaware 383 24 39 128 184 7 0Maine 17,699 241 1,825 6,066 8,821 368 380Maryland 2,566 191 416 890 875 14 180Massachusetts 3,126 232 318 1,045 1,035 369 126New Hampshire 4,818 54 478 1,356 2,615 158 157New Jersey 2,132 26 137 475 1,238 96 160New York 18,432 815 1,592 3,754 9,228 123 2,920Pennsylvania 16,905 716 1,471 3,838 9,828 219 833Rhode Island 385 4 30 103 202 36 10Vermont 4,618 88 535 1,056 2,803 21 114West Virginia 12,108 971 2,718 3,839 4,373 27 181
Total 85,032 3,424 9,669 23,098 42,180 1,586 5,075
North Central: Illinois 4,331 754 1,303 1,340 690 0 244Indiana 4,501 1,082 1,641 1,203 416 0 159Iowa 2,050 82 573 911 377 19 88Michigan 19,281 960 4,388 7,710 5,558 90 575Minnesota 16,680 266 2,948 5,355 6,154 840 1,117 Missouri 13,992 124 554 6,395 6,291 311 317Ohio 7,855 387 583 1,495 5,103 147 140Wisconsin 15,963 1,014 4,022 7,013 3,652 61 201
Total 84,653 4,669 16,011 31,423 28,240 1,468 2,842 North total: 169,685 8,093 25,680 54,521 70,420 3,054 7,916
South:Southeast:
Florida 16,285 206 1,942 8,694 3,793 528 1,121 Georgia 24,405 983 6,093 14,970 1,756 7 595North Carolina 19,302 1,106 5,613 9,690 2,255 40 598South Carolina 12,495 902 3,229 5,842 2,327 0 194Virginia 16,074 563 3,294 9,501 2,013 16 686
Total 88,560 3,761 20,171 48,697 12,145 592 3,194
South Central:Alabama 22,987 4,941 9,115 7,470 1,396 0 65Arkansas 18,771 3,452 5,060 7,112 2,749 167 231Kentucky 12,684 1,102 2,065 3,876 5,305 32 305Louisiana 13,812 6,374 4,498 2,552 299 0 90Mississippi 18,580 7,900 7,347 3,033 291 0 8Oklahoma 7,665 258 636 2,715 2,624 1,386 45Tennessee 14,396 2,279 4,283 5,755 1,639 0 440Texas 17,149 3,722 4,769 2,707 576 5,250 125
Total 126,043 30,027 37,774 35,220 14,878 6,834 1,309 South total: 214,603 33,788 57,945 83,917 27,023 7,427 4,503
Table 4—Forest land area in the United States by productivity class, region, subregion, and State, 2002________________________________________________________________________________________________
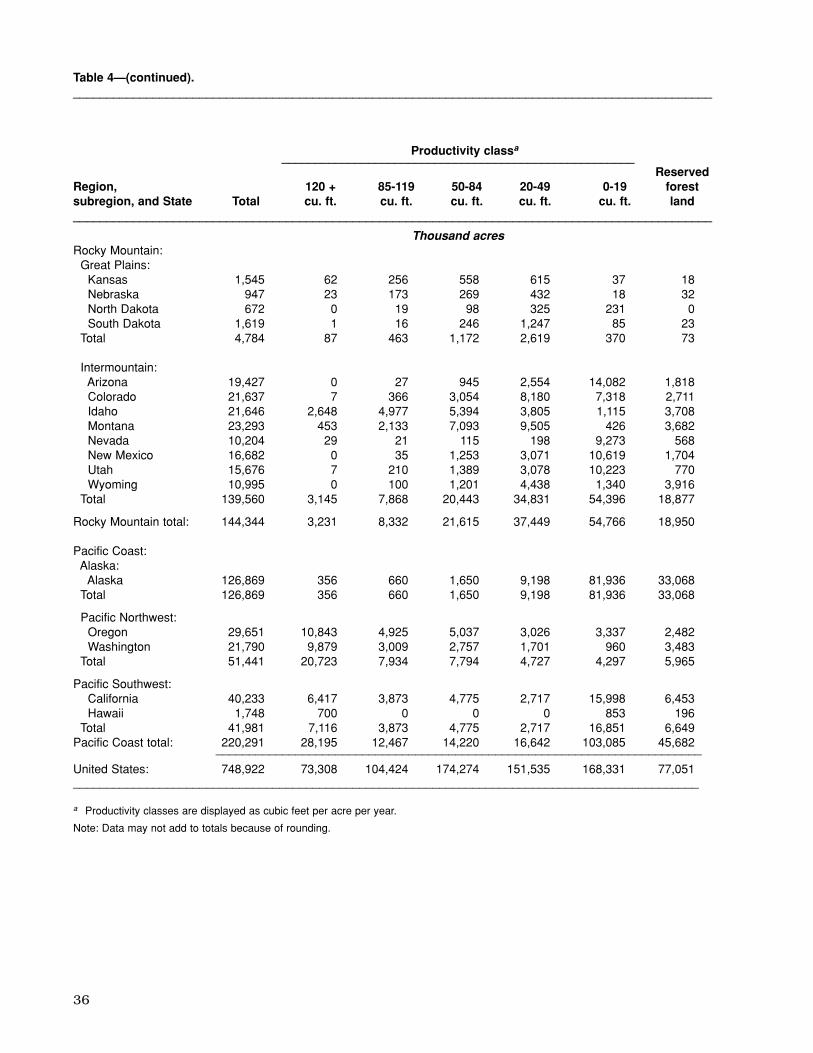
36
Table 4—(continued).________________________________________________________________________________________________
Productivity classa_____________________________________________________
ReservedRegion, 120 + 85-119 50-84 20-49 0-19 forestsubregion, and State Total cu. ft. cu. ft. cu. ft. cu. ft. cu. ft. land________________________________________________________________________________________________
Thousand acresRocky Mountain:
Great Plains:Kansas 1,545 62 256 558 615 37 18Nebraska 947 23 173 269 432 18 32North Dakota 672 0 19 98 325 231 0South Dakota 1,619 1 16 246 1,247 85 23
Total 4,784 87 463 1,172 2,619 370 73
Intermountain:Arizona 19,427 0 27 945 2,554 14,082 1,818 Colorado 21,637 7 366 3,054 8,180 7,318 2,711 Idaho 21,646 2,648 4,977 5,394 3,805 1,115 3,708 Montana 23,293 453 2,133 7,093 9,505 426 3,682 Nevada 10,204 29 21 115 198 9,273 568New Mexico 16,682 0 35 1,253 3,071 10,619 1,704 Utah 15,676 7 210 1,389 3,078 10,223 770Wyoming 10,995 0 100 1,201 4,438 1,340 3,916
Total 139,560 3,145 7,868 20,443 34,831 54,396 18,877
Rocky Mountain total: 144,344 3,231 8,332 21,615 37,449 54,766 18,950
Pacific Coast:Alaska:
Alaska 126,869 356 660 1,650 9,198 81,936 33,068 Total 126,869 356 660 1,650 9,198 81,936 33,068
Pacific Northwest:Oregon 29,651 10,843 4,925 5,037 3,026 3,337 2,482Washington 21,790 9,879 3,009 2,757 1,701 960 3,483
Total 51,441 20,723 7,934 7,794 4,727 4,297 5,965
Pacific Southwest:California 40,233 6,417 3,873 4,775 2,717 15,998 6,453 Hawaii 1,748 700 0 0 0 853 196
Total 41,981 7,116 3,873 4,775 2,717 16,851 6,649 Pacific Coast total: 220,291 28,195 12,467 14,220 16,642 103,085 45,682 _________________________________________________________________________
United States: 748,922 73,308 104,424 174,274 151,535 168,331 77,051 ______________________________________________________________________________________________
a Productivity classes are displayed as cubic feet per acre per year.
Note: Data may not add to totals because of rounding.

37
Great Plains:120 + 87 0 2 0 0 0 0 0 0 3 82 0 085 to 119 463 0 38 0 0 0 0 0 0 21 404 0 050 to 84 1,172 0 170 0 0 0 0 0 0 49 945 0 720 to 49 2,619 0 1,065 0 0 0 0 0 0 82 1,432 0 39Other forest 370 0 3 0 0 0 0 0 0 3 9 6 348Reserved 73 0 29 0 0 0 0 0 0 1 27 0 16
Total 4,784 0 1,307 0 0 0 0 0 0 160 2,900 6 410
Intermountain:120 + 3,145 1,343 308 64 841 341 61 130 0 6 51 0 085 to 119 7,868 2,664 505 31 2,855 630 341 559 0 5 263 0 1450 to 84 20,443 6,197 2,641 29 6,175 518 372 2,456 0 111 1,846 0 9720 to 49 34,831 7,219 10,525 0 4,539 23 119 6,410 0 1,559 4,086 70 281Other forest 54,396 122 280 0 217 0 15 451 0 2,285 6,113 43,721 1,191 Reserved 18,877 2,595 1,709 0 4,611 68 103 4,690 0 1,053 1,055 2,428 567
Total 139,560 20,141 15,968 124 19,239 1,580 1,011 14,696 0 5,019 13,414 46,219 2,150
Alaskab:120 + 356 0 0 0 0 336 0 0 0 0 20 0 085 to 119 660 0 0 0 6 637 0 0 0 0 17 0 050 to 84 1,650 0 0 0 104 1,451 0 6 0 6 82 0 120 to 49 9,198 0 0 0 3,538 1,823 0 34 0 149 3,543 0 112Other forest 81,936 0 0 0 30,681 2,581 0 294 0 44,103 4,272 0 4Reserved 33,068 0 0 0 11,412 3,622 0 28 0 16,587 1,352 0 68
Total 126,869 0 0 0 45,741 10,449 0 361 0 60,845 9,287 0 185
Pacific Northwest:120 + 20,723 10,208 292 11 2,042 4,057 76 476 6 7 3,223 22 30285 to 119 7,934 3,005 1,387 14 1,201 538 112 696 0 8 799 69 10750 to 84 7,794 2,518 2,493 4 830 355 80 797 0 26 434 134 12220 to 49 4,727 1,230 2,079 22 204 77 14 477 0 23 253 192 156Other forest 4,297 327 766 2 12 26 0 19 0 11 714 2,216 204Reserved 5,965 1,268 202 37 1,421 2,152 55 246 0 308 173 76 26
Total 51,441 18,555 7,219 90 5,711 7,206 338 2,710 6 383 5,597 2,709 918
Pacific Southwest:120 + 7,116 383 1,243 0 511 13 0 22 654 2,353 1,519 2 41585 to 119 3,873 213 933 2 407 1 0 42 76 1,060 1,046 0 9350 to 84 4,775 143 1,789 17 305 18 0 200 0 748 1,275 1 28120 to 49 2,717 29 881 21 132 16 0 179 0 502 621 4 332Other forest 16,851 5 1,501 16 5 0 0 7 0 373 11,864 2,404 676Reserved 6,649 132 628 96 791 93 0 542 186 1,190 2,232 393 366
Total 41,981 904 6,975 152 2,150 141 0 992 916 6,226 18,558 2,805 2,162
West total:120 + 31,426 11,934 1,845 75 3,395 4,747 137 628 660 2,369 4,896 24 71885 to 119 20,798 5,882 2,862 46 4,469 1,806 454 1,296 76 1,094 2,530 69 21450 to 84 35,835 8,858 7,093 49 7,414 2,343 452 3,459 0 941 4,582 136 50820 to 49 54,092 8,477 14,550 43 8,413 1,939 133 7,100 0 2,316 9,936 266 919Other forest 157,851 454 2,550 18 30,915 2,608 15 771 0 46,776 22,973 48,348 2,423 Reserved 64,632 3,995 2,568 133 18,235 5,935 157 5,506 186 19,138 4,839 2,897 1,042 __________________________________________________________________________________________________________
Total 364,634 39,599 31,469 365 72,841 19,377 1,349 18,759 921 72,633 49,756 51,739 5,825
Table 5—Forest land area in the Western United States by forest type group, subregion, productivity class, and ownershipgroup, 2002
_____________________________________________________________________________________________________
Forest type group______________________________________________________________________________________________________________
Subregion and All Pon- Western Hemlock- Lodge- Other Westernproductivity forest Douglas- derosa white Fir- Sitka pole soft- hard- Pinyon- Non-class a types fir pine pine spruce spruce Larch pine Redwood woods woods juniper stocked _____________________________________________________________________________________________________________________________________________________________________________________________
Thousand acresAll ownership groups
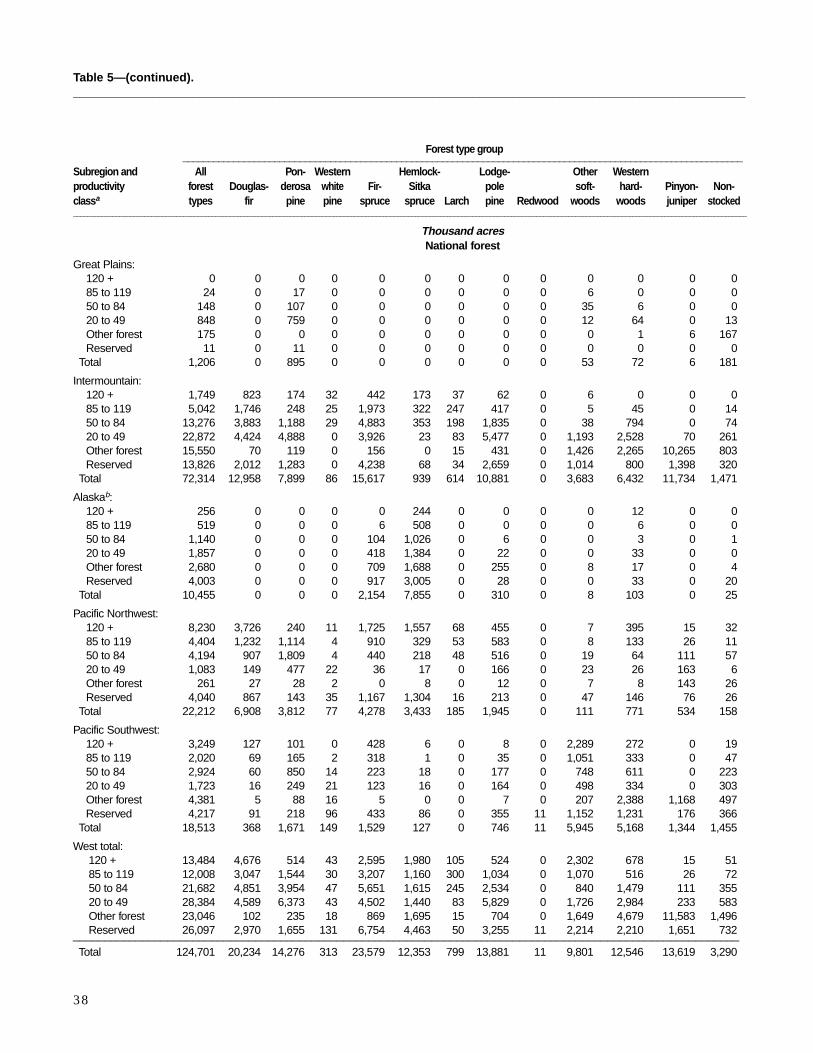
38
Table 5—(contin ued)._____________________________________________________________________________________________________
Great Plains:120 + 0 0 0 0 0 0 0 0 0 0 0 0 085 to 119 24 0 17 0 0 0 0 0 0 6 0 0 050 to 84 148 0 107 0 0 0 0 0 0 35 6 0 020 to 49 848 0 759 0 0 0 0 0 0 12 64 0 13Other forest 175 0 0 0 0 0 0 0 0 0 1 6 167Reserved 11 0 11 0 0 0 0 0 0 0 0 0 0
Total 1,206 0 895 0 0 0 0 0 0 53 72 6 181
Intermountain:120 + 1,749 823 174 32 442 173 37 62 0 6 0 0 085 to 119 5,042 1,746 248 25 1,973 322 247 417 0 5 45 0 1450 to 84 13,276 3,883 1,188 29 4,883 353 198 1,835 0 38 794 0 7420 to 49 22,872 4,424 4,888 0 3,926 23 83 5,477 0 1,193 2,528 70 261Other forest 15,550 70 119 0 156 0 15 431 0 1,426 2,265 10,265 803Reserved 13,826 2,012 1,283 0 4,238 68 34 2,659 0 1,014 800 1,398 320
Total 72,314 12,958 7,899 86 15,617 939 614 10,881 0 3,683 6,432 11,734 1,471
Alaskab:120 + 256 0 0 0 0 244 0 0 0 0 12 0 085 to 119 519 0 0 0 6 508 0 0 0 0 6 0 050 to 84 1,140 0 0 0 104 1,026 0 6 0 0 3 0 120 to 49 1,857 0 0 0 418 1,384 0 22 0 0 33 0 0Other forest 2,680 0 0 0 709 1,688 0 255 0 8 17 0 4Reserved 4,003 0 0 0 917 3,005 0 28 0 0 33 0 20
Total 10,455 0 0 0 2,154 7,855 0 310 0 8 103 0 25
Pacific Northwest:120 + 8,230 3,726 240 11 1,725 1,557 68 455 0 7 395 15 3285 to 119 4,404 1,232 1,114 4 910 329 53 583 0 8 133 26 1150 to 84 4,194 907 1,809 4 440 218 48 516 0 19 64 111 5720 to 49 1,083 149 477 22 36 17 0 166 0 23 26 163 6Other forest 261 27 28 2 0 8 0 12 0 7 8 143 26Reserved 4,040 867 143 35 1,167 1,304 16 213 0 47 146 76 26
Total 22,212 6,908 3,812 77 4,278 3,433 185 1,945 0 111 771 534 158
Pacific Southwest:120 + 3,249 127 101 0 428 6 0 8 0 2,289 272 0 1985 to 119 2,020 69 165 2 318 1 0 35 0 1,051 333 0 4750 to 84 2,924 60 850 14 223 18 0 177 0 748 611 0 22320 to 49 1,723 16 249 21 123 16 0 164 0 498 334 0 303Other forest 4,381 5 88 16 5 0 0 7 0 207 2,388 1,168 497Reserved 4,217 91 218 96 433 86 0 355 11 1,152 1,231 176 366
Total 18,513 368 1,671 149 1,529 127 0 746 11 5,945 5,168 1,344 1,455
West total:120 + 13,484 4,676 514 43 2,595 1,980 105 524 0 2,302 678 15 5185 to 119 12,008 3,047 1,544 30 3,207 1,160 300 1,034 0 1,070 516 26 7250 to 84 21,682 4,851 3,954 47 5,651 1,615 245 2,534 0 840 1,479 111 35520 to 49 28,384 4,589 6,373 43 4,502 1,440 83 5,829 0 1,726 2,984 233 583Other forest 23,046 102 235 18 869 1,695 15 704 0 1,649 4,679 11,583 1,496 Reserved 26,097 2,970 1,655 131 6,754 4,463 50 3,255 11 2,214 2,210 1,651 732 __________________________________________________________________________________________________________
Total 124,701 20,234 14,276 313 23,579 12,353 799 13,881 11 9,801 12,546 13,619 3,290
Forest type gr oup______________________________________________________________________________________________________________
Subregion and All Pon- Western Hemloc k- Lodg e- Other Westernproductivity forest Douglas- derosa white Fir- Sitka pole soft- hard- Pinyon- Non-classa types fir pine pine spruce spruce Larch pine Redwood woods woods juniper stoc ked _____________________________________________________________________________________________________________________________________________________________________________________________
Thousand acresNational f orest

39
Great Plains:120 + 12 0 0 0 0 0 0 0 0 0 12 0 085 to 119 27 0 5 0 0 0 0 0 0 0 22 0 050 to 84 87 0 11 0 0 0 0 0 0 0 72 0 420 to 49 131 0 43 0 0 0 0 0 0 6 77 0 5Other forest 15 0 0 0 0 0 0 0 0 0 1 0 14Reserved 55 0 13 0 0 0 0 0 0 1 25 0 16
Total 327 0 72 0 0 0 0 0 0 7 210 0 38
Intermountain:120 + 432 137 35 6 168 54 6 15 0 0 11 0 085 to 119 759 282 48 0 253 109 23 14 0 0 30 0 050 to 84 1,638 674 138 0 325 57 35 182 0 22 204 0 020 to 49 3,222 1,038 1,082 0 213 0 2 418 0 166 302 0 0Other forest 21,347 30 60 0 54 0 0 11 0 189 1,052 19,856 96Reserved 4,888 544 419 0 359 0 69 2,031 0 38 236 945 247
Total 32,287 2,705 1,782 6 1,374 221 136 2,670 0 415 1,836 20,801 342
Alaskab:120 + 60 0 0 0 0 55 0 0 0 0 6 0 085 to 119 100 0 0 0 0 88 0 0 0 0 12 0 050 to 84 239 0 0 0 0 159 0 0 0 0 79 0 020 to 49 4,922 0 0 0 1,951 129 0 0 0 57 2,718 0 67Other forest 46,158 0 0 0 7,618 290 0 15 0 34,873 3,361 0 0Reserved 29,059 0 0 0 10,489 617 0 0 0 16,587 1,319 0 48
Total 80,538 0 0 0 20,058 1,338 0 15 0 51,517 7,495 0 114
Pacific Northwest:120 + 3,225 1,913 0 0 71 585 0 0 0 0 622 7 2885 to 119 812 512 65 0 52 57 18 13 0 0 88 0 650 to 84 824 481 71 0 43 35 11 38 0 7 133 7 020 to 49 732 284 213 0 6 11 0 64 0 0 116 7 32Other forest 1,244 94 137 0 0 0 0 0 0 3 111 864 35Reserved 1,785 392 51 3 248 797 4 7 0 259 24 0 0
Total 8,623 3,675 536 3 420 1,485 33 122 0 269 1,094 885 100
Pacific Southwest:120 + 474 10 45 0 0 0 0 0 79 18 149 0 17385 to 119 115 0 57 0 10 0 0 0 1 0 47 0 050 to 84 77 7 19 0 0 0 0 1 0 0 49 0 020 to 49 55 0 36 0 0 0 0 1 0 0 11 3 4Other forest 2,450 0 81 0 0 0 0 0 0 55 1,545 741 29Reserved 2,388 39 407 0 358 7 0 187 173 35 966 217 0
Total 5,559 57 645 0 368 7 0 189 253 108 2,767 961 206
West total:120 + 4,204 2,060 80 6 240 694 6 15 79 18 800 7 20185 to 119 1,813 794 175 0 316 255 41 27 1 0 199 0 650 to 84 2,864 1,162 239 0 368 252 46 221 0 29 537 7 420 to 49 9,063 1,322 1,374 0 2,170 140 2 483 0 229 3,225 9 108Other forest 71,215 124 278 0 7,672 290 0 26 0 35,121 6,070 21,461 173Reserved 38,175 975 890 3 11,454 1,421 73 2,225 173 16,919 2,571 1,162 310
__________________________________________________________________________________________________________
Total 127,334 6,437 3,035 9 22,220 3,051 169 2,996 253 52,316 13,402 22,647 800
Table 5—(contin ued)._____________________________________________________________________________________________________
Forest type gr oup______________________________________________________________________________________________________________
Subregion and All Pon- Western Hemloc k- Lodg e- Other Westernproductivity forest Douglas- derosa white Fir- Sitka pole soft- hard- Pinyon- Non-classa types fir pine pine spruce spruce Larch pine Redwood woods woods juniper stoc ked _____________________________________________________________________________________________________________________________________________________________________________________________
Thousand acresOther pub lic
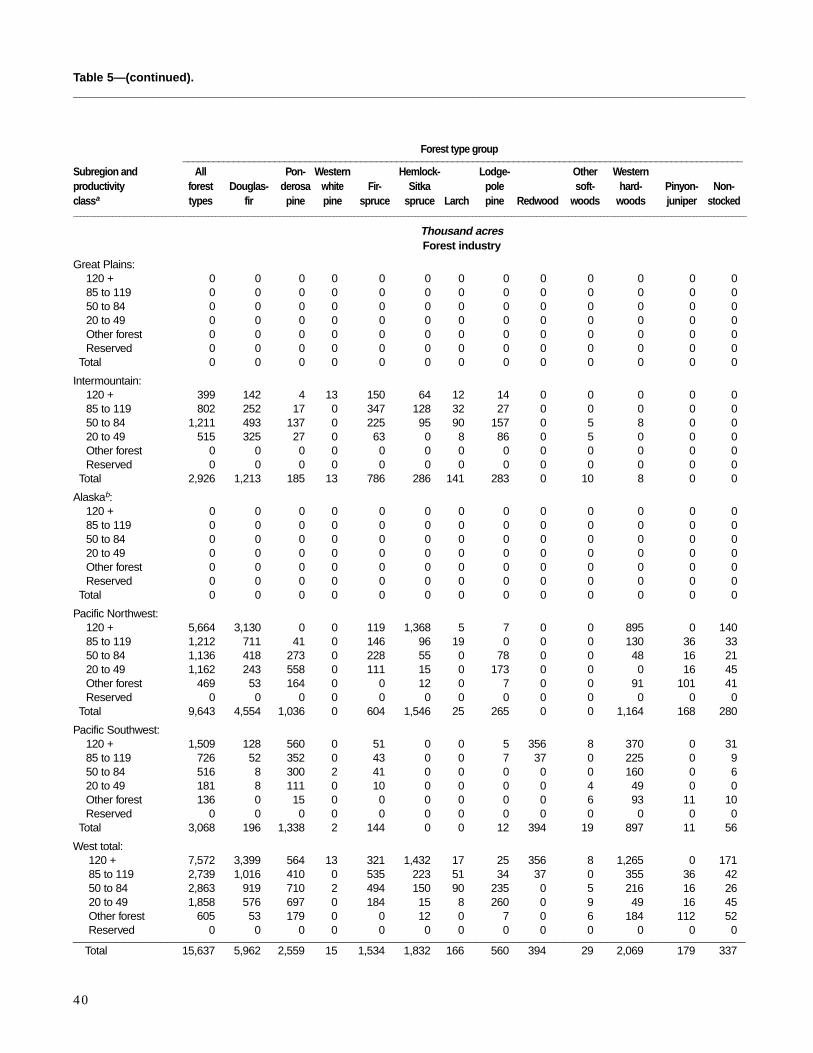
40
Great Plains:120 + 0 0 0 0 0 0 0 0 0 0 0 0 085 to 119 0 0 0 0 0 0 0 0 0 0 0 0 050 to 84 0 0 0 0 0 0 0 0 0 0 0 0 020 to 49 0 0 0 0 0 0 0 0 0 0 0 0 0Other forest 0 0 0 0 0 0 0 0 0 0 0 0 0Reserved 0 0 0 0 0 0 0 0 0 0 0 0 0
Total 0 0 0 0 0 0 0 0 0 0 0 0 0
Intermountain:120 + 399 142 4 13 150 64 12 14 0 0 0 0 085 to 119 802 252 17 0 347 128 32 27 0 0 0 0 050 to 84 1,211 493 137 0 225 95 90 157 0 5 8 0 020 to 49 515 325 27 0 63 0 8 86 0 5 0 0 0Other forest 0 0 0 0 0 0 0 0 0 0 0 0 0Reserved 0 0 0 0 0 0 0 0 0 0 0 0 0
Total 2,926 1,213 185 13 786 286 141 283 0 10 8 0 0
Alaskab:120 + 0 0 0 0 0 0 0 0 0 0 0 0 085 to 119 0 0 0 0 0 0 0 0 0 0 0 0 050 to 84 0 0 0 0 0 0 0 0 0 0 0 0 020 to 49 0 0 0 0 0 0 0 0 0 0 0 0 0Other forest 0 0 0 0 0 0 0 0 0 0 0 0 0Reserved 0 0 0 0 0 0 0 0 0 0 0 0 0
Total 0 0 0 0 0 0 0 0 0 0 0 0 0
Pacific Northwest:120 + 5,664 3,130 0 0 119 1,368 5 7 0 0 895 0 14085 to 119 1,212 711 41 0 146 96 19 0 0 0 130 36 3350 to 84 1,136 418 273 0 228 55 0 78 0 0 48 16 2120 to 49 1,162 243 558 0 111 15 0 173 0 0 0 16 45Other forest 469 53 164 0 0 12 0 7 0 0 91 101 41Reserved 0 0 0 0 0 0 0 0 0 0 0 0 0
Total 9,643 4,554 1,036 0 604 1,546 25 265 0 0 1,164 168 280
Pacific Southwest:120 + 1,509 128 560 0 51 0 0 5 356 8 370 0 3185 to 119 726 52 352 0 43 0 0 7 37 0 225 0 950 to 84 516 8 300 2 41 0 0 0 0 0 160 0 620 to 49 181 8 111 0 10 0 0 0 0 4 49 0 0Other forest 136 0 15 0 0 0 0 0 0 6 93 11 10Reserved 0 0 0 0 0 0 0 0 0 0 0 0 0
Total 3,068 196 1,338 2 144 0 0 12 394 19 897 11 56
West total:120 + 7,572 3,399 564 13 321 1,432 17 25 356 8 1,265 0 17185 to 119 2,739 1,016 410 0 535 223 51 34 37 0 355 36 4250 to 84 2,863 919 710 2 494 150 90 235 0 5 216 16 2620 to 49 1,858 576 697 0 184 15 8 260 0 9 49 16 45Other forest 605 53 179 0 0 12 0 7 0 6 184 112 52Reserved 0 0 0 0 0 0 0 0 0 0 0 0 0
___________________________________________________________________________________________________________Total 15,637 5,962 2,559 15 1,534 1,832 166 560 394 29 2,069 179 337
Table 5—(contin ued)._____________________________________________________________________________________________________
Forest type gr oup______________________________________________________________________________________________________________
Subregion and All Pon- Western Hemloc k- Lodg e- Other Westernproductivity forest Douglas- derosa white Fir- Sitka pole soft- hard- Pinyon- Non-classa types fir pine pine spruce spruce Larch pine Redwood woods woods juniper stoc ked _____________________________________________________________________________________________________________________________________________________________________________________________
Thousand acresForest industr y

41
Table 5—(contin ued)._____________________________________________________________________________________________________
Great Plains:120 + 75 0 2 0 0 0 0 0 0 3 70 0 085 to 119 413 0 15 0 0 0 0 0 0 15 382 0 050 to 84 938 0 52 0 0 0 0 0 0 14 867 0 420 to 49 1,639 0 263 0 0 0 0 0 0 64 1,291 0 20Other forest 180 0 3 0 0 0 0 0 0 3 6 0 167Reserved 6 0 5 0 0 0 0 0 0 0 2 0 0
Total 3,251 0 341 0 0 0 0 0 0 100 2,619 0 192Intermountain:
120 + 565 241 95 13 80 50 6 40 0 0 40 0 085 to 119 1,266 384 193 6 283 72 40 101 0 0 188 0 050 to 84 4,318 1,147 1,177 0 741 13 48 282 0 47 839 0 2320 to 49 8,221 1,431 4,527 0 337 0 26 429 0 194 1,256 0 20Other forest 17,499 22 102 0 7 0 0 9 0 670 2,796 13,600 293Reserved 164 39 7 0 14 0 0 0 0 0 19 84 0
Total 32,032 3,265 6,101 19 1,462 134 120 861 0 911 5,138 13,684 336Alaskab:
120 + 40 0 0 0 0 37 0 0 0 0 3 0 085 to 119 41 0 0 0 0 41 0 0 0 0 0 0 050 to 84 271 0 0 0 0 266 0 0 0 6 0 0 020 to 49 2,419 0 0 0 1,169 310 0 12 0 92 792 0 45Other forest 33,098 0 0 0 22,354 603 0 25 0 9,222 894 0 0Reserved 6 0 0 0 6 0 0 0 0 0 0 0 0
Total 35,875 0 0 0 23,528 1,256 0 36 0 9,320 1,689 0 45Pacific Northwest:
120 + 3,603 1,439 53 0 127 547 3 14 6 0 1,312 0 10385 to 119 1,507 550 166 10 92 55 22 100 0 0 449 7 5650 to 84 1,641 712 340 0 119 47 22 165 0 0 190 0 4520 to 49 1,750 554 830 0 51 35 14 74 0 0 111 7 73Other forest 2,323 153 437 0 12 7 0 0 0 0 504 1,108 102Reserved 140 9 8 0 7 52 34 26 0 2 3 0 0
Total 10,963 3,418 1,834 10 409 743 95 379 6 2 2,567 1,121 379Pacific Southwest:
120 + 1,884 118 537 0 33 7 0 10 219 37 729 2 19285 to 119 1,012 92 359 0 36 0 0 0 38 9 442 0 3850 to 84 1,258 67 621 0 41 0 0 22 0 0 455 1 5220 to 49 758 6 485 0 0 0 0 14 0 1 227 1 24Other forest 9,884 0 1,317 0 0 0 0 0 0 104 7,839 484 140Reserved 44 2 3 0 0 0 0 0 1 3 35 0 0
Total 14,840 284 3,322 0 110 7 0 46 258 154 9,726 489 445West total:
120 + 6,166 1,799 687 13 240 641 9 64 224 40 2,153 2 29585 to 119 4,238 1,025 733 16 411 168 62 201 38 24 1,460 7 9450 to 84 8,426 1,927 2,191 0 901 326 71 469 0 67 2,351 1 12320 to 49 14,787 1,991 6,106 0 1,557 344 41 528 0 352 3,677 8 183Other forest 62,984 175 1,859 0 22,373 610 0 34 0 10,000 12,039 15,192 702Reserved 360 50 22 0 27 52 34 26 1 5 59 84 0 __________________________________________________________________________________________________________
Total 96,962 6,967 11,598 29 25,509 2,141 216 1,322 263 10,487 21,739 15,294 1,398__________________________________________________________________________________________________________a Productivity classes are displayed as cubic feet per acre per year.b Per the Alaska Natives Claims Settlement Act of 1971, approximately 35 million forested acres expected upon update of all ownership data
for Alaska.Note: Data may not add to totals because of rounding.
Forest type gr oup_______________________________________________________________________________________________________________
Subregion and All Pon- Western Hemloc k- Lodg e- Other Westernproductivity forest Douglas- derosa white Fir- Sitka pole soft- hard- Pinyon- Non-classa types fir pine pine spruce spruce Larch pine Redwood woods woods juniper stoc ked _____________________________________________________________________________________________________________________________________________________________________________________________
Thousand acresNonindustrial priv ate
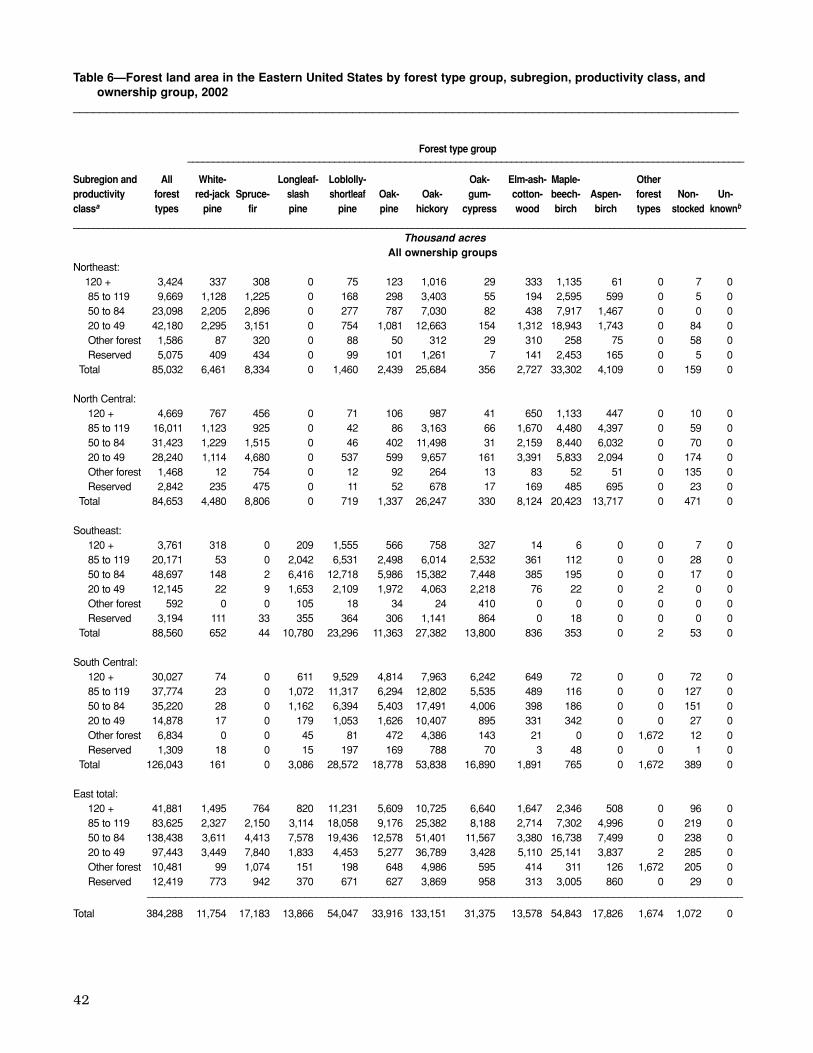
42
Forest type group______________________________________________________________________________________________________________
Subregion and All White- Longleaf- Loblolly- Oak- Elm-ash- Maple- Otherproductivity forest red-jack Spruce- slash shortleaf Oak- Oak- gum- cotton- beech- Aspen- forest Non- Un-classa types pine fir pine pine pine hickory cypress wood birch birch types stocked knownb
_____________________________________________________________________________________________________________________________________Thousand acres
All ownership groupsNortheast:
120 + 3,424 337 308 0 75 123 1,016 29 333 1,135 61 0 7 085 to 119 9,669 1,128 1,225 0 168 298 3,403 55 194 2,595 599 0 5 050 to 84 23,098 2,205 2,896 0 277 787 7,030 82 438 7,917 1,467 0 0 020 to 49 42,180 2,295 3,151 0 754 1,081 12,663 154 1,312 18,943 1,743 0 84 0Other forest 1,586 87 320 0 88 50 312 29 310 258 75 0 58 0Reserved 5,075 409 434 0 99 101 1,261 7 141 2,453 165 0 5 0
Total 85,032 6,461 8,334 0 1,460 2,439 25,684 356 2,727 33,302 4,109 0 159 0
North Central:120 + 4,669 767 456 0 71 106 987 41 650 1,133 447 0 10 085 to 119 16,011 1,123 925 0 42 86 3,163 66 1,670 4,480 4,397 0 59 050 to 84 31,423 1,229 1,515 0 46 402 11,498 31 2,159 8,440 6,032 0 70 020 to 49 28,240 1,114 4,680 0 537 599 9,657 161 3,391 5,833 2,094 0 174 0Other forest 1,468 12 754 0 12 92 264 13 83 52 51 0 135 0Reserved 2,842 235 475 0 11 52 678 17 169 485 695 0 23 0
Total 84,653 4,480 8,806 0 719 1,337 26,247 330 8,124 20,423 13,717 0 471 0
Southeast:120 + 3,761 318 0 209 1,555 566 758 327 14 6 0 0 7 085 to 119 20,171 53 0 2,042 6,531 2,498 6,014 2,532 361 112 0 0 28 050 to 84 48,697 148 2 6,416 12,718 5,986 15,382 7,448 385 195 0 0 17 020 to 49 12,145 22 9 1,653 2,109 1,972 4,063 2,218 76 22 0 2 0 0Other forest 592 0 0 105 18 34 24 410 0 0 0 0 0 0Reserved 3,194 111 33 355 364 306 1,141 864 0 18 0 0 0 0
Total 88,560 652 44 10,780 23,296 11,363 27,382 13,800 836 353 0 2 53 0
South Central:120 + 30,027 74 0 611 9,529 4,814 7,963 6,242 649 72 0 0 72 085 to 119 37,774 23 0 1,072 11,317 6,294 12,802 5,535 489 116 0 0 127 050 to 84 35,220 28 0 1,162 6,394 5,403 17,491 4,006 398 186 0 0 151 020 to 49 14,878 17 0 179 1,053 1,626 10,407 895 331 342 0 0 27 0Other forest 6,834 0 0 45 81 472 4,386 143 21 0 0 1,672 12 0Reserved 1,309 18 0 15 197 169 788 70 3 48 0 0 1 0
Total 126,043 161 0 3,086 28,572 18,778 53,838 16,890 1,891 765 0 1,672 389 0
East total:120 + 41,881 1,495 764 820 11,231 5,609 10,725 6,640 1,647 2,346 508 0 96 085 to 119 83,625 2,327 2,150 3,114 18,058 9,176 25,382 8,188 2,714 7,302 4,996 0 219 050 to 84 138,438 3,611 4,413 7,578 19,436 12,578 51,401 11,567 3,380 16,738 7,499 0 238 020 to 49 97,443 3,449 7,840 1,833 4,453 5,277 36,789 3,428 5,110 25,141 3,837 2 285 0Other forest 10,481 99 1,074 151 198 648 4,986 595 414 311 126 1,672 205 0Reserved 12,419 773 942 370 671 627 3,869 958 313 3,005 860 0 29 0
__________________________________________________________________________________________________________
Total 384,288 11,754 17,183 13,866 54,047 33,916 133,151 31,375 13,578 54,843 17,826 1,674 1,072 0
Table 6—Forest land area in the Eastern United States by forest type group, subregion, productivity class, andownership group, 2002
____________________________________________________________________________________________________
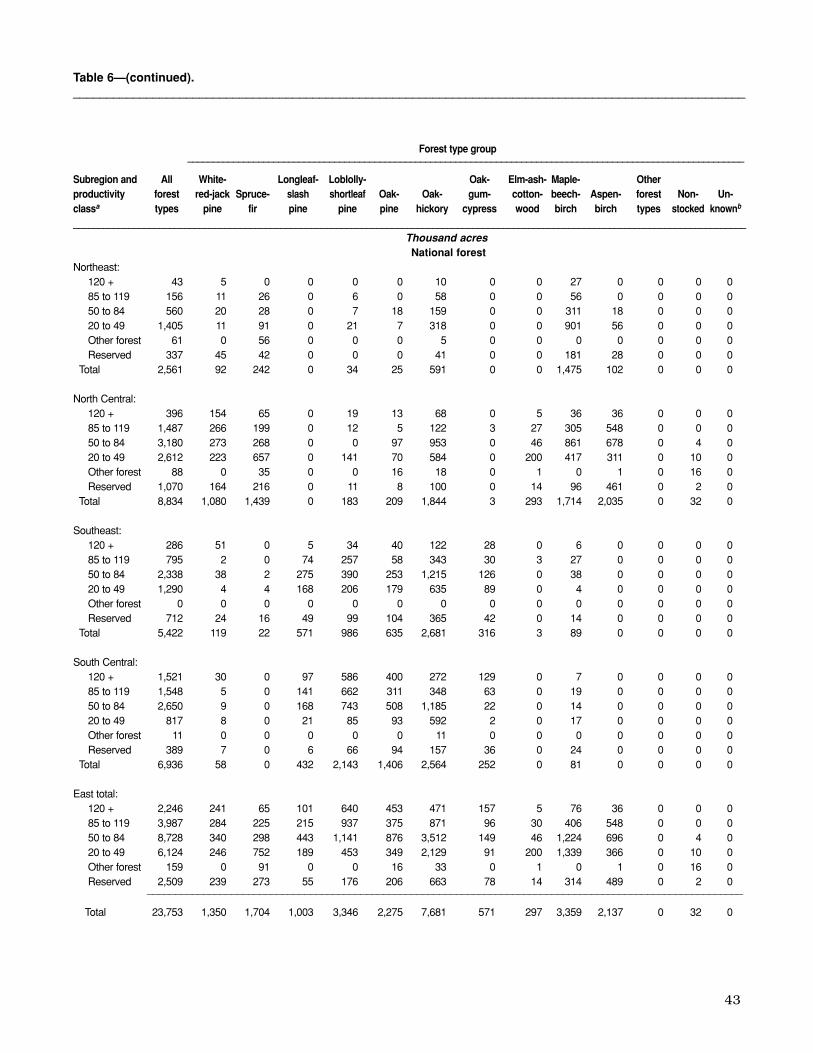
43
Table 6—(continued)._____________________________________________________________________________________________________
Forest type group______________________________________________________________________________________________________________
Subregion and All White- Longleaf- Loblolly- Oak- Elm-ash- Maple- Otherproductivity forest red-jack Spruce- slash shortleaf Oak- Oak- gum- cotton- beech- Aspen- forest Non- Un-classa types pine fir pine pine pine hickory cypress wood birch birch types stocked knownb
_____________________________________________________________________________________________________________________________________Thousand acresNational forest
Northeast:120 + 43 5 0 0 0 0 10 0 0 27 0 0 0 085 to 119 156 11 26 0 6 0 58 0 0 56 0 0 0 050 to 84 560 20 28 0 7 18 159 0 0 311 18 0 0 020 to 49 1,405 11 91 0 21 7 318 0 0 901 56 0 0 0Other forest 61 0 56 0 0 0 5 0 0 0 0 0 0 0Reserved 337 45 42 0 0 0 41 0 0 181 28 0 0 0
Total 2,561 92 242 0 34 25 591 0 0 1,475 102 0 0 0
North Central:120 + 396 154 65 0 19 13 68 0 5 36 36 0 0 085 to 119 1,487 266 199 0 12 5 122 3 27 305 548 0 0 050 to 84 3,180 273 268 0 0 97 953 0 46 861 678 0 4 020 to 49 2,612 223 657 0 141 70 584 0 200 417 311 0 10 0Other forest 88 0 35 0 0 16 18 0 1 0 1 0 16 0Reserved 1,070 164 216 0 11 8 100 0 14 96 461 0 2 0
Total 8,834 1,080 1,439 0 183 209 1,844 3 293 1,714 2,035 0 32 0
Southeast:120 + 286 51 0 5 34 40 122 28 0 6 0 0 0 085 to 119 795 2 0 74 257 58 343 30 3 27 0 0 0 050 to 84 2,338 38 2 275 390 253 1,215 126 0 38 0 0 0 020 to 49 1,290 4 4 168 206 179 635 89 0 4 0 0 0 0Other forest 0 0 0 0 0 0 0 0 0 0 0 0 0 0Reserved 712 24 16 49 99 104 365 42 0 14 0 0 0 0
Total 5,422 119 22 571 986 635 2,681 316 3 89 0 0 0 0
South Central:120 + 1,521 30 0 97 586 400 272 129 0 7 0 0 0 085 to 119 1,548 5 0 141 662 311 348 63 0 19 0 0 0 050 to 84 2,650 9 0 168 743 508 1,185 22 0 14 0 0 0 020 to 49 817 8 0 21 85 93 592 2 0 17 0 0 0 0Other forest 11 0 0 0 0 0 11 0 0 0 0 0 0 0Reserved 389 7 0 6 66 94 157 36 0 24 0 0 0 0
Total 6,936 58 0 432 2,143 1,406 2,564 252 0 81 0 0 0 0
East total:120 + 2,246 241 65 101 640 453 471 157 5 76 36 0 0 085 to 119 3,987 284 225 215 937 375 871 96 30 406 548 0 0 050 to 84 8,728 340 298 443 1,141 876 3,512 149 46 1,224 696 0 4 020 to 49 6,124 246 752 189 453 349 2,129 91 200 1,339 366 0 10 0Other forest 159 0 91 0 0 16 33 0 1 0 1 0 16 0Reserved 2,509 239 273 55 176 206 663 78 14 314 489 0 2 0
__________________________________________________________________________________________________________
Total 23,753 1,350 1,704 1,003 3,346 2,275 7,681 571 297 3,359 2,137 0 32 0

44
Forest type group______________________________________________________________________________________________________________
Subregion and All White- Longleaf- Loblolly- Oak- Elm-ash- Maple- Otherproductivity forest red-jack Spruce- slash shortleaf Oak- Oak- gum- cotton- beech- Aspen- forest Non- Un-classa types pine fir pine pine pine hickory cypress wood birch birch types stocked knownb
_____________________________________________________________________________________________________________________________________Thousand acres
Other public
Northeast:120 + 237 39 58 0 7 5 43 0 28 49 7 0 0 085 to 119 663 129 31 0 28 30 218 7 18 172 31 0 0 050 to 84 1,968 170 206 0 39 67 732 18 50 589 97 0 0 020 to 49 5,053 234 101 0 270 169 2,207 28 145 1,765 135 0 0 0Other forest 259 10 20 0 58 1 51 19 51 43 6 0 0 0Reserved 4,574 346 385 0 87 93 1,195 7 130 2,200 125 0 5 0
Total 12,754 927 801 0 488 365 4,446 80 423 4,817 401 0 5 0
North Central:120 + 654 153 138 0 6 13 54 3 72 82 132 0 1 085 to 119 2,802 321 273 0 3 3 294 6 207 393 1,292 0 11 050 to 84 5,583 420 474 0 0 21 1,034 7 293 1,295 2,016 0 22 020 to 49 5,748 503 2,148 0 29 15 758 23 744 737 723 0 66 0Other forest 763 0 621 0 0 0 14 13 31 2 25 0 57 0Reserved 1,669 49 253 0 0 41 559 17 146 364 219 0 21 0
Total 17,219 1,446 3,907 0 38 94 2,714 69 1,493 2,874 4,407 0 179 0
Southeast:120 + 167 3 0 42 74 23 10 15 1 0 0 0 0 085 to 119 879 4 0 190 267 86 138 172 19 2 0 0 0 050 to 84 2,500 6 0 567 520 215 487 687 19 0 0 0 0 020 to 49 1,353 8 0 353 215 298 240 233 1 2 0 2 0 0Other forest 4 0 0 0 0 0 4 0 0 0 0 0 0 0Reserved 2,436 87 17 306 266 202 775 778 0 4 0 0 0 0
Total 7,340 108 17 1,460 1,342 824 1,654 1,884 40 10 0 2 0 0
South Central:120 + 1,386 4 0 22 288 175 261 538 90 0 0 0 8 085 to 119 1,571 1 0 26 269 197 436 554 62 0 0 0 27 050 to 84 1,495 0 0 82 110 203 696 345 53 0 0 0 5 020 to 49 630 0 0 9 44 93 364 107 3 9 0 0 0 0Other forest 58 0 0 0 13 0 41 0 4 0 0 0 0 0Reserved 920 12 0 9 131 75 632 34 3 24 0 0 1 0
Total 6,060 17 0 149 855 743 2,431 1,578 214 33 0 0 41 0
East total:120 + 2,444 199 196 64 375 216 368 555 191 131 138 0 10 085 to 119 5,915 455 304 217 567 315 1,086 739 305 567 1,322 0 38 050 to 84 11,546 596 680 649 669 506 2,949 1,057 416 1,884 2,113 0 27 020 to 49 12,784 745 2,249 363 558 576 3,570 391 893 2,513 859 2 66 0Other forest 1,084 10 641 0 71 1 110 33 86 45 31 0 57 0Reserved 9,600 494 655 315 484 412 3,161 836 278 2,593 344 0 27 0
__________________________________________________________________________________________________________
Total 43,373 2,498 4,725 1,608 2,723 2,027 11,244 3,610 2,169 7,733 4,808 2 226 0
Table 6—(continued)._____________________________________________________________________________________________________
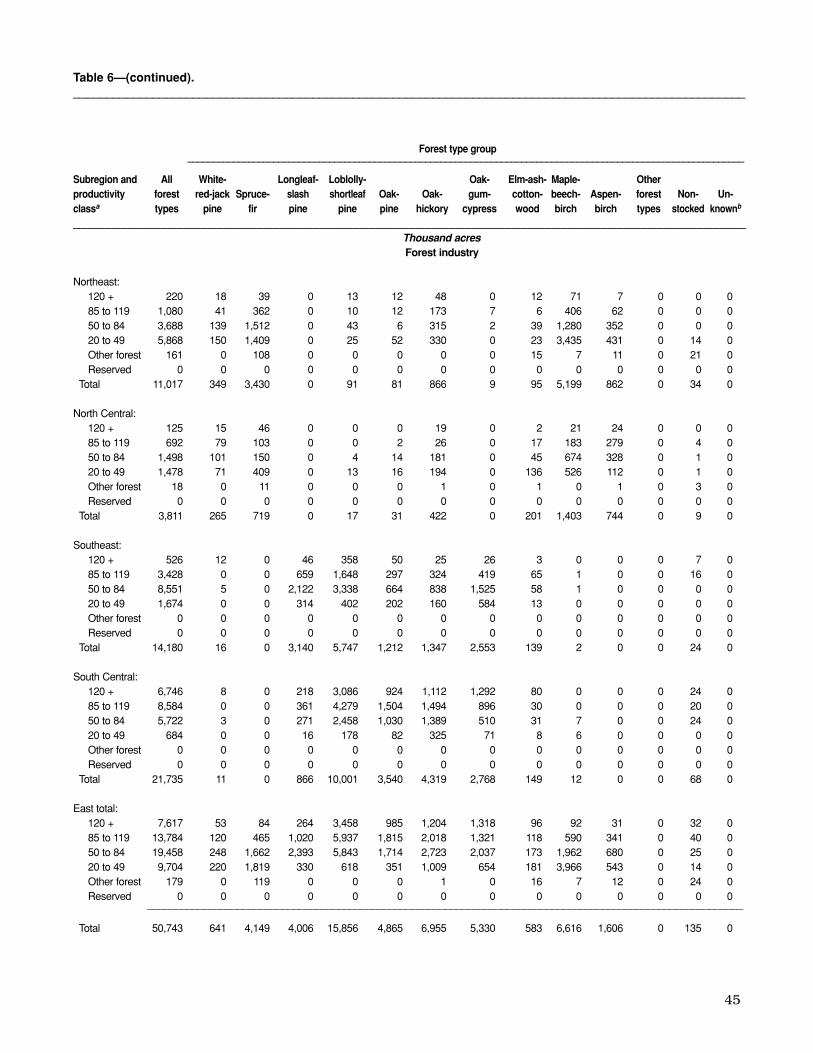
45
Forest type group______________________________________________________________________________________________________________
Subregion and All White- Longleaf- Loblolly- Oak- Elm-ash- Maple- Otherproductivity forest red-jack Spruce- slash shortleaf Oak- Oak- gum- cotton- beech- Aspen- forest Non- Un-classa types pine fir pine pine pine hickory cypress wood birch birch types stocked knownb
_____________________________________________________________________________________________________________________________________Thousand acresForest industry
Northeast:120 + 220 18 39 0 13 12 48 0 12 71 7 0 0 085 to 119 1,080 41 362 0 10 12 173 7 6 406 62 0 0 050 to 84 3,688 139 1,512 0 43 6 315 2 39 1,280 352 0 0 020 to 49 5,868 150 1,409 0 25 52 330 0 23 3,435 431 0 14 0Other forest 161 0 108 0 0 0 0 0 15 7 11 0 21 0Reserved 0 0 0 0 0 0 0 0 0 0 0 0 0 0
Total 11,017 349 3,430 0 91 81 866 9 95 5,199 862 0 34 0
North Central:120 + 125 15 46 0 0 0 19 0 2 21 24 0 0 085 to 119 692 79 103 0 0 2 26 0 17 183 279 0 4 050 to 84 1,498 101 150 0 4 14 181 0 45 674 328 0 1 020 to 49 1,478 71 409 0 13 16 194 0 136 526 112 0 1 0Other forest 18 0 11 0 0 0 1 0 1 0 1 0 3 0Reserved 0 0 0 0 0 0 0 0 0 0 0 0 0 0
Total 3,811 265 719 0 17 31 422 0 201 1,403 744 0 9 0
Southeast:120 + 526 12 0 46 358 50 25 26 3 0 0 0 7 085 to 119 3,428 0 0 659 1,648 297 324 419 65 1 0 0 16 050 to 84 8,551 5 0 2,122 3,338 664 838 1,525 58 1 0 0 0 020 to 49 1,674 0 0 314 402 202 160 584 13 0 0 0 0 0Other forest 0 0 0 0 0 0 0 0 0 0 0 0 0 0Reserved 0 0 0 0 0 0 0 0 0 0 0 0 0 0
Total 14,180 16 0 3,140 5,747 1,212 1,347 2,553 139 2 0 0 24 0
South Central:120 + 6,746 8 0 218 3,086 924 1,112 1,292 80 0 0 0 24 085 to 119 8,584 0 0 361 4,279 1,504 1,494 896 30 0 0 0 20 050 to 84 5,722 3 0 271 2,458 1,030 1,389 510 31 7 0 0 24 020 to 49 684 0 0 16 178 82 325 71 8 6 0 0 0 0Other forest 0 0 0 0 0 0 0 0 0 0 0 0 0 0Reserved 0 0 0 0 0 0 0 0 0 0 0 0 0 0
Total 21,735 11 0 866 10,001 3,540 4,319 2,768 149 12 0 0 68 0
East total:120 + 7,617 53 84 264 3,458 985 1,204 1,318 96 92 31 0 32 085 to 119 13,784 120 465 1,020 5,937 1,815 2,018 1,321 118 590 341 0 40 050 to 84 19,458 248 1,662 2,393 5,843 1,714 2,723 2,037 173 1,962 680 0 25 020 to 49 9,704 220 1,819 330 618 351 1,009 654 181 3,966 543 0 14 0Other forest 179 0 119 0 0 0 1 0 16 7 12 0 24 0Reserved 0 0 0 0 0 0 0 0 0 0 0 0 0 0
__________________________________________________________________________________________________________
Total 50,743 641 4,149 4,006 15,856 4,865 6,955 5,330 583 6,616 1,606 0 135 0
Table 6—(continued)._____________________________________________________________________________________________________

46
Forest type group______________________________________________________________________________________________________________
Subregion and All White- Longleaf- Loblolly- Oak- Elm-ash- Maple- Otherproductivity forest red-jack Spruce- slash shortleaf Oak- Oak- gum- cotton- beech- Aspen- forest Non- Un-classa types pine fir pine pine pine hickory cypress wood birch birch types stocked knownb
_____________________________________________________________________________________________________________________________________Thousand acres
Nonindustrial private
Northeast:120 + 2,925 274 211 0 54 106 915 29 293 988 48 0 7 085 to 119 7,770 946 806 0 124 256 2,953 41 170 1,961 507 0 5 050 to 84 16,882 1,876 1,150 0 188 696 5,824 62 348 5,737 1,000 0 0 020 to 49 29,854 1,901 1,549 0 438 853 9,809 126 1,144 12,843 1,121 0 70 0Other forest 1,106 78 136 0 30 49 256 9 244 209 58 0 37 0Reserved 164 18 7 0 12 7 24 0 11 73 12 0 0 0
Total 58,700 5,093 3,860 0 846 1,967 19,782 267 2,210 21,810 2,744 0 119 0
North Central:120 + 3,493 445 207 0 46 80 847 38 572 994 255 0 9 085 to 119 11,030 458 351 0 27 76 2,721 57 1,420 3,600 2,278 0 44 050 to 84 21,162 435 623 0 42 270 9,329 25 1,775 5,610 3,010 0 44 020 to 49 18,403 317 1,466 0 355 498 8,119 138 2,311 4,153 949 0 97 0Other forest 599 12 87 0 12 76 231 0 50 50 23 0 58 0Reserved 102 22 7 0 0 2 20 0 10 25 15 0 0 0
Total 54,789 1,689 2,741 0 481 1,003 21,267 258 6,137 14,433 6,530 0 251 0
Southeast:120 + 2,781 252 0 116 1,089 454 601 258 11 0 0 0 0 085 to 119 15,069 47 0 1,119 4,358 2,057 5,208 1,912 274 83 0 0 12 050 to 84 35,307 100 0 3,451 8,470 4,853 12,843 5,110 308 155 0 0 17 020 to 49 7,827 10 5 818 1,286 1,293 3,027 1,312 61 15 0 0 0 0Other forest 588 0 0 105 18 34 19 410 0 0 0 0 0 0Reserved 45 0 0 0 0 0 1 44 0 0 0 0 0 0
Total 61,618 409 5 5,610 15,221 8,691 21,700 9,047 654 253 0 0 29 0
South Central:120 + 20,374 31 0 274 5,569 3,316 6,319 4,284 479 65 0 0 39 085 to 119 26,071 18 0 544 6,108 4,281 10,524 4,022 397 97 0 0 80 050 to 84 25,354 17 0 641 3,083 3,663 14,221 3,128 314 166 0 0 121 020 to 49 12,747 10 0 133 746 1,358 9,126 715 321 311 0 0 27 0Other forest 6,765 0 0 45 67 472 4,334 143 17 0 0 1,672 12 0Reserved 0 0 0 0 0 0 0 0 0 0 0 0 0 0
Total 91,311 75 0 1,639 15,572 13,090 44,523 12,292 1,528 639 0 1,672 280 0
East total:120 + 29,574 1,002 419 390 6,758 3,955 8,682 4,610 1,354 2,047 303 0 55 085 to 119 59,940 1,468 1,157 1,663 10,617 6,671 21,406 6,031 2,261 5,740 2,785 0 141 050 to 84 98,705 2,427 1,773 4,093 11,783 9,482 42,217 8,325 2,745 11,668 4,010 0 182 020 to 49 68,831 2,238 3,020 952 2,824 4,001 30,081 2,292 3,836 17,322 2,069 0 195 0Other forest 9,058 90 223 151 127 632 4,841 562 311 259 81 1,672 108 0Reserved 311 40 14 0 12 9 45 44 21 98 27 0 0 0
__________________________________________________________________________________________________________
Total 266,419 7,266 6,606 7,248 32,121 24,750 107,272 21,864 10,529 37,134 9,275 1,672 680 0_______________________________________________________________________________________________________________________a Productivity classes are displayed as cubic feet per acre per year.b Poorly stocked reserved and other forest lands have insufficient data to determine a forest type.
Note: Data may not add to totals because of rounding.
Table 6—(continued)._____________________________________________________________________________________________________

47
Predominant county population continuum class____________________________________________________
Major Intermediate- Large SmallForest type group Total metro small metro town town Rural___________________________________________________________________________________________
Thousand acresEast:
White-red-jack pine 11,754 1,712 2,443 531 4,894 2,175Spruce-fir 17,183 221 2,202 2,364 9,715 2,682Longleaf-slash pine 13,866 2,915 1,519 386 6,259 2,785Loblolly-shortleaf pine 54,047 9,055 5,835 1,879 26,082 11,196Oak-pine 33,916 6,534 3,801 1,102 15,274 7,204Oak-hickory 133,151 26,320 15,941 3,213 56,882 30,795Oak-gum-cypress 31,375 6,339 4,377 974 14,435 5,250Elm-ash-cottonwood 13,578 3,381 2,002 567 5,692 1,935Maple-beech-birch 54,843 8,721 8,026 4,187 25,247 8,662Aspen-birch 17,826 580 2,792 1,011 8,853 4,589Other forest types 1,676 647 74 9 511 434Nonstocked 1,072 176 196 37 466 197
___________________________________________________________________________
East total: 384,288 66,603 49,209 16,261 174,309 77,905
West:Douglas-fir 39,599 4,542 6,520 4,168 15,308 9,062 Ponderosa pine 31,469 2,416 3,304 5,109 13,309 7,331 Western white pine 365 51 43 4 245 23Fir-spruce 72,841 1,627 2,199 3,005 14,393 51,616 Hemlock-Sitka spruce 19,377 1,570 1,909 1,439 6,185 8,275 Larch 1,349 4 42 314 665 325Lodgepole pine 18,759 585 756 2,864 9,897 4,657 Redwood 921 221 287 349 63 0Other softwoods 72,633 1,576 1,437 861 6,486 62,272 Western hardwoods 49,756 12,324 6,119 4,045 13,632 13,636 Pinyon-juniper 51,739 5,118 4,362 9,718 23,201 9,340 Nonstocked 5,825 1,082 915 956 2,098 773
___________________________________________________________________________
West total: 364,635 31,117 27,894 32,831 105,482 167,310___________________________________________________________________________
United States: 748,922 97,720 77,103 49,092 279,791 245,216___________________________________________________________________________________________Note: Data may not add to totals because of rounding.
Table 7—Forest land area in the Eastern and Western United States by rural-urban continuum class andforest type group, 2002
___________________________________________________________________________________________

48
North:White-red-jack pine 10,941 2,663 8,278 1,173 543 630 2,373 675 1,698 Spruce-fir 17,140 460 16,679 1,682 67 1,614 4,708 108 4,600 Longleaf-slash pine 0 0 0 0 0 0 0 0 0Loblolly-shortleaf pine 2,179 273 1,906 217 61 156 526 27 499Oak-pine 3,776 228 3,547 234 38 196 460 33 426Oak-hickory 51,931 283 51,648 2,435 18 2,418 7,159 45 7,114 Oak-gum-cypress 686 7 679 3 3 0 148 2 146Elm-ash-cottonwood 10,851 85 10,766 293 0 293 1,915 15 1,901 Maple-beech-birch 53,725 252 53,473 3,189 19 3,170 7,691 43 7,648 Aspen-birch 17,826 60 17,766 2,137 2 2,134 4,808 3 4,805 Other forest types 0 0 0 0 0 0 0 0 0Nonstocked 630 13 617 32 0 32 185 1 183
____________________________________________________________________North total: 169,685 4,326 165,359 11,395 752 10,643 29,973 953 29,021
South:White-red-jack pine 813 98 715 177 2 175 125 2 123Spruce-fir 44 0 44 22 0 22 17 0 17Longleaf-slash pine 13,866 7,683 6,183 1,003 266 736 1,608 367 1,241 Loblolly-shortleaf pine 51,868 23,928 27,940 3,129 731 2,398 2,197 378 1,819 Oak-pine 30,140 4,242 25,898 2,041 179 1,862 1,567 74 1,493 Oak-hickory 81,220 1,369 79,851 5,245 95 5,150 4,085 35 4,049 Oak-gum-cypress 30,690 170 30,519 568 0 568 3,462 14 3,448 Elm-ash-cottonwood 2,727 63 2,664 3 0 3 254 0 254Maple-beech-birch 1,118 8 1,110 170 0 170 42 0 42Aspen-birch 0 0 0 0 0 0 0 0 0Other forest types 1,675 0 1,675 0 0 0 2 0 2Nonstocked 442 40 402 0 0 0 41 8 33
____________________________________________________________________South total: 214,603 37,602 177,001 12,358 1,274 11,084 13,400 878 12,522
Westc:Douglas-fir 39,599 7,402c 32,197 20,234 c c 6,437 c c
Ponderosa pine 31,469 2,328c 29,141 14,276 c c 3,035 c c
Western white pine 365 45c 320 313 c c 9 c c
Fir-spruce 72,841 1,216c 71,625 23,579 c c 22,220 c c
Hemlock-Sitka spruce 19,377 194c 19,183 12,353 c c 3,051 c c
Larch 1,349 859c 490 799 c c 169 c c
Lodgepole pine 18,759 988c 17,771 13,881 c c 2,996 c c
Redwood 921 0c 921 11 c c 253 c c
Other softwoods 72,633 195c 72,438 9,801 c c 52,316 c c
Western hardwoods 49,756 397c 49,359 12,546 c c 13,402 c c
Pinyon-juniper 51,739 0c 51,739 13,619 c c 22,647 c c
Nonstocked 5,825 0c 5,825 3,290 c c 800 c c____________________________________________________________________
West total: 364,635 13,624c 351,011 124,701 c c 127,334 c c____________________________________________________________________
United States: 748,922 55,551c 693,371 148,454 c c 170,707 c c
Table 8—Area of planted and natural forest land in the Eastern and Western United States by forest typegroup and major ownership group, 2002
___________________________________________________________________________________________
All owners National forest Other public_______________________ _____________________ ___________________
Forest type groupa Total Planted Natural Total Planted Natural Total Planted Natural___________________________________________________________________________________________
Thousand acres

49
North:White-red-jack pine 613 210 403 6,782 1,235 5,547 Spruce-fir 4,149 85 4,064 6,601 200 6,401 Longleaf-slash pine 0 0 0 0 0 0Loblolly-shortleaf pine 108 37 71 1,327 148 1,179 Oak-pine 113 10 102 2,970 146 2,823 Oak-hickory 1,288 25 1,263 41,049 196 40,853 Oak-gum-cypress 9 0 9 525 2 524Elm-ash-cottonwood 296 0 296 8,347 70 8,277 Maple-beech-birch 6,602 32 6,570 36,243 158 36,085 Aspen-birch 1,606 8 1,598 9,275 46 9,229 Other forest types 0 0 0 0 0 0Nonstocked 43 3 40 371 9 362
_______________________________________________North total: 14,827 410 14,417 113,489 2,211 111,278
South:White-red-jack pine 27 12 16 483 82 401Spruce-fir 0 0 0 5 0 5Longleaf-slash pine 4,006 3,362 645 7,248 3,688 3,560 Loblolly-shortleaf pine 15,748 11,380 4,368 30,794 11,438 19,356 Oak-pine 4,752 1,770 2,982 21,781 2,219 19,561 Oak-hickory 5,667 536 5,131 66,224 703 65,520 Oak-gum-cypress 5,321 60 5,262 21,339 97 21,242 Elm-ash-cottonwood 288 24 264 2,182 39 2,143 Maple-beech-birch 14 0 14 892 8 884Aspen-birch 0 0 0 0 0 0Other forest types 0 0 0 1,674 0 1,674 Nonstocked 92 12 80 309 20 289
_______________________________________________South total: 35,916 17,155 18,761 152,929 18,295 134,634
Westc:Douglas-fir 5,962 c c 6,967 c c
Ponderosa pine 2,559 c c 11,598 c c
Western white pine 15 c c 29 c c
Fir-spruce 1,534 c c 25,509 c c
Hemlock-Sitka spruce 1,832 c c 2,141 c c
Larch 166 c c 216 c c
Lodgepole pine 560 c c 1,322 c c
Redwood 394 c c 263 c c
Other softwoods 29 c c 10,487 c c
Western hardwoods 2,069 c c 21,739 c c
Pinyon-juniper 179 c c 15,294 c c
Chaparral 0 c c 0 c c
Nonstocked 337 c c 1,398 c c_______________________________________________
West total: 15,637 c c 96,962 c c_______________________________________________
United States: 66,380 c c 363,381 c c
Table 8—(continued).____________________________________________________________________________________________________
Forest industry Nonindustrial privateb_______________________ _____________________
Forest type groupa Total Planted Natural Total Planted Natural_____________________________________________________________________
Thousand acres
____________________________________________________________________________________________________a Forest type reflects the current dominant species by plurality of stocking and may not reflect the actual species planted at the time of stand origin.b Per the Alaska Natives Claims Settlement Act of 1971, approximately 35 million forested acres expected upon update of all ownership data
for Alaska.c Approximately 13.6 million acres of forest in the West are planted, primarily to augment natural regeneration after a harvest and ensure adequate
stocking of desired species. The species planted are usually native, making these stands difficult to detect during field sampling. Additionally, thereare thousands of acres of more traditional “plantations” such as those found in the East that are not currently identified during field sampling.
Note: Data may not add to totals because of rounding.
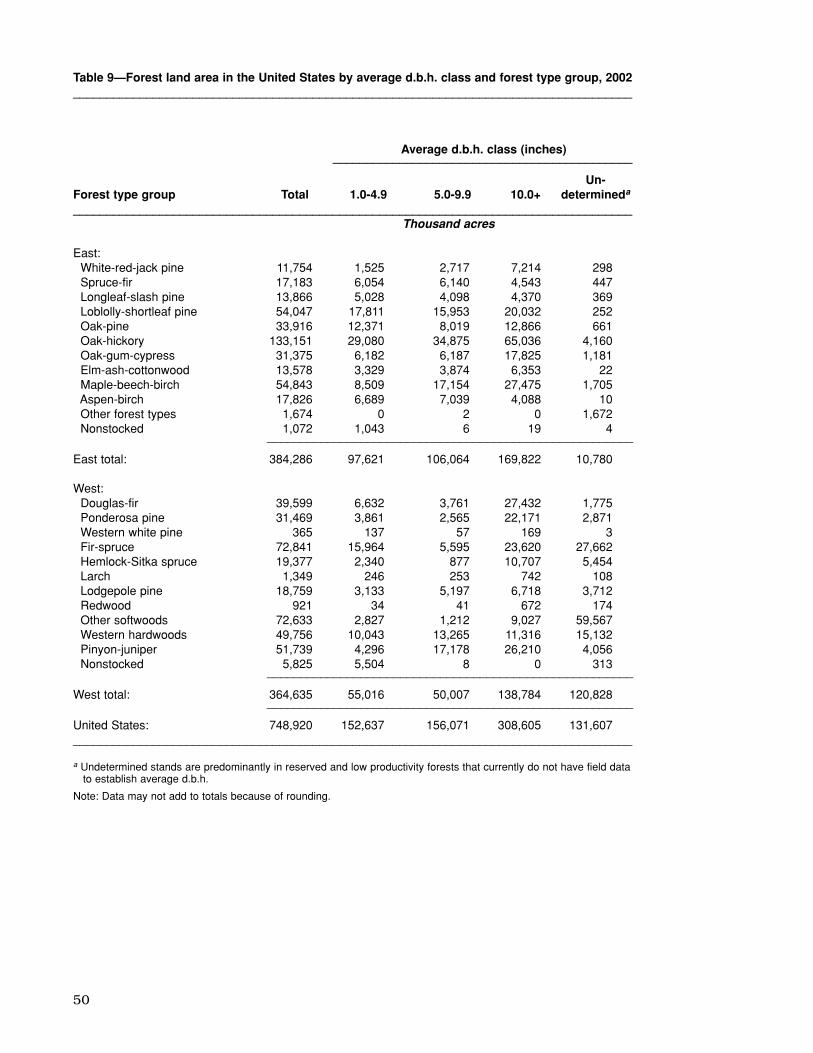
50
Average d.b.h. class (inches)_____________________________________________
Un-Forest type group Total 1.0-4.9 5.0-9.9 10.0+ determineda
____________________________________________________________________________________Thousand acres
East:White-red-jack pine 11,754 1,525 2,717 7,214 298Spruce-fir 17,183 6,054 6,140 4,543 447Longleaf-slash pine 13,866 5,028 4,098 4,370 369Loblolly-shortleaf pine 54,047 17,811 15,953 20,032 252Oak-pine 33,916 12,371 8,019 12,866 661Oak-hickory 133,151 29,080 34,875 65,036 4,160 Oak-gum-cypress 31,375 6,182 6,187 17,825 1,181 Elm-ash-cottonwood 13,578 3,329 3,874 6,353 22Maple-beech-birch 54,843 8,509 17,154 27,475 1,705 Aspen-birch 17,826 6,689 7,039 4,088 10Other forest types 1,674 0 2 0 1,672 Nonstocked 1,072 1,043 6 19 4
_______________________________________________________
East total: 384,286 97,621 106,064 169,822 10,780
West:Douglas-fir 39,599 6,632 3,761 27,432 1,775 Ponderosa pine 31,469 3,861 2,565 22,171 2,871 Western white pine 365 137 57 169 3Fir-spruce 72,841 15,964 5,595 23,620 27,662 Hemlock-Sitka spruce 19,377 2,340 877 10,707 5,454 Larch 1,349 246 253 742 108Lodgepole pine 18,759 3,133 5,197 6,718 3,712 Redwood 921 34 41 672 174Other softwoods 72,633 2,827 1,212 9,027 59,567 Western hardwoods 49,756 10,043 13,265 11,316 15,132 Pinyon-juniper 51,739 4,296 17,178 26,210 4,056 Nonstocked 5,825 5,504 8 0 313
_______________________________________________________
West total: 364,635 55,016 50,007 138,784 120,828_______________________________________________________
United States: 748,920 152,637 156,071 308,605 131,607 ____________________________________________________________________________________
a Undetermined stands are predominantly in reserved and low productivity forests that currently do not have field data to establish average d.b.h.
Note: Data may not add to totals because of rounding.
Table 9—Forest land area in the United States by average d.b.h. class and forest type group, 2002____________________________________________________________________________________

51
North:
Northeast:
Connecticut 2002 1,696 280 7 0 0 7 166 107 1,416 0 1,416 1997 1,815 249 10 0 0 10 163 77 1,565 0 1,565 1987 1,776 246 16 0 0 16 156 74 1,530 0 1,530 1977 1,806 147 2 0 0 2 120 24 1,659 0 1,659 1953 1,973 155 1 0 0 1 122 32 1,818 3 1,815
Delaware 2002 376 25 0 0 0 0 25 0 351 26 3251997 376 13 0 0 0 0 13 0 363 31 3321987 388 14 0 0 0 0 14 0 374 30 3441977 384 14 1 0 0 1 13 0 370 30 3411953 392 13 1 0 0 1 10 2 379 21 358
Maine 2002 16,952 631 53 34 0 20 469 109 16,321 7,298 9,022 1997 16,952 629 51 32 0 20 469 109 16,323 7,298 9,024 1987 17,174 495 76 46 0 30 331 88 16,679 8,286 8,393 1977 16,864 541 73 38 0 36 354 114 16,323 8,083 8,240 1953 16,609 182 90 39 0 51 41 51 16,427 6,617 9,810
Maryland 2002 2,372 422 26 0 0 26 310 86 1,950 88 1,862 1997 2,423 281 22 0 0 22 236 23 2,143 137 2,006 1987 2,462 280 22 0 0 22 236 22 2,182 133 2,049 1977 2,523 243 25 0 0 25 185 33 2,280 139 2,141 1953 2,855 214 54 0 0 54 128 32 2,641 57 2,584
Massachusetts 2002 2,631 554 35 0 0 35 344 175 2,077 14 2,063 1997 2,965 480 48 0 0 48 275 157 2,486 71 2,415 1987 3,010 474 40 0 0 40 292 142 2,536 81 2,455 1977 2,798 365 10 0 0 10 240 116 2,432 30 2,402 1953 3,259 399 29 0 0 29 280 90 2,860 259 2,601
New Hampshire 2002 4,503 881 542 520 0 22 215 123 3,622 458 3,164 1997 4,551 793 440 417 0 22 228 125 3,758 513 3,246 1987 4,803 788 536 506 0 30 133 119 4,015 662 3,353 1977 4,692 580 472 459 0 13 79 29 4,112 947 3,165 1953 4,819 682 585 580 0 5 45 52 4,137 771 3,366
New Jersey 2002 1,876 588 54 0 0 54 475 59 1,288 0 1,288 1997 1,864 500 49 0 0 49 351 100 1,364 0 1,364 1987 1,914 533 246 0 0 246 224 63 1,381 0 1,381 1977 1,857 319 28 0 0 28 246 45 1,538 16 1,522 1953 2,050 181 1 0 0 1 130 50 1,869 4 1,865
New York 2002 15,389 1,148 82 5 0 77 851 214 14,241 1,219 13,022 1997 15,406 1,154 86 9 0 77 852 215 14,252 1,220 13,032 1987 15,798 1,215 123 6 0 117 899 193 14,583 1,116 13,467 1977 15,405 979 95 6 0 89 721 163 14,426 1,034 13,392 1953 11,952 895 98 0 0 98 714 83 11,057 1,172 9,885
Pennsylvania 2002 15,853 3,519 498 446 0 51 2,788 233 12,334 613 11,721 1997 15,853 3,519 498 446 0 51 2,788 233 12,334 613 11,721 1987 15,918 3,487 543 478 0 65 2,731 213 12,431 879 11,552 1977 15,924 3,471 503 485 0 18 2,796 173 12,453 964 11,489 1953 14,574 3,229 492 454 0 38 2,580 157 11,345 442 10,903
Table 10—Timberland area in the United States by ownership, region, subregion, and State, 2002, 1997, 1987, 1977, and 1953____________________________________________________________________________________________________
Public Privatea
______________________________________________________ ________________________Federal
_______________________________
Bureau CountyRegion, All of Land and Non-subregion, owner- Total Total National Manage- muni- Total Forest industrialand State Year ships public Federal forest ment Other State cipal private industry private_________________________________________________________________________________________________________________
Thousand acres

52
Table 10—(continued)._________________________________________________________________________________________________________________
Rhode Island 2002 340 81 3 0 0 3 67 10 259 0 2591997 356 69 5 0 0 5 64 0 287 0 2871987 368 78 3 0 0 3 68 7 290 0 2901977 395 32 0 0 0 0 20 12 363 0 3631953 430 26 0 0 0 0 13 13 404 0 404
Vermont 2002 4,482 633 286 255 0 32 275 72 3,850 253 3,597 1997 4,461 593 251 221 0 31 271 70 3,868 227 3,642 1987 4,424 660 251 251 0 0 330 79 3,764 352 3,412 1977 4,430 422 213 209 0 4 168 41 4,008 666 3,342 1953 3,846 297 199 191 0 8 79 19 3,549 528 3,021
West Virginia 2002 11,900 1,324 1,033 904 0 128 253 38 10,576 887 9,689 1997 11,900 1,324 1,033 904 0 128 253 38 10,576 887 9,689 1987 11,799 1,320 1,070 916 0 154 250 0 10,479 1,036 9,443 1977 11,484 1,121 892 853 0 39 229 0 10,363 880 9,483 1953 10,276 982 895 881 0 14 83 4 9,294 270 9,024
Northeast total: 2002 78,371 10,085 2,621 2,164 0 456 6,239 1,225 68,286 10,855 57,430 1997 78,923 9,603 2,491 2,029 0 462 5,966 1,146 69,320 10,996 58,324 1987 79,834 9,590 2,926 2,203 0 723 5,665 1,000 70,244 12,575 57,669 1977 78,561 8,233 2,312 2,049 0 263 5,171 750 70,328 12,789 57,539 1953 73,035 7,255 2,445 2,145 0 300 4,225 585 65,780 10,144 55,636
North Central: Illinois 2002 4,087 440 312 249 0 64 82 46 3,647 11 3,635
1997 4,058 417 321 254 0 66 55 42 3,641 13 3,628 1987 4,030 389 292 226 0 66 55 42 3,641 13 3,628 1977 4,033 330 273 211 0 62 22 35 3,703 15 3,688 1953 3,830 226 216 184 0 32 10 0 3,604 10 3,594
Indiana 2002 4,342 623 373 170 0 203 238 12 3,719 17 3,701 1997 4,342 624 373 170 0 203 238 13 3,719 17 3,701 1987 4,296 535 329 166 0 163 177 29 3,761 18 3,743 1977 3,815 410 239 162 0 77 170 1 3,405 27 3,378 1953 4,015 283 172 112 0 60 109 2 3,732 9 3,723
Iowa 2002 1,944 156 44 0 0 44 74 38 1,788 0 1,788 1997 1,944 156 44 0 0 44 74 38 1,788 0 1,788 1987 1,460 102 43 0 0 43 52 7 1,358 0 1,358 1977 1,460 111 55 0 0 55 51 5 1,350 17 1,333 1953 2,595 36 12 3 0 9 22 2 2,559 0 2,559
Michigan 2002 18,616 6,577 2,592 2,542 0 50 3,728 256 12,039 1,514 10,525 1997 18,667 6,628 2,643 2,593 0 50 3,728 256 12,039 1,514 10,525 1987 17,364 6,288 2,520 2,475 0 45 3,581 187 11,076 1,966 9,110 1977 18,199 6,360 2,489 2,435 8 45 3,763 109 11,839 2,137 9,702 1953 19,121 6,288 2,509 2,410 9 90 3,695 85 12,832 1,548 11,284
Minnesota 2002 14,723 7,584 2,019 1,821 26 172 3,062 2,503 7,139 751 6,388 1997 14,819 7,680 2,115 1,917 26 172 3,063 2,503 7,139 751 6,388 1987 13,572 6,814 1,826 1,670 44 112 2,654 2,334 6,758 788 5,970 1977 13,695 6,862 1,870 1,715 10 145 2,651 2,342 6,834 772 6,062 1953 16,580 8,407 2,338 2,195 49 94 2,450 3,619 8,173 578 7,595
Public Privatea
______________________________________________________ ________________________Federal
_______________________________
Bureau CountyRegion, All of Land and Non-subregion, owner- Total Total National Manage- muni- Total Forest industrialand State Year ships public Federal forest ment Other State cipal private industry private_________________________________________________________________________________________________________________
Thousand acres

53
Missouri 2002 13,365 2,006 1,561 1,315 0 246 403 42 11,359 222 11,137 1997 13,411 2,052 1,608 1,361 0 246 403 42 11,359 222 11,137 1987 11,995 1,657 1,390 1,303 0 87 242 25 10,338 231 10,107 1977 12,289 1,532 1,313 1,246 0 67 187 32 10,757 362 10,394 1953 14,300 1,617 1,461 1,339 1 121 156 0 12,683 460 12,223
Ohio 2002 7,568 531 220 216 0 4 227 84 7,036 174 6,862 1997 7,568 531 220 216 0 4 227 84 7,036 174 6,862 1987 7,141 423 171 171 0 0 173 79 6,718 186 6,532 1977 6,916 411 168 159 0 9 202 42 6,505 186 6,319 1953 5,450 297 88 88 0 0 168 41 5,153 30 5,123
Wisconsin 2002 15,701 4,546 1,520 1,363 0 157 744 2,282 11,155 1,102 10,053 1997 15,701 4,546 1,520 1,363 0 157 744 2,282 11,155 1,102 10,053 1987 14,726 4,167 1,419 1,242 0 177 569 2,179 10,559 1,159 9,400 1977 14,478 4,318 1,383 1,266 0 117 568 2,366 10,161 1,148 9,012 1953 15,349 4,720 1,624 1,357 5 262 444 2,652 10,629 942 9,687
North Central total: 2002 80,344 22,462 8,641 7,676 26 940 8,557 5,264 57,881 3,793 54,088 1997 80,510 22,633 8,843 7,874 26 942 8,530 5,260 57,877 3,795 54,082 1987 74,584 20,375 7,990 7,253 44 693 7,503 4,882 54,209 4,361 49,848 1977 74,885 20,333 7,790 7,194 18 578 7,613 4,931 54,552 4,664 49,887 1953 81,240 21,875 8,420 7,688 64 668 7,054 6,401 59,365 3,577 55,788
North total: 2002 158,715 32,547 11,262 9,840 26 1,396 14,796 6,489 126,167 14,649 111,519 1997 159,433 32,237 11,334 9,904 26 1,404 14,497 6,406 127,197 14,791 112,406 1987 154,418 29,965 10,916 9,456 44 1,416 13,168 5,882 124,453 16,936 107,517 1977 153,446 28,566 10,102 9,243 18 841 12,784 5,681 124,880 17,453 107,426 1953 154,275 29,130 10,865 9,833 64 968 11,279 6,986 125,145 13,721 111,424
South:
Southeast:
Florida 2002 14,636 2,817 1,601 1,015 0 586 1,138 78 11,819 4,016 7,803 1997 14,605 2,786 1,570 984 0 586 1,138 78 11,819 4,016 7,803 1987 14,983 2,434 1,561 990 0 571 814 59 12,549 4,770 7,779 1977 15,843 2,151 1,579 1,005 0 574 532 40 13,692 4,658 9,034 1953 18,135 2,215 1,777 1,035 14 728 382 56 15,920 4,369 11,551
Georgia 2002 23,802 1,757 1,386 703 0 683 260 111 22,045 4,381 17,664 1997 23,796 1,751 1,380 711 0 669 260 111 22,045 4,381 17,664 1987 23,660 1,609 1,421 790 0 631 118 70 22,051 4,983 17,068 1977 24,106 1,589 1,453 813 0 640 100 36 22,517 4,629 17,888 1953 23,969 1,685 1,560 644 0 916 102 23 22,284 4,246 18,038
North Carolina 2002 18,664 1,904 1,473 1,036 0 437 346 84 16,760 2,252 14,508 1997 18,639 1,878 1,448 1,011 0 437 346 84 16,760 2,252 14,508 1987 18,749 1,861 1,440 1,025 0 415 339 82 16,888 2,337 14,551 1977 19,435 1,717 1,319 1,029 0 290 320 78 17,718 2,140 15,578 1953 19,582 1,540 1,251 1,020 0 232 253 36 18,043 2,584 15,459
South Carolina 2002 12,301 1,224 880 564 0 316 280 64 11,076 1,994 9,082 1997 12,419 1,078 867 524 0 343 177 33 11,341 2,322 9,019 1987 12,179 1,173 913 577 0 336 233 27 11,006 2,626 8,380 1977 12,496 1,085 895 573 0 322 167 23 11,411 2,215 9,196 1953 11,884 955 802 563 0 239 128 25 10,929 1,650 9,279
Table 10—(continued)._________________________________________________________________________________________________________________
Public Privatea
______________________________________________________ ________________________Federal
_______________________________
Bureau CountyRegion, All of Land and Non-subregion, owner- Total Total National Manage- muni- Total Forest industrialand State Year ships public Federal forest ment Other State cipal private industry private_________________________________________________________________________________________________________________
Thousand acres

54
Virginia 2002 15,371 1,906 1,612 1,392 0 221 211 83 13,465 1,537 11,927 1997 15,345 1,880 1,586 1,365 0 221 211 83 13,465 1,537 11,927 1987 15,570 1,993 1,707 1,486 0 221 209 77 13,577 1,834 11,743 1977 15,939 1,921 1,669 1,424 0 245 183 69 14,018 1,670 12,348 1953 15,497 1,493 1,355 1,198 0 157 86 52 14,004 1,095 12,909
Southeast total: 2002 84,774 9,609 6,953 4,710 0 2,244 2,236 419 75,165 14,180 60,985 1997 84,803 9,373 6,851 4,594 0 2,257 2,133 389 75,430 14,508 60,922 1987 85,141 9,070 7,042 4,868 0 2,174 1,713 315 76,071 16,550 59,521 1977 87,818 8,462 6,914 4,843 0 2,071 1,303 246 79,356 15,312 64,044 1953 89,067 7,887 6,745 4,459 14 2,272 951 192 81,180 13,944 67,236
South Central: Alabama 2002 22,922 1,226 863 601 0 263 241 122 21,696 3,740 17,956
1997 21,911 1,130 823 573 0 250 212 95 20,781 4,796 15,985 1987 21,659 1,161 951 689 5 257 147 63 20,498 4,464 16,034 1977 21,498 1,091 860 659 0 201 172 59 20,407 4,330 16,077 1953 20,756 968 791 616 10 165 150 27 19,788 3,138 16,650
Arkansas 2002 18,373 3,277 2,816 2,353 0 463 394 67 15,096 4,497 10,599 1997 18,392 3,275 2,813 2,350 0 463 394 67 15,118 4,498 10,620 1987 16,673 3,011 2,659 2,329 0 330 311 41 13,662 4,240 9,422 1977 16,793 2,918 2,658 2,350 1 307 240 20 13,875 4,156 9,719 1953 19,627 2,916 2,799 2,292 122 385 115 2 16,711 4,157 12,554
Kentucky 2002 12,347 1,004 863 628 0 235 141 0 11,344 205 11,139 1997 12,347 1,004 863 628 0 235 141 0 11,344 205 11,139 1987 11,909 890 856 583 0 273 34 0 11,019 205 10,814 1977 11,902 895 819 589 0 230 76 1 11,007 255 10,752 1953 11,497 725 672 455 0 217 53 0 10,772 308 10,464
Louisiana 2002 13,722 1,245 737 507 0 230 300 207 12,477 3,898 8,578 1997 13,693 1,214 707 477 0 230 300 207 12,479 3,899 8,579 1987 13,872 1,331 833 621 0 212 330 168 12,541 3,603 8,938 1977 14,292 1,024 715 581 1 133 299 10 13,268 3,773 9,495 1953 16,039 848 666 535 4 127 177 5 15,191 3,166 12,025
Mississippi 2002 18,572 1,935 1,525 1,091 0 435 310 100 16,636 3,238 13,399 1997 18,587 1,936 1,526 1,091 0 435 311 100 16,651 3,241 13,411 1987 16,674 1,720 1,488 1,240 0 248 100 132 14,954 2,864 12,090 1977 16,504 1,663 1,202 1,121 1 80 95 366 14,841 2,995 11,846 1953 16,853 1,709 1,235 1,036 4 195 54 420 15,144 2,461 12,683
Oklahoma 2002 6,234 582 443 223 0 220 118 21 5,651 1,047 4,604 1997 6,234 574 435 214 0 221 118 21 5,659 1,049 4,610 1987 6,087 586 464 243 0 221 115 7 5,501 1,046 4,455 1977 5,536 448 342 219 0 123 91 15 5,088 1,009 4,079 1953 5,075 494 309 213 7 89 185 0 4,581 889 3,692
Tennessee 2002 13,956 1,565 978 557 0 422 519 69 12,390 1,391 11,000 1997 13,265 1,509 1,027 556 0 471 422 59 11,757 1,122 10,635 1987 12,840 1,360 958 581 6 371 373 29 11,480 1,220 10,260 1977 12,862 1,161 856 558 0 298 283 22 11,701 1,212 10,489 1953 12,551 1,114 806 564 0 242 298 10 11,437 713 10,724
Table 10—(continued)._________________________________________________________________________________________________________________
Public Privatea
______________________________________________________ ________________________Federal
_______________________________
Bureau CountyRegion, All of Land and Non-subregion, owner- Total Total National Manage- muni- Total Forest industrialand State Year ships public Federal forest ment Other State cipal private industry private_________________________________________________________________________________________________________________
Thousand acres

55
Texas 2002 11,774 783 669 577 0 92 68 47 10,990 3,720 7,271 1997 11,766 776 661 569 0 92 68 47 10,990 3,720 7,271 1987 12,414 795 708 610 0 98 75 12 11,619 3,796 7,823 1977 12,426 773 717 576 0 141 49 7 11,653 3,818 7,835 1953 13,081 782 745 654 0 91 35 2 12,299 3,019 9,280
South Central total: 2002 117,899 11,618 8,895 6,536 0 2,359 2,090 633 106,281 21,735 84,546 1997 116,196 11,417 8,855 6,457 0 2,397 1,966 597 104,778 22,529 82,249 1987 112,128 10,854 8,917 6,896 11 2,010 1,485 452 101,274 21,438 79,836 1977 111,812 9,973 8,169 6,653 3 1,513 1,305 500 101,839 21,548 80,291 1953 115,479 9,556 8,023 6,365 147 1,511 1,067 466 105,923 17,851 88,072
South total: 2002 202,673 21,226 15,848 11,245 0 4,603 4,326 1,052 181,447 35,916 145,531 1997 200,999 20,791 15,706 11,052 0 4,654 4,099 986 180,208 37,037 143,171 1987 197,269 19,924 15,959 11,764 11 4,184 3,198 767 177,345 37,988 139,357 1977 199,630 18,435 15,083 11,496 3 3,584 2,608 746 181,195 36,860 144,335 1953 204,546 17,443 14,768 10,824 161 3,783 2,018 658 187,103 31,795 155,308
Rocky Mountain:
Great Plains: Kansas 2002 1,491 92 53 0 0 53 32 8 1,399 0 1,399
1997 1,491 92 53 0 0 53 32 8 1,399 0 1,399 1987 1,207 46 37 0 0 37 7 2 1,161 0 1,161 1977 1,187 37 27 0 0 27 8 2 1,151 0 1,151 1953 1,208 27 27 0 0 27 0 0 1,181 0 1,181
Nebraska 2002 898 108 48 47 0 2 50 10 790 0 7901997 898 108 48 47 0 2 50 10 790 0 7901987 537 55 29 29 0 0 22 4 482 0 4821977 593 54 43 29 0 14 10 1 539 0 5391953 734 56 45 28 0 17 11 1 678 0 678
North Dakota 2002 441 54 28 14 0 14 26 0 387 0 3871997 442 55 28 14 0 14 26 0 387 0 3871987 338 36 12 0 0 12 22 2 302 0 3021977 405 63 53 0 0 53 10 0 342 0 3421953 451 68 57 0 1 57 11 0 383 0 383
South Dakota 2002 1,511 1,023 967 960 0 8 54 1 488 0 4881997 1,487 1,001 946 938 0 8 54 1 485 0 4851987 1,447 1,005 915 914 0 1 87 3 442 21 4211977 1,467 1,038 965 953 6 6 70 3 429 16 4131953 1,621 1,037 970 951 7 11 67 0 585 17 568
Great Plains total: 2002 4,341 1,277 1,097 1,020 0 76 162 18 3,064 0 3,064 1997 4,317 1,256 1,076 999 0 76 162 18 3,062 0 3,062 1987 3,529 1,142 993 943 0 50 138 11 2,387 21 2,366 1977 3,652 1,190 1,087 982 6 99 98 5 2,462 16 2,446 1953 4,014 1,188 1,099 979 8 112 88 1 2,827 17 2,809
Intermountain:Arizona 2002 3,527 2,450 2,438 2,405 0 33 12 0 1,077 0 1,077
1997 4,073 2,775 2,763 2,720 20 23 12 0 1,297 0 1,297 1987 3,789 2,527 2,515 2,471 20 24 12 0 1,262 0 1,262 1977 3,896 2,513 2,480 2,462 18 0 32 2 1,382 0 1,382 1953 3,621 2,304 2,271 2,269 2 0 32 2 1,317 0 1,317
Table 10—(continued)._________________________________________________________________________________________________________________
Public Privatea
______________________________________________________ ________________________Federal
_______________________________
Bureau CountyRegion, All of Land and Non-subregion, owner- Total Total National Manage- muni- Total Forest industrialand State Year ships public Federal forest ment Other State cipal private industry private_________________________________________________________________________________________________________________
Thousand acres
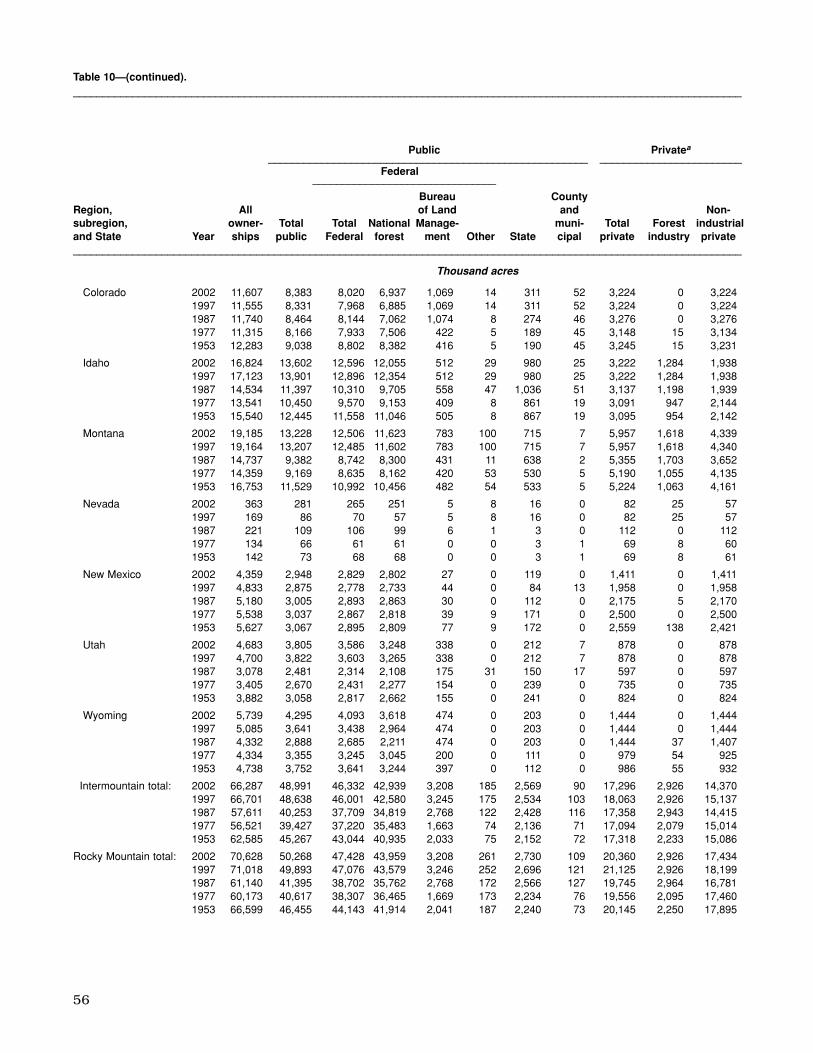
56
Colorado 2002 11,607 8,383 8,020 6,937 1,069 14 311 52 3,224 0 3,224 1997 11,555 8,331 7,968 6,885 1,069 14 311 52 3,224 0 3,224 1987 11,740 8,464 8,144 7,062 1,074 8 274 46 3,276 0 3,276 1977 11,315 8,166 7,933 7,506 422 5 189 45 3,148 15 3,134 1953 12,283 9,038 8,802 8,382 416 5 190 45 3,245 15 3,231
Idaho 2002 16,824 13,602 12,596 12,055 512 29 980 25 3,222 1,284 1,938 1997 17,123 13,901 12,896 12,354 512 29 980 25 3,222 1,284 1,938 1987 14,534 11,397 10,310 9,705 558 47 1,036 51 3,137 1,198 1,939 1977 13,541 10,450 9,570 9,153 409 8 861 19 3,091 947 2,144 1953 15,540 12,445 11,558 11,046 505 8 867 19 3,095 954 2,142
Montana 2002 19,185 13,228 12,506 11,623 783 100 715 7 5,957 1,618 4,339 1997 19,164 13,207 12,485 11,602 783 100 715 7 5,957 1,618 4,340 1987 14,737 9,382 8,742 8,300 431 11 638 2 5,355 1,703 3,652 1977 14,359 9,169 8,635 8,162 420 53 530 5 5,190 1,055 4,135 1953 16,753 11,529 10,992 10,456 482 54 533 5 5,224 1,063 4,161
Nevada 2002 363 281 265 251 5 8 16 0 82 25 571997 169 86 70 57 5 8 16 0 82 25 571987 221 109 106 99 6 1 3 0 112 0 1121977 134 66 61 61 0 0 3 1 69 8 601953 142 73 68 68 0 0 3 1 69 8 61
New Mexico 2002 4,359 2,948 2,829 2,802 27 0 119 0 1,411 0 1,411 1997 4,833 2,875 2,778 2,733 44 0 84 13 1,958 0 1,958 1987 5,180 3,005 2,893 2,863 30 0 112 0 2,175 5 2,170 1977 5,538 3,037 2,867 2,818 39 9 171 0 2,500 0 2,500 1953 5,627 3,067 2,895 2,809 77 9 172 0 2,559 138 2,421
Utah 2002 4,683 3,805 3,586 3,248 338 0 212 7 878 0 8781997 4,700 3,822 3,603 3,265 338 0 212 7 878 0 8781987 3,078 2,481 2,314 2,108 175 31 150 17 597 0 5971977 3,405 2,670 2,431 2,277 154 0 239 0 735 0 7351953 3,882 3,058 2,817 2,662 155 0 241 0 824 0 824
Wyoming 2002 5,739 4,295 4,093 3,618 474 0 203 0 1,444 0 1,444 1997 5,085 3,641 3,438 2,964 474 0 203 0 1,444 0 1,444 1987 4,332 2,888 2,685 2,211 474 0 203 0 1,444 37 1,407 1977 4,334 3,355 3,245 3,045 200 0 111 0 979 54 9251953 4,738 3,752 3,641 3,244 397 0 112 0 986 55 932
Intermountain total: 2002 66,287 48,991 46,332 42,939 3,208 185 2,569 90 17,296 2,926 14,370 1997 66,701 48,638 46,001 42,580 3,245 175 2,534 103 18,063 2,926 15,137 1987 57,611 40,253 37,709 34,819 2,768 122 2,428 116 17,358 2,943 14,415 1977 56,521 39,427 37,220 35,483 1,663 74 2,136 71 17,094 2,079 15,014 1953 62,585 45,267 43,044 40,935 2,033 75 2,152 72 17,318 2,233 15,086
Rocky Mountain total: 2002 70,628 50,268 47,428 43,959 3,208 261 2,730 109 20,360 2,926 17,434 1997 71,018 49,893 47,076 43,579 3,246 252 2,696 121 21,125 2,926 18,199 1987 61,140 41,395 38,702 35,762 2,768 172 2,566 127 19,745 2,964 16,781 1977 60,173 40,617 38,307 36,465 1,669 173 2,234 76 19,556 2,095 17,460 1953 66,599 46,455 44,143 41,914 2,041 187 2,240 73 20,145 2,250 17,895
Table 10—(continued)._________________________________________________________________________________________________________________
Public Privatea
______________________________________________________ ________________________Federal
_______________________________
Bureau CountyRegion, All of Land and Non-subregion, owner- Total Total National Manage- muni- Total Forest industrialand State Year ships public Federal forest ment Other State cipal private industry private_________________________________________________________________________________________________________________
Thousand acres
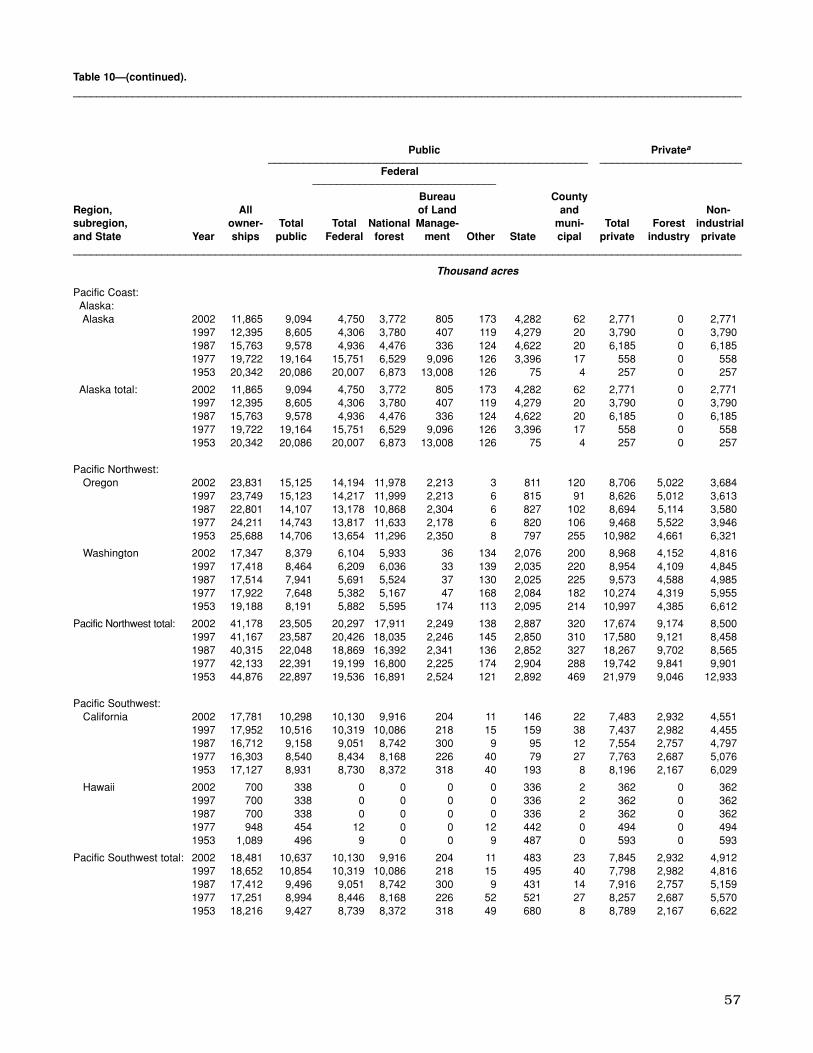
57
Pacific Coast:Alaska:Alaska 2002 11,865 9,094 4,750 3,772 805 173 4,282 62 2,771 0 2,771
1997 12,395 8,605 4,306 3,780 407 119 4,279 20 3,790 0 3,790 1987 15,763 9,578 4,936 4,476 336 124 4,622 20 6,185 0 6,185 1977 19,722 19,164 15,751 6,529 9,096 126 3,396 17 558 0 5581953 20,342 20,086 20,007 6,873 13,008 126 75 4 257 0 257
Alaska total: 2002 11,865 9,094 4,750 3,772 805 173 4,282 62 2,771 0 2,771 1997 12,395 8,605 4,306 3,780 407 119 4,279 20 3,790 0 3,790 1987 15,763 9,578 4,936 4,476 336 124 4,622 20 6,185 0 6,185 1977 19,722 19,164 15,751 6,529 9,096 126 3,396 17 558 0 5581953 20,342 20,086 20,007 6,873 13,008 126 75 4 257 0 257
Pacific Northwest:Oregon 2002 23,831 15,125 14,194 11,978 2,213 3 811 120 8,706 5,022 3,684
1997 23,749 15,123 14,217 11,999 2,213 6 815 91 8,626 5,012 3,613 1987 22,801 14,107 13,178 10,868 2,304 6 827 102 8,694 5,114 3,580 1977 24,211 14,743 13,817 11,633 2,178 6 820 106 9,468 5,522 3,946 1953 25,688 14,706 13,654 11,296 2,350 8 797 255 10,982 4,661 6,321
Washington 2002 17,347 8,379 6,104 5,933 36 134 2,076 200 8,968 4,152 4,816 1997 17,418 8,464 6,209 6,036 33 139 2,035 220 8,954 4,109 4,845 1987 17,514 7,941 5,691 5,524 37 130 2,025 225 9,573 4,588 4,985 1977 17,922 7,648 5,382 5,167 47 168 2,084 182 10,274 4,319 5,955 1953 19,188 8,191 5,882 5,595 174 113 2,095 214 10,997 4,385 6,612
Pacific Northwest total: 2002 41,178 23,505 20,297 17,911 2,249 138 2,887 320 17,674 9,174 8,500 1997 41,167 23,587 20,426 18,035 2,246 145 2,850 310 17,580 9,121 8,458 1987 40,315 22,048 18,869 16,392 2,341 136 2,852 327 18,267 9,702 8,565 1977 42,133 22,391 19,199 16,800 2,225 174 2,904 288 19,742 9,841 9,901 1953 44,876 22,897 19,536 16,891 2,524 121 2,892 469 21,979 9,046 12,933
Pacific Southwest:California 2002 17,781 10,298 10,130 9,916 204 11 146 22 7,483 2,932 4,551
1997 17,952 10,516 10,319 10,086 218 15 159 38 7,437 2,982 4,455 1987 16,712 9,158 9,051 8,742 300 9 95 12 7,554 2,757 4,797 1977 16,303 8,540 8,434 8,168 226 40 79 27 7,763 2,687 5,076 1953 17,127 8,931 8,730 8,372 318 40 193 8 8,196 2,167 6,029
Hawaii 2002 700 338 0 0 0 0 336 2 362 0 3621997 700 338 0 0 0 0 336 2 362 0 3621987 700 338 0 0 0 0 336 2 362 0 3621977 948 454 12 0 0 12 442 0 494 0 4941953 1,089 496 9 0 0 9 487 0 593 0 593
Pacific Southwest total: 2002 18,481 10,637 10,130 9,916 204 11 483 23 7,845 2,932 4,912 1997 18,652 10,854 10,319 10,086 218 15 495 40 7,798 2,982 4,816 1987 17,412 9,496 9,051 8,742 300 9 431 14 7,916 2,757 5,159 1977 17,251 8,994 8,446 8,168 226 52 521 27 8,257 2,687 5,570 1953 18,216 9,427 8,739 8,372 318 49 680 8 8,789 2,167 6,622
Table 10—(continued)._________________________________________________________________________________________________________________
Public Privatea
______________________________________________________ ________________________Federal
_______________________________
Bureau CountyRegion, All of Land and Non-subregion, owner- Total Total National Manage- muni- Total Forest industrialand State Year ships public Federal forest ment Other State cipal private industry private_________________________________________________________________________________________________________________
Thousand acres

58
Pacific Coast total: 2002 71,524 43,235 35,178 31,599 3,258 322 7,652 405 28,290 12,106 16,183 1997 72,214 43,046 35,052 31,901 2,871 279 7,624 370 29,168 12,103 17,064 1987 73,490 41,122 32,856 29,610 2,977 269 7,905 361 32,368 12,459 19,909 1977 79,106 50,549 43,396 31,497 11,547 352 6,821 332 28,557 12,528 16,029 1953 83,434 52,140 48,282 32,136 15,850 296 3,647 481 31,025 11,213 19,812
______________________________________________________________________________________________
United States: 2002 503,540 147,276 109,717 96,643 6,492 6,582 29,505 8,055 356,264 65,596 290,667 1997 503,664 145,967 109,168 96,435 6,143 6,590 28,915 7,883 357,698 66,858 290,840 1987 486,317 132,406 98,433 86,592 5,800 6,041 26,837 7,137 353,911 70,347 283,564 1977 492,355 138,169 106,887 88,701 13,237 4,949 24,447 6,835 354,186 68,937 285,249 1953 508,854 145,436 118,056 94,707 18,116 5,234 19,183 8,197 363,419 58,979 304,440
________________________________________________________________________________________________________________
a Native American lands have been exclusively in the nonindustrial private owner group since 1997. For 1987 and earlier years, these lands may be included in the other public owner group.
Note: Data may not add to totals because of rounding.
Table 10—(continued)._________________________________________________________________________________________________________________
Public Privatea
______________________________________________________ ________________________Federal
_______________________________
Bureau CountyRegion, All of Land and Non-subregion, owner- Total Total National Manage- muni- Total Forest industrialand State Year ships public Federal forest ment Other State cipal private industry private_________________________________________________________________________________________________________________
Thousand acres
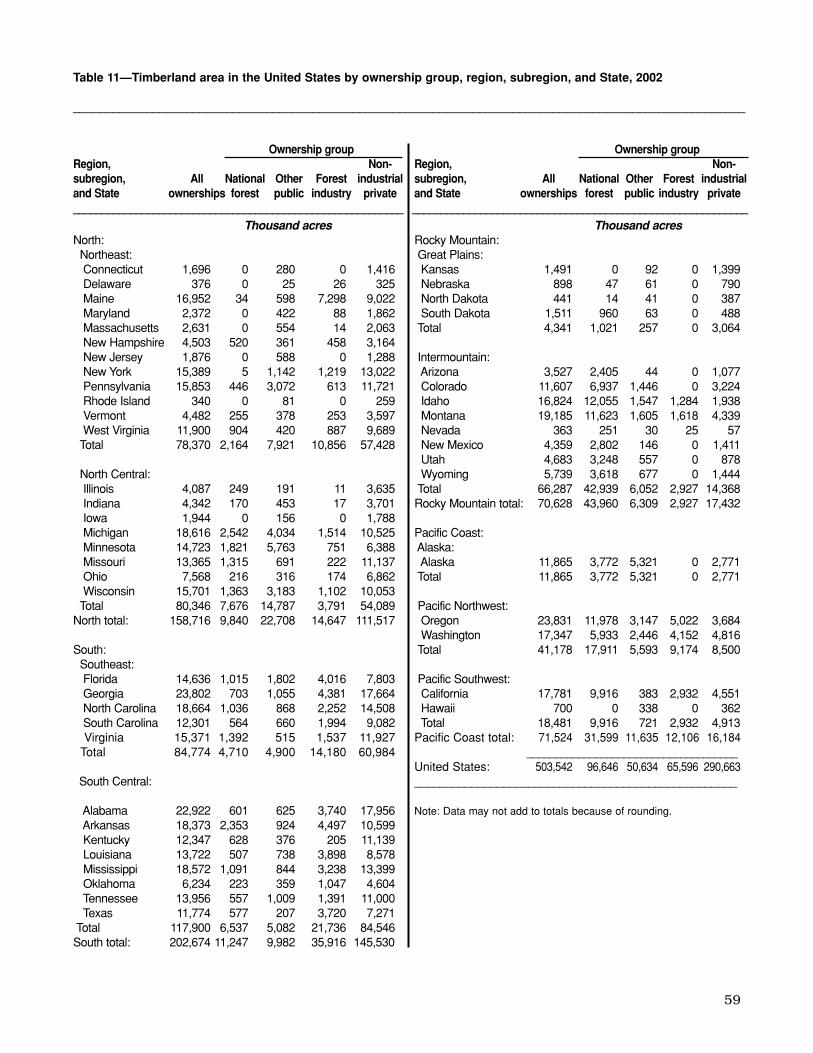
59
Table 11—Timberland area in the United States by ownership group, region, subregion, and State, 2002
_____________________________________________________________________________________________________
Thousand acres Thousand acresNorth: Rocky Mountain:Northeast: Great Plains:Connecticut 1,696 0 280 0 1,416 Kansas 1,491 0 92 0 1,399 Delaware 376 0 25 26 325 Nebraska 898 47 61 0 790Maine 16,952 34 598 7,298 9,022 North Dakota 441 14 41 0 387Maryland 2,372 0 422 88 1,862 South Dakota 1,511 960 63 0 488Massachusetts 2,631 0 554 14 2,063 Total 4,341 1,021 257 0 3,064 New Hampshire 4,503 520 361 458 3,164 New Jersey 1,876 0 588 0 1,288 Intermountain:New York 15,389 5 1,142 1,219 13,022 Arizona 3,527 2,405 44 0 1,077 Pennsylvania 15,853 446 3,072 613 11,721 Colorado 11,607 6,937 1,446 0 3,224 Rhode Island 340 0 81 0 259 Idaho 16,824 12,055 1,547 1,284 1,938 Vermont 4,482 255 378 253 3,597 Montana 19,185 11,623 1,605 1,618 4,339 West Virginia 11,900 904 420 887 9,689 Nevada 363 251 30 25 57
Total 78,370 2,164 7,921 10,856 57,428 New Mexico 4,359 2,802 146 0 1,411 Utah 4,683 3,248 557 0 878
North Central: Wyoming 5,739 3,618 677 0 1,444 Illinois 4,087 249 191 11 3,635 Total 66,287 42,939 6,052 2,927 14,368 Indiana 4,342 170 453 17 3,701 Rocky Mountain total: 70,628 43,960 6,309 2,927 17,432 Iowa 1,944 0 156 0 1,788 Michigan 18,616 2,542 4,034 1,514 10,525 Pacific Coast:Minnesota 14,723 1,821 5,763 751 6,388 Alaska:Missouri 13,365 1,315 691 222 11,137 Alaska 11,865 3,772 5,321 0 2,771 Ohio 7,568 216 316 174 6,862 Total 11,865 3,772 5,321 0 2,771 Wisconsin 15,701 1,363 3,183 1,102 10,053
Total 80,346 7,676 14,787 3,791 54,089 Pacific Northwest:North total: 158,716 9,840 22,708 14,647 111,517 Oregon 23,831 11,978 3,147 5,022 3,684
Washington 17,347 5,933 2,446 4,152 4,816 South: Total 41,178 17,911 5,593 9,174 8,500 Southeast:Florida 14,636 1,015 1,802 4,016 7,803 Pacific Southwest:Georgia 23,802 703 1,055 4,381 17,664 California 17,781 9,916 383 2,932 4,551 North Carolina 18,664 1,036 868 2,252 14,508 Hawaii 700 0 338 0 362South Carolina 12,301 564 660 1,994 9,082 Total 18,481 9,916 721 2,932 4,913 Virginia 15,371 1,392 515 1,537 11,927 Pacific Coast total: 71,524 31,599 11,635 12,106 16,184
Total 84,774 4,710 4,900 14,180 60,984 _____________________________________United States: 503,542 96,646 50,634 65,596 290,663
South Central: ___________________________________________________
Alabama 22,922 601 625 3,740 17,956 Note: Data may not add to totals because of rounding.Arkansas 18,373 2,353 924 4,497 10,599 Kentucky 12,347 628 376 205 11,139 Louisiana 13,722 507 738 3,898 8,578 Mississippi 18,572 1,091 844 3,238 13,399 Oklahoma 6,234 223 359 1,047 4,604 Tennessee 13,956 557 1,009 1,391 11,000Texas 11,774 577 207 3,720 7,271
Total 117,900 6,537 5,082 21,736 84,546South total: 202,674 11,247 9,982 35,916 145,530
Ownership group Ownership groupRegion, Non- Region, Non-subregion, All National Other Forest industrial subregion, All National Other Forest industrialand State ownerships forest public industry private and State ownerships forest public industry private__________________________________________________________ ___________________________________________________________
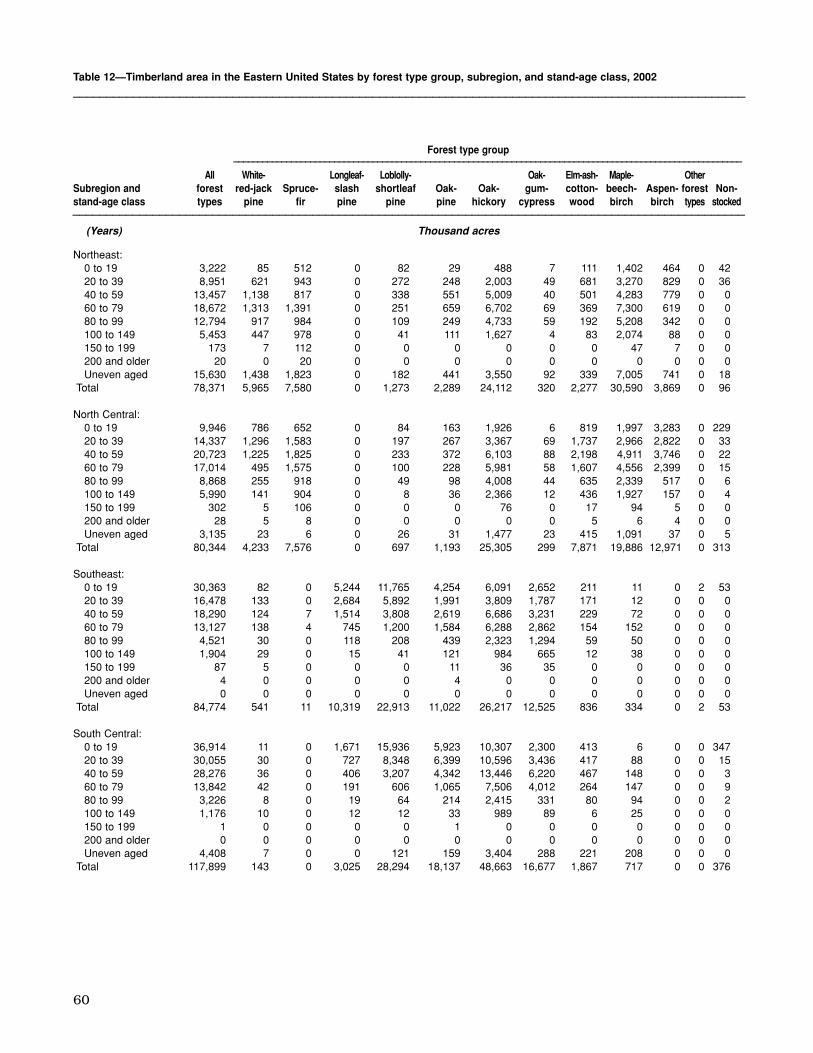
60
Northeast:0 to 19 3,222 85 512 0 82 29 488 7 111 1,402 464 0 4220 to 39 8,951 621 943 0 272 248 2,003 49 681 3,270 829 0 3640 to 59 13,457 1,138 817 0 338 551 5,009 40 501 4,283 779 0 060 to 79 18,672 1,313 1,391 0 251 659 6,702 69 369 7,300 619 0 080 to 99 12,794 917 984 0 109 249 4,733 59 192 5,208 342 0 0100 to 149 5,453 447 978 0 41 111 1,627 4 83 2,074 88 0 0150 to 199 173 7 112 0 0 0 0 0 0 47 7 0 0200 and older 20 0 20 0 0 0 0 0 0 0 0 0 0Uneven aged 15,630 1,438 1,823 0 182 441 3,550 92 339 7,005 741 0 18
Total 78,371 5,965 7,580 0 1,273 2,289 24,112 320 2,277 30,590 3,869 0 96
North Central:0 to 19 9,946 786 652 0 84 163 1,926 6 819 1,997 3,283 0 22920 to 39 14,337 1,296 1,583 0 197 267 3,367 69 1,737 2,966 2,822 0 3340 to 59 20,723 1,225 1,825 0 233 372 6,103 88 2,198 4,911 3,746 0 2260 to 79 17,014 495 1,575 0 100 228 5,981 58 1,607 4,556 2,399 0 1580 to 99 8,868 255 918 0 49 98 4,008 44 635 2,339 517 0 6100 to 149 5,990 141 904 0 8 36 2,366 12 436 1,927 157 0 4150 to 199 302 5 106 0 0 0 76 0 17 94 5 0 0200 and older 28 5 8 0 0 0 0 0 5 6 4 0 0Uneven aged 3,135 23 6 0 26 31 1,477 23 415 1,091 37 0 5
Total 80,344 4,233 7,576 0 697 1,193 25,305 299 7,871 19,886 12,971 0 313
Southeast:0 to 19 30,363 82 0 5,244 11,765 4,254 6,091 2,652 211 11 0 2 5320 to 39 16,478 133 0 2,684 5,892 1,991 3,809 1,787 171 12 0 0 040 to 59 18,290 124 7 1,514 3,808 2,619 6,686 3,231 229 72 0 0 060 to 79 13,127 138 4 745 1,200 1,584 6,288 2,862 154 152 0 0 080 to 99 4,521 30 0 118 208 439 2,323 1,294 59 50 0 0 0100 to 149 1,904 29 0 15 41 121 984 665 12 38 0 0 0150 to 199 87 5 0 0 0 11 36 35 0 0 0 0 0200 and older 4 0 0 0 0 4 0 0 0 0 0 0 0Uneven aged 0 0 0 0 0 0 0 0 0 0 0 0 0
Total 84,774 541 11 10,319 22,913 11,022 26,217 12,525 836 334 0 2 53
South Central:0 to 19 36,914 11 0 1,671 15,936 5,923 10,307 2,300 413 6 0 0 34720 to 39 30,055 30 0 727 8,348 6,399 10,596 3,436 417 88 0 0 1540 to 59 28,276 36 0 406 3,207 4,342 13,446 6,220 467 148 0 0 360 to 79 13,842 42 0 191 606 1,065 7,506 4,012 264 147 0 0 980 to 99 3,226 8 0 19 64 214 2,415 331 80 94 0 0 2100 to 149 1,176 10 0 12 12 33 989 89 6 25 0 0 0150 to 199 1 0 0 0 0 1 0 0 0 0 0 0 0200 and older 0 0 0 0 0 0 0 0 0 0 0 0 0Uneven aged 4,408 7 0 0 121 159 3,404 288 221 208 0 0 0
Total 117,899 143 0 3,025 28,294 18,137 48,663 16,677 1,867 717 0 0 376
Table 12—Timberland area in the Eastern United States by forest type group, subregion, and stand-age class, 2002_____________________________________________________________________________________________________
Forest type group__________________________________________________________________________________________________________
All White- Longleaf- Loblolly- Oak- Elm-ash- Maple- OtherSubregion and forest red-jack Spruce- slash shortleaf Oak- Oak- gum- cotton- beech- Aspen- forest Non-stand-age class types pine fir pine pine pine hickory cypress wood birch birch types stocked_____________________________________________________________________________________________________
(Years) Thousand acres
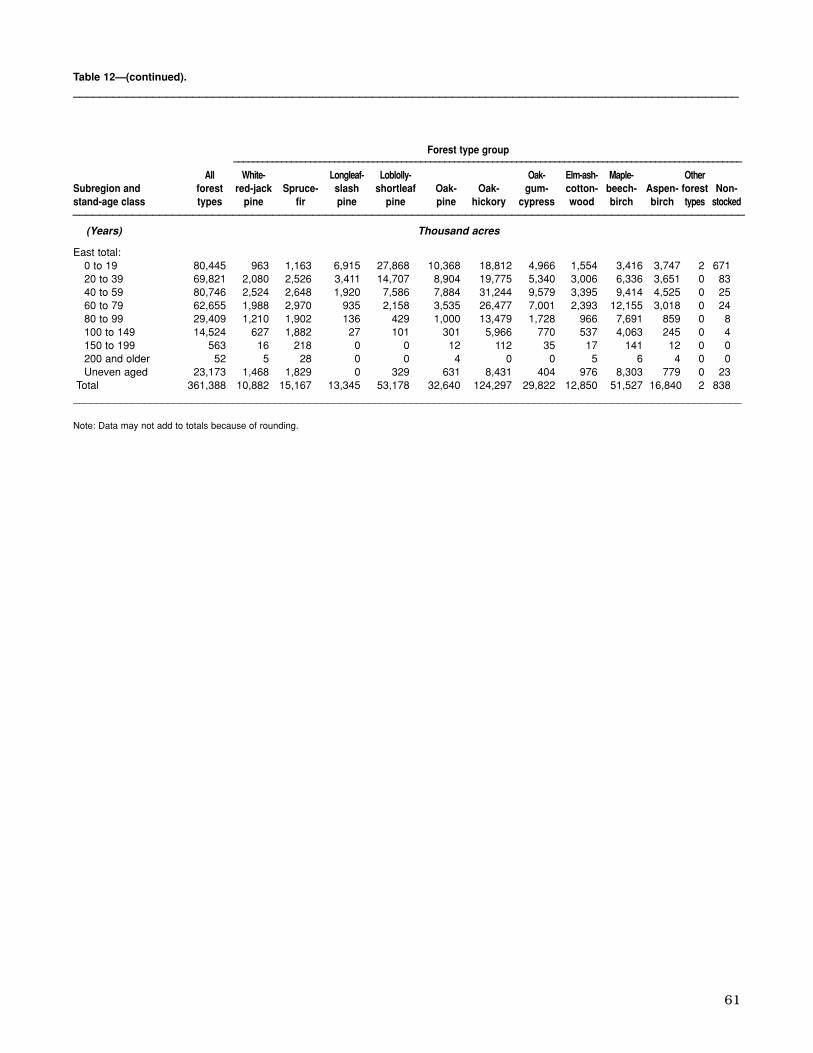
61
East total:0 to 19 80,445 963 1,163 6,915 27,868 10,368 18,812 4,966 1,554 3,416 3,747 2 67120 to 39 69,821 2,080 2,526 3,411 14,707 8,904 19,775 5,340 3,006 6,336 3,651 0 8340 to 59 80,746 2,524 2,648 1,920 7,586 7,884 31,244 9,579 3,395 9,414 4,525 0 2560 to 79 62,655 1,988 2,970 935 2,158 3,535 26,477 7,001 2,393 12,155 3,018 0 2480 to 99 29,409 1,210 1,902 136 429 1,000 13,479 1,728 966 7,691 859 0 8100 to 149 14,524 627 1,882 27 101 301 5,966 770 537 4,063 245 0 4150 to 199 563 16 218 0 0 12 112 35 17 141 12 0 0200 and older 52 5 28 0 0 4 0 0 5 6 4 0 0Uneven aged 23,173 1,468 1,829 0 329 631 8,431 404 976 8,303 779 0 23
Total 361,388 10,882 15,167 13,345 53,178 32,640 124,297 29,822 12,850 51,527 16,840 2 838_________________________________________________________________________________________________________________
Note: Data may not add to totals because of rounding.
Table 12—(continued).____________________________________________________________________________________________________
Forest type group__________________________________________________________________________________________________________
All White- Longleaf- Loblolly- Oak- Elm-ash- Maple- OtherSubregion and forest red-jack Spruce- slash shortleaf Oak- Oak- gum- cotton- beech- Aspen- forest Non-stand-age class types pine fir pine pine pine hickory cypress wood birch birch types stocked_____________________________________________________________________________________________________
(Years) Thousand acres

62
Great Plains:0 to 19 452 0 133 0 0 0 0 0 0 10 284 0 2520 to 39 898 0 47 0 0 0 0 0 0 50 798 0 340 to 59 952 0 88 0 0 0 0 0 0 27 834 0 460 to 79 880 0 257 0 0 0 0 0 0 20 598 0 580 to 99 708 0 408 0 0 0 0 0 0 13 279 0 8100 to 149 372 0 272 0 0 0 0 0 0 35 63 0 3150 to 199 72 0 64 0 0 0 0 0 0 0 9 0 0200 and older 7 0 6 0 0 0 0 0 0 1 0 0 0Uneven aged 0 0 0 0 0 0 0 0 0 0 0 0 0
Total 4,341 0 1,275 0 0 0 0 0 0 156 2,864 0 46
Intermountain:0 to 19 7,249 1,769 1,816 37 1,292 110 123 730 0 183 726 70 39220 to 39 2,588 477 380 29 736 48 80 330 0 83 424 0 040 to 59 4,856 1,312 937 38 819 204 86 645 0 73 745 0 060 to 79 12,590 3,167 3,160 3 1,789 272 235 1,955 0 162 1,845 0 080 to 99 15,175 3,940 3,811 12 2,655 401 177 2,319 0 133 1,726 0 0100 to 149 15,673 4,217 2,957 4 4,307 317 116 2,575 0 450 730 0 0150 to 199 5,766 1,710 718 0 1,963 131 65 799 0 341 40 0 0200 and older 2,390 831 200 0 851 30 10 202 0 256 10 0 0Uneven aged 0 0 0 0 0 0 0 0 0 0 0 0 0
Total 66,287 17,424 13,979 124 14,411 1,512 893 9,555 0 1,681 6,246 70 392
Alaska:0 to 19 425 0 0 0 63 182 0 0 0 0 164 0 1620 to 39 974 0 0 0 135 82 0 0 0 3 715 0 3940 to 59 1,095 0 0 0 279 34 0 0 0 79 700 0 460 to 79 907 0 0 0 332 38 0 4 0 18 515 0 080 to 99 1,509 0 0 0 540 310 0 0 0 7 652 0 0100 to 149 1,838 0 0 0 1,031 369 0 0 0 38 367 0 33150 to 199 1,395 0 0 0 447 489 0 6 0 3 450 0 0200 and older 3,217 0 0 0 724 2,444 0 29 0 0 6 0 14Uneven aged 507 0 0 0 97 299 0 1 0 8 94 0 8
Total 11,865 0 0 0 3,648 4,247 0 39 0 155 3,663 0 113
Pacific Northwest:0 to 19 7,060 3,192 619 10 420 850 16 430 0 2 796 111 61320 to 39 5,478 2,619 271 9 191 914 9 160 0 10 1,260 15 1840 to 59 6,203 2,833 716 6 190 848 29 364 6 0 1,170 15 2860 to 79 5,514 2,224 1,230 0 463 442 89 390 0 4 618 46 780 to 99 4,841 1,789 1,237 4 596 320 52 413 0 18 352 59 2100 to 149 6,863 2,557 1,412 15 1,268 595 51 505 0 9 304 127 20150 to 199 2,914 990 545 4 652 440 28 122 0 17 90 26 0200 and older 2,305 756 220 4 497 619 9 61 0 4 118 18 0Uneven aged 0 0 0 0 0 0 0 0 0 0 0 0 0
Total 41,178 16,960 6,251 51 4,277 5,027 284 2,445 6 64 4,710 417 687
Table 13—Timberland area in the Western United States by forest type group, subregion, and stand-age class, 2002_____________________________________________________________________________________________________
Forest type group_______________________________________________________________________________________________
Subregion and All Pon- Western Hemlock- Lodge- Other Westernstand-age class forest Douglas- derosa white Fir- Sitka pole Red- soft- hard- Pinyon- Non-(Years) types fir pine pine spruce spruce Larch pine wood woods woods juniper stocked_____________________________________________________________________________________________________________________________
Thousand acres

63
Pacific Southwest:0 to 19 2,311 99 265 0 41 0 0 11 43 159 569 4 1,12120 to 39 1,310 148 326 0 4 1 0 2 177 114 537 0 040 to 59 1,929 78 596 8 81 7 0 22 197 214 727 0 060 to 79 2,594 52 878 7 212 0 0 40 141 474 787 2 080 to 99 2,955 117 1,262 0 212 0 0 49 59 565 691 0 0100 to 149 3,588 70 1,100 9 337 1 0 154 50 1,307 558 1 0150 to 199 1,754 66 167 10 282 21 0 69 8 830 302 0 0200 and older 2,040 137 252 5 187 18 0 97 54 1,000 291 0 0Uneven aged 0 0 0 0 0 0 0 0 0 0 0 0 0
Total 18,481 767 4,846 39 1,355 48 0 443 730 4,663 4,461 7 1,121
West total:0 to 19 17,496 5,061 2,833 47 1,816 1,142 140 1,170 43 355 2,538 185 2,167 20 to 39 11,247 3,244 1,024 39 1,067 1,045 89 493 177 260 3,735 15 5940 to 59 15,036 4,223 2,337 52 1,368 1,093 114 1,030 203 392 4,175 15 3560 to 79 22,483 5,444 5,526 10 2,796 752 324 2,389 141 677 4,364 48 1180 to 99 25,187 5,846 6,718 16 4,002 1,030 229 2,782 59 736 3,700 59 9100 to 149 28,334 6,843 5,741 27 6,943 1,281 168 3,234 50 1,840 2,023 129 56150 to 199 11,902 2,766 1,493 13 3,343 1,081 93 995 8 1,192 891 26 0200 and older 9,959 1,724 678 9 2,259 3,111 20 388 54 1,260 425 18 14Uneven aged 507 0 0 0 97 299 0 1 0 8 94 0 8
Total 142,152 35,151 26,350 214 23,691 10,834 1,177 12,483 735 6,719 21,944 494 2,359 ____________________________________________________________________________________________________
Note: Data may not add to totals because of rounding.
Table 13—(continued). _____________________________________________________________________________________________________
Forest type group_______________________________________________________________________________________________
Subregion and All Pon- Western Hemlock- Lodge- Other Westernstand-age class forest Douglas- derosa white Fir- Sitka pole Red- soft- hard- Pinyon- Non-(Years) types fir pine pine spruce spruce Larch pine wood woods woods juniper stocked_____________________________________________________________________________________________________________________________
Thousand acres
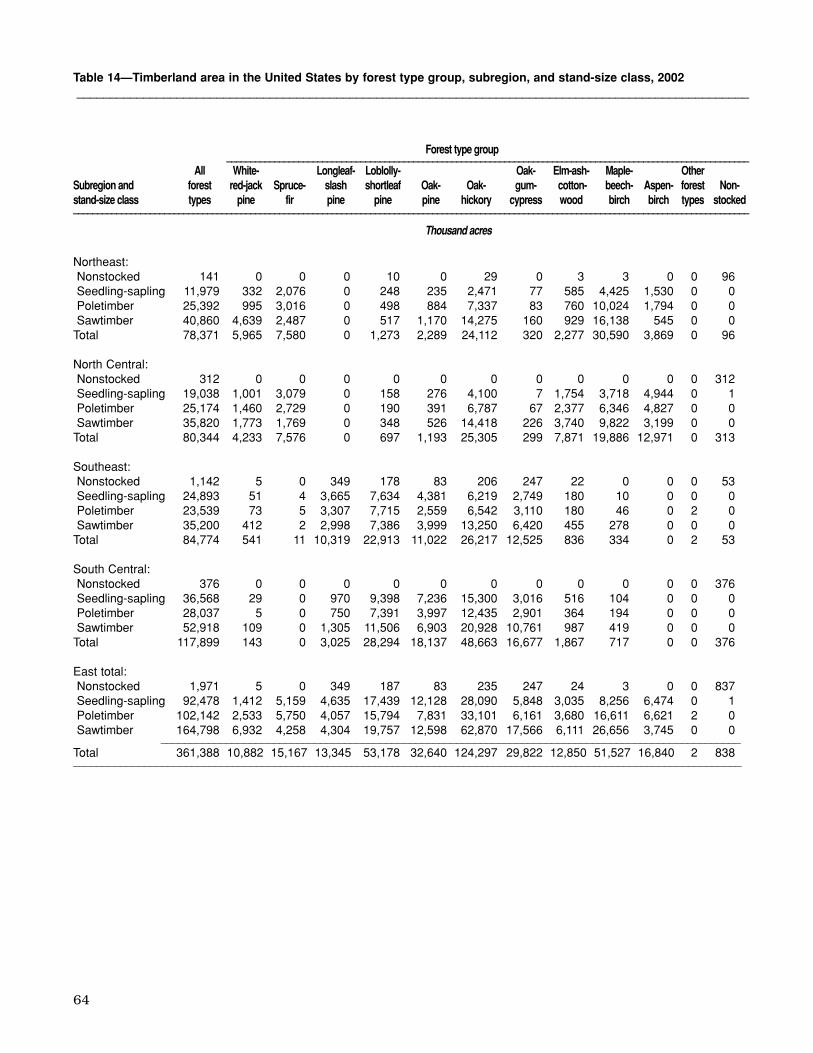
64
Northeast:Nonstocked 141 0 0 0 10 0 29 0 3 3 0 0 96Seedling-sapling 11,979 332 2,076 0 248 235 2,471 77 585 4,425 1,530 0 0Poletimber 25,392 995 3,016 0 498 884 7,337 83 760 10,024 1,794 0 0Sawtimber 40,860 4,639 2,487 0 517 1,170 14,275 160 929 16,138 545 0 0
Total 78,371 5,965 7,580 0 1,273 2,289 24,112 320 2,277 30,590 3,869 0 96
North Central:Nonstocked 312 0 0 0 0 0 0 0 0 0 0 0 312Seedling-sapling 19,038 1,001 3,079 0 158 276 4,100 7 1,754 3,718 4,944 0 1Poletimber 25,174 1,460 2,729 0 190 391 6,787 67 2,377 6,346 4,827 0 0Sawtimber 35,820 1,773 1,769 0 348 526 14,418 226 3,740 9,822 3,199 0 0
Total 80,344 4,233 7,576 0 697 1,193 25,305 299 7,871 19,886 12,971 0 313
Southeast:Nonstocked 1,142 5 0 349 178 83 206 247 22 0 0 0 53Seedling-sapling 24,893 51 4 3,665 7,634 4,381 6,219 2,749 180 10 0 0 0Poletimber 23,539 73 5 3,307 7,715 2,559 6,542 3,110 180 46 0 2 0Sawtimber 35,200 412 2 2,998 7,386 3,999 13,250 6,420 455 278 0 0 0
Total 84,774 541 11 10,319 22,913 11,022 26,217 12,525 836 334 0 2 53
South Central:Nonstocked 376 0 0 0 0 0 0 0 0 0 0 0 376Seedling-sapling 36,568 29 0 970 9,398 7,236 15,300 3,016 516 104 0 0 0Poletimber 28,037 5 0 750 7,391 3,997 12,435 2,901 364 194 0 0 0Sawtimber 52,918 109 0 1,305 11,506 6,903 20,928 10,761 987 419 0 0 0
Total 117,899 143 0 3,025 28,294 18,137 48,663 16,677 1,867 717 0 0 376
East total:Nonstocked 1,971 5 0 349 187 83 235 247 24 3 0 0 837Seedling-sapling 92,478 1,412 5,159 4,635 17,439 12,128 28,090 5,848 3,035 8,256 6,474 0 1Poletimber 102,142 2,533 5,750 4,057 15,794 7,831 33,101 6,161 3,680 16,611 6,621 2 0Sawtimber 164,798 6,932 4,258 4,304 19,757 12,598 62,870 17,566 6,111 26,656 3,745 0 0
__________________________________________________________________________________________________Total 361,388 10,882 15,167 13,345 53,178 32,640 124,297 29,822 12,850 51,527 16,840 2 838_________________________________________________________________________________________________________________
Table 14—Timberland area in the United States by forest type group, subregion, and stand-size class, 2002_____________________________________________________________________________________________________
Forest type group_____________________________________________________________________________________________________________All White- Longleaf- Loblolly- Oak- Elm-ash- Maple- Other
Subregion and forest red-jack Spruce- slash shortleaf Oak- Oak- gum- cotton- beech- Aspen- forest Non-stand-size class types pine fir pine pine pine hickory cypress wood birch birch types stocked_____________________________________________________________________________________________________________________________________________
Thousand acres

65
Great Plains:Nonstocked 46 0 0 0 0 0 0 0 0 0 0 0 46Seedling-sapling 881 0 204 0 0 0 0 0 0 65 612 0 0Poletimber 1,168 0 218 0 0 0 0 0 0 39 912 0 0Sawtimber 2,245 0 853 0 0 0 0 0 0 51 1,340 0 0
Total 4,341 0 1,275 0 0 0 0 0 0 156 2,864 0 46
Intermountain:Nonstocked 2,864 719 1,032 7 311 37 8 107 0 115 136 0 392Seedling-sapling 7,151 1,622 979 47 1,820 128 188 1,182 0 158 1,026 0 0Poletimber 12,132 1,660 1,121 36 1,477 153 186 3,861 0 294 3,275 70 0Sawtimber 44,140 13,423 10,847 34 10,803 1,194 512 4,404 0 1,114 1,808 0 0
Total 66,287 17,424 13,979 124 14,411 1,512 893 9,555 0 1,681 6,246 70 392
Alaska:Nonstocked 234 0 0 0 23 91 0 0 0 6 1 0 113Seedling-sapling 2,550 0 0 0 948 406 0 6 0 78 1,112 0 0Poletimber 3,135 0 0 0 1,048 74 0 14 0 68 1,932 0 0Sawtimber 5,945 0 0 0 1,629 3,676 0 19 0 3 618 0 0
Total 11,865 0 0 0 3,648 4,247 0 39 0 155 3,663 0 113
Pacific Northwest:Nonstocked 1,059 81 199 0 20 8 2 28 0 0 15 28 679Seedling-sapling 8,910 3,753 785 37 961 1,178 35 1,072 0 21 1,009 58 0Poletimber 5,442 1,788 642 4 274 490 61 668 0 8 1,447 52 8Sawtimber 25,768 11,338 4,625 11 3,023 3,352 186 677 6 34 2,239 278 0
Total 41,178 16,960 6,251 51 4,277 5,027 284 2,445 6 64 4,710 417 687
Pacific Southwest:Nonstocked 1,140 0 6 0 6 0 0 3 0 3 0 0 1,121 Seedling-sapling 1,360 115 325 8 73 1 0 28 34 238 535 4 0Poletimber 1,598 68 356 5 14 0 0 21 41 157 936 0 0Sawtimber 14,384 584 4,159 26 1,262 47 0 390 655 4,265 2,991 3 0
Total 18,481 767 4,846 39 1,355 48 0 443 730 4,663 4,461 7 1,121
West total:Nonstocked 5,343 800 1,237 7 359 135 10 138 0 124 152 28 2,352 Seedling-sapling 20,851 5,489 2,292 91 3,802 1,713 224 2,288 34 561 4,295 62 0Poletimber 23,476 3,516 2,337 45 2,813 717 246 4,565 41 566 8,501 122 8Sawtimber 92,482 25,345 20,484 71 16,717 8,269 697 5,491 661 5,468 8,996 281 0
______________________________________________________________________________________Total 142,152 35,151 26,350 214 23,691 10,834 1,177 12,483 735 6,719 21,944 494 2,359_____________________________________________________________________________________________________Note: Data may not add to totals because of rounding.
Table 14—(continued). _____________________________________________________________________________________________________
Forest type group_____________________________________________________________________________________________________________All Western Hemlock Lodge- Other Western
Subregion and forest Douglas- Ponderosa white Fir- Sitka pole soft- hard- Pinyon- Non-stand-size class types fir pine pine spruce spruce Larch pine Redwood woods woods juniper stocked_____________________________________________________________________________________________________________________________________________________________
Thousand acres

66
North:Northeast 2002 78,370 40,860 25,392 11,978 142
1997 78,923 40,513 26,022 12,285 104 1987 79,835 41,299 27,588 10,676 271 1977 78,561 33,801 21,614 21,071 2,075 1953 73,035 27,639 30,287 12,631 2,478
North Central 2002 80,346 35,820 25,174 19,038 314 1997 80,510 35,545 25,025 19,640 300 1987 74,585 26,017 28,018 19,022 1,528 1977 74,885 21,971 29,774 20,811 2,329 1953 81,240 15,414 26,712 26,524 12,590
North total: 2002 158,716 76,680 50,566 31,016 456 1997 159,433 76,058 51,047 31,925 403 1987 154,419 67,316 55,606 29,698 1,799 1977 153,446 55,772 51,388 41,882 4,404 1953 154,275 43,053 56,999 39,155 15,068
South:Southeast 2002 84,774 35,202 23,539 24,893 1,142
1997 84,803 35,742 22,385 25,511 1,165 1987 85,141 36,415 25,189 20,273 3,264 1977 87,818 32,878 28,619 22,162 4,159 1953 89,067 25,669 29,709 21,804 11,885
South Central 2002 117,900 52,917 28,036 36,568 375 1997 116,196 52,801 30,018 33,111 266 1987 112,127 48,622 34,688 28,677 140 1977 111,812 43,789 32,611 34,331 1,081 1953 115,479 39,736 53,172 18,051 4,520
South total: 2002 202,674 88,119 51,575 61,461 1,517 1997 200,999 88,543 52,403 58,622 1,431 1987 197,268 85,037 59,877 48,950 3,404 1977 199,630 76,667 61,230 56,493 5,240 1953 204,546 65,405 82,881 39,855 16,405
East total: 2002 361,390 164,799 102,141 92,477 1,973 1997 360,432 164,601 103,450 90,547 1,834 1987 351,687 152,342 115,495 78,648 5,202 1977 353,076 132,439 112,618 98,375 9,644 1953 358,821 108,458 139,880 79,010 31,473
Table 15—Area of timberland in the United States by stand-size class, region, and subregion, 2002, 1997,1987, 1977, and 1953
__________________________________________________________________________________________
Seedling/Region and subregion Year Total Sawtimber Poletimber sapling Nonstocked__________________________________________________________________________________________
Thousand acres

67
Rocky Mountain:Great Plains 2002 4,341 2,245 1,169 882 46
1997 4,317 2,250 1,254 761 53 1987 3,529 1,993 758 675 102 1977 3,652 2,003 756 396 497 1953 4,014 1,341 1,302 850 521
Intermountain 2002 66,287 44,140 12,132 7,150 2,863 1997 66,701 45,416 12,078 6,543 2,664 1987 57,610 40,526 9,453 6,308 1,324 1977 56,521 35,880 12,197 5,873 2,571 1953 62,585 29,613 19,412 8,823 4,737
Rocky Mountain total: 2002 70,628 46,385 13,301 8,032 2,909 1997 71,018 47,666 13,332 7,304 2,717 1987 61,139 42,519 10,211 6,983 1,426 1977 60,173 37,883 12,953 6,269 3,068 1953 66,599 30,954 20,714 9,673 5,258
Pacific Coast:Alaska 2002 11,865 5,945 3,135 2,550 234
1997 12,395 7,282 2,764 2,186 163 1987 15,763 10,155 3,018 2,423 168 1977 19,720 14,592 2,487 2,492 149 1953 20,342 19,499 357 357 129
Pacific Northwest 2002 41,178 25,768 5,441 8,909 1,058 1997 41,167 25,744 5,421 8,955 1,047 1987 40,315 24,093 7,672 7,403 1,147 1977 42,133 26,230 7,196 6,711 1,996 1953 44,876 28,367 8,418 5,428 2,663
Pacific Southwest 2002 18,481 14,383 1,598 1,359 1,139 1997 18,652 13,387 2,203 1,291 1,772 1987 17,412 13,747 1,597 1,956 112 1977 17,251 12,066 1,440 1,995 1,750 1953 18,216 14,213 1,319 97 2,587
Pacific Coast total: 2002 71,524 46,096 10,174 12,818 2,431 1997 72,214 46,413 10,387 12,431 2,982 1987 73,490 47,994 12,286 11,782 1,427 1977 79,104 52,888 11,123 11,198 3,895 1953 83,434 62,079 10,094 5,882 5,379
West total: 2002 142,152 92,481 23,475 20,850 5,340 1997 143,232 94,079 23,719 19,735 5,699 1987 134,629 90,513 22,498 18,765 2,853 1977 139,277 90,771 24,076 17,467 6,963 1953 150,033 93,033 30,808 15,555 10,637
United States: 2002 503,542 257,280 125,616 113,327 7,313 1997 503,664 258,680 127,169 110,283 7,533 1987 486,316 242,855 137,993 97,413 8,055 1977 492,353 223,210 136,694 115,842 16,607 1953 508,854 201,491 170,688 94,565 42,110
_________________________________________________________________________________________
Note: Data may not add to totals because of rounding.
Table 15—(continued).__________________________________________________________________________________________
Seedling/Region and subregion Year Total Sawtimber Poletimber sapling Nonstocked__________________________________________________________________________________________
Thousand acres

68
North 2002 158,715 10,198 15,156 0 1,971 3,482 49,416 620 10,148 50,476 16,840 4091997 159,433 10,512 15,185 0 2,263 3,595 49,678 770 10,000 50,210 16,818 4041987 154,418 13,030 16,421 0 2,294 3,457 45,945 778 11,009 42,263 17,346 1,876 1977 153,446 11,362 17,468 0 2,468 3,115 42,262 518 18,050 34,300 19,149 4,754 1953 154,275 8,940 18,887 0 3,569 1,022 46,455 1,212 19,673 23,248 24,637 6,633
South 2002 202,673 683 11 13,345 51,207 29,159 74,881 29,203 2,703 1,051 0 4291997 200,999 645 11 13,129 49,719 29,809 74,315 28,495 2,299 1,146 0 1,431 1987 197,269 519 18 15,640 46,694 28,043 71,239 27,596 3,036 884 0 3,599 1977 199,630 407 8 16,725 47,433 31,453 66,307 26,116 4,171 1,776 0 5,234 1953 204,546 329 12 26,926 51,792 23,970 54,872 34,498 4,051 750 0 7,346
East total: 2002 361,388 10,882 15,167 13,345 53,178 32,640 124,297 29,822 12,850 51,527 16,840 8381997 360,432 11,157 15,196 13,129 51,982 33,404 123,992 29,265 12,299 51,356 16,818 1,835 1987 351,687 13,789 16,752 15,407 48,335 31,148 116,997 27,977 14,210 43,939 17,676 5,457 1977 353,076 11,769 17,476 16,725 49,901 34,568 108,569 26,635 22,222 36,076 19,149 9,988 1953 358,821 9,269 18,899 26,926 55,360 24,992 101,326 35,710 23,724 23,998 24,637 13,979
_____________________________________________________________________________________________________________________________
Table 16—Timberland area in the United States by major geographic region and forest type group, 2002, 1997, 1987, 1977, and 1953____________________________________________________________________________________________________
All White- Loblolly- Maple-eastern red- Spruce- Longleaf- shortleaf Oak- Oak- Oak-gum- Elm-ash-- beech-- Aspen- Non-
Region Year types jack pine fir slash pine pine pine hickory cypress cottonwood birc h birch stocked___________________________________________________________________________________________________________________________________________
Thousand acres
___________________________________________________________________________________________________________________________________________
OtherAll Ponderosa- Western Hemlock- Westerm Western
western Douglas- Jeffrey white Fir- Sitka Lodgepole Red- softwood hardwood Pinyon- Non-Region Year types fir pine pine spruce spruce Larch pine wood types types juniper stocked___________________________________________________________________________________________________________________________________________
Thousand acres
Rocky Mountain 2002 70,628 17,424 15,254 124 14,411 1,512 893 9,555 0 1,837 9,110 70 4381997 71,018 17,645 15,752 131 14,236 1,510 873 9,696 0 1,906 8,796 365 1081987 61,140 14,119 14,555 276 11,684 1,580 1,856 9,973 0 319 5,105 1,673 1,576 1977 60,173 12,729 15,285 333 10,545 1,298 1,822 10,225 0 528 4,745 2,663 2,556 1953 66,599 11,923 18,800 2,670 7,529 99 2,677 13,326 0 0 5,600 3,973 3,241
Pacific 2002 59,660 17,727 11,096 90 5,633 5,076 284 2,889 736 4,727 9,171 424 1,808 West 1997 59,819 18,889 13,553 147 7,214 5,084 288 2,573 738 1,610 8,248 273 1,203
1987 57,727 19,768 11,236 14 10,438 4,034 873 2,233 1,129 319 6,849 834 8141977 59,384 18,666 11,969 126 8,197 4,819 683 2,917 662 0 7,566 3,780 3,782 1953 63,092 20,646 16,281 2,797 4,441 4,881 888 2,703 1,283 0 4,773 4,398 4,370
Alaska 2002 11,865 0 0 0 3,648 4,247 0 40 0 155 3,663 0 1131997 12,395 0 0 0 3,107 4,818 0 0 0 155 4,165 0 1501987 15,763 0 0 0 5,661 5,560 0 0 0 181 4,358 4 41977 19,722 0 0 0 2,715 12,063 0 0 0 0 4,857 87 491953 20,342 0 0 0 0 19,438 0 0 0 0 0 904 190
West total: 2002 142,152 35,151 26,350 214 23,691 10,834 1,177 12,483 735 6,719 21,944 494 2,359 1997 143,232 36,534 29,305 278 24,557 11,411 1,161 12,269 738 3,671 21,210 638 1,460 1987 134,630 33,887 25,791 290 27,783 11,174 2,729 12,205 1,129 819 16,312 2,511 2,394 1977 139,279 31,395 27,253 459 21,457 18,180 2,504 13,142 662 528 17,168 6,529 6,387 1953 150,033 32,570 35,081 5,467 11,970 24,419 3,565 16,030 1,283 0 10,373 9,275 7,800
_____________________________________________________________________________________________________________________________
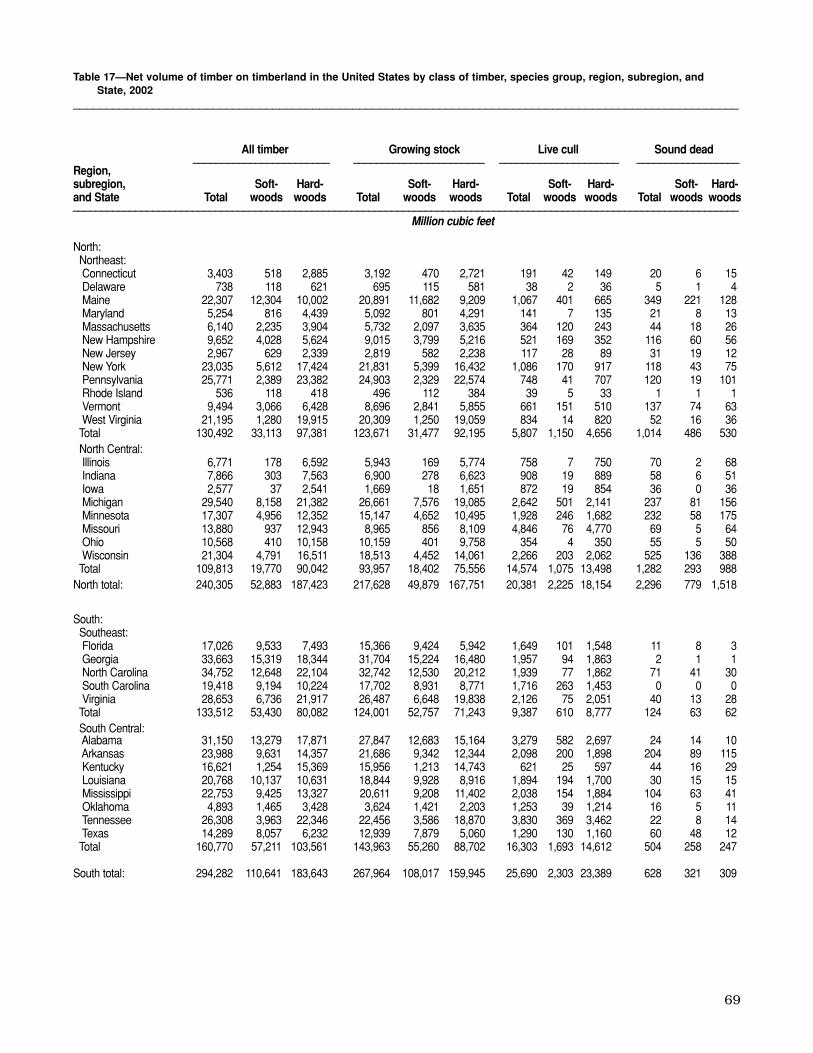
69
North:Northeast:Connecticut 3,403 518 2,885 3,192 470 2,721 191 42 149 20 6 15Delaware 738 118 621 695 115 581 38 2 36 5 1 4Maine 22,307 12,304 10,002 20,891 11,682 9,209 1,067 401 665 349 221 128Maryland 5,254 816 4,439 5,092 801 4,291 141 7 135 21 8 13Massachusetts 6,140 2,235 3,904 5,732 2,097 3,635 364 120 243 44 18 26New Hampshire 9,652 4,028 5,624 9,015 3,799 5,216 521 169 352 116 60 56New Jersey 2,967 629 2,339 2,819 582 2,238 117 28 89 31 19 12New York 23,035 5,612 17,424 21,831 5,399 16,432 1,086 170 917 118 43 75Pennsylvania 25,771 2,389 23,382 24,903 2,329 22,574 748 41 707 120 19 101Rhode Island 536 118 418 496 112 384 39 5 33 1 1 1Vermont 9,494 3,066 6,428 8,696 2,841 5,855 661 151 510 137 74 63West Virginia 21,195 1,280 19,915 20,309 1,250 19,059 834 14 820 52 16 36
Total 130,492 33,113 97,381 123,671 31,477 92,195 5,807 1,150 4,656 1,014 486 530North Central: Illinois 6,771 178 6,592 5,943 169 5,774 758 7 750 70 2 68Indiana 7,866 303 7,563 6,900 278 6,623 908 19 889 58 6 51Iowa 2,577 37 2,541 1,669 18 1,651 872 19 854 36 0 36Michigan 29,540 8,158 21,382 26,661 7,576 19,085 2,642 501 2,141 237 81 156Minnesota 17,307 4,956 12,352 15,147 4,652 10,495 1,928 246 1,682 232 58 175Missouri 13,880 937 12,943 8,965 856 8,109 4,846 76 4,770 69 5 64Ohio 10,568 410 10,158 10,159 401 9,758 354 4 350 55 5 50Wisconsin 21,304 4,791 16,511 18,513 4,452 14,061 2,266 203 2,062 525 136 388
Total 109,813 19,770 90,042 93,957 18,402 75,556 14,574 1,075 13,498 1,282 293 988North total: 240,305 52,883 187,423 217,628 49,879 167,751 20,381 2,225 18,154 2,296 779 1,518
South:Southeast: Florida 17,026 9,533 7,493 15,366 9,424 5,942 1,649 101 1,548 11 8 3Georgia 33,663 15,319 18,344 31,704 15,224 16,480 1,957 94 1,863 2 1 1North Carolina 34,752 12,648 22,104 32,742 12,530 20,212 1,939 77 1,862 71 41 30South Carolina 19,418 9,194 10,224 17,702 8,931 8,771 1,716 263 1,453 0 0 0Virginia 28,653 6,736 21,917 26,487 6,648 19,838 2,126 75 2,051 40 13 28
Total 133,512 53,430 80,082 124,001 52,757 71,243 9,387 610 8,777 124 63 62South Central: Alabama 31,150 13,279 17,871 27,847 12,683 15,164 3,279 582 2,697 24 14 10Arkansas 23,988 9,631 14,357 21,686 9,342 12,344 2,098 200 1,898 204 89 115Kentucky 16,621 1,254 15,369 15,956 1,213 14,743 621 25 597 44 16 29Louisiana 20,768 10,137 10,631 18,844 9,928 8,916 1,894 194 1,700 30 15 15Mississippi 22,753 9,425 13,327 20,611 9,208 11,402 2,038 154 1,884 104 63 41Oklahoma 4,893 1,465 3,428 3,624 1,421 2,203 1,253 39 1,214 16 5 11Tennessee 26,308 3,963 22,346 22,456 3,586 18,870 3,830 369 3,462 22 8 14Texas 14,289 8,057 6,232 12,939 7,879 5,060 1,290 130 1,160 60 48 12Total 160,770 57,211 103,561 143,963 55,260 88,702 16,303 1,693 14,612 504 258 247
South total: 294,282 110,641 183,643 267,964 108,017 159,945 25,690 2,303 23,389 628 321 309
Table 17—Net volume of timber on timberland in the United States by class of timber, species group, region, subregion, and State, 2002
____________________________________________________________________________________________________
All timber Growing stock Live cull Sound dead________________________ _______________________ _____________________ __________________
Region,subregion, Soft- Hard- Soft- Hard- Soft- Hard- Soft- Hard-and State Total woods woods Total woods woods Total woods woods Total woods woods_____________________________________________________________________________________________________________________
Million cubic feet

70
Rocky Mountain:Great Plains: Kansas 1,998 22 1,977 1,254 17 1,238 704 5 699 40 0 40Nebraska 1,329 261 1,069 856 212 645 449 42 407 24 7 17North Dakota 504 5 498 330 3 326 147 2 145 27 0 27South Dakota 2,043 1,763 280 1,819 1,648 171 136 31 105 88 84 4
Total 5,874 2,051 3,824 4,259 1,880 2,380 1,436 80 1,356 179 91 88
Intermountain: Arizona 7,243 6,582 660 6,193 5,914 279 608 243 365 442 425 16Colorado 23,050 18,710 4,341 20,943 16,933 4,011 236 154 82 1,871 1,623 248Idaho 44,070 43,177 894 40,050 39,276 774 657 589 69 3,363 3,312 51Montana 38,682 38,094 589 35,167 34,607 561 472 449 23 3,043 3,038 5Nevada 595 526 69 543 484 59 22 14 8 30 28 2New Mexico 8,023 7,180 843 7,013 6,385 628 456 262 194 554 533 21Utah 8,701 6,879 1,823 7,336 5,687 1,649 411 296 116 954 896 58Wyoming 12,380 11,822 558 10,154 9,673 481 200 140 60 2,026 2,009 17
Total 142,744 132,970 9,777 127,399 118,959 8,442 3,062 2,147 917 12,283 11,864 418
Rocky Mountain total: 148,618 135,021 13,601 131,658 120,839 10,822 4,498 2,227 2,273 12,462 11,955 506
Pacific Coast:Alaska:Alaska 34,268 31,192 3,076 31,998 29,125 2,873 1,151 977 174 1,119 1,090 29Total 34,268 31,192 3,076 31,998 29,125 2,873 1,151 977 174 1,119 1,090 29
Pacific Northwest:Oregon 87,682 80,569 7,112 83,212 76,694 6,518 934 395 538 3,536 3,480 56Washington 67,557 60,854 6,702 65,413 58,891 6,522 262 94 167 1,882 1,869 13
Total 155,239 141,423 13,814 148,625 135,585 13,040 1,194 489 705 5,418 5,349 69
Pacific Southwest:California 59,521 49,074 10,446 57,902 48,351 9,550 1,441 548 893 178 175 3Hawaii 333 4 329 280 4 276 41 0 41 12 0 12
Total 59,854 49,078 10,775 58,182 48,355 9,826 1,482 548 934 190 175 15
Pacific Coast total: 249,361 221,693 27,665 238,805 213,065 25,739 3,827 2,014 1,813 6,727 6,614 113________________________________________________________________________________________________
United States: 932,566 520,238 412,332 856,055 491,800 364,257 54,396 8,769 45,629 22,113 19,669 2,446_____________________________________________________________________________________________________________________
Note: Data may not add to totals because of rounding.
Table 17—(continued).____________________________________________________________________________________________________
All timber Growing stock Live cull Sound dead________________________ _______________________ _____________________ __________________
Region,subregion, Soft- Hard- Soft- Hard- Soft- Hard- Soft- Hard-and State Total woods woods Total woods woods Total woods woods Total woods woods_____________________________________________________________________________________________________________________
Million cubic feet
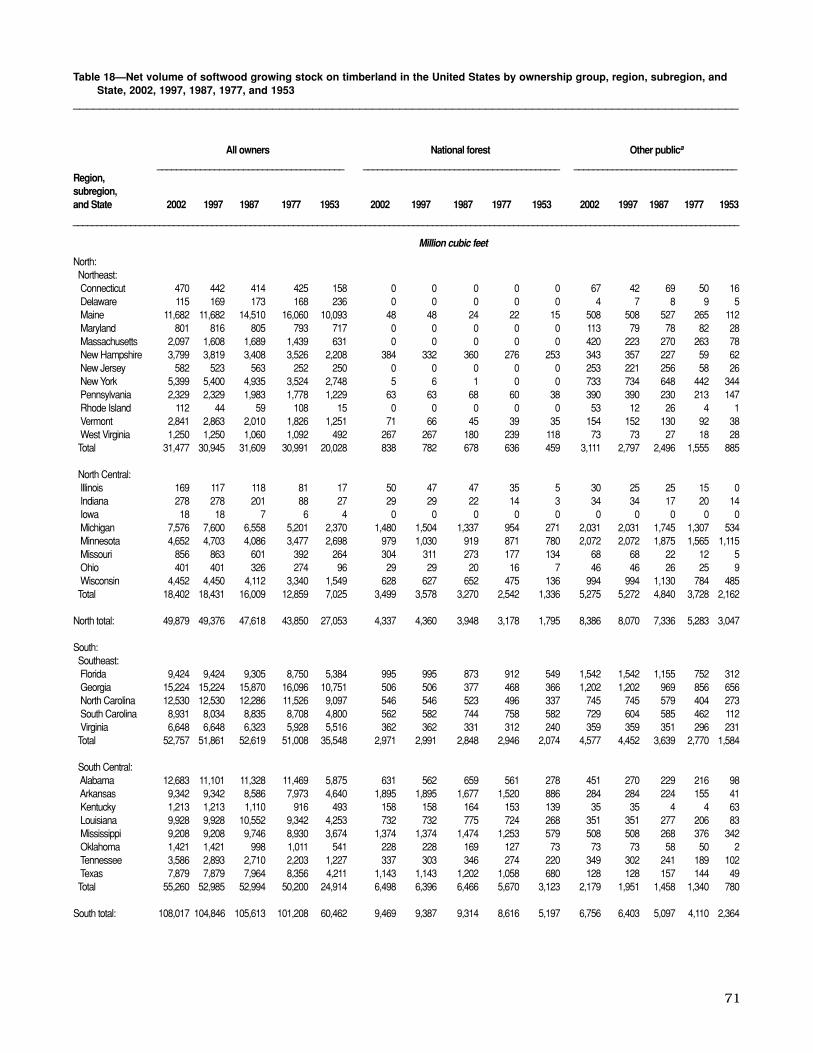
71
North:Northeast:Connecticut 470 442 414 425 158 0 0 0 0 0 67 42 69 50 16Delaware 115 169 173 168 236 0 0 0 0 0 4 7 8 9 5Maine 11,682 11,682 14,510 16,060 10,093 48 48 24 22 15 508 508 527 265 112Maryland 801 816 805 793 717 0 0 0 0 0 113 79 78 82 28Massachusetts 2,097 1,608 1,689 1,439 631 0 0 0 0 0 420 223 270 263 78New Hampshire 3,799 3,819 3,408 3,526 2,208 384 332 360 276 253 343 357 227 59 62New Jersey 582 523 563 252 250 0 0 0 0 0 253 221 256 58 26New York 5,399 5,400 4,935 3,524 2,748 5 6 1 0 0 733 734 648 442 344Pennsylvania 2,329 2,329 1,983 1,778 1,229 63 63 68 60 38 390 390 230 213 147Rhode Island 112 44 59 108 15 0 0 0 0 0 53 12 26 4 1Vermont 2,841 2,863 2,010 1,826 1,251 71 66 45 39 35 154 152 130 92 38West Virginia 1,250 1,250 1,060 1,092 492 267 267 180 239 118 73 73 27 18 28Total 31,477 30,945 31,609 30,991 20,028 838 782 678 636 459 3,111 2,797 2,496 1,555 885
North Central:Illinois 169 117 118 81 17 50 47 47 35 5 30 25 25 15 0Indiana 278 278 201 88 27 29 29 22 14 3 34 34 17 20 14Iowa 18 18 7 6 4 0 0 0 0 0 0 0 0 0 0Michigan 7,576 7,600 6,558 5,201 2,370 1,480 1,504 1,337 954 271 2,031 2,031 1,745 1,307 534Minnesota 4,652 4,703 4,086 3,477 2,698 979 1,030 919 871 780 2,072 2,072 1,875 1,565 1,115 Missouri 856 863 601 392 264 304 311 273 177 134 68 68 22 12 5Ohio 401 401 326 274 96 29 29 20 16 7 46 46 26 25 9Wisconsin 4,452 4,450 4,112 3,340 1,549 628 627 652 475 136 994 994 1,130 784 485Total 18,402 18,431 16,009 12,859 7,025 3,499 3,578 3,270 2,542 1,336 5,275 5,272 4,840 3,728 2,162
North total: 49,879 49,376 47,618 43,850 27,053 4,337 4,360 3,948 3,178 1,795 8,386 8,070 7,336 5,283 3,047
South:Southeast:Florida 9,424 9,424 9,305 8,750 5,384 995 995 873 912 549 1,542 1,542 1,155 752 312Georgia 15,224 15,224 15,870 16,096 10,751 506 506 377 468 366 1,202 1,202 969 856 656North Carolina 12,530 12,530 12,286 11,526 9,097 546 546 523 496 337 745 745 579 404 273South Carolina 8,931 8,034 8,835 8,708 4,800 562 582 744 758 582 729 604 585 462 112Virginia 6,648 6,648 6,323 5,928 5,516 362 362 331 312 240 359 359 351 296 231Total 52,757 51,861 52,619 51,008 35,548 2,971 2,991 2,848 2,946 2,074 4,577 4,452 3,639 2,770 1,584
South Central:Alabama 12,683 11,101 11,328 11,469 5,875 631 562 659 561 278 451 270 229 216 98Arkansas 9,342 9,342 8,586 7,973 4,640 1,895 1,895 1,677 1,520 886 284 284 224 155 41Kentucky 1,213 1,213 1,110 916 493 158 158 164 153 139 35 35 4 4 63Louisiana 9,928 9,928 10,552 9,342 4,253 732 732 775 724 268 351 351 277 206 83Mississippi 9,208 9,208 9,746 8,930 3,674 1,374 1,374 1,474 1,253 579 508 508 268 376 342Oklahoma 1,421 1,421 998 1,011 541 228 228 169 127 73 73 73 58 50 2Tennessee 3,586 2,893 2,710 2,203 1,227 337 303 346 274 220 349 302 241 189 102Texas 7,879 7,879 7,964 8,356 4,211 1,143 1,143 1,202 1,058 680 128 128 157 144 49Total 55,260 52,985 52,994 50,200 24,914 6,498 6,396 6,466 5,670 3,123 2,179 1,951 1,458 1,340 780
South total: 108,017 104,846 105,613 101,208 60,462 9,469 9,387 9,314 8,616 5,197 6,756 6,403 5,097 4,110 2,364
Table 18—Net volume of softwood growing stock on timberland in the United States by ownership group, region, subregion, andState, 2002, 1997, 1987, 1977, and 1953
____________________________________________________________________________________________________
All owners National forest Other publica
_______________________________________ _________________________________________ __________________________________Region, subregion, and State 2002 1997 1987 1977 1953 2002 1997 1987 1977 1953 2002 1997 1987 1977 1953
___________________________________________________________________________________________________________________________________________
Million cubic feet
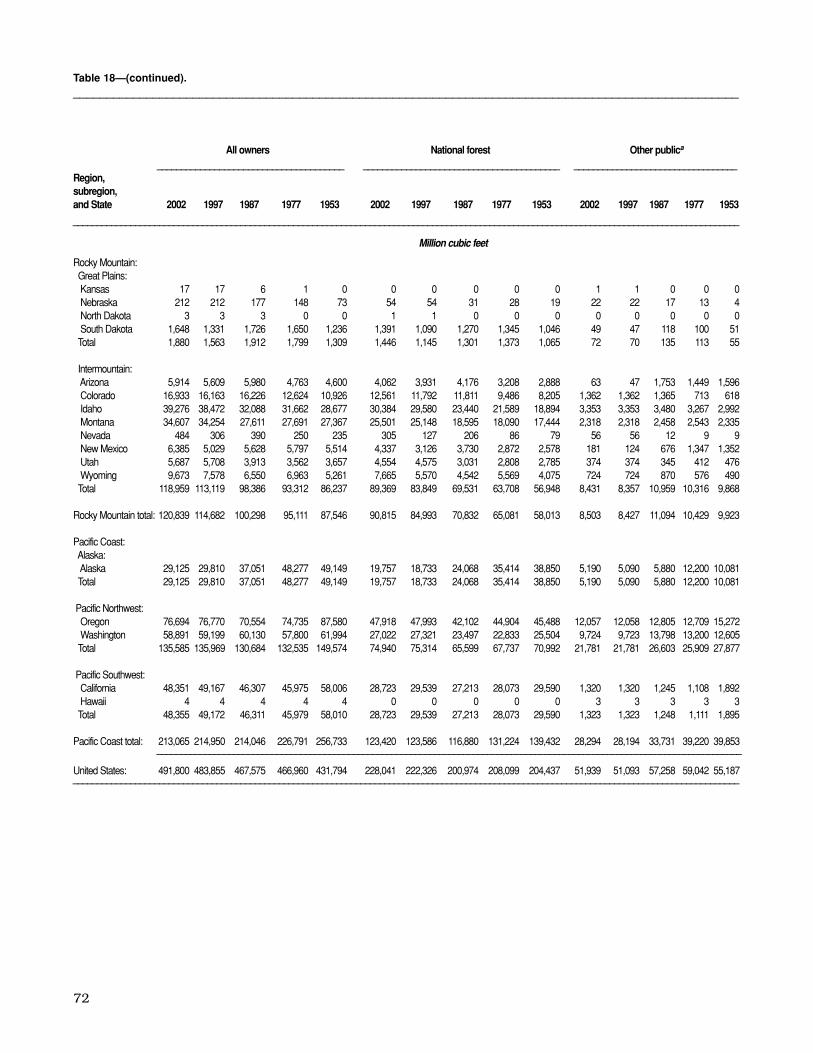
72
Rocky Mountain:Great Plains:Kansas 17 17 6 1 0 0 0 0 0 0 1 1 0 0 0Nebraska 212 212 177 148 73 54 54 31 28 19 22 22 17 13 4North Dakota 3 3 3 0 0 1 1 0 0 0 0 0 0 0 0South Dakota 1,648 1,331 1,726 1,650 1,236 1,391 1,090 1,270 1,345 1,046 49 47 118 100 51Total 1,880 1,563 1,912 1,799 1,309 1,446 1,145 1,301 1,373 1,065 72 70 135 113 55
Intermountain:Arizona 5,914 5,609 5,980 4,763 4,600 4,062 3,931 4,176 3,208 2,888 63 47 1,753 1,449 1,596 Colorado 16,933 16,163 16,226 12,624 10,926 12,561 11,792 11,811 9,486 8,205 1,362 1,362 1,365 713 618Idaho 39,276 38,472 32,088 31,662 28,677 30,384 29,580 23,440 21,589 18,894 3,353 3,353 3,480 3,267 2,992 Montana 34,607 34,254 27,611 27,691 27,367 25,501 25,148 18,595 18,090 17,444 2,318 2,318 2,458 2,543 2,335 Nevada 484 306 390 250 235 305 127 206 86 79 56 56 12 9 9New Mexico 6,385 5,029 5,628 5,797 5,514 4,337 3,126 3,730 2,872 2,578 181 124 676 1,347 1,352 Utah 5,687 5,708 3,913 3,562 3,657 4,554 4,575 3,031 2,808 2,785 374 374 345 412 476Wyoming 9,673 7,578 6,550 6,963 5,261 7,665 5,570 4,542 5,569 4,075 724 724 870 576 490Total 118,959 113,119 98,386 93,312 86,237 89,369 83,849 69,531 63,708 56,948 8,431 8,357 10,959 10,316 9,868
Rocky Mountain total: 120,839 114,682 100,298 95,111 87,546 90,815 84,993 70,832 65,081 58,013 8,503 8,427 11,094 10,429 9,923
Pacific Coast:Alaska:Alaska 29,125 29,810 37,051 48,277 49,149 19,757 18,733 24,068 35,414 38,850 5,190 5,090 5,880 12,200 10,081 Total 29,125 29,810 37,051 48,277 49,149 19,757 18,733 24,068 35,414 38,850 5,190 5,090 5,880 12,200 10,081
Pacific Northwest:Oregon 76,694 76,770 70,554 74,735 87,580 47,918 47,993 42,102 44,904 45,488 12,057 12,058 12,805 12,709 15,272 Washington 58,891 59,199 60,130 57,800 61,994 27,022 27,321 23,497 22,833 25,504 9,724 9,723 13,798 13,200 12,605 Total 135,585 135,969 130,684 132,535 149,574 74,940 75,314 65,599 67,737 70,992 21,781 21,781 26,603 25,909 27,877
Pacific Southwest:California 48,351 49,167 46,307 45,975 58,006 28,723 29,539 27,213 28,073 29,590 1,320 1,320 1,245 1,108 1,892 Hawaii 4 4 4 4 4 0 0 0 0 0 3 3 3 3 3Total 48,355 49,172 46,311 45,979 58,010 28,723 29,539 27,213 28,073 29,590 1,323 1,323 1,248 1,111 1,895
Pacific Coast total: 213,065 214,950 214,046 226,791 256,733 123,420 123,586 116,880 131,224 139,432 28,294 28,194 33,731 39,220 39,853__________________________________________________________________________________________________________________________
United States: 491,800 483,855 467,575 466,960 431,794 228,041 222,326 200,974 208,099 204,437 51,939 51,093 57,258 59,042 55,187___________________________________________________________________________________________________________________________________________
Table 18—(continued).____________________________________________________________________________________________________
All owners National forest Other publica
_______________________________________ _________________________________________ __________________________________Region, subregion, and State 2002 1997 1987 1977 1953 2002 1997 1987 1977 1953 2002 1997 1987 1977 1953
___________________________________________________________________________________________________________________________________________
Million cubic feet

73
Table 18—(continued)._________________________________________________________________________
North:Northeast:Connecticut 0 0 0 0 0 403 399 345 375 142Delaware 24 18 18 28 14 87 144 147 131 217Maine 4,771 4,771 7,849 9,120 4,194 6,356 6,356 6,110 6,653 5,772 Maryland 59 80 79 91 64 629 657 648 620 625Massachusetts 10 86 64 24 52 1,668 1,299 1,355 1,152 501New Hampshire 253 269 433 800 371 2,818 2,862 2,388 2,391 1,522 New Jersey 0 0 0 0 1 329 302 307 194 223New York 355 355 403 382 298 4,307 4,304 3,883 2,700 2,106 Pennsylvania 82 82 91 71 49 1,794 1,794 1,594 1,434 995Rhode Island 0 0 0 0 0 59 32 33 104 14Vermont 99 73 128 212 184 2,517 2,572 1,707 1,483 994West Virginia 69 69 126 96 19 842 842 727 739 327Total 5,722 5,803 9,191 10,824 5,246 21,809 21,563 19,244 17,976 13,438
North Central:Illinois 0 0 0 1 1 89 46 46 30 11Indiana 0 0 0 1 0 214 214 162 53 10Iowa 0 0 0 0 0 18 18 7 6 4Michigan 764 764 885 808 563 3,301 3,301 2,591 2,132 1,002 Minnesota 302 302 336 265 232 1,298 1,298 956 776 571Missouri 36 36 21 21 7 448 448 285 182 118Ohio 24 24 2 4 4 301 301 278 229 76Wisconsin 300 300 409 590 110 2,529 2,529 1,921 1,491 818Total 1,426 1,426 1,653 1,690 917 8,198 8,155 6,246 4,899 2,610
North total: 7,148 7,229 10,844 12,514 6,163 30,007 29,718 25,490 22,875 16,048
South:Southeast:Florida 2,311 2,311 2,687 2,789 1,689 4,576 4,576 4,590 4,297 2,834 Georgia 3,227 3,227 3,443 2,836 2,031 10,289 10,289 11,081 11,936 7,698 North Carolina 1,884 1,884 1,646 1,157 1,546 9,356 9,356 9,538 9,469 6,941 South Carolina 1,737 1,672 1,774 1,417 700 5,903 5,175 5,732 6,071 3,406 Virginia 1,136 1,136 1,167 943 837 4,791 4,791 4,474 4,377 4,208 Total 10,295 10,231 10,717 9,142 6,803 34,915 34,187 35,415 36,150 25,087
South Central:Alabama 2,355 2,999 2,802 2,883 1,634 9,247 7,271 7,638 7,809 3,865 Arkansas 3,472 3,472 3,191 3,120 2,372 3,691 3,691 3,494 3,178 1,341 Kentucky 12 12 6 6 10 1,008 1,008 936 753 281Louisiana 2,855 2,855 2,779 2,725 1,952 5,990 5,990 6,721 5,687 1,950 Mississippi 1,892 1,892 1,822 1,726 1,454 5,436 5,436 6,182 5,575 1,299 Oklahoma 574 574 350 517 359 546 546 421 317 107Tennessee 558 302 289 232 74 2,342 1,985 1,834 1,508 831Texas 2,126 2,126 2,276 3,221 1,883 4,481 4,481 4,329 3,933 1,599 Total 13,844 14,231 13,515 14,430 9,738 32,741 30,408 31,555 28,760 11,273
South total: 24,139 24,462 24,232 23,572 16,541 67,656 64,594 66,970 64,910 36,360
Forest Industry Nonindustrial privatea
________________________________________ _______________________________________Region, subregion, and State 2002 1997 1987 1977 1953 2002 1997 1987 1977 1953
______________________________________________________________________________________________________
Million cubic feet

74
Table 18—(continued)._________________________________________________________________________
Rocky Mountain:Great Plains:Kansas 0 0 0 0 0 16 16 6 1 0Nebraska 0 0 0 0 0 135 135 129 107 50North Dakota 0 0 0 0 0 2 2 3 0 0South Dakota 0 0 12 19 8 208 194 326 186 131Total 0 0 12 19 8 361 348 464 294 181
Intermountain:Arizona 0 0 0 0 0 1,790 1,631 51 106 116Colorado 0 0 0 21 19 3,010 3,010 3,050 2,404 2,084 Idaho 2,593 2,593 2,312 2,913 3,438 2,947 2,947 2,856 3,893 3,353 Montana 2,157 2,157 2,963 2,097 3,104 4,632 4,632 3,595 4,961 4,484 Nevada 23 23 0 16 15 100 100 172 139 132New Mexico 0 0 3 0 113 1,866 1,779 1,219 1,578 1,471 Utah 0 0 0 0 0 759 759 537 342 396Wyoming 0 0 53 61 52 1,284 1,284 1,085 757 644Total 4,773 4,773 5,331 5,108 6,741 16,388 16,141 12,565 14,180 12,680
Rocky Mountain total: 4,773 4,773 5,343 5,127 6,749 16,749 16,489 13,029 14,474 12,861
Pacific Coast:Alaska:Alaska 0 0 0 0 0 4,177 5,987 7,103 663 218Total 0 0 0 0 0 4,177 5,987 7,103 663 218
Pacific Northwest:Oregon 9,673 9,673 10,011 12,110 19,060 7,046 7,046 5,636 5,012 7,760 Washington 11,532 11,532 14,404 13,717 17,640 10,613 10,611 8,431 8,050 6,245 Total 21,205 21,205 24,415 25,827 36,700 17,659 17,657 14,067 13,062 14,005
Pacific Southwest:California 8,592 8,592 7,918 7,457 11,268 9,716 9,716 9,931 9,337 15,256 Hawaii 0 0 0 0 0 1 1 1 1 1Total 8,592 8,592 7,918 7,457 11,268 9,717 9,717 9,932 9,338 15,257
Pacific Coast total: 29,797 29,797 32,333 33,284 47,968 31,553 33,361 31,102 23,063 29,480____________________________________________________________________________________
United States: 65,857 66,262 72,752 74,497 77,421 145,965 144,162 136,591 125,322 94,749 _____________________________________________________________________________________________________
a Native American lands have been exclusively in the nonindustrial private owner group since 1997. For 1987 and earlieryears, these lands may be included in the other public owner group.
Note: Data may not add to totals because of rounding.
Forest Industry Nonindustrial privatea
________________________________________ _______________________________________Region, subregion, and State 2002 1997 1987 1977 1953 2002 1997 1987 1977 1953
_________________________________________________________________________________Million cubic feet

75
North:Northeast2002 123,667 31,476 0 658 1,653 9,823 14 9,178 7,164 6 2,980 1997 121,179 30,945 0 652 1,717 9,460 14 9,184 6,949 3 2,965 1987 112,133 31,609 0 658 1,573 7,977 0 12,977 5,878 0 2,547 1977 98,311 30,991 0 656 1,368 7,123 0 14,895 5,006 0 1,943 1963 76,869 24,034 0 701 1,119 4,958 46 11,042 4,113 0 2,056
North Central2002 93,957 18,402 0 734 374 5,608 1,547 4,557 1,079 21 4,481 1997 93,072 18,431 0 737 373 5,597 1,550 4,579 1,082 22 4,491 1987 77,905 16,009 0 561 158 4,396 1,646 4,711 876 31 3,630 1977 64,697 12,859 0 402 214 2,411 1,851 4,038 1,260 31 2,652 1963 51,419 9,627 0 307 110 1,794 1,520 2,954 1,040 15 1,888
North total:2002 217,625 49,878 0 1,393 2,027 15,431 1,561 13,735 8,244 27 7,461 1997 214,251 49,376 0 1,390 2,090 15,058 1,564 13,763 8,031 25 7,456 1987 190,038 47,618 0 1,219 1,731 12,373 1,646 17,688 6,753 31 6,178 1977 163,008 43,850 0 1,058 1,582 9,534 1,851 18,934 6,265 31 4,596 1963 128,288 33,661 0 1,008 1,229 6,752 1,566 13,995 5,153 15 3,944
South:Southeast2002 124,001 52,758 10,888 28,242 6,799 1,725 0 24 402 4,205 4731997 122,985 51,861 11,044 27,248 6,855 1,733 0 24 413 4,066 4781987 120,773 52,619 12,598 26,441 6,989 1,457 0 24 396 4,306 4081977 111,699 51,008 12,284 25,910 6,897 1,068 0 25 324 4,101 4001963 87,172 40,174 9,477 21,877 4,121 480 0 33 242 3,677 267
South Central2002 143,964 55,260 4,799 43,639 2,646 411 0 0 285 2,421 1,061 1997 133,377 52,985 4,886 41,517 2,774 281 0 0 213 2,317 9971987 123,868 52,994 5,039 42,006 2,670 207 0 1 115 2,225 7321977 111,674 50,200 5,114 40,108 2,375 185 0 0 67 1,829 5221963 86,900 34,913 3,806 27,874 1,341 146 0 0 182 1,332 231
South total:2002 267,965 108,018 15,687 71,881 9,445 2,136 0 24 686 6,626 1,533 1997 256,361 104,846 15,931 68,765 9,629 2,014 0 24 626 6,382 1,475 1987 244,641 105,613 17,638 68,447 9,659 1,663 0 25 511 6,530 1,140 1977 223,373 101,208 17,398 66,018 9,272 1,253 0 25 391 5,929 9221963 174,072 75,087 13,284 49,751 5,462 626 0 33 424 5,009 498
East total:2002 485,590 157,896 15,687 73,274 11,472 17,567 1,561 13,759 8,930 6,653 8,994 1997 470,612 154,222 15,931 70,154 11,719 17,072 1,564 13,787 8,657 6,408 8,931 1987 434,679 153,231 17,638 69,666 11,390 14,037 1,646 17,713 7,264 6,561 7,317 1977 386,381 145,058 17,398 67,076 10,854 10,787 1,851 18,958 6,657 5,960 5,518 1963 302,360 108,748 13,284 50,759 6,691 7,378 1,566 14,028 5,577 5,023 4,442
___________________________________________________________________________________________________________________________
Table 19—Net volume of growing stock on timberland in the Eastern United States by species, region, andsubregion, 2002, 1997, 1987, 1977, and 1963
____________________________________________________________________________________________________
Softwoods____________________________________________________________________________________________
Region and Total Total Longleaf Loblolly Other White Spruce Othersubregion all soft- and slash and shortleaf yellow and red Jack and Eastern soft-(year) species woods pines pines pines pines pine balsam fir hemlock Cypress woods____________________________________________________________________________________________________________________________
Million cubic feet

76
North:Northeast2002 92,191 4,521 8,605 4,227 5,124 2,927 3,129 11,659 17,265 5,542 1997 90,234 4,437 8,625 4,271 4,932 2,846 3,062 11,533 16,741 5,466 1987 80,524 4,384 8,137 4,928 5,405 2,791 2,987 10,104 13,544 4,685 1977 67,320 4,721 7,616 4,589 4,890 2,563 2,452 7,755 10,645 3,807 1963 52,835 3,402 6,536 3,709 2,550 1,810 3,791 5,883 6,515 3,973
North Central2002 75,555 7,643 6,038 1,476 5,832 3,694 783 8,388 7,832 1,125 1997 74,640 7,550 5,983 1,474 5,682 3,572 786 8,369 7,662 1,122 1987 61,896 6,001 4,774 1,528 5,077 2,912 674 6,335 5,542 8541977 51,838 5,277 4,006 1,365 4,579 2,605 807 4,814 3,302 8961963 41,792 3,730 3,373 405 2,340 1,449 872 4,025 2,572 835
North total:2002 167,746 12,165 14,643 5,703 10,956 6,621 3,912 20,047 25,097 6,667 1997 164,874 11,987 14,608 5,745 10,615 6,417 3,848 19,902 24,403 6,588 1987 142,420 10,385 12,911 6,456 10,482 5,703 3,661 16,439 19,086 5,538 1977 119,158 9,121 12,186 5,788 7,991 4,401 3,719 12,972 14,985 5,278 1963 94,627 6,093 11,705 6,642 4,567 3,241 6,790 10,536 11,668 7,115
South:Southeast2002 71,244 7,177 3,157 5,919 12,367 3,642 83 464 5,565 1,016 1997 71,124 7,167 3,126 6,008 12,307 3,593 83 467 5,712 1,000 1987 68,154 6,639 3,074 5,563 11,826 3,641 62 402 5,221 9421977 60,691 6,152 2,650 5,009 10,841 3,680 61 299 3,845 8051963 46,998 4,753 1,966 3,886 7,837 3,314 39 158 2,555 561
South Central2002 88,703 10,102 5,000 8,010 17,194 8,257 14 1,595 2,699 1,579 1997 80,392 9,194 4,620 7,186 15,900 7,625 5 1,411 2,283 1,458 1987 70,874 7,974 3,969 6,722 15,062 7,254 6 933 1,719 1,193 1977 61,474 6,623 3,071 6,362 12,584 6,816 0 758 1,319 1,054 1963 51,987 5,262 2,053 5,607 9,652 5,799 11 428 898 1,116
South total:2002 159,947 17,279 8,157 13,930 29,561 11,899 97 2,059 8,264 2,594 1997 151,516 16,361 7,746 13,194 28,207 11,218 87 1,878 7,996 2,458 1987 139,028 14,613 7,043 12,285 26,889 10,895 68 1,335 6,940 2,135 1977 122,165 12,769 5,715 11,353 23,402 10,451 62 1,051 5,201 1,856 1963 98,985 10,015 4,021 9,467 17,469 9,069 51 580 3,492 1,667
East total:2002 327,693 29,444 22,800 19,632 40,517 18,520 4,008 22,107 33,362 9,262 1997 316,390 28,348 22,354 18,939 38,821 17,635 3,936 21,780 32,399 9,047 1987 281,448 24,998 19,955 18,741 37,370 16,598 3,730 17,774 26,026 7,673 1977 241,323 22,230 17,227 17,679 32,904 15,442 3,409 12,806 19,176 6,781 1963 193,612 17,154 13,364 16,832 25,683 13,941 4,815 8,117 12,657 7,123
_________________________________________________________________________________________________________________
Table 19—(continued).____________________________________________________________________________________________
Hardwoods ____________________________________________________________________________________________
Region and Total Select Select Other Othersubregion hard- white red white red Yellow Hard Soft(year) woods oaks oaks oaks oaks Hickory birch maple maple Beech_________________________________________________________________________________________________________________
Million cubic feet

77
Table 19—(continued)._____________________________________________________________________________________
Hardwoods ____________________________________________________________________________________
Region and Tupelo Cotton- Othersubregion Sweet- and Bass- Yellow wood Black Black hard-(year) gum black gum Ash wood poplar and aspen walnut cherrya woods_________________________________________________________________________________________________________
Million cubic feet
North:Northeast2002 670 595 4,762 1,489 5,039 3,651 282 4,795 7,908 1997 556 588 4,748 1,476 4,740 3,611 295 4,683 7,623 1987 486 491 3,656 1,162 2,925 3,219 211 3,738 7,671 1977 418 409 2,656 1,073 2,630 2,145 192 3,000 5,760 1963 460 333 1,898 1,221 1,968 1,719 154 0 6,915
North Central2002 178 194 4,842 3,104 1,716 12,095 843 1,657 8,114 1997 148 199 4,798 3,098 1,686 12,061 804 1,639 8,007 1987 122 79 3,657 2,476 1,073 10,521 612 1,144 8,516 1977 153 89 2,818 1,861 641 9,669 459 530 7,967 1963 168 63 2,127 1,505 441 8,807 340 0 8,740
North total:2002 848 789 9,604 4,593 6,755 15,746 1,125 6,453 16,023 1997 704 787 9,546 4,574 6,426 15,672 1,099 6,322 15,631 1987 608 570 7,313 3,639 3,998 13,740 823 4,881 16,187 1977 653 541 5,158 2,700 3,516 10,938 551 3,530 15,129 1963 824 596 3,400 2,187 3,524 3,079 275 0 12,385
South:Southeast2002 7,760 7,155 1,728 330 9,531 86 194 320 4,749 1997 7,573 7,248 1,752 334 9,538 92 197 311 4,618 1987 7,487 7,854 1,735 314 8,392 107 181 222 4,491 1977 6,850 7,462 1,492 259 6,732 117 138 155 4,143 1963 5,582 7,106 1,348 247 3,845 53 160 0 3,588
South Central2002 9,780 4,362 3,024 322 6,462 641 414 544 8,706 1997 9,058 4,106 2,689 275 5,283 621 362 452 7,862 1987 8,244 3,962 2,219 257 3,845 580 281 0 6,653 1977 6,826 3,921 1,967 246 2,847 504 271 195 6,110 1963 6,059 4,057 1,757 277 1,823 469 296 0 6,423
South total:2002 17,540 11,516 4,752 652 15,993 727 608 864 13,455 1997 16,631 11,354 4,441 609 14,821 713 559 763 12,480 1987 15,732 11,816 3,954 571 12,237 687 462 222 11,144 1977 13,678 11,436 3,452 506 9,637 616 407 349 10,225 1963 11,644 11,240 3,100 524 5,718 514 453 0 9,960
East total:2002 18,388 12,305 14,356 5,245 22,748 16,472 1,733 7,317 29,478 1997 17,336 12,141 13,987 5,183 21,247 16,384 1,658 7,085 28,111 1987 16,339 12,387 11,267 4,210 16,235 14,427 1,286 5,103 27,331 1977 15,623 13,058 8,428 2,981 13,752 10,501 942 3,555 24,829 1963 15,565 14,886 6,369 2,204 9,826 2,815 775 0 21,485
_____________________________________________________________________________________
a Separate black cherry data not available for 1963, included in other hardwoods category.
Note: Data may not add to totals because of rounding.

78
Great Plains:
Kansas 1,254 17 0 0 0 0 0 0 0 0Nebraska 856 212 0 0 0 0 0 0 0 0North Dakota 330 3 0 0 0 0 0 0 0 0South Dakota 1,819 1,648 0 1,278 0 0 0 0 0 0
Total 4,259 1,880 0 1,278 0 0 0 0 0 0
Intermountain:Arizona 6,193 5,914 612 4,580 321 0 0 0 0 0Colorado 20,943 16,933 2,173 2,113 2,642 0 0 0 0 0Idaho 40,050 39,276 12,427 2,603 9,374 896 0 447 0 0Montana 35,167 34,607 10,706 2,843 3,540 195 0 108 0 0Nevada 543 484 28 141 182 0 0 8 0 0New Mexico 7,013 6,385 1,538 2,934 971 0 0 0 0 0Utah 7,336 5,687 1,429 453 1,481 0 0 0 0 0Wyoming 10,153 9,673 1,424 1,159 1,369 0 0 0 0 0
Total 127,399 118,957 30,336 16,827 19,879 1,091 0 562 0 0
Alaska:Alaska 31,998 29,124 0 0 6 11,224 0 0 0 8,641 Total 31,998 29,124 0 0 6 11,224 0 0 0 8,641
Pacific Northwest:Oregon 83,222 76,701 44,050 8,154 8,856 6,384 681 244 32 274Washington 65,412 58,890 25,405 3,409 7,405 13,388 0 129 0 54
Total 148,635 135,591 69,454 11,563 16,261 19,772 681 372 32 328
Pacific Southwest:California 57,902 48,351 14,491 8,962 12,687 31 2,691 293 4,599 0Hawaii 280 4 0 0 0 0 0 0 0 0
Total 58,182 48,355 14,491 8,962 12,687 31 2,691 293 4,599 0________________________________________________________________________________
West total: 370,472 333,907 114,281 38,630 48,832 32,118 3,373 1,227 4,631 8,969_______________________________________________________________________________________________________________________
Table 20—Net volume of growing stock on timberland in the Western United States by species, subregion, andState, 2002
________________________________________________________________________________________________
Softwoods_______________________________________________________________________________________
Total Ponderosa WesternSubregion All soft- Douglas- and Jeffrey True Western Sugar white Sitkaand State species woods fir pines fir hemlock pine pine Redwood spruce_______________________________________________________________________________________________________________________
Million cubic feet

79
Great Plains: Kansas 0 0 0 0 0 17 1,238 0 0 0 1,238 Nebraska 0 0 0 0 0 212 645 0 0 0 645North Dakota 0 0 0 0 0 3 327 0 0 0 327South Dakota 92 0 0 0 0 278 171 14 0 1 155
Total 92 0 0 0 0 510 2,380 14 0 1 2,364
Intermountain:Arizona 313 0 0 0 0 88 279 279 0 0 0Colorado 5,995 0 0 3,891 0 119 4,011 4,011 0 0 0Idaho 2,559 1,490 0 5,780 2,365 1,335 774 600 0 0 174Montana 3,494 2,258 0 9,786 336 1,341 561 486 0 0 75Nevada 42 0 4 57 0 21 59 59 0 0 0New Mexico 713 0 0 0 0 229 628 628 0 0 0Utah 1,527 0 0 706 0 91 1,649 1,649 0 0 0Wyoming 1,981 0 0 3,003 0 737 481 477 0 1 2
Total 16,623 3,748 4 23,224 2,701 3,961 8,442 8,190 0 1 251
Alaska:Alaska 4,287 3 0 81 1,213 3,671 2,873 843 73 0 1,957 Total 4,287 3 0 81 1,213 3,671 2,873 843 73 0 1,957
Pacific Northwest:Oregon 1,252 785 723 2,227 1,502 1,537 6,521 94 3,182 451 2,794 Washington 1,565 1,451 0 1,774 3,531 780 6,523 645 4,353 28 1,496
Total 2,817 2,236 723 4,001 5,034 2,317 13,044 739 7,536 479 4,289
Pacific Southwest:California 37 0 2,884 1,195 1 481 9,550 71 230 4,932 4,318 Hawaii 0 0 0 0 0 4 276 0 0 0 276
Total 37 0 2,884 1,195 1 485 9,826 71 230 4,932 4,594___________________________________________________________________________________
West total: 23,856 5,987 3,611 28,501 8,949 10,943 36,565 9,857 7,839 5,414 13,456 ____________________________________________________________________________________________________
a Western redcedar volume may be included in other western softwood volume. Western redcedar volume in Oregon for national forestlands includes some incense-cedar.
Note: Data may not add to totals because of rounding. Total volume by State in this table may differ slightly from volume by State in othertables because of rounding.
Table 20—(continued).____________________________________________________________________________________________________
Softwoods - continued Hardwoods__________________________________________________________ ___________________________________________
Englemann Western Other Total Cottonwood OtherSubregion and other Western Incense- Lodgepole red- soft- hard- and Red hard-and State spruces larch cedar pine cedara woods woods aspen alder Oak woods____________________________________________________________________________________________________________________________
Million cubic feet
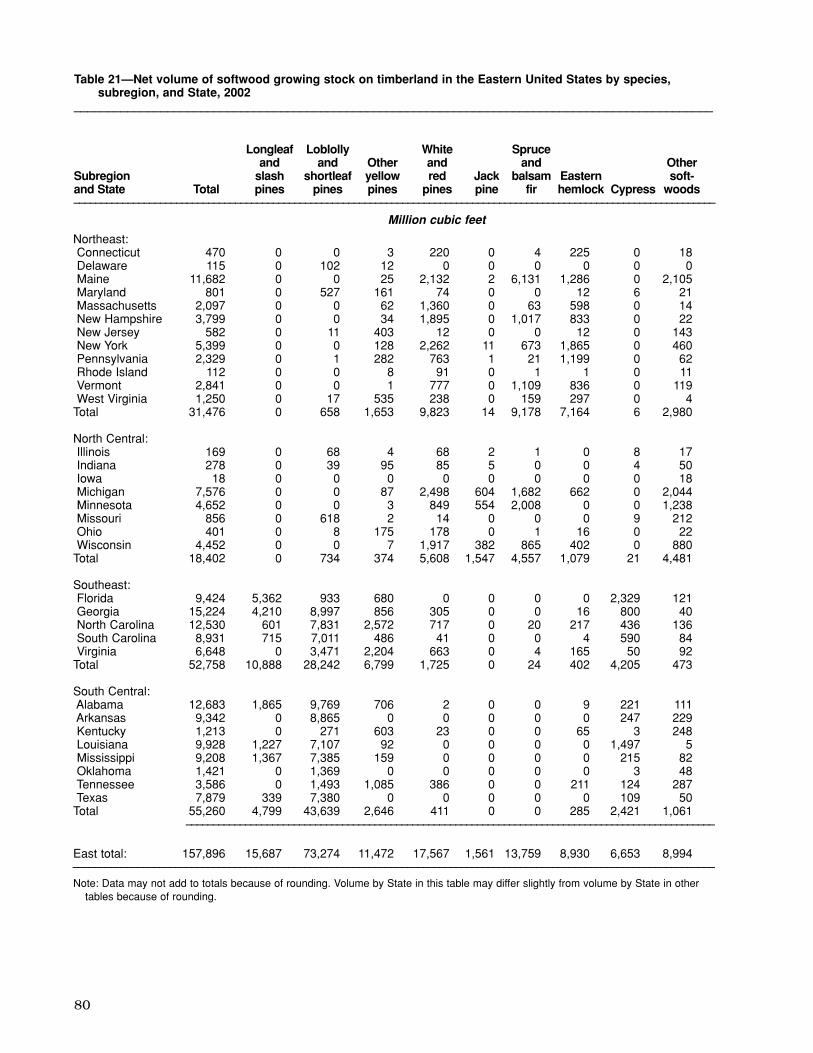
80
Northeast: Connecticut 470 0 0 3 220 0 4 225 0 18Delaware 115 0 102 12 0 0 0 0 0 0Maine 11,682 0 0 25 2,132 2 6,131 1,286 0 2,105 Maryland 801 0 527 161 74 0 0 12 6 21Massachusetts 2,097 0 0 62 1,360 0 63 598 0 14New Hampshire 3,799 0 0 34 1,895 0 1,017 833 0 22New Jersey 582 0 11 403 12 0 0 12 0 143New York 5,399 0 0 128 2,262 11 673 1,865 0 460Pennsylvania 2,329 0 1 282 763 1 21 1,199 0 62Rhode Island 112 0 0 8 91 0 1 1 0 11Vermont 2,841 0 0 1 777 0 1,109 836 0 119West Virginia 1,250 0 17 535 238 0 159 297 0 4
Total 31,476 0 658 1,653 9,823 14 9,178 7,164 6 2,980
North Central: Illinois 169 0 68 4 68 2 1 0 8 17Indiana 278 0 39 95 85 5 0 0 4 50Iowa 18 0 0 0 0 0 0 0 0 18Michigan 7,576 0 0 87 2,498 604 1,682 662 0 2,044 Minnesota 4,652 0 0 3 849 554 2,008 0 0 1,238 Missouri 856 0 618 2 14 0 0 0 9 212Ohio 401 0 8 175 178 0 1 16 0 22Wisconsin 4,452 0 0 7 1,917 382 865 402 0 880
Total 18,402 0 734 374 5,608 1,547 4,557 1,079 21 4,481
Southeast: Florida 9,424 5,362 933 680 0 0 0 0 2,329 121Georgia 15,224 4,210 8,997 856 305 0 0 16 800 40North Carolina 12,530 601 7,831 2,572 717 0 20 217 436 136South Carolina 8,931 715 7,011 486 41 0 0 4 590 84Virginia 6,648 0 3,471 2,204 663 0 4 165 50 92
Total 52,758 10,888 28,242 6,799 1,725 0 24 402 4,205 473
South Central: Alabama 12,683 1,865 9,769 706 2 0 0 9 221 111Arkansas 9,342 0 8,865 0 0 0 0 0 247 229Kentucky 1,213 0 271 603 23 0 0 65 3 248Louisiana 9,928 1,227 7,107 92 0 0 0 0 1,497 5Mississippi 9,208 1,367 7,385 159 0 0 0 0 215 82Oklahoma 1,421 0 1,369 0 0 0 0 0 3 48Tennessee 3,586 0 1,493 1,085 386 0 0 211 124 287Texas 7,879 339 7,380 0 0 0 0 0 109 50
Total 55,260 4,799 43,639 2,646 411 0 0 285 2,421 1,061 __________________________________________________________________________________________________
East total: 157,896 15,687 73,274 11,472 17,567 1,561 13,759 8,930 6,653 8,994_______________________________________________________________________________________________________________________
Note: Data may not add to totals because of rounding. Volume by State in this table may differ slightly from volume by State in othertables because of rounding.
Table 21—Net volume of softwood growing stock on timberland in the Eastern United States by species,subregion, and State, 2002
________________________________________________________________________________________________
Longleaf Loblolly White Spruceand and Other and and Other
Subregion slash shortleaf yellow red Jack balsam Eastern soft-and State Total pines pines pines pines pine fir hemlock Cypress woods_______________________________________________________________________________________________________________________
Million cubic feet
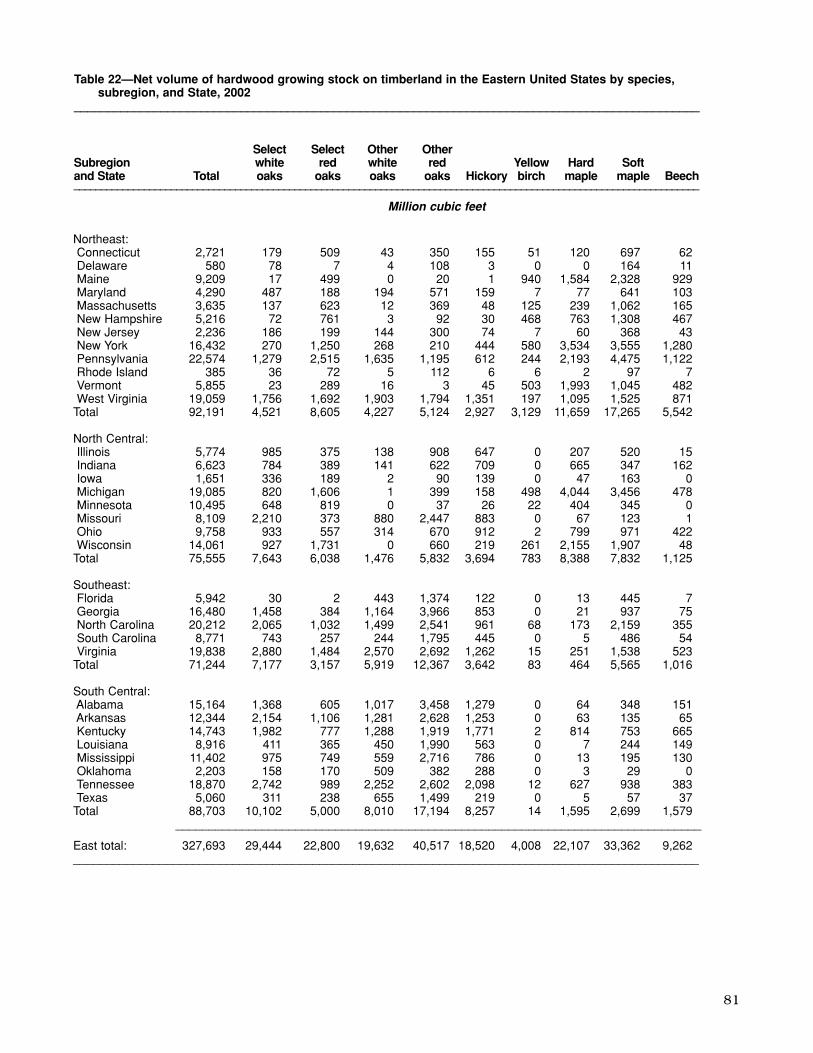
81
Northeast: Connecticut 2,721 179 509 43 350 155 51 120 697 62Delaware 580 78 7 4 108 3 0 0 164 11Maine 9,209 17 499 0 20 1 940 1,584 2,328 929Maryland 4,290 487 188 194 571 159 7 77 641 103Massachusetts 3,635 137 623 12 369 48 125 239 1,062 165New Hampshire 5,216 72 761 3 92 30 468 763 1,308 467New Jersey 2,236 186 199 144 300 74 7 60 368 43New York 16,432 270 1,250 268 210 444 580 3,534 3,555 1,280 Pennsylvania 22,574 1,279 2,515 1,635 1,195 612 244 2,193 4,475 1,122 Rhode Island 385 36 72 5 112 6 6 2 97 7Vermont 5,855 23 289 16 3 45 503 1,993 1,045 482West Virginia 19,059 1,756 1,692 1,903 1,794 1,351 197 1,095 1,525 871
Total 92,191 4,521 8,605 4,227 5,124 2,927 3,129 11,659 17,265 5,542
North Central: Illinois 5,774 985 375 138 908 647 0 207 520 15Indiana 6,623 784 389 141 622 709 0 665 347 162Iowa 1,651 336 189 2 90 139 0 47 163 0Michigan 19,085 820 1,606 1 399 158 498 4,044 3,456 478Minnesota 10,495 648 819 0 37 26 22 404 345 0Missouri 8,109 2,210 373 880 2,447 883 0 67 123 1Ohio 9,758 933 557 314 670 912 2 799 971 422Wisconsin 14,061 927 1,731 0 660 219 261 2,155 1,907 48
Total 75,555 7,643 6,038 1,476 5,832 3,694 783 8,388 7,832 1,125
Southeast: Florida 5,942 30 2 443 1,374 122 0 13 445 7Georgia 16,480 1,458 384 1,164 3,966 853 0 21 937 75North Carolina 20,212 2,065 1,032 1,499 2,541 961 68 173 2,159 355South Carolina 8,771 743 257 244 1,795 445 0 5 486 54Virginia 19,838 2,880 1,484 2,570 2,692 1,262 15 251 1,538 523
Total 71,244 7,177 3,157 5,919 12,367 3,642 83 464 5,565 1,016
South Central: Alabama 15,164 1,368 605 1,017 3,458 1,279 0 64 348 151Arkansas 12,344 2,154 1,106 1,281 2,628 1,253 0 63 135 65Kentucky 14,743 1,982 777 1,288 1,919 1,771 2 814 753 665Louisiana 8,916 411 365 450 1,990 563 0 7 244 149Mississippi 11,402 975 749 559 2,716 786 0 13 195 130Oklahoma 2,203 158 170 509 382 288 0 3 29 0Tennessee 18,870 2,742 989 2,252 2,602 2,098 12 627 938 383Texas 5,060 311 238 655 1,499 219 0 5 57 37
Total 88,703 10,102 5,000 8,010 17,194 8,257 14 1,595 2,699 1,579_______________________________________________________________________________
East total: 327,693 29,444 22,800 19,632 40,517 18,520 4,008 22,107 33,362 9,262 ______________________________________________________________________________________________
Table 22—Net volume of hardwood growing stock on timberland in the Eastern United States by species,subregion, and State, 2002
______________________________________________________________________________________________
Select Select Other OtherSubregion white red white red Yellow Hard Softand State Total oaks oaks oaks oaks Hickory birch maple maple Beech____________________________________________________________________________________________________________________
Million cubic feet

82
Table 22—(continued).______________________________________________________________________________________
Tupelo Cotton-and wood Other
Subregion black Bass- Yellow- and Black Black hard-and State Sweetgum gum Ash wood poplar aspen walnut cherry woods___________________________________________________________________________________________________________
Million cubic feet
Northeast: Connecticut 0 8 136 3 41 23 0 54 290Delaware 88 30 8 0 46 2 1 7 22Maine 0 0 402 34 0 1,225 0 34 1,195 Maryland 441 125 101 27 750 13 15 132 258Massachusetts 0 11 210 9 7 97 0 194 328New Hampshire 0 0 291 19 0 254 0 59 628New Jersey 126 64 183 7 232 15 10 28 190New York 0 10 1,416 468 61 1,047 27 1,075 936Pennsylvania 8 151 1,138 320 816 665 100 2,391 1,715 Rhode Island 0 8 11 0 4 4 0 2 12Vermont 0 0 402 41 0 260 0 118 633West Virginia 7 189 464 562 3,082 45 129 701 1,699
Total 670 595 4,762 1,489 5,039 3,651 282 4,795 7,908
North Central: Illinois 75 22 312 71 82 234 158 107 919Indiana 85 52 494 70 747 219 174 152 811Iowa 0 0 56 106 0 170 64 19 270Michigan 0 6 1,153 904 39 3,687 54 496 1,287 Minnesota 0 0 889 693 0 4,749 14 16 1,832 Missouri 8 46 146 14 4 155 147 19 586Ohio 11 68 803 153 845 298 182 648 1,171 Wisconsin 0 0 989 1,093 0 2,582 48 200 1,239
Total 178 194 4,842 3,104 1,716 12,095 843 1,657 8,114
Southeast: Florida 563 1,484 339 13 83 0 0 21 1,002 Georgia 2,408 1,932 313 14 1,981 7 21 98 847North Carolina 2,051 1,937 488 130 3,271 28 49 85 1,320 South Carolina 1,814 1,342 247 0 723 48 9 36 523Virginia 924 459 341 172 3,472 2 115 80 1,058
Total 7,760 7,155 1,728 330 9,531 86 194 320 4,749
South Central: Alabama 2,388 1,221 356 53 1,436 30 11 82 1,297 Arkansas 1,510 464 347 20 11 143 31 59 1,073 Kentucky 217 240 570 124 1,961 74 183 103 1,299 Louisiana 1,664 1,090 426 6 62 132 2 20 1,338 Mississippi 2,009 733 370 18 575 108 10 91 1,365 Oklahoma 37 19 125 1 0 90 32 4 358Tennessee 850 346 670 98 2,417 38 140 179 1,491 Texas 1,105 248 161 2 0 27 5 6 484
Total 9,780 4,362 3,024 322 6,462 641 414 544 8,706 _____________________________________________________________________________
East total: 18,388 12,305 14,356 5,245 22,748 16,472 1,733 7,317 29,478 ______________________________________________________________________________________
Note: Data may not add to totals because of rounding. Volume by State in this table may differ from volume by State inother tables because of rounding.

83
North:Northeast:Connecticut 2,721 2,313 2,293 2,237 1,146 0 0 0 0 0 489 370 343 190 121Delaware 581 471 469 457 219 0 0 0 0 0 48 40 17 18 4Maine 9,209 9,209 7,938 6,543 5,378 45 45 27 46 18 367 367 253 87 51Maryland 4,291 3,695 3,685 2,699 2,053 0 0 0 0 0 778 432 437 260 142Massachusetts 3,635 3,254 3,040 2,454 1,240 0 0 0 0 0 826 597 504 326 164New Hampshire 5,216 5,220 4,471 3,760 1,757 787 597 727 623 483 404 426 226 128 38New Jersey 2,238 1,855 1,332 1,282 917 0 0 0 0 0 525 382 315 182 47New York 16,432 16,427 15,154 9,732 7,775 12 18 6 0 0 1,325 1,327 1,245 647 517Pennsylvania 22,574 22,574 22,763 21,625 11,716 983 983 1,184 1,184 444 4,766 4,766 4,645 4,175 2,262Rhode Island 384 350 369 305 146 0 0 0 0 0 85 56 84 17 11Vermont 5,855 5,812 4,233 3,164 2,228 417 339 331 155 152 599 590 507 157 109West Virginia 19,059 19,054 14,777 13,062 8,622 1,715 1,715 1,799 1,741 886 806 806 534 291 337Total 92,195 90,234 80,524 67,320 43,197 3,959 3,696 4,074 3,749 1,983 11,018 10,158 9,110 6,478 3,803
North Central: Illinois 5,774 4,717 4,717 4,185 2,387 368 257 257 198 69 356 250 250 174 36Indiana 6,623 6,623 5,015 3,671 2,876 280 280 217 156 50 717 717 511 250 186Iowa 1,651 1,651 1,244 1,032 1,357 0 0 0 0 1 164 164 145 118 19Michigan 19,085 19,134 14,414 13,103 7,610 2,051 2,100 1,689 1,392 578 3,332 3,332 2,587 2,524 1,419Minnesota 10,495 10,564 9,645 7,978 4,253 1,124 1,193 1,045 1,000 570 3,619 3,619 3,543 2,899 1,434Missouri 8,109 8,135 7,334 5,631 5,450 847 872 899 665 578 437 437 265 153 109Ohio 9,758 9,758 7,227 6,121 3,153 302 302 202 190 72 531 531 321 312 187Wisconsin 14,061 14,059 12,300 10,117 6,412 1,277 1,277 1,161 882 564 2,382 2,381 2,490 1,913 1,193Total 75,556 74,640 61,896 51,838 33,498 6,249 6,281 5,470 4,483 2,482 11,538 11,430 10,112 8,343 4,583
North total: 167,751 164,874 142,420 119,158 76,695 10,208 9,977 9,544 8,232 4,465 22,556 21,588 19,222 14,821 8,386
South:Southeast: Florida 5,942 5,942 5,665 4,700 3,517 269 269 214 187 103 1,065 1,065 741 238 76Georgia 16,480 16,480 14,917 13,322 8,600 922 922 874 841 611 927 927 588 443 250North Carolina 20,212 20,212 19,778 17,705 12,323 1,913 1,913 1,929 1,462 936 767 767 574 382 197South Carolina 8,771 8,651 8,898 8,089 5,412 372 369 407 385 195 561 362 336 278 76Virginia 19,838 19,838 18,896 16,875 11,681 2,300 2,300 2,079 1,804 939 942 942 767 651 246Total 71,243 71,124 68,154 60,691 41,533 5,776 5,773 5,503 4,679 2,784 4,262 4,062 3,006 1,992 845
South Central: Alabama 15,164 11,974 10,484 9,489 6,477 534 369 326 259 147 686 464 330 203 83Arkansas 12,344 12,344 10,655 9,048 9,469 1,942 1,942 1,529 1,247 656 1,156 1,156 639 475 360Kentucky 14,743 14,739 13,500 11,052 5,858 883 883 799 627 314 501 501 393 351 181Louisiana 8,916 8,916 8,440 7,813 6,756 293 293 290 214 89 674 674 617 306 114Mississippi 11,402 11,402 10,069 8,305 6,370 760 760 662 502 144 804 804 363 366 199Oklahoma 2,203 2,203 1,221 1,051 840 66 66 80 75 43 152 152 130 97 31Tennessee 18,870 13,753 11,582 9,798 7,023 985 701 626 503 276 1,637 1,087 716 510 378Texas 5,060 5,060 4,923 4,918 3,682 236 236 190 149 116 118 118 119 93 19Total 88,702 80,392 70,874 61,474 46,475 5,699 5,249 4,502 3,576 1,785 5,728 4,956 3,307 2,401 1,365
South total: 159,945 151,515 139,028 122,165 88,008 11,475 11,022 10,005 8,255 4,569 9,990 9,018 6,313 4,393 2,210
Table 23—Net volume of hardwood growing stock on timberland in the United States by ownership group, region, subregion, and State, 2002,1997, 1987, 1977, and 1953
____________________________________________________________________________________________________
All owners National forest Other publica
____________________________________ ____________________________________ ________________________________Region, subregion, and State 2002 1997 1987 1977 1953 2002 1997 1987 1977 1953 2002 1997 1987 1977 1953
______________________________________________________________________________________________________________________________
Million cubic feet

84
Rocky Mountain:Great Plains: Kansas 1,238 1,238 847 584 477 0 0 0 0 0 67 67 46 24 16Nebraska 645 643 312 304 285 0 0 1 1 0 55 53 16 13 7North Dakota 326 327 239 257 257 1 1 0 0 0 32 32 39 79 79South Dakota 171 161 70 128 79 17 9 9 9 2 7 7 11 22 13Total 2,380 2,368 1,468 1,273 1,098 18 10 10 10 2 161 159 112 138 115
Intermountain: Arizona 279 368 336 220 174 128 164 151 133 103 0 0 185 48 39Colorado 4,011 3,865 3,222 2,413 1,787 2,677 2,531 1,876 1,638 1,147 285 285 304 150 124Idaho 774 784 503 223 213 258 268 152 67 77 116 116 149 49 42Montana 561 561 405 287 248 107 108 40 46 28 37 37 33 62 55Nevada 59 33 29 13 12 53 27 27 13 12 5 5 1 0 0New Mexico 628 549 496 599 457 464 371 308 240 178 17 16 41 32 25Utah 1,649 1,655 881 878 898 1,140 1,146 572 444 546 127 127 68 145 118Wyoming 481 433 341 232 187 216 169 76 81 61 79 79 81 58 48Total 8,442 8,251 6,213 4,865 3,976 5,043 4,783 3,202 2,662 2,152 666 664 862 544 451
Rocky Mountain total: 10,822 10,618 7,681 6,138 5,074 5,061 4,793 3,212 2,672 2,154 827 823 974 682 566
Pacific Coast:Alaska:Alaska 2,873 3,145 4,209 4,222 4,189 99 176 146 237 248 2,260 1,930 1,751 3,864 3,902
Total 2,873 3,145 4,209 4,222 4,189 99 176 146 237 248 2,260 1,930 1,751 3,864 3,902
Pacific Northwest:Oregon 6,518 6,526 6,066 4,819 4,217 1,178 1,185 1,135 897 723 1,535 1,535 1,124 1,198 628Washington 6,522 6,523 6,937 5,703 2,859 358 372 335 141 121 1,311 1,311 1,319 1,124 507
Total 13,040 13,049 13,003 10,522 7,076 1,536 1,557 1,470 1,038 844 2,846 2,846 2,443 2,322 1,135
Pacific Southwest:California 9,550 8,337 7,464 3,693 2,828 3,477 2,264 2,184 1,133 1,276 319 319 554 283 218Hawaii 276 276 276 198 220 0 0 0 0 0 122 122 122 95 99Total 9,826 8,613 7,740 3,891 3,048 3,477 2,264 2,184 1,133 1,276 441 440 676 378 317
Pacific Coast total: 25,739 24,808 24,952 18,635 14,313 5,112 3,997 3,800 2,408 2,368 5,547 5,216 4,870 6,564 5,354 ___________________________________________________________________________________________________________________________
United States: 364,257 351,816 314,081 266,096 184,090 31,856 29,789 26,561 21,567 13,556 38,920 36,645 31,379 26,460 16,516
Table 23—(continued).____________________________________________________________________________________________________
All owners National forest Other publica
____________________________________ ____________________________________ ________________________________Region, subregion, and State 2002 1997 1987 1977 1953 2002 1997 1987 1977 1953 2002 1997 1987 1977 1953
______________________________________________________________________________________________________________________________
Million cubic feet

85
Table 23—(continued).__________________________________________________________________________
North:Northeast:Connecticut 0 0 0 0 2 2,232 1,943 1,950 2,047 1,023 Delaware 14 2 8 10 13 519 429 444 429 202Maine 3,582 3,582 3,711 3,311 2,215 5,215 5,215 3,947 3,099 3,094 Maryland 53 107 102 97 53 3,459 3,157 3,146 2,342 1,858 Massachusetts 12 82 94 43 96 2,797 2,575 2,442 2,085 980New Hampshire 378 452 628 629 241 3,648 3,745 2,890 2,380 995New Jersey 0 0 0 28 2 1,712 1,473 1,017 1,072 868New York 1,522 1,522 1,253 902 721 13,572 13,560 12,650 8,183 6,537 Pennsylvania 1,120 1,120 1,246 945 512 15,706 15,706 15,688 15,321 8,498 Rhode Island 0 0 0 0 0 300 294 285 288 135Vermont 292 277 346 533 385 4,546 4,607 3,049 2,319 1,582 West Virginia 1,558 1,558 1,447 1,138 502 14,980 14,975 10,997 9,892 6,897 Total 8,531 8,700 8,835 7,636 4,742 68,686 67,680 58,505 49,457 32,669
North Central: Illinois 18 14 14 12 15 5,032 4,196 4,196 3,801 2,267 Indiana 26 26 24 22 21 5,600 5,599 4,263 3,243 2,619 Iowa 0 0 0 12 5 1,487 1,487 1,099 902 1,332 Michigan 1,572 1,572 1,744 1,657 1,175 12,130 12,130 8,394 7,530 4,438 Minnesota 369 369 430 371 213 5,383 5,383 4,627 3,708 2,036 Missouri 137 137 185 146 109 6,688 6,688 5,985 4,667 4,654 Ohio 198 198 105 183 87 8,727 8,727 6,599 5,436 2,807 Wisconsin 957 957 928 973 423 9,445 9,444 7,721 6,349 4,232 Total 3,277 3,274 3,430 3,376 2,048 54,492 53,655 42,884 35,636 24,385
North total: 11,808 11,974 12,265 11,012 6,790 123,178 121,335 101,389 85,093 57,054
South:Southeast: Florida 1,230 1,230 1,477 1,511 1,053 3,378 3,378 3,232 2,764 2,285 Georgia 1,914 1,914 2,388 2,097 1,178 12,718 12,718 11,067 9,941 6,561 North Carolina 1,433 1,433 1,540 1,402 1,762 16,099 16,099 15,735 14,459 9,428 South Carolina 972 1,262 1,554 1,418 651 6,866 6,658 6,601 6,008 4,490 Virginia 1,017 1,017 1,198 1,114 944 15,579 15,579 14,852 13,306 9,552 Total 6,566 6,857 8,157 7,542 5,588 54,640 54,432 51,487 46,478 32,316
South Central: Alabama 1,435 1,921 1,739 1,647 887 12,510 9,220 8,089 7,380 5,360 Arkansas 1,923 1,923 2,337 2,023 1,359 7,324 7,324 6,150 5,303 7,094 Kentucky 230 230 231 241 171 13,129 13,125 12,077 9,833 5,192 Louisiana 1,778 1,778 1,652 1,851 1,077 6,171 6,171 5,881 5,442 5,476 Mississippi 1,379 1,379 1,357 1,407 664 8,460 8,460 7,687 6,030 5,363 Oklahoma 173 173 157 211 129 1,811 1,811 854 668 637Tennessee 1,550 919 984 881 408 14,699 11,046 9,256 7,904 5,961 Texas 1,165 1,165 1,137 1,400 961 3,542 3,542 3,477 3,276 2,586 Total 9,633 9,488 9,594 9,661 5,656 67,646 60,699 53,471 45,836 37,669
South total: 16,199 16,344 17,751 17,203 11,244 122,286 115,131 104,958 92,314 69,985
Forest industry Nonindustrial privatea
_______________________________________ ___________________________________________ Region, subregion, and State 2002 1997 1987 1977 1953 2002 1997 1987 1977 1953_____________________________________________________________________________________________
Million cubic feet

86
Table 23—(continued).__________________________________________________________________________
Rocky Mountain:Great Plains: Kansas 0 0 0 0 0 1,170 1,170 801 560 461Nebraska 0 0 0 0 0 590 590 295 290 278North Dakota 0 0 0 0 0 294 294 200 178 178South Dakota 0 0 0 1 0 147 145 50 96 64Total 0 0 0 1 0 2,201 2,198 1,346 1,124 981
Intermountain: Arizona 0 0 0 0 0 151 204 0 39 32Colorado 0 0 0 0 0 1,049 1,049 1,042 625 516Idaho 20 20 17 28 35 381 381 185 79 59Montana 10 10 16 6 9 407 407 316 173 156Nevada 1 1 0 0 0 0 0 1 0 0New Mexico 0 0 0 0 13 147 163 147 327 241Utah 0 0 0 0 0 383 383 241 289 234Wyoming 0 0 0 3 3 186 186 184 90 75Total 31 31 33 37 60 2,704 2,773 2,116 1,622 1,313
Rocky Mountain total: 31 31 33 38 60 4,905 4,971 3,462 2,746 2,294
Pacific Coast:Alaska:Alaska 0 0 0 0 0 515 1,040 2,312 121 39Total 0 0 0 0 0 515 1,040 2,312 121 39
Pacific Northwest:Oregon 1,502 1,502 1,524 1,302 940 2,303 2,303 2,283 1,422 1,926 Washington 1,973 1,973 2,364 2,053 960 2,882 2,882 2,919 2,385 1,271
Total 3,475 3,475 3,888 3,355 1,900 5,185 5,185 5,202 3,807 3,197
Pacific Southwest:California 1,701 1,701 1,374 679 336 4,054 4,054 3,352 1,598 998Hawaii 0 0 0 0 0 154 154 154 103 121Total 1,701 1,701 1,374 679 336 4,208 4,208 3,506 1,701 1,119
Pacific Coast total: 5,176 5,176 5,262 4,034 2,236 9,908 10,433 11,020 5,629 4,355 _____________________________________________________________________________________
United States: 33,214 33,526 35,311 32,287 20,330 260,277 251,870 220,829 185,782 133,688 _______________________________________________________________________________________________________
a Native American lands have been exclusively in the nonindustrial private owner group since 1997. For 1987 andearlier years, these lands may be included in the other public owner group.
Note: Data may not add to totals because of rounding.
Forest industry Nonindustrial privatea
_______________________________________ ___________________________________________ Region, subregion, and State 2002 1997 1987 1977 1953 2002 1997 1987 1977 1953
_____________________________________________________________________________________
Million cubic feet
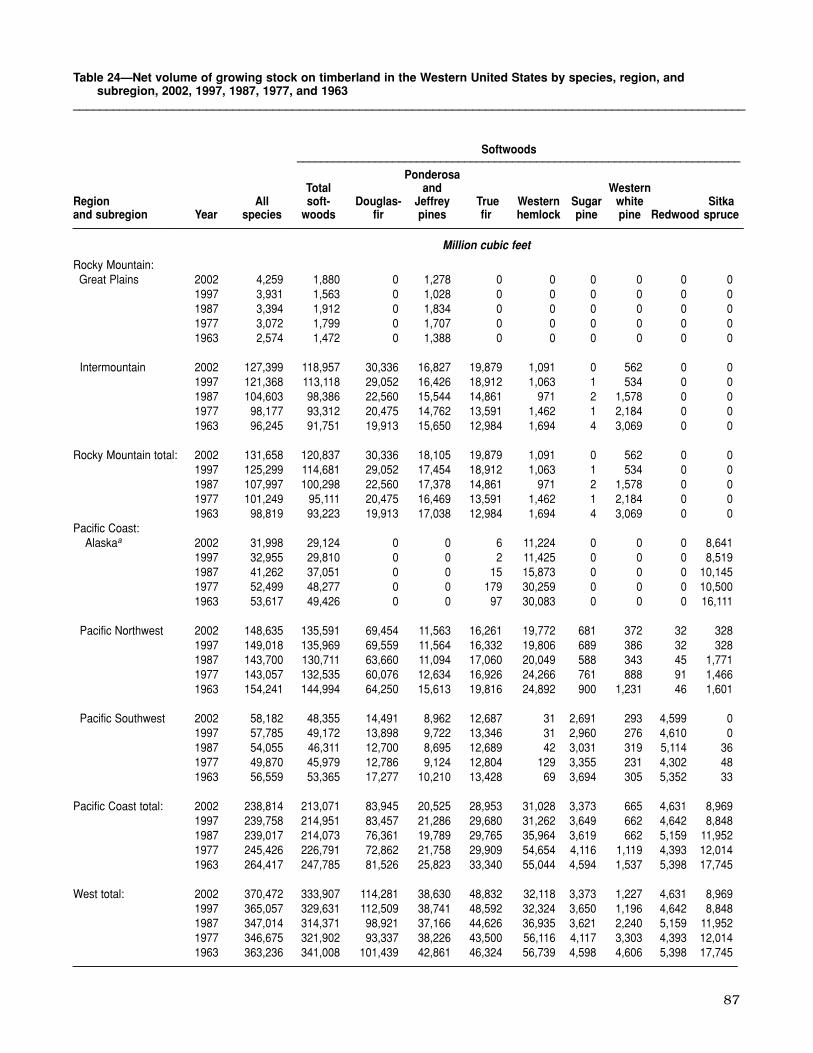
87
Rocky Mountain:Great Plains 2002 4,259 1,880 0 1,278 0 0 0 0 0 0
1997 3,931 1,563 0 1,028 0 0 0 0 0 01987 3,394 1,912 0 1,834 0 0 0 0 0 01977 3,072 1,799 0 1,707 0 0 0 0 0 01963 2,574 1,472 0 1,388 0 0 0 0 0 0
Intermountain 2002 127,399 118,957 30,336 16,827 19,879 1,091 0 562 0 01997 121,368 113,118 29,052 16,426 18,912 1,063 1 534 0 01987 104,603 98,386 22,560 15,544 14,861 971 2 1,578 0 01977 98,177 93,312 20,475 14,762 13,591 1,462 1 2,184 0 01963 96,245 91,751 19,913 15,650 12,984 1,694 4 3,069 0 0
Rocky Mountain total: 2002 131,658 120,837 30,336 18,105 19,879 1,091 0 562 0 01997 125,299 114,681 29,052 17,454 18,912 1,063 1 534 0 01987 107,997 100,298 22,560 17,378 14,861 971 2 1,578 0 01977 101,249 95,111 20,475 16,469 13,591 1,462 1 2,184 0 01963 98,819 93,223 19,913 17,038 12,984 1,694 4 3,069 0 0
Pacific Coast:Alaskaa 2002 31,998 29,124 0 0 6 11,224 0 0 0 8,641
1997 32,955 29,810 0 0 2 11,425 0 0 0 8,5191987 41,262 37,051 0 0 15 15,873 0 0 0 10,1451977 52,499 48,277 0 0 179 30,259 0 0 0 10,5001963 53,617 49,426 0 0 97 30,083 0 0 0 16,111
Pacific Northwest 2002 148,635 135,591 69,454 11,563 16,261 19,772 681 372 32 3281997 149,018 135,969 69,559 11,564 16,332 19,806 689 386 32 3281987 143,700 130,711 63,660 11,094 17,060 20,049 588 343 45 1,771 1977 143,057 132,535 60,076 12,634 16,926 24,266 761 888 91 1,466 1963 154,241 144,994 64,250 15,613 19,816 24,892 900 1,231 46 1,601
Pacific Southwest 2002 58,182 48,355 14,491 8,962 12,687 31 2,691 293 4,599 01997 57,785 49,172 13,898 9,722 13,346 31 2,960 276 4,610 01987 54,055 46,311 12,700 8,695 12,689 42 3,031 319 5,114 361977 49,870 45,979 12,786 9,124 12,804 129 3,355 231 4,302 481963 56,559 53,365 17,277 10,210 13,428 69 3,694 305 5,352 33
Pacific Coast total: 2002 238,814 213,071 83,945 20,525 28,953 31,028 3,373 665 4,631 8,969 1997 239,758 214,951 83,457 21,286 29,680 31,262 3,649 662 4,642 8,848 1987 239,017 214,073 76,361 19,789 29,765 35,964 3,619 662 5,159 11,952 1977 245,426 226,791 72,862 21,758 29,909 54,654 4,116 1,119 4,393 12,014 1963 264,417 247,785 81,526 25,823 33,340 55,044 4,594 1,537 5,398 17,745
West total: 2002 370,472 333,907 114,281 38,630 48,832 32,118 3,373 1,227 4,631 8,969 1997 365,057 329,631 112,509 38,741 48,592 32,324 3,650 1,196 4,642 8,848 1987 347,014 314,371 98,921 37,166 44,626 36,935 3,621 2,240 5,159 11,952 1977 346,675 321,902 93,337 38,226 43,500 56,116 4,117 3,303 4,393 12,014 1963 363,236 341,008 101,439 42,861 46,324 56,739 4,598 4,606 5,398 17,745
_______________________________________________________________________________________________________________
Table 24—Net volume of growing stock on timberland in the Western United States by species, region, andsubregion, 2002, 1997, 1987, 1977, and 1963
_____________________________________________________________________________________________________
Softwoods__________________________________________________________________________
PonderosaTotal and Western
Region All soft- Douglas- Jeffrey True Western Sugar white Sitkaand subregion Year species woods fir pines fir hemlock pine pine Redwood spruce________________________________________________________________________________________________________________
Million cubic feet

88
Rocky Mountain:Great Plains 2002 92 0 0 0 510 2,380 14 0 1 2,364
1997 48 0 0 0 486 2,368 9 0 0 2,359 1987 61 0 0 0 17 1,482 463 0 314 7051977 62 0 0 0 30 1,273 424 0 197 6511963 63 0 0 0 21 1,102 387 0 217 499
Intermountain 2002 16,623 3,748 4 23,224 6,662 8,442 8,190 0 1 2511997 15,260 3,704 3 22,269 5,896 8,250 7,808 0 0 4421987 13,515 4,816 3 21,131 3,405 6,217 6,172 0 0 451977 12,932 3,876 1 19,857 4,171 4,865 4,758 0 0 1071963 12,689 6,153 4 16,806 2,785 4,494 4,421 6 0 67
Rocky Mountain total: 2002 16,715 3,748 4 23,224 7,172 10,822 8,204 0 2 2,616 1997 15,308 3,704 3 22,269 6,382 10,618 7,817 0 0 2,801 1987 13,576 4,816 3 21,131 3,422 7,699 6,635 0 314 7501977 12,994 3,876 1 19,857 4,201 6,138 5,182 0 197 7591963 12,752 6,153 4 16,806 2,806 5,596 4,808 6 217 565
Pacific Coast:Alaska 2002 4,287 3 0 81 4,884 2,873 843 73 0 1,957
1997 4,605 0 0 38 4,827 3,145 1,555 33 0 1,557 1987 6,052 0 0 39 4,927 4,211 1,827 62 0 2,322 1977 2,889 0 0 57 4,392 4,222 1,863 214 0 2,145 1963 6 0 0 28 3,101 4,191 3,706 436 0 48
Pacific Northwest 2002 2,817 2,236 723 4,001 7,350 13,044 739 7,536 479 4,289 1997 2,825 2,254 723 4,012 7,459 13,049 740 7,535 484 4,290 1987 1,863 2,365 624 4,479 6,768 12,990 600 8,290 606 3,494 1977 1,273 2,568 648 5,640 5,298 10,522 348 6,781 486 2,906 1963 1,386 2,413 776 3,826 8,243 9,247 346 5,111 756 3,034
Pacific Southwest 2002 37 0 2,884 1,195 487 9,826 71 230 4,932 4,594 1997 36 0 2,849 911 534 8,613 35 218 4,320 4,041 1987 14 0 2,365 861 445 7,744 20 133 5,728 1,863 1977 7 0 2,004 870 319 3,891 21 64 1,796 2,010 1963 0 0 1,699 903 395 3,194 41 61 892 2,200
Pacific Coast total: 2002 7,141 2,239 3,606 5,277 12,720 25,743 1,653 7,839 5,411 10,840 1997 7,466 2,254 3,571 4,960 12,821 24,808 2,330 7,786 4,804 9,888 1987 7,929 2,365 2,989 5,379 12,140 24,944 2,447 8,485 6,334 7,679 1977 4,169 2,568 2,652 6,567 10,009 18,635 2,232 7,059 2,282 7,062 1963 1,392 2,413 2,476 4,757 11,739 16,632 4,094 5,609 1,647 5,282
West total:a 2002 23,856 5,987 3,611 28,501 19,892 36,565 9,857 7,839 5,414 13,456 1997 22,773 5,958 3,574 27,229 19,203 35,425 10,147 7,786 4,804 12,689 1987 27,072 7,181 2,992 26,549 20,412 32,644 9,082 8,485 6,648 8,429 1977 19,697 6,444 2,653 26,481 18,509 24,773 7,414 7,059 2,480 7,821 1963 13,970 8,567 2,479 21,592 17,586 22,228 8,901 5,615 1,864 5,848
________________________________________________________________________________________________________________a Data for Englemann and other spruces included in other softwoods for 1963.Note: Data may not add to totals because of rounding.
Table 24—(continued)._____________________________________________________________________________________________________
Softwoods Hardwoods___________________________________________ _______________________________________
Englemann Cotton-and Other Total wood Other
Region other Western Incense- Lodgepole soft- hard- and Red hardand subregion Year spruces larch cedar pine woods woods aspen alder Oak woods________________________________________________________________________________________________________________
Million cubic feet
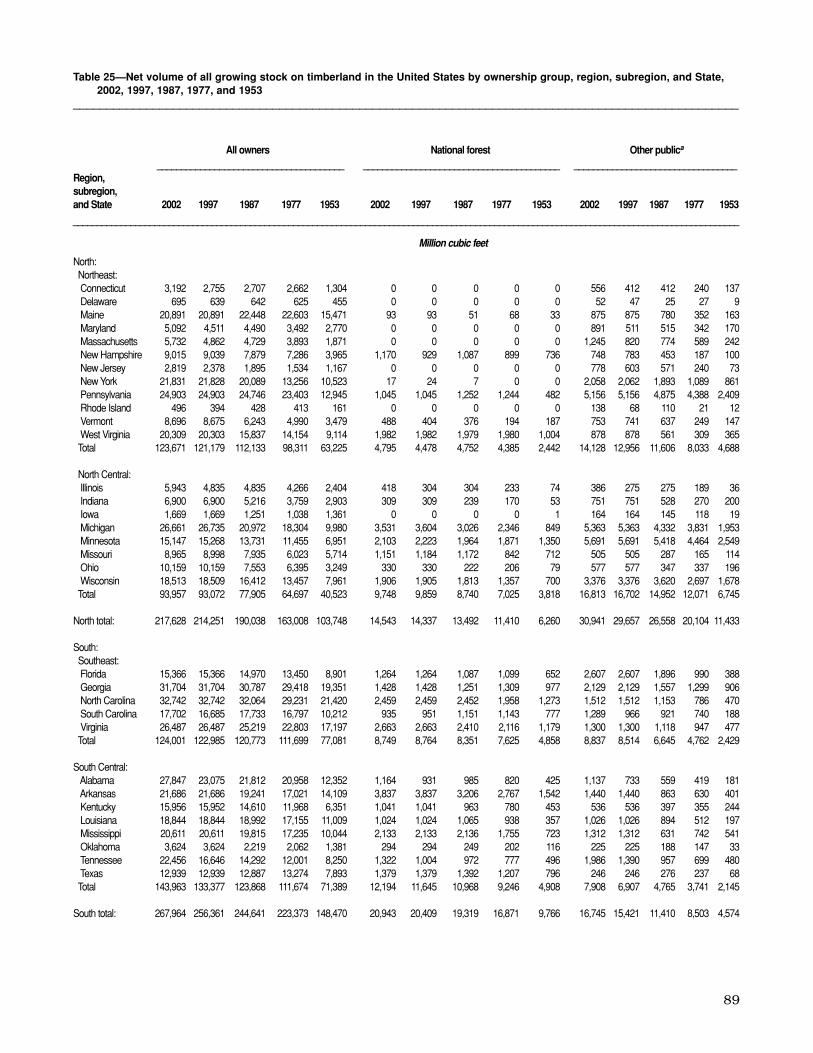
89
North:Northeast:Connecticut 3,192 2,755 2,707 2,662 1,304 0 0 0 0 0 556 412 412 240 137Delaware 695 639 642 625 455 0 0 0 0 0 52 47 25 27 9Maine 20,891 20,891 22,448 22,603 15,471 93 93 51 68 33 875 875 780 352 163Maryland 5,092 4,511 4,490 3,492 2,770 0 0 0 0 0 891 511 515 342 170Massachusetts 5,732 4,862 4,729 3,893 1,871 0 0 0 0 0 1,245 820 774 589 242New Hampshire 9,015 9,039 7,879 7,286 3,965 1,170 929 1,087 899 736 748 783 453 187 100New Jersey 2,819 2,378 1,895 1,534 1,167 0 0 0 0 0 778 603 571 240 73New York 21,831 21,828 20,089 13,256 10,523 17 24 7 0 0 2,058 2,062 1,893 1,089 861Pennsylvania 24,903 24,903 24,746 23,403 12,945 1,045 1,045 1,252 1,244 482 5,156 5,156 4,875 4,388 2,409 Rhode Island 496 394 428 413 161 0 0 0 0 0 138 68 110 21 12Vermont 8,696 8,675 6,243 4,990 3,479 488 404 376 194 187 753 741 637 249 147West Virginia 20,309 20,303 15,837 14,154 9,114 1,982 1,982 1,979 1,980 1,004 878 878 561 309 365Total 123,671 121,179 112,133 98,311 63,225 4,795 4,478 4,752 4,385 2,442 14,128 12,956 11,606 8,033 4,688
North Central:Illinois 5,943 4,835 4,835 4,266 2,404 418 304 304 233 74 386 275 275 189 36Indiana 6,900 6,900 5,216 3,759 2,903 309 309 239 170 53 751 751 528 270 200Iowa 1,669 1,669 1,251 1,038 1,361 0 0 0 0 1 164 164 145 118 19Michigan 26,661 26,735 20,972 18,304 9,980 3,531 3,604 3,026 2,346 849 5,363 5,363 4,332 3,831 1,953 Minnesota 15,147 15,268 13,731 11,455 6,951 2,103 2,223 1,964 1,871 1,350 5,691 5,691 5,418 4,464 2,549 Missouri 8,965 8,998 7,935 6,023 5,714 1,151 1,184 1,172 842 712 505 505 287 165 114Ohio 10,159 10,159 7,553 6,395 3,249 330 330 222 206 79 577 577 347 337 196Wisconsin 18,513 18,509 16,412 13,457 7,961 1,906 1,905 1,813 1,357 700 3,376 3,376 3,620 2,697 1,678 Total 93,957 93,072 77,905 64,697 40,523 9,748 9,859 8,740 7,025 3,818 16,813 16,702 14,952 12,071 6,745
North total: 217,628 214,251 190,038 163,008 103,748 14,543 14,337 13,492 11,410 6,260 30,941 29,657 26,558 20,104 11,433
South:Southeast:Florida 15,366 15,366 14,970 13,450 8,901 1,264 1,264 1,087 1,099 652 2,607 2,607 1,896 990 388Georgia 31,704 31,704 30,787 29,418 19,351 1,428 1,428 1,251 1,309 977 2,129 2,129 1,557 1,299 906North Carolina 32,742 32,742 32,064 29,231 21,420 2,459 2,459 2,452 1,958 1,273 1,512 1,512 1,153 786 470South Carolina 17,702 16,685 17,733 16,797 10,212 935 951 1,151 1,143 777 1,289 966 921 740 188Virginia 26,487 26,487 25,219 22,803 17,197 2,663 2,663 2,410 2,116 1,179 1,300 1,300 1,118 947 477Total 124,001 122,985 120,773 111,699 77,081 8,749 8,764 8,351 7,625 4,858 8,837 8,514 6,645 4,762 2,429
South Central:Alabama 27,847 23,075 21,812 20,958 12,352 1,164 931 985 820 425 1,137 733 559 419 181Arkansas 21,686 21,686 19,241 17,021 14,109 3,837 3,837 3,206 2,767 1,542 1,440 1,440 863 630 401Kentucky 15,956 15,952 14,610 11,968 6,351 1,041 1,041 963 780 453 536 536 397 355 244Louisiana 18,844 18,844 18,992 17,155 11,009 1,024 1,024 1,065 938 357 1,026 1,026 894 512 197Mississippi 20,611 20,611 19,815 17,235 10,044 2,133 2,133 2,136 1,755 723 1,312 1,312 631 742 541Oklahoma 3,624 3,624 2,219 2,062 1,381 294 294 249 202 116 225 225 188 147 33Tennessee 22,456 16,646 14,292 12,001 8,250 1,322 1,004 972 777 496 1,986 1,390 957 699 480Texas 12,939 12,939 12,887 13,274 7,893 1,379 1,379 1,392 1,207 796 246 246 276 237 68Total 143,963 133,377 123,868 111,674 71,389 12,194 11,645 10,968 9,246 4,908 7,908 6,907 4,765 3,741 2,145
South total: 267,964 256,361 244,641 223,373 148,470 20,943 20,409 19,319 16,871 9,766 16,745 15,421 11,410 8,503 4,574
Table 25—Net volume of all growing stock on timberland in the United States by ownership group, region, subregion, and State,2002, 1997, 1987, 1977, and 1953
____________________________________________________________________________________________________
All owners National forest Other publica
_______________________________________ _________________________________________ __________________________________Region, subregion, and State 2002 1997 1987 1977 1953 2002 1997 1987 1977 1953 2002 1997 1987 1977 1953
___________________________________________________________________________________________________________________________________________
Million cubic feet

90
Rocky Mountain:Great Plains:Kansas 1,254 1,254 853 585 477 0 0 0 0 0 68 68 46 24 16Nebraska 856 854 489 452 358 54 54 32 29 19 77 75 33 26 11North Dakota 330 330 242 257 257 2 2 0 0 0 32 32 39 79 79South Dakota 1,819 1,492 1,796 1,778 1,315 1,408 1,099 1,279 1,354 1,048 56 55 129 122 64Total 4,259 3,931 3,380 3,072 2,407 1,464 1,155 1,311 1,383 1,067 233 230 247 251 170
Intermountain:Arizona 6,193 5,977 6,316 4,983 4,774 4,190 4,095 4,327 3,341 2,991 63 47 1,938 1,497 1,635 Colorado 20,943 20,028 19,448 15,037 12,713 15,238 14,323 13,687 11,124 9,352 1,646 1,646 1,669 863 742Idaho 40,050 39,256 32,591 31,885 28,890 30,641 29,848 23,592 21,656 18,971 3,468 3,468 3,629 3,316 3,034 Montana 35,167 34,815 28,016 27,978 27,615 25,608 25,256 18,635 18,136 17,472 2,354 2,354 2,491 2,605 2,390 Nevada 543 339 419 263 247 358 154 233 99 91 62 62 13 9 9New Mexico 7,013 5,578 6,124 6,396 5,971 4,802 3,497 4,038 3,112 2,756 198 140 717 1,379 1,377 Utah 7,336 7,363 4,794 4,440 4,555 5,694 5,721 3,603 3,252 3,331 500 500 413 557 594Wyoming 10,154 8,012 6,891 7,195 5,448 7,880 5,739 4,618 5,650 4,136 803 803 951 634 538Total 127,399 121,370 104,599 98,177 90,213 94,411 88,632 72,733 66,370 59,100 9,094 9,020 11,821 10,860 10,319
Rocky Mountain total: 131,658 125,300 107,979 101,249 92,620 95,875 89,787 74,044 67,753 60,167 9,327 9,250 12,068 11,111 10,489
Pacific Coast:Alaska:Alaska 31,998 32,955 41,260 52,499 53,338 19,856 18,909 24,214 35,651 39,098 7,450 7,020 7,631 16,064 13,983 Total 31,998 32,955 41,260 52,499 53,338 19,856 18,909 24,214 35,651 39,098 7,450 7,020 7,631 16,064 13,983
Pacific Northwest:Oregon 83,212 83,296 76,620 79,554 91,797 49,096 49,178 43,237 45,801 46,211 13,592 13,593 13,929 13,907 15,900 Washington 65,413 65,724 67,067 63,503 64,853 27,380 27,693 23,832 22,974 25,625 11,034 11,034 15,117 14,324 13,112 Total 148,625 149,020 143,687 143,057 156,650 76,476 76,871 67,069 68,775 71,836 24,626 24,627 29,046 28,231 29,012
Pacific Southwest:California 57,902 57,505 53,771 49,668 60,834 32,200 31,803 29,397 29,206 30,866 1,639 1,639 1,799 1,391 2,110 Hawaii 280 280 280 202 224 0 0 0 0 0 125 125 125 98 102Total 58,182 57,785 54,051 49,870 61,058 32,200 31,803 29,397 29,206 30,866 1,764 1,763 1,924 1,489 2,212
Pacific Coast total: 238,805 239,760 238,998 245,426 271,046 128,532 127,583 120,680 133,632 141,800 33,840 33,410 38,601 45,784 45,207 ___________________________________________________________________________________________________________________________
United States: 856,055 835,672 781,656 733,056 615,884 259,893 252,115 227,535 229,666 217,993 90,853 87,738 88,637 85,502 71,703 ____________________________________________________________________________________________________________________________________________
Table 25—(continued).____________________________________________________________________________________________________
All owners National forest Other publica
_______________________________________ _________________________________________ __________________________________Region, subregion, and State 2002 1997 1987 1977 1953 2002 1997 1987 1977 1953 2002 1997 1987 1977 1953
___________________________________________________________________________________________________________________________________________
Million cubic feet

91
Table 25—(continued).__________________________________________________________________________
North:Northeast:Connecticut 0 0 0 0 2 2,636 2,343 2,295 2,422 1,165 Delaware 38 20 26 38 27 606 573 591 560 419Maine 8,352 8,352 11,560 12,431 6,409 11,571 11,571 10,057 9,752 8,866 Maryland 113 187 181 188 117 4,088 3,813 3,794 2,962 2,483 Massachusetts 22 168 158 67 148 4,465 3,874 3,797 3,237 1,481 New Hampshire 631 721 1,061 1,429 612 6,466 6,607 5,278 4,771 2,517 New Jersey 0 0 0 28 3 2,042 1,775 1,324 1,266 1,091 New York 1,877 1,877 1,656 1,284 1,019 17,879 17,864 16,533 10,883 8,643 Pennsylvania 1,202 1,202 1,337 1,016 561 17,500 17,500 17,282 16,755 9,493 Rhode Island 0 0 0 0 0 358 326 318 392 149Vermont 391 350 474 745 569 7,063 7,180 4,756 3,802 2,576 West Virginia 1,627 1,627 1,573 1,234 521 15,822 15,816 11,724 10,631 7,224 Total 14,253 14,503 18,026 18,460 9,988 90,496 89,243 77,749 67,433 46,107
North Central:Illinois 18 14 14 13 16 5,121 4,242 4,242 3,831 2,278 Indiana 26 26 24 23 21 5,814 5,814 4,425 3,296 2,629 Iowa 0 0 0 12 5 1,505 1,505 1,106 908 1,336 Michigan 2,336 2,336 2,629 2,465 1,738 15,431 15,431 10,985 9,662 5,440 Minnesota 672 672 766 636 445 6,681 6,681 5,583 4,484 2,607 Missouri 173 173 206 167 116 7,136 7,136 6,270 4,849 4,772 Ohio 223 223 107 187 91 9,029 9,029 6,877 5,665 2,883 Wisconsin 1,257 1,257 1,337 1,563 533 11,974 11,972 9,642 7,840 5,050 Total 4,705 4,700 5,083 5,066 2,965 62,691 61,811 49,130 40,535 26,995
North total: 18,958 19,204 23,109 23,526 12,953 153,187 151,053 126,879 107,968 73,102
South:Southeast:Florida 3,541 3,541 4,164 4,300 2,742 7,954 7,954 7,822 7,061 5,119 Georgia 5,141 5,141 5,831 4,933 3,209 23,007 23,007 22,148 21,877 14,259 North Carolina 3,317 3,317 3,186 2,559 3,308 25,454 25,454 25,273 23,928 16,369 South Carolina 2,709 2,934 3,328 2,835 1,351 12,769 11,833 12,333 12,079 7,896 Virginia 2,154 2,154 2,365 2,057 1,781 20,370 20,370 19,326 17,683 13,760 Total 16,862 17,088 18,874 16,684 12,391 89,554 88,619 86,902 82,628 57,403
South Central:Alabama 3,789 4,920 4,541 4,530 2,521 21,756 16,491 15,727 15,189 9,225 Arkansas 5,394 5,394 5,528 5,143 3,731 11,015 11,015 9,644 8,481 8,435 Kentucky 242 242 237 247 181 14,137 14,133 13,013 10,586 5,473 Louisiana 4,633 4,633 4,431 4,576 3,029 12,161 12,161 12,602 11,129 7,426 Mississippi 3,270 3,270 3,179 3,133 2,118 13,896 13,896 13,869 11,605 6,662 Oklahoma 748 748 507 728 488 2,357 2,357 1,275 985 744Tennessee 2,108 1,221 1,273 1,113 482 17,041 13,032 11,090 9,412 6,792 Texas 3,291 3,291 3,413 4,621 2,844 8,023 8,023 7,806 7,209 4,185 Total 23,475 23,719 23,109 24,091 15,394 100,386 91,106 85,026 74,596 48,942
South total: 40,337 40,807 41,983 40,775 27,785 189,940 179,725 171,928 157,224 106,345
Forest industry Nonindustrial privatea
_______________________________________ ___________________________________________ Region, subregion, and State 2002 1997 1987 1977 1953 2002 1997 1987 1977 1953_______________________________________________________________________________________________________
Million cubic feet

92
Table 25—(continued).__________________________________________________________________________
Rocky Mountain:Great Plains:Kansas 0 0 0 0 0 1,186 1,186 807 561 461Nebraska 0 0 0 0 0 725 725 424 397 328North Dakota 0 0 0 0 0 296 296 203 178 178South Dakota 0 0 12 20 8 355 339 376 282 195Total 0 0 12 20 8 2,562 2,546 1,810 1,418 1,162
Intermountain:Arizona 0 0 0 0 0 1,941 1,835 51 145 148Colorado 0 0 0 21 19 4,059 4,059 4,092 3,029 2,600 Idaho 2,613 2,613 2,329 2,941 3,473 3,328 3,328 3,041 3,972 3,412 Montana 2,167 2,167 2,979 2,103 3,113 5,038 5,038 3,911 5,134 4,640 Nevada 24 24 0 16 15 100 100 173 139 132New Mexico 0 0 3 0 126 2,013 1,942 1,366 1,905 1,712 Utah 0 0 0 0 0 1,142 1,142 778 631 630Wyoming 0 0 53 64 55 1,471 1,470 1,269 847 719Total 4,804 4,803 5,364 5,145 6,801 19,092 18,914 14,681 15,802 13,993
Rocky Mountain total: 4,804 4,803 5,376 5,165 6,809 21,654 21,461 16,491 17,220 15,155
Pacific Coast:Alaska:Alaska 0 0 0 0 0 4,692 7,027 9,415 784 257Total 0 0 0 0 0 4,692 7,027 9,415 784 257
Pacific Northwest:Oregon 11,175 11,176 11,535 13,412 20,000 9,349 9,349 7,919 6,434 9,686 Washington 13,504 13,504 16,768 15,770 18,600 13,495 13,493 11,350 10,435 7,516 Total 24,679 24,680 28,303 29,182 38,600 22,844 22,842 19,269 16,869 17,202
Pacific Southwest:California 10,293 10,294 9,292 8,136 11,604 13,770 13,769 13,283 10,935 16,254 Hawaii 0 0 0 0 0 156 156 155 104 122Total 10,293 10,294 9,292 8,136 11,604 13,926 13,925 13,438 11,039 16,376
Pacific Coast total: 34,972 34,973 37,595 37,318 50,204 41,462 43,794 42,122 28,692 33,835______________________________________________________________________________________
United States: 99,071 99,787 108,063 106,784 97,751 406,243 396,032 357,420 311,104 228,437 _______________________________________________________________________________________________________
a Native American lands have been included exclusively in the nonindustrial private owner group since 1997. For 1987 and earlier years, these lands may be included in the other public owner group.
Note: Data may not add to totals because of rounding.
Forest industry Nonindustrial privatea
_______________________________________ ___________________________________________ Region, subregion, and State 2002 1997 1987 1977 1953 2002 1997 1987 1977 1953_______________________________________________________________________________________________________
Million cubic feet

93
Northeast:5.0 - 6.9 7,929 257 325 250 202 254 320 954 2,010 5587.0 - 8.9 13,139 496 703 558 457 465 520 1,635 3,107 829
9.0 - 10.9 15,694 693 1,032 758 686 577 603 1,981 3,384 97711.0 - 12.9 14,337 676 1,269 710 748 523 512 1,853 2,656 84913.0 - 14.9 12,344 663 1,243 635 751 421 396 1,570 2,144 65815.0 - 16.9 9,436 515 1,130 477 651 290 272 1,205 1,396 54117.0 - 18.9 6,497 385 896 311 504 162 184 768 885 40719.0 - 20.9 4,408 285 611 198 374 116 115 527 571 27421.0 - 28.9 6,769 410 1,104 282 614 109 181 923 866 39729.0 + 1,639 141 292 48 137 11 26 243 245 53
Total 92,191 4,521 8,605 4,227 5,124 2,927 3,129 11,659 17,265 5,542
North Central:5.0 - 6.9 7,325 433 195 163 342 341 81 1,076 1,046 557.0 - 8.9 10,501 655 434 225 551 528 106 1,385 1,347 80
9.0 - 10.9 12,198 915 699 226 726 608 127 1,413 1,353 11311.0 - 12.9 11,386 981 866 219 833 610 114 1,178 1,088 11513.0 - 14.9 9,813 1,048 878 197 840 533 100 964 852 13215.0 - 16.9 7,580 994 758 165 734 425 92 782 620 12417.0 - 18.9 5,450 789 623 107 541 301 58 579 461 12419.0 - 20.9 3,675 558 471 76 402 138 40 400 309 9521.0 - 28.9 6,093 1,027 883 86 681 196 62 562 556 23129.0 + 1,535 243 232 10 182 14 4 50 200 54
Total 75,555 7,643 6,038 1,476 5,832 3,694 783 8,388 7,832 1,125
Southeast:5.0 - 6.9 5,514 383 114 330 841 259 8 47 783 517.0 - 8.9 7,805 628 165 642 1,246 417 11 62 906 70
9.0 - 10.9 9,525 893 241 763 1,574 577 12 57 851 10111.0 - 12.9 10,139 1,022 334 778 1,694 570 3 53 832 11713.0 - 14.9 9,669 1,051 377 754 1,664 542 6 56 696 12215.0 - 16.9 8,430 945 410 626 1,409 447 11 60 512 13717.0 - 18.9 6,387 712 332 571 1,120 320 8 44 375 13019.0 - 20.9 4,688 528 311 404 890 221 7 29 243 8421.0 - 28.9 7,441 848 665 765 1,540 267 17 44 323 17529.0 + 1,647 166 208 287 390 24 0 12 44 29
Total 71,244 7,177 3,157 5,919 12,367 3,642 83 464 5,565 1,016
Table 26—Net volume of hardwood growing stock on timberland in the Eastern United States by species,subregion, and diameter class, 2002
_____________________________________________________________________________________________
Subregion and Select Select Other Otherdiameter class white red white red Yellow Hard Soft(in inches) Total oaks oaks oaks oaks Hickory birch maple maple Beech________________________________________________________________________________________________________
Million cubic feet

94
South Central:5.0 - 6.9 6,832 662 162 560 847 690 4 195 469 467.0 - 8.9 10,117 1,087 322 947 1,403 1,098 1 249 499 79
9.0 - 10.9 12,316 1,412 476 1,186 2,027 1,357 1 262 428 11011.0 - 12.9 12,075 1,494 557 1,125 2,164 1,360 2 226 328 14613.0 - 14.9 11,838 1,461 577 1,098 2,346 1,217 1 202 289 15615.0 - 16.9 10,253 1,263 582 907 2,199 953 1 150 236 18117.0 - 18.9 7,965 989 565 702 1,779 619 2 105 143 19619.0 - 20.9 5,754 629 490 484 1,383 367 2 89 111 16921.0 - 28.9 9,523 973 1,001 814 2,432 490 0 85 163 39629.0 + 2,031 133 266 186 614 105 0 33 34 99
Total 88,703 10,102 5,000 8,010 17,194 8,257 14 1,595 2,699 1,579
East total:5.0 - 6.9 27,599 1,734 796 1,303 2,232 1,545 413 2,272 4,307 7097.0 - 8.9 41,562 2,866 1,624 2,373 3,657 2,507 637 3,331 5,859 1,058
9.0 - 10.9 49,732 3,913 2,449 2,933 5,012 3,118 742 3,712 6,017 1,302 11.0 - 12.9 47,938 4,173 3,025 2,832 5,438 3,063 630 3,309 4,904 1,227 13.0 - 14.9 43,665 4,222 3,075 2,685 5,601 2,713 503 2,791 3,981 1,068 15.0 - 16.9 35,699 3,718 2,880 2,174 4,993 2,115 376 2,197 2,764 98317.0 - 18.9 26,299 2,876 2,416 1,692 3,944 1,402 252 1,496 1,864 85719.0 - 20.9 18,524 2,000 1,883 1,162 3,049 841 164 1,046 1,233 62321.0 - 28.9 29,825 3,258 3,652 1,948 5,267 1,062 259 1,614 1,908 1,199 29.0 + 6,851 683 999 531 1,323 154 30 338 522 235
Total 327,693 29,444 22,800 19,632 40,517 18,520 4,008 22,107 33,362 9,262_____________________________________________________________________________________________
Table 26—(continued)._____________________________________________________________________________________________
Subregion and Select Select Other Otherdiameter class white red white red Yellow Hard Soft(in inches) Total oaks oaks oaks oaks Hickory birch maple maple Beech_______________________________________________________________________________________________________
Million cubic feet

95
Table 26—(continued)._____________________________________________________________________________________________
Northeast:5.0 - 6.9 40 99 463 70 149 410 23 319 1,226 7.0 - 8.9 70 96 688 157 317 723 39 547 1,732
9.0 - 10.9 101 97 836 195 497 803 46 737 1,691 11.0 - 12.9 108 79 766 260 637 694 49 770 1,180 13.0 - 14.9 114 70 635 263 703 499 50 728 80215.0 - 16.9 94 58 498 207 715 277 32 594 48517.0 - 18.9 50 30 312 126 647 108 18 424 27919.0 - 20.9 19 24 200 94 474 70 12 274 16821.0 - 28.9 62 41 275 102 748 52 12 350 24129.0 + 11 2 89 14 153 13 1 53 105
Total 670 595 4,762 1,489 5,039 3,651 282 4,795 7,908
North Central:5.0 - 6.9 11 27 628 218 58 1,178 50 192 1,230 7.0 - 8.9 17 30 834 402 106 1,829 92 257 1,623
9.0 - 10.9 21 29 815 567 169 2,437 126 297 1,558 11.0 - 12.9 26 21 707 591 198 2,311 152 265 1,112 13.0 - 14.9 28 30 601 467 227 1,739 156 240 78115.0 - 16.9 26 18 432 333 232 1,069 108 146 52117.0 - 18.9 18 14 311 200 215 543 79 110 37419.0 - 20.9 15 6 209 135 180 268 42 66 26421.0 - 28.9 15 14 265 169 297 458 33 76 48329.0 + 0 5 40 22 36 264 4 7 168
Total 178 194 4,842 3,104 1,716 12,095 843 1,657 8,114
Southeast:5.0 - 6.9 763 683 152 12 436 5 9 71 5677.0 - 8.9 1,021 924 187 27 680 8 20 67 725
9.0 - 10.9 1,257 1,097 246 37 934 7 34 60 78311.0 - 12.9 1,198 1,178 259 52 1,259 8 38 43 70213.0 - 14.9 1,082 1,024 221 54 1,352 16 31 28 59415.0 - 16.9 825 837 193 56 1,444 14 25 15 46417.0 - 18.9 567 543 147 31 1,147 7 10 17 30719.0 - 20.9 394 346 119 29 856 2 15 6 20621.0 - 28.9 564 422 174 25 1,249 9 11 10 33429.0 + 90 102 30 9 175 10 2 2 67
Total 7,760 7,155 1,728 330 9,531 86 194 320 4,749
Tupelo Cotton- OtherSubregion and and wood easterndiameter class black Yellow- and Black Black hard-(in inches) Sweetgum gum Ash Basswood poplar aspen walnut cherry woods_______________________________________________________________________________________________________
Million cubic feet

96
Table 26—(continued).____________________________________________________________________________________________
South Central:5.0 - 6.9 978 385 252 21 284 7 34 93 1,143 7.0 - 8.9 1,437 581 399 27 489 20 59 94 1,325
9.0 - 10.9 1,677 704 437 33 684 32 87 109 1,292 11.0 - 12.9 1,419 673 415 55 800 36 74 60 1,141 13.0 - 14.9 1,330 661 405 41 876 43 57 66 1,012 15.0 - 16.9 994 547 346 45 915 53 53 55 77317.0 - 18.9 704 356 263 36 757 52 20 31 64519.0 - 20.9 463 188 195 19 624 73 15 12 43921.0 - 28.9 706 225 284 42 893 207 15 21 77529.0 + 70 42 27 3 139 116 0 3 161
Total 9,780 4,362 3,024 322 6,462 641 414 544 8,706
East total:5.0 - 6.9 1,793 1,193 1,495 321 927 1,600 117 674 4,166 7.0 - 8.9 2,545 1,630 2,108 612 1,591 2,580 210 965 5,406
9.0 - 10.9 3,057 1,927 2,335 832 2,284 3,279 292 1,204 5,324 11.0 - 12.9 2,751 1,950 2,147 959 2,893 3,049 313 1,138 4,135 13.0 - 14.9 2,554 1,785 1,862 824 3,158 2,297 294 1,062 3,189 15.0 - 16.9 1,939 1,460 1,470 642 3,306 1,413 218 810 2,243 17.0 - 18.9 1,340 943 1,034 394 2,766 710 126 582 1,605 19.0 - 20.9 891 565 722 277 2,133 414 84 359 1,077 21.0 - 28.9 1,346 702 997 338 3,187 726 71 457 1,832 29.0 + 172 151 186 47 502 403 7 64 501
____________________________________________________________________________
Total 18,388 12,305 14,356 5,245 22,748 16,472 1,733 7,317 29,478 ____________________________________________________________________________________________
Note: Data may not add to totals because of rounding. Total volume by State in this table may differ slightly from volume by Statein other tables because of rounding.
Tupelo Cotton- OtherSubregion and and wood easterndiameter class black Yellow- and Black Black hard-(in inches) Sweetgum gum Ash Basswood poplar aspen walnut cherry woods_______________________________________________________________________________________________________
Million cubic feet

97
Northeast:5.0 - 6.9 3,738 0 63 207 502 3 1,917 611 0 4367.0 - 8.9 5,298 0 101 375 864 2 2,375 944 0 637
9.0 - 10.9 5,167 0 121 372 1,097 5 1,946 1,032 0 59411.0 - 12.9 4,776 0 115 322 1,270 3 1,395 1,145 0 52613.0 - 14.9 3,908 0 87 208 1,394 1 763 1,098 0 35515.0 - 16.9 2,856 0 70 107 1,151 0 439 854 0 23517.0 - 18.9 1,900 0 44 37 942 0 192 561 1 12319.0 - 20.9 1,286 0 38 17 767 0 78 339 1 4721.0 - 28.9 2,073 0 19 8 1,439 0 72 503 4 2829.0 + 474 0 0 0 398 0 0 76 0 0
Total 31,476 0 658 1,653 9,823 14 9,178 7,164 6 2,980
North Central:5.0 - 6.9 3,543 0 84 53 585 270 1,425 39 0 1,087 7.0 - 8.9 4,140 0 134 90 944 433 1,265 63 0 1,210
9.0 - 10.9 3,322 0 164 89 831 398 824 107 0 90911.0 - 12.9 2,377 0 150 64 704 259 474 137 0 59013.0 - 14.9 1,580 0 110 34 565 121 246 154 1 34815.0 - 16.9 1,062 0 56 26 451 45 150 157 2 17517.0 - 18.9 769 0 20 14 401 16 91 135 3 8919.0 - 20.9 543 0 13 4 335 4 45 100 2 4121.0 - 28.9 891 0 3 0 640 2 37 168 9 3129.0 + 177 0 0 0 151 0 0 21 4 1
Total 18,402 0 734 374 5,608 1,547 4,557 1,079 21 4,481
Southeast:5.0 - 6.9 6,737 1,682 3,473 961 100 0 3 36 365 1187.0 - 8.9 9,702 2,222 5,106 1,532 148 0 4 35 557 98
9.0 - 10.9 9,315 1,963 4,773 1,600 180 0 5 34 671 9011.0 - 12.9 8,039 1,719 4,167 1,211 175 0 7 44 663 5313.0 - 14.9 6,436 1,401 3,371 802 177 0 2 33 603 4715.0 - 16.9 4,833 932 2,824 380 199 0 3 45 418 3317.0 - 18.9 3,082 517 1,877 169 177 0 0 41 286 1419.0 - 20.9 1,968 255 1,215 79 183 0 0 29 196 1221.0 - 28.9 2,294 196 1,347 64 319 0 0 67 293 929.0 + 353 2 89 2 67 0 1 36 155 1
Total 52,758 10,888 28,242 6,799 1,725 0 24 402 4,205 473
Table 27—Net volume of softwood growing stock on timberland in the Eastern United States by species,subregion, and diameter class, 2002
______________________________________________________________________________________________
Longleaf Loblolly White SpruceSubregion and and and Other and and Otherdiameter class slash shortleaf yellow red Jack balsam Eastern soft-(in inches) Total pines pines pines pines pine fir hemlock Cypress woods________________________________________________________________________________________________________
Million cubic feet

98
South Central:5.0 - 6.9 5,132 409 4,116 237 18 0 0 18 54 2797.0 - 8.9 7,983 683 6,393 436 21 0 0 24 127 299
9.0 - 10.9 8,348 853 6,550 525 30 0 0 32 153 20411.0 - 12.9 8,507 915 6,643 505 28 0 0 32 251 13313.0 - 14.9 7,737 813 6,070 372 48 0 0 32 324 7915.0 - 16.9 6,320 548 5,087 224 47 0 0 29 348 3617.0 - 18.9 4,372 329 3,532 116 29 0 0 27 321 2019.0 - 20.9 2,826 148 2,267 94 56 0 0 28 225 821.0 - 28.9 3,619 92 2,754 132 107 0 0 51 479 429.0 + 417 7 227 5 28 0 0 11 139 0
Total 55,260 4,799 43,639 2,646 411 0 0 285 2,421 1,061
East total:5.0 - 6.9 19,149 2,091 7,737 1,458 1,204 273 3,344 704 419 1,919 7.0 - 8.9 27,123 2,906 11,734 2,432 1,978 435 3,644 1,067 683 2,243
9.0 - 10.9 26,151 2,816 11,608 2,585 2,138 403 2,775 1,205 824 1,796 11.0 - 12.9 23,700 2,634 11,075 2,103 2,177 262 1,876 1,358 914 1,302 13.0 - 14.9 19,660 2,214 9,639 1,416 2,184 122 1,011 1,317 929 82815.0 - 16.9 15,071 1,480 8,037 737 1,849 45 592 1,086 768 47817.0 - 18.9 10,123 846 5,473 336 1,549 16 283 764 611 24619.0 - 20.9 6,622 403 3,532 194 1,341 4 123 496 423 10821.0 - 28.9 8,876 287 4,123 205 2,504 2 109 789 785 7329.0 + 1,420 9 316 7 643 0 2 144 297 2
_______________________________________________________________________________
Total 157,896 15,687 73,274 11,472 17,567 1,561 13,759 8,930 6,653 8,994______________________________________________________________________________________________
Note: Data may not add to totals because of rounding. Total volume by State in this table may differ slightly from volume by Statein other tables because of rounding.
Table 27—(continued).______________________________________________________________________________________________
Longleaf Loblolly White SpruceSubregion and and and Other and and Otherdiameter class slash shortleaf yellow red Jack balsam Eastern soft-(in inches) Total pines pines pines pines pine fir hemlock Cypress woods________________________________________________________________________________________________________
Million cubic feet
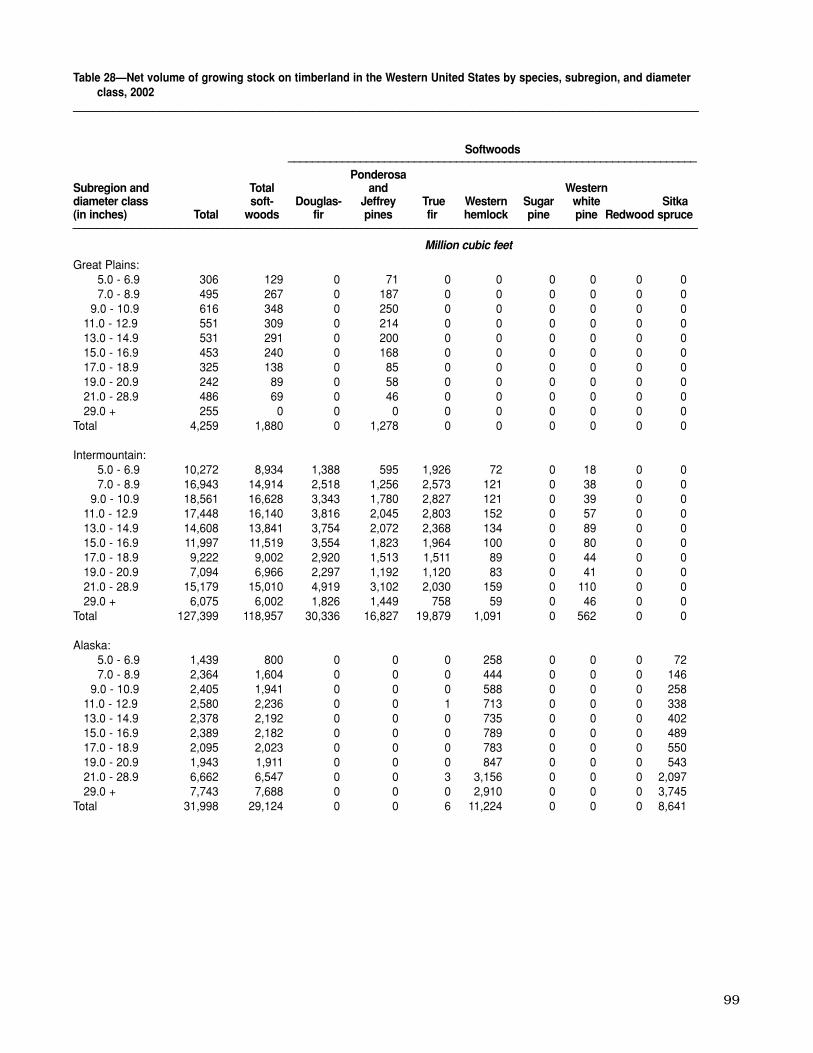
99
Great Plains:5.0 - 6.9 306 129 0 71 0 0 0 0 0 07.0 - 8.9 495 267 0 187 0 0 0 0 0 0
9.0 - 10.9 616 348 0 250 0 0 0 0 0 011.0 - 12.9 551 309 0 214 0 0 0 0 0 013.0 - 14.9 531 291 0 200 0 0 0 0 0 015.0 - 16.9 453 240 0 168 0 0 0 0 0 017.0 - 18.9 325 138 0 85 0 0 0 0 0 019.0 - 20.9 242 89 0 58 0 0 0 0 0 021.0 - 28.9 486 69 0 46 0 0 0 0 0 029.0 + 255 0 0 0 0 0 0 0 0 0
Total 4,259 1,880 0 1,278 0 0 0 0 0 0
Intermountain:5.0 - 6.9 10,272 8,934 1,388 595 1,926 72 0 18 0 07.0 - 8.9 16,943 14,914 2,518 1,256 2,573 121 0 38 0 0
9.0 - 10.9 18,561 16,628 3,343 1,780 2,827 121 0 39 0 011.0 - 12.9 17,448 16,140 3,816 2,045 2,803 152 0 57 0 013.0 - 14.9 14,608 13,841 3,754 2,072 2,368 134 0 89 0 015.0 - 16.9 11,997 11,519 3,554 1,823 1,964 100 0 80 0 017.0 - 18.9 9,222 9,002 2,920 1,513 1,511 89 0 44 0 019.0 - 20.9 7,094 6,966 2,297 1,192 1,120 83 0 41 0 021.0 - 28.9 15,179 15,010 4,919 3,102 2,030 159 0 110 0 029.0 + 6,075 6,002 1,826 1,449 758 59 0 46 0 0
Total 127,399 118,957 30,336 16,827 19,879 1,091 0 562 0 0
Alaska:5.0 - 6.9 1,439 800 0 0 0 258 0 0 0 727.0 - 8.9 2,364 1,604 0 0 0 444 0 0 0 146
9.0 - 10.9 2,405 1,941 0 0 0 588 0 0 0 25811.0 - 12.9 2,580 2,236 0 0 1 713 0 0 0 33813.0 - 14.9 2,378 2,192 0 0 0 735 0 0 0 40215.0 - 16.9 2,389 2,182 0 0 0 789 0 0 0 48917.0 - 18.9 2,095 2,023 0 0 0 783 0 0 0 55019.0 - 20.9 1,943 1,911 0 0 0 847 0 0 0 54321.0 - 28.9 6,662 6,547 0 0 3 3,156 0 0 0 2,097 29.0 + 7,743 7,688 0 0 0 2,910 0 0 0 3,745
Total 31,998 29,124 0 0 6 11,224 0 0 0 8,641
Table 28—Net volume of growing stock on timberland in the Western United States by species, subregion, and diameterclass, 2002
______________________________________________________________________________________________
Softwoods____________________________________________________________________
PonderosaSubregion and Total and Westerndiameter class soft- Douglas- Jeffrey True Western Sugar white Sitka(in inches) Total woods fir pines fir hemlock pine pine Redwood spruce________________________________________________________________________________________________________
Million cubic feet

100
Pacific Northwest:
5.0 - 6.9 4,478 3,735 1,211 335 540 607 6 12 0 17.0 - 8.9 8,375 6,926 2,540 584 956 1,235 7 18 0 4
9.0 - 10.9 10,943 9,043 3,603 864 1,169 1,645 15 36 1 511.0 - 12.9 12,457 10,369 4,418 989 1,369 1,925 18 31 1 913.0 - 14.9 12,096 10,403 4,815 1,013 1,316 1,820 15 25 2 915.0 - 16.9 11,670 10,247 4,996 946 1,290 1,729 15 28 1 1017.0 - 18.9 10,700 9,595 4,722 864 1,266 1,560 17 33 3 919.0 - 20.9 9,633 8,896 4,522 848 1,210 1,284 18 26 4 921.0 - 28.9 28,078 26,700 13,740 2,741 3,574 3,648 97 86 6 3929.0 + 40,205 39,678 24,889 2,378 3,571 4,319 474 78 15 233
Total 148,635 135,591 69,454 11,563 16,261 19,772 681 372 32 328
Pacific Southwest:5.0 - 6.9 1,535 805 298 123 228 3 17 2 40 07.0 - 8.9 2,435 1,365 428 250 399 1 34 4 67 0
9.0 - 10.9 3,142 2,019 579 398 607 3 60 7 134 011.0 - 12.9 3,468 2,451 641 512 747 5 64 13 169 013.0 - 14.9 3,738 2,755 727 563 832 0 86 10 209 015.0 - 16.9 3,889 3,072 776 650 914 5 75 9 298 017.0 - 18.9 3,900 3,164 777 679 934 3 116 18 284 019.0 - 20.9 3,844 3,208 802 660 891 0 128 13 373 021.0 - 28.9 12,817 11,187 2,807 2,333 3,036 7 565 60 1,296 029.0 + 19,414 18,329 6,656 2,794 4,099 5 1,545 156 1,728 0
Total 58,182 48,355 14,491 8,962 12,687 31 2,691 293 4,599 0
West total:5.0 - 6.9 18,029 14,403 2,896 1,123 2,695 941 22 32 40 737.0 - 8.9 30,612 25,076 5,486 2,278 3,928 1,800 41 60 67 150
9.0 - 10.9 35,666 29,978 7,524 3,293 4,603 2,357 75 82 135 26311.0 - 12.9 36,503 31,506 8,875 3,760 4,920 2,795 82 101 170 34713.0 - 14.9 33,352 29,482 9,296 3,847 4,516 2,689 101 125 211 41115.0 - 16.9 30,398 27,261 9,326 3,588 4,167 2,624 89 117 299 49917.0 - 18.9 26,243 23,922 8,418 3,141 3,712 2,435 133 95 287 55919.0 - 20.9 22,755 21,070 7,622 2,758 3,220 2,215 147 80 377 55221.0 - 28.9 63,223 59,513 21,466 8,223 8,643 6,970 663 256 1,302 2,136 29.0 + 73,692 71,697 33,371 6,621 8,428 7,293 2,019 279 1,743 3,978
__________________________________________________________________________________Total 370,472 333,907 114,281 38,630 48,832 32,118 3,373 1,227 4,631 8,969 ___________________________________________________________________________________________________
Table 28—(continued).______________________________________________________________________________________________
Softwoods_____________________________________________________________________
PonderosaSubregion and Total and Westerndiameter class soft- Douglas- Jeffrey True Western Sugar white Sitka(in inches) Total woods fir pines fir hemlock pine pine Redwood spruce________________________________________________________________________________________________________
Million cubic feet
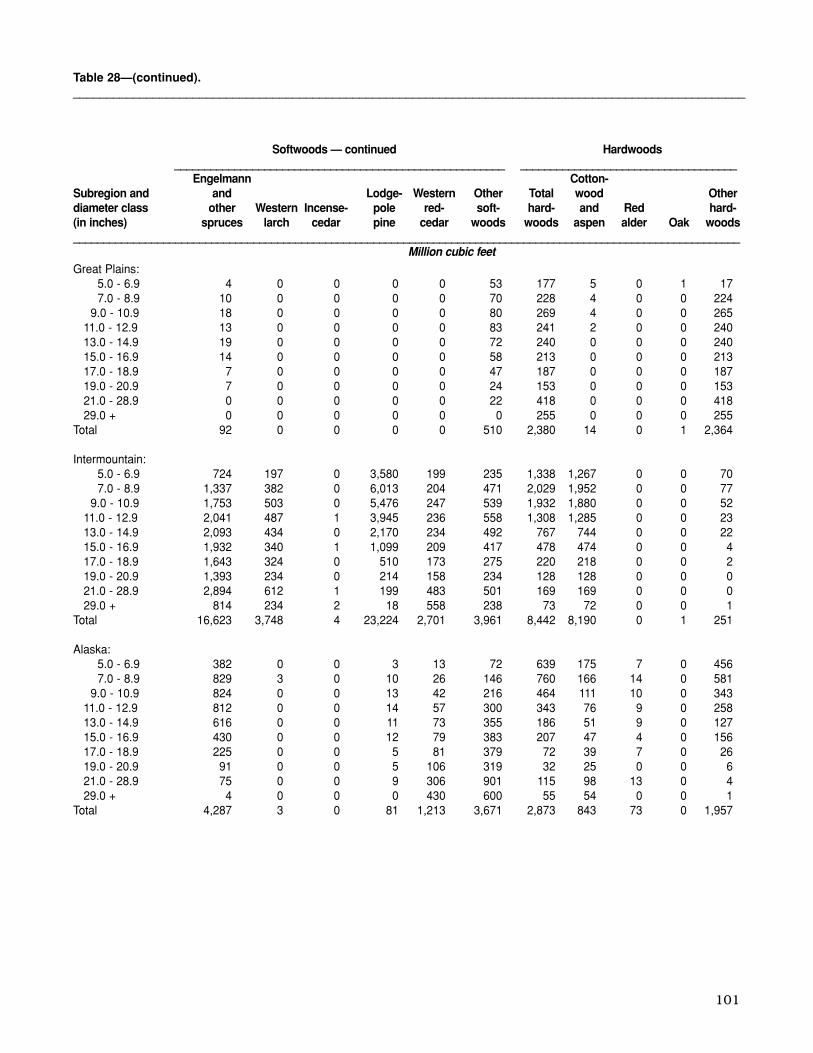
101
Table 28—(continued)._____________________________________________________________________________________________________
Softwoods — continued Hardwoods_______________________________________________________ ____________________________________
Engelmann Cotton-Subregion and and Lodge- Western Other Total wood Otherdiameter class other Western Incense- pole red- soft- hard- and Red hard-(in inches) spruces larch cedar pine cedar woods woods aspen alder Oak woods_______________________________________________________________________________________________________________
Million cubic feetGreat Plains:
5.0 - 6.9 4 0 0 0 0 53 177 5 0 1 177.0 - 8.9 10 0 0 0 0 70 228 4 0 0 224
9.0 - 10.9 18 0 0 0 0 80 269 4 0 0 26511.0 - 12.9 13 0 0 0 0 83 241 2 0 0 24013.0 - 14.9 19 0 0 0 0 72 240 0 0 0 24015.0 - 16.9 14 0 0 0 0 58 213 0 0 0 21317.0 - 18.9 7 0 0 0 0 47 187 0 0 0 18719.0 - 20.9 7 0 0 0 0 24 153 0 0 0 15321.0 - 28.9 0 0 0 0 0 22 418 0 0 0 41829.0 + 0 0 0 0 0 0 255 0 0 0 255
Total 92 0 0 0 0 510 2,380 14 0 1 2,364
Intermountain:5.0 - 6.9 724 197 0 3,580 199 235 1,338 1,267 0 0 707.0 - 8.9 1,337 382 0 6,013 204 471 2,029 1,952 0 0 77
9.0 - 10.9 1,753 503 0 5,476 247 539 1,932 1,880 0 0 5211.0 - 12.9 2,041 487 1 3,945 236 558 1,308 1,285 0 0 2313.0 - 14.9 2,093 434 0 2,170 234 492 767 744 0 0 2215.0 - 16.9 1,932 340 1 1,099 209 417 478 474 0 0 417.0 - 18.9 1,643 324 0 510 173 275 220 218 0 0 219.0 - 20.9 1,393 234 0 214 158 234 128 128 0 0 021.0 - 28.9 2,894 612 1 199 483 501 169 169 0 0 029.0 + 814 234 2 18 558 238 73 72 0 0 1
Total 16,623 3,748 4 23,224 2,701 3,961 8,442 8,190 0 1 251
Alaska:5.0 - 6.9 382 0 0 3 13 72 639 175 7 0 4567.0 - 8.9 829 3 0 10 26 146 760 166 14 0 581
9.0 - 10.9 824 0 0 13 42 216 464 111 10 0 34311.0 - 12.9 812 0 0 14 57 300 343 76 9 0 25813.0 - 14.9 616 0 0 11 73 355 186 51 9 0 12715.0 - 16.9 430 0 0 12 79 383 207 47 4 0 156 17.0 - 18.9 225 0 0 5 81 379 72 39 7 0 2619.0 - 20.9 91 0 0 5 106 319 32 25 0 0 621.0 - 28.9 75 0 0 9 306 901 115 98 13 0 429.0 + 4 0 0 0 430 600 55 54 0 0 1
Total 4,287 3 0 81 1,213 3,671 2,873 843 73 0 1,957

102
Table 28—(continued).____________________________________________________________________________________________________
Pacific Northwest:5.0 - 6.9 70 94 20 669 127 42 743 15 375 41 3127.0 - 8.9 118 170 30 938 227 100 1,449 34 865 44 506
9.0 - 10.9 190 240 33 843 248 152 1,900 65 1,195 60 58011.0 - 12.9 232 249 30 634 286 179 2,088 68 1,410 54 55613.0 - 14.9 243 252 28 404 286 175 1,694 44 1,119 66 46515.0 - 16.9 260 233 39 227 275 197 1,422 65 941 41 37517.0 - 18.9 247 230 25 145 280 195 1,105 62 667 48 32819.0 - 20.9 230 187 40 70 266 180 737 70 374 28 26521.0 - 28.9 559 436 145 63 983 585 1,378 206 530 63 57929.0 + 667 146 334 9 2,056 511 527 112 60 32 323
Total 2,817 2,236 723 4,001 5,034 2,317 13,044 739 7,536 479 4,289
Pacific Southwest:5.0 - 6.9 1 0 71 15 0 9 730 2 17 376 3357.0 - 8.9 0 0 119 47 1 15 1,070 5 41 549 475
9.0 - 10.9 1 0 126 76 0 28 1,123 8 56 565 49511.0 - 12.9 0 0 174 92 0 32 1,017 7 38 485 48813.0 - 14.9 4 0 178 110 0 36 983 7 28 472 47615.0 - 16.9 4 0 197 115 0 30 816 12 12 373 41917.0 - 18.9 0 0 205 104 0 43 737 2 5 364 36619.0 - 20.9 3 0 185 111 0 41 636 5 10 282 33921.0 - 28.9 10 0 664 310 0 98 1,630 19 15 818 77829.0 + 14 0 964 215 0 153 1,085 5 8 648 424
Total 37 0 2,884 1,195 1 485 9,826 71 230 4,932 4,594
West total:5.0 - 6.9 1,182 291 91 4,267 338 412 3,626 1,464 399 418 1,345 7.0 - 8.9 2,294 555 149 7,007 459 803 5,536 2,160 921 593 1,862
9.0 - 10.9 2,785 743 159 6,407 538 1,015 5,688 2,067 1,261 626 1,734 11.0 - 12.9 3,099 736 205 4,684 578 1,152 4,997 1,438 1,456 539 1,564 13.0 - 14.9 2,975 686 206 2,695 593 1,130 3,869 846 1,155 539 1,330 15.0 - 16.9 2,640 573 237 1,453 563 1,085 3,137 598 958 415 1,167 17.0 - 18.9 2,121 554 229 765 534 939 2,320 321 679 412 90819.0 - 20.9 1,723 422 225 401 530 798 1,685 228 384 310 76321.0 - 28.9 3,538 1,048 810 580 1,772 2,107 3,710 492 559 881 1,778 29.0 + 1,499 380 1,300 242 3,044 1,501 1,995 243 67 680 1,004
______________________________________________________________________________________Total 23,856 5,987 3,611 28,501 8,949 10,943 36,565 9,857 7,839 5,414 13,456 _________________________________________________________________________________________________________
Note: Data may not add to totals because of rounding. Total volume by State in this table may differ slightly from volume by State in othertables because of rounding.
Softwoods — continued Hardwoods_______________________________________________________ ____________________________________
Engelmann Cotton-Subregion and and Lodge- Western Other Total wood Otherdiameter class other Western Incense- pole red- soft- hard- and Red hard-(in inches) spruces larch cedar pine cedar woods woods aspen alder Oak woods_______________________________________________________________________________________________________________
Million cubic feet

103
North:White-red-jack pine 19,314 4,189 14,914 4,758 1,849 2,812 14,556 2,340 12,102Spruce-fir 17,259 478 16,576 4,805 228 4,514 12,455 250 12,062Longleaf-slash pine 0 0 0 0 0 0 0 0 0Loblolly-shortleaf pine 2,214 357 1,857 727 142 585 1,486 215 1,272Oak-pine 4,844 320 4,523 774 95 679 4,070 226 3,844Oak-hickory 67,861 239 67,309 11,283 55 11,138 56,578 184 56,171Oak-gum-cypress 1,000 11 989 167 11 156 834 0 834Elm-ash-cottonwood 11,290 89 11,148 2,143 20 2,106 9,147 69 9,042Maple-beech-birch 76,029 226 74,390 14,365 80 13,940 61,663 147 60,450Aspen-birch 17,804 57 17,126 6,458 15 6,254 11,345 42 10,872Nonstocked 14 0 12 6 0 5 8 0 7
______________________________________________________________________North total: 217,628 5,966 208,845 45,486 2,494 42,190 172,142 3,473 166,655
South:White-red-jack pine 1,808 259 1,549 536 52 484 1,272 208 1,065Spruce-fir 16 0 16 7 0 7 9 0 9Longleaf-slash pine 13,621 6,026 7,595 3,169 561 2,608 10,452 5,465 4,987Loblolly-shortleaf pine 68,152 21,174 46,978 9,331 1,350 7,981 58,820 19,824 38,996Oak-pine 33,646 1,796 31,851 4,963 179 4,784 28,683 1,617 27,067Oak-hickory 97,016 392 96,624 12,946 47 12,899 84,069 344 83,725Oak-gum-cypress 48,378 51 48,327 5,925 0 5,925 42,453 50 42,403Elm-ash-cottonwood 3,594 47 3,546 478 0 478 3,115 47 3,068Maple-beech-birch 1,722 2 1,719 331 0 331 1,390 2 1,388Aspen-birch 0 0 0 0 0 0 0 0 0Nonstocked 12 1 11 1 0 1 12 1 11
______________________________________________________________________South total: 267,965 29,749 238,216 37,688 2,189 35,498 230,277 27,559 202,718
Westernb:Douglas-fir 107,187 b b 77,029 b b 30,157 b b
Ponderosa pine 40,401 b b 20,660 b b 19,742 b b
Western white pine 318 b b 273 b b 46 b b
Fir-spruce 68,394 b b 59,882 b b 8,511 b b
Hemlock-Sitka spruce 56,190 b b 42,953 b b 13,237 b b
Larch 3,059 b b 2,327 b b 732 b b
Lodgepole pine 27,467 b b 24,047 b b 3,421 b b
Redwood 4,990 b b 634 b b 4,356 b b
Other softwoods 21,205 b b 20,835 b b 369 b b
Western hardwoods 40,639 b b 18,593 b b 22,046 b b
Pinyon-juniper 347 b b 230 b b 117 b b
Nonstocked 267 b b 111 b b 156 b b______________________________________________________________________
Western total: 370,464 b b 267,574 b b 102,890 b b______________________________________________________________________
United States: 856,057 b b 350,748 b b 505,309 b b___________________________________________________________________________________________a Forest type reflects the current dominant species by plurality of stocking and may not reflect the actual species planted at the time of
stand origin.b Approximately 13.6 million acres of forest in the West are planted, primarily to augment natural regeneration after a harvest and
ensure adequate stocking of desired species. The species planted are usually native, making these stands difficult to detect duringfield sampling. Additionally, there are thousands of acres of more traditional plantations such as those found in the East that are notcurrently identified during field sampling. Refer to the text accompanying this report for a discussion of planted forest in the West.
Note: Data may not add to totals because of rounding.
Table 29—Net volume of growing stock on planted and natural timberland in the Eastern and WesternUnited States by forest type group and major ownership group, 2002
___________________________________________________________________________________________
All ownership groups Public ownerships Private ownerships_______________________ _____________________ ___________________
Forest type groupa Total Planted Natural Total Planted Natural Total Planted Natural___________________________________________________________________________________________
Million cubic feet

104
North:Northeast 2002 31,476 3,738 5,298 5,167 4,776 3,908 2,856 1,900 1,286 2,073 474
1997 30,945 3,744 5,318 5,133 4,751 3,810 2,783 1,827 1,227 1,935 4171987 31,609 4,751 6,404 6,043 4,919 3,351 2,288 1,426 904 1,291 2321977 30,991 7,639 7,255 5,431 3,877 2,547 1,711 1,018 607 767 1381953 20,028 4,628 4,734 3,147 2,498 1,791 1,190 721 527 702 90
North Central 2002 18,402 3,543 4,140 3,322 2,377 1,580 1,062 769 543 891 1771997 18,431 3,571 4,149 3,316 2,374 1,579 1,058 772 542 893 1781987 16,009 3,429 3,816 2,939 1,964 1,285 865 609 426 598 811977 12,859 3,163 3,103 2,190 1,430 949 695 491 315 461 601953 7,025 1,802 1,592 1,167 862 516 348 261 161 274 41
North total: 2002 49,878 7,281 9,438 8,488 7,153 5,487 3,918 2,669 1,829 2,963 6511997 49,376 7,314 9,467 8,449 7,125 5,389 3,841 2,599 1,769 2,828 5951987 47,618 8,180 10,220 8,982 6,883 4,636 3,153 2,035 1,330 1,889 3131977 43,850 10,802 10,358 7,621 5,307 3,496 2,406 1,509 922 1,228 1981953 27,053 6,430 6,326 4,314 3,360 2,307 1,538 982 688 976 131
South:Southeast 2002 52,758 6,737 9,702 9,315 8,039 6,436 4,833 3,082 1,968 2,294 353
1997 51,861 6,621 9,358 9,146 8,043 6,447 4,732 3,032 1,888 2,293 3011987 52,619 6,483 9,420 9,878 8,847 6,834 4,544 2,886 1,640 1,845 2421977 51,008 6,929 9,384 9,780 8,535 6,467 4,337 2,500 1,408 1,487 1811953 35,548 4,547 6,776 7,473 6,574 4,265 2,550 1,464 805 969 125
South Central 2002 55,260 5,132 7,983 8,348 8,507 7,737 6,320 4,372 2,826 3,619 4171997 52,985 4,772 7,530 8,014 8,364 7,602 6,117 4,172 2,677 3,344 3931987 52,994 4,765 7,521 8,985 8,978 7,515 5,788 3,885 2,418 2,844 2981977 50,200 5,178 7,691 8,771 8,451 6,923 5,126 3,406 2,082 2,340 2321953 24,914 2,596 3,834 4,554 4,338 3,473 2,556 1,645 886 910 122
South total: 2002 108,018 11,868 17,685 17,663 16,546 14,173 11,153 7,454 4,794 5,913 7691997 104,846 11,393 16,888 17,160 16,407 14,049 10,849 7,204 4,564 5,637 6941987 105,613 11,248 16,941 18,863 17,825 14,349 10,332 6,771 4,058 4,689 5401977 101,208 12,107 17,075 18,551 16,986 13,390 9,463 5,906 3,490 3,827 4131953 60,462 7,143 10,610 12,027 10,912 7,738 5,106 3,109 1,691 1,879 247
Rocky Mountain:Great Plains 2002 1,880 129 267 348 309 291 240 138 89 69 0
1997 1,563 145 267 271 266 221 157 107 64 63 21987 1,912 162 278 334 339 285 215 156 74 69 11977 1,799 147 267 324 315 263 195 130 83 72 21953 1,309 68 132 174 197 177 176 136 111 131 8
Intermountain 2002 118,957 8,934 14,914 16,628 16,140 13,841 11,519 9,002 6,966 15,010 6,0021997 113,118 9,164 14,678 15,933 15,176 12,897 10,605 8,428 6,485 14,056 5,6951987 98,386 8,639 12,318 13,388 12,425 10,685 8,957 7,142 5,603 13,161 6,0741977 93,318 9,383 11,772 11,883 10,950 9,682 8,172 6,912 5,681 13,305 5,5801953 86,237 8,573 8,455 8,956 8,968 8,542 7,858 6,884 5,886 14,935 7,178
Table 30—Net volume of softwood growing stock on timberland in the United States by diameter class, region, and subregion,2002, 1997, 1987, 1977, and 1953
____________________________________________________________________________________________________
Diameter class(Inches)
____________________________________________________________________________
5.0 7.0 9.0 11.0 13.0 15.0 17.0 19.0 21.0Region to to to to to to to to toand subregion Year Total 6.9 8.9 10.9 12.9 14.9 16.9 18.9 20.9 28.9 29.0+_________________________________________________________________________________________________________________
Million cubic feet

105
Table 30—(continued)._____________________________________________________________________________________________________
Rocky Mountain 2002 120,837 9,063 15,180 16,976 16,449 14,132 11,760 9,141 7,055 15,079 6,002total: 1997 114,681 9,309 14,945 16,204 15,442 13,118 10,762 8,535 6,549 14,120 5,697
1987 100,298 8,801 12,596 13,722 12,764 10,970 9,172 7,298 5,677 13,230 6,0751977 95,111 9,529 12,038 12,206 11,264 9,944 8,366 7,041 5,763 13,376 5,5811953 87,546 8,641 8,587 9,130 9,165 8,719 8,034 7,020 5,997 15,066 7,186
Pacific Coast:Alaska 2002 29,124 800 1,604 1,941 2,236 2,192 2,182 2,023 1,911 6,547 7,688
1997 29,810 743 1,538 1,830 2,044 2,162 1,995 2,052 2,008 6,908 8,5301987 37,051 956 1,934 2,394 2,705 2,675 2,662 2,750 2,506 8,797 9,6701977 48,277 1,346 1,849 2,754 3,521 3,996 4,116 3,685 3,424 11,547 12,0421953 49,149 1,103 1,495 2,279 3,097 3,619 3,963 3,792 3,624 12,414 13,764
Pacific Northwest 2002 135,591 3,735 6,926 9,043 10,369 10,403 10,247 9,595 8,896 26,700 39,6781997 135,969 3,767 6,983 9,101 10,397 10,471 10,273 9,629 8,884 26,732 39,7321987 130,684 4,154 7,662 9,780 10,863 10,636 10,266 9,527 8,533 24,926 34,3371977 132,535 5,821 7,235 8,235 8,800 8,719 8,682 8,493 7,859 26,299 42,3921953 149,574 4,264 5,593 6,366 7,370 7,242 8,090 7,844 7,967 29,507 65,331
Pacific Southwest 2002 48,355 805 1,365 2,019 2,451 2,755 3,072 3,164 3,208 11,187 18,3291997 49,172 820 1,444 2,064 2,462 2,676 3,070 3,134 3,201 11,369 18,9311987 46,311 891 1,417 1,754 2,135 2,383 2,627 2,791 2,664 10,222 19,4291977 45,979 769 1,259 1,613 1,885 2,213 2,387 2,456 2,511 10,016 20,8701953 58,010 766 1,245 1,603 1,835 2,055 2,160 2,269 2,282 10,141 33,654
Pacific Coast total: 2002 213,070 5,341 9,895 13,002 15,056 15,350 15,502 14,782 14,015 44,434 65,6951997 214,951 5,330 9,966 12,994 14,903 15,309 15,339 14,815 14,093 45,009 67,1931987 214,046 6,001 11,013 13,928 15,703 15,694 15,555 15,068 13,703 43,945 63,4361977 226,791 7,936 10,343 12,602 14,206 14,928 15,185 14,634 13,794 47,862 75,3041953 256,733 6,133 8,333 10,248 12,302 12,916 14,213 13,905 13,873 52,062 112,749
______________________________________________________________________________________________
United States: 2002 491,803 33,552 52,199 56,129 55,206 49,142 42,332 34,045 27,692 68,389 73,1171997 483,854 33,346 51,266 54,808 53,877 47,865 40,791 33,153 26,975 67,593 74,1791987 467,575 34,230 50,770 55,495 53,175 45,649 38,212 31,172 24,768 63,753 70,3641977 466,960 40,374 49,812 50,980 47,763 41,758 35,419 29,089 23,968 66,295 81,4951953 431,794 28,346 33,857 35,719 35,737 31,679 28,892 25,016 22,248 69,981 120,314
_________________________________________________________________________________________________________________
Note: Data may not add to totals because of rounding. Total volume by subregion in this table may differ slightly from total volume by subregion in other tablesbecause of rounding.
Diameter class(Inches)
____________________________________________________________________________
5.0 7.0 9.0 11.0 13.0 15.0 17.0 19.0 21.0Region to to to to to to to to toand subregion Year Total 6.9 8.9 10.9 12.9 14.9 16.9 18.9 20.9 28.9 29.0+_________________________________________________________________________________________________________________
Million cubic feet

106
North:Northeast 2002 92,191 7,929 13,139 15,694 14,337 12,344 9,436 6,497 4,408 6,769 1,639
1997 90,234 8,137 13,420 15,604 14,110 12,048 9,054 6,165 4,145 6,160 1,3911987 80,524 9,280 13,288 14,328 12,619 10,359 7,344 5,022 3,090 4,402 7941977 67,320 10,488 12,220 12,275 9,872 7,790 5,458 3,558 2,240 2,968 4511953 43,197 6,926 7,703 7,332 5,712 4,652 3,578 2,532 1,660 2,709 395
North Central 2002 75,555 7,325 10,501 12,198 11,386 9,813 7,580 5,450 3,675 6,093 1,5351997 74,640 7,436 10,575 12,210 11,341 9,678 7,475 5,305 3,499 5,798 1,3231987 61,896 8,177 10,121 10,432 9,074 7,103 5,452 3,829 2,604 4,076 1,0281977 51,838 7,773 9,665 9,338 7,414 5,925 4,203 2,775 1,753 2,468 5211953 33,498 4,766 5,925 6,037 4,359 3,630 2,705 1,928 1,319 2,401 428
North total: 2002 167,746 15,253 23,640 27,892 25,724 22,157 17,016 11,947 8,083 12,861 3,1741997 164,874 15,573 23,995 27,814 25,451 21,726 16,529 11,471 7,644 11,958 2,7141987 142,420 17,457 23,409 24,760 21,693 17,462 12,796 8,851 5,694 8,478 1,8221977 119,158 18,261 21,885 21,613 17,286 13,715 9,661 6,333 3,993 5,436 9721953 76,695 11,692 13,628 13,369 10,071 8,282 6,283 4,460 2,979 5,110 823
South:Southeast 2002 71,244 5,514 7,805 9,525 10,139 9,669 8,430 6,387 4,688 7,441 1,647
1997 71,124 5,598 7,861 9,542 10,208 9,781 8,365 6,387 4,613 7,219 1,5501987 68,154 5,963 8,156 9,556 10,345 9,516 7,805 5,787 3,815 5,947 1,2641977 60,691 6,005 8,037 9,192 9,239 8,346 6,500 4,616 2,985 4,766 1,0051953 41,533 3,558 5,218 6,391 6,315 5,900 4,309 3,293 2,226 3,603 720
South Central 2002 88,703 6,832 10,117 12,316 12,075 11,838 10,253 7,965 5,754 9,523 2,0311997 80,392 6,605 9,823 11,838 11,180 10,815 8,941 6,848 4,877 7,807 1,6571987 70,874 7,385 9,914 11,340 10,493 9,487 7,505 5,295 3,430 5,129 8911977 61,474 7,426 8,978 9,843 8,852 8,019 6,404 4,380 2,782 4,055 7331953 46,475 4,529 6,170 7,308 7,028 6,304 4,901 3,553 2,354 3,739 589
South total: 2002 159,947 12,346 17,922 21,841 22,214 21,508 18,683 14,352 10,441 16,964 3,6771997 151,516 12,202 17,684 21,380 21,389 20,596 17,306 13,235 9,490 15,026 3,2071987 139,028 13,348 18,070 20,896 20,838 19,003 15,310 11,082 7,245 11,076 2,1551977 122,165 13,431 17,015 19,035 18,091 16,365 12,904 8,996 5,767 8,821 1,7381953 88,008 8,087 11,388 13,699 13,343 12,204 9,210 6,846 4,580 7,342 1,309
Rocky Mountain:Great Plains 2002 2,380 177 228 269 241 240 213 187 153 418 255
1997 2,368 175 225 265 240 239 212 187 153 418 2551987 1,468 168 158 177 148 136 116 96 82 230 1611977 1,273 133 149 169 155 136 114 90 76 230 211953 1,098 92 130 139 106 121 113 97 78 199 22
Intermountain 2002 8,442 1,338 2,029 1,932 1,308 767 478 220 128 169 731997 8,250 1,462 1,933 1,837 1,222 750 439 216 139 178 741987 6,213 1,086 1,423 1,424 888 550 317 167 124 163 751977 4,865 797 1,164 1,007 738 462 278 175 95 133 141953 3,976 444 802 817 660 467 298 188 114 158 25
Table 31—Net volume of hardwood growing stock on timberland in the United States by diameter class, region, and subregion,2002, 1997, 1987, 1977, and 1953
____________________________________________________________________________________________________
Diameter class(Inches)
____________________________________________________________________________
5.0 7.0 9.0 11.0 13.0 15.0 17.0 19.0 21.0Region to to to to to to to to toand subregion Year Total 6.9 8.9 10.9 12.9 14.9 16.9 18.9 20.9 28.9 29.0+_________________________________________________________________________________________________________________
Million cubic feet

107
Table 31—(continued)._____________________________________________________________________________________________________
Rocky Mountain 2002 10,822 1,515 2,257 2,201 1,549 1,007 691 407 281 587 328total: 1997 10,618 1,636 2,158 2,103 1,461 989 652 402 292 596 328
1987 7,681 1,254 1,581 1,601 1,036 686 433 263 206 393 2361977 6,138 930 1,313 1,176 893 598 392 265 171 363 351953 5,074 536 932 956 766 588 411 285 192 357 47
Pacific Coast:Alaska 2002 2,873 639 760 464 343 186 207 72 32 115 55
1997 3,145 583 710 466 359 224 281 124 102 233 631987 4,209 664 1,030 675 562 335 337 187 135 216 701977 4,222 616 915 744 416 373 304 203 148 313 1901953 4,189 610 874 720 407 370 305 208 155 335 205
Pacific Northwest 2002 13,044 743 1,449 1,900 2,088 1,694 1,422 1,105 737 1,378 5271997 13,049 742 1,454 1,905 2,083 1,698 1,417 1,113 731 1,380 5241987 13,005 826 1,567 2,079 2,116 1,813 1,364 1,020 633 1,151 4381977 10,522 1,199 1,475 1,594 1,520 1,299 971 762 511 924 2671953 7,076 1,037 1,062 1,049 961 807 529 458 321 671 187
Pacific Southwest 2002 9,826 730 1,070 1,123 1,017 983 816 737 636 1,630 1,0851997 8,613 641 892 876 948 882 704 661 583 1,548 8791987 7,740 551 798 823 781 750 699 626 485 1,412 8191977 3,891 254 411 415 391 368 365 299 266 720 4021953 3,048 193 320 250 281 301 257 242 203 536 466
Pacific Coast total: 2002 25,743 2,112 3,279 3,487 3,448 2,862 2,446 1,913 1,405 3,123 1,6671997 24,808 1,966 3,055 3,247 3,391 2,804 2,403 1,899 1,416 3,162 1,4661987 24,954 2,041 3,395 3,577 3,459 2,898 2,400 1,833 1,253 2,779 1,3271977 18,635 2,069 2,801 2,753 2,327 2,040 1,640 1,264 925 1,957 8591953 14,313 1,840 2,256 2,019 1,649 1,478 1,091 908 679 1,542 858_____________________________________________________________________________________________
United States: 2002 364,259 31,225 47,098 55,420 52,935 47,534 38,836 28,619 20,209 33,535 8,8461997 351,815 31,377 46,892 54,544 51,692 46,115 36,890 27,006 18,843 30,742 7,7151987 314,083 34,100 46,455 50,834 47,026 40,049 30,939 22,029 14,398 22,726 5,5401977 266,096 34,691 43,014 44,577 38,597 32,718 24,597 16,858 10,856 16,577 3,6041953 184,090 22,155 28,204 30,043 25,829 22,552 16,995 12,499 8,430 14,351 3,037
_________________________________________________________________________________________________________________
Note: Data may not add to totals because of rounding. Total volume by subregion in this table may differ slightly from total volume by subregion in other tablesbecause of rounding.
Diameter class(Inches)
____________________________________________________________________________
5.0 7.0 9.0 11.0 13.0 15.0 17.0 19.0 21.0Region to to to to to to to to toand subregion Year Total 6.9 8.9 10.9 12.9 14.9 16.9 18.9 20.9 28.9 29.0+_________________________________________________________________________________________________________________
Million cubic feet
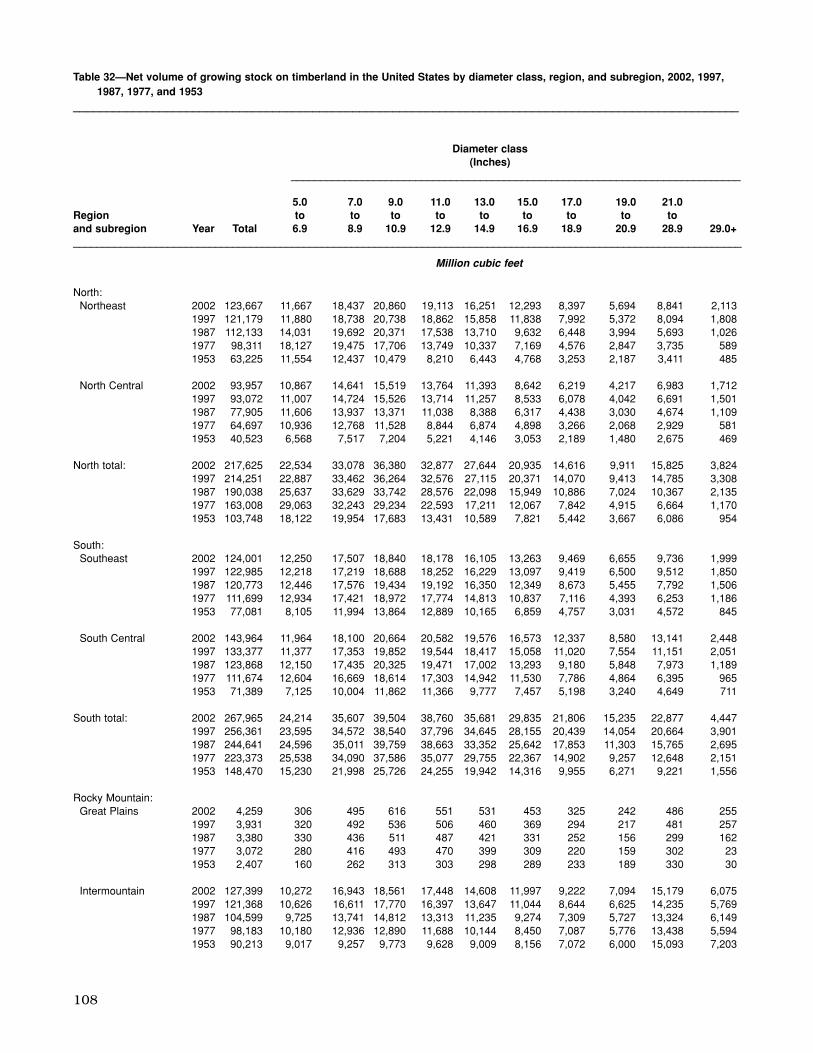
108
North:Northeast 2002 123,667 11,667 18,437 20,860 19,113 16,251 12,293 8,397 5,694 8,841 2,113
1997 121,179 11,880 18,738 20,738 18,862 15,858 11,838 7,992 5,372 8,094 1,8081987 112,133 14,031 19,692 20,371 17,538 13,710 9,632 6,448 3,994 5,693 1,0261977 98,311 18,127 19,475 17,706 13,749 10,337 7,169 4,576 2,847 3,735 5891953 63,225 11,554 12,437 10,479 8,210 6,443 4,768 3,253 2,187 3,411 485
North Central 2002 93,957 10,867 14,641 15,519 13,764 11,393 8,642 6,219 4,217 6,983 1,7121997 93,072 11,007 14,724 15,526 13,714 11,257 8,533 6,078 4,042 6,691 1,5011987 77,905 11,606 13,937 13,371 11,038 8,388 6,317 4,438 3,030 4,674 1,1091977 64,697 10,936 12,768 11,528 8,844 6,874 4,898 3,266 2,068 2,929 5811953 40,523 6,568 7,517 7,204 5,221 4,146 3,053 2,189 1,480 2,675 469
North total: 2002 217,625 22,534 33,078 36,380 32,877 27,644 20,935 14,616 9,911 15,825 3,8241997 214,251 22,887 33,462 36,264 32,576 27,115 20,371 14,070 9,413 14,785 3,3081987 190,038 25,637 33,629 33,742 28,576 22,098 15,949 10,886 7,024 10,367 2,1351977 163,008 29,063 32,243 29,234 22,593 17,211 12,067 7,842 4,915 6,664 1,1701953 103,748 18,122 19,954 17,683 13,431 10,589 7,821 5,442 3,667 6,086 954
South:Southeast 2002 124,001 12,250 17,507 18,840 18,178 16,105 13,263 9,469 6,655 9,736 1,999
1997 122,985 12,218 17,219 18,688 18,252 16,229 13,097 9,419 6,500 9,512 1,8501987 120,773 12,446 17,576 19,434 19,192 16,350 12,349 8,673 5,455 7,792 1,5061977 111,699 12,934 17,421 18,972 17,774 14,813 10,837 7,116 4,393 6,253 1,1861953 77,081 8,105 11,994 13,864 12,889 10,165 6,859 4,757 3,031 4,572 845
South Central 2002 143,964 11,964 18,100 20,664 20,582 19,576 16,573 12,337 8,580 13,141 2,4481997 133,377 11,377 17,353 19,852 19,544 18,417 15,058 11,020 7,554 11,151 2,0511987 123,868 12,150 17,435 20,325 19,471 17,002 13,293 9,180 5,848 7,973 1,1891977 111,674 12,604 16,669 18,614 17,303 14,942 11,530 7,786 4,864 6,395 9651953 71,389 7,125 10,004 11,862 11,366 9,777 7,457 5,198 3,240 4,649 711
South total: 2002 267,965 24,214 35,607 39,504 38,760 35,681 29,835 21,806 15,235 22,877 4,4471997 256,361 23,595 34,572 38,540 37,796 34,645 28,155 20,439 14,054 20,664 3,9011987 244,641 24,596 35,011 39,759 38,663 33,352 25,642 17,853 11,303 15,765 2,6951977 223,373 25,538 34,090 37,586 35,077 29,755 22,367 14,902 9,257 12,648 2,1511953 148,470 15,230 21,998 25,726 24,255 19,942 14,316 9,955 6,271 9,221 1,556
Rocky Mountain:Great Plains 2002 4,259 306 495 616 551 531 453 325 242 486 255
1997 3,931 320 492 536 506 460 369 294 217 481 2571987 3,380 330 436 511 487 421 331 252 156 299 1621977 3,072 280 416 493 470 399 309 220 159 302 231953 2,407 160 262 313 303 298 289 233 189 330 30
Intermountain 2002 127,399 10,272 16,943 18,561 17,448 14,608 11,997 9,222 7,094 15,179 6,0751997 121,368 10,626 16,611 17,770 16,397 13,647 11,044 8,644 6,625 14,235 5,7691987 104,599 9,725 13,741 14,812 13,313 11,235 9,274 7,309 5,727 13,324 6,1491977 98,183 10,180 12,936 12,890 11,688 10,144 8,450 7,087 5,776 13,438 5,5941953 90,213 9,017 9,257 9,773 9,628 9,009 8,156 7,072 6,000 15,093 7,203
Table 32—Net volume of growing stock on timberland in the United States by diameter class, region, and subregion, 2002, 1997,1987, 1977, and 1953
____________________________________________________________________________________________________
Diameter class(Inches)
____________________________________________________________________________
5.0 7.0 9.0 11.0 13.0 15.0 17.0 19.0 21.0Region to to to to to to to to toand subregion Year Total 6.9 8.9 10.9 12.9 14.9 16.9 18.9 20.9 28.9 29.0+_________________________________________________________________________________________________________________
Million cubic feet

109
Table 32—(continued)._____________________________________________________________________________________________________
Rocky Mountain 2002 131,658 10,577 17,437 19,177 17,999 15,139 12,450 9,547 7,336 15,665 6,330total: 1997 125,299 10,945 17,103 18,306 16,903 14,107 11,414 8,938 6,842 14,716 6,026
1987 107,979 10,055 14,177 15,323 13,800 11,656 9,605 7,561 5,883 13,623 6,3111977 101,255 10,460 13,352 13,383 12,158 10,543 8,759 7,307 5,935 13,740 5,6171953 92,620 9,177 9,519 10,086 9,931 9,307 8,445 7,305 6,189 15,423 7,233
Pacific Coast:Alaska 2002 31,998 1,439 2,364 2,405 2,580 2,378 2,389 2,095 1,943 6,662 7,743
1997 32,955 1,326 2,248 2,296 2,403 2,387 2,277 2,175 2,110 7,141 8,5931987 41,260 1,620 2,964 3,069 3,267 3,010 2,999 2,937 2,641 9,013 9,7401977 52,499 1,962 2,764 3,498 3,937 4,369 4,420 3,888 3,572 11,860 12,2321953 53,338 1,713 2,369 2,999 3,504 3,989 4,268 4,000 3,779 12,749 13,969
Pacific Northwest 2002 148,635 4,478 8,375 10,943 12,457 12,096 11,670 10,700 9,633 28,078 40,2051997 149,018 4,509 8,438 11,006 12,480 12,169 11,690 10,743 9,615 28,112 40,2561987 143,698 4,979 9,230 11,859 12,989 12,450 11,630 10,546 9,166 26,077 34,7751977 143,057 7,020 8,710 9,829 10,320 10,018 9,653 9,255 8,370 27,223 42,6591953 156,650 5,301 6,655 7,415 8,331 8,049 8,619 8,302 8,288 30,178 65,518
Pacific Southwest 2002 58,182 1,535 2,435 3,142 3,468 3,738 3,889 3,900 3,844 12,817 19,4141997 57,785 1,461 2,336 2,939 3,411 3,557 3,775 3,795 3,784 12,917 19,8101987 54,051 1,442 2,215 2,577 2,916 3,133 3,326 3,417 3,149 11,634 20,2481977 49,870 1,023 1,670 2,028 2,276 2,581 2,752 2,755 2,777 10,736 21,2721953 61,058 959 1,565 1,853 2,116 2,356 2,417 2,511 2,485 10,677 34,120
Pacific Coast total: 2002 238,814 7,452 13,175 16,489 18,504 18,213 17,948 16,695 15,419 47,557 67,3611997 239,758 7,296 13,022 16,241 18,294 18,113 17,742 16,713 15,509 48,170 68,6591987 239,009 8,041 14,409 17,505 19,172 18,593 17,955 16,900 14,956 46,724 64,7631977 245,426 10,005 13,144 15,355 16,533 16,968 16,825 15,898 14,719 49,819 76,1631953 271,046 7,973 10,589 12,267 13,951 14,394 15,304 14,813 14,552 53,604 113,607
______________________________________________________________________________________________
United States: 2002 856,062 64,778 99,297 111,549 108,141 96,677 81,168 62,665 47,902 101,924 81,9631997 835,669 64,723 98,158 109,352 105,569 93,981 77,681 60,159 45,818 98,335 81,8941987 781,667 68,329 97,226 106,329 100,211 85,699 69,151 53,200 39,166 86,479 75,9041977 733,062 75,066 92,829 95,558 86,361 74,477 60,018 45,949 34,826 82,871 85,1011953 615,884 50,502 62,060 65,762 61,568 54,232 45,886 37,515 30,679 84,334 123,350
_________________________________________________________________________________________________________________
Note: Data may not add to totals because of rounding. Total volume by subregion in this table may differ slightly from total volume by subregion in other tablesbecause of rounding.
Diameter class(Inches)
____________________________________________________________________________
5.0 7.0 9.0 11.0 13.0 15.0 17.0 19.0 21.0Region to to to to to to to to toand subregion Year Total 6.9 8.9 10.9 12.9 14.9 16.9 18.9 20.9 28.9 29.0+_________________________________________________________________________________________________________________
Million cubic feet

110
North:Northeast:Softwoods 274,607 273,609 257,140 191,544 150,800 7,705 7,549 5,393 1,746 3,570 18,814 16,790 14,875 10,561 6,911Hardwoods 535,577 514,142 418,217 356,773 248,200 27,500 26,217 15,518 10,823 9,810 82,359 73,113 51,156 33,580 21,982Total 810,272 787,750 675,357 548,317 399,000 35,201 33,766 20,911 12,569 13,380 101,155 89,902 66,031 44,141 28,893
North Central:Softwoods 182,572 181,907 110,926 132,777 64,834 32,998 32,973 19,836 21,732 16,214 60,390 60,153 41,299 36,930 19,644Hardwoods 690,051 658,116 456,852 467,451 226,384 55,800 55,959 44,034 36,115 18,417 124,715 121,076 87,701 102,796 38,737Total 872,899 840,022 567,778 600,228 291,218 88,850 88,932 63,870 57,847 34,631 185,176 181,229 129,000 139,726 58,381
North total:Softwoods 457,179 455,516 368,066 324,321 215,634 40,704 40,522 25,229 23,478 19,784 79,204 76,943 56,174 47,491 26,555Hardwoods 1,225,628 1,172,257 875,069 824,224 474,584 83,300 82,176 59,552 46,938 28,227 207,074 194,189 138,857 136,376 60,719Total 1,683,171 1,627,773 1,243,135 1,148,545 690,218 124,051 122,698 84,781 70,416 48,011 286,331 271,132 195,031 183,867 87,274
South:Southeast:Softwoods 451,263 629,975 489,320 416,000 234,700 34,841 58,533 30,147 21,447 11,800 33,125 41,084 26,081 18,553 11,100Hardwoods 535,766 603,553 371,125 286,783 283,800 48,325 53,034 35,262 24,358 18,600 31,795 31,725 14,171 13,018 6,300Total 987,000 1,233,528 860,445 702,783 518,500 83,176 111,567 65,409 45,805 30,400 64,921 72,809 40,252 31,571 17,400
South Central:Softwoods 467,255 405,829 351,451 216,201 98,700 47,226 34,270 29,491 19,769 12,132 19,621 17,169 11,919 6,983 3,000Hardwoods 622,344 596,714 460,976 359,267 355,200 38,791 28,680 18,285 14,497 12,227 52,257 50,648 30,302 18,081 8,359Total 1,089,498 1,002,543 812,427 575,468 453,900 86,022 62,950 47,776 34,266 24,359 71,871 67,817 42,221 25,064 11,359
South total:Softwoods 918,519 1,035,804 840,771 632,201 333,400 82,067 92,803 59,638 41,216 23,932 52,746 58,253 38,000 25,536 14,100Hardwoods 1,158,110 1,200,267 832,101 646,050 639,000 87,116 81,714 53,547 38,855 30,827 84,052 82,373 44,473 31,099 14,659Total 2,076,498 2,236,071 1,672,872 1,278,251 972,400 169,198 174,517 113,185 80,071 54,759 136,792 140,626 82,473 56,635 28,759
Rocky Mountain:Great Plains:Softwoods 6,896 9,563 7,033 3,940 3,300 3,968 6,857 4,483 3,543 3,025 692 666 38 130 59Hardwoods 38,146 38,025 7,803 29,312 24,730 241 245 61 0 0 2,958 2,902 474 4,379 3,896Total 45,086 47,587 14,836 33,252 28,030 4,215 7,102 4,544 3,543 3,025 3,648 3,568 512 4,509 3,955
Intermountain:Softwoods 1,012,139 889,962 487,864 454,779 565,300 838,061 708,911 365,637 270,479 388,200 55,731 55,212 51,122 66,643 66,354Hardwoods 99,806 103,244 42,628 39,160 34,600 65,726 70,177 22,143 17,860 17,200 4,442 4,036 4,082 6,709 5,443Total 1,111,941 993,206 530,492 493,939 599,900 903,759 779,088 387,780 288,339 405,400 60,171 59,249 55,204 73,352 71,797
Rocky Mountain total:Softwoods 1,019,035 899,525 494,897 458,719 568,600 842,029 715,768 370,120 274,022 391,225 56,423 55,878 51,160 66,773 66,413Hardwoods 137,952 141,268 50,431 68,472 59,330 65,967 70,422 22,204 17,860 17,200 7,399 6,939 4,556 11,088 9,339Total 1,157,027 1,040,793 545,328 527,191 627,930 907,974 786,190 392,324 291,882 408,425 63,819 62,817 55,716 77,861 75,752
Pacific Coast:Alaska:Softwoods 155,407 194,542 172,267 213,596 224,700 103,856 123,624 99,767 146,799 171,090 27,394 32,908 25,451 63,781 52,563Hardwoods 8,786 10,163 9,912 9,395 9,467 1,049 430 154 1,536 1,608 6,346 6,450 5,742 7,656 7,756Total 164,187 204,705 182,179 222,991 234,167 104,899 124,054 99,921 148,335 172,698 33,740 39,358 31,193 71,437 60,319
Pacific Northwest:Softwoods 783,755 777,610 657,843 699,600 952,500 468,498 468,829 422,000 326,700 407,300 96,921 95,810 113,227 172,200 210,000Hardwoods 120,090 118,232 72,131 71,800 50,500 4,326 4,953 4,000 6,600 6,100 24,539 23,946 12,559 11,900 13,700Total 903,875 895,842 729,974 771,400 1,003,000 472,809 473,783 426,000 333,300 413,400 121,470 119,756 125,786 184,100 223,700
Pacific Southwest:Softwoods 262,315 263,106 247,804 137,700 366,800 149,871 151,846 171,205 80,800 199,500 6,096 6,002 6,395 5,100 16,500
Hardwoods 57,311 51,763 24,316 6,792 10,100 7,767 2,174 5,217 2,300 7,400 3,386 3,381 2,399 870 300Total 319,829 314,869 272,120 144,492 376,900 157,695 154,020 176,422 83,100 206,900 9,456 9,383 8,794 5,970 16,800
Table 33—Annual mortality of growing stock on timberland in the United States by ownership group, region, subregion, and species group,2001, 1996, 1986, 1976, and 1952
_____________________________________________________________________________________________________
All owners National forest Other publica
____________________________________________ ____________________________________________ ______________________________________Region, subregion, and species group 2001 1996 1986 1976 1952 2001 1996 1986 1976 1952 2001 1996 1986 1976 1952
_____________________________________________________________________________________________________________________________________________________
Thousand cubic feet

111
Pacific Coast total:Softwoods 1,201,477 1,235,258 1,077,914 1,050,896 1,544,000 722,225 744,299 692,972 554,299 777,890 130,411 134,721 145,073 241,081 279,063Hardwoods 186,187 180,158 106,359 87,987 70,067 13,142 7,558 9,371 10,436 15,108 34,271 33,777 20,700 20,426 21,756Total 1,387,892 1,415,416 1,184,273 1,138,883 1,614,067 735,403 751,857 702,343 564,735 792,998 164,666 168,498 165,773 261,507 300,819
United States:Softwoods 3,596,210 3,626,102 2,781,648 2,466,137 2,661,634 1,687,024 1,593,393 1,147,959 893,015 1,212,831 318,784 325,794 290,407 380,881 386,131Hardwoods 2,707,877 2,693,950 1,863,960 1,626,733 1,242,981 249,525 241,870 144,674 114,089 91,362 332,796 317,278 208,586 198,989 106,473
_____________________________________________ _____________________________________________ ______________________________________
Total 6,304,588 6,320,052 4,645,608 4,092,870 3,904,615 1,936,625 1,835,262 1,292,633 1,007,104 1,304,193 651,607 643,072 498,993 579,870 492,604_____________________________________________________________________________________________________________________________________________________
Table 33—(continued)._____________________________________________________________________________________________________
All owners National forest Other publica
____________________________________________ ____________________________________________ ______________________________________Region, subregion, and species group 2001 1996 1986 1976 1952 2001 1996 1986 1976 1952 2001 1996 1986 1976 1952
_____________________________________________________________________________________________________________________________________________________
Thousand cubic feet
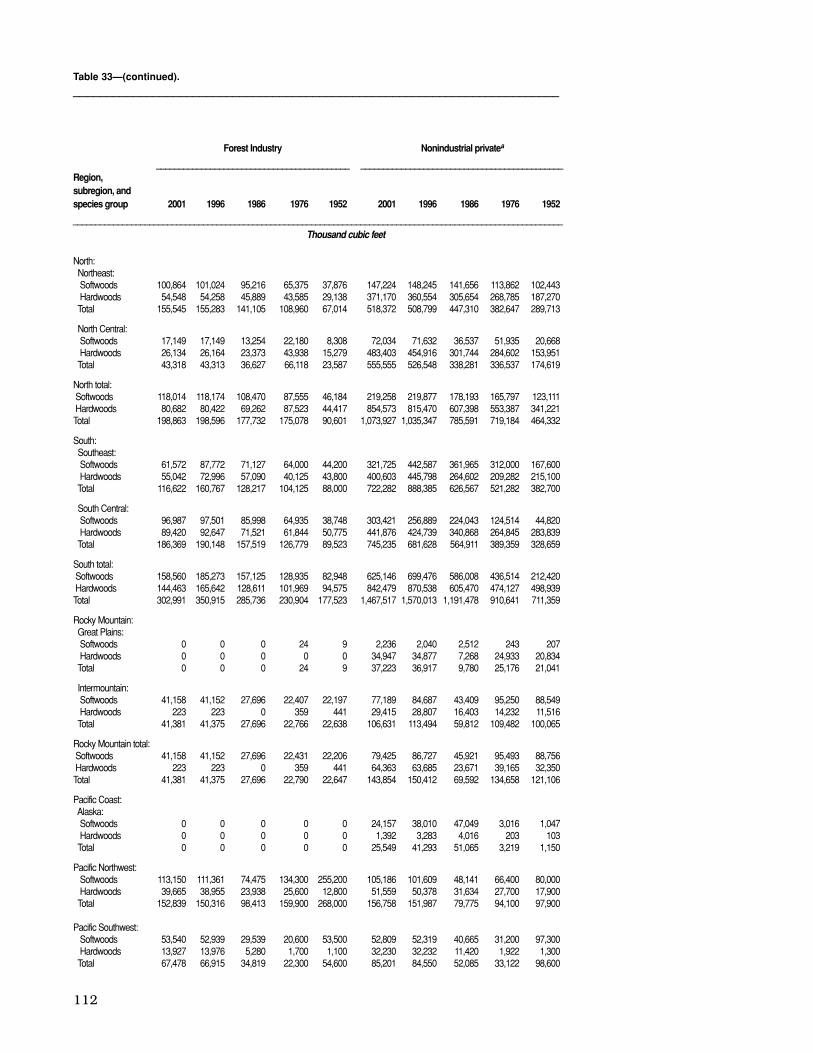
112
Table 33—(continued)._________________________________________________________________________
North:Northeast:Softwoods 100,864 101,024 95,216 65,375 37,876 147,224 148,245 141,656 113,862 102,443Hardwoods 54,548 54,258 45,889 43,585 29,138 371,170 360,554 305,654 268,785 187,270Total 155,545 155,283 141,105 108,960 67,014 518,372 508,799 447,310 382,647 289,713
North Central:Softwoods 17,149 17,149 13,254 22,180 8,308 72,034 71,632 36,537 51,935 20,668Hardwoods 26,134 26,164 23,373 43,938 15,279 483,403 454,916 301,744 284,602 153,951Total 43,318 43,313 36,627 66,118 23,587 555,555 526,548 338,281 336,537 174,619
North total:Softwoods 118,014 118,174 108,470 87,555 46,184 219,258 219,877 178,193 165,797 123,111Hardwoods 80,682 80,422 69,262 87,523 44,417 854,573 815,470 607,398 553,387 341,221Total 198,863 198,596 177,732 175,078 90,601 1,073,927 1,035,347 785,591 719,184 464,332
South:Southeast:Softwoods 61,572 87,772 71,127 64,000 44,200 321,725 442,587 361,965 312,000 167,600Hardwoods 55,042 72,996 57,090 40,125 43,800 400,603 445,798 264,602 209,282 215,100Total 116,622 160,767 128,217 104,125 88,000 722,282 888,385 626,567 521,282 382,700
South Central:Softwoods 96,987 97,501 85,998 64,935 38,748 303,421 256,889 224,043 124,514 44,820Hardwoods 89,420 92,647 71,521 61,844 50,775 441,876 424,739 340,868 264,845 283,839Total 186,369 190,148 157,519 126,779 89,523 745,235 681,628 564,911 389,359 328,659
South total:Softwoods 158,560 185,273 157,125 128,935 82,948 625,146 699,476 586,008 436,514 212,420Hardwoods 144,463 165,642 128,611 101,969 94,575 842,479 870,538 605,470 474,127 498,939Total 302,991 350,915 285,736 230,904 177,523 1,467,517 1,570,013 1,191,478 910,641 711,359
Rocky Mountain:Great Plains:Softwoods 0 0 0 24 9 2,236 2,040 2,512 243 207Hardwoods 0 0 0 0 0 34,947 34,877 7,268 24,933 20,834Total 0 0 0 24 9 37,223 36,917 9,780 25,176 21,041
Intermountain:Softwoods 41,158 41,152 27,696 22,407 22,197 77,189 84,687 43,409 95,250 88,549Hardwoods 223 223 0 359 441 29,415 28,807 16,403 14,232 11,516Total 41,381 41,375 27,696 22,766 22,638 106,631 113,494 59,812 109,482 100,065
Rocky Mountain total:Softwoods 41,158 41,152 27,696 22,431 22,206 79,425 86,727 45,921 95,493 88,756Hardwoods 223 223 0 359 441 64,363 63,685 23,671 39,165 32,350Total 41,381 41,375 27,696 22,790 22,647 143,854 150,412 69,592 134,658 121,106
Pacific Coast:Alaska:Softwoods 0 0 0 0 0 24,157 38,010 47,049 3,016 1,047Hardwoods 0 0 0 0 0 1,392 3,283 4,016 203 103Total 0 0 0 0 0 25,549 41,293 51,065 3,219 1,150
Pacific Northwest:Softwoods 113,150 111,361 74,475 134,300 255,200 105,186 101,609 48,141 66,400 80,000Hardwoods 39,665 38,955 23,938 25,600 12,800 51,559 50,378 31,634 27,700 17,900Total 152,839 150,316 98,413 159,900 268,000 156,758 151,987 79,775 94,100 97,900
Pacific Southwest:Softwoods 53,540 52,939 29,539 20,600 53,500 52,809 52,319 40,665 31,200 97,300Hardwoods 13,927 13,976 5,280 1,700 1,100 32,230 32,232 11,420 1,922 1,300Total 67,478 66,915 34,819 22,300 54,600 85,201 84,550 52,085 33,122 98,600
Forest Industry Nonindustrial privatea
___________________________________________ _____________________________________________Region, subregion, and species group 2001 1996 1986 1976 1952 2001 1996 1986 1976 1952
_____________________________________________________________________________________________________________Thousand cubic feet
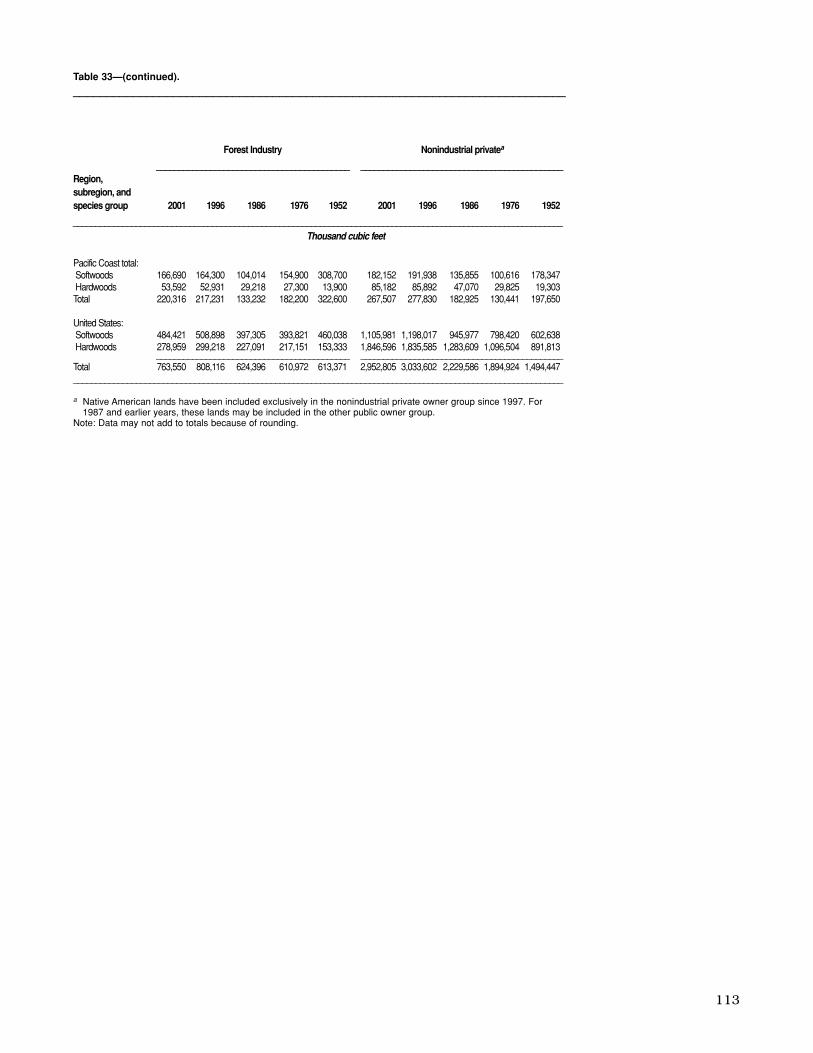
113
Table 33—(continued).__________________________________________________________________________
Pacific Coast total:Softwoods 166,690 164,300 104,014 154,900 308,700 182,152 191,938 135,855 100,616 178,347Hardwoods 53,592 52,931 29,218 27,300 13,900 85,182 85,892 47,070 29,825 19,303Total 220,316 217,231 133,232 182,200 322,600 267,507 277,830 182,925 130,441 197,650
United States:Softwoods 484,421 508,898 397,305 393,821 460,038 1,105,981 1,198,017 945,977 798,420 602,638Hardwoods 278,959 299,218 227,091 217,151 153,333 1,846,596 1,835,585 1,283,609 1,096,504 891,813
___________________________________________ _____________________________________________Total 763,550 808,116 624,396 610,972 613,371 2,952,805 3,033,602 2,229,586 1,894,924 1,494,447_____________________________________________________________________________________________________________
a Native American lands have been included exclusively in the nonindustrial private owner group since 1997. For 1987 and earlier years, these lands may be included in the other public owner group.
Note: Data may not add to totals because of rounding.
Forest Industry Nonindustrial privatea
___________________________________________ _____________________________________________Region, subregion, and species group 2001 1996 1986 1976 1952 2001 1996 1986 1976 1952
_____________________________________________________________________________________________________________Thousand cubic feet

114
North:Northeast:Softwoods 658,040 646,083 701,741 1,067,271 652,600Hardwoods 2,174,717 2,223,289 2,246,366 2,072,571 1,358,000
Total 2,832,478 2,869,371 2,948,107 3,139,842 2,010,600
North Central:Softwoods 524,811 523,127 586,546 490,986 320,702Hardwoods 2,060,589 2,027,493 1,977,350 1,718,072 1,385,188
Total 2,585,392 2,550,620 2,563,896 2,209,058 1,705,890
North total:Softwoods 1,182,850 1,169,210 1,288,287 1,558,257 973,302Hardwoods 4,235,306 4,250,781 4,223,716 3,790,643 2,743,188
Total 5,417,870 5,419,991 5,512,003 5,348,900 3,716,490
South:Southeast:Softwoods 3,097,488 2,778,801 2,622,053 3,104,000 1,874,017Hardwoods 2,059,494 1,951,849 2,104,004 2,186,000 1,291,618
Total 5,157,047 4,730,651 4,726,057 5,290,000 3,165,635
South Central:Softwoods 3,369,692 3,110,078 2,876,764 3,210,598 1,767,400Hardwoods 2,995,358 2,871,358 2,382,778 2,822,683 1,749,700
Total 6,365,191 5,981,436 5,259,542 6,033,281 3,517,100
South total:Softwoods 6,467,180 5,888,879 5,498,817 6,314,598 3,641,417Hardwoods 5,054,852 4,823,208 4,486,782 5,008,683 3,041,318
Total 11,522,238 10,712,087 9,985,599 11,323,281 6,682,735
Rocky Mountain:Great Plains:Softwoods 41,542 50,448 47,412 43,521 22,220Hardwoods 45,211 44,808 38,438 39,818 30,500
Total 86,747 95,256 85,850 83,339 52,720
Intermountain:Softwoods 1,816,084 1,912,245 1,909,449 1,550,496 1,077,700Hardwoods 158,787 426,175 131,347 99,098 56,800
Total 1,975,024 2,338,421 2,040,796 1,649,594 1,134,500
Rocky Mountain total:Softwoods 1,857,626 1,962,694 1,956,861 1,594,017 1,099,920Hardwoods 203,998 470,983 169,785 138,916 87,300
Total 2,061,771 2,433,676 2,126,646 1,732,933 1,187,220
Pacific Coast:Alaska:Softwoods 122,008 136,888 102,686 162,499 103,600Hardwoods 84,859 85,888 93,664 6,824 6,725
Total 206,873 222,776 196,350 169,323 110,325
Table 34—Net annual growth of growing stock on timberland in the United States by ownershipgroup, region, subregion, and species group, 2001, 1996, 1986, 1976, and 1952
________________________________________________________________________
All owners_________________________________________________________Region,subregion, andspecies group 2001 1996 1986 1976 1952____________________________________________________________________________
Thousand cubic feet

115
Pacific Northwest:Softwoods 2,841,124 3,080,632 3,270,724 2,158,700 1,472,500Hardwoods 312,753 391,648 498,155 400,800 221,500
Total 3,154,055 3,472,280 3,768,879 2,559,500 1,694,000
Pacific Southwest:Softwoods 1,195,754 1,155,171 889,365 713,200 444,000Hardwoods 130,575 133,172 156,834 79,137 75,000
Total 1,326,267 1,288,343 1,046,199 792,337 519,000
Pacific Coast total:Softwoods 4,158,887 4,372,692 4,262,775 3,034,399 2,020,100Hardwoods 528,187 610,708 748,653 486,761 303,225
Total 4,687,196 4,983,400 5,011,428 3,521,160 2,323,325
United States:Softwoods 13,666,543 13,393,474 13,006,740 12,501,271 7,734,739Hardwoods 10,022,342 10,155,680 9,628,936 9,425,003 6,175,031
_________________________________________________________Total 23,689,074 23,549,154 22,635,676 21,926,274 13,909,770____________________________________________________________________________________
Table 34—(continued).____________________________________________________________________
All owners_________________________________________________________Region,subregion, andspecies group 2001 1996 1986 1976 1952____________________________________________________________________________
Thousand cubic feet
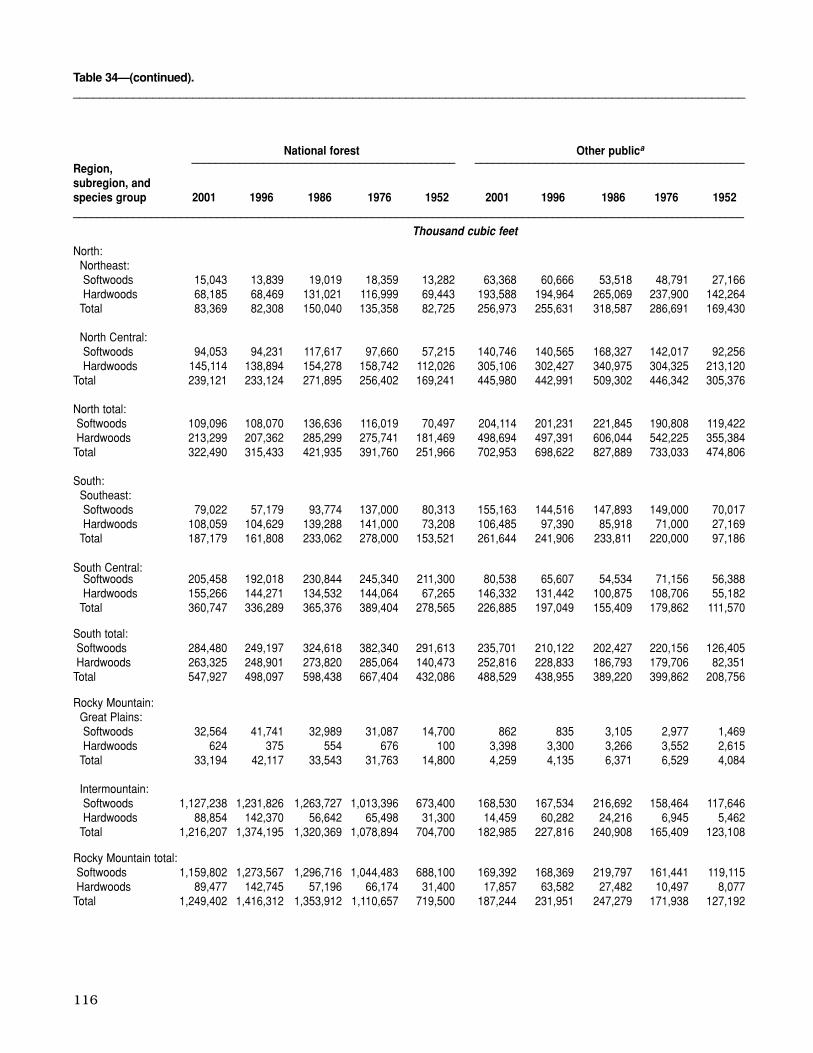
116
Table 34—(continued)._____________________________________________________________________________________________________
National forest Other publica____________________________________________ _____________________________________________
Region, subregion, andspecies group 2001 1996 1986 1976 1952 2001 1996 1986 1976 1952________________________________________________________________________________________________________________
Thousand cubic feet
North:Northeast:Softwoods 15,043 13,839 19,019 18,359 13,282 63,368 60,666 53,518 48,791 27,166Hardwoods 68,185 68,469 131,021 116,999 69,443 193,588 194,964 265,069 237,900 142,264
Total 83,369 82,308 150,040 135,358 82,725 256,973 255,631 318,587 286,691 169,430
North Central:Softwoods 94,053 94,231 117,617 97,660 57,215 140,746 140,565 168,327 142,017 92,256Hardwoods 145,114 138,894 154,278 158,742 112,026 305,106 302,427 340,975 304,325 213,120
Total 239,121 233,124 271,895 256,402 169,241 445,980 442,991 509,302 446,342 305,376
North total:Softwoods 109,096 108,070 136,636 116,019 70,497 204,114 201,231 221,845 190,808 119,422Hardwoods 213,299 207,362 285,299 275,741 181,469 498,694 497,391 606,044 542,225 355,384
Total 322,490 315,433 421,935 391,760 251,966 702,953 698,622 827,889 733,033 474,806
South:Southeast:Softwoods 79,022 57,179 93,774 137,000 80,313 155,163 144,516 147,893 149,000 70,017Hardwoods 108,059 104,629 139,288 141,000 73,208 106,485 97,390 85,918 71,000 27,169
Total 187,179 161,808 233,062 278,000 153,521 261,644 241,906 233,811 220,000 97,186
South Central:Softwoods 205,458 192,018 230,844 245,340 211,300 80,538 65,607 54,534 71,156 56,388Hardwoods 155,266 144,271 134,532 144,064 67,265 146,332 131,442 100,875 108,706 55,182
Total 360,747 336,289 365,376 389,404 278,565 226,885 197,049 155,409 179,862 111,570
South total:Softwoods 284,480 249,197 324,618 382,340 291,613 235,701 210,122 202,427 220,156 126,405Hardwoods 263,325 248,901 273,820 285,064 140,473 252,816 228,833 186,793 179,706 82,351
Total 547,927 498,097 598,438 667,404 432,086 488,529 438,955 389,220 399,862 208,756
Rocky Mountain:Great Plains:Softwoods 32,564 41,741 32,989 31,087 14,700 862 835 3,105 2,977 1,469Hardwoods 624 375 554 676 100 3,398 3,300 3,266 3,552 2,615
Total 33,194 42,117 33,543 31,763 14,800 4,259 4,135 6,371 6,529 4,084
Intermountain:Softwoods 1,127,238 1,231,826 1,263,727 1,013,396 673,400 168,530 167,534 216,692 158,464 117,646Hardwoods 88,854 142,370 56,642 65,498 31,300 14,459 60,282 24,216 6,945 5,462
Total 1,216,207 1,374,195 1,320,369 1,078,894 704,700 182,985 227,816 240,908 165,409 123,108
Rocky Mountain total:Softwoods 1,159,802 1,273,567 1,296,716 1,044,483 688,100 169,392 168,369 219,797 161,441 119,115Hardwoods 89,477 142,745 57,196 66,174 31,400 17,857 63,582 27,482 10,497 8,077
Total 1,249,402 1,416,312 1,353,912 1,110,657 719,500 187,244 231,951 247,279 171,938 127,192
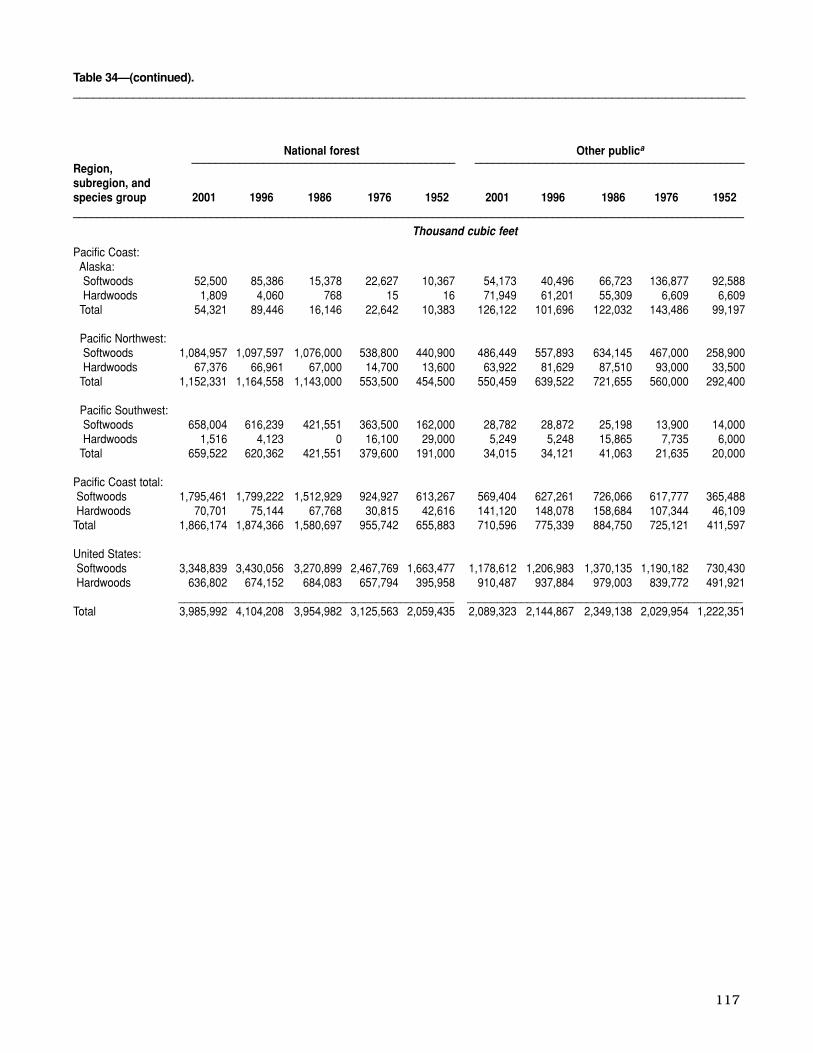
117
Table 34—(continued)._____________________________________________________________________________________________________
Pacific Coast:Alaska:Softwoods 52,500 85,386 15,378 22,627 10,367 54,173 40,496 66,723 136,877 92,588Hardwoods 1,809 4,060 768 15 16 71,949 61,201 55,309 6,609 6,609
Total 54,321 89,446 16,146 22,642 10,383 126,122 101,696 122,032 143,486 99,197
Pacific Northwest:Softwoods 1,084,957 1,097,597 1,076,000 538,800 440,900 486,449 557,893 634,145 467,000 258,900Hardwoods 67,376 66,961 67,000 14,700 13,600 63,922 81,629 87,510 93,000 33,500
Total 1,152,331 1,164,558 1,143,000 553,500 454,500 550,459 639,522 721,655 560,000 292,400
Pacific Southwest:Softwoods 658,004 616,239 421,551 363,500 162,000 28,782 28,872 25,198 13,900 14,000Hardwoods 1,516 4,123 0 16,100 29,000 5,249 5,248 15,865 7,735 6,000
Total 659,522 620,362 421,551 379,600 191,000 34,015 34,121 41,063 21,635 20,000
Pacific Coast total:Softwoods 1,795,461 1,799,222 1,512,929 924,927 613,267 569,404 627,261 726,066 617,777 365,488Hardwoods 70,701 75,144 67,768 30,815 42,616 141,120 148,078 158,684 107,344 46,109
Total 1,866,174 1,874,366 1,580,697 955,742 655,883 710,596 775,339 884,750 725,121 411,597
United States:Softwoods 3,348,839 3,430,056 3,270,899 2,467,769 1,663,477 1,178,612 1,206,983 1,370,135 1,190,182 730,430Hardwoods 636,802 674,152 684,083 657,794 395,958 910,487 937,884 979,003 839,772 491,921
______________________________________________ ______________________________________________Total 3,985,992 4,104,208 3,954,982 3,125,563 2,059,435 2,089,323 2,144,867 2,349,138 2,029,954 1,222,351
National forest Other publica____________________________________________ _____________________________________________
Region, subregion, andspecies group 2001 1996 1986 1976 1952 2001 1996 1986 1976 1952________________________________________________________________________________________________________________
Thousand cubic feet

118
North:Northeast:Softwoods 66,388 64,526 188,430 377,359 178,928 513,241 507,051 440,774 622,762 433,224Hardwoods 191,003 195,939 230,023 226,164 128,574 1,721,941 1,763,917 1,620,253 1,491,508 1,017,719
Total 257,376 260,465 418,453 603,523 307,502 2,234,760 2,270,967 2,061,027 2,114,270 1,450,943
North Central:Softwoods 35,442 35,442 50,172 55,090 43,288 254,571 252,890 250,430 196,219 127,943Hardwoods 86,241 86,260 105,370 118,401 99,057 1,524,129 1,499,913 1,376,727 1,136,604 960,985
Total 121,658 121,701 155,542 173,491 142,345 1,778,634 1,752,803 1,627,157 1,332,823 1,088,928
North total:Softwoods 101,829 99,968 238,602 432,449 222,216 767,812 759,941 691,204 818,981 561,167Hardwoods 277,244 282,199 335,393 344,565 227,631 3,246,070 3,263,829 2,996,980 2,628,112 1,978,704
Total 379,034 382,167 573,995 777,014 449,847 4,013,393 4,023,770 3,688,184 3,447,093 2,539,871
South:Southeast:Softwoods 966,345 889,665 724,829 688,000 374,583 1,896,958 1,687,442 1,655,557 2,130,000 1,349,104Hardwoods 199,194 191,390 245,858 259,000 170,797 1,645,756 1,558,440 1,632,940 1,715,000 1,020,444
Total 1,165,427 1,081,055 970,687 947,000 545,380 3,542,797 3,245,882 3,288,497 3,845,000 2,369,548
South Central:Softwoods 1,207,415 1,135,049 829,133 894,423 707,496 1,876,280 1,717,403 1,762,253 1,999,679 792,216Hardwoods 349,178 358,018 347,608 452,703 202,822 2,344,582 2,237,627 1,799,763 2,117,210 1,424,431
Total 1,556,542 1,493,068 1,176,741 1,347,126 910,318 4,221,017 3,955,030 3,562,016 4,116,889 2,216,647
South total:Softwoods 2,173,760 2,024,714 1,553,962 1,582,423 1,082,079 3,773,239 3,404,846 3,417,810 4,129,679 2,141,320Hardwoods 548,372 549,408 593,466 711,703 373,619 3,990,338 3,796,067 3,432,703 3,832,210 2,444,875
Total 2,721,968 2,574,122 2,147,428 2,294,126 1,455,698 7,763,813 7,200,912 6,850,513 7,961,889 4,586,195
Rocky Mountain:Great Plains:Softwoods 0 0 340 608 233 8,116 7,872 10,978 8,849 5,818Hardwoods 0 0 0 62 5 41,189 41,133 34,618 35,528 27,780
Total 0 0 340 670 238 49,293 49,005 45,596 44,377 33,598
Intermountain:Softwoods 125,962 125,967 124,840 103,030 78,404 394,354 386,918 304,190 275,606 208,250Hardwoods 695 7,867 980 793 660 54,779 215,657 49,509 25,862 19,378
Total 126,682 133,834 125,820 103,823 79,064 449,150 602,575 353,699 301,468 227,628
Rocky Mountain total:Softwoods 125,962 125,967 125,180 103,638 78,637 402,469 394,790 315,168 284,455 214,068Hardwoods 695 7,867 980 855 665 95,968 256,789 84,127 61,390 47,158
Total 126,682 133,834 126,160 104,493 79,302 498,444 651,580 399,295 345,845 261,226
Table 34—(continued)._____________________________________________________________________________________________________
Forest industry Nonindustrial privatea____________________________________________ _____________________________________________
Region, subregion, andspecies group 2001 1996 1986 1976 1952 2001 1996 1986 1976 1952________________________________________________________________________________________________________________
Thousand cubic feet

119
Table 34—(continued)._____________________________________________________________________________________________________
Forest industry Nonindustrial privatea____________________________________________ _____________________________________________
Region, subregion, andspecies group 2001 1996 1986 1976 1952 2001 1996 1986 1976 1952_________________________________________________________________________________________________________________
Thousand cubic feet
Pacific Coast:Alaska:Softwoods 0 0 0 0 0 15,335 11,007 20,585 2,995 645Hardwoods 0 0 0 0 0 11,101 20,628 37,587 200 100
Total 0 0 0 0 0 26,429 31,635 58,172 3,195 745
Pacific Northwest:Softwoods 804,261 883,870 1,029,287 691,200 399,000 465,457 541,274 531,292 461,700 373,700Hardwoods 72,899 100,919 154,079 145,200 75,300 108,557 142,138 189,566 147,900 99,100
Total 877,169 984,788 1,183,366 836,400 474,300 574,096 683,412 720,858 609,600 472,800
Pacific Southwest:Softwoods 246,506 247,112 204,912 138,500 90,000 262,462 262,948 237,704 197,300 178,000Hardwoods 45,515 45,497 45,596 19,100 11,000 78,294 78,305 95,373 36,202 29,000
Total 292,010 292,608 250,508 157,600 101,000 340,720 341,253 333,077 233,502 207,000
Pacific Coast total:Softwoods 1,050,767 1,130,981 1,234,199 829,700 489,000 743,254 815,228 789,581 661,995 552,345Hardwoods 118,414 146,415 199,675 164,300 86,300 197,951 241,071 322,526 184,302 128,200
Total 1,169,180 1,277,396 1,433,874 994,000 575,300 941,246 1,056,299 1,112,107 846,297 680,545
United States:Softwoods 3,452,319 3,381,630 3,151,943 2,948,210 1,871,932 5,686,774 5,374,805 5,213,763 5,895,110 3,468,900Hardwoods 944,726 985,888 1,129,514 1,221,423 688,215 7,530,328 7,557,756 6,836,336 6,706,014 4,598,937
______________________________________________ _______________________________________________
Total 4,396,863 4,367,519 4,281,457 4,169,633 2,560,147 13,216,896 12,932,561 12,050,099 12,601,124 8,067,837_____________________________________________________________________________________________________________________________
a Native American lands have been included exclusively in the nonindustrial private owner group since 1997. For 1987 and earlier years, these lands may beincluded in the other public owner group.
Note: Data may not add to totals because of rounding.

120
Table 35—Annual removals of growing stock on timberland in the United States by ownership group, region,subregion, and species group, 2001, 1996, 1986, and 1976
_____________________________________________________________________________________________________
Non-National Other Forest industrial
All owners forest public industry private_________________________________________ ______________________________________
Region, subregion,and species group 2001 1996 1986 1976 2001 2001 2001 2001_____________________________________________________________________________________________________
Thousand cubic feet
North:Northeast:Softwoods 414,216 413,718 520,797 498,576 965 13,487 117,552 282,212Hardwoods 857,400 860,999 781,162 803,694 6,655 45,498 158,074 647,174
Total 1,271,616 1,274,717 1,301,959 1,302,270 7,620 58,984 275,626 929,387
North Central:Softwoods 228,599 254,630 204,719 193,534 14,352 59,262 25,397 129,587Hardwoods 1,210,611 1,243,071 1,201,539 999,059 49,027 211,813 92,594 857,176
Total 1,439,210 1,497,701 1,406,258 1,192,593 63,379 271,076 117,991 986,764
North total:Softwoods 642,815 668,348 725,516 692,110 15,318 72,749 142,949 411,800Hardwoods 2,068,011 2,104,070 1,982,701 1,802,753 55,681 257,311 250,668 1,504,351
Total 2,710,826 2,772,418 2,708,217 2,494,863 70,999 330,060 393,617 1,916,150
South:Southeast:Softwoods 2,913,288 2,947,436 2,411,562 2,028,804 9,788 111,824 928,285 1,863,392Hardwoods 1,390,533 1,511,833 1,260,821 1,002,521 13,616 50,148 221,709 1,105,060
Total 4,303,821 4,459,269 3,672,383 3,031,325 23,403 161,972 1,149,994 2,968,452
South Central:Softwoods 3,600,177 3,530,826 2,905,505 2,407,658 36,826 62,525 1,300,939 2,199,887Hardwoods 2,166,136 2,194,685 1,625,779 1,239,717 17,108 54,703 406,205 1,688,120
Total 5,766,313 5,725,511 4,531,284 3,647,375 53,934 117,228 1,707,144 3,888,007
South total:Softwoods 6,513,465 6,478,262 5,317,067 4,436,462 46,614 174,349 2,229,224 4,063,279Hardwoods 3,556,668 3,706,518 2,886,600 2,242,238 30,724 104,851 627,914 2,793,180
Total 10,070,134 10,184,780 8,203,667 6,678,700 77,337 279,200 2,857,138 6,856,459
Rocky Mountain:Great Plains:Softwoods 23,682 20,181 25,797 21,322 16,567 529 0 6,586Hardwoods 15,803 15,113 16,260 20,600 15 381 0 15,408
Total 39,486 35,294 42,057 41,922 16,582 910 0 21,993
Intermountain:Softwoods 487,135 480,943 817,031 821,687 62,164 50,306 150,054 224,611Hardwoods 10,490 15,757 11,635 3,054 2,159 2,007 3,398 2,926
Total 497,625 496,700 828,666 824,741 64,323 52,313 153,453 227,537
Rocky Mountain total:Softwoods 510,818 501,124 842,828 843,009 78,731 50,836 150,054 231,196Hardwoods 26,293 30,870 27,895 23,654 2,174 2,387 3,398 18,334
Total 537,111 531,994 870,723 866,663 80,905 53,223 153,453 249,530

121
Table 35—(continued)._____________________________________________________________________________________________________
Pacific Coast:Alaska:
Softwoods 138,695 177,298 117,881 107,437 13,814 4,642 0 120,240Hardwoods 3,634 5,229 5,211 3,164 119 796 0 2,719
Total 142,329 182,527 123,092 110,601 13,933 5,437 0 122,959
Pacific Northwest:Softwoods 1,623,663 1,621,480 3,121,025 3,101,707 53,201 226,575 800,856 543,031Hardwoods 106,502 99,492 98,375 106,286 467 12,686 39,693 53,657
Total 1,730,165 1,720,969 3,219,400 3,207,993 53,668 239,260 840,548 596,688
Pacific Southwest:Softwoods 624,853 618,021 818,897 818,402 41,824 22,925 356,938 203,166Hardwoods 8,660 10,036 11,579 16,805 1,534 100 5,020 2,005
Total 633,513 628,056 830,476 835,207 43,359 23,025 361,958 205,171
Pacific Coast total:Softwoods 2,387,211 2,416,799 4,057,803 4,027,546 108,839 254,141 1,157,794 866,437Hardwoods 118,796 114,757 115,165 126,255 2,120 13,582 44,713 58,381
Total 2,506,007 2,531,552 4,172,968 4,153,801 110,960 267,723 1,202,506 924,818
United States:Softwoods 10,054,310 10,064,531 10,943,214 9,999,127 249,502 552,075 3,680,020 5,572,712Hardwoods 5,769,768 5,956,213 5,012,361 4,194,900 90,699 378,130 926,693 4,374,246
____________________________________________________________________________________
Total 15,824,078 16,020,744 15,955,575 14,194,027 340,201 930,205 4,606,714 9,946,958_____________________________________________________________________________________________________
Note: Data may not add to totals because of rounding.
Non-National Other Forest industrial
All owners forest public industry private_________________________________________ ______________________________________
Region, subregion,and species group 2001 1996 1986 1976 2001 2001 2001 2001_____________________________________________________________________________________________________
Thousand cubic feet

122
North:Northeast:Connecticut 55,496 11,691 16,344 8,459 3,013 1,768 47,078 8,678 14,575Delaware 16,168 7,654 7,868 4,202 3,966 2,085 11,965 3,688 5,777Maine 402,086 441,729 223,378 181,603 234,026 164,644 220,688 207,703 58,674Maryland 107,091 40,507 36,964 23,673 12,891 6,264 83,409 27,617 30,696Massachusetts 97,467 15,703 26,437 38,943 7,987 6,117 58,466 7,715 20,300New Hampshire 169,877 140,282 50,471 77,972 44,737 22,662 91,881 95,545 27,799New Jersey 55,431 10,549 16,475 14,613 753 4,417 40,813 9,795 12,070New York 589,718 141,068 109,260 145,115 42,645 23,270 444,715 98,422 86,013Pennsylvania 630,403 215,912 177,131 69,745 18,739 11,019 560,768 197,173 166,138Rhode Island 8,032 1,742 2,841 2,916 588 336 5,105 1,154 2,505Vermont 190,367 77,355 48,025 69,408 38,530 15,233 120,966 38,825 32,747West Virginia 510,343 167,425 95,077 21,393 6,340 16,791 488,863 161,085 78,282
Total 2,832,478 1,271,616 810,272 658,040 414,216 274,607 2,174,717 857,400 535,577
North Central:Illinois 172,023 69,338 72,316 5,451 585 1,358 166,559 68,752 70,957Indiana 223,783 96,532 60,789 8,721 655 2,789 215,043 95,877 57,992Iowa 41,151 25,251 15,878 840 206 59 40,314 25,046 15,823Michigan 756,369 315,660 198,293 227,239 69,647 62,075 529,170 246,013 136,160Minnesota 370,145 316,130 215,962 114,072 62,293 66,068 256,075 253,837 149,850Missouri 239,428 167,895 65,718 27,581 12,248 3,031 211,839 155,647 62,561Ohio 293,485 101,216 56,147 10,904 2,848 4,399 282,593 98,368 51,766Wisconsin 489,009 347,187 187,797 130,004 80,117 42,792 358,994 267,071 144,942
Total 2,585,392 1,439,210 872,899 524,811 228,599 182,572 2,060,589 1,210,611 690,051North total: 5,417,870 2,710,826 1,683,171 1,182,850 642,815 457,179 4,235,306 2,068,011 1,225,628
South:Southeast:Florida 684,925 560,475 100,027 526,274 470,670 49,962 158,565 89,804 50,080Georgia 1,518,775 1,447,941 296,065 1,006,769 1,082,359 159,542 511,841 365,582 136,546North Carolina 1,159,595 957,675 263,957 589,829 588,255 116,369 569,755 369,419 147,573South Carolina 945,451 682,901 151,191 657,445 475,339 70,414 288,102 207,562 80,794Virginia 848,302 654,829 175,759 317,170 296,665 54,977 531,231 358,164 120,773
Total 5,157,047 4,303,821 987,000 3,097,488 2,913,288 451,263 2,059,494 1,390,533 535,766
South Central:Alabama 1,460,114 1,298,533 274,289 871,754 888,314 153,850 588,321 410,219 120,447Arkansas 896,350 795,789 140,756 546,133 495,947 44,997 350,141 299,842 95,767Kentucky 384,128 276,220 88,571 25,114 14,738 12,851 359,015 261,482 75,741Louisiana 834,049 958,981 157,635 526,081 697,829 77,642 307,926 261,152 79,997Mississippi 1,104,531 1,149,880 163,263 639,086 752,347 74,777 465,523 397,532 88,495Oklahoma 243,259 133,401 15,066 117,100 79,609 3,250 125,997 53,792 11,822Tennessee 737,547 384,009 156,619 140,633 100,609 46,301 597,020 283,400 110,340Texas 705,212 769,501 93,300 503,792 570,783 53,588 201,415 198,718 39,735
Total 6,365,191 5,766,313 1,089,498 3,369,692 3,600,177 467,255 2,995,358 2,166,136 622,344South total: 11,522,238 10,070,134 2,076,498 6,467,180 6,513,465 918,519 5,054,852 3,556,668 1,158,110
Table 36—Net annual growth, removals, and mortality of growing stock on timberland in the United States byspecies group, region, subregion, and State, 2002
____________________________________________________________________________________________________
All species Softwoods Hardwoods______________________________ _____________________________ ____________________________Region,subregion, Net Net Netand State growth Removals Mortality growth Removals Mortality growth Removals Mortality_______________________________________________________________________________________________________________
Thousand cubic feet
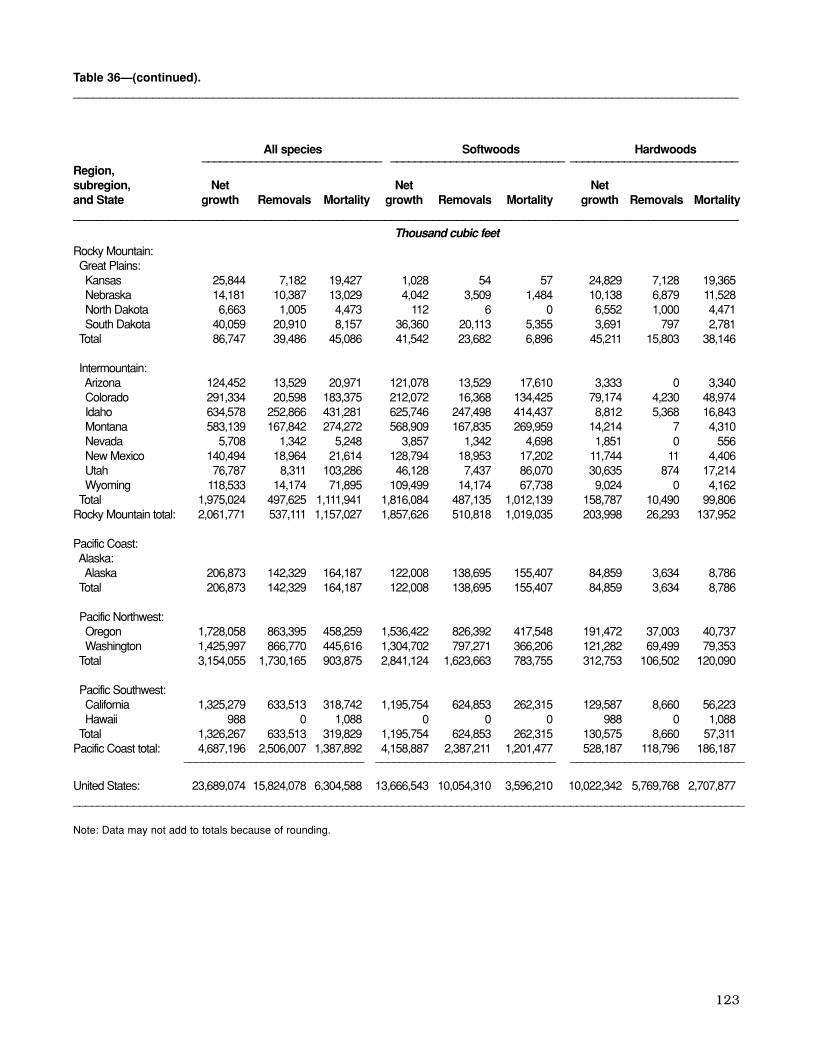
123
Rocky Mountain:Great Plains: Kansas 25,844 7,182 19,427 1,028 54 57 24,829 7,128 19,365Nebraska 14,181 10,387 13,029 4,042 3,509 1,484 10,138 6,879 11,528North Dakota 6,663 1,005 4,473 112 6 0 6,552 1,000 4,471South Dakota 40,059 20,910 8,157 36,360 20,113 5,355 3,691 797 2,781
Total 86,747 39,486 45,086 41,542 23,682 6,896 45,211 15,803 38,146
Intermountain:Arizona 124,452 13,529 20,971 121,078 13,529 17,610 3,333 0 3,340Colorado 291,334 20,598 183,375 212,072 16,368 134,425 79,174 4,230 48,974Idaho 634,578 252,866 431,281 625,746 247,498 414,437 8,812 5,368 16,843Montana 583,139 167,842 274,272 568,909 167,835 269,959 14,214 7 4,310Nevada 5,708 1,342 5,248 3,857 1,342 4,698 1,851 0 556New Mexico 140,494 18,964 21,614 128,794 18,953 17,202 11,744 11 4,406Utah 76,787 8,311 103,286 46,128 7,437 86,070 30,635 874 17,214Wyoming 118,533 14,174 71,895 109,499 14,174 67,738 9,024 0 4,162
Total 1,975,024 497,625 1,111,941 1,816,084 487,135 1,012,139 158,787 10,490 99,806Rocky Mountain total: 2,061,771 537,111 1,157,027 1,857,626 510,818 1,019,035 203,998 26,293 137,952
Pacific Coast:Alaska:Alaska 206,873 142,329 164,187 122,008 138,695 155,407 84,859 3,634 8,786
Total 206,873 142,329 164,187 122,008 138,695 155,407 84,859 3,634 8,786
Pacific Northwest:Oregon 1,728,058 863,395 458,259 1,536,422 826,392 417,548 191,472 37,003 40,737Washington 1,425,997 866,770 445,616 1,304,702 797,271 366,206 121,282 69,499 79,353
Total 3,154,055 1,730,165 903,875 2,841,124 1,623,663 783,755 312,753 106,502 120,090
Pacific Southwest:California 1,325,279 633,513 318,742 1,195,754 624,853 262,315 129,587 8,660 56,223Hawaii 988 0 1,088 0 0 0 988 0 1,088
Total 1,326,267 633,513 319,829 1,195,754 624,853 262,315 130,575 8,660 57,311Pacific Coast total: 4,687,196 2,506,007 1,387,892 4,158,887 2,387,211 1,201,477 528,187 118,796 186,187
______________________________ ______________________________ _____________________________
United States: 23,689,074 15,824,078 6,304,588 13,666,543 10,054,310 3,596,210 10,022,342 5,769,768 2,707,877________________________________________________________________________________________________________________
Note: Data may not add to totals because of rounding.
Table 36—(continued).____________________________________________________________________________________________________
All species Softwoods Hardwoods______________________________ _____________________________ ____________________________Region,subregion, Net Net Netand State growth Removals Mortality growth Removals Mortality growth Removals Mortality_______________________________________________________________________________________________________________
Thousand cubic feet

124
East:White-red-jack pine 558 104 130 20 222 81Spruce-fir 547 8 61 91 320 68Longleaf-slash pine 379 76 39 14 149 107Loblolly-shortleaf pine 2,025 327 222 80 913 438Oak-pine 1,298 255 144 42 559 298Oak-hickory 6,250 1,285 764 153 2,504 1,644Oak-gum-cypress 1,637 312 197 55 757 316Elm-ash-cottonwood 515 135 70 19 219 73Maple-beech-birch 2,665 396 393 194 1,255 427Aspen-birch 538 14 73 34 276 140Nonstocked 1 0 0 0 1 0
___________________________________________________________East total: 16,413 2,912 2,093 701 7,174 3,532
West:Douglas-fir 2,181 445 522 223 644 347Ponderosa pine 840 54 121 149 364 152Western white pine 7 0 1 0 4 1Fir-spruce 1,260 87 130 107 566 370Hemlock-Sitka spruce 1,197 113 150 86 440 408Larch 62 0 1 10 34 17Lodgepole pine 529 13 26 63 260 168Redwood 106 27 38 37 4 0Other hardwoods 1,060 158 255 123 337 187Other softwoods 452 69 47 8 282 45Pinyon-juniper 8 0 4 0 2 1Nonstocked 6 1 0 1 3 1
West total: 7,707 969 1,294 806 2,941 1,697___________________________________________________________
United States: 24,120 3,881 3,387 1,508 10,115 5,222________________________________________________________________________________________
Note: Data may not add to totals because of rounding.
Table 37—Net all live biomass on timberland in the Eastern and Western United States by rural-urban con-tinuum class and forest type group, 2002
__________________________________________________________________________________________
Predominant county population continuum class____________________________________________________
Major Intermediate- Large SmallForest type group Total metro small metro town town Rural__________________________________________________________________________________________
Million dry tons

125
North:Northeast:
Connecticut 106 105 75 23 7 1Delaware 25 25 19 3 3 0Maine 772 759 461 163 136 13Maryland 167 166 132 20 13 1Massachusetts 180 179 126 39 14 1New Hampshire 292 289 195 63 30 3New Jersey 109 108 83 14 11 2New York 746 741 494 158 90 5Pennsylvania 905 896 608 215 73 9Rhode Island 18 18 12 4 1 0Vermont 282 279 191 61 26 3West Virginia 717 714 487 169 58 4
Total 4,319 4,277 2,883 933 461 42
North Central:Illinois 195 193 132 46 15 2Indiana 217 216 149 52 14 2Iowa 78 77 51 19 7 1Michigan 817 812 523 190 100 5Minnesota 473 468 291 105 72 5Missouri 498 496 308 123 65 2Ohio 367 364 237 83 44 3Wisconsin 588 576 379 138 58 12
Total 3,232 3,200 2,070 756 374 32
North total: 7,551 7,477 4,953 1,689 835 73
South:Southeast:
Florida 464 464 323 78 62 0Georgia 888 888 676 91 121 0North Carolina 953 953 697 153 103 0South Carolina 505 505 370 81 54 0Virginia 836 836 609 140 87 0
Total 3,645 3,645 2,675 543 428 0
South Central:Alabama 897 897 644 145 109 0Arkansas 846 839 560 176 102 7Kentucky 660 655 440 153 62 5Louisiana 651 650 453 133 64 1Mississippi 783 780 518 163 99 3Oklahoma 196 196 119 40 36 1Tennessee 805 805 600 140 66 0Texas 470 468 319 93 56 2
Total 5,308 5,290 3,653 1,044 594 18
South total: 8,954 8,936 6,328 1,586 1,021 18
Table 38—Biomass on timberland in the United States by region, subregion, State, and tree component,2002
__________________________________________________________________________________________
Live trees________________________________________ _________
Region, All All Soundsubregion, and State biomass live Boles Tops Saplings dead__________________________________________________________________________________________
Million dry tons

126
Table 38—(contin ued).__________________________________________________________________________________________
Rocky Mountain:Great Plains:
Kansas 53 52 36 13 4 1Nebraska 32 31 22 8 2 1North Dakota 15 14 9 4 1 1South Dakota 42 40 28 9 3 2
Total 142 137 95 33 9 4
Intermountain:Arizona 149 138 98 33 7 10Colorado 497 454 337 97 21 44Idaho 853 772 597 131 44 81Montana 812 734 526 142 66 78Nevada 13 12 8 3 0 1New Mexico 167 155 107 36 12 12Utah 180 156 108 36 12 24Wyoming 238 198 142 42 13 40
Total 2,909 2,618 1,924 519 175 291
Rocky Mountain total: 3,051 2,756 2,020 552 184 295
Pacific Coast:Alaska:
Alaska 844 830 501 227 101 14Total 844 830 501 227 101 14
Pacific Northwest:Oregon 1,693 1,629 1,148 458 23 64Washington 1,192 1,159 873 255 31 33
Total 2,886 2,789 2,021 714 54 97
Pacific Southwest:California 1,330 1,328 864 415 49 2Hawaii 4 4 4 0 0 0
Total 1,334 1,332 868 415 49 2
Pacific Coast total: 5,064 4,951 3,391 1,356 204 113____________________________________________________________
United States: 24,619 24,120 16,692 5,183 2,245 499________________________________________________________________________________________
Note: Data may not add to totals because of rounding.
Live trees________________________________________ _________
Region, All All Soundsubregion, and State biomass live Boles Tops Saplings dead__________________________________________________________________________________________
Million dr y tons

127
North:Northeast:
Saw logs 715,703 260,429 455,274 610,860 208,491 402,368 104,843 51,938 52,906Veneer logs 33,538 2,566 30,972 29,451 2,054 27,396 4,088 512 3,576Pulpwood 518,958 213,911 305,047 416,890 167,230 249,660 102,068 46,681 55,387Composite products 2,118 179 1,940 1,727 140 1,587 391 39 352Fuelwood 466,267 53,254 413,013 62,521 4,979 57,542 403,746 48,275 355,471Posts, poles, and pilings 7,612 1,854 5,758 6,290 1,231 5,059 1,323 623 700Miscellaneous products 23,605 13,119 10,486 17,922 8,710 9,212 5,684 4,410 1,274
Total 1,767,801 545,312 1,222,490 1,145,661 392,835 752,824 622,143 152,478 469,666
North Central:Saw logs 555,595 76,113 479,482 505,512 73,586 431,926 50,083 2,527 47,556Veneer logs 25,487 504 24,983 23,294 454 22,840 2,193 50 2,143Pulpwood 511,120 127,649 383,471 426,613 112,970 313,643 84,507 14,679 69,828Composite products 209,614 11,926 197,688 192,220 9,716 182,505 17,394 2,211 15,183Fuelwood 247,472 14,045 233,427 44,590 5,588 39,002 202,882 8,457 194,425Posts, poles, and pilings 10,824 8,418 2,406 8,328 7,051 1,277 2,496 1,367 1,129Miscellaneous products 18,462 3,245 15,218 16,320 3,158 13,162 2,142 86 2,056
Total 1,578,574 241,900 1,336,675 1,216,877 212,523 1,004,355 361,697 29,377 332,320
North total:Saw logs 1,271,298 336,542 934,756 1,116,372 282,077 834,294 154,926 54,465 100,462Veneer logs 59,025 3,070 55,955 52,745 2,508 50,236 6,281 562 5,719Pulpwood 1,030,078 341,560 688,518 843,503 280,200 563,303 186,575 61,360 125,215Composite products 211,732 12,105 199,628 193,947 9,856 184,092 17,785 2,250 15,535Fuelwood 713,739 67,299 646,440 107,111 10,567 96,544 606,628 56,732 549,896Posts, poles, and pilings 18,436 10,272 8,164 14,618 8,282 6,336 3,819 1,990 1,829Miscellaneous products 42,067 16,364 25,704 34,242 11,868 22,374 7,826 4,496 3,330
Total 3,346,375 787,212 2,559,165 2,362,538 605,358 1,757,179 983,840 181,855 801,986
South:Southeast:
Saw logs 1,585,027 1,238,337 346,690 1,523,541 1,196,528 327,013 61,486 41,809 19,677Veneer logs 243,363 195,453 47,910 236,397 188,945 47,452 6,966 6,508 457Pulpwood 1,626,855 1,138,425 488,430 1,498,780 1,060,402 438,378 128,075 78,023 50,052Composite products 139,219 101,505 37,714 126,783 93,811 32,972 12,436 7,694 4,743Fuelwood 229,834 27,786 202,048 182,208 21,125 161,083 47,626 6,661 40,965Posts, poles, and pilings 34,669 34,598 71 31,990 31,930 60 2,679 2,668 11Miscellaneous products 25,809 21,895 3,914 21,797 18,257 3,540 4,012 3,638 374
Total 3,884,776 2,757,999 1,126,777 3,621,496 2,610,998 1,010,498 263,280 147,001 116,279
South Central:Saw logs 2,155,328 1,493,312 662,016 2,042,730 1,446,287 596,442 112,599 47,025 65,574Veneer logs 644,236 595,976 48,260 624,281 578,816 45,465 19,955 17,161 2,795Pulpwood 2,127,566 1,277,963 849,603 1,898,466 1,150,758 747,708 229,101 127,205 101,896Composite products 95,231 59,370 35,861 79,495 50,857 28,638 15,736 8,513 7,222Fuelwood 154,821 16,325 138,496 127,284 11,759 115,525 27,538 4,566 22,972Posts, poles, and pilings 31,997 31,997 1 29,296 29,296 1 2,701 2,701 0Miscellaneous products 2,611 967 1,644 1,559 714 845 1,052 253 798
Total 5,211,790 3,475,910 1,735,881 4,803,111 3,268,487 1,534,624 408,682 207,424 201,257
Table 39—Volume of roundwood products harvested in the United States by source of material, species group, region, subregion,and product, 2001
_____________________________________________________________________________________________________
Source of material________________________________________________________________All sources Growing stock Other sources
______________________________ ________________________________ _____________________________Region, subregion,and product Total Softwoods Hardwoods Total Softwoods Hardwoods Total Softwoods Hardwoods____________________________________________________________________________________________________________________________
Thousand cubic feet

128
South total:Saw logs 3,740,355 2,731,649 1,008,706 3,566,271 2,642,815 923,455 174,085 88,834 85,251Veneer logs 887,599 791,429 96,170 860,678 767,761 92,917 26,921 23,669 3,252Pulpwood 3,754,421 2,416,388 1,338,033 3,397,246 2,211,160 1,186,086 357,176 205,228 151,948Composite products 234,450 160,875 73,575 206,278 144,668 61,610 28,172 16,207 11,965Fuelwood 384,655 44,111 340,544 309,492 32,884 276,608 75,164 11,227 63,937Posts, poles, and pilings 66,666 66,595 72 61,286 61,226 61 5,380 5,369 11Miscellaneous products 28,420 22,862 5,558 23,356 18,971 4,385 5,064 3,891 1,172
Total 9,096,566 6,233,909 2,862,658 8,424,607 5,879,485 2,545,122 671,962 354,425 317,536
Rocky Mountain:Great Plains:
Saw logs 29,587 20,962 8,625 28,769 20,769 8,000 818 193 625Veneer logs 99 0 99 98 0 98 1 0 1Pulpwood 0 0 0 0 0 0 0 0 0Composite products 919 829 91 760 685 75 159 144 16Fuelwood 28,688 1,029 27,659 876 48 828 27,811 981 26,830Posts, poles, and pilings 845 327 518 158 157 0 688 169 518Miscellaneous products 219 138 81 219 138 81 0 0 0
Total 60,357 23,285 37,073 30,880 21,797 9,082 29,477 1,487 27,990
Intermountain:Saw logs 375,259 374,678 581 346,215 345,685 530 29,044 28,992 51Veneer logs 57,414 57,414 0 56,428 56,428 0 986 986 0Pulpwood 28,536 28,536 0 20,052 20,052 0 8,483 8,483 0Composite products 4,465 0 4,465 4,424 0 4,424 40 0 40Fuelwood 79,649 55,213 24,436 4,739 1,952 2,786 74,910 53,261 21,650Posts, poles, and pilings 12,433 12,391 41 11,073 11,034 40 1,359 1,358 1Miscellaneous products 15,569 13,497 2,072 10,195 8,132 2,063 5,373 5,365 9
Total 573,325 541,729 31,595 453,126 443,283 9,843 120,196 98,445 21,751
Rocky Mountain total:Saw logs 404,846 395,640 9,206 374,984 366,454 8,530 29,862 29,185 676Veneer logs 57,513 57,414 99 56,526 56,428 98 987 986 1Pulpwood 28,536 28,536 0 20,052 20,052 0 8,483 8,483 0Composite products 5,384 829 4,556 5,184 685 4,499 199 144 56Fuelwood 108,337 56,242 52,095 5,615 2,000 3,614 102,721 54,242 48,480Posts, poles, and pilings 13,278 12,718 559 11,231 11,191 40 2,047 1,527 519Miscellaneous products 15,788 13,635 2,153 10,414 8,270 2,144 5,373 5,365 9
Total 633,682 565,014 68,668 484,006 465,080 18,925 149,672 99,932 49,741
Pacific Coast:Alaska:
Saw logs 12,742 12,656 86 12,501 12,416 85 241 240 1Veneer logs 0 0 0 0 0 0 0 0 0Pulpwood 23,199 23,128 71 20,817 20,753 63 2,383 2,375 7Composite products 0 0 0 0 0 0 0 0 0Fuelwood 8,391 5,155 3,236 6,830 4,346 2,484 1,561 809 752Posts, poles, and pilings 0 0 0 0 0 0 0 0 0Miscellaneous products 66,521 66,519 2 66,521 66,519 2 0 0 0
Total 110,853 107,458 3,395 106,669 104,034 2,634 4,185 3,424 760
Table 39—(continued).____________________________________________________________________________________________________
Source of material________________________________________________________________All sources Growing stock Other sources
______________________________ ________________________________ _____________________________Region, subregion,and product Total Softwoods Hardwoods Total Softwoods Hardwoods Total Softwoods Hardwoods____________________________________________________________________________________________________________________________
Thousand cubic feet

129
Table 39—(continued)._____________________________________________________________________________________________________
Source of material________________________________________________________________All sources Growing stock Other sources
______________________________ ________________________________ _____________________________Region, subregion,and product Total Softwoods Hardwoods Total Softwoods Hardwoods Total Softwoods Hardwoods____________________________________________________________________________________________________________________________
Thousand cubic feetPacific Northwest:
Saw logs 1,214,799 1,161,979 52,820 1,180,540 1,127,761 52,779 34,260 34,218 42Veneer logs 300,651 287,604 13,047 276,837 263,993 12,844 23,814 23,611 202Pulpwood 41,321 37,483 3,838 35,069 31,433 3,636 6,251 6,049 202Composite products 1,491 1,491 0 1,257 1,257 0 234 234 0Fuelwood 138,003 91,473 46,531 83,053 50,620 32,433 54,951 40,853 14,098Posts, poles, and pilings 69,282 69,282 0 69,282 69,282 0 0 0 0Miscellaneous products 2,231 2,231 0 1,584 1,584 0 647 647 0
Total 1,767,778 1,651,543 116,236 1,647,622 1,545,930 101,692 120,157 105,612 14,544
Pacific Southwest:Saw logs 517,919 517,919 0 475,642 475,642 0 42,277 42,277 0Veneer logs 34,003 33,918 85 27,700 27,615 85 6,303 6,303 0Pulpwood 0 0 0 0 0 0 0 0 0Composite products 0 0 0 0 0 0 0 0 0Fuelwood 165,447 113,235 52,212 62,497 54,721 7,775 102,950 58,514 44,436Posts, poles, and pilings 10,058 10,058 0 10,058 10,058 0 0 0 0Miscellaneous products 256 256 0 4 4 0 252 252 0
Total 727,683 675,386 52,297 575,901 568,040 7,860 151,782 107,346 44,436
Pacific Coast total:Saw logs 1,745,460 1,692,554 52,906 1,668,683 1,615,819 52,864 76,778 76,735 43Veneer logs 334,654 321,522 13,132 304,537 291,608 12,929 30,117 29,914 202Pulpwood 64,520 60,611 3,909 55,886 52,186 3,699 8,634 8,424 209Composite products 1,491 1,491 0 1,257 1,257 0 234 234 0Fuelwood 311,841 209,863 101,979 152,380 109,687 42,692 159,462 100,176 59,286Posts, poles, and pilings 79,340 79,340 0 79,340 79,340 0 0 0 0Miscellaneous products 69,008 69,006 2 68,109 68,107 2 899 899 0
Total 2,606,314 2,434,387 171,928 2,330,192 2,218,004 112,186 276,124 216,382 59,740
United States:Saw logs 7,161,959 5,156,385 2,005,574 6,726,310 4,907,165 1,819,143 435,651 249,219 186,432Veneer logs 1,338,791 1,173,435 165,356 1,274,486 1,118,305 156,180 64,306 55,131 9,174Pulpwood 4,877,555 2,847,095 2,030,460 4,316,687 2,563,598 1,753,088 560,868 283,495 277,372Composite products 453,057 175,300 277,759 406,666 156,466 250,201 46,390 18,835 27,556Fuelwood 1,518,572 377,515 1,141,058 574,598 155,138 419,458 943,975 222,377 721,599Posts, poles, and pilings 177,720 168,925 8,795 166,475 160,039 6,437 11,246 8,886 2,359Miscellaneous products 155,283 121,867 33,417 136,121 107,216 28,905 19,162 14,651 4,511
_______________________________________________________________________________________________
Total 15,682,937 10,020,522 5,662,419 13,601,343 9,167,927 4,433,412 2,081,598 852,594 1,229,003______________________________________________________________________________________________________________________
Note: Data may not add to totals because of rounding.

130
North:Northeast:Roundwood products—
Growing stock 1,145,660 392,835 752,824Other sources 622,143 152,477 469,666Total 1,767,803 545,312 1,222,490
Logging residues—Growing stocka 125,957 21,381 104,576Other sourcesb 585,493 173,648 411,845Total 711,450 195,029 516,421
Other removals—Growing stockc 0 0 0Other sourcesd 10,669 1,400 9,270Total 10,669 1,400 9,270
Total, all classes—Growing stock 1,271,617 414,216 857,400Other sources 1,218,305 327,525 890,781
Total, all materials 2,489,922 741,741 1,748,181
North Central:Roundwood products—
Growing stock 1,216,878 212,524 1,004,354Other sources 361,697 29,376 332,321Total 1,578,575 241,900 1,336,675
Logging residues—Growing stocka 129,795 8,915 120,880Other sourcesb 508,842 77,903 430,939Total 638,637 86,818 551,819
Other removals—Growing stockc 92,537 7,159 85,377Other sourcesd 73,385 4,177 69,207Total 165,922 11,336 154,584
Total, all classes—Growing stock 1,439,210 228,598 1,210,611Other sources 943,924 111,456 832,467
Total, all materials 2,383,134 340,054 2,043,078
North Total:Roundwood products—
Growing stock 2,362,538 605,359 1,757,178Other sources 983,840 181,853 801,987Total 3,346,378 787,212 2,559,165
Logging residues—Growing stocka 255,752 30,296 225,456Other sourcesb 1,094,335 251,551 842,784Total 1,350,087 281,847 1,068,240
Table 40—Roundwood products, logging residues, and other removalsfrom growing stock and other sources by species group, region, andsubregion, 2001
________________________________________________________________
Species group______________________________
Region, subregion,class of material,and source of material Total Softwoods Hardwoods_______________________________________________________________________
Thousand cubic feet

131
Other removals—Growing stockc 92,537 7,159 85,377 Other sourcesd 84,054 5,577 78,477 Total 176,591 12,736 163,854
Total, all classes—Growing stock 2,710,827 642,814 2,068,011 Other sources 2,162,229 438,981 1,723,248
Total, all materials 4,873,056 1,081,795 3,791,259
South:Southeast:Roundwood products—
Growing stock 3,621,496 2,610,998 1,010,498Other sources 263,280 147,001 116,280Total 3,884,776 2,757,999 1,126,778
Logging residues—Growing stocka 351,122 169,950 181,172Other sourcesb 169,860 58,984 110,876Total 520,982 228,934 292,048
Other removals—Growing stockc 331,203 132,340 198,863Other sourcesd 144,997 43,190 101,807Total 476,200 175,530 300,670
Total, all classes—Growing stock 4,303,821 2,913,288 1,390,533Other sources 578,137 249,175 328,963
Total, all materials 4,881,958 3,162,463 1,719,496
South Central:Roundwood products—
Growing stock 4,803,110 3,268,487 1,534,623Other sources 408,681 207,424 201,257Total 5,211,791 3,475,911 1,735,880
Logging residues—Growing stocka 545,089 200,069 345,020Other sourcesb 403,575 134,943 268,631Total 948,664 335,012 613,651
Other removals—Growing stockc 418,114 131,622 286,493Other sourcesd 133,674 27,775 105,898Total 551,788 159,397 392,391
Total, all classes—Growing stock 5,766,313 3,600,178 2,166,136Other sources 945,930 370,142 575,786
Total, all materials 6,712,243 3,970,320 2,741,922
Table 40—(continued)._______________________________________________________________
Species group_____________________________
Region, subregion,class of material,and source of material Total Softwoods Hardwoods______________________________________________________________________
Thousand cubic feet

132
South total:Roundwood products—
Growing stock 8,424,606 5,879,485 2,545,121Other sources 671,961 354,425 317,537Total 9,096,567 6,233,910 2,862,658
Logging residues—Growing stocka 896,211 370,019 526,192 Other sourcesb 573,435 193,927 379,507 Total 1,469,646 563,946 905,699
Other removals—Growing stockc 749,317 263,962 485,356 Other sourcesd 278,671 70,965 207,705 Total 1,027,988 334,927 693,061
Total, all classes—Growing stock 10,070,134 6,513,466 3,556,669 Other sources 1,524,067 619,317 904,749
Total, all materials 11,594,201 7,132,783 4,461,418
Rocky Mountain:Great Plains:
Roundwood products—Growing stock 30,880 21,797 9,083Other sources 29,478 1,488 27,990Total 60,358 23,285 37,073
Logging residues—Growing stocka 3,115 1,742 1,374Other sourcesb 9,817 7,054 2,763Total 12,932 8,796 4,137
Other removals—Growing stockc 5,490 143 5,346Other sourcesd 10,241 150 10,091Total 15,731 293 15,437
Total, all classes—Growing stock 39,485 23,682 15,803Other sources 49,536 8,692 40,844
Total, all materials 89,021 32,374 56,647
Intermountain:Roundwood products—
Growing stock 453,128 443,284 9,843Other sources 120,196 98,445 21,751Total 573,324 541,729 31,594
Logging residues—Growing stocka 44,498 43,851 646Other sourcesb 105,212 102,484 2,727Total 149,710 146,335 3,373
Table 40—(continued).________________________________________________________________
Species group_____________________________
Region, subregion,class of material,and source of material Total Softwoods Hardwoods_______________________________________________________________________
Thousand cubic feet
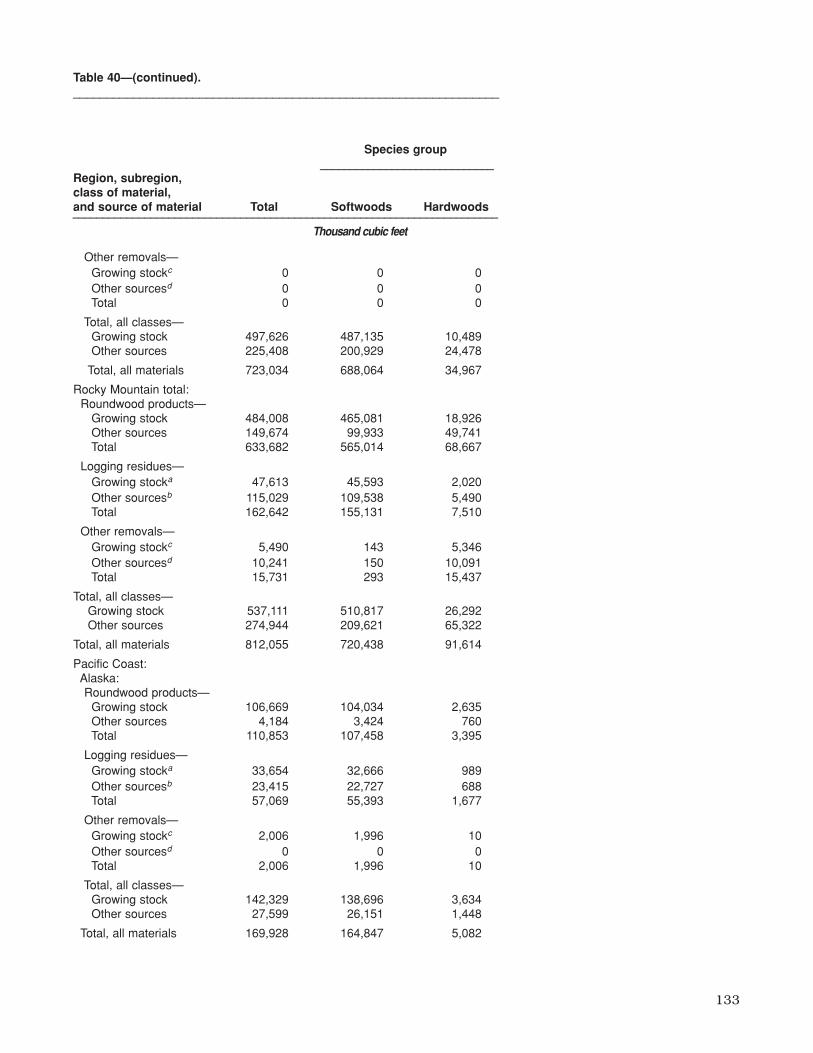
133
Other removals—Growing stockc 0 0 0 Other sourcesd 0 0 0 Total 0 0 0
Total, all classes—Growing stock 497,626 487,135 10,489 Other sources 225,408 200,929 24,478
Total, all materials 723,034 688,064 34,967
Rocky Mountain total:Roundwood products—
Growing stock 484,008 465,081 18,926Other sources 149,674 99,933 49,741Total 633,682 565,014 68,667
Logging residues—Growing stocka 47,613 45,593 2,020Other sourcesb 115,029 109,538 5,490Total 162,642 155,131 7,510
Other removals—Growing stockc 5,490 143 5,346Other sourcesd 10,241 150 10,091Total 15,731 293 15,437
Total, all classes—Growing stock 537,111 510,817 26,292 Other sources 274,944 209,621 65,322
Total, all materials 812,055 720,438 91,614
Pacific Coast:Alaska:Roundwood products—
Growing stock 106,669 104,034 2,635Other sources 4,184 3,424 760Total 110,853 107,458 3,395
Logging residues—Growing stocka 33,654 32,666 989Other sourcesb 23,415 22,727 688Total 57,069 55,393 1,677
Other removals—Growing stockc 2,006 1,996 10Other sourcesd 0 0 0Total 2,006 1,996 10
Total, all classes—Growing stock 142,329 138,696 3,634Other sources 27,599 26,151 1,448
Total, all materials 169,928 164,847 5,082
Table 40—(continued).________________________________________________________________
Species group_____________________________
Region, subregion,class of material,and source of material Total Softwoods Hardwoods_______________________________________________________________________
Thousand cubic feet

Pacific Northwest:Roundwood products—
Growing stock 1,647,622 1,545,931 101,692Other sources 120,157 105,612 14,544Total 1,767,779 1,651,543 116,236
Logging residues—Growing stocka 81,538 77,127 4,411Other sourcesb 83,423 80,151 3,272Total 164,961 157,278 7,683
Other removals—Growing stockc 1,005 605 400Other sourcesd 0 0 0Total 1,005 605 400
Total, all classes—Growing stock 1,730,165 1,623,663 106,503Other sources 203,580 185,763 17,816
Total, all materials 1,933,745 1,809,426 124,319
Pacific Southwest:Roundwood products—
Growing stock 575,900 568,040 7,860Other sources 151,782 107,346 44,436Total 727,682 675,386 52,296
Logging residues—Growing stocka 57,590 56,804 786Other sourcesb 46,386 46,386 0Total 103,976 103,190 786
Other removals—Growing stockc 22 9 13Other sourcesd 222 77 145Total 244 86 158
Total, all classes—Growing stock 633,512 624,853 8,659Other sources 198,390 153,809 44,581
Total, all materials 831,902 778,662 53,240
Pacific Coast total:Roundwood products—
Growing stock 2,330,191 2,218,005 112,187Other sources 276,123 216,382 59,740Total 2,606,314 2,434,387 171,927
Logging residues—Growing stocka 172,782 166,597 6,186Other sourcesb 153,224 149,264 3,960Total 326,006 315,861 10,146
Other removals—Growing stockc 3,033 2,610 423Other sourcesd 222 77 145Total 3,255 2,687 568
134
Table 40—(continued).________________________________________________________________
Species group_____________________________
Region, subregion,class of material,and source of material Total Softwoods Hardwoods_______________________________________________________________________
Thousand cubic feet
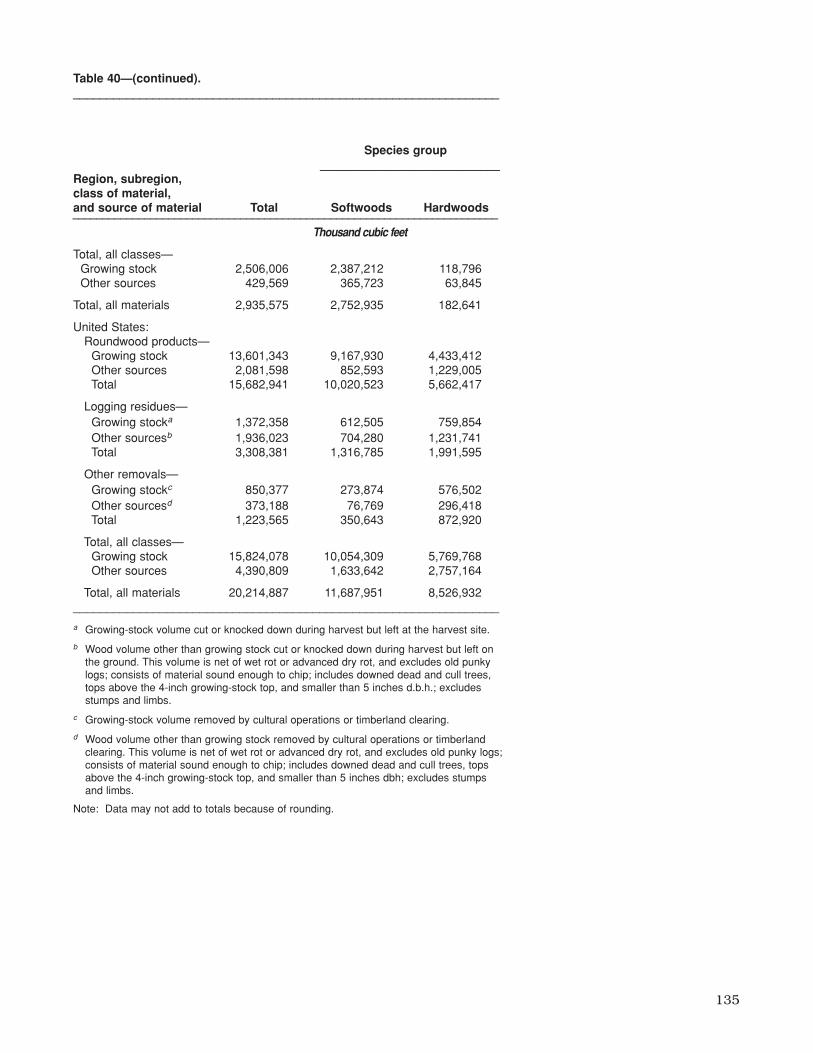
135
Total, all classes—Growing stock 2,506,006 2,387,212 118,796 Other sources 429,569 365,723 63,845
Total, all materials 2,935,575 2,752,935 182,641
United States:Roundwood products—
Growing stock 13,601,343 9,167,930 4,433,412Other sources 2,081,598 852,593 1,229,005Total 15,682,941 10,020,523 5,662,417
Logging residues—Growing stocka 1,372,358 612,505 759,854 Other sourcesb 1,936,023 704,280 1,231,741 Total 3,308,381 1,316,785 1,991,595
Other removals—Growing stockc 850,377 273,874 576,502 Other sourcesd 373,188 76,769 296,418 Total 1,223,565 350,643 872,920
Total, all classes—Growing stock 15,824,078 10,054,309 5,769,768 Other sources 4,390,809 1,633,642 2,757,164
Total, all materials 20,214,887 11,687,951 8,526,932 ________________________________________________________________
a Growing-stock volume cut or knocked down during harvest but left at the harvest site.
b Wood volume other than growing stock cut or knocked down during harvest but left onthe ground. This volume is net of wet rot or advanced dry rot, and excludes old punkylogs; consists of material sound enough to chip; includes downed dead and cull trees,tops above the 4-inch growing-stock top, and smaller than 5 inches d.b.h.; excludesstumps and limbs.
c Growing-stock volume removed by cultural operations or timberland clearing.
d Wood volume other than growing stock removed by cultural operations or timberlandclearing. This volume is net of wet rot or advanced dry rot, and excludes old punky logs;consists of material sound enough to chip; includes downed dead and cull trees, topsabove the 4-inch growing-stock top, and smaller than 5 inches dbh; excludes stumpsand limbs.
Note: Data may not add to totals because of rounding.
Table 40—(continued).________________________________________________________________
Species group______________________________
Region, subregion,class of material,and source of material Total Softwoods Hardwoods_______________________________________________________________________
Thousand cubic feet
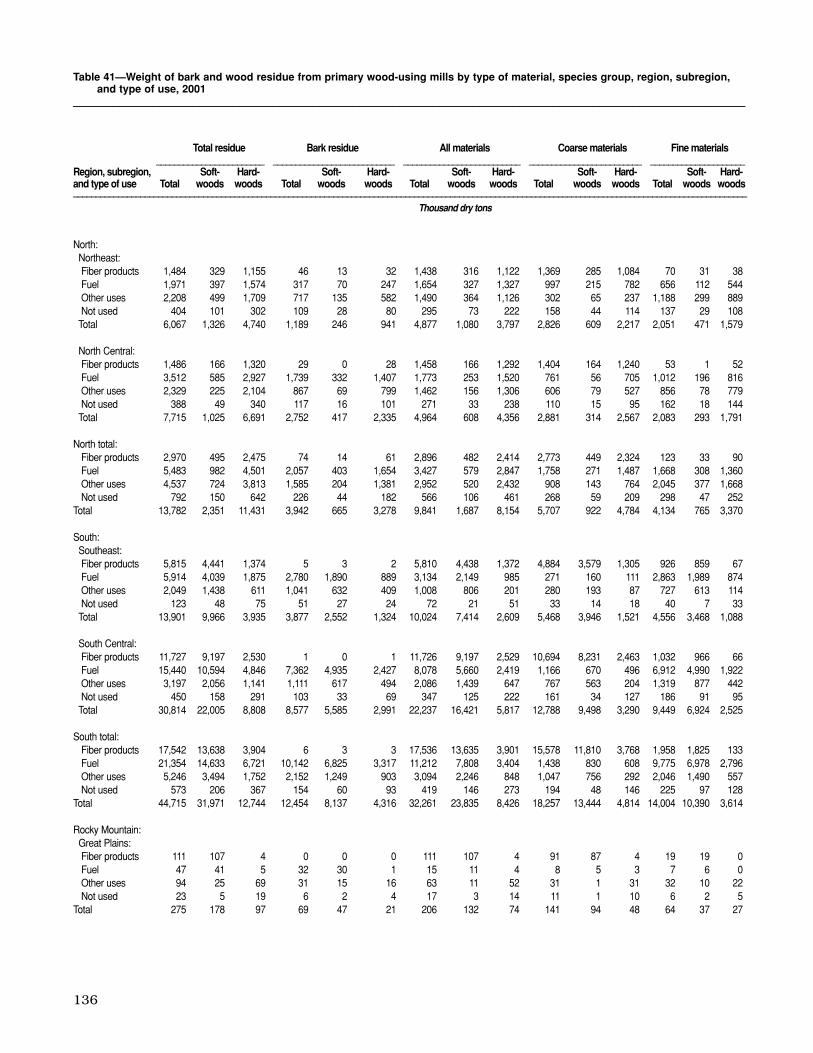
136
North:Northeast:Fiber products 1,484 329 1,155 46 13 32 1,438 316 1,122 1,369 285 1,084 70 31 38Fuel 1,971 397 1,574 317 70 247 1,654 327 1,327 997 215 782 656 112 544Other uses 2,208 499 1,709 717 135 582 1,490 364 1,126 302 65 237 1,188 299 889Not used 404 101 302 109 28 80 295 73 222 158 44 114 137 29 108
Total 6,067 1,326 4,740 1,189 246 941 4,877 1,080 3,797 2,826 609 2,217 2,051 471 1,579
North Central:Fiber products 1,486 166 1,320 29 0 28 1,458 166 1,292 1,404 164 1,240 53 1 52Fuel 3,512 585 2,927 1,739 332 1,407 1,773 253 1,520 761 56 705 1,012 196 816Other uses 2,329 225 2,104 867 69 799 1,462 156 1,306 606 79 527 856 78 779Not used 388 49 340 117 16 101 271 33 238 110 15 95 162 18 144
Total 7,715 1,025 6,691 2,752 417 2,335 4,964 608 4,356 2,881 314 2,567 2,083 293 1,791
North total:Fiber products 2,970 495 2,475 74 14 61 2,896 482 2,414 2,773 449 2,324 123 33 90Fuel 5,483 982 4,501 2,057 403 1,654 3,427 579 2,847 1,758 271 1,487 1,668 308 1,360Other uses 4,537 724 3,813 1,585 204 1,381 2,952 520 2,432 908 143 764 2,045 377 1,668Not used 792 150 642 226 44 182 566 106 461 268 59 209 298 47 252
Total 13,782 2,351 11,431 3,942 665 3,278 9,841 1,687 8,154 5,707 922 4,784 4,134 765 3,370
South:Southeast:Fiber products 5,815 4,441 1,374 5 3 2 5,810 4,438 1,372 4,884 3,579 1,305 926 859 67Fuel 5,914 4,039 1,875 2,780 1,890 889 3,134 2,149 985 271 160 111 2,863 1,989 874Other uses 2,049 1,438 611 1,041 632 409 1,008 806 201 280 193 87 727 613 114Not used 123 48 75 51 27 24 72 21 51 33 14 18 40 7 33
Total 13,901 9,966 3,935 3,877 2,552 1,324 10,024 7,414 2,609 5,468 3,946 1,521 4,556 3,468 1,088
South Central:Fiber products 11,727 9,197 2,530 1 0 1 11,726 9,197 2,529 10,694 8,231 2,463 1,032 966 66Fuel 15,440 10,594 4,846 7,362 4,935 2,427 8,078 5,660 2,419 1,166 670 496 6,912 4,990 1,922Other uses 3,197 2,056 1,141 1,111 617 494 2,086 1,439 647 767 563 204 1,319 877 442Not used 450 158 291 103 33 69 347 125 222 161 34 127 186 91 95
Total 30,814 22,005 8,808 8,577 5,585 2,991 22,237 16,421 5,817 12,788 9,498 3,290 9,449 6,924 2,525
South total:Fiber products 17,542 13,638 3,904 6 3 3 17,536 13,635 3,901 15,578 11,810 3,768 1,958 1,825 133Fuel 21,354 14,633 6,721 10,142 6,825 3,317 11,212 7,808 3,404 1,438 830 608 9,775 6,978 2,796Other uses 5,246 3,494 1,752 2,152 1,249 903 3,094 2,246 848 1,047 756 292 2,046 1,490 557Not used 573 206 367 154 60 93 419 146 273 194 48 146 225 97 128
Total 44,715 31,971 12,744 12,454 8,137 4,316 32,261 23,835 8,426 18,257 13,444 4,814 14,004 10,390 3,614
Rocky Mountain:Great Plains:Fiber products 111 107 4 0 0 0 111 107 4 91 87 4 19 19 0Fuel 47 41 5 32 30 1 15 11 4 8 5 3 7 6 0Other uses 94 25 69 31 15 16 63 11 52 31 1 31 32 10 22Not used 23 5 19 6 2 4 17 3 14 11 1 10 6 2 5
Total 275 178 97 69 47 21 206 132 74 141 94 48 64 37 27
Table 41—Weight of bark and wood residue from primary wood-using mills by type of material, species group, region, subregion,and type of use, 2001
_____________________________________________________________________________________________________
Total residue Bark residue All materials Coarse materials Fine materials________________________ ___________________________ __________________________ _________________________ _____________________
Region, subregion, Soft- Hard- Soft- Hard- Soft- Hard- Soft- Hard- Soft- Hard-and type of use Total woods woods Total woods woods Total woods woods Total woods woods Total woods woods______________________________________________________________________________________________________________________________________________________
Thousand dry tons

137
Intermountain:Fiber products 4,325 4,321 4 0 0 0 4,325 4,321 4 3,186 3,182 4 1,139 1,139 0Fuel 2,147 2,143 4 1,137 1,136 1 1,011 1,007 4 151 150 1 860 857 3Other uses 409 406 3 137 136 1 272 270 2 81 81 0 191 189 2Not used 268 265 3 131 130 1 136 135 2 67 65 1 70 70 0
Total 7,149 7,135 14 1,405 1,402 3 5,744 5,733 12 3,485 3,478 6 2,260 2,255 5
Rocky Mountain total:Fiber products 4,436 4,428 8 0 0 0 4,436 4,428 8 3,277 3,269 8 1,159 1,159 0Fuel 2,194 2,184 10 1,168 1,166 2 1,026 1,018 8 160 155 4 866 863 3Other uses 503 431 72 168 151 18 335 280 55 112 81 31 223 199 24Not used 291 270 21 137 132 5 154 138 16 78 67 11 76 71 5
Total 7,424 7,313 111 1,473 1,449 25 5,951 5,864 87 3,627 3,572 54 2,324 2,292 32
Pacific Coast:Alaska:Fiber products 69 69 0 0 0 0 69 69 0 69 69 0 0 0 0Fuel 28 28 0 0 0 0 28 28 0 8 8 0 20 20 0Other uses 0 0 0 0 0 0 0 0 0 0 0 0 0 0 0Not used 128 118 10 89 86 3 39 32 7 29 24 6 10 9 2
Total 225 215 10 89 86 3 136 129 7 106 101 6 30 29 2
Pacific Northwest:Fiber products 7,304 6,987 317 1 1 0 7,303 6,986 316 5,062 4,772 291 2,240 2,215 26Fuel 3,986 3,606 380 2,385 2,221 165 1,601 1,385 216 561 443 119 1,039 942 97Other uses 1,219 1,110 109 335 305 31 884 805 79 600 566 34 284 239 45Not used 15 15 0 7 7 0 7 7 0 4 4 0 4 4 0
Total 12,524 11,718 806 2,728 2,534 196 9,795 9,183 611 6,227 5,785 444 3,567 3,400 168
Pacific Southwest:Fiber products 2,147 2,144 3 15 15 0 2,132 2,129 3 1,592 1,589 3 540 540 0Fuel 2,286 2,284 1 850 849 1 1,436 1,436 0 544 544 0 892 891 0Other uses 382 382 0 119 119 0 263 263 0 88 88 0 175 175 0Not used 8 8 0 8 8 0 0 0 0 0 0 0 0 0 0
Total 4,823 4,818 4 992 991 1 3,831 3,828 3 2,224 2,221 3 1,607 1,606 0
Pacific Coast total:Fiber products 9,520 9,200 320 16 15 0 9,504 9,185 320 6,724 6,430 294 2,781 2,755 26Fuel 6,300 5,918 382 3,235 3,069 166 3,064 2,848 216 1,114 995 119 1,951 1,853 97Other uses 1,602 1,492 110 454 424 31 1,147 1,068 79 688 654 34 459 414 45Not used 151 141 10 104 101 3 47 40 7 33 27 6 14 12 2
Total 17,573 16,751 822 3,809 3,609 200 13,762 13,141 622 8,559 8,106 453 5,205 5,034 170
United States:Fiber products 34,469 27,762 6,707 96 32 64 34,373 27,730 6,643 28,352 21,958 6,394 6,020 5,771 249Fuel 35,331 23,718 11,614 16,602 11,463 5,139 18,729 12,254 6,475 4,469 2,251 2,218 14,260 10,003 4,257Other uses 11,887 6,141 5,746 4,359 2,027 2,332 7,528 4,114 3,414 2,756 1,634 1,121 4,773 2,480 2,293 Not used 1,807 767 1,040 621 338 283 1,186 429 757 572 201 371 614 228 386
_____________________________________________________________________________________________________________________
Total 83,494 58,388 25,107 21,678 13,860 7,818 61,816 44,527 17,289 36,149 26,044 10,104 25,667 18,482 4,892_____________________________________________________________________________________________________________________________________
Note: Data may not add to totals because of rounding.
Table 41—(continued)._____________________________________________________________________________________________________
Total residue Bark residue All materials Coarse materials Fine materials________________________ ___________________________ __________________________ _________________________ _____________________
Region, subregion, Soft- Hard- Soft- Hard- Soft- Hard- Soft- Hard- Soft- Hard-and type of use Total woods woods Total woods woods Total woods woods Total woods woods Total woods woods______________________________________________________________________________________________________________________________________________________
Thousand dry tons

Smith, W. Brad; Miles, Patrick D.; Vissage, John S.; Pugh, Scott A. 2003. Forest Resources ofthe United States, 2002. Gen. Tech. Rep. NC-241. St. Paul, MN: U.S. Department ofAgriculture, Forest Service, North Central Research Station. 137 p.
An update of forest statistics from the 1997 Resources Planning Act (RPA) Assessment wereupdated to 2002 to provide current information on the Nation's forests. Resource tables presentestimates of forest area, volume, mortality, growth, removals, and timber products output invarious ways, such as by ownership, region, or State. Historic data for 1953, 1963, 1977, 1987,and 1997 are included for resource trend analysis. A compact disk contains the summary data,and a computerized tool that allows readers to make customized analyses.
KEY WORDS: RPA, assessment, inventory, forest statistics, area, volume, trends.
RPA DATA WIZ CD
The included CD contains the RPA Data Wiz, a computer desktop application that allows customsummaries of Resource Planning Act (RPA) Assessment forest information. Summary tables, graphs,and choropleth maps can be produced with this software. A number of variables can be analyzed.Volumes for growing stock, live cull, dead salvable, net growth, and mortality can be estimated.Acreage, biomass, and tree count estimates are also available. Currently, removals are not availablein this software. There is an English and a Metric version of RPA Data Wiz.
Requirements to use RPA Data WizYour computer must have one of the following operating systems:• Windows 95, 98, XP, 2000 or NT 4.0• Windows 2000 Service Pack 2 or higher
Your computer must have the following:• CD-ROM or DVD-ROM drive• Color monitor with 256 or more colors• Microsoft Internet Explorer Version 5.0 or higher• 848 MB of hard disk space for one version (1030 MB for both English and metric versions)
The following items are recommendations, but are not essential:• 200 MB of virtual memory• 512 MB of RAM• Pentium III processor or later• 14 inch computer monitor• Monitor resolution of 1024 X 768• High color (16 bit) display

UNITED STATES DEPARTMENT OF AGRICULTURE
FOREST SERVICE
GENERAL TECHNICAL REPORT NC-241APRIL 2004
http://fia.fs.fed.us