foreword - environmentclearance.nic.inenvironmentclearance.nic.in/writereaddata/online/...dang...
TRANSCRIPT

FOREWORD
A National Perspective Plan for water resources development envisaging inter-basin water transfer was formulated by the Ministry of Water Resources in 1980 for equitable distribution of available water from water surplus basins to water short areas. Subsequently National Water Development Agency (NWDA) was set up to study the feasibility of the river basin links proposed in the above Plan in 1982. The preparation of Detailed Project Report (DPR) of link projects proposed under the National Perspective Plan was included in the functions of NWDA in 2006. Due to concerted efforts of NWDA in association with Central Water Commission (CWC) and Ministry of Water Resources, a tripartite Memorandum of Understanding was signed by the States of Gujarat and Maharashtra and the Union Government on 3rd May 2010 in the presence of Hon’ble Prime Minister for the preparation of Detailed Project Reports of Damanganga-Pinjal and Par-Tapi-Narmada Link Projects. Subsequently, NWDA completed the DPR of Damanganga-Pinjal link Project in March 2014; DPR of the Par-Tapi-Narmada Link Project was completed in August 2015.
The Par-Tapi-Narmada Link Project is a multi-purpose scheme with irrigation, hydropower and water supply benefits. Gujarat State is the principal beneficiary and Maharashtra State will get the benefits of irrigation, water supply to tribal areas in Nasik district and power generation. The project will provide an annual irrigation of 2.32 lakh ha utilizing about 1330 MCM of water including water supply and also generate 21 MW of hydropower.
Government of Gujarat suggested to provide maximum irrigation and drinking water facilities to the tribal areas adjacent to the project. It was suggested to provide irrigation in tribal areas right side of canal by lift in addition to enroute irrigation already proposed and irrigation in tribal areas in the vicinity of six proposed reservoirs. It is also proposed to include command area of five proposed projects of State Government and irrigation in tribal areas of Chhota Udepur and Panchmahal district by lift directly from Narmada Main Canal on substitution basis.
The Secretary (WR,RD&GR) had held meeting with the Hon’ble Chief Minister of Gujarat on 31.12.2016 at Gandhinagar wherein the revised proposal was presented. Some suggestions were given by the Government of Gujarat regarding the planning of the project. NWDA has now completed the modified DPR duly considering the views of Government of Gujarat.
The DPR of the Project has been prepared as per the Guidelines for Preparation of Detailed Project Report
of Irrigation and Multipurpose Projects of Ministry of Water Resources (2010). The DPR contains the details of surveys and investigations such as topographical surveys, geotechnical and construction material surveys, geological investigations, environmental impact assessment studies etc. As mentioned in the MoU, the feasibility of utilization of water by Maharashtra State in their territory by lifting water over the western divide from Par, Auranga and Ambica basins was examined and the proposal was found to be economically not viable.
The Secretary, Ministry of Water Resources, River Development & Ganga Rejuvenation and Chairman,
Central Water Commission have regularly monitored the work of preparation of DPR and provided valuable guidance for its timely completion. Their contribution in this regard is gratefully acknowledged. The co-operation and assistance received from the Water Resources Department of the Governments of Gujarat and Maharashtra in the preparation of the DPR is thankfully acknowledged. My thanks are due to Central Water Commission, Central Soil & Material Research Station (CSMRS), Geological Survey of India (GSI), Central Water & Power Research Station (CWPRS), Tehri Hydro Development Corporation India Ltd. (THDCIL), Regional Remote Sensing Centre (RRSC), Water and Power Consultancy Services (WAPCOS) who were closely associated with various aspects of the investigations and studies and provided necessary technical assistance.
I compliment the concerned officers of NWDA, especially the Chief Engineer (HQ), the Chief Engineer (South), Hyderabad and the Superintending Engineer, Investigation Circle, Valsad and their teams including field Investigation Divisions Vadodara and Valsad for their sincerity, devotion and hard work in completing this challenging task in the assigned time period.
It is hoped that after the requisite statutory clearances, the Project will be taken up for implementation in the
right earnest.
April 27, 2017 (Sharad Kumar Jain) New Delhi Director General, NWDA

ii
PREFACE
Water resources development and management is a key area which needs focused attention for proper utilization of water which is a precious natural resource. The development, conservation and use of water, therefore, play a vital role in the country’s development planning. The water resources in the country are, however, limited. The rainfall in the country is mostly confined to monsoon season and is unevenly distributed with respect to both space and time. As a result, some parts of the country are affected by droughts whereas other parts are affected by floods. Water will become a scarce resource in the near future due to increasing population and increasing demands for various uses due to continuous improvement in the living standards of the people. So, the monsoon flood waters should be conserved and utilized for drinking, irrigation, power generation, etc.
Saurashtra and Kutch regions are semi-arid and suffer from frequent droughts. In these regions, ground water scenario is also disappointing and reliable water resources have disappeared. The areas bordering desert and coastal region are heavily saline; a large part of Saurashtra is surrounded by the traps which do not bear any ground water. The salinity is increasing further inland due to over-exploitation of sweet ground water. Scanty and irregular rainfall, shallow soils in most of the areas and lack of assured irrigation limit the intensity of agriculture, selection of crops and level of productivity in this region.
A tripartite Memorandum of Understanding (MoU) was signed by the States of Gujarat and Maharashtra and the Union Government on 3rd May, 2010 at New Delhi for preparation of Detailed Project Reports (DPR) of Damanganga – Pinjal and Par-Tapi-Narmada link projects. Both these projects envisage diversion of water from the west flowing rivers of Gujarat and Maharashtra. The DPR of Par-Tapi-Narmada link project was completed by NWDA in August, 2015.
The Par – Tapi – Narmada Link Project envisages utilisation of 1330 MCM of
surplus waters of Par, Auranga, Ambica and Purna river basins for utilization in en-route irrigation and to meet drinking water needs in the vicinity of the project. This project will also take over a part of the command area of the existing Miyagam Branch canal of Narmada canal system so that water saved in Sardar Sarovar Project could be taken further northwards to benefit water scarce areas of Saurashtra and Kutch regions in Gujarat.
Government of Gujarat suggested to provide maximum irrigation and drinking water facilities to the tribal areas adjacent to the project. It was suggested to provide irrigation in tribal areas right side of canal by lift in addition to enroute irrigation already proposed and irrigation in tribal areas in the vicinity of six proposed reservoirs. It is also proposed to include command area of five proposed projects of State Government and irrigation in tribal areas of Chhota Udepur and Panchmahal district by lift directly from Narmada Main Canal on substitution basis.

iii
The Secretary (WR,RD&GR) held meeting with Hon’ble Chief Minister of Gujarat on 31.12.2016 at Gandhinagar and made presentation on the revised proposal. Some additional suggestions were made regarding the planning of the project by the Government of Gujarat. NWDA has now completed the modified DPR duly considering the views of Government of Gujarat.
The project is now estimated to cost Rs. 10211 Crore (2014-15 price level) and the benefit-cost ratio works out to 1.035.
The Project Report has been prepared in eleven volumes as detailed below.
Volume – I Main Report (Part-I and Part-II) Volume – II Annexures of Main Report Volume – III Appendices – Survey & Investigations Volume – IV Appendices - Hydrology and Water Assessment Volume – V Appendices - Power Volume – VI (A) Appendices – Cost Estimate Volume – VI (B) Appendices – Cost Estimate Volume – VII Drawings – Survey & Investigations Volume – VIII (A) Drawings – Designs Volume – VIII (B) Drawings – Designs Volume – VIII (C) Drawings – Designs
Director General, NWDA had regularly monitored the progress of preparation of Detailed Project Report and has provided valuable guidance and advice which has helped in timely completion of the DPR. His contribution in this regard is gratefully acknowledged. I also acknowledge the support provided by Chief Engineer (HQ) and his team.
The officers of Water Resources Department, Government of Gujarat and Maharashtra provided continuous support to NWDA in preparation of the DPR. Their contribution in this regard is thankfully acknowledged.
I would also like to place on record my sincere thanks to my Office and the Superintending Engineer, Investigation Circle, Valsad, and Executive Engineers of Investigation Divisions, Vadodara & Valsad and their team for their meticulous planning and untiring efforts due to which the DPR could be completed within the stipulated time.
28th April, 2017 (M.K. Srinivas) Hyderabad Chief Engineer (South), NWDA

xxxiv
Par-Tapi-Narmada Link Project
Salient Features
Sl. No.
Particulars
1 Name of the Project Par-Tapi-Narmada Link Project 2 Type of Project
(Irrigation or Multipurpose)
Multipurpose
3 Location Maharashtra and Gujarat 3.1 River Basin a) Name Par, Auranga, Ambica, Purna, Mindhola,
Tapi,Kim and Narmada b) Located in i) State(s) Gujarat and Maharashtra
3.2 River / Tributary Par/Aroti, Nar, Bhimtas, Vajra and Keng Auranga/Man and Tan, Ambica/Khapri, Olan, Kaveri and Kharera,Purna/Girra, Zankhari and Damas khadi
3.3 State(s)/Districtrict(s)/Taluka(s) in which the following are located:
a) Reservoirs State District Taluka (i) Jheri Dam Maharashtra Nasik Peint (ii) Paikhed Dam Gujarat /
Maharashtra Valsad/Nasik Dharampur/
Surgana (iii) Chasmandva Dam Gujarat /
Maharashtra Valsad/Nasik Dharampur/
Surgana (iv) Chikkar Dam Gujarat Dang Ahwa (v) Dabdar Dam Gujarat Dang Ahwa (vi)Kelwan Dam Gujarat Dang Ahwa
b) Head work State District Taluka (i) Jheri Dam Maharashtra Nasik Peint (ii) (a) Paikhed Dam Gujarat Valsad Dharampur (b)Paikhed barrage Gujarat Valsad Dharampur (iii) (a)Chasmandva
Dam Gujarat Valsad Dharampur
(b)Chasmandva barrage
Gujarat Valsad Dharampur
(iv) Chikkar Dam Gujarat Dang Ahwa (v) Dabdar Dam Gujarat Dang Ahwa (vi) Kelwan Dam Gujarat Dang Ahwa

xxxv
c) Command Area State District Taluka 1. Enroute command
area Gujarat Dang Ahwa
Bharuch Ankleshwar, Valia Jhagadia
Navsari Vansda Surat Mangrol,Mahuva,
Mandvi Tapi Vyara Valsad Dharampur
2. Projects proposed by Government of Gujarat
Gujarat Navsari Vansda,Chikhali Khergam
Valsad Kaprada, Valsad, Dharampur
Tapi Vyara,Songadh Surat Mahuva
3. Right side command area by lift
Gujarat Tapi Vyara
Tapi Songadh Surat Mangrol,
Umarpada Bharuch Jhagadia, Valia
4. Command area in the vicinity of proposed reservoirs by lift
Maharashtra Nasik Surgana, Peint Gujarat Navsari Vansada
Valsad Dharampur Dang Ahwa,Waghai
Subir 5. Taken over command 1. Chhota Udepur Gujarat Chhota
Udepur Jetpur Pavi, Sankheda, Nasvadi, Kavant, Bodeli, Chhota Udepur
2. Panchmahal Gujarat Panchmahal Halol, Kalol, Ghoghamba
3. Saurashtra Region Saurashtra Region d) Power house State District Taluka
(i) Paikhed Dam Gujarat Valsad Dharampur (ii) Chasmandva Dam Gujarat Valsad Dharampur (iii) Chikkar Dam Gujarat Dang Ahwa (iv) Dabdar Dam Gujarat Dang Ahwa (v) Kelwan Dam Gujarat Dang Ahwa

xxxvi
(vi) Kelwan Feeder Pipe line
Gujarat Dang Ahwa
3.4 Name of village near Head works
Name of the village
(i)Jheri Dam Jheri /Behadpada (ii)Paikhed Dam Paikhed/Tutarkhed Paikhed barrage Nanicoswadi (iii) Chasmandva Dam Chasmandva Chasmandva
barrage Chondha Chikadi
(iv)Chikkar Dam Chikkar (v) Dabdar Dam Dabdar (vi) Kelwan Dam Kelwan
3.5 Location of Head works
Latitude (N) Longitude (E)
(i) Jheri Dam 20o 22’ 25" 73o 25’ 51" (ii) (a) Paikhed Dam 20o 27’ 42" 73o 23’ 37"
(b) Paikhed
barrage 20o 27’ 11" 73o 22’ 30"
(iii) (a)Chasmandva Dam
20o 37’ 02" 73o 22’ 36"
(b)Chasmandva barrage
20o 36’ 05" 73o 18’ 50"
(iv)Chikkar Dam 20o 42’ 00" 73o 30’ 50" (v) Dabdar Dam 20o 48’ 58" 73o 32’ 05" (vi) Kelwan Dam 20o 55’ 30 " 73o 32’ 00"
c) Lies in Earthquake Zone No.
The project sites lie in seismic Zone-III as per the zoning map of India (IS: 1893-2002, Part-1).
3.6 Project area reference to: a) Survey of India Topo-
sheets-1:50,000 Scale 46 F/12 46G / 2, 3, 5, 6, 7, 8, 9, 11, 12 46H / 2, 3, 5, 6, 7, 9, 10
b) Index Plan Plate: 1.1 3.7 Access to the project Name Distance from
project site a) Airport Mumbai/ Surat 170 km to 300 km b) Rail head Valsad/Surat on WR 90 km to 100 km c) Road head Valsad/Surat
West side of NH-8 80 km to 95 km
d) River port Hazira 100 km to 150 km e) Seaport Mumbai 170 km to 300 km

xxxvii
4 InterState aspects of the project a) Catchment area of the
basin
1) State-wise details of catchment area
Maharashtra (km2)
Gujarat (km2)
Total (km2)
(i) Par Basin 773 875 1648 (ii) Auranga Basin 150 598 748 (iii) Ambica Basin 102 2583 2685 (iv) Purna Basin 58 2135 2193
b) State-wise details of catchment area up to diversion dam
Maharashtra (km2)
Gujarat (km2)
Total (km2)
(i) Jheri Dam-Par river 425 - 425 (ii) Paikhed-Nar river 269 46 315 (iii) Chasmandva-
Auranga river 62 27 89
(iv) Chikkar-Ambica River
102 202 304
(v) Dabdar-Khapri River - 457 457 (vi) Kelwan-Purna River - 694 694
c) 1.Submergence due to projects (ha)-State wise
Maharashtra (ha)
Gujarat (ha)
Total (ha)
(i) Jheri Dam 836 -- 836 (ii) Paikhed 100 894 994 (iii) Chasmandva 32 583 615 (iv) Chikkar -- 742 742 (v) Dabdar -- 1249 1249 (vi) Kelwan -- 1629 1629 Total 968 5097 6065 2.Submergence due to
projects (ha) & Land use / Land cover
Forest (ha)
Culturable land(ha)
River bed (ha)
Total (ha)
(i) Jheri Dam 408 256 172 836 (ii) Paikhed 317 589 88 994 (iii) Chasmandva 300 255 60 615 (iv) Chikkar 300 332 110 742 (v) Dabdar 614 482 153 1249 (vi) Kelwan 890 450 289 1629 Total 2829 2364 872 6065
d) Water allocation for the State (if any) / country
Water sharing between the States of Gujarat and Maharashtra is under finalisation
e) Committed Jheri (MCM) Paikhed (MCM)

xxxviii
utilisation Upstream
Projects Irriga-tion
Water supply
Indu-strial
Hydel Envr. &Eco
Irriga-tion
Water supply
Indu-strial
Hydel Envr. & Eco
i) Projects completed
6.49 -- -- -- -- 1.61 -- -- - --
ii) Projects under construction
1.58 -- -- -- -- -- -- -- - --
iii) Future projects 11.09 1.30 3.94 -- -- 11.32 1.83 3.99 -- 3.06 iv) Any other -- -- -- -- -- -- -- -- -- --
Downstream Projects
i) Projects completed
-- -- -- -- -- -- -- -- -- --
ii) Projects under construction
-- -- -- -- -- -- -- -- -- --
iii) Future projects -- -- -- -- -- -- -- -- -- -- iv) Any other -- -- -- -- -- -- -- -- -- --
Sub-total 19.16 1.30 3.94 -- -- 12.93 1.83 3.99 -- 3.06 Committed
utilisation Chasmandva (MCM) Chikkar (MCM)
Upstream Projects
Irrigation
Water supply
Industrial
Hydel Envr. &Eco
Irrigation
Water supply
Industrial
Hydel Envr. & Eco
i) Projects completed
-- -- -- -- -- -- -- -- -- --
ii) Projects under construction
-- -- -- -- -- -- -- -- -- --
iii) Future projects 5.88 0.27 0.85 -- 0.59 52.79 0.64 2.20 -- 2.42 Downstream
Projects
i) Projects completed
-- -- -- -- -- -- -- -- -- --
ii) Projects under construction
-- -- -- -- -- -- -- -- -- --
iii) Future projects -- -- -- -- -- -- -- -- -- -- iv) Any other -- -- -- -- -- -- -- -- -- --
Sub-total 5.88 0.27 0.85 -- 0.59 52.79 0.64 2.20 -- 2.42 Committed
utilisation Dabdar (MCM) Kelwan (MCM)
Upstream Projects
Irrigation
Water supply
Industrial
Hydel Envr. &Eco
Irrigation
Water supply
Industrial
Hydel Envr. &Eco
i) Projects completed
-- -- -- -- -- -- -- -- -- --

xxxix
ii) Projects under construction
-- -- -- -- -- -- -- -- -- --
iii) Future projects 61.54 3.88 5.53 -- 3.93 52.47 5.22 7.53 -- 4.10 iv) Any other -- -- -- -- -- -- -- -- -- --
Downstream Projects
i) Projects completed
-- -- -- -- -- -- -- -- -- --
ii) Projects under construction
-- -- -- -- -- -- -- -- -- --
iii) Future projects -- -- -- -- -- -- -- -- -- -- iv) Any other -- -- -- -- -- -- -- -- -- --
Sub-total 61.54 3.88 5.53 -- 3.93 52.47 5.22 7.53 -- 4.10 f) Proposed annual
utilisation(net consumptive) by the project (MCM)
Jheri Paikhed Chas mandva
Chikkar Dabdar Kelwan
i) Irrigation 19.16 12.93 5.8 50.29 58.67 52.47 ii) Hydel (evaporation
losses) (MCM) nil nil nil nil nil nil
iii) Thermal Power (MCM)
nil nil nil nil nil nil
iv) Local Domestic and Industrial (MCM)
1.05 1.17 0.22 0.57 1.89 2.55
v) Gross annual utilisation (MCM) (sum of i to v)
20.21 14.10 6.02 50.86 60.56 55.02
g Minimum agreed / proposed flow in the river for maintaining ecology
0.00 3.06 0.59 2.42 3.93 4.10
5 Estimated life of the projects (years)
100 years
6 Irrigation (ha)
The project will provide annual irrigation to 2.32 lakh hectare area in En-route and drought prone Saurashtra and Kutch area as detailed below:
Command CCA (ha)
Annual Irrigation(ha)
a. En-route command
(i) From Main canal 59920 59920
(ii) From feeder pipe line 1270 1270

xl
b.Project proposed by Government of Gujrat on the left side of canal
45561 45561
c. Tribal area in enroute right of canal
36200 36200
d. Tribal area in vicinity of reservoirs
12514 12514
e. Tribal areas on right side of Narmada main canal by lift
34342 34342
f. Target command in drought prone Saurashtra and Kutch region
42368 42368
Grand Total 232175 232175 Say 2.32 lakh ha
7 Flood control No flood control envisaged 8 Navigation No navigation proposed 9 Water supply
9.1 Domestic and Industrial a) Names of towns / villages/
Industries served Local domestic and industrial demands considered in the vicinity of project area.
b) Size of population served Villages in the vicinity of the dam sites c) Quantum of water made
available (MCM) 126 MCM (76 MCM for drinking + 50 MCM
for filling tanks) d) Quantum of water per
capita (litre) 70/135
10 Project performance Jheri Paikhed Period of simulation
No. of failure
Period of simulation
No. of failure
a) Irrigation 32 -- 32 -- b) Power 32 -- 32 -- c) Flood control Not applicable Not applicable d) Water supply 32 -- 32 -- e) Navigation Not applicable Not applicable
Chasmandva Chikkar a) Irrigation 32 -- 32 -- b) Power 32 -- 32 -- c) Flood control Not applicable Not applicable d) Water supply 32 32 e) Navigation Not applicable Not applicable
Dabdar Kelwan a) Irrigation 32 -- 32 -- b) Power 32 -- 32 --

xli
c) Flood control Not applicable Not applicable d) Water supply 32 32 e) Navigation Not applicable Not applicable 11 Hydrology
11.1 Catchments 11.1.1 Catchments area
at headwork site km2)
Jheri Paikhed Chas mandva
Chikkar
Dabdar
Kelwan
a) Gross 425 315 89 323 482 733 b) Intercepted i) By existing projects 5.83 1.34 - - - -
ii) By ongoing projects 2.55 - - - - - iii) By contemplated
projects 17.90 18.27 8.16 44.3 58.26 53.98
c) Un-intercepted 398.72 331.93 80.84 278.7 398.74 640.02 11.1.2 Catchment area
classification according to mode of precipitation
(a) Rain-fed (km2)
(b) Snow-fed (km2)
(i) Jheri Dam 425 Nil (ii) Paikhed 315 Nil (iii)Chasmandva 89 Nil (iv)Chikkar 323 Nil (v)Dabdar 482 Nil (vi)Kelwan 733 Nil
11.2 Precipitation(mm) 11.2.1 Catchments Annual rainfall Annual
Snowfall (a)
Average (b)
Maximum (c)
Minimum
(i) Par 2180 2669 1920 Nil (ii) Auranga 2050 2406 1644 Nil (iii) Ambica 1830 2520 1419 Nil (iv) Purna 1472 1972 782 Nil
11.2.2 Command Area: Command area lies in the following basins
Mean annual rainfall
(i) Ambica and Purna 2528.5 (ii) Tapi 894.4 (iii) Narmada 1107.3
11.3 Annual yield calculated at the proposed site (MCM)
Jheri Paikhed

xlii
Gross Net Gross Net a) Average yield 528 508.70 380 366.60 b) At 50% dependability 467 446.30 335 320.80 c) At 75% dependability 391 371.10 264 249.90 d) At 100% dependability 183 173.60 152 144.10
Chasmandva Chikkar Gross Net Gross Net
a) Average yield 102 96.10 304 254.70 b) At 50% dependability 91 84.90 257 206.20 c) At 75% dependability 70 64.00 220 169.70 d) At 100% dependability 41 37.40 139 107.10
Dabdar Kelwan Gross Net Gross Net
a) Average yield 488 429.90 497 443.50 b) At 50% dependability 455 394.20 445 390.30 c) At 75% dependability 323 262.00 362 307.60 d) At 100% dependability 150 122.00 252 214.10
11.4 Climatic Data (command)
IMD Stations in the command area
Surat station Vadodara station
Max Min Max Min Temperature (0C) 36.80 14.70 39.90 13.20 Relative Humidity (%) 90.00 53.00 94.00 44.00 Wind Speed (km/h) 6.40 1.70 13.30 2.20 Cloud Cover (Oktas) 6.2 0.70 6.4 0.80
11.5 Seismic coefficients Jheri Paikhed Concrete Earthen Concrete Earthen
a) Horizontal 0.090 0.017 0.086 0.024
b) Vertical 0.085 0.012 0.078 0.017
Chasmandva Chikkar Concrete Earthen Concrete Earthen
a) Horizontal 0.088 0.028 0.082 0.023
b) Vertical 0.083 0.020 0.076 0.016
Seismic coefficients Dabdar Kelwan Concrete Earthen Concrete Earthen
a) Horizontal 0.097 0.028 0.097 0.029
b) Vertical 0.091 0.019 0.091 0.020
11.6 Utilisation within the State 1330 MCM (PTN link canal

xliii
(MCM) requirement:1210 MCM ; Environmental releases d/s of proposed dam sites: 20 MCM ; Drinking water and filling of tanks requirement in the vicinity of proposed reservoirs: 60 MCM; and evaporation losses proposed in the reservoir: 40 MCM in Gujarat State
11.6.1 Water availability (State’s share in case of interState river)
Water sharing between the States of Gujarat and Maharashtra is under finalisation
11.6.2 Committed utilisation Jheri Dam
(MCM) Paikhed Dam (MCM)
Major & Medium
Minor Major & Medium
Minor
a) Upstream Projects i) Projects completed - 6.49 1.61
ii) Projects under construction - 1.58 - - iii) Future projects - 11.09 11.32 iv) Any other - - - - b) Downstream Projects - i) Projects completed - - - -
ii) Projects under construction - - - - iii) Future projects - - - - iv) Any other - - - -
Chasmandva Dam (MCM)
Chikkar Dam (MCM)
Major & Medium
Minor Major & Medium
Minor
a) Upstream Projects i) Projects completed - - - -
ii) Projects under construction - - - - iii) Future projects - 5.8 30.05 22.74 iv) Any other - - - b) Downstream Projects - - - - i) Projects completed - - - -
ii) Projects under construction - - - - iii) Future projects - - - - iv) Any other - - - -
Committed utilisation Dabdar Dam (MCM)
Kelwan Dam (MCM)
Major & Minor Major & Minor

xliv
Medium Medium a) Upstream Projects - - - - i) Projects completed - - - -
ii) Projects under construction - - - - iii) Future projects 34.43 27.11 - 52.47 iv) Any other - - - - b) Downstream Projects - - - - i) Projects completed - - - -
ii) Projects under construction - - - - iii) Future projects - - - - iv) Any other - - - -
11.6.3 Proposed utilisation by the
project (a) Irrigation
(MCM)
(b) Water supply (MCM)
(i)Jheri Dam 0.00 10.00 (ii)Paikhed Dam 0.00 10.00 (iii)Chasmandva Dam 0.00 10.00 (iv)Chikkar Dam 0.00 10.00 (v)Dabdar Dam 5.00 10.00 (vi)Kelwan Dam 5.00 10.00 10.00 60.00
11.7 Floods near the headwork site 11.7.1 Observed period of
record (a) Maximum water level (El-m)
(b)Maximum discharge estimated (Cumec)
(c)Year of occurrence, date
(i)Jheri Dam NA NA NA (ii)Paikhed Dam NA NA NA (iii)Chasmandva
Dam NA NA NA
(iv)Chikkar Dam NA NA NA (v)Dabdar Dam NA NA NA (vi)Kelwan Dam NA NA NA
11.7.2 Estimated Flood -Magnitude (Cumec) /Dams
Jheri Paikhed Chasmandva Chikkar Dabdar Kelwan
a) 50 year return period diversion flood (Cumec)
2703 2017 1024 2167 2539 3102
b) 100 year return period diversion
2989 2211 1065 2374 2796 3428

xlv
flood (Cumec) c) Standard project
flood NA NA NA NA NA NA
d) Maximum probable flood (Cumec)
6539 5307 2578 5649 6683 7979
Barrage Sites Paikhed Chasmandva a) 500 year return period
diversion flood (Cumec) 2819 1961
b) 100 year return period diversion flood (Cumec)
2247 1572
c) Standard project flood 4596 3213 11.7.3 Design flood
(Cumec) Jheri Paikhed Chas
mandva Chikkar Dabdar Kelwan
a) Dam (Cumec) 6539 5307 2578 5649 6683 7979 b) Barrage NA 2247 1572 2758 NA NA c) Construction
Diversion NA NA NA NA NA NA
d) Flood control works
NA NA NA NA NA NA
11.7.4 River flows (minimum observed)
(a)Water level (El-m)
(b)Discharge (Cumec)
(c)Months of Nil flow, if any
Par River River bed level 0.00 January to May Auranga River River bed level 0.00 January to May Ambica River River bed level 0.00 January to May Purna River River bed level 0.00 January to May Mindhola River River bed level 0.00 January to May Tapi River River bed level 0.00 January to May Kim River River bed level 0.00 January to May Narmada River River bed level 0.00 January to May
12 Reservoir Jheri Paikhed Chas mandva
Chikkar
Dabdar
Kelwan
12.1 Water levels (m) a) Maximum Water
Level (m) 247.00 249.00 215.00 212.00 170.00 166.00
b) Full Reservoir Level (m)
246.00 248.00 214.00 210.00 169.00 164.00
c) Minimum Draw Down Level (m)
204.00 190.00 190.00 179.00 139.00 136.00
d) Outlet levels i) Irrigation (m)
ii) Power TWL(m) NA 172.00 173.02 172.00 136.96 135.46 iii) Others (please NA 162.35 167.81 168.81 134.87 134.12

xlvi
specify)Invert level of penstock at inlet
e) Dead Storage Level (m)
199.00 172.00 176.00 170.00 127.00 128.2
f) Deepest River bed level (m)
180.00 163.14 170.00 152.43 112.00 115.27
12.4 Live storage (MCM)
190.18 218.30 75.86 129.03 201.06 258.28
12.5 Capacity at (MCM)
Jheri Paikhed Chas mandva
Chikkar
Dabdar
Kelwan
a) Full reservoir level (MCM)
206.03 229.53 83.63 141.99 222.38 282.17
b) Minimum draw down level (MCM)
15.85 11.23 7.77 12.96 21.32 23.89
c) Dead storage level (MCM)
9.23 0.92 0.36 3.69 4.32 6.51
12.6 Flood absorption capacity (MCM)
No Flood storage is earmarked for any of these project
12.7 Sedimentation (MCM) and levels after
Jheri Reservoir Paikhed Reservoir
Years 50 Years 100 Year 50 Year 100 Year a) Above MDDL 9.69 20.79 10.02 20.10 b) Below MDDL 8.47 14.81 3.64 7.00 c) Sedimentation volume
(MCM) 18.01 35.94 13.57 27.11
d) New zero elevation 185.00 198.50 164.34 171.88 Chasmandva
Reservoir Chikkar Reservoir
50 Years 100 Year 50 Years
100 Year
a) Above MDDL 2.282 4.723 8.018 17.081 b) Below MDDL 1.572 3.099 5.025 8.746 c) Sedimentation volume
(MCM) 3.88 7.76 13.04 26.03
d) New zero elevation 171.75 176.00 162.10 169.30 Sedimentation
(MCM) and levels after
Dabdar Reservoir Kelwan Reservoir
Years 50 Years 100 Year 50 Years 100 Year

xlvii
a) Above MDDL 11.455 24.450 19.38 40.92 b) Below MDDL 7.994 14.950 10.29 18.33 c) Sedimentation volume
(MCM) 19.55 39.03 29.90 59.69
d) New zero elevation 119.90 126.90 122.20 128.20`
12.8 Average monthly evaporation losses from the reservoir
Monthly Evaporation depths (mm/day)
Jheri, Paikhed, Chasmandva, Chasmandva barrage, Dabdar and Kelwan
Paikhed barrage, Chikkar dam and
Ukai dam
i) June 4.7 6.8 ii) July 2.3 3.3
iii) August 2.3 3.3 iv) September 3.6 5.1 v) October 4.6 6.5
vi) November 3.6 5.1 vii) December 2.9 4.1
viii) January 2.9 4.1 ix) February 3.0 4.6 x) March 4.6 6.5
xi) April 5.3 7.5 xii) May 5.7 8.1
12.9 Seepage in the reservoir All the reservoirs are water tight
13 Submergence 13.1 Land and property submerged
Name of project
Jheri Paikhed Chas mandva
Chikkar Dabdar Kelwan Total
a) Villages affected (No.)
6 11 7 9 11 17 61
i) Fully - - - - - 1 1 ii) Partially 6 11 7 9 11 16 60 b) Land affected
(ha)
i) Gross 836 994 615 742 1249 1629 6065 ii) Culturable 256 589 255 332 482 450 2364
iii) Forest 408 317 300 300 614 890 2829 iv) Others (specify)
River portion 172 88 60 110 153 289 872
c) Buildings / 98 331 379 345 563 793 2509

xlviii
houses No. d) Road / Rail (km) Major
road connecting Peint-Surgana(1km)
Major road connecting Sidumber-Tutarkhed
nil Waghai- Saputara National Highway (NH-360) (8 km).
Waghai-Ahwa Major Road (8 km)
Vyra-Ahwa Major Road (7 km)
e) Transmission lines (km)
nil nil nil The power and telephone lines of about 10 km length connecting Baj-Lahen-Dabdar village
The power and telephone lines of about 12 km length connecting Waghai-Pimpri village
The power and telephone lines of about 4 km length connecting Karlipada-Khatal village
f) Any other 13.2 Submergence
ratio (with reference to CCA)
Total submergence area (cultivated) under the 6 reservoirs is 2364 ha and the total CCA of the Link project is 232175 ha. Therefore, the submergence Ratio works out to 0.0102
13.3 Number of families affected
Jheri Paikhed Chas mandva
Chikkar
Dabdar Kelwan
98 331 379 345 563 793 13.4 Anticipated back water levels at important places along the periphery
of reservoir

xlix
(i)Jheri 247 m upto 14.60 km from dam axis (ii)Paikhed 249 m upto 17.40 km from dam axis (iii)Chasmandva 215 m upto 6.00 km from dam axis (iv)Chikkar 212 m upto 11.00 km from dam axis (v)Dabdar 170 m upto 11.00 km from dam axis (vi)Kelwan 166 m upto 24.00 km from dam axis
14 Head works 14.1 Dam
14.1.1 Embankment Dam
Jheri Paikhed Chas mandva
Chikkar Dabdar Kelwan
a) Type of dam (Homogenous/Zoned/Rock-fill/Concrete faced)
CFRD/ Concrete
CFRD/ Concrete
CFRD/ Concrete
CFRD/ Concrete
CFRD/ Concrete
CFRD/ Concrete
b) TBL (m) 253.00 255.00 222.00 217.00 177.00 174.0 c) Length of dam at
top (m) 808.32 1431.85 2781 1887 1170 1330
i) Right Flank -- 757.60 841 -- -- 1141 ii) Left Flank (m) 663.32 553.25 1862 1736 1035 -- d) Top width (m) 10.00 10.00 10.00 10.00 10.00 10.00 e) Maximum height
above GL (m) 75.88 94.4 53.70 62.27 63.65 57.95
f) Dyke(s)
The entire rim of proposed reservoirs is covered with the contours of value higher than the MWL as such no dyke(s) are proposed along the rim of reservoirs.
i) Number ii) Total length (m)
iii) Maximum height m)
g) Type of cut off and maximum depth
14.1.2 Masonry and Concrete Dam (Non-over flow section)
Jheri Paikhed Chas mandva
Chikkar Dabdar Kelwan
a) Type of Dam (masonry/concrete/ composite, any other)
Concrete Concrete Concrete Concrete
Concrete Concrete
b) EL of top (m) (Road EL)
253 255 222 217 177 174
c) EL of deepest 210 175 184 170 132 123

l
foundation left side(m)
EL of deepest foundation right side(m)
225 210 184 179 145 123
d) Length at top (m) 54 49 34 79 44 98 e) Length at the river
bed (m) 40 45 30 75 40 40
f) Width at top (m) 7 10 10 7 7 8 g) Width at deepest
bed level (m) 65.4 72.89 69.12 87.18 157.80 34.81
h) Maximum height above deepest foundation level (m)
43 80 38 47 45 51
14.1.3 Spillway (overflow section)
Jheri Paikhed Chas mandva
Chikkar Dabdar Kelwan
a) Type of spillway (Ogee / chute / side channel / tunnel / siphon / any other type (specify)
Ogee Ogee Ogee Ogee Ogee Ogee
b) Full reservoir level (m)
246.00 248.00 214.00 210.00 169.00 164.00
c) Maximum water level (m)
247.00 249.00 215.00 212.00 170.00 166.00
d) Length (m) 91.00 72.00 44.00 72.00 91.00 91.00 e) Crest level (m) 234.00 236.00 202.00 198.00 157.00 152.00 f) Deepest
foundation level (m)
215.00 210.00 184.00 170.00 132.00 123.00
g) Maximum height up to crest level (m)
19 26 18 18
25 29
h) Number of gates 5 4 3 4 5 5 i) Type of gate Radial Radial Radial Radial Radial Radial j) Size of gate
(m X m) 15x12 15x12 12x12 15x12 15x12 15x12
k) Maximum routed 6586 5226 3044 5226 6582 6582

li
out flow (cumec) l) Tail water level
(m)
i) Maximum (m) 228.00 230.00 192.00 175.00 139.00 135.46 ii) Minimum (m) 223.50 220.00 187.50 172.50 134.00 134.40 m) Type of energy
dissipation arrangement
Ski jump bucket type (Stilling basin with Chute block and end sill)
Ski jump bucket type (Stilling basin with Chute block and end sill)
Ski jump bucket type (Stilling basin with Chute block and end sill)
Ski jump bucket type (Stilling basin with Chute block and end sill)
Ski jump bucket type (Stilling basin with Chute block and end sill)
Ski jump
bucket type
(Stilling basin with
Chute block
and end sill)
n) Type of hoisting arrangement and its capacity
Hydrau lic hoisting
Hydrau lic hoisting
Hydraulic hoisting
Hydrau lic hoisting
Hydrau lic hoisting
Hydrau lic
hoisting
14.1.4 River sluice(s), Irrigation / Power outlet(s)
Paikhed dam
Paikhed barrage
Chasmandva dam
Chasmandva barrage
Chikkar
Dabdar Kelwan
I River sluice(s), Nil II Irrigation
/Power
a) Purpose Power Irrigation
Power Irrigation
Power/Irrigation
Power/Irrigation
Power/Irrigation
b) Number 1 1 1 1 1 1 1 c) Size (m) 2.5 147.5 1.8 128.0 1.8 2.5 2.5 d) Sill level (El-m) 185 136 185.
50 123.0 174.5
0 134.37 133.37
e) Number of gates 1 7 1 8 1 1 1 f) Type of gate Verti
cal lift
Radial Vertical lift
Vertical lift
Vertical lift
Vertical lift
Vertical lift
g) Size of gate (mXm)
1.8x 2.5
15x 7
1.42x1.8
12x 8
1.42x 1.8
2x 2.5
1.8x 2.5
h) Type of hoisting arrangement and
Hydraulic,
Hydraulic,
Hydraulic,
Hydraulic,
Hydraulic,
Hydrau lic,
Hydrau lic,

lii
its capacity 200 t 200 t 180 t 200 t 200 t 200 t 200 t 14.2 Weir No weir is proposed 14.3 Barrage Paikhed Chasmandava
(i) Design Flood Discharge (cumecs) 2223 1571 (ii) Total Length (m) 68.320 63.350
(iii) Total Waterway (m) 138.500 122.000 (iv) Top level of pier/abut (m) 152.000 133.000 (v) Crest Level (m) 136.000 123.000
(vi) Cistern Level (m) 131.500 118.500 (vii) Pond Level (m) 143.500 /
150.00 131.000
(viii) HFL (1 in 100) (m) 140.529 127.446 (ix) HFL (1 in 500) (m) 141.936 128.240 (x) Width of Pier (m) 4.500 3.000
(xi) Clear Width of each span (m) 15.000 12.000 14.4 Head Regulator(s) 1 No. 1 No. 15 Canal System 15.1 Main Canal Par-Tapi Reach Tapi-Narmada Reach
15.1.1 Purpose of canal (Irrigation/Power/Navigation/Diversion/ Water Supply/ Multipurpose)
Irrigation/Power Irrigation/Power
15.1.2 Type (a) Flow /Lift Flow Flow (b) Lined / Un
lined Lined Lined
(c) Type of lining C.C lining C.C lining 15.1.3 Main canal data Par-Tapi reach Tapi-Narmada reach
(i) Length (km) (Total length:406.118)
214.811 (including 37.075 km of feeder pipe line and 1.15 km of tunnels)
191.307
(ii) FSL at Head/Tail (m)
142.800/105.275 81.790/53.573
(iii) Maximum discharging capacity at head/tail (cumec)
38.170/63.69 46.640/17.260
(iv) Full supply Depth at head (m)
2.80 3.22

liii
(v) Bed width at head (m)
8.50 8.80
(vi) Side slope at head (H:V)
1.5:1 1.5:1
(vii) Bed Slope(range) 1 in 7500 to 1 in 8500
1 in 10 000
(viii) Total number of canal structures on main canal
154 315
(ix) Total assumed losses across the structures (m)
14.76 9.086
(x) Gross Command Area (En-route) (ha)
11448 57345
(xi) Culturable Command Area (En-route) (ha)
10100 49820
15.1.4 Branch Canal(s) (a) Number 22 22 (b) Total length
(km) 86 238
15.1.5 Total length of districtribution system upto minimum discharge capacity of 24 cusec
- -
15.2 Feeder Pipe Lines Chasmandva Chikkar-Dabdar
Dabdar Kelwan
(i) Length (km) (Total length:37.075)
2.859 14.342 12.258 7.616
(ii) F.S.L at Head/Tail (m)
130.600/ 129.748
172.000/ 169.128
136.960/ 132.768
135.460/ 117.309
(iii) Maximum discharging capacity at head/tail (cumec)
8.50 6.40 17.00 17.00
(iv) Full supply Depth at head (m)
1.60 1.50 2.2 2.25
(v) Diameter of pipe line (m)
2.60 2.50 2.90 2.60
(vi) Bed Slope(range) 1 in 5500 1 in 7500 1 in 5000 1 in 5500 (vii) Joins main canal at 62.072 - 108.250 129.600

liv
RD(km) 15.3 Efficiencies (%)
(i) Conveyance 75 75 (ii) Field application 65 65
15.4 Tunnel 15.4.1 Jheri-Paikhed
Tunnel
(i) Length of tunnel (m)
12700
(ii) Dia of tunnel (m) 3.0, D-shaped (iii) Invert Level (m) EL. 199.50 at inlet (iv) Invert level (m) EL. 185.00 at out fall
15.4.2 Adit (i) Length of Adit (m) 408.60
(ii) Size (m) 6.0x6.0, D-Shaped (iii) Invert level (m) EL. 210.00
15.4.3 Tunnels along the link canal
RD from (m)
RD to (m)
Length (m)
Diameter (m)
Tunnel No.1 14650 14750 100 5.5 Tunnel No.2 24000 24350 350 5.5 Tunnel No.3 32350 32550 200 5.5 Tunnel No.4 37750 37800 50 5.5 Tunnel No.5 51500 51950 450 5.5 Total 1150
16 Proposed Cropping Pattern
16.1 Cropping Pattern for En-route command Season/
Name of the Crop % age of Area
Area of crop for En-route command
(59920 ha)
Area of crop for Command of projects proposed by Government of Gujarat (45561 ha)
Kharif Paddy 8% 4794 3645 Jowar 8% 4794 3645 Pulses 4% 2397 1823 Ground nut 8% 4794 3645 Oilseed 8% 4794 3645 Vegetables 4% 2397 1823 L.S. Cotton 4% 2397 1823 S. S. Cotton 8% 4794 3645 Rabi Wheat 8% 4794 3645 Jowar 4% 2397 1823

lv
Maize 4% 2397 1823 Vegetable 4% 2397 1823 Pulses 8% 4794 3645 Oilseeds 4% 2397 1823 Ground nut 4% 2397 1823 Hot
Weather
Bajra 2% 1197 910 Vegetable 2% 1197 910 Soyabean 2% 1197 910 Perennial Sugarcane 4% 2397 1822 Fruits 2% 1198 910
Total 100% 59920
45561
16.2 Cropping Pattern for feeder canal Command Season/ Name of the Crop % age of Area Area of crop for feeder canal
(1270 ha) Kharif Paddy 8% 102 Jowar 8% 102 Pulses 4% 51 Ground nut 8% 102 Oilseed 8% 102 Vegetable 4% 51 L.S. Cotton 4% 51 S. S. Cotton 8% 102 Rabi Wheat 8% 102 Jowar 4% 51 Maize 4% 51 Vegetable 4% 51 Pulses 8% 102 Oilseeds 4% 51 Ground nut 4% 51 Hot Weather Bajra 2% 24 Vegetable 2% 24 Soyabean 2% 24 Perennial Sugarcane 4% 51

lvi
Fruits 2% 25 Total
100% 1270
16.3 Cropping Pattern adopted for the Command Areas of Tribal area of right side of canal, Vicinity of proposed reservoirs, tribal area on right side of NMC and command area of Narmada canal system of SSP to be taken over the Link Canal
S. No. Crop Season/ Name of the
Crop
Command Areas of Tribal area of right side of canal, Vicinity of proposed reservoirs and tribal area on right side of NMC (83056 ha)
Target command area of Narmada canal system of SSP to be taken over the Link Canal (43268 ha)
% age of CCA
Area of Crop (ha)
% age of
CCA
Area of Crop (ha)
Kharif 1 Late Paddy -- -- -- -- 2 Early Paddy -- -- -- -- 3 Maize/Bajra -- -- -- -- 4 Oilseeds 10 8306 10 4237 Rabi 5 Wheat 55 45681 55 23302 6 Jowar -- -- -- -- 7 Pulses/Vegetable
s 20 16611 20 8474 8 Potato 6 4983 6 2542 Two Seasonal 9 S. S. Cotton -- -- -- -- 10 L. S. Cotton -- -- -- -- 11 Tobacco -- -- -- -- 12 Lucene -- -- -- -- Hot Weather
13 Bajra -- -- -- -- 14 Fodder 6 4983 6 2542 Perennial
15 Sugarcane -- -- -- -- 16 Fruits 3 2492 3 1271

lvii
Total 100 83056 100 43268 17 Power Paikhed Chas
mandva Chikkar Dabd
ar Kelwan Kelwan
Feeder canal
17.1 Type – Conventional / Pumped storage
Conventional
Conventional
Conventional
Conventional
Conventional
Conventional
17.2 Installed capacity (MW)
9 2 2 3.2 2.5 2
17.3 Annual PLF % 57.75 32.37 47.67 59.86 57.35 71.25
17.4 Annual energy (MU)
a) Firm (MU) 45.53 5.67 8.35 16.60 13.07 12.48 b) Seasonal
(secondary) (MU) 10.59 0.72 - - - -
Total (MU) 56.12 6.39 8.35 16.60 13.07 12.48 17.5 Off peak
requirement for pumping
NA NA NA NA NA NA
17.6 Head Race Channel / Tunnel
NA NA NA 8300 m
5925 m NA
17.7 Balancing Reservoir
No Balancing Reservoir Proposed
17.8 Fore bay NA
NA
NA
1612 m³
1781 m³
1650 m³
17.9 Intakes Paikhed Chas mandva
Chikkar Dab dar
Kelwan Kelwan Feeder canal
a) Upper Intake i) Type & size of
intake Dam
Intake Dam
Intake Dam Intake
Dam Intake
Dam Intake
Canal Intake
ii) Submergence of the entry below water level
Yes Yes Yes Yes Yes Yes
iii) Intake gates-number, type & size
1 No, Fixed Wheel Gate, Size: 1800
1 No, Fixed Wheel Gate,
Size:1420 mmX
1 No, Fixed Wheel Gate, Size:1420 mmX
1 Nos, Fixed Wheel Gate,
1 Nos, Fixed Wheel Gate, Size: 1800
1 No, Fixed Wheel Gate, Size: 2000

lviii
mmX 2500 mm
1800 mm 1800 mm Size: 2000 mmX 2500 mm
mmX 2500 mm
mmX 2500 mm
iv) Details of anti-vortex arrangements
Centre line of
Penstock is kept 3.75 m below MDDL
Centre line of
Penstock is kept 3.40 m below MDDL
Centre line of Penstock is kept 3.60 m below MDDL
Centre line of Penstock is kept 3.38 m below MDDL
Centre line of
Penstock is kept
1.38 m below MDDL
-
v) Type of hoisting arrangement and its capacity
Hydraulic 50 t 25 t 30 t 30 t 25 t 12 t
b) Lower Intake (for pumped storage scheme)
NA NA NA NA NA NA
17.10 Surge tank / shaft
NA NA NA NA NA NA
17.11 Penstocks / pressure shafts
Paikhed Chas mandva
Chikkar Dab dar
Kelwan Kelwan Feeder canal
a) i) Number 1 1 1 1 1 ii) Diameter and
Length 2.5 m Dia:
230 m; 2.0 m Dia:
9 m; 1.6 m Dia:
71 m
1.8 m Dia: 78 m ;
1.2 m Dia:
36 m
1.8 m Dia: 59 m;
1.2 m Dia:
34 m
2.5 m Dia:
53 m; 1.6 m Dia: 51 m
2.5 m Dia:
51 m; 1.6 m Dia: 54 m
2.5 m Dia: 35 m;
1.6 m Dia: 16 m
b) Bifurcation / trifurcation
Trifurcation
Bifurcation Bifurcation Bifurcation
Bifurcation
Bifurcation
17.12 Power House Paikhed Chas mandva
Chikkar Dab dar
Kelwan Kelwan Feeder canal
a) Type (surface or underground)
Surface Surface Surface Surface
Surface Surface
b) Maximum gross head (m)
76.00 40.98 38.00 32.04 28.54 16.17
c) Minimum gross head (m)
18.20
16.98 7.00 2.04 0.54 -

lix
d) Head loss in water conductor system (m)
0.20 0.20 0.20 0.2 0.2 0.20
e) Design net head (m)
56.53 32.78 27.47 24.49 22.16 15.97
f) Dimensions (m) (LX B X H)
45.32 x 16.43 x19.00
32.7x 13.90x 17.62
32.7x 13.90x 17.62
49.05x
20.85x117.
61
32.7x 13.88x18.62
19.00x14.70x16.50
g) Unit capacity(MW)
3x3 2x1 2x1 2x1.6 2x1.25 2x1
h) Installed capacity (MW)
9 2 2 3.20 2.50 2
i) Energy Generation(MU)
45.53 5.67 8.35 16.60 13.07 12.48
j) Type of turbine Francis Francis Francis Francis
Francis Kaplan
k) Type of generator AC Synchronous
AC Sync hronous
AC Sync hronous
AC Sync
hronous
AC Sync hronous
AC Synchrono
us
l) Type of power house crane
EOT EOT EOT EOT
EOT EOT
m) Number & size of draft tube gates/bulk head & capacity of hoists
3 number vertical lift slide
type (4020
mmX2300 mm) Rope drum hoist, 15 t
2 number vertical lift slide type
(3400 mmX2340 mm) Rope
drum hoist, 15 t
2 number vertical lift slide type (3400 mmX 2340 mm) Rope drum hoist, 15t
2 number vertical lift slide type (5100 mmX2340 mm) Rope drum hoist, 15 t
2 number vertical
lift slide type
(3400 mmX 2340 mm) Rope drum hoist, 12 t
2 number vertical lift slide
type (2652 mmX
1500mm) Rope drum hoist, 10 t
17.13 Switch yard Paikhed Chas mandva
Chikkar Dab dar
Kelwan Kelwan Feeder canal
a) Type Out Door
Out Door Out Door Out Door
Out Door
Out Door

lx
b) Voltage level 33 kV 33 kV 33 kV 33 kV 33 kV 33 kV 17.14 Transformer
Cavern NA NA NA NA NA NA
17.15 Tail Race Channel
Paikhed Chas mandva
Chikkar Dab dar
Kelwan Kelwan Feeder canal
a) Shape & size Open
Channel of width 26 m
Open Channel of
width 5.00 m
Open Channel of width 5.00
m
Open Channel of width 5.00 m
Open Channel of width 5.00 m
Open Channel of
width 3.00m
b) Length (m) 40 470 22 40 20 5 c) Recovery slope 1V:4H 1V:4.5H 1V:4H 1V:4H 1V:4H 1V:4H d) Maximum tail
water level (m)
-- -- -- -- -- --
e) Minimum tail water level (El-m)
170.50 171.52 170.00 134.00
134.00 116.57
f) Average tail water level (El-m)
172.00 173.02 171.50 136.96
135.46 117.77
17.16 Tail Race Tunnel
NA NA NA NA NA NA
18 Cost of project (lakh) Unit-wise
Unit – I: Head Works
474773 lakh
Unit – II: Canal and Conveyance system
455710 lakh
Unit – III: Power installations
18091 lakh
Unit – IV: Command Area Development
72547 lakh
Total cost of the project
1021121 lakh
19 Benefits / Revenue
Quantity Value (Rs. in lakh)
a) Food production (Quintals)
7510379 111176.70
b) Power (MU) 102 6120.00 c) Flood protection - -

lxi
(ha) d) Navigation - - e) Water supply
(MCM) 76 8987.00
f) Any other (fisheries) Tons
303 303.00
Total Benefits 126586.70 g) Total Annual
cost 122364.64
20 Benefit Cost (BC) Ratio and IRR
a) BC Ratio 1.035 b) Internal Rate of
Return (IRR) 10.172%

lxii
Executive Summary
1.0 National Perspective Plan for Water Resources Development
The eastwhile Union Ministry of Irrigation and Central Water Commission (CWC) formulated, in the year 1980, a National Perspective Plan (NPP) for water resources development through inter basin transfer of water which comprises of two components: Himalayan Rivers Development Component, and Peninsular Rivers Development Component. The distinctive feature of the NPP is that the transfer of water from surplus basin to deficit basin would essentially be by gravity and only in small reaches it would be by lifts not exceeding 120 metres. These two components are briefly outlined in the following paragraphs. Himalayan Rivers Development
Himalayan Rivers Development envisages construction of storage reservoirs on the principal tributaries of the Ganga and the Brahmaputra in India, Nepal and Bhutan, along with inter-linking canal systems to transfer surplus flows of the eastern tributaries of the Ganga to the west, apart from linking of the main Brahmaputra and its tributaries with the Ganga and Ganga with Mahanadi and augmentation of flow at Farakka. Peninsular Rivers Development
This component is divided into four major Parts:
i. Interlinking of Mahanadi–Godavari-Krishna-Pennar-Cauvery rivers and building storages at potential sites in these basins
ii. Interlinking of west flowing rivers, north of Mumbai and south of Tapi
iii. Interlinking of Ken-Chambal Rivers
iv. Diversion of other west flowing rivers

lxiii
The National Water Development Agency (NWDA) after carrying out the detailed technical studies identified 30 link proposals for preparation of Feasibility Reports/ Detailed Project Reports; 14 links under Himalayan Rivers Development Component and 16 links under Peninsular Rivers Development Component. Par – Tapi – Narmada link project is one of the 16 link proposals under Peninsular Rivers Development Component. 2.0 Memorandum of Understanding amongst Centre and Concerned States and Inter-State Aspects
The Feasibility Report of Par–Tapi–Narmada link project was prepared by NWDA during October, 2005 and circulated to all concerned State Governments and members of Technical Advisory Committee (TAC) of NWDA. Since then continuous efforts were made by NWDA, CWC and Ministry of Water Resources to arrive at the consensus between two beneficiary States of Gujarat and Maharashtra. As a result of these efforts, consensus was arrived amongst the Central Government and concerned States of Gujarat and Maharashtra for preparation of Detailed Project Report (DPR) of Par–Tapi–Narmada link project.
The Water Resources Department, Government of Maharashtra and
Narmada Water Resources, Water Supply and Kalpasar Department, Government of Gujarat conveyed their concurrence to Union Ministry of Water Resources during May, 2008 for preparation of Detailed Project Report (DPR) of the project. Subsequently, the work for preparation of DPR was entrusted to NWDA.
A tripartite Memorandum of Understanding (MoU) was signed by the
States of Gujarat and Maharashtra and the Union Government on 3rd May, 2010 at New Delhi for preparation of Detailed Project Report of Par–Tapi–Narmada link project. The tripartite Memorandum of Understanding indicates that: the Gujarat State will get the benefits of Par–Tapi–Narmada link project through en-route irrigation from the link canal and also in the drought prone Saurashtra and Kutch region by way of substitution. The sharing of Hydro Power produced in the Power House located in this link project will also be studied during the preparation of DPR; The feasibility of utilization of water by Maharashtra State in their territory by lifting water

lxiv
over the western divide will also be examined during preparation of DPR; The issue of compensating the quantity of water contributed from Maharashtra catchments will be decided by States mutually after preparation of DPR when diversion quantity through this link is firmed up; at DPR stage, the size of canal from Ukai Dam to Narmada Canal will be decided based on simulation studies, keeping in view the request of Government of Gujarat about retaining the size of canal as designed in Feasibility Report of Par-Tapi-Narmada link considering the diversion of water from Tapi Basin.
Accordingly, NWDA has prepared the DPR of Par – Tapi – Narmada link project with active support and co-operation of CWC and other domain expert organizations like Central Soil and Materials Research Station (CSMRS), Geological Survey of India (GSI), Central Water and Power Research Station (CWPRS), Tehri Hydro Development Corporation India Ltd (THDCIL), India Meteorological Department (IMD), National Remote Sensing Center (NRSC), Water and Power Consultancy Services (WAPCOS), Regional Remote Sensing Centre (RRSC), Jodhpur, Bhaskaracharya Institute for Space Applications and Geo-informatics (BISAG), Gandhinagar etc.
It is indicated in the tripartite Memorandum of Understanding that the issue of sharing of Hydro Power produced in the Power Houses proposed in this link project and the feasibility of utilization of water by Maharashtra State in their territory by lifting water over the western divide will be examined during preparation of DPR. Accordingly, the issue of water and power sharing was taken-up for discussion with both Maharashtra and Gujarat States at the level of Chief Engineers. The water availability study of Par–Tapi–Narmada link project has been carried out by CWC for NWDA in consultation of State Governments of Gujarat and Maharashtra. This study was sent to both the States. Three meetings have been held with the Water Resources Departments of Maharashtra and Gujarat Governments at the level of Chief Engineers (CEs) and the water availability study report has been finalized. It has also been agreed by both the States that the sharing of water shall be based on the catchment area of the respective States duly accounting for the variation in catchment rainfall.

lxv
The DPR of Par-Tapi-Narmada Link Project was completed by NWDA in August, 2015 and sent to Water Resources Departments of Governments of Gujarat and Maharashtra vide Director General, NWDA, New Delhi D.O. Letter No. NWDA/Tech-I/200/44-I/Vol.V/12269 Dated 25.08.2015 for their views.
The issue of water sharing and power sharing between the States of
Gujarat and Maharashtra has been discussed at the level of Chief Engineers of the States of Gujarat and Maharashtra and NWDA. Further matter in this regard is taken up at the Senior Officers level of the two States and MoWR, RDandGR, Government of India. Hon’ble Union Minister for WR, RDandGR held meeting with the Hon’ble Chief Minister, Government of Maharashtra at Mumbai on 3rd May, 2016 where in Damanganga-Pinjal and Par-Tapi-Narmada Link Projects were discussed among other issues. 2.1 Proposed Modifications in DPR of Par-Tapi-Narmada Link Project 2.2 Need for Modification
The DPR of the Par-Tapi-Narmada Link Project was completed by NWDA in August, 2015 and sent to the Governments of Gujarat and Maharashtra vide Director General, NWDA, New Delhi D.O Letter No.NWDA/Tech-I/200/44-I/Vol.V/12269 dated 25.08.2015 for their views. In response, Government of Gujarat have conveyed their observations on DPR of Par-Tapi-Narmada Link Project vide letter No.Gen/2010/GoI-3/Part-I/MI Cell dated 21.05.2016 and letter No. S/2015/NWDA/2540/J dated 29.07.2016. Government of Gujarat suggested (i) to explore possibilities for providing maximum irrigation facilities to tribal areas on right side of the canal by lift (ii) to include the command area of five projects proposed by the Government of Gujarat on left side of the canal in addition to enroute command and target command in Saurashtra etc. to the extent possible. In this context, Chief Engineers level meeting was held between NWDA and NWRWS and Kalpasar Department, Government of Gujarat at Gandhinagar on 11thNovember, 2016 for firming up of modifications in

lxvi
DPR of Par-Tapi-Narmada Link Project. Also, discussions were held between the then OSD now the Secretary, MoWR, RD&GR, Government of India and the Chief Secretary, Government of Gujarat on 16th November, 2016 regarding Par-Tapi-Narmada Link Project. In continuation, Secretary, MoWR, RD&GR vide D.O Letter No. 2/7/2007-BM(pt) dated 25.11.2016 requested to convey the consent of Government of Gujarat for new irrigation Planning of Par-Tapi-Narmada Link Project so as to revise the DPR and facilitate early implementation of the project. As a result, to finalise the issues on modifications of DPR, Secretary, MoWR, RD&GR along with the officers of NWDA and NWRWS and Kalpasar Department, Government of Gujarat held a meeting with the Hon’ble Chief Minister of Gujarat on 31.12.2016. Chief Engineers level Meeting was held at Gandhinagar on 9thFebruary, 2017 for firming up of modifications and to revise the DPR of Par-Tapi-Narmada Link Project. During discussions in the above meetings following modifications in DPR of Par-Tapi-Narmada Link Project are firmed up (i) Inclusion of command areas of the Projects proposed by the
Government of Gujarat on left side of the canal in South Gujarat. It was decided to include the command area of five projects proposed
by the Government of Gujarat namely i) Ugta ii) Sidhumber iii) Khata Amba iv) Zankhari and v) Khuntali. (ii) Providing irrigation to the Tribal areas enroute right side of Link
Canal by lift. Providing water for irrigation by lift for possible maximum Tribal
areas on right side of the Par-Tapi-Narmada Link Canal. (iii) Irrigation in Tribal areas in the vicinity of reservoirs.
Providing irrigation in tribal areas of Dang and Valsad districts of Gujarat directly from the reservoirs under Par-Tapi-Narmada link by lift.

lxvii
(iv) Irrigation in Tribal areas right side of the Narmada Main Canal by lift in Chhota Udepur and Panchmahal Districts.
It was further suggested to explore the possibilities of providing
irrigation in the tribal areas of Chhota Udepur and Panchmahal districts of the Gujarat State from Narmada Main Canal on substitution basis. (v) Provision for drinking water
Provision for drinking water for all villages of Dang and Navsari districts and villages of Kaprada and Dharampur taluks of Valsad district is to be made from this project. (vi) Filling of Panchayat and village tanks in the periphery of
Reservoirs.
Provision for filling all possible tanks in benefitted areas to be made. Also, during the meeting with the Hon’ble Chief Minister, Gujarat State on 31.12.2016, it was decided to explore techno-economic feasibility for providing pipe line system instead of open canal for main canal of the link to avoid/minimize the land acquisition in tribal areas as well as to reduce evaporation/seepage losses under Par-Tapi-Narmada Link Project. Secretary, Government of Gujarat vide letter No. Gen/2010/GoI-3/(3)/Part/MI Cell(K-1) dated 18.01.2017 has conveyed NWDA to explore the above possibility, while revising the DPR. NWDA examined the feasibility of pipe line system instead of open canal for Par-Tapi-Narmada Link Canal. As per the study, it reveals that the gradient vis-à-vis ideal velocity of flows in pipe lines have become the constraints in laying the pipe line system due to prevailing large difference of head between the canal off-take point and out-fall point at Ukai reservoir. As the link canal runs mostly in deep cutting, laying a number of gravity pipe lines with very flatter gradients and lesser velocities for diversion of large discharges lead to heavy excavation which escalates the project cost leading to no significant reduction in land acquisition for the Par-Tapi-Narmada link canal. The note on techno-economic feasibility of providing

lxviii
pipe line in lieu of main canal has been sent to the NWRS and Kalpsar Department, Government of Gujarat vide Letter No. NWDA/IC/V/T-143/504-10 dated 14.03.2017. However, NWDA suggested gravity pipe line can be adopted in place of feeder canals as discharges are small and lies in hilly terrain. Copy of the minutes of the Chief Engineers level meeting dated 09.02.2017 is enclosed at Annexure – 1.18 of Annexures Volume. Based on the decision taken by the Government of Gujarat from time to time during the above meetings, NWDA modified the DPR of the Par-Tapi-Narmada Link Project. 3.0 Aim and Objective of the Project and Description of Works
The main objective of the Par-Tapi-Narmada Link project is to provide maximum irrigation facilities to Tribal areas enroute the link canal lying on Right side including drought prone Saurashtra region of Gujarat. The link project will also cater the command areas of five projects namely Khuntali, Ugta, Sidhumber, Khata Amba, Zankhari, proposed by Government of Gujarat. Command in tribal areas of Chhota Udepur and Panchmahal districts from Narmada Main canal on substitution basis, tribal dominant districts of Dang and Valsad of Gujarat State and Nasik district of Maharashtra State along with Drinking water of most of the villages in the vicinity and filling of most of Panchayat tanks/Check dams will be served under Par-Tapi-Narmada link canal.
There is a wide variation in distribution of water resources in different regions of Gujarat State due to variation in rainfall. The rainfall in Saurashtra and Kutch regions of Gujarat is very scanty and the area is frequently affected by droughts. The annual normal rainfall (1951-2000) in Saurashtra and Kutch region is 507 mm and where as the average annual rainfall in Par, Auranga, Ambica and Purna river basins of South Gujarat region is assessd to be 2180, 2055, 1830 and 1472 mm respectively. Par, Auranga, Ambica, Purna and Mindhola are the important west flowing rivers in the western ghat region, North of Mumbai and South of Tapi in Southern Gujarat. All these rivers originate in the State of Maharashtra and after flowing through the States of Maharashtra and Gujarat outfall into

lxix
Arabian sea. Only about 14% of the catchment area of the above rivers lies in Maharashtra State and the remaining 86% lies in the State of Gujarat.
Par, Auranga, Ambica, Purna and Mindhola river basins have the same hydro-meteorological characteristics. About 95% to 97% of annual rainfall confines to monsoon only from June to September.The rainfall pattern of the river basins is given in Table-1.
Table-1
Rainfall pattern of the river basins
Sl. No.
Name of the Basin
Catchment Area (sq.km)
Avg. Annual Rain-fall (mm)
1 Par 1648 2217
2 Auranga 748 2063
3 Ambica 2685 1833
4 Purna 2193 1472
5 Mindhola 1056 780
From the above Table, it is seen that the rainfall is decreasing from
South to North direction.
Surface Water Availability:
Out of total 38100 MCM of estimated utilizable surface water resources in Gujarat State, the utilizable surface water resources in South and Central Gujarat region is 31750 MCM (83%). Whereas, it is 2100 MCM (6%) in North Gujarat, 3600 MCM (9%) in Saurashtra and 650 MCM (2%) in Kutch region. Consequently, there is large variation in per capita water availability in different regions of the State. The per capita water availability in South and Central Gujarat region is about 1100 m3 (2011 census) and it is about 600 m3 in Saurashtra and Kutch region. With the anticipated growth of population in the State by 2050, the per capita availability of water would further reduce. The rivers in Saurashtra and Kutch region are mostly dry through the year, where as sizeable quantum of

lxx
flows of Par, Auranga, Ambica and Purna rivers situated in South Gujarat are going to Sea unutilized every year. The water availability studies of these basins carried out by CWC indicates availability of sizable surplus water after meeting in basin requirements. The water availability study of the following river basins indicates availability of sizeable surplus water after meeting the in-basin requirements, as given in Table-2.
Table-2 Surplus water available for Diversion
Unit: MCM Sl. No.
Name of the Basin
Effective drainage
area (sq.km)
Gross annual yield at
75% dep.
Planned Basin
Utilisations projected by
States
Surplus yield at 75%
dep.
1 Par 1648 1725.9 647.44 1078.46
2 Auranga 748 857.7 507.39 350.31
3 Ambica 2685 1914.1 1493.66 420.44
4 Purna 2193 1101.1 958.95 142.15
Total 7274 5598.8 3607.44 1991.36
In light of the above scenario, the Par-Tapi-Narmada Link Project in
the western part of India is envisaged to transfer the surplus flows from west-flowing Par, Auranga, Ambica and Purna rivers between Par and Tapi to water deficit drought-prone regions lying on both sides of the link canal, towards North including tribal areas and upto drought-prone Saurastra and Kutch regions. Index plan of the link project is at Plate-I.
The Par-Tapi-Narmada link projects contemplated at Feasibility Report stage by NWDA envisage construction of 7 dams: viz i) Jheri, ii) Mohankavchali, iii) Paikhed, iv) Chasmandva, v) Chikkar, vi) Dabdar and vii) Kelwan. However, due to public resistance no field topographical surveys and geotechnical investigations could be conducted at the Mohankavchali dam site (proposed downstream of Jheri dam site) either at Feasibility Report stage or DPR stage by NWDA. Therefore, while
lxxi
preparing the DPR of the link project the Mohankavchali dam has not been considered and the water planning has been revised to ensure that the overall objective of the Par-Tapi-Narmada link project is achieved. It is planned now to divert the surplus waters of Par river tapped at Jheri reservoir to Paikhed reservoir through a 12.70 km long tunnel. The feeder canal and the Chikkar weir from which the feeder canal is proposed for diversion of surplus waters of Ambica River at Feasibility Report stage is also dropped now to avoid passing of the canal through the Vansda national park.
The Par-Tapi-Narmada Link Project comprises construction of six dams: namely i) Jheri dam across river Par in Peint taluka of Nasik district in Maharashtra; ii) Paikhed dam across river Nar – a tributary of river Par, iii) Chasmandva dam across river Tan–tributary of river Auranga–all in Dharampur taluka of Valsad district in Gujarat; iv) Chikkar dam across river Ambica, v) Dabdar dam across river Khapri – a tributary of river Ambica and vi) Kelwan dam across river Purna – all in Ahwa taluka of Dang district in Gujarat. Also, construction of 2 diversion barrages–one each in the downstream of Paikhed and Chasmandva dams; 6 power houses; and construction of about 406.118 km long link canal (including feeder pipe line and tunnels along the link canal) passing through Dharampur taluka of Valsad district, Ahwa taluka of Dang district, Vansda taluka of Navsari district, Vyara and Songadh talukas of Tapi district, Mandvi and Mangrol talukas of Surat district, Valia, Jhagadia and Nandod talukas of Bharuch district, Tilakwada and Sankheda talukas of Vadodara district of Gujarat connecting all 6 dams with existing Miyagam Branch Canal of Narmada Canal System of Sardar Sarovar Project are envisaged.
The surplus water proposed for diversion through Par-Tapi-Narmada
link project will provide irrigation to a total area of 232175 ha, of which 61190 ha lies enroute the link canal i.e., 10100 ha is en-route command in the reach between Par and Tapi; 49820 ha en-route command in the reach between Tapi and Narmada; 630 ha en-route command under Dabdar feeder pipelines; 640 ha en-route command under Kelwan feeder pipelines. The command area of five projects proposed by Government of Gujarat on the left side of canal is about 45561 ha to be irrigated by gravity through link canal. Tribal area on right side of canal is 36200 ha will be irrigated by lift. About

lxxii
12514 ha tribal area will also be irrigated directly by lift from proposed six reservoirs.The link project will take over the area of 76710 ha under the command of existing Miyagam branch canal of Narmada canal system. Narmada Water so saved will be utilized to provide irrigation facilities in tribal area on right side of Narmada Main canal to the extent of 23750 ha in Chhota Udepur district and 10592 ha in Panchmahal district through lift directly from Narmada Main canal on substitution basis and 42368 ha area in Saurashtra region of Gujarat State. A provision of about 76 MCM of water is allocated to meet drinking water supply to 27.60 lakh population in the above areas. Also, a provision of 50 MCM is made for filling of 2226 panchayat and village tanks/check dams in the benefitted areas.The project will also generate about 102 MU of hydropower from the power houses proposed at various dams and canal fall, besides providing drinking water to the villages in the region.
NWDA and CWC jointly carried out hydrological studies of Par-Tapi-Narmada Link Project during March, 2012 to assess the water balance position at the ultimate stage of development (by the year 2050 AD) in Par, Auranga, Ambica, Purna river basins and at the proposed dam sites. As per these studies the net annual yields at Jheri, Paikhed, Chasmandva, Chikkar, Dabdar and Kelwan dam sites are assessed to be 371 MCM, 250 MCM, 64 MCM, 170 MCM, 262 MCM and 308 MCM respectively keeping a provision for upstream utilizations planned by the States for irrigation, domestic requirement, industrial requirement, regeneration from domestic and industrial uses and the environmental and ecological needs in the down-stream. Thus about 1425 MCM of surplus water at 75% dependability is available at the 6 reservoirs proposed in Par, Auranga, Ambica and Purna river basins.
The total utilisation through Par–Tapi–Narmada link from 6 dams will be 1330 MCM. However, at later stage when the public hindrance is resolved and the required field survey and investigations are carried out the proposed Mohankavchali dam will also be dovetailed with Par–Tapi–Narmada link project.

lxxiii
4.0 Interlinking of the Proposed Project with Other Existing and Future Projects
It is planned to drop the Par-Tapi-Narmada link canal in to the existing Ukai reservoir on the river Tapi and to take it off from the right bank. However, neither the storage of Ukai reservoir nor the waters of Tapi river would be used under the Par-Tapi- Narmada link canal project. But the Ukai reservoir will be used just as a ‘Level Crossing’ for diversion of water through the link canal.
The link canal crosses Narmada river downstream of Sardar Sarovar Project (SSP) and out-falls in to the existing Miyagam branch canal of Narmada Main Canal at RD 16.70 km and takes over part of its command area. Thus saved water under Narmada Main Canal by substitution with the diverted water through the link canal, will be utilized in Saurashtra andKutch region by further extending the Narmada canal system. So, the Par-Tapi-Narmada link canal is integrated with SSP for delivery of surplus waters of Par, Auranga, Ambica and Purna Rivers to drought prone Saurashtra and Kutch region.
And also, the Government of Gujarat had proposed a barrage across
river Narmada (as part of Kalpasar project) at Bhadbhut and it was desired by Government of Gujarat that instead of terminating the Par-Tapi-Narmada link canal at existing Miyagam Branch Canal of Narmada Main Canal, the NWDA should plan to release water diverted through Par-Tapi-Narmada link into Narmada river at suitable location upstream of proposed Bhadbhut barrage. Accordingly, NWDA has studied an alternative proposal to terminate the Par-Tapi-Narmada link canal at Amravati river (a stream joining the Narmada river downstream of Sardar Sarovar Project) and release the water intended for substitution in the Command Area of Miyagam Branch Canal of Narmada Main Canal into Amravati river for tapping the same at proposed Bhadbhut barrage as planned by Government of Gujarat. However, the Water Resources Department, Government of Gujarat, Gandhinagar, later requested NWDA to carry out Survey and Investigations as envisaged in original proposal. Accordingly, the Survey and Investigations were carried out while preparing the DPR.

lxxiv
5.0 Methodology Adopted
The Feasibility Report of Par-Tapi-Narmada link project prepared by NWDA formed the basis for proceeding further for preparation of Detailed Project Report and make suitable changes based on detailed surveys and investigations and up-dated hydrological and other studies. During preparation of DPR detailed surveys and investigations such as topographical surveys, geological and geotechnical investigations including drilling bore holes on dam axes for obtaining rock cores, construction material investigations including borrow area surveys, socio-economic, ecological and environmental impact assessment studies, seismo-tectonic studies etc. have been undertaken departmentally through various specialized organizations in order to examine the feasibility of the scheme. Detailed geological and geo-technical investigations etc were carried out through GSI and CSMRS; hydrological studies were carried out through CWC. To complete the work in a time bound manner private agencies were hired where Government agencies were not available for the works like topographical surveys, drilling and submergence area survey. Based on these investigations and studies the layout and designs of various components of the project have been finalized. However, while carrying out the topographical surveys and geotechnical investigations at the proposed dam sites and along the canal alignment, resentment against the project by local people has been encountered forcing NWDA’s field engineers to abandon all field surveys and investigations. The subsequent efforts made by NWDA to convince the local people with the help of public representatives and State Government agencies could not yield the desired results. Thus, the detailed surveys and investigations planned at various locations of the link project could not be completed fully. Therefore, in respect of the components for which the detailed surveys and investigations could not be taken up /completed at DPR stage, the information based on the surveys and investigations carried out at Feasibility Report (FR) stage of the link project have been compiled and supplemented for preparation of DPR, as found necessary.
The DPR has been prepared with active support and co-operation of
CWC and other domain expert organizations like, GSI, CWPRS, CSMRS, THDCIL, IMD, NRSC, WAPCOS, RRSC, BISAG etc.

lxxv
The Union Ministry of Water Resources has constituted a Committee
under the Chairman, CWC to monitor and supervise the work of preparation of DPR; and also a Steering Committee under Secretary (WR). These 2 Committees monitored the progress of work and guided NWDA in preparation of DPR.
The DPR of the project is in 11 Volumes. The main report of the DPR
is contained in Volume – I. The data and detailed reports of various expert agencies associated with work are contained in Volume - II to V as Annexure / Appendices. The cost estimate of the project is in Volume-VI. The relevant drawings are furnished in Volume -VII and VIII.
5.1 Data Collection
The preparation of DPR of Par-Tapi-Narmada link project requires various data / information. The rainfall and meteorological data were collected from IMD, Pune; hydrological data collected from CWC and State Water Resources Departments; Remote sensing data (LISS- IV) from NRSC, Hyderabad; topo-sheets from Survey of India. The data / information required by various Designs Directorates of CWC were collected during the field surveys.
Laboratory testing of rock core samples and various construction
material samples were carried out by CSMRS; geological mapping and investigations were carried out by GSI, Jaipur. These data formed the in-puts for design of various components of the project. Simulation analysis was carried out for optimizing the storage capacities and heights of Jheri, Paikhed, Chasmandva, Chikkar, Dabdar and Kelwan dams. The simulation analysis formed in-puts for the power potential studies carried out by THDCIL and the out-put given by THDCIL in the form of power potential studies formed in-put for civil designs of hydel structures. Thus, there were many activities apart from the normal data collection and these activities were successfully managed by NWDA officers and various data required by the consultants were supplied to them for carrying out various consultancy works for preparation of DPR of Par-Tapi-Narmada link assigned to them.

lxxvi
5.2 Planning and Lay-out The Par-Tapi-Narmada Link Project has been planned to transfer the surplus waters of West flowing Par, Auranga, Ambica and Purna river basins of South Gujarat and neighbouring Maharashtra to provide irrigation facilities to tribal area in the right side of the Par-Tapi-Narmada link canal, tribal dominant districts of Dang and Valsad of Gujarat and Nasik district of Maharashtra. The link project will also take-over the part command area of existing Miyagam Branch Canal of Narmada Canal System. The Narmada waters so saved in Sardar Sarovar Project would be utilized in Tribal areas of Naswadi, Kavant, Sankheda, Jetpur Pavi, Chhota Udepur talukas of Chhota Udepur district and Halol, Ghogamba and Kalol talukas of Panchmahal district through lift directly from Narmada Main Canal on substitution basis and drought affected Saurashtra area of Gujarat through Narmada Canal System to meet irrigation, domestic and other requirements.
For storage and diversion of surplus waters of Par, Auranga, Ambica and Purna Rivers under the link project six dams viz i) Jheri across Par river, ii) Paikhed across river Nar (a tributary of river Par), iii) Chasmandva across river Tan (a tributary of river Auranga), iv) Chikkar across river Ambica, v) Dabdar across river Khapri (a tributary of river Ambica) and vi) Kelwan across river Purna are to be constructed. Also, 2 diversion barrages – one each in the downstream of Paikhed and Chasmandva dams; a tunnel 12.70 km inter connecting Jheri and Paikhed reservoirs and about 406.118 km long link canal (including 4 feeder pipe lines of 37.075 km and 5 tunnels of 1.15 km along the link canal) are required for effecting the proposed utilisation of 1330 MCM under the link project. 6 Power Houses, one each at the toe of the dams except Jheri dam and at the drop of Kelwan feeder pipe line are also planned to generate hydro-power by utilizing water proposed to be released to meet the link canal and downstream requirements and spills from the respective dams. Various components of the project are described below: 5.2.1 Jheri Dam
Jheri dam is proposed across river Par near village Jheri in Peint taluka of Nasik district of Maharashtra. The total length of Jheri dam is

lxxvii
808.32 m of which 663.32 m is concrete face rock fill dam (CFRD) and the length of concrete non-overflow section and spillway is 145.00 m.
The surplus waters available at Jheri reservoir will be transferred to Paikhed reservoir through a tunnel of 12.70 km length.
5.2.2 Paikhed Dam
Paikhed dam is proposed across Nar River a tributary of Par River near village Paikhed in Dharampur taluka of Valsad district of Gujarat. The total length of Paikhed dam is 1431.85 m of which 1310.85 m is concrete face rock fill dam (CFRD) and the length of concrete non-overflow section and spillway is 121.00 m. The spillway has been proposed in the right flank. A penstock is proposed in extreme left of the concrete portion of the dam for taking water to the power house located at the toe of the dam.
The surplus water available at Paikhed reservoir is to be released into the river through powerhouse and will be picked-up at Paikhed barrage from where the Par–Tapi–Narmada link canal will off take and carry the surplus waters of Jheri and Paikhed reservoirs. 5.2.3 Chasmandva Dam
Chasmandva dam is proposed across river Tan, a tributary of Auranga River near village Chasmandva in Dharampur taluka of Valsad district of Gujarat. The total length of Chasmandva dam is 2781.00 m of which 2703.00 m is concrete face rock fill dam (CFRD) and the length of concrete non-overflow section and spillway is 78.00 m. The chute spillway has been proposed in the right flank. A penstock is proposed in extreme left of the concrete portion of the dam for taking water to the power house located at the toe of the dam.
The surplus water available at Chasmandva reservoir is to be released
into the river through powerhouse and will be picked-up at Chasmandva barrage, from where a feeder pipe line will carry the surplus water of Chasmandva reservoir up to main Par-Tapi–Narmada link canal.

lxxviii
5.2.4 Chikkar Dam
Chikkar dam is proposed across river Ambica near village Chikkar in Ahwa taluka of Dang district of Gujarat. The total length of Chikkar dam is 1887.00 m of which 1736.00 m is concrete face rock fill dam (CFRD) and the length of concrete non-overflow section and spillway is 151.00 m. The chute spillway has been proposed in the right flank. A penstock is proposed in extreme left of the concrete portion of the dam for taking water to the power house located at the toe of the dam.
The Chikkar and Dabdar reservoirs will be inter-connected through
pipe line. The surplus water available at Chikkar reservoir will be released into inter-connecting pipe line through the powerhouse and will be taken to Dabdar reservoir.
5.2.5 Dabdar Dam
Dabdar dam is proposed across river Khapri a tributary of Ambica river near village Dabdar in Ahwa taluka of Dang district of Gujarat. The total length of Dabdar dam is 1170.00 m of which 1035.00 m is concrete face rock fill dam (CFRD) and the length of concrete non-overflow section and spillway is 135.00 m. The spillway has been proposed in the right flank. A penstock is proposed in extreme left of the concrete portion of the dam for taking water to the power house located at the toe of the dam.
A feeder pipe line will carry the combined surplus waters of Chikkar and Dabdar reservoirs up to main Par–Tapi–Narmada link canal after power generation at its head. 5.2.6 Kelwan Dam
Kelwan dam is proposed across river Purna near village Kelwan in Ahwa taluka of Dang district of Gujarat. The total length of Kelwan dam is 1330.00 m of which 1141.00 m and the length of concrete non-overflow section and spillway is 189.00 m. The spillway has been proposed in the left flank. A penstock is proposed in extreme right of the concrete portion of the dam for taking water to the power house located at the toe of the dam.

lxxix
After the power generation in dam toe power house, a feeder pipe line
will carry the surplus water available at proposed Kelwan reservoir up to main Par–Tapi–Narmada link canal. Hydro-power will also be generated at the canal fall of feeder pipe line.
5.2.7 Paikhed Barrage
Paikhed barrage is proposed across river Nar about 4.60 km downstream of proposed Paikhed dam to facilitate the release of combined surplus waters of Jheri and Paikhed reservoirs into the link canal. The length of Paikhed barrage is 147.50 m. 5.2.8 Chasmandva Barrage
Chasmandva barrage is proposed across river Tan about 8.50 km downstream of proposed Chasmandva dam to facilitate the off take of the feeder pipe line to release the surplus water of Chasmandva reservoir into the link canal. The length of Chasmandva barrage is 128.00 m.
5.2.9 Link Canal and Feeder pipe lines
The Par–Tapi–Narmada link canal will off take from proposed Paikhed barrage with Full Supply Level (FSL) of 142.800 m. The canal will out fall in to existing Ukai reservoir at RD 177.736 km with FSL of 105.275 m. The Par–Tapi–Narmada link canal will further off-takes from saddle of Ukai dam in the right flank with FSL 81.790 m. The link canal will cross Kim, Amravati, Karjan, Narmada, Orsang and Hiren rivers, besides other small streams, before joining existing Miyagam Branch Canal at RD 191.307 km with FSL of 53.573 m and will take over its part command area.
A 2.859 km long feeder pipe line from Chasmandva weir transfer surplus waters of Chasmandva reservoir in to the link canal at RD 62.072 km. A 14.342 km long inter-connecting pipe line from Chikkar reservoir to transfer surplus waters available at Chikkar dam to Dabdar reservoir. A 12.258 km long feeder pipe line from Dabdar reservoir transfer the combined waters of Chikkar and Dabdar reservoirs in to the link canal at

lxxx
RD 108.250 km. A 7.616 km long feeder pipe line from Kelwan reservoir transfer surplus water of Purna River available at Kelwan dam to the link canal at RD 129.600 km.
5.2.10 Power House
A power house is proposed at the toe of Paikhed dam to generate the hydro power from the combined surplus waters of Jheri and Paikhed reservoirs. For generation of hydro power from the surplus Chasmandva waters, a power house has been proposed at the toe of proposed Chasmandva dam. A power house is proposed at the toe of proposed Chikkar dam. After hydro power generation the Chikkar water will be transferred to proposed Dabdar reservoir through inter-connecting canal. The power house proposed at the toe of Dabdar dam will generate the hydro power by utilizing combined waters of proposed Chikkar and Dabdar reservoirs. At Kelwan dam a power house is proposed at the dam toe. A power house is proposed at the available drop of Kelwan feeder pipe line. Thus total 6 power houses are proposed.
5.3 Surveys and Investigations
On receipt of concurrence from Government of Maharashtra and Gujarat, the work for preparation of DPR of Par-Tapi-Narmada Link Project was taken-up by NWDA during January, 2009. The work for preparation of DPR of the Project was taken-up by NWDA utilizing one Circle Office located at Valsad. Based on the location of the various components of the project and accessibility, the Investigation Division of NWDA located at Valsad was entrusted with the survey and investigation works of Jheri, Mohankavchali, Paikhed and Chasmandva reservoirs, Paikhed and Chasmandva barrages and Par to Ambica reach of the Link canal / Feeder pipe lines and consultancy works assigned to expert agencies. The Investigation Division of NWDA located at Vadodara was entrusted with the survey and investigation works of Chikkar, Dabdar and Kelwan reservoirs, Chikkar weir and Ambica to Out-fall of link canal in to Miyagam branch canal / Feeder pipe lines for preparation of DPR of Par-Tapi-Narmada link project.

lxxxi
The permission for carrying out the survey and investigations work in the forest area was obtained from Principal Chief Conservator of Forest, Government of Gujarat, Gandhinagar vide their letter No. Land/29/B/3034-36/08-09 dated 12th Dec, 2008. Similar permission for Maharashtra area has been obtained from Deputy Conservator of Forest (West), Government of Maharashtra, Nasik vide their letter No. B/Land/CF/4294 dated 25th Nov, 2008 for Surgana and Peint talukas of Nasik district. The NWDA has adopted two pronged strategy for carrying out the survey and investigation works for preparation of DPR of Par-Tapi-Narmada link project. The major parts of the detailed survey and investigation works of the project for which in-house capability was available has been carried out by NWDA itself, whereas other specialized survey and investigation works and other technical studies were out sourced to the institutions of eminence in respective fields, mostly the government agencies.
Certain survey and investigations, which could not be completed due to resistance from local peoples in the project area, are proposed to be carried out at pre-construction stage. 6.0 Climate
The climate of the Par-Tapi-Narmada link project area is moderate except during the months of April and May. Summer is hot and winter is generally cold. The year may be divided into four seasons, the cold season from December to February followed by the hot season from March to May and the south-west monsoon season from June to Sept followed by the post-monsoon season from October to November.
Par–Tapi–Narmada link involves Par, Auranga, Ambica and Purna river basins of South Gujarat and neighboring Maharashtra. All these 4 river basins have the same hydro meteorological characteristics. Most of the rainfall is received during the South-West monsoon period, i.e. from June to Sept. The average annual rainfall in the Par, Auranga, Ambica and Purna river basins is 2180 mm, 2055 mm, 1830 mm and 1472 mm respectively.
Two meteorological observatories i.e. Surat and Vadodara maintained
by IMD located adjacent to the project area have been used to characterize

lxxxii
the climatic conditions of the project area. The average maximum and minimum temperatures recorded are 39.9 °C and 13.2 °C respectively. The monthly mean relative humidity data of the project area indicates the maximum and minimum values of humidity as 94% (Aug) and 44% (Apr) during monsoon and summer seasons respectively. The maximum and minimum wind velocities observed are 13.3 km/hr and 1.7 km/hr respectively. The maximum cloud cover is observed during the months of July and August whereas the minimum cloud cover is observed during months of Jan and Feb. There is no pan-evapometer installed in the project area. The mean monthly average evapotranspiration computed for Surat IMD observatory varies from 99.2 (Dec) to 202.0 mm (May), whereas the same at Vadodara IMD observatory varies from 92.9 mm (Dec) to 246.4 mm (May). 7.0 Topography and Physiography Jheri and Paikhed Reservoirs: The Jheri reservoir is proposed across Par river and Paikhed reservoir is proposed across Nar river, a tributary of Par. The Par river originates from the Sahyadri hill ranges near village Gogul of Surgana taluka in Nasik district of Maharashtra. The Par basin can be divided into two prominent physiographic zones. The eastern part comes under rugged mountain chains of the Sahyadri hills and undulating slope on the western side to the edge of the uplands of Valsad district. This region is placed at a steep slope of elevation 1050 m to 100 m. The Western part, barring the coastal plains, is essentially in the sub-Sahyadrian zone of hills and valley generally lies at an elevation below 100 m. Deccan traps with dykes of quarternary and tertiary ages occupy most of the area of the basin. The middle ranges have developed on the Deccan traps and the intermediate amphitheatres have developed out of the alluvial debris washed from the hills. The lower reaches of the basin upto the coastal margins are mainly alluvial plains. Chasmandva Reservoir: The Chasmandva reservoir is proposed across Tan river, a tributary of Auranga river. The river is known as Auranga after the confluence of its two tributaries the Man and the Tan. Both tributaries originate in the Sahyadri hill ranges in the Nasik district of Maharashtra. The area is hilly and covered with forest in the upstream reaches, while the

lxxxiii
area down-wards from about 30 km upstream of confluence of the Tan and the Man rivers can be described as plain with cultivated lands. Physiographically, the basin can be divided into five groups namely i) hill tops and hill slopes, ii) hill terraces and uplands, iii) upper and lower foot slopes (medium land) iv) valley plains and local depressions (low lands) and v) river and stream beds. The geological formations in the region belong to the Precambrian, Mellpozoic, Tertiary and Quarternary ages. Deccan traps occupy major portion of the upper reaches. Chikkar and Dabdar Reservoirs: The Chikkar reservoir is proposed across Ambica river and Dabdar reservoir is proposed across Khapri river, a tributary of Ambica river. The Ambica river originates in the Sahyadri hill ranges near village Kotambi of Surgana taluka in Nasik district of Maharashtra. Ambica basin is bounded by Western Ghats separating Ambica and Tapi rivers in east, the ridge separating Auranga and Ambica rivers in south, Arabian Sea in west and the ridge separating Ambica and Purna rivers on north. The basin can be divided into two prominent physiographic zones. The eastern part comes under rugged mountain chains of the Sahyadri hills and undulating slope on the western side up to the edge of the uplands of Surat district. This region is placed at a general elevation of 1050 m to 100 m. The western part, barring the coastal plains, is essentially in the sub-Sahyadrian zone of hills and valleys generally below 100 m elevation. Deccan traps with dykes of Quaternary and Tertiary ages occupy most of the area of the basin. Kelwan Reservoir: The Kelwan reservoir is proposed on Purna river. The river rises in the Sahyadri hill ranges of the Western Ghats at an elevation of about 1300 m in the Ahwa taluka of Dang district in Gujarat and after traversing a distance of 180 km, it outfalls into the Arabian sea. The level of the river bed drops steeply from 1300 m at source to about 115 m at the dam site as the river in this reach passes through hilly area covered with dense forest and patches of cultivated land. Physiographically, the basin can be divided into three zones namely, i) eastern zone, ii) middle zone and iii) coastal zone. The eastern zone of the basin cover a chain of rugged mountain ranges of the Western Ghats running to elevations of over 1300 m and descending to an elevation of about 100 m at the edge of the uplands of the Surat district. The middle zone of the basin is marked by high relief

lxxxiv
zone with ridges and valleys. The hilly region then merges into the plain through an undulating piedmont coastal zone running parallel to the sea. Link Canal and Feeder pipe lines: The Par-Tapi-Narmada link canal is aligned through Valsad, Navsari, Tapi, Surat, Bharuch, Narmada, and Chhota Udepur districts of South Gujarat. The terrain through which the link canal is aligned is undulating. Three Feeder pipe lines are proposed, one each from Chasmandva barrage; Dabdar and Kelwan dams respectively for diversion of water in to the link canal. The canals are aligned skirting the hill slopes and the terrain is undulating.
The Command Area of the link canal lies in Navsari, Tapi, Surat and Bharuch districts. The Command Areas of Dabdar and Kelwan Feeder pipe lines lie in Ahwa taluka of Dang district and Vyara Taluka of Tapi district. Topography of the command area is undulating and of moderate slope. Basaltic out crops are seen in Vansda taluka of Navsari district in which the Command area lies. The Command Area in Tapi district comprises of Deccan trap Basalt of Cretaceous-Eocene age, which is overlain by quaternary alluvium. Limestone and clay formation of Eocene ages and quaternary alluvium formation are seen in the Command Area lying in Surat district. In the eastern side of Bharuch district, where the Command Area lies, Basaltic rocks are seen. 8.0 Population
The population in the Valsad, Dang, Navsari, Tapi, Surat, Bharuch, Narmada, and Chhota Udepur and Panchmahal districts of South Gujarat and Saurashtra and Kutch region will get irrigation and drinking water supply benefits from the link project.
9.0 Geology, Geophysical, Geo-technical and Seismic Study i) Local Geology
The Par-Tapi-Narmada link project area is occupied by Deccan Lava flows intruded by dolerite dykes and sill. Very commonly due to differentiation the middle portion of a flow exhibits a dolerite texture. They are of Cretaceous-Eocene age.

lxxxv
ii) Sub-surface Geology and Foundation Investigations
The geological investigations were carried out for Jheri, Chasmandva, Chikkar, Dabdar and Kelwan dam sites during the preparation of Feasibility Report (FR) of Par-Tapi-Narmada link project by Engineering Geology Division, GSI, Western Region, Jaipur. The DPR stage geological investigation work of Par–Tapi–Narmada link project was assigned to GSI, Jaipur and the geological and geo-technical investigations at Paikhed and Chasmandva dam sites were carried out by them. But, due to opposition from local peoples in carrying out the field survey and investigation work the geological investigations could not be taken-up by GSI at other dam sites. As such, the data of geological investigation carried out at FR stage have been used for designing the various components of Par–Tapi–Narmada link project at DPR stage. Jheri Dam: Jheri dam site has been explored by four numbers bore holes, in order to evaluate the sub-surface rock / over burden conditions. The bore hole cores have been logged by GSI, Jaipur and their data was analyzed to find out foundation grade levels and water tightness of bed rock as well as to ascertain the soil structure and its permeability characteristics. Paikhed Dam: In order to evaluate the sub-surface rock / over burden conditions the Paikhed dam site has been explored by 12 numbers of NX size bore holes. The bore hole cores have been logged and their data was analyzed to find out foundation grade levels and water tightness of bed rock as well as to ascertain the soil structure and its permeability characteristics. Chasmandva Dam: The Chasmandva dam site has been explored by 19 numbers of NX size bore holes. The bore hole cores have been logged and their data was analyzed to find out foundation grade levels and water tightness of bed rock as well as to ascertain the soil structure and its permeability characteristics. Chikkar Dam: Chikkar dam site has been explored by four numbers of NX size bore holes and eight numbers of trail pits, in order to evaluate the sub-surface rock / over burden conditions. The bore hole cores and trail pits

lxxxvi
have been logged and their data was analyzed to find out foundation grade levels and water tightness of bed rock as well as to ascertain the soil structure and its permeability characteristics. Dabdar Dam: Dabdar dam site has been explored by four numbers of NX size bore holes and seven numbers of trail pits, in order to evaluate the sub-surface rock / over burden conditions. The bore hole cores and trail pits have been logged by GSI, Jaipur and their data was analyzed to find out foundation grade levels and water tightness of bed rock as well as to ascertain the soil structure and its permeability characteristics. Kelwan Dam: To evaluate the details sub-surface conditions at Kelwan dam site four numbers of bore holes were recommended by GSI; two in the river section and one each on the either bank. Due to public hindrance in the project area no bore hole could be drilled. However, the Kelwan dam site could be explored by 8 trial pits / trenches. Tunnels: Due to public hindrance no subsurface explorations could be carried out. iii) Seismicity
Par- Tapi- Narmada project area lies in the Seismic zone –III as per the seismic zone map of India. The studies for site specific design ground motion parameters for the various components of Par-Tapi-Narmada link project has been carried out by CWPRS, Pune during the year, 2011. As per these studies the deterministic estimate is found to be governed by a maximum credible earthquake magnitude of 6.3 at a closest distance of 20.1 km to the fault rupture plane. The area of 7 dams and three barrage sites proposed in Par–Tapi–Narmada link project has been divided into three clusters. Both deterministic and probabilistic approaches have been applied to arrive at the Maximum Credible Earthquake (MCE) and the Design Basis Earthquake (DBE) levels of ground motion. For both the MCE and DBE levels of design ground motion, it is found that the deterministic target spectra are higher than the probabilistic spectra for all the three clusters. To be on the conservative side, the same has been recommended as a basis for the design ground motion. The values of the peak ground acceleration for

lxxxvii
horizontal and vertical components are found to be 0.172 g and 0.145 g for MCE condition, and 0.089 g and 0.076 g for DBE condition, respectively for Cluster-1. For Cluster-2 and Cluster-3, the corresponding values are found to be 0.171 g and 0.139 g for MCE condition, and 0.079 g and 0.067 g for DBE condition respectively. This report has been approved by the National Committee on Seismic Design Parameters in its 23rd meeting held on 20th Nov, 2012. 10.0 Hydrology and Water Assessment
The water availability studies at Jheri, Paikhed, Chasmandva, Chikkar, Dabdar and Kelwan dam sites have been carried out by the Hydrological Studies Organization, CWC, New Delhi as a part of “Hydrological Studies of Par-Tapi-Narmada link project” in consultation with NWDA and Water Resources Departments of Gujarat and Maharashtra to assess the water balance position at the ultimate stage of development (by the year 2050 AD). As per the study the 75% dependable gross annual yields at Jheri, Paikhed, Chasmandva, Chikkar, Dabdar and Kelwan dam sites are 391 MCM, 264 MCM, 70 MCM, 220 MCM, 323 MCM and 362 MCM respectively.
After considering the upstream utilizations planned by the States for irrigation through existing, ongoing and proposed projects, hydropower projects, reservoir evaporation losses, domestic and industrial requirements about 371 MCM, 250 MCM, 64 MCM, 170 MCM, 262 MCM and 308 MCM of surplus waters at 75% dependability are available at proposed Jheri, Paikhed, Chasmandva, Chikkar, Dabdar and Kelwan dam sites respectively for diversion through Par-Tapi-Narmada link canal.
11.0 Flood Control and Drainage
No flood storage is earmarked in any of the reservoirs proposed under Par-Tapi-Narmada link project. However, due to storage in the reservoirs and release into the link canal / feeder pipe lines for irrigation domestic and industrial water supply, there will be incidental flood moderation in the areas down-stream of Jheri, Paikhed, Chasmandva, Chikkar, Dabdar and Kelwan dam sites.

lxxxviii
12.0 Reservoir and Power
Six reservoirs viz., Jheri, Paikhed, Chasmandva, Chikkar, Dabdar and Kelwan are planned to be utilized for diversion of surplus waters of Par, Auranga, Ambica and Purna Rivers into the Par-Tapi-Narmada link canal. The Jheri reservoir will have gross storage capacity of 206.03 MCM at FRL 246.00 m and dead storage of 9.23 MCM at MDDL of 204.00 m. The Paikhed reservoir will have gross storage capacity of 229.53 MCM at FRL 248.00 m and dead storage of 0.92 MCM at MDDL of 190.00 m. The Chasmandva reservoir will have gross storage capacity of 83.63 MCM at FRL 214.00 m and dead storage of 0.36 MCM at MDDL of 190.00 m. The Chikkar reservoir will have gross storage capacity of 141.99 MCM at FRL 210.00 m and dead storage of 3.69 MCM at MDDL of 179.00 m. The Dabdar reservoir will have gross storage capacity of 222.38 MCM at FRL 169.00 m and dead storage of 4.32 MCM at MDDL of 139.00 m. The Kelwan reservoir will have gross storage capacity of 282.17 MCM at FRL 164.00 m and dead storage of 6.51 MCM at MDDL of 136.00 m.
Hydropower of the order of 21 MW and annual energy of 102 million
units will be generated through the 6 power houses installed at 5 dam sites viz. Paikhed, Chasmandva, Chikkar, Dabdar and Kelwan and one at Canal fall of Kelwan Feeder Pipe line. The power house (of 9 MW) at Paikhed dam will be with 3 units each of 3.0 MW installed capacity. The annual energy generation in the 90% dependable year will be 45.53 Million Units (MU). Power house (of 2 MW) at Chasmandva dam will be with 2 units each of 1.0 MW installed capacity. The annual energy generation in the 90% dependable year will be 5.67 MU. Power house (of 2 MW) at Chikkar dam will be with 2 units each of 1.0 MW installed capacity. The annual energy generation in the 90% dependable year will be 8.35 MU. Power house (of 3.2 MW) at Dabdar dam will be with 2 units each of 1.6 MW installed capacity. The annual energy generation in the 90% dependable year will be 16.60 MU. Power house (of 2.5 MW) at Kelwan dam will be with 2 units each of 1.25 MW installed capacity. The annual energy generation in the 90% dependable year will be 13.07 MU. Power house at canal fall of Kelwan feeder will be with 2 units each of 1.0 MW installed capacity. The annual energy generation in the 90% dependable year will be 12.48 MU.

lxxxix
13.0 Irrigation and Command Area Development
As per water planning, the total Culturable Command Area (CCA) of about 232175 ha has been identified under the link canal. The enroute Culturable Command Area (CCA) of 61190 ha with Annual Water Utilization of 382 MCM is proposed, out of which the CCA identified in Par-Tapi reach is 10100 ha with Annual Water Utilization of 63 MCM; in Tapi-Narmada reach is 49820 ha with Annual Water Utilization of 311 MCM; and 1270 ha identified under Dabdar and Kelwan Feeder pipe lines with Annual Water Utilization of 8 MCM are firming up of en-route command area of the link canal. The command area of five projects proposed by Government of Gujarat on the left side of canal is about 45561 ha with Annual Water Utilization of 285 MCM to be irrigated by gravity through link canal. Tribal area right side of canal is 36200 ha with Annual Water Utilization of 138 MCM will be irrigated by lift. About 12514 ha with Annual Water Utilization of 48 MCM tribal area will also be irrigated directly by lift from proposed six reservoirs of this project. The Link Project will take over an area of 76710 ha CCA with annual irrigation of 76710 ha with Annual Water Utilization of 291 MCM under the command area of existing Miyagam branch canal of Narmada canal system. Narmada Water so saved will be utilized to provide irrigation facilities in Tribal area on right side of Narmada main canal 23750 ha with Annual Water Utilization of 90 MCM of Chhota Udepur district and 10592 ha with Annual Water Utilization of 40 MCM of Panchmahal district by lift directly from Narmada main canal on substitution basis and in Saurashtra and Kutch region of Gujarat.
14.0 Navigation and Tourism
Navigation is not proposed under this project. Regarding tourism development, the tourist / picnic spots are proposed to be developed on the periphery of Jheri, Paikhed, Chasmandva, Chikkar, Dabdar and Kelwan reservoirs and near Paikhed and Chasmandva barrages.

xc
15.0 Design Features Jheri Dam: The height of the Jheri dam has been designed as 73.00 m with top width as 10.00 m. The FRL of the Jheri dam has been kept as 246.0 m. The concrete portion of the dam will be 145.00 m long whereas concrete faced rock fill portion will be 663.32 m. The spillway will have 5 nos. of gates of size 15 X12 m. Paikhed Dam: The height of the Paikhed dam has been designed as 93.0 m with top width as 10.0 m. The FRL of the Paikhed dam has been kept as 248.0 m. The concrete portion of the dam will be 121.0 m long whereas concrete faced rock fill portion will be 1310.85 m. The spillway will have 4 nos. of gates of size 15 X 12 m. The power house at dam toe is proposed with 3 units of 3 MW each. Chasmandva Dam: The height of the Chasmandva dam has been designed as 52.0 m with top width as 10.0 m. The FRL of the Chasmandva dam has been kept as 214.0 m. The concrete portion of the dam will be 78 m long whereas concrete faced rock fill portion will be 2703 m. The spillway will have 3 nos. of gates of size 12 X 12 m. The power house at dam toe is proposed with 2 units of 1 MW each. Chikkar Dam: The height of the Chikkar dam has been designed as 63.0m with top width as 10.0 m. The FRL of the Chikkar dam has been kept as 210.0 m. The concrete portion of the dam will be 151.0 m long whereas concrete faced rock fill portion will be 1736.0 m. The spillway will have 4 nos. of gates of size 15 X 12 m. The power house at dam toe is proposed with 2 units of 1 MW each. Dabdar Dam: The height of the Dabdar dam has been designed as 65.0 m with top width as 10.0 m. The FRL of the Dabdar dam has been kept as 169 m. The concrete portion of the dam will be 135.0 m long whereas concrete faced rock fill portion will be 1035 m. The spillway will have 5 nos. of gates of size 15 X 12 m. The power house at dam toe is proposed with 2 units of 1.6 MW each. Kelwan Dam: The height of the Kelwan dam has been designed as 58.0m with top width as 10.0 m. The FRL of the Kelwan dam has been kept as

xci
164 m. The concrete portion of the dam will be 189.0 m long whereas concrete faced rock fill portion will be 1141.0 m. The spillway will have 5 nos. of gates of size 15 X 12 m. The power house at dam toe is proposed with 2 units of 1.25 MW each. The power house proposed at canal fall of the feeder pipe line connecting Kelwan dam with link canal will have 2 units of 1MW each Tunnel Connecting Jheri and Paikhed Reservoirs: The total length of tunnel from Jheri and Paikhed reservoirs will be about 12.70 km with diameter as 3.00 m and bed slope 1:875. The tunnel will be of D shape. Paikhed Barrage: This barrage will be 147.50 m long with spillway of 138.50 m (7 bays of 15 m width with 5 nos. of piers of 4.5 m thick and 1 no. of double pier of 11 m thick). A head regulator is provided at the upstream right side of the barrage. Par-Tapi-Narmada link canal will offtake from this head regulator at crest level of 136.0 m. Chasmandva Barrage: This barrage will be 128 m long with spillway of 122 m (8 bays of 12 m width with 6 nos. of piers of 3.0 m thick and 1 no. of double pier of 8 m thick). A head regulator is provided at the upstream right side of the barrage. Chasmandva feeder pipe line will offtake from this head regulator at crest level of 123.0 m. Link Canal: Total length of Par-Tapi-Narmada link canal is 406.118 Km including feeder pipe lines and tunnels along the link canal. The length of Par-Tapi reach link canal is 177.736 km offtaking from the Paikhed barrage. The head reach of canal has been designed for a capacity of 38.17 cumecs. The canal will have 8.50 m bed width and 2.8 m full supply depth at its head and 16.50 m bed width and 2.80 m full supply depth at its tail end. The length of Tapi-Narmada reach of link canal is 191.307 km offtaking from the Ukai reservoir. The head reach of canal has been designed for a capacity of 46.64 cumecs. The canal will have 8.80 m bed width and 3.22 m full supply depth at its head and 5.0 m bed width and 2.650 m full supply depth at its tail end.

xcii
16.0 Construction Material
Coarse as well as fine sand including gravel are available in required quantities in the river bed, both upstream and downstream within leads of 1 to 9 km in respect of Jheri, Chasmandva, Chikkar, Dabdar and Kelwan dam sites. However, in case of Paikhed dam site, the lead varies from 2 to 35 km. Good rubble stone suitable for construction work is available from quarries, in the vicinity of each dam site within economical leads of 1 to 4 km.
The nearest cement factory for the dam sites is Narmada Cement Factory, Magdalla in Surat district. The cement manufactured from this factory can be transported to Vyara and Valsad through rail head. Friends Ispat plant is located at Ahmadabad. The steel required for project construction can be procured from this plant and transported to Valsad, Billimora, and Vyara rail heads by rail and further up to project sites by road.
17.0 Accessibility and Infrastructure
The Par-Tapi-Narmada link project is located in Gujarat except Jheri dam which falls in Maharashtra while remaining dams viz. Paikhed, Chasmandva, Chikkar, Dabdar and Kelwan dams are located in Valsad and Dang districts of Gujarat. Par-Tapi reach of link canal passes through Valsad, Navsari, Dang, Tapi and Surat districts whereas Tapi-Narmada reach of link canal passes through Surat, Bharuch, Narmada and Vadodara / Chhota Udepur districts of Gujarat.
The Jheri dam across Par River is located near village Jheri in Peint taluka of Nasik district of Maharashtra. The Jheri dam site is approachable from Peint as well as from Dharampur, taluka head quarters in Nasik and Valsad districts respectively via Valsad - Nasik National Highway. The nearest railway station is Nasik on Central Railway and nearest town is Peint. The distance of Jheri dam site from Nasik via Peint is about 75 km.
The Paikhed dam across Nar River, a tributary of river Par is located near village Paikhed in Dharampur taluka of Valsad district. The nearest town is Dharampur and the nearest railway station is Valsad on Western

xciii
Railway. The Paikhed dam site is approachable from Dharampur on Valsad – Nasik National Highway. The distance of Paikhed dam site from Dharampur is about 38 km.
The Chasmandva dam across Tan River, a tributary of river Auranga is located near Chasmandva village in Dharampur taluka of Valsad district. The nearest town is Dharampur and the nearest railway station is Valsad. The dam site is approachable from Dharampur on Dharampur – Vansda road and the distance of Chasmandva dam site from Dharampur is about 25 km.
The Chikkar dam across Ambica River is located near village Chikkar in Ahwa taluka of Dang district in Gujarat. The Chikkar dam site is approachable from Waghai / Vansda on Gandevi – Saputara National Highway No - 360. The nearest town and railway station is Waghai on narrow gauge (Bilimora – Waghai section) and Bilimora on Broad gauge of Western Railway. The dam site is approachable from Dharampur. The distance of Chikkar dam site from Waghai is about 12 km.
The Dabdar dam across Khapri River, a tributary of river Ambica near village Dabdar in Ahwa taluka of Dang district in Gujarat. The Dabdar dam site is approachable from Waghai on Gandevi – Saputara National Highway No - 360. The nearest town is Waghai and the nearest railway station is Waghai on narrow gauge (Bilimora – Waghai section) and Bilimora on Broad gauge of Western Railway. The distance of Dabdar dam site from Waghai is about 8 km.
The Kelwan dam across Purna river is located near village Kelwan and Kakarda in Ahwa taluka of Dang district in Gujarat. The Kelwan dam site is approachable from Waghai on Gandevi – Saputara National Highway No - 360. The nearest town is Waghai and the nearest railway station is Unai on narrow gauge (Bilimora – Waghai section) and Vyara on Broad gauge (Surat – Bhusaval section). The distance of Kelwan dam site from Vyara and Waghai is about 30 km.
The nearest airports in the vicinity of the link project are at Mumbai,
Nasik and Surat.

xciv
18.0 Construction and Equipment Planning
The Construction Planning, Equipment Planning and Man-power Planning has been carried out by Construction Machineries Consultancy (CMC) Directorate of Central Mechanical Organization, CWC, New Delhi. 19.0 Environmental and Ecological Aspects of the Project
The water resources projects when built increase the water availability leading to various developmental activities and prosperity in the area, but some adverse impacts on the environment are also seen. As such it is necessary to identify the adverse impacts of the project and suggest the measures to mitigate or ameliorate the anticipated adverse impacts on the environment. To identify the possible environmental impacts, both positive and adverse due to the proposed Par-Tapi-Narmada link project and to suggest measures to mitigate or ameliorate the anticipated adverse impacts on the environment, the Environmental Impact Assessment Study of Par-Tapi-Narmada link project has been carried out through WAPCOS Ltd.
i) Base Line Study and EIA Study
The baseline levels of environmental parameters which could be significantly affected by the implementation of the project are essential to be ascertained before implementation of the project. The baseline status shall involve both field work and review of data collected from secondary sources. The baseline survey planning commenced with the short listing of impacts and identification of parameters for which the data needs to be collected. Baseline status has been ascertained for air environment, water environment, land environment, public health and biological (terrestrial and aquatic) environment. The likely impacts due to the project during construction and operation phases have been studied on the aspects like land, water and air environments, aquatic and terrestrial ecology, socio-economic, impact on public health, risk on failure of dam structures etc.

xcv
ii) Flora and Fauna
The impacts on forest cover; rare, endangered and threatened species and impacts on wildlife such as impact due to habitat change having effect like corridor loss and loss of migratory path for wildlife including birds, impact on breeding grounds of species, impacts on access of animals to food and shelter have been studied. The study indicates that rare, endangered and threatened species are not reported in the study area. The impacts due to acquisition of forest land shall be mitigated through compensatory afforestation measures and implementation of bio-diversity conservation measures suggested in the EMP. The area to be brought under irrigation within the command area is devoid of forests. The project area is interspersed with settlements and agricultural land. In such settings large scale faunal population is not observed. Thus, no significant impact on wild life is anticipated due to the project. Purna and Vansda Wild life Sanctuaries are falling within the study area. The project shall not acquire any land from these sanctuaries. However, adverse impacts on account of increased human interferences may take place during project construction phase. A detailed anti-poaching plan including surveillance measures outlined in the Environmental Management Plan.
The impact on aquatic ecology due to increase in the turbidity levels; spawning areas of fishes; damming of rivers and impacts on migratory fish species etc. have also been studied.
iii) Land Use Pattern Majority of the environmental impacts during construction phase are temporary in nature, lasting mainly during the construction phase and for small duration beyond the construction period. The major impacts anticipated on land environment during construction phase are: environmental degradation due to immigration of labour population; operation of construction equipment; soil erosion; and solid waste management. Remedial measures have been suggested to mitigate/ameliorate these impacts. During operation phase the impact is mainly due to submergence of land by the Jheri, Paikhed, Chasmandva, Chikkar, Dabdar and Kelwan reservoirs. These 6 reservoirs will

xcvi
submerge about 6065 ha land (Jheri 836 ha, Paikhed 994 ha, Chasmandva 615 ha, Chikkar 742 ha, Dabdar 1249 ha and Kelwan 1629 ha) of which 2829 ha forest land, 2364 ha culturable and other and river portion land 872 ha.
(iv) Environmental Management Plan (EMP)
The various environmental aspects such as pollution control at construction sites; water quality management; land management plan, biodiversity conservation and management plan; green belt development plan; environmental management in labour camps; public health management; catchment area treatment (CAT) plan, dam break analysis and disaster management programme (DMP), environmental monitoring programme etc have been considered and suitable provisions have been kept in the estimate.
The total water demand of Par-Tapi-Narmada link project is about
1330 MCM (PTN link canal requirement: 1210 MCM; Environmental releases d/s of proposed dam sites: 20 MCM; Local domestic and industrial requirement in the vicinity of proposed reservoirs: 60 MCM; and evaporation losses proposed in the reservoir: 40 MCM). The reservoirs are devoid of any minerals of economic importance and no monuments or any remains of archaeological importance were noticed in the project area of the Link. Ensured release of minimum quantity of water required to maintain the river ecology down-stream of dams during lean season will increase the river ecology. Due to creation of Jheri, Paikhed, Chasmandva, Chikkar, Dabdar and Kelwan reservoirs the ground water level in the down-stream areas will rise. The water samples tests indicate that organic and heavy metal components in the water are within permissible limits. The rocks in the reservoirs area are hard, massive and devoid of any major fault or shear zones while the joints are mostly tight and as such there will be no problem of reservoir leakage. The total estimated cost for implementation of Environmental Management Plan (EMP) is Rs 445 crore (excluding the cost of R and R Plan).

xcvii
20.0 Socio-Economic Aspects and Resettlement and Rehabilitation
About 6065 ha land area will come under submergence of proposed reservoirs. Total number of affected families would be 2509 of which 98 families would be affected due to creation of Jheri reservoir spread over 6 villages, 331 families would be affected due to Paikhed reservoir spread over 11 villages, 379 families would be affected due to creation of Chasmandva reservoir spread over 7 villages, 345 families would be affected due to creation of Chikkar reservoir spread over 9 villages, 563 families would be affected due to creation of Dabdar reservoir spread over 11 villages and 793 families would be affected due to Kelwan reservoir spread over 17 villages. The affected villages are located in Surgana and Peint talukas of Nasik district in Maharashtra and Dharampur taluka of Valsad, Vansda taluka of Navsari and Ahwa taluka of Dang districts in Gujarat. The affected families may lose their lands or houses or both in the submergence when the reservoirs are created. All the affected families would be compensated for the loss of their lands and houses. The families whose houses are coming under submergence would be resettled in the new habitations and would be assisted to take up some alternative occupation in the new surroundings.
(i) Resettlement and Rehabilitation Plan
The Department of Land Resources (DLR), Ministry of Rural Development, Government of India formulated a policy entitled, “National Rehabilitation and Resettlement Policy-2007”. Similarly, the State Governments of Madhya Pradesh, Gujarat and Maharashtra also developed the R and R Policies for Project Affected Peoples (PAPs) of Sardar Sarovar Project. The provisions of Land Acquisition, Rehabilitation and Resettlement Bill - 2013 have also been considered. The provisions in all these documents have been compared. Keeping in view these policies a R and R package has been developed to compensate the project affected families enabling them to gain at least their levels of living standards. All major sons in a joint family are to be treated as separate families and would be entitled for all R and R benefits.

xcviii
Creation of 6 reservoirs viz. Jheri, Paikhed, Chasmandva, Chikkar, Dabdar and Kelwan would submerge one villages fully and 60 villages partly. The affected villages are located in Dang and Valsad districts of Gujarat and Nasik district of Maharashtra. All the Project Affected Families will be provided Rehabilitation and Resettlement assistance. The rehabilitation assistance would include sanction of productive asset grant to each head of project affected households and also to each of the major son of such households, besides provision of subsistence allowance, annuity, mandatory employment for one member from each family or compensation, RandR relief aid, vocational training grant, etc. The costs for resettlement of displaced persons includes free residential plot, house building assistance, grant for construction of cattle shed, and civic amenities like domestic water, electricity, school, playground and children park, health centre, resettlement centre, place of worship, community hall, sanitation, drainage, approach roads, public transport, place of funeral etc. The total cost of Resettlement and Rehabilitation of the project affected families including cost of Local Area Development Plan and monitoring and evaluation aspects works out to be Rs.1126 crore.
Socio-economic condition of the people living in command area as well as in near vicinity of the project will improve in general. No major adverse impacts are anticipated due to the link project on the socio-economic front.
21.0 Cost estimate
The cost estimate for Par-Tapi-Narmada link project has been prepared based on the quantities of various material and works involved in the various components worked out based on the engineering drawings. To work out the rates of various items the rate analysis has been carried out using the rates of various material, man power etc. from schedule of rates for South Gujarat region of Water Resources Department, Government of Gujarat for the year 2012-13 and enhanced to 2014-15 price level by considering 5% escalation per annum to arrive the cost of the project components.

xcix
The total cost of Par-Tapi-Narmada link project has been estimated to be Rs. 989325 lakh. The details are in the following table:
Sl. No
Item Estimated cost Rs in lakh
1. Unit-I Head works 474773 2. Unit-II Canals and Conveyance system 455710 3. Unit-III Power installations 18091 4. Unit-IV Navigation - 5. Unit-V Water Supply - 6. Unit-VI Command Area Development 72547
Total cost of the project 1021121 22.0 Economic and Financial Evaluation
Sl. No
Description Rs in lakh
1. Net return from agricultural produce (i) Pre-project 165068.25 (ii) Post-project 53891.55 (iii) Total net return from agricultural produce 111176.70 2. Revenue from sale of power @ Rs. 6.00/kwh
for 102 MU 6120.00
3. Revenue from Water supply @ Rs. 118.25 lakh per MCM for 76 MCM
8987.00
4. Revenue from Fisheries 303.00 Total Revenue 126586.70
5. Annual cost like interest, depreciation, charges of operation and maintenance (OandM) for command area and head works, power plants, etc.
122364.64
6. Benefit-Cost (BC) Ratio 1.035 7. Internal Rate of Return (IRR) 10.172%
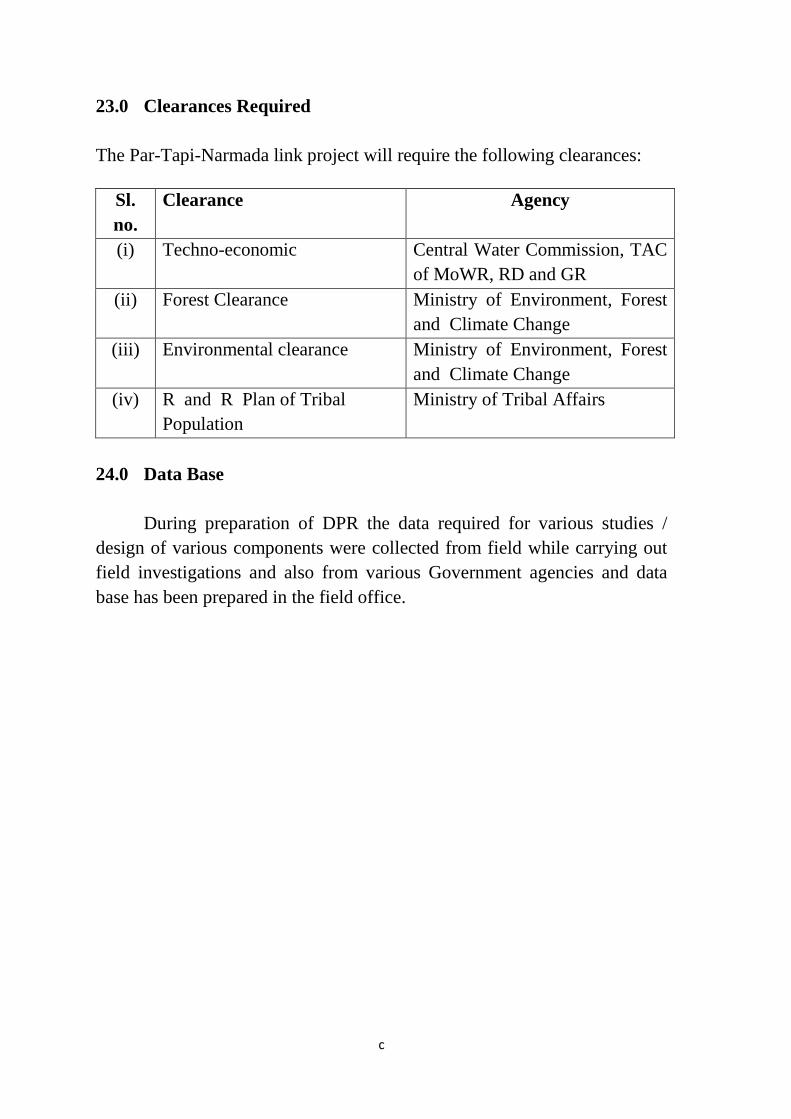
c
23.0 Clearances Required The Par-Tapi-Narmada link project will require the following clearances:
Sl. no.
Clearance Agency
(i) Techno-economic Central Water Commission, TAC of MoWR, RD and GR
(ii) Forest Clearance Ministry of Environment, Forest and Climate Change
(iii) Environmental clearance Ministry of Environment, Forest and Climate Change
(iv) R and R Plan of Tribal Population
Ministry of Tribal Affairs
24.0 Data Base
During preparation of DPR the data required for various studies / design of various components were collected from field while carrying out field investigations and also from various Government agencies and data base has been prepared in the field office.

Contents Report Volume – I
Foreword Preface Check List Salient Features Executive Summary List of Officers Associated in Preparation of DPR Index Map
Volume –I - Main Report
Para No. Particulars Page No.
Chapter – 1 Introduction
1.0 General 1 1.1 Outline of the Project 3 1.2 Justification and the Objective of the Project 9 1.3 Lessons Learned from Previous Projects 10 1.4 National Perspective Plan for Water Resources Development 13 1.5 Memorandum of Understanding between Centre and States and
Inter- State Aspects 15
1.6 Selection of Proposed Scheme 18 1.7 Proposed Modification in Command area of Par-Tapi-Narmada
Link Project 25
1.7.1 Need for Modification 25 1.7.2 Project Planning and Optimisation of Benefits 29 1.8 Methodology Adopted 35 1.8.1 Data Collection 35 1.8.2 Planning and Lay-out 36 1.8.2.1 Jheri Dam 36 1.8.2.2 Paikhed Dam 37 1.8.2.3 Chasmandva Dam 37 1.8.2.4 Chikkar Dam 38 1.8.2.5 Dabdar Dam 38 1.8.2.6 Kelwan Dam 38 1.8.2.7 Paikhed Barrage 39 1.8.2.8 Chasmandva Barrage 39 1.8.2.9 Link Canal 39 1.8.2.10 Powerhouse 40 1.8.3 Surveys & Investigations 40 1.8.3.1 Survey & Investigation Works Carried out Departmentally 41 1.8.3.2 Survey and Investigation Works Carried out by Other Agencies 42 1.8.3.2.1 Topographical Surveys 42 1.8.3.2.2 Borrow Area Survey, Construction Material Survey and Testing
of Rock Core Samples 43
1.8.3.2.3 Geological Survey 43 1.8.3.2.4 Drilling Works 43 1.8.3.2.5 Demarcation of Command Area En- route of the Link Canal 44 1.8.3.3 Technical Studies 44 1.8.3.3.1 Design of Important Project Components and writing of Design
Chapter 44

Para No. Particulars Page No.
1.8.3.3.2 Irrigation Planning 45 1.8.3.3.3 Construction Planning, Equipment Planning and Man-power
Planning 45
1.8.3.3.4 Hydrological Study 45 1.8.3.3.5 Power Potential and Electrical & Mechanical Studies 45 1.8.3.3.6 Study of Seismic Parameter 45 1.8.3.3.7 Morphological Study 45 1.8.3.3.8 Mineral Surveys 46 1.8.3.3.9 Archaeological Surveys 46 1.8.3.3.10 Cadastral Surveys 46 1.8.3.3.11 Soil Surveys 46 1.8.3.4 Socio-economic Survey and Environmental Impact Assessment
Studies 46
1.8.4 Engineering Assessment and Front End Engineering 47 1.8.4.1 Dam and Head Works 47 1.8.4.2 Tunnel Connecting Jheri and Paikhed Reservoir 49 1.8.4.3 Barrages 49 1.8.4.4 Link Canal 50 1.8.5 Ecological, Socio-economic and Financial Aspects 51
1.8.6 Monitoring Mechanism 57 1.9 Clearances Required 58 Chapter – 2
Physical Features
2.1 Geographical Disposition 59 2.2 Topography of the Basins, Reservoirs and Command Area 59 2.2.1 Par Basin 59 2.2.2 Auranga Basin 60 2.2.3 Ambica Basin 61 2.2.4 Purna Basin 61 2.2.5 Tapi Basin 62 2.2.6 Narmada Basin 62 2.2.7 Topography of the Reservoirs 63 2.2.8 Topography of the Command Area 64 2.3 Geology of the Basin, Reservoir and Command Area 65 2.3.1 Geology of the Basins 65 2.3.2 Geology of Reservoirs 66 2.3.3 Geology of Command Area 68 2.4 River System and catchment Area 70 2.4.1 Par Basin 70 2.4.2 Auranga Basin 71 2.4.3 Ambica Basin 71 2.4.4 Purna Basin 72 2.4.5 Tapi Basin 73 2.5 Basin Characteristics 73 2.5.1 Rainfall 73 2.5.2 Temperature, Relative Humidity, Wind Speed and Cloud Cover 75 Chapter – 3
Interstate Aspects
3.1 States Traversed by the Rivers 76 3.2 Distribution of Catchment in State and Yields from the 76

Para No. Particulars Page No.
Catchment of the State Concerned 3.3 (a) Effect on Project & of the Project on the Interstate Agreement on
Sharing of Waters, Sharing the Benefits and Costs, Acceptance of Submergence in the Upstream State Etc., if Any.
79
3.3(b) Effect on Project & of the Project on the Interstate Adjudication, if Any
84
3.3(c) Effect on Project & of the Project on the Interstate Aspect of Territory, Property, etc. Coming Under Submergence, Project Affected People, Rehabilitation, Compensation, etc.
84
3.3 (d) Effect on Project & of the Project on the Existing and Sanctioned Projects.
84
3.3 (e) Any Other Aspect of the Project Involving Interstate Problems. 85 Chapter – 4
Surveys and Investigations
4.0 General 86 4.1 Topographical Surveys 91 4.1.1 Rivers 92 4.1.2 Reservoirs 95 4.1.3 Head Works 99 4.1.4 Plant and Colony Layout 104 4.1.5 Canal & Water Conductor System and Canal Structures 104 4.1.5.1 Alternative crossing of Tapi River without Dropping at Ukai
Reservoir 105
4.1.6 Power House, Switch Yard, Surge shaft, Tailrace etc 105 4.1.7 Tunnel Survey 106 4.1.8 Command Area (detailed and sample) 106 4.1.8.1 Detailed topographical surveys for identification of en-route
Command Area of link canal. 107
4.1.8.2 Sample Command Area surveys for OFD works 110 4.1.9 Soil Conservation 110 4.2 Other Surveys 111 4.2.1 Archaeological Survey in the Reservoir area 111 4.2.2 Mineral Survey in the Catchments/ Reservoir/Canals Area 111 4.2.3 Right of Way Survey for the Reservoirs 111 4.2.4 Communication Surveys 112 4.2.5 Drainage Survey 113 4.2.6 Soil Surveys 114 4.3 Geology, Geophysical and Seismic Investigations 114 4.3.1. Regional Geology 114 4.3.2 Local Geology 115 4.3.3 Geological Investigations 116 4.3.4 Seismicity 120 4.4 Sub-surface Geology and Foundation Investigations 122 4.4.1 Geophysical Investigations 131 4.5 Construction Material Investigations 135 4.5.1 Soils 135 4.5.2 Sand 137 4.5.3 Rock and Aggregates 137 4.5.4 Bricks and Tiles 138 4.5.5 Pozzolona 138 4.5.6 Cement 138

Para No. Particulars Page No.
4.5.7 Steel 139 4.5.8 Scarce Material 139 4.5.9 Steel pipe of 2.5 To 2.9m dia 139 4.5.10 Any other Material 139 4.6 Hydrological and Meteorological Investigations 139 4.6.1 Rainfall 139 4.6.2 Discharge Data 142 4.6.3 Wind Speed 143 4.6.4 Humidity 143 4.6.5 Temperature 143 4.6.6 Sedimentation 143 4.6.7 Water Quality 145 4.6.8 Evaporation 146 4.6.9 Morphological Studies 146 Chapter –5
Hydrology and Water Assessment
5.0 General 147 5.1 General Climate and Hydrology 147 5.2 General Information about Regions 149 5.3 Specific Information 150 5.3.1 Drainage Basins 150 5.3.2 Command Area as per the Revised Irrigation Planning 152 5.3.3 Floods and Drainage 156 5.3.4 River Geometry 157 5.3.5 Ground Water Recharge 158 5.3.6 Reservoir Area 158 5.3.7 Other Water Usage 162 5.3.8 Navigation 162 5.4 Data Availability 162 5.4.1 Rainfall and Snowfall 162 5.4.2 Pan Evaporation 170 5.4.3 Temperature, Relative Humidity, Wind Speed and Cloud Cover 171 5.4.4 River Gauge and Discharge 172 5.4.5 Sediment (Suspended and Bed Load) Inflow and Grain Size
Composition 173
5.4.6 Water Quality 174 5.5 Hydrological Data Requirement 175 5.5.1 Alternatives and Classifications 175 5.6 Type of Inputs 175 5.6.1 Hydrological Inputs 175 5.7 Compilation and Processing of Basic Hydrological Data 176 5.7.1 Hydrological Investigation 176 5.7.2 Data from Other Sources 178 5.7.3 Processing of Data 178 5.7.3.1 Quality of Data 178 5.7.3.2 Filling of Short Data Gaps 178 5.7.4 Consistency of Data 179 5.7.4.1 Consistency Check of Rainfall Data 179 5.7.4.2 Weighted Mean Rainfall 180 5.7.4.3 Consistency Check for Discharge Data 185 5.7.5 Presentation of Data 205

Para No. Particulars Page No.
5.7.5.1 Rainfall Data 205 5.7.5.2 Discharge / Yield Data 205 5.8 Water Availability / Inflows 206 5.8.1 Storage Projects 206 5.8.2 Approach in the Current Study 206 5.8.3 Hydrological Inputs required for Simulation 206 5.8.3.1 Water inflow in to Storage Reservoirs 207 5.8.3.2 Rainfall-Runoff Relationship 207 5.8.3.3 Gross Yield Series 213 5.8.3.4 Net yield Series 215 5.8.3.5 Diversion and Small Pondages 217 5.9 Sedimentation Studies 218 5.9.1 Revised Area Capacity Curves 218 5.10 Potential Evapotranspiration and Rainfall 228 5.11 Inputs for Water Quality 228 5.12 Low Flow Inputs 229 5.13 Surface to Groundwater Recharge 229 5.14 Data for Studies other than Simulation 229 5.14.1 Design Flood and Diversion Flood Studies of Dams 229 5.14.1.1 Derivation of Unit Hydrograph 230 5.14.1.2 Design Storm Studies 235 5.14.1.3 Convolution 239 5.14.1.4 Design flood (PMF) 239 5.14.1.5 Diversion Flood 248 5.14.1.6 Conclusion 249 5.14.2 Design Flood and Diversion Flood Studies of Weirs 250 5.14.2.1 Derivation of Unit Hydrograph 251 5.14.2.2 Design Storm Studies 253 5.14.2.3 Convolution 257 5.14.2.4 Flood Hydrograph at Weir Sites 257 5.14.2.5 Conclusion 260 5.14.3 Tail water rating curves 261 5.15 Studies for design of drainage in the command area 264 5.16 Studies for Determination of Levels for Locating Structures on
Outlets 265
5.16.1 Location of structures 265 5.16.2 Location of Outlets 266 5.17 Simulation Studies of the Reservoirs 270 5.17 .1 Broad Criteria 270 5.17.2 Computation of Net Inflows in to the Reservoirs and Barrages 270 5.17.3 Priorities / Operation policy 281 5.17.4 Demands 282 5.17.4.1 Common Demands at Each Reservoirs 282 5.17.4.2 Project Specific Demands 283 5.17.5 Multi reservoir Simulation Study 286 5.17.5.1 Reservoir Operation Policy / Priorities 286 5.17.5.2 Assumptions in the Simulation Study 287 5.17.6 Simulation Results and Observations 288 Chapter –6
Design Aspects
6.0 Engineering Assessment 291

Para No. Particulars Page No.
6.1 General 291 6.1.1 Geology, Seismicity and Foundation 294 6.1.1.1 Geology 294 6.1.1.2 Seismicity 298 6.1.1.3 Foundation Treatment 298 6.1.2 Alternative Studies carried out for Selection of Site and Type of
Structure 300
6.1.3 Choice of Final Layout of all Major Components of the Project and Reason
301
6.1.4 Design Flood and Sediment Studies 302 6.1.4.1 Design Flood Studies 302 6.1.4.2 Sediment Studies 303 6.1.4.3 Flood Routing Studies 304 6.1.5 Free Board for Fixing Top Elevation of Various Dams 306 6.1.5.1 Jheri Dam 306 6.1.5.2 Paikhed Dam 306 6.1.5.3 Chasmandva Dam 306 6.1.5.4 Chikkar Dam 307 6.1.5.5 Dabdar Dam 307 6.1.5.6 Kelwan Dam 307 6.1.5.7 Paikhed Barrage 308 6.1.5.8 Chasmandva Barrage 308 6.1.6 River Diversion Arrangements 308 6.1.7 Construction Materials 308 6.1.7.1 Rock / River Boulder Samples (Coarse Aggregate) 308 6.1.7.2 Fine Aggregate Samples 309 6.1.8 Details of Model Studies for Important Structures 310 6.2 Dam 310 6.2.1 Concrete Face Rock Fill Dam – Design Criteria and Stability
Analysis 310
6.2.1.1 General Layout 310 6.2.1.2 Background on Selection of CFRD 312 6.2.1.3 Attractive Features of a CFRD 313 6.2.1.4 Design of Typical Section of CFRDs 314 6.2.1.5 Dam Slope Stability 318 6.2.1.6 Plinth 318 6.2.1.7 Face Slab 319 6.2.1.7.1 Face Slab Thickness 320 6.2.1.7.2 Panel Width 320 6.2.1.7.3 Joints 321 6.2.1.7.3(a) Parametric Joint and Water Stops 321 6.2.1.7.3(b) Tensile Vertical Joint (Near Abutments) and Compressive
Vertical Joint 322
6.2.1.7.3(c) Horizontal Construction Joint 323 6.2.1.7.4 Concrete Properties 323 6.2.1.7.4(a) Concrete Mix Design Properties 324 6.2.1.7.4(b) Concrete Aggregates 324 6.2.1.7.5 Reinforcement 324 6.2.1.8 Parapet Wall 324 6.2.1.8.1 Joint between Parapet Wall and Face Slab 325 6.2.1.9 Interface Wall 325

Para No. Particulars Page No.
6.2.1.10 Filter (Zone 2A) - Filter Requirements 326 6.2.2 Concrete Dam 328 6.2.2.1 Layout of Concrete Dam 328 6.2.2.2 Free Board 330 6.2.2.3 Zoning 330 6.2.2.4 Design of Concrete Dam 333 6.2.2.4.1 Design Criteria for Non- Overflow Section 333 6.2.2.4.2 Stability Analysis of Non-Overflow Section 334 6.2.2.4.3 Design of Overflow Section (Spillway) 341 6.2.2.4.4 Stability Analysis of Overflow Section 344 6.2.2.4.5 Chute Spillway 352 6.2.2.4.6 Energy Dissipation Arrangement 352 6.2.2.4.7 Curtain and Consolidation Grouting 353 6.2.2.4.8 Spillway Gates 354 6.2.2.5 Opening through Dams 369 6.2.2.5.1 Gallery 369 6.2.2.5.2 Water Stop, Air Vent & Internal Drainage 369 6.3 Barrages and Head Regulators 370 6.3.1 Selection of Barrage Site 371 6.3.2 Design Flood 371 6.3.3 River Diversion for Paikhed and Chasmandva Barrage 359 6.3.4 Silt Factor 372 6.3.5
Assumed Retrogression at Maximum and Minimum Discharges 372
6.3.6 Pond Level 372 6.3.7 Waterway and HFL 372 6.3.8 Energy Dissipation Arrangement 373 6.3.9 Drainage and Anchorage Arrangements 373 6.3.10 Barrage Spillway Gates 373 6.3.10.1 Paikhed Barrage 373 6.3.10.2 Chasmandva Barrage 374 6.3.11 Barrage Spillway Stop Logs 374 6.3.11.1 Paikhed Barrage 374 6.3.11.2 Chasmandva Barrage 375 6.3.12 Gantry Crane for Stop Logs 376 6.3.12.1 Paikhed Barrage 376 6.3.12.2 Chasmandva Barrage 376 6.3.13 Road-Cum-Gantry Bridge, Trestle, etc. 376 6.3.14 Instruments and Remote Control 377 6.3.15 Diesel Generating Set 377 6.3.16 Weight Estimate for Gates and Operating Equipment 377 6.3.17 Protection Works 378 6.3.18 Seepage Control 378 6.3.19 Head Regulator, Service Gate and Stop Logs and Hoists 379 6.3.19.1 Paikhed Barrage 379 6.3.19.2 Chasmandva Barrage 380 6.4 Jheri – Paikhed Link Tunnel 381 6.4.1 Layout of Link Tunnel 381 6.4.2 Hydraulic Design of the Link Tunnel 381 6.4.3 Intake Structure at Jheri Reservoir 382 6.4.4 Jheri to Paikhed Link Tunnel Details 384

Para No. Particulars Page No.
6.4.5 Outfall Structure at Paikhed Reservoir 386 6.4.6
Hydro-Mechanical Equipment for Jheri-Paikhed Tunnel 386
6.4.6.1 Intake at Jheri reservoir 386 6.4.6.2 Outfall in Paikhed reservoir 387 6.4.6.3 Instruments and Remote Control 388 6.4.6.4 Diesel Generating Set 388 6.4.6.5
Weight Estimate for Gates and Operating Equipment 389
6.5 Canals 389 6.5.1 Description of Canal System 390 6.5.1.1 Canal Capacity 390 6.5.1.2 Canal Alignment 391 6.5.1.3 Details of Lining Provided 393 6.5.1.4 Transmission Losses 394 6.5.1.5 Sections and Reaches 394 6.5.1.6 Shape 394 6.5.1.7 Design Calculation for Adequacy of Canal Section 395 6.5.1.8 Canal Operation 400 6.5.2 Canal Structures 400 6.5.2.1 Cross Drainage Works / Regulators 400 6.5.2.1.1 Layout and Foundation 400 6.5.2.1.2 Cross Drainage 401 6.5.3
Study of Integrated Network of Canal System and its Operation 404
6.5.4 Description of Soil Profile along the Canal Alignment 404 6.5.5 Broad Outline of Canal Automation and Branch Canals upto 8
Cumec 404
6.6 Power Houses 404 6.6.1 6.6.1 Surface Power house at Paikhed dam 405 6.6.1.1 Intake Structure 407 6.6.1.2 Pressure Shaft /Penstock 407 6.6.1.3 Tail race pool / Tail race channel 408 6.6.1.4 Power Intake Service & Emergency Gate 408 6.6.1.5 Draft Tube Gates 409 6.6.2 6.6.2 Surface Power house at Chasmandva Dam 410 6.6.2.1 Intake Structure 411 6.6.2.2 Penstock 412 6.6.2.3 Tail Race Pool / Channel 412 6.6.2.4 Power Intake Service & Emergency Gate 412 6.6.2.5 Draft Tube Gates 413 6.6.3 Surface Power House at Chikkar Dam 413 6.6.3.1 Intake Structure 415 6.6.3.2 Penstock 415 6.6.3.3 Tail Race Pool /Channel 416 6.6.3.4 Power Intake Service & Emergency Gate 416 6.6.3.5 Draft Tube Gates 417 6.6.4 Surface Power House at Dabdar Dam 417 6.6.4.1 Intake Structure 419 6.6.4.2 Penstock 419 6.6.4.3 Tail Race Pool / Channel 420

Para No. Particulars Page No.
6.6.4.4 Power Intake Service & Emergency Gate 420 6.6.4.5 Draft Tube Gates 420 6.6.5 Surface Power House at Kelwan Dam 421 6.6.5.1 Intake Structure 423 6.6.5.2 Penstock 423 6.6.5.3 Tail Race Pool / Channel 423 6.6.5.4 Power Intake Service & Emergency Gate 424 6.6.5.5 Draft Tube Gates 424 6.6.6 Surface Power House of Kelwan Feeder Canal 425 6.6.6.1 Intake Structure 426 6.6.6.2 Penstock 427 6.6.6.3 Tail Race Pool 427 6.6.6.4 Feeder Canal Power House Intake Service & Emergency Gate 427 6.6.6.5 Feeder Canal Draft Tube Gates 428 6.7 Instrumentation 428 6.8 Other Studies 429 Chapter – 7
Reservoir
7.0 General 430 7.1 Jheri Reservoir 432 7.1.1 Fixation of Storage and Reservoir Levels - Approach–Criteria 432 7.1.1.1 Dead Storage Level (DSL) 434 7.1.1.2 Low Water Level / Minimum Draw-Down Level (MDDL) 435 7.1.1.3 Full Reservoir Level (FRL) 435 7.1.1.4 Maximum Water Level (MWL) 436 7.1.1.5 Maximum Backwater Level at FRL and MWL and its Effect,
Points to Which Backwater Effect is Felt. Maximum Distance of Such Points from the Axis of the Structure
436
7.1.1.6 Saddles along the Reservoir Rim 437 7.1.1.7 Fetch 437 7.1.1.8 Direction of Wind - Velocity of Wind - Wave Height - Free
Board-Top of Dam 437
7.1.2 Sedimentation Data and Studies 437 7.1.2.1 Rate of Sedimentation with Basis 439 7.1.2.2 Quantity of Sediment 440 7.1.2.3 Type and Shape of Reservoir 440 7.1.2.4 Sediment Studies – Jheri Reservoir 440 7.1.2.5 Sediment Distribution 441 7.1.3 Life of Reservoir in Years with Basis 446 7.1.4 Capacity 446 7.1.4.1 Capacities of Jheri Reservoir 446 7.1.4.2 Storage 446 7.1.4.3 Water Tightness of the Reservoir 447 7.1.4.4 Annual Losses 448 7.1.4.5 Flood Absorption 448 7.1.5 Effects on Sub Soil Water Table in the Adjoining Areas
Particularly Downstream of the Dam 448
7.1.6 Reservoir Rim Stability 448 7.1.7 Area of Submergence 449 7.1.7.1 At Maximum Water Level 449 7.1.7.2 At Full Reservoir Level 449

Para No. Particulars Page No.
7.1.7.3 Submergence Ratio - Submerged (Cultivated) Area / CCA 449 7.1.8 Land Acquisition-Property Submerged-Rehabilitation 449 7.1.8.1 Land Acquisition 449 7.1.8.2 Details of Property Submerged 450 7.1.8.3 Rehabilitation of Project Affected People 450 7.1.9 Recreation Facilities 452 7.1.10 Pisciculture 452 7.1.11 Need and Recommendation for Soil Conservation Measure in the
Catchment 453
7.2 Paikhed Reservoir 453 7.2.1 Fixation of Storage and Reservoir Levels - Approach–Criteria 453 7.2.1.1 Dead Storage Level (DSL) 455 7.2.1.2 Low Water Level / Minimum Draw-Down Level (MDDL) 455 7.2.1.3 Full Reservoir Level (FRL) 455 7.2.1.4 Maximum Water Level (MWL) 456 7.2.1.5 Maximum Backwater Level at FRL and MWL and its Effect,
Points to which Backwater Effect is Felt. Maximum Distance of such Points from the Axis of the Structure
456
7.2.1.6 Saddles along the Reservoir Rim 456 7.2.1.7 Fetch 457 7.2.1.8 Direction of Wind - Velocity of Wind - Wave Height - Free
Board-Top of Dam 457
7.2.2 Sedimentation Data and Studies 457 7.2.2.1 Rate of Sedimentation with Basis 458 7.2.2.2 Quantity of Sediment 458 7.2.2.3 Type and Shape of Reservoir 458 7.2.2.4 Sediment Studies –Paikhed Reservoir 458 7.2.2.5 Sediment Distribution 458 7.2.3 Life of Reservoir in Years with Basis 463 7.2.4 Capacity 464 7.2.4.1 Capacities of Paikhed Reservoir 464 7.2.4.2 Storage 464 7.2.4.3 Water Tightness of the Reservoir 465 7.2.4.4 Annual Losses 465 7.2.4.5 Flood Absorption 465 7.2.5 Effects on Sub Soil Water Table in the Adjoining Areas
Particularly Downstream of the Dam 466
7.2.6 Reservoir Rim Stability 466 7.2.7 Area of Submergence 466 7.2.7.1 At Maximum Water Level 466 7.2.7.2 At Full Reservoir Level 466 7.2.7.3 Submergence Ratio - Submerged (Cultivated) Area / CCA 466 7.2.8 Land Acquisition-Property Submerged-Rehabilitation 467 7.2.8.1 Land Acquisition 467 7.2.8.2 Details of Property Submerged 467 7.2.8.3 Rehabilitation of Project Affected People 468 7.2.9 Recreation Facilities 468 7.2.10 Pisciculture 468 7.2.11 Need and Recommendation for Soil Conservation Measure in the
Catchment 469
7.3 Chasmandva Reservoir 469

Para No. Particulars Page No.
7.3.1 Fixation of Storage and Reservoir Levels - Approach–Criteria 469 7.3.1.1 Dead Storage Level (DSL) 470 7.3.1.2 Low Water Level / Minimum Draw-Down Level (MDDL) 471 7.3.1.3 Full Reservoir Level (FRL) 471 7.3.1.4 Maximum Water Level (MWL) 471 7.3.1.5 Maximum Backwater Level at FRL and MWL and its Effect,
Points to Which Backwater Effect is Felt. Maximum Distance of Such Points from the Axis of the Structure
472
7.3.1.6 Saddles along the Reservoir Rim 472 7.3.1.7 Fetch 472 7.3.1.8 Direction of Wind - Velocity of Wind - Wave Height - Free
Board-Top of Dam 473
7.3.2 Sedimentation Data and Studies 473 7.3.2.1 Rate of Sedimentation with Basis 473 7.3.2.2 Quantity of Sediment 474 7.3.2.3 Type and Shape of Reservoir 474 7.3.2.4 Sediment Studies – Chasmandva Reservoir 474 7.3.2.5 Sediment Distribution 474 7.3.3 Life of Reservoir in Years with Basis 478 7.3.4 Capacity 478 7.3.4.1 Capacities of Chasmandva Reservoir 478 7.3.4.2 Storage 478 7.3.4.3 Water Tightness of the Reservoir 479 7.3.4.4 Annual Losses 480 7.3.4.5 Flood Absorption 480 7.3.5 Effects on Sub Soil Water Table in the Adjoining Areas
Particularly Downstream of the Dam 480
7.3.6 Reservoir Rim Stability 480 7.3.7 Area of Submergence 481 7.3.7.1 At Maximum Water Level 481 7.3.7.2 At Full Reservoir Level 481 7.3.7.3 Submergence Ratio - Submerged (Cultivated) Area / CCA 481 7.3.8 Land Acquisition-Property Submerged-Rehabilitation 481 7.3.8.1 Land Acquisition 481 7.3.8.2 Details of Property Submerged 481 7.3.8.3 Rehabilitation of Project Affected People 482 7.3.9 Recreation Facilities 482 7.3.10 Pisciculture 483 7.3.11 Need and Recommendation for Soil Conservation Measure in the
Catchment 483
7.4 Chikkar Reservoir 483 7.4.1 Fixation of Storage and Reservoir Levels - Approach–Criteria 483 7.4.1.1 Dead Storage Level (DSL) 485 7.4.1.2 Low Water Level / Minimum Draw-Down Level (MDDL) 485 7.4.1.3 Full Reservoir Level (FRL) 485 7.4.1.4 Maximum Water Level (MWL) 486 7.4.1.5 Maximum Backwater Level at FRL and MWL and its Effect,
Points to which Backwater Effect is Felt. Maximum Distance of such Points from the Axis of the Structure
486
7.4.1.6 Saddles along the Reservoir Rim 486 7.4.1.7 Fetch 487

Para No. Particulars Page No.
7.4.1.8 Direction of Wind - Velocity of Wind - Wave Height - Free Board-Top of Dam
487
7.4.2 Sedimentation Data and Studies 487 7.4.2.1 Rate of Sedimentation with Basis 488 7.4.2.2 Quantity of Sediment 488 7.4.2.3 Type and Shape of Reservoir 488 7.4.2.4 Sediment Studies –Chikkar Reservoir 488 7.4.2.5 Sediment Distribution 488 7.4.3 Life of Reservoir in Years with Basis 492 7.4.4 Capacity 493 7.4.4.1 Capacities of Chikkar Reservoir 493 7.4.4.2 Storage 493 7.4.4.3 Water Tightness of the Reservoir 494 7.4.4.4 Annual Losses 494 7.4.4.5 Flood Absorption 494 7.4.5 Effects on Sub Soil Water Table in the Adjoining Areas
Particularly Downstream of the Dam 495
7.4.6 Reservoir Rim Stability 495 7.4.7 Area of Submergence 495 7.4.7.1 At Maximum Water Level 495 7.4.7.2 At Full Reservoir Level 495 7.4.7.3 Submergence Ratio - Submerged (Cultivated) Area / CCA 495 7.4.8 Land Acquisition-Property Submerged-Rehabilitation 496 7.4.8.1 Land Acquisition 496 7.4.8.2 Details of Property Submerged 496 7.4.8.3 Rehabilitation of Project Affected People 497 7.4.9 Recreation Facilities 497 7.4.10 Pisciculture 497 7.4.11 Need and Recommendation for Soil Conservation Measure in the
Catchment 498
7.5 Dabdar Reservoir 498 7.5.1 Fixation of Storage and Reservoir Levels - Approach–Criteria 498 7.5.1.1 Dead Storage Level (DSL) 499 7.5.1.2 Low Water Level / Minimum Draw-Down Level (MDDL) 500 7.5.1.3 Full Reservoir Level (FRL) 500 7.5.1.4 Maximum Water Level (MWL) 500 7.5.1.5 Maximum Backwater Level at FRL and MWL and its Effect,
Points to Which Backwater Effect is Felt. Maximum Distance of Such Points from the Axis of the Structure
501
7.5.1.6 Saddles along the Reservoir Rim 501 7.5.1.7 Fetch 501 7.5.1.8 Direction of Wind - Velocity of Wind - Wave Height - Free
Board-Top of Dam 501
7.5.2 Sedimentation Data and Studies 502 7.5.2.1 Rate of Sedimentation With Basis 502 7.5.2.2 Quantity of Sediment 502 7.5.2.3 Type and Shape of Reservoir 503 7.5.2.4 Sediment Studies – Dabdar Reservoir 503 7.5.2.5 Sediment Distribution 503 7.5.3 Life of Reservoir in Years with Basis 508 7.5.4 Capacity 508

Para No. Particulars Page No.
7.5.4.1 Capacities of Dabdar Reservoir 508 7.5.4.2 Storage 508 7.5.4.3 Water Tightness of the Reservoir 509 7.5.4.4 Annual Losses 509 7.5.4.5 Flood Absorption 509 7.5.5 Effects on Sub Soil Water Table in the Adjoining Areas
Particularly Downstream of the Dam 510
7.5.6 Reservoir Rim Stability 510 7.5.7 Area of Submergence 510 7.5.7.1 At Maximum Water Level 510 7.5.7.2 At Full Reservoir Level 510 7.5.7.3 Submergence Ratio - Submerged (Cultivated) Area / CCA 510 7.5.8 Land Acquisition-Property Submerged-Rehabilitation 511 7.5.8.1 Land Acquisition 511 7.5.8.2 Details of Property Submerged 511 7.5.8.3 Rehabilitation of Project Affected People 512 7.5.9 Recreation Facilities 512 7.5.10 Pisciculture 512 7.5.11 Need and Recommendation for Soil Conservation Measure in the
Catchment 513
7.6 Kelwan Reservoir 513 7.6.1 Fixation of Storage and Reservoir Levels - Approach–Criteria 513 7.6.1.1 Dead Storage Level (DSL) 514 7.6.1.2 Low Water Level / Minimum Draw-Down Level (MDDL) 515 7.6.1.3 Full Reservoir Level (FRL) 515 7.6.1.4 Maximum Water Level (MWL) 515 7.6.1.5 Maximum Backwater Level at FRL and MWL and its Effect,
Points to which Backwater Effect is Felt. Maximum Distance of such Points from the Axis of the Structure
516
7.6.1.6 Saddles along the Reservoir Rim 516 7.6.1.7 Fetch 516 7.6.1.8 Direction of Wind - Velocity of Wind - Wave Height - Free
Board-Top of Dam 516
7.6.2 Sedimentation Data and Studies 517 7.6.2.1 Rate of Sedimentation with Basis 517 7.6.2.2 Quantity of Sediment 517 7.6.2.3 Type and Shape of Reservoir 518 7.6.2.4 Sediment Studies –Kelwan Reservoir 518 7.6.2.5 Sediment Distribution 518 7.6.3 Life of Reservoir in Years with Basis 523 7.6.4 Capacity 523 7.6.4.1 Capacities of Kelwan Reservoir 523 7.6.4.2 Storage 523 7.6.4.3 Water Tightness of the Reservoir 524 7.6.4.4 Annual Losses 524 7.6.4.5 Flood Absorption 525 7.6.5 Effects on Sub Soil Water Table in the Adjoining Areas
Particularly Downstream of the Dam 525
7.6.6 Reservoir Rim Stability 525 7.6.7 Area of Submergence 525 7.6.7.1 At Maximum Water Level 525

Para No. Particulars Page No.
7.6.7.2 At Full Reservoir Level 525 7.6.7.3 Submergence Ratio - Submerged (Cultivated) Area / CCA 526 7.6.8 Land Acquisition-Property Submerged-Rehabilitation 526 7.6.8.1 Land Acquisition 526 7.6.8.2 Details of Property Submerged 526 7.6.8.3 Rehabilitation of Project Affected People 527 7.6.9 Recreation Facilities 527 7.6.10 Pisciculture 527 7.6.11 Need and Recommendation for Soil Conservation Measure in the
Catchment 528
7.7 Ukai Reservoir (Existing) 528 7.8 Paikhed Barrage 529 7.9 Chasmandva Barrage 529 Chapter – 8
Power
8.0 General 530 8.1 Present Status of Power Development in Maharashtra and
Gujarat States 530
8.1.1 Available Generating Capacity (MW) in the State/Region from different sources with location, category wise.
530
8.1.2 Present Status of Utilisation of Power Produced 535 8.1.3 Shortages / Surpluses and Import / Export of Power from/to the
neighbouring States/Regions 536
8.1.4 Transmission System and Operation Voltages 537 8.2 Power requirements 538 8.2.1 Existing 538 8.2.2 Anticipated Requirements of energy (MU) and peak load (MW) 538 8.3 Future Plans of Power Development 538 8.4 Assessment of the Power Benefits from Par-Tapi-Narmada Link
Project 541
8.4.1 Paikhed Dam Power House 543 8.4.1.1 Power Potential Study 543 8.4.1.1.1 Type of Project 543 8.4.1.1.2 Hydrology, Sedimentation Studies and Criteria for Fixing up
Reservoir Levels 544
8.4.1.1.3 Reservoir Operation 545 8.4.1.1.4 Simulation Studies 545 8.4.1.1.5 Firm Power 546 8.4.1.1.6 Installed Capacity 546 8.4.1.1.7 Scope for Seasonal/Secondary Power Generation 548 8.4.1.1.8 Size and Type of Generating Units 549 8.4.1.1.9 Number of Generating Units 549 8.4.1.2 Electrical & Mechanical Works 549 8.4.1.2.1 Turbine 550 8.4.1.2.2 Francis Turbine and Associated Equipments 551 8.4.1.2.3 Inlet Valves 552 8.4.1.2.4 Governing Equipment 553 8.4.1.2.5 Pressure Oil System 553 8.4.1.2.6 Generator 554 8.4.1.2.7 Electrical Control and Protection Equipments 557 8.4.1.2.8 Material Handling in the Power House 558

Para No. Particulars Page No.
8.4.1.2.9 Auxiliary Power Supply 558 8.4.1.2.10 Cables and Boxes 559 8.4.1.2.11 Station Drainage System 559 8.4.1.2.12 Dewatering System 559 8.4.1.2.13 Ventilation System 560 8.4.1.2.14 Draft Tube Gate 560 8.4.1.2.15 Tailrace Channel 560 8.4.1.2.16 Switchyard 560 8.4.1.2.17 Grounding Systems 561 8.4.1.2.18 Transmission and Distribution Works 561 8.4.1.2.19 Drawings 562 8.4.1.2.20 Cost Estimate (S-Power Plant) 562 8.4.2 Chasmandva Dam Power House 563 8.4.2.1 Power Potential Study 563 8.4.2.1.1 Type of Project 563 8.4.2.1.2 Hydrology, Sedimentation Studies and Criteria for Fixing up
Reservoir Levels 563
8.4.2.1.3 Reservoir Operation 565 8.4.2.1.4 Simulation Studies 565 8.4.2.1.5 Firm Power 565 8.4.2.1.6 Installed Capacity 565 8.4.2.1.7 Scope For Seasonal/Secondary Power Generation 567 8.4.2.1.8 Size and Type of Generating Units 568 8.4.2.1.9 Number of Generating Units 568 8.4.2.2 Electrical & Mechanical Works 568 8.4.2.2.1 Turbine 569 8.4.2.2.2 Francis Turbine and Associated Equipments 570 8.4.2.2.3 Inlet Valves 571 8.4.2.2.4 Governing Equipment 572 8.4.2.2.5 Pressure Oil System 573 8.4.2.2.6 Generator 573 8.4.2.2.7 Electrical Control And Protection Equipments 576 8.4.2.2.8 Material Handling in the Power House 577 8.4.2.2.9 Auxiliary Power Supply 577 8.4.2.2.10 Cables and Boxes 577 8.4.2.2.11 Station Drainage System 577 8.4.2.2.12 Ventilation System 578 8.4.2.2.13 Draft Tube Gate 578 8.4.2.2.14 Tailrace Channel 578 8.4.2.2.15 Switchyard 578 8.4.2.2.16 Grounding Systems 579 8.4.2.2.17 Transmission and Distribution Works 579 8.4.2.2.18 Drawings 580 8.4.2.2.19 Cost Estimate (S-Power Plant) 580 8.4.3 Chikkar Dam Power House 581 8.4.3.1 Power Potential Study 581 8.4.3.1.1 Type of Project 581 8.4.3.1.2 Hydrology, Sedimentation Studies and Criteria for Fixing up
Reservoir Levels 581
8.4.3.1.3 Reservoir Operation 583 8.4.3.1.4 Simulation Studies 583

Para No. Particulars Page No.
8.4.3.1.5 Firm Power 583 8.4.3.1.6 Installed Capacity 583 8.4.3.1.7 Scope for Seasonal/Secondary Power Generation 585 8.4.3.1.8 Size and Type of Generating Units 585 8.4.3.1.9 Number of Generating Units 585 8.4.3.2 Electrical & Mechanical Works 586 8.4.3.2.1 Turbine 586 8.4.3.2.2 Francis Turbine and Associated Equipments 587 8.4.3.2.3 Inlet Valves 589 8.4.3.2.4 Governing Equipment 590 8.4.3.2.5 Pressure Oil System 590 8.4.3.2.6 Generator 590 8.4.3.2.7 Electrical Control And Protection Equipments 593 8.4.3.2.8 Material Handling in the Power House 594 8.4.3.2.9 Auxiliary Power Supply 594 8.4.3.2.10 Cables and Boxes 595 8.4.3.1.11 Station Drainage System 595 8.4.3.2.12 Ventilation System 595 8.4.3.2.13 Draft Tube Gate 595 8.4.3.2.14 Tailrace Channel 595 8.4.3.2.15 Switchyard 596 8.4.3.2.16 Grounding Systems 596 8.4.3.2.17 Transmission and Distribution Works 596 8.4.3.2.18 Drawings 598 8.4.3.2.19 Cost Estimate (S-Power Plant) 598 8.4.4 Dabdar Dam Power House 598 8.4.4.1 Power Potential Study 598 8.4.4.1.1 Type of Project 598 8.4.4.1.2 Hydrology, Sedimentation Studies and Criteria for Fixing up
Reservoir Levels 599
8.4.4.1.3 Reservoir Operation 600 8.4.4.1.4 Simulation Studies 600 8.4.4.1.5 Firm Power 601 8.4.4.1.6 Installed Capacity 601 8.4.4.1.7 Scope For Seasonal/Secondary Power Generation 603 8.4.4.1.8 Size and Type of Generating Units 603 8.4.4.1.9 Number of Generating Units 603 8.4.4.2 Electrical & Mechanical Works 603 8.4.4.2.1 Turbine 604 8.4.4.2.2 Francis Turbine and Associated Equipments 605 8.4.4.2.3 Inlet Valves 606 8.4.4.2.4 Governing Equipment 607 8.4.4.2.5 Pressure Oil System 607 8.4.4.2.6 Generator 607 8.4.4.2.7 Electrical Control And Protection Equipments 610 8.4.4.2.8 D.C. System 611 8.4.4.2.9 Fire Protection 611 8.4.4.2.10 Material Handling in the Power House 612 8.4.4.1.11 Auxiliary Power Supply 612 8.4.4.2.12 Cables and Boxes 612 8.4.4.2.13 Station Drainage System 612

Para No. Particulars Page No.
8.4.4.2.14 Ventilation System 612 8.4.4.2.15 Draft Tube Gate 613 8.4.4.2.16 Tailrace Channel 613 8.4.4.2.17 Switchyard 613 8.4.4.2.18 Grounding Systems 613 8.4.4.2.19 Transmission and Distribution Works 614 8.4.4.2.20 Drawings 615 8.4.4.2.21 Cost Estimate (S-Power Plant) 615 8.4.5 Kelwan Dam Power House 616 8.4.5.1 Power Potential Study 616 8.4.5.1.1 Type of Project 616 8.4.5.1.2 Hydrology, Sedimentation Studies and Criteria for Fixing up
Reservoir Levels 616
8.4.5.1.3 Reservoir Operation 618 8.4.5.1.4 Simulation Studies 618 8.4.5.1.5 Firm Power 618 8.4.5.1.6 Installed Capacity 618 8.4.5.1.7 Scope For Seasonal/Secondary Power Generation 620 8.4.5.1.8 Size and Type of Generating Units 620 8.4.5.1.9 Number of Generating Units 620 8.4.5.2 Electrical & Mechanical Works 620 8.4.5.2.1 Turbine 621 8.4.5.2.2 Francis Turbine and Associated Equipments 622 8.4.5.2.3 Inlet Valves 623 8.4.5.2.4 Governing Equipment 624 8.4.5.2.5 Pressure Oil System 624 8.4.5.2.6 Generator 625 8.4.5.2.7 Electrical Control And Protection Equipments 627 8.4.5.2.8 D. C. System 628 8.4.5.2.9 Fire Protection 629 8.4.5.2.10 Material Handling in the Power House 629 8.4.5.2.11 Auxiliary Power Supply 629 8.4.5.2.12 Cables and Boxes 629 8.4.5.1.13 Station Drainage System 629 8.4.5.2.14 Ventilation System 630 8.4.5.2.15 Draft Tube Gate 630 8.4.5.2.16 Tailrace Channel 630 8.4.5.2.17 Switchyard 630 8.4.5.2.18 Grounding Systems 630 8.4.5.2.19 Transmission and Distribution Works 631 8.4.5.2.20 Power evacuation 631 8.4.5.2.21 Step-up Transformers for the Switchyard 631 8.4.5.2.22 Transmission Lines 632 8.4.5.2.23 Drawings 632 8.4.5.2.24 Cost Estimate (S-Power Plant) 632 8.4.6 Power House on Kelwan Feeder Canal (Canal drop at RD 5.80
km) 633
8.4.6.1 Power Potential Study 634 8.4.6.1.1 Parameters used in Power Potential Study 634 8.4.6.1.2 Net Discharge 634

Para No. Particulars Page No.
8.4.6.1.3 Firm Power 635 8.4.6.1.4 Installed Capacity 635 8.4.6.1.5 Scope for Seasonal/Secondary Power Generation 636 8.4.6.1.6 Size and Type of Generating Units 636 8.4.6.1.7 Number of Generating Units 637 8.4.6.2 Electrical & Mechanical Works 637 8.4.6.2.1 Turbine 637 8.4.6.2.2 Kaplan Turbine and Associated Equipments 638 8.4.6.2.3 Inlet Valves 639 8.4.6.2.4 Governing Equipment 640 8.4.6.2.5 Pressure Oil System 641 8.4.6.2.6 Generator 641 8.4.6.2.7 Electrical Control And Protection Equipments 644 8.4.6.2.8 Station Drainage System 646 8.4.6.2.9 Dewatering System 646 8.4.6.2.10 Ventilation System 646 8.4.6.1.11 Draft Tube Gate 646 8.4.6.2.12 Switchyard 647 8.4.6.2.13 Grounding Systems 647 8.4.6.2.14 Transmission and Distribution Works 648 8.4.6.2.15 Drawings 649 8.4.6.2.16 Cost Estimate (S-Power Plant) 649
Chapter-9 Irrigation Planning and Command Area
Development
9.0 General 650 9.1 Existing/Proposed Irrigation Facilities in the Proposed Project
Command Area 650
9.1.1 Proposed Irrigation Facilities in the Proposed Project Command Area
651
9.1.1.1 Command Area Proposed En-Route the Link Canal 652 9.1.1.2 Command Area of Projects suggested by Government of Gujarat. 657 9.1.1.3 Command area falling in Tribal area on right side of canal by lift. 658 9.1.1.4 Command area in the vicinity of six proposed reservoirs by Lift.
659
9.1.1.5 Command area of Tribal area on right side of Narmada Main canal by lift.
660
9.1.1.6 Command area of Miyagam Branch canal of Narmada Canal System
661
9.2 Existing Cropping Pattern 662 9.2.1 Existing Area Under Rain-Fed Cultivation 662 9.3 Soil Surveys 664 9.3.1 Soil Capability Classification 664 9.3.2 Land Irrigability Classification 665 9.4 Agro-Climatic Conditions 666 9.4.1 Rainfall 666 9.4.2 Temperature, Relative Humidity, Wind Speed and Cloud Cover 667 9.4.3 Frost free days 668 9.5 Proposed cropping pattern 668 9.5.1 Proposed irrigation facilities 671 9.5.1.1 En-route command 671

Para No. Particulars Page No.
9.5.1.2 Command area proposed under Feeder Canals 672 9.5.1.3 Command Area of Narmada Main Canal (NMC) of SSP to be
taken over by the Link Canal 672
9.5.2 Scope for double and multiple cropping pattern and change in cropping pattern on the basis of latest available data
674
9.5.2.1 Soils 674 9.5.2.1.1 Agro-climatic conditions 674 9.5.2.2 Water and other inputs like Fertilizers, Weedicides and
Pesticides 674
9.5.2.3 Irrigated crops in the adjoining areas 674 9.5.2.4 Attitude of farmers towards modern irrigated agricultural
practices 675
9.6 Crop water requirement 675 9.6.1 Monthly water requirement for irrigation 678 9.7 Water Planning 682 9.7.1 Surface water 682 9.7.1.1 Total irrigation demand of the link project 682 9.7.1.2 Domestic and Industrial use in the Periphery of Reservoirs 682 9.7.1.2.1 Supply of Drinking water for villages and filling of village
andPanchayat tanks 682
9.7.1.4 Environmental Releases 682 9.7.1.5 Evaporation losses 683 9.7.1.6 Total water demand of the link project 683 9.7.1.7 Working Tables 684 9.7.1.8 Designed head discharge of canal systems 685 9.7.2 Ground water 686 9.7.2.1 Ground water quality 686 9.7.2.2 Conjunctive Use/ground water support 687 9.8 Command Area Drainage 687 9.9 Water Course / Field Channels 687 9.10 Water Management 688 9.10.1 Review and evaluation of existing system of operation and
distribution in the command and/or in some adjoining projects, if any
688
9.10.2 Proposals for Participatory Irrigation Management including formation of water users Association
688
9.10.3 Scope of introduction of modern technology like sprinklers, drip irrigation etc
689
9.10.4 Existing practice of Department of Agriculture for popularizing micro irrigation
689
9.10.5 Facilities for training the operation and maintenance personnel at different levels of management & farmers-adequacy of existing facilities and proposals for augmentation
690
9.10.6 Existing extension activity & proposals for its improvement 690 9.11 Command Area 691 9.11.1 Command Area Details 691 9.11.1.1 Location 691 9.11.1.2 Classification of land (forest, grass land, cultivable land,
cultivable waste, barren land) 692
9.11.1.3 Size of land holding 693 9.11.1.4 Climate of Command Area 693

Para No. Particulars Page No.
9.11.1.5 Irrigation 694 9.11.1.6 Socio-economic Aspects 695 9.11.1.7 Infrastructure facilities 696
9.11.1.8 Topography and soils 698 9.11.1.9 Ground Water and Drainage 699 9.11.1.10 Agriculture 700 9.11.1.11 Farmers’ attitude towards improved agricultural practices 702 9.11.1.12 Identification of problems in en-route command area 703 9.11.1.13 Financial problems 704 9.11.1.14 Proposed cropping pattern with justification based on land
irrigability classification, agro climatic conditions developed irrigated cropping pattern in adjoining project / area etc.
704
9.11.1.15 Land development work proposals 704 9.11.1.16 Ayacut roads 705 9.11.1.17 Benefits 705 9.11.2 Command area proposed under Feeder Canals 708 9.11.2.1 Benefits 708 9.11.3 Command Area of Projects Proposed by Government of Gujrat 710 9.11.4 Command of Tribal area enroute right side of canal, Tribal area
in vicinity of reservoirs and Tribal area on right side of Narmada Main canal
713
9.11.4.1 Benefits 713 9.11.5 Command Area of Narmada Main Canal (NMC) of SSP to
betaken over by the Link Canal – dditional Irrigation inSaurashtraRegion (Target Command) and Benefits
715
9.11.5.1 Benefits 715 Chapter - 10
Construction Program, Man Power and Plant Planning
10.0 General 718 10.1 Objective of the Project 718 10.2 Main Project Components 719 10.3 Basis for Study 721 10.3.1 General 721
10.3.2 Construction Material Sources 722 10.3.3 Basic Considerations 724 10.3.3.1 Scheduled Working Hours 724 10.3.3.2 Construction Period 725 10.4 Construction Methodology and Equipment planning 726 10.4.1 River Diversion Works 726 10.4.2 Jheri Dam 726 10.4.2.1 Concrete Face Rock-Fill Dam (Jheri Dam) 726 10.4.2.1(a) Surface Excavation 727 10.4.2.1(b) Fill Placement 729
10.4.2.1(c) List of Major Construction Plant and Equipment for Jheri CFRD Dam
734
10.4.2.1(d) Construction Programme 735 10.4.2.2 Concrete Dam (Jheri Dam) 736 10.4.2.2(a) Surface Excavations 737 10.4.2.2(b) Concreting 738

Para No. Particulars Page No.
10.4.2.2(c) List of Major Construction Plant and Equipment for Concrete Dam
738
10.4.2.2(d) Construction Programme 739 10.4.3 Paikhed Dam 740 10.4.3.1 Concrete Face Rock-Fill Dam (Paikhed Dam) 740 10.4.3.1(a) Surface Excavation 741 10.4.3.1 (b) Fill Placement 742 10.4.3.1(c) List of Major Construction Plant and Equipment for CFRD Dam 747 10.4.3.1 (d) Construction Programme 748 10.4.3.2 Concrete Dam (Paikhed Dam) 748 10.4.3.2 (a) Surface Excavations 749 10.4.3.2 (b) Concreting 750 10.4.3.2(c ) List of Major Construction Plant and Equipment for Concrete
Dam 750
10.4.3.2(d) Construction Programme 751 10.4.3.3 Paikhed Dam Power House 752 10.4.3.3(a) Excavation and Concreting 752 10.4.3.3(b) List of Major Construction Plant and Equipment for Power
House 753
10.4.3.3(c ) Construction Programme 753 10.4.4 Chasmandva Dam 753 10.4.4.1 Concrete Face Rock-Fill Dam (Chasmandva) 753 10.4.4.1 (a) Surface Excavation 754 10.4.4.1 (b) Fill Placement 756 10.4.4.1(c) List of Major Construction Plant and Equipment for CFRD Dam 760 10.4.4.1(d) Construction Programme 761 10.4.4.2 Concrete Dam (Chasmandva) 762 10.4.4.2 (a) Surface Excavations 762 10.4.4.2 (b) Concreting 763 10.4.4.2(c) List of Major Construction Plant and Equipment for Concrete
Dam 764
10.4.4.2 (d) Construction Programme 765 10.4.4.3 Chasmandva Dam Power House 765 10.4.4.3(a) Excavation and Concreting 765 10.4.4.3(b) List of Major Construction Plant and Equipment for Power
House 766
10.4.4.3 (c) Construction Programme 766 10.4.5 Chikkar Dam 767 10.4.5.1 Concrete Face Rock-Fill Dam (Chikkar) 767 10.4.5.1 (a) Surface Excavation 768 10.4.5.1 (b) Fill Placement 769 10.4.5.1(c) List of Major Construction Plant and Equipment for CFRD Dam 775 10.4.5.1(d) Construction Programme 775 10.4.5.2 Concrete Dam (Chikkar) 776 10.4.5.2 (a) Surface Excavations 776 10.4.5.2 (b) Concreting 777 10.4.5.2(c ) List of Major Construction Plant and Equipment for Concrete
Dam 778
10.4.5.2 (d) Construction Programme 779 10.4.5.3 Chikkar Dam Power House 779 10.4.5.3(a) Excavation and Concreting 779

Para No. Particulars Page No.
10.4.5.3(b) List of Major Construction Plant and Equipment for Power House
780
10.4.5.3(c ) Construction Programme 781 10.4.6 Dabdar Dam 781 10.4.6.1 Concrete Face Rock-Fill Dam (Dabdar) 781 10.4.6.1(a) Surface Excavation 782 10.4.6.1 (b) Fill Placement 783 10.4.6.1(c) List of Major Construction Plant and Equipment for CFRD Dam 788 10.4.6.1 (d) Construction Programme 789 10.4.6.2 Concrete Dam (Dabdar) 790 10.4.6.2 (a) Surface Excavations 790 10.4.6.2 (b) Concreting 791 10.4.6.2 (c) List of Major Construction Plant and Equipment for Concrete
Dam 792
10.4.6.2 (d) Construction Programme 793 10.4.6.3 Dabdar Dam Power House 793 10.4.6.3(a) Excavation and Concreting 793 10.4.6.3 (b )
List of Major Construction Plant and Equipment for Power House
794
10.4.6.3 (c) Construction Programme 794 10.4.7 Kelwan Dam 795 10.4.7.1 Concrete Face Rock-Fill Dam (Kelwan Dam) 795 10.4.7.1 (a) Surface Excavation 796 10.4.7.1 (b) Fill Placement 797 10.4.7.1(c) List of Major Construction Plant and Equipment for CFRD Dam 802 10.4.7.1 (d) Construction Programme 803 10.4.7.2 Concrete Dam (Kelwan Dam) 804 10.4.7.2 (a) Surface Excavations 804 10.4.7.2(b) Concreting 805 10.4.7.2(c ) List of Major Construction Plant and Equipment for Concrete
Dam 806
10.4.7.2 (d) Construction Programme 807 10.4.7.3 Kelwan Dam Power House 807 10.4.7.3(a) Excavation and Concreting 807 10.4.7.3(b) List of Major Construction Plant and Equipment for Power
House 808
10.4.7.3 (c) Construction Programme 808 10.4.8 Barrages 809 10.4.8(a) Paikhed Barrage & Head Regulator 809 10.4.8(a).1 Surface Excavation 809 10.4.8(a).2 Concreting 810 10.4.8(a).3 List of Major Construction Plant and Equipment for Paikhed
Barrage 810
10.4.8(b) Chasmandva Barrage & Head Regulator 811 10.4.8(b).1 Surface Excavation 811 10.4.8(b).2 Concreting 812 10.4.8(b).3 List of Major Construction Plant and Equipment
for Chasmandva Barrage 813
10.4.9.1(a) Chasmandva Canal 814 10.4.9.1(b) List of Major Construction Plant and Equipment for Chasmandva
Feeder Canal 815

Para No. Particulars Page No.
10.4.9.1 (c) Construction Programme 815 10.4.9.2(a) Chikkar - Dabdar feeder canal 816 10.4.9.2(b)
List of Major Construction Plant and Equipment r for Chikkar feeder canal
817
10.4.9.2 (c) Construction Programme 818 10.4.9.3(a) Dabdar Feeder Canal 819 10.4.9.3(b) List of Major Construction Plant and Equipment r
for Dabdar Feeder Canal 820
10.4.9.3 (c) Construction Programme 821 10.4.9.4(a) Kelwan Feeder Canal 821 10.4.9.4(b) List of Major Construction Plant and
Equipmentnt for Kelwan Feeder Canal 823
10.4.9.4(c) Construction Programme 823 10.4.10 Kelwan Dam Power House at the drop of Feeder Canal from
Kelwan Reservoir 823
10.4.10(a) Excavation and Concreting 823 10.4.10(b) List of Major Construction Plant and Equipment for Power
House 824
10.4.10 (c) Construction Programme 824 10.4.11(a) Par-Tapi Link Canal 825 10.4.11 (b) List of Major Construction Plant and Equipment r
for Par-Tapi Link Canal 826
10.4.11 (c) Construction Programme 827 10.4.12(a) Tapi - Narmada Link Canal 828 10.4.12(b) List of Major Construction Plant and
Equipmentnt for Tapi-Narmada Canal 830
10.4.12(c ) Construction Programme 831 10.4.13(a) Jheri to Paikhed Link Tunnel 831 10.4.13(b) Concrete Lining 834 10.4.13(c) List of Major Construction Plant & Equipment for Construction
of Jheri- Paikhed Link Tunnel 835
10.4.13 (d) Construction Programme 836 10.4.14 Tunnels in Main Canal 836 10.4.14(a) Excavation of Tunnel 836 10.4.14 (b) Concrete Lining 838 10.4.14 (c) List of Major Construction Plant & Equipment for
Construction of tunnel in Main Canal 840
10.4.14(d) Construction Program 841 10.5 Construction Program & Deployment Schedule 841 10.6 Manpower Planning 841 10.6.1 Organisation Setup 841 10.7 Year Wise Allocation of Cost 843
Chapter - 11 Environment Impact Assessment and
Environment Management Plan
11.0 General 844 11.1 The Proposed Project 844 11.1.1 Project Background 844 11.1.2 Project Justification 846

Para No. Particulars Page No.
11.1.3 Project Description 847 11.2 Study Area 850 11.3 Legal Status of the Project 850 11.4 Baseline Environmental Data 852 11.4.1 Air Environment 853 11.4.1.1 Ambient Air Quality 853 11.4.1.2 Noise Environment 855 11.4.1.3 Meteorology 856 11.4.2 Water Quality 857 11.4.2.1 Surface Water Quality Monitoring 857 11.4.2.2 Ground Water Quality Monitoring 861 11.4.3 Land Environment 862 11.4.3.1 Land Use 862 11.4.3.2 Mineral Deposits 864 11.4.3.3 Historic / Archaeological Monuments 864 11.4.3.4 Geology 865 11.4.3.5 Soils 866 11.4.4 Terrestrial Ecology 871 11.4.4.1 Delineation of Flora in Study Area 871 11.4.4.2 Status of Fauna 874 11.4.4.3 Status of Fish Fauna 874 11.4.5 Public Health Facilities 875 11.4.6 Drinking Water Supply 878 11.5 Environmental Impact Assessment 878 11.5.1 Impacts on Air Environment 879 11.5.1.1 Impact on Air Quality 879 11.5.1.2 Impacts on Noise Environment 880 11.5.2 Impacts on Water Resources and Quality 880 11.5.3 Impacts on Land Environment 885 11.5.4 Impact on Biological Environment 888 11.5.4.1 Terrestrial Environment 888 11.5.4.1.1 Impacts on Forest Cover 888 11.5.4.2 Impacts on Wildlife 889 11.5.4.3 Impacts on Aquatic Ecology 889 11.5.4.4 Impact on Socio-economic Environment 891 11.5.5 Impacts On Micro Climate 893 11.5.6 Greenhouse Gas Emission 893 11.6 Environmental Management Plan 894 11.6.1 Pollution Control at Construction Sites 894 11.6.1.1 Air Population Control 894 11.6.1.2 Noise Control Measures 897 11.6.2 Water Pollution 898 11.6.3 Land Management Plan 898 11.6.3.1 Disposal of Muck and Reclamation of Muck Disposal Sites 898 11.6.3.2 Restoration Plan for Quarry sites 899 11.6.3.3 Restoration of Colony and Office Complex 903 11.6.4 Biodiversity Conservation and Management Plan 904 11.6.4.1 Compensatory Afforestation 904 11.6.4.2 Biodiversity Management Plan 904 11.6.5 Green Belt Development Plan 911 11.6.6 Environmental Management in Labour Camps 912

Para No. Particulars Page No.
11.6.7 Public Health 913 11.6.8 Catchment Area Treatment Plan 915 11.6.8.1 Approach for the study 915 11.6.8.2 Estimate of Soil loss using Silt Yield Index Method 916 11.6.8.3 Catchment Area Treatment measures 916 11.6.8.4 Silt Transfer 921 11.6.9 Disaster Management Plan 922 11.6.10 Energy Conservation Measures 923 11.6.10.1 Energy Conservation during Construction Phase 924 11.6.10.2 Energy Conservation during Operation Phase 924 11.6.10.3 Budget 925 11.6.11 Environmental Monitoring Programme 925 11.6.12 Cost of Environmental Management Plan 927 Chapter - 12
Socio-Economic Studies and Resettlement and Rehabilitation Plan
12.0 Introduction 929 12.1 Socio-Economic Profile and Survey 930 12.1.1 Regional Profile from the Available Secondary Data 931 12.1.1.1 Demography 933 12.1.1.2 Agriculture 933 12.1.1.3 Literacy 934 12.1.2 Salient Features of the Link 934 12.1.3 Sample Design and Methodology 935 12.1.3.1 Selection of Villages 936 12.1.3.2 Selection of Households 937 12.1.4 Questionnaire 937 12.1.5 Profile of the Study Area 937 12.1.5.1 Jheri Reservoir 940 12.1.5.2 Paikhed Reservoir 946 12.1.5.3 Chasmandva Reservoir 953 12.1.5.4 Chikkar Reservoir 958 12.1.5.5 Dabdar Reservoir 965 12.1.5.6 Kelwan Reservoir 972 12.1.6 Perception about the Project 981 12.2 Impact of Par-Tapi-Narmada Link 981 12.2.1 Short-Term Impact of Link Project 982 12.2.2 Long-Term Impact of Link Project 982 12.2.3 Social Impact Assessment 983 12.2.3.1 Impacts Due to Land Acquisition 983 12.3 Rehabilitation and Resettlement 984 12.3.1 Assessment of Economic Loss Due to Displacement 985 12.3.1.1 Land under Submergence 985 12.3.1.2 Project Affected Community 986 12.3.2 People’s Perception towards Rehabilitation Package 986 12.3.3 Rehabilitation and Resettlement Package 987 12.3.3.1 Measures for Resettlement 987 12.3.3.2 Measures for Rehabilitation 995 12.3.4 Local Area Development Plan 999 12.3.5 Monitoring and Evaluation 999 12.3.6 Cost of Rehabilitation & Resettlement Plan 1001

Para No. Particulars Page No.
Chapter – 13 Cost Estimate, Benefit Cost Ratio and Financial Aspects
13.0 General 1003 13.1 Classification of Units 1005 13.1.1 Unit – I : Head Works 1007 13.1.1.1 Direct Charges 1008 13.1.1.2 Indirect Charges 1013 13.1.2 Unit – II : Canal System 1013 13.1.2.1 Direct Charges 1014 13.1.2.2 Indirect Charges 1019 13.1.3 Unit – III : Hydroelectric Installation 1019 13.1.3.1 Direct Charges 1019 13.1.3.2 Indirect Charges 1021 13.1.4 Unit–IV: Navigation 1022 13.1.5 Unit–V: Water Supply Works 1033 13.1.6 Unit–VI: Command Area Development 1022
13.1.6.1 Direct charges 1025
13.2 Revenues 1025 13.2.1 Yearly Programme of Development w.r.t. Date of Starting of
Construction of the Project 1025
13.2.2 Sources of Revenue 1026 13.2.2.1 Water Rates – Irrigation Cess 1026 13.2.2.2 Auction of Ferry Service, Inundated Land Lease, Auction for
Fruit Bearing Trees along Canals, Lease of Land for Shops in Colony Area, Navigational Permits
1026
13.2.2.3 Revenue from Hydro-Power 1026 13.2.2.4 Revenue from Water Supply 1026 13.2.2.5 Navigation 1027 13.2.2.6 Other Sources (Pisciculture, Tourism etc.) 1027 13.2.3 Concession in Water Rates (Irrigation), Cargo and Passenger
Rates, etc. 1027
13.2.4 Administrative Charges for Supply of Water and Collection of Revenues etc.
1027
13.2.5 If the Area to be Irrigated is Prone to Scarcity, the Expenditure Normally Incurred to Redress the Scarcity
1027
13.2.6 Year in Which the Revenue Would Start Accruing from Various Sources Counting from the First Year of Construction
1027
13.2.7 Total Income from Various Sources 1028 13.2.8 Details of Staff Proposed for Collection of Revenues and its
Basis 1028
13.2.9 Net Revenue Expected from Different Components of Project 1028 13.2.10 Productivity of Project in Terms of Percentage Financial Returns 1028 13.3 Benefit– Cost Ratio and Internal Rate of Return 1031 13.3.1 Estimate of Annual Cost 1031 13.3.2 Benefit Cost Ratio 1031 13.3.3 Internal Rate of Return (IRR) 1032 13.3.4 Benefit-Cost Ratio for flood control component of projects 1032 13.3.5 Benefits Other than those Considered in the Benefit-Cost Ratio 1032

Para No. Particulars Page No.
and Internal Rate of Return Chapter - 14
Other Aspects of the Project
14.1 Foreign Exchange Element 1033 14.2 Revenue 1033 14.2.1 Revenue from Irrigation 1033 14.2.2 Revenue from Power 1034 14.2.3 Fisheries 1034 14.3 Financial Resources 1035 14.4 Future Utilisation of Facilities Created (Buildings) 1035 14.5 Legal Aspects of Par-Tapi-Narmada Link 1036 14.5.1 Effect of Par-Tapi-Narmada Link on the Territory of Other
States 1036
14.5.2 Existing Interstate Agreement on Sharing of Water 1037 14.6 Sharing of Water and Hydro Power 1037 14.6.1 Water Sharing 1038 14.6.2 Power Sharing 1038 14.7 Feasibility of Utilisation of Water by Maharashtra State Across
Western Divide by Lift 1039
List of Abbreviations 1040
Volume – II Annexures of Main Report
Annexure No.
Particulars Page No.
1.1 Letter of Concurrence Received from Govt. of Maharashtra in respect of Par-Tapi-Narmada link
1
1.2 Letter of Concurrence Received from Govt. of Gujarat in respect of Par-Tapi-Narmada link
2
1.3 A Copy of Memorandum of Understanding (MoU) Signed By Hon’ble Chief Ministers of Gujarat and Maharashtra and Hon’ble Union Minister for Water Resources for Preparation of DPR of Damanganga - Pinjal & Par-Tapi-Narmada Links
3
1.4 A Copy of Letter No. NWDA/IC/V/T-85/ 2010/1383-86 dated 20.04.2010 Gist of discussion held by Director General, NWDA with Principle Secretary, Water Resources Department, Govt. of Gujarat, Gandhinagar Terminating the Par-Tapi-Narmada Link Canal at Existing Miyagam Branch Canal of Narmada Canal System
6
1.5 A Copy of Letter from Water Resources Department, Govt. of Gujarat, Gandhinagar Requesting to Carry out Survey and Investigations as Envisaged in Original Proposal of NWDA
8

Annexure No.
Particulars Page No.
1.6 A Copy of Letter from Principal Chief Conservator of Forest, Gandhinagar According Permission For Carrying Out Survey & Investigations Work in the Forest Area in Gujarat State
9
1.7 A Copy of Letter from Deputy Conservator of Forest (West), Nasik According Permission for Carrying Out Survey & Investigations Work in the Forest Area in Nasik District of Maharashtra
11
1.8 Constitution of the Committee for Empanelment of Consultant for Socio-Economic and Environmental Impact Assessment Studies- Office Order Dated 14/11/2008 Issued by NWDA Head Office
15
1.9 Modification in the Scope of the Committee for Empanelment of Consultants for EIA Studies- Office Order Dated 14/05/2009 Issued by NWDA Head Office
17
1.10 A Copy of MoEF letter No. J-12011/55/2008-IA.I Dated 8th June 2009 Regarding ToRs for EIA Studies
19
1.11 A Copy of Letter Constituting the Committee to Monitor and Review the Progress of Work of EIA Studies - Office Order Dated 09/06/2010 Issued by NWDA Head Office
34
1.12 A Copy of Letter Reconstituting the Committee to Monitor and Review the Progress of EIA Studies of Damanganga - Pinjal and Par – Tapi - Narmada Link Projects under the Chairmanship of Chief Engineer (EMO), CWC, New Delhi
36
1.13 A Copy of MoWR’s Office Order Constituting Monitoring Committee to Monitor and Supervise the Overall Work of Preparation of DPR of Damanganga - Pinjal & Par – Tapi - Narmada Link Projects
38
1.14 A Copy of MoWR‘s Letter Constituting Steering Committee to Review the Progress of Works of DPR of Damanganga - Pinjal and Par – Tapi - Narmada Link Projects
44
1.15 A Copy of Letter of Chief Engineer (S.G.)& Additional Secretary,Narmada Water Resources Water Supply & Kalpsar Department Govt. Of Gujarat, Gandhinagar dated 21.5.2016
1.16 A Copy of Letter of Chief Engineer (S.G.)& Additional Secretary,Narmada Water Resources Water Supply & Kalpsar Department Govt. Of Gujarat, Gandhinagar dated 29.7.2016
1.17 A copy of Minutes of Chief Engineers level Meeting held at New Sachivalaya, Gandhinagar on 11.11.2016 for firming up of Modifications in DPR of Par – Tapi - Narmada Link Project
1.18 A copy of Minutes of Chief Engineers level Meeting held at New Sachivalaya, Gandhinagar on 09.02.2017 for firming up of Modifications in the DPR of Par - Tapi - Narmada Link Project
4.1.1 Details of RCC Permanent Bench Marks Established in the Project Area of Par-Tapi-Narmada Link Project
45
4.1.2 Details of Temporary Bench Marks Established in the Project Area of Par-Tapi-Narmada Link Project
48
4 (A) A Copy of Letter No. NWDA/Tech-I/200/44-14/mmeting/09/Vol.I/126-32 dated 26th June, 2012 from the Head office of NWDA – Minutes of the meeting held with CWC Regarding Dropping of Mohankavchali dam and Connecting Jheri Reservoir with Paikhed Reservoir by Tunnel
54 (A)
4.2.1
A Copy of Letter No.36/10/MIS/08-09/4078 dated 19th Jun, 2009 from the Superintending Archaeologist, ASI, Vadodara –
55

Annexure No.
Particulars Page No.
Regarding Archaeological Survey in the Gujarat Portion of Par-Tapi-Narmada Link Project
4.2.2 A Copy of Letter No.F No.12/2009-10/Tech-3036 dated 17th Feb, 2011 from the Superintending Archaeologist, ASI, Aurangabad – Regarding Archaeological Survey in the Maharashtra Portion of Par-Tapi-Narmada Link Project
56
4.3 A Copy of Letter 171/G-1/EG/WR/GSI/08-09 dated 9th April, 2009 from Engineering Geological Division of Geological Survey of India, Jaipur - Regarding Mineral Survey
63
4.4 A Copy of Letter No. 2/2/2012 (vol-I)/FE&SA/16 dated 4th January, 2013 from FE&SA Directorate of CWC – Regarding Site Specific Design Earthquake Parameters for Par-Tapi-Narmada Link Project- Approved by NCSDP
64
4.5 Litho Logs of Bore Holes on Jheri Dam 67 4.6 Litho Logs of Bore Holes on Paikhed Dam 71 4.7 Litho Logs of Bore Holes on Chasmandva Dam 102 4.8 Litho Logs of Bore Holes on Chikkar Dam 130 4.9 Litho Logs of Bore Holes on Dabdar Dam 138 4.10.1 Test Results of Soil Sample Collected from Trial Pits on Jheri
Dam Axis Area 146
4.10.2 Test Results of Soil Sample Collected from Trial Pits Upstream of Jheri Dam Axis Area
147
4.11 Test Results of Soil Sample Collected from Trial Pits Upstream of Paikhed Dam Axis Area
149
4.12.1 Test Results of Soil Sample Collected from Trial Pits on Chasmandva Dam Axis Area
151
4.12.2 Test Results of Soil Sample Collected from Trial Pits Upstream of Chasmandva Dam Axis Area
152
4.13.1 Test Results of Soil Sample Collected from Trial Pits on Chikkar Dam Axis Area
155
4.13.2 Test Results of Soil Sample Collected from Trial Pits Upstream of Chikkar Dam Axis Area
156
4.14.1 Test Results of Soil Sample Collected from Trial Pits on Dabdar Dam Axis Area
158
4.14.2 Test Results of Soil Sample Collected from Trial Pits Upstream of Dabdar Dam Axis Area
159
4.15.1 Test Results of Soil Samples from Trial pits on Kelwan Dam Axis Area
165
4.15.2 Test Results of Soil Samples from Trial pits on Upstream of Kelwan Dam Axis Area
166
5.1 Gross Yield Series upto Railway Bridge Site 168 5.2 Gross Yield Series at Jheri Dam Site on Par River 169 5.3 Gross Yield Series at Paikhed Dam Site on Par River 170 5.4 Gross Yield Series for whole Auranga Basin. 172 5.5 Gross Yield Series at Chasmandva Dam Site on Tan River
(Tributary of Auranga River) 173
5.6 Gross Yield Series for whole Ambica Basin. 174 5.7 Gross Yield Series at Chikkar Dam Site on Ambica River 175 5.8 Gross Yield Series at Dabdar Dam Site on Khapri River (Tributary
of Ambica River) 176
5.9 Gross Yield Series for whole Purna Basin. 177

Annexure No.
Particulars Page No.
5.10 Gross Yield Series at Kelwan Dam Site on Purna River 178 5.11 Net Yield Series at Jheri Dam Site on Par River 179 5.12 Net Yield Series at Paikhed Dam Site on Par River 180 5.13 Net Yield Series at Chasmandva Dam Site on Tan River
(Tributary of Auranga River) 182
5.14 Net Yield Series at Chikkar Dam Site on Ambica River 183 5.15 Net Yield Series at Dabdar Dam Site on Khapri River (Tributary
of Ambica River) 184
5.16 Net Yield Series at Kelwan Dam Site on Purna River 185 5.17 Minutes of 1st Meeting Held on 23rd September, 2011 between
the States of Gujarat and Maharashtra at the Level of Chief Engineers on Sharing of Damanganga Water
186
5.18 Minutes of 2nd Meeting Held on 14th June, 2013 between the States of Gujarat and Maharashtra at the Level of Chief Engineers on Sharing of Damanganga Water
193
5.19 Minutes of 3rd Meeting Held on 17th June, 2014 between the States of Gujarat and Maharashtra at the Level of Chief Engineers on Sharing of Damanganga Water
203
6.1 Salient Features of Spillway Radial Gate at Jheri Dam 211 6.2 Salient Features of Spillway Stop log at Jheri Dam 212 6.3 Tentative Weight Estimate of Hydro mechanical Equipment of
Jheri Dam 213
6.4 Salient Features of Spillway Radial Gate at Paikhed Dam 214 6.5 Salient Features of Spillway Stoplogs at Paikhed Dam 215 6.6 Tentative Weight Estimate of Hydro mechanical Equipment of
Paikhed Dam and Paikhed Power House 216
6.7 Salient Features of Spillway Radial Gate at Chasmandva Dam 218 6.8 Salient Features of Spillway Stoplogs at Chasmandva Dam 219 6.9 Tentative Weight Estimate of Hydro mechanical Equipment of
Chasmandva Dam 220
6.10 Salient Features of Spillway Radial Gate at Chikkar Dam 222 6.11 Salient Features of Spillway Stoplogs at Chikkar Dam 223 6.12 Tentative Weight Estimate of Hydro mechanical Equipment of
Chikkar Dam 224
6.13 Salient Features of Spillway Radial Gate at Dabdar Dam 226 6.14 Salient Features of Spillway Stoplogs at Dabdar Dam 227 6.15 Tentative Weight Estimate of Hydro mechanical Equipment of
Dabdar Dam and Dabdar power House 228
6.16 Salient Features of Spillway Radial Gate at Kelwan Dam 229 6.17 Salient Features of Spillway Stoplogs at Kelwan Dam 230 6.18 Tentative Weight Estimate of Hydro mechanical Equipment of
Kelwan Dam , Kelwan Dam toe PH and Kelwan Feeder canal PH 231
6.19 Salient Features of Spillway Radial Gate at Paikhed Barrage 233 6.20 Salient Features of Spillway Radial Gate at Chasmandva Barrage 234 6.21 Salient Features of Spillway Stoplogs at Paikhed Barrage 235 6.22 Salient Features of Spillway Stoplogs at Chasmandva Barrage 236 6.23(a) Tentative Weight Estimate of Hydromechanical Equipment for
Paikhed Barrage 237
6.23(b) Tentative Weight Estimate of Hydromechanical Equipment for Chasmandva Barrage
239

Annexure No.
Particulars Page No.
6.24 Tentative Weight Estimate of Hydro mechanical Equipment for Canal Head Regulator & Cross Regulator at D/S of Ukai Dam
241
6.25 Salient Features of Spillway Radial Gate at Paikhed Head Regulator
242
6.26 Salient Features of Stop Logs for Paikhed Head Regulator Service Gate
243
6.27 Salient Features of Spillway Radial Gate at Chasmandva Head Regulator
244
6.28 Salient Features of Stop Logs for Chasmandva Head Regulator Service Gate
245
6.29 Salient Features of Intake Service Gate at Jheri Dam 246 6.30 Salient Features of Emergency Service Gate at Jheri Dam 247 6.31 Salient Features of Intake Service Gate at Paikhed Dam 248 6.32 Salient Features of Emergency Service Gate at Paikhed Dam 249 6.33 Tentative Weight Estimate of Hydromechanical
Equipment for Jheri- Paikhed Link Tunnel 250
6.34 Hydraulic Particulars of Canal 251 6.35 Hydraulic Particulars of Feeder Canals 252 6.36 Salient Features of Power Intake Service Gate at
Paikhed Dam Power House 253
6.37 Salient Features of Power Intake Emergency Gate at Paikhed Dam Power House
254
6.38 Salient Features of Draft Tube Gate at Paikhed Dam Power House
255
6.39 Salient Features of Power Intake Service Gate at Chasmandva Dam Power House
256
6.40 Salient Features of Power Intake Service Emergency Gate at Chasmandva Dam Power House
257
6.41 Salient Features of Draft Tube Gate at Chasmandva Dam Power House
258
6.42 Salient Features of Power Intake Service Gate at Chikkar Dam Power House
259
6.43 Salient Features of Power Intake Emergency Gate at Chikkar Dam Power House
260
6.44 Salient Features of Draft Tube Gate at Chikkar Dam Power House
261
6.45 Salient Features of Power Intake Service Gate at Dabdar Dam Power House
262
6.46 Salient Features of Power Intake Emergency Gate at Dabdar Dam Power House
263
6.47 Salient Features of Draft Tube Gate at Dabdar Dam Power House 264 6.48 Salient Features of Power Intake Service Gate at
Kelwan Dam Power House 265
6.49 Salient Features of Power Intake Emergency Gate at Kelwan Dam Power House
266
6.50 Salient Features of Draft Tube Gate at Kelwan Dam Power House
267
6.51 Salient Features of Power Intake Service Gate at Kelwan Feeder Canal Power House
268
6.52 Salient Features of Power Intake Emergency Gate at 269
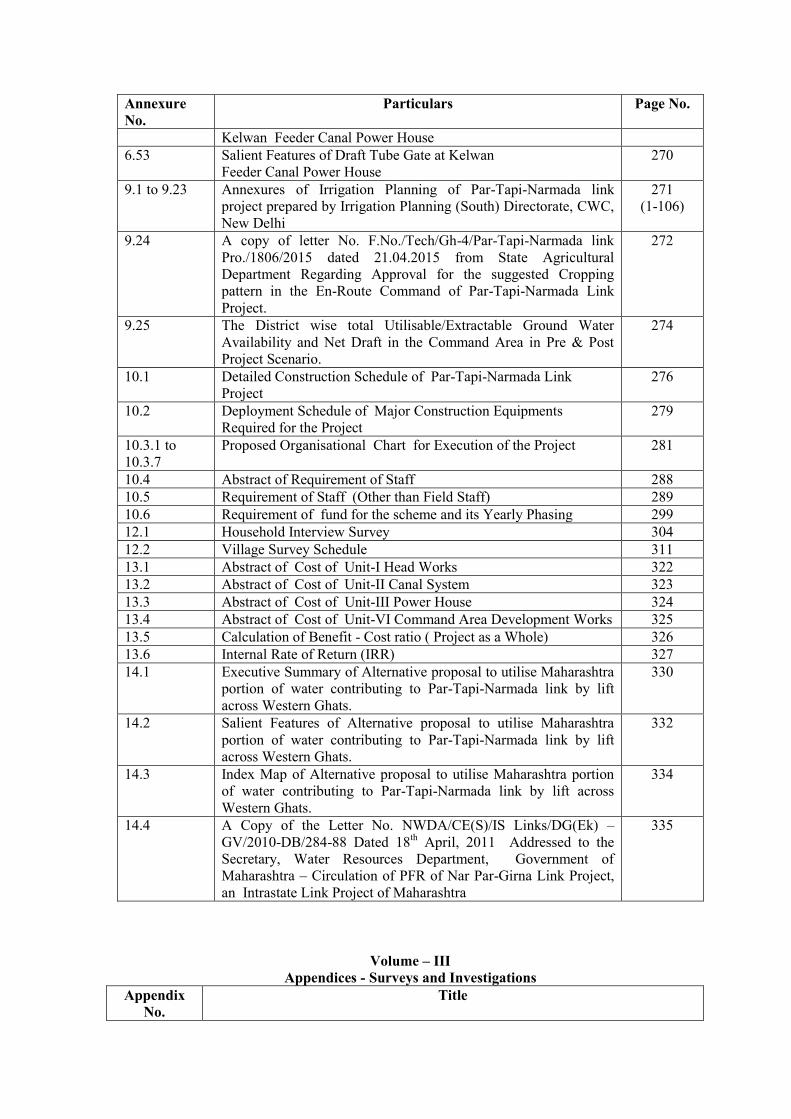
Annexure No.
Particulars Page No.
Kelwan Feeder Canal Power House 6.53 Salient Features of Draft Tube Gate at Kelwan
Feeder Canal Power House 270
9.1 to 9.23 Annexures of Irrigation Planning of Par-Tapi-Narmada link project prepared by Irrigation Planning (South) Directorate, CWC, New Delhi
271 (1-106)
9.24 A copy of letter No. F.No./Tech/Gh-4/Par-Tapi-Narmada link Pro./1806/2015 dated 21.04.2015 from State Agricultural Department Regarding Approval for the suggested Cropping pattern in the En-Route Command of Par-Tapi-Narmada Link Project.
272
9.25 The District wise total Utilisable/Extractable Ground Water Availability and Net Draft in the Command Area in Pre & Post Project Scenario.
274
10.1 Detailed Construction Schedule of Par-Tapi-Narmada Link Project
276
10.2 Deployment Schedule of Major Construction Equipments Required for the Project
279
10.3.1 to 10.3.7
Proposed Organisational Chart for Execution of the Project 281
10.4 Abstract of Requirement of Staff 288 10.5 Requirement of Staff (Other than Field Staff) 289 10.6 Requirement of fund for the scheme and its Yearly Phasing 299 12.1 Household Interview Survey 304 12.2 Village Survey Schedule 311 13.1 Abstract of Cost of Unit-I Head Works 322 13.2 Abstract of Cost of Unit-II Canal System 323 13.3 Abstract of Cost of Unit-III Power House 324 13.4 Abstract of Cost of Unit-VI Command Area Development Works 325 13.5 Calculation of Benefit - Cost ratio ( Project as a Whole) 326 13.6 Internal Rate of Return (IRR) 327 14.1 Executive Summary of Alternative proposal to utilise Maharashtra
portion of water contributing to Par-Tapi-Narmada link by lift across Western Ghats.
330
14.2 Salient Features of Alternative proposal to utilise Maharashtra portion of water contributing to Par-Tapi-Narmada link by lift across Western Ghats.
332
14.3 Index Map of Alternative proposal to utilise Maharashtra portion of water contributing to Par-Tapi-Narmada link by lift across Western Ghats.
334
14.4 A Copy of the Letter No. NWDA/CE(S)/IS Links/DG(Ek) –GV/2010-DB/284-88 Dated 18th April, 2011 Addressed to the Secretary, Water Resources Department, Government of Maharashtra – Circulation of PFR of Nar Par-Girna Link Project, an Intrastate Link Project of Maharashtra
335
Volume – III Appendices - Surveys and Investigations
Appendix No.
Title

Appendix No.
Title
4.1 RRSC, Jodhpur Report No. RRSCN/TR/2011/1- Regarding Demarcation of Command Area en-route Par-Tapi-Narmada link.
4.2 Report on Preliminary Geotechnical Investigation for Par-Tapi- Narmada Link Project of National Water Development Agency in the Dangs & Valsad Districts of Gujarat and Nasik District Maharashtra (Field Season 1993 - 94).
4.3 Report on Estimation of Site Specific Design Ground Motion (Seismic) Study of Par-Tapi-Narmada Link Project (CWPRS Report No. 4848).
4.4 Interim Report on Geophysical Surveys for Par-Tapi-Narmada Link Project of National Water Development Agency in Dang and Valsad Districts of Gujarat and Nasik District of Maharashtra (Field Season 1993-94).
4.5 The Report of GSI on geotechnical investigations at Paikhed and Chasmandava dam sites carried out at DPR stage(Field Season 2009-10).
4.6 The report on laboratory investigations of Rock core samples from Paikhed Dam Area Submitted by CSMRS, New Delhi (CSMRS Report No. 2/RM-I/CSMRS/E/4/2011of April, 2011).
4.7 The report on laboratory investigations of Rock core samples from Chasmandva Dam Area Submitted by CSMRS, New Delhi (CSMRS Report No. 1/RM-I/CSMRS/E/4/2011of April, 2011.
4.8 Report on Sub-Surface Exploration at the Chikkar Dam Site of Par-Tapi- Narmada Link Project, of National Water Development Agency, in District The Dangs, Gujarat (Field Season 1994-95).
4.9 The report of CSMRS bearing No. C-I/CSMRS/E/04/2014-Regarding Construction Material Survey and Investigations of Coarse and Fine Aggregate Samples for Par-Tapi-Narmada Link Project.
4.10 Morphological Studies of Par-Tapi-Narmada Link Project using Remote Sensing and GIS Technology (RRSC Report No. RRSCN/TR/2013/01).
Volume – IV Appendices – Hydrology and Water Assessment
Appendix No.
Title
5.1 Water Availability Study Report of Par-Tapi-Narmada Link Project (CWC Report - March 2012)
5.2 Sedimentation Study Report of Par-Tapi-Narmada Link Project (CWC Report – July 2013)
5.3 Design Flood and Diversion Flood Studies at Dams of Par-Tapi-Narmada link project (CWC Report – October 2012)
5.4 Design Flood and Diversion Flood Studies at Weirs of Par-Tapi-Narmada link project (CWC Report - January 2014)
5.5 Simulation Studies of Reservoirs Involved in Par-Tapi-Narmada Link Project (Prepared by NWDA)
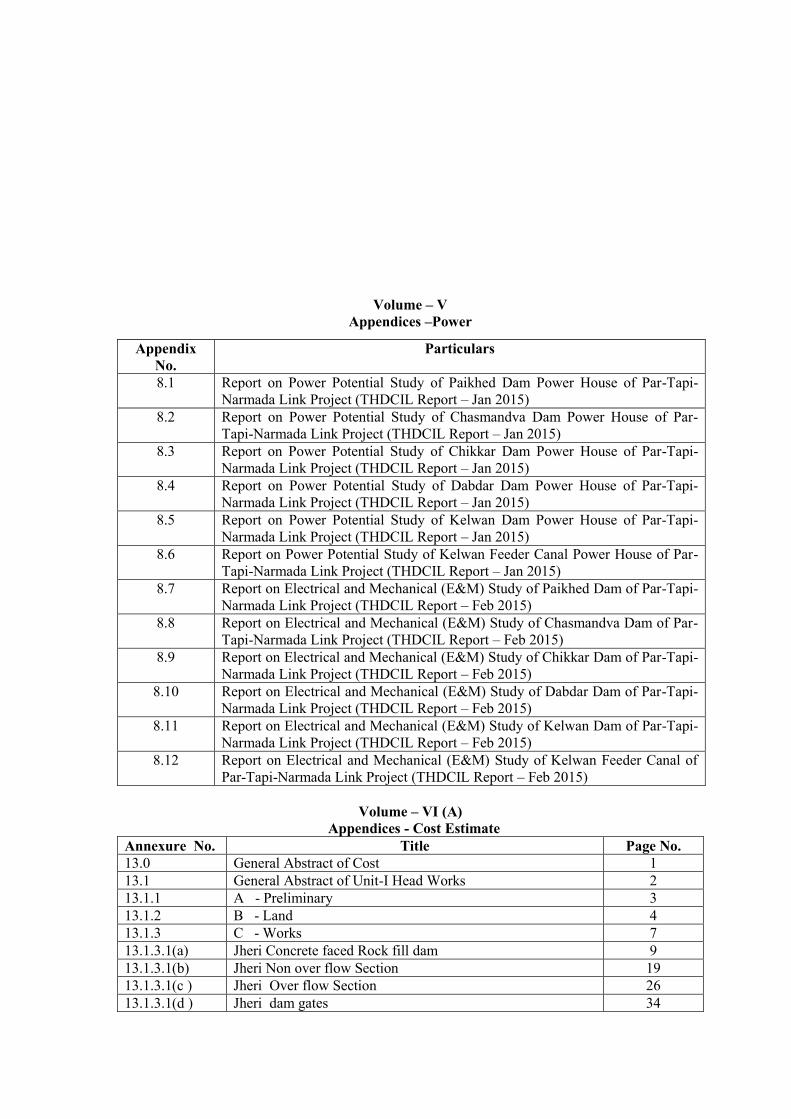
Volume – V Appendices –Power
Volume – VI (A)
Appendices - Cost Estimate Annexure No. Title Page No. 13.0 General Abstract of Cost 1 13.1 General Abstract of Unit-I Head Works 2 13.1.1 A - Preliminary 3 13.1.2 B - Land 4 13.1.3 C - Works 7 13.1.3.1(a) Jheri Concrete faced Rock fill dam 9 13.1.3.1(b) Jheri Non over flow Section 19 13.1.3.1(c ) Jheri Over flow Section 26 13.1.3.1(d ) Jheri dam gates 34
Appendix No.
Particulars
8.1 Report on Power Potential Study of Paikhed Dam Power House of Par-Tapi-Narmada Link Project (THDCIL Report – Jan 2015)
8.2 Report on Power Potential Study of Chasmandva Dam Power House of Par-Tapi-Narmada Link Project (THDCIL Report – Jan 2015)
8.3 Report on Power Potential Study of Chikkar Dam Power House of Par-Tapi-Narmada Link Project (THDCIL Report – Jan 2015)
8.4 Report on Power Potential Study of Dabdar Dam Power House of Par-Tapi-Narmada Link Project (THDCIL Report – Jan 2015)
8.5 Report on Power Potential Study of Kelwan Dam Power House of Par-Tapi-Narmada Link Project (THDCIL Report – Jan 2015)
8.6 Report on Power Potential Study of Kelwan Feeder Canal Power House of Par-Tapi-Narmada Link Project (THDCIL Report – Jan 2015)
8.7 Report on Electrical and Mechanical (E&M) Study of Paikhed Dam of Par-Tapi-Narmada Link Project (THDCIL Report – Feb 2015)
8.8 Report on Electrical and Mechanical (E&M) Study of Chasmandva Dam of Par-Tapi-Narmada Link Project (THDCIL Report – Feb 2015)
8.9 Report on Electrical and Mechanical (E&M) Study of Chikkar Dam of Par-Tapi-Narmada Link Project (THDCIL Report – Feb 2015)
8.10 Report on Electrical and Mechanical (E&M) Study of Dabdar Dam of Par-Tapi-Narmada Link Project (THDCIL Report – Feb 2015)
8.11 Report on Electrical and Mechanical (E&M) Study of Kelwan Dam of Par-Tapi-Narmada Link Project (THDCIL Report – Feb 2015)
8.12 Report on Electrical and Mechanical (E&M) Study of Kelwan Feeder Canal of Par-Tapi-Narmada Link Project (THDCIL Report – Feb 2015)

Annexure No. Title Page No. 13.1.3.2(a) Paikhed Concrete faced Rock fill dam 35 13.1.3.2 (b) Paikhed Non over flow Section 45 13.1.3.2(c ) Paikhed Over flow Section 53 13.1.3.2(d ) Paikhed dam gates 61 13.1.3.2(e ) Paikhed Barrage 62 13.1.3.2(f ) Paikhed Head Regulator 66 13.1.3.2(g ) Paikhed Barrage and Head Regulator gate 69 13.1.3.3(a) Chasmandva Concrete faced Rock fill dam 70 13.1.3.3 (b) Chasmandva Non over flow Section 80 13.1.3.3(c ) Chasmandva Over flow Section 86 13.1.3.3(d ) Chasmandva dam gates 93 13.1.3.3(e ) Chasmandva Barrage 95 13.1.3.3(f ) Chasmandva Head Regulator 99 13.1.3.3(g ) Chasmandva Barrage and Head Regulator gate 102 13.1.3.4(a) Chikkar Concrete faced Rock fill dam 103 13.1.3.4(b) Chikkar Non over flow Section 114 13.1.3.4(c ) Chikkar Over flow Section 121 13.1.3.4(d ) Chikkar dam gates 129 13.1.3.5(a) Dabdar Concrete faced Rock fill dam 130 13.1.3.5(b) Dabdar Non over flow Section 140 13.1.3.5(c ) Dabdar Over flow Section 148 13.1.3.5(d ) Dabdar dam gates 156 13.1.3.6(a) Kelwan Concrete faced Rock fill dam 157 13.1.3.6(b) Kelwan Non over flow Section 169 13.1.3.6(c ) Kelwan Over flow Section 177 13.1.3.6(d ) Kelwan dam gates 185 13.1.4 K - Buildings 186 13.1.5 M - Plantation 192 13.1.6 O - Miscellaneous 193 13.1.7 P - Maintenance 196 13.1.8 R - Communications 197 13.1.9 X - Environment & Ecology 198 13.2 General Abstract of Cost Unit-II: Canal System 206 13.2.1 B-Land 207 13.2.2 C - Works Abstract of cost of Tunnels 208 13.2.2.1 ( a) Cost of Tunnels 209 13.2.2.1 ( b) Cost of Tunnel gates 220 13.2.3 D-Regulators 221 13.2.4 E-Falls 225 13.2.5 F-Cross drainage structures 226 13.2.5.1 Aqueduct 227 13.2.5.2 Syphon aqueduct 230 13.2.5.3 Super passages 232 13.2.5.4 Canal syphon 235 13.2.5.5 Culverts 237 13.2.6 G – Bridges 238 13.2.7 H – Escapes 243 13.2.8 K – Buildings 244 13.2.9 L-Earthwork & Lining 249 13.2.9 ( a) Par-Tapi Reach including Feeder canals 250 13.2.9 ( b) Tapi-Narmada Reach 254 13.2.10 M-Plantation 258

Annexure No. Title Page No. 13.2.11 O-Miscellaneous 259 13.2.12 P-Maintenance 261 13.2.13 R-Communications 262 13.2.14 U-Distributaries/Minors 263 V-Field channels & Water courses 13.2.15 W-Drainage 264 13.2.16 X-Environment & Ecology 265 13.3 General Abstract of cost of Unit-III: Power 267 13.3.1 J – Abstract of Power Plant Civil works 268 13.3.1(a) Paikhed dam toe power house 269 13.3.1(b) Paikhed dam toe power house gate 280 13.3.1(c) Chasmandva dam toe power house 281 13.3.1(d) Chasmandva dam toe power house gate 289 13.3.1(e) Chikkar dam toe power house 290 13.3.1(f) Chikkar dam toe power house gate 297 13.3.1(g) Dabdar dam toe power house 298 13.3.1(h) Dabdar dam toe power house gate 306 13.3.1(i) Kelwan dam toe power house 307 13.3.1(j) Kelwan dam toe power house gate & Feeder canal gate 315 13.3.1(k) Kelwan Feeder canal Power house 316 13.3.2 P – Maintenance 323 13.3.3 S – Abstract of Electro-mechanical works 324 13.3.3(a) Paikhed dam toe power house 325 13.3.3(b) Chasmandva dam toe power house 327 13.3.3(c) Chikkar dam toe power house 330 13.3.3(d) Dabdar dam toe power house 333 13.3.3(e) Kelwan dam toe power house 336 13.3.3(f) Kelwan Feeder canal Power house 339 13.4 General Abstract of cost of Unit-IV: Command area
development 342
13.5 Calculation of B.C.Ratio 343 13.6 Calculation of I.R.R 344 13.7.1 ( a) Quantity estimate of Jheri dam ( CFRD) 345 13.7.1 ( b) Quantity estimate of Jheri dam ( NOF) 359 13.7.1 ( c) Quantity estimate of Jheri dam ( OF) 365 13.7.2 ( a) Quantity estimate of Paikhed dam ( CFRD) 372 13.7.2 ( b) Quantity estimate of Paikhed dam ( NOF) 387 13.7.2 ( c) Quantity estimate of Paikhed dam ( OF) 394 13.7.2 ( d) Quantity estimate of Paikhed Barrage 402 13.7.3 ( a) Quantity estimate of Chasmandva dam ( CFRD) 407 13.7.3 ( b) Quantity estimate of Chasmandva dam ( NOF) 424 13.7.3 ( c) Quantity estimate of Chasmandva dam ( OF) 431 13.7.3 ( d) Quantity estimate of Chasmandva Barrage 438 13.7.4 ( a) Quantity estimate of Chikkar dam ( CFRD) 443 13.7.4 ( b) Quantity estimate of Chikkar dam ( NOF) 458 13.7.4 ( c) Quantity estimate of Chikkar dam ( OF) 465 13.7.5 ( a) Quantity estimate of Dabdar dam ( CFRD) 473 13.7.5 ( b) Quantity estimate of Dabdar dam ( NOF) 486 13.7.5 ( c) Quantity estimate of Dabdar dam ( OF) 493 13.7.6 ( a) Quantity estimate of Kelwan dam ( CFRD) 501 13.7.6 ( b) Quantity estimate of Kelwan dam ( NOF) 515 13.7.6( c) Quantity estimate of Kelwan dam ( OF) 523

Annexure No. Title Page No. 13.8.1 (a) Quantity estimate of Jheri-Paikhed tunnel 530 13.8.1 (b) Quantity estimate of Par-Tapi reach and Feeder Canal 535 13.8.1 (c) Quantity estimate of Tapi-Narmada reach Canal 634 13.8.1 (d) Abstract of quantity of Canal lining 726 13.9.1 (a) Quantity estimate of Paikhed dam toe Power house 727 13.9.1 (b) Quantity estimate of Chasmandvar dam toe Power house 738 13.9.1 (c) Quantity estimate of Chikkar dam toe Power house 747 13.9.1 (d) Quantity estimate of Dabdar dam toe Power house 755 13.9.1 (e) Quantity estimate of Kelwan dam toe Power house 764 13.9.1 (f) Quantity estimate of Kelwan feeder canal Power house 772
Volume – VI (B) Appendices - Cost Estimate
Annexure No. Title Page No.
13.10 Cost of Material, Hire Charges and Labour Charges for Rate Analysis
1
13.10.1 Rate Analysis for Dam 7 13.10.2 Rate Analysis for Tunnel 247 13.10.3 Rate Analysis for Power House 364 13.10.4 Quantities and Cost of U –Distributaries and V- Water
courses 463
13.10.5 Benefits from pre and post project scenario 475
Volume – VII Drawings - Surveys and Investigations
Plate No.
Title Drawing No.
1.1 Index map of PTN link project NWDA/PTN/Link/ICV/2014/1 4.1 Longitudinal Section of Par River: 17.70 km u/s
and 10.60 km d/s of Proposed Jheri Dam Site NWDA/PTN/Link/ICV/2014/2
4.2 Longitudinal Section of Nar River: 18.45 km u/s and 5.55 km d/s of Proposed Paikhed Dam Site
NWDA/PTN/Link/ICV/2014/3
4.3 Longitudinal Section of Nar River: 1.60 km u/s and 6.82 km d/s of Proposed Paikhed Weir Site
NWDA/PTN/Link/ICV/2014/4
4.4 Longitudinal Section of Tan River: 1.14 km u/s and 14.74 km d/s of Proposed Chasmandva Dam Site
NWDA/PTN/Link/ICV/2014/5
4.5 Longitudinal Section of Ambica River: 6.86 km u/s and 6.28 km d/s of Proposed Chikkar Dam Site
NWDA/PTN/Link/ ICV/2014/6
4.6 Longitudinal Section of Ambica River: 80 km towards Sea from Confluence with Khapri River Near Kalaamba Village
NWDA/PTN/Link/ ICV/2014/7
4.7 Longitudinal Section of Khapri River: 7.95 km NWDA/PTN/Link/ ICV/2014/8

Plate No.
Title Drawing No.
u/s and 10.53 km d/s of Proposed Dabdar Dam Site
4.8 Longitudinal Section of Purna River: 14.25 km u/s and 5.19 km d/s of Proposed Kelwan Dam Site
NWDA/PTN/Link/ ICV/2014/9
4.9 Longitudinal Section of Purna River: 85.80 km towards Sea from Waghi to Vyara Road Bridge
NWDA/PTN/Link/ ICV/2014/10
4.10 Cross Section of Par River at Proposed Jheri Dam Site
NWDA/PTN/Link/ ICV/2014/11
4.11 Cross Section of Nar River (Tributary of Par River) at Proposed Paikhed Dam Site
NWDA/PTN/Link/ ICV/2014/12
4.12 Cross Section of Nar River (Tributary of Par River) at Proposed Paikhed Weir Site
NWDA/PTN/Link/ ICV/2014/13
4.13 Cross Section of Tan River (Tributary of Auranga River) at Proposed Chasmandva Dam Site
NWDA/PTN/Link/ ICV/2014/14
4.14 Cross Section of Tan River (Tributary of Auranga River) at Proposed Chasmandva Weir Site
NWDA/PTN/Link/ ICV/2014/15
4.15 Cross Section of Ambica River at Proposed Chikkar Dam Site
NWDA/PTN/Link/ ICV/2014/16
4.16 Cross Section of Khapri River (Tributary of Ambica River) at Proposed Dabdar Dam Site
NWDA/PTN/Link/ ICV/2014/17
4.17 Cross Section of Purna River at Proposed Kelwan Dam Site
NWDA/PTN/Link/ ICV/2014/18
4.18 Submergence Map of Jheri Reservoir (FR stage)
NWDA/PTN/Link/ ICV/2014/19
4.19 Submergence Map of Jheri Reservoir (DPR stage)
Prepared by BISAG
4.20 Submergence Map of Paikhed Reservoir (FR stage)
NWDA/PTN/Link/ ICV/2014/20
4.21 Submergence Map of Paikhed Reservoir (DPR stage)
Prepared by BISAG
4.22 Submergence Map of Chasmandva Reservoir (FR stage)
NWDA/PTN/Link/ ICV/2014/21
4.23 Submergence Map of Chasmandva (DPR stage) Prepared by BISAG 4.24 Submergence Map of Chikkar Reservoir (FR
stage) NWDA/PTN/Link/ ICV/2014/22
4.25 Submergence Map of Chikkar Reservoir (DPR stage)
Prepared by BISAG
4.26 Submergence Map of Dabdar Reservoir (FR stage)
NWDA/PTN/Link/ ICV/2014/23
4.27 Submergence Map of Dabdar Reservoir (DPR stage)
Prepared by BISAG
4.28 Submergence Map of Kelwan Reservoir (FR stage)
NWDA/PTN/Link/ ICV/2014/24
4.29 Submergence Map of Kelwan Reservoir (DPR stage)
Prepared by BISAG
4.30 Contour Plan of Jheri Dam Site Area NWDA/PTN/Link/ ICV/2014/25 4.31 Contour Plan of Paikhed Dam Site Area NWDA/PTN/Link/ ICV/2014/26 4.32 Contour Plan of Chasmandva Dam Site Area NWDA/PTN/Link/ ICV/2014/27 4.33 Contour Plan of Chikkar Dam Site Area NWDA/PTN/Link/ ICV/2014/28
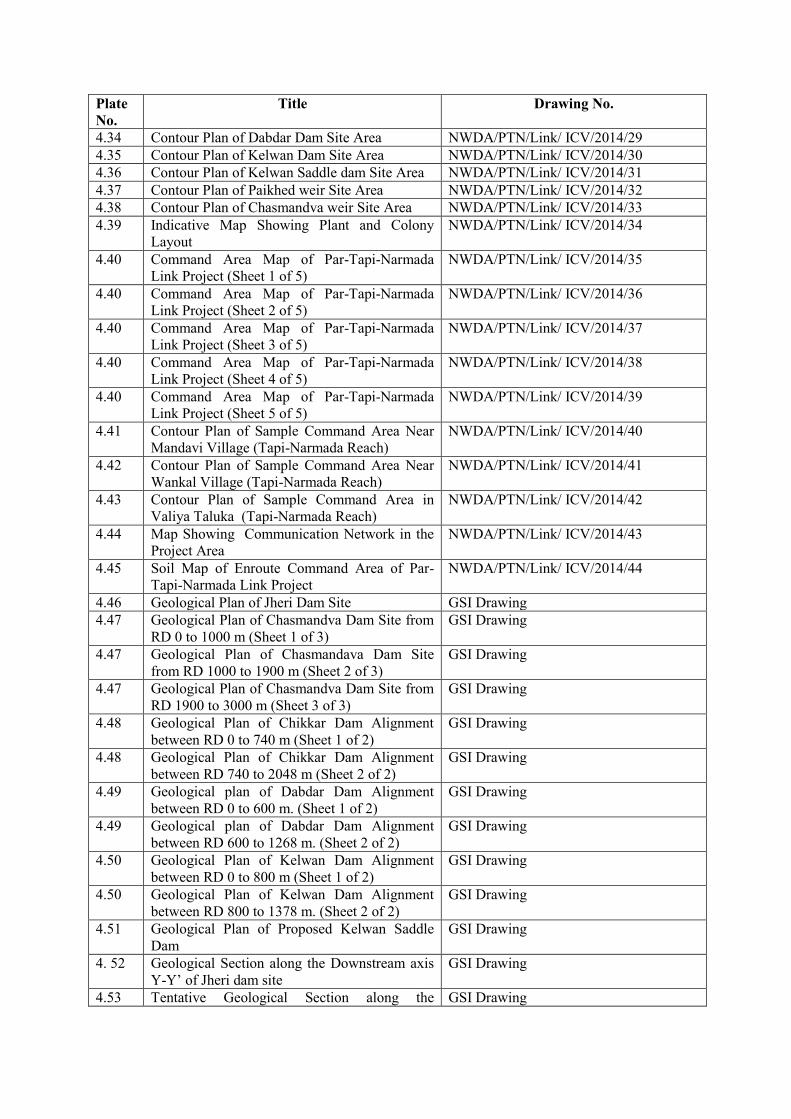
Plate No.
Title Drawing No.
4.34 Contour Plan of Dabdar Dam Site Area NWDA/PTN/Link/ ICV/2014/29 4.35 Contour Plan of Kelwan Dam Site Area NWDA/PTN/Link/ ICV/2014/30 4.36 Contour Plan of Kelwan Saddle dam Site Area NWDA/PTN/Link/ ICV/2014/31 4.37 Contour Plan of Paikhed weir Site Area NWDA/PTN/Link/ ICV/2014/32 4.38 Contour Plan of Chasmandva weir Site Area NWDA/PTN/Link/ ICV/2014/33 4.39 Indicative Map Showing Plant and Colony
Layout NWDA/PTN/Link/ ICV/2014/34
4.40 Command Area Map of Par-Tapi-Narmada Link Project (Sheet 1 of 5)
NWDA/PTN/Link/ ICV/2014/35
4.40 Command Area Map of Par-Tapi-Narmada Link Project (Sheet 2 of 5)
NWDA/PTN/Link/ ICV/2014/36
4.40 Command Area Map of Par-Tapi-Narmada Link Project (Sheet 3 of 5)
NWDA/PTN/Link/ ICV/2014/37
4.40 Command Area Map of Par-Tapi-Narmada Link Project (Sheet 4 of 5)
NWDA/PTN/Link/ ICV/2014/38
4.40 Command Area Map of Par-Tapi-Narmada Link Project (Sheet 5 of 5)
NWDA/PTN/Link/ ICV/2014/39
4.41 Contour Plan of Sample Command Area Near Mandavi Village (Tapi-Narmada Reach)
NWDA/PTN/Link/ ICV/2014/40
4.42 Contour Plan of Sample Command Area Near Wankal Village (Tapi-Narmada Reach)
NWDA/PTN/Link/ ICV/2014/41
4.43 Contour Plan of Sample Command Area in Valiya Taluka (Tapi-Narmada Reach)
NWDA/PTN/Link/ ICV/2014/42
4.44 Map Showing Communication Network in the Project Area
NWDA/PTN/Link/ ICV/2014/43
4.45 Soil Map of Enroute Command Area of Par-Tapi-Narmada Link Project
NWDA/PTN/Link/ ICV/2014/44
4.46 Geological Plan of Jheri Dam Site GSI Drawing 4.47 Geological Plan of Chasmandva Dam Site from
RD 0 to 1000 m (Sheet 1 of 3) GSI Drawing
4.47 Geological Plan of Chasmandava Dam Site from RD 1000 to 1900 m (Sheet 2 of 3)
GSI Drawing
4.47 Geological Plan of Chasmandva Dam Site from RD 1900 to 3000 m (Sheet 3 of 3)
GSI Drawing
4.48 Geological Plan of Chikkar Dam Alignment between RD 0 to 740 m (Sheet 1 of 2)
GSI Drawing
4.48 Geological Plan of Chikkar Dam Alignment between RD 740 to 2048 m (Sheet 2 of 2)
GSI Drawing
4.49 Geological plan of Dabdar Dam Alignment between RD 0 to 600 m. (Sheet 1 of 2)
GSI Drawing
4.49 Geological plan of Dabdar Dam Alignment between RD 600 to 1268 m. (Sheet 2 of 2)
GSI Drawing
4.50 Geological Plan of Kelwan Dam Alignment between RD 0 to 800 m (Sheet 1 of 2)
GSI Drawing
4.50 Geological Plan of Kelwan Dam Alignment between RD 800 to 1378 m. (Sheet 2 of 2)
GSI Drawing
4.51 Geological Plan of Proposed Kelwan Saddle Dam
GSI Drawing
4. 52 Geological Section along the Downstream axis Y-Y’ of Jheri dam site
GSI Drawing
4.53 Tentative Geological Section along the GSI Drawing

Plate No.
Title Drawing No.
Proposed Chasmandva Dam Axis between RD 0 to1320 m (left NOF) Earthen Dam (Sheet 1 of 3)
4. 53 Tentative Geological Section along the Proposed Chasmandva Dam Axis between RD 1320 m to 2500 m (Sheet 2 of 3)
GSI Drawing
4.53 Tentative Geological Section of Right NOF along the Proposed Chasmandva Dam Axis from RD 2500 m to 3050 m (Sheet 3 of 3)
GSI Drawing
4.54 Geological Sections of Chikkar Dam(Sheet 1 of 2)
GSI Drawing
4.54 Detailed Geological Section along Proposed Chikkar Masonry Dam between RD 1090 m to 1485 m (Sheet 2 of 2)
GSI Drawing
4.55 Tentative Geological Sections of Dabdar Dam GSI Drawing 4.56 Tentative Geological Sections of Kelwan Dam GSI Drawing 4.57 Tentative Geological Section along the
Proposed Kelwan Saddle Dam Alignment. GSI Drawing
4.58 Location Plan of Borrow Area Pits of Jheri Dam Area
NWDA/PTN/Link/ ICV/2014/45
4.59 Location Plan of Borrow Area Pits of Paikhed Dam Area
NWDA/PTN/Link/ ICV/2014/46
4.60 Location Plan of Borrow Area Pits of Chasmandva Dam Area
NWDA/PTN/Link/ ICV/2014/47
4.61 Location Plan of Borrow Area Pits of Chikkar Dam Area
NWDA/PTN/Link/ ICV/2014/48
4.62 Location Plan of Borrow Area Pits of Dabdar Dam Area
NWDA/PTN/Link/ ICV/2014/49
4.63 Location Plan of Borrow Area Pits of Kelwan Dam Area
NWDA/PTN/Link/ ICV/2014/50
5.1 Par Basin Map NWDA/PTN/Link/ ICV/2014/51 5.2 Auranga Basin Map NWDA/PTN/Link/ ICV/2014/52 5.3 Ambica Basin Map NWDA/PTN/Link/ ICV/2014/53 5.4 Purna Basin Map NWDA/PTN/Link/ ICV/2014/54
Drawings-Report on Preliminary Geotechnical Investigations carried out by Geological Survey of India, Jaipur
Plate No. Title A-1 Photo-geological Lineament Map of Dabdar Dam Site, the Dangs, Gujarat A-2 Photo-geological Lineament Map of Chikkar Dam Site, the Dangs, Gujarat A-3 Photo-geological Lineament Map of Kelwan Dam Site, the Dangs, Gujarat A-4 Photo-geological Lineament Map of Chasmandva Dam Site, Valsad District,
Gujarat A-5 Photo-geological Lineament Map of Mohankavchali Dam Site, Valsad
District, Gujarat A-6 Photo-geological Lineament Map of Paikhed Dam Site, Valsad District,
Gujarat A-7 Photo-geological Lineament Map of Jheri Dam Site, Nashik District,
Maharashtra I Bedrock Section along Dam and Energy Dissipation Axes along with the
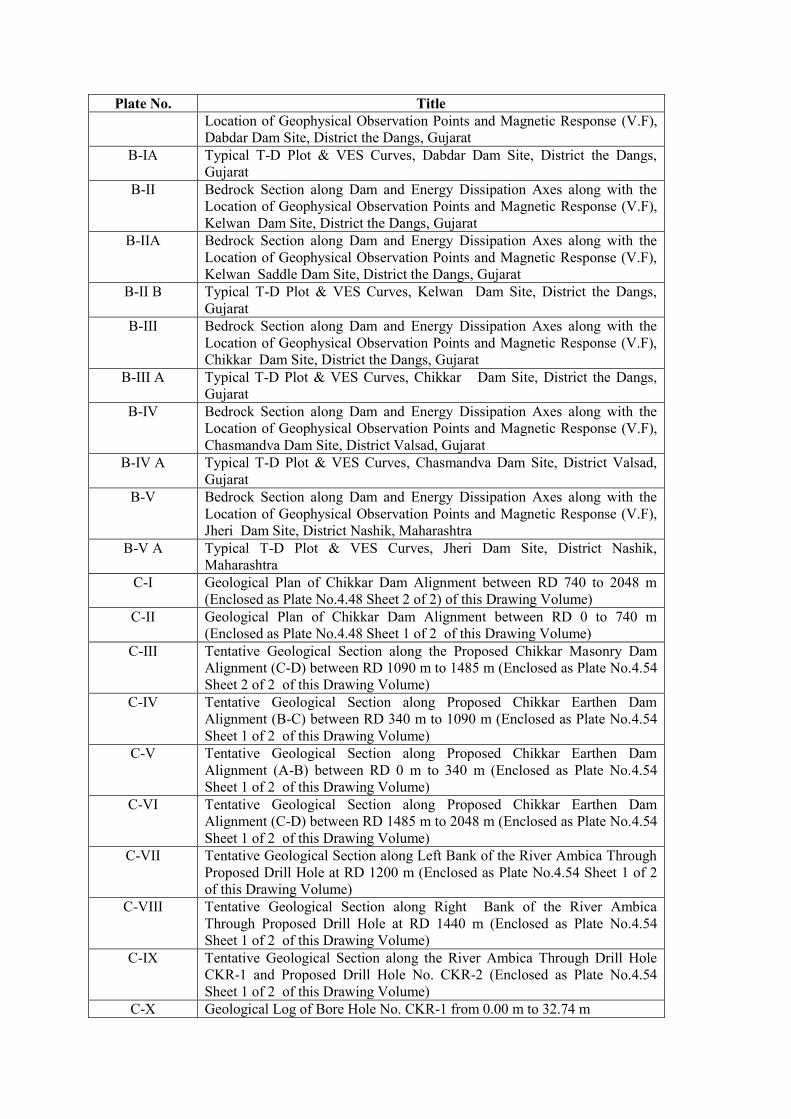
Plate No. Title Location of Geophysical Observation Points and Magnetic Response (V.F), Dabdar Dam Site, District the Dangs, Gujarat
B-IA Typical T-D Plot & VES Curves, Dabdar Dam Site, District the Dangs, Gujarat
B-II Bedrock Section along Dam and Energy Dissipation Axes along with the Location of Geophysical Observation Points and Magnetic Response (V.F), Kelwan Dam Site, District the Dangs, Gujarat
B-IIA Bedrock Section along Dam and Energy Dissipation Axes along with the Location of Geophysical Observation Points and Magnetic Response (V.F), Kelwan Saddle Dam Site, District the Dangs, Gujarat
B-II B Typical T-D Plot & VES Curves, Kelwan Dam Site, District the Dangs, Gujarat
B-III Bedrock Section along Dam and Energy Dissipation Axes along with the Location of Geophysical Observation Points and Magnetic Response (V.F), Chikkar Dam Site, District the Dangs, Gujarat
B-III A Typical T-D Plot & VES Curves, Chikkar Dam Site, District the Dangs, Gujarat
B-IV Bedrock Section along Dam and Energy Dissipation Axes along with the Location of Geophysical Observation Points and Magnetic Response (V.F), Chasmandva Dam Site, District Valsad, Gujarat
B-IV A Typical T-D Plot & VES Curves, Chasmandva Dam Site, District Valsad, Gujarat
B-V Bedrock Section along Dam and Energy Dissipation Axes along with the Location of Geophysical Observation Points and Magnetic Response (V.F), Jheri Dam Site, District Nashik, Maharashtra
B-V A Typical T-D Plot & VES Curves, Jheri Dam Site, District Nashik, Maharashtra
C-I Geological Plan of Chikkar Dam Alignment between RD 740 to 2048 m (Enclosed as Plate No.4.48 Sheet 2 of 2) of this Drawing Volume)
C-II Geological Plan of Chikkar Dam Alignment between RD 0 to 740 m (Enclosed as Plate No.4.48 Sheet 1 of 2 of this Drawing Volume)
C-III Tentative Geological Section along the Proposed Chikkar Masonry Dam Alignment (C-D) between RD 1090 m to 1485 m (Enclosed as Plate No.4.54 Sheet 2 of 2 of this Drawing Volume)
C-IV Tentative Geological Section along Proposed Chikkar Earthen Dam Alignment (B-C) between RD 340 m to 1090 m (Enclosed as Plate No.4.54 Sheet 1 of 2 of this Drawing Volume)
C-V Tentative Geological Section along Proposed Chikkar Earthen Dam Alignment (A-B) between RD 0 m to 340 m (Enclosed as Plate No.4.54 Sheet 1 of 2 of this Drawing Volume)
C-VI Tentative Geological Section along Proposed Chikkar Earthen Dam Alignment (C-D) between RD 1485 m to 2048 m (Enclosed as Plate No.4.54 Sheet 1 of 2 of this Drawing Volume)
C-VII Tentative Geological Section along Left Bank of the River Ambica Through Proposed Drill Hole at RD 1200 m (Enclosed as Plate No.4.54 Sheet 1 of 2 of this Drawing Volume)
C-VIII Tentative Geological Section along Right Bank of the River Ambica Through Proposed Drill Hole at RD 1440 m (Enclosed as Plate No.4.54 Sheet 1 of 2 of this Drawing Volume)
C-IX Tentative Geological Section along the River Ambica Through Drill Hole CKR-1 and Proposed Drill Hole No. CKR-2 (Enclosed as Plate No.4.54 Sheet 1 of 2 of this Drawing Volume)
C-X Geological Log of Bore Hole No. CKR-1 from 0.00 m to 32.74 m

Plate No. Title C-XI Geological Log of Bore Hole No. CKR-1 from 32.74 m to 54.86 m C-XII Geological Log of the Trial Pits C-XIII Geological plan of Dabdar Dam Alignment District the Dangs, Gujarat
(Enclosed as Plate No.4.49 Two Parts / Sheets of this Drawing Volume) C-XIV Section along the Proposed Dabdar Masonry Dam between RD 650 m and
980 m (Enclosed as Plate No.4.55 of this Drawing Volume) C-XV Section along the Proposed Dabdar Earth Dam between RD 0.00 m and 650
m (Enclosed as Plate No.4.55 of this Drawing Volume) C-XVI Section along the Proposed Dabdar Earth Dam between RD 980 m and 1300
m (Enclosed as Plate No.4.55 of this Drawing Volume) C-XVII Section along the Left Bank Through Bore Hole No. DBR-4 RD 689.393 m
(Enclosed as Plate No.4.55 of this Drawing Volume) C-XVIII Section along the Right Bank Through Bore Hole No. DBR-2 RD 976.401
m (Enclosed as Plate No.4.55 of this Drawing Volume) C-XIX Section Across the Dam Alignment Through Bore Hole No. DBR-1 and 3
and River (Enclosed as Plate No.4.55 of this Drawing Volume) C-XX Geological Log of Bore Hole No. DBR-1 C-XXI Geological Log of Bore Hole No. DBR-2 C-XXII Geological Log of Bore Hole No. DBR-3 C-XXIII Geological Log of Bore Hole No. DBR-4 C-XXIV Geological Log of the Trial Pits C-XXV Geological Plan of Kelwan Dam Alignment District the Dangs, Gujarat
(Enclosed as Plate No.4.50 Two Parts/Sheets of this Drawing Volume) C-XXVI Tentative Geological Section along the Proposed Kelwan Masonry Dam
Alignment Between RD 215 m and 552 m (Enclosed as Plate No.4.56 of this Drawing Volume)
C-XXVII Tentative Geological Section along the Proposed Kelwan Earthen Dam Alignment Between RD 0.00 m and 215 m (Enclosed as Plate No.4.56 of this Drawing Volume)
C-XXVIII Tentative Geological Section along the Proposed Kelwan Earthen Dam Alignment Between RD 552 m and 1388 m (Enclosed as Plate No.4.56 of this Drawing Volume)
C-XXIX Tentative Geological Section along the Kelwan Dam Alignment at RD 205 m along Left Bank of Purna River (Enclosed as Plate No.4.56 of this Drawing Volume)
C-XXX Tentative Geological Section across the Kelwan Dam Alignment at RD 550 m along Right Bank of Purna River (Enclosed as Plate No.4.56 of this Drawing Volume)
C-XXXI Tentative Geological Section across the Kelwan Dam Alignment at RD 500 m along the Purna River (Enclosed as Plate No.4.56 of this Drawing Volume)
C-XXXII Geological Log of the Trial Pits C-XXXIII Geological Plan of the Proposed Kelwan Saddle Dam, District the Dangs,
Gujarat (Enclosed as Plate No.4.51 of this Drawing Volume) C-XXXIV Tentative Geological Section along the Kelwan Saddle Dam ,(Enclosed as
Plate No.4.57 of this Drawing Volume) C-XXXV Geological Plan of Chasmandva Dam Site, District Valsad, from RD 0.00 m
to 1000 m (Enclosed as Plate No.4.47 Sheet 1 of 3 of this Drawing Volume) C-XXXVI Geological Plan of Chasmandva Dam Site, District Valsad, from RD 1000 m
to 1900 m (Enclosed as Plate No.4.47 Sheet 2 of 3 of this Drawing Volume) C-XXXVII Geological Plan of Chasmandva Dam Site, District Valsad, from RD 1900 m
to 3000 m (Enclosed as Plate No.4.47 Sheet 3 of 3 of this Drawing Volume)

Plate No. Title C-XXXVIII Tentative Geological Section along the Proposed Chasmandva Dam Axis
between RD 0.00 m to 1320 m (left NOF) Earthen Dam (Enclosed as Plate No.4.53 Sheet 1 of 3 of this Drawing Volume)
C-XXXIX Tentative Geological Section along the Proposed Chasmandva Dam Axis between RD 1320 m to 2500 m (Enclosed as Plate No.4.53 Sheet 2 of 3 of this Drawing Volume)
C-XL Tentative Geological Section of Right NOF along the Proposed Chasmandva Dam Axis from RD 2500 m to 3050 m (Enclosed as Plate No.4.53 Sheet 3 of 3 of this Drawing Volume)
C-XLI Geological Plan of Jheri dam site, District Nashik, Maharashtra (Enclosed as Plate No.4.46 of this Drawing Volume)
C-XLII Geological Section along the Downstream axis Y-Y’ of Jheri dam site (Enclosed as Plate No.4.52 of this Drawing Volume)
C-XLIII Geological Log of Bore Hole BH-1 at Jheri Dam Site C-XLIV Geological Log of Bore Hole BH-2 at Jheri Dam Site C-XLV Geological Log of Bore Hole BH-3 at Jheri Dam Site C-XLVI Geological Log of Bore Hole BH-4 at Jheri Dam Site
Note: Text and Appendices of Report on Preliminary Geotechnical Investigations carried Out by Geological Survey of India, Western Region, Jaipur is enclosed as Appendix – 4.2 in Volume-III: Appendices- Survey Investigations.

Volume – VIII (A) Drawings - Design Aspects
Plate No. Description CWC Drawing No. 1. 1 Index Map of Par-Tapi-Narmada Link Project (NWDA/PTN
Link/ICV/2015/1) -
6. 1 Plinth Foundation Treatment Details of Concrete Faced Rockfill Dam of Jheri Dam
PTNL-5900-P-1042
6. 2 Layout Plan of Concrete Faced Rockfill Dam of Jheri Dam PTNL-5900-P-1036 6. 3 Section at A-A of Concrete Faced Rockfill Dam of Jheri
Dam PTNL-5900-P-1037
6. 4 Section at B-B of Concrete Faced Rockfill Dam of Jheri Dam
PTNL-5900-P-1038
6. 5 Joint Details of Concrete Faced Rockfill Dam of Jheri Dam PTNL-5900-P-1039 6. 6 Plan of Interface Wall of Concrete Faced Rockfill Dam of
Jheri Dam PTNL-5900-P-1040
6. 7 Sectional Details of Interface Wall of Concrete Faced Rockfill Dam of Jheri Dam
PTNL-5900-P-1041
6. 8 Layout Plan of Jheri Dam PTNL-5900-P-3041 6. 9 Maximum Non Over Flow (NOF) Section (Right Side) of
Jheri Dam PTNL-5900-P-3049
6. 10 Maximum Non over flow (NOF) Section (Left Side) of Jheri Dam
PTNL-5900-P-3052
6. 11 Zoning of Materials for Non Over Flow (NOF) Section (Right Side) of Jheri Dam.
PTNL-5900-P-3051
6. 12 Zoning of Materials for Non Over Flow (NOF) Section (Left Side) of Jheri Dam
PTNL-5900-P-3054
6. 13 Water Stop Details for Maximum Non Over Flow (NOF) Section (Right Side) of Jheri Dam
PTNL-5900-P-3050
6. 14 Water Stop Details for Maximum Non Over Flow (NOF) Section (Left Side) of Jheri Dam
PTNL-5900-P-3053
6. 15 Maximum Over Flow (OF) Section of Jheri Dam PTNL-5900-P-3046 6. 16 Zoning of Materials for Maximum Over Flow (OF) Section of
Jheri Dam PTNL-5900-P-3048
6. 17 Water Stop Details for Maximum Over Flow (OF) Section of Jheri Dam
PTNL-5900-P-3047
6. 18 Typical Details of Consolidation Grouting in Over Flow (OF) Portion of Jheri Dam
PTNL-5900-P-3045
6. 19 Spillway Plan of Jheri Dam PTNL-5900-P-3043 6. 20 Spillway Elevation of Jheri Dam PTNL-5900-P-3044 6. 21 Longitudinal Section of Chute Spillway of Jheri Dam PTNL-5900-P-3042 6. 22 Chute Channel and Cross Section at A-A of Jheri Dam PTNL-5900-P-3055 6. 23 General Installation of Spillway Radial Gate
(15000mmx12000mm) of Jheri Dam PTNL-5900-JHD-1501
6. 24 General Installation of Spillway Stoplogs (15000mmx12600mm) of Jheri Dam
PTNL-5900-JHD-1502
6. 25 Plinth Foundation Treatment of Concrete Faced Rockfill Dam of Paikhed Dam
PTNL-5900-P-1028
6. 26 Layout Plan of Concrete Faced Rockfill Dam of Paikhed Dam
PTNL-5900-P-1022
6. 27 Section at A-A of Concrete Faced Rockfill Dam of Paikhed Dam
PTNL-5900-P-1023
6. 28 Section at B-B of Concrete Faced Rockfill Dam of Paikhed Dam
PTNL-5900-P-1024

Plate No. Description CWC Drawing No. 6. 29 Joint Details of Concrete Faced Rockfill Dam of Paikhed
Dam PTNL-5900-P-1025
6. 30 Plan of Interface Wall of Concrete Faced Rockfill Dam of Paikhed Dam
PTNL-5900-P-1026
6. 31 Sectional Details of Interface Wall of Concrete Faced Rockfill Dam of Paikhed Dam
PTNL-5900-P-1027
6. 32 Layout Plan of Paikhed Dam PTNL-5900-P-3001 6. 33 Maximum Non Over Flow (NOF) Section (Right Side) of
Paikhed Dam PTNL-5900-P-3011
6. 34 Maximum Non Over Flow (NOF) Section Power Intake Block of Paikhed Dam
PTNL-5900-P-3009
6. 35 Zoning of Materials for Non Over Flow (NOF) section of Paikhed Dam
PTNL-5900-P-3013
6. 36 Zoning of Materials for Non Over Flow (NOF) Section- Power Intake Block of Paikhed Dam
PTNL-5900-P-3010
6. 37 Water Stop Details for Non Over Flow (NOF) Section of Paikhed Dam
PTNL-5900-P-3012
6. 38 Maximum Over Flow (OF) Section of Paikhed Dam PTNL-5900-P-3006 6. 39 Zoning of Materials for Maximum Over Flow (OF) Section of
Paikhed Dam PTNL-5900-P-3008
6. 40 Water Stop Details for Maximum Over Flow (OF) Section of Paikhed Dam
PTNL-5900-P-3007
6. 41 Typical Details of Consolidation Grouting in Over Flow (OF) Portion of Paikhed Dam
PTNL-5900-P-3004
6. 42 Spillway Plan of Paikhed Dam PTNL-5900-P-3003 6. 43 Spillway Elevation of Paikhed Dam PTNL-5900-P-3005 6. 44 Longitudinal Section of Chute Spillway of Paikhed Dam PTNL-5900-P-3002 6. 45 Chute Channel and Cross Section at A-A of Paikhed Dam PTNL-5900-P-3014 6. 46 Chute Channel and Cross Section at B-B of Paikhed Dam PTNL-5900-P-3015 6. 47 General Installation of Spillway Radial Gate (15000mm X
12000 mm) of Paikhed Dam PTNL-5900-PKD-1501
6. 48 General Installation of Spillway Stoplogs (15000mm X 12300mm) of Paikhed Dam
PTNL-5900-PKD-1502
6. 49 Plinth Foundation Treatment of Concrete Faced Rockfill Dam of Chasmandva Dam
PTNL-5900-P-1035
6. 50 Layout Plan of Concrete Faced Rockfill Dam of Chasmandva Dam
PTNL-5900-P-1029
6. 51 Section at A-A of Concrete Faced Rockfill Dam of Chasmandva Dam
PTNL-5900-P-1030
6. 52 Section at B-B of Concrete Faced Rockfill Dam of Chasmandva Dam
PTNL-5900-P-1031
6. 53 Joint Details of Concrete Faced Rockfill Dam of Chasmandva Dam
PTNL-5900-P-1032
6. 54 Plan of Interface Wall of Concrete Faced Rockfill Dam of Chasmandva Dam
PTNL-5900-P-1033
6. 55 Sectional Details of Interface Wall of Concrete Faced Rockfill Dam of Chasmandva Dam
PTNL-5900-P-1034
6. 56 Layout Plan of Chasmandva Dam PTNL-5900-P-3021 6. 57 Maximum Non Over Flow (NOF) Section (Right Side) of
Chasmandva Dam PTNL-5900-P-3030
6. 58 Maximum Non Over Flow (NOF) Section (Left Side) of Chasmandva Dam
PTNL-5900-P-3033

Plate No. Description CWC Drawing No. 6. 59 Zoning of Materials for Maximum Non Over Flow (NOF)
Section (Right Side) of Chasmandva Dam PTNL-5900-P-3031
6. 60 Water Stop Details for Non Over Flow (NOF) Section (Right side) of Chasmandva Dam
PTNL-5900-P-3032
6. 61 Maximum Over Flow (OF) Section of Chasmandva Dam PTNL-5900-P-3026 6. 62 Zoning of Materials for Maximum Over Flow (OF) Section of
Chasmandva Dam PTNL-5900-P-3028
6. 63 Water Stop Details for Maximum Over Flow (OF) Section of Chasmandva Dam
PTNL-5900-P-3027
6. 64 Typical Details of Consolidation Grouting in Over Flow (OF) Portion of Chasmandva Dam
PTNL-5900-P-3025
6. 65 Spillway Plan of Chasmandva Dam PTNL-5900-P-3024 6. 66 Spillway Elevation of Chasmandva Dam PTNL-5900-P-3023 6. 67 Longitudinal Section of Chute Spillway of Chasmandva Dam PTNL-5900-P-3022 6. 68 Chute Channel and Cross Section at A-A of Chasmandva
Dam PTNL-5900-P-3029
6. 69 General Installation of Spillway Radial Gate (12000 mm X 12000 mm) of Chasmandva Dam
PTNL-5900-CHVD-1501
6. 70 General Installation of Spillway Stoplogs (12000 mm X 12300 mm ) of Chasmandva Dam
PTNL-5900-CHVD-1502
6. 71 Plinth Foundation Treatment of Concrete Faced Rockfill Dam of Chikkar Dam.
PTNL-5900-P-1049
6. 72 Layout Plan of Concrete Faced Rockfill Dam of Chikkar Dam
PTNL-5900-P-1043
6. 73 Section at A-A of Concrete Faced Rockfill Dam of Chikkar Dam
PTNL-5900-P-1044
6. 74 Section at B-B of Concrete Faced Rockfill Dam of Chikkar Dam
PTNL-5900-P-1045
6. 75 Joint Details of Concrete Faced Rockfill Dam of Chikkar Dam
PTNL-5900-P-1046
6. 76 Plan of Interface Wall of Concrete Faced Rockfill Dam of Chikkar Dam
PTNL-5900-P-1047
6. 77 Sectional Details of Interface Wall of Concrete Faced Rockfill Dam of Chikkar Dam
PTNL-5900-P-1048
6. 78 Layout Plan of Chikkar Dam PTNL-5900-P-3061 6. 79 Maximum Non Over Flow (NOF) Section (Right Side) of
Chikkar Dam PTNL-5900-P-3072
6. 80 Maximum Non Over Flow (NOF) Section (Left Side) of Chikkar Dam
PTNL-5900-P-3069
6. 81 Zoning of Materials for Maximum Non Over Flow (NOF) Section (Right Side) of Chikkar Dam
PTNL-5900-P-3074
6. 82 Zoning of Materials for Maximum Non Over Flow (NOF) Section (Left Side) of Chikkar Dam
PTNL-5900-P-3071
6. 83 Water Stop Details for Non Over Flow (NOF) Section (Right Side) of Chikkar Dam
PTNL-5900-P-3073
6. 84 Water Stop Details for Non Over Flow (NOF) Section (Left Side) of Chikkar Dam
PTNL-5900-P-3070
6. 85 Maximum Over Flow (OF) Section of Chikkar Dam PTNL-5900-P-3066 6. 86 Zoning of Materials for Maximum Over Flow (OF) Section of
Chikkar Dam PTNL-5900-P-3068
6. 87 Water Stop Details for Maximum Over Flow (OF) Section of PTNL-5900-P-3067

Plate No. Description CWC Drawing No. Chikkar Dam
6. 88 Typical Details of Consolidation Grouting in Over Flow (OF) Portion of Chikkar Dam
PTNL-5900-P-3065
6. 89 Spillway Plan of Chikkar Dam PTNL-5900-P-3064 6. 90 Spillway Elevation of Chikkar Dam PTNL-5900-P-3063 6. 91 Longitudinal Section of Chute Spillway of Chikkar Dam PTNL-5900-P-3062 6. 92 Chute Channel and Cross Section at A-A of Chikkar Dam PTNL-5900-P-3075 6. 93 General Installation of Spillway Radial Gate (15000 mm X
12000 mm) of Chikkar Dam PTNL-5900-CKD-1501
6. 94 General Installation of Spillway Stoplogs (15000 mm X 12900 mm) of Chikkar Dam
PTNL-5900-CKD-1502
Volume – VIII (B) Drawings - Design Aspects
Plate No. Description CWC Drawing No. 1. 1 Index Map of Par-Tapi-Narmada Link Project (NWDA/PTN
Link/ICV/2015/1) -
6.95 Plinth Foundation Treatment of Concrete Faced Rockfill Dam of Dabdar dam
PTNL-5900-P-1056
6.96 Layout Plan of Concrete Faced Rockfill Dam of Dabdar Dam PTNL-5900-P-1050 6.97 Section at A-A of Concrete Faced Rockfill Dam of Dabdar
Dam PTNL-5900-P-1051
6.98 Section at B-B of Concrete Faced Rockfill Dam of Dabdar Dam
PTNL-5900-P-1052
6.99 Joint Details of Concrete Faced Rockfill Dam of Dabdar Dam PTNL-5900-P-1053 6.100 Plan of Interface Wall of Concrete Faced Rockfill Dam of
Dabdar Dam PTNL-5900-P-1054
6.101 Sectional Details of Interface Wall of Concrete Faced Rockfill Dam of Dabdar Dam
PTNL-5900-P-1055
6.102 Layout Plan of Dabdar Dam PTNL-5900-P-3081 6.103 Maximum Non Over Flow (NOF) Section (Right Side) of
Dabdar Dam PTNL-5900-P-3092
6.104 Maximum Non Over Flow (NOF) Section (Left side) of Dabdar Dam
PTNL-5900-P-3089
6.105 Zoning of Materials for Non Over Flow (NOF) Section (Right Side) of Dabdar Dam
PTNL-5900-P-3094
6.106 Zoning of Materials for Non Over Flow (NOF) Section (Left Side) of Dabdar Dam
PTNL-5900-P-3091
6.107 Water Stop Details for Non Over Flow (NOF) Section (Right Side) of Dabdar Dam
PTNL-5900-P-3093
6.108 Water Stop Details for Non Over Flow (NOF) Section (Left Side) of Dabdar Dam
PTNL-5900-P-3090
6.109 Maximum Over Flow (OF) Section of Dabdar Dam PTNL-5900-P-3086 6.110 Zoning of Materials for Maximum Over Flow (OF) Section of
Dabdar Dam PTNL-5900-P-3088
6.111 Water Stop Details for Maximum Over Flow (OF) Section of Dabdar Dam
PTNL-5900-P-3087
6.112 Typical Details of Consolidation Grouting in Over Flow (OF) Portion of Dabdar Dam
PTNL-5900-P-3085

Plate No. Description CWC Drawing No. 6.113 Spillway Plan of Dabdar Dam PTNL-5900-P-3084 6.114 Spillway Elevation of Dabdar Dam PTNL-5900-P-3083 6.115 Longitudinal Section of Chute Spillway of Dabdar Dam PTNL-5900-P-3082 6.116 Chute Channel and Cross Section at A-A of Dabdar Dam PTNL-5900-P-3095 6.117 General Installation of Spillway Radial Gate (15000 mm X
12000 mm) of Dabdar Dam PTNL-5900-DBD-1501
6.118 General Installation of Spillway Stoplogs (15000 mm X 12600 mm ) of Dabdar Dam
PTNL-5900-DBD-1502
6.119 Plinth Foundation Treatment Details of Concrete Faced Rockfill Dam of Kelwan Dam
PTNL-5900-P-1063
6.120 Layout Plan of Concrete Faced Rockfill Dam of Kelwan Dam
PTNL-5900-P-1057
6.121 Section at A-A of Concrete Faced Rockfill Dam of Kelwan Dam
PTNL-5900-P-1058
6.122 Section at B-B of Concrete Faced Rockfill Dam of Kelwan Dam
PTNL-5900-P-1059
6.123 Joint Details of Concrete Faced Rockfill Dam of Kelwan Dam
PTNL-5900-P-1060
6.124 Plan of Interface Wall of Concrete Faced Rockfill Dam of Kelwan Dam
PTNL-5900-P-1061
6.125 Sectional Details of Interface Wall of Concrete Faced Rockfill Dam of Kelwan Dam
PTNL-5900-P-1062
6.126 Layout plan of Kelwan dam PTNL-5900-P-3101 6.127 Maximum Non Over flow (NOF) Section (Right Side) of
Kelwan Dam PTNL-5900-P-3109
6.128 Maximum Non Over flow (NOF) Section (Left Side) of Kelwan Dam
PTNL-5900-P-3112
6.129 Zoning of Materials for Non Over Flow (NOF) Section (Right Side) of Kelwan Dam
PTNL-5900-P-3111
6.130 Zoning of Materials for Non Over Flow (NOF) Section (Left Side) of Kelwan Dam
PTNL-5900-P-3114
6.131 Water Stop Details for Non Over flow (NOF) Section (Right Side) of Kelwan Dam
PTNL-5900-P-3110
6.132 Water Stop Details for Non Over flow (NOF) Section (Left Side) of Kelwan Dam
PTNL-5900-P-3113
6.133 Maximum Over flow (OF) Section of Kelwan Dam PTNL-5900-P-3106 6.134 Zoning of Materials for Maximum Over flow (OF) Section of
Kelwan Dam PTNL-5900-P-3108
6.135 Water Stop details for Maximum Over flow (OF) Section of Kelwan Dam
PTNL-5900-P-3107
6.136 Typical Details of consolidations Grouting in Over flow (OF) Portion of Kelwan Dam
PTNL-5900-P-3105
6.137 Spillway Plan of Kelwan Dam PTNL-5900-P-3104 6.138 Spillway Elevation of Kelwan Dam PTNL-5900-P-3103 6.139 Longitudinal Section of Chute spillway of Kelwan Dam PTNL-5900-P-3102 6.140 Chute Channel and Cross Section at A-A of Kelwan Dam PTNL-5900-P-3115 6.141 General Installation of Spillway Radial Gate
(15000mmX12000mm) of Kelwan Dam PTNL-5900-KLD-1501
6.142 General Installation of Spillway Stoplogs (15000mmX12000mm) of Kelwan Dam
PTNL-5900-KLD-1502
6.143 General Layout Plan (Alternative Alignments) of Jheri-Paikhed Link Tunnel
PTNL-5900-DPR-1001

Plate No. Description CWC Drawing No. 6.144 General Layout Plan (Final Alignment) of Jheri-Paikhed Link
Tunnel PTNL-5900-DPR-1002
6.145 L-section Along Jheri-Paikhed Link Tunnel PTNL-5900-DPR-1003
6.146 Intake Details at Jheri of Jheri-Paikhed Link Tunnel PTNL-5900-DPR-1004
6.147 Trash Rack Details (Metal Work) at Intake of Jheri-Paikhed Link Tunnel
PTNL-5900-DPR-1005
6.148 Typical Excavation and Rock Support Details (Horizontal Reach) of Jheri-Paikhed Link Tunnel
PTNL-5900-DPR-1006
6.149 Typical Concrete Lining and Grouting Details of Jheri-Paikhed Link Tunnel
PTNL-5900-DPR-1007
6.150 Construction Adit Portal Excavation Support Details of Jheri-Paikhed Link Tunnel
PTNL-5900-DPR-1008
6.151 Typical Excavation and Rock Support Details of Construction Adit (6 m x 6 m D-Shape) of Jheri-Paikhed Link Tunnel
PTNL-5900-DPR-1009
6.152 General Installation of Intake Service Gate (3000 mm X 3000 mm) at Jheri of Jheri-Paikhed Link Tunnel
PTNL-5900-JPLT-1501
6.153 General Installation of Intake Emergency Gate (3000 mm X 300 0mm) at Jheri of Jheri-Paikhed Link Tunnel
PTNL-5900-JPLT-1502
6.154 General Installation of Intake Service Gate (3000 mm X 3000 mm) at Paikhed of Jheri-Paikhed Link Tunnel
PTNL-5900-JPLT-1503
6.155 General Installation of Intake Emergency Gate (3000 mm X 3000 mm) at Paikhed of Jheri-Paikhed Link Tunnel
PTNL-5900-JPLT-1504
6.156 General Layout Plan (Alternative Alignments) of Power House at Paikhed Dam
PTNL-5900-DPR-2001
6.157 General Layout Plan (Final Alignment) of Power House at Paikhed Dam
PTNL-5900-DPR-2002
6.158 L-section of Water Conductor System and Power House at Paikhed Dam
PTNL-5900-DPR-2003
6.159 Plan and Section of Power Intake of Power House at Paikhed Dam
PTNL-5900-DPR-2004
6.160 Trash Rack Details (Metal Work) of Power Intake of Power House at Paikhed Dam
PTNL-5900-DPR-2005
6.161 Pressure Shaft (Typical Excavation on Rock Support Details) of Power House at Paikhed Dam
PTNL-5900-DPR-2006
6.162 Pressure Shaft (Typical Concrete Lining and Grouting Details) of Power House at Paikhed Dam
PTNL-5900-DPR-2007
6.163 Penstock / Pressure Shaft (Ferrule Details) of Power House at Paikhed Dam
PTNL-5900-DPR-2008
6.164 Penstock Shaft (Ferrule Details) of Power House at Paikhed Dam
PTNL-5900-DPR-2009
6.165 Plan of Power House at Paikhed Dam PTNL-5900-DPR-2010
6.166 Cross Section of Surface Power House at Paikhed Dam PTNL-5900-DPR-2011
6.167 General Installation of Power Intake Service Gate (1800 mm X 2500 mm) at Paikhed Dam
PTNL-5900-PKPH-1501
6.168 General Installation of Draft Tube Gate (4020 mmX2300 mm) at Paikhed Dam
PTNL-5900-PKPH-1502
6.169 General Layout Plan (Alternative Alignments) of Power House at Chasmandva Dam
PTNL-5900-DPR-3001
6.170 General Layout Plan (Final Alignment) of Power House at PTNL-5900-DPR-

Plate No. Description CWC Drawing No. Chasmandva Dam 3002
6.171 Layout Plan of Water Conductor System and Power House at Chasmandva Dam
PTNL-5900-DPR-3003
6.172 L-Section of Water Conductor System and Power House at Chasmandva Dam
PTNL-5900-DPR-3004
6.173 Plan and Section of Power Intake of Power House at Chasmandva Dam
PTNL-5900-DPR-3005
6.174 Trash Rack Details (Metal Work) of Power Intake of Power House at Chasmandva Dam
PTNL-5900-DPR-3006
6.175 Penstock (Details of Steel Liner) of Power House at Chasmandva Dam (Sheet 1 of 2)
PTNL-5900-DPR-3007
6.176 Penstock (Details of Steel Liner) of Power House at Chasmandva Dam (Sheet 2 of 2)
PTNL-5900-DPR-3008
6.177 Plan of Surface Power House at Elevation of 175.120 m of Chasmandva Dam
PTNL-5900-DPR-3009
6.178 Cross Section of Surface Power House at Chasmandva Dam PTNL-5900-DPR-3010
6.179 L-Section Through Centre Line of Turbine of Surface Power House at Chasmandva Dam
PTNL-5900-DPR-3011
6.180 General Installation of Power Intake Service Gate (1420 mm X 1800 mm) at Chasmandva Dam
PTNL-5900-CHPH-1501
6.181 General Installation of Draft Tube Gate (3400 mm X 2340 mm) at Chasmandva Dam
PTNL-5900-CHPH-1502
6.182 General Layout Plan (Alternative Alignments) of Power House at Chikkar Dam
PTNL-5900-DPR-4001
6.183 General Layout Plan (Final Alignment) of Power House at Chikkar Dam
PTNL-5900-DPR-4002
6.184 L-section of Water Conductor System and Power House at Chikkar Dam
PTNL-5900-DPR-4003
6.185 Power Intake Details of Power House at Chikkar Dam PTNL-5900-DPR-4004
6.186 Trash Rack Details (Metal Work) of Power Intake of Power House at Chikkar Dam
PTNL-5900-DPR-4005
6.187 Penstock (Details of Steel Liner) of Power House at Chikkar Dam (Sheet 1 of 2)
PTNL-5900-DPR-4006
6.188 Penstock (Details of Steel Liner) of Power House at Chikkar Dam (Sheet 2 of 2)
PTNL-5900-DPR-4007
6.189 Plan of Surface Power House at Elevation of 167.920 m of Chikkar Dam
PTNL-5900-DPR-4008
6.190 L-Section Through Centre Line of Turbine of Surface Power House at Chikkar Dam
PTNL-5900-DPR-4009
6.191 Cross Section of Power House at Chikkar Dam PTNL-5900-DPR-4010
6.192 General Installation of Power Intake Service Gate (1420 mm X 1800 mm) at Chikkar Dam
PTNL-5900-CKPH-1501
6.193 General Installation of Draft Tube Gate (3400 mm X 2340 mm) at Chikkar Dam
PTNL-5900-CKPH-1502
6.194 General Layout Plan of Power House at Dabdar Dam PTNL-5900-DPR-5001
6.195 L-section of Water Conductor System and Power House at Dabdar Dam
PTNL-5900-DPR-5002
6.196 Plan and Section of Power Intake of Power House at Dabdar Dam
PTNL-5900-DPR-5003

Plate No. Description CWC Drawing No. 6.197 Trash Rack Details (Metal Work) of Power Intake of Power
House at Dabdar Dam PTNL-5900-DPR-5004
6.198 Penstock (Details of Steel Liner) of Power House at Dabdar Dam (Sheet 1 of 2)
PTNL-5900-DPR-5005
6.199 Penstock (Details of Steel Liner) of Power House at Dabdar Dam (Sheet 2 of 2)
PTNL-5900-DPR-5006
6.200 Plan of Power House at Elevation of 135.830 m of Dabdar Dam
PTNL-5900-DPR-5007
6.201 Cross Section of Surface Power House at Dabdar Dam PTNL-5900-DPR-5008
6.202 L-Section Through Centre Line of Turbine of Surface Power House at Dabdar Dam
PTNL-5900-DPR-5009
6.203 General Installation of Power Intake Service Gate (2000 mm X 2500 mm) at Dabdar Dam
PTNL-5900-DBPH-1501
6.204 General Installation of Draft Tube Gate (5100 mm X 2340 mm) at Dabdar Dam
PTNL-5900-DBPH-1502
6.205 General Layout Plan of Power House at Kelwan Dam PTNL-5900-DPR-6001
6.206 L-section of Water Conductor System and Power House at Kelwan Dam
PTNL-5900-DPR-6002
6.207 Plan and Section of Power Intake of Power House at Kelwan Dam
PTNL-5900-DPR-6003
6.208 Trash Rack Details (Metal Work) of Power Intake of Power House at Kelwan Dam
PTNL-5900-DPR-6004
6.209 Penstock (Details of Steel Liner) of Power House at Kelwan Dam (Sheet 1 of 2)
PTNL-5900-DPR-6005
6.210 Penstock (Details of Steel Liner) of Power House at Kelwan Dam (Sheet 2 of 2)
PTNL-5900-DPR-6006
6.211 Plan of Power House at Elevation of 134.830 m of Kelwan Dam
PTNL-5900-DPR-6007
6.212 Cross Section of Power House at Kelwan Dam PTNL-5900-DPR-6008
6.213 L-Section Through Centre Line of Turbine of Surface Power House at Kelwan Dam
PTNL-5900-DPR-6009
6.214 General Installation of Power Intake Service Gate (1800 mm X 2500 mm) at Kelwan Dam
PTNL-5900-KEPH-1501
6.215 General Installation of Draft Tube Gate (4020 mm X 2300 mm) at Kelwan Dam
PTNL-5900-KEPH-1502
6.216 General Layout Plan of Power House at Kelwan Feeder Canal PTNL-5900-DPR-7001
6.217 L-section of Water Conductor System and Power House at Kelwan Feeder Canal
PTNL-5900-DPR-7002
6.218 Plan and Section of Power Intake of Power House at Kelwan Feeder Canal
PTNL-5900-DPR-7003
6.219 Trash Rack Details (Metal Work) of Power Intake of Power House at Kelwan Feeder Canal
PTNL-5900-DPR-7004
6.220 Penstock Details of Steel Liner (Details of Ferrule) of Power House at Kelwan Feeder Canal
PTNL-5900-DPR-7005
6.221 Penstock Details of Steel Liner (Details of Ferrule) of Power House at Kelwan Feeder Canal
PTNL-5900-DPR-7006
6.222 Plan of Power House at Elevation of 118.180 m of Kelwan Feeder Canal
PTNL-5900-DPR-7007
6.223 Cross Section of Power House at Kelwan Feeder Canal PTNL-5900-DPR-
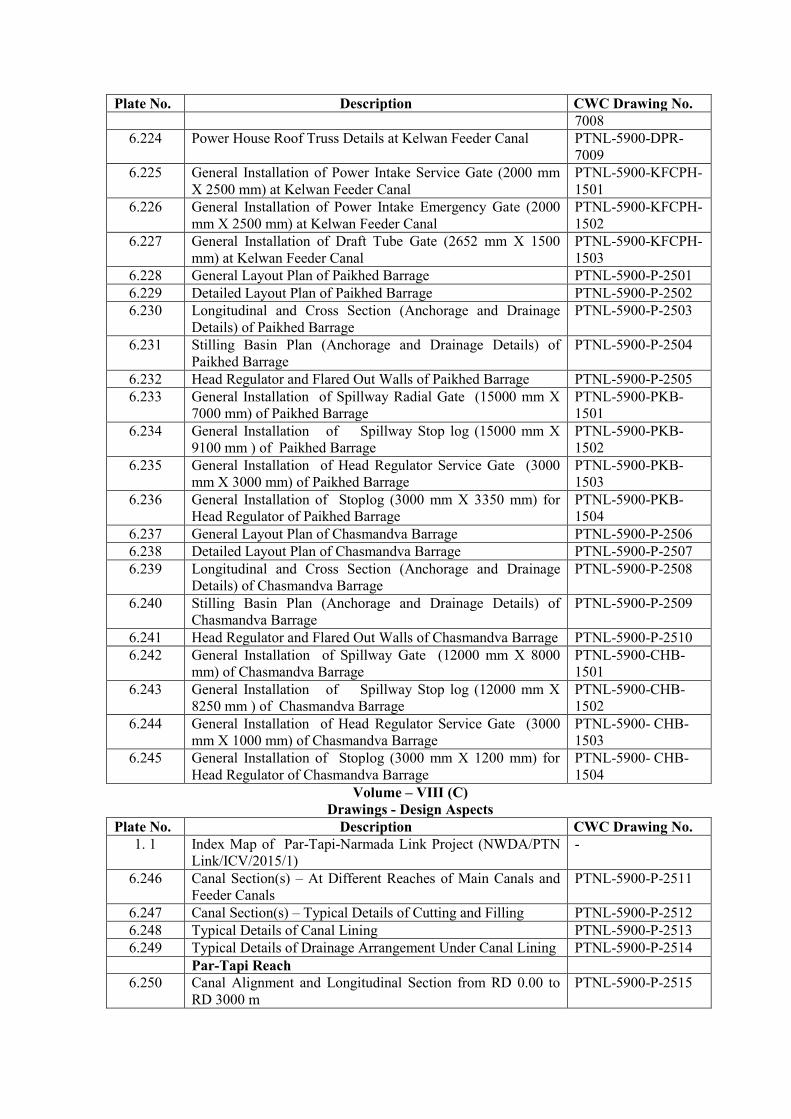
Plate No. Description CWC Drawing No. 7008
6.224 Power House Roof Truss Details at Kelwan Feeder Canal PTNL-5900-DPR-7009
6.225 General Installation of Power Intake Service Gate (2000 mm X 2500 mm) at Kelwan Feeder Canal
PTNL-5900-KFCPH-1501
6.226 General Installation of Power Intake Emergency Gate (2000 mm X 2500 mm) at Kelwan Feeder Canal
PTNL-5900-KFCPH-1502
6.227 General Installation of Draft Tube Gate (2652 mm X 1500 mm) at Kelwan Feeder Canal
PTNL-5900-KFCPH-1503
6.228 General Layout Plan of Paikhed Barrage PTNL-5900-P-2501 6.229 Detailed Layout Plan of Paikhed Barrage PTNL-5900-P-2502 6.230 Longitudinal and Cross Section (Anchorage and Drainage
Details) of Paikhed Barrage PTNL-5900-P-2503
6.231 Stilling Basin Plan (Anchorage and Drainage Details) of Paikhed Barrage
PTNL-5900-P-2504
6.232 Head Regulator and Flared Out Walls of Paikhed Barrage PTNL-5900-P-2505 6.233 General Installation of Spillway Radial Gate (15000 mm X
7000 mm) of Paikhed Barrage PTNL-5900-PKB-1501
6.234 General Installation of Spillway Stop log (15000 mm X 9100 mm ) of Paikhed Barrage
PTNL-5900-PKB-1502
6.235 General Installation of Head Regulator Service Gate (3000 mm X 3000 mm) of Paikhed Barrage
PTNL-5900-PKB-1503
6.236 General Installation of Stoplog (3000 mm X 3350 mm) for Head Regulator of Paikhed Barrage
PTNL-5900-PKB-1504
6.237 General Layout Plan of Chasmandva Barrage PTNL-5900-P-2506 6.238 Detailed Layout Plan of Chasmandva Barrage PTNL-5900-P-2507 6.239 Longitudinal and Cross Section (Anchorage and Drainage
Details) of Chasmandva Barrage PTNL-5900-P-2508
6.240 Stilling Basin Plan (Anchorage and Drainage Details) of Chasmandva Barrage
PTNL-5900-P-2509
6.241 Head Regulator and Flared Out Walls of Chasmandva Barrage PTNL-5900-P-2510 6.242 General Installation of Spillway Gate (12000 mm X 8000
mm) of Chasmandva Barrage PTNL-5900-CHB-1501
6.243 General Installation of Spillway Stop log (12000 mm X 8250 mm ) of Chasmandva Barrage
PTNL-5900-CHB-1502
6.244 General Installation of Head Regulator Service Gate (3000 mm X 1000 mm) of Chasmandva Barrage
PTNL-5900- CHB-1503
6.245 General Installation of Stoplog (3000 mm X 1200 mm) for Head Regulator of Chasmandva Barrage
PTNL-5900- CHB-1504
Volume – VIII (C) Drawings - Design Aspects
Plate No. Description CWC Drawing No. 1. 1 Index Map of Par-Tapi-Narmada Link Project (NWDA/PTN
Link/ICV/2015/1) -
6.246 Canal Section(s) – At Different Reaches of Main Canals and Feeder Canals
PTNL-5900-P-2511
6.247 Canal Section(s) – Typical Details of Cutting and Filling PTNL-5900-P-2512 6.248 Typical Details of Canal Lining PTNL-5900-P-2513 6.249 Typical Details of Drainage Arrangement Under Canal Lining PTNL-5900-P-2514
Par-Tapi Reach 6.250 Canal Alignment and Longitudinal Section from RD 0.00 to
RD 3000 m PTNL-5900-P-2515

Plate No. Description CWC Drawing No. 6.251 Canal Alignment and Longitudinal Section from RD 3000 m
to RD 6000 m PTNL-5900-P-2516
6.252 Canal Alignment and Longitudinal Section from RD 6000 m to RD 9000 m
PTNL-5900-P-2517
6.253 Canal Alignment and Longitudinal Section from RD 9000 m to RD 12000 m
PTNL-5900-P-2518
6.254 Canal Alignment and Longitudinal Section from RD 12000 m to RD 15000 m
PTNL-5900-P-2519
6.255 Canal Alignment and Longitudinal Section from RD 15000 m to RD 18000 m
PTNL-5900-P-2520
6.256 Canal Alignment and Longitudinal Section from RD 18000 m to RD 21000 m
PTNL-5900-P-2521
6.257 Canal Alignment and Longitudinal Section from RD 21000 m to RD 24000 m
PTNL-5900-P-2522
6.258 Canal Alignment and Longitudinal Section from RD 24000 m to RD 27000 m
PTNL-5900-P-2523
6.259 Canal Alignment and Longitudinal Section from RD 27000 m to RD 30000 m
PTNL-5900-P-2524
6.260 Canal Alignment and Longitudinal Section from RD 30000 m to RD 33000 m
PTNL-5900-P-2525
6.261 Canal Alignment and Longitudinal Section from RD 33000 m to RD 36000 m
PTNL-5900-P-2526
6.262 Canal Alignment and Longitudinal Section from RD 36000 m to RD 39000 m
PTNL-5900-P-2527
6.263 Canal Alignment and Longitudinal Section from RD 39000 m to RD 42000 m
PTNL-5900-P-2528
6.264 Canal Alignment and Longitudinal Section from RD 42000 m to RD 45000 m
PTNL-5900-P-2529
6.265 Canal Alignment and Longitudinal Section from RD 45000 m to RD 48000 m
PTNL-5900-P-2530
6.266 Canal Alignment and Longitudinal Section from RD 48000 m to RD 51000 m
PTNL-5900-P-2531
6.267 Canal Alignment and Longitudinal Section from RD 51000 m to RD 54000 m
PTNL-5900-P-2532
6.268 Canal Alignment and Longitudinal Section from RD 54000 m to RD 57000 m
PTNL-5900-P-2533
6.269 Canal Alignment and Longitudinal Section from RD 57000 m to RD 60000 m
PTNL-5900-P-2534
6.270 Canal Alignment and Longitudinal Section from RD 60000 m to RD 63000 m
PTNL-5900-P-2535
6.271 Canal Alignment and Longitudinal Section from RD 63000 m to RD 66000 m
PTNL-5900-P-2536
6.272 Canal Alignment and Longitudinal Section from RD 66000 m to RD 69000 m
PTNL-5900-P-2537
6.273 Canal Alignment and Longitudinal Section from RD 69000 m to RD 72000 m
PTNL-5900-P-2538
6.274 Canal Alignment and Longitudinal Section from RD 72000 m to RD 75000 m
PTNL-5900-P-2539
6.275 Canal Alignment and Longitudinal Section from RD 75000 m to RD 78000 m
PTNL-5900-P-2540
6.276 Canal Alignment and Longitudinal Section from RD 78000 m to RD 81000 m
PTNL-5900-P-2541
6.277 Canal Alignment and Longitudinal Section from RD 81000 m PTNL-5900-P-2542

Plate No. Description CWC Drawing No. to RD 84000 m
6.278 Canal Alignment and Longitudinal Section from RD 84000 m to RD 87000 m
PTNL-5900-P-2543
6.279 Canal Alignment and Longitudinal Section from RD 87000 m to RD 90000 m
PTNL-5900-P-2544
6.280 Canal Alignment and Longitudinal Section from RD 90000 m to RD 93000 m
PTNL-5900-P-2545
6.281 Canal Alignment and Longitudinal Section from RD 93000 m to RD 96000 m
PTNL-5900-P-2546
6.282 Canal Alignment and Longitudinal Section from RD 96000 m to RD 99000 m
PTNL-5900-P-2547
6.283 Canal Alignment and Longitudinal Section from RD 99000 m to RD 102000 m
PTNL-5900-P-2548
6.284 Canal Alignment and Longitudinal Section from RD 102000 m to RD 105000 m
PTNL-5900-P-2549
6.285 Canal Alignment and Longitudinal Section from RD 105000 m to RD 108000 m
PTNL-5900-P-2550
6.286 Canal Alignment and Longitudinal Section from RD 108000 m to RD 111000 m
PTNL-5900-P-2551
6.287 Canal Alignment and Longitudinal Section from RD 111000 m to RD 114000 m
PTNL-5900-P-2552
6.288 Canal Alignment and Longitudinal Section from RD 114000 m to RD 117000 m
PTNL-5900-P-2553
6.289 Canal Alignment and Longitudinal Section from RD 117000 m to RD 120000 m
PTNL-5900-P-2554
6.290 Canal Alignment and Longitudinal Section from RD 120000 m to RD 123000 m
PTNL-5900-P-2555
6.291 Canal Alignment and Longitudinal Section from RD 123000 m to RD 126000 m
PTNL-5900-P-2556
6.292 Canal Alignment and Longitudinal Section from RD 126000 m to RD 129000 m
PTNL-5900-P-2557
6.293 Canal Alignment and Longitudinal Section from RD 129000 m to RD 132000 m
PTNL-5900-P-2558
6.294 Canal Alignment and Longitudinal Section from RD 132000 m to RD 135000 m
PTNL-5900-P-2559
6.295 Canal Alignment and Longitudinal Section from RD 135000 m to RD 138000 m
PTNL-5900-P-2560
6.296 Canal Alignment and Longitudinal Section from RD 138000 m to RD 141000 m
PTNL-5900-P-2561
6.297 Canal Alignment and Longitudinal Section from RD 141000 m to RD 144000 m
PTNL-5900-P-2562
6.298 Canal Alignment and Longitudinal Section from RD 144000 to RD 147000 m
PTNL-5900-P-2563
6.299 Canal Alignment and Longitudinal Section from RD 147000 m to RD 150000 m
PTNL-5900-P-2564
6.300 Canal Alignment and Longitudinal Section from RD 150000 m to RD 153000 m
PTNL-5900-P-2565
6.301 Canal Alignment and Longitudinal Section from RD 153000 m to RD 156000 m
PTNL-5900-P-2566
6.302 Canal Alignment and Longitudinal Section from RD 156000 m to RD 159000 m
PTNL-5900-P-2567
6.303 Canal Alignment and Longitudinal Section from RD 159000 m to RD 162000 m
PTNL-5900-P-2568

Plate No. Description CWC Drawing No. 6.304 Canal Alignment and Longitudinal Section from RD 162000
m to RD 165000 m PTNL-5900-P-2569
6.305 Canal Alignment and Longitudinal Section from RD 165000 m to RD 168000 m
PTNL-5900-P-2570
6.306 Canal Alignment and Longitudinal Section from RD 168000 m to RD 171000 m
PTNL-5900-P-2571
6.307 Canal Alignment and Longitudinal Section from RD 171000 m to RD 174000 m
PTNL-5900-P-2572
6.308 Canal Alignment and Longitudinal Section from RD 174000 m to RD 177360 m
PTNL-5900-P-2573
Feeder Canals 6.309 Canal Alignment and Longitudinal Section from RD 0.00 to
RD 2859.91 m of Chasmandva Feeder Canal PTNL-5900-P-2574
6.310 Canal Alignment and Longitudinal Section from RD 0.00 to RD 3000.00 m of Interconnecting Canal between Chikkar and Dabdar Reservoirs
PTNL-5900-P-2575
6.311 Canal Alignment and Longitudinal Section from RD 3000.00 m to RD 6000.00 m of Interconnecting Canal between Chikkar and Dabdar Reservoirs
PTNL-5900-P-2576
6.312 Canal Alignment and Longitudinal Section from RD 6000.00 m to RD 9000.00 m of Interconnecting Canal between Chikkar and Dabdar Reservoirs
PTNL-5900-P-2577
6.313 Canal Alignment and Longitudinal Section from RD 9000.00 m to RD 12000.00 m of Interconnecting Canal between Chikkar and Dabdar Reservoirs
PTNL-5900-P-2578
6.314 Canal Alignment and Longitudinal Section from RD 12000.00 m to RD 14341.97 m of Interconnecting Canal between Chikkar and Dabdar Reservoirs
PTNL-5900-P-2579
6.315 Canal Alignment and Longitudinal Section from RD 0.00 to RD 3100.00 m of Dabdar Feeder Canal
PTNL-5900-P-2580
6.316 Canal Alignment and Longitudinal Section from RD 3100.00 m to RD 6200.00 m of Dabdar Feeder Canal
PTNL-5900-P-2581
6.317 Canal Alignment and Longitudinal Section from RD 6200.00 m to RD 9300.00 m of Dabdar Feeder Canal
PTNL-5900-P-2582
6.318 Canal Alignment and Longitudinal Section from RD 9300.00 m to RD 12258.087 m of Dabdar Feeder Canal
PTNL-5900-P-2583
6.319 Canal Alignment and Longitudinal Section from RD 0.00 to RD 3100.00 m of Kelwan Feeder Canal
PTNL-5900-P-2584
6.320 Canal Alignment and Longitudinal Section from RD 3100.00 m to RD 6200.00 m of Kelwan Feeder Canal
PTNL-5900-P-2585
6.321 Canal Alignment and Longitudinal Section from RD 6200.00 m to RD 7615.69 m of Kelwan Feeder Canal
PTNL-5900-P-2586
Tapi-Narmada Reach 6.322 Canal Alignment and Longitudinal Section from RD 0.00 to
RD 3000 m PTNL-5900-P-2587
6.323 Canal Alignment and Longitudinal Section from RD 3000 m to RD 6000 m
PTNL-5900-P-2588
6.324 Canal Alignment and Longitudinal Section from RD 6000 m to RD 9000 m
PTNL-5900-P-2589
6.325 Canal Alignment and Longitudinal Section from RD 9000 m to RD 12000 m
PTNL-5900-P-2590
6.326 Canal Alignment and Longitudinal Section from RD 12000 m to RD 15000 m
PTNL-5900-P-2591

Plate No. Description CWC Drawing No. 6.327 Canal Alignment and Longitudinal Section from RD 15000 m
to RD 18000 m PTNL-5900-P-2592
6.328 Canal Alignment and Longitudinal Section from RD 18000 m to RD 21000 m
PTNL-5900-P-2593
6.329 Canal Alignment and Longitudinal Section from RD 21000 m to RD 24000 m
PTNL-5900-P-2594
6.330 Canal Alignment and Longitudinal Section from RD 24000 m to RD 27000 m
PTNL-5900-P-2595
6.331 Canal Alignment and Longitudinal Section from RD 27000 m to RD 30000 m
PTNL-5900-P-2596
6.332 Canal Alignment and Longitudinal Section from RD 30000 m to RD 33000 m
PTNL-5900-P-2597
6.333 Canal Alignment and Longitudinal Section from RD 33000 m to RD 36000 m
PTNL-5900-P-2598
6.334 Canal Alignment and Longitudinal Section from RD 36000 m to RD 39000 m
PTNL-5900-P-2599
6.335 Canal Alignment and Longitudinal Section from RD 39000 m to RD 42000 m
PTNL-5900-P-2600
6.336 Canal Alignment and Longitudinal Section from RD 42000 m to RD 45000 m
PTNL-5900-P-2601
6.337 Canal Alignment and Longitudinal Section from RD 45000 m to RD 48000 m
PTNL-5900-P-2602
6.338 Canal Alignment and Longitudinal Section from RD 48000 m to RD 51000 m
PTNL-5900-P-2603
6.339 Canal Alignment and Longitudinal Section from RD 51000 m to RD 54000 m
PTNL-5900-P-2604
6.340 Canal Alignment and Longitudinal Section from RD 54000 m to RD 57000 m
PTNL-5900-P-2605
6.341 Canal Alignment and Longitudinal Section from RD 57000 m to RD 60000 m
PTNL-5900-P-2606
6.342 Canal Alignment and Longitudinal Section from RD 60000 m to RD 63000 m
PTNL-5900-P-2607
6.343 Canal Alignment and Longitudinal Section from RD 63000 m to RD 66000 m
PTNL-5900-P-2608
6.344 Canal Alignment and Longitudinal Section from RD 66000 m to RD 69000 m
PTNL-5900-P-2609
6.345 Canal Alignment and Longitudinal Section from RD 69000 m to RD 72000 m
PTNL-5900-P-2610
6.346 Canal Alignment and Longitudinal Section from RD 72000 m to RD 75000 m
PTNL-5900-P-2611
6.347 Canal Alignment and Longitudinal Section from RD 75000 m to RD 78000 m
PTNL-5900-P-2612
6.348 Canal Alignment and Longitudinal Section from RD 78000 m to RD 81000 m
PTNL-5900-P-2613
6.349 Canal Alignment and Longitudinal Section from RD 81000 m to RD 84000 m
PTNL-5900-P-2614
6.350 Canal Alignment and Longitudinal Section from RD 84000 m to RD 87000 m
PTNL-5900-P-2615
6.351 Canal Alignment and Longitudinal Section from RD 87000 m to RD 90000 m
PTNL-5900-P-2616
6.352 Canal Alignment and Longitudinal Section from RD 90000 m to RD 93000 m
PTNL-5900-P-2617
6.353 Canal Alignment and Longitudinal Section from RD 93000 m PTNL-5900-P-2618

Plate No. Description CWC Drawing No. to RD 96000 m
6.354 Canal Alignment and Longitudinal Section from RD 96000 m to RD 99000 m
PTNL-5900-P-2619
6.355 Canal Alignment and Longitudinal Section from RD 99000 m to RD 102000 m
PTNL-5900-P-2620
6.356 Canal Alignment and Longitudinal Section from RD 102000 m to RD 105000 m
PTNL-5900-P-2621
6.357 Canal Alignment and Longitudinal Section from RD 105000 m to RD 108000 m
PTNL-5900-P-2622
6.358 Canal Alignment and Longitudinal Section from RD 108000 m to RD 111000 m
PTNL-5900-P-2623
6.359 Canal Alignment and Longitudinal Section from RD 111000 m to RD 114000 m
PTNL-5900-P-2624
6.360 Canal Alignment and Longitudinal Section from RD 114000 m to RD 117000 m
PTNL-5900-P-2625
6.361 Canal Alignment and Longitudinal Section from RD 117000 m to RD 120000 m
PTNL-5900-P-2626
6.362 Canal Alignment and Longitudinal Section from RD 120000 m to RD 123000 m
PTNL-5900-P-2627
6.363 Canal Alignment and Longitudinal Section from RD 123000 m to RD 126000 m
PTNL-5900-P-2628
6.364 Canal Alignment and Longitudinal Section from RD 126000 m to RD 129000 m
PTNL-5900-P-2629
6.365 Canal Alignment and Longitudinal Section from RD 129000 m to RD 132000 m
PTNL-5900-P-2630
6.366 Canal Alignment and Longitudinal Section from RD 132000 m to RD 135000 m
PTNL-5900-P-2631
6.367 Canal Alignment and Longitudinal Section from RD 135000 m to RD 138000 m
PTNL-5900-P-2632
6.368 Canal Alignment and Longitudinal Section from RD 138000 m to RD 141000 m
PTNL-5900-P-2633
6.369 Canal Alignment and Longitudinal Section from RD 141000 m to RD 144000 m
PTNL-5900-P-2634
6.370 Canal Alignment and Longitudinal Section from RD 144000 to RD 147000 m
PTNL-5900-P-2635
6.371 Canal Alignment and Longitudinal Section from RD 147000 m to RD 150000 m
PTNL-5900-P-2636
6.372 Canal Alignment and Longitudinal Section from RD 150000 m to RD 153000 m
PTNL-5900-P-2637
6.373 Canal Alignment and Longitudinal Section from RD 153000 m to RD 156000 m
PTNL-5900-P-2638
6.374 Canal Alignment and Longitudinal Section from RD 156000 m to RD 159000 m
PTNL-5900-P-2639
6.375 Canal Alignment and Longitudinal Section from RD 159000 m to RD 162000 m
PTNL-5900-P-2640
6.376 Canal Alignment and Longitudinal Section from RD 162000 m to RD 165000 m
PTNL-5900-P-2641
6.377 Canal Alignment and Longitudinal Section from RD 165000 m to RD 168000 m
PTNL-5900-P-2642
6.378 Canal Alignment and Longitudinal Section from RD 168000 m to RD 171000 m
PTNL-5900-P-2643
6.379 Canal Alignment and Longitudinal Section from RD 171000 m to RD 174000 m
PTNL-5900-P-2644

Plate No. Description CWC Drawing No. 6.380 Canal Alignment and Longitudinal Section from RD 174000
m to RD 177000 m PTNL-5900-P-2645
6.381 Canal Alignment and Longitudinal Section from RD 177000 m to RD 180000 m
PTNL-5900-P-2646
6.382 Canal Alignment and Longitudinal Section from RD 180000 m to RD 183000 m
PTNL-5900-P-2647
6.383 Canal Alignment and Longitudinal Section from RD 183000 m to RD 186000 m
PTNL-5900-P-2648
6.384 Canal Alignment and Longitudinal Section from RD 186000 m to RD 189000 m
PTNL-5900-P-2649
6.385 Canal Alignment and Longitudinal Section from RD 189000 m to RD 191307.40 m
PTNL-5900-P-2650
CD Structures 6.386 General Layout Map of Aqueducts and Culverts in Par-Tapi
Reach PTNL-5900-P-2651
6.387 General Layout Map of Aqueducts and Culverts in Tapi-Narmada Reach
PTNL-5900-P-2652
6.388 General Layout Map of Superpassage in Par-Tapi and Tapi-Narmada Reach
PTNL-5900-P-2653
6.389 General Layout Map of Head / Cross Regulator at Par-Tapi and Tapi-Narmada Reach
PTNL-5900-P-2654
6.390 General Layout Map of Canal Syphons and Syphon Aqueduct in Par-Tapi Reach
PTNL-5900-P-2655
6.391 General Layout Map of Canal Syphons and Syphon Aqueduct in Tapi-Narmada Reach
PTNL-5900-P-2656
6.392 General Layout Map of Road and Railway Bridges in Par-Tapi Reach
PTNL-5900-P-2657
6.393 General Layout Map of Road and Railway Bridges in Tapi-Narmada Reach
PTNL-5900-P-2658
6.394 Typical Details of Double Lane Road Bridge Across Canal of Bed Width 15 m
PTNL-5900-P-2659
6.395 Typical Details of Double Lane Road Bridge Across Canal of Bed Width 21.80 m
PTNL-5900-P-2660
6.396 Typical Details of Double Lane Road Bridge Across Canal of Bed Width 5.50 m
PTNL-5900-P-2661
6.397 Typical Details of Double Lane Road Bridge Across Canal of Bed Width 8.50 m
PTNL-5900-P-2662
6.398 Typical Details of Single Lane Road Bridge Across Canal of Bed Width 15 m
PTNL-5900-P-2663
6.399 Typical Details of Single Lane Road Bridge Across Canal of Bed Width 21.80 m
PTNL-5900-P-2664
6.400 Typical Details of Single Lane Road Bridge Across Canal of Bed Width 5.50 m
PTNL-5900-P-2665
6.401 Typical Details of Single Lane Road Bridge Across Canal of Bed Width 8.50 m
PTNL-5900-P-2666
6.402 Typical Details of Aqueducts in the Reach RD 0.000 km to RD 60.070 km and Feeder Canals
PTNL-5900-P-2667
6.403 Typical Details of Aqueducts in the Reach RD 60.070 km to RD 108.250 km
PTNL-5900-P-2668
6.404 Typical Details of Aqueducts in the Reach RD 108.250 km to RD 129.600 km
PTNL-5900-P-2669
6.405 Typical Details of Aqueducts in the Reach RD 129.600 km to RD 177.736 km
PTNL-5900-P-2670

Plate No. Description CWC Drawing No. 6.406 Typical Details of Superpassages PTNL-5900-P-2671 6.407 Typical Details of Syphon Aqueducts PTNL-5900-P-2672 6.408 Typical Details of Canal Syphons PTNL-5900-P-2673 6.409 Typical Details of Feeder Canal Out Fall PTNL-5900-P-2674 6.410 Typical Details of Pipe Culverts / Box Culvert PTNL-5900-P-2675 6.411 Typical Details of Cross Regulator PTNL-5900-P-2676 6.412 Typical Details of Head Regulator (Type A&B) and Escape
on Main Canal Escape PTNL-5900-P-2677
6.413 Construction Adit (5.50 m X 5.75 m, D-Shape) Typical Excavation and Rock Support Details of Tunnels in Par-Tapi Reach
PTNL-5900-P-2678
6.414 Typical Concrete Lining and Grouting Details of Tunnels in Par-Tapi Reach
PTNL-5900-P-2679
6.415 Typical Construction Tunnel Portal Excavation Support Details of Entry and Exit Portal of Tunnels in Par-Tapi Reach
PTNL-5900-P-2680

1
Chapter – 1 Introduction
1.0 General
The erstwhile Union Ministry of Irrigation and Central Water Commission (CWC), formulated a National Perspective Plan (NPP) for Water Resources Development for the country in the year 1980, which comprises of two Components: (i) Himalayan Rivers Development Component; and (ii) Peninsular Rivers Development Component. The National Water Development Agency (NWDA) was set up by the Government of India as an Autonomous Society under the Ministry of Water Resources in July, 1982 to study the feasibility of the proposals of the National Perspective Plan and give concrete shape to these proposals. The NWDA after carrying out the detailed technical study identified 30 link proposals for preparation of Feasibility Reports; 14 links under Himalayan Rivers Development Component and 16 links under Peninsular Rivers Development Component. Par – Tapi - Narmada link project is one of the 16 link proposals of Peninsular Rivers Development Component.
The Feasibility Report of Par – Tapi – Narmada Link project was
prepared by NWDA during the year 1995 and circulated among all concerned State Government and members of Technical Advisory Committee (TAC) of NWDA. The link project envisages transfer of 1350 MCM of water from 7 reservoirs contemplated on Par, Auranga, Ambica and Purna rivers and 1554 MCM from the existing Ukai reservoir on Tapi river. However, the water balance study of Tapi basin at Ukai dam carried out by NWDA in the year 2002 revealed that Tapi basin is water deficit. The Government of Gujarat had also indicated that there is no surplus water in Tapi basin at Ukai and suggested to revise the feasibility study. Accordingly, the Feasibility Report of Par – Tapi – Narmada link was revised during 2005 and again circulated to all concerned. Since then continuous efforts were made by National Water Development Agency, Central Water Commission (CWC) and Ministry of Water Resources to arrive at the consensus between two beneficiary States of Gujarat and Maharashtra. As a result of these efforts, consensus was arrived amongst the Central Government and concerned States of Gujarat and Maharashtra

2
for preparation of Detailed Project Report (DPR) of Par – Tapi – Narmadalink project. A tripartite Memorandum of Understanding (MoU) was signed by the States of Gujarat and Maharashtra and the Union Government on 3rd May, 2010 in the presence of the Hon’ble Prime Minister of India at New Delhi for preparation of Detailed Project Report of Par – Tapi – NarmadaLink Project.
NWDA has prepared the DPR of Par – Tapi - Narmada link project
with active support and co-operation of Central Water Commission (CWC) and other domain expert organisations like Central Soil & Material Research Station (CSMRS), Geological Survey of India (GSI), Central Water and Power Research Station (CWPRS), Tehri Hydro Development Corporation India Ltd (THDCIL), India Meteorological Department (IMD), National Remote Sensing Center (NRSC), Hyderabad, Water & Power Consultancy Services (WAPCOS), Regional Remote Sensing Centre (RRSC), Jodhpur etc.
The DPR of Par-Tapi-Narmada Link Project was completed by
NWDA in August, 2015 and sent to the Government of Gujarat and Maharashtra vide NWDA, New Delhi D.O Letter No. NWDA/Tech-I/200/44-I/Vol.V/12269 dated 25.08.2015 for their views.
The issue of water sharing and power sharing between the States of
Gujarat and Maharashtra has been discussed at the level of Chief Engineers of the States of Gujarat and Maharashtra and NWDA. Further matter in this regard is taken up at the Senior Officers level of the two States and MoWR, RD&GR, Government of India. Hon’ble Union Minister for WR, RD&GR held meeting with the Hon’ble Chief Minister, Government of Maharashtra on 7th January 2015, 9th January 2016 and 3rd May, 2016 where in Damanganga-Pinjal and Par-Tapi-Narmada Link Projects were discussed among other issues. The Secretary WR, RD&GR held meeting with the Hon’ble Chief Minister, Government of Gujarat on 31-12-2016 at Gandhi Nagar regarding DPR of Par-Tapi-Narmada Link. Government of Gujarat suggested, to include more tribal areas in the beneficiary areas of PTN Link. The DPR has been modified considering the modification /suggestions of Government of Gujarat. The modification in the proposal as per the suggeastion of Government of Gujarat are detailed in para 1.7.1.

3
1.1 Outline of the Project
Par-Tapi-Narmada Link Project now envisages to transfer the surplus waters (after providing the waters to the people in the vicinity of the reservoirs to meet all the requirements in ultimate stage of development) of West flowing Par, Auranga, Ambica and Purna river basins of South Gujarat and neighbouring Maharashtra to north Gujarat for utilisation in drought affected Saurashtra and Kutch region, tribal areas in Chhota Udepur and Panchmahal districts by substitution, tribal areas in the vicinity of proposed reservoirs and other areas enroute of link canal including tribal areas right side of link canal .
The requirements of the people in the vicinity will be always met by assigning the first priority. The Par – Tapi – Narmada link project will provide waters for irrigation and drinking purposes in its en-route and take over the part command area of existing Miyagam Branch Canal of Narmada Canal System. The Narmada waters so saved in Sardar Sarovar Project would be utilized in Saurashtra and Kutch region of Gujarat and tribal areas in Chhota Udepur and Panchmahal districts by substitution through Narmada Canal System to meet irrigation, domestic and other requirements.
While preparation of Feasibility Report the Par-Tapi-Narmada Link Project proposal comprises construction of seven dams: namely Jheri dam across river Par in Peint taluka of Nasik district in Maharashtra State; Mohankavchali dam across river Par, Paikhed dam across river Nar – a tributary of river Par, Chasmandva dam across river Tan – tributary of river Auranga – all in Dharampur taluka of Valsad district in Gujarat State; Chikkar dam across river Ambica, Dabdar dam across river Khapri – a tributary of river Ambica and Kelwan dam across river Purna – all in Ahwa taluka of Dang district in Gujarat State. Also, Construction of 3 nos. of diversion weirs – one each in the downstream of Paikhed,Chasmandva and Chikkar dam; six power houses; and construction of 400 km long link canal (including 2 tunnels of total 5.5 km) passing through Dharampur taluka of Valsad district, Ahwa taluka of Dang district, Vansda taluka of Navsari district, Vyara and Songadh talukas of Tapi district, Mandvi and Mangrol talukas of Surat district, Valia, Jhagadia and Nandod talukas of Bharuch district, Tilakwada Mahal and Sankheda talukas of Vadodara district of Gujarat State connecting all seven dams with existing Miyagam Branch

4
Canal of Narmada Canal System are envisaged. The surplus water proposed for diversion through Par-Tapi-Narmada link shall take over the part command of existing Miyagam Branch Canal of Narmada Canal System and the Narmada water so saved shall be utilized to extend the irrigation facilities and also to meet the drinking water and other requirements in the drought prone Saurashtra and Kutch region of north Gujarat. The project will provide irrigation to a total area of 1.69 lakh hectare annually which includes 0.52 lakh hectare new command area in its enroute region in Navsari, Surat, Dang and Bharuch districts of Gujarat State and take over about 1.17 lakh hectare area in the command area of existing Miyagam Branch Canal of Narmada Canal System. The project will also generate about 93 Mkwh of hydropower from the power houses proposed at various dams and canal falls, besides providing drinking water to the villages in the region.
The objective of the proposed Par-Tapi-Narmada link project is to divert surplus water available in the west flowing rivers between Par and Tapi (including Par but excluding Tapi) of south Gujarat and neighbouring Maharashtra for utilization in the drought prone Saurashtra and Kutch region of north Gujarat by substitution.
NWDA and CWC jointly carried out hydrological studies of Par basin and at proposed Jheri, Mohankavchali and Paikhed dam sites; Auranga basin and at proposed Chasmandva dam site; Ambica basin and at proposed Chikkar and Dabdar dam sites; and Purna basin and at proposed Kelwan dam site during March, 2012 to assess the water balance position at the ultimate stage of development (by the year 2050 AD).
The gross annual yield series for the entire Par basin up to Railway Bridge has been developed for the period from 1975 to 2006 using the virgin discharge data of Nanivahiyal G&D site for the period from 1966 to 2004. As per the study, the average, 50% and 75% dependable annual gross yields of the whole Par basin at railway bridge site are assessed to be 2160 MCM, 1922 MCMand 1726 MCM respectively. The gross annual yield series at proposed Jheri, Mohankavchali (free catchment) and Paikhed dam sites have also been developed for the period from 1975 to 2006 based on observed discharge data at Nanivahiyal G&D site.As per the study, the

5
average, 50%, and 75% dependable annual gross yields at: Jheri dam site are assessed to be 528 MCM, 467 MCM and 391 MCM respectively; at Mohankavchali dam site (from free catchment downstream of Jheri dam site) 284 MCM, 268 MCM and 213 MCM respectively; and at Paikhed dam site 380 MCM, 335 MCM and 264 MCM respectively.
The gross annual yield series for the entire Auranga basin has been developed for the period from 1975 to 2006 using the virgin discharge data of Bhervi G&D site for the period from 1974 to 2006. As per the study, the average, 50% and 75% dependable annual gross yields of the whole Auranga basin are assessed to be 1092 MCM, 983 MCMand 858 MCM respectively. The gross annual yield series at proposed Chasmandva dam site has been developed for the period from 1975 to 2006 based on observed discharge data at Amba G&D site located in the downstream of the Chasmandva dam site. As per the study, the average, 50% and 75% dependable annual gross yields at Chasmandva dam site are assessed to be 102 MCM, 91 MCM and 70 MCM respectively.
The gross annual yield series for the entire Ambica basin has been developed for the period from 1975 to 2006 using the virgin discharge data of Gadat G&D site (maintained by CWC) for the period from 1979 to 2004. As per the study, the average, 50% and 75% dependable annual gross yields of the whole Ambica basin are assessed to be 2800 MCM, 2430 MCM and 1914 MCM respectively. The gross annual yield series at proposed Chikkar and Dabdar dam sites have been developed for the period from 1975 to 2006 based on observed discharge data at Kudkas G&D site located just upstream of Dabdar dam site. As per the study, the average, 50% and 75% dependable annual gross yields at Chikkar dam site are 304 MCM 257 MCM and 220 MCM respectively and that of at Dabdar dam site are assessed to be 488 MCM, 455 MCM and 323 MCM respectively.
The gross annual yield series for the entire Purna basin has been developed for the period from 1975 to 2006 using the virgin discharge data of Mahuva G&D site (maintained by CWC) for the period from 1974 to 2006. As per the study, the average, 50% and 75% dependable annual gross yields of the whole Purna basin are assessed to be 1667 MCM, 1419 MCM and 1101 MCM respectively. The gross annual yield series at proposed

6
Kelwan dam site has been developed for the period from 1975 to 2006 based on observed discharge data at Kalibel G&D site located just in the upstream of the Kelwan dam site. As per the study, the average, 50% and 75% dependable annual gross yields at Kelwan dam site are assessed to be 497 MCM, 445 MCM and 362 MCM respectively.
The net annual yields available at Jheri dam site in Par basin at average, 50% and 75%dependabilities are assessed to be 509 MCM, 446 MCM and 371 MCM respectively keeping a provision for upstream utilizations planned by the States for irrigation (19.16 MCM), domestic requirement (1.30 MCM), Industrial requirement (3.94 MCM) and regeneration from domestic and industrial uses (4.19 MCM).
The net annual yields available at Mohankavchali dam site (free
catchment between Jhiri and Mohankavchali dam sites)in Par basin at average, 50% and 75% dependabilities are assessed to be 281 MCM, 265 MCM and 209 MCM respectively keeping a provision for upstream utilizations planned by the States for irrigation (2.72 MCM), domestic requirement (0.78 MCM), Industrial requirement (2.37 MCM) and regeneration from domestic and industrial uses (2.52 MCM).
The net annual yields available at Paikhed dam site across Nar river in Par basin at average, 50% and 75% dependabilities are assessed to be 367 MCM, 321 MCM and 250 MCM respectively keeping a provision for upstream utilizations planned by the States for irrigation (12.93MCM), domestic requirement (1.83MCM), industrial requirement (3.99 MCM) and regeneration from domestic and industrial uses (4.65MCM). In addition, the environmental and ecological needs in the downstream will be 3.06 MCM.
The net annual yields available at Chasmandva dam site across Tan river in Auranga basin at average, 50% and 75% dependabilities are assessed to be 96MCM, 85 MCM and 64 MCM respectively keeping a provision for upstream utilizations planned by the States for irrigation (5.80 MCM), domestic requirement (0.27 MCM), industrial requirement (0.85 MCM) and regeneration from domestic and industrial uses (0.90 MCM). In addition, the environmental and ecological needs in the down-stream will be 0.59 MCM.

7
The net annual yields available at Chikkar dam site in Ambica basin
at average, 50% and 75% dependabilities are assessed to be 255MCM, 206 MCM and 170 MCM respectively keeping a provision for upstream utilizations planned by the States for irrigation (52.79 MCM), domestic requirement (0.64 MCM), industrial requirement (2.20 MCM) and regeneration from domestic and industrial uses (4.77 MCM). In addition, the environmental and ecological needs in the down-stream will be 2.42 MCM.
The net annual yields available at Dabdar dam site across Khapri river in Ambica basin at average, 50% and 75% dependabilities are assessed to be 430MCM, 394 MCM and 262 MCM respectively keeping a provision for upstream utilizations planned by the States for irrigation (61.54 MCM), domestic requirement (3.88 MCM), industrial requirement (5.53 MCM) and regeneration from domestic and industrial uses (10.39 MCM). In addition, the environmental and ecological needs in the down-stream will be 3.93 MCM.
The net annual yields available at Kelwan dam site in Purna basin at average, 50% and 75% dependabilities are assessed to be 444MCM, 390 MCM and 308 MCM respectively keeping a provision for upstream utilizations planned by the States for irrigation (52.47MCM), domestic requirement (5.22 MCM), industrial requirement (7.53 MCM) and regeneration from domestic and industrial uses (10.20 MCM). In addition, the environmental and ecological needs in the down-stream will be 4.10 MCM.
About 1634 MCM of surplus water at 75% dependability is available at the 7 reservoirs proposed in Par, Auranga, Ambica and Purna river basins. The dam wise details are given in Table – 1.1:
Table – 1.1
Net Water Availability S.
No. Dam Net Water Available At
75% Dependability (MCM)
1 Jheri dam 371 2 Mohankavchali dam* 209 3 Paikhed dam 250

8
4 Chasmandva dam 64 5 Chikkar dam 170 6 Dabdar dam 262 7 Kelwan dam 308 Total 1634
*Note: Mohankavchali dam has not been considered in the present planning of Par – Tapi – Narmada link
Due to public hindrance in carrying out field survey and
investigations during preparation of Detailed Project Report of Par – Tapi – Narmada link project, the required field investigations could not be carried out at proposed Mohankavchali dam. This aspect was viewed during the meeting of Director General, NWDA with the concerned Chief Engineer of CWC on dated 18.02.2012 regarding completion of various design consultancy works for preparation of Detailed Project Report. It was decided that the NWDA shall examine the possibility of transfer of water directly from Jheri reservoir to Paikhed reservoir /barrage by avoiding Mohankavchali dam.As such, the Mohankavchali dam has not been considered in the present planning of Par – Tapi – Narmada link. However, at later stage when the public hindrance is resolved and the required field survey and investigations are carried out the proposed Mohankavchali dam will also be dovetailed with Par – Tapi – Narmada link. The diverted water will be utilised enroute of link canal to provide domestic water and irrigation facilities in the new areas and take over part command of existing Miyagam Branch Canal of Narmada Canal System. The Narmada waters so saved will be utilised by substitution in the Saurashtra and Kutchregion of North Gujarat for providing domestic water supply and irrigation facilities through Narmada Canal System.
To work out the quantity that can be diverted from Jheri, Paikhed, Chasmandva, Chikkar, Dabdar and Kelwan reservoirs for use in enroute and in Saurashtra and Kutch region of Gujarat by substitution, simulation analysis considering the inflows, local demands, committed down-stream release, environmental flow requirement and capacity of the reservoirs has been carried out for the period from 1975 to 2004. Simulation analysis indicates the total water demand of the link projectis about 1330 MCM. The Details are given in Table-1.5.The dam wise quantity of water

9
diversion is given in Table – 1.2.The index map of Par – Tapi – Narmada link project is at Plate 1.1 of Volume –VII.
Table – 1.2
Diversion Quantity from reservoirs S.
No. Dam Diversion
Quantity (MCM) 1 Jheri 176 2 Paikhed 250 3 Chasmandva 64 4 Chikkar 150 5 Dabdar 262 6 Kelwan 308 Total 1210
1.2 Justification and Objective of the Project The rainfall in Saurashtra and Kutch regions of Gujarat is very scanty
and the area is frequently affected by droughts.The annual normal rainfall (1951-2000) in Saurashtra & Kutch region is 507 mm and whereas the average annual Rainfall in Par, Auranga, Ambica and Purna river basins is assessed to be 2217, 2063, 1833 and 1472 mm respectively. The rivers in Saurashtra & Kutch region are mostly dry throughout the year. Whereas, sizable quantum of flows of Par, Auranga, Ambica and Purna rivers are going to sea unutilised every year.The water availability studies of these basins carried out by CWC indicates availability of sizable surplus waters as mentioned in Table: 1.1.The available surplus waters shall be stored in the reservoirs to be constructed on these rivers and diverted to Saurashtra & Kutch regions for meeting irrigation, drinking and other needs.However, before considering any water transfer from these basins the water requirements of the peoples in the vicinity of the proposed reservoirs and en-route of link canal will be met on first priority. The Par-Tapi-Narmada link project is one of the viable options to divert the surplus flows of Par, Auranga, Ambica and Purna rivers to drought prone Saurashtra & Kutch regions of Gujarat.

10
Accordingly, Preliminary Feasibility study to ascertain whether the project is feasible, was carried out for diversion of surplus waters of West flowing Par, Auranga, Ambica and Purna rivers of South Gujarat to drought affected Saurashtra and Kutch region of Gujarat State. The project was found techno- economically viable and accepted by the TAC of NWDA. While working out the quantity of water that can be diverted through Par- Tapi – Narmada link, the in-basin requirements of water up-stream and down-stream of dams for ultimate stage of development have been considered, as such the diversion of water through the proposed Par- Tapi – Narmada link project is justified.
1.3 Lessons Learned from Previous Projects
A few examples of Inter-basin water transfer Projects implemented in
the past as well as recent past in India are as under: Periyar Project: The project is the most notable endeavor of the 19th century in trans-basin diversion. The project involves transfer of water from Periyar basin to Vaigai basin. A masonry gravity dam of 47.28 m high has been constructed across a gorge on west flowing Periyar river. A 1,740 m long tunnel with a discharging capacity of 40.75 cumecs has been driven across the mountain barrier to convey the water eastwards to Vaigai basin. The project was commissioned in 1895 and provided irrigation to an area of 57,923 ha initially, which has since been extended to 81,069 ha. There is also a power station of 140 MW capacity. Parambikulam - Aliyar: The project is a complex multi-basin multi-purpose project of seven streams; five flowing towards the west and two towards the east, which have been dammed and their reservoirs interlinked by tunnels. The project envisages transfer of water from Chalakudy basin to Bharatapuzha and Cauvery basins. The water is ultimately delivered to drought prone areas in Coimbatore district of Tamil Nadu and the Chittur area of Palakkad District of Kerala. The command area for irrigation is presently about 1,62,000 ha. There is a total of 185 MW power generation capacity at four power houses. This project was built during the second and third five year plans.
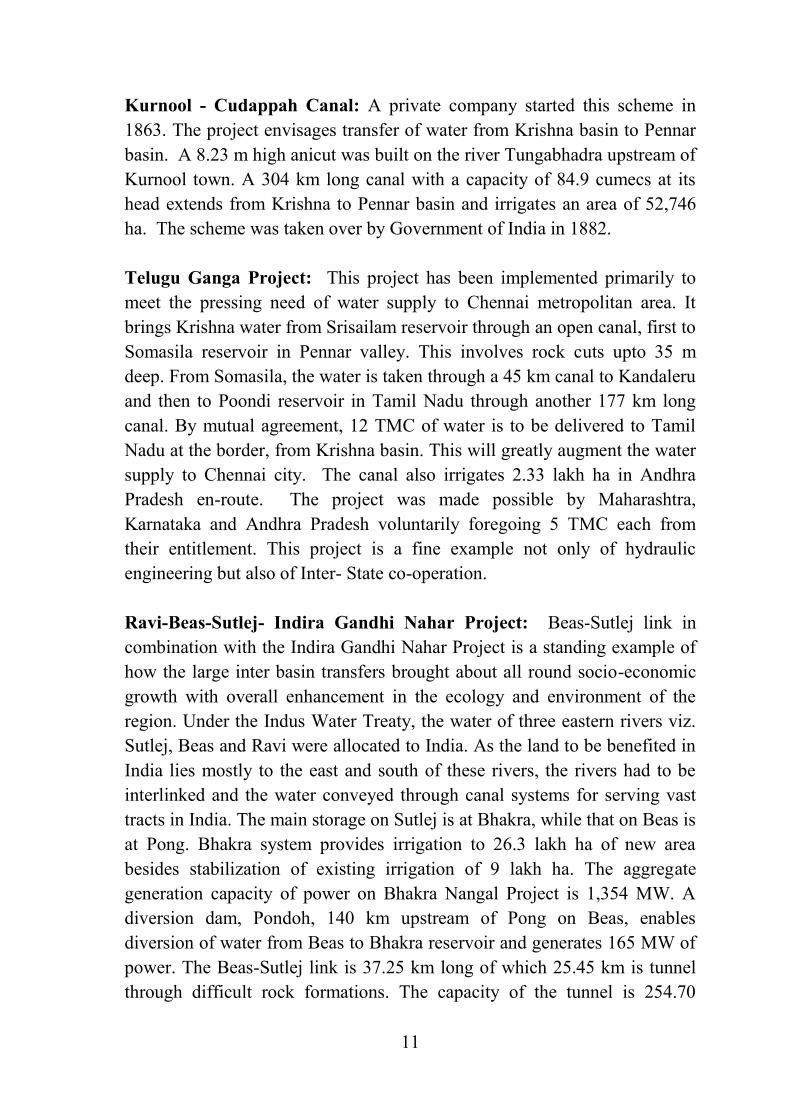
11
Kurnool - Cudappah Canal: A private company started this scheme in 1863. The project envisages transfer of water from Krishna basin to Pennar basin. A 8.23 m high anicut was built on the river Tungabhadra upstream of Kurnool town. A 304 km long canal with a capacity of 84.9 cumecs at its head extends from Krishna to Pennar basin and irrigates an area of 52,746 ha. The scheme was taken over by Government of India in 1882. Telugu Ganga Project: This project has been implemented primarily to meet the pressing need of water supply to Chennai metropolitan area. It brings Krishna water from Srisailam reservoir through an open canal, first to Somasila reservoir in Pennar valley. This involves rock cuts upto 35 m deep. From Somasila, the water is taken through a 45 km canal to Kandaleru and then to Poondi reservoir in Tamil Nadu through another 177 km long canal. By mutual agreement, 12 TMC of water is to be delivered to Tamil Nadu at the border, from Krishna basin. This will greatly augment the water supply to Chennai city. The canal also irrigates 2.33 lakh ha in Andhra Pradesh en-route. The project was made possible by Maharashtra, Karnataka and Andhra Pradesh voluntarily foregoing 5 TMC each from their entitlement. This project is a fine example not only of hydraulic engineering but also of Inter- State co-operation. Ravi-Beas-Sutlej- Indira Gandhi Nahar Project: Beas-Sutlej link in combination with the Indira Gandhi Nahar Project is a standing example of how the large inter basin transfers brought about all round socio-economic growth with overall enhancement in the ecology and environment of the region. Under the Indus Water Treaty, the water of three eastern rivers viz. Sutlej, Beas and Ravi were allocated to India. As the land to be benefited in India lies mostly to the east and south of these rivers, the rivers had to be interlinked and the water conveyed through canal systems for serving vast tracts in India. The main storage on Sutlej is at Bhakra, while that on Beas is at Pong. Bhakra system provides irrigation to 26.3 lakh ha of new area besides stabilization of existing irrigation of 9 lakh ha. The aggregate generation capacity of power on Bhakra Nangal Project is 1,354 MW. A diversion dam, Pondoh, 140 km upstream of Pong on Beas, enables diversion of water from Beas to Bhakra reservoir and generates 165 MW of power. The Beas-Sutlej link is 37.25 km long of which 25.45 km is tunnel through difficult rock formations. The capacity of the tunnel is 254.70

12
cumecs. Another dam on Ravi namely, Ranjit Sagar dam will provide additional water to Beas and also generate a large block of hydro-power. Subsequently, it was decided to link the Indira Gandhi Nahar Project with the river systems to provide 9.36 BCM of water to Rajasthan Canal for irrigating the areas of Thar Desert.
It is no exaggeration to say that the transfer of surplus waters of Ravi, Beas and Sutlej to Rajasthan right upto Jaisalmer and Barmer through Indira Gandhi Nahar Pariyojana has eliminated drought conditions, provided power benefits, transformed desert waste land into an agriculturally productive area by bringing irrigation and vegetation to about 2 million hectare area. Contribution in agricultural production due to implementation of the project is worth Rs. 1,750 crores annually. Canal water is also available for meeting domestic needs. The project has substantially changed the living standard and socio-economic conditions of the people in the area.
Sardar Sarovar Project: The Sardar Sarovar Project across river Narmada is a landmark project for harnessing the water resources of Narmada river basin in an integrated way to meet the in-basin water requirements as well to transfer surplus water to Saurashtra & Kutch region of Gujarat and desert area of Jallore and Barmer districts in Rajasthan which have no other dependable water source, ensuring to minimize the ecology degradation, advancement of desert and salinity ingress in the regions. The main canal of Sardar Sarovar Project which is 458 km long in Gujarat and 75 km in Rajasthan Crosses several rivers basins in western part of the country; Dhadhar, Mahi, Sabarmati, Banas and Luni. The transfer of water from Narmada to these river basins have regenerated rivers which have become dead in recent past. Although project is still partially completed Narmada Water has also been transferred to 370 villages, Ponds in Gujarat.
These examples indicate that to even out the uneven distribution of rainfall with respect to space and time, Interlinking of Rivers Projects are need of the future.
13
1.4 National Perspective Plan for Water Resources Development
The erstwhile Union Ministry of Irrigation and Central Water Commission formulated, in the year 1980, a National Perspective Plan (NPP) for water resources development which comprises of following two components:
a) The Himalayan Rivers Development, and b) The Peninsular Rivers Development
The distinctive feature of the National Perspective Plan is that the
transfer of water from surplus basin to deficit basin would essentially be by gravity and only in small reaches, it would be by lifts not exceeding 120 metres. These two components are briefly outlined in the following paragraphs. a) Himalayan Rivers Development
Himalayan Rivers Development envisages construction of storage reservoirs on the principal tributaries of the Ganga and the Brahmaputra in India, Nepal and Bhutan, along with inter-linking canal systems to transfer surplus flows of the eastern tributaries of the Ganga to the west, apart from linking of the main Brahmaputra and its tributaries with the Ganga and Ganga with Mahanadi and augmentation of flow at Farakka.
The Himalayan Rivers Development Component would provide additional irrigation benefits to an area of about 22 M ha and generation of hydro-power for about 30 million KW, besides providing substantial flood control in the Ganga-Brahmaputra basins. It would also provide the necessary flow required to flush the Kolkata Port and for the inland navigation facilities across the country. b) Peninsular Rivers Development This component is divided into four major Parts:

14
i. Interlinking of Mahanadi – Godavari - Krishna- Pennar - Cauvery rivers and building storages at potential sites in these basins This is the major interlinking of the river systems where surpluses from the Mahanadi and the Godavari are intended to be transferred to the needy areas in the south.
ii. Interlinking of west flowing rivers, north of Mumbai and south of the Tapi This scheme envisages construction of as many optimal storages as possible on these streams, and interlinking them to make available appreciable quantum of water for transfer to areas, where additional water is needed. The scheme provides for taking canal to provide waters to Saurashtra and Kutch areas of Gujarat by substitution and another water supply canal to the metropolitan areas of Mumbai, it also provides irrigation to the coastal areas in Maharashtra.
iii. Interlinking of Ken-Chambal Rivers The scheme provides for a water grid for Madhya Pradesh, Rajasthan and Uttar Pradesh and Interlinking canal backed by as many storages as possible.
iv. Diversion of other west flowing rivers
Heavy rainfall on the western side of the Western Ghats runs down numerous streams which empty into the Arabian Sea. Construction of an interlinking canal system, backed up by adequate storages, could be planned to meet all requirements of Kerala as also for transfer of some water towards east to meet the needs of drought affected areas. The Peninsular Rivers Development Component would provide an
additional irrigation to an area of about 13 M ha and generation of about 4 million KW of hydro power.

15
The proposals of National Perspective Plan would thus give an additional benefit of 25 M ha of irrigation from surface waters, 10 M ha by increased use of Ground water and generation of 34 million KW of hydro power, apart from the incidental benefits of flood control, and other multipurpose benefits.
Two link projects viz. Damanganga – Pinjal link and Par – Tapi – Narmada link were identified under second part of Peninsular Rivers Development Component of NPP. 1.5 Memorandum of Understanding between Centre and States and
Inter-State Aspects Par-Tapi-Narmada Link Project envisages transferring the surplus
waters of West flowing Par, Auranga, Ambica and Purna river basins of South Gujarat and neighbouring Maharashtra to north Gujarat for utilisation in drought affected Saurashtra and Kutch region by substitution. The Feasibility Report of Par – Tapi – Narmada link was prepared by NWDA during the year 2005 and circulated to the concerned State Government and members of Technical Advisory Committee (TAC) of NWDA. The Par, Auranga, Ambica and Purna rivers involved in Par – Tapi – Narmada link project are interState rivers spreading their catchment area in the Gujarat and Maharashtra States.Series of meetings were held by National Water Development Agency, Central Water Commission and Ministry of Water Resources with the concerned States of Gujarat and Maharashtra to arrive at the consensus for preparation of Detailed Project Report of this Project. The concurrence for preparation of Detailed Project Reports of Damanganga-Pinjal and Par-Tapi-Narmada Link Projects by the State Government of Maharashtra was issued by Water Resources Department, Government of Maharashtra vide their letter No. MoU- 2008/(105/08)/WRI of May, 2008 and the concurrence of the State Government of Gujarat was issued by Narmada Water Resources, Water Supply & Kalpasar Department vide their letter No. 5/2005/NWDA(96)-J dated 1st May, 2008. Copy of these letters is placed at Annexure – 1.1 and 1.2 in Volume – II respectively. Subsequently, a tripartite Memorandum of Understanding (MoU) was signed by Hon’ble Chief Ministers of Maharashtra and Gujarat and Hon’ble Union Minister of Water Resources on 3rd May, 2010 in the auspicious presence of the

16
Hon’ble Prime Minister of India. A copy of the MoU is placed at Annexure – 1.3 in Volume – II. The gist of the MoU entered is as follows: 1. Union Government shall identify and decide the organisational
framework necessary for preparation and completion of the Detailed Project Report (hereinafter referred as DPR) of Damanganga-Pinjal link and Par-Tapi-Narmada link.
2. Specific MoUs as required will be entered into amongst the States of Gujarat, Maharashtra and Union Government based on the DPR of Damanganga-Pinjal link and Par-Tapi-Narmada link and Agreements reached on scope of each of the links, sharing of costs and benefits and arrangements for management and control of water etc.
3. The Maharashtra State Government will get the benefits through the
Damanganga-Pinjal Link Project by way of augmentation of water supply to meet the domestic water requirement of Mumbai city, while Government of Gujarat will be free to utilise remaining water spilled from Bhugad & Khargihill dams. In pursuance of the said objective, broad consensus and in principle understanding was arrived at through consensus building efforts of the Union Government and the States of Gujarat and Maharashtra to ensure optimum and integrated planning, successful implementation and effective monitoring and operation of Damanganga-Pinjal Link Project under National Perspective Plan. The issue of water sharing, quantum of diversion in link canal, exploring the possibilities of hydropower generation in Damanganga basin, extending the link to Tansa reservoir etc., raised by States will be addressed and resolved before the finalisation of the DPR.
4. It is proposed that the Gujarat State will get the benefits of Par-Tapi-Narmada link Project through en-route irrigation from the link canal and also in the drought prone Saurashtra and Kutch region by way of substitution. The sharing of hydro power produced in the power house located in this link project will also be studied during the

17
preparation of DPR. In pursuance of the said objective, broad consensus and in principle understanding was arrived at through consensus building efforts of the Union Government and the States to ensure optimum and integrated planning, successful implementation and effective monitoring and operation of Par-Tapi-Narmada Link Project under National Perspective Plan.
5. The feasibility of utilisation of water by Maharashtra State in their territory by lifting water over the western divide will also be examined during preparation of DPR. The issue of compensating the quantity of water contributed from Maharashtra catchments raised by Maharashtra State will be decided by States mutually after preparation of DPR when diversion quantity through this link is firmed up.
6. At DPR stage, the size of canal from Ukai Dam to Narmada canal will be decided based on simulation studies, keeping in view the request of Government of Gujarat about retaining the size of canal as designed in Feasibility Report of Par-Tapi-Narmada link considering the diversion of water from Tapi basin.
7. The preparation of DPR of both the links, i.e. Par-Tapi-Narmada and Damanganga-Pinjal link will be taken up together by National Water Development Agency, an autonomous body under the Ministry of Water Resources on behalf of Union Government.
8. Both the States shall enter into and abide by Agreements with the Union Government and amongst themselves in the larger interest of combating natural calamities of floods and droughts in different regions of the country.
9. Any review / amendment of the MoU shall be done if the same is agreeable to by all the parties.
10. This is being executed amongst the State of Gujarat, State of Maharashtra and Union Government for preparation of the DPRs of Damanganga-Pinjal Link Project and Par-Tapi-Narmada Link Project.

18
1.6 Selection of Proposed Scheme: 1.6.1 Earlier Proposals
The Government of Gujarat in the year 1973 has carried out a broad study with particular reference of meeting the needs of the drought prone areas of the State. The study contained proposals to inter-link the river of the State with the object of better utilisation of water resources in the State. This study was submitted to the Government of India.
Thereafter, the Government of India requested Gujarat to furnish a
master plan, incorporating studies regarding the availability of water, its committed and projected utilisation and proposals for diversion of surplus waters to the needy areas. Accordingly, a report titled “National Perspectives for Water Resources Development – Master plan of Gujarat for utilisation of surplus water of west flowing rivers south of Tapi” was prepared by Irrigation Department, Government of Gujarat in 1981.
The proposal envisaged a link canal inter-connecting the
Damanganga, the Tapi and the Narmada rivers. This link canal proposed transfer of surplus waters from the west flowing rivers, south of Tapi viz, Damanganga, Par, Auranga, Ambica and Purna, to the Ukai left bank canal, thereby releasing 2580 MCM (2.09 MAF) of waters for utilisation in the needy areas of both Tapi and Narmada basins releasing in turn an equal quantity of water as an exchange from Ukai reservoir. Out of this quantity, about 380 MCM (0.31 MAF) of water was proposed to be utilized for irrigating C.C.A. of about 50000 hectares between the proposed link canal and Ukai Right Bank Main Canal which does not have any other sources of irrigation. Culturable command area of about 25,000 hectares to the right of the canal was proposed to be brought under lift irrigation utilising about 190 MCM (0.15 MAF) of water. The remaining quantity of 2010 MCM (1.63 MAF) was proposed to be transferred further north for extension of irrigation in the Saurashtra and Kutch areas through the Narmada high level canal.
The total water resources of these west flowing rivers were assessed
at 11,991 MCM (9.72 MAF), out of which the quantity of about 5,738
19
MCM (4.65 MAF) could be utilized in Gujarat. The transfer of surplus waters from these west flowing rivers was proposed to be effected by building storage reservoirs across these rivers and constructing a link canal of about 290 Km length from Damanganga to Karjan. The contemplated link canal was to be a contour canal with its alignment roughly determined on the basis of quick toposheet studies. Three alternative alignments as mentioned below were thought of:
Alternative I: The waters from the reservoirs on these rivers can be fed to the existing Ukai left bank canal system and the equivalent quantity of 720 MCM (0.6 MAF) would become available at Ukai. This quantity plus 1860 MCM (1.49 MAF) i.e. 2580 MCM of surplus waters available in the reservoirs would be available for further transfer to the areas north of Tapi.
Alternative II: A parallel canal linking these reservoirs and opposite in direction to the Ukai left bank canal may be run to feed the Ukai reservoir itself.
Alternative III: An arterial canal carrying surplus waters from these reservoirs may be runcrossing the Tapi and the Narmada on its way and emptying in Narmada command.
Detailed feasibility studies and accurate cost estimates based on
surveys and designs could only give a correct idea about the relative merits of the three alternatives. However, a transfer of 2580 MCM (2.09 MAF) of water was envisaged from the storages on these rivers and this quantity of water seemed to be adequate to irrigate an area of about 3.44 lakh hectares (8.5 lakh acres) considering an overall delta of 0.76 m (2.5 ft.).
When NWDA came into existence and the study of the Damanganga to Tapi link was carried out, it was found that major portion of yield from the catchment of Damanganga in Gujarat was being developed for utilisation in Gujarat itself through Madhuban dam and very little surplus water from the Gujarat portion of catchment were left for diversion through the Damanganga-Tapi Link. With this in view, toposheet studies and later prefeasibility studies of Par-Tapi-Narmada Link were carried out by NWDA, where the link starts from Par riverinstead of Damanganga River.

20
Pre-Feasibility Report on Par – Tapi-Narmada Link (Technical study
No.PFR/5/90) circulated in March 1991 envisaged diversion of 1389 MCMsurplus water of Par, Auranga, Ambica and Purna basins to Narmada command system besides enroute irrigation. As per this study, the link canal originates from river Par and terminates at Ukai reservoir on Tapi river. Further the proposed link canal takes off from the right side of the Ukai reservoir and terminates at Vadodara Branch Canal of Narmada Canal System after crossing Narmada river. 1.6.2 Proposal at Feasibility Report Stage
The Pre-Feasibility Report prepared by NWDA was discussed and accepted by the TAC of NWDA. Thereafter, the feasibility study of Par-Tapi-Narmada Link was carried out and the report was circulated to the concerned State Government and the Members of TAC of NWDA during August, 1995. As per this report a total quantity of 2904 MCM was considered for diversion which includes: 1554 MCM of water assumed to be surplus in Tapi basin at Ukai reservoir; and 1350 MCM of water available as surplus at the seven dams proposed under Par - Tapi – Narmada link project. However, the water balance study of Tapi basin at Ukai dam carried out by NWDA in the year 2002 revealed that Tapi basin is water deficit at Ukai dam. Hence, the transfer of 1554 MCM of water of Tapi basin from Ukai reservoir will not be available for diversion through Par-Tapi-Narmada link. Water Resources Department, Government of Gujarat, Gandhinagar vide their letter No. NWDA-1095/2538/(1)/k3 dated 01.02.1996 had also indicated that there is no likelihood of surplus water in Tapi basin at Ukai and suggested to revise feasibility study of Par-Tapi-Narmada link without considering augmentation of water from Tapi basin.
In view of the above, the FR of Par-Tapi-Narmada link (circulated in
the year 1995) was revised considering only the surplus water of 1350 MCM available from the 7 reservoirs proposed in Par – Tapi – Narmada link project. As per the revised study it is found that Par-Tapi portion of the link canal will remain unchanged and in the Tapi-Narmada portion of the link canal the length of the canal will be reduced to 190 km from earlier 225

21
km and the link canal will now terminate at Miyagam Branch Canal instead of Vadodara Branch canal of Narmada Canal System.
The proposal at FR stage consists of the following components: (i) A 773.50 m long composite earth - cum - concrete dam at Jheri across
river Par in Peint taluka of Nasik district of Maharashtra State with FRL 246 m and corresponding gross storage capacity of 186 MCM;
(ii) A 947 m long composite earth - cum - concrete dam at Mohankavachali across river Par in Kaprada taluka of Valsad district of Gujarat State with FRL 158 m and corresponding gross storage capacity of 347 MCM;
(iii) A 1306 m long composite earth - cum - concrete dam at Paikhed across river Nar, a tributary of river Par in Dharampur taluka of Valsad district of Gujarat State with FRL 248 m and corresponding gross storage capacity of 217 MCM.
(iv) A 2837 m long composite earth - cum - concrete dam at Chasmandva across river Tan, a tributary of Auranga river in Dharampur taluka of Valsad district of Gujarat State with FRL 214 m and corresponding gross storage capacity of 79 MCM;
(v) A 1656 m long composite earth - cum - concrete dam at Chikkar across river Ambica in Ahwa taluka of Dang district of Gujarat State with FRL 210 m and corresponding gross storage capacity of 129 MCM;
(vi) A 1046 m long composite earth - cum - concrete dam at Dabdar across river Khapri, a tributary of Ambica river in Ahwa taluka of Dang district of Gujarat State with FRL 169 m and corresponding gross storage capacity of 204 MCM;
(vii) A 1284 m long composite earth - cum - concrete dam at Kelwan across river Purna in Ahwa taluka of Dang district of Gujarat State with FRL 164 m and corresponding gross storage capacity of 255 MCM;
(viii) Construction of three diversion barrages one each in the downstream of Paikhed, Chasmandva and Chikkar dams.
(ix) Six power houses: one each at the toe of Jheri, Paikhed, Chasmandva and Chikkar dams; and two power houses, one each at the falls of Dabdar feeder canal and Kelwan feeder canal.

22
(x) A 400 km long link canal (including feeder canals and two tunnels of total about 5.5 km long).
The Par – Tapi – Narmada link will provide irrigation to a total area
of 1.69 lakh hectare annually which includes 0.52 lakh hectare new command areas in its en-route in Vansda and Chikhali talukas of Navsari district; Valod, Vyara, Songadh, Uchhal, Mandvi and Mangrol talukas of Surat district (undivided); Ahwa taluka of The Dang district; and Valia, Ankleshwar and Jhagadia talukas of Bharuch district of Gujarat State;and take over about 1.17 lakh hectare areas in the command area of existing Miyagam Branch Canal of Narmada canal system. The Narmada water so saved will be utilized in drought affected Saurashtra and Kutch region of North Gujarat by substitution for providing irrigation, domestic water supply etc through Narmada canal System. The project will also generate about 93 Mkwh of hydropower from the 6 power houses proposed at various dams and canals fall, besides providing drinking water to the villages in the vicinity of the reservoirs and en -route of link canal. 1.6.3 Proposal at DPR Stage
The topographical survey and other investigations have been carried outduring the preparation of DPR. Based on the investigations at DPR stage and also considering the scarce availability of borrow area and sand in the project area, certain changes have been made in various components of the project. Due to resistance from local public while carrying out the field survey and Investigations works at DPR stage no surveys could be carried out at Mohankavchali dam, As such the Mohankavchali dam has not been considered in the planning of Par – Tapi – Narmada link. However at later stage when required field investigations at Mohankavchali may be carried out as this dam can also be dovetailed with the Par – Tapi – Narmada link. In the present planning the waters from Jheri reservoir will be directly transferred to Paikhed reservoir through a tunnel. The Proposal at DPR stage consists of following components: i) A 808.32 m long composite embankment (concrete face rock fill)
cum concrete dam across river Par near village Jheri with FRL 246.00

23
m and corresponding gross storage capacity 206.03 MCM. The length of concrete face rock fill portion of the dam is 663.32 m and the length of concrete non-overflow section and spill way is 145.00 m. The dam axis is located at Latitude 20°22'25" N and Longitude 73°25'51" E.
ii) A 1431.85 m long composite embankment (concrete face rock fill) cum concrete dam across river Nar (a tributary of Par river) near village Paikhed with FRL 248.00 m and corresponding gross storage capacity of 229.53 MCM. The length of concrete face rock fill portion of the dam is 1310.85 m and the length of concrete non-overflow section and spill way is 121.00 m. The dam axis is located at Latitude 20°27'42" N and Longitude 73°23'37" E;
iii) A power house of 9.0 MW installed capacity at the toe of Paikhed dam with 3 units each of 3 MW.
iv) A 2781.00 m long composite embankment (concrete face rock fill) cum concrete dam across river Tan (a tributary of Auranga river) near village Chasmandva with FRL 214.00 m and corresponding gross storage capacity of 83.63 MCM. The length of concrete face rock fill portion of the dam is 2703.00 m and the length of concrete non overflow section and spill way is 78.00 m. The dam axis is located at Latitude 20°37'02" N and Longitude 73°22'36" E.
v) A power house of 2.0 MW installed capacity at the toe of Chasmandva dam with 2 units each of 1 MW.
vi) A 1887.00 m long composite embankment (concrete face rock fill) cum concrete dam across river Ambica near village Chikkar with FRL 210.00 m and corresponding gross storage capacity of 141.99 MCM. The length of concrete face rock fill portion of the dam is 1736.00 m and the length of concrete non overflow section and spill way is 151.00 m. The dam axis is located at Latitude 20°42'00" N and Longitude 73°30'50" E.
vii) A power house of 2.0 MW installed capacity at the toe of Chikkar dam with 2 units each of 1 MW.
viii) A 1170.00 m long composite embankment (concrete face rock fill) cum concrete dam across river Kapri (a tributary of Ambica river)

24
near village Dabdar with FRL 169.00 m and corresponding gross storage capacity 222.38 MCM. The length of concrete face rock fill portion of the dam is 1035.00 m and the length of concrete non overflow section and spill way is 135.00 m. The dam axis is located at Latitude 20°48'58" N and Longitude 73°32'05" E.
ix) A power house of 3.2 MW installed capacity at the toe of Dabdar dam with 2 units each of 1.60 MW.
x) A 1330.00 m long composite embankment (concrete face rock fill) cum concrete dam across river Purna near village Kelwan with FRL 164.00 m and corresponding gross storage capacity of 282.17 MCM. The length of concrete face rock fill portion of the dam is 1141.00 m and length of concrete non overflow section and spill way is 189.00 m. The main dam axis is located at Latitude 20°55'30" N and Longitude 73°32'00" E.
xi) A power house of 2.5 MW installed capacity at the toe of Kelwan dam with 2 units each of 1.25 MW.
xii) A power house of 2.0 MW installed capacity at the fall of feeder pipe line connecting Kelwan dam with main link canal with 2 units each of 1 MW.
xiii) A tunnel of about 12.70 km long with 3.00 m diameter (D shape) and bed slope of 1:875 connecting Jheri reservoir with Paikhed reservoir.
xiv) A 147.50 m long barrage in the downstream of Paikhed dam with crest level of 136.00 m.
xv) A 128.00 m long barrage in the downstream of Chasmandva dam with crest level of 123.00 m.
xvi) A 369.043 km long link canal off-taking from Paikhed barrage at FSL 142.80 m.
xvii) A 100 m long tunnel No.1 at RD 14.650 to 14.750 km; A 350 m long tunnel No.2 at RD 24.000 to 24.350 km; A 200 m long tunnel No.3 at RD 32.350 to 32.550 km; A 50 m long tunnel No.4 at RD 37.750 to 37.800 km; and A 450 m long tunnel No.5 at RD 51.500 to 51.950 km;

25
xviii) A 2.859 km feeder canal connecting main canal with Chasmandva barrage.
xix) A 14.342 km inter connecting canal Chikkar and Dabdar reservoirs.
xx) A 12.258 km feeder canal connecting main canal with Dabdar dam.
xxi) A 7.616 km feeder canal connecting main canal with Kelwan dam.
xxii) Cross Drainage / Cross Masonry works including Regulators, Escapes, Road/Railway bridges
The creation of six reservoirs will submerge an area of 6065 ha in Nasik district of Maharashtra, Valsad and Dang districts of Gujarat State.
1.7 Proposed Modifications in Command area of Par-Tapi-Narmada
Link Project
1.7.1 Need for Modification The DPR of the Par-Tapi-Narmada Link Project was completed by NWDA in August, 2015 and sent to the Govts. of Gujarat and Maharashtra vide Director General, NWDA, New Delhi D.O Letter No.NWDA/Tech-I/200/44-I/Vol.V/12269 dated 25.08.2015 for their views. In response, Government of Gujarat have conveyed their observations on DPR of Par-Tapi-Narmada Link Project vide letter No.Gen/2010/GoI-3/Part-I/MI Cell dated 21.05.2016 and letter No. S/2015/NWDA/2540/J dated 29.07.2016. Government of Gujarat suggested (i) to explore possibilities for providing maximum irrigation facilities to Tribal areas on right side of the canal by lift (ii) to take over the five projects proposed by the Government of Gujarat on left side of the canal in addition to enroute command and target command in Saurashtra etc. to the extent possible. In this context, Chief Engineers level meeting was held between NWDA and NWRWS & Kalpasar Department, Government of Gujarat at Gandhinagar on 11thNovember, 2016 for firming up of modifications in DPR of Par-Tapi-Narmada Link Project. Also, discussions were held between the then OSD now the Secretary, MoWR, RD&GR, Government of

26
India and the Chief Secretary, Government of Gujarat on 11th November, 2016 and 9th February,2017 regarding Par-Tapi-Narmada Link Project. Secretary, MoWR, RD&GR vide D.O Letter No. 2/7/2007-BM(pt) dated 25.11.2016 requested to convey the consent of Government of Gujarat for new irrigation Planning of Par-Tapi-Narmada Link Project so as to modify the DPR and facilitate early implementation of the project. To finalise the issues for modifications of DPR, Secretary, MoWR, RD&GR alongwith the officers of NWDA and Gujarat Department held a meeting with the Hon’ble Chief Minister on 31.12.2016. It was suggested to modify the DPR by inclusion of following tribal and other areas in the beneficiary area of PTN link proposal (i) Inclusion of command areas of the Projects proposed by the
Government of Gujarat on left side of the canal in South Gujarat. To include the command area of five projects proposed by the
Government of Gujarat namely i) Ugta ii) Sidhumber iii) Khata Amba iv) Zankhari and v) Khuntali. (ii) Providing irrigation to the Tribal areas enroute right side of Link
Canal by lift. Providing water for irrigation by lift for possible maximum Tribal
areas on right side of the Link Canal. (iii) Irrigation in Tribal areas in the vicinity of reservoirs.
Providing irrigation in tribal areas of Dangs and Valsad districts of Gujarat and Nasik district of Maharashtra directly from the all six reservoirs under link by lift. (iv) Irrigation in Tribal areas right side of the Narmada Main Canal
by lift in Chhota Udepur and Panchmahal Districts.
Provide irrigation in the tribal areas of Chhota Udepur and Panchmahal districts of the Gujarat State from Narmada Main Canal on substitution basis.

27
(v) Provision for drinking water
Provision for drinking water for all villages of Dang and Navsari districts, Kaprada and Dharampur taluks of Valsad district and the villages located on the periphery of Jheri Reservoir in Nasik district. (vi) Filling of Panchayat and village tanks in the periphery of
Reservoirs.
Provision for filling all possible tanks in benefitted areas. A line diagram showing the modified water planning of Present
Detailed Project is given at Figure 1.1.
It was also suggested to explore techno-economic feasibility for providing pipe line system instead of open canal for main canal of the link to avoid/minimize the land acquisition in tribal areas as well as to reduce evaporation/seepage losses under Par-Tapi-Narmada Link Project. Secretary, Government of Gujarat also vide letter No. Gen/2010/GoI-3/(3)/Part/MI Cell(K-1) dated 18.01.2017 requested NWDA to explore the above possibility, while revising the DPR. NWDA examined the feasibility of pipe line system instead of open canal for Par-Tapi-Narmada Link Canal. As per the study, it reveals that the gradient vis-à-vis ideal velocity of flows in pipe lines have become the constraints in laying the pipe line system due to prevailing large difference of head between the canal off-take point and out-fall point at Ukai reservoir. As the link canal runs mostly in cutting, laying a number of gravity pipe lines with very flatter gradients and lesser velocities for diversion of large discharges lead to heavy excavation which escalates the project cost leading to no significant reduction in land acquisition for the Par-Tapi-Narmada link canal. The note on techno-economic feasibility of providing pipe line in lieu of main canal has been sent to the NWRS & Kalpsar Department, Government of Gujarat vide Letter No. NWDA/IC/V/T-143/504-10 dated 14.03.2017. However, NWDA suggested that gravity pipe line can be adopted in place of feeder canals as discharges are small and lies in hilly

28
terrain. Copy of the minutes of the Chief Engineers level meeting dated 09.02.2017 is enclosed at Annexure – 1.18. Based on the discussions with the Government of Gujarat from time to time during the above meetings, NWDA modified the DPR of the Par-Tapi-Narmada Link Project. 1.7.2 Project Planning and Optimisation of Benefits
The DPR of Par-Tapi-Narmada Link Project has been modified considering the views / suggestions of Government of Gujarat as mentioned in the preceding pages at para 1.7.1. The optimised project benefits of PTN link are as below:
I. Irrigation Benefits
1. Provision of irrigation to tune of 61190 ha new command area in enroute of link canal in Navsari, Tapi, Dang and Bharuch districts.(No change from August-2015 DPR )
2. Providing irrigation in the 45561 ha command area of Ugta,
Sidhumber, Khata Amba, Zankhari and Khuntali projects proposed by Government of Gujarat in Valsad, Navsari and Tapi districts. The details are in Table 1.3 below:
Table – 1.3
Details of Proposed projects of Government of Gujarat
Sl.
No
Name of Reservoir
River Taluka Benefitted
District
Benefitted
Culturable Command Area (ha)
Annual
Irrigation (ha)
1 Sidhumber Man river
Dharampur
Chikhli
Valsad
Navsari
17441 17441
2 Ugta Par river Dharampur Valsad 4963 4963 3 Khuntali Dholdo / Dharmpur Valsad 3162 3162
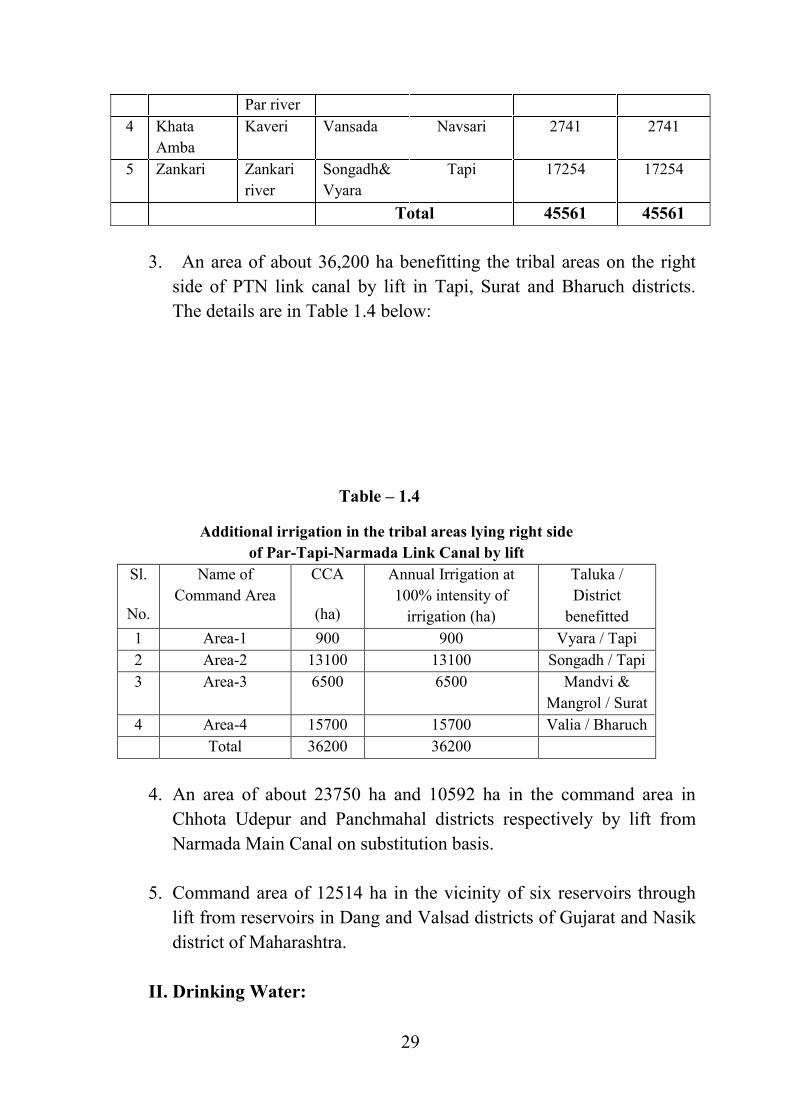
29
Par river 4 Khata
Amba Kaveri Vansada Navsari 2741 2741
5 Zankari Zankari river
Songadh& Vyara
Tapi 17254 17254
Total 45561 45561
3. An area of about 36,200 ha benefitting the tribal areas on the right side of PTN link canal by lift in Tapi, Surat and Bharuch districts. The details are in Table 1.4 below:
Table – 1.4
Additional irrigation in the tribal areas lying right side of Par-Tapi-Narmada Link Canal by lift
Sl.
No.
Name of Command Area
CCA
(ha)
Annual Irrigation at 100% intensity of
irrigation (ha)
Taluka / District
benefitted 1 Area-1 900 900 Vyara / Tapi 2 Area-2 13100 13100 Songadh / Tapi 3 Area-3 6500 6500 Mandvi &
Mangrol / Surat 4 Area-4 15700 15700 Valia / Bharuch Total 36200 36200
4. An area of about 23750 ha and 10592 ha in the command area in
Chhota Udepur and Panchmahal districts respectively by lift from Narmada Main Canal on substitution basis.
5. Command area of 12514 ha in the vicinity of six reservoirs through
lift from reservoirs in Dang and Valsad districts of Gujarat and Nasik district of Maharashtra.
II. Drinking Water:

30
6. A provision of 76 MCM of water is made to supply drinking water for about 27.5 lakh populations for most of the villages of Dang and Navsari Districts, Kaprada and Dharampur talukas of Valsad District and the villages located on the periphery of Jheri reservoir in Nasik district.
Distribution of above water to all villages by pipeline system will be planned by the Government of Gujarat on its own at the time of execution of the project.
7. Provision for filling all possible tanks in tribal areas.
A Provision of about 50 MCM water is made for filling 2226 Panchayat tanks and village tanks/check dams in all the tribal areas in the vicinity of the project. Thus the Par-Tapi-Narmada link Project will provide water to meet the domestic and Industrial water requirements of the villages enroute the link canal along with the villages located in the vicinity of all the proposed reservoirs. Details of irrigation / drinking water benefits /water demands under Par-Tapi-Narmada link Project considering all the above modifications are given at Table 1.5:
Table – 1.5
Irrigation / Drinking water benefits and water Demand of Par-Tapi-Narmada Link project
Sl.
No.
Reach / Feedar CCA (ha) Annual Irrigation
(ha)
Annual Utilisation in (MCM)
In Tribal areas
Non-Tribal
Total
1 Enroute command
51173 10017 61190 61190 382
2 Project proposed by Government of Gujarat on the left side of link canal
40631 4930 45561 45561 285
3 Tribal area 36200 0 36200 36200 138

31
enroute right side of link canal by lift
4 Tribal area in the vicinity of reservoirs
12514 0 12514 12514 48
5 Tribal areas on right side of Narmada Main Canal by lift
a.Chhota Udepur dist.
b.Panchmahal dist.
14940
1833
8810
8759
23750
10592
23750
10592
90
40 6 Supply of
drinking water for all villages of Dang District and Villages of Kaprada & Dharmpur taluka of Valsad District.
Provision of 76 MCM made for about 27.5 lakh population of these areas.
76
7 Filling all possible tanks in benefitted areas.
Provision of 50 MCM water has been kept for filling 2226 Panchayat and village tanks/ check dams in benefit.
50
8 Target command in Saurashtra region
0 42368 42368 42368 161
Sub Total
157291 74884 232175 232175
9 Environmental releases
20
10 Evaporation losses
40
Total 1330 MCM
II. Power Benefits

32
Six power houses: one each at the toe of Paikhed, Chasmandva,
Chikkar, Dabdar and Kelwan dams and one at the fall of the feeder pipe line connecting Kelwan reservoir to the main canal are proposed. The power potential study of the powerhouses proposed in Par – Tapi – Narmada link project has been carried out by THDCIL. The details such as number of generating units, installed capacity and annual energy generation in the 90% dependable year and at 95 % plant availability are given in Table – 1.6:
Table – 1.6 Power Potential
S No.
Powerhouse Installed Capacity (MW) Annual Energy
Generation (MU)
Number of Units
Installed Capacity of each Unit (MW)
Total
1 Paikhed dam PH
3 3.00 9.00 45.53
2 Chasmandva dam PH
2 1.00 2.00 5.67
3 Chikkar dam PH
2 1.00 2.00 8.35
4 Dabdar dam PH 2 1.60 3.20 16.60 5 Kelwan dam
PH 2 1.25 2.50 13.07
6 Kelwan feeder canal PH
2 1.00 2.00 12.48
Total 20.70 101.70 Say 21.00 102.00
III. Flood Control Benefits

33
Though no flood cushion has been provided in the proposed sixreservoirs they will provide incidental benefit of flood moderation in the rivers where reservoirs are identified viz.Par,Auranga, Ambica and Purna rivers.
IV. Other Benefits
Besides above benefits, many other incidental benefits such as pisciculture, recharge of ground water in downstream areas of the proposed dams and in the command area, development of agro based industries and food processing units due to enhancement of water availability, improvement in water availability for irrigation & drinking in the vicinity of the reservoirs, employment generation during construction phase and afterwards, tourism development, development of infrastructure etc. will accrue from the project. This will result in upliftment of socio-economic conditions of people in the vicinity of the project area.
1.8 Methodology Adopted The Feasibility Report of Par – Tapi - Narmada Link Project prepared by National Water Development Agency formed the basis for proceeding further for preparation of Detailed Project Report and make suitable changes based on detailed survey and investigations and updated hydrological and other studies. 1.8.1 Data Collection The preparation of Detailed Project Report of Par – Tapi - Narmada Link Project requires various data / information. The rainfall and meteorological data were collected from India Meteorological Department (IMD), Pune; hydrological data collected from Central Water Commission and State Water Resources Departments; Remote sensing data (LISS- IV) from NRSC, Hyderabad; Topo-sheets from Survey of India. The data / information required by various Designs Directorates of Central Water Commission were collected during the field surveys.

34
Laboratory testing of rock cores samples and various construction material samples were carried out by Central Soil & Material Research Station; geological mapping and investigations were carried out by Geological Survey of India, Jaipur. These data formed the inputs for design of various components of the project. The Hydrological studies and Irrigation Planning was carried out by Central Water Commission. Simulation analysis was carried out for optimising the height of various dams. The simulation analysis formed inputs for the power potential studies carried out by Tehri Hydro Development Corporation of India Ltd. (THDCIL) and the output given by THDCIL in the form of power potential studies formed input for civil designs of hydel structures. The designs of various components of the project were carried out by Central Water Commission. Thus, there were many activities apart from the normal data collection and these activities were successfully managed by National Water Development Agency officers and various data required by the consultants were supplied to them for carrying out various consultancy works for preparation of Detailed Project Report of Par-Tapi-Narmada Link assigned to them. 1.8.2 Planning and Lay-out
The Par-Tapi-Narmada Link Project has been planned to transfer the surplus waters of West flowing Par, Auranga, Ambica and Purna river basins of South Gujarat and neighbouring Maharashtra to provide maximum possible irrigation facilities to tribal areas enroute on right side of the Par-Tapi-Narmada link canal; tribal dominant Dang and Valsad district of Gujarat and Nasik district of Maharashtra; tribal areas of Naswadi, Kavant, Sankheda, Jetpur Pavi, Chhota Udepur taluks of Chhota Udepur district, and Halol, Ghogamba and Kalol talukas of Panchmahal district by lift directly from Narmada Main Canal on substitution basis. The link project will also provide irrigation to the command areas of five projects proposed by the Government of Gujarat in its initial reaches and cater the water demands for irrigation & drinking purposes on its enroute. The link project also takesover the part command area of existing Miyagam Branch Canal of Narmada Canal System. The Narmada waters so saved in Sardar Sarovar Project would be utilized for Chhota Udepur and Panchmahal district and in drought affected Saurashtra area of Gujarat through Narmada Canal System to meet irrigation, domestic and other requirements.

35
The Par-Tapi-Narmada Link Project comprises construction of six dams: namely Jheri dam across Par river, Paikhed dam across river Nar – a tributary of river Par, Chasmandva dam across river Tan –a tributary of river Auranga, Chikkar dam across river Ambica, Dabdar dam across river Khapri – a tributary of river Ambica and Kelwan dam across river Purna. Also, Construction of 2barrages – one each in the downstream of Paikhed and Chasmandva dams; a tunnel inter connecting Jheri and Paikhed reservoirs; six power houses; and construction of 406.118km long link canal (including 5tunnels along the canal and feeder pipe lines) connecting all six dams with existing Miyagam Branch Canal of Narmada Canal System are envisaged. The details of various components are given below: 1.8.2.1 Jheri Dam
Jheri dam is proposed across river Par near village Jheri in Peint taluka of Nasik district of Maharashtra. The total length of Jheri dam is 808.32m of which 663.32m is concrete face rock fill dam (CFRD) and remaining 145.0 m length will be of concrete. The length of spillway is 91.0 m and has been proposed in the river portion.
The surplus waters available at Jheri reservoir will be transferred to Paikhed reservoir through a tunnel of 12.70km length.
1.8.2.2 Paikhed Dam
Paikhed dam is proposed across Nar river a tributary of Par river near village Paikhed in Dharampur taluka of Valsad district of Gujarat. The total length of Paikhed dam is 1431.85 m of which 1310.85 m is concrete face rock fill dam (CFRD) and remaining 121.0m length of dam will be of concrete. The spillway has been proposed in the right flank of the dam. A penstock is proposed in extreme left of the concrete portion of the dam for taking water to the power house located at the toe of the dam.
The surplus waters available at Paikhed reservoir is to be released into the river through powerhouse and will be picked-up at Paikhed barrage from where the Par – Tapi – Narmada link canal will offtake and carry the surplus waters of Jheri and Paikhed reservoirs.

36
1.8.2.3 Chasmandva Dam
Chasmandva dam is proposed across river Tan, a tributary of Auranga river near village Chasmandva in Dharampur taluka of Valsad district of Gujarat. The total length of Chasmandva dam is 2781.0m of which 2703.0 m is concrete face rock fill dam (CFRD) and remaining 78.0 m length of dam will be of concrete. The chute spillway has been proposed in the right flank of the dam. A penstock is proposed in extreme left of the concreteportion of the dam for taking water to the power house.
The surplus water available at Chasmandva reservoir is to be released into the river through powerhouse and will be picked-up at Chasmandvabarrage, from where a feeder pipelines will carry the surplus water of Chasmandva reservoir upto main Par - Tapi – Narmada link canal.
1.8.2.4 Chikkar Dam
Chikkar dam is proposed across river Ambica near village Chikkar in Ahwa taluka of Dang district of Gujarat. The total length of Chikkar dam is 1877.0 m of which 1736.0 m is concrete face rock fill dam (CFRD) and remaining 151.0 m length of dam will be of concrete. The chute spillway has been proposed in the right flank of the dam. A penstock is proposed in extreme left the concrete portion of the dam for taking water to the power house.
The Chikkar and Dabdar reservoirs will be inter-connected by a pipeline. The surplus water available at Chikkar reservoir will be released into inter-connecting canal through the powerhouse and will be taken to Dabdar reservoir. 1.8.2.5 Dabdar Dam
Dabdar dam is proposed across river Khapri a tributary of Ambica river near village Dabdar in Ahwa taluka of Dang district of Gujarat. The total length of Dabdar dam is 1170 m of which 1035 m is concrete face rock fill dam (CFRD) and remaining 135 m length of dam will be of concrete. The spillway has been proposed in the right flank of the dam. A penstock is
37
proposed in extreme left of the concrete portion of the dam for taking water to the power house located at the toe of the dam.
A feeder pipeline will carry the combined surplus waters ofChikkar and Dabdar reservoirs upto main Par – Tapi – Narmada link canal after power generation at its head. 1.8.2.6 Kelwan Dam
Kelwan dam is proposed across river Purna near village Kelwanin Ahwa taluka of Dang district of Gujarat. The total length of Kelwan dam is 1330 m of which 1141 m is concrete face rock fill dam and remaining 189m length of dam will be of concrete. The spillway has been proposed in the river portion. A penstock is proposed in extreme right of the concrete portion of the dam for taking water to the power house located at the toe of the dam.
After the power generation in dam toe power house, a feeder pipeline will carry the surplus water available at proposed Kelwan reservoir upto main Par – Tapi – Narmada link canal. Hydro-power will also be generated at the end of feeder pipeline.
1.8.2.7 Paikhed Barrage
Paikhed barrage is proposed across river Nar about 4.60Km downstream of proposed Paikhed dam to facilitate the release of combined surplus waters of Jheri and Paikhed reservoirs into the link canal. The total length of Paikhed barrage is 147.50 m. 1.8.2.8 Chasmandva Barrage
Chasmandvabarrage is proposed across river Tan about 8.50 Km downstream of proposed Chasmandva dam to facilitate the off take of the feeder pipeline to release the surplus water of Chasmandva reservoir into the link canal. The total length of Chasmandvabarrage is 128.0m. 1.8.2.9 Link Canal

38
The Par – Tapi – Narmada link canal will off take from proposed Paikhed barrage with Full Supply Level (FSL) of 142.800m. The feeder pipelines from Chasmandva barrage to transfer surplus waters of Chasmandva reservoir; from Dabdar reservoir to transfer Surplus waters of proposed Chikkar and Dabdar reservoirs; and from proposed Kelwan reservoir to transfer surplus water at Kelwan reservoirs will join link canal at RD 62.072 km, 108.250 km and 129.600 km respectively.
The canal will out fall in existing Ukai reservoir at FSL of 105.275 m. The Par – Tapi – Narmada link canal will further off takes from saddle of Ukai dam in the right flank at FSL81.790 m. The link canal will cross Kim, Amravati, Karjan, Narmada, Orsang and Hiren rivers, besides other small streams, before joining existing Miyagam Branch Canal at RD16.70 km and will take over its part command area.
1.8.2.10 Powerhouse
A power house is proposed at the toe of Paikhed dam to generate the hydro power from the combined surplus waters of Jheri and Paikhed reservoirs. For generation of hydro power from the surplus Chasmandva waters, a power house has been proposed at the toe of proposed Chasmandva dam. A power house is proposed at the toe of proposed Chikkar dam. After hydro power generation the Chikkar water will be transferred to proposed Dabdar reservoir through an inter connecting pipe line. The power house proposed at the toe of Dabdar dam will generate the hydro power by utilizing combined waters of proposed Chikkar and Dabdar reservoirs. At Kelwan dam a power house is proposed at the dam toe and another power house at the fall of feeder pipe line. Total 6 power houses are proposed. 1.8.3 Survey & Investigations
On receipt of concurrence from Government of Maharashtra and Gujarat, the work for preparation of Detailed Project Reports of Par-Tapi-Narmada and Damanganga-Pinjal Link Projects were taken-up by National Water Development Agency during January, 2009. Subsequently, the Memorandum of Understanding has also been signed by States of Gujarat

39
and Maharashtra with Union Government for preparation of Detailed Project Reports of Par-Tapi-Narmada and Damanganga-Pinjal Link Projects on 3rd May, 2010.
The work for preparation of Detailed Project Report of Par-Tapi-Narmada link project was taken up by National Water Development Agency utilising one Circle Office located at Valsad. One division office located at Valsad has been utilized and erstwhile Investigation Sub Division, NWDA, Vadodara has been upgraded to division office. The works for carrying out Survey & Investigations for preparation of Detailed Project Report of Par-Tapi-Narmada Link Project was taken-up during the year 2009, jointly by division offices located at Valsad and Vadodara.
The permission for carrying out the Survey & Investigations work in the forest area was obtained from Principal Chief Conservator of Forest, Government of Gujarat, Gandhinagar vide their letter No. Land/29/B/3034-36/08-09 date 12th December, 2008 (Annexure – 1.6). Similar permission for Maharashtra area has been obtained from Deputy Conservator of Forest (West), Government of Maharashtra, Nasik vide their letter No. Land/CA/4294 Date 25th November, 2008 (Annexure – 1.7) for Surgana and Peint taluka of Nasik district. The details of the Survey & Investigation works carried out departmentally are listed in Para 1.8.3.1 and 1.8.3.2. 1.8.3.1 Survey & Investigations Works Carried out Departmentally
The NWDA has adopted two pronged strategy for carrying out the Survey & Investigation works for preparation of Detailed Project Report of Par-Tapi-Narmada link Project. The major parts of the detailed Survey & Investigation works of the project for which in-house capability was available has been carried out by National Water Development Agency itself, whereas other specialised Survey & Investigation works and other technical studies were out sourced to the institutions of eminence in respective fields, mostly the Government agencies. Survey & Investigation works carried out departmentally by National Water Development Agency are as under:

40
i. Topographical Surveys along dam axis of Paikhed, Chasmandva, Chikkar and Dabdar dam sites. The similar survey at Jheri and Kelwan reservoirs was carried out at the time of preparation of Feasibility Report and the same data has been used in preparation of DPR;
ii. Topographical surveys along barrage axis of Paikhed and Chasmandvabarrages (carried out at the time of preparation of Feasibility Report and the same data has been used in preparation of DPR);
iii. Reservoir submergence area surveys for Jheri and Paikhed reservoirs (carried out at the time of preparation of Feasibility Report and the same data has been used in preparation of DPR);
iv. Reservoir submergence area survey of Chasmandva reservoir carried out by NWDA through Survey of India at the time of preparation of Feasibility Report and the same data has been used in preparation of DPR;
v. Reservoir submergence area survey of Chikkar, Dabdar, and Kelwan reservoirs carried out by Government of Gujarat through Survey of India during the year 1975and the same data has been used in preparation of DPR;
vi. Topographical Surveys along the alignment of Par - Tapi portion for a length of about 100 kmfrom Par river to Ambica river (carried out at the time of preparation of Feasibility Report and the same data has been used in preparation of DPR);
vii. Topographical Surveys along the alignment of Tapi- Narmada portion for a length of 61.595 km from Ukai dam;
viii. Sample Command Area survey for enroute command - 4200 ha; ix. Topographical surveys along river course upstream and downstream of
Jheri dam; upstream and downstream of Paikhed dam;upstream and downstream of Paikhed barrage; upstream and downstream of Chasmandva dam and barrage;upstream and downstream of Chikkar dam; upstream and downstream of Dabdar dam;upstream and downstream of Kelwan dam (carried out at the time of preparation of Feasibility Report and the same data has been used in preparation of DPR);
x. NWDA has established three gauge sites during preparation of DPR, one gauge site across river Nar (a tributary of Par river) on the cause-way at a location between proposed Paikhed dam site and barrage site and two gauge sites across river Tan (a tributary of Auranga river) at location just

41
downstream of proposed Chasmandva dam site and on the cause way at a location between Chasmandva dam site and barrage site. Hourly gauge observations during monsoon period were carried out at these sites for the period from July 2009 to October 2012.No Gauge sites could be established at the remaining dam sites viz. Jheri, Chikar, Dabdar, and Kelwan due to opposition from the local people.
1.8.3.2 Survey and Investigation Works Carried Out by Other Agencies 1.8.3.2.1 Topographical Surveys
Topographical surveys of about 72 km in Par – Tapi reach from Ambica river crossing up to its out fall into Ukai reservoir, 132 km of canal alignment in Tapi-Narmada reach starting from RD 61.595 km and upto Miyagam Branch Canal, at the left side periphery of Ukai reservoir to decide the out fall location of link canal, Alternative link canal alignment to cross the river Tapi downstream of Ukai dam for a length of about 15 km and the river surveys for Purna and Ambica rivers (except the small portion of rivers near the dam sites, which could not be surveyed due to public hindrance) were completed by outsourcing the works. 1.8.3.2.2 Borrow Area Survey, Construction Material Survey and
Testing of Rock Core Samples
The work of Borrow Area Survey for Paikhed, Chasmandva, Chikkar and Kelwan dams;petrographic analysis of sand samples and testing of construction material has been carried out by Gujarat Engineering Research Institute (GERI), Surat at Feasibility Report stage. Testing of rock core samples was carried out by Geological Survey of India, Jaipur and Central Soil & Material Research Station (CSMRS), New Delhi. The rock samples for use as crushed were collected from various quarries located in the project area and testing of these samples to ascertain their suitability to be used as crushed sand has been carried out by Central Soil and Material Research Station (CSMRS), New Delhi 1.8.3.2.3 Geological Survey

42
The geological survey along the Jheri, Paikhed, Chasmandva, Chikkar, Dabdar and Kelwan dam sites has been carried out by Geological Survey of India, Jaipur.
1.8.3.2.4 Drilling Work
The drilling work along theChasmandva and Paikhed dam axis was carried out through private firmduring preparation of DPR. The drilling work at Jheri, Chikkar and Dabdar dam axis was carried out by engineering Geology Division, WRI, Government of Gujarat, Vadodara. The logging of rock cores recovered from these drill holes was done by GSI, Jaipur. The laboratory testing of rock core samples was carried out by GSI, Jaipur and Central Soil and Material Research Station, New Delhi. 1.8.3.2.5 Demarcation of Command Area Enroute of the Link Canal
Demarcation of enroute command area has been got done through Regional Remote Sensing Centre (RRSC), Jodhpur by using Remote Sensing Technology.
1.8.3.3 Technical Studies 1.8.3.3.1 Design of Important Project Components and Writing of
Design Chapter
The Par-Tapi-Narmada link Project envisages construction of six dams,two diversion barrages, about 406.118km long link canal (including feeder pipelines and 5 tunnels of 1.150km length along the canal), a tunnel of about 12.70 km length connecting Jheri and Paikhed reservoirs, and six power houses. The design of the important structures and the preparation of design chapter have been carried out by Central Water Commission involving the following Design Directorates:
1. HCD(N&W) Directorate 2. CMDD (N&W) Directorate 3. Embankment Design (N&W)Directorate 4. Gates Design (N&W)Directorate 5. Barrage and Canal Design (N&W) Directorate

43
Four Feeder pipelines are proposed under the Link Project as detailed below:
i) Feeder pipe line from Chasmandva barrage to Main Canal ii) Feeder pipe line interconnecting Chikkar & Dabdar reservoirs iii) Feeder pipe linefrom Dabdar reservoir to Main Canal iv) Feeder pipe linefrom Kelwan reservoir to Main Canal
Preliminary design of feeder pipelines has been done by NWDA. Detailed design of feeder pipelines will be carried out at the time of execution of the project.
1.8.3.3.2 Irrigation Planning
Irrigation planning studies of the link project were carried out by Irrigation Management Organization, CWC, New Delhi at original DPR stage.The same has been modified by NWDA incorporating the suggestions of Government of Gujarat. However basic planning of project remained unchanged. The alignment of the link canal kept unchanged. 1.8.3.3.3 Construction Planning, Equipment Planning and Man-
power Planning
The Construction Planning, Equipment Planning and Man-power Planning has been carried out by construction machineries consultancy (CMC) Directorates of Central Mechanical Organisation, Central Water Commission, New Delhi. 1.8.3.3.4 Hydrological Studies
The hydrological studies of Par-Tapi-Narmada link Project have been carried out by Hydrology (South) Directorate of Central Water Commission, New Delhi. 1.8.3.3.5 Power Potential and Electrical & Mechanical Studies

44
The Power Potential study and Electrical & Mechanical (E&M)
studies were carried out by Tehri Hydro Development Corporation India Ltd., (THDCIL),Rishikesh. 1.8.3.3.6 Study of Seismic Parameters
The Seismic study of Par-Tapi-Narmada link Project has been carried out by Central Water & Power Research Station (CW&PRS), Pune. 1.8.3.3.7 Morphological Study
Morphological study of the Par, Nar, Tan, Ambica, Khapri and Purna rivers has been carried out by Regional Remote Sensing Centre, Nagpur
1.8.3.3.8 Mineral Surveys
Mineral Surveys are carried out by GSI, Jaipur. 1.8.3.3.9 Archaeological Surveys
Archaeological Surveys were carried out through Archaeological Survey of India (ASI), Vadodara for Gujarat part and ASI, Aurangabad for Maharashtra part. 1.8.3.3.10 Cadastral Surveys Cadastral maps for both Maharashtra and Gujarat portion have been collected from concerned district authorities. Based on the data and with the help of BISAG, Gandhinagar the cadastral maps of all the 7 reservoirs and canal alignment have been prepared.
1.8.3.3.11 Soil Surveys
The taluka wise reports of the soil survey carried out by Gujarat Government in respect of the districts falling in the en-route command area have been collected from the Agriculture Department, Government of Gujarat. Reports on land irrigability and soil classification of Banni area of

45
Kutchh region and SSNNL phase I (Upto Mahi river), Soil classification report and soil maps for the talukas lying in reservoir submergence areas and link alignment have also been collected. Using this information the soil map of the enroute command area has been prepared.
1.8.3.4 Socio-economic Survey and Environmental Impact Assessment Studies
These studies have been carried out by M/s WAPCOSLtd. A Committee was constituted by National Water Development Agency for empanelment of consultant for socio-economic and environmental impact assessment studies under Chief Engineer, Environment Management Organisation (EMO), Central Water Commission with Director (Technical), NWDA; Director (Finance), NWDA; Superintending Engineer, NWDA and two Experts as Members. The composition of the Committee is at Annexure -1.8 in Volume - II. The scope of the Committee was further modified and preparation of Terms of Reference (TOR), Request for Proposal (RFP) for inviting the bids, evaluation of the bids, and recommendation of suitable agency for award of work were included in the functions of the Committee (Annexure - 1.9 in Volume - II). The Expression of Interests were invited by the Committee from various consultancy firms and the eligible firms were short listed. The Terms of Reference for carrying out comprehensive EIA studies were prepared and submitted to the Ministry of Environment & Forest (MoEF) for vetting. The MoEF vide letter No.J-12011/55/2008-IA.I dated 08-06-2009 has accorded the clearance for pre-construction activities at the proposed site and TORs for preparation of EIA report (Annexure -1.10 in Volume - II). Based on these Terms of References, Request for Proposal document was prepared and the proposals were invited from the short listed consultancy firms. The consultancy work for EIA studies was finally awarded to M/s Water & Power Consultancy Services (WAPCOS), Gandhinagar.
To monitor and review the progress of work of EIA studies, a Committee was constituted by NWDA under the Chairmanship of Chief Engineer (South), NWDA; with Director (MDU), NWDA; Superintending Engineer, NWDA and two out-side Experts as Members (Annexure -1.11 in Volume - II). Subsequently this Committee was reconstituted under the Chairmanship of Chief Engineer (EMO), Central Water Commission, New

46
Delhi with Chief Engineer (South), NWDA; Representative of NWDA head office; Superintending Engineer, NWDA and two out-side Experts as Members (Annexure -1.12 in Volume - II). 1.8.4 Engineering Assessment and Front End Engineering 1.8.4.1 Dam and Head Works (i) Jheri Dam
The height of the Jheri dam has been designed as 73.00m high with top width as10.0m. The FRL of the Jheri dam has been kept as 246.00 m. The concrete portion of the dam will be 145.00 m long whereas concrete faced rock fill portion will be 663.32m. The spillway will have 5 nos. of gates of size 15 X 12 m.
(ii) Paikhed Dam
The height of the Paikhed dam has been designed as93.0m high with top width as10.0m. The FRL of the Paikhed dam has been kept as 248.0 m. The concrete portion of the dam will be 121.0 m long whereas concrete faced rock fill portion will be 1310.85 m. The spillway will have 4 nos. of gates of size 15 X 12 m. The power house of 9.0 MW installed capacity at dam toe is proposed with 3 units of 3 MW each. (iii) Chasmandva Dam
The height of the Chasmandva dam has been designed as52.0m high with top width as 10.0m. The FRL of the Chasmandva dam has been kept as 214.0m. The concrete portion of the dam will be 78 m long whereas concrete faced rock fill portion will be 2703 m. The spillway will have 3 nos. of gates of size 12 X 12 m. The power house of 2.0 MW installed capacity at dam toe is proposed with 2 units of 1 MW each. (iv) Chikkar Dam
The height of the Chikkar dam has been designed as63.0m high with top width as10.0m. The FRL of the Chikkar dam has been kept as 210.0m.
47
The concrete portion of the dam will be 151.0 m long whereas concrete faced rock fill portion will be 1736.0 m. The spillway will have 4 nos. of gates of size 15 X 12 m. The power house of 2.0 MW installed capacity at dam toe is proposed with 2 units of1 MW each. (v) Dabdar Dam
The height of the Dabdar dam has been designed as 65.0 m high with top width as 10.0 m. The FRL of the Dabdar dam has been kept as 169 m. The concrete portion of the dam will be 135.0 m long whereas concrete faced rock fill portion will be 1035 m. The spillway will have 5 nos. of gates of size 15 X 12 m. The power house of 3.2 MW installed capacity at dam toe is proposed with 2 units of1.60 MW each. (vi) Kelwan Dam
The height of the Kelwan dam has been designed as 58.0m high with top width as 10.0 m. The FRL of the Kelwan dam has been kept as 164 m. The concrete portion of the dam will be 189.0 m long whereas concrete faced rock fill portion will be 1141.0 m. The spillway will have 5 nos. of gates of size 15 X 12 m. The power house of 2.5 MW installed capacity at dam toe is proposed with 2 units of 1.25 MW each. The power house proposed at fall of the feeder pipe line connecting Kelwan dam with link canal will have 2 units of1MW each 1.8.4.2 Tunnel Connecting Jheri and Paikhed Reservoirs
The total length of tunnel from Jheri and Paikhed reservoirs will be about 12.7 Km with diameter as 3.0 m and bed slope 1:875 The tunnel will be of D shaped.
1.8.4.3Barrages (i) Paikhed Barrage
This barrage will be 147.50 m long with spillway of 138.50 m (7 bays of 15 m width with 5 nos. of piers of 4.5 m thick and 1 no. of double pier of 11 m thick). A head regulator is provided at the upstream right side of the

48
barrage. Par-Tapi-Narmada link canal will offtake from this head regulator at crest level of 136.0 m.
(ii) Chasmandva Barrage
This barrage will be 128 m long with spillwayof 122 m (8 bays of 12 m width with 6 nos. of piers of 3.0 m thick and 1 no. of double pier of 8 m thick). A head regulator is provided at the upstream right side of the barrage. Chasmandva feeder pipe line will offtake from this head regulator at crest level of 123.0 m.
1.8.4.4 Link Canal
Total length of Par-Tapi-Narmada link canal is 406.118 km including feeder pipelines and tunnels along the link canal. The length of Par-Tapi reach link canal is 177.736 km off taking from the Paikhed barrage. The head reach of canal has been designed for a capacity of 38.17cumec. The canal will have8.5m bed width &2.80 m full supply depth at its head and 16.5m bed width & 2.80m full supply depth at its tail end. The length of Tapi-Narmada reach of link canal is 191.307 km off taking from the Ukai reservoir. The head reach of canal has been designed for a capacity of46.64cumec. The canal will have 8.80m bed width &3.22 m full supply depth at its head and 5.0m bed width &2.65m full supply depth at its tail end.The design details are summarized below in Table- 1.7:
Table – 1.7 Design details of Par-Tapi-Narmada link canal
Hydraulic particulars of Main canal of Par-Tapi-Narmada link canal
Sl. No.
Reach Design discharge of canal
Bed slope 1 in
Bed width
Fully supply depth
From To km km cumec m m 1 2 3 4 5 6 7
PAR-TAPI- REACH
1 0.000 62.072 38.170 7500 8.500 2.800 2 62.072 108.250 46.640 7500 10.500 2.800

49
3 108.250 129.600 46.640 8000 10.950 2.800
4 129.600 177. 736 63.690 8500 16.500 2.800
TAPI-NARMADA REACH
1 0.000 51.043 46.640 10000 8.800 3.220 2 51.043 69.150 36.400 10000 7.500 3.120 3 69.150 82.171 31.890 10000 5.600 3.060 4 82.171 191. 07 17.260 10000 5.000 2.650
Four feeder pipe lines are also proposed. Details of these feeder pipe
lines are also summarized in Tables -1.8:
Table – 1.8 Design details of feeder pipe lines
Sl. No.
Feeder pipe line Length Km
Bed slope
Design Discharge in cumec
Dia. of
Pipe
Nos. of pipe
1 Feeder Pipe line from Chasmandva weir to Main Canal
2.8591 1 in 5500
8.50 2.6 m 2
2 Feeder Pipe line interconnecting Chikkar & Dabdar Reservoirs
14.342 1 in 7500
6.40 2.5m 2
3 Feeder Pipe line from Dabdar Reservoir to main canal
12.258 1 in 5000
17.00 2.9m 3
4 Feeder Pipe line from Kelwan Reservoir to main canal
7.62 1 in 5500
17.00 2.6m 4

50
1.8.5 Ecological, Socio-economic and Financial Aspects
WAPCOS Ltd, Gandhinagar has carried out the Environmental Impact Assessment Studies of Par – Tapi – Narmada Link Project, the results / recommendations of the study are furnished below: I. Ecological Aspects
The impacts on flora and fauna like increased pressure on aquatic
ecology due to indiscriminate fishing, reduced productivity due to increase in turbidity, migratory fish species, spawning & breeding grounds, degradation of riverine ecology and increased potential for reservoir fishes have been studied. In addition, impacts on rare, endangered and threatened species, access to food and shelter for animals, increased pressure on wood & timber due to labour force, migratory labour population, terrestrial flora, wildlife movement, diversity and productivity of flora, economically / genetically / biologically important plant species, compensatory afforestation, reservoir rim treatment plan, etc. were also studied. Aspects like Catchment Area Treatment Plan, Land Management Plan, Command Area Management, Bio-diversity Management & Fisheries Development Plan, Surface and Groundwater Management, Public Health Management, Environmental Monitoring Programme, Dam Break Analysis and Disaster Management, implementation schedule have been considered and suitable provisions have been kept in the estimate.
No significant rich mineral deposits have been identified in the catchment and hence no acidification of any of the proposed reservoirs is anticipated. Necessary minimum flows in the Par, Nar, and Tan, Ambica, Khapri and Purna rivers during lean season will flush the untreated sewage and hence no impact is expected on river water quality. The flooding of previously forested and agricultural land in the submergence area will increase the nutrients resulting from decomposition of vegetative matter. Enrichment of impounded water with organic and inorganic nutrients will be main water quality problem which will last for a

51
short duration of few years from the time of filling the reservoir. The water samples’ tests indicate that organic and heavy metal components in the water are within permissible limits. No major adverse impact due to the project is anticipated on environmental and ecological angle.
II. Socio-economic Aspects
About 6065 ha of land will be submerged due to creation of 6 reservoirs proposed in Par – Tapi – Narmada link project. Total 61villages will be affected by these reservoirs. Twobarrage proposed under the link project will submerge an area of about 79 ha. 406.118 Km long link canal (including feeder canals) will require 4399ha land area. The impact on Project Affected People (PAP) in the affected villages as well in influenced villages has been studied while carrying out the Environmental Impact Assessment studies. The reservoir wise details are described in the following paragraphs: i Jheri Reservoir
Jheri reservoir will submerge an area of about 836.0ha of land which includes 408.0ha of forest land, 256.0ha of culturable land and the remaining 172.0ha is other land including river portion. Total 6villages will be partially affected due to creation of Jheri reservoir. The impact on all project affected people in all 6affected villages has been studied while carrying out the Environmental Impact Assessment studies. Total 98house-holds will be affected by Jheri reservoir. The average literacy rate in the area is 88%. 73% of the house-holds in the submergence area of Jheri reservoir are belong to Scheduled Tribe category. The primary schools are available in 6 affected villages, middle schools are available in 6 affected villages and college facility is available at average distance of more than 10 km. The main source of domestic water supply in all affected villages is from wells, few villages are having tube wells and hand pumps also. Electric power supply is available in all villages. The medical facilities such as allopathic hospitals, maternity hospital and child welfare centers, primary health centers (PHC) are available at average distance of less than 10 km, except for one village where these facilities are available within 5 to 10 km distance. All the villages are connected with public transport and telephone

52
facilities. Banking facilities are not available in any of the affected villages; however, credit societies are functioning in few of the affected villages. ii Paikhed Reservoir
Paikhed reservoir will submerge an area of about 994.00 ha of land which includes 317.0 ha of forest land, 589.0 ha of culturable land and the remaining 88.0 ha is other land including river portion. Total 11villages will be affected due to creation of Paikhed reservoir. The impact on all project affected people in all 11affected villages has been studied while carrying out the Environmental Impact Assessment studies. Total 331house-holds will be affected by Paikhed reservoir. The average literacy rate in the area is 63 %. 97 % of the house-holds in the submergence area of Paikhed reservoir are belong to Scheduled Tribe category. The primary schools are available in 11 affected villages, middle schools are available in 3 affected villages and college facility is available at average distance of more than 10 km. The main source of domestic water supply in all affected villages is from wells, few villages are having tube wells and hand pumps also. Electric power supply is available in 10 villages. The medical facilities such as allopathic hospitals, maternity hospital and child welfare centers, primary health centers (PHC) are available at average distance of more than 10 km. All the villages are connected with public transport and telephone facilities. Banking facilities are not available in any of the affected villages, however, credit societies are functioning in few of the affected villages. iii Chasmandva Reservoir
Chasmandva reservoir will submerge an area of about 615.0 ha of land which includes 300.0 ha of forest land, 255.0 ha of culturable land and the remaining 60.0 ha is other land including river portion. Total 7 villages will be partly affected due to creation of Chasmandva reservoir. The impact on all project affected people in all 7 affected villages has been studied while carrying out the Environmental Impact Assessment studies. Total 379 house-holds will be affected by Chasmandva reservoir. The average literacy rate in the area is 58 %. 99 % of the house-holds in the submergence area of Chasmandva reservoir are belong to Scheduled Tribe category. The primary schools are available in 7 affected villages, middle schools are notavailable

53
in 7 affected villages and college facility is available at average distance of more than 10 km. The main source of domestic water supply in all affected villages is from wells, few villages are having tube wells and hand pumps also. Electric power supply is available in all villages except in one village.The medical facilities such as allopathic hospitals, maternity hospital and child welfare centers, primary health centers (PHC) are available at average distance of more than 10 km, except for few villages where these facilities are available within 5 to 10 km distance. All the villages are connected with public transport and telephone facilities. Banking facilities are not available in any of the affected villages, however, credit societies are functioning in few of the affected villages. iv Chikkar Reservoir
Chikkar reservoir will submerge an area of about 742.0 ha of land which includes 300.0 ha of forest land, 332.0 ha of culturable land and the remaining 110.0 ha is other land including river portion. Total 9 villages will be partlyaffected due to creation of Chikkar reservoir. The impact on all project affected people in all 9 affected villages has been studied while carrying out the Environmental Impact Assessment studies. Total 345 house-holds will be affected by Chikkar reservoir. The average literacy rate in the area is 63 %.99.77 % of the house-holds in the submergence area of Chikkar reservoir are belong to Scheduled Tribe category. The primary schools are available in 9 affected villages, middle schools are available in 9 affected villages and college facility is available at average distance of more than 10km. The main source of domestic water supply in all affected villages is from wells, few villages are having tube wells and hand pumps also. Electric power supply is available in all villages. The medical facilities such as allopathic hospitals, maternity hospital and child welfare centers, primary health centers (PHC) are available at average distance of more than 10 km, except for few villages where these facilities are available within 5 to 10 km distance. All the villages are connected with public transport and telephone facilities. Banking facilities are not available in any of the affected villages, however, credit societies are functioning in few of the affected villages.
v Dabdar Reservoir

54
Dabdar reservoir will submerge an area of about 1249.0 ha of land which includes 614.0 ha of forest land, 482.0 ha of culturable land and the remaining 153.0 ha is other land including river portion. Total 11 villages will bepartly affected due to creation of Dabdar reservoir. The impact on all project affected people in all 11 affected villages has been studied while carrying out the Environmental Impact Assessment studies. Total 563house-holds will be affected by Dabdar reservoir. The average literacy rate in the area is 65 %. 99 % of the house-holds in the submergence area of Dabdar reservoir are belong to Scheduled Tribe category. The primary schools are available in 11 affected villages, middle schools are not available in 11 affected villages and college facility is available at average distance of more than 10 km. The main source of domestic water supply in all affected villages is from wells, few villages are having tube wells and hand pumps also. Electric power supply is available in all villages. The medical facilities such as allopathic hospitals, maternity hospital and child welfare centers, primary health centers (PHC) are available at average distance of more than 10 km, except for few villages where these facilities are available within 5 to 10 km distance. All the villages are connected with public transport and telephone facilities. Banking facilities are not available in any of the affected villages, however, credit societies are functioning in few of the affected villages. vi Kelwan Reservoir
Kelwan reservoir will submerge an area of about 1629.0 ha of land which includes 890.0 ha of forest land, 450.0 ha of culturable land and the remaining 289.0 ha is other land including river portion. Total 17villages (1fully and 16partly) will be affected due to creation of Kelwan reservoir. The impact on all project affected people in all the affected villages has been studied while carrying out the Environmental Impact Assessment studies. Total 793house-holds will be affected by Kelwan reservoir. The average literacy rate in the area is 62 %. 99.60 % of the house-holds in the submergence area of Kelwan reservoir are belong to Scheduled Tribe category. The primary schools are available in 17 affected villages, middle schools are not available in 17 affected villages and college facility is available at average distance of more than 10 km. The main source of domestic water supply in all affected villages is from wells, few villages are

55
having tube wells and hand pumps also. Electric power supply is available in all villages. The medical facilities such as allopathic hospitals, maternity hospital and child welfare centers, primary health centers (PHC) are available at average distance of more than 10 km, except for few villages where these facilities are available within 5 to 10 km distance. All the villages are connected with public transport and telephone facilities. Banking facilities are available in one of the affected villages, however, credit societies are functioning in few of the affected villages. III Financial Aspects
After extensive survey / study of the project affected families and land acquisition, the Resettlement & Rehabilitation Plan for project affected families was suggested based on the National Resettlement and Rehabilitation Policy 2007 of Ministry of Rural Development, Government of India and also the Resettlement and Rehabilitation Policy of Sardar Sarovar Project of Gujarat. Provision of Rs. 445Crores has been kept for Environmental Management Plan. The total cost of the Rehabilitation & Resettlement plan for the affected families has been worked out as Rs. 1126 Crores. The details of the Environmental Impact Assessment studies and Socio-economic studies of Par – Tapi – Narmada link Project are furnished in Chapter 11 and 12 respectively. IV Financial and Economic Analysis
The total cost of Par – Tapi – Narmada link project including Rehabilitation & Resettlement plan for the project affected people has been worked out to be Rs. 10211.21 Crores at 2014-15 price level. Annual cost of the project including cost of maintenance of head works, dam appurtenants, power house, tunnels, canal, CD structures etc works out to be Rs. 1223.65 Crores. The benefits from Irrigation, power generation, water supply and fishries works out to be Rs. 1265.87 Crores. The benefit-cost ratio and the Internal Rate of Return (IRR) of the project works out to be 1.035 and 10.172%respectively.

56
1.8.6 Monitoring Mechanism
In order to monitor and supervise, the over-all work of preparation of Detailed Project Report of Damanganga-Pinjal and Par-Tapi-Narmada Link Projects, a Monitoring Committee under the Chairmanship of the Chairman, Central Water Commission, New Delhi was constituted by Ministry of Water Resources vide letter No. 2/56/2003-BM/2036 dated 12th November, 2009 (Annexure -1.13 in Volume - II). The Committee consisted representatives of State Government of Maharashtra & Gujarat and various Central Government Departments.
Apart from the above, a high level Committee in the form of Steering Committee headed by the Secretary, Ministry of Water Resources was formed by Union Ministry of Water Resources vide Letter No. 2/56/2003-BM/795-800 dated 7th June, 2006 (Annexure –1.14 in Volume - II) to review the progress of works of DPR of Ken – Betwa link. The same Steering Committee was assigned the work of review the progress of DPR of Par – Tapi - Narmada link project.
1.9 Clearances Required The Par-Tapi-Narmada Link Project will require the following clearances:
Sl.no. Clearances Agency (i) Techno-economic Central Water Commission, TAC
of MoWR, RD & GR (ii) Forest Clearance Ministry of Environment, Forest
and Climate Change (iii) Environmental clearance Ministry of Environment, Forest
and Climate Change (iv) R&R Plan of Tribal
Population Ministry of Tribal Affairs
Based on the above, investment clearance will be accorded by the Ministry of Water Resources, RD & GR.

59
Chapter – 2 Physical Features
2.1 Geographical Disposition
The Par-Tapi-Narmada link canal, its proposed six reservoirs, two
barrages, two tunnels, six power houses, feeder canals and command area are located in the basins of west flowing rivers from Par to Tapi, Tapi and Narmada. The basins of west flowing rivers from Par to Tapi lie between north latitudes 20o 13’ to 21o 14’ and east longitudes 72 o 43’ to 73 o 58’. The Tapi basin lies between north latitudes 20 o 05’ to 22 o 03’ and east longitudes 72 o 38’ to 78 o 17’ while the Narmada basin lies between north latitudes 21o 20’ to 23o 45’ and east longitudes 72o 32’ to 81o 45’. The link traverses between Par and Narmada from south to north. Index map showing rivers, basin boundaries, State boundaries, dams etc is appended at Plate 1.1 in Volume-VII.
2.2 Topography of the Basins, Reservoirs and Command Area
The link canal passes through Par, Auranga, Ambica, Purna,
Mindhola, Tapi and Narmada basins. Physiographic map of the adjoining area of the Par-Tapi-Narmada link project is at Fig - 2.1. Each of the basins is described below separately:
2.2.1 Par Basin
The Par river is one of the important west flowing rivers in the region,
north of Mumbai and south of the Tapi river. The river rises in the Sahyadri hill ranges at an elevation of about 1100 m above mean sea level in Nasik district of Maharashtra State and traverses a distance of 131 km before draining into the Arabian Sea. The Par river travels mostly through hills covered with forest and patches of cultivated lands on banks of river.
The basin lies in the States of Maharashtra and Gujarat and has a effective catchment area of 1648 km2. The percentages of the area of the basin in the States of Maharashtra and Gujarat are 46.91% and 53.09 %

60
respectively. The basin is part of the Western Ghats portion in Maharashtra and Gujarat and is covered by Deccan traps. 2.2.2 Auranga Basin
The Auranga is one of the important west flowing rivers in the region
north of Mumbai city and south of Tapi river. The river is known as Auranga after the confluence of its two tributaries the Man and the Tan. Both tributaries originate in the Sahyadri hill ranges in the Nasik district of Maharashtra State. The river traverses a distance of about 30 km from confluence of the tributaries before draining into the Arabian Sea. The effective drainage area of the Auranga basin is 748 km2, out of which 150 km2 is in Maharashtra State and 598 km2 is in Gujarat State. The area is hilly and covered with forest in the upstream reaches, while the area down-wards from about 15 km upstream of confluence of the Tan and the Man rivers can be described as plain with cultivated lands.
The Tan river rises at an elevation of about 645 m and the elevation where it meets the Man river is about 50 m. The length of the river upto its confluence with Man river is 52 km. The catchment area of the Tan river upto its confluence with Man river is 289 km2, out of which 68 km2 lies in Nasik district of Maharashtra State and the balance 221 km2 lies in the Valsad and Navsari district of Gujarat State. 2.2.2 Ambica Basin
The Ambica which is a west flowing river, rises in the Sahyadri hill
ranges in the Nasik district of Maharashtra State at an elevation of about 1050 m above MSL and after traversing a total distance of 164 km joins the Arabian Sea in the State of Gujarat. The effective drainage area of the Ambica basin 2685 km2 out of which 102 km2 lies in Maharashtra and 2583 km2 is in Gujarat. The important tributaries of the Ambica river are Khapri, Kaveri and Kharera rivers.
The Khapri river rises at an altitude of 1030 m in Sahyadri hill range in Ahwa taluka of Dang district in the State of Gujarat and joins the river

61
Ambica near village Milan at an elevation of 100 m. The length of river Khapri is about 80 km. The Khapri catchment upto its confluence with Ambica river is spread over an area of 537 km2 which is about 19% of the total catchment of the Ambica basin.
2.2.4. Purna Basin
The river Purna, a west flowing river, rises in the Sahyadri hill ranges of the Western Ghats at an elevation of about 1300 m in the Ahwa taluka of Dang district in the State of Gujarat and after traversing a distance of 180 km, it outfalls into the Arabian sea. The level of the river bed drops steeply from 1300 m at source to about 115 m at the dam site as the river in this reach passes through hilly area covered with dense forest and patches of cultivated land. The effective drainage area of the basin is 2193 km2, out of which 58 km2 lies in Maharashtra State and 2135 km2 lies in the State of Gujarat.
The important tributaries of the Purna river are Girra, Jankhari and Damaskhadi rivers.
2.2.5 Tapi Basin
The Tapi basin is bounded on the north by the Satpura range, on east
by the Mahadeo hills, on the south by the Ajanta range and the Satmala hills and on the west by the Arabian Sea. The basin has an elongated shape with a maximum length of 587 km east to west and maximum width of 201 km from north to south. The basin has two well-defined physical regions, viz. the hilly region and the plains. The hilly region covers the Satpuras, the Satmalas, the Ajanta and the Gawilgarh hills with good forests. The Khandesh and the Gujarat plains are broad and fertile areas suitable for cultivation. The Tapi basin consists mainly of black cotton soils. The coastal plains in Gujarat are composed of alluvial clays with a layer of black soil on the surface.
2.2.6 Narmada Basin

62
The Narmada basin is bounded on the north by the Vindyas, on the east by the Maikalu range, on the south by the Satpura and on the west by the Arabian Sea. The basin has five well defined physiographic regions. They are:(1) The upper hilly areas covering the districts of Shahdol, Mandla, Durg, Balaghat and Seoni;(2) The upper plains covering the districs of Jabalpur, Narsimhapur, Sagar, Damoh, Chhindwara, Hoshangabad, Betul, Raisen and Sehore: (3) The middle plains covering the districts of East Nimar, part of west Nimar, Dewas, Indore and Dhar; (4) The lower hilly areas covering part of the west Nimar, Jhabua, Dhulia, Narmada and parts of Vadodara; and (5) The lower plains covering mainly the districts of Narmada, Bharuch and parts of Vadodara. The hill regions are well forested. The upper, middle and lower plains are broad and fertile areas, well suited for cultivation. The Narmada basin mainly consists of black soils. The coastal plains in Gujarat are composed of alluvial clays with a layer of black soils on the surface.
2.2.7 Topography of the Reservoirs
Six storage reservoirs are proposed for storing and diverting the water
through Par-Tapi-Narmada link. These are Jheri dam across Par river; Paikhed dam across Nar river (a tributary of Par river); Chasmandva dam across Tan river (a tributary of Auranga river); Chikkar dam across Ambica river; Dabdar dam across Khapri river (a tributary of Ambica river); and Kelwan dam across Purna river. The Jheri reservoir is entirely lies in Maharashtra whereas, Dabdar and Kelwan reservoirs lies entirely in Gujarat. Other reservoirs namely Paikhed, Chasmandva and Chikkar reservoirs lie in both Gujarat and Maharashtra. The topographical details of six reservoirs are detailed below:
The Jheri dam is proposed across Par River near village ‘Jheri’ in
Peint taluka of Nasik district of Maharashtra State. Paikhed dam is proposed across Nar River (a tributary of Par) near village ‘Paikhed’ in Dharampur taluka of Valsad district of Gujarat State. It is proposed to divert surplus waters from Jheri reservoir to Paikhed reservoir through 12.70 km long inter-connecting tunnel. The combined waters will be released through the Dam toe Power House of Paikhed dam into Nar river and tapped at

63
Paikhed barrage, proposed at about 4.60 km downstream near village ‘Nani Coswadi’ of Dharampur taluka, and let into the Link Canal which off-takes from Paikhed barrage.
The Chasmandva dam is proposed across Tan River (a tributary of
Auranga) near village ‘Chasmandva’ in Dharampur taluka. The surplus waters of Tan River released through the Dam toe Power House of Chasmandva dam will be tapped at Chasmandva barrage, proposed at about 8.50 km downstream near village ‘Chandha Chikadi’ of Dharampur taluka, and will be diverted into the Link Canal by a Feeder Pipeline of about 2.859 km long.
The Chikkar dam is proposed across Ambica River near village
‘Chikkar’ in Ahwa taluka of the Dangs district in Gujarat State. The surplus water of Ambica River will be diverted through a 14.342 km long inter-connecting Pipeline into Dabdar reservoir after power generation at Chikkar dam toe Power House. The Dabdar dam is proposed across Khapri River (a tributary of Ambica) near village ‘Dabdar’ in Ahwa taluka of the Dangs district. The combined surplus flows of Ambica and Khapri Rivers will be diverted into the Link Canal through a 12.258 km long Feeder Pipeline after power generation at Dabdar dam toe Power House.
The Kelwan dam is proposed across Purna River near villages
‘Kelwan’ and ‘Kakarda’ in Ahwa taluka of The Dangs district. The surplus waters of Purna River will be fed to the Link Canal through a 7.616 km long Feeder Pipeline after power generation at Kelwan dam toe Power House. Another Power House is proposed at RD 5.80 km of the Kelwan feeder Pipeline where considerable drop in ground level is observed.
2.2.8 Topography of the Command Area
(i) Topography
Topography of the command area is undulating and of moderate
slope. The command area in Valsad district comprises of Deccan trap Basalt. Basaltic out crops are seen in Vansda taluka of Navsari district in

64
which the Command area lies. The command area in the Dangs district comprises of Deccan trap Basalt. The Command Area in Tapi district is comprises of Deccan trap Basalt of Cretaceous-Eocene age, which is overlain by quaternary alluvium. Limestone and clay formation of Eocene ages and quaternary alluvium formation are seen in Command Area lying in Surat district. In the eastern side of Bharuch district, where the Command Area lies, Basaltic rocks are seen.
(ii) Land Slopes
Slopes of the lands in the command are generally moderate neither steep nor flat.
(iii) Soils
The taluka wise reports of the soil survey carried out by Gujarat Government in respect of the districts falling in the en-route command area have been collected from the Agriculture Department, Government of Gujarat. Reports on land irrigability and soil classification of Banni area of Kutchh region and SSNNL phase I (Upto Mahi river), Soil classification report and soil maps for the talukas lying in reservoir submergence areas and link alignment have also been collected. Using this information the soil map of the enroute command area has been prepared and appended at Plate -4.45 in Volume -VII.
The soils in the command area can be broadly classified into 3 main
categories viz. i) Deep Black, Medium Black to Loamy Sand (Goradu) soils, ii) Deep Black with Alluvial, Laterite and Medium Black Soils and iii) Deep Black Clayey Soils.
2.3 Geology of the Basins, Reservoirs and Command Area 2.3.1 Geology of the Basins
The major part of the ‘Par-Tapi’ portion of the link canal and its
enroute command areas are covered by Deccan trap basalts with isolated

65
deposits of laterite. The geological formations in Par and Auranga basins where Paikhed and Chasmandva dam sites lie, belong to the Precambrian, melipozoice, tertiary and quatertiary ages. Deccan traps which occupy major portion of upper reaches are of two prominent types, one being dark grey to bluish black which are hard, compact and massive and the other being light brown to pink which are soft.
Like in Par and Auranga basins, Deccan traps with dykes occupy
most of the areas of Ambica basin in which Chikkar ad Dabdar dam sites are proposed. The geological formations found in Ambica basin include those of the Quaternary and Tertiary ages. The middle ranges have developed on the Deccan traps and the intermediate amphitheatres have developed out of the alluvial debris washed out from the hills. The lower reaches of the basin contain mainly alluvial plains upto coastal margins.
Deccan traps also occupy most parts of Purna basin in which Kelwan
dam site is proposed. In the east, there are high ridges and deep valleys and towards the west, they merge into the lower reach composed of recent and sub-recent alluvium and sand. The stratigraphical sequences of the rocks found in the basin are Neogene, Paleogene and early Paleogene. A geological map Par-Tapi-Narmada link is at Fig - 2.2. 2.3.2 Geology of Reservoirs
i) Jheri
The Jheri reservoir area is thickly forested and restricted to the valley with steep hills on both sides. Amygdular basalts which are jointed and sheared are encountered in the area. No major fault or shear zone was noted in the area.
ii) Paikhed In the Paikhed reservoir area the Basalts of the Deccan trap forms
foundation rock. The rocks have horizontal to sub horizontal dips. The water percolation test results of these bore holes indicate that the strata in general have low permeability but higher values of equivalent permeability

66
up to 15 lugeons since the rocks in the area have a horizontal to sub horizontal disposition. iii) Chasmandva In the Chasmandva reservoir area the basaltic flows of Deccan Trap form foundation rock. The rock has horizontal to sub horizontal disposition with low permeability.
iv) Chikkar The Chikkar reservoir area consists sub horizontal sequence of lava
flows of Deccan traps. The contacts zone between the successive lava flows are moderately to highly weathered and marked by presence of flow breccias, with predominance of Amygdule. v) Dabdar
The Dabdar reservoir area consists of Deccan traps. The bed rock
constituting the foundation are a sequence of lava flows, which comprises Amygdaloidal, dense, perphyritic basalt and flow breccias with horizontal to sub horizontal dips. vi) Kelwan
The Kelwan reservoir area consists of Deccan traps and it’s
differentiates. The exposed out crops are mainly consisting of horizontal to sub horizontal sequence of lava flows, which includes Amygdaloidal, dense, perphyritic basalt and flow breccias.
2.3.3 Geology of Command Area
The proposed Command Area of the link canal lies in Valsad, Navsari, Dangs, Tapi, Surat and Bharuch, Chhota Udepur and Panchmahal districts of Gujarat State.

67
Geologically the Valsad district comprises of Deccan trap with dykes of quaternary and tertiary ages. The middle ranges have developed on Deccan trap and the intermediate amphitheatres have developed out of the alluvial debris washed from the hills. The lower reaches are mainly alluvial plains.
Geologically the Navsari district comprises of Alluvium (Clay and Sand) and Trap. Basaltic out crops are seen in Vansda taluka in which the Command area lies. Ground water availability in alluvial formations is satisfactory. In Trap area, the availability of ground water is less. The ground water quality in the Command area is good.
Geologically the Dangs district is composed of Deccan trap Basalt. Basalt acts as poor aquifer. The water quality is very good.
Geologically the Tapi district is comprises of Deccan trap Basalt of Cretaceous-Eocene age, which is overlain by quaternary alluvium. The ground water availability is poor in hard rock area but its quality is good.
Limestone and clay formation of Eocene ages and quaternary alluvium formation are seen in Surat district. The ground water availability and quality is good in the proposed Command Area.
Geologically, Bharuch district is mainly divided in two types of rocks. Alluvial formations are seen in western side. In the eastern side, where the Command area lies, Basaltic rocks are seen. Ground water availability and quality is good in the proposed Command Area. Overall, the level of groundwater development in the proposed Command area of the link project can be categorized as “Safe”.
Geologically, in Chhota Udepur district, Rocks of highly intricate and
varied gneissic complex; they are mostly of igneous origin, but on account of interfoliar injection, they have a general northerly foliation strike, and are continuous with gneissic complex of Central Mewar.

68
Geologically, in Panchmahals district Rocks of Aravali System (including Champaners) are Metamorphic and have been affected by tectonic forces forming folds. Basal conglomerates, an impure calcareous facies generally dolomitic in composition, quartzite, phyllites, slates and schists are the rocks under this system. Phyllites are common rocks and occupy large areas with quartzite as intercalations: phyllites grade into schists.
2.4 River System and Catchment Area
Each river system and its catchment area intercepted by the Par-Tapi-Narmada link is described below:
2.4.1 Par Basin
Par is a west flowing river with its catchment area lying in
Maharashtra and Gujarat. It rises at an elevation of 1100 m in the Sahyadri hill ranges near village Gogul of Surgana taluka in Nasik district of Maharashtra. After traversing a distance of about 131 km, it drains into Arabian sea. The important tributaries of the Par river are Aroti, Nar, Bhimtas, Vajri and Keng.
The Par basin lies between North latitudes 20o 16’ and 20o 35’ and
East longitudes 72o 54’ and 73o 44’ with effective drainage area of 1648 km2.
The basin can be divided into two prominent physiographic zones.
The eastern part comes under rugged mountain chains of the Sahyadri hills and descends on the western side to the edge of the uplands of Valsad district. This region is placed at a steep slope of elevation 1050 m to 100 m. The Western part, barring the coastal plains, is essentially in the sub-Sahyadrian zone of hills and valley generally lies at an elevation below 100 m.

69
Deccan traps with dykes of quaternary and tertiary ages occupy most of the area of the basin. The middle ranges have developed on the Deccan traps and the intermediate amphitheatres have developed out of the alluvial debris washed from the hills. The lower reaches of the basin upto the coastal margins are mainly alluvial plains. 2.4.2 Auranga Basin
Auranga is a west flowing river with its catchment in Gujarat and
Maharashtra. The river is known as Auranga after the confluence of its 2 tributaries viz., Man and Tan. The rivers Man and Tan originate in the Sahyadri hill ranges near village Dongar and Kuranjul respectively in Surgana taluka in Nasik district of Maharashtra. The length of Man and Tan rivers upto their confluence is 78 km and 49 km respectively. The Auranga river traverses a distance of about 30 km after the confluence of Man and Tan rivers before draining into the Arabian sea.
Auranga basin lies between north latitudes 200 30' and 200 42' and
east longitudes 720 53' and 730 37' with effective drainage area of 748 km2. A portion of Valsad and Navsari districts of Gujarat and Nasik district of Maharashtra falls in this basin.
The basin forms part of the Western Ghats in Gujarat.
Physiographically, the basin can be divided into 5 groups namely, 1. Hill tops and hill slopes, 2. Hill terraces and uplands, 3. Upper and lower foot slopes (medium land), 4. Valley plains and local depressions (low lands) and 5. River and stream beds.

70
Geological formations in the region belong to the Precambrian, mellpozoic, tertiary and quarternary ages. Deccan traps occupy major portion of the upper reaches. They are of two prominent types viz. dark grey to bluish black which are hard, compact and massive and the light brown to pink which are soft.
2.4.3 Ambica Basin Ambica is a west flowing river with its catchment area in Gujarat and
Maharashtra. It rises in the Sahyadri hill ranges near village Kotambi of Surgana taluka in Nasik district of Maharashtra. After traversing a distance of about 164 km, it drains into the Arabian Sea. Important tributaries of Ambica river are Khapri, Olan, Kaveri and Kharera.
Ambica basin lies between latitudes 20o 31' N and 20o 57' N and longitudes 72o 48' E and 73o 52' E with effective drainage area of about 2685 km2. Valsad, Dangs and Surat districts of Gujarat and a small portion of Nasik district of Maharashtra fall in this basin.
Basin can be divided into 2 prominent physiographic zones. The
eastern part comes under rugged mountain chains of the Sahyadri hills and descends on the western side to the edge of the uplands of Surat district. This region is placed at a general elevation of 1050 to 100 m. Western part, barring the coastal plains, is essentially in the sub-Sahyadrian zone of hills and valleys generally below 100 m elevation.
Deccan traps with dykes of quaternary and tertiary ages occupy most
of the area of the basin. The middle ranges have developed on the Deccan traps and the intermediate amphitheatres have developed out of the alluvial debris washed from the hills. Lower reaches of the basin upto the coastal margins are mainly alluvial plains.
2.4.4 Purna Basin

71
Purna is a west flowing river with its catchment in Gujarat and Maharashtra. The river rises in the Salher hills in the Western Ghats near village Chinchi at an elevation of about 1300 m in Maharashtra State. Total length of the river from its source to outfall in the Arabian Sea is about 180 km. Important tributaries of the river are Dhodar Nallah, Barda nallah, Nagihpar nallah, Girra river, Zankhari river and Dumas khadi.
Purna basin lies between East longitude of 720 44’ and 730 58’ and
North latitudes of 200 44’ and 210 06’ and effective drains an area of 2193 km2.
Basin can be divided in 2 prominent physiographic Zones. The
eastern part comes under rugged mountain chains of the Sahyadri hills and descends on the western side to the edge of the uplands of Surat district. The region is placed at a general elevation of 1300 to 100 m. Western part, barring the coastal plains, is essentially in the sub-sahyadrian zone of hills and valleys and generally below 100 m elevation.
Deccan traps occupy major portion of the upper reaches. In the east,
there are high ridges and deep valleys and towards the west, they merge into the lower reach composed of recent and sub recent alluvium and blown sand. Stratigraphical sequences of the rocks found in the basin are neogene, paleogene and early paleogene. Availability of ground water is restricted to weathered residues and fractured zones.
2.4.5 Tapi Basin
The river Tapi which is the second largest west flowing inland river
of the peninsula rises near Betul district of Madhya Pradesh at an elevation of 752 m. In the head reach for a distance of about 241 km, the river traverses through an open and partially cultivated plain before plunging into a rocky gorge in the Satpura hills. The Tapi basin extends over an area of 65,145 km2 and lies between north latitudes 20o 5’ to 22o 3’ and east longitudes 72o 38’ to 78o 17’ situated in the Deccan plateau. The basin covers a drainage area of 9804 km2 in Madhya Pradesh, 51,504 km2 in Maharashtra and 3837 km2 in Gujarat. The important tributaries joining

72
from the left are the Purna, the Vaghur, the Girna, the Bori, the Panjhra and from the right the Aner. The drainage area of the Tapi basin upto Ukai dam is 62,225 km2 of which 9,804 km2 in Madhya Pradesh, 51,504 km2 in Maharashtra and 917 km2 in Gujarat. The Tapi basin consists of mainly black soil. The coastal plains in Gujarat have alluvial soil with black soil on the surface.
2.5 Basin Characteristics 2.5.1 Rainfall
Par Basin Basin receives about 97% of the annual rainfall during the South-
West monsoon from June to September. The maximum, minimum and annual average rainfall in the basin is 2669 mm, 1920 mm and 2180 mm respectively Auranga Basin
Basin receives most of the rainfall from South-West monsoon during
June to September. 97% of the rainfall occurs during monsoon season. Rainfall during non-monsoon season is meager. Maximum, minimum and average annual rainfall recorded in the basin are 2406 mm,1644 mm and 2055 mm respectively.
Ambica Basin
Basin receives most of the rainfall from south-west monsoon during
June to September. About 98% of the rainfall occurs during the monsoon season. Rainfall during non-monsoon months is meager. Maximum, minimum and average annual rainfall recorded in the basin is 2520 mm, 1460 mm and 1830 mm respectively. Purna Basin

73
Basin receives about 97% of the annual rainfall during south-west monsoon from June to September. Maximum, minimum and annual average rainfall of in the basin is 1972 mm, 782 mm, and 1472 mm respectively. Tapi Basin
The basin comes under the direct influence of the south-west monsoon and receives heavy and assured rainfall between June and August. The rainfall gradually decreases from Karnataka in the south to Gujarat in the north. The south-west monsoon rainfall is usually very heavy. 90% of the rainfall occurs from June to November.
2.5.2 Temperature, Relative Humidity, Wind Speed and Cloud Cover
Two meteorological observatories viz., Surat and Vadodara
maintained by IMD located adjacent to the project area have been used to characterize the climatic condition of the project area. The normal temperature, relative humidity, wind speed and cloud cover observed at Surat IMD observatory (based on the data for the period from 1998 to 2007) and Vadodara IMD observatories (based on the data for the period from 1998 to 2007) are as follows. Temperature:
Monthly mean maximum and minimum temperatures recorded at
Surat and Vadodara stations are 36.8 0C and 14.7 0C and 39.9 0C and 13.2 0C respectively. Humidity:
Monthly mean maximum and minimum relative humidity recorded at
Surat and Vadodara stations are 90% and 53% and 94% and 44% respectively. Wind Speed:

74
Monthly mean maximum and minimum wind speed recorded at Surat
and Vadodara stations are 6.4 km/h and 1.7 km/h and 13.3 km/h and 2.2 km/h respectively.
Cloud Cover:
Monthly mean maximum and minimum wind speed recorded at Surat
and Vadodara stations are 6.2 oktas and 0.7 oktas and 6.4 oktas and 0.8 oktas respectively.

76
Chapter – 3 InterState Aspects
3.1 States Traversed by the Rivers The Par-Tapi-Narmada Link Project in the Western part of India is envisaged to transfer surplus water from west flowing Par, Nar (a tributary of Par River), Tan (a tributary of Auranga River), Ambica, Khapri (a tributary of Ambica) and Purna rivers for providing additional irrigation facilities in South Gujarat and for further diversion towards North Gujarat, predominantly to bring maximum benefits to en-route command areas Tribal areas of Dang, Navsari, Valsad, Chhota Udepur and Panchmahal districts.and in Saurashtra region of North Gujarat The Par, Auranga and Ambica rivers originate in the Maharashtra State and flow through Maharashtra and Gujarat States and drain into the Arabian Sea. The Purna River originates in the Gujarat State and drains into the Arabian Sea after traversing through the Gujarat State. However, the catchment area of all these river basins lies both in Maharashtra and Gujarat States. Therefore, the rivers Par, Auranga, Ambica and Purna are all inter-State rivers. 3.2 Distribution of Catchment in State and Yields from the
Catchment of the State Concerned
The State-wise distribution of catchment area of the river basins and dam sites of Par-Tapi-Narmada link project is given in Table –3.1:
Table – 3.1 State Wise Distribution of the Catchment Area of the Basins/Dam Sites
Sl. No.
Name of Basin / Dam Catchment Area (km2) Maharashtra Gujarat Total
1 Par basin 773 (46.91%)
875* (53.09%)
1648
a Jheri 425 (100 %)
Nil 425

77
Sl. No.
Name of Basin / Dam Catchment Area (km2) Maharashtra Gujarat Total
b Mohankavchali (free catchment)**
79 (38.35%)
127 (61.65%)
206
c Paikhed (Nar river) 269 (85.40%)
46 (14.60%)
315
2 Auranga basin 150 (20.05%)
598* (79.95%)
748
a Chasmandva (Tan river) 62 (69.66%)
27 (30.34%)
89
3 Ambica basin 102 (3.80%)
2583* ((96.20%)
2685
a Chikkar 102 (33.55%)
202 (66.45%)
304
b Dabdar (Khapri river) Nil 457 (100%)
457
4 Purna basin 58 (2.64%)
2135* (97.36%)
2193
a Kelwan Nil 694 (100%) 694
* Effective drainage area ** The Mohankavchali dam has not been considered in the present planning of Par-
Tapi-Narmada link The catchment area of Jheri dam site is lying entirely in Maharashtra
State and the annual surface water yield from the catchment up to the dam site is 391.2 MCM at 75% dependability. The distribution of 75% dependable annual yields on the basis of catchment area and based on catchment area including weighted rainfall in respect of Mohankavchali, Paikhed, Chasmandva and Chikkar dams are given in Table-3.2:

78
Table – 3.2
State Wise Yields from the Catchment Areas of Mohankavchali, Paikhed, Chasmandva and Chikkar Dam Sites
Dam site Basis of
Distribution at 75% Dependability
Gross Yield at Dam Site (MCM)
Yield from Maharashtra Area (MCM)
Yield from Gujarat Area (MCM)
Mohankavchali (free catchment d/s of Jheri dam)*
Based on catchment area
212.70 81.57 131.13
Based on catchment area and weighted rainfall
79.81 132.89
Paikhed Based on catchment area
263.90
225.36 38.54
Based on catchment area and weighted rainfall
220.62 43.28
Chasmandva Based on catchment area
70.00
47.98 22.02
Based on catchment area and weighted rainfall
47.15 22.85
Chikkar Based on catchment area
220.40
73.95 146.45
Based on catchment area and weighted rainfall
74.66 145.74
* Mohankavchali dam has not been considered in the present planning of Par- Tapi-Narmada link

79
The catchment area of proposed Dabdar and Kelwan dams are lying entirely in the Gujarat State. The annual surface water yield at the Dabdar dam site is 322.50 MCM and at Kelwan dam site is 362.20 MCM at 75% dependability.
3.3 (a) Effect on Project and of the Project on the InterState
Agreement on Sharing of Waters, Sharing the Benefits and Costs, Acceptance of Submergence in the Upstream State etc., if any
The preparation of Detailed Project Report of the link project had
been taken up with the concurrence of Governments of Gujarat and Maharashtra during the year 2009. Subsequently, a Memorandum of Understanding (MoU) was signed on 3rd May, 2010 by Hon’ble Chief Ministers of Gujarat and Maharashtra with Hon’ble Union Minister for Water Resources in the presence of Hon’ble Prime Minister for preparation of Detailed Project Reports of Par-Tapi-Narmada and Damanganga-Pinjal links (Annexure-1.3 in Volume-II). As per the tripartite Memorandum Gujarat State will get the benefits of Par-Tapi-Narmada link project through en-route irrigation.
The DPR of Par-Tapi-Narmada Link Project was completed by
NWDA in August, 2015 and sent to the Government of Gujarat and Maharashtra vide NWDA, New Delhi D.O Letter No. NWDA/Tech-I/200/44-I/Vol.V/12269 dated 25.08.2015 for their views.
The issue of water sharing and power sharing between the States of Gujarat and Maharashtra has been discussed at the level of Chief Engineers of the States of Gujarat and Maharashtra and NWDA. Further matter in this regard is taken up at the Senior Officers level of the two States and MoWR, RDandGR, Government of India. Hon’ble Union Minister for WR, RDandGR held meeting with the Hon’ble Chief Minister, Government of Maharashtra on 7th January 2015, 9th January 2016 and 3rd May, 2016 where in Damanganga-Pinjal and Par-Tapi-Narmada Link Projects were discussed among other issues. The Secretary WR, RDandGR held meeting with the Hon’ble Chief Minister, Government of Gujarat on 31-12-2016 at Gandhi Nagar regarding DPR of Par-Tapi-Narmada Link. Government of Gujarat suggested, to include more tribal areas in the beneficiary areas of PTN Link. The DPR has been modified considering the modification /suggestions of

80
Government of Gujarat. The modification in the proposal as per the suggeastion of Government of Gujarat are detailed in para 1.7.1 and briefly furnished below: (i) Inclusion of command areas of the Projects proposed by the
Government of Gujarat on left side of the canal in South Gujarat. Viz., Ugta, Sidhumber, Khata Amba, Zankhari and Khuntali.
(ii) Providing irrigation to the Tribal areas enroute right side of Link
Canal by lift.
(iii) Irrigation in Tribal areas in the vicinity of reservoirs. (iv) Irrigation in Tribal areas right side of the Narmada Main Canal
by lift in Chhota Udepur and Panchmahal Districts. (v) Provision for drinking water in vicinity of reservoirs / Link (vi) Filling of Panchayat and village tanks in the periphery of
Reservoirs.
As mentioned at Para 2 of the MoU, specific MoUs as required shall be entered into amongst the States of Gujarat, Maharashtra and Union Government based on the Detailed Project Report of the Link project and agreements shall be reached on scope of the link, sharing of costs and benefits and arrangements for management and control of water etc.
To review the overall progress of the works for Preparation of Detailed Project Reports of Damanganga-Pinjal and Par-Tapi-Narmada links, the Union Ministry of Water Resources (now Ministry of Water Resources, River Development and Ganga Rejuvenation) had constituted a Steering Committee under the Chairmanship of Secretary, Water Resources. It was decided during 3rd Meeting of the Steering Committee held on 24th December, 2008 that after the Hydrological studies of link projects are completed, a meeting shall be convened with the concerned States to resolve the issue of Water and Power sharing. The Committee to Monitor and Supervise the overall work for preparation of Detailed Project Reports of

81
Par-Tapi-Narmada and Damanganga-Pinjal Link Projects in its 3rd Meeting held on 31stAugust, 2010 at New Delhi under the Chairmanship of Chairman, CWC also desired that a copy of hydrological study carried out by CWC of Par-Tapi-Narmada and Damanganga-Pinjal links shall be made available to the State Governments of Gujarat and Maharashtra for their observations and also for initiating the discussions on the issue of water sharing.
The Hydrological study of Par-Tapi-Narmada link project has been
carried out by NWDA through CWC, New Delhi. After completion of Water Availability Study of river basins and diversion sites involved in Par-Tapi-Narmada link by CWC, three meetings at the level of Chief Engineers were convened so far by NWDA to discuss the issue of sharing of Par, Auranga, Ambica and Purna river water between the States of Gujarat and Maharashtra i.e. on 23rd September, 2011, 14th June, 2013 and 17th June, 2014 respectively (Copy of the minutes are enclosed as Annexure -5.17, 5.18 and 5.19 in the Annexure Volume-II). The issues that have been emerged during the meetings which pertain to Par-Tapi-Narmada link are summarised below:
i) The sharing of water shall be based on the catchment area of the
respective States duly accounting for the variation in catchment rainfall.
ii) The representative of Government of Maharashtra desired that the
water available at Jheri reservoir shall be utilised by Maharashtra Government and water available at Dabdar and Kelwan reservoirs shall be solely utilised by Government of Gujarat and the water available in remaining 4 reservoirs i.e., Mohankavchali, Paikhed, Chasmandva and Chikkar shall be shared by both the States on the basis of the catchment area and variation in the catchment rainfall in the respective States in addition to riparian right. The representatives of Government of Maharashtra also indicated that Maharashtra will utilise their share of water within respective basins in their territory upstream of the reservoirs proposed under Par-Tapi-Narmada link as well in the Godavari and Tapi basins by transfer of water across Western divide.

82
iii) NWDA made a suggestion that due to topographical constraints the Government of Maharashtra may not be able to utilise their full share of water for transfer across western divide and as such, the Government of Gujarat may be allowed to divert the unutilised water from Maharashtra catchment through Par-Tapi-Narmada link for utilisation in en route and drought prone area of Saurashtra and Kutch area in north Gujarat and in lieu of that the Government of Maharashtra may claim share in the Hydro Power likely to be generated through 6 power houses. The representatives of both the States desired to discuss this matter further with their respective Governments to arrive at consensus on these suggestions.
iv) The Methodology adopted in the Water Availability Study Report of Par-Tapi-Narmada link was accepted by both the States and agreed to utilise the details on Gross yield at Jheri, Mohankavchali and Paikhed dam sites of Par basin; Chasmandva dam site of Auranga basin; Chikkar and Dabdar dam sites of Ambica basin; and Kelwan dam site of Purna basin involved in Par-Tapi-Narmada link project and Par, Auranga, Ambica and Purna river basins as a whole for planning of various components of Par-Tapi-Narmada link project as worked out in the Water Availability Study Report of Par-Tapi-Narmada link prepared by CWC.
v) The representative Government of Maharashtra indicated that the areas across the Western Ghats of Maharashtra State in the region i.e. Tapi basin is water short and they are planning to utilize 534 MCM of water from Ambica, Auranga, Nar and Par basins by diversion across the western divide through lift schemes. A note prepared on this issue by TIDC was circulated during the meeting.
vi) Chief Engineer (South), NWDA requested the representative of
Government of Maharashtra to provide the details of lift schemes so that the views of Government of Gujarat can be obtained. The representative of Government of Gujarat was requested to examine and comment on the note circulated by TIDC and to study and indicate their opinion on planning of Par-Tapi-Narmada link project by diverting 1030 MCM of water from Gujarat catchment.

83
vii) The representatives of both the States are of the opinion that the issue of water and power sharing of Par-Tapi-Narmada link project needs to be discussed further.
(I) Sharing of Water
During the 2nd meeting at the level of Chief Engineers, it was also decided that NWDA will prepare a comprehensive note on sharing of water and power benefits between Maharashtra and Gujarat. Accordingly, a note has been prepared and circulated to the States. Both the States agreed that the sharing of water should be on the proportionate catchment area basis duly accounting for the variation in the catchment rainfall.
The proposed distribution of water between Gujarat and Maharashtra at 75% dependability at various dam sites proposed under Par-Tapi-Narmada link project is presented in Table-3.3:
Table – 3.3 Proposed distribution of Water between Maharashtra and Gujarat Dam site Gross yield at
Dam Site (MCM) (at 75%
Dependability)
Proposed Distribution to Maharashtra
(MCM)
Proposed Distribution to Gujarat
(MCM)
Jheri 391.20 391.20 0.00 Mohankavchali 212.70 79.81 132.89 Paikhed 263.90 220.62 43.28 Chasmandava 70.00 47.15 22.85 Chikkar 220.40 74.66 145.74 Dabdar 322.50 0.00 322.50 Kelwan 362.20 0.00 362.20 Total 1842.90 813.44 1029.46 Total excluding Mohankavchali
1630.20 733.63 896.57
Mohankavchali Dam is not considered in the present DPR.
(II) Sharing of Hydro Power
Under Par-Tapi-Narmada link, NWDA has proposed six hydropower

84
schemes, out of which five power schemes are proposed at the toe of Paikhed, Chasmandva, Chikkar, Dabdar and Kelwan dams and one at the available drop of Kelwan feeder pipe line. The total installed capacity of power generation from all the power schemes is 21 MW and the energy generation that could be achieved from the Power stations is 102 Mkwh. It is proposed that the Hydropower generated as above can be provided for use of Maharashtra in lieu of water contributed by Maharashtra State to the link project.
(III) Sharing of Costs
Appropriate agreements shall be entered into amongst the States of Gujarat, Maharashtra and Union Government based on the Detailed Project Report of the Link Project on sharing of costs.
3.3 (b) Effect on Project and of the Project on the InterState Adjudication, if any
No InterState adjudication exists as of now on sharing the waters of Par, Auranga, Ambica and Purna river basins. 3.3 (c) Effect on Project and of the Project on the InterState Aspect of
Territory, Property, etc. Coming under Submergence, Project Affected People, Rehabilitation, Compensation, etc
The details of territory, property, etc. coming under submergence, project affected people, rehabilitation, compensation, etc. are furnished under Chapters “Environment Impact assessment and Environment Management Plan” and “Socio-economic Studies and Rehabilitation and Resettlement Plan”.
3.3 (d) Effect on Project and of the Project on the Existing and
Sanctioned Projects
The water needs of all the existing and contemplated projects have been considered while proposing water diversion from each river basin. So,

85
the Link Project may not be effected by these projects and the Link Project may not affect these projects.
Though the Par-Tapi reach of the Link Canal drops in the Existing Ukai reservoir on Tapi River, neither the water of Tapi River is proposed for diversion in the Link Canal nor the Link Canal supplement the reservoir with the diverted water. The water let in the Ukai reservoir at its left bank will be drawn instantly from its right bank through the Head Regulator of Tapi-Narmada reach of the Link Canal.
3.3 (e) Any Other Aspect of the Project Involving InterState Problems
The issue of compensating the quantity of water contributed from
Maharashtra catchments raised by Maharashtra State shall be addressed.

147
Chapter – 5
Hydrology and Water Assessment
5.0 General
The Par-Tapi-Narmada Link Project involves Par, Auranga, Ambica and Purna river basins of South Gujarat and neighboring Maharashtra State. The Hydrological studies of this project comprising Par, Auranga, Ambica and Purna river basins with Jheri, Paikhed, Chasmandva, Chikkar, Dabdar and Kelwan dam sites were carried out by Hydrological Studies Organization, Central Water Commission, New Delhi. The hydrological studies of the Par-Tapi-Narmada link had been compiled in three volumes by Central Water Commission; Volume– I: Water availability studies; Volume– II: Design flood and diversion flood (in two parts); Volume– III: Sedimentation studies and were appended in “Volume– IV: of DPR i.e Appendices – Hydrology and Water Assessment” of the DPR of the link project prepared by NWDA in August, 2015. Brief details of the studies werealso furnished in “Volume-I: Main Report”of the DPR (August-2015) under Chapter-5 - Hydrology and Water Assessment.
Since the link canal demands and diversion of surplus yields available
for diversion at the above proposed reservoirs are unchanged, no separate Hydrological and Water Assessment studies have been carried out. Brief details of the studies are furnished below.
5.1 General Climate and Hydrology
The climate of the Par-Tapi-Narmada link project area is moderate except during the months of April and May. Summer is hot and winter is generally cold. The year may be divided into four seasons, the cold season from Dec to Feb followed by the hot season from March to May and the south-west monsoon season from June to Sept followed by the post-monsoon season from Oct to Nov.
As per the Hydrological studies, the Par river at proposed Jheri dam
site; Nar river (tributary of Par river) at proposed Paikhed dam site; Tan river (Tributary of Auranga river) at proposed Chasmandva dam; Ambica river at proposed Chikkar dam site; Khapri river (tributary of Ambica river)

148
at proposed Dabdar dam site; and Purna river at proposed Kelwan dam site have been found water surplus at 75% dependability. As such after meeting in-basin requirements (by 2050 AD) of all the above four river basins up to the proposed dam sites and downstream commitments / requirements, surplus water of 1210 MCM has been proposed for diversion to utilize en-route of link canal in the tribal areas lying rightside of link canal,periphery of proposed reservoirs, tribal areas lying right side of Narmada Main Canal (in Chhota Udepur and Panchamahals Districts) by lift;to takeover the command areas of the projects viz., i) Khuntali, ii) Ugta, iii) Sidhumber, iv) Khata Amba and v) Zankhari proposed by Government of Gujarat to supply drinking water to all villages of Dangs District and villages of Kaprada and Dharampur talukas of Valsad District; to fill all possible tanks in the benefitted areas and in water short Saurashtra region of Gujarat by Substitution. The Par-Tapi-Narmada link will also take over the part command area of existing Miyagam Branch Canal of Narmada Canal System and the Narmada waters so saved in Sardar Sarovar dam will be utilized in Chhota Udepur and Panchamahal Districts and Saurashtra region for providing irrigation facilities and drinking water by substitution. The schematic Diagram of the Par-Tapi-NarmLink Project is at Fig. 5.1.

149
5.2 General Information about Regions
The Par-Tapi-Narmada link involves Par, Auranga, Ambica and Purna river basins of South Gujarat and neighboring Maharashtra. All these four river basins have the same hydro meteorological characteristics. Most of the rainfall is received during the South-West monsoon period, from June to Sept. The average annual rainfall in the Par, Auranga, Ambica and Purna river basins is 2180 mm, 2055 mm, 1830 mm and 1472 mm respectively. Two meteorological observatories at Surat and Vadodara maintained by India Meteorological Department (IMD) located adjacent to the project area have been used to characterize the climatic conditions of the project area. The average maximum and minimum temperatures recorded are 39.9 °C and 13.2 °C respectively. The monthly mean relative humidity data of the project area indicates the maximum and minimum values of humidity as 94% (August) and 44% (April) during monsoon and summer seasons respectively. The maximum and minimum wind velocities observed are 13.3 km/hr and 2.2 km/hr respectively. The maximum cloud cover is observed during the months of July and August whereas the minimum cloud cover is observed during months of Jan and Feb. There is no pan-evapometer installed in the project area. The mean monthly average evapotranspiration computed for Surat IMD observatory varies from 99.2 (Dec) to 202.0 mm (May), whereas the same at Vadodara IMD observatory varies from 92.9 mm (Dec) to 246.4 mm (May).
5.3 Specific Information 5.3.1 Drainage Basins a) Par Basin
The Par River is one of the important west flowing rivers in the region, north of Mumbai and south of the Tapi river. The river originates from the Sahyadri hill ranges near village Gogul of Surgana taluka in Nasik district of Maharashtra at an elevation of about 1100 m above mean sea level. The total length of the river from its origin to its outfall into Arabian Sea is 131 km.
The river basin lies between 20°16' – 20°35' N latitudes and 72°54' – 73°44' E longitudes. The total catchment area of the river is 1664 km2, out of which 773 km2 lies in Nasik district of Maharashtra and the remaining 891 km2 in Valsad district of Gujarat. It is bounded by western Ghat ridge

150
separating west flowing rivers and Godavari in east, the ridge separating Kolak and Damanganga rivers in south, Arabian Sea in west and the ridge separating Par and Auranga rivers on north. The important tributaries of Par river are Aroti, Nar, Bhimtas, Vajri and Keng. b) Auranga Basin
The Auranga is another important west flowing rivers in the South
Gujarat region. The river is known as Auranga after the confluence of its two tributaries the Man and the Tan. Both tributaries originate in the Sahyadri hill ranges in the Nasik district of Maharashtra. The river traverses a distance of about 30 km from confluence of the tributaries before draining into the Arabian Sea. The Auranga river basin lies between 20° 30' to 20° 42' N latitudes, and 72°53' to 73°37' E longitudes. The Auranga basin extends over an area of 787 km2, out of which 150 km2 is in Maharashtra State and 637 km2 is in Gujarat. The effective drainage area of the basin in Gujarat State is 598 km2 since 39 km2 area near the mouth is low-lying, marshy and cannot be beneficially utilized. The basin is bounded by ridge separating Auranga and Par rivers in south and east, Arabian Sea in west and the ridge separating Auranga and Ambica rivers in north. Important tributaries of Auranga River are Man and Tan. c) Ambica Basin
The Ambica River is also a west flowing river of South Gujarat region located north of Auranga basin. The catchment area of Ambica basin is lying in Gujarat and Maharashtra. The Ambica River originates in the Sahyadri hill ranges near village Kotambi of Surgana taluka in Nasik district of Maharashtra at an elevation of about 1050 m above mean sea level. The total length of the river from its origin to its outfall into Arabian Sea is 164 km. The river basin lies between 20°31' – 20°57' N latitudes and 72°48' – 73°52' E longitudes. The total catchment area of the basin is 2830 km2, of which 102 km2 lies in Maharashtra and the remaining 2728 km2 in Gujarat. The catchment area of the basin in Gujarat is 2583 km2, since 145 km2 area near mouth is low lying, marshy and cannot be beneficially utilized. Ambica basin is bounded by Western Ghats separating Ambica and Tapi rivers in east, the ridge separating Auranga and Par rivers in south, Arabian Sea in

151
west and the ridge separating Ambica and Purna rivers on north. Important tributaries of Ambica River are Khapri, Olan, Kaveri and Kharera. d) Purna Basin
The river Purna, a west flowing river, rises in the Sahyadri hill ranges of the Western Ghats at an elevation of about 1300 m in the Ahwa taluka of Dangs district in Gujarat and after traversing a distance of 180 km, it outfalls into the Arabian sea. The level of the river bed drops steeply from 1300 m at source to about 115 m at the dam site as the river in this reach passes through hilly area covered with dense forest and patches of cultivated land. The Purna basin lies between 20°44' – 21°06' N latitudes and 72°44' – 73°58' E longitudes. The total drainage area of the basin is 2435 km2, out of which 58 km2 lies in Maharashtra and 2377 km2 lies in Gujarat. The effective drainage area of the river is 2193 km2 since 242 km2 near the mouth is low-lying and cannot be beneficially utilized. The Purna basin is bounded by Western Ghats separating Purna and Tapi rivers in east, the ridge separating Purna and Ambica rivers in south, Arabian sea in west and the ridge separating Purna and Mindhola on north. Important tributaries are Girra river, Zankhari river and Damas khadi. 5.3.2 Command Area as per the Revised Irrigation Planning
As per the revised planning Par-Tapi-Narmada link project will provide irrigation to 59920 ha new areas in the en-route of main canal; 1270 ha new area in the en-route of Dabdar and Kelwan feeder pipelines; and take over the part command area of existing Miyagam Branch Canal of Narmada Canal System to an extent of 42368 ha. In addition to this areas as per the suggestion of Gujarat Government have been included.
In the Chief Engineers level meeting held on 11/11/2016, Chief Engineer (South Gujarat) has suggested to include command of five proposed projects namely Sidhumber Reservoir Project, Ugta Irrigation Project, Khuntali Irrigation Project, Zankari and Khata Amba irrigation project which are in the vicinity of Par-Tapi-Narmada link canal and also to provide irrigation facilities in the tribal area, enroute the link canal.
(i) Accordingly command area of these five projects are included in the DPR . Details of these projects are given below in Table - 5.1:
Table – 5.1

152
Details of Proposed projects of Government of Gujarat
Sr.
No
Name of Reservoir
River Taluka
benefitted
District
benefitted
Culturable command area (ha)
Annual Irrigation (ha)
1 Sidhumber Man river
Dharampur
Chikhli
Valsad
Navsari
17441 17441
2 Ugta Par river Dharampur Valsad 4963 4963 3 Khuntali Dholdo / Par
river Dharmpur Valsad 3162 3162
4 Khata Amba Kaveri Vansada Navsari 2741 2741
5 Zankari Zankari river Songadhand Vyara
Tapi 17254 17254
Total 45561 45561
It can be seen from the above table that an Annual Irrigation of about 45561 ha can be provided through inclusion of the above projects as proposed by Government of Gujarat, for which the proposed command area lies on the left side of the PTN link canal. Government of Gujarat desired to explore the possibilities for providing maximum possible irrigation facilities to tribal area in the right side of the Par-Tapi-Narmada link canal. (ii) Accordingly possible areas at four different locations enroute on Right
side of the PTN link canal have also been identified as requested by Government of Gujarat for providing irrigation in tribal areas. Since these areas are located at a higher level than the P-T-N canal, the water can be provided for irrigation by lift involving from about 3.0 m to 70.0 m. These are described below :
(a) Area No.1 is located in Par-Tapi reach between RD 113.25 to 115.00 km (Besuniya) of link canal and average F.S.L. of P-T-N Link canal near this area is 117.70 m. Irrigation can be provided through lift in this area upto 3 m from P-T-N link canal. About 900 ha area can be covered in this reach in Vyara tehsil of Tapi district.
(b) Area No.2 is located in Par-Tapi reach between RD 141.440 to 153.400 km (in between Jhankhri river and Mindhola river) of link canal and average F.S.L. of
P-T-N link canal near this area is 111.0 m. Irrigation can be provided through lift upto 50 m to 70 m from P-T-N link canal. About 13100 ha area can be covered in this reach in Songadh tehsil of Tapi district.

153
(c) Area No.3 is located in Tapi-Narmada reach between RD 32.00 to
72.00 km of link canal and average F.S.L. of this area is 70.0 m. Irrigation can be provided through lift of about 50 m from P-T-N link canal. About 6500 ha area can be covered in this reach in Mandvi and Mangrol tehsil of Surat district.
(d) Area No.4 is located in Tapi-Narmada reach between RD 72.033 to 87.274 km (in between Ghanta River and Amravati River) of link canal and average F.S.L. of this area is 71.5 m. Irrigation can be provided through lift by about 50 m to 70 m from P-T-N link canal. About 15700 ha area can be covered in this reach in Valia tehsil of Bharuch district. The summary of above command area in the right side through lift is given in Table – 5.2 below:
Table –5.2
Additional irrigation in the tribal areas lying on the right side of Par-Tapi-Narmada Link Canal by lift
Sl.
No.
Name of Command Area
CCA
(ha)
Annual Irrigation at 100% intensity of
irrigation (ha)
Taluka / District
benefitted 1 Area-1 900 900 Vyara / Tapi 2 Area-2 13100 13100 Songadh / Tapi 3 Area-3 6500 6500 Mandvi and
Mangrol / Surat 4 Area-4 15700 15700 Valia / Bharuch Total 36200 36200
(iii) As suggested by Government of Gujarat, it is proposed to bring 12514
ha under irrigation in tribal dominant districts of Dang and Valsad of Gujarat and Nasik district of Maharashtra, directly by lift from proposed six reservoirs of the project.
(iv) Command in the tribal areas inChhota Udepur and Pamchmahal districts :
It is proposed to provide irrigation in 23750 ha predominantly tribal areas of Naswadi, Kavant, Sankheda, Jetpur Pavi, Chhota Udepur taluks of Chhota Udepur district through lift, directly from Narmada Main Canal on substitution basis.
It is also proposed to provide irrigation in 10592 ha predominantly tribal area of Halol, Ghogamba and Kalol talukas of Panchmahal district through lift, directly from Narmada Main Canal on substitution basis.

154
Details of benefits considering all the above suggestions and details of water Demand are summarized in Table-5.3:
Table – 5.3 Irrigation / Drinking water benefits and water Demand of Par-Tapi-
Narmada Link Project
Sl.
No.
Reach / Feedar CCA (ha) Annual Irrigation
(ha)
Annual Utilisation in (MCM)
In Tribal areas
Non-Tribal
Total
1 Enroute command 51173 10017 61190 61190 382 2 Project proposed
by Government of Gujarat on the left side of link canal
40631 4930 45561 45561 285
3 Tribal area enroute right side of link canal by lift
36200 0 36200 36200 138
4 Tribal area in the vicinity of reservoirs
12514 0 12514 12514 48
5 Tribal areas on right side of Narmada Main Canal by lift
a.Chhota Udepur dist.
b.Panchmahal dist.
14940
1833
8810
8759
23750
10592
23750
10592
90
40 6 Supply of
drinking water for all villages of Dang District and Villages of Kaprada & Dharmpur taluka of Valsad District.
Provision of 76 MCM made for about 27.5 lakh population of these areas.
76
7 Filling all possible tanks in benefitted areas.
Provision of 50 MCM water has been kept for filling 2226 Panchayat and village tanks/ check dams in benefit.
50
8 Target command in Saurashtra region
0 42368 42368 42368 161

155
Sub Total
157291 74884 232175 232175
9 Environmental releases
20
10 Evaporation losses 40 Total 1330
MCM
5.3.3 Floods and Drainage a) Par Basin
The Water Resources Department of Gujarat State is maintaining Nanivahiyal G & D site across Par river in the downstream of proposed Mohankavchali dam site. The observed monthly discharge data at Nanivahiyal G & D site is available for the period from 1966 to 2004. The maximum observed discharge at the G & D site was 3054 cumec in the year 1997. b) Auranga Basin
The observed monthly discharge data at 3 G & D sites viz., Amba, Bhervi and Asura are available for the period from 1962 to 2004, 1974 to 2006 and 1980 to 2005 respectively. These sites are located much in the downstream of proposed Chasmandva dam site. Bhervi G & D site covers the maximum catchment area of the basin and maximum observed discharge at this site was 3300 cumec in the year 2005.
c) Ambica Basin
The observed monthly discharge data of 3 G & D sites viz., Gadat, Kudkas and Unai are available for the period from 1979 to 2004; 1980 to 2006; and 1979 to 2006 respectively. Gadat, and Unai G & D sites are located downstream of Chikkar and Dabdar dam sites where as the Kudkas site is located just upstream of Dabdar dam site. The maximum observed discharge at Gadat G & D sites was 2989 cumec in the year 2004. d) Purna Basin

156
The observed monthly discharge data of 3 G & D sites viz., Mahuva, Kalibel and Navsari are available for the period from 1979 to 2004; 1962 to 2000; and 1980 to 1997 respectively with some missing data. Mahuva and Navsari G & D sites are located much in the downstream of Kelwan dam whereas the Kalibel G & D site is located just upstream of Kelwan dam site. The maximum observed discharge at Mahuva G & D site was 8835 cumec in the year 1994. 5.3.4 River Geometry
The Par river travels mostly through hills covered with forest and patches of cultivated lands on banks of river. The Narriver is a Northern tributary of Par river. The Nar river flows towards west through Surgana taluka for its initial length of about 39 km. After forming the boundary between Maharashtra and Gujarat for a length of about 4.5 km, it enters the Dharampur taluka of Valsad district in the State of Gujarat and after flowing for about 39.5 km in south westerly direction, it joins the Par river near village Veribhavad at RL 72 m. The total length of river Nar is about 83 km. The diversion point identified across Nar river lies near village Paikhed at about 14 km upstream of its confluence with Par river.
The Auranga river traverses a distance of about 30 km from confluence of its tributaries before draining into the Arabian Sea. The area is hilly and covered with forest in the upstream reaches, while the area down-wards from about 15 km upstream of confluence of the Tan and the Man rivers is plain with cultivated lands. The Tanriver rises at an elevation of about 645 m and the elevation where it meets the Man river is about RL 50 m.
The Ambicariver after traversing a total distance of 164 Km joins the Arabian Sea in Gujarat. The important tributaries of the Ambica river are Khapri, Kaveri and Kharera rivers. The Khapri river rises at an altitude of 1030 m in Sahyadri hill range in Ahwa taluka of Dangs district in Gujarat and joins the river Ambica near village Milan at an elevation of 100 m. The length of river Khapri is about 80 km.
The Purna river after traversing a distance of 180 km it outfalls into the Arabian sea. The level of the river bed drops steeply from 1300 m at source to about 115 m at the proposed Kelwan dam site as the river in this

157
reach passes through hilly area covered with dense forest and patches of cultivated land. The important tributaries of the Purna river are Girna, Zankhari and Damaskhadi rivers.
5.3.5 Ground Water Recharge
During environmental impact assessment of Par-Tapi-Narmada link, detailed studies of ground water quality have been carried out during the year 2010-11.The details are furnished in Chapter-11 “Environmental Impact Assessment and Environment Management Plan”. The analysis of water level data in project area indicates a general rise in water level during monsoon season. The reservoir and link canal are likely to have a long term increase in water levels of the phreatic zones. 5.3.6 Reservoir Area
Six storage reservoirs are proposed for storing and diverting the water through Par-Tapi-Narmada link. These are Jheri dam across Par river; Paikhed dam across Nar river (a tributary of Par river); Chasmandva dam across Tan river (a tributary of Auranga river); Chikkar dam across Ambica river; Dabdar dam across Khapri river (a tributary of Ambica river); and Kelwan dam across Purna river. The Jheri reservoir is entirely lies in Maharashtra whereas, Dabdar and Kelwan reservoirs lies entirely in Gujarat. Other reservoirs namely Paikhed, Chasmandva and Chikkar reservoirs lie in both Gujarat and Maharashtra. The details of these reservoirs are described below:
i) Jheri Reservoir
The Jheri reservoir is proposed across river Par near village Jheri in Peint taluka of Nasik district of Maharashtra (20°22'25" N and 73°25'51" E). The catchment area of Par basin up to proposed Jheri dam site is 425 km2 and lies entirely in Nasik district of Maharashtra. The Jheri reservoir area lies between latitudes 20o 19’ 20” N and 20o 24’ 15” N and longitudes 73o 25’ 39” E and 73o 31’ 28” E. The submergence area of the reservoir at FRL 246m is about 836 hectare of which 408 ha is forest area. The submergence

158
area of the reservoir lies in Surgana and Peint taluka of Nasik district in Maharashtra. The reservoir extends along Par river with fetch length of2.809 km. The deepest bed level of Par river at proposed Jheri dam site is 178 m. The live storage capacity of the proposed Jheri reservoir is 190.18 MCM.
The Jheri dam site is approachable from Peint as well as from Dharampur taluka head quarters in Nasik and Valsad districts respectively via Valsad - Nasik State highway. The nearest railway station is Nasik on Central Railway and nearest town is Peint, a taluka head quarter in Nasik district.
ii) Paikhed Reservoir
The Paikhed reservoir is proposed across river Nar, a tributary of river Par near village Paikhed in Dharampur taluka of Valsad district in Gujarat (20°27'42" N and 73°23'37" E).The catchment area of Nar Sub-basin of Par basin up to proposed Paikhed dam site is 315 km2 of which 269 km2 in Surgana taluka of Nasik district in Maharashtra and 46 Km2 in Dharampur taluka of Valsad district in Gujarat. The Paikhed reservoir area lies between latitudes 20o 27’ 17” Nand 20o 29’ 47” N and longitudes 73o 24’ 07” E and 73o 28’ 24” E. The submergence area of the reservoir at FRL 248m is about 994 ha of which 317 ha is forest area. The submergence area of the reservoir lies in Surgana taluka of Nasik district of Maharashtra and Dharampur taluka of Valsad district in Gujarat. The reservoir extends along Nar river with fetch length of3.60 km. The deepest bed level of Nar river at proposed Paikhed dam site is 161.60 m. The live storage capacity of the Paikhed reservoir is 216.43 MCM.
The Paikhed dam site is approachable from Dharampur on Valsad – Nasik State highway. The nearest town is Dharampur and the nearest railway station is Valsad on Western Railway. iii) Chasmandva Reservoir
The Chasmandva reservoir is proposed across river Tan, a tributary of river Auranga near Chasmandva village in Dharampur taluka of Valsad district in Gujarat (20°37'02" N and 73°22'36" E). The catchment area of Auranga basin up to proposed Chasmandva dam site is 89 km2 of which 62

159
Km2 in Surgana taluka of Nasik district in Maharashtra and 27 km2 in Dharampur taluka of Valsad district and Vansda taluka of Navsari district in Gujarat. The Chasmandva reservoir area lies between latitudes 20o 36’ 00” N and 20o 37’ 35” N and longitudes 73o 22’ 32” E and 73o 25’ 48” E. The submergence area of the reservoir at FRL 214.0m is about 615 ha of which 300 ha is forest area. The submergence area of the reservoir lies in Surgana taluka of Nasik district of Maharashtra and Dharampur taluka of Valsad district and Vansda taluka of Navsari district in Gujarat. The reservoir extends along Tan river with fetch length of4.38 km. The deepest bed level of Tan river at proposed Chasmandva dam site is 169.50 m. The live storage capacity of the Chasmandva reservoir is 75.86 MCM.
The Chasmandva dam site is approachable from Dharampur on Dharampur – Vansda road. The nearest town is Dharampur and the nearest railway station is Valsad on Western Railway. iv) Chikkar Reservoir
The Chikkar reservoir is proposed across river Ambica near village Chikkar in Ahwa taluka of Dangs district in Gujarat (20°42'00" N and 73°30'50" E). The catchment area of Ambica basin up to proposed Chikkar dam site is 304 km2 of which 102 km2 in Surgana taluka of Nasik district in Maharashtra and 202 km2 in Ahwa taluka of Dangs district in Gujarat. The Chikkar reservoir area lies between latitudes 20o 40’ 32” N and 20o 43’ 06” N and longitudes 73o 30’ 09” E and 73o 35’ 18” E. The submergence area of the reservoir at FRL 210m is about 742 ha of which 300 ha is forest area. The entire submergence area lies in Ahwa taluka of Dangs district in Gujarat. The reservoir extends along Ambica river with fetch length of2.815 km. The deepest bed level of Ambica river at proposed Chikkar dam site is 153.50 m. The live storage capacity of the Chikkar reservoir is 129.03 MCM. The Chikkar dam site is approachable from Waghai / Vansda on Gandevi – Saputara National Highway 360. The nearest town is Waghai and the nearest railway station is Waghai on narrow gauge (Bilimora – Waghai section) and Bilimora on Broad gauge of Western Railway. v) Dabdar Reservoir
The Dabdar reservoir is proposed across river Khapri, a tributary of river Ambica near village Dabdar in Ahwa taluka of Dangs district in

160
Gujarat (20°48'58" N and 73°32'05" E). The catchment area of Ambica basin up to proposed Dabdar dam site is 457 km2 entirely lies in Dangsdistrict in Gujarat. The Dabdar reservoir area lies between latitudes 20o 46’ 53” N and 20o 49’ 36” N and longitudes 73o 30’ 33” E and 73o 34’ 59” E. The submergence area of the reservoir at FRL 169m is about 1249 ha of which 614 ha is forest area. The entire submergence area lies in Ahwa taluka of Dangs district in Gujarat. The reservoir extends along Khapri river with fetch length of3.512 km. The deepest bed level of Khapri river at proposed Dabdar dam site is 113.0 m. The live storage capacity of the Dabdar reservoir is 201.06 MCM. The Dabdar dam site is approachable from Waghai on Gandevi – Saputara National Highway 360. The nearest town is Waghai and the nearest railway station is Waghai on narrow gauge (Bilimora – Waghai section) and Bilimora on Broad gauge of Western Railway. vi) Kelwan Reservoir
The Kelwan reservoir is proposed across river Purna near village Kelwan and Kakarda in Ahwa taluka of Dangs district in Gujarat (20°55'30" N and 73°32'00" E). The catchment area of Purna basin up to proposed Kelwan dam site is 694 km2 entirely lies in Dangsdistrict in Gujarat. The Kelwan reservoir area lies between latitudes 20o 53’ 04” N and 20o 57’ 31” N and longitudes 73o 31’ 23” E and 73o 37’ 20” E. The submergence area of the reservoir at FRL 164.0m is about 1629 hectare of which 890 ha is forest area. The entire submergence area lies in Ahwa taluka of Dangs district in Gujarat. The reservoir extends along Purna river with fetch length of5.382 km. The deepest bed level of Purna river at proposed Kelwan dam site is 116.0 m. The live storage capacity of the Kelwan reservoir is 258.28 MCM. The Kelwan dam site is approachable from Waghai on Gandevi – Saputara National Highway 360. The nearest town is Waghai and the nearest railway station is Unai on narrow gauge (Bilimora – Waghai section) and Vyara on Broad gauge (Surat – Bhusaval section).
The State – wise break-up of the catchment areas of Par, Auranga, Ambica and Purna basins and upto dam sites is given in Table 5.4:

161
Table 5.4 State-wise Break-up of the Catchment Area of Basins
Sl. No.
River/ Basin Catchment Area (km2) Maharashtra Gujarat Total
1 Par basin 773 875 1648 i Par basin upto Jheri dam site 425 - 425 ii Nar river (tributary of Par river)
upto Paikhed dam site 269 46 315
2 Auranga basin 150 598 748 i Tan river ( tributary of Auranga
river) upto Chasmandva dam site 62 27 89
3 Ambica basin 102 2583 2685 i Ambica basin upto Chikkar dam
site 102 202 304
ii Khapri river (tributary of Ambica river) upto Dabdar dam site
- 457 457
4 Purna basin 58 2135 2193 i Purna basin upto Kelwan dam site - 694 694
5.3.7 Other Water Usage
The water stored in the Jheri, Paikhed, Chasmandva, Chikkar, Dabdar and Kelwan dams will mostly be used for irrigation and drinking purposes mostly in Tribal areas lying on en-route, in the vicinity / periphery of reservoirs, villages in the downstream and the targeted command area and to fill all possible tanks in the vicinity of benefitted area. In addition, 10% of lean season flow is also earmarked for environmental and ecological needs to sustain the aquatic life along the river course downstream of proposed dam sites.
5.3.8 Navigation
Rivers in Par-Tapi-Narmada system are presently not used for any major navigational purpose. There is no provision for navigation in the proposed Par-Tapi-Narmada link also. 5.4 Data Availability 5.4.1 Rainfall and Snowfall

162
There is no snowfall in Par, Auranga, Ambica and Purna basins involved in Par-Tapi-Narmada link project. The precipitation in the link project area is in the form of rainfall. There are number of Raingauge stations and G & D sites in these basins where long term data is available. The basin wise availability of Rainfall data is described in following paragraphs: a) Par Basin
There are ten raingauge stations located in and around the Par basin. The details of period of availability, average annual rainfall are given in Table 5.2 and location of these rain gauge stations are shown in Fig 5.5:
Table 5.5 Period of Availability and Average Annual Rainfall
Sl.No. RG station Period of
Availability of Data
Average Annual Rainfall (mm)
1 Peint 1901 to 2008 2273 2 Pardi 1901 to 2003 1926 3 Mandva 1964 to 2007 2669 4 Panchalai 1969 to 2007 1920 5 Nanivahiyal 1968 to 2006 2215 6 Dhamni 1969 to 2000 2019 7 Pindval 1977 to 2006 2406 8 Dharampur 1901 to 2003 2368 9 Surgana 1955 to 2006 1997 10 Bildha 1965 to 2006 2010
b) Auranga Basin
There are ten raingauge stations located in and around the Auranga basin. The details of period of availability, average annual rainfall are given in Table 5.3 and location of these raingauge stations are shown in Fig 5.6:
Table 5.6 Period of Availability and Average Annual Rainfall
Sl.No. RG station Period of Availability
of Data (Year) Average Annual Rainfall (mm)
1 Valsad 1901 to 2003 1890
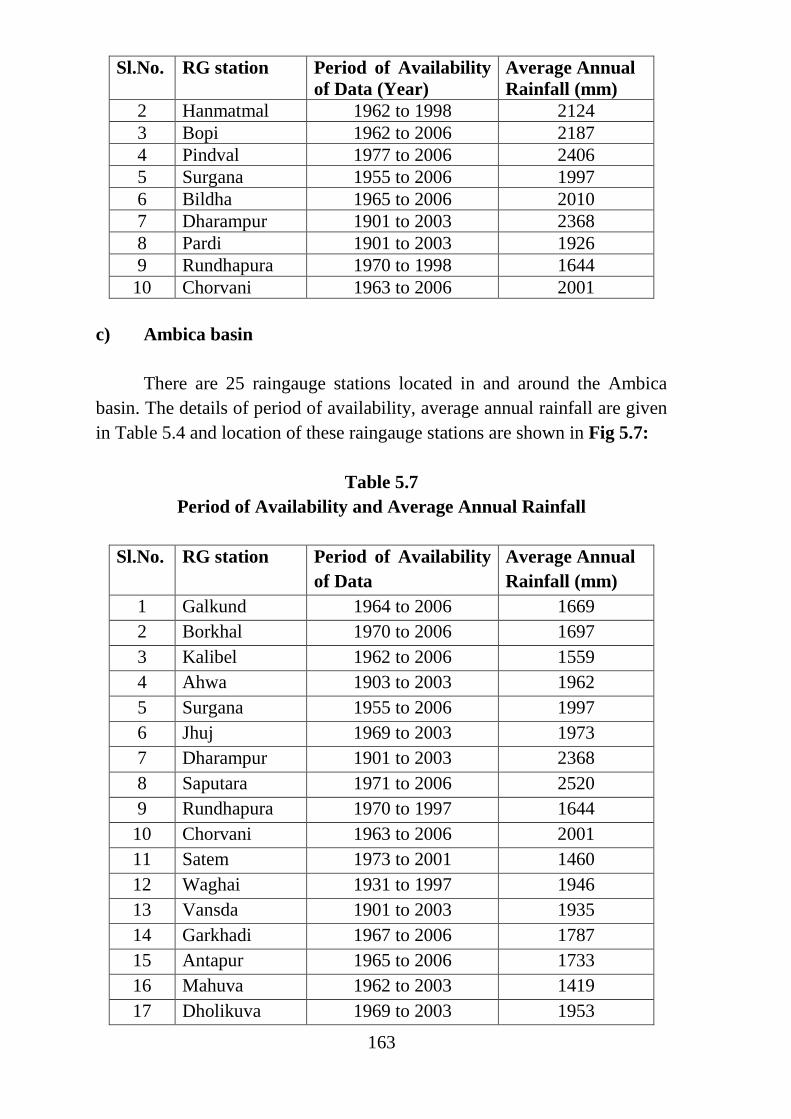
163
Sl.No. RG station Period of Availability of Data (Year)
Average Annual Rainfall (mm)
2 Hanmatmal 1962 to 1998 2124 3 Bopi 1962 to 2006 2187 4 Pindval 1977 to 2006 2406 5 Surgana 1955 to 2006 1997 6 Bildha 1965 to 2006 2010 7 Dharampur 1901 to 2003 2368 8 Pardi 1901 to 2003 1926 9 Rundhapura 1970 to 1998 1644
10 Chorvani 1963 to 2006 2001 c) Ambica basin
There are 25 raingauge stations located in and around the Ambica basin. The details of period of availability, average annual rainfall are given in Table 5.4 and location of these raingauge stations are shown in Fig 5.7:
Table 5.7
Period of Availability and Average Annual Rainfall
Sl.No. RG station Period of Availability of Data
Average Annual Rainfall (mm)
1 Galkund 1964 to 2006 1669 2 Borkhal 1970 to 2006 1697 3 Kalibel 1962 to 2006 1559 4 Ahwa 1903 to 2003 1962 5 Surgana 1955 to 2006 1997 6 Jhuj 1969 to 2003 1973 7 Dharampur 1901 to 2003 2368 8 Saputara 1971 to 2006 2520 9 Rundhapura 1970 to 1997 1644
10 Chorvani 1963 to 2006 2001 11 Satem 1973 to 2001 1460 12 Waghai 1931 to 1997 1946 13 Vansda 1901 to 2003 1935 14 Garkhadi 1967 to 2006 1787 15 Antapur 1965 to 2006 1733 16 Mahuva 1962 to 2003 1419 17 Dholikuva 1969 to 2003 1953
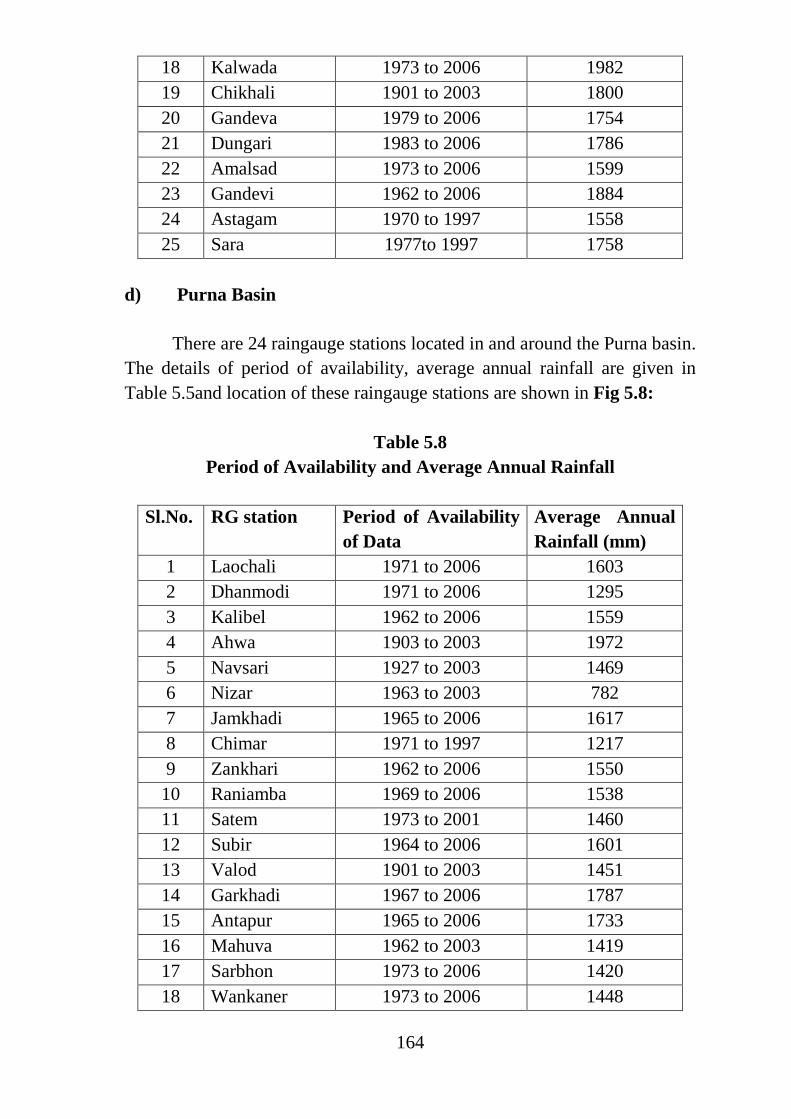
164
18 Kalwada 1973 to 2006 1982 19 Chikhali 1901 to 2003 1800 20 Gandeva 1979 to 2006 1754 21 Dungari 1983 to 2006 1786 22 Amalsad 1973 to 2006 1599 23 Gandevi 1962 to 2006 1884 24 Astagam 1970 to 1997 1558 25 Sara 1977to 1997 1758
d) Purna Basin
There are 24 raingauge stations located in and around the Purna basin. The details of period of availability, average annual rainfall are given in Table 5.5and location of these raingauge stations are shown in Fig 5.8:
Table 5.8
Period of Availability and Average Annual Rainfall
Sl.No. RG station Period of Availability of Data
Average Annual Rainfall (mm)
1 Laochali 1971 to 2006 1603 2 Dhanmodi 1971 to 2006 1295 3 Kalibel 1962 to 2006 1559 4 Ahwa 1903 to 2003 1972 5 Navsari 1927 to 2003 1469 6 Nizar 1963 to 2003 782 7 Jamkhadi 1965 to 2006 1617 8 Chimar 1971 to 1997 1217 9 Zankhari 1962 to 2006 1550
10 Raniamba 1969 to 2006 1538 11 Satem 1973 to 2001 1460 12 Subir 1964 to 2006 1601 13 Valod 1901 to 2003 1451 14 Garkhadi 1967 to 2006 1787 15 Antapur 1965 to 2006 1733 16 Mahuva 1962 to 2003 1419 17 Sarbhon 1973 to 2006 1420 18 Wankaner 1973 to 2006 1448

165
19 Ugat 1974 to 2002 1392 20 Vesma 1973 to 2006 1462 21 Maroli 1969 to 1997 1246 22 Vyara 1962 to 2003 1477 23 Astagam 1970 to 1997 1558 24 Dosvada 1972 to 2003 1279
The consistency check of rainfall data of all the stations have been carried out by Central Water Commission using double mass curve technique. The missing data have been estimated using normal ratio formula. 5.4.2 Pan Evaporation
There is no pan-evaporimeter installed in the project area. The monthly reservoir evaporation losses of existing Madhuban (Damanganga) reservoir (located in the vicinity of the project area of Par-Tapi-Narmada link) have been collected and adopted for simulation studies of reservoirs proposed under Par-Tapi-Narmada link. The monthly pan evaporation depths considered for the simulation study are given in Table 5.9:
Table 5.9
Monthly Pan Evaporation Depths Considered for Simulation Study Unit: mm/day
Sl. No.
Month Jheri Paikhed, Chasmandva, Chasmandva Barrage, Dabdar and Kelwan
Paikhed Barrage, Chikkar and Ukai Dams
1 June 4.7 6.8 2 July 2.3 3.3 3 August 2.3 3.3 4 September 3.6 5.1 5 Oct 4.6 6.5 6 Nov 3.6 5.1 7 Dec 2.9 4.1 8 Jan 2.9 4.1 9 Feb 3 4.6
10 Mar 4.6 6.5 11 Apr 5.3 7.5

166
12 May 5.7 8.1 Source: Pan evaporation
data of Pinjal reservoir. Source: Pan evaporation data of Damanganga reservoir.
5.4.3 Temperature, Relative Humidity, Wind Speed and Cloud (Climatological Parameters of the Project Area)
Two meteorological observatories viz., Surat and Vadodara maintained by IMD located adjacent to the project area have been used to characterize the climatic condition of the project area. The normal temperature, relative humidity, wind speed and cloud cover observed at Surat IMD observatory (based on the data for the period from 1998 to 2007) are furnished in Table 5.10A and Vadodara IMD observatories (based on the data for the period from 1998 to 2007) are furnished in Table 5.10B:
Table 5.10A
Climatological Details Observed at Surat IMD Stations
Month
Temperature Relative Humidity
Wind Speed
Cloud Cover
(oC) (%) (km/h)
(Okta) Max Min Max Min
Jan 30.4 14.7 78 65 3.1 0.7 Feb 32.5 16.7 78 54 1.8 0.7 Mar 36.4 19.8 74 53 2.1 0.9 Apr 36.8 23.9 75 61 3.4 1.4 May 35.4 27.3 78 67 6.4 3.1 Jun 33.7 27.3 83 72 6.0 5.1 Jul 31.1 26.4 90 80 6.0 6.2 Aug 30.6 25.8 90 83 4.4 6.2 Sept 32.2 25.5 90 80 2.1 4.5 Oct 34.8 22.4 79 67 1.7 1.9 Nov 34.5 18.5 76 64 1.9 1.1 Dec 32.0 15.4 76 62 2.7 0.9
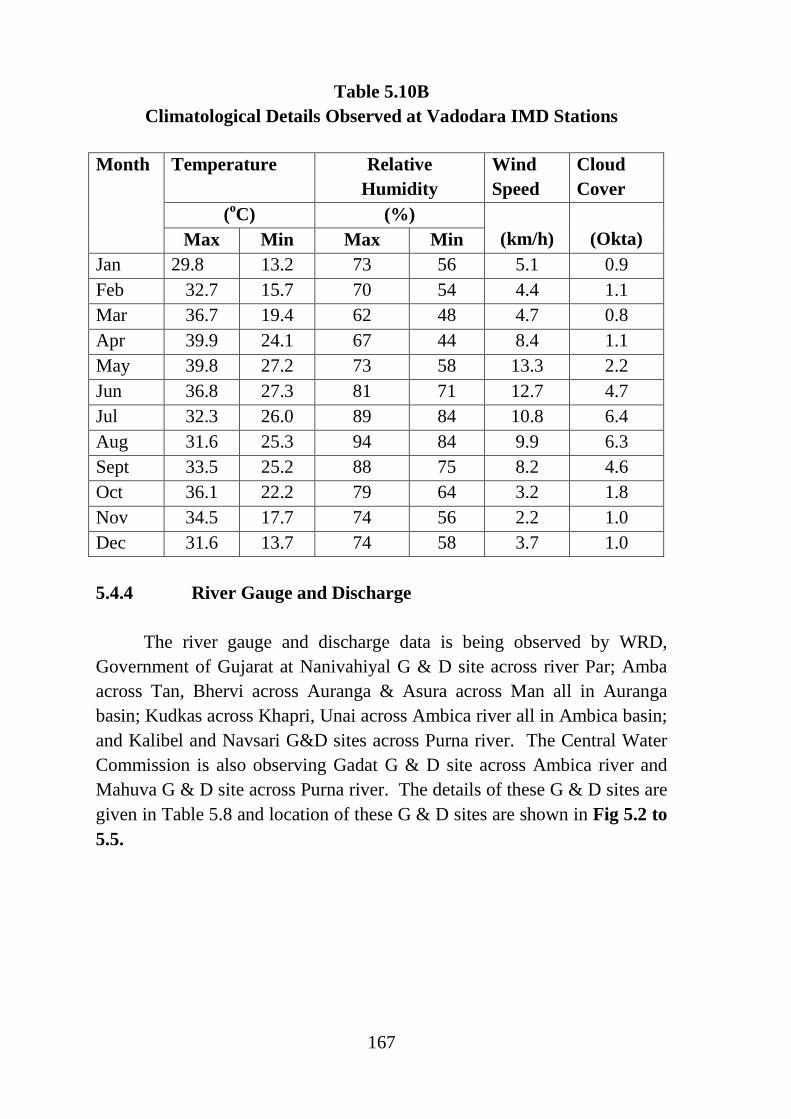
167
Table 5.10B
Climatological Details Observed at Vadodara IMD Stations
Month
Temperature Relative Humidity
Wind Speed
Cloud Cover
(oC) (%) (km/h)
(Okta) Max Min Max Min
Jan 29.8 13.2 73 56 5.1 0.9 Feb 32.7 15.7 70 54 4.4 1.1 Mar 36.7 19.4 62 48 4.7 0.8 Apr 39.9 24.1 67 44 8.4 1.1 May 39.8 27.2 73 58 13.3 2.2 Jun 36.8 27.3 81 71 12.7 4.7 Jul 32.3 26.0 89 84 10.8 6.4 Aug 31.6 25.3 94 84 9.9 6.3 Sept 33.5 25.2 88 75 8.2 4.6 Oct 36.1 22.2 79 64 3.2 1.8 Nov 34.5 17.7 74 56 2.2 1.0 Dec 31.6 13.7 74 58 3.7 1.0 5.4.4 River Gauge and Discharge
The river gauge and discharge data is being observed by WRD, Government of Gujarat at Nanivahiyal G & D site across river Par; Amba across Tan, Bhervi across Auranga & Asura across Man all in Auranga basin; Kudkas across Khapri, Unai across Ambica river all in Ambica basin; and Kalibel and Navsari G&D sites across Purna river. The Central Water Commission is also observing Gadat G & D site across Ambica river and Mahuva G & D site across Purna river. The details of these G & D sites are given in Table 5.8 and location of these G & D sites are shown in Fig 5.2 to 5.5.

168
Table 5.11
Details of G & D Sites
Sl. No.
G & D Site
Maintained by
River/ Tributary
Catchment Area (km2)
Data Availability From To
1 Nanivahiyal Government of Gujarat
Par 1254.00 1966 2004 2 Amba Auranga/ Tan 241.00 1962 2004 3 Bhervi Auranga 628.65 1974 2006 4 Asura Auranga/ Man 309.29 1980 2005 5 Gadat CWC Ambica 1510.00 1979 2004 6 Kudkas Governme
nt of Gujarat
Ambica/ Khapri
476.00 1980 2006
7 Unai Ambica 1031.00 1979 2006 8 Mahuva CWC Purna 1750.00 1979 2004 9 Kalibel Governme
nt of Gujarat
Purna 720.85 1962 2000 10 Navsari Purna 2012.00 1980 1997
5.4.5 Sediment (Suspended and Bed Load) Inflow and Grain Size Composition
The sedimentation observations are being carried out by Central Water Commission at Gadat G & D site across river Ambica, Mahuva G & D site across river Purna and by WRD, Government of Gujarat at Amba G & D site on Auranga river. The grain size composition observed for Gadat and Mahuva G & D sites maintained by Central Water Commission and Amba G & D site maintained by WRD, Government of Gujarat are furnished in Table 5.9. The average suspended load of sediment computed for 9 years found to be 0.244 mm/yr, 0.369 mm/yr and 0.383 mm/yr of catchment area for Gadat, Mahuva and Amba G & D sites respectively.

169
Table 5.12
Grain Size Composition
Sl. No.
G & D site
River Period of Observation
Grain size ( gram/litre)
Medium Sand-silt Fine 1 Gadat Ambica 1979 to 2004 0.013310 0.013510 0.084900 2 Mahuva Purna 1970 to 2005 0.006540 0.007040 0.128540 3 Amba Auranga 1993 to 2007 0.191948 0.285153 0.058153 5.4.6 Water Quality
The surface water quality is being observed by Water Resources Department, Government of Gujarat at Nanivahiyal G & D site across Par river, Amba G & D site across Tan river (tributary of Auranga river) and by Central Water Commission at Mahuva Gauge and discharge site across Purna river. The data on various water quality parameters observed at these G & D sites is furnished at Table 5.10. As a part of the field study done for Environmental Impact Assessment ( EIA) studies, surface water samples were collected from Par, Auranga, Ambica and Purna river basins and analyzed for various physio-chemical parameters and details are furnished in Chapter- 11 “Environmental Impact Assessment and Environmental Management Plan”.The test results presented in this study indicate that quality of surface water is generally of safe category. Ground water analysis for EIA studies has been done for the monsoon season 2010. It is found that the quality of ground water is satisfactory in the project area.
Table 5.13 Water Quality Data Observed at G & D Sites (Average for the Period from 1999 to 2005)
Sl. No.
Code Name of Minerals/ Chemical
Unit Limitation Name of G & D Sites Min Max Nanivahiyal
on Par Amba
on Tan
Mahuva on
Purna 1 Alk Phen Alkalinity,
phenolphthalein mgCaCO3/ L 0 3000 3.59 3.46 5.01
2 ALK-TOT Alkalinity, total mgCaCO3/L 5 5000 119.62 126.68 144.66 3 Ca Calcium mg/L 0.5 1000 33.93 35.28 36.16

170
4 Cl Chloride mg/L 0.5 20000 30.39 37.94 49.51 5 CO3 Carbonate mg/L 0 1000 2.19 2.57 3.79 6 COD Chemical Oxygen
Demand mg/L 1 10000 16.40 9.25 10.53
7 DO Dissolved oxygen mg/L 0 30 8.59 8.12 7.86 8 DO_SAT% Dissolved Oxygen
Saturation % % 0 300 107.09 102.71 100.88
9 EC_FLD Electrical Conductivity Field
µmho/cm 5 10000 343.33 346.29 409.44
10 EC_GEN Electrical Conductivity
µmho/cm 5 10000 276.73 343.21 453.98
11 HAR_Ca Hardness, Calcium mgCaCO3/L 0.1 2000 84.83 88.21 90.39 12 HAR_
Total Hardness , Total mgCaCO3/L 0.1 2000 150.64 156.60 180.59
13 HCO3 Bicarbonate mg/L 0.1 2000 117.34 124.41 142.25 14 K Potassium mg/L 0.1 1000 0.65 0.13 0.25 15 Mg Magnesium mg/L 0.1 1000 15.99 16.62 21.92 16 Na Sodium mg/L 1 20000 20.46 24.25 32.81 17 Na% Percent Sodium % 0.1 100 22.77 23.49 26.85 18 NH3-N Nitrogen, ammonia mg N/L 0.05 1000 0.09 0.09 0.14 19 NO2+NO3 Nitrogen, Total
Oxidised (NO2+NO3)
mg N/L 0.05 2000 0.98 0.68 0.78
20 P-Tot Phosphorus, total mgP/L 0.001 100 0.63 0.50 0.56 21 pH_FLD pH_Field pH units 2 14 7.45 7.42 8.00 22 pH_GEN pH pH units 2 14 8.24 8.22 8.32 23 RSC Residual Sodium
Carbonate - 1 100 0.00 0.00 0.00
24 SAR Sodium Adsorption Ratio
- 1 50 0.75 0.88 1.06
25 SO4 Sulphate mg/L 1 3000 32.89 30.70 31.64 26 SS Solids, Suspended mg/L 0 3000 18.45 15.31 18.53 27 TDS Solids, Total
Dissolved mg/L 5 30000 181.08 223.63 298.73
28 Temp Temperature deg C 0.1 50 27.19 27.73 28.67
Source: State Water Data Centre, Government of Gujarat, Gandhinagar 5.5 Hydrological Data Requirement 5.5.1 Alternatives and Classifications
This information is not necessary for the present study. 5.6 Type of Inputs 5.6.1 Hydrological Inputs a) Temporal Data
For economic design of any hydraulic structure such as spillways, barrages etc. estimation of design flood is required. Diversion flood is required for estimation of carrying capacity of the diversion channel.

171
Guidelines are available for selection of methodology for estimation of design flood. For major structures, the design flood is estimated using hydro-meteorological approach and the diversion flood is estimated mainly by frequency analysis of non-peak period flood. Hence, short duration rainfall-runoff data are required for estimation of design flood. Short duration rainfall data are generally measured at the gauging stations / Automatic weather stations using self recording rain gauges. Hourly gauge data are required for estimation of short duration discharge data and non monsoon peak flow data are required for estimation of diversion flood.
To estimate the reservoir inflow, daily discharge series are required. In absence of daily series, ten-daily series can be used. For development of rainfall-yield relationship, daily / monthly average rainfall and concurrent stream flow data are required. The inflow to the reservoir is affected by water utilization at the upstream. Hence the utilization of water by the upstream projects is also required to compute the reservoir inflow. The periodic water demands and releases from the reservoir, and evaporation rates in the reservoir area are also required for simulation study of a reservoir. b) Spatial Data
For estimation of weighted rainfall, the locations of raingauges and the delineated basin boundary are required. The basin boundary also gives the area of the basin which can be used for other purposes such as synthetic hydrograph generation, application of conceptual models etc. For reservoir simulation the elevation-area-capacity data are required which can also be used for reservoir routing. c) Time Units for Simulation Studies
Two types of simulations are mainly carried out: a) routing of design flood through the reservoir to estimate the dam height, b) reservoir simulation with series of inflows and demands to estimate the reliability of the reservoir. For reservoir routing, hourly time unit is used. For reservoir simulation, monthly time unit is adopted. 5.7 Compilation and Processing of Basic Hydrological Data 5.7.1 Hydrological Investigation
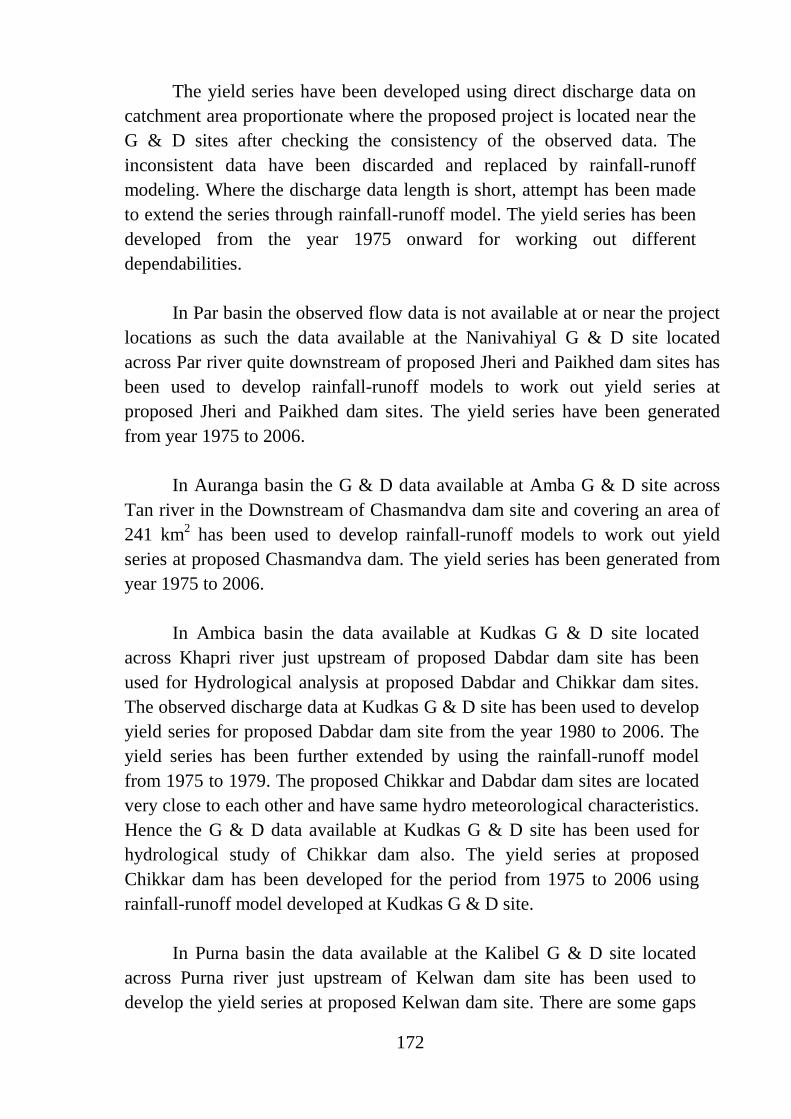
172
The yield series have been developed using direct discharge data on
catchment area proportionate where the proposed project is located near the G & D sites after checking the consistency of the observed data. The inconsistent data have been discarded and replaced by rainfall-runoff modeling. Where the discharge data length is short, attempt has been made to extend the series through rainfall-runoff model. The yield series has been developed from the year 1975 onward for working out different dependabilities.
In Par basin the observed flow data is not available at or near the project locations as such the data available at the Nanivahiyal G & D site located across Par river quite downstream of proposed Jheri and Paikhed dam sites has been used to develop rainfall-runoff models to work out yield series at proposed Jheri and Paikhed dam sites. The yield series have been generated from year 1975 to 2006.
In Auranga basin the G & D data available at Amba G & D site across Tan river in the Downstream of Chasmandva dam site and covering an area of 241 km2 has been used to develop rainfall-runoff models to work out yield series at proposed Chasmandva dam. The yield series has been generated from year 1975 to 2006.
In Ambica basin the data available at Kudkas G & D site located across Khapri river just upstream of proposed Dabdar dam site has been used for Hydrological analysis at proposed Dabdar and Chikkar dam sites. The observed discharge data at Kudkas G & D site has been used to develop yield series for proposed Dabdar dam site from the year 1980 to 2006. The yield series has been further extended by using the rainfall-runoff model from 1975 to 1979. The proposed Chikkar and Dabdar dam sites are located very close to each other and have same hydro meteorological characteristics. Hence the G & D data available at Kudkas G & D site has been used for hydrological study of Chikkar dam also. The yield series at proposed Chikkar dam has been developed for the period from 1975 to 2006 using rainfall-runoff model developed at Kudkas G & D site.
In Purna basin the data available at the Kalibel G & D site located across Purna river just upstream of Kelwan dam site has been used to develop the yield series at proposed Kelwan dam site. There are some gaps

173
in discharge data of Kalibel G and D site and observed data is available upto the year 2000 only. Hence, the gaps and the series beyond the year 2000 have been worked out by rainfall-runoff model. The data of inconsistent years have also been generated by rainfall-runoff model. 5.7.2 Data from Other Sources
The data used in this study were collected from various agencies. Rainfall, climatological and evapotranspiration data were collected from IMD and State Water Data Center (SWDC), Gandhinagar. G & D data was collected from Central Water Commission and State Water Data Center (SWDC) of Gujarat State. The data related to Water Resources projects such as location, water utilization and other salient features were collected from Water Resources Departments of the concerned State Governments.
5.7.3 Processing of Data
The time units of available and required time series data are often different. Further, the short duration discharges are not measured but are estimated from the gauge records. This requires preliminary processing of thetime series data. Following hydrological variables were processed in this study: (i) rainfall data (ii) gauge and discharge data.
5.7.3.1 Quality of Data
As indicated earlier the rainfall data at above raingauge stations and G & D data at the respective G & D sites is available for varying periods with some missing records for shorter durations. These missing record values have been estimated using standard statistical methods. The data observed at these sites have been checked for consistency and homogeneity. Both internal and external consistency checks were made on discharge data.
5.7.3.2 Filling of Short Data Gaps
The period of availability of rainfall data at above stations varies and in many cases the data are available for short duration only. However, in the Par basin from the year 1966 to 2006, in the Auranga basin from the year 1962 to 2006, in the Ambica basin from the year 1970 to 2006 and in the Purna basin from the year 1962 to 2006, the rainfall is mostly available for all the stations and the same has been considered in this study. Still there are some gaps in the rainfall data and these gaps have been filled using standard

174
procedure. These gaps have been filled by the normal ratio formula as given below.
Px = Nx/m[ P1/N1+ P2/N2+ ……… Pm/Nm] Where,
Px is estimated rainfall of a station for a particular month and year
Nx is average rainfall of the station for that particular month
P1, P2…… Pm are observed rainfall of nearby stations in that particular month and period
N1 N2…….Nm are average rainfall of nearby stations for that particular month
Using above procedure, gaps in rainfall data have been filled up and the same has been used in working out the weighted average rainfalls in the catchments.
5.7.4 Consistency of Data 5.7.4.1 Consistency Check of Rainfall Data
For this study, the Double Mass Curve (DMC) analysis is used to check the consistency of a rainfall series and adjustment of records. This analysis is based on the principle that when each recorded data comes from the same parent population, they are consistent.
The consistency of rainfall data of all the stations have been checked using double mass curve technique. Plotsof mass curvesindicate that the rainfall data is more or less consistent for almost all the stations. Only the rainfall data of Panchalai rain gauge station in Par basin is showing some inconsistency as indicated in Fig 5.6.
On scrutiny, the rainfall data of Panchalai for the year 1995, 1996 and 1997 are showing inconsistency and found to be on lower side as compared to rainfall of other stations. The rainfall during these years was also compared with observed discharges during the corresponding years. The runoff is not showing any significantly lower values during these years. Hence, the rainfall data of Panchalai station has been modified suitably. The mass curve after correcting the inconsistent data is shown in Fig 5.7.

175
5.7.4.2 Weighted Mean Rainfall
There are ten rain gauge stations in and around the Par basin; ten raingauge stations in and around the Auranga basin; twenty five rain gauge stations in and around the Ambica basin; and twenty four rain gauge stations in and around the Purna basin. The Weighted Mean Rainfall for the whole basins, catchments upto the proposed dam sites and upto the G & D sites have been estimated by Thiessen Polygon Method. The Isohyetal map of Par, Auranga, and Ambica and Purna basins is at Fig 5.8 to 5.11 respectively.
`5.7.4.3 Consistency Check of Discharge Data
G & D data of all the sites have been checked for consistency and homogeneity. Both internal and external consistency checks have been made on discharge data.
c) Homogeneity Tests
FandT tests were also made on discharge data to check the homogeneity. F-test is used to determine whether two samples have different variances and t-Test is used to determine whether two samples are likely to have come from the same two underlying populations that have the same mean. The discharge data for all the G & D sites have been found more or less homogeneous. However, Runoff factors have also been checked as detailed below in addition to homogeneity checks before adopting the discharge data. ii) External Consistency
The discharge data of all sites were also compared with corresponding rainfall by plotting monsoon yield vs. monsoon rainfall and also computingrun-off factors. a) Nanivahiyal G & D Site on Par River

176
The monsoon rainfall-runoff plot for Nanivahiyal G & D Site is at Fig 5.23(A); monthly rainfall-runoff plot for Nanivahiyal G & D Site for the year 1981 is at Fig 5.23(B) and monsoon rainfall-runoff plot for Nanivahiyal G & D Site after discarding inconsistent years is at Fig 5.24. The runoff factors are in Table 5.11.
The runoff is more than rainfall in almost each month during the year and therefore runoff data of year 1981does not appears consistent. The runoff factors of this year also show inconsistency.
Table 5.14 Monsoon Rainfall-Runoff Consistency at Nanivahiyal G & D site Year WMR (mm) Runoff (mm) Runoff factor
1966 2263 900 0.40 1967 2071 780 0.38 1969 2412 1812 0.75 1970 2120 1156 0.55 1971 2134 1217 0.57 1972 1492 458 0.31 1973 2474 1434 0.58 1974 1093 257 0.23 1975 2122 1559 0.73 1976 3230 3021 0.94 1977 2453 1402 0.57 1978 1973 939 0.48 1979 1853 912 0.49 1980 2050 1073 0.52 1981 2680 3803 1.42 1982 1859 1552 0.83 1983 2487 1456 0.59 1984 1691 1509 0.89 1985 1567 825 0.53 1986 1376 687 0.50 1987 1376 716 0.52 1988 2144 1166 0.54 1989 1601 834 0.52 1990 2411 1000 0.41 1991 1990 927 0.47 1992 2149 1008 0.47 1993 1970 1177 0.60 1994 3156 2004 0.64

177
1995 1423 661 0.46 1996 1975 1086 0.55 1997 2008 1399 0.70 1998 1936 900 0.47 1999 1996 824 0.41 2000 1540 681 0.44 2001 1801 980 0.54 2002 2010 475 0.24 2003 2396 1019 0.43 2004 2726 1160 0.43
The flow data of inconsistent years have been discarded while
developing rainfall-runoff modeling for working out the yield series.
The flow data of the year 1975,76,77,91,95,2005 and 2006 does not appear consistent with respect to corresponding weighted rainfall. The flow
data of these years was also checked on monthly basis. Monthly
Rainfall-Runoff Plots for years 1975,76,77,91, 2005 and 2006 are at Fig 5.26 to 5.31: 5.7.5 Presentation of Data 5.7.5.1 Rainfall Data
For carrying out the hydrological analysis of an area the average rainfall over that area is required. The rainfall data observed at rain-gauge station represents only point sampling of the areal distribution of a storm. The point rainfall values at various stations can be converted into an average value over the area by three methods: (i) Arithmetic average or mean (AM) method, (ii) Isohyetal method, and (iii) Thiessen polygon (TP) method. In the present study, the arithmetic average or mean (AM) method has been used for double mass curve analysis and Thiessen polygon (TP) method has been used for estimation of average areal rainfall over the study area for rainfall-runoff analysis and estimation of yields through regression from rainfall. 5.7.5.2 Discharge / Yield Data
The observed daily discharge data are available from 1962 onwards with some missing records for Nanivahiyal, Bhervi, Amba, Gadat, Kudkas,

178
Mahuva and Kalibel G & D sites. This daily discharge data have been aggregated to work out the monthly yield at respective G & D sites.
5.8 Water Availability/Inflows 5.8.1 Storage Projects
Six storage projects: Jheri reservoir across river Par, Paikhed reservoir across river Nar (tributary of Par river); Chasmandva reservoir across river Tan in Auranga basin; Chikkar reservoir across Ambica river, Dabdar reservoir across Khapri river in Ambica basin; and Kelwan reservoir across Purna river are envisaged in Par-Tapi-Narmada link project, for which simulation study has been carried out. 5.8.2 Approach in the Current Study
In the present studies the yield series have been developed using direct discharge data on catchment area proportion where the proposed project is located near the G & D sites after checking the consistency of the observed data. The inconsistent data have been discarded and replaced by rainfall-runoff modeling. Where the discharge data length is short, attempt has been made to extend the series through rainfall-runoff model. Normally the yield series has been developed from the year 1975 onward.
In Par basin and Auranga basin, the observed flow data is not available at or near the project locations and therefore, rainfall-runoff models have been used to work out yield series. The series have been generated from year 1975 to 2006. In Ambica basin, the observed discharge data have been used to develop yield series for Dabdar dam from the year 1980 to 2006. The yield series has been further extended by using the rainfall-runoff model from 1975 to 1979. For Chikkar dam, the yield series has been developed using rainfall-runoff model from 1975 to 2006. In Purna basin the yield series for Kelwan dam has been developed using the discharge data of Kalibel G & D site. There are some gaps in discharge data of Kalibel G & D site and observed data is available upto the year 2000 only. Hence, the gaps and the series beyond the year 2000 have been worked out by rainfall-runoff model. The data of inconsistent years have also been generated by rainfall-runoff model.

179
5.8.3 Hydrological Inputs Required for Simulation
The natural water availability at Jheri, Paikhed, Chasmandva, Chikkar, Dabdar and Kelwan project locations is mainly confined to monsoon months (June to Sept) and these projects are being planned for storages. For such storage projects as per the “Guidelines for preparation of Detailed Project Report of Irrigation and Multi Purpose projects, 2010” the minimum length of hydrological inputs required is about 25 years. Accordingly, the yield series have been generated on monthly basis for 30-35 years period. The contribution of non-monsoon period, which is very nominal, has been added on lumped basis. 5.8.3.1 Water Inflow in to Storage Reservoirs
The water inflows into proposed reservoirs at Jheri and Paikhed dams in Par basin; Chasmandva dam in Auranga basin; Chikkar and Dabdar dams in Ambica basin and Kelwan damin Purna basin have been computed by regression analysis using discharge data of Nanivahiyal, Amba, Kudkas, and Kalibel G & D sites respectively and the same have been used for simulation study of the link project. 5.8.3.2 Rainfall – Runoff Relationship
The concurrent weighted mean rainfall and runoff data have been used to derive rainfall-runoff models. The inconsistent data points, if any, have been discarded. Rainfall-runoff relationship has been developed for monsoon period. The monthly models for the monsoon period (June to September) have also been developed to disaggregate the monsoon yield into monsoon months.
The rainfall-runoff relations developed at the G & D sites for monsoon period are shown in Fig 5.50 to 5.56:
The monthly rainfall-runoff models have also been developed at above G & D sites. The details of monthly models are given in Table 5.15:
Table 5.15 Monthly Rainfall-Runoff Models Developed at Various G & D sites
Sl. Month Gauge and Discharge Site

180
No. Nanivahiyal in Par Basin
Bhervi in Auranga Basin
Amba in Auranga Basin
(1) (2) (3) (4) (5) 1 Jun Y=0.27764 x -
48.56 Y=0.61052 x -123.54
Y=0.31484 x -51.08
2 Jul Y=0.79357 x -300.83
Y=0.88427 x -300.18
Y=0.6026 x -147.24
3 Aug Y=0.61543 x +26.81
Y=0.94561 x -167.09
Y=0.85518 x -77.16
4 Sept Y=0.73749 x +22.75
Y=0.7342 x -11.70
Y=0.81117 x -33.14
Table 5.15 (contd..) Sl No
Month Gauge and Discharge Site Gadat in
Ambica Basin Kudkas in
Ambica Basin Mahuva in Purna
Basin (1) (2) (6) (7) (8) 1 Jun Y=0.25697 x –
30.92 Y=0.37931 x -71.66
Y=0.04388 x -5.69
2 Jul Y=0.83023 x -324.60
Y=0.47828 x -139.04
Y=0.80448 x -243.15
3 Aug Y=0.47714 x +69.31
Y=0.64783 x + 19.64
Y=0.88019 x -110.86
4 Sept Y=0.80751 x -19.35
Y=0.84862 x -14.82
Y=0.66988 x -12.78
Table 5.15 (contd.)
Sl No Month Kalibel in Purna Basin (1) (2) (9) 1 Jun Y=0.15192 x – 8.18 2 Jul Y=0.42232 x -102.78 3 Aug Y=0.91623 x -142.07 4 Sept Y=0.81182 x -29.76

181
The monsoon model is generally found more robust and realistic to
the catchment behavior as compared to monthly models as it represents lumped rainfall runoffprocess for the entire season and most of the monthly fluctuations get compensated. Therefore, monsoon model has been used to derive the monsoon yield. Monthly models have been used to disaggregate the monsoon yield into monthly yields.
The non monsoon yield has been taken as the percentage of monsoon yield based on the observed discharge data of the respective G & D sites. The percentage of non-monsoon flow to monsoon flow at Various G & D sites are given in Table – 5. 16:
Table – 5.16 Percentage of Non Monsoon Flow to Monsoon Flow
Sl. No.
G & D Site % of Non Monsoon Flow to Monsoon Flow
1 Nanivahiyal 8.87 2 Bhervi 8.81 3 Amba 5.78 4 Gadat 9.59 5 Kudkas 9.31 6 Mahuva 12.04 7 Kalibel 10.78
Even during non monsoon months, flows are mainly limited to
October and November months and there is hardly any flow after December month. 5.8.3.3 Gross Yield Series
In Par basin Gauge and Discharge data at Nanivahiyal G & D site (located quite downstream of proposed Mohankavchali, Jheri and Paikhed dams) is available for the period from 1966 to 2004. The same has been used for developing the monthly and monsoon Rainfall-Runoff models at Nanivahiyal G & D site. Using the Rainfall-Runoff modeling at Nanivahiyal G & D site, the yield series have been generated from 1975 to 2006 on monthly basis for whole Par basin and proposed Jheriand Paikhed dams.

182
In Auranga basinthe Gauge and Discharge data of Bhervi G & D site across Auranga river is available for the period from 1974 to 2006 and has been used for developing the monthly and monsoon Rainfall - Runoff models. Using Rainfall - Runoff models developed at Bhervi G & D site, the yield series for whole Auranga basin has been developed from 1975 to 2006. Gauge and Discharge data at Amba G & D site across Tan river located downstream of proposed Chasmandva dam is available for the period from 1962 to 2004. The data of Amba G & D site have been used for developing the monthly and monsoon Rainfall - Runoff models. Using Rainfall - Runoff models at Amba G & D site, the yield series at proposed Chasmandva dam site has been developed from 1975 to 2006.
In Ambica basin the Gauge and Discharge data at Gadat G & D site located across Ambica river is available for the period from the year 1979 to 2004 and same has been used for developing the monthly and monsoon Rainfall - Runoff models. Using Rainfall Runoff models developed at Gadat G & D site, the yield series for whole Ambica basin has been generated for the period from 1975 to 2006. Gauge and Discharge data at Kudkas G & D site located just upstream of the proposed Dabdar reservoir across Khapri river (tributary of Ambica river) is available from the year 1980 to 2006. The yield series at proposed Dabdar dam site has been generated from year 1980 to 2006 on catchment area proportionate basis, using observed data after duly checking the consistency. The inconsistent data have been modified using Rainfall - Runoff modeling. As rainfall data is available for long period, the same has been used to extend the yield series from 1975 to 1979 using Rainfall - Runoff modeling developed at Kudkas G & D site. Thus the yield series from 1975 to 2006 has been used for working out the water availability at the Dabdar dam site. Rainfall-Runoff models developed at Kudkas G & D site have been used to derive the yield series at proposed Chikkar dam site. The yield series at proposed Chikkar dam site has been generated from 1975 to 2006.
In Purna basinfor working out the water availability for whole Purna basin the monthly and monsoon Rainfall - Runoff models have been developed at Mahuva G & D site where discharge data is available from the year 1979 to 2004. The yield series for whole Purna basin has been generated from 1975 to 2006 using Rainfall - Runoff modeling. Gauge and Discharge data at Kalibel G & D site is available for the period from the year 1962 to 2000 except for the years 1979, 1980, 1991, 1992, 1993 to 1996 and 1999. The site is located just upstream of the proposed Kelwan
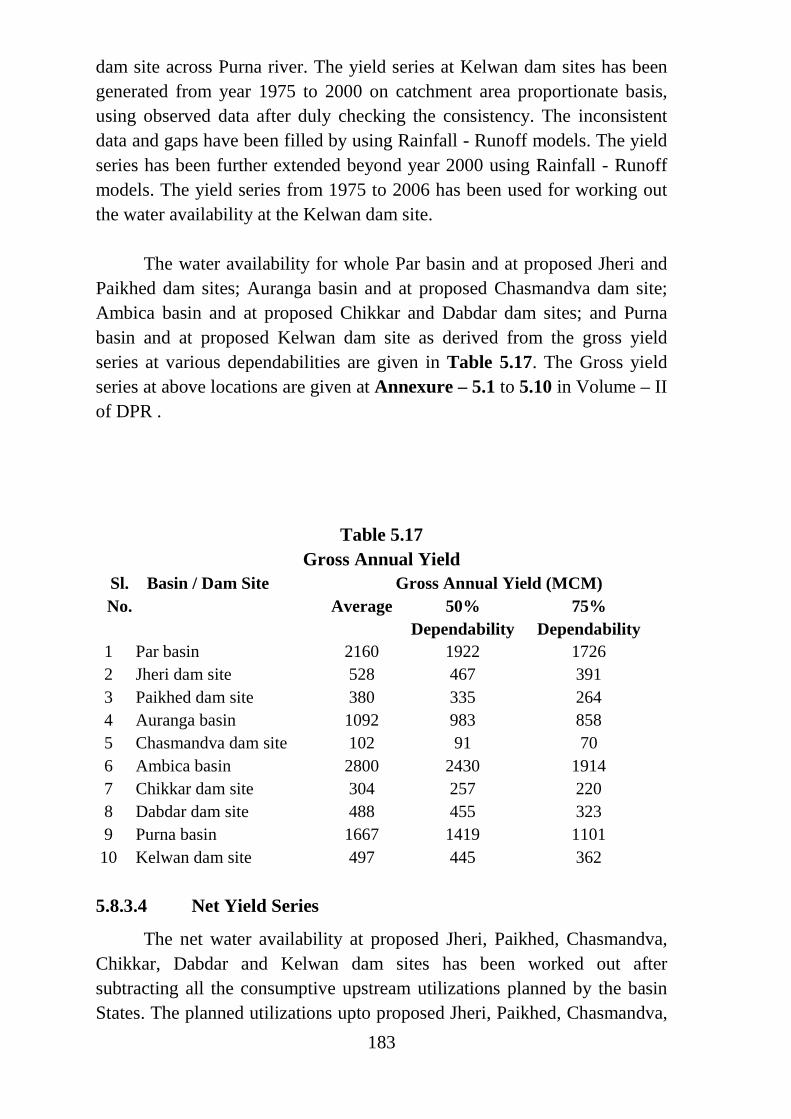
183
dam site across Purna river. The yield series at Kelwan dam sites has been generated from year 1975 to 2000 on catchment area proportionate basis, using observed data after duly checking the consistency. The inconsistent data and gaps have been filled by using Rainfall - Runoff models. The yield series has been further extended beyond year 2000 using Rainfall - Runoff models. The yield series from 1975 to 2006 has been used for working out the water availability at the Kelwan dam site.
The water availability for whole Par basin and at proposed Jheri and Paikhed dam sites; Auranga basin and at proposed Chasmandva dam site; Ambica basin and at proposed Chikkar and Dabdar dam sites; and Purna basin and at proposed Kelwan dam site as derived from the gross yield series at various dependabilities are given in Table 5.17. The Gross yield series at above locations are given at Annexure – 5.1 to 5.10 in Volume – II of DPR .
Table 5.17 Gross Annual Yield
Sl. No.
Basin / Dam Site Gross Annual Yield (MCM) Average 50%
Dependability 75%
Dependability 1 Par basin 2160 1922 1726 2 Jheri dam site 528 467 391 3 Paikhed dam site 380 335 264 4 Auranga basin 1092 983 858 5 Chasmandva dam site 102 91 70 6 Ambica basin 2800 2430 1914 7 Chikkar dam site 304 257 220 8 Dabdar dam site 488 455 323 9 Purna basin 1667 1419 1101 10 Kelwan dam site 497 445 362 5.8.3.4 Net Yield Series
The net water availability at proposed Jheri, Paikhed, Chasmandva, Chikkar, Dabdar and Kelwan dam sites has been worked out after subtracting all the consumptive upstream utilizations planned by the basin States. The planned utilizations upto proposed Jheri, Paikhed, Chasmandva,

184
Chikkar, Dabdar and Kelwan dam sites is given in Table 5.18. The Net yield series at above locations isgiven at Annexure 5.11 to 5.16 in Volume- IIof DPR .
Table 5.18 Planned Utilizations Upstream of Proposed Dam Sites upto
Sl No.
Type of Demand
Jheri Dam Site(MCM) Paikhed Dam Site (MCM) Existing Projects
Ongoing Projects
Proposed Projects
Total Existing Projects
Ongoing Projects
Proposed Projects
Total
1. Irrigation 6.49 1.58 11.09 19.16 1.61 - 11.32 12.93 2. Hydro - - - - - - - - 3. Domestic 1.30 1.83 4. Industrial 3.94 3.99 5. Envr.and
Ecological - 3.06
Total 24.40 21.81
Table – 5.18 (contd.) Planned Utilisation Upstream of Proposed Dam Sites upto
Sl No.
Type of Demand
Chasmandva Dam Site (MCM)
Chikkar Dam Site (MCM)
Existing Projects
Ongoing Projects
Proposed Projects
Total Existing Projects
Ongoing Projects
Proposed Projects
Total
1. Irrigation - - 5.88 5.88 - - 52.79 52.79 2. Hydro - - - - - - - 3. Domestic 0.27 0.64 4. Industrial 0.85 2.20 5. Envr.and
Ecological 0.59 2.42
Total 7.59 58.05
Table – 5.18 (contd.) Planned Utilisation Upstream of Proposed Dam Sites upto
Sl No.
Type of Demand
Dabdar Dam Site (MCM) Kelwan Dam Site (MCM)

185
Existing Projects
Ongoing Projects
Proposed Projects
Total Existing Projects
Ongoing Projects
Proposed Projects
Total
1. Irrigation - - 61.54 61.54 - - 52.47 52.47 2. Hydro - - - - - - - - 3. Domestic 3.88 5.22 4. Industrial 5.53 7.53 5. Envr.andE
cological 3.93 4.10
Total 74.88 69.32
Regeneration from major and medium irrigationprojects has been taken as 10 percent while the same has been neglected in case of minor irrigation projects. The regeneration from domestic and industrial uses has been considered as 80 percent. The net consumptive abstraction considering from regeneration due to planned projects in upstream is estimated and shown in Table 5.19:
Table 5.19 Net Consumptive Abstraction U/S of Dam Sites
and Downstream Requirement Dam Site Abstraction U/S of Dam Sites (MCM) Environmental
and Ecological D/s of Dam (MCM)
Irrigation (Minor)
Hydro
Domestic
Industrial
Total
Jheri 19.16 0 0.26 0.79 20.21 - Paikhed 12.93 0 0.37 0.8 14.1 3.06 Chasmandva 5.80 0 0.05 0.17 6.02 0.59 Chikkar 50.29 0 0.13 0.44 50.86 2.42 Dabdar 58.67 0 0.78 1.11 60.56 3.93 Kelwan 52.47 0 1.04 1.51 55.02 4.10
The net yield series have been generated at proposed Jheri, Paikhed,
Chasmandva, Chikkar, Dabdar and Kelwan dam sites after deducting the net consumptive utilizations upto dam sites from the gross yields. The net yield at all the 6 dam sites at various dependabilities as worked out is furnished in Table 5.20:
Table 5.20

186
Net Yield (MCM) at Dam Sites Diversion point Average 50% dependability 75% dependability
Jheri 508.7 446.3 371.1 Paikhed 366.6 320.8 249.9 Chasmandva 96.1 84.9 64.0 Chikkar 254.7 206.2 169.7 Dabdar 429.9 394.2 262.0 Kelwan 443.5 390.3 307.6
The Water Availability Study report of Par-Tapi-Narmada link
(March, 2012) carried out by hydrological Studies Organization of Central Water Commission is given at Appendix 3.1 inVolume - IVof DPR. 5.8.3.5 Diversion and Small Pondages
It is proposed to divert 1210 MCM through Par-Tapi-Narmada linkcanal from all the proposed reservoirs for utilization in en-route of link canal for irrigation, drinking water supply mostly in tribal areas and filling tanks/Check dams in the benefitted areas and also to take over the part command area of existing Miyagam Branch Canal of Narmada Canal System. The Narmada water so saved will be utilized by substitution in the tribal areas of Chota Udepur and Panchamahal Districts and water short Saurashtra region to provide irrigation and drinking water facilities. Details of diversion quantity are given in Table 5.21:
Table 5.21
Details of Diversion Quantity Sl. No.
Dam Diversion Quantity (MCM)
1 Jheri 176 2 Paikhed 250 3 Chasmandva 64 4 Chikkar 150 5 Dabdar 262 6 Kelwan 308 Total 1210
5.9 Sedimentation Studies

187
5.9.1 Revised Area Capacity Curves
Reservoir sedimentation studies for all the6 reservoirs proposed in Par-Tapi-Narmada link project have been carried out by Hydrological Studies organization, Central Water Commission, New Delhi. The Report on Sedimentation Study of Par-Tapi-Narmada link project is at Appendix 5.2 in Volume – IV of the DPR of link project prepared by NWDA in August, 2015.Sediment data measurements are being observed in three rivers only: Ambica, Purna and Auranga rivers. Data for Par and Nar basins are not available. Using the observed values of daily discharge and sediment concentration, sedimentation rate in the 3 river basins were assessed and are given below in Table 5.22: Table 5.22
Suspended Sediment Rate Sl. No.
G & D Site
River Sediment Rate (mm/year) Suspended Load (SL) Total Load (1.15*SL)
1 Gadat Ambica 0.2443 0.2810 2 Mahuwa Purna 0.3693 0.4247 3 Amba Auranga 0.3831 0.4406
The sedimentation rates observed at G & D data sites are relatively
lower as compared to sediment rate based on hydrographic survey of five reservoirs in the region and much lower than the generalized siltation rate recommended for the region (west flowing rivers beyond Tapi) in the “Compendium of Silting of Reservoirs in India” (Table 5.23:)
Table 5.23
Average and Median Values of Rate of Siltation taken from “Compendium on Silting of Reservoirs in India”
Zone for Sedimentation
Rate
Region No. of Reservoirs
Under Study
Average Siltation
Rate mm/yr
Median Siltation
Rate mm/yr
6 Narmada and Tapi Basin
3 0.729 0.75
7 West Flowing Rivers beyond Tapi and South
19 3.533 1.79

188
Indian Rivers
The hydrographic survey of five existing reservoirs in the region indicates sedimentation rate of 7.15 ha m/ 100 km2/year. The hydrographic Survey of Madhuban reservoir in Damanganga basin, which lies towards south of Par-Tapi-Narmada link projects, gave sedimentation rate of 8.94 ha m / 100 km2/yr. Normal rainfall in Damanganga basin is higher than the normal rainfall in river basins of Par-Tapi-Narmada link and therefore sedimentation rate of 7.15 ha m / 100 km2/yr, as assessed based on hydrographic survey of existing reservoirs in the region, appears in order. However, the land use changes are likely to impact the sediment generation from the catchment in the future with increasing human activities such as agriculture etc. Presently the catchment of these river basins particularly the upper catchment are not significantly affected by the human activities. Impact of climate change is likely to increase rainfall intensities and extreme meteorological events. In view of above factors, the observed sedimentation rate of 7.15 ha m/100 km2/ year is enhanced by 25% and sedimentation rate of 8.94 say 9 ha m/100 km2/yr has been adopted in the analysis of all the seven reservoirs in the Par-Tapi-Narmada link.
The sedimentation distribution in reservoir submergence has been carried out for two periods viz. 50 years and 100 years using Empirical area reduction method as per IS: 5477 (part-2) 1994, ‘Fixing the capacities of reservoirs’. The Jheri reservoir has been classified as Type – III(Hill) and remaining 6 reservoirs have been classified as Type – II(Flood plain foot hill). The total quantity of sediment likely to be deposited in 50-years and 100-years of life in the reservoirs and corresponding New Zero Elevations as estimated are given in Table 5.24:
Table 5.24
50 Year and 100 Year Sediment Volume and New Zero Elevation Sl. No.
Reservoir After 50 Years After 100 Years Sediment Volume (MCM)
New Zero
Elevation (m)
Sediment Volume (MCM)
New Zero Elevation
(m)
1 Jheri 18.01 185.00 35.94 198.50 2 Paikhed 13.57 164.34 27.11 171.88 3 Chasmandva 3.88 171.75 7.76 176.00
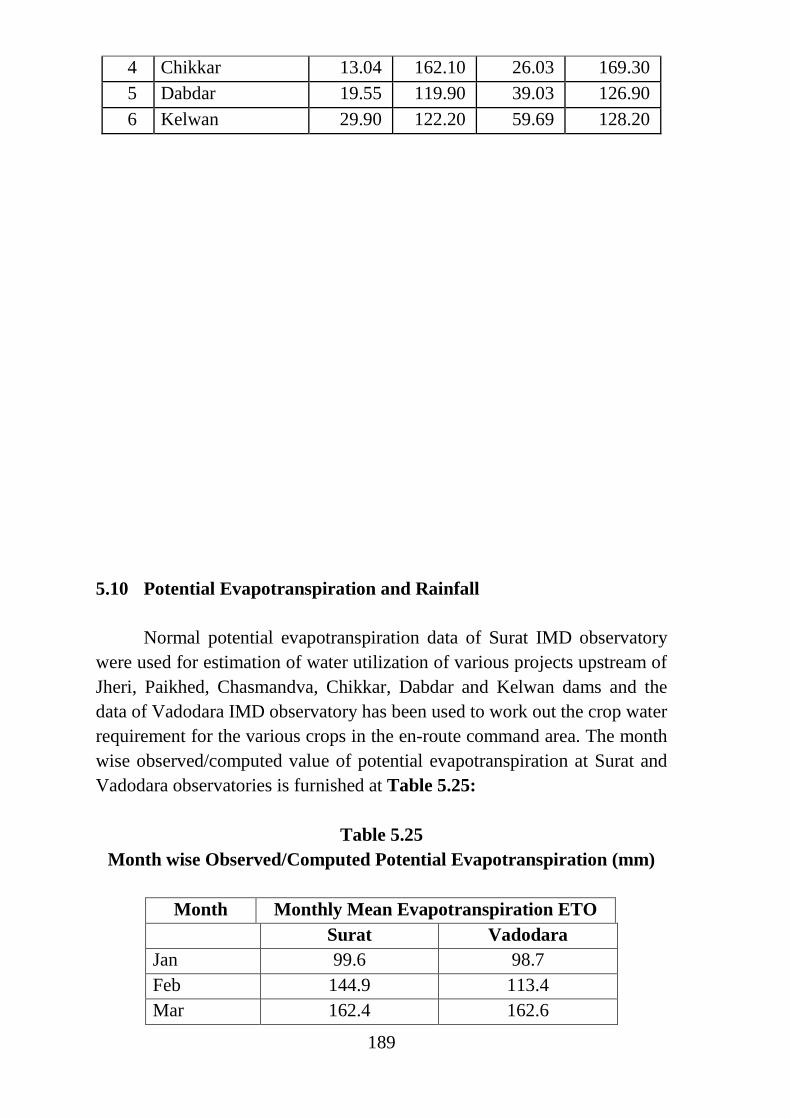
189
4 Chikkar 13.04 162.10 26.03 169.30 5 Dabdar 19.55 119.90 39.03 126.90 6 Kelwan 29.90 122.20 59.69 128.20
5.10 Potential Evapotranspiration and Rainfall
Normal potential evapotranspiration data of Surat IMD observatory were used for estimation of water utilization of various projects upstream of Jheri, Paikhed, Chasmandva, Chikkar, Dabdar and Kelwan dams and the data of Vadodara IMD observatory has been used to work out the crop water requirement for the various crops in the en-route command area. The month wise observed/computed value of potential evapotranspiration at Surat and Vadodara observatories is furnished at Table 5.25:
Table 5.25
Month wise Observed/Computed Potential Evapotranspiration (mm)
Month Monthly Mean Evapotranspiration ETO Surat Vadodara Jan 99.6 98.7 Feb 144.9 113.4 Mar 162.4 162.6

190
Apr 185.7 192.8 May 202.0 246.4 Jun 152.4 197.8 Jul 109.2 128.2 Aug 107.9 114.9 Sep 114.6 129.6 Oct 141.5 143.1 Nov 116.2 111.0 Dec 99.2 92.9
5.11 Inputs for Water Quality
Different parameters of water quality are observed regularly at Nanivahiyal on Par, Amba on Tan and Mahuva Gand D (State) site on Purna river by Water Resources Dept, Government of Gujarat. The details of water quality had been already briefed at Para 5.4.6. Also, as part of the field study done for Environmental Impact Assessment studies by WAPCOS Ltd., for the link project while preparing the DPR in August, 2015. Surface water samples were collected from various rivers in the project area and analyzed for various physio-chemical parameters for ascertaining the water quality status in the project area during summer, winter and monsoon seasons. The details are furnished in Chapter- 11 “Environmental Impact Assessment and Environmental Management Plan” of the DPR of link project prepared by NWDA in August, 2015. The laboratory test results carried out for collected water samples indicate that the quality of surface water is generally of safe category. 5.12 Low Flow Inputs
The WRD, Government of Gujarat is observing Gauge and Discharge data at Nanivahiyal G & D site across river Par; Amba across Tan, Bhervi across Auranga and Asura across Man all in Auranga basin; Kudkas across Khapri, Unai across Ambica river all in Ambica basin; and Kalibel and Navsari G & D sites across Purna river. The Central Water Commission is also observing the Gauge and Discharge data at Gadat G & D site across Ambica river and Mahuva G & D site across Purna river. Daily G & D data at these G & D sites is available for varying period (Table 5.8). Analysis of the observed daily discharge data at these G & D sites indicates that the flow in these rivers is zero during summer months every year.

191
5.13 Surface to Ground Water Recharge
The quantum of water proposed to be transferred through Par – Tapi - Narmada link project is of the order of 1210 MCM annually, utilizing382 MCM for en-route irrigation, 285 MCM for Projects proposed by the Government of Gujarat on the left side of the canal, 138 MCM for Tribal area enroute right side of canal, 48 MCM Tribal area in the vicinity of reservoirs, 90 MCM and 40 MCM for Tribal areas on right side of Narmada Main Canal by liftin Chhota Udepur dist and Panchmahal dist. respectively, 48 MCM towards Supply of drinking water for all villages of Dang District and Villages of Kaprada and Dharampur taluka of Valsad District, 18 MCM for Filling all possible tanks in benefitted areas, 161 MCM for Target command in Saurashtra region. As the bottom surface and both side slopes of the entire link canal for diverting the above water will be lined with cement concrete, there may not be much seepage loss to the ground water. Thus, the hazards of water logging and salinization is not anticipated in the region.
5.14 Data for Studies other than Simulation 5.14.1 Design Flood and Diversion Flood Studies of Dams
The Par-Tapi-Narmada link project envisages total 6 dams; Jheri across river Par, Paikhed across river Nar (a tributary of Par river); Chasmandva across river Tan in Auranga basin; Chikkar across Ambica river; Dabdar across river Khapri (a tributary of Ambica river); and Kelwan across river Purna. Two weirs one each in the downstream of Paikhed and Chasmandva dam sites are also proposed. The Design Flood and Diversion Flood studies at all the six dams and 2 barrages proposed in Par – Tapi – Narmada link project have been carried out by Hydrological Studies Organization, Central Water Commission, New Delhi. The Reports on flood study of Par-Tapi-Narmada Link, Part-I covering the design and diversion flood studies of dams carried out by Central Water Commission are at Appendix 3.3 in Volume-IV of the DPR of link project prepared by NWDA in August, 2015.
Hydro-meteorological approach has been used for computing design flood and diversion flood. The catchment response functions have been derived using Regional Flood Estimation Report. The short interval observed discharge data and concurrent rainfall data are not available at any of the 7 dam sites proposed in Par-Tapi-Narmada link, as such, the unit

192
hydrographs at the proposed dam sites and barrage sites have been derived synthetically based on physiographic characteristics using Flood Estimate Report. The storm studies as carried out by IMD, have been used in the study. The 100/50 year return period rainfalls have been adopted from the State-wise isopluvial maps published by IMD. The time distribution has been supplied by IMD and used in the study. Loss rate parameters have been taken from Regional Flood Estimation Report. The base flows have been assessed based on observed flood events. The design flood and diversion flood studies carried out for the dams are briefly described below: 5.14.1.1 Derivation of Unit Hydrograph Short interval observed discharge and concurrent rainfall data is not available at the project sites and therefore, the unit hydrograph at the project location has been derived synthetically using FER. i) Physiographic Characteristics
The physiographic parameters for derivation of unit hydrograph at the dam sites such as catchment area, slope (s) and length of river etc have been derived using Survey of India Topo - sheets in 1: 50000 scale. Physiographic parameters as derived are given in Table 5.26:
Table 5.26 Physiographic Parameters at Dam Sites
Sl No.
Parameter Catchment Area (A)
km2
Length of River (L)
km
Equivalent Slope (S)
m/km
L/S Dam Site
1 Jheri 425 57.67 7.41 7.78 2 Paikhed 315 70.60 5.27 13.40 3 Chasmandva 89 21.75 8.43 2.58 4 Chikkar 304 53.40 5.59 9.55 5 Dabdar 457 74.85 4.32 17.33 6 Kelwan 694 88.95 3.73 23.85
ii) Unit Hydrograph Parameters
Considering the physiographic parameters as above, UG parameters have been computed based on “Flood Estimation Report 5 (a) and 5 (b) for

193
West Coast Region, Konkan and Malabar Coasts”. The UG Parameters are given in Table 5.27:
Table 5.27
Unit Hydrograph Parameters at Dam Sites Sl. No.
Parameter Unit Jheri Paikhed
(1) (2) (3) (4) (5)
1 qp = 0.9178*(L/S)^-0.4313 cumec 0.379 0.300 2 tp=1.5607*(qp)^-1.0814 hr 4.500 5.500 3 W50 =1.9251*(qp)^-1.0896 hr 5.540 7.150 4 W75 =1.0189*(qp)^-1.0443 hr 2.810 3.580 5 WR50 =0.5788*(qp)^-1.1072 hr 1.690 2.200 6 WR75=0.3469*(qp)^-1.0538 hr 0.960 1.230 7 TB =7.3801*(tp)^0.7343 hr 22.000 26.000 8 Tm =tp+tr/2 hr 5.000 6.000 9 Qp =qp*A cumec 161.000 94.500 10 ∑Qi =A*d/tr*0.36 cumec 1181.000 875.000 d=1.00cm ,tr=1hrs
Table 5.27 (contd.) Unit Hydrograph Parameters
Sl. No.
Parameter Unit Chasmandva
Chikkar
Dabdar Kelwan
(1) (2) (3) (6) (7) (8) (9)
1 qp = 0.9178*(L/S)^-0.4313 cumec 0.610 0.347 0.268 0.234 2 tp=1.5607*(qp)^-1.0814 hr 2.500 4.50 6.50 7.500 3 W50 =1.9251*(qp)^-1.0896 hr 3.300 6.10 8.08 9.370 4 W75 =1.0189*(qp)^-1.0443 hr 1.710 3.08 4.03 4.640 5 WR50 =0.5788*(qp)^-1.1072 hr 1.000 1.87 2.49 2.890 6 WR75=0.3469*(qp)^-1.0538 hr 0.580 1.06 1.39 1.600 7 TB =7.3801*(tp)^0.7343 hr 14.000 22.00 29.00 32.000 8 Tm =tp+tr/2 hr 3.000 5.00 7.00 8.000 9 Qp =qp*A cumec 54.290 105.49 122.48 162.400
10 ∑Qi =A*d/tr*0.36 cumec 247.000 844.00 1269.00 1928.000 d=1.00cm ,tr=1hrs

194
iii) Validation of Unit Hydrographs
Observed short interval discharge and corresponding rainfall data are not available at project locations. Therefore, the synthetic unit hydrographs as derived above could not be validated by observed data. 5.14.1.2 Design Storm Studies i) PMP Studies
The storm study for the project has been carried by IMD. Earlier the storm studies were submitted by IMD in year 2010. However, IMD was requested to review the storm study as the 1-day SPS and PMP values supplied by IMD appeared on lower side. The storm study has been reviewed by IMD and revised storm values were received in May, 2012.
The following rainstorms were considered by IMD: 1-3 July 1941 (Centered at Dharampur, North – West of Project) 9-10 July 1958 (Centered at Ghatghar, South-East of Project)
The rainstorm of 1-3 July 1941 (Centered at Dharampur) has been found
the severe most rainstorms in the vicinity of the project catchment for 1-day and 2-day design storm values. The SPS, PMP and MAF (Moisture Adjustment Factor) values as finalized by IMD are in Table 5. 28:
Table 5.28 SPS, PMP and MAF Values
Sl. No.
Diversion Site SPS (cm) PMP (cm) MAF 1 day 2 day 1 day 2 day
1 Jheri 77.5 111.8 90.7 130.8 1.17 2 Paikhed 78.7 114.5 92.1 134.0 1.17 3 Chasmandva 98.8 126.0 115.6 147.4 1.17 4 Chikkar 78.4 114.4 91.7 133.7 1.17 5 Dabdar 75.9 110.0 88.8 128.7 1.17 6 Kelwan 64.5 99.1 75.5 115.9 1.17
However, it is seen that in transposition of 1941 Dharampur storm to
the catchment of Jheri dam by IMD, the storm pattern has been moved quite

195
considerably even towards ridge line (eastward) though it is mentioned in the report that the storm pattern has been moved along ridge line only ( north-south). This has resulted in transposed depth of 77.5 cm. The Hydrological Studies Organization (HSO) of Central Water Commission is of the view that the movement of storm towards ridge line should be very limited. Central Water Commission has worked out the transposed depth by restricting the movement of storm pattern towards ridge line and one day transposed depth works out as 63.5 cm. applying the MAF of 1.17, the one day PMP works out as 74.3 cm which has been adopted as one day design storm for estimating PMF. ii) 50 and 100 Year Return Period Rainfall
50/100-year return period point rainfalls have been taken from the isopluvial maps published by IMD recently. 50/100-year return period point rainfall and areal rainfall for various reservoirs are given in Table 5.29:
Table 5.29
50 and 100 Year Return Period Rainfall Sl. No.
Flood
Area 24 hr Point Rainfall
Point to Areal Rainfall Ratio*
24 hr Areal
RF (km2) (cm) (cm)
1 Jheri Dam 50-Year Return Period 425 40 0.86 34.40 100-Year return period 425 44 0.86 37.84 2 Paikhed Dam
50-Year Return Period 315 44 0.88 38.72 100-Year return period 315 48 0.88 42.24 3 Chasmandva Dam 50-Year Return Period 89 52 0.95 49.4 100-Year return period 89 54 0.95 51.3 4 Chikkar Dam 50-Year Return Period 304 44 0.88 38.72 100-Year return period 304 48 0.88 42.24 5 Dabdar Dam 50-Year Return Period 457 42 0.85 35.7 100-Year return period 457 46 0.85 39.1 6 Kelwan Dam
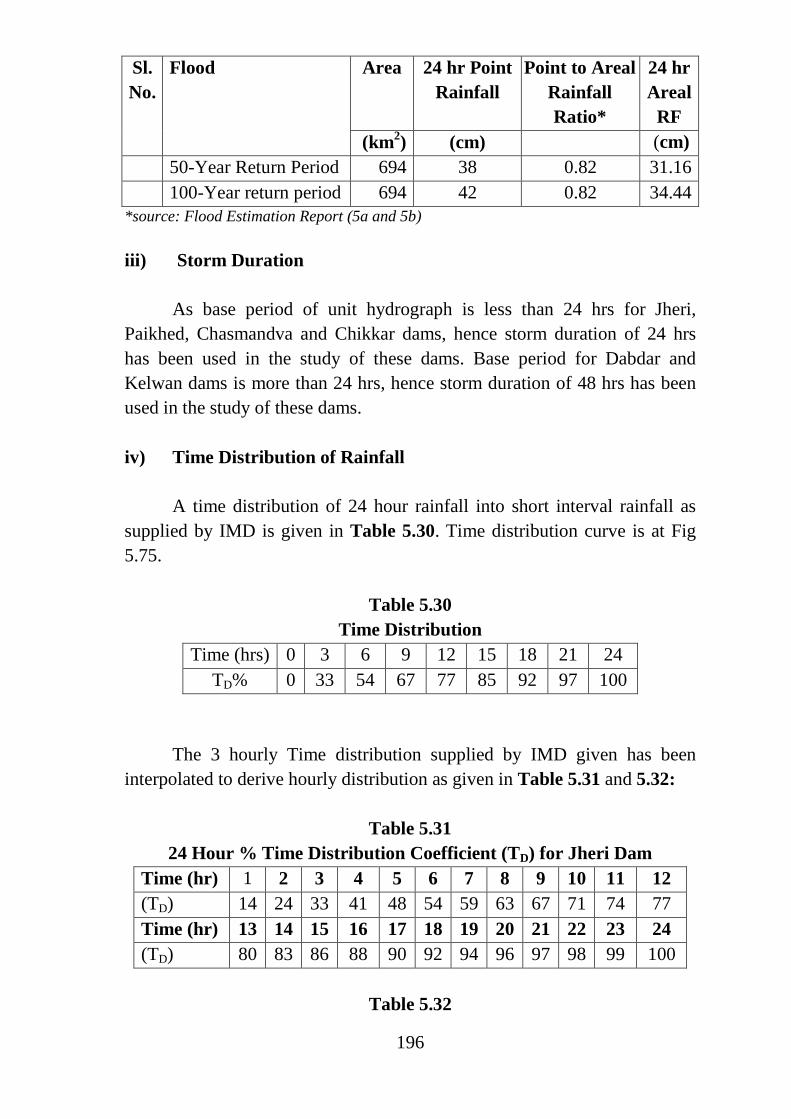
196
Sl. No.
Flood
Area 24 hr Point Rainfall
Point to Areal Rainfall Ratio*
24 hr Areal
RF (km2) (cm) (cm)
50-Year Return Period 694 38 0.82 31.16 100-Year return period 694 42 0.82 34.44
*source: Flood Estimation Report (5a and 5b) iii) Storm Duration
As base period of unit hydrograph is less than 24 hrs for Jheri, Paikhed, Chasmandva and Chikkar dams, hence storm duration of 24 hrs has been used in the study of these dams. Base period for Dabdar and Kelwan dams is more than 24 hrs, hence storm duration of 48 hrs has been used in the study of these dams. iv) Time Distribution of Rainfall
A time distribution of 24 hour rainfall into short interval rainfall as supplied by IMD is given in Table 5.30. Time distribution curve is at Fig 5.75.
Table 5.30 Time Distribution
Time (hrs) 0 3 6 9 12 15 18 21 24 TD% 0 33 54 67 77 85 92 97 100
The 3 hourly Time distribution supplied by IMD given has been interpolated to derive hourly distribution as given in Table 5.31 and 5.32:
Table 5.31 24 Hour % Time Distribution Coefficient (TD) for Jheri Dam
Time (hr) 1 2 3 4 5 6 7 8 9 10 11 12 (TD) 14 24 33 41 48 54 59 63 67 71 74 77 Time (hr) 13 14 15 16 17 18 19 20 21 22 23 24 (TD) 80 83 86 88 90 92 94 96 97 98 99 100
Table 5.32

197
24 Hour %Time Distribution Factors (TD) for the Dams Except Jheri Dam
Time (hr) 1 2 3 4 5 6 7 8 9 10 11 12 (TD) 11 22 33 40 48 54 59 63 67 71 74 77 Time (hr) 13 14 15 16 17 18 19 20 21 22 23 24 (TD) 80 82 85 87 90 92 94 96 97 98 99 100
As the design storm depth is to be convoluted as two bells per day
approach, time distribution coefficients for 12 hour rainfall has been worked out based on 24 hour distribution as given in Table 5.33 and 5.34:
Table 5.33 12 Hour Time Distribution Coefficients for Jheri Dam
Time (hr) 1 2 3 4 5 6 7 8 9 10 11 12 (TD) 18 31 43 53 62 70 77 82 87 92 96 100
Table 5.34
12 Hour Time Distribution Coefficients for the Dams Except Jheri Dam Time (hr) 1 2 3 4 5 6 7 8 9 10 11 12
(TD) 14 29 43 52 62 70 77 82 87 92 96 100 v) Design Loss Rate
A loss rate of 0.19 cm/hr (modal loss rate) as recommended in the Flood Estimation Report for sub zone 5(a) and 5(b) has been adopted for computing 50/100 year return period floods. A lower loss rate of 0.10 cm/hr has been considered for PMF estimation. 5.14.1.3 Convolution
The rainfall excess has been convoluted with the unit hydrograph developed for dams to compute Direct Surface Runoff Ordinate (DSRO). A base flow at the rate of 0.15 cumec / km2 has been added to the ordinates of the DSRO to get the design flood hydrograph ordinates. 5.14.1.4 Design Flood (PMF)

198
The design flood hydrograph for all the 7 dams are at Fig 5.76 to 5.81 and the design peak flood as worked out is given in Table 5.35:
Table 5. 35 Design Peak Flood for Various Dams
Dam Design Peak Flood (cumec) Jheri 6539 Paikhed 5307 Chasmandva 2578 Chikkar 5649 Dabdar 6683 Kelwan 7979
5.14.1.5 Diversion Flood i) Diversion Flood (50 Year Return Period)
The 50 year return period hydrograph for all the 6 dams are at Fig 5.82 to 5.87 and 50 year return period peak flood as worked out is given in Table 5.36:
Table 5. 36 50 Year Return Period Peak Flood for Various Dams
Dam 50 Year Return Period Peak Flood (cumec)
Jheri 2703 Paikhed 2017 Chasmandva 1024 Chikkar 2167 Dabdar 2539 Kelwan 3102

199
ii) Diversion Flood (100 Year Return Period)
The 100 year return period hydrograph for all the 6 dams are at Fig5.88 to 5.93 and 100 year return period peak flood as worked out is given in Table 5.37:
Table 5.37 100 Year Return Period Peak Flood for Various Dams Dam 100 Year Return Period
Peak Flood (cumec) Jheri 2989 Paikhed 2211 Chasmandva 1065 Chikkar 2374 Dabdar 2796 Kelwan 3428
5.14.1.6 Conclusion
The design flood (PMF) and 50 year return period and 100 year return period diversion floods estimated by hydro-meteorological approach as above for all the 6 dams proposed in Par-Tapi-Narmada link are given in Table 5.38:
Table 5.38
Design flood (PMF) and Diversion Flood of Par-Tapi-Narmada link project
Sl. No.
Diversion Site PMF (cumec)
Diversion Flood (cumec) with Return Period
50 year 100 year 1 Jheri 6539 2703 2989 2 Paikhed 5307 2017 2211 3 Chasmandva 2578 1024 1065 4 Chikkar 5649 2167 2374 5 Dabdar 6683 2539 2796 6 Kelwan 7979 3102 3428
5.14.2 Design Flood and Diversion Flood Studies of Barrages

200
Two barrages one each in the downstream of Paikhedand Chasmandva dam sites are also proposed in Par-Tapi-Narmada link project. The flood studies of these weir sites have been carried out by Hydrological Studies Organization of Central Water Commission. The Reports on flood study of Par-Tapi-Narmada link, Part-II covering the design flood studies for diversion barrages carried out by Central Water Commission are at Appendix –3.4 in Volume - IV.The flood studies at the 6 dam sites are described in Para 5.14.1 and the similar studies at the weir sites are described below.
The flood studies at Paikhed and Chasmandva barrage sites have been carried out using hydro-meteorological approach. The whole catchment upto weir site has been divided into two sub catchments: i) Sub catchment upto respective dam site located in the upstream, and ii) sub catchment below dam upto weir site. The flood hydrograph worked out at dam site was suitably routed upto weir site and routed hydrograph was added to the flood hydrograph of free catchment to assess the resulting flood hydrograph at the weir site. As all the six dams proposed in Par-Tapi-Narmada link project are large dams and the spillway of the dams shall be designed corresponding to PMF, the peak of incoming SPF, 500 year and 100 year return period flood hydrograph is likely to be less than spillway capacity and therefore, the effect of reservoir routing has been ignored and outflow from these dams has been assumed same as inflow hydrograph at respective dam. The outflow hydrograph for the respective dams has been channel routed for dam site to respective weir site using Muskingum method. 5.14.2.1 Derivation of Unit Hydrograph Short interval observed discharge and concurrent rainfall data is not available at the project sites and therefore, the unit hydrograph for the free catchment between dam site and Barrage site has been derived synthetically using “Flood Estimation Report 5 (a) and 5 (b) for West Coast Region, Konkan and Malabar Coasts”. i) Physiographic Characteristics
The physiographic parameters for derivation of unit hydrograph for
the free catchment between dam site and Barrage site such as catchment area, slope and length of river etc have been derived using Survey of India
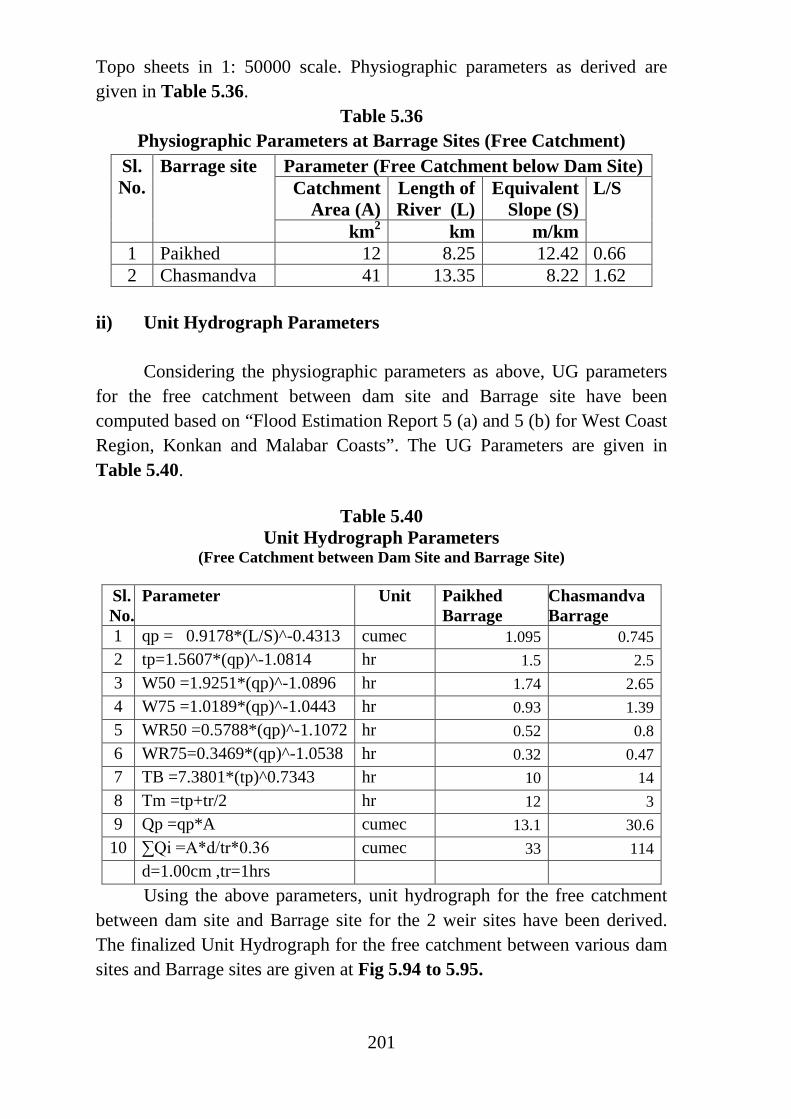
201
Topo sheets in 1: 50000 scale. Physiographic parameters as derived are given in Table 5.36.
Table 5.36 Physiographic Parameters at Barrage Sites (Free Catchment)
Sl. No.
Barrage site Parameter (Free Catchment below Dam Site) Catchment
Area (A) Length of River (L)
Equivalent Slope (S)
L/S
km2 km m/km 1 Paikhed 12 8.25 12.42 0.66 2 Chasmandva 41 13.35 8.22 1.62
ii) Unit Hydrograph Parameters
Considering the physiographic parameters as above, UG parameters for the free catchment between dam site and Barrage site have been computed based on “Flood Estimation Report 5 (a) and 5 (b) for West Coast Region, Konkan and Malabar Coasts”. The UG Parameters are given in Table 5.40.
Table 5.40
Unit Hydrograph Parameters (Free Catchment between Dam Site and Barrage Site)
Sl. No.
Parameter Unit Paikhed Barrage
Chasmandva Barrage
1 qp = 0.9178*(L/S)^-0.4313 cumec 1.095 0.745 2 tp=1.5607*(qp)^-1.0814 hr 1.5 2.5 3 W50 =1.9251*(qp)^-1.0896 hr 1.74 2.65 4 W75 =1.0189*(qp)^-1.0443 hr 0.93 1.39 5 WR50 =0.5788*(qp)^-1.1072 hr 0.52 0.8 6 WR75=0.3469*(qp)^-1.0538 hr 0.32 0.47 7 TB =7.3801*(tp)^0.7343 hr 10 14 8 Tm =tp+tr/2 hr 12 3 9 Qp =qp*A cumec 13.1 30.6 10 ∑Qi =A*d/tr*0.36 cumec 33 114 d=1.00cm ,tr=1hrs
Using the above parameters, unit hydrograph for the free catchment between dam site and Barrage site for the 2 weir sites have been derived. The finalized Unit Hydrograph for the free catchment between various dam sites and Barrage sites are given at Fig 5.94 to 5.95.

202
iii) Validation of Unit Hydrographs
Observed short interval discharge and corresponding rainfall data are not available at project locations. Therefore, the synthetic unit hydrographs as derived above could not be validated by observed data. 5.14.2.2 Design Storm Studies i) SPS Studies
The storm study for the project has been carried out by IMD. The details are described in Para 5.14.1.2. The SPS values for all the 6 dams as finalized by IMD are given in Table 5.28.
Using the storm pattern given in the IMD report, the Central Water Commission has estimated the SPS value for the free catchment between dam site and weir site for the 2 weir sites. As free catchment below the respective dam sites up to respective Barragesites is very small, the critical placement of the storm pattern as adopted for assessing the transposed depth for the catchments upto dam sites has been adopted for assessing the transposed storm depths for the sub catchments upto Barragesite. The transposed depth (SPS) values for the free catchment between dam sites and Barrage sites as estimated by Central Water Commission is given in Table 5.41.
Table 5.41
SPS Values for Free Catchment between Dam Sites and Barrage Sites
Weir Site Duration SPS (cm) Paikhed 1 day 87.48 Chasmandva 1 day 98.80
ii) 100 Year and 500 Year Return Period Rainfall 100 year return period point rainfalls have been taken from the isopluvial maps published by IMD recently. The Central Water Commission has assessed 500 year Return Period rainfall for the dam site as well as for the free catchment between respective dam sites and barragesites by Gumbel method (XT= X +KT *σn-1 ) X and σn-1 were assessed using various return period rainfall given in isopluvial maps of IMD as given in Table 5.42.

203
Table 5.42 Gumbel Parameters
Dam / Weir Site Gumbel Parameter X σn-1
Paikhed Dam 22 cm 7.545 Paikhed Barrage (Free catchment between dam and weir sites)
26 cm 8.415
Chasmandva Dam 24 cm 8.706 Chasmandva Barrage (Free catchment between dam and weir sites)
26 cm 9.286
100 year and 500 year return period point rainfall and areal rainfall
are given in Table 5.43.
Table 5.43 100 Year and 500 Year Return Period Rainfall
Sl. No.
Flood
Area 24 hr Point
Rainfall
Point to Areal Rainfall Ratio*
24 hr Areal
RF (km2) (cm) (cm) 1 Paikhed dam
100-Year return period 315 48 0.88 42.24 500-Year return period 315 58 0.88 51.00 2 Paikhed Barrage (free catchment)
100-Year return period 12 55 0.88 48.40 500-Year return period 12 67 0.88 59.00 3 Chasmandva dam
100-Year return period 89 54 0.94 50.80 500-Year return period 89 66 0.94 62.00 4 Chasmandva Barrage (free catchment)
100-Year return period 41 58 0.94 54.50 500-Year return period 41 70.8 0.94 66.60
*source: Flood Estimation Report (5a and 5b) iii) Storm Duration

204
As base period of unit hydrograph is less than 24 hr, storm duration of
24 hr has been used in the study. iv) Time Distribution of Rainfall
Time distribution of 24 hour rainfall into short interval rainfall as supplied by IMD is given in Table 5.44. Time distribution curve is at Fig 5.96.
Table - 5.44 Time Distribution
Time (hrs) 0 3 6 9 12 15 18 21 24
TD% 0 33 54 67 77 85 92 97 100 The 3 hourly Time distribution supplied by IMD has been interpolated to derive hourly distribution as given in Table 5.45.
Table 5.45
24 Hour % Time Distribution Coefficient (TD)
Time (hr) 1 2 3 4 5 6 7 8 9 10 11 12 (TD) 14 24 33 41 48 54 59 63 67 71 74 77 Time (hr) 13 14 15 16 17 18 19 20 21 22 23 24 (TD) 80 83 86 88 90 92 94 96 97 98 99 100
As the design storm depth is to be convoluted as two bells per day
approach, time distribution coefficients for 12 hour rainfall has been worked out based on 24 hour distribution are as given in Table 5.46.
Table 5.46
12 Hour Time Distribution Coefficients
Time (hr) 1 2 3 4 5 6 7 8 9 10 11 12 (TD) 18 31 43 53 62 70 77 82 87 92 96 100
v) Design Loss Rate

205
A loss rate 0.19 cm/hr as recommended in the Flood Estimation Report for sub zone 5(a) and 5(b) has been adopted for computing 100 year return period floods. A lower loss rate of 0.10 cm/hr has been considered for SPF estimation. 5.14.2.3 Convolution
The rainfall excess has been convoluted with the unit hydrograph developed for respective dam site and for the free catchment between respective dam sites and weir sites to compute Direct Surface Runoff Ordinate (DSRO). A base flow at the rate of 0.15 m3/s / km2 has been added to the ordinates of the DSRO to get the design flood hydrograph ordinates.
5.14.2.4 Flood Hydrograph at Barrage Sites
Outflow flood hydrograph at the respective dam sites has been routed using Muskingum method and routed flood hydrograph has been added to flood hydrograph of sub catchment between respective dam site and barrage site to assess the SPF, 500 year and 100 year return period flood for the respective weir site. The standard project flood hydrograph (SPF), 500 year return period flood and 100 year return period flood hydrograph for the Paikhed barrage are given in Fig 5.97 to 5.99 respectively. The peaks of SPF, 500 year return period and 100 year return period flood at Paikhed barrage site works out as 4596 cumec, 2819 cumec and 2247 cumec respectively. The standard project flood hydrograph (SPF), 500 year return period flood and 100 year return period flood hydrograph for the Chasmandva Barrage are given in Fig - 5.100 to 5.102 respectively. The peaks of SPF, 500 year return period and 100 year return period flood at Chasmandva Barrage site works out as 3213 cumec, 1961 cumec and 1572 cumec respectively.
5.14.2.5 Conclusion The peaks of SPF, 500 year return period flood and 100 year return period flood as estimated at Paikhed and Chasmandva barrages sites are given in Table 5.47:

206
The storm event of July 1941 centered at Dharampur appears to be very severe event and consequently the estimate of SPS and SPF appears to be very high. Accordingly it is proposed to adopt 500 year return period flood as check flood for the Barrage.
Table 5.47
SPF /500 Year and 100 year Return Period Flood at Various Barrage Sites
Sl. No.
Flood Barrage sites Paikhed Chasmandva
1 SPF 4596 3213 2 500 year Return Period
Flood (Check Flood) 2819 1961
3 100 year Return Period Flood (Design Flood)
2247 1572
5.14.3 Tail Water Rating Curves
Dam toe power houses are proposed at Paikhed, Chasmandva, Chikkar, Dabdar and Kelwan dam sites. One canal power house is also proposed on canal fall of feeder canal originating from Kelwan dam. One tail race channel is proposed at the exit of each power house to carry the waters to the respective river course after power generation. G & D observations very close to dam site could not be carried out due to public hindrance and the G & D sites for which the observations carried out are lying far away from dam sites. Thus, the data available from the Nanipalsan G & D site located on Damanganga river just downstream of proposed Bhugad dam is found to be appropriate to consider for generation of tail water rating curve as topographical and physical characteristics of the G & D site and dam sites proposed in Par-Tapi-Narmada are similar. Data for Tail water rating curve in the down-stream of various dam sites are furnished at Table 5.48 and the tail water rating curves are at Fig 5.103 to 5.107.
Table 5.48
Tail Water Rating Curve at various Dam Sites
Sl. No.
Paikhed Chasmandva Chikkar

207
Level (m)
Discharge (cumec)
Level (m)
Discharge (cumec)
Level (m)
Discharge (cumec)
1 158 0 166.92 0 152.45 0 2 159 25 167.92 50 153.45 50 3 160 80 168.92 95 154.45 95 4 161 125 169.92 135 155.45 200 5 162 300 170.92 262 156.45 425 6 163 851 171.92 512 157.45 600 7 164 1355 172.92 872 158.45 800 8 165 1909 173.92 1667 159.45 1020 9 166 2566 174.92 2813 160.45 1600 10 167 3479 175.92 4324 161.45 2244 11 168 4674 162.45 3405 12 169 6573 163.45 5082 13 170 9335 164.45 7709
Table 5.48 (contd…) Tail Water Rating Curve of various Dam Sites
Sl. No.
Dabdar Kelwan
Level (m)
Discharge (cumec)
Level (m)
Discharge (cumec)
1 110.38 0 115 0 2 111.38 50 116 50 3 112.38 95 117 95 4 113.38 202 118 163 5 114.38 459 119 566 6 115.38 822 120 1267 7 116.38 1168 121 2206 8 117.38 1623 122 3334 9 118.38 2000 123 4742
10 119.38 2650 124 5900 11 120.38 3910 125 7199 12 121.38 5500 126 8100 13 122.38 7052 127 11342

208
5.15 Studies for Design of Drainage in the Command Area
The link canal will cross number of natural streams/ river in its en-route. The natural course of these streams/ river may be affected due to canal crossing. Suitable cross drainage works will be provided at each of such crossings. These cross drainage works will be so designed that they do not hamper the width and course of the river streams and therefore, minimized the siltation problem which may arise at the crossings. Thus, little impacts on the drainage aspects are anticipated. The cross drainage structures will take care of any adverse impacts in the command area 5.16 Studies for Determination of Levels for Locating Structures on
Outlets 5.16.1 Location of Structures Par–Tapi–Narmada link project envisages construction of following components:
1. A composite embankment (concrete faced rock fill) - cum - concrete dam
across river Par near village Jheri with FRL 246 m;
2. A composite embankment (concrete faced rock fill) - cum - concrete dam across river Nar (a tributary of river Par) near village Paikhed with FRL 248 m;
3. A composite embankment (concrete faced rock fill) - cum - concrete dam
across river Tan (a tributary of river Auranga) near village Chasmandva with FRL 214 m;
4. A composite embankment (concrete faced rock fill) - cum - concrete dam
across river Ambica near Chikkar village with FRL 210 m;
5. A composite embankment (concrete faced rock fill) - cum - concrete dam across Khapri river (a tributary of river Ambica) near village Dabdar with FRL 169 m;
6. A composite embankment (concrete faced rock fill) - cum - concrete dam
across Purna river near village Kelwan with FRL 164 m;

209
7. Two Barrages; one each in the downstream of Paikhed and Chasmandva dam sites;
8. A tunnel of about 12.7 km long inter connecting Jheri and Paikhed
reservoirs;
9. Six power houses one each at the toe of Paikhed, Chasmandva, Chikkar, Dabdar and Kelwan dams and one power house at the drop of feeder pipelines connecting Kelwan reservoir with Link canal;
10. A link canal 406.116 km long (including feeder pipelines of total length
37.075 km and 5 Nos. of tunnels of total length 1.15 km along the canal) off taking from Paikhed Barrage at FSL 142.800 m and connecting all the reservoirs (proposed in Par-Tapi-Narmada link project) in its en-route to carry water upto existing Miyagam Branch Canal of Narmada Canal System (target command area);
11. Cross Drainage / Cross Masonry works including regulators, escapes,
road/ railway bridges (469 No). 5.16.2 Location of Outlets
The Par-Tapi-Narmada link will provide irrigation in its en-route in the new areas to its left, to the tribal areas lying right side of link canalby lift, take over the command area of five proposed projects of Government of Gujarat(Khuntali, Ugta, Sidhumber, Khata Amba and Zankhari), and take over the part command area of the existing Miyagam Branch Canal of Narmada Canal System. The link canal will terminate at RD 16.70 km of Miyagam Branch Canal. In addition, the village tanks/check dams in the benefitted area will be filled and drinking water needs of the people will be met.Suitable outlets are provided in Par-Tapi-Narmada link canal to cater the needs of en-route area and location and area covered are given in Tables 5.49, 5.50and 5.51.

210
Table - 5.49 Locations of Outlets and En-route Command Area Benefitted under
Par-Tapi Reach of Par-Tapi-Narmada Link Project
Outlet No/
branch canal
Topo sheet no.
Location of main
canal RD in km.
En-route command area (ha)
FSL at head of Branch canal
En-route Irrigation Demand (MCM)
Dis-charge (cumec)
Taluka District
Gross CCA 1 46
H/6 76.45 250 233 126.597 1.50 0.10 Vansda Navsari
2 81.20 70 69 125.593 0.43 0.03 Vansda Navsari 3 82.35 3240 2448 125.090 15.32 1.02 Vansda Navsari 4 46
H/5 99.00 222 222 121.140 1.38 0.10 Vansda Navsari
5 103.85 314 312 120.123 1.98 0.13 Vansda Navsari 6 108.49 208 201 119.036 1.25 0.08 Vyara Tapi 7 111.82 174 167 118.471 1.05 0.06 Vyara Tapi 8 112.45 122 118 118.242 0.74 0.05 Vyara Tapi 9 115.05 4071 3796 117.487 23.65 1.57 Vyara Tapi 10 118.36 163 163 116.783 1.02 0.06 Vyara Tapi 11 122.02 38 36 115.756 0.26 0.02 Vyara Tapi 12 46
G/8 125.33 37 34 115.152 0.26 0.02 Vyara Tapi
13 133.09 64 47 113.818 0.29 0.02 Vyara Tapi 14 137.61 185 165 113.095 1.04 0.06 Vyara Tapi 15 143.53 100 98 111.830 0.62 0.04 Vyara Tapi 16 46
G/12 159.86 438 421 109.138 2.62 0.18 Songadh Tapi
17 161.94 146 139 108.663 0.86 0.06 Songadh Tapi 18 165.94 493 428 107.863 2.66 0.18 Songadh Tapi 19 169.42 218 205 107.043 1.28 0.09 Songadh Tapi 20 171.99 288 253 106.551 1.55 0.10 Songadh Tapi 21 174.27 134 133 106.012 0.82 0.06 Songadh Tapi 22 177.12 473 412 105.347 2.56 0.18 Songadh Tapi Total 11448 10100 63.13
Tapi-Narmada Reach
Outlet No/
branch canal
Topo sheet no.
Location of main canal RD in km.
En-route command area (ha)
FSL at head of Branch canal
En-route Irrigatio
n Demand (MCM)
Dis-charge
(cumec)
Taluka District
Gross CCA
1 46 G/11
1.41 101 92 81.650 0.55 0.04 Songadh Tapi 2 3.70 171 168 81.267 1.05 0.06 Songadh Tapi 3 6.87 109 107 80.797 0.68 0.04 Songadh Tapi 4 7.69 120 115 80.709 0.71 0.05 Songadh Tapi 5 11.49 125 121 80.277 0.77 0.05 Songadh Tapi 6 46 15.72 151 150 79.750 0.94 0.06 Songadh Tapi

211
7 G/7 17.41 240 234 79.481 1.49 0.10 Songadh Tapi 8 32.01 324 316 77.761 1.98 0.13 Mandvi Surat 9 33.33 436 408 77.629 2.54 0.17 Mandvi Surat 10 34.11 176 170 77.551 1.06 0.06 Mandvi Surat 11 37.71 430 413 77.090 2.59 0.18 Mandvi Surat 12 43.22 138 130 76.384 0.82 0.06 Mandvi Surat 13 46
G/3 47.79 615 612 76.127 3.83 0.26 Mandvi Surat
14 49.56 3570 3365 75.698 21.05 1.39 Mandvi Surat 15 51.04 13347 11457 75.550 71.61 4.74 Mandvi Surat 16 55.79 817 756 75.023 4.74 0.31 Mandvi Surat 17 57.09 600 589 74.892 3.68 0.25 Mandvi Surat 18 46
G/7 60.69 5003 4061 74.428 25.38 1.69 Mangrol Surat
19 64.37 2636 2386 73.946 14.90 0.98 Mangrol Surat 20 69.15 1493 1433 73.261 8.94 0.59 Mangrol Surat 21 46
G/6 71.48 306 295 72.976 1.84 0.12 Valia Bharuc
h 22 82.17 26437 22442 71.143 140.24 9.30 Valia Bharuc
h Total 57345 49820 311.39
The location of branch canals/outlets and area covered in respect of five proposed projects of Government of Gujarat taken over by Par-Tapi-Narmada link canal are furnished in Table – 5.50:
Table - 5.50
Location of Branch Canals/Outlets and Command Area of Five Proposed Projects Benefitted Under Par-Tapi-Narmada Link Project
Outlet No./
Branch Canal
Topo sheet no.
Location of Main Canal RD in km.
En-route Command Area (ha)
FSL at head of Branch canal (m)
En-route Irrigati
on Deman
d (MCM)
Discharge (cumec)
Taluka
District
CCA AI I Par-Tapi reach A Khuntali 1 46
H/3 31.300 3162 3162 135.507 20 1.26 Dharam
pur Valsad
B Ugta 1 46
H/6 42.75 2080 2080 131.967 13 0.82 Dharam
pur Valsad
2 46 H/6
46.08 2883 2883 132.40 18 1.14 Dharampur
Valsad
C Sidhumber 1 46
H/6 48.78 11073 11073 131.956 69 4.35 Dharam
pur Valsad
2 46 H/6
49.63 6368 6368 131.643 40 2.52 Dharampur
Valsad

212
D Khata Amba 1 46
H/6 82.44 2032 2032 124.780 13 0.82 Vansada Navsari
2 46 H/6
89.09 709 709 123.570 4 0.25 Vansada Navsari
E Zankhari 1 46
G/12 137.93 8817 8817 112.758 55 3.47 Vyara Tapi
2 46 G/12
141.03 8437 8437 112.174 53 3.34 Songadh Tapi
Total 45561 45561 285
The location of Pump Houses proposed to irrigate tribal areas lying Right side of Link canal by lift, proposed irrigation and water demand are furnished in Table – 5.51:
Table - 5.51
Location of Pump Houses proposed to irrigate tribal areas lying Right side of Link Canal by lift and Command Area under Par-Tapi-
Narmada Link Project Outlet No./
Topo sheet no.
Location of Main Canal RD in km.
En-route Command Area
(ha)
FSL of MainCan
al (m)
En-route Irrigatio
n Demand (MCM)
Discharge (cumec)
Taluka District
CCA AI I Par-Tapi reach A Area-1 1 46
H/5 113.60 900 900 117.958 3.5 0.29 Vyara Tapi
B Area-2 46
G/12 141.60 13100 13100 112.206 50.0 4.27 Songadh Tapi
II Tapi-Narmada reach C Area-3 1 46
G/7 38.000 1200 1200 77.010
4.6 0.39 Mandvi Surat
2 46 G/7
44.700 4400 4400 76.236 16.9 1.43 Mangrol Surat
3 46 G/7
59.700 900 900 74.580 3.5 0.29 Mangrol Surat
D Area-4 1 68.60 15700 15700 73.316 60 5.09 Mangrol Surat Total 36200 36200 138.0

213
5.17 Simulation Studies of the Reservoirs
The multi reservoir simulation studies carried out with the 6 reservoirs (Jheri, Paikhed, Chasmandva, Chikkar, Dabdar and Kelwan), 2 barrages (Paikhed and Chasmandva) and existing Ukai reservoir for Par-Tapi-Narmada link project using the Simulation software programme exclusively developed for Par-Tapi-Narmada link in C++ language by the NWDA.
Simulation study is appended as Annexures 5.20 in Volume-II. The Broad Criteria adopted while carrying out the Simulation studies are as follows: 5.17.1 Broad Criteria
• The simulation studies have been carried out on monthly basis for a period of 30 years from 1976 to 2006.
• The minimum flows required for d/s environmental uses are considered as 10% of the average annual lean season natural flow during October to May.
• The initial storage at the beginning of the simulation (June, 1976) is considered with 10% of the live storage for each reservoir.
• Upto 10% deficit in meeting a demand on annual basis is considered to be success, presuming the system to be resilient in coping with such shortage.
• The Storage capacities at different elevations after 50 years of sedimentation have been considered for each reservoir.
• No salinity control requirements are considered in the study assuming that the demand would be met from the yields of downstream catchments of proposed reservoirs and existing Ukai project.
5.17.2 Computation of Net Inflows into Reservoirs and Barrages
The hydrological studies for Jheri, Paikhed, Chasmandva, Chikkar,
Dabdar and Kelwan reservoirs have been carried out by Central Water Commission, New Delhi and submitted Report on Water Availability Study of Par-Tapi-Narmada Link Project (March, 2012).

214
Therefore, the respective month-wise gross yields for monsoon period (June to Sept) are considered as per the studies conducted by Central Water Commission from which corresponding annual u/s utilizations (existing, ongoing and proposed) are deducted to arrive at net inflows at these reservoirs. The year-wise gross non-monsoon flows as assessed by Central Water Commission have been distributed into monthly flows in proportion to the observed flow data available at the nearest G & D site on the respective rivers. The list of proposed storage Dams / barrages and G & D site on various rivers are given in Table 5.52:
Table 5.52 Proposed Storage Dams / Barrages and G & D Site
OnVarious Rivers Sl. No
Dam / Barrage
Located on River / Tributary
G & D Site (for Yield Analysis)
Location of Proposed Dam / Barrage
Period of Availability of Data
Yields Developed for the Period
1 Jheri dam Par Nanivahiyal
U/s of G & D site
1966 to 2004
1975 to 2006
2 Paikhed dam
Par / Nar Nanivahiyal
U/s of G & D site
1966 to 2004
1975 to 2006
3 Paikhed barrage
Par / Nar Nanivahiyal
U/s of G & D site
1966 to 2004
1975 to 2006
4 Chasmandva dam
Auranga / Tan
Amba
U/s of G & D site
1962 to 2004
1975 to 2006
5 Chasmandva barrage
Auranga / Tan
Amba
U/s of G & D site
1962 to 2004
1975 to 2006
6 Chikkar dam
Ambica Waghai*
U/s of G & D site
*Kudkas site 1980 to 2006
1975 to 2006
*Rainfall-Run off model at Kudkas G & D site used for yield analysis instead of Waghai G & D site 7 Dabdar
dam Ambica / Khapri
Kudkas
D/s of G & D site
1980 to 2006
1975 to 2006
8 Kelwan dam
Purna Kalibel
D/s of G & D site
1962 to 2000
1975 to 2006
9 Ukai existing dam
Tapi river Inflows in to Ukai reservoir
1973 to 1998
1975 to 2006

215
The methodology for arriving the net inflows at Jheri, Paikhed, Chasmandva, Chikkar, Dabdar and Kelwan and Ukai reservoirs are furnished in the following paragraphs. (I) Jheri Reservoir
The proposed Jheri dam site is located upstream of the Nanivahiyal G
& D site across Par river and the discharge data of Nanivahiyal G & D site is available from 1966 to 2004. The same has been used for developing the monthly and monsoon rainfall-runoff modeling at Nanivahiyal G & D site. Using the Rainfall-Runoff model developed at Nanivahiyal G & D site the monthly yield series at Jheri dam site for the monsoon period from 1975-2006 has been generated. The non-monsoon yield is distributed in to non-monsoon monthly yields in the proportion of the observed flow at Nanivahiyal G & D site.
The net yield has been worked out after subtracting all the upstream
utilisation and adding the regeneration. The regeneration for major and medium Irrigation projects has been considered as 10% while the same minor Irrigation projects has been neglected. The regeneration from domestic and industrial requirement met from surface water has been considered as 80%.
Monthly inflows in to Jheri reservoir as worked out above pattern for the period from 1975 to 2006 are given Table 5.53.
Table 5.53
Monthly Net Inflows at Jheri Dam Site from 1975-76 to 2006-07 (MCM) Year Jun Jul Aug Sep Oct Nov Dec Jan Feb Mar Apr May 1975 15.24 43.98 219.71 143.30 26.7 5.32.9 1.5 0.6 0.4 0.0 0.0 1976 73.05 390.19 294.06 96.75 42.8 20.5 7.7 3.0 1.4 0.2 0.0 0.0 1977 50.47 224.85 149.51121.58 27.2 11.4 6.5 2.5 0.90.0 0.0 0.0 1978 13.18 101.91 202.2089.87 15.6 11.9 6.2 2.0 0.4 0.0 0.0 0.0 1979 0.00 77.86 253.33 66.31 21.3 10.53.4 0.00.00.0 0.0 0.0 1980 41.81 121.75 230.83 96.17 31.8 8.03.7 0.00.00.0 0.0 0.0 1981 13.78 378.82 187.64145.04 63.6 0.00.0 0.50.20.1 0.0 0.0 1982 0.00 69.58 237.73 72.46 20.2 9.12.9 1.00.30.1 0.0 0.0 1983 0.00 156.24 315.80123.87 45.3 5.41.5 0.50.20.0 0.0 0.0 1984 5.89 96.80 159.66 75.56 26.0 2.70.9 0.40.00.0 0.0 0.0 1985 0.00 81.80 140.07 33.77 17.8 2.81.4 0.60.10.0 0.0 0.0 1986 6.78 74.57 108.64 24.55 13.8 3.11.4 0.60.00.0 0.0 0.0 1987 0.00 63.13 116.76 32.83 11.2 6.01.7 0.00.00.0 0.0 0.0 1988 6.93 220.26 113.48136.69 38.0 3.40.6 0.30.00.0 0.0 0.0

216
1989 0.00 147.58 105.26 68.01 25.9 1.80.7 0.10.00.0 0.0 0.0 1990 15.32 289.68 386.35151.76 67.3 4.5 2.5 0.50.00.0 0.0 0.0 1991 9.13 102.53 259.83151.42 35.78.91.7 0.00.00.0 0.0 0.0
1992 11.93 85.75 261.28182.02 42.0 5.01.0 0.00.00.0 0.0 0.0 1993 6.72165.46 75.06165.55 30.5 4.51.5 0.20.00.0 0.0 0.0 1994 71.73322.28 228.45165.75 48.1 18.53.3 0.00.00.0 0.0 0.0 1995 0.00 90.20 54.39 80.64 17.6 2.00.4 0.00.00.0 0.0 0.0 1996 4.92 113.43 157.02 74.54 23.0 6.81.1 0.10.00.0 0.0 0.0 1997 4.80 101.78 227.5361.92 22.1 8.04.0 1.10.00.0 0.0 0.0 1998 7.27 41.38 155.50165.36 24.6 6.31.7 0.20.00.0 0.0 0.0
1999 29.44 165.80 79.82 92.29 31.3 1.00.2 0.00.00.0 0.0 0.0 2000 0.00 64.69 59.30 35.45 10.3 1.20.3 0.71.60.0 0.0 0.0 2001 29.27 65.71 118.69 60.05 15.4 6.12.4 0.30.00.0 0.0 0.0 2002 74.57 61.97 175.9479.43 20.8 7.63.9 2.00.40.0 0.0 0.0 2003 33.60 141.82 177.3698.43 28.010.01.6 0.30.20.0 0.0 0.0 2004 15.03 45.55 459.31102.45 55.0 0.00.0 0.20.00.0 0.0 0.0 2005 113.11 180.22 194.83276.53 54.3 9.23.2 0.80.30.0 0.0 0.0 2006 10.43 282.60 439.80101.61 59.310.03.5 0.90.30.0 0.0 0.0
(II) Paikhed Reservoir
The proposed Paikhed dam site is located across Nar river, a tributary of Par river. The Discharge data of Nanivahiyal G & D site is available from 1966 to 2004. The same has been used for developing the monthly and monsoon rainfall-runoff modeling at Nanivahiyal G & D site. Using the Rainfall-Runoff model developed at Nanivahiyal G & D site the monthly yield series at Paikhed dam site for the monsoon period from 1975 to 2006 has been generated.
The net yield has been worked out after subtracting all the upstream utilisation and adding the regeneration. The regeneration for major and medium Irrigation projects has been considered as 10% while the same minor Irrigation projects has been neglected. The regeneration from domestic and industrial requirement met from surface water has been considered as 80%.
Monthly inflows in to Paikhed reservoir as worked out above pattern for the period from 1975 to 2006 are given Table 5.54:

217
Table 5.54 Monthly Net Inflows at Paikhed Dam Site from 1975-76 to 2006-07 (MCM)
Year Jun Jul Aug Sept Oct Nov Dec Jan Feb Mar Apr May 1975 11.2 24.4145.593.717.43.51.9 1.0 0.4 0.2 0.0 0.0 1976 45.6294.8212.085.532.015.35.8 2.3 1.1 0.2 0.0 0.0 1977 48.2152.2117.5118.921.89.25.2 2.0 0.7 0.0 0.0 0.0 1978 13.1104.0176.162.713.710.45.4 1.7 0.4 0.0 0.0 0.0 1979 0.046.8178.4 48.514.77.22.4 0.0 0.0 0.0 0.0 0.0 1980 20.3 82.1168.6 56.821.35.32.5 0.0 0.0 0.0 0.0 0.0 1981 6.7303.6151.4101.349.40.0 0.0 0.4 0.1 0.0 0.0 0.0 1982 3.4 96.1205.0 66.219.78.92.9 1.0 0.3 0.1 0.0 0.0 1983 0.0 106.5257.6137.8 38.2 4.51.3 0.5 0.1 0.0 0.0 0.0 1984 5.2 71.7 100.7 49.217.41.80.6 0.2 0.0 0.0 0.0 0.0 1985 0.0 80.6 97.8 16.913.62.21.1 0.4 0.1 0.0 0.0 0.0 1986 2.5 56.9 63.8 15.28.92.00.9 0.4 0.0 0.0 0.0 0.0 1987 0.0 53.3 78.9 20.6 8.14.31.2 0.0 0.0 0.0 0.0 0.0 1988 0.0 117.2 61.2124.824.22.20.4 0.2 0.0 0.0 0.0 0.0 1989 0.0 100.0 78.5 36.4 17.31.20.5 0.1 0.0 0.0 0.0 0.0 1990 6.0 51.6 137.1 73.9 21.41.40.8 0.2 0.0 0.0 0.0 0.0 1991 6.2 92.0 112.8 27.2 16.34.10.8 0.0 0.0 0.0 0.0 0.0 1992 9.6 52.7 118.8 94.7 21.42.50.50.0 0.0 0.0 0.0 0.0 1993 16.4106.2 55.6123.6 22.33.31.10.1 0.0 0.0 0.0 0.0 1994 72.2250.3164.8148.1 38.814.92.7 0.0 0.0 0.0 0.0 0.0 1995 0.0 56.0 32.3 44.1 10.41.20.20.0 0.0 0.0 0.0 0.0 1996 1.7104.6120.1 55.9 18.65.50.90.1 0.0 0.0 0.0 0.0 1997 0.0 79.7152.7 55.1 16.05.82.90.8 0.0 0.0 0.0 0.0 1998 0.0 17.7114.3117.9 16.64.21.20.1 0.0 0.0 0.0 0.0 1999 18.2156.665.9 87.6 28.00.90.20.0 0.0 0.0 0.0 0.0 2000 0.0 65.6 65.0 33.7 10.61.20.30.8 1.7 0.0 0.0 0.0 2001 22.8 63.6102.6 27.9 12.24.81.90.2 0.0 0.0 0.0 0.0 2002 57.9 11.1176.0 94.9 18.16.63.41.8 0.3 0.0 0.0 0.0 2003 26.8 120.2135.0 92.1 23.28.31.40.2 0.1 0.0 0.0 0.0 2004 19.5 55.1346.2 84.5 44.70.00.00.1 0.0 0.0 0.0 0.0 2005 119.2161.2152.5201.8 45.17.62.60.7 0.2 0.0 0.0 0.0 2006 1.6210.0296.2 58.6 40.36.82.30.6 0.2 0.0 0.0 0.0
(III) Paikhed Barrage
The catchment area upto Paikhed barrage is 315 km2. The catchment area between Paikhed dam and Paikhed barrage is 12 km2. No inflow has been considered from the free catchment between Paikhed dam and Paikhed barrage. (IV) Chasmandva Reservoir:
The proposed Chasmandva dam site is located u/s of the Amba G & D site across Tan river a tributary of Auranga river and discharge data of

218
Amba G & D site is available from 1962 to 2004. The monsoon discharge data extended for the years 2005 and 2006 and is taken as the average of monsoon data pertaining to 1975 to 2004. For non-monsoon period, monthly flow data is available from 1998-99 to 2006-07. The non monsoon monthly flows from 1975-76 to 1997-98 are worked out based on the average of available data. The monsoon monthly yield series at Chasmandva dam site has been developed for the period from 1975 to 2006 using rainfall runoff models developed at Amba G & D site. The non-monsoon yield is distributed in to non-monsoon monthly yields in the proportion of the observed flow at Amba G & D site.
The net yield has been worked out after subtracting all the upstream utilisation and adding the regeneration. The regeneration for major and medium Irrigation projects has been considered as 10% while the same minor Irrigation projects has been neglected. The regeneration from domestic and industrial requirement met from surface water has been considered as 80%. Monthly inflows in to Chasmandva reservoir as worked out above pattern for the period from 1975 to 2006 are given Table 5.55:
Table 5.55 Monthly Net Inflows at Chasmandva Dam Site
from 1975-76 to 2006-07 (MCM) Year Jun Jul Aug Sept Oct Nov Dec Jan Feb Mar Apr May 1975 7.6 17.561.824.25.80.5 0.1 0.0 0.0 0.0 0.0 0.0 1976 11.1 88.0 69.925.410.10.9 0.3 0.0 0.0 0.0 0.0 0.0 1977 12.440.337.740.16.80.6 0.2 0.0 0.0 0.0 0.0 0.0 1978 7.2 29.053.411.45.20.5 0.1 0.0 0.0 0.0 0.0 0.0 1979 0.07.450.25.83.30.3 0.1 0.0 0.0 0.0 0.0 0.0 1980 6.7 25.2 56.37.24.90.4 0.1 0.0 0.0 0.0 0.0 0.0 1981 0.464.8 39.128.16.90.6 0.2 0.0 0.0 0.0 0.0 0.0 1982 0.0 13.5 47.87.23.60.3 0.1 0.0 0.0 0.0 0.0 0.0 1983 0.016.052.018.74.50.4 0.1 0.0 0.0 0.0 0.0 0.0 1984 1.127.1 31.38.93.60.3 0.1 0.0 0.0 0.0 0.0 0.0 1985 0.026.431.32.13.10.3 0.1 0.0 0.0 0.0 0.0 0.0 1986 2.125.823.30.02.70.2 0.1 0.0 0.0 0.0 0.0 0.0 1987 0.013.521.90.01.80.2 0.0 0.0 0.0 0.0 0.0 0.0 1988 0.0 44.517.232.94.90.4 0.1 0.0 0.0 0.0 0.0 0.0 1989 0.021.727.33.82.70.2 0.1 0.0 0.0 0.0 0.0 0.0 1990 0.76.435.816.93.10.3 0.1 0.0 0.0 0.0 0.0 0.0 1991 0.027.427.12.63.00.3 0.1 0.0 0.0 0.0 0.0 0.0 1992 7.613.231.431.44.30.4 0.1 0.0 0.0 0.0 0.0 0.0

219
1993 23.241.714.349.86.70.6 0.2 0.0 0.0 0.0 0.0 0.0 1994 21.655.853.734.98.60.8 0.2 0.0 0.0 0.0 0.0 0.0 1995 0.022.46.38.71.90.2 0.1 0.0 0.0 0.0 0.0 0.0 1996 0.026.735.56.23.60.3 0.1 0.0 0.0 0.0 0.0 0.0 1997 0.025.933.89.73.60.3 0.1 0.0 0.0 0.0 0.0 0.0 1998 0.010.134.429.53.01.0 0.3 0.0 0.0 0.0 0.0 0.0 1999 6.538.313.426.54.20.6 0.1 0.0 0.0 0.0 0.0 0.0 2000 0.027.524.84.82.70.3 0.3 0.0 0.0 0.0 0.0 0.0 2001 6.621.633.41.03.00.5 0.2 0.0 0.0 0.0 0.0 0.0 2002 13.5 0.0 45.917.54.4 0.0 0.0 0.0 0.0 0.0 0.0 0.0 2003 7.8 38.7 31.417.75.5 0.0 0.0 0.0 0.0 0.0 0.0 0.0 2004 7.4 15.1 96.512.77.6 0.0 0.0 0.0 0.0 0.0 0.0 0.0 2005 41.542.643.935.99.5 0.0 0.0 0.0 0.0 0.0 0.0 0.0 2006 0.8 50.681.810.68.3 0.0 0.0 0.0 0.0 0.0 0.0 0.0
(V) Chasmandva Barrage
The proposed Chasmandva barrage site is located u/s of the Amba G & D site across Tan river a tributary of Auranga river. The catchment area upto Chasmandva dam is 89.25 km2 and the catchment area between Chasmandva dam and Chasmandva barrage is 41 km2. No inflow has been considered from the free catchment between Chasmandva dam and Chasmandva barrage.
(VI) Chikkar Reservoir
The proposed Chikkar dam site is located u/s of the Wagai G & D site across Ambica river. The discharge data of Wagai G & D site is available from 1974 to 1978 and 1999 to 2006 and data is not sufficient for developing the rainfall runoff model. The data at Kudkas G & D site located across Khapri river, a tributary of Ambica river is available from 1980 to 2006. The rainfall runoff models developed at Kudkas G & D site has been used to generate the monthly monsoon yields series at proposed Chikkar dam site for the period from 1975 to 2006. The non-monsoon yield is distributed in to non-monsoon monthly yields in the proportion of the observed flow at Kudkas G & D site.
The net yield has been worked out after subtracting all the upstream utilisation and adding the regeneration. The regeneration for major and medium Irrigation projects has been considered as 10% while the same minor Irrigation projects has been neglected. The regeneration from

220
domestic and industrial requirement met from surface water has been considered as 80%.
Monthly inflows in to Chikkar reservoir as worked out above pattern for the period from 1975 to 2006 are given Table 5.56:
Table 5.56 Monthly Net Inflows at Chikkar Dam Site
from 1975-76 to 2006-07 (MCM) Year Jun Jul Aug Sept Oct Nov Dec Jan Feb Mar Apr May 1975 0.0 34.7126.7 75.5 19.12.50.4 0.0 0.0 0.0 0.0 0.0 1976 30.0 124.1 195.176.334.34.50.7 0.1 0.0 0.0 0.0 0.0 1977 27.2 65.3 85.687.221.42.80.4 0.0 0.0 0.0 0.0 0.0 1978 6.7 35.8 111.9 35.315.32.00.3 0.0 0.0 0.0 0.0 0.0 1979 0.0 23.0 104.429.812.71.70.3 0.0 0.0 0.0 0.0 0.0 1980 9.2 15.0 105.5 17.310.52.50.7 0.0 0.0 0.0 0.0 0.0 1981 0.0 84.1 81.4 77.122.60.00.0 0.0 0.0 0.0 0.0 0.0 1982 0.1 17.4 89.123.08.72.60.9 0.0 0.0 0.0 0.0 0.0 1983 0.0 22.3 131.180.419.91.40.5 0.0 0.0 0.0 0.0 0.0 1984 0.0 48.1 78.960.615.81.40.0 0.3 0.0 0.0 0.0 0.0 1985 0.0 66.9 70.617.1 10.5 2.81.1 0.0 0.0 0.0 0.0 0.0 1986 1.3 44.4 86.328.0 13.51.40.0 0.0 0.0 0.0 0.0 0.0 1987 0.0 12.4 75.2 10.45.63.60.0 0.0 0.0 0.0 0.0 0.0 1988 0.0 85.2 59.3136.625.21.00.0 0.0 0.0 0.0 0.0 0.0 1989 0.0 25.8 70.517.49.31.20.0 0.0 0.0 0.0 0.0 0.0 1990 0.0 21.1110.245.6 4.610.81.0 0.0 0.0 0.0 0.0 0.0 1991 12.2 35.382.49.4 10.92.1 0.0 0.0 0.0 0.0 0.0 0.0 1992 7.2 18.081.974.5 15.01.9 0.0 0.0 0.0 0.0 0.0 0.0 1993 3.055.460.0126.420.32.5 0.0 0.0 0.0 0.0 0.0 0.0 1994 84.3118.1123.7126.539.8 2.4 0.0 0.0 0.0 0.0 0.0 0.0 1995 0.0 25.667.338.2 10.81.4 0.0 0.0 0.0 0.0 0.0 0.0 1996 0.039.382.659.0 16.10.7 0.0 0.0 0.0 0.0 0.0 0.0 1997 0.014.8113.734.9 12.71.6 0.7 0.3 0.0 0.0 0.0 0.0 1998 0.0 28.2146.398.021.03.9 0.5 0.0 0.0 0.0 0.0 0.0 1999 15.149.652.060.7 15.01.3 0.2 0.0 0.0 0.0 0.0 0.0 2000 2.552.263.716.68.83.2 0.5 0.0 0.0 0.0 0.0 0.0 2001 21.7 59.2116.220.9 16.63.0 0.7 0.0 0.0 0.0 0.0 0.0 2002 40.2 0.0108.574.9 14.84.8 1.3 0.0 0.0 0.0 0.0 0.0 2003 31.187.6117.681.326.82.2 0.6 0.0 0.0 0.0 0.0 0.0 2004 11.244.1269.156.729.84.0 1.7 0.0 0.0 0.0 0.0 0.0 2005 101.6 86.4170.1191.545.05.9 0.3 0.0 0.0 0.0 0.0 0.0 2006 2.7 150.6 284.051.734.89.61.2 0.0 0.0 0.0 0.0 0.0
(VII) Dabdar Reservoir
The proposed Dabdar dam site is located downstream of the Kudkas G & D site across Khapri river, a tributary of Ambica river. The gauge and discharge data of Kudkas G & D site are available from 1980 to 2006. The

221
yield series at proposed Dabdar dam site has been generated from year 1980 to 2006 on catchment are proportionate basis, using observed data after duly checking the consistency. As the Rainfall is available for longer period, the same has been used to extend the yield series for 1975 to 1979 using Rainfall-Runoff model developed at Kudkas G & D site. The non-monsoon yield at Dabdar dam site is distributed in to non-monsoon monthly uields in the proportion of the observed flow at Kudkas G & D site.
The net yield has been worked out after subtracting all the upstream utilisation and adding the regeneration. The regeneration for major and medium Irrigation projects has been considered as 10% while the same minor Irrigation projects has been neglected. The regeneration from domestic and industrial requirement met from surface water has been considered as 80%.
Monthly inflows in to Dabdar reservoir as worked out above pattern
for the period from 1975 to 2006 are given Table 5.57:
Table 5.57 Monthly Net Inflows at Dabdar Dam Site
from 1975-76 to 2006-07 (MCM) Year Jun Jul Aug Sept Oct Nov Dec Jan Feb Mar Apr May 1975 0.0 46.8186.8120.228.63.80.6 0.0 0.0 0.0 0.0 0.0 1976 62.3232.7340.9124.561.48.11.2 0.1 0.0 0.0 0.0 0.0 1977 53.4 115.1134.493.432.04.20.6 0.1 0.0 0.0 0.0 0.0 1978 8.147.6154.648.820.92.80.4 0.0 0.0 0.0 0.0 0.0 1979 0.0 39.5160.053.920.52.70.4 0.0 0.0 0.0 0.0 0.0 1980 1.239.5128.550.66.21.5 0.4 0.0 0.0 0.0 0.0 0.0 1981 12.0219.2149.874.627.20.00.0 0.0 0.0 0.0 0.0 0.0 1982 0.8 35.0 166.7 39.4 7.6 2.20.70.0 0.0 0.0 0.0 0.0 1983 0.041.9235.0145.7 75.9 5.41.80.00.00.0 0.0 0.0 1984 1.2 135.3191.1 121.3 30.0 2.7 0.00.50.00.0 0.0 0.0 1985 0.0 81.7147.3 21.8 7.9 2.00.80.00.00.0 0.0 0.0 1986 1.383.7131.127.8 4.1 0.4 0.00.00.00.0 0.0 0.0 1987 0.035.265.6 17.42.3 1.50.00.00.00.0 0.0 0.0 1988 5.4 116.7 89.5 165.4 49.6 1.9 0.00.00.00.0 0.0 0.0 1989 0.1 58.0114.832.7 5.6 0.7 0.00.00.00.0 0.0 0.0 1990 1.8 22.8122.0 67.5 0.7 1.7 0.20.00.00.0 0.0 0.0 1991 4.550.9149.9 52.3 4.7 0.9 0.00.00.00.0 0.0 0.0 1992 13.727.6110.3 101.8 9.2 1.2 0.00.00.00.0 0.0 0.0 1993 4.9110.4 46.9 102.3 53.6 6.60.00.00.00.0 0.0 0.0 1994 183.6417.5354.6 309.6 16.4 1.00.00.00.00.0 0.0 0.0 1995 0.0 94.0 107.7 130.5 37.7 4.80.00.00.00.0 0.0 0.0

222
1996 1.0 71.5156.4 114.8 11.3 0.50.00.00.00.0 0.0 0.0 1997 0.7 50.2261.3 79.1 8.5 1.10.40.20.00.0 0.0 0.0 1998 1.5 63.8282.7239.4 56.810.41.30.00.00.0 0.0 0.0 1999 16.0 173.3 162.3 98.2 150.3 13.4 2.10.20.00.0 0.0 0.0 2000 0.0 93.6 65.6 54.9 22.2 8.2 1.30.00.00.0 0.0 0.0 2001 21.3 163.7 189.3 50.2 31.5 5.7 1.30.00.00.0 0.0 0.0 2002 83.0 82.9 217.9 218.8 11.1 3.61.00.00.00.0 0.0 0.0 2003 50.4 118.9 215.7 151.0 60.8 5.11.30.00.00.0 0.0 0.0 2004 13.7 35.5 345.3 56.5 48.8 6.5 2.70.00.00.0 0.0 0.0 2005 101.1 153.1 149.6 135.7 68.3 8.90.50.00.00.0 0.0 0.0 2006 0.0 140.8 226.7 79.3 51.014.11.70.00.00.0 0.0 0.0
(VIII) Kelwan Reservoir
The proposed Kelwan dam site is located downstream of the Kalibel G & D site across Purna river. The gauge and discharge data of Kalibel G & D site are available from 1962 to 2000 except for the years 1979, 1980, 1991, 1992, 1993, 1994, 1995, 1996 and 1999. The yield series at Kelwan dam site has been generated from year 1975 to 2000 on catchment area proportionate basis, using observed data after duly checking the consistency. The inconsistence data and gaps have been filled by using Rainfall-Runoff models. The yield series has been further extended beyond year 2000 using Rainfall-Runoff models. The non-monsoon yield at Kelwan dam site is distributed in to non-monsoon monthly yields in the proportion of the observed flow at Kalibel G & D site.
The net yield has been worked out after subtracting all the upstream utilisation and adding the regeneration. The regeneration for major and medium Irrigation projects has been considered as 10% while the same minor Irrigation projects has been neglected. The regeneration from domestic and industrial requirement met from surface water has been considered as 80%.
The monthly inflows in to Kelwan reservoir as worked out on the above pattern for the period from 1975 to 2006 are given in Table 5.58:

223
Table 5.58 Monthly Net Inflows at Kelwan Dam Site
from 1975-76 to 2006-07 (MCM) Year Jun Jul Aug Sept Oct Nov Dec Jan Feb Mar Apr May 1975 0.0 27.3 217.5 147.0 47.1 6.2 0.9 0.1 0.0 0.0 0.0 0.0 1976 34.2 189.6 379.6 132.5 68.8 9.1 1.4 0.10.00.00.0 0.0 1977 47.5 256.9 225.5 194.3 24.6 3.3 0.50.00.00.00.0 0.0 1978 0.0 21.5 247.3 95.1 27.5 3.6 0.60.00.00.00.0 0.0 1979 9.7 27.3 272.0 24.4 31.1 4.1 0.60.00.00.00.0 0.0 1980 10.4 46.8 249.0 1.8 25.5 6.1 1.70.00.00.00.0 0.0 1981 0.0 130.6 129.9 76.2 24.9 0.0 0.00.00.00.00.0 0.0 1982 0.0 46.5 181.3 30.6 7.7 2.3 0.80.00.00.00.0 0.0 1983 0.2 36.3 323.8 116.4 74.4 5.3 1.80.00.00.00.0 0.0 1984 7.5 105.9 154.1 80.1 33.9 3.0 0.00.60.00.00.0 0.0 1985 0.0 153.5 64.2 7.6 5.1 1.3 0.50.00.00.00.0 0.0 1986 3.7 69.0 143.0 23.9 54.0 5.6 0.00.00.00.00.0 0.0 1987 0.0 124.3 77.8 15.1 1.3 0.9 0.00.00.00.00.0 0.0 1988 8.2 240.8 122.0 263.2 110.6 4.3 0.00.00.00.00.0 0.0 1989 0.0 129.0 212.0 114.1 53.0 7.0 0.00.00.00.00.0 0.0 1990 25.2 71.6 187.6 67.3 15.4 35.9 3.40.00.00.00.0 0.0 1991 17.4 61.5 172.1 4.0 23.0 4.5 0.00.00.00.00.0 0.0 1992 11.4 22.5 104.9 135.8 26.3 3.3 0.00.00.00.00.0 0.0 1993 12.1 94.5 28.0 183.3 30.5 3.8 0.00.00.00.00.0 0.0 1994 67.6 165.4 143.1 193.1 57.9 3.4 0.00.00.00.00.0 0.0 1995 0.0 126.6 18.5 109.3 24.3 3.1 0.00.00.00.00.0 0.0 1996 5.9 77.8 173.5 90.1 35.8 1.7 0.00.00.00.00.0 0.0 1997 0.0 0.0 292.5 49.0 11.8 1.5 0.60.20.00.00.0 0.0 1998 6.5 49.5 124.4 176.0 55.1 10.1 1.30.00.00.00.0 0.0 1999 17.9 58.7 44.8 165.5 28.3 2.6 0.40.00.00.00.0 0.0 2000 4.3 82.1 59.8 47.2 14.6 5.4 0.90.00.00.00.0 0.0 2001 47.2 63.4 230.2 114.6 40.2 7.3 1.60.00.00.00.0 0.0 2002 51.6 0.0 174.1 191.9 32.0 10.3 2.90.00.00.00.0 0.0 2003 28.2 147.6 177.1 166.0 50.6 4.3 1.10.00.00.00.0 0.0 2004 12.4 41.9 359.4 50.5 42.0 5.6 2.40.00.00.00.0 0.0 2005 74.9 123.4 235.8 230.1 63.0 8.2 0.40.00.00.00.0 0.0 2006 10.5 181.0 361.7 114.4 54.9 15.2 1.90.00.00.00.0 0.0
(IX) Ukai Reservoir
The existing Ukai reservoir is located across the Tapi River and is having large storage capacity which is used only as balancing reservoir for the Par-Tapi-Narmada link. The monthly inflows at Ukai reservoir are available from 1973 to 1998. The data for the remaining period from 1999-2006 are assumed as the average of data available. The monthly inflows in to Ukai reservoir for the period from 1975 to 2006 are given in Table 5.59.The inflows and storage capacity were not utilized in study.

224
Table 5.59 Monthly Net Inflows at Ukai Reservoir from 1973-74 to 2006-07
(MCM)
Year Jun Jul Aug Sep Oct Nov Dec Jan Feb Mar Apr May
1973 138.3 4231.6 5148.1 5314.8 1548.1 526.9 148.5 148.5 128.0 107.3 143.8 165.8
1974 175.3 1049.6 2901.8 507.5 748.0 75.7 0.0 0.0 102.9 73.4 9.5 0.0
1975 425.6 1373.5 4210.2 5050.6 973.7 200.3 0.0 0.0 0.0 85.6 68.6 0.0
1976 1931.9 3846.1 5388.3 5061.6 243.4 429.7 67.8 0.0 98.7 176.0 91.4 0.0
1977 1649.8 1817.5 3025.5 4323.4 458.6 221.3 194.9 35.3 13.9 17.4 81.8 0.0
1978 799.1 2950.6 6624.8 2637.9 200.4 77.7 102.4 199.8 193.9 226.8 18.5 0.0
1979 1051.7 1233.7 8840.2 1464.5 279.6 133.6 268.9 188.7 109.4 71.9 1.0 0.0
1980 1563.3 1022.1 4629.7 1065.4 208.6 129.4 92.0 100.4 38.0 11.5 0.0 0.0
1981 44.3 1766.0 3806.4 2303.9 716.8 10.1 76.7 195.3 133.8 76.5 0.0 0.0
1982 479.7 1111.6 1411.4 741.6 181.2 94.0 7.7 44.7 4.8 4.4 0.0 3.5
1983 99.1 1381.5 4428.8 5347.4 1822.2 0.0 0.0 75.4 127.2 177.0 0.0 13.9
1984 173.8 890.9 4009.3 629.9 481.9 729.0 753.7 54.4 32.3 1.7 0.0 0.0
1985 288.6 495.5 2020.0 251.3 283.7 39.1 0.0 0.0 0.0 0.0 0.0 0.0
1986 281.6 2046.8 4541.1 88.6 0.0 0.0 0.0 46.1 34.4 13.4 26.9 0.0
1987 597.4 961.3 1121.4 216.5 5.1 0.0 0.0 0.0 0.0 0.0 0.0 0.0
1988 438.3 3740.3 3448.6 5296.2 3327.4 0.0 0.0 0.0 0.0 49.7 15.1 11.0
1989 258.4 2055.2 4780.1 2198.8 0.0 0.0 0.0 0.0 14.6 6.4 27.6 98.0
1990 979.6 2746.3 7963.1 2845.3 1728.6 0.0 0.0 65.7 9.9 22.9 2.1 0.0
1991 349.8 1523.4 2260.6 274.9 47.7 0.0 0.0 0.0 0.0 0.0 0.0 0.0
1992 881.3 115.7 3299.8 2039.1 402.5 0.0 0.0 0.0 0.0 0.0 0.0 0.0
1993 137.8 3150.6 1828.6 2348.4 1047.6 0.0 0.0 0.0 0.0 0.0 0.0 0.0
1994 481.2 2891.7 4349.0 9783.7 428.1 53.2 0.0 0.0 0.0 0.0 0.0 0.0
1995 0.0 1966.0 573.1 2183.0 141.6 0.0 0.0 0.0 0.0 0.0 0.0 0.0
1996 94.5 1470.3 2023.5 2741.9 688.0 65.3 62.8 0.0 0.0 0.0 0.0 0.0
1997 371.9 1533.5 4028.8 1304.4 241.9 130.0 887.9 0.0 0.0 0.0 0.0 0.0
1998 0.0 967.3 3148.1 6889.9 1669.8 358.8 36.5 0.0 0.0 0.0 0.0 0.0
1999 349.8 1523.4 2260.6 274.9 47.7 0.0 0.0 0.0 0.0 0.0 0.0 0.0
2000 881.3 115.7 3299.8 2039.1 402.5 0.0 0.0 0.0 0.0 0.0 0.0 0.0
2001 137.8 3150.6 1828.6 2348.4 1047.6 0.0 0.0 0.0 0.0 0.0 0.0 0.0
2002 481.2 2891.7 4349.0 9783.7 428.1 53.2 0.0 0.0 0.0 0.0 0.0 0.0
2003 0.0 1966.0 573.1 2183.0 141.6 0.0 0.0 0.0 0.0 0.0 0.0 0.0
2004 94.5 1470.3 2023.5 2741.9 688.0 65.3 62.8 0.0 0.0 0.0 0.0 0.0
2005 371.9 1533.5 4028.8 1304.4 241.9 130.0 887.9 0.0 0.0 0.0 0.0 0.0
2006 0.0 967.3 3148.1 6889.9 1669.8 358.8 36.5 0.0 0.0 0.0 0.0 0.0
5.17.3 Priorities / Operation Policy
The Reservoir Simulation studies were carried out considering the above monthly net inflows into the reservoirs and monthly demands to be met from the reservoirs in the following order of priorities.

225
5.17.4 Demands 5.17.4.1 Common Demands at Each Reservoir (i) Evaporation Losses
At each reservoir, evaporation losses (a natural hydrological process)
will have to be first met irrespective of the status of storage. The annual pan evaporation data for the Pinjal reservoir is available in the ‘Yield Study report of Gargai and Pinjal rivers’ has been applied for Jheri, Paikhed, Chasmandva, Chasmandva barrage, Dabdar and Kelwan dams. The pan evaporation data for the Madhuban (Damanganga) reservoir is available in the Damanganga project working tables which has been applied for Paikhed barrage, Chikkar dam and Ukai reservoirs also. ii) Environmental Demand
In order of priority, the next demand considered at each reservoir is release of minimum flows downstream during the lean season.
The minimum environmental flow demand in the river is considered as 10% of the average annual lean season flows at the respective reservoirs/Weirs during the period from October to May are given in Table 5.60:
Table 5.60
Demands for Environmental flow Sl. No.
Reservoir / Weir Minimum Downstream Release for Environmental Needs (MCM)
1 Jheri reservoir 4.40 2 Paikhed reservoir 3.20 3 Paikhed barrage 0.00 4 Chasmandva reservoir 0.80 5 Chasmandva barrage 0.00 6 Chikkar reservoir 1.60 7 Dabdar reservoir 4.00 8 Kelwan reservoir 4.80 9 Ukai reservoir 0.00 Total 18.80

226
The d/s releases for environmental purpose from each reservoir are proposed to be met from each reservoir until it reaches its Dead storage level (i.e., keeping the monthly live storage as zero). 5.17.4.2 Project Specific Demands
After meeting the above common demands, the project specific demands at each of the reservoirs are considered in certain order of priority as detailed below under each reservoir. As the rivers are non-perennial in nature, there would not be any inflow into the reservoir during the non monsoon period. Each reservoir has to meet its mandatory evaporation losses and environmental demand without fail, therefore month-wise minimum live storages (cut-off storages) are proposed to be maintained in respect of each project specific demand from the reservoir, in accordance with their order of priority.
The various Water demands that are proposed to be met from proposed reservoir are considered in the following order.
382 MCM for en-route irrigation , 285 MCM for the Projects
proposed by the Government of Gujarat on the left side of canal, 138 MCM
for Tribal area enroute right side of canal, 48 MCMfor Tribal area in the vicinity of reservoirs, 90 MCMand 40 MCMfor Tribal areas on right side of Narmada main canal by lift in Chhota Udepur dist and Panchmahal dist. respectively,48 MCM towardsSupply of drinking water for all villages of Dang District and Villages of Kaprada and Dharmpur taluka of Valsad District, 18 MCMfor filling all possible tanks in benefitted areas, and 161 MCMfor Target command in Saurashtra region The Water Demands (i) Domestic & Industrial Use and Filling of tanks in the Periphery of Reservoirs (ii) Supply of Drinking water for villages and filling of village and Panchayat tanks A provision of 76 MCM has been made for supply of drinking water to 27.5 lakh populations for villages of Valsad, Navsari, Dang, Tapi, Surat,

227
Bharuch, Narmada and Vadodara district of Gujarat and Nasik district in Maharashtra State. In adition to above, provision of 50 MCM has been kept for filling of 2226 village and panchayat tanks located in Valsad, Navsari, Dang, Tapi, Surat, Bharuch, Narmada and Vadodara district of Gujarat and Nasik district in Maharashtra State. (i) Drinking water supply (GWSSB) for all villages of Dangs District,
villages of Kaprada and Dharampur talukas of Valsad District and filling of tanks in the Command Area (66 MCM)
Drinking water supply (GWSSB)for all villages of Dangs District,
villages of Kaprada and Dharampur talukas of Valsad Districtand filling of tanks in the Command Area,a provision of 66 MCMis made under the link project.
(ii) Irrigation Demand of Feeder pipelinefrom the Project ( 7.9
MCM) The irrigation demand of Dabdar Feeder pipeline at 3.9 MCMto be
met from Dabdar reservoir and irrigation demand of Kelwan Feeder pipeline at 4.0 MCMto be met from Kelwan reservoir are considered. (iii) Irrigation demand in the periphery of six reservoirs (48 MCM)
The irrigation demand in the periphery of six reservoirs is furnished in Table 5.61:
Table 5.61 Irrigation demand in the periphery of six reservoirs
Sl. No. Reservoir / Weir Irrigation demand (MCM) 1 Jheri reservoir 3.7 2 Paikhed reservoir 14.5 3 Chasmandva reservoir 9.0 4 Chikkar reservoir 4.8 5 Dabdar reservoir 10.0 6 Kelwan reservoir 6.1 Total 48.0
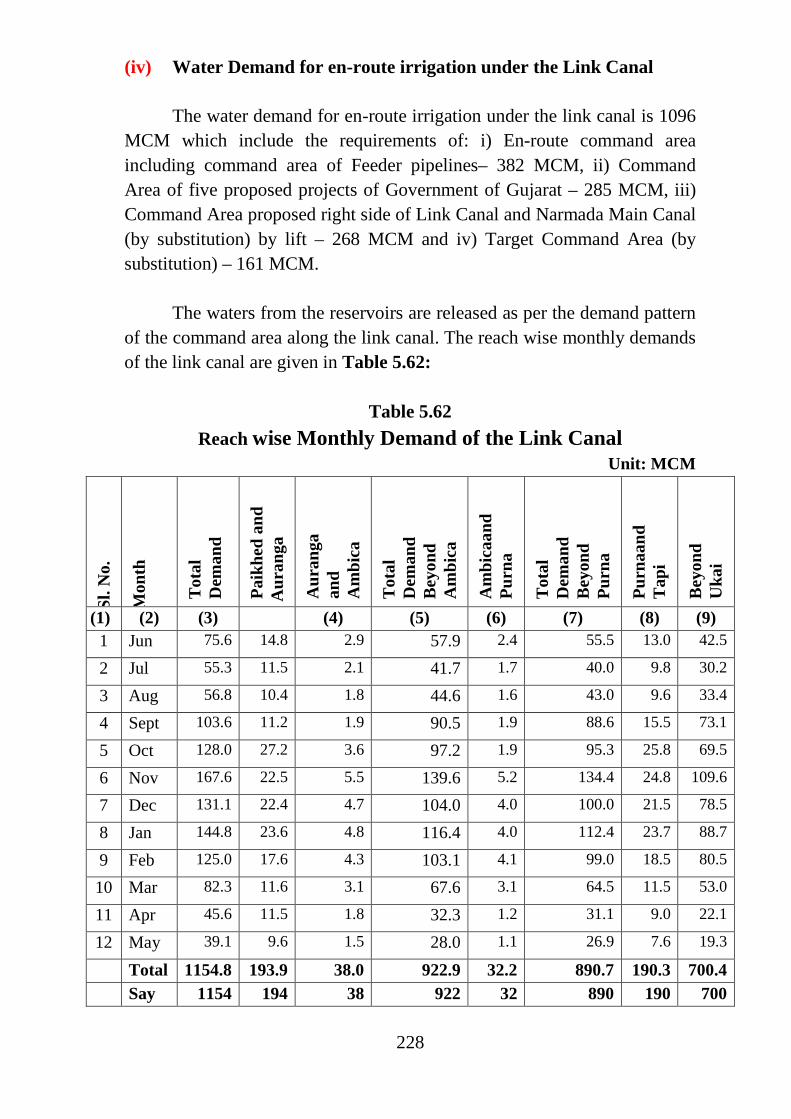
228
(iv) Water Demand for en-route irrigation under the Link Canal The water demand for en-route irrigation under the link canal is 1096
MCM which include the requirements of: i) En-route command area including command area of Feeder pipelines– 382 MCM, ii) Command Area of five proposed projects of Government of Gujarat – 285 MCM, iii) Command Area proposed right side of Link Canal and Narmada Main Canal (by substitution) by lift – 268 MCM and iv) Target Command Area (by substitution) – 161 MCM.
The waters from the reservoirs are released as per the demand pattern
of the command area along the link canal. The reach wise monthly demands of the link canal are given in Table 5.62:
Table 5.62
Reach wise Monthly Demand of the Link Canal Unit: MCM
Sl.
No.
Mon
th
Tot
al
Dem
and
Paik
hed
and
Aur
anga
Aur
anga
an
d A
mbi
ca
Tot
al
Dem
and
Bey
ond
Am
bica
Am
bica
and
Purn
a
Tot
al
Dem
and
Bey
ond
Purn
a
Purn
aand
T
api
Bey
ond
Uka
i
(1) (2) (3) (4) (5) (6) (7) (8) (9) 1 Jun 75.6 14.8 2.9 57.9 2.4 55.5 13.0 42.5
2 Jul 55.3 11.5 2.1 41.7 1.7 40.0 9.8 30.2
3 Aug 56.8 10.4 1.8 44.6 1.6 43.0 9.6 33.4
4 Sept 103.6 11.2 1.9 90.5 1.9 88.6 15.5 73.1
5 Oct 128.0 27.2 3.6 97.2 1.9 95.3 25.8 69.5
6 Nov 167.6 22.5 5.5 139.6 5.2 134.4 24.8 109.6
7 Dec 131.1 22.4 4.7 104.0 4.0 100.0 21.5 78.5
8 Jan 144.8 23.6 4.8 116.4 4.0 112.4 23.7 88.7
9 Feb 125.0 17.6 4.3 103.1 4.1 99.0 18.5 80.5
10 Mar 82.3 11.6 3.1 67.6 3.1 64.5 11.5 53.0
11 Apr 45.6 11.5 1.8 32.3 1.2 31.1 9.0 22.1
12 May 39.1 9.6 1.5 28.0 1.1 26.9 7.6 19.3
Total 1154.8 193.9 38.0 922.9 32.2 890.7 190.3 700.4 Say 1154 194 38 922 32 890 190 700

229
The monthly minimum live storages are assumed for different dependabilities to be met at required successes rates (cut off storages) to be maintained at each of the reservoir/barrage 5.17.5 Multi Reservoir Simulation Study
Simulation studies have been carried out considering the Area – Elevation - Capacity tables of respective reservoirs, net inflows, evaporation depths, irrigation demands for irrigation, domestic, industrial and downstream releases for environmental purposes. 5.17.5.1 Reservoir Operation Policy / Priorities
The priorities considered for release of water for various purposes from the reservoirs is as under.
• Evaporation losses in the reservoir/barrages. • Releases for environmental purposes to be met at 90 to 100% success
rate. • Domestic and industrial requirements to be met at 93 to 100% success
rate. • Irrigation demands at the reservoir to be met at a minimum of 75%
success rate. • Downstream releases to meet irrigation demands at a minimum of
75% success rate • Demands of the link canal to be met at a minimum of 75% success
rate
The demands are proposed to be met from the spills of the reservoirs and balance demand is proposed from the storages on the priority mentioned above.
(i) Irrigation Demand below Chasmandva Barrage: The deficit in
irrigation demand below Chasmandva barrage is proposed to be met on priority from Paikhed reservoir and Jheri reservoir.
(ii) Link Canal Demand between Ambica and Purna River: The demand of 32 MCM is proposed to be met from Dabdar reservoir. The deficit of the link canal demand is proposed to be met from

230
Chikkar reservoir, Chasmandva reservoir, Paikhed reservoir and Jheri reservoir on priority.
(iii) Link Canal Demand between Purna and Tapi River: The demand of 190 MCM is proposed to be met from Kelwan reservoir. The deficit of the link canal demand is proposed to be met from Dabdar reservoir, Chikkar reservoir, Chasmandva reservoir, Paikhed reservoir and Jheri reservoir on priority.
(iv) Link Canal Demand beyond Tapi River: The demand of 700 MCM is proposed to be met from Kelwan reservoir. The deficit of the link canal demand is proposed to be met from Dabdar reservoir, Chikkar reservoir, Chasmandva reservoir, Paikhed reservoir and Jheri reservoir on priority.
5.17.5.2 Assumptions in the Simulation Study (1) Computation of Reservoir Evaporation Losses
Reservoir evaporation MCM = Submergence area at beginning of the Month * pan evaporation in mm / day * number of days in the month / 100000
(2) Setting of Initial Storage of the Reservoir The initial storage of the reservoir are assumed as 10% of the live Storage plus dead storage of the reservoir.
(3) The Minimum Storages Proposed in each Reservoir The minimum storages are proposed for meeting the demand for evaporation losses, environmental demands and domestic demand for meeting the required success rate.
(4) If the annual deficit falls less than 10% of demand is considered as success year
(5) Designed Demand through Canals in various Reaches (MCM)
1 Demand between Paikhed and Auranga Demand between Auranga and Ambica river
194.00 38.00
2 Demand between Ambica and Purna river 32.00

231
3 Demand between Purna and Tapi river 190.00 4 Demand Beyond Tapi river 700.00 Total 1154.00
The above demand is inclusive of transmission losses at 12% of diversion. 5.17.6 Simulation Results and Observations: Using the above inputs, the multi reservoir simulation studies were carried out for the period from 1975-2006 i.e., 32 years. The diversion quantities and other demands of the link are optimized with storages proposed in the reservoirs. The results are described below. (i) Evaporation losses of the reservoir: The annual evaporation losses
worked out for different reservoirs and required quantity of water has been kept for maintaining the storage of each reservoirs and are given in Simulation studies.
(ii) Environmental and Ecological Needs: About 10% of the 75% dependable lean season flow is considered for this purpose. It is seen from simulation studies that this demand is being met at 90 to 100% success rate in all the reservoirs
(iii) Irrigation Demands under the Reservoirs:
a) The local irrigation demands at Kelwan dam and Dabdar dam are 4.0 and3.9 MCM respectively. These demands are met at 96% success rate. b) The total irrigation demand at the periphery of six reservoirs is 48
MCM. The success rate in meeting the demand at Jheri, Paikhed,Chasmandava and Chikkar dams is 100%, where as the same at Dabdar and Kelwan reservoirs is 96% and 93% respectively.
(iv) Domestic Requirement for filling Tanks/Check dams : The
local domestic demands is considered as 60 MCM from the proposed Jheri, Paikhed, Chasmandva, Chikkar, Dabdar and Kelwan reservoirs @ 10.0 MCM each of the reservoir. These demands are met at 93 to 100% success rate.

232
(v) Link Canal Demands for Diversion of Water: (1) The annual link canal demand of 38MCM between Auranga and
Ambica rivers met at 93% success rate. The Maximum deficit for the demand in this reach is up to 2 MCM.
(2) The annual link canal demand of 32 MCMbetween Ambica and Purna river is met at 100% success rate.
(3) The annual link canal demand of 190 MCM between Purna and Tapi river is met at 96% success rate.
(4) The annual link canal demand of 700 MCM beyond Tapi river is met at 84.0 % success rate.
(5) The annual link canal demands of 194 MCM between Paikhed and Chasmandava feeder pipeline is met at 93% success rate.
(vi) Canal and Tunnel Capacity:The designed discharge capacity of
canals and tunnels betweenvarious reaches for the Par-Tapi-Narmada link are given in Table 5.63.
Table 5.63
Designed Diversion Capacity of Canals and Tunnels
Reservoir / Weir/Canal
Canal/Tunnel Capacity (cumec)
Jheri Reservoir Tunnel connecting Jheri and Paikhed reservoirs
12.80
Paikhed Weir Par-Tapi-Narmada Link Canal at head 38.17 Link Canal Link Canal between Paikhed weir and
Chasmandva Feeder(RD 0.00 to 62.072 km) 38.17
Chasmandva Weir Chasmandva Feeder Pipeline 8.50 Link Canal Link Canal between Chasmandva Feeder and
Dabdar Feeder(RD 62.072 to 108.250 km) 46.64
Chikkar Reservoir Chikkar and Dabdar inter-connecting canal 6.40 Dabdar Reservoir Dabdar Feeder Pipeline 17.00 Link Canal Link Canal between Dabdar Feeder and
Kelwan Feeder(RD 108.250 to 129.600 km) 46.64
Kelwan Reservoir Kelwan Feeder Pipeline 17.00 Link Canal Link Canal between Kelwan Feeder and Ukai
reservoir(RD 129.600 to 177.736 km) 63.69
Link Canal Off-take from Ukai reservoir(Tapi – Narmada canal at Head)
46.64

233
Conclusion
The simulation studies are carried out based on the data available and assumptions. Based on the data and assumptions the various demands are met successfully for all 12 months. However, the transfer of water is restricted to around 11 months only, instead of transferring the water throughout the year for maintaining the canal and optimum utilization of overall system. Out of total 1330 MCM of water to be transferred; about 108 MCM of water will be utilized in the vicinity of the six proposed reservoirs for various purposes as mentioned above, after allocation of 20 MCM towards downstream releases from the above reservoirs to meet environmental needs and 40 MCM towards evaporation losses from these reservoirs, annually. Thus, a total net quantum of 1210 MCM of water is planned to divert from these reservoirs/ barrages to the Par-Tapi-Narmada link canal at 75% success rate.
RD 51.043 to 69.150 Km 36.40
RD 69.150 to 82.171 Km 31.89
RD 82.171 to 191.307Km 17.26

430
Chapter- 7 Reservoir
7.0 General
Building reservoirs, either big or small, on rivers and streams facilitate conservation, management and development of water resources in our country in a big way. The spatial and temporal variations in rainfall and consequent seasonal variations in stream flows necessitate creation of reservoirs to obliterate the gap between the demand for water and availability of flows in the respective time periods in the streams. Water stored in a reservoir provides a buffer against water scarcity when rainfall is scanty. Reservoir is a source for renewable energy generation which is cheap and environment friendly. And also, water supplies to the needy areas could be delivered by gravity from the reservoirs which is very economical. Therefore, creation of reservoirs across rivers/streams for storage of water is vital for conservation, better management and optimum development of water resources in our country.
The river basins viz. Par, Auranga, Ambica and Purna, from which diversion of water is proposed through the Par-Tapi-Narmada link canal, receive 95% of annual rainfall in four months i.e. from June to September during South-West monsoon season. The average monsoon run-off in Par, Auranga, Ambica and Purna rivers is about 90% of annual run-off. During non-monsoon season there would be negligible flows or no flows at all in some months in these rivers. While flows are available in these rivers in a limited period in a year, the water requirement for various purposes, such as, irrigation, drinking and industrial, ecological etc. to be met by the link canal are spread throughout the year. Therefore, to bridge the gap between flows availability in these rivers at different time periods and demands to be met in the respective time periods through the link canal, building storages across these rivers is essential. Further, the rivers are flowing in deep channels in Western Ghats and whereas the cultivable lands are lying at much higher elevations. For irrigating these lands by gravity, it is necessary to raise the water levels of the rivers by constructing dams/weirs/barrages across them. Accordingly, six dams and two barrages are proposed under the link project for diversion of surplus waters of Par, Auranga, Ambica and Purna rivers to needy areas en-route and to take-over part Command Area of

431
Narmada Main Canal of Sardar Sarovar Project (SSP). The six dams proposed under the link project are: Jheri, Paikhed, Chasmandva, Chikkar, Dabdar and Kelwan. The two barrages are proposed, one each at the downstream of Paikhed and Chasmandva dams for diversion of the releases from Paikhed and Chasmandva reservoirs into the link canal.
The Jheri dam is proposed across Par River near village ‘Jheri’ in Peint taluka of Nasik district of Maharashtra State. Paikhed dam is proposed across Nar River (a tributary of Par) near village ‘Paikhed’ in Dharampur taluka of Valsad district of Gujarat State. It is proposed to divert surplus waters from Jheri reservoir to Paikhed reservoir through 12.7 km long inter-connecting tunnel. The combined waters will be released through the Dam toe Power House of Paikhed dam into Nar river and tapped at Paikhed barrage, proposed at about 4.60 km downstream near village ‘Nani Coswadi’ of Dharampur taluka, and let into the Link Canal which off-takes from Paikhed barrage.
The Chasmandva dam is proposed across Tan River (a tributary of
Auranga) near village ‘Chasmandva’ in Dharampur taluka. The surplus waters of Tan River released through the Dam toe Power House of Chasmandva dam will be tapped at Chasmandva barrage, proposed at about 8.5 km downstream near village ‘Chandha Chikadi’ of Dharampur taluka, and will be diverted into the Link Canal by a Feeder Pipe line of about 2.859 km long.
The Chikkar dam is proposed across Ambica River near village
‘Chikkar’ in Ahwa taluka of The Dangs district in Gujarat State. The surplus water of Ambica River will be diverted through a 14.342 km long Feeder Canal into Dabdar reservoir after power generation at Chikkar dam toe Power House. The Dabdar dam is proposed across Khapri River (a tributary of Ambica) near village ‘Dabdar’ in Ahwa taluka of The Dangs district. The combined surplus flows of Ambica and Khapri Rivers will be diverted into the Link Canal through a 12.258 km long Feeder Pipe line after power generation at Dabdar dam toe Power House.
The Kelwan dam is proposed across Purna River near villages ‘Kelwan’ and ‘Kakarda’ in Ahwa taluka of The Dangs district. The surplus

432
waters of Purna River will be fed in to the Link Canal through a 7.616 km long Feeder Pipe line after power generation at Kelwan dam toe Power House. A Canal Power House is proposed across the Feeder Pipe line where considerable drop in ground level is observed.
It is planned to drop the Link Canal in to the existing Ukai reservoir on the river Tapi and to take it off from the right bank. However, neither the storage of Ukai reservoir nor the waters of Tapi River would be used under the Par-Tapi- Narmada Link Canal project. But the Ukai reservoir will be used just as a ‘Level Crossing’ for diversion of water through the Link Canal. The Link Canal crosses Narmada River downstream of Sardar Sarovar Project and finally out-falls in to Miyagam branch canal of Narmada Main Canal at RD 16.70 km.
In addition to the Link Canal’s demands, the above reservoirs will also meet downstream environmental needs; domestic, industrial and irrigation needs of the areas located at the periphery of these reservoirs. The power generation at these reservoirs is planned utilizing releases for link canal, environmental releases, committed downstream releases, spills, etc.
Considering the inflow pattern and water demands for various
purposes at a particular time, socio-economic and environmental impact due to submergence and keeping in view the techno-economic aspects, attempt has been made to fix the size of the proposed reservoirs.
The details on criteria adopted for fixation of various reservoir levels,
sedimentation studies carried out, area of submergence etc. of Jheri, Paikhed, Chasmandva, Chikkar, Dabdar and Kelwan reservoirs and the details relevant to proposed barrages are presented in the following paragraphs.
7.1. Jheri Reservoir 7.1.1. Fixation of Storage and Reservoir Levels - Approach–Criteria
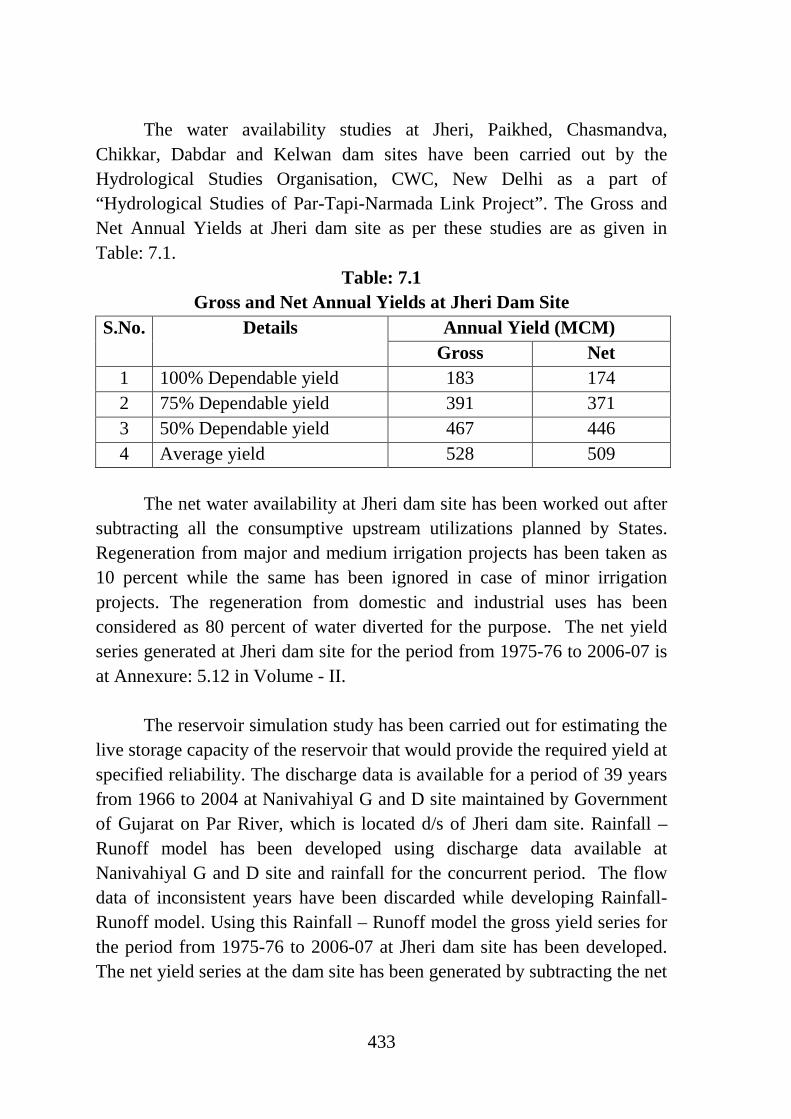
433
The water availability studies at Jheri, Paikhed, Chasmandva,
Chikkar, Dabdar and Kelwan dam sites have been carried out by the Hydrological Studies Organisation, CWC, New Delhi as a part of “Hydrological Studies of Par-Tapi-Narmada Link Project”. The Gross and Net Annual Yields at Jheri dam site as per these studies are as given in Table: 7.1.
Table: 7.1 Gross and Net Annual Yields at Jheri Dam Site
S.No. Details Annual Yield (MCM) Gross Net
1 100% Dependable yield 183 174 2 75% Dependable yield 391 371 3 50% Dependable yield 467 446 4 Average yield 528 509
The net water availability at Jheri dam site has been worked out after
subtracting all the consumptive upstream utilizations planned by States. Regeneration from major and medium irrigation projects has been taken as 10 percent while the same has been ignored in case of minor irrigation projects. The regeneration from domestic and industrial uses has been considered as 80 percent of water diverted for the purpose. The net yield series generated at Jheri dam site for the period from 1975-76 to 2006-07 is at Annexure: 5.12 in Volume - II.
The reservoir simulation study has been carried out for estimating the live storage capacity of the reservoir that would provide the required yield at specified reliability. The discharge data is available for a period of 39 years from 1966 to 2004 at Nanivahiyal G and D site maintained by Government of Gujarat on Par River, which is located d/s of Jheri dam site. Rainfall – Runoff model has been developed using discharge data available at Nanivahiyal G and D site and rainfall for the concurrent period. The flow data of inconsistent years have been discarded while developing Rainfall-Runoff model. Using this Rainfall – Runoff model the gross yield series for the period from 1975-76 to 2006-07 at Jheri dam site has been developed. The net yield series at the dam site has been generated by subtracting the net

434
upstream consumptive use from the gross yield series and used for simulation analysis.
The simulation analysis has been done using Simulation Program developed using c++. This programme also takes into account the different releases from Jheri reservoir: i) for local domestic and industrial water demand, ii) environmental and ecological requirements downstream of proposed dam site, and iii) diversion to Paikhed reservoir for further transfer to Par-Tapi-Narmada Link Canal. The result of this analysis is at Appendix 5.5 in Volume - IV which gives detailed output for the gross capacity of 206.03 MCM. 7.1.1.1 Dead Storage Level (DSL)
One of the most important issues in the planning of storage reservoirs is the loss in the storage capacity due to silting. Hence, it is necessary at the planning stage that a portion of the capacity of the reservoir is reserved for occupation by silt deposition. By providing extra storage volume in the reservoir for sediment accumulation, in addition to the live storage, it is ensured that the live storage will function at full efficiency for an assigned number of years. This volume of storage (in addition of live storage) is referred to as the dead storage and is equivalent to the volume of sediment expected to be deposited in the reservoir during the designed life of the structure.
The sediment entering into a storage reservoir gets deposited
progressively with the passage of time and thereby reduces the dead as well as live storage capacity of the reservoir. This causes the bed level near the dam to rise and the raised bed level is termed as “New Zero Elevation”. It is therefore necessary to assess the revised areas and capacities at various reservoir elevations that would be available in future and could be used in simulation studies to test the reservoir performance and also the New Zero Elevation. As per IS: 12182 (1987) – “Guidelines for Determination of Effects of Sedimentation in Planning and Performance of Reservoirs”. The live storage is to be so planned that the benefits do not reduce for a period of 50 years (full service time) for irrigation or 25 years for hydropower projects connected to a grid on account of sedimentation. Also the

435
sedimentation in the reservoir should not cause operational problems (sedimentation beyond the outlet) for 100 years for irrigation projects and 70 years for hydropower projects in a grid. As Par-Tapi-Narmada Link Canal project is being planned mainly for irrigation purpose, the reservoirs under the link project are proposed to be planned in such a way that full benefits are available for 50 years and reservoirs will function normally for about 100 years. Accordingly, sedimentation studies have been carried out for 50 years (for reservoir simulation) and 100 years (for planning outlet).
The dead storage capacity of the Jheri reservoir has been fixed on the
basis of the guidelines given in “Fixing the capacities of reservoirs – Methods, Part 2 Dead storage, IS 5477 (Part 2): 1994”.
The new zero elevation of the Jheri reservoir has been worked out as 185.00 m and 198.50 m after 50 years and 100 years respectively on the basis of sedimentation studies. The corresponding capacities at these levels as per the original Area - Capacity table come to 34 ha m and 868 ha m respectively. However, Dead Storage Level of the reservoir has been proposed as 199.00 m (corresponding original capacity of 923 ha m). The details of sedimentation studies are furnished in Appendix 5.2 in Volume – IV.
7.1.1.2 Low Water Level /Minimum Draw-Down Level (MDDL)
The Minimum Draw Down Level (MDDL) of Jheri reservoir can be fixed anywhere above 198.50 m which is the new zero elevation after 100 years of operation of the reservoir, based on sedimentation studies carried out by Hydrological Studies Organisation, CWC, New Delhi. Considering the delivery head requirement at Jheri reservoir for diversion of waters into Paikhed reservoir through the 12.7 km long tunnel, the MDDL of Jheri reservoir is kept at 204.00 m. 7.1.1.3 Full Reservoir Level (FRL)
Integrated simulation studies carried out for Jheri, Paikhed, Chasmandva, Chikkar, Dabdar and Kelwan reservoirs indicate that the proposed Jheri reservoir with Full Reservoir Level at 246.00 m will meet

436
various planned demands at 100% success rate. Therefore, the Full Reservoir Level of Jheri dam has been kept at 246.00 m. 7.1.1.4 Maximum Water Level (MWL) Maximum water level of Jheri reservoir has been kept as 247.00 m and the gates of spillway have been designed to pass design flood of 6539 Cumecs. Various levels fixed at Jheri Reservoir are given in Table - 7.2.
Table -7.2
Levels Fixed as per Simulation Study Jheri Reservoir Elevation(m)
MWL 247.00 m FRL 246.00 m MDDL 204.00 m
Jheri – Paikhed Tunnel Invert level at entry 199.50 m Crown level at entry 202.50 m Invert level at exit 185.00 m
Crown level at exit 188.00 m 7.1.1.5 Maximum Backwater Level at Full Reservoir Level and
Maximum Water Level and its Effect, Points to Which Backwater Effect is Felt, Maximum Distance of Such Points from the Axis of the Structure
The Full Reservoir Level (FRL) and Maximum Water Level (MWL)
of the Jheri dam have been fixed at 246.00 m and 247.00 m respectively. The maximum back water level at MWL is 247.00 m and the effect extends up to a distance of about 14.60 km from the axis of the dam (at the periphery of the reservoir) within which no structure of significant importance has been identified.

437
7.1.1.6 Saddles along the Reservoir Rim
The entire rim of proposed Jheri reservoir is covered with the contours of value higher than the MWL as such no saddle is proposed along the rim of Jheri reservoir.
7.1.1.7 Fetch
The fetch of the reservoir was determined to fix the free board and the top of the dam. The fetch computations were done as per the Indian Standards IS: 10635(Latest), “Guidelines for Free board requirements in Embankment Dams”.
7.1.1.8 Direction of Wind - Velocity of Wind - Wave Height - Free
Board-Top of Dam
The direction of wind in Jheri reservoir area is mostly from east to west. The Nasik IMD station is located near to the Jheri dam site. The maximum wind velocity of 13.2 km/hr is experienced in the month of June and the minimum wind velocity of 4.5 km/hr is experienced in the month of December. The average velocity of wind is 8.4 km/hr. However, a normal wind velocity of 44 m/sec has been considered. The following factors are taken into consideration while computing the free board requirement:
(a) Wave characteristics i.e. wave height and wave length; (b) Upstream slope of the dam and roughness of the pitching; (c) Height of wind setup above the still water level.
The details of free board requirement for all the six dams are
furnished in para 6.1.5 of Chapter – 6: Design Aspects. The top of the rock-fill portion of the Jheri dam has been fixed at 253.00 m. 7.1.2 Sedimentation Data and Studies
As a part of Hydrological Studies of Par-Tapi-Narmada Link Project,
the Sedimentation Studies of the reservoirs proposed under the Link Project have been carried out by Hydrological Studies Organisation, CWC, New

438
Delhi. The details of sedimentation studies are furnished in Appendix 5.2 in Volume – IV and the gist of the studies is presented below.
Previously, five reservoirs which are situated in the vicinity of Par-Tapi-Narmada Link Project were studied by Government of Gujarat to determine the sedimentation rate in the region. Based on the hydrographic surveys of Bhatsa, Dantiwada, Kanhar, Attaria-II and Machrewa-II reservoirs in the vicinity, sedimentation rate was found in the range of 1.2 to 2.0 acre-ft/sq mile/ year for South Gujarat area. Based on these studies, a silt rate of 1.5 acre-ft/ sq mile/ year (7.15 ham/ 100 sq.km/ year) was adopted in Feasibility Study of the Link Project. These figures included bed load assumed as 15 % of the suspended load.
Presently, Sediment load is being measured in only three river basins viz. Auranga (at Amba GandD site), Ambica (at Gadat GandD site) and Purna (at Mahuva GandD site) pertaining to Par-Tapi-Narmada Link Project. The sedimentation rate assessed in these three river basins based on observed daily discharges and sediment concentration are given in Table 7.3.
Table -7.3
Sediment Rate in Auranga, Ambica and Purna River Basins S.
No. River GandD site Sediment Rate (mm/km2/year)
Suspended Load
(SL) Total Load (1.15*SL)
1 Auranga Amba 0.3831 0.4406 2 Ambica Gadat 0.2443 0.2810 3 Purna Mahuva 0.3693 0.4247
And also, based on the analysis of capacity survey data of 144
reservoirs, rate of siltation in the existing dams were calculated and zone wise sedimentation rate was established in CWC’s document “Compendium on Silting of Reservoirs in India”. In the document India is divided into seven zones and silting rate for each zone is established based on the reservoirs located in the respective zones. Table 7.4 summarizes the

439
published values of average and median siltation rate for the regions “Narmada and Tapi Basin” and “West Flowing Rivers beyond Tapi and South Indian Rivers”.
Table -7.4 Rate of Siltation as per
“Compendium on Silting of Reservoirs in India” Zone Region No. of
Reservoirs Under Study
Average Rate of Siltation (mm/year)
Median Values of Rate of Siltation (mm/year)
6 Narmada and Tapi Basin
3 0.729 0.75
7 West Flowing Rivers beyond Tapi and South Indian Rivers
19 3.533 1.79
But the sediment data is not available for Par and Nar rivers on which
Jheri and Paikhed dams are proposed. Currently no sediment observations are planned in the catchment area of Jheri dam. However, the Government of Gujarat had carried out sedimentation survey of existing Madhuban reservoir on Damanganga River, which lies in the vicinity of the Link Project. Using this data the sedimentation rate at Jheri dam site has been assessed. 7.1.2.1 Rate of Sedimentation with Basis
The sedimentation rates observed at GandD sites (Table-7.3) are
relatively lower as compared to sediment rate based on hydrographic survey of five reservoirs in the region and much lower than the generalized siltation rate (Table-7.4) recommended for the region (west flowing rivers beyond Tapi) in the “Compendium of Silting of Reservoirs in India”. The hydrographic survey of existing reservoirs generally provide sound basis for the assessment of sedimentation rate in the region. The hydrographic survey of five reservoirs indicate sedimentation rate of 7.15 ham/100sq.km/year as above. The hydrographic Survey of Madhuban reservoir in Damanganga basin, which lies towards south of Par-Tapi-Narmada link projects, gave sedimentation rate of 8.94 ham/100 sq.km/ year. Normal rainfall in

440
Damanganga basin is higher than the normal rainfall in river basins of Par-Tapi-Narmada Link Project and therefore sedimentation rate of 7.15 ham/ 100 sq.km/year, as assessed based on hydrographic survey of reservoirs in the region, appears in order. However the land use changes are likely to impact the sediment generation from the catchment in the future with increasing human activities such as agriculture etc. Presently the catchment of these river basins particularly the upper catchments are not significantly affected by the human activities. Impact of climate change is likely to increase rainfall intensities and extreme meteorological events. In view of above factors, the observed sedimentation rate of 7.15 ham/100 sq.km/year is enhanced by 25% and sedimentation rate of 8.94 say 9.0 ham/100 sq.km/year has been adopted for analysis of all the reservoirs contemplated under Par-Tapi-Narmada Link Project. 7.1.2.2 Quantity of Sediment
Considering the inflow sedimentation rate of 9.0 ham/100 sq km/year the sediment volume at Jheri reservoir will be as under:
i) 50 years sediment volume 18.008 MCM ii) 100 years sediment volume 35.938 MCM
7.1.2.3 Type and Shape of Reservoir
The Jheri reservoir is considered as hill type and the standard classification is taken as Type III. 7.1.2.4 Sediment Studies – Jheri Reservoir
As per IS 5477 (Part – 2): 1994 (Fixing the capacities of reservoirs), either the “Empirical Area Reduction” method or the “Area Increment” method is recommended to be used for sedimentation study. In this report, the sedimentation study has been carried out using “Empirical Area Reduction” method.

441
7.1.2.5 Sediment Distribution
The sediment distribution is worked out for two periods, viz. 50 years and 100 years by Empirical Area Reduction method. For this purpose, the FRL 246.00 m is adopted and bed level of the reservoir is considered as 180 m. The original Elevation-Area-Capacity table for Jheri reservoir is given in Table-7.5.
Table-7.5
Original Elevation-Area-Capacity Table for Jheri Reservoir Elevation (m) Area ( ha) Capacity (MCM)
246.00 836.42 206.03 245.00 818.20 197.75 242.00 758.51 174.11 239.00 686.39 152.44 236.00 590.39 133.31 233.00 553.52 116.15 230.00 487.80 98.76 227.00 451.01 81.36 224.00 414.09 68.39 221.00 375.66 56.55 218.00 320.41 46.12 215.00 240.50 37.73 212.00 215.10 30.90 210.00 208.20 26.67 208.00 190.33 22.69 206.00 170.64 19.08 204.00 152.65 15.85 202.00 136.26 12.96 200.00 120.00 10.40 199.00 113.04 9.23 198.00 105.56 8.14 197.00 98.31 7.12 196.00 91.34 6.17 195.50 87.97 5.73 195.00 84.60 5.30

442
Elevation (m) Area ( ha) Capacity (MCM) 194.00 76.46 4.49 193.00 68.72 3.76 192.00 61.40 3.11 191.00 54.49 2.54 190.00 50.00 2.01 189.00 41.49 1.56 188.00 35.45 1.17 187.00 30.90 0.84 186.00 24.81 0.56 185.12 20.75 0.36 185.00 20.20 0.34 184.75 18.38 0.29 184.50 16.56 0.25 184.00 12.92 0.17 183.00 7.27 0.07 182.00 3.23 0.02 181.00 0.81 0.00 180.00 0.00 0.00
The total sediment during 50 and 100 years will get distributed up to
and above various elevations as given in the Table-7.6 below:
Table-7.6 Distribution of Total Sediment at Various Elevations of Jheri Dam
Reservoir Level Sediment Deposition in MCM After 50 Years After 100 Years
Up to 185 m 0.34 0.34 Above 185 m 17.82 35.26 Up to 199 m 5.89 9.24 Above 199 m 12.27 26.36 Up to 204 m 8.47 14.81 Above 204 m 9.69 20.79
The new zero elevation will be as follows: After 50 years = 185.00 m After 100 years = 198.50 m
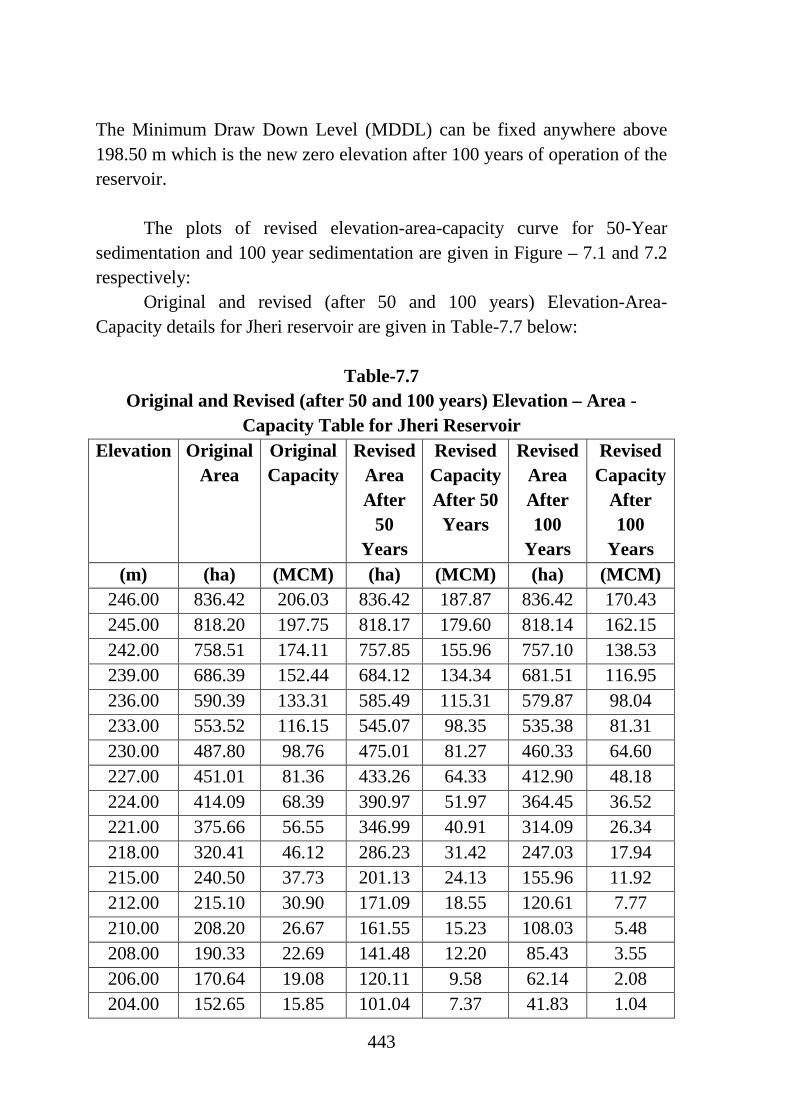
443
The Minimum Draw Down Level (MDDL) can be fixed anywhere above 198.50 m which is the new zero elevation after 100 years of operation of the reservoir.
The plots of revised elevation-area-capacity curve for 50-Year sedimentation and 100 year sedimentation are given in Figure – 7.1 and 7.2 respectively: Original and revised (after 50 and 100 years) Elevation-Area-Capacity details for Jheri reservoir are given in Table-7.7 below:
Table-7.7
Original and Revised (after 50 and 100 years) Elevation – Area - Capacity Table for Jheri Reservoir
Elevation Original Area
Original Capacity
Revised Area After
50 Years
Revised Capacity After 50
Years
Revised Area After 100
Years
Revised Capacity
After 100
Years (m) (ha) (MCM) (ha) (MCM) (ha) (MCM)
246.00 836.42 206.03 836.42 187.87 836.42 170.43 245.00 818.20 197.75 818.17 179.60 818.14 162.15 242.00 758.51 174.11 757.85 155.96 757.10 138.53 239.00 686.39 152.44 684.12 134.34 681.51 116.95 236.00 590.39 133.31 585.49 115.31 579.87 98.04 233.00 553.52 116.15 545.07 98.35 535.38 81.31 230.00 487.80 98.76 475.01 81.27 460.33 64.60 227.00 451.01 81.36 433.26 64.33 412.90 48.18 224.00 414.09 68.39 390.97 51.97 364.45 36.52 221.00 375.66 56.55 346.99 40.91 314.09 26.34 218.00 320.41 46.12 286.23 31.42 247.03 17.94 215.00 240.50 37.73 201.13 24.13 155.96 11.92 212.00 215.10 30.90 171.09 18.55 120.61 7.77 210.00 208.20 26.67 161.55 15.23 108.03 5.48 208.00 190.33 22.69 141.48 12.20 85.43 3.55 206.00 170.64 19.08 120.11 9.58 62.14 2.08 204.00 152.65 15.85 101.04 7.37 41.83 1.04

444
Elevation Original Area
Original Capacity
Revised Area After
50 Years
Revised Capacity After 50
Years
Revised Area After 100
Years
Revised Capacity
After 100
Years (m) (ha) (MCM) (ha) (MCM) (ha) (MCM)
202.00 136.26 12.96 84.24 5.52 24.56 0.38 200.00 120.00 10.40 68.32 4.00 9.02 0.04 199.00 113.04 9.23 61.82 3.35 0.00 0.00 198.00 105.56 8.14 55.02 2.77 0.00 0.00 197.00 98.31 7.12 48.67 2.25 0.00 0.00 196.00 91.34 6.17 42.82 1.79 0.00 0.00 195.50 87.97 5.73 40.10 1.58 0.00 0.00 195.00 84.60 5.30 37.43 1.39 0.00 0.00 194.00 76.46 4.49 30.88 1.05 0.00 0.00 193.00 68.72 3.76 24.98 0.77 0.00 0.00 192.00 61.40 3.11 19.73 0.55 0.00 0.00 191.00 54.49 2.54 15.15 0.37 0.00 0.00 190.00 50.00 2.01 13.24 0.23 0.00 0.00 189.00 41.49 1.56 7.56 0.13 0.00 0.00 188.00 35.45 1.17 4.60 0.07 0.00 0.00 187.00 30.90 0.84 3.37 0.03 0.00 0.00 186.00 24.81 0.56 0.84 0.00 0.00 0.00 185.12 20.75 0.36 0.09 0.00 0.00 0.00 185.00 20.20 0.34 0.00 0.00 0.00 0.00 184.00 12.92 0.17 0.00 0.00 0.00 0.00 183.00 7.27 0.07 0.00 0.00 0.00 0.00 182.00 3.23 0.02 0.00 0.00 0.00 0.00 181.00 0.81 0.00 0.00 0.00 0.00 0.00 180.00 0.00 0.00 0.00 0.00 0.00 0.00
7.1.3 Life of Reservoir in Years with Basis All the outlets from the reservoir are fixed at an elevation above the New Zero Elevation estimated after considering 100 years of sedimentation. Therefore, the life of the Jheri reservoir has been considered as 100 years.

445
7.1.4 Capacity 7.1.4.1 Capacities of Jheri Reservoir S No.
Capacity (MCM) Initial After 50
Years After 100
Years 1 Gross storage capacity 206.03 187.87 170.43 2 Live storage capacity 190.18 180.50 169.39 3 Storage capacity at MDDL 15.85 7.37 1.04 4 Dead storage capacity (at
DSL) 9.23 3.35 0.00
7.1.4.2 Storage
Simulation analysis considering the inflow and various water demands to be met from Jheri reservoir has been carried out. Based on the simulation analysis the live storage has been provided so that the demand of water for various requirements could be met. The dead storage has been provided so that the functioning of the project would not be affected even after accumulation of silt over a period of 100 years. Various storage details of the proposed Jheri reservoir have been mentioned in the Para 7.1.4.1 above.
The initial storage of each reservoir planned under the Link Project is assumed as 10% of live storage plus storage at MDDL for simulation analysis. No storage capacity is reserved for downstream use under any of the proposed reservoirs. The monthly minimum storages reserved in Jheri reservoir for meeting the water demands towards evaporation losses, environmental (10% of 75% dependable lean season flow) and domestic needs to achieve intended success rates are given in Table-7.8 below:
Table-7.8 Monthly Minimum Storages Reserved in Jheri Reservoir for Meeting
Evaporation Losses, Environmental and Domestic Needs
Unit: MCM

446
Jun Jul Aug Sept Oct Nov Dec Jan Feb March Apr May 2 2 2 2 2 12 10 10 7 6 4 2
The monthly inflow series and monthly diversion requirements
considered for simulation analysis of Jheri reservoir for fixing its live storage are furnished in Appendix 5.5 in Volume – IV. 7.1.4.3 Water Tightness of the Reservoir
Preliminary Geotechnical Investigations were carried out at the dam site by GSI, Western Region, Jaipur at Feasibility Report stage of Par-Tapi-Narmada Link Project during 1993-94. As per these investigations the foundation rocks at the dam site are massive and amygdular basalts which are jointed and sheared, particularly at the flow contacts. Hence, special attention shall be needed to delineate the flow contacts and their structural conditions, necessitating selective treatment to improve their strength and imperviousness.
The Jheri reservoir area is thickly forested and restricted to the valley with steep hills on both sides. Amygdular basalts which are jointed and sheared are encountered in the area. No major fault or shear zone was noted in the area. The reservoir appears to be water tight. The reports of GSI are at Appendix – 4.2 and 4.4 in Volume – III. Also the periphery of the proposed Jheri reservoir is covered with the contours of value higher than the MWL.
7.1.4.4 Annual Losses The simulation study carried out for Jheri reservoir for the period from 1975 to 2006 indicates that the annual average evaporation loss from Jheri reservoir is 10.3 MCM with highest evaporation loss as 11.3 MCM during the years 1994 and 2005 and the lowest evaporation loss as 7.9 MCM during the year 1987. Maximum Monthly evaporation loss is in May month and least Monthly evaporation loss is in July. 7.1.4.5 Flood Absorption

447
No flood storage is earmarked for this project. However, from reservoir routing it is seen that the maximum water level attained was 247.00 m and the maximum outflow discharge was 6586 Cumec. 7.1.5 Effects on Sub Soil Water Table in the Adjoining Areas
Particularly Downstream of the Dam
The sub-soil water table will improve due to the impoundment of water in the Jheri reservoir. In addition, the regulated flows from the Jheri dam into Par River to meet environmental needs will increase the sub soil water level in the adjoining areas even during lean season. 7.1.6 Reservoir Rim Stability
The entire Reservoir area lies in the Deccan volcanoes. The rock type encountered is moderately to highly amygdular basalt, which is generally non-porphyritic in nature with occasional thin bands of massive basalt occurring in it. Occasional dykes of dolerite composition have been observed.
The reservoir area appears to be water tight with no perceptible shear
or fault zone criss-crossing the area.
7.1.7 Area of Submergence 7.1.7.1 At Maximum Water Level
Area of submergence of Jheri reservoir at MWL is 905 ha.
7.1.7.2 At Full Reservoir Level
Area of submergence of Jheri reservoir at FRL is 836 ha. 7.1.7.3 Submergence Ratio - Submerged (Cultivated) Area/CCA The Jheri reservoir is a part of net-work of 6 reservoirs proposed under Par-Tapi-Narmada Link Project for diversion of surplus waters of Par, Auranga, Ambica and Purna rivers for en-route irrigation and to take-over

448
part command of Narmada Main Canal. The irrigation water requirement of the Link Project will be met in an integrated manner i.e. first attempt will be to meet the irrigation needs from the nearest reservoir (Kelwan) and if there is any shortage of water at the reservoir, the water will be drawn from the successive reservoirs up to the Jheri reservoir. It implies that the storages available at all the six reservoirs will be utilized for meeting the irrigation demand of the Link Project. As such, the submergence ratio should be worked considering the total submergence area (cultivated) under six reservoirs and the total CCA of the Link Project. The total submergence area (cultivated) under the six reservoirs is 2364 ha and the total CCA of the Link project is 232175 ha. Therefore, the Submergence Ratio works out to 0.0102. 7.1.8 Land Acquisition-Property Submerged-Rehabilitation 7.1.8.1 Land Acquisition
The land to be acquired is about 836 ha (forest land: 408 ha, cultivable land: 256 ha and other lands including river portion: 172 ha) that is coming under submergence of Jheri reservoir.
7.1.8.2 Details of Property Submerged
Due to creation of Jheri reservoir 6 villages will be partially affected. All these villages come under Peint and Surgana talukas of Nasik district of Maharashtra. Total 98 households of these villages are likely to be affected. (i) Details of Dislocation of Communication (Railways), Road(s), Right
of Way, Telegraph Lines etc.) as a Result of the Project
No railway line is coming under the submergence area of Jheri reservoir. Major road connecting Peint to Surgana is passing through the Submergence area of Jheri dam and approximately 1 km length is under the submergence. No telegraph/ telephone line needs to be dislocated as a result of the project. (ii) Details of Valuable Mineral Deposits / Mines

449
The Engineering Geology Division of GSI, Jaipur vide Letter No. 171/G-1/EG/WR/GSI08-09 dated 9th April, 2009 (Annexure – 4.3 in Volume -II) informed that no significant minerals have been reported from the Jheri reservoir area, except construction material and a few minor minerals like zeolites.
(iii) Historic/Archaeological Monuments
As already mentioned under “Chapter – 4: Surveys and Investigations-Para 4.2.1 Archaeological Survey”, no antiquarian archaeological remains have been noticed and none of the centrally protected monuments are located in the area likely to be submerged due to construction of Jheri dam. 7.1.8.3 Rehabilitation of Project Affected People
The objective of development is poverty alleviation, social justice and a better quality of life for people. Some development situations however entail displacement of populations and adverse impacts including disruption of social and kinship networks and livelihoods and other economic or cultural loss.
Lack of development, however, can also impact on the environment and lead to distress migration. Involuntary displacement by dams or other water resource projects must therefore be sought to be converted into a development opportunity that leaves those affected better off through enlightened processes of resettlement and rehabilitation. The Social and Occupational profile of the people of the project area is described in the Chapter -12 “Socio- economic Studies and RandR Plan”.
Due to creation of Jheri reservoir 98 households/families are likely to be affected. These Project Affected People (PAPs) are to be compensated for their loss of land, home etc, for which an RandR package has been evolved. The process of RandR has three distinct components: relocation of PAPs to a new location where necessary; resettlement in that location and the restoration of livelihood; and rehabilitation so that every individual

450
could regain and/or improve his/her life and socio-economic status within a reasonable time after displacement.
The RandR package for PAPs has been devised considering the provisions of “National Policy on Rehabilitation and Resettlement -2007” formulated by Ministry of Rural Development, Government of India, as basic minimum criteria. Due weightage has also been given to various provisions of the Resettlement and Rehabilitation (RandR) Plan adopted for Sardar Sarovar Project by the States of Gujarat, Madhya Pradesh and Maharashtra.
Resettlement and Rehabilitation (RandR) Plan adopted for Sardar Sarovar Project by the States of Gujarat, Madhya Pradesh and Maharashtra has been reviewed and compared with NPRR, 2007 and the best norms of each policy have been adopted. People’s perception on the resettlement aspects and facilities they expect in the area where they are supposed to be resettled after displacement and preferences of affected population regarding compensation package, whether it should be in cash or kind have also been considered while formulating the Resettlement and Rehabilitation package for the people likely to be affected due to the submergence of Jheri, Paikhed, Chasmandva, Chikkar, Dabdar and Kelwan reservoirs. The details of R and R package are described in the Chapter – 12 (Socio- economic studies and RandR plan).
7.1.9 Recreation Facilities Following are the recreational facilities which are proposed to be developed.
• Development of parks/gardens in d/s of dam. • Development of Children parks in the township. • Development of Tourist spot with boating facilities • Development of Guest house, inspection bungalow and
dormitory accommodation.
These facilities will ensure tourism development in the area. 7.1.10 Pisciculture

451
The submergence area of Jheri reservoir is 836 ha and there is lot of
scope for developing fisheries. Based on literature review, the present average fish production rate in Indian reservoirs is given in Table – 7. 9 below:
Table – 7.9 Average Fish Production Rates in Reservoirs Reservoir Type Yield (kg/ ha) Small 49.90 Medium 12.30 Large 11.43
Fish Seed Committee of the Government of India (1966) termed all
water bodies of more than 200 ha in area as reservoirs. David et al. (1974) while classifying the water bodies of Karnataka State, considered impoundments above 500 ha as reservoirs and named the smaller ones as irrigation tanks.
Reservoirs are classified generally as small (<1000 ha), medium (1000 to 5000 ha) and large (> 5000 ha), especially in the records of the Government of India (Sarma, 1990, Srivastava et al., 1985), which has been followed in the present study.
Considering the water spread area of Jheri reservoir and the fish production rate indicated above, expected fish production in Jheri reservoir will be about 42 tonnes per year which will increase the revenue from the project.
7.1.11 Need and Recommendation for Soil Conservation Measures
in the Catchment
The chances of soil erosion, if any can be prevented/minimized by adopting following measures:
• Step drain • Angle iron barbed wire fencing • Stone masonry

452
• Check dams • Contour bunding • Development of nurseries • Plantation/ afforestation • Pasture development • Social forestry Appropriate financial provisions have been provided for soil
conservation measures in the catchment area. 7.2. Paikhed Reservoir 7.2.1. Fixation of Storage and Reservoir Levels - Approach–Criteria
The water availability studies at Jheri, Paikhed, Chasmandva,
Chikkar, Dabdar and Kelwan dam sites have been carried out by the Hydrological Studies Organisation, CWC, New Delhi as a part of “Hydrological Studies of Par-Tapi-Narmada Link Project”. The Gross and Net Annual Yields at Paikhed dam site as per these studies are as given in Table: 7.10 below.
Table: 7.10
Gross and Net Annual Yields at Paikhed Dam Site S.No. Details Annual Yield (MCM)
Gross Net 1 100% Dependable yield 152 144 2 75% Dependable yield 264 250 3 50% Dependable yield 335 321 4 Average yield 380 367
The net water availability at Paikhed dam site has been worked out
after subtracting all the consumptive upstream utilizations planned by States. Regeneration from major and medium irrigation projects has been taken as 10 percent while the same has been ignored in case of minor irrigation projects. The regeneration from domestic and industrial uses has been considered as 80 percent of water diverted for the purpose. The net yield series generated at Paikhed dam site for the period from 1975-76 to 2006-07 is at Annexure: 5.14 in Volume – II.

453
The reservoir simulation study has been carried out for estimating the
live storage capacity of the reservoir that would provide the required yield at specified reliability. The discharge data is available for a period of 39 years from 1966 to 2004 at Nanivahiyal G and D site maintained by Government of Gujarat on Par River, which is located d/s of Paikhed dam site. Rainfall – Runoff model has been developed using discharge data available at Nanivahiyal G and D site and rainfall for the concurrent period. The flow data of inconsistent years have been discarded while developing Rainfall-Runoff model. Using this Rainfall – Runoff model the gross yield series for the period from 1975-76 to 2006-07 at Paikhed dam site has been developed. The net yield series at the dam site has been generated by subtracting the net upstream consumptive use from the gross yield series and used for simulation analysis.
The simulation analysis has been done using Simulation Program developed using c++. This programme also takes into account the different releases from Paikhed reservoir: i) for local domestic and industrial water demand, ii) environmental and ecological requirements downstream of proposed dam site and iii) downstream releases for further transfer to Par-Tapi-Narmada Link Canal. The result of this analysis is at Appendix 5.5 in Volume - IV which gives detailed output for the gross capacity of 229.53 MCM.
7.2.1.1 Dead Storage Level (DSL)
The dead storage capacity of the Paikhed reservoir has been fixed on the basis of the guidelines given in “Fixing the capacities of reservoirs – Methods, Part 2 Dead storage, IS 5477 (Part 2): 1994”.
The new zero elevation of the Paikhed reservoir has been worked out
as 164.34 m and 171.88 m after 50 years and 100 years respectively on the basis of sedimentation studies. The corresponding capacities at these levels as per the original Area - Capacity table come to 1.59 ha m and 89.36 ha m respectively. However, Dead Storage Level of the reservoir has been proposed as 172.00 m (corresponding original capacity of 92 ha m) and

454
sluices are proposed to be provided above this level. The details of sedimentation studies are furnished in Appendix 5.2 in Volume – IV.
7.2.1.2 Low Water Level /Minimum Draw-Down Level (MDDL)
The Minimum Draw Down Level (MDDL) of Paikhed reservoir can be fixed anywhere above 171.88 m which is the new zero elevation after 100 years of operation of the reservoir, based on sedimentation studies carried out by Hydrological Studies Organisation, CWC, New Delhi. Keeping in view the live storage requirement for meeting the Link Canal demands and power generation, the MDDL of Paikhed reservoir is kept at 190.00 m. 7.2.1.3 Full Reservoir Level (FRL)
Integrated simulation studies carried out for Jheri, Paikhed, Chasmandva, Chikkar, Dabdar and Kelwan reservoirs indicate that the proposed Paikhed reservoir with Full Reservoir Level at 248.00 m will meet various planned demands at 100% success rate. Therefore, the Full Reservoir Level of Paikhed dam has been kept at 248.00 m. 7.2.1.4 Maximum Water Level (MWL)
Maximum water level of Paikhed reservoir has been kept as 249.00 m and the gates of spillway have been designed to pass design flood of 5307 Cumecs.
The Maximum Water Level at Paikhed dam has been fixed as 249.00 m. Various levels fixed at Paikhed Reservoir are given in Table - 7.11.
Table -7.11
Levels Fixed as per Simulation Study Paikhed Reservoir Elevation(m)
MWL 249.00 FRL 248.00 MDDL 190.00

455
7.2.1.5 Maximum Backwater Level at Full Reservoir Level and Maximum Water Level and its Effect, Points to Which Backwater Effect is Felt, Maximum Distance of Such Points from the Axis of the Structure
The Full Reservoir Level (FRL) and Maximum Water Level (MWL)
of the Paikhed dam have been fixed at 248.00 m and 249.00 m respectively. The maximum back water level at MWL is 249.00 m and the effect extends up to a distance of about 17.40 km from the axis of the dam (at the periphery of the reservoir) within which no structure of significant importance has been identified. 7.2.1.6 Saddles along the Reservoir Rim
The entire rim of proposed Paikhed reservoir is covered with the contours of value higher than the MWL as such no saddle is proposed along the rim of Paikhed reservoir.
7.2.1.7 Fetch
The fetch of the reservoir was determined to fix the free board and the top of the dam. The fetch computations were done as per the Indian Standards IS: 10635(Latest), “Guidelines for Free board requirements in Embankment Dams”.
7.2.1.8 Direction of Wind - Velocity of Wind - Wave Height - Free
Board-Top of Dam
The direction of wind in Paikhed reservoir area is mostly from east to west. The Nasik IMD station is located near to the Paikhed dam site. The maximum wind velocity of 13.2 km/hr is experienced in the month of June and the minimum wind velocity of 4.5 km/hr is experienced in the month of December. The average velocity of wind is 8.4 km/hr. However, a normal

456
wind velocity of 44 m/sec has been considered. The following factors are taken into consideration while computing the free board requirement:
(a) Wave characteristics i.e. wave height and wave length; (b) Upstream slope of the dam and roughness of the pitching; (c) Height of wind setup above the still water level.
The details of free board requirement for all the six dams are
furnished in para 6.1.5 of Chapter – 6: Design Aspects. The top of the rock-fill portion of the Paikhed dam has been fixed at 255 m. 7.2.2 Sedimentation Data and Studies
Sediment data is not available for Nar River on which Paikhed dam is
proposed. Currently no sediment observations are planned in the catchment area of Paikhed dam. However, the Government of Gujarat had carried out sedimentation survey of existing Madhuban reservoir on Damanganga River, which lies in the vicinity of the Link Project. Using this data the sedimentation rate at Paikhed dam site has been assessed. 7.2.2.1 Rate of Sedimentation with Basis
A sedimentation rate of 9.0 ham/100 sq.km/year has been adopted for
analysis of Paikhed reservoir. The basis for adopting the value has already been explained under Para 7.1.2.1 above. 7.2.2.2 Quantity of Sediment Considering the inflow sedimentation rate of 9.0 ham/100 km2/year the sediment volume at Paikhed reservoir will be as under.
i) 50 years sediment volume 13.571 MCM ii) 100 years sediment volume 27.115 MCM
7.2.2.3 Type and Shape of Reservoir

457
The Paikhed reservoir is considered as Flood plain-foot hill type and
the standard classification is taken as Type II. 7.2.2.4 Sediment Studies – Paikhed Reservoir
The sedimentation study has been carried out using “Empirical Area Reduction” method. 7.2.2.5 Sediment Distribution
The sediment distribution is worked out for two periods, viz. 50 years and 100 years by Empirical Area Reduction method. For this purpose, the FRL 248.00 m is adopted and bed level of the reservoir is considered as 163.14 m. The original Elevation-Area-Capacity table for Paikhed reservoir is given in Table-7.12:
Table-7.12 Original Elevation-Area-Capacity Table for Paikhed Reservoir
Elevation
(m) Area (ha)
Capacity (MCM)
248.00 993.57 229.53 245.00 890.19 201.28 242.00 781.20 176.23 239.00 684.19 154.27 236.00 602.75 134.97 233.00 528.40 118.02 230.00 459.89 104.06 227.00 414.53 90.10 224.00 368.02 78.36 221.00 317.73 68.09 218.00 281.97 59.10 215.00 253.51 51.07 212.00 227.80 43.85 209.00 203.43 37.39
206.00 180.36 31.63 203.00 156.08 26.59

458
Elevation (m)
Area (ha)
Capacity (MCM)
200.00 132.30 22.27 198.00 122.90 19.72 196.00 115.06 17.34 194.00 105.63 15.13 192.00 97.75 13.10 190.00 90.17 11.22 188.00 83.04 9.49 186.00 76.19 7.90 184.00 68.74 6.45
182.00 60.81 5.16 180.00 53.38 4.01 179.00 49.74 3.50 178.00 46.24 3.02 177.00 42.86 2.57 176.00 39.61 2.16 175.00 36.49 1.78 174.00 31.15 1.44 173.00 26.22 1.16 172.00 21.72 0.92 171.50 19.69 0.81 171.00 17.65 0.72 170.50 15.82 0.64 170.00 13.99 0.56 169.00 12.40 0.43 168.00 10.91 0.31 167.00 9.51 0.21 166.00 8.21 0.12 165.00 7.00 0.05 164.51 4.43 0.02 164.50 4.38 0.02 164.00 1.75 0.01 163.14 0.00 0.00
The total sediment during 50 and 100 years will get distributed up to and above various elevations as given in the Table-7.13 below:

459
Table-7.13
Distribution of Total Sediment at Various Elevations of Paikhed Dam Reservoir Level Sediment Deposition in MCM
After 50 Years After 100 Years Up to 164.34 m 0.02 0.02 Above 164.34 m 13.64 27.08 Up to 172.00 m 0.60 0.92 Above 172.00 m 13.06 26.18 Up to 192.00 m 3.64 7.00 Above 192.00 m 10.02 20.10
The new zero elevation will be as follows:
After 50 years = 164.34 m After 100 years = 171.88 m
The Minimum Draw Down Level (MDDL) can be fixed anywhere above 171.88 m which is the new zero elevation after 100 years of operation of the reservoir. The plots of revised elevation-area-capacity curve for 50-Year sedimentation and 100 year sedimentation are given in Figure – 7.3 and 7.4 respectively. Original and revised (after 50 and 100 years) Elevation-Area-Capacity details for Paikhed reservoir are given in Table-7.14 below:
Table-7.14
Original and Revised (after 50 and 100 years) Elevation – Area - Capacity Table for Paikhed Reservoir
Elevation Original Area
Original Capacity
Revised Area
After 50 Years
Revised Capacity After 50
Years
Revised Area
After 100 Years
Revised Capacity After 100
Years (m) (ha) (MCM) (ha) (MCM) (ha) (MCM)
248.00 993.57 229.53 993.57 215.87 993.57 202.43 245.00 890.19 201.28 880.13 187.73 870.02 174.39 242.00 781.20 176.23 768.11 163.02 754.97 150.03 239.00 684.19 154.27 669.07 141.48 653.89 128.92 236.00 602.75 134.97 586.13 122.66 569.43 110.58 233.00 528.40 118.02 510.61 106.22 492.75 94.66

460
Elevation Original Area
Original Capacity
Revised Area
After 50 Years
Revised Capacity After 50
Years
Revised Area
After 100 Years
Revised Capacity After 100
Years (m) (ha) (MCM) (ha) (MCM) (ha) (MCM)
230.00 459.89 104.06 441.20 91.96 422.42 80.94 227.00 414.53 90.10 395.13 79.42 375.65 68.98 224.00 368.02 78.36 348.08 68.28 328.06 58.43 221.00 317.73 68.09 297.40 58.61 276.99 49.36 218.00 281.97 59.10 261.38 50.23 240.70 41.60 215.00 253.51 51.07 232.77 42.82 211.95 34.82 212.00 227.80 43.85 207.03 36.23 186.17 28.85 209.00 203.43 37.39 182.73 30.38 161.94 23.63
206.00 180.36 31.63 159.83 25.25 139.21 19.12 203.00 156.08 26.59 135.81 20.82 115.46 15.30 200.00 132.30 22.27 112.40 17.10 92.41 12.19 198.00 122.90 19.72 103.29 14.94 83.61 10.43 196.00 115.06 17.34 95.80 12.95 76.45 8.83 194.00 105.63 15.13 86.75 11.13 67.80 7.38 192.00 97.75 13.10 79.31 9.47 60.79 6.10 190.00 90.17 11.22 72.21 7.95 54.18 4.95 188.00 83.04 9.49 65.62 6.58 48.12 3.93 186.00 76.19 7.90 59.35 5.33 42.45 3.02 184.00 68.74 6.45 52.55 4.21 36.29 2.24 182.00 60.81 5.16 45.33 3.23 29.79 1.58 180.00 53.38 4.01 38.68 2.39 23.92 1.04 179.00 49.74 3.50 35.46 2.02 21.12 0.81 178.00 46.24 3.02 32.40 1.68 18.50 0.62 177.00 42.86 2.57 29.48 1.37 16.04 0.44 176.00 39.61 2.16 26.71 1.09 13.76 0.29 175.00 36.49 1.78 24.11 0.84 11.67 0.17 174.00 31.15 1.44 19.31 0.62 7.41 0.07 173.00 26.22 1.16 14.95 0.45 3.63 0.02 172.00 21.72 0.92 11.06 0.32 0.00 0.00 171.50 19.69 0.81 9.34 0.27 0.00 0.00 171.00 17.65 0.72 7.64 0.23 0.00 0.00 170.50 15.82 0.64 6.15 0.19 0.00 0.00

461
Elevation Original Area
Original Capacity
Revised Area
After 50 Years
Revised Capacity After 50
Years
Revised Area
After 100 Years
Revised Capacity After 100
Years (m) (ha) (MCM) (ha) (MCM) (ha) (MCM)
170.00 13.99 0.56 4.68 0.16 0.00 0.00 169.00 12.40 0.43 3.84 0.12 0.00 0.00 168.00 10.91 0.31 3.18 0.09 0.00 0.00 167.00 9.51 0.21 2.69 0.06 0.00 0.00 166.00 8.21 0.12 2.44 0.03 0.00 0.00 165.00 7.00 0.05 2.46 0.01 0.00 0.00 164.51 4.43 0.02 0.60 0.00 0.00 0.00 164.50 4.38 0.02 0.57 0.00 0.00 0.00 164.00 1.75 0.01 0.11 0.00 0.00 0.00 163.14 0.00 0.00 0.00 0.00 0.00 0.00
7.2.3 Life of Reservoir in Years with Basis All the outlets from the reservoir are fixed at an elevation above the New Zero Elevation estimated after considering 100 years of sedimentation. Therefore, the life of the Paikhed reservoir has been considered as 100 years. 7.2.4 Capacity 7.2.4.1 Capacities of Paikhed Reservoir S No.
Capacity (MCM) Initial After 50
Years After 100
Years 1 Gross storage capacity 229.53 215.87 202.43 2 Live storage capacity 218.30 207.92 197.48 3 Storage capacity at MDDL 11.23 7.95 4.95 4 Dead storage capacity (at
DSL) 0.92 0.32 0.00
7.2.4.2 Storage

462
Simulation analysis considering the inflow and various water demands to be met from Paikhed reservoir has been carried out. Based on the simulation analysis the live storage has been provided so that the demand of water for various requirements could be met. The dead storage has been provided so that the functioning of the project would not be affected even after accumulation of silt over a period of 100 years. Various storage details of the proposed Paikhed reservoir have been mentioned in the Para 7.2.4.1 above.
The monthly minimum storages reserved in Paikhed reservoir for meeting the water demands towards evaporation losses, environmental and domestic needs to achieve intended success rates are given in Table-7.15 below:
Table-7.15 Monthly Minimum Storages Reserved in Paikhed Reservoir for
Meeting Evaporation Losses, Environmental and Domestic Needs
Unit: MCM
Jun Jul Aug Sept Oct Nov Dec Jan Feb March April May 2 2 2 3 12 10 8 8 6 6 4 3
The monthly inflow series and monthly diversion requirements considered for simulation analysis of Paikhed reservoir for fixing its live storage are furnished in Appendix 5.5 in Volume – IV. 7.2.4.3 Water Tightness of the Reservoir
DPR stage Geotechnical investigations were carried out at Paikhed dam site by Engineering Geology Division, Western Region, GSI, Jaipur during the field season 2009-10. A total of 12 number of exploratory bore holes have been drilled in the different sections of the proposed dam site at Paikhed. The bore hole core logging aggregating a total length of 622.95 m has been carried out. Basalts of the Deccan trap forms the foundation rock at the project area. The rocks have horizontal to sub horizontal dips. The water percolation test results of these bore holes indicate that the strata in general have low permeability but higher values of equivalent permeability up to 15 lugeons has been worked out in one section of bore hole number 9.

463
In the left abutment and NOF from R.D. 0 to R.D.180, no bore hole has been drilled. Additional bore holes should be drilled in this section to know the suitable foundation grade. Since the rocks in the area have a horizontal to sub horizontal disposition, there may be the need of consolidation grouting / anchoring, which may be decided after the excavation has been done.
The reservoir appears to be water tight. The report of GSI is at Appendix – 4.5 in Volume – III. 7.2.4.4 Annual Losses
The simulation study carried out for Paikhed reservoir for the period from 1975 to 2006 indicates that the annual average evaporation loss from Paikhed reservoir is 6.8 MCM with highest evaporation loss as 8.5 MCM during the year 1976 and the lowest evaporation loss as 4.2 MCM during the year 1995. Maximum Monthly evaporation loss is in December month and least Monthly evaporation loss is in June. 7.2.4.5 Flood Absorption
No flood storage is earmarked for this project. However, from reservoir routing it is seen that the maximum water level attained was 249.00 m and the maximum outflow discharge was 5226 Cumec. 7.2.5 Effects on Sub Soil Water Table in the Adjoining Areas
Particularly Downstream of the Dam
The sub-soil water table will improve due to the impoundment of water in the Paikhed reservoir. In addition, the regulated flows from the Paikhed dam into Nar River to meet environmental needs will increase the sub soil water level in the adjoining areas even during lean season. 7.2.6 Reservoir Rim Stability The detailed geological mapping to analyze the problems of reservoir stability and reservoir competency with respect to seepage/leakage of the

464
proposed Paikhed reservoir could not be carried out due to public hindrance either during FR stage or DPR stage. However, in order to evaluate the sub-surface rock/over burden conditions of the Paikhed dam site has been explored by 12 numbers of NX size bore holes. The bore hole cores have been logged and their data was analysed to find out foundation grade levels and water tightness of bed rock as well as to ascertain the soil structure and its permeability characteristics. However, no reservoir rim stability problems are anticipated in view of the type of rock formation present at the periphery of the submergence area. 7.2.7 Area of Submergence 7.2.7.1 At Maximum Water Level
Area of submergence of Paikhed reservoir at MWL is 1089 ha.
7.2.7.2 At Full Reservoir Level
Area of submergence of Paikhed reservoir at FRL is 994 ha. 7.2.7.3 Submergence Ratio - Submerged (Cultivated) Area/CCA
The Paikhed reservoir is a part of net-work of 6 reservoirs proposed under Par-Tapi-Narmada Link Project for diversion of surplus waters of Par, Auranga, Ambica and Purna rivers for en-route irrigation and to take-over part command of Narmada Main Canal. The total submergence area (cultivated) under the six reservoirs is 2364 ha and the total CCA of the Link project is 232175 ha. Therefore, the Submergence Ratio works out to 0.0102. 7.2.8 Land Acquisition-Property Submerged-Rehabilitation 7.2.8.1 Land Acquisition
The land to be acquired is about 994 ha (forest land: 317 ha, cultivable land: 589 ha and other lands including river portion: 88 ha) that is coming under submergence of Paikhed reservoir.
7.2.8.2 Details of Property Submerged

465
Due to creation of Paikhed reservoir 11 villages will be affected. These
villages come under Dharampur taluka of Valsad district of Gujarat and Surgana taluka of Nasik district of Maharashtra. Total 331 households of these villages are likely to be affected. (ii) Details of Dislocation of Communication (Railways), Road(s), Right
of Way, Telegraph Lines etc.) as a result of the Project
No railway line is coming under the submergence area of Paikhed reservoir. Major road connecting Sidumber-Tutarkhed is passing through the Submergence area of Paikhed dam. No telegraph/ telephone line needs to be dislocated as a result of the project. (iii) Details of Valuable Mineral Deposits / Mines
The Engineering Geology Division of GSI, Jaipur vide Letter No. 171/G-
1/EG/WR/GSI08-09 dated 9th April, 2009 (Annexure – 4.3-- in Volume -II) informed that no significant minerals have been reported from the Paikhed reservoir area, except construction material and a few minor minerals like zeolites. (iii) Historic/Archaeological Monuments
As already mentioned under “Chapter – 4: Surveys and
Investigations-Para 4.2.1 Archaeological Survey”, no antiquarian archaeological remains have been noticed and none of the centrally protected monuments are located in the area likely to be submerged due to construction of Paikhed dam. 7.2.8.3 Rehabilitation of Project Affected People
The rehabilitation plan has already been detailed under Para 7.1.8.3 above.

466
7.2.9 Recreation Facilities
Following are the recreational facilities which are proposed to be developed.
• Development of parks/gardens in d/s of dam. • Development of Children parks in the township. • Development of Tourist spot with boating facilities • Development of Guest house, inspection bungalow and dormitory
accommodation.
These facilities will ensure tourism development in the area. 7.2.10 Pisciculture The submergence area of Paikhed reservoir is 994 ha and there is lot of scope for developing fisheries.
Considering the water spread area of Paikhed reservoir and the fish production rate indicated above, expected fish production in Paikhed reservoir will be about 50 tonnes per year which will increase the revenue from the project.
7.2.11 Need and Recommendation for Soil Conservation Measure in the Catchment
The chances of soil erosion, if any can be prevented/minimized by
adopting following measures:
• Step drain • Angle iron barbed wire fencing • Stone masonry • Check dams • Contour bunding • Development of nurseries • Plantation/ afforestation

467
• Pasture development • Social forestry Appropriate financial provisions have been provided for soil
conservation measures in the catchment area. 7.3. Chasmandva Reservoir 7.3.1. Fixation of Storage and Reservoir Levels - Approach–Criteria
The water availability studies at Jheri, Paikhed, Chasmandva,
Chikkar, Dabdar and Kelwan dam sites have been carried out by the Hydrological Studies Organisation, CWC, New Delhi as a part of “Hydrological Studies of Par-Tapi-Narmada Link Project”. The Gross and Net Annual Yields at Chasmandva dam site as per these studies are as given in Table: 7.16 below:
Table: 7.16 Gross and Net Annual Yields at Chasmandva Dam Site
S.No. Details Annual Yield (MCM) Gross Net
1 100% Dependable yield 41 37 2 75% Dependable yield 70 64 3 50% Dependable yield 91 85 4 Average yield 102 96
The net water availability at Chasmandva dam site has been worked
out after subtracting all the consumptive upstream utilizations planned by States. Regeneration from major and medium irrigation projects has been taken as 10 percent while the same has been ignored in case of minor irrigation projects. The regeneration from domestic and industrial uses has been considered as 80 percent of water diverted for the purpose. The net yield series generated at Chasmandva dam site for the period from 1975-76 to 2006-07 is at Annexure: 5.15 in Volume - II.
The reservoir simulation study has been carried out for estimating the live storage capacity of the reservoir that would provide the required yield at specified reliability. The discharge data is available for a period of 43 years from 1962 to 2004 at Amba G and D site maintained by Government of

468
Gujarat on Tan River, which is located d/s of Chasmandva dam site. Rainfall – Runoff model has been developed using discharge data available at Amba G and D site and rainfall for the concurrent period. The flow data of inconsistent years have been discarded while developing Rainfall-Runoff model. Using this Rainfall – Runoff model the gross yield series for the period from 1975-76 to 2006-07 at Chasmandva dam site has been developed. The net yield series at the dam site has been generated by subtracting the net upstream consumptive use from the gross yield series and used for simulation analysis.
The simulation analysis has been done using Simulation Program developed using c++. This programme also takes into account the different releases from Chasmandva reservoir: i) for local domestic and industrial water demand, ii) environmental and ecological requirements downstream of proposed dam site, and iii) downstream releases for further transfer to Par-Tapi-Narmada Link Canal. The result of this analysis is at Appendix 5.5 in Volume - IV which gives detailed output for the gross capacity of 83.63 MCM. 7.3.1.1 Dead Storage Level (DSL)
The dead storage capacity of the Chasmandva reservoir has been
fixed on the basis of the guidelines given in “Fixing the capacities of reservoirs – Methods, Part 2 Dead storage, IS 5477 (Part 2): 1994”.
The new zero elevation of the Chasmandva reservoir has been worked out as 171.75 m and 176.00 m after 50 years and 100 years respectively on the basis of sedimentation studies. The corresponding capacities at these levels as per the original Area - Capacity table come to 2.73 ha m and 36.54 ha m respectively. However, Dead Storage Level of the reservoir has been proposed as 176.00 m (corresponding original capacity of 36.54 ha m) and sluices are proposed to be provided above this level. The details of sedimentation studies are furnished in Appendix 5.2 in Volume – IV. 7.3.1.2 Low Water Level /Minimum Draw-Down Level (MDDL)

469
The Minimum Draw Down Level (MDDL) of Chasmandva reservoir can be fixed anywhere above 176 m which is the new zero elevation after 100 years of operation of the reservoir, based on sedimentation studies carried out by Hydrological Studies Organisation, CWC, New Delhi. Keeping in view the live storage requirement for meeting the Link Canal demands and power generation, the MDDL of Chasmandva reservoir is kept at 190.00 m.
7.3.1.3 Full Reservoir Level (FRL)
Integrated simulation studies carried out for Jheri, Paikhed, Chasmandva, Chikkar, Dabdar and Kelwan reservoirs indicate that the proposed Chasmandva reservoir with Full Reservoir Level at 214.00 m will meet various planned demands at 100% success rate. Therefore, the Full Reservoir Level of Chasmandva dam has been kept at 214.00 m. 7.3.1.4 Maximum Water Level (MWL)
Maximum Water Level of Chasmandva reservoir has been kept as 215.0 m and the gates of spillway have been designed to pass design flood of 2578 Cumec.
The Maximum Water Level at Chasmandva dam has been fixed as 215.0 m. Various levels fixed at Chasmandva Reservoir are given in Table - 7.17.
Table -7.17 Levels Fixed as per Simulation Study
Chasmandva Reservoir Elevation(m)
MWL 215.00 FRL 214.00 MDDL 190.00
7.3.1.5 Maximum Backwater Level at Full Reservoir Level and
Maximum Water Level and its Effect, Points to Which Backwater Effect is Felt, Maximum Distance of Such Points from the Axis of the Structure

470
The Full Reservoir Level (FRL) and Maximum Water Level (MWL) of the Chasmandva dam have been fixed at 214.00 m and 215.0 m respectively. The maximum back water level at MWL is 215.0 m and the effect extends up to a distance of about 6 km from the axis of the dam (at the periphery of the reservoir) within which no structure of significant importance has been identified.
7.3.1.6 Saddle along the Reservoir Rim
The entire rim of proposed Chasmandva reservoir is covered with the contours of value higher than the MWL as such no saddle is proposed along the rim of Chasmandva reservoir.
7.3.1.7 Fetch
The fetch of the reservoir was determined to fix the free board and the top of the dam. The fetch computations were done as per the Indian Standards IS: 10635(Latest), “Guidelines for Free board requirements in Embankment Dams”.
7.3.1.8 Direction of Wind - Velocity of Wind - Wave Height - Free Board-Top of Dam
The direction of wind in Chasmandva reservoir area is mostly from
east to west. The Nasik IMD station is located near to the Chasmandva dam site. The maximum wind velocity of 13.2 km/hr is experienced in the month of June and the minimum wind velocity of 4.5 km/hr is experienced in the month of December. The average velocity of wind is 8.4 km/hr. However, a normal wind velocity of 44 m/sec has been considered. The following factors are taken into consideration while computing the free board requirement:
(a) Wave characteristics i.e. wave height and wave length;

471
(b) Upstream slope of the dam and roughness of the pitching; (c) Height of wind setup above the still water level.
The details of free board requirement for all the six dams are
furnished in para 6.1.5 of Chapter – 6: Design Aspects. The top of the rock-fill portion of the Chasmandva dam has been fixed at 222 m.
7.3.2 Sedimentation Data and Studies
Sediment load observations are being carried out by Government of Gujarat at Amba GandD site located on Tan River (a tributary of Auranga River) downstream of Chasmandva dam site. The annual suspended sediment load observed at the GandD site was 0.3831 mm/year/km2 (Average of sediment flow observed from 1983 to 1992) and the total sediment load including the bed load would be 0.4406 mm/year/km2. The sedimentation rate observed at the GandD site is much lower than the siltation rate recommended for the region in the “compendium of Silting of Reservoirs in India” prepared by CWC. This may be due to less developmental activities in the catchment area of the dam at present.
7.3.2.1 Rate of Sedimentation with Basis
A sedimentation rate of 9.0 ham/100 sq.km/year has been adopted for analysis of Chasmandva reservoir. The basis for adopting the value has already been explained under Para 7.1.2.1 above.
7.3.2.2 Quantity of Sediment
Considering the inflow sedimentation rate of 9.0 ham/100 km2/year the sediment volume at Chasmandva reservoir will be as under:
i) 50 years sediment volume 3.883 MCM ii) 100 years sediment volume 7.762 MCM
7.3.2.3 Type and Shape of Reservoir
The Chasmandva reservoir is considered as Flood plain-foot hill type and the standard classification is taken as Type II.

472
7.3.2.4 Sediment Studies – Chasmandva Reservoir
The sedimentation study has been carried out using “Empirical Area Reduction” method.
7.3.2.5 Sediment Distribution
The sediment distribution is worked out for two periods, viz. 50 years and 100 years by Empirical Area Reduction method. For this purpose, the FRL 214.00 m is adopted and bed level of the reservoir is considered as 170.00 m. The original Elevation-Area-Capacity table for Chasmandva reservoir is given in Table-7.18.
Table-7.18
Original Elevation-Area-Capacity Table for Chasmandva Reservoir Elevation
(m) Area( ha) Capacity
(MCM) 214.00 615.00 83.63 211.00 534.00 66.41 209.00 480.00 56.27 208.00 454.50 51.60 205.00 375.00 39.18 202.00 285.00 29.31 199.00 212.00 21.88 196.00 173.00 16.12 193.00 138.80 11.45 190.00 107.00 7.77 188.00 90.20 5.80 186.00 66.40 4.24 184.00 58.00 3.00 182.00 44.00 1.98 181.00 37.00 1.58 180.00 30.00 1.24 179.00 26.00 0.96 178.00 22.00 0.72 177.00 18.00 0.52 176.00 14.00 0.36 175.00 10.00 0.25 173.00 6.00 0.09

473
Elevation (m)
Area( ha) Capacity (MCM)
172.05 4.09 0.04 172.00 4.00 0.04 171.00 2.00 0.01 170.00 0.00 0.00
[[ The total sediment during 50 and 100 years will get distributed up to
and above various elevations as given in the Table-7.19 below. Table-7.19
Distribution of Total Sediment at Various Elevations of Chasmandva Dam
Reservoir Level Sediment Deposition in MCM After 50 Years After 100 Years Up to 171.75 m 0.027 0.038 Above 171.75 m 3.827 7.784 Up to 176.00 m 0.252 0.367 Above 176.00 m 3.602 7.455 Up to 190.00 m 1.572 3.099 Above 190.00 m 2.282 4.723
The new zero elevation will be as follows:
After 50 years = 171.75 m After 100 years = 176.00 m
The Minimum Draw Down Level (MDDL) can be fixed anywhere above 176.00 m which is the new zero elevation after 100 years of operation of the reservoir. The plots of revised elevation-area-capacity curve for 50-Year sedimentation and 100 year sedimentation are given in Figure – 7.5 and 7.6 respectively: Original and revised (after 50 and 100 years) Elevation-Area-Capacity details for Chasmandva reservoir are given in Table-7.20 below:
Table-7.20
Original and Revised (after 50 and 100 years) Elevation – Area - Capacity Table for Chasmandva Reservoir

474
Elevation Original
Area Original Capacity
Revised Area
After 50 Years
Revised Capacity After 50
Years
Revised Area
After 100 Years
Revised Capacity After 100
Years (m) (ha) (MCM) (ha) (MCM) (ha) (MCM)
214.00 615.00 83.63 615.00 79.78 615.00 75.81 211.00 534.00 66.41 526.86 62.63 519.22 58.74 209.00 480.00 56.27 471.44 52.65 462.28 48.93 208.00 454.50 51.60 445.41 48.06 435.69 44.44 205.00 375.00 39.18 364.76 35.93 353.81 32.61 202.00 285.00 29.31 274.05 26.38 262.34 23.40 199.00 212.00 21.88 200.66 19.29 188.52 16.67 196.00 173.00 16.12 161.51 13.86 149.23 11.61 193.00 138.00 11.45 127.39 9.54 115.19 7.65 190.00 107.00 7.77 95.87 6.20 83.97 4.68 188.00 90.20 5.80 79.37 4.45 67.79 3.16 186.00 66.40 4.24 55.96 3.10 44.80 2.04 184.00 58.00 3.00 48.05 2.06 37.40 1.22 182.00 44.00 1.98 34.64 1.24 24.63 0.60 181.00 37.00 1.58 27.98 0.93 18.33 0.39 180.00 30.00 1.24 21.35 0.68 12.10 0.24 179.00 26.00 0.96 17.76 0.49 8.94 0.13 178.00 22.00 0.72 14.21 0.33 5.87 0.06 177.00 18.00 0.52 10.70 0.20 2.88 0.01 176.00 14.00 0.36 7.24 0.11 0.00 0.00 175.00 10.00 0.25 3.84 0.06 0.00 0.00 174.00 8.00 0.16 2.52 0.03 0.00 0.00 173.00 6.00 0.09 1.30 0.01 0.00 0.00 172.05 4.09 0.04 0.28 0.00 0.00 0.00 172.00 4.00 0.04 0.23 0.00 0.00 0.00 171.00 2.00 0.01 0.00 0.00 0.00 0.00 170.00 0.00 0.00 0.00 0.00 0.00 0.00
7.3.3 Life of Reservoir in Years with Basis

475
All the outlets from the reservoir are fixed at an elevation above the New Zero Elevation estimated after considering 100 years of sedimentation. Therefore, the life of the Chasmandva reservoir has been considered as 100 years. 7.3.4 Capacity 7.3.4.1 Capacities of Chasmandva Reservoir S No.
Capacity (MCM) Initial After 50
Years After 100
Years 1 Gross storage capacity 83.63 79.78 75.81 2 Live storage capacity 75.86 73.58 71.13 3 Storage capacity at MDDL 7.77 6.20 4.68 4 Dead storage capacity (at
DSL) 0.36 0.11 0.00
7.3.4.2 Storage
Simulation analysis considering the inflow and various water demands to be met from Chasmandva reservoir has been carried out. Based on the simulation analysis the live storage has been provided so that the demand of water for various requirements could be met. The dead storage has been provided so that the functioning of the project would not be affected even after accumulation of silt over a period of 100 years. Various storage details of the proposed Chasmandva reservoir have been mentioned in the Para 7.3.4.1 above.
The monthly minimum storages reserved in Chasmandva reservoir for meeting the water demands towards evaporation losses, environmental and domestic needs to achieve intended success rates are given in Table-7.21 below.
Table-7.21 Monthly Minimum Storages Reserved in Chasmandva Reservoir for
Meeting Evaporation Losses, Environmental and Domestic Needs
Unit: MCM Jun Jul Aug Sept Oct Nov Dec Jan Feb March April May

476
2 2 2 2 2 8 7 6 5 4 3 2
The monthly inflow series and monthly diversion requirements considered for simulation analysis of Chasmandva reservoir for fixing its live storage are furnished in Appendix 5.5 in Volume – III. 7.3.4.3 Water Tightness of the Reservoir
DPR stage Geotechnical investigations were carried out at Chasmandva dam site by Engineering Geology Division, Western Region, GSI, Jaipur during the field season 2009-10. A total of 19 number of exploratory bore holes have been drilled in the different sections of the proposed dam site at Chasmandva. The bore hole core logging aggregating a total length of 413.75 m has been carried out. These exploratory bore holes were drilled along the different sections of the proposed dam to know the sub surface geological conditions at the dam site. The basaltic flows of Deccan Trap form the foundation rock at the dam site. The rock has horizontal to sub horizontal disposition. The water percolation test results of these bore holes indicate that permeability of the rock strata is low. But certain sections in bore hole numbers 7, 8, 9, and 11 have higher values of equivalent permeability. The depth of permeable strata established by the bore holes need to be plugged by grouting between R.D.1280 m to R.D.1780 m (B.H.No.7 to B.H.No.11).
The reservoir appears to be water tight. The report of GSI is at Appendix – 4.5 in Volume – III. Also the periphery of the proposed Chasmandva reservoir is covered with the contours of value higher than the MWL. 7.3.4.4 Annual Losses
The simulation study carried out for Chasmandva reservoir for the period from 1975 to 2006 indicates that the annual average evaporation loss from Chasmandva reservoir is 3.1 MCM with highest evaporation loss as 4.0 MCM during the year 1975 and the lowest evaporation loss as 2.0 MCM during the year 1987. Maximum Monthly evaporation loss is in October month and least Monthly evaporation loss is in June/December.

477
7.3.4.5 Flood Absorption
No flood storage is earmarked for this project. However, from reservoir routing it is seen that the maximum water level attained was 215.0 m and the maximum outflow discharge was 3044 Cumec. 7.3.5 Effects on Sub Soil Water Table in the Adjoining Areas
Particularly Downstream of the Dam
The sub-soil water table will improve due to the impoundment of water in the Chasmandva reservoir. In addition, the regulated flows from the Chasmandva dam into Tan River to meet environmental needs will increase the sub soil water level in the adjoining areas even during lean season. 7.3.6 Reservoir Rim Stability
The detailed geological mapping to analyze the problems of reservoir stability and reservoir competency with respect to seepage/leakage of the proposed Chasmandva reservoir could not be carried out due to public hindrance during DPR stage. However, based on type of rock formations observed at the periphery of the reservoir, no reservoir rim stability problems are expected.
7.3.7 Area of Submergence 7.3.7.1 At Maximum Water Level Area of submergence of Chasmandva reservoir at MWL is 629 ha.
7.3.7.2 At Full Reservoir Level
Area of submergence of Chasmandva reservoir at FRL is 615 ha. 7.3.7.3 Submergence Ratio - Submerged (Cultivated) Area/CCA

478
The Chasmandva reservoir is a part of net-work of 6 reservoirs proposed under Par-Tapi-Narmada Link Project for diversion of surplus waters of Par, Auranga, Ambica and Purna rivers for en-route irrigation and to take-over part command of Narmada Main Canal. The total submergence area (cultivated) under the six reservoirs is 2364 ha and the total CCA of the Link project is 232175 ha. Therefore, the Submergence Ratio works out to 0.0102.
7.3.8 Land Acquisition-Property Submerged-Rehabilitation 7.3.8.1 Land Acquisition
The land to be acquired is about 615 ha (forest land: 300 ha, cultivable land: 255 ha and other lands including river portion: 60 ha) that is coming under submergence of Chasmandva reservoir.
7.3.8.2 Details of Property Submerged
Due to creation of Chasmandva reservoir 7 villages will be affected. These villages come under Dharampur taluka of Valsad district and Vansda taluka of Navsari district of Gujarat and Surgana taluka of Nasik district of Maharashtra. Total 379 households of these villages are likely to be affected.
(i) Details of Dislocation of Communication (Railways), Road(s), Right of Way, Telegraph Lines etc.) as a Result of the Project
No railway line is coming under the submergence area of Chasmandva reservoir. No major road is coming under Submergence area of Chasmandva dam. No telegraph/ telephone line needs to be dislocated as a result of the project.
(ii) Details of Valuable Mineral Deposits / Mines The Engineering Geology Division of GSI, Jaipur vide Letter No.
171/G-1/EG/WR/GSI08-09 dated 9th April, 2009 (Annexure – 4.3 in

479
Volume -II) informed that no significant minerals have been reported from the Chasmandva reservoir area, except construction material and a few minor minerals like zeolites. (iii) Historic/Archaeological Monuments
As already mentioned under “Chapter – 4: Surveys and
Investigations-Para 4.2.1 Archaeological Survey”, no antiquarian archaeological remains have been noticed and none of the centrally protected monuments are located in the area likely to be submerged due to construction of Chasmandva dam.
7.3.8.3 Rehabilitation of Project Affected People
The rehabilitation plan has already been detailed under Para 7.1.8.3 above. 7.3.9 Recreation Facilities Following are the recreational facilities which are proposed to be developed.
• Development of parks/gardens in d/s of dam. • Development of Children parks in the township. • Development of Tourist spot with boating facilities • Development of Guest house, inspection bungalow and
dormitory accommodation.
These facilities will ensure tourism development in the area. 7.3.10 Pisciculture
The submergence area of Chasmandva reservoir is 615 ha and there is lot of scope for developing fisheries. Considering the water spread area of Chasmandva reservoir and the fish production rate indicated above, expected fish production in Chasmandva reservoir will be about 31 tonnes per year which will increase the revenue from the project.

480
7.3.11 Need and Recommendation for Soil Conservation Measure in the Catchment
The chances of soil erosion, if any can be prevented/minimized by
adopting following measures:
• Step drain • Angle iron barbed wire fencing • Stone masonry • Check dams • Contour bunding • Development of nurseries • Plantation/ afforestation • Pasture development • Social forestry
Appropriate financial provisions have been provided for soil
conservation measures in the catchment area. 7.4. Chikkar Reservoir 7.4.1. Fixation of Storage and Reservoir Levels - Approach–Criteria
The water availability studies at Jheri, Paikhed, Chasmandva,
Chikkar, Dabdar and Kelwan dam sites have been carried out by the Hydrological Studies Organisation, CWC, New Delhi as a part of “Hydrological Studies of Par-Tapi-Narmada Link Project”. The Gross and Net Annual Yields at Chikkar dam site as per these studies are as given in Table: 7.22 below.
Table: 7.22 Gross and Net Annual Yields at Chikkar Dam Site
S.No. Details Annual Yield (MCM) Gross Net
1 100% Dependable yield 139 107 2 75% Dependable yield 220 170 3 50% Dependable yield 257 206 4 Average yield 304 255

481
The net water availability at Chikkar dam site has been worked out after subtracting all the consumptive upstream utilizations planned by States. Regeneration from major and medium irrigation projects has been taken as 10 percent while the same has been ignored in case of minor irrigation projects. The regeneration from domestic and industrial uses has been considered as 80 percent of water diverted for the purpose. The net yield series generated at Chikkar dam site for the period from 1975-76 to 2006-07 is at Annexure: 5.16 in Volume - II.
The reservoir simulation study has been carried out for estimating the live storage capacity of the reservoir that would provide the required yield at specified reliability. The discharge data is available for a period of 27 years from 1980 to 2006 at Kudkas G and D site maintained by Government of Gujarat on Khapri River (tributary of Ambica river), which is located U/s of Dabdar dam site. Rainfall – Runoff model has been developed using discharge data available at Kudkas G and D site and rainfall for the concurrent period. Using this Rainfall – Runoff model the gross yield series for the period from 1975-76 to 2006-07 at Chikkar dam site has been developed. The net yield series at the dam site has been generated by subtracting the net upstream consumptive use from the gross yield series and used for simulation analysis.
The simulation analysis has been done using Simulation Program developed using c++. This programme also takes into account the different releases from Chikkar reservoir: i) for local domestic and industrial water demand, ii) environmental and ecological requirements downstream of proposed dam site, and iii) diversion to Dabdar reservoir through Feeder Canal for further transfer to Par-Tapi-Narmada Link Canal. The result of this analysis is at Appendix 5.5 in Volume - IV which gives detailed output for the gross capacity of 141.99 MCM.
7.4.1.1 Dead Storage Level (DSL)
The dead storage capacity of the Chikkar reservoir has been fixed on the basis of the guidelines given in “Fixing the capacities of reservoirs – Methods, Part 2 Dead storage, IS 5477 (Part 2): 1994”. The new zero elevation of the Chikkar reservoir has been worked out as 162.10 m and

482
169.30 m after 50 years and 100 years respectively on the basis of sedimentation studies. The corresponding capacities at these levels as per the original Area - Capacity table come to 64.64 ha m and 331.90 ha m respectively. However, Dead Storage Level of the reservoir has been proposed as 170.00 m (corresponding original capacity of 369.17 ha m) and sluices are proposed to be provided above this level. The details of sedimentation studies are furnished in Appendix 5.2 in Volume – IV. 7.4.1.2 Low Water Level /Minimum Draw-Down Level (MDDL)
The Minimum Draw Down Level (MDDL) of Chikkar reservoir can be fixed anywhere above 169.30 m which is the new zero elevation after 100 years of operation of the reservoir, based on sedimentation studies carried out by Hydrological Studies Organisation, CWC, New Delhi. Keeping in view the live storage requirement for meeting the Link Canal demands and power generation, the MDDL of Chikkar reservoir is kept at 179.00 m.
7.4.1.3 Full Reservoir Level (FRL)
Integrated simulation studies carried out for Jheri, Paikhed,
Chasmandva, Chikkar, Dabdar and Kelwan reservoirs indicate that the proposed Chikkar reservoir with Full Reservoir Level at 210.00 m will meet various planned demands at 100% success rate. Therefore, the Full Reservoir Level of Chikkar dam has been kept at 210.00 m. 7.4.1.4 Maximum Water Level (MWL) Maximum Water Level of Chikkar reservoir has been kept as 212.0 m and the gates of spillway have been designed to pass design flood of 5649 Cumec.
The Maximum Water Level at Chikkar dam has been fixed as 212.0 m. various levels fixed at Chikkar Reservoir are given in Table - 7.23.
Table -7.23
Levels Fixed as per Simulation Study

483
Chikkar Reservoir Elevation(m) MWL 212.0 FRL 210.00 MDDL 179.00
7.4.1.5 Maximum Backwater Level at Full Reservoir Level and
Maximum Water Level and its Effect, Points to Which Backwater Effect is Felt, Maximum Distance of Such Points from the Axis of the Structure
The Full Reservoir Level (FRL) and Maximum Water Level (MWL)
of the Chikkar dam have been fixed at 210.00 m and 212.0 m respectively. The maximum back water level at MWL is 212.0 m and the effect extends up to a distance of about 11 km from the axis of the dam (at the periphery of the reservoir) within which no structure of significant importance has been identified. 7.4.1.6 Saddle along the Reservoir Rim
The entire rim of proposed Chikkar reservoir is covered with the contours of value higher than the MWL as such no saddle is proposed along the rim of Chikkar reservoir. 7.4.1.7 Fetch
The fetch of the reservoir was determined to fix the free board and the top of the dam. The fetch computations were done as per the Indian Standards IS: 10635(Latest), “Guidelines for Free board requirements in Embankment Dams”. 7.4.1.8 Direction of Wind - Velocity of Wind - Wave Height - Free
Board-Top of Dam

484
The direction of wind in Chikkar reservoir area is mostly from east to west. The Nasik IMD station is located near to the Chikkar dam site. The maximum wind velocity of 13.2 km/hr is experienced in the month of June and the minimum wind velocity of 4.5 km/hr is experienced in the month of December. The average velocity of wind is 8.4 km/hr. However, a normal wind velocity of 44 m/sec has been considered. The following factors are taken into consideration while computing the free board requirement:
(a) Wave characteristics i.e. wave height and wave length; (b) Upstream slope of the dam and roughness of the pitching; (c) Height of wind setup above the still water level.
The details of free board requirement for all the six dams are
furnished in para 6.1.5 of Chapter – 6: Design Aspects. The top of the rock-fill portion of the Chikkar dam has been fixed at 217 m. 7.4.2 Sedimentation Data and Studies
Sediment load observations are being carried out by CWC at Gadat GandD site located on Ambica River downstream of Chikkar dam site. The annual suspended sediment load observed at the GandD site was 0.2443 mm/year/km2 (Average of sediment flow observed from 1985 to 1993) and the total sediment load including the bed load would be 0.2810 mm/year/km2. The sedimentation rate observed at the GandD site is much lower than the siltation rate recommended for the region in the “Compendium of Silting of Reservoirs in India” prepared by CWC. This may be due to less developmental activities in the catchment area of the dam at present. 7.4.2.1 Rate of Sedimentation with Basis
A sedimentation rate of 9.0 ham/100 sq.km/year has been adopted for analysis of Chikkar reservoir. The basis for adopting the value has already been explained under Para 7.1.2.1 above. 7.4.2.2 Quantity of Sediment
Considering the inflow sedimentation rate of 9.0 ham/100 km2/year the sediment volume at Chikkar reservoir will be as under.

485
i) 50 years sediment volume 13.040 MCM ii) 100 years sediment volume 26.034 MCM
7.4.2.3 Type and Shape of Reservoir
The Chikkar reservoir is considered as Flood plain-foot hill type and the standard classification is taken as Type II. 7.4.2.4 Sediment Studies – Chikkar Reservoir
The sedimentation study has been carried out using “Empirical Area Reduction” method. 7.4.2.5 Sediment Distribution
The sediment distribution is worked out for two periods, viz. 50 years and 100 years by Empirical Area Reduction method. For this purpose, the FRL 210.00 m is adopted and bed level of the reservoir is considered as 152.43 m. The original Elevation-Area-Capacity table for Chikkar reservoir is given in Table-7.24.
Table-7.24 Original Elevation-Area-Capacity Table
for Chikkar Reservoir
Elevation (m)
Area ( ha)
Capacity (MCM)
210.00 741.83 141.99
208.00 711.10 127.46
205.00 666.23 106.81
202.00 589.18 87.99
199.00 510.38 71.51
196.00 425.33 57.49
193.00 354.84 45.81
190.00 298.85 36.01
187.00 241.81 27.92
184.00 197.05 21.35
181.00 160.87 15.99
179.00 142.03 12.96

486
Elevation (m)
Area ( ha)
Capacity (MCM)
176.00 120.43 9.03
173.00 89.40 5.89 170.00 58.50 3.69 168.00 47.79 2.63 166.00 38.16 1.77 164.00 28.59 1.11 163.00 24.08 0.84 162.50 21.82 0.73 162.46 21.62 0.72 162.00 19.56 0.62 160.00 12.23 0.31 159.00 9.22 0.20 158.00 6.63 0.12 157.50 5.55 0.09 157.00 4.46 0.07 156.50 3.59 0.05 156.00 2.72 0.03 155.00 1.41 0.01 154.00 0.53 0.00 152.43 0.00 0.00
The total sediment during 50 and 100 years will get distributed up to
and above various elevations as given in the Table-7.25 below.
Table-7.25 Distribution of Total Sediment at Various Elevations of Chikkar Dam Reservoir Level Sediment Deposition in MCM
After 50 Years After 100 Years Up to 162.10 m 0.646 0.646 Above 162.10 m 12.397 25.181 Up to 170.00 m 2.489 3.445 Above 170.00 m 10.554 22.482 Up to 179.00 m 5.025 8.746 Above 179.00 m 8.018 17.081

487
The new zero elevation will be as follows: After 50 years = 162.10 m After 100 years = 169.30 m The Minimum Draw Ddown Level (MDDL) can be fixed anywhere above 169.30 m which is the new zero elevation after 100 years of operation of the reservoir. The plots of revised elevation-area-capacity curve for 50-Year sedimentation and 100 year sedimentation are given in Figure – 7.7 and 7.8 respectively. Figure 7.8: Revised Elevation-Area-Capacity Curve for Chikkar Dam after 100 years Original and revised (after 50 and 100 years) Elevation-Area-Capacity details for Chikkar reservoir are given in Table-7.26 below:
Table-7.26
Original and Revised (after 50 and 100 years) Elevation – Area - Capacity Table for Chikkar Reservoir
Elevation Original
Area Original Capacity
Revised Area
After 50 Years
Revised Capacity After 50
Years
Revised Area
After 100 Years
Revised Capacity After 100
Years (m) (ha) (MCM) (ha) (MCM) (ha) (MCM)
210.00 741.83 141.99 741.83 128.95 741.83 116.15 208.00 711.10 127.46 696.36 114.52 679.69 101.83 205.00 666.23 106.81 645.43 94.40 621.92 82.30 202.00 589.18 87.99 564.79 76.25 537.23 64.92 199.00 510.38 71.51 483.56 60.54 453.25 50.08 196.00 425.33 57.49 396.83 47.35 364.61 37.83 193.00 354.84 45.81 325.20 36.54 291.71 28.00 190.00 298.85 36.01 268.53 27.65 234.26 20.13 187.00 241.81 27.92 211.19 20.47 176.58 13.98 184.00 197.05 21.35 166.47 14.81 131.92 9.36 181.00 160.87 15.99 130.66 10.36 96.52 5.94 179.00 142.03 12.96 112.24 7.94 78.58 4.20

488
Elevation Original Area
Original Capacity
Revised Area
After 50 Years
Revised Capacity After 50
Years
Revised Area
After 100 Years
Revised Capacity After 100
Years (m) (ha) (MCM) (ha) (MCM) (ha) (MCM)
176.00 120.43 9.03 91.54 4.88 58.88 2.14 173.00 89.40 5.89 61.72 2.60 30.44 0.81 170.00 58.50 3.69 32.38 1.20 2.85 0.33 168.00 47.79 2.63 22.91 0.65 0.00 0.00 166.00 38.16 1.77 14.72 0.28 0.00 0.00 164.00 28.59 1.11 6.79 0.06 0.00 0.00 163.00 24.08 0.84 3.18 0.01 0.00 0.00 162.50 21.82 0.73 1.41 0.00 0.00 0.00 162.10 20.01 0.65 0.00 0.00 0.00 0.00 162.00 19.56 062 0.00 0.00 0.00 0.00 160.00 12.23 0.31 0.00 0.00 0.00 0.00 159.00 9.22 0.20 0.00 0.00 0.00 0.00 158.00 6.63 0.12 0.00 0.00 0.00 0.00 157.50 5.55 0.09 0.00 0.00 0.00 0.00 157.00 4.46 0.07 0.00 0.00 0.00 0.00 156.50 3.59 0.05 0.00 0.00 0.00 0.00 156.00 2.72 0.03 0.00 0.00 0.00 0.00 155.00 1.41 0.01 0.00 0.00 0.00 0.00 154.00 0.53 0.00 0.00 0.00 0.00 0.00 152.43 0.00 0.00 0.00 0.00 0.00 0.00
7.4.3 Life of Reservoir in Years with Basis All the outlets from the reservoir are fixed at an elevation above the New Zero Elevation estimated after considering 100 years of sedimentation. Therefore, the life of the Chikkar reservoir has been considered as 100 years. 7.4.4 Capacity 7.4.4.1 Capacities of Chikkar Reservoir S No.
Capacity (MCM) Initial After 50 After 100

489
Years Years 1 Gross storage capacity 141.99 128.95 116.15 2 Live storage capacity 129.03 121.01 111.95 3 Storage capacity at MDDL 12.96 7.94 4.20 4 Dead storage capacity (at
DSL) 3.69 1.20 0.33
7.4.4.2 Storage
Simulation analysis considering the inflow and various water demands to be met from Chikkar reservoir has been carried out. Based on the simulation analysis the live storage has been provided so that the demand of water for various requirements could be met. The dead storage has been provided so that the functioning of the project would not be affected even after accumulation of silt over a period of 100 years. Various storage details of the proposed Chikkar reservoir have been mentioned in the Para 7.4.4.1 above.
The monthly minimum storages reserved in Chikkar reservoir for meeting the water demands towards evaporation losses, environmental and domestic needs to achieve intended success rates are given in Table-7.27 below:
Table-7.27 Monthly Minimum Storages Reserved in Chikkar Reservoir for
Meeting Evaporation Losses, Environmental and Domestic Needs Unit:
MCM Jun Jul Aug Sept Oct Nov Dec Jan Feb March April May
1 1 1 1 1 8 7 6 5 4 3 2
The monthly inflow series and monthly diversion requirements considered for simulation analysis of Chikkar reservoir for fixing its live storage are furnished in Appendix 5.5 in Volume – IV. 7.4.4.3 Water Tightness of the Reservoir
Preliminary Geotechnical Investigations were carried out at the dam
site by GSI, Western Region, and Jaipur at Feasibility stage of Par-Tapi-

490
Narmada Link Project during 1993-94. As per these investigations the foundation rocks at the dam site are sub-horizontal sequence of lava flows of Deccan traps. The contacts zone between the successive lava flows are moderately to highly weathered and marked by presence of flow breccias, with predominance of amygdule. Hence, consolidated grouting shall be needed to make the strata monolithic and to improve their strength and imperviousness.
The report of GSI is at Appendix-4.8 in Volume-III. Also the
periphery of the proposed Chikkar reservoir is covered with the contours of value higher than the MWL.
7.4.4.4 Annual Losses
The simulation study carried out for Chikkar reservoir for the period from 1975 to 2006 indicates that the annual average evaporation loss from Chikkar reservoir is 6.4 MCM with highest evaporation loss as 6.9 MCM during the years 1994, 2003 and 2005 and the lowest evaporation loss as 4.5 MCM during the year 1987. Maximum Monthly evaporation loss is in December month and least Monthly evaporation loss is in June. 7.4.4.5 Flood Absorption
No flood storage is earmarked for this project. However, from reservoir routing it is seen that the maximum water level attained was 212.0 m and the maximum outflow discharge was 5226 Cumec. 7.4.5 Effects on Sub Soil Water Table in the Adjoining Areas
Particularly Downstream of the Dam
The sub-soil water table will improve due to the impoundment of water in the Chikkar reservoir. In addition, the regulated flows from the Chikkar dam into Ambica River to meet environmental needs will increase the sub soil water level in the adjoining areas even during lean season. 7.4.6 Reservoir Rim Stability

491
The detailed geological mapping to analyze the problems of reservoir
stability and reservoir competency with respect to seepage/leakage of the proposed Chikkar reservoir could not be carried out due to public hindrance during DPR stage. However, preliminary Geotechnical investigations were carried out at the dam site by GSI, Western Region, Jaipur at Feasibility stage of Par-Tapi-Narmada Link Project during 1993-94. The entire reservoir area is covered by the Deccan basalts with moderate relief. The rock type encountered is a sub horizontal sequence of lava flows. The reservoir rim is expected to be stable and may not pose any stability problems
The reservoir area appears to be water tight with no perceptible shear or fault zone criss- crossing the area.
7.4.7 Area of Submergence 7.4.7.1 At Maximum Water Level Area of submergence of Chikkar reservoir at MWL is 760 ha.
7.4.7.2 At Full Reservoir Level Area of submergence of Chikkar reservoir at FRL is 742 ha. 7.4.7.3 Submergence Ratio - Submerged (Cultivated) Area/CCA The Chikkar reservoir is a part of net-work of 6 reservoirs proposed under Par-Tapi-Narmada Link Project for diversion of surplus waters of Par, Auranga, Ambica and Purna rivers for en-route irrigation and to take-over part command of Narmada Main Canal. The total submergence area (cultivated) under the six reservoirs is 2364 ha and the total CCA of the Link project is 232175 ha. Therefore, the Submergence Ratio works out to 0.0102.
7.4.8 Land Acquisition-Property Submerged-Rehabilitation 7.4.8.1 Land Acquisition

492
The land to be acquired is about 742 ha (forest land: 300 ha, cultivable land: 332 ha and other lands including river portion: 110 ha) that is coming under submergence of Chikkar reservoir. 7.4.8.2 Details of Property Submerged
Due to creation of Chikkar reservoir 9 villages will be affected. These villages come under Ahwa taluka of The Dangs district of Gujarat. Total 345 households of these villages are likely to be affected.
(i) Details of Dislocation of Communication (Railways), Road(s),
Right of Way, Telegraph Lines etc.) as a result of the Project
No railway line is coming under the submergence area of Chikkar reservoir. The State Highway connecting Waghai and Saputara is coming under Submergence area of Chikkar dam. The power and telephone lines of about 10 km length connecting Baj-Lahen-Dabdar villages to be dislocated as a result of the project.
(ii) Details of Valuable Mineral Deposits / Mines The Engineering Geology Division of GSI, Jaipur vide Letter No.
171/G-1/EG/WR/GSI08-09 dated 9th April, 2009 (Annexure – 4.3 in Volume -II) informed that no significant minerals have been reported from the Chikkar reservoir area, except construction material and a few minor minerals like zeolites. (iii) Historic/Archaeological Monuments
As already mentioned under “Chapter – 4: Surveys and
Investigations-Para 4.2.1 Archaeological Survey”, no antiquarian archaeological remains have been noticed and none of the centrally protected monuments are located in the area likely to be submerged due to construction of Chikkar dam.

493
7.4.8.3 Rehabilitation of Project Affected People
The rehabilitation plan has already been detailed under Para 7.1.8.3 above. 7.4.9 Recreation Facilities Following are the recreational facilities which are proposed to be developed.
• Development of parks/gardens in d/s of dam. • Development of Children parks in the township. • Development of Tourist spot with boating facilities • Development of Guest house, inspection bungalow and
dormitory accommodation.
These facilities will ensure tourism development in the area. The water-fall located just downstream of the dam site further enhances the tourism potential. 7.4.10 Pisciculture The submergence area of Chikkar reservoir is 742 ha and there is lot of scope for developing fisheries.
Considering the water spread area of Chikkar reservoir and the fish production rate indicated above, expected fish production in Chikkar reservoir will be about 37 tonnes per year which will increase the revenue from the project. 7.4.11 Need and Recommendation for Soil Conservation Measure
in the Catchment The chances of soil erosion, if any can be prevented/minimized by adopting following measures:
• Step drain • Angle iron barbed wire fencing

494
• Stone masonry • Check dams • Contour bunding • Development of nurseries • Plantation/ afforestation • Pasture development • Social forestry
Appropriate financial provisions have been provided for soil
conservation measures in the catchment area. 7.5. Dabdar Reservoir 7.5.1. Fixation of Storage and Reservoir Levels - Approach–Criteria
The water availability studies at Jheri, Paikhed, Chasmandva, Chikkar, Dabdar and Kelwan dam sites have been carried out by the Hydrological Studies Organisation, CWC, New Delhi as a part of “Hydrological Studies of Par-Tapi-Narmada Link Project”. The Gross and Net Annual Yields at Dabdar dam site as per these studies are as given in Table: 5.28 below.
Table: 5.28 Gross and Net Annual Yields at Dabdar Dam Site
S.No. Details Annual Yield (MCM) Gross Net
1 100% Dependable yield 150 122 2 75% Dependable yield 323 262 3 50% Dependable yield 455 394 4 Average yield 488 430
The net water availability at Dabdar dam site has been worked out
after subtracting all the consumptive upstream utilizations planned by States. Regeneration from major and medium irrigation projects has been taken as 10 percent while the same has been ignored in case of minor irrigation projects. The regeneration from domestic and industrial uses has been considered as 80 percent of water diverted for the purpose. The net yield series generated at Dabdar dam site for the period from 1975-76 to 2006-07 is at Annexure: 5.17 in Volume - II.

495
The reservoir simulation study has been carried out for estimating the
live storage capacity of the reservoir that would provide the required yield at specified reliability. The discharge data is available for a period of 27 years from 1980 to 2006 at Kudkas G and D site maintained by Government of Gujarat on Khapri River (tributary of Ambica river), which is located U/s of Dabdar dam site. Rainfall – Runoff model has been developed using discharge data available at Kudkas G and D site and rainfall for the concurrent period. Using this Rainfall – Runoff model the gross yield series for the period from 1975-76 to 2006-07 at Dabdar dam site has been developed. The net yield series at the dam site has been generated by subtracting the net upstream consumptive use from the gross yield series and used for simulation analysis.
The simulation analysis has been done using Simulation Program developed using c++. This programme also takes into account the different releases from Dabdar reservoir: i) for local domestic and industrial water demand, ii) environmental and ecological requirements downstream of proposed dam site, and iii) en-route irrigation requirement of Dabdar Feeder Canal and iv) releases into Dabdar Feeder Canal, after power generation, for further transfer to Par-Tapi-Narmada Link Canal. The result of this analysis is at Appendix 5.5 in Volume - IV which gives detailed output for the gross capacity of 222.38 MCM. 7.5.1.1 Dead Storage Level (DSL)
The dead storage capacity of the Dabdar reservoir has been fixed on the basis of the guidelines given in “Fixing the capacities of reservoirs – Methods, Part 2 Dead storage, IS 5477 (Part 2): 1994”.
The new zero elevation of the Dabdar reservoir has been worked out as 119.90 m and 126.90 m after 50 years and 100 years respectively on the basis of sedimentation studies. The corresponding capacities at these levels as per the original Area - Capacity table come to 70.07 ha m and 424.28 ha m respectively. However, Dead Storage Level of the reservoir has been proposed as 127.00 m (corresponding original capacity of 432.16 ha m) and sluices are proposed to be provided above this level. The details of sedimentation studies are furnished in Appendix 5.2 in Volume – IV.

496
7.5.1.2 Low Water Level /Minimum Draw-Down Level (MDDL)
The Minimum Draw Down Level (MDDL) of Dabdar reservoir can be fixed anywhere above 126.90 m which is the new zero elevation after 100 years of operation of the reservoir, based on sedimentation studies carried out by Hydrological Studies Organisation, CWC, New Delhi. Keeping in view the live storage requirement for meeting the Link Canal demands and power generation, the MDDL of Dabdar reservoir is kept at 139.00 m.
7.5.1.3 Full Reservoir Level (FRL)
Integrated simulation studies carried out for Jheri, Paikhed, Chasmandva, Chikkar, Dabdar and Kelwan reservoirs indicate that the proposed Dabdar reservoir with Full Reservoir Level at 169.00 m will meet various planned demands at 100% success rate. Therefore, the Full Reservoir Level of Dabdar dam has been kept at 169.00 m. 7.5.1.4 Maximum Water Level (MWL) Maximum Water Level of Dabdar reservoir has been kept as 170.0 m and the gates of spillway have been designed to pass design flood of 6683 Cumec.
The Maximum Water Level at Dabdar dam has been fixed as 170.0 m. Various levels fixed at Dabdar Reservoir are given in Table - 7.29.
Table -7.29 Levels Fixed as per Simulation Study
Dabdar Reservoir Elevation(m) MWL 170.00 FRL 169.00 MDDL 139.00
7.5.1.5 Maximum Backwater Level at Full Reservoir Level and
Maximum Water Level and its Effect, Points to Which

497
Backwater Effect is Felt, Maximum Distance of Such Points from the Axis of the Structure
The Full Reservoir Level (FRL) and Maximum Water Level (MWL)
of the Dabdar dam have been fixed at 169.00 m and 170.0 m respectively. The maximum back water level at MWL is 170.0 m and the effect extends up to a distance of about 11 km from the axis of the dam (at the periphery of the reservoir) within which no structure of significant importance has been identified. 7.5.1.6 Saddle along the Reservoir Rim
The entire rim of proposed Dabdar reservoir is covered with the contours of value higher than the MWL as such no saddle is proposed along the rim of Dabdar reservoir. 7.5.1.7 Fetch
The fetch of the reservoir was determined to fix the free board and the top of the dam. The fetch computations were done as per the Indian Standards IS: 10635(Latest), “Guidelines for Free board requirements in Embankment Dams”.
7.5.1.8 Direction of Wind - Velocity of Wind - Wave Height - Free
Board-Top of Dam The direction of wind in Dabdar reservoir area is mostly from east to
west. The Nasik IMD station is located near to the Dabdar dam site. The maximum wind velocity of 13.2 km/hr is experienced in the month of June and the minimum wind velocity of 4.5 km/hr is experienced in the month of December. The average velocity of wind is 8.4 km/hr. However, a normal wind velocity of 44 m/sec has been considered. The following factors are taken into consideration while computing the free board requirement:
(a) Wave characteristics i.e. wave height and wave length; (b) Upstream slope of the dams and roughness of the pitching; (c) Height of wind setup above the still water level.

498
The details of free board requirement for all the six dams are furnished in
para 6.1.5 of Chapter – 6: Design Aspects. The top of the rock-fill portion of the Dabdar dam has been fixed at 177 m. 7.5.2 Sedimentation Data and Studies
Sediment load observations are being carried out by CWC at Gadat GandD site located on Ambica River downstream of Dabdar dam site. The annual suspended sediment load observed at the GandD site was 0.2443 mm/year/km2 (Average of sediment flow observed from 1985 to 1993) and the total sediment load including the bed load would be 0.2810 mm/year/km2. The sedimentation rate observed at the GandD site is much lower than the siltation rate recommended for the region in the “Compendium of Silting of Reservoirs in India” prepared by CWC. This may be due to less developmental activities in the catchment area of the dam at present. 7.5.2.1 Rate of Sedimentation with Basis
A sedimentation rate of 9.0 ham/100 sq.km/year has been adopted for analysis of Dabdar reservoir. The basis for adopting the value has already been explained under Para 7.1.2.1 above. 7.5.2.2 Quantity of Sediment
Considering the inflow sedimentation rate of 9.0 ham/100 km2/year the sediment volume at Dabdar reservoir will be as under.
i) 50 years sediment volume 19.553 MCM ii) 100 years sediment volume 39.035 MCM
7.5.2.3 Type and Shape of Reservoir
The Dabdar reservoir is considered as Flood plain-foot hill type and the standard classification is taken as Type II.

499
7.5.2.4 Sediment Studies – Dabdar Reservoir
The sedimentation study has been carried out using “Empirical Area Reduction” method. 7.5.2.5 Sediment Distribution
The sediment distribution is worked out for two periods, viz. 50 years and 100 years by Empirical Area Reduction method. For this purpose, the FRL 169.00 m is adopted and bed level of the reservoir is considered as 112.00 m. The original Elevation-Area-Capacity table for Dabdar reservoir is given in Table-7.30.
Table-7.30 Original Elevation-Area-Capacity Table
for Dabdar Reservoir Elevation
(m) Area( ha) Capacity
( MCM)
169.00 1248.77 222.38
166.00 1204.37 185.58
163.00 1036.71 152.00
160.00 826.05 124.12
157.00 740.22 100.63
154.00 636.30 80.01
151.00 499.61 63.01
148.00 412.78 49.34
145.00 349.75 37.92
142.00 273.08 28.60
139.00 213.25 21.32
136.00 173.90 15.53
133.00 139.29 10.84
130.00 108.84 7.13
128.00 88.43 5.16 126.00 70.14 3.57 125.00 61.80 2.92 124.00 53.95 2.34 123.00 46.63 1.83 122.00 39.87 1.40

500
Elevation (m)
Area( ha) Capacity ( MCM)
121.00 33.62 1.04 120.38 30.07 0.84 120.00 27.90 0.73 119.50 24.61 0.60 119.00 21.31 0.48 118.00 15.60 0.30 117.00 10.79 0.17 116.00 6.86 0.08 115.00 3.82 0.03 114.00 1.05 0.00 113.00 0.01 0.00 112.00 0.00 0.00
The total sediment during 50 and 100 years will get distributed up to
and above various elevations as given in the Table-7.31below:
Table-7.31 Distribution of Total Sediment at Various Elevations of Dabdar Dam Reservoir level Sediment Deposition in MCM
After 50 Years After 100 Years Up to 119.90 m 0.701 0.702 Above 119.90 m 18.748 38.698 Up to 127.00 m 3.019 4.321 Above 127.00 m 16.429 35.079 Up to 139.00 m 7.994 14.950 Above 139.00 m 11.455 24.450
The new zero elevation will be as follows: After 50 years = 119.90 m After 100 years = 126.90 m The Minimum Draw Down Level (MDDL) can be fixed anywhere above 126.90 m which is the new zero elevation after 100 years of operation of the reservoir.

501
The plots of revised elevation-area-capacity curve for 50-Year sedimentation and 100 year sedimentation are given in Figure – 7.9 and 7.10 respectively.
Original and revised (after 50 and 100 years) Elevation-Area-Capacity details for Dabdar reservoir are given in Table-7.32 below:
Table-7.32
Original and Revised (after 50 and 100 years) Elevation – Area - Capacity Table for Dabdar Reservoir
Elevation Original
Area Original Capacity
Revised Area
After 50 Years
Revised Capacity After 50
Years
Revised Area
After 100 Years
Revised Capacity After 100
Years (m) (ha) (MCM) (ha) (MCM) (ha) (MCM)
169.00 1248.77 222.38 1248.77 202.93 1248.77 182.98 166.00 1204.37 185.58 1178.47 166.39 1149.08 146.74 163.00 1036.71 152.00 1003.40 133.70 965.61 115.05 160.00 826.05 124.12 788.05 106.88 744.94 89.45 157.00 740.22 100.63 699.01 84.59 652.25 68.50 154.00 636.30 80.01 592.88 65.23 543.62 50.58 151.00 499.61 63.01 454.75 49.56 403.87 36.41 148.00 412.78 49.34 367.13 37.25 315.34 25.64 145.00 349.75 37.92 303.86 27.20 251.81 17.15 142.00 273.08 28.60 227.47 19.25 175.73 10.76 139.00 213.25 21.32 168.40 13.33 117.52 6.38 136.00 173.90 15.53 130.29 8.86 80.82 3.41 133.00 139.29 10.84 97.41 5.45 49.90 1.46 130.00 108.84 7.13 69.20 2.96 24.24 0.36 128.00 88.43 5.16 50.60 1.77 7.68 0.04 127.00 79.29 4.32 42.50 1.34 0.68 0.00 126.00 70.14 3.57 34.39 0.92 0.00 0.00 125.00 61.80 2.92 27.21 0.62 0.00 0.00 124.00 53.95 2.34 20.59 0.38 0.00 0.00 123.00 46.63 1.83 14.60 0.20 0.00 0.00 122.00 39.87 1.40 9.26 0.08 0.00 0.00

502
Elevation Original Area
Original Capacity
Revised Area
After 50 Years
Revised Capacity After 50
Years
Revised Area
After 100 Years
Revised Capacity After 100
Years (m) (ha) (MCM) (ha) (MCM) (ha) (MCM)
121.00 33.62 1.04 4.55 0.01 0.00 0.00 120.38 30.07 0.84 0.00 0.00 0.00 0.00 120.00 27.90 0.73 0.00 0.00 0.00 0.00 119.90 27.24 0.70 0.00 0.00 0.00 0.00 119.50 24.61 0.60 0.00 0.00 0.00 0.00 119.00 21.31 0.48 0.00 0.00 0.00 0.00 118.80 20.17 0.44 0.00 0.00 0.00 0.00 118.00 15.60 0.29 0.00 0.00 0.00 0.00 117.00 10.79 0.17 0.00 0.00 0.00 0.00 116.00 6.86 0.08 0.00 0.00 0.00 0.00 115.00 3.82 0.03 0.00 0.00 0.00 0.00 114.00 1.05 0.00 0.00 0.00 0.00 0.00 113.00 0.01 0.00 0.00 0.00 0.00 0.00 112.00 0.00 0.00 0.00 0.00 0.00 0.00
7.5.3 Life of Reservoir in Years with Basis
All the outlets from the reservoir are fixed at an elevation above the New Zero Elevation estimated after considering 100 years of sedimentation. Therefore, the life of the Dabdar reservoir has been considered as 100 years.
7.5.4 Capacity 7.5.4.1 Capacities of Dabdar Reservoir S No.
Capacity (MCM) Initial After 50
Years After 100
Years 1 Gross storage capacity 222.38 202.93 182.98 2 Live storage capacity 201.06 189.60 176.60 3 Storage capacity at MDDL 21.32 13.33 6.38

503
4 Dead storage capacity (at DSL)
4.32 1.34 0.00
7.5.4.2 Storage
Simulation analysis considering the inflow and various water
demands to be met from Dabdar reservoir has been carried out. Based on the simulation analysis the live storage has been provided so that the demand of water for various requirements could be met. The dead storage has been provided so that the functioning of the project would not be affected even after accumulation of silt over a period of 100 years. Various storage details of the proposed Dabdar reservoir have been mentioned in the Para 7.5.4.1 above.
The monthly minimum storages reserved in Dabdar reservoir for meeting the water demands towards evaporation losses, environmental and domestic needs to achieve intended success rates are given in Table-7.33 below:
Table-7.33 Monthly Minimum Storages Reserved in Dabdar Reservoir for Meeting
Evaporation Losses, Environmental and Domestic Needs Unit: MCM Jun Jul Aug Sept Oct Nov Dec Jan Feb March April May
2 2 2 2 18 15 13 12 10 6 5 3
The monthly inflow series and monthly diversion requirements considered for simulation analysis of Dabdar reservoir for fixing its live storage are furnished in Appendix 5.5 in Volume – III. 7.5.4.3 Water Tightness of the Reservoir
Preliminary Geotechnical Investigations were carried out at the dam
site by GSI, Western Region, Jaipur at Feasibility stage of Par-Tapi-Narmada Link Project during 1993-94. As per these investigations the foundation rocks at the dam site are Deccan traps. The bed rock constituting the foundation are a sequence of lava flows, which comprises amygdaloidal, dense, perphyritic basalt and flow breccias with horizontal to sub horizontal dips. The reservoir appears to be water tight.

504
The reports of GSI are at Appendix-4.2 and 4.4 in Volume-III. Also the periphery of the proposed Dabdar reservoir is covered with the contours of value higher than the MWL. 7.5.4.4 Annual Losses The simulation study carried out for Dabdar reservoir for the period from 1975 to 2006 indicates that the annual average evaporation loss from Dabdar reservoir is 6.6 MCM with highest evaporation loss as 8.6 MCM during the years 1975 and 1983 and the lowest evaporation loss as 3.7 MCM during the year 1987. Maximum Monthly evaporation loss is in October month and least Monthly evaporation loss is in July. 7.5.4.5 Flood Absorption
No flood storage is earmarked for this project. However, from reservoir routing it is seen that the maximum water level attained was 170.00 m and the maximum outflow discharge was 6582 Cumec. 7.5.5 Effects on Sub Soil Water Table in the Adjoining Areas
Particularly Downstream of the Dam
The sub-soil water table will improve due to the impoundment of water in the Dabdar reservoir. In addition, the regulated flows from the Dabdar dam into Khapri River to meet environmental needs will increase the sub soil water level in the adjoining areas even during lean season. 7.5.6 Reservoir Rim Stability
The detailed geological mapping to analyze the problems of reservoir stability and reservoir competency with respect to seepage/leakage of the proposed Dabdar reservoir could not be carried out due to public hindrance during DPR stage. However, preliminary Geotechnical investigations were carried out at the dam site by GSI, Western Region, Jaipur at Feasibility

505
stage of Par-Tapi-Narmada Link Project during 1993-94. The entire reservoir area is covered by the Deccan traps. The rock type encountered is sequence of lava flows. In view of the rock type encountered at the periphery of the reservoir, no stability problem of reservoir rim is expected.
The reservoir area appears to be water tight with no perceptible shear or fault zone criss- crossing the area. 7.5.7 Area of Submergence 7.5.7.1 At Maximum Water Level
Area of submergence of Dabdar reservoir at MWL is 1271 ha.
7.5.7.2 At Full Reservoir Level Area of submergence of Dabdar reservoir at FRL is 1249 ha.
7.5.7.3 Submergence Ratio - Submerged (Cultivated) Area/CCA The Dabdar reservoir is a part of net-work of 6 reservoirs proposed under Par-Tapi-Narmada Link Project for diversion of surplus waters of Par, Auranga, Ambica and Purna rivers for en-route irrigation and to take-over part command of Narmada Main Canal. The total submergence area (cultivated) under the six reservoirs is 2364 ha and the total CCA of the Link project is 232175 ha. Therefore, the Submergence Ratio works out to 0.0102.
7.5.8 Land Acquisition-Property Submerged-Rehabilitation 7.5.8.1 Land Acquisition
The land to be acquired is about 1249 ha (forest land: 614 ha, cultivable land: 482 ha and other lands including river portion: 153 ha) that is coming under submergence of Dabdar reservoir. 7.5.8.2 Details of Property Submerged

506
Due to creation of Dabdar reservoir 11 villages will be affected. These villages come under Ahwa taluka of The Dangs district of Gujarat. Total 563 households of these villages are likely to be affected. (i) Details of Dislocation of Communication (Railways), Road(s), Right of Way, Telegraph Lines etc.) as a Result of the Project
No railway line is coming under the submergence area of Dabdar
reservoir. The State Highway connecting Bilimora and Ahwa is coming under Submergence area of Dabdar dam. The power and telephone lines of about 12 km length connecting Waghai-Pimpri villages to be dislocated as a result of the project. (ii) Details of Valuable Mineral Deposits / Mines
The Engineering Geology Division of GSI, Jaipur vide Letter No. 171/G-1/EG/WR/GSI08-09 dated 9th April, 2009 (Annexure – 4.3 in Volume -II) informed that no significant minerals have been reported from the Dabdar reservoir area, except construction material and a few minor minerals like zeolites. (iii) Historic/Archaeological Monuments
As already mentioned under “Chapter – 4: Surveys and
Investigations-Para 4.2.1 Archaeological Survey”, no antiquarian archaeological remains have been noticed and none of the centrally protected monuments are located in the area likely to be submerged due to construction of Dabdar dam. 7.5.8.3 Rehabilitation of Project Affected People The rehabilitation plan has already been detailed under Para 7.1.8.3 above. 7.5.9 Recreation Facilities

507
Following are the recreational facilities which are proposed to be developed.
• Development of parks/gardens in d/s of dam. • Development of Children parks in the township. • Development of Tourist spot with boating facilities • Development of Guest house, inspection bungalow and
dormitory accommodation. These facilities will ensure tourism development in the area. The water-fall located just downstream of the dam site further enhances the tourism potential. 7.5.10 Pisciculture The submergence area of Dabdar reservoir is 1249 ha and there is lot of scope for developing fisheries.
Considering the water spread area of Dabdar reservoir and the fish production rate indicated above, expected fish production in Dabdar reservoir will be about 62 tonnes per year which will increase the revenue from the project.
7.5.11 Need and Recommendation for Soil Conservation Measures
in the Catchment
The chances of soil erosion, if any can be prevented/minimized by adopting following measures:
• Step drain • Angle iron barbed wire fencing • Stone masonry • Check dams • Contour bunding • Development of nurseries • Plantation/ afforestation • Pasture development
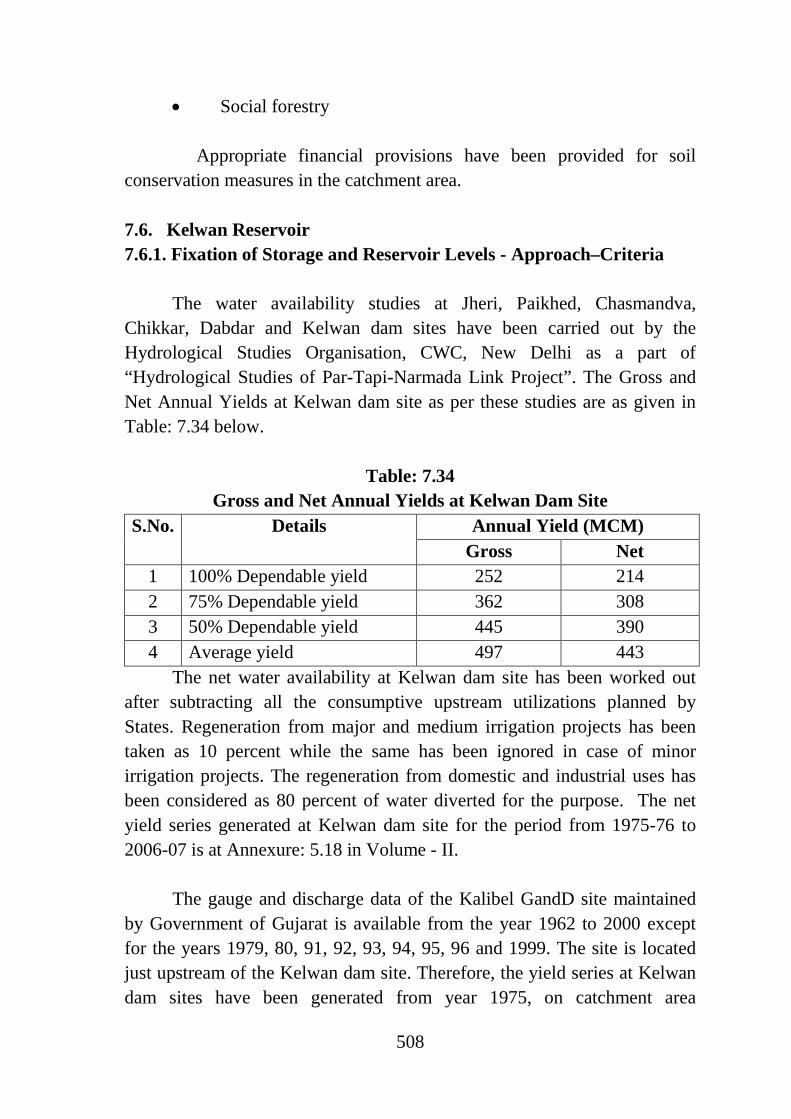
508
• Social forestry
Appropriate financial provisions have been provided for soil conservation measures in the catchment area. 7.6. Kelwan Reservoir 7.6.1. Fixation of Storage and Reservoir Levels - Approach–Criteria
The water availability studies at Jheri, Paikhed, Chasmandva, Chikkar, Dabdar and Kelwan dam sites have been carried out by the Hydrological Studies Organisation, CWC, New Delhi as a part of “Hydrological Studies of Par-Tapi-Narmada Link Project”. The Gross and Net Annual Yields at Kelwan dam site as per these studies are as given in Table: 7.34 below.
Table: 7.34
Gross and Net Annual Yields at Kelwan Dam Site S.No. Details Annual Yield (MCM)
Gross Net 1 100% Dependable yield 252 214 2 75% Dependable yield 362 308 3 50% Dependable yield 445 390 4 Average yield 497 443
The net water availability at Kelwan dam site has been worked out after subtracting all the consumptive upstream utilizations planned by States. Regeneration from major and medium irrigation projects has been taken as 10 percent while the same has been ignored in case of minor irrigation projects. The regeneration from domestic and industrial uses has been considered as 80 percent of water diverted for the purpose. The net yield series generated at Kelwan dam site for the period from 1975-76 to 2006-07 is at Annexure: 5.18 in Volume - II.
The gauge and discharge data of the Kalibel GandD site maintained
by Government of Gujarat is available from the year 1962 to 2000 except for the years 1979, 80, 91, 92, 93, 94, 95, 96 and 1999. The site is located just upstream of the Kelwan dam site. Therefore, the yield series at Kelwan dam sites have been generated from year 1975, on catchment area

509
proportionate basis, using observed data after duly checking the consistency. The inconsistent data and gaps have been filled by using rainfall runoff modeling. The yield series has been further extended beyond year 2000 using rainfall runoff modeling. The yield series from 1975 to 2006 has used for working out the water availability at the Kelwan dam site.
The simulation analysis has been done using Simulation Program developed using c++. This programme also takes into account the different releases from Kelwan reservoir: i) for local domestic and industrial water demand, ii) environmental and ecological requirements downstream of proposed dam site, and iii) en-route irrigation requirement of Kelwan Feeder Canal and iv) releases into Kelwan Feeder Canal, after power generation, for further transfer to Par-Tapi-Narmada Link Canal. The result of this analysis is at Appendix 5.5 in Volume - IV which gives detailed output for the gross capacity of 282.17 MCM. 7.6.1.1 Dead Storage Level (DSL)
The dead storage capacity of the Kelwan reservoir has been fixed on the basis of the guidelines given in “Fixing the capacities of reservoirs – Methods, Part 2 Dead storage, IS 5477 (Part 2): 1994”.
The new zero elevation of the Kelwan reservoir has been worked out
as 122.20 m and 128.20 m after 50 years and 100 years respectively on the basis of sedimentation studies. The corresponding capacities at these levels as per the original Area - Capacity table come to 125.05 ha m and 651.28 ha m respectively. However, Dead Storage Level of the reservoir has been proposed as 128.20 m (corresponding original capacity of 651.28 ha m) and sluices are proposed to be provided above this level. The details of sedimentation studies are furnished in Appendix 5.2 in Volume – IV. 7.6.1.2 Low Water Level /Minimum Draw-Down Level (MDDL)
The Minimum Draw Down Level (MDDL) of Kelwan reservoir can be fixed anywhere above 128.20 m which is the new zero elevation after 100 years of operation of the reservoir, based on sedimentation studies carried out by Hydrological Studies Organisation, CWC, New Delhi.

510
Keeping in view the live storage requirement for meeting the Link Canal demands and power generation, the MDDL of Kelwan reservoir is kept at 136.00 m.
7.6.1.3 Full Reservoir Level (FRL)
Integrated simulation studies carried out for Jheri, Paikhed, Chasmandva, Chikkar, Dabdar and Kelwan reservoirs indicate that the proposed Kelwan reservoir with Full Reservoir Level at 164.00 m will meet various planned demands at 100% success rate. Therefore, the Full Reservoir Level of Kelwan dam has been kept at 164.00 m. 7.6.1.4 Maximum Water Level (MWL) Maximum Water Level of Kelwan reservoir has been kept as 166.00 m and the gates of spillway have been designed to pass design flood of 7979 Cumec. The Maximum Water Level at Kelwan dam has been fixed as 166.00 m. Various levels fixed at Kelwan Reservoir are given in Table - 7.35.
Table -7.35 Levels Fixed as per Simulation Study
Kelwan Reservoir Elevation(m) MWL 166.00 FRL 164.00 MDDL 136.00
7.6.1.5 Maximum Backwater Level at Full Reservoir Level and
Maximum Water Level and its Effect, Points to Which Backwater Effect is Felt, Maximum Distance of Such Points from the Axis of the Structure
The Full Reservoir Level (FRL) and Maximum Water Level (MWL) of the Kelwan dam have been fixed at 164.00 m and 166.00 m respectively. The maximum back water level at MWL is 166.00 m and the effect extends

511
up to a distance of about 24 km from the axis of the dam (at the periphery of the reservoir) within which no structure of significant importance has been identified. 7.6.1.6 Saddles along the Reservoir Rim
The entire rim of proposed Kelwan reservoir is covered with the contours of value higher than the MWL as such no saddle is proposed along the rim of Kelwan reservoir.
7.6.1.7 Fetch
The fetch of the reservoir was determined to fix the free board and the top of the dam. The fetch computations were done as per the Indian Standards IS: 10635(Latest), “Guidelines for Free board requirements in Embankment Dams”.
7.6.1.8 Direction of Wind - Velocity of Wind - Wave Height - Free
Board-Top of Dam
The direction of wind in Kelwan reservoir area is mostly from east to west. The Nasik IMD station is located near to the Kelwan dam site. The maximum wind velocity of 13.2 km/hr is experienced in the month of June and the minimum wind velocity of 4.5 km/hr is experienced in the month of December. The average velocity of wind is 8.4 km/hr. However, a normal wind velocity of 44 m/sec has been considered. The following factors are taken into consideration while computing the free board requirement:
(a) Wave characteristics i.e. wave height and wave length; (b) Upstream slope of the dam and roughness of the pitching; (c) Height of wind setup above the still water level.
The details of free board requirement for all the six dams are
furnished in para 6.1.5 of Chapter – 6: Design Aspects. The top of the rock-fill portion of the Kelwan dam has been fixed at 174.0 m. 7.6.2 Sedimentation Data and Studies

512
Sediment load observations are being carried out by CWC at Mahuva
GandD site located on Purna River downstream of Kelwan dam site. The annual suspended sediment load observed at the GandD site was 0.3693 mm/year/km2 and the total sediment load including the bed load would be 0.4247 mm/year/km2. The sedimentation rate observed at the GandD site is much lower than the siltation rate recommended for the region in the “Compendium of Silting of Reservoirs in India” prepared by CWC. This may be due to less developmental activities in the catchment area of the dam at present. 7.6.2.1 Rate of Sedimentation with Basis
A sedimentation rate of 9.0 ham/100 sq.km/year has been adopted for analysis of Kelwan reservoir. The basis for adopting the value has already been explained under Para 7.1.2.1 above. 7.6.2.2 Quantity of Sediment
Considering the inflow sedimentation rate of 9.0 ham/100 km2/year the sediment volume at Kelwan reservoir will be as under:
i) 50 years sediment volume 29.902 MCM ii) 100 years sediment volume 59.689 MCM
7.6.2.3 Type and Shape of Reservoir
The Kelwan reservoir is considered as Flood plain-foot hill type and the standard classification is taken as Type II. 7.6.2.4 Sediment Studies – Kelwan Reservoir
The sedimentation study has been carried out using “Empirical Area Reduction” method. 7.6.2.5 Sediment Distribution

513
The sediment distribution is worked out for two periods, viz. 50 years and 100 years by Empirical Area Reduction method. For this purpose, the FRL 164.00 m is adopted and bed level of the reservoir is considered as 115.27 m. The original Elevation-Area-Capacity table for Kelwan reservoir is given in Table-7.36:
Table-7.36 Original Elevation-Area-Capacity Table
for Kelwan Reservoir Elevation (m) Revised Area(ha) Capacity
(MCM) 164.00 1628.85 282.16 163.00 1559.22 266.22 161.00 1453.06 236.11 158.00 1280.42 195.13 155.00 1150.00 158.69 152.00 1007.49 126.36 149.00 850.95 98.51 146.00 704.09 75.22 143.00 624.75 55.30 140.00 488.00 38.65 138.00 344.07 30.37 136.00 304.78 23.89 134.00 268.72 18.16 132.00 215.59 13.32 130.00 180.00 9.37 128.00 135.19 6.23 126.00 95.00 3.94 125.00 83.00 3.05 124.00 70.00 2.29 123.00 55.00 1.66 122.00 47.00 1.15 121.00 34.00 0.75 120.00 26.00 0.45 119.00 18.00 0.23 118.50 14.00 0.15 118.00 10.00 0.12 117.94 9.25 0.09

514
Elevation (m) Revised Area(ha) Capacity (MCM)
117.75 8.50 0.09 117.50 7.00 0.07 117.00 4.00 0.05 116.00 0.90 0.02 115.27 0 0.00
The total sediment during 50 and 100 years will get distributed up to
and above various elevations as given in the Table-7.37 below:
Table-7.37 Distribution of Total Sediment at Various Elevations of Kelwan Dam Reservoir Level Sediment Deposition in MCM
After 50 Years After 100 Years Up to 122.20 m 1.25 1.26 Above 122.20 m 28.42 57.99 Up to 128.20 m 4.70 6.51 Above 128.20 m 24.97 52.74 Up to 136.00 m 10.29 18.33 Above 136.00 m 19.38 40.92
The new zero elevation will be as follows. After 50 years = 122.20 m After 100 years = 128.20 m The Minimum Draw Down Level (MDDL) can be fixed anywhere above 128.20 m which is the new zero elevation after 100 years of operation of the reservoir.
The plots of revised elevation-area-capacity curve for 50-Year sedimentation and 100 year sedimentation are given in Figure – 7.11 and 7.12 respectively:

515
Original and revised (after 50 and 100 years) Elevation-Area-Capacity details for Kelwan reservoir are given in Table-7.38 below:
Table-7.38
Original and Revised (after 50 and 100 years) Elevation – Area - Capacity Table for Kelwan Reservoir
Elevation Original
Area Original Capacity
Revised Area
After 50 Years
Revised Capacity After 50
Years
Revised Area
After 100 Years
Revised Capacity After 100
Years (m) (ha) (MCM) (ha) (MCM) (ha) (MCM)
164.00 1628.85 282.17 1628.85 252.50 1628.85 222.91 163.00 1559.22 266.23 1527.62 236.67 1492.49 207.20 161.00 1453.06 236.12 1404.68 207.35 1350.89 178.76 158.00 1280.42 195.14 1218.58 168.02 1149.82 141.27 155.00 1150.00 158.70 1079.94 133.56 1002.05 109.00 152.00 1007.49 126.36 932.11 103.40 848.30 81.27 149.00 850.95 98.52 772.26 77.87 684.78 58.31 146.00 704.09 75.23 623.68 56.96 534.28 40.05 143.00 624.75 55.31 543.97 39.46 454.15 25.24 140.00 488.00 38.66 408.06 25.22 319.19 13.68 138.00 344.07 30.38 265.34 18.53 177.81 8.75 136.00 304.78 23.89 227.77 13.60 142.16 5.56 134.00 268.72 18.16 193.95 9.39 110.83 3.03 132.00 215.59 13.33 143.61 6.02 63.58 1.64 130.00 180.00 9.38 111.37 3.48 35.07 0.31 128.20 137.43 6.51 74.62 1.85 0.00 0.00 128.00 135.19 6.24 70.54 1.67 0.00 0.00 127.00 115.10 4.99 52.69 1.06 0.00 0.00 126.00 95.00 3.94 35.04 0.62 0.00 0.00 125.00 83.00 3.05 25.68 0.32 0.00 0.00 124.75 79.75 2.85 23.13 0.25 0.00 0.00 124.63 78.13 2.75 21.86 0.23 0.00 0.00 124.50 76.50 2.65 20.59 0.20 0.00 0.00 124.00 70.00 2.29 15.55 0.11 0.00 0.00 123.00 55.00 1.66 3.69 0.01 0.00 0.00 122.20 48.60 1.25 0.00 0.00 0.00 0.00

516
Elevation Original Area
Original Capacity
Revised Area
After 50 Years
Revised Capacity After 50
Years
Revised Area
After 100 Years
Revised Capacity After 100
Years (m) (ha) (MCM) (ha) (MCM) (ha) (MCM)
122.00 47.00 1.15 0.00 0.00 0.00 0.00 121.00 34.00 0.75 0.00 0.00 0.00 0.00 120.00 26.00 0.45 0.00 0.00 0.00 0.00 119.00 18.00 0.23 0.00 0.00 0.00 0.00 118.50 14.00 0.15 0.00 0.00 0.00 0.00 118.25 12.00 0.12 0.00 0.00 0.00 0.00 118.00 10.00 0.09 0.00 0.00 0.00 0.00 117.94 9.25 0.08 0.00 0.00 0.00 0.00 117.75 8.50 0.07 0.00 0.00 0.00 0.00 117.50 7.00 0.05 0.00 0.00 0.00 0.00 117.00 4.00 0.02 0.00 0.00 0.00 0.00 116.00 0.90 0.002 0.00 0.00 0.00 0.00 115.27 0.00 0.00 0.00 0.00 0.00 0.00
7.6.3 Life of Reservoir in Years with Basis All the outlets from the reservoir are fixed at an elevation above the New Zero Elevation estimated after considering 100 years of sedimentation. Therefore, the life of the Kelwan reservoir has been considered as 100 years.
7.6.4 Capacity 7.6.4.1 Capacities of Kelwan Reservoir S No.
Capacity (MCM) Initial After 50
Years After 100
Years 1 Gross storage capacity 282.17 252.50 222.91 2 Live storage capacity 258.28 238.90 217.35 3 Storage capacity at MDDL 23.89 13.60 5.56 4 Dead storage capacity (at
DSL) 6.51 1.85 0.00
7.6.4.2 Storage

517
Simulation analysis considering the inflow and various water
demands to be met from Kelwan reservoir has been carried out. Based on the simulation analysis the live storage has been provided so that the demand of water for various requirements could be met. The dead storage has been provided so that the functioning of the project would not be affected even after accumulation of silt over a period of 100 years. Various storage details of the proposed Kelwan reservoir have been mentioned in the Para 7.6.4.1 above. The monthly minimum storages reserved in Kelwan reservoir for meeting the water demands towards evaporation losses, environmental and domestic needs to achieve intended success rates are given in Table-7.39 below:
Table-7.39 Monthly minimum storages reserved in Kelwan reservoir for meeting
evaporation losses, environmental and domestic needs Unit: MCM Jun Jul Aug Sept Oct Nov Dec Jan Feb March April May
3 3 3 3 14 11 10 9 8 5 5 5
The monthly inflow series and monthly diversion requirements considered for simulation analysis of Kelwan reservoir for fixing its live storage are furnished in Appendix 5.5 in Volume – IV. 7.6.4.3 Water Tightness of the Reservoir
Preliminary Geotechnical Investigations were carried out at the dam
site by GSI, Western Region, Jaipur at Feasibility stage of Par-Tapi-Narmada Link Project during 1993-94. As per these investigations the foundation rocks at the dam site are Deccan traps and it’s differentiates. The exposed out crops are mainly consisting of horizontal to sub horizontal
518
sequence of lava flows, which includes amygdaloidal, dense, perphyritic basalt and flow breccias.
The report of GSI is at Appendix-4.2 and 4.4 in Volume-III. Also the
periphery of the proposed Kelwan reservoir is covered with the contours of value higher than the MWL. 7.6.4.4 Annual Losses The simulation study carried out for Kelwan reservoir for the period from 1975 to 2006 indicates that the annual average evaporation loss from Kelwan reservoir is 6.9 MCM with highest evaporation loss as 8.7 MCM during the year 1975 and the lowest evaporation loss as 4.2 MCM during the year 1987. Maximum Monthly evaporation loss is in October month and least Monthly evaporation loss is in July. 7.6.4.5 Flood Absorption
No flood storage is earmarked for this project. However, from reservoir routing it is seen that the maximum water level attained was 166.00 m and the maximum outflow discharge was 6582 Cumec. 7.6.5 Effects on Sub Soil Water Table in the Adjoining Areas
Particularly Downstream of the Dam
The sub-soil water table will improve due to the impoundment of water in the Kelwan reservoir. In addition, the regulated flows from the Kelwan dam into Purna River to meet environmental needs will increase the sub soil water level in the adjoining areas even during lean season. 7.6.6 Reservoir Rim Stability
The detailed geological mapping to analyze the problems of reservoir stability and reservoir competency with respect to seepage/leakage of the

519
proposed Kelwan reservoir could not be carried out due to public hindrance during DPR stage. However, preliminary Geotechnical investigations were carried out at the dam site by GSI, Western Region, Jaipur at Feasibility stage of Par-Tapi-Narmada Link Project during 1993-94. The entire reservoir area is covered by the Deccan trap and it’s differentiates. The rock type encountered is horizontal to sub horizontal sequence of lava flows.
There is shear zones and dykes, hence adequate care should be taken
to control these phenomenon before impounding the reservoir.
7.6.7 Area of Submergence 7.6.7.1 At Maximum Water Level
Area of submergence of Kelwan reservoir at MWL is 1870 ha.
7.6.7.2 At Full Reservoir Level
Area of submergence of Kelwan reservoir at FRL is 1629 ha. 7.6.7.3 Submergence Ratio - Submerged (Cultivated) Area/CCA The Kelwan reservoir is a part of net-work of 6 reservoirs proposed under Par-Tapi-Narmada Link Project for diversion of surplus waters of Par, Auranga, Ambica and Purna rivers for en-route irrigation and to take-over part command of Narmada Main Canal. The total submergence area (cultivated) under the six reservoirs is 2364 ha and the total CCA of the Link project is 232175 ha. Therefore, the Submergence Ratio works out to 0.0102.
7.6.8 Land Acquisition-Property Submerged-Rehabilitation 7.6.8.1 Land Acquisition
The land to be acquired is about 1629 ha (forest land: 890 ha, cultivable land: 450 ha and other lands including river portion: 289 ha) that is coming under submergence of Kelwan reservoir.
7.6.8.2 Details of Property Submerged

520
Due to creation of Kelwan reservoir 17 villages will be affected. These villages come under Ahwa taluka of The Dangs district of Gujarat. Total 793 households of these villages are likely to be affected.
(i) Details of Dislocation of Communication (Railways), Road(s), Right of Way, Telegraph Lines etc.) as a Result of the Project
No railway line is coming under the submergence area of Kelwan
reservoir. The State Highway connecting Vyara and Ahwa is coming under Submergence area of Kelwan dam. The power and telephone lines of about 14 km length connecting Karlipada-Khatal villages to be dislocated as a result of the project.
(ii) Details of Valuable Mineral Deposits / Mines
The Engineering Geology Division of GSI, Jaipur vide Letter No.
171/G-1/EG/WR/GSI08-09 dated 9th April, 2009 (Annexure – 4.3 in Volume -II) informed that no significant minerals have been reported from the Kelwan reservoir area, except construction material and a few minor minerals like zeolites.
(iii) Historic/Archaeological Monuments
As already mentioned under “Chapter – 4: Surveys and
Investigations-Para 4.2.1 Archaeological Survey”, no antiquarian archaeological remains have been noticed and none of the centrally protected monuments are located in the area likely to be submerged due to construction of Kelwan dam.
7.6.8.3 Rehabilitation of Project Affected People
The rehabilitation plan has already been detailed under Para 7.1.8.3 above.
7.6.9 Recreation Facilities

521
Following are the recreational facilities which are proposed to be developed.
• Development of parks/gardens in d/s of dam. • Development of Children parks in the township. • Development of Tourist spot with boating facilities • Development of Guest house, inspection bungalow and dormitory
accommodation.
These facilities will ensure tourism development in the area. The water-fall located just downstream of the dam site further enhances the tourism potential. 7.6.10 Pisciculture The submergence area of Kelwan reservoir is 1629 ha and there is lot of scope for developing fisheries. Considering the water spread area of Kelwan reservoir and the fish production rate indicated above, expected fish production in Kelwan reservoir will be about 81 tonnes per year which will increase the revenue from the project. 7.6.11 Need and Recommendation for Soil Conservation Measure
in the Catchment
The chances of soil erosion, if any can be prevented/minimized by adopting following measures:
• Step drain • Angle iron barbed wire fencing • Stone masonry • Check dams • Contour bunding • Development of nurseries • Plantation/ afforestation • Pasture development • Social forestry
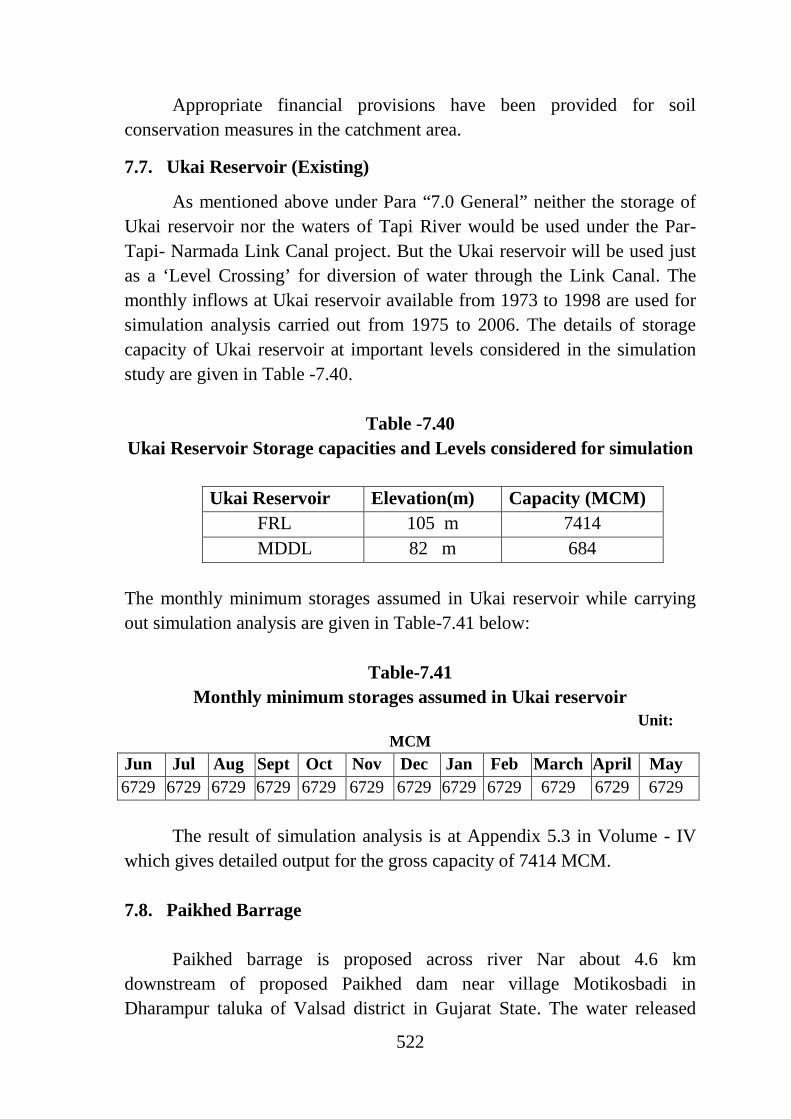
522
Appropriate financial provisions have been provided for soil conservation measures in the catchment area.
7.7. Ukai Reservoir (Existing)
As mentioned above under Para “7.0 General” neither the storage of Ukai reservoir nor the waters of Tapi River would be used under the Par-Tapi- Narmada Link Canal project. But the Ukai reservoir will be used just as a ‘Level Crossing’ for diversion of water through the Link Canal. The monthly inflows at Ukai reservoir available from 1973 to 1998 are used for simulation analysis carried out from 1975 to 2006. The details of storage capacity of Ukai reservoir at important levels considered in the simulation study are given in Table -7.40.
Table -7.40
Ukai Reservoir Storage capacities and Levels considered for simulation
Ukai Reservoir Elevation(m) Capacity (MCM) FRL 105 m 7414 MDDL 82 m 684
The monthly minimum storages assumed in Ukai reservoir while carrying out simulation analysis are given in Table-7.41 below:
Table-7.41
Monthly minimum storages assumed in Ukai reservoir Unit:
MCM Jun Jul Aug Sept Oct Nov Dec Jan Feb March April May 6729 6729 6729 6729 6729 6729 6729 6729 6729 6729 6729 6729
The result of simulation analysis is at Appendix 5.3 in Volume - IV
which gives detailed output for the gross capacity of 7414 MCM. 7.8. Paikhed Barrage
Paikhed barrage is proposed across river Nar about 4.6 km downstream of proposed Paikhed dam near village Motikosbadi in Dharampur taluka of Valsad district in Gujarat State. The water released

523
from Paikhed reservoir after power generation will be picked-up at Paikhed barrage from where the Par – Tapi – Narmada link canal will off take.
7.9. Chasmandva Barrage
Chasmandava barrage is proposed across river Tan about 8.5 km in the downstream of proposed Chasmandava dam near village Chandha Chikadi in Vansda taluka of Navsari district in Gujarat State. The water released from Chasmandava reservoir after power generation will be picked-up at Chasmandava barrage from where a feeder pipe line will off take to release the water in to the Par – Tapi – Narmada link canal.

650
Chapter - 9
Irrigation Planning and Command Area Development
9.0 General The main objective of the Par-Tapi-Narmada Link project is to provide maximum irrigation facilities to Tribal areas enroute the link canal lying on its right side including drought prone Saurashtra region of Gujarat. The link project will cater the command areas of five projects namely Khuntali, Ugta, Sidhumber, Khata Amba, Zankhari, suggested by Government of Gujarat. Command in Tribal areas of Chhota Udepur and Panchmahal districts from Narmada Main canal on substitution basis, Tribal dominant districts of Dangs & Valsad of Gujarat State and Nasik district of Maharashtra State along with Drinking water of most of the villages in the vicinity and filling of most of Panchayat tanks will be served under Par-Tapi-Narmada link canal.
The Par-Tapi-Narmada link takes off from the Paikhed barrage. The initial part of the link consists of a 12.70 km long tunnel connecting Jheri to Nar river upstream of Paikhed dam. The canal part of the link starts from Paikhed barrage which is located 4.60 km downstream of the Paikhed dam. The FSL of the canal at Paikhed barrage is 142.800 m. The link canal on its way to Ukai reservoir on Tapi river is fed by the storages envisaged at Chasmandva, Chikkar, Dabdar and Kelwan reservoirs through feeder pipelines. The link canal after irrigating the command en-route, outfalls into the Ukai reservoir at FSL105.275 m and takes off from the Ukai reservoir with FSL 81.790 m and finally outfalls into the Miyagam branch canal at RD16.70 km of the Narmada main canal system. The FSL of the link canal at its tail end is 53.573 m.
9.1 Existing Irrigation Facilities in the Proposed Project Command
Area The Par-Tapi-Narmada link canal is aligned through Valsad, Navsari,
Tapi, Surat, Bharuch, Narmada, and Chhota Udepur districts of South Gujarat. The Command Area identified en-route the link canal lies in Navsari, Tapi, Surat and Bharuch districts. The existing source of irrigation in the vicinity of the en-route Command Area of the link canal is mainly

651
Wells and Tube-wells. The details of existing, ongoing and proposed irrigation & multipurpose projects in the vicinity of en-route Command Area of the link canal are given in Table-9.1:
Table – 9.1
Irrigation Facilities from Existing, Ongoing and Proposed Projects Sl. No. District Project GCA(ha) CCA(ha) Existing Projects
1. Tapi Kakrapar 347220 204080 2. Tapi Ukai 121410 66168 3. Surat Ver-I 2266 1376 4. Surat Ver-II 7248 5789 5. Navsari Jhuj 8950 6695 6. Navsari Kelia 6014 4794 7. Narmada Karjan 79785 56200
Ongoing Projects 1. Valsad Chinchai LIS 10362 7000 2. Tapi Ukai LB High Level
Canal 22775 13300
Source: i) Major, Medium & Minor River Valley Projects of Gujarat, as published by Water Resources Department, Government of Gujarat-2002.
ii) Narmada, Water Resources, Water supply & Kalpsar Department, Government of Gujarat
9.1.1 Proposed Irrigation Facilities in the Proposed Project Command Area
The area envisaged for irrigation under the Par-Tapi-Narmada link canal project is divided into six parts:
i) The command area proposed en-route the link canal and feeder
pipelines by gravity. ii) Command area of Projects proposed by Government of Gujarat by
gravity. iii) Command area in the Tribal area right side of link canal by lift. iv) Command area in the vicinity of six proposed reservoirs through lift

652
v) Tribal area on right side of the Narmada Main canal by lift, on substitution basis.
vi) Command area of Miyagam branch canal of Narmada Main Canal (Target command) in Saurashtra region. The total culturable command area under the link project is 232175 ha,
of which 61190 ha lies enroute the link canal i.e., (i) 10100 ha is en-route command in the reach between Par and Tapi (ii) 49820 ha en-route command in the reach between Tapi and Narmada (iii) 630 ha en-route command under Dabdar feeder pipelines (iv) 640 ha en-route command under Kelwan feeder pipelines with 100% irrigation intensity.
The command area of projects suggested by Government of Gujarat on the left side of canal is about 45561 ha to be irrigated by gravity through link canal. Tribal area on right side of canal is 36200 ha will be irrigated by lift. About 12514 ha tribal area will also be irrigated directly by lift from proposed six reservoirs.Tribal area on right side of Narmada Main canal to the extent of 23750 ha in Chhota Udepur district and 10592 ha in Panchmahal district will also be irrigated through lift directly from Narmada Main canal on substitution basis. Finally, the linkproject will take over the area of 76710 ha under the command of existing Miyagam branch canal of Narmada canal system. Narmada Water so saved will be utilized to provide irrigation facilities in predominantly tribal areas of Chhota Udepur, Panchmahal district and in drought prone Saurashtra region of Gujarat State through Narmada Canal System. Thus the Par-Tapi-Narmada link project with present modified water planning shall provide irrigation facilities to 232175 ha CCA out of which 157291 ha in tribal areas of Gujarat and 74884 ha in other areas.
9.1.1.1 Command Area Proposed En-Route the Link Canal
The en-route command area of the link canal has been planned as (a) Directly from the link canal in Par-Tapi reach; (b) Feeder pipelinesoriginating from the proposed Dabdarand Kelwan dams to the link canal in Par-Tapi reach and (c) Directly from the link canal in Tapi-Narmada reach.

653
(a) Command area Directly from Link Canal in Par-Tapi reach on left side The command area of about 10100 ha has been identified under this
reach under Vansda taluka of Navsari district, Vyara taluka and Songadh taluka of Tapi districts are given in Table -9.2:
Table –9.2 Locations of Command Area Benefitted Under Par-Tapi Reach of Par-
Tapi-Narmada Link Project Outlet
No/ branc
h canal
Topo
sheet no.
Location of
main canal RD in km.
En-route command area (ha)
FSL at head of Branch canal
En-route
Irrigation
Demand (MCM)
Dis-charge (cume
c)
Taluka
District
Gross CCA
1 46 H/6 76.45 250 233
126.597 1.50 0.12
Vansda
Navsari
2 81.20 70 69 125.593 0.43 0.04
Vansda
Navsari
3 82.35 3240 2448 125.090 15.32 1.27
Vansda
Navsari
4 46 H/5 99.00 222 222
121.140 1.38 0.12
Vansda
Navsari
5 103.85 314 312 120.123 1.98 0.16
Vansda
Navsari
6 108.49 208 201 119.036 1.25 0.1 Vyara Tapi
7 111.82 174 167 118.471 1.05 0.08 Vyara Tapi
8 112.45 122 118 118.242 0.74 0.06 Vyara Tapi
9 115.05 4071 3796 117.487 23.65 1.97 Vyara Tapi
10 118.36 163 163 116.783 1.02 0.08 Vyara Tapi
11 122.02 38 36 115.75 0.26 0.02 Vyara Tapi

654
Outlet No/
branch
canal
Topo
sheet no.
Location of
main canal RD in km.
En-route command area (ha)
FSL at head of Branch canal
En-route
Irrigation
Demand (MCM)
Dis-charge (cume
c)
Taluka
District
Gross CCA 6
12 46 G/8 125.33 37 34
115.152 0.26 0.02 Vyara Tapi
13 133.09 64 47 113.818 0.29 0.02 Vyara Tapi
14 137.61 185 165 113.095 1.04 0.08 Vyara Tapi
15 143.53
100 98 111.830 0.62 0.05 Vyara Tapi
16 46 G/12
159.86 438 421 109.138 2.62 0.22
Songadh Tapi
17 161.94 146 139 108.663 0.86 0.07
Songadh Tapi
18 165.94 493 428 107.863 2.66 0.22
Songadh Tapi
19 169.42 218 205 107.043 1.28 0.11
Songadh Tapi
20 171.99 288 253 106.551 1.55 0.13
Songadh Tapi
21 174.27 134 133 106.012 0.82 0.07
Songadh Tapi
22 177.12 473 412 105.347 2.56 0.22
Songadh Tapi
Total 11448 10100 63.13 The command area is shown in plate No. 4.40 (1/5 to 3/5) Vol-VII of DPR. (b) Command area through Feeder pipelines originating from the
Proposed Dabdar and Kelwan Dams to the Link Canal in Par-Tapi Reach

655
The feeder pipeline from Dabdar dam on Khapri river to main canal of length 12.258 km will carry 262 MCM of water out of which 3.9 MCM of water will be utilized for irrigating 630 ha en-route command area of feeder before it join to main canal. The feeder pipeline from Kelwan dam on Purna river to main link canal of length 7.616km will divert 308MCMout of which 4.0MCMof water will be utilized for irrigating 640 ha command area before joining to the main link canal.
Though the feeder pipeline from Chasmandva dam on river Tan to
main canal of length 2.859 km has also been proposed but no en-route command area has been proposed along the feeder. The proposed Chikkar and Dabdar Dams are also connected by 14.342 km pipelines but no en-route command area has been proposed. The total command area through feeder pipes shall be 1270 ha utilizing 7.9 MCM of water. (c) Command area Directly from Link Canal in Tapi-Narmada Reach
on Left side
Under Tapi-Narmada reach command area of about 49820 ha has been identified falling in Songadh taluka of Tapi District, Mandvi and Mangrol taluka of Surat District and Valia taluka of Bharuch District of Gujarat State. The details are given in Table -9.3:
Table –9.3
Locations of Branch Canal/Outlet and Command Area Benefitted Under Tapi-Narmada Reach of Par-Tapi-Narmada Link Project
Outlet No/
branch
canal
Topo
sheet no.
Location of
main canal RD in km.
En-route command area (ha)
FSL at head of Branch canal
En-route
Irrigation
Demand
(MCM)
Dis-charge (cumec
)
Taluka District
Gross CCA
1 46
G/11 1.41 101 92 81.650 0.55 0.05 Songadh Tapi
2 3.70 171 168 81.267 1.05 0.08 Songadh Tapi

656
Outlet No/
branch
canal
Topo
sheet no.
Location of
main canal RD in km.
En-route command area (ha)
FSL at head of Branch canal
En-route
Irrigation
Demand
(MCM)
Dis-charge (cumec
)
Taluka District
Gross CCA
3 6.87 109 107 80.797 0.68 0.05 Songadh Tapi
4 7.69 120 115 80.709 0.71 0.06 Songadh Tapi
5 11.4
9 125 121 80.277 0.77 0.06 Songadh Tapi
6 46 G/7
15.72 151 150 79.750 0.94 0.08
Songadh Tapi
7 17.4
1 240 234 79.481 1.49 0.12 Songadh Tapi
8 32.0
1 324 316 77.761 1.98 0.16 Mandvi Surat
9 33.3
3 436 408 77.629 2.54 0.21 Mandvi Surat
10 34.1
1 176 170 77.551 1.06 0.08 Mandvi Surat
11 37.7
1 430 413 77.090 2.59 0.22 Mandvi Surat
12 43.2
2 138 130 76.384 0.82 0.07 Mandvi Surat
13 46 G/3
47.79 615 612 76.127 3.83 0.32 Mandvi Surat
14 49.5
6 3570 3365 75.698 21.05 1.74 Mandvi Surat 15 51.0
4 13347 1145
7 75.550 71.61 5.93 Mandvi Surat
16 55.7
9 817 756 75.023 4.74 0.39 Mandvi Surat
17 57.0
9 600 589 74.892 3.68 0.31 Mandvi Surat

657
Outlet No/
branch
canal
Topo
sheet no.
Location of
main canal RD in km.
En-route command area (ha)
FSL at head of Branch canal
En-route
Irrigation
Demand
(MCM)
Dis-charge (cumec
)
Taluka District
Gross CCA
18 46 G/7
60.69 5003 4061 74.428 25.38 2.11
Mangrol Surat
19 64.3
7 2636 2386 73.946 14.90 1.23 Mangrol Surat
20 69.15 1493 1433 73.261 8.94 0.74
Mangrol Surat
21 46 G/6
71.48 306 295 72.976 1.84 0.15 Valia
Bharuch
22 82.17 26437
22442 71.143 140.24 11.63 Valia
Bharuch
Tota
l 57345 4982
0 311.39 The command area is shown in plate No. 4.40 (4/5 & 5/5) of Vol-VII of DPR. 9.1.1.2 Command Area of Projects suggested by Government of Gujarat.
The command area of about 45561 ha under five Projects as suggested by Government of Gujarat viz., namely Khuntali, Ugta, Sidhumber, Khata Amba and Zankhari irrigation projects which are in the vicinity of the project command area are planned to take over by the Par-Tapi-Narmada link canal. Details of these projects are given in Table –9.4.

658
Table –9.4
Sl. No
Name of Reservoi
r
River Command area in Culturable command area (ha)
Annual Irrigation (ha) Taluka
District
1 Khuntali Dholdo / Par river
Dharmpur Valsad 3162 3162
2 Ugta Par river Dharampur Valsad 4963 4963 3 Sidhumbe
r Man river
Dharampur Chikhli
Valsad Navsari
17441 17441
4 Khata Amba
Kaveri Vansda Navsari 2741 2741
5 Zankhari Zankari river
Songadh& Vyara
Tapi 17254 17254
Total 45561 45561
The salient features of the above projects are given at Annexure No.9.26.
The command area maps of these projects are at Plate No.3 to Plate no. 7 of Vol-VIII(c).
9.1.1.3 Command area falling in Tribal area on right side of canal by lift.
Maximum possible Tribal areas to an extent of 36200 ha at four
different locations enroute on Right side of the Par-Tapi-Narmada link canal have been identified as requested by Government of Gujarat for providing irrigation in tribal areas. Since these areas are located at a higher level than the link canal, the water can be provided for irrigation by lift upto 70.0 m. These are described below:
(a) Area No.1 is located in Par-Tapi reach between RD 113.25 to 115.00 km of link canal with average F.S.L. 117.70 m, in this area irrigation can be provided through lift upto 3 m from P-T-N link canal. About 900 ha area can be covered in this reach in Vyara tehsil of Tapi district.
(b) Area No.2 is located in Par-Tapi reach between RD 141.440 to 153.400 km in between Jhankhari river and Mindhola river. Average

659
F.S.L. of P-T-N link canal near this area is 111.0 m. Irrigation can be provided through lift upto 50 m to 70 m from P-T-N link canal. About 13100 ha area can be covered in this reach in Songadh tehsil of Tapi district.
(c) Area No.3 is located in Tapi-Narmada reach between RD 32.00 to 72.00 km of link canal and average F.S.L. of this area is 70.0 m. Irrigation can be provided through lift of about 50 m from P-T-N link canal. About 6500 ha area can be covered in this reach in Mandvi and Mangrol tehsils of Surat district.
(d) Area No.4 is located in Tapi-Narmada reach between RD 72.033 to 87.274 km in between Ghanta River and Amravati River and average F.S.L. of this area is 71.5 m. Irrigation can be provided through lift by about 50 m to 70 m from P-T-N link canal. About 15700 ha area can be covered in this reach in Valia tehsil of Bharuch district.
The abstract of proposed command area falling in tribal region is given in Table – 9.5 below:
Table – 9.5
Additional irrigation in the tribal areas lying right side of Par-Tapi-Narmada Link Canal by lift
Sl. No.
Name of Command Area
CCA (ha)
Annual Irrigation at 100% intensity of
irrigation (ha)
Taluka / District benefitted
1 Area-1 900 900 Vyara / Tapi 2 Area-2 13100 13100 Songadh /
Tapi 3 Area-3 6500 6500 Mandvi and
Mangrol / Surat
4 Area-4 15700 15700 Valia / Bharuch
Total 36200 36200 The command areas under Area-1 to Area-4 are shown in Plate No. 17 to 20 of Vol-VIII (C).
9.1.1.4 Command area in the vicinity of six proposed reservoirs by Lift.

660
About 12514 ha of command area in the vicinity of six proposed reservoirs which lies in Tribal dominant districts of Dang and Valsad of Gujarat and Nasik district of Maharashtra is proposed to bring under irrigation.Details are given in Table-9.6:
Table – 9.6
Command area in the vicinity of reservoir through lift up to 70meter.
Sl. No.
Name of Dam
CCA (ha) Annual Irrigation Total (ha)
Taluka/ District Maharashtra Gujarat
1 Jheri 966 - 966 Peint / Nasik 2 Paikhed 3305 480 3785 Dharampur /
Valsad 3 Chasmand
va - 2300 2300 Dharampur
/Valsad 4 Chikkar - 1260 1260 Ahwa /
Dang 5 Dabdar - 2595 2595 Ahwa /
Dang 6 Kelwan - 1608 1608 Ahwa /
Dang Total 4271 8243 12514
The command area in the vicinity of reservoirs is shown in Plate No.1 & 2 of Vol-VIII(c).
9.1.1.5 Command area of Tribal area on right side of Narmada Main canal by lift.
It is proposed to provide irrigation to 23750 ha predominantly in
tribal areas of Jetpur pavi, Sankheda, Nasvadi, Kavant, Bodeli, Chhota Udepur taluks of Chhota Udepur district by lift directly from Narmada Main Canal on substitution basis.
It is also proposed to provide irrigation of 10592 ha predominantly in tribal area of Halol, Ghogamba and Kalol talukas of Panchmahal district by lift directly from Narmada Main Canal, on substitution basis. Thus, a total command area of 34342 ha can be brought under irrigation in the command
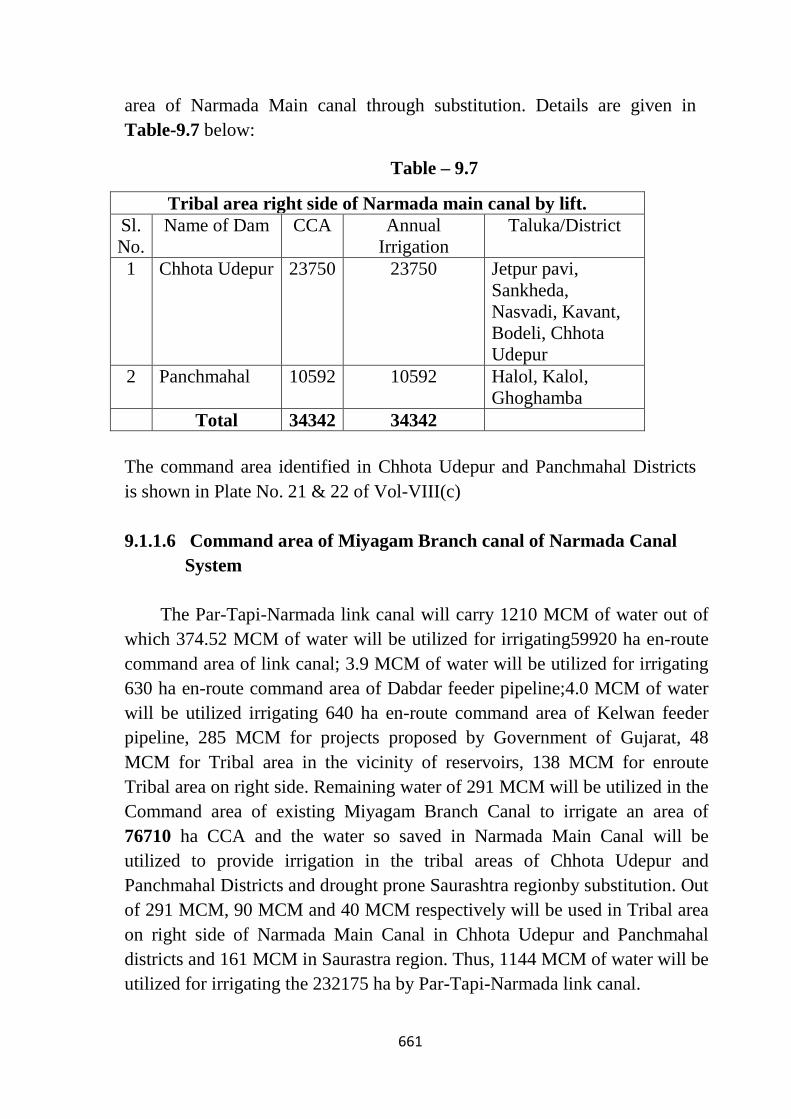
661
area of Narmada Main canal through substitution. Details are given in Table-9.7 below:
Table – 9.7
Tribal area right side of Narmada main canal by lift. Sl. No.
Name of Dam CCA Annual Irrigation
Taluka/District
1 Chhota Udepur 23750 23750 Jetpur pavi, Sankheda, Nasvadi, Kavant, Bodeli, Chhota Udepur
2 Panchmahal 10592 10592 Halol, Kalol, Ghoghamba
Total 34342 34342
The command area identified in Chhota Udepur and Panchmahal Districts is shown in Plate No. 21 & 22 of Vol-VIII(c)
9.1.1.6 Command area of Miyagam Branch canal of Narmada Canal System
The Par-Tapi-Narmada link canal will carry 1210 MCM of water out of which 374.52 MCM of water will be utilized for irrigating59920 ha en-route command area of link canal; 3.9 MCM of water will be utilized for irrigating 630 ha en-route command area of Dabdar feeder pipeline;4.0 MCM of water will be utilized irrigating 640 ha en-route command area of Kelwan feeder pipeline, 285 MCM for projects proposed by Government of Gujarat, 48 MCM for Tribal area in the vicinity of reservoirs, 138 MCM for enroute Tribal area on right side. Remaining water of 291 MCM will be utilized in the Command area of existing Miyagam Branch Canal to irrigate an area of 76710 ha CCA and the water so saved in Narmada Main Canal will be utilized to provide irrigation in the tribal areas of Chhota Udepur and Panchmahal Districts and drought prone Saurashtra regionby substitution. Out of 291 MCM, 90 MCM and 40 MCM respectively will be used in Tribal area on right side of Narmada Main Canal in Chhota Udepur and Panchmahal districts and 161 MCM in Saurastra region. Thus, 1144 MCM of water will be utilized for irrigating the 232175 ha by Par-Tapi-Narmada link canal.

662
In the irrigation planning of Par-Tapi-Narmada link project, it is proposed to take over the part Command Area of Miyagam Branch Canal of Narmada Canal System of Sardar Sarovar Project (SSP) under the Link Canal. The Narmada waters so saved in Sardar Sarovar Project would be utilized in Panchmahal and Chhota Udepur districts and in Saurashtra and Kutch regions of Gujarat by substitution through Narmada canal system to meet irrigation, domestic and other requirements.
Thus, a total command area of about 232175 ha will be brought under
irrigation by the Par-Tapi-Narmada Link Project. The canal runs through five basins lying in the districts of Valsad, Navsari, Dang, Surat, Tapi, Bharuch, and Narmada and Vadodara in Gujarat State. The details like existing, ongoing and proposed irrigation projects and the proposed command area under the link canal in the reach from Par to Tapi and Tapi to Narmada and beyond Narmada upto Miyagam branch canal of Narmada Main Canal are shown in Index map at Plate 1.1 in Volume-VII.Line diagram of Par-Tapi-Narmada canal system showing the location of dams, barrages and Feeder pipeline is at Fig-9.1. 9.2 Existing cropping pattern
9.2.1 Existing area under rain-fed cultivation
(A) En-route command
The existing cropping pattern of the area under rain-fed cultivation
varies from District to District. The cropping pattern in the Districts which lie in the en-route command area is furnished in Table 9.8:
Table – 9.8
Existing Cropping Pattern in Rain-fed Area Sl. No.
Crop Districts Navsari Tapi Surat Bharuch
(%) (%) (%) (%) 1 Rice 40 23 9 1 2 Wheat - 1 - 9 3 Jowar 1 25 16 11
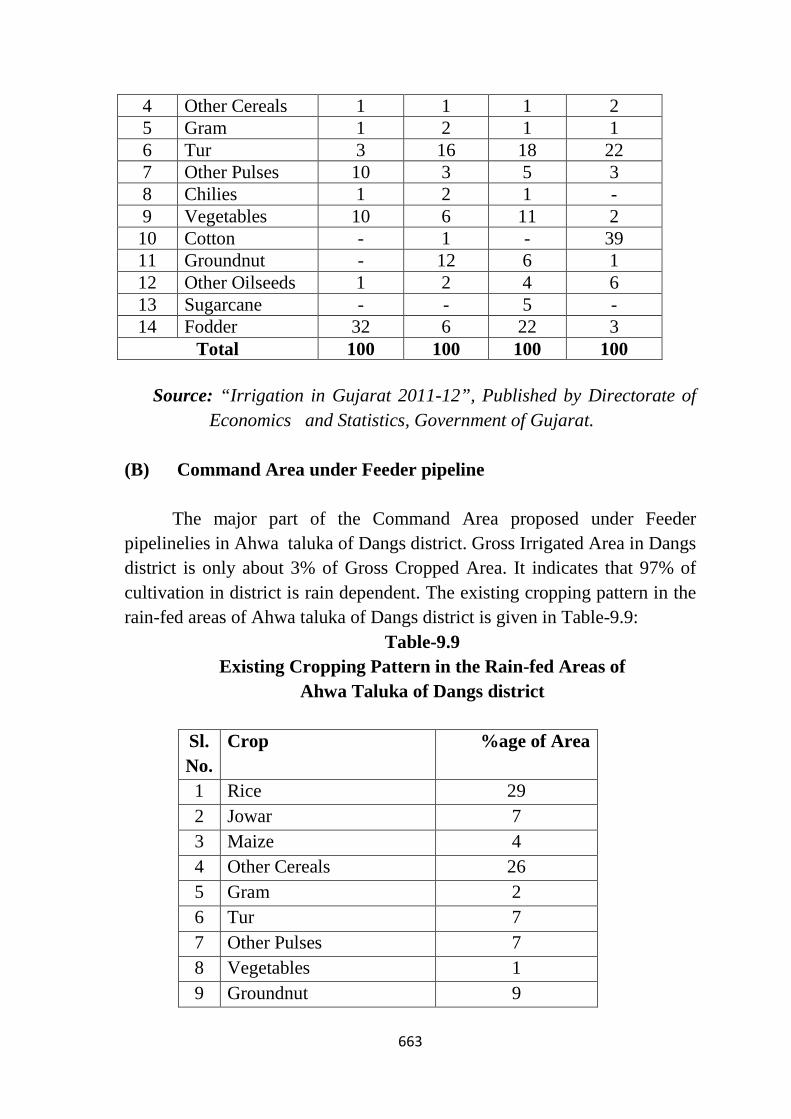
663
4 Other Cereals 1 1 1 2 5 Gram 1 2 1 1 6 Tur 3 16 18 22 7 Other Pulses 10 3 5 3 8 Chilies 1 2 1 - 9 Vegetables 10 6 11 2 10 Cotton - 1 - 39 11 Groundnut - 12 6 1 12 Other Oilseeds 1 2 4 6 13 Sugarcane - - 5 - 14 Fodder 32 6 22 3
Total 100 100 100 100
Source: “Irrigation in Gujarat 2011-12”, Published by Directorate of Economics and Statistics, Government of Gujarat.
(B) Command Area under Feeder pipeline
The major part of the Command Area proposed under Feeder pipelinelies in Ahwa taluka of Dangs district. Gross Irrigated Area in Dangs district is only about 3% of Gross Cropped Area. It indicates that 97% of cultivation in district is rain dependent. The existing cropping pattern in the rain-fed areas of Ahwa taluka of Dangs district is given in Table-9.9:
Table-9.9 Existing Cropping Pattern in the Rain-fed Areas of
Ahwa Taluka of Dangs district
Sl. No.
Crop %age of Area
1 Rice 29 2 Jowar 7 3 Maize 4 4 Other Cereals 26 5 Gram 2 6 Tur 7 7 Other Pulses 7 8 Vegetables 1 9 Groundnut 9

664
Sl. No.
Crop %age of Area
10 Other Oilseeds 3 11 Fodder 5
Total 100 Source: Irrigation in Gujarat 2011-12, Published by Directorate of Economics and Statistics, Government of Gujarat.
9.3 Soil Surveys 9.3.1 Soil Capability Classification
The taluka wise reports of the soil survey carried out by Gujarat
Government in respect of the districts falling in the en-route command area have been collected from the Agriculture Department, Government of Gujarat. Reports on land irrigability and soil classification of Banni area of Kutch region and SSNNL phase I (Upto Mahi river), Soil classification report and soil maps for the talukas lying in reservoir submergence areas and link alignment have also been collected. Using this information the soil map of the en-route command area has been prepared and appended at Plate -4.45 in Volume -VII.
The characteristics of the soils present in the proposed Command
Area are described below. The en-route Command Area of the link canal lies in Navsari, Tapi,
Surat and Bharuch districts of South Gujarat. The Command area of Feeder Canals lies in Navsari and Dangs districts of South Gujarat.The soils found in South Gujarat can be divided into 3 main types viz. i) Deep Black, Medium Black to Loamy Sand (Goradu) soils, ii) Deep Black with Alluvial, Laterite and Medium Black Soils and iii) Deep Black Clayey Soils. Deep Black Soils are clay-like in texture, poor in drainage, neutral to alkaline in reaction and most fertile soils. Medium Black soils are Silt loam to clay in texture, neutral to alkaline in reaction. Lateritic soils support good forests. Alluvial soils are very deep.
Deep Black Clayey soils are found in Plain & Coastal areas and Sandy loam soils with shallow depth are present in Hilly areas of Navsari

665
district. Deep Black soils are present in Plain areas and Lateritic and eroded shallow and Clay loam moderately deep soils are present in Hilly areas of Tapi district. The predominant soils found in Surat district are Deep Black Clayey soils. “Goradu” soils are present in some areas of Kamarej, Mandavi, Mangrol talukas of Suratdistrict. Soils in Bharuch district are predominantly Deep Black soils followed by Loamy sand soils. Lateritic & Hilly soils are present in Dangs district.
The soils in Navsari, Surat and Bharuch districts are predominantly
very deep. In Tapi district soil depth is dominantly shallow. In Dangs districtthe soil depth is mostly shallow.
Soils in South Gujarat are fine to medium textured (Clayey to Loamy
Clay), except in Dangs district. In Dangs the soils are medium textured. Soil Drainage in South Gujarat in general can be classified as well to moderately drain. Whereas, the soils in Dangs district are well drained.Soil salinity belongs to slight to moderate and severe towards coastal area in Bharuch district. In Tapi and Dangs districts Soil salinity is moderate. Soil salinity in Surat and Navsari districts belongs to slight to strong salinity class. Soil Sodicity in South Gujarat in general belongs to slight Sodicity class except in Navsari where soil Sodicity varies from slight to moderate.
9.3.2 Land Irrigability Classification
Land irrigability class indicates limitations on the land use. Among
Land Irrigability classes, Class 1 to Class 4 comes under Irrigable Land class, Land under Class 5 is temporarily non-irrigable (further investigations needed) and Class 6 is land not suitable for irrigation. The soils belong to Soil Irrigability Classes from A to D come under Irrigable Land class. The lands having slopes less than 10%and depth of water table more than 1.5 m come under Irrigable Land class. The soils of texture “Sandy loam to clay loam” come under Soil irrigability class “A”. The soils of texture “Loamy sand and clay” come under Soil irrigability class “B”. The soils of texture “Sand and clay” come under Soil irrigability classes “C&D”.
As the soils in the Command Area are mainly Deep Black and
Medium Black Clayey soils, slope of the land is less than 5% and

666
Groundwater depth is more than 1.5 mthe area can be put under irrigation without any major constraints. However, in Tapi and Dangs districts where soil depth is shallow appropriate cropping pattern and water application methods need to be devised for irrigating the areas. 9.4 Agro-Climatic Conditions 9.4.1 Rainfall i) Rainfall during Monsoon (Max, Min & Mean Rainfall)
The maximum, minimum and mean monsoon rainfall (June to Sept)
observed at Raingauge stations situated in vicinity of proposed Command Area of the link canal viz Bopi, Vansda, Sara, Kalibel, Antapur, Dhanmodi and Vyara are given in Table-9.10:
Table-9.10
Monsoon Rainfall in the Vicinity of Proposed Command Area Sl.No. Raingauge Station Monsoon Rainfall (mm)
Maximum Minimum Mean 1 Bopi 4098 897 2143 2 Vansda 3212 902 1870 3 Sara 2635 1088 1730 4 Kalibel 2641 450 1528 5 Antapur 4343 624 1715 6 Dhanmodi 2614 549 1260 7 Vyara 2873 603 1444
Source: Water Availability Study of Par-Tapi-Narmada link project-March,2012, HSO,CWC.
Maximum and minimum rainfall occurs in the months of July and
June respectively during monsoon in the command. The mean monsoon rainfall at Baroda meteorological station (data of which is considered for estimating crop water requirement of en-route command area of link canal) is 760 mm. The mean non-monsoon rainfall at the station is 55 mm. ii) Rainfall during Non-monsoon (Max. Min & Mean Rainfall)

667
The maximum, minimum and mean non-monsoon rainfall (Oct to May) observed at Bopi, Vansda, Sara, Kalibel, Antapur, Dhanmodi and Vyara Raingauge stations are given in Table-9.11:
Table-9.11
Non-monsoon Rainfall in the Vicinity of Proposed Command Area Sl.No. Raingauge station Non-monsoon Rainfall (mm)
Maximum Minimum Mean 1 Bopi 323 0.0 44 2 Vansda 318 0.0 65 3 Sara 129 0.0 28 4 Kalibel 223 0.0 31 5 Antapur 127 0.0 18 6 Dhanmodi 257 0.0 34 7 Vyara 202 0.0 33
Source: Water Availability Study of Par-Tapi-Narmada Link Project,March, 2012, HSO, CWC. 9.4.2 Temperature, Relative Humidity, Wind Speed and Cloud Cover
Two meteorological observatories viz., Surat and Vadodara
maintained by IMD located adjacent to the project area have been used to characterize the climatic condition of the project area. The normal temperature, relative humidity, wind speed and cloud cover observed at Surat IMD observatory (based on the data for the period from 1998 to 2007) and Vadodara IMD observatories (based on the data for the period from 1998 to 2007) are as follows.
Temperature Monthly mean maximum and minimum temperatures recorded at Surat and Vadodara stations are 36.8 0C & 14.7 0C and 39.9 0C & 13.2 0C respectively. Humidity
Monthly mean maximum and minimum relative humidity recorded at Surat and Vadodara stations are 90% & 53% and 94% & 44% respectively.

668
Wind Speed Monthly mean maximum and minimum wind speed recorded at Surat
and Vadodara stations are 6.4 km/h & 1.7 km/h and 13.3 km/h & 2.2 km/h respectively.
Cloud Cover:
Monthly mean maximum and minimum wind speed recorded at Surat and Vadodara stations are 6.2 oktas & 0.7 oktas and 6.4 oktas & 0.8 oktas respectively.
9.4.3 Frost Free Days
Generally this region does not experience any frost
9.5 Proposed Cropping Pattern
Irrigation Planning of Par-Tapi-Narmada link project has been carried out by the Irrigation Planning (South) Directorate of CWC. The working sheets /data/ computations are placed at Annexures- 9.1 to 9.23. Keeping in view the prevailing cropping pattern in the nearby areas the cropping pattern for En-route Command Area of the link canal and Feeder pipeline has been proposed. The proposed cropping in the en-route command of project has been approved by State Agricultural Department and is at Annexure-9.24. (A) Proposed Cropping Pattern En-route and under State
Government projects
Similar type of cropping pattern is proposed for the command areas enroute the link canal lying on left side as well as of the projects proposed by Government of Gujarat. The proposed cropping pattern and crop calendar for en-route command is given in Table-9.12 below.

669
Table-9.12 Cropping Pattern Proposed for the En-route Command
CCA: 59920 ha Sl. No.
Season/ Crop %age of CCA
Area of Crop(ha)
Crop duration
(days)
Starting Monthand Fortnight
Kharif 1 Paddy 8 4794 153 Jun Ist 2 Jowar 8 4794 123 May IInd 3 Pulses 4 2397 107 May IInd 4 Groundnut 8 4794 169 May IInd 5 Oilseeds 8 4794 107 Jun Ist 6 Vegetables 4 2397 107 Jun Ist 7 L.S.Cotton 4 2397 199 Jul IInd 8 S.S.Cotton 8 4794 199 Jul IInd
Rabi 9 Wheat 8 4794 135 Nov Ist
10 Jowar 4 2397 151 Oct Ist 11 Maize 4 2397 138 Oct Ist 12 Vegetables 4 2397 107 Nov Ist 13 Pulses 8 4794 151 Oct Ist
14 Oil seeds 4 2397 151 Oct Ist
15 Ground nut 4 2397 151 Oct Ist Hot Weather 16 Bajra 2 1197 151 Mar Ist 17 Vegetables 2 1197 137 Mar Ist 18 Soyabean 2 1197 151 Mar Ist Perennial 19 Sugarcane 4 2397 350 Oct IInd 20 Fruits 2 1198 349 Jun Ist
Total 100 59920 (B) Command area under Feeder pipelines
The cropping pattern as adopted for en-route Command Area is also
considered for the Command area proposed under Feeder pipeline.

670
(C) Target Command Area in Saurashtra Regionand under othercommand areas of the link canal
The proposed cropping pattern considering the pressurized irrigation
system for the target command area in the Saurashtra region is given in Table-9.13:
Table-9.13 Cropping Pattern Adopted for the Target
Command Area of Link Canal Total CCA: 42368 ha
Sl. No.
Crop Season/ Name of the Crop
For Pressurized Irrigation
% age of CCA Area of Crop (ha)
Kharif 1 Late Paddy 2 Early Paddy 3 Maize/Bajra 4 Oilseeds 10 4237
Rabi 5 Wheat 55 23302 6 Jowar 7 Pulses/Vegetables 20 8474 8 Potato 6 2542
Two Seasonal 9 S.S. Cotton 10 L.S. Cotton 11 Tobacco 12 Lucene
Hot Weather 13 Bajra 14 Fodder 6 2542
Perennial 15 Sugarcane 16 Fruits 3 1271 Total 100 42368

671
Sl. No.
Crop Season/ Name of the Crop
For Pressurized Irrigation
Grand Total 42368 9.5.1 Proposed Irrigation Facilities 9.5.1.1 En-route Command
The Par-Tapi-Narmada Link Canal off-takes from Paikhed barrage proposed on Nar River (a tributary of Par River) with a Full Supply Level of 142.800 m. The canal runs for a distance of about 177.736 km from Paikhed barrage and drops into existing Ukai reservoir on Tapi River at its left flank. Again the canal takes-off from the right flank of Ukai reservoir with an Off-take Level of 81.79 m and crosses the Narmada River downstream of Sardar Sarovar dam and out-falls into Miyagam branch canal (at RD 16.70 km) of Narmada Main canal after covering a total distance of about 191.307 km from its off-take point at Ukai reservoir. The Full Supply Level of the link canal at its tail end is 53.573 m.
Sample Command Area surveys were carried out in the Tapi-Narmada reach at three locations viz. i) Mandvi, ii) Wankal and iii) Valia to an extent of 1300 ha, 1750 ha and 1150 ha respectively, covering a total area of about 4200 ha. The topographical survey had been carried out at 50 m grid basis and the Command Area maps were prepared to a scale of 1: 15000 with contour interval of 1 to 2 m. The maps are appended as Plates 4.41 to 4.43 in Volume –VII. However, due to public hindrance no sample Command Area surveys could be carried out in the Par-Tapi reach.
En- route Gross Command Area of the link is 68793 ha which need to be surveyed for finalizing the Command Area en-route the link canal. Since field survey of such a large area was time consuming, it was decided to demarcate en-route Command Area under the link canal with Remote Sensing techniques. The demarcation of Command Area was got done through Regional Remote Sensing Centre (Jodhpur), ISRO. IRS P6 LISS IV data has been used along with SRTM DEM data to get the ground information of the proposed Command Area. A total area of around 3851 km2 is analyzed for identification of Command Area. For the analysis the entire area has been divided into two reaches viz. i) Par-Tapi reach and ii)

672
Tapi-Narmada reach. It is proposed to adopt an irrigation intensity of 100% in the en-route Command. The details of Command Area in these reaches are furnished in Table-9.14:
Table-9.14
GCA, CCA and Annual Irrigation En-route Sl. No.
Reach GCA (ha)
CCA(ha) Annual Irrigation(ha)
1 Par-Tapi 11448 10100 10100 2 Tapi-Narmada 57345 49820 49820 Total 68793 59920 59920
9.5.1.2 Command Area Proposed under Feeder pipeline
The CCA and Annual Irrigation under Dabdar and Kelwan Feeder Canals adopting an Irrigation Intensity of 100% are given in Table-9.15:
Table-9.15
CCA and Annual Irrigation under Feeder pipeline Sl. No.
Name of Feeder Canal CCA(ha) Annual Irrigation (ha)
1 Dabdar 630 630 2 Kelwan 640 640 Total 1270 1270
9.5.1.3 Command Area of Narmada Main Canal (NMC) of SSP to
be takenover by the Link Canal.
Par – Tapi – Narmada link project will take over 76710 ha CCA (annual irrigation 76710 ha with irrigation intensity as 100%) of existing Miyagam branch canal of Narmada Canal System. The Narmada water so saved will be utilized to provide irrigation to 23750 ha CCA in Chhota Udepur district, 10592 ha CCA in Panchmahal distict and 42368 ha CCA with 100% irrigation intensity in Saurashtra region by Pressurized Irrigation.

673
The abstract of CCA and annual irrigation from the Par-Tapi-Narmada link and other demand are given in Table 9.16:
Table 9.16
Abstract of CCA and Area to be Irrigated Through Par-Tapi-Narmada Link Project
Irrigation / Drinking water benefits from Par-Tapi-Narmada Link
Sl. No.
Reach / Feedar CCA (ha) Annual Irrigation
(ha)
Annual Utilisation in
(MCM)
In Tribal areas
Non-Tribal
Total
1 Enroute command 51173 10017 61190 61190 382 2 Project proposed by
Government of Gujarat on the left side of canal
40631 4930 45561 45561 285
3 Tribal area in enroute right side of canal
36200 0 36200 36200 138
4 Tribal area in vicinity of reservoirs
12514 0 12514 12514 48
5 Tribal areas on right side of Narmada main canal by lift
a.Chhota Udepur dist. b.Panchmahal dist.
14940 1833
8810 8759
23750 10592
23750 10592
90 40
Sub-total 16773 17569 34342 34342 130 6 Supply of drinking
water for all villages of Dang District and Villages of Kaprada & Dharmpur taluka of Valsad District.
Provision of 76 MCM made for about 27.60 lakh population of these areas.
76
7 Filling all possible tanks in benefitted areas.
50
8 Target command in Saurashtra region
0 42368 42368 42368 161
Total 157291 74884 232175 232175 1270

674
Say 2.32 lakh hectares 9 Environmental
releases 20
10 Evaporation losses 40 Grand Total 1330
9.5.2 Scope for Double & Multiple Cropping pattern and Change in
Cropping Pattern 9.5.2.1 Soils
The details of soils present in the proposed Command Area are
already described under para 9.3 above. As the soils in the Command Area are mainly Deep Black and Medium Black Clayey soils, there are no limitations for adopting double and multiple cropping patterns in the proposed Command Area as far as soils are concerned. 9.5.2.1.1 Agro-climatic Conditions
Based on soil characteristics, rainfall and temperature Gujarat is
divided in to 8 Agro-climatic zones. The Command area of Par-Tapi-Narmada link canal falls in i) South Gujarat Heavy Rainfall Zone and ii) South Gujarat Zone. The climate in the region is Semi-arid to dry sub-humid. Therefore, the Agro-climatic conditions in the proposed Command Area are favorable for adopting double and multiple cropping patterns. 9.5.2.2 Water and Other Inputs like Fertilizers, Weedicides and
Pesticides
Input survey carried out by Revenue Department, Government of Gujarat in 2006-07 indicated that in 86% of agricultural holdings having irrigation facilities, Chemical Fertilizers were used and in about 80% of these holdings crops were treated with Pesticides. In un-irrigated holdings the use of Chemical Fertilizers & Pesticides was recorded as 62% and 65% respectively. It shows that usage of Fertilizers & Pesticides is very common among the farmers in the State. 9.5.2.3 Irrigated Crops in the Adjoining Area

675
The irrigated crops grown in the adjoining areas of command are
mainly Paddy, Wheat, Sugarcane, Cotton, Fruits and Vegetables. 9.5.2.4 Attitude of Farmers towards Modern Irrigated Agricultural
Practices As the farmers in the Command Area will get assured irrigation
through the link canal which improves their socio-economic status, most of the farmers may support modern irrigated agricultural practices. 9.6 Crop Water Requirement (A) En-route Command Area
The annual crop water requirement for each crop under En-route
Command Area has been computed by Irrigation Planning (South) Directorate, CWC adopting Modified Penman’s method. Basic data is given at Annexure-9.7 and detailed computations are at Annexure 9.8 in Volume-II. The details are given below in Table-9.17:
Table –9.17
Crop Water Requirement for En-route Command Area
CCA: 59920 ha Sl. No.
Crop Season/ Name of the Crop
% age of CCA
Area of Crop (ha)
Water Requirement
(MCM) Kharif
1 Paddy 8 4794 39.664 2 Jowar 8 4794 9.928 3 Pulses 4 2397 5.936 4 Groundnut 8 4794 11.216 5 Oilseeds 8 4794 11.048 6 Vegetables 4 2397 0.176 7 L S Cotton 4 2397 11.192 8 SS Cotton 8 4794 21.728
Rabi 9 Wheat 8 4794 38.576 10 Jowar 4 2397 15.928
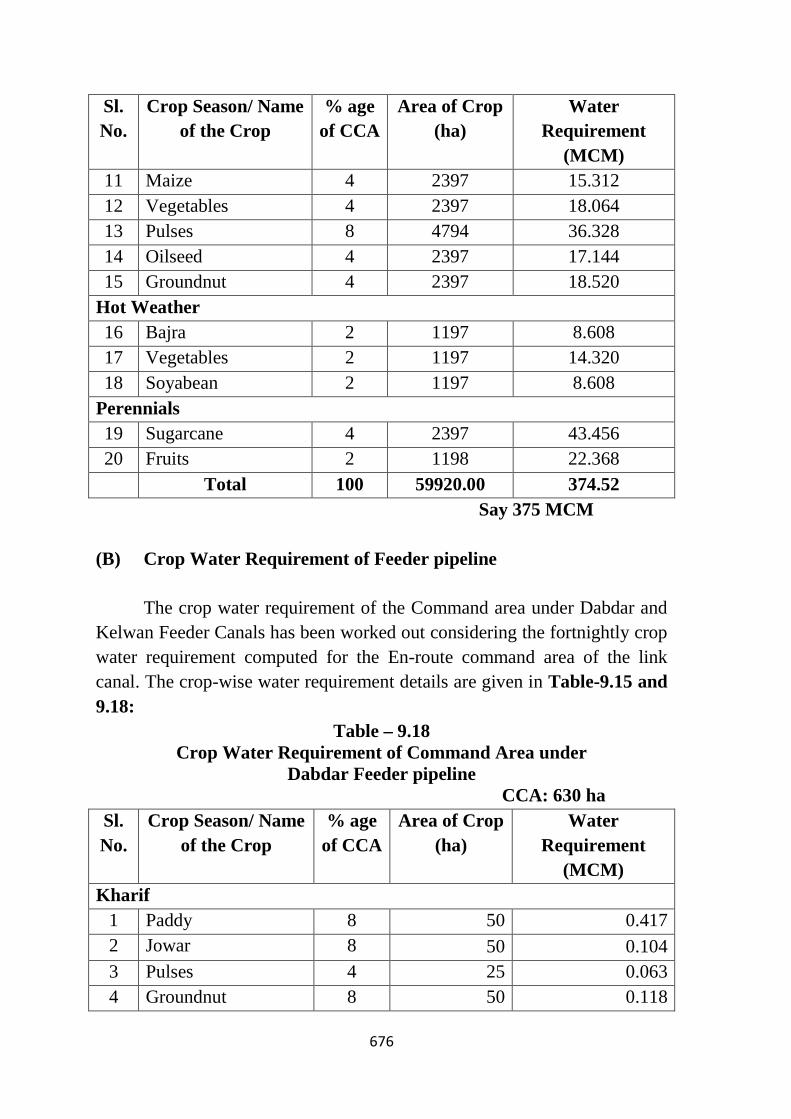
676
Sl. No.
Crop Season/ Name of the Crop
% age of CCA
Area of Crop (ha)
Water Requirement
(MCM) 11 Maize 4 2397 15.312 12 Vegetables 4 2397 18.064 13 Pulses 8 4794 36.328 14 Oilseed 4 2397 17.144 15 Groundnut 4 2397 18.520
Hot Weather 16 Bajra 2 1197 8.608 17 Vegetables 2 1197 14.320 18 Soyabean 2 1197 8.608
Perennials 19 Sugarcane 4 2397 43.456 20 Fruits 2 1198 22.368 Total 100 59920.00 374.52
Say 375 MCM (B) Crop Water Requirement of Feeder pipeline
The crop water requirement of the Command area under Dabdar and Kelwan Feeder Canals has been worked out considering the fortnightly crop water requirement computed for the En-route command area of the link canal. The crop-wise water requirement details are given in Table-9.15 and 9.18:
Table – 9.18 Crop Water Requirement of Command Area under
Dabdar Feeder pipeline CCA: 630 ha
Sl. No.
Crop Season/ Name of the Crop
% age of CCA
Area of Crop (ha)
Water Requirement
(MCM) Kharif
1 Paddy 8 50 0.417 2 Jowar 8 50 0.104 3 Pulses 4 25 0.063 4 Groundnut 8 50 0.118

677
Sl. No.
Crop Season/ Name of the Crop
% age of CCA
Area of Crop (ha)
Water Requirement
(MCM) 5 Oilseeds 8 50 0.117 6 Vegetables 4 25 0.070 7 L S Cotton 4 25 0.118 8 SS Cotton 8 50 0.228
Rabi 9 Wheat 8 50 0.406
10 Jowar 4 25 0.167 11 Maize 4 25 0.161 12 Vegetables 4 25 0.190 13 Pulses 8 50 0.382 14 Oilseed 4 25 0.179 15 Groundnut 4 25 0.195
Hot Weather 16 Bajra 2 13 0.090 17 Vegetables 2 20 0.151 18 Soyabean 2 12 0.090
Perennials 19 Sugarcane 4 25 0.457 20 Fruits 2 10 0.234
Total 100 630 3.900 Table – 9.19
Crop water Requirement of Command Area under Kelwan Feeder pipeline
CCA: 640 ha Sl. No.
Crop Season/ Name of the Crop
% age of CCA
Area of Crop (ha)
Water Requirement
(MCM) Kharif
1 Paddy 8 51 0.422 2 Jowar 8 51 0.106 3 Pulses 4 26 0.064 4 Groundnut 8 51 0.118 5 Oilseeds 8 51 0.118

678
Sl. No.
Crop Season/ Name of the Crop
% age of CCA
Area of Crop (ha)
Water Requirement
(MCM) 6 Vegetables 4 26 0.070 7 L S Cotton 4 26 0.118 8 SS Cotton 8 50 0.234
Rabi 9 Wheat 8 50 0.413
10 Jowar 4 26 0.170 11 Maize 4 26 0.163 12 Vegetables 4 26 0.192 13 Pulses 8 50 0.387 14 Oilseed 4 26 0.182 15 Groundnut 4 26 0.198
Hot Weather 16 Bajra 2 13 0.093 17 Vegetables 2 13 0.154 18 Soyabean 2 13 0.093
Perennials 19 Sugarcane 4 26 0.471 20 Fruits 2 13 0.240
Total 100 640 4.006 9.6.1 Monthly Water Requirement for Irrigation A total quantum of 1144 MCM of water is allocated to meet irrigation demand for about 232175 ha of command area under the Par-Tapi-Narmada link project. Details are given in the following paragraphs. (A) En-route Command Area Monthly water requirement for irrigation in en-route command area has been worked out by Irrigation Planning (South) Directorate, CWC is at Annexures- 9.3, 9.4, 9.5.1 and 9.5.2 in Volume-II. The month-wise break up of water requirement for en-route command area as computed isgiven in Table-9.20:

679
Table – 9.20 Month-wise Water Requirement for En-route Command Area
CCA = 59920 ha Assumed Intensity of Irrigation = 100%
Annual Irrigation = 59920 ha Sl. No. Month Water Requirement (MCM) 1. June 30.38 2. July 20.95 3. August 18.65 4. September 17.88 5. October 18.21 6. November 60.59 7. December 47.29 8. January 46.79 9. February 48.32 10. March 37.82 11. April 14.24 12. May 13.4 Total 374.52
Fortnightly crop water requirement for the en-route command Area
has been detailed in Irrigation Planning of Par-Tapi-Narmada link project prepared by Irrigation Planning (South), Directorate at Annexure-9.8 in Volume-II.The above crop water requirement has been computed considering field irrigation efficiency of 85% for Paddy and 65% for normal ID crops and a conveyance efficiency of 75% for all crops. (B) Monthly Water Requirement of Feeder pipeline
The month-wise break up of water requirement of the Command area under Dabdar and Kelwan Feeder pipe line is given in Table-9.21:

680
Table – 9.21 Month-wise Water Requirement of Command Area under
Dabdar Feeder pipeline CCA = 630 ha
Assumed Intensity of Irrigation = 100% Annual Irrigation = 630ha
Sl. No. Month Water Requirement (MCM) 1. June 0.265 2. July 0.252 3. August 0.216 4. September 0.251 5. October 0.650 6. November 0.498 7. December 0.490 8. January 0.528 9. February 0.332 10. March 0.163 11. April 0.148 12. May 0.107 Total 3.900
Table – 9.22
Month-wise Water Requirement of Command Area under Kelwan Feeder pipeline
CCA = 640 ha Assumed Intensity of Irrigation = 100%
Annual Irrigation = 640 ha Sl. No. Month Water Requirement (MCM) 1. June 0.280 2. July 0.180 3. August 0.140 4. September 0.170 5. October 0.780 6. November 0.520 7. December 0.530 8. January 0.540 9. February 0.367 10. March 0.180

681
Sl. No. Month Water Requirement (MCM) 11. April 0.176 12. May 0.137 Total 4.000 (C) Monthly Water Requirement of Command Area of Narmada
Main Canal (NMC) of SSP to be taken over by the Link Canal This command is already developed and water demands have been kept same as proposed in Sardar Sarovar Project. The monthly water requirements are given in Table-9.23:
Table – 9.23 Month-wise Water Requirement of Target Command Area in
Saurashtra & Kutch by the Link Canal Pressurised Irrigation :CCA-42368
Intensity of Irrigation - 100% Annual Irrigation- 42368ha
Sl. No. Month Water Requirement (MCM
Total(MCM)
For Pressurised Irrigation 1. June 7.38 7.38 2. July 5.46 5.46 3. August 7.65 7.65 4. September 24.94 24.94 5. October 23.26 23.26 6. November 24.44 24.44 7. December 15.85 15.85 8. January 20.40 20.40 9. February 16.33 16.33 10. March 8.31 8.31 11. April 3.48 3.48 12. May 3.50 3.50 Total 161.00 161.00
(D) Also, 285MCM for projects proposed by Government of Gujarat, 138 MCMfor Tribal areas lying enroute right side, 48 MCM for Tribal area in the vicinity of the reservoirs, 90MCM&40 MCM for Tribal areas on right

682
side of the Narmada Main canal in Chhota Udepur & Panchmahal districts are planned in the irrigation planning of Par-Tapi-Narmada link project. 9.7 Water Planning 9.7.1 Surface Water 9.7.1.1 Total Irrigation Demand of the Link Project
The gross irrigation demand of the link project in vicinity of reservoirs, en-route of link canal / Pipe line, Projects proposed by Government of Gujarat, Tribal area right side of link canal and for tribal areas of Chhota Udepur and Panchmahal districts and Saurashtra works out to be 1144 MCM. 9.7.1.2 Domestic & Industrial Use and Filling of tanks in the
Periphery of Reservoirs 9.7.1.2.1 Supply of Drinking water for villages and filling of village and Panchayat tanks A provision of 76 MCM has been made for supply of drinking water to 27.5 lakh populations for villages of Valsad, Navsari, Dang, Tapi, Surat, Bharuch, Narmada and Vadodara district of Gujarat and Nasik district in Maharashtra State. In adition to above, provision of 50 MCM has been kept for filling of 2226 village and panchayat tanks located in Valsad, Navsari, Dang, Tapi, Surat, Bharuch, Narmada and Vadodara district of Gujarat and Nasik district in Maharashtra State.
9.7.1.4 Environmental Releases
The minimum environmental flow demand in the river is considered as 10% of the average annual lean season flows at the respective reservoirs/barrages during the period from October to May are given in Table 9.24:
Table 9.24 Demands for Environmental Flow
Sl. No.
Reservoir / Weir Minimum Downstream Release for Environmental Needs (MCM)

683
Sl. No.
Reservoir / Weir Minimum Downstream Release for Environmental Needs (MCM)
1 Jheri reservoir 4.40 2 Paikhed reservoir 3.20 3 Paikhed barrage 0.00 4 Chasmandva reservoir 0.80 5 Chasmandva barrage 0.00 6 Chikkar reservoir 1.60 7 Dabdar reservoir 4.00 8 Kelwan reservoir 4.80 9 Ukai reservoir 0.00 Total 18.80
Say 20 MCM The monthly Environmental releases works out to 2.35 MCM from
October to May month. 9.7.1.5 Evaporation losses A provision of 40 MCM is kept to meet evaporation losses. 9.7.1.6 Total Water Demand of the Link Project
The total water demand of the link project include: i) Irrigation water
demand of 1144 MCM, ii) Drinking water demand of 76 MCM iii) For filling of tanks 50 MCM (32 MCM in the vicinity of proposed reservoirs iv) Environmental demand of 20 MCM downstream of 6 reservoirs) and v) Evaporation losses from 6 reservoirs to an extent of 40 MCM.Thus, the total water demand of the Par-Tapi-Narmada link project is 1330MCM. The total monthly water demands of the link project are furnished in Table-9.25:

684
Table – 9.25 Total Monthly Water Demand of the Link Project
Sl. No.
Month Irrigation Provision for
Drinking water
Filling of
Tanks
Environmental Relea
ses
Total Water
Demand
1 2 3 4 5 6 7 1. June 72.29 6.32 0.00 0.00 78.61 2. July 53.15 6.32 0.00 0.00 59.47 3. August 54.84 6.32 0.00 0.00 61.16 4. September 109.36 6.32 0.00 0.00 115.68 5. October 171.36 6.32 0.00 2.35 180.03 6. November 153.89 6.32 8.31 2.35 170.87 7. December 127.75 6.32 8.31 2.35 144.73 8. January 146.38 6.32 8.31 2.35 163.36 9. February 109.38 6.32 8.31 2.35 126.36 10. March 60.38 6.32 8.31 2.35 77.36 11. April 45.72 6.32 8.31 2.35 62.70 12. May 39.50 6.32 0.00 2.35 48.17 Total : 1144.00 75.84 49.86 18.80 1288.50 Say 1144.00 76.00 50.00 20.00 1290.00 Evaporation losses 40.00 Grand
Total 1330.00
9.7.1.7 Working Tables
Six reservoirs viz. i) Jheri, ii) Paikhed, iii) Chasmandva, iv) Chikkar, v) Dabdar and vi) Kelwan are proposed across the rivers Par, Nar, Tan, Ambica, Khapri and Purna respectivelyfor diversion of surplus waters in to Par-Tapi-Narmada link canal. Working table for 32 years from 1975-76 to 2006-07 have been prepared in an integrated manner, based on storage capacities of all these reservoirs to ascertain the success rate of the project in meeting the proposed water demands. The details of working tables/simulation studies are already discussed in Chapter-5: Hydrology & Water Assessment under Para -5.17 “Simulation studies”. The simulation

685
studies show that the reservoirs are 100% successful in meeting Environmental, Domestic & Industrial demands at their peripheryand diversion demand of link canal between Auranga & Tapi Rivers. The reservoirs are 78% successful in meeting the Diversion demand of link canal beyond Tapi River.Working tables for 32 years from 1975-76 to 2006-07 are given in Annexure-9.9 and abstract of the working tables are given at Annexure -9.10 in Volume-II.
9.7.1.8 Designed Head Discharge of Canal Systems
The canal/tunnel capacities at the Off-take points of reservoirs and
en-routeare worked out by Irrigation Planning (S) directorate of CWC and given at Annexure-9.10 in Volume-II. A provision of 10 % additional capacity has been provided towards rush irrigation and furnished in Table: 9.26:
Table – 9.26 Canal /Tunnel Capacity at off-take Points and En -route
Reservoir / Weir/Canal
Canal/Tunnel Capacity (cumec)
Jheri Reservoir Tunnel connecting Jheri and Paikhed reservoirs
12.80
Paikhed Weir Par-Tapi-Narmada Link Canal at head 38.17 Link Canal Link Canal between Paikhed weir and
Chasmandva Feeder 38.17
Chasmandva Weir
Chasmandva Feeder Canal 8.50
Link Canal Link Canal between Chasmandva Feeder and Dabdar Feeder
46.64
Chikkar Reservoir Chikkar and Dabdar interconnecting canal 6.40 Dabdar Reservoir Dabdar Feeder Canal 17.00 Link Canal Link Canal between Dabdar Feeder and
Kelwan Feeder 46.64
Kelwan Reservoir Kelwan Feeder Canal 17.00 Link Canal Link Canal between Kelwan Feeder and
Ukai reservoir 63.69
Link Canal Off-take from Ukai reservoir 46.64

686
9.7.2 Ground Water 9.7.2.1 Ground Water Quality
The proposed Command Area of the link canal lies in Navsari, Dangs, Tapi, Surat and Bharuch districts of Gujarat.
Geologically the Navsari district comprises of Alluvium (Clay & Sand) & Trap. Basaltic out crops are seen in Vansda taluka in which the Command area lies. Ground water availability in alluvial formations is satisfactory. In Trap area, the availability of groundwater is less. The groundwater quality in the Command area is good.
Geologically the Dangs district is composed of Deccan trap Basalt. Basalt acts as poor aquifer. The water quality is very good.
Geologically the Tapi district is comprises of Deccan trap Basalt of Cretaceous-Eocene age, which is overlain by quaternary alluvium. The groundwater availability is poor in hard rock area but its quality is good.
Limestone & clay formation of Eocene ages and quaternary alluvium formation are seen in Surat district. The groundwater availability and quality is good in the proposed Command Area.
Geologically, Bharuch district is mainly divided in to 2 types of rocks. Alluvial formations are seen in western side. In the eastern side, where the Command area lies, Basaltic rocks are seen. Groundwater availability and quality is good in the proposed Command Area. Overall, the level of groundwater development in the proposed Command area of the link project can be categorized as “Safe”.
RD 51.043 Km to 69.150 Km 36.40
RD 69.150 Km to 82.171 Km 31.89
RD 82.171 Km to 191.310 Km 17.26

687
9.7.2.2 Conjunctive Use / Ground Water Support
In order to make an economic and efficient use of available water resources, it is essential that a judicious mix of surface and ground water are resorted to for irrigation purposes. There is considerable scope to further intensify the irrigation in the command areas by making use of the ground water resources available. This may further facilitate in checking the hazards of water logging and soil salinity in the command.
In the present planning, no use of ground water is proposed in any of the command. However, the available ground water resource can be utilized in future for further intensification or augmentation of the irrigation facilities in various commands, particularly to meet the irrigation requirement during lean season. 9.8 Command Area Drainage
The command area en-route the link canal is drained by a network of rivers namely Par, Auranga, Ambica and Purna in addition to number of small streams and nallahs. The commands have quite good draining facilities. However, with the introduction of irrigation, as the command area develops, drainage problem may crop up in the course of time. Suitable provision is, therefore, made in the project estimate towards chalk and collecting drains in the command area. 9.9 Water Course / Field Channels
These are small channels to deliver water to each and every field in the command area of an outlet which is approximately 40 ha for a delivery system of one cusec. Water course generally off takes from a minor or distributaries. Capacity of a water course depends upon (a) Water allowance (b) running period of outlet and (c) Area to be irrigated.
Branch canals, major/minor distributaries, sub-minors & water
courses /field channels etc., are planned and designed to facilitate in carrying water from their out lets upto the tail end, at very short time, preventing loss of seepage in agricultural land. The rate per hectare arrived

688
on the basis of a representative sample area surveyed. Thus, the total cost of U-Distributaries, minors & sub-minors and V-Water courses/field channels in the whole command area of the link project has been arrived.
Three sample areas have been selected for command area surveys viz Wankal,Valiya and Mandavi. The grid survey of proposed command area under the Mandavi Branch canal which off-takes at RD 51.525 km of Tapi-Narmada portion of Par-Tapi-Narmada link has been carried out, covering an area of 1300 ha has been selected for cost estimation of command area development. The estimated cost/ha of CCA works out to Rs.38701/- (price level 2013-14), inclusive of U-Distributaries, Minors and Sub-minors and V-Water courses/field channels. The details are at Appendix Volume-VI. 9.10 Water Management 9.10.1 Review and Evaluation of Existing System of Operation and
Distribution in the Command and/or in some Adjoining Projects, if any
Maximum gains in water use efficiency can only be made when these
are combined with better management practices. Keeping this concept in view, the Government of Gujarat has decided to cover maximum possible command area under Participatory Irrigation Management to ensure that irrigation water is distributed efficiently and equitably in the command area and that it be used efficiently through Participatory Irrigation Management (PIM). Where irrigation Co-Operatives maintain the canal network and field channels, expand irrigated area and distribute and provide tail-enders their fair and just share of water. Rehabilitation of existing canal network through stakeholders' participation to make water available to tail-enders is given priority.
9.10.2 Proposals for Participatory Irrigation Management Including
Formation of Water Users Association
The Government of Gujarat has taken up initiative to involve beneficiaries and stakeholders in irrigation management by enacting PIM Act in 2007. Under the provisions of this Act, Water Users' Association (WUA) is formed from amongst the beneficiary farmers in command area of an irrigation project. 90% of cost for community mobilization is borne by

689
the Government. Rehabilitation of canals is completed by the Government before handing over to WUAs. The WUA contributes 10% of the rehabilitation cost. Preference is given to WUA to carry out rehabilitation by them. A canal can be handed over to WUA even prior to rehabilitation, if the WUA so demands. Advance payment of the order of 1/3rd of the estimated cost is given to WUA for starting the work. Under the provisions of the Act, a WUA is authorized for;
Collecting Government water charges Retention of 50% for O&M permitted, rest goes to the Government Deciding water rates higher than the Government charges Retaining entire additional amount Increasing women's participation in the WUA Similar practice can be adopted in Par – Tapi – Narmada link project also. 9.10.3 Scope of Introduction of Modern Technology Like Sprinklers,
Drip Irrigation etc. A total command area of 232175 ha is envisaged under the Par-Tapi-Narmada link project with intensity of irrigation as 100%. Out of the above, 125424 ha area covered under Chhota Udepur & Panchmahal Districts (34342 ha) covered by lift from Narmada Main canal, target area under Saurashtra region (42368 ha), enroute area lying on right side of the link canal (36200 ha), area in the vicinity of the six proposed reservoirs (12514 ha) is planned to be irrigated by Drip & Sprinkler irrigation Systems.Government of Gujarat has also suggested to adopt pressure irrigation where lifting of water is involved. 9.10.4 Existing Practice of Department of Agriculture for
Popularizing Micro Irrigation
Gujarat Green Revolution Company limited is an implementing agency for implementation of Micro Irrigation Scheme on behalf of Government of India and Government of Gujarat in Gujarat State through reputed authorized Micro Irrigation System suppliers, who supplies and

690
installs the Micro Irrigation System and also provides agro services pertaining to Micro Irrigation System. It is aim to bring 2nd Green Revolution in the State by saving of water, electricity and enhancing agriculture productivity resulting in the farmers prosperity at large.
The Gujarat Agro Industries Corporation (GAIC) and Agricultural
Produce Marketing Committee (APMC) adopts various programs and schemes for the Agriculture and Horticulture segment for investments and other processing subsidies in the Food Processing Sector. Agri implement service help is provided by the government for open pipelines and purchase of Tractor, etc. Bio gas subsidies are offered with loan application.
9.10.5 Facilities for Training the Operation and Maintenance
Personnel at Different Levels of Management and Farmers-Adequacy of Existing Facilities and Proposals for Augmentation Water Resources Department through Water & Land Management
Institute (WALMI) initiated systematic and intensive training courses and orientation programs for all stake holders at each level. Adequate training facilities are available to the farmers. Due to latest technology like Television and Mobile phones available in each house, farmers get to know the latest in the agricultural field and Government schemes, subsidies etc.Training to the farmers at their native villages may be imparted on various crops suitable in area specific agro climatic zone and also on Pressurrised irrigation practices.
9.10.6 Existing Extension Activity andProposals for its Improvement
The Agriculture & Co-operation Department, Government of Gujarat
provides Training and extension services to educate the farmers about the use of improved and modern agriculture technology, and cultivation of high value crops. The department is organizing Krushi Mahotsavs (Lab to Land programme) with 'Krushi Raths' (vans) reaching to farmers with Researchers, Scientists and experts interacting and providing information and counseling on soil health, organic farming, technology and inputs, irrigation etc. Gujarat is the first State to issue Soil Health Cards to farmers which helps them in getting good yields. Agri-implements subsidies,

691
Agriculture Support Schemes, Seeds Sahaya etc. are some of the schemes launched by the Agriculture & Co-operation Department, Government of Gujarat for the benefit of farmers. 9.11 Command Area
Location, Gross Command Area, Cultural Command Area, En-route
irrigation demand etc are at Para 9.1.1 and descriptions of the Command Areas have already been given in previous paras. 9.11.1 Command Area Details 9.11.1.1 Location
The entire Command area proposed under Par-Tapi-Narmadalink project lies in Gujarat. En-route command area under the link canal is divided in to 2 parts viz. i) Command Area lying in Par-Tapi reach and ii) Command Area lying in Tapi-Narmada reach. The Gross Command Area (GCA) in Par-Tapi reach is 11448 ha and it lies in Vansdataluka of Navsari district and Vyara&Songadhtalukas of Tapi district. The Gross Command Area in Tapi-Narmada reach is 57345 ha and it lies in Songadhtaluka of Tapidistrict, Mandvi&Mangroltalukas of Surat district and Valia, Ankaleswar&Zagadiatalukas of Bharuch district. Maps showing en-route command area are given as Plates 4.40 (total 5 sheets) in Volume - VII.Locations of command area have already been given at Table 9.2 and 9.3. Abstract of District / Taluka wise break-up of the en-route command area are given at Table-9.27:
Table- 9.27 Abstract of District/Talukawise Details of En-route Command Area
Sl.No. District Taluka GCA (ha) CCA (ha) I Par-Tapi reach
a) Navsari Vansda 4096 3285 b) Tapi Vyara 5162 4825 Songadh 2190 1990
Sub-total 11448 10100 II Tapi-Narmada reach
a) Tapi Songadh 1017 987 b) Surat Mandvi 9693 8978 Mangrol 25179 21568

692
Sl.No. District Taluka GCA (ha) CCA (ha) c) Bharuch Valia 8816 7557 Ankaleswar 11800 10017 Zagadia 840 713 Sub-total 57345 49820
III Feeder Pipe lines a) Dabdar Feeder Pipe line Dangs Ahwa 714 630
b) Kelwan FeederPipe line Dangs Ahwa 725 640
Sub-total 1439 1270 Grand-total 70232 61190
9.11.1.2 Classification of Land (Forest, Grass Land, Cultivable Land, Cultivable Waste, Barren Land)
The classification of land in en-route command area is furnished in Table-9.28:
Table: 9.28 Reach-wise Land Use Particulars in the En-route Command Area Unit: ha
Land Par-Tapi Reach
Tapi-Narmada Reach
Feeder pipe line Total Dabdar Kelwan
Agriculture 10194 44620 233 236 54814 Forest 559 149 429 436 708 Land with scrub 143 2506 52 53 2649 Land without scrub 454 5494 0 0 5948 Mining 0 895 0 0 895 Water bodies 5 201 0 0 206 River 33 218 0 0 251 Towns 14 2305 0 0 2319 Villages 46 780 0 0 826 Industrial 0 177 0 0 177 Gross Command Area
11448 57345 714 725 70232
Source: Technical Report: Demarcation of command area en-route PTN link-March, 2011, prepared by RRSC, Jodhpur.

693
9.11.1.3 Size of Land Holding
The size of land holding and area in the Districts lying in the en-route command area as per Agriculture census 2005-06 is given in Table-9.29:
Table-9.29
Size of Land Holding in the En-route Command Area Area: ha
Size Class Navsari Tapi Surat Bharuch No Area No Area No Area No Area
Marginal (Up to 0.99)
76938 24779 23732
10406 54050 25237 43096 21687
Small (1.00-1.99)
21215 30108 19052
27535 38139 55216 33660 48848
Semi medium (2.00-3.99)
14346 39827 14762
41462 31221 87803 30292 84930
Medium (4.00-9.99)
6090 34511 7993 46061 15100 85334 21021 124891
Large (10&Above)
623 12932 882 16240 1121 17282 2935 43347
All Classes 119212
142157
66421
141705
139631
270871
131004
323703
Source: Agriculture census–2005-06 (Part-I), Report on Operational Holdings, Revenue Department, Government of Gujarat, 2011. 9.11.1.4 Climate of Command Area
The climate of en-route command is as given below: a) Rainfall: The annual mean rainfall in the command is about 1700 mm,
the mean monsoon rainfall is around 1670 mm and mean non-monsoon rainfall is about 36 mm. Maximum rainfall occurs in the month of July and the minimum rainfall occurs in June during monsoon.

694
b) Temperature: The climate of the Command Area is characterized by a
hot summer except in the Monsoon season during June to Sept. The climate is moderately cold in winter. Maximum temperature recorded in the vicinity of the Command area was 48°C and minimum winter temperature recorded was5°C.
c) Relative Humidity: The maximum and minimum relative humidity in & around the command area are 89% and 32% respectively.
d) Evaporation: The monthly mean evaporation in the command area varies between 10 cm & 25 cm.
9.11.1.5 Irrigation
(a) Present Sources of Irrigation in Command
The present source of irrigation in proposed command area is mainly wells including Tube wells.
(b) Methods of Irrigation Followed
At present, the conventional method of applying water through minor
irrigation channels, distributaries and water courses is being followed in these areas. However, sometimes electric/diesel pump sets are also used to lift water from the streams and wells.
(c)Status of Land Development for Irrigated Area (i)Condition of Channels The condition of existing irrigation channels in the command area is generally satisfactory except in some reaches where proper maintenance is required. Most of the channels are unlined, hence susceptible to loss of water through seepage.
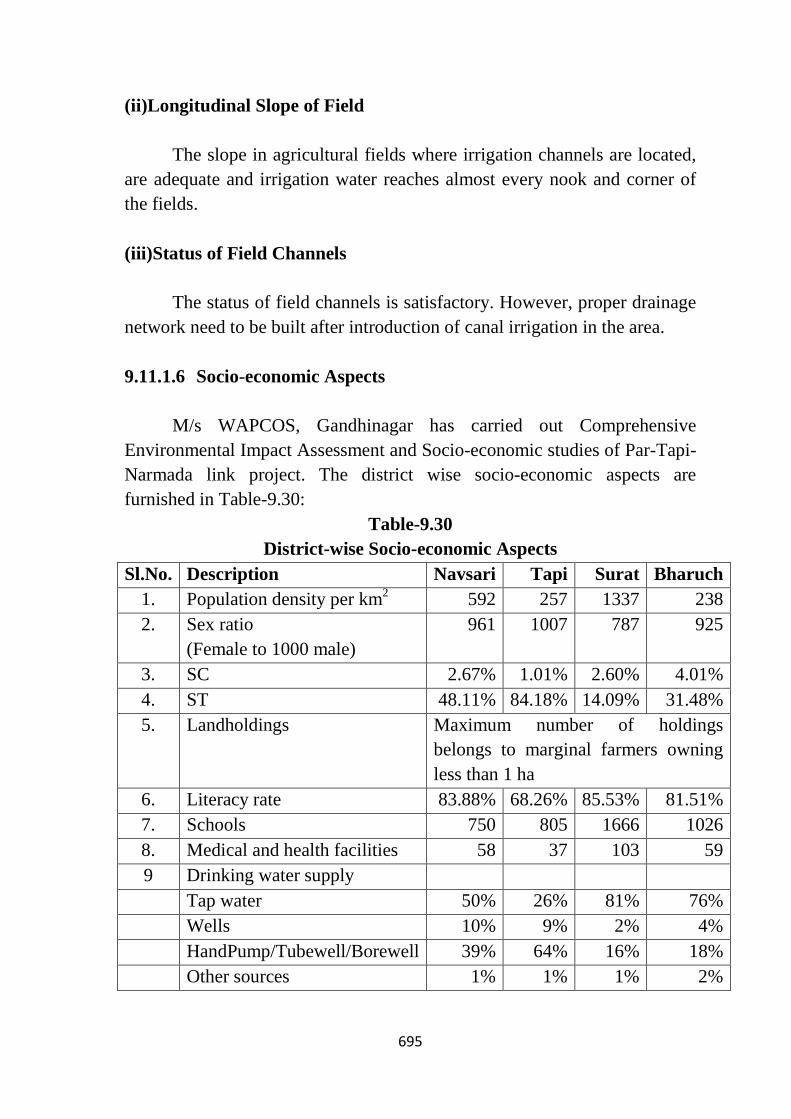
695
(ii)Longitudinal Slope of Field The slope in agricultural fields where irrigation channels are located, are adequate and irrigation water reaches almost every nook and corner of the fields. (iii)Status of Field Channels
The status of field channels is satisfactory. However, proper drainage
network need to be built after introduction of canal irrigation in the area. 9.11.1.6 Socio-economic Aspects
M/s WAPCOS, Gandhinagar has carried out Comprehensive
Environmental Impact Assessment and Socio-economic studies of Par-Tapi-Narmada link project. The district wise socio-economic aspects are furnished in Table-9.30:
Table-9.30 District-wise Socio-economic Aspects
Sl.No. Description Navsari Tapi Surat Bharuch 1. Population density per km2 592 257 1337 238 2. Sex ratio
(Female to 1000 male) 961 1007 787 925
3. SC 2.67% 1.01% 2.60% 4.01% 4. ST 48.11% 84.18% 14.09% 31.48% 5. Landholdings Maximum number of holdings
belongs to marginal farmers owning less than 1 ha
6. Literacy rate 83.88% 68.26% 85.53% 81.51% 7. Schools 750 805 1666 1026 8. Medical and health facilities 58 37 103 59 9 Drinking water supply Tap water 50% 26% 81% 76% Wells 10% 9% 2% 4% HandPump/Tubewell/Borewell 39% 64% 16% 18% Other sources 1% 1% 1% 2%

696
Source: 1. State, District and Talukawise Salient Features of Population statistics (2001 and 2011) Gujarat, Directorate of Economics & Statistics;
2. Statistical Outline Gujarat State 2012, Directorate of Economics & Statistics;
3. Socio-Economic review 2013-2014, Gujarat State. 9.11.1.7 Infrastructure Facilities (a)Roads and Railways
Details of roads and railways of the districts falling in the en-route command area are given in Table-9.31:
Table-9.31
Distribution of Roads and Railways in the en-route command area District Length of all
Weather Roads (km)
Length of Railway line(km)
Total Length of Transport Network (km)
Navsari 2870 71 2941 Tapi 2242 82 2324 Surat 3803 242 4045 Bharuch 1309 168 1477 Source: Brief industrial profiles of districts, prepared by MSME-
Development Institute, Government of India, Ahmedabad.
(b) Marketing Facilities (i) Navsari District
Almost all the villages falling under the proposed command with in
Vansda taluka are dependent on the marketing facilities available in Vansda, Navsariand Chikhli towns. These included about 8 co-operative marketing societies available in this taluka. There are 4 Main Agriculture Market Yards and 3 Sub-Market Yards in Navsari district.
(ii) Tapi District
The nearest marketing places for the people residing in Vyarataluka
in the en-route command area of Vyara and Valod. The nearest marketing

697
places for the people residing in Songadhtaluka in the en-route command is at Songadh. There are 5 Main Agriculture Market Yards and 12 Sub-Market Yards in Tapi district.
(iii) Surat District
Good marketing facilities are available for the people of the command
areas in Mandvi and Mangroltalukas of Surat district. In addition, numerous fair price shops, within reasonable distances are available in all villages. There are 7 Main Agriculture Market Yards and 14 Sub-Market Yards in Surat district.
(iv) BharuchDistrict
In 3 talukas viz. Valia, Ankaleswar and Zagadiaof Bharuch district, good marketing facilities are available. There are 7 Main Agriculture Market Yards and 13 Sub-Market Yards in Bharuch district.
(c) Agro-industries (i) Navsari District
Cotton Textile, Paper & Paper products, Oil products, Kachori
Making/Food Products and Sugar mills are the major Agro-industries established in district. Floriculture projects are also coming up in the district.
(ii) Tapi District
Sugar, Textile and Paper mills are the major Agro based industries in
the district. J K Paper Ltd is in Songadh taluka of the district.
(iii) Surat District
Sugar and Textile mills are the major Agro-industries in the district.
(iv) Bharuch District

698
Cotton mills, Oil mills, Poultry & Fish Feeds are the major agro based industries located in this district.
(d) Banks/Credit Societies etc. (i) Navsari District
There are 137 Commercial banks, 25 Rural banks, 25 Co-operative
banks and 21 PLDB branches are located in this district.
(ii) Tapi District
There are 40 Commercial banks, 3 Rural banks, 11Co-operative banks and 4 PLDB branches are located in this district.
(iii) Surat District
There are 200 Commercial banks, 9 Rural banks, 111Co-operative
banks and one PLDB branch are located in this district.
(iv) Bharuch District
There are 129 Commercial banks, 23 Rural banks, 47 Co-operative banks and 8 PLDB branches are located in this district. 9.11.1.8 Topography and Soils (i) Topography and Relief
Topography of the command area is undulating and of moderate
slope. Basaltic out crops are seen in Vansda taluka of Navsari district in which the Command area lies. The Command Area in Tapi district is comprises of Deccan trap Basalt of Cretaceous-Eocene age, which is overlain by quaternary alluvium. Limestone & clay formation of Eocene ages and quaternary alluvium formation are seen in Command Area lying in Surat district. In the eastern side of Bharuch district, where the Command Area lies, Basaltic rocks are seen.

699
(ii) Land Slopes
Slopes of the lands in the command are generally moderate neither steep nor flat.
(iii) Soils
The details of soils present in the Command area are already given
under Para 9.3 above. The soils in the command area can be broadly classified into 3 main categories viz. i) Deep Black, Medium Black to Loamy Sand (Goradu) soils, ii) Deep Black with Alluvial, Laterite and Medium Black Soils and iii) Deep Black Clayey Soils. 9.11.1.9 Ground Water and Drainage
Ground water assessment has been made for the en-route command
area based on data collected from Central Ground water Board (CGWB). Details are furnished in Table -9.32:
Table -9.32
Assessment of Groundwater Availability in the Proposed En route Command Area
Sl. No.
District Geographical Area (km2)
Estimated Potential (MCM
Present Draft (MCM)
%age Area of District in Proposed Command Area (km2)
Estimated Potential in the Command (MCM)
Present Draft in the Command (MCM)
Balance Ground Water Potential (MCM)
Par-Tapi reach I Navsari 2200.77 405.46 185.93 1.86 7.54 3.46 4.08 II Tapi 3434.64 354.74 110.30 2.14 7.59 2.36 5.23 Sub-
total 15.13 5.82 9.31

700
Tapi-Narmada reach I Tapi 3434.64 354.74 110.30 0.30 1.06 0.33 0.73 II Surat 4326.97 856.33 365.12 8.06 69.02 29.43 39.59 III Bharuc
h 5253.00 409.16 184.10 4.08 16.69 7.51 9.18
Sub-total
86.77 37.27 49.50
Grand-total 101.90 43.09 58.81
Though the soils in the Command Area are mainly clayey soils, as the slope of the land is less than 5% and Groundwater depth is more than 1.5 m no drainage problem is anticipated. With the network of a number of tributaries of Kharera, Kelia, Kaveri, Ambica, Purna, Kim and Amravati Rivers, the command area has good drainage facilities. Thedistrict wise total utilisable/extractable Ground Water Availability and net draft in the command area in pre & post project scenario are given in Annexure- 9.25.In the command area, the stage of groundwater development is less than 70% and hence falls under the “Safe Category” 9.11.1.10 Agriculture
The classification of lands and the present land use in en-route
Command Area has already been discussed in this chapter under Para 9.11.1.2. Proposed land use will change due to increase in cultivated area and increase in developmental activities due to this project. The Cropping Intensity and Intensity of irrigated crops in the districts of en-route Command Area are given in Table-9.33:
Table-9.33
Cropping Intensity and Intensity of Irrigated Crops in En-route Command Area (Season and Crop Report 2007-08)
Sl. No.
District Cropping Intensity (%)
Intensity of Irrigated Crops(%)
1 Navsari 118 117 2 Tapi 118 123 3 Surat 106 109

701
Sl. No.
District Cropping Intensity (%)
Intensity of Irrigated Crops(%)
4 Bharuch 108 107 Source: Irrigation in Gujarat, 2011-12, Directorate of Economics &
Statistics The details of percentage of food crops to total cropped area and
percentage of Irrigated food crops to total Irrigated area in the districts of en-route Command Area are given in Table-9.34:
Table-9.34
District-wise Percentage of Food Crops in En-route Command (Season and Crop Report 2007-08)
Sl. No.
District %age of Food Crops to Total Cropped
Area
%age of Irrigated Food Crops to Total Irrigated Area
1 Navsari 83.87 97.90 2 Tapi 83.23 77.18 3 Surat 85.90 94.58 4 Bharuch 53.64 58.33
Source: Irrigation in Gujarat, 2011-12, Directorate of Economics & Statistics
The details of percentage of Non-food crops to total cropped area and percentage of Irrigated non-food crops to total Irrigated area in the districts of en-route Command Area are given in Table-9.35”
Table-9.35
District-wise Percentage of Non Food Crops in the En-route Command (Season and Crop Report 2007-08)
Sl. No.
District %Age of Non-Food Crops to Total Cropped Area
%Age of Irrigated Non-Food Crops to Total Irrigated Area
1 Navsari 16 2 2 Tapi 17 23 3 Surat 14 5 4 Bharuch 46 42
Source: Irrigation in Gujarat, 2011-12, Directorate of Economics & Statistics

702
The yield of principal crops in the Districts of en-route Command Area is given in Table-9.36:
Table-9.36
Yield of Principal Crops in Districts of En-route Command Area (2004-05)
Sl. No.
Crop Yield in kg/ha Navsari Surat* Bharuch
1 Rice 2332 1731 1431 2 Jowar 1563 1486 763 3 Bajra - 1024 1111 4 Wheat 3000 2488 1479 5 Maize - 922 922 6 Gram 627 802 627 7 Groundnut 1571 1415 1533 8 Rape seed & Mustard - - 1391
Source: Statistical Abstract of Gujarat State, 2009 – Directorate of Economics & Statistics, Gandhinagar.* Include Tapi District area. 9.11.1.11 Farmers’ Attitude Towards Improved Agricultural Practices
The increase in Intensity of Irrigated crops in the area leads to
increase in the agricultural production which in turn makes agriculture remunerative. Therefore, the farmers will have a positive attitude towards improved agricultural practices.
(a) Use of Improved Implements and Seeds
Sixty eight percent of Agricultural holdings in the Districts lying in
en-route Command Area are Small & marginal (less than 2 ha). The Input Survey carried out by Revenue Department, Government of Gujarat in 2006-07 shows that among all groups of Holdings in which Tractors were used, 38% were used in Small & marginal holding for Agricultural purposes. Among all groups of Holdings in which Tractor drawn Seed Drill Cum Fertilizer Drills were used, 41% were used in Small & marginal holdings. Among all groups of Holdings in which Power Threshers were

703
used, 42% were used in Small & marginal holdings. Among all groups of Holdings in which Sprinklers were used, 47% were used in Small & marginal holdings. Among all groups of Holdings in which Drip Irrigation Sets were used, 34% were used in Small & marginal holdings. Among all groups of Holdings in which Certified seeds were used, 63% were used in Small & marginal holdings. Among all groups of Holdings in which Notified seeds were used, 62% were used in Small & marginal holdings. Among all groups of Holdings in which Hybrid seeds were used, 53% were used in Small & marginal holdings. This shows that farmers in general are willing to use improved agricultural implements and seeds.
(b) Use of Fertilizers, Insecticides, Pesticides, etc.
Input survey carried out by Revenue Department, Government of
Gujarat indicated that in 86% of agricultural holdings having irrigation facilities, Chemical Fertilizers were used and in about 80% of these holdings crops were treated with Pesticides. In un-irrigated holdings the use of Chemical Fertilizers & Pesticides was recorded as 62% and 65% respectively. It shows that usage of Fertilizers & Pesticides is very common among the farmers in the State. Farmers in the Command Area are also inclined to use Fertilizers, Insecticides, Pesticides, etc. in their farms. 9.11.1.12. Identification of Problems in En-route Command Area (i) Physical Problems Including Hazards
(a) Land Slopes: The land is generally undulating; therefore, canal
distribution system has to be aligned accordingly. (b) Soil Depth: There may not be any problem on this account, as sufficient
soil depth is available in the area for providing canal irrigation. (c) Salinity/Alkalinity: Since the Par, Nar, Tan, Ambica, Kapri and Purna
Rivers’ water, which does not have Salinity/Alkalinity problem, will be used for irrigation no Salinity/Alkalinity problem is expected in the Command Area.

704
(d) Water Logging: No water-logging problem of serious nature has been reported from the area. But after introduction of irrigation, the Command Area shall be monitored for water logging as the soils in the Command Area are mainly clayey soils.
(e) Drainage: As area is undulating with moderate slopes no drainage
problem is anticipated. However, keeping in view the soil type present in the Command suitable drainage network shall be provided.
9.11.1.13 Financial Problems
Kisan credit cards issued by State Government,Primary Agricultural
Credit Societies, Regional Rural Bank Branches, Commercial Bank Branches and Primary Land Development Banks will meet the credit needs of the farmers and hence no financial problems need to be faced by the farmers.
9.11.1.14 Proposed Cropping Pattern with Justification based on Land
Irrigability Classification, Agro Climatic Conditions Developed Irrigated Cropping Pattern in Adjoining Project / Area etc.
Proposed cropping pattern of en-route command and target command has been developed based on the Land irrigability and capability classification along with agro climatic conditions of the region. The details of proposed cropping pattern for the command area have been covered in Irrigation Planning. 9.11.1.15 Land Development Work Proposals
As the area is already under rain-fed cultivation, no major land
development works are required. However, a provision of Rs. 72547 lakh has been kept in the estimate for land development works wherever required. At the time of implementation of the project, detailed survey of each command will be done and based on the requirement, land development works will be taken up. This work will be done by State Irrigation Department or State Agriculture Department or Command Area

705
Development Authority (to be decided by concerned State Governments). Estimate comprising land levelling charges are given in Annexure-13.4 in Appendix Volume-VI (A).
At present fairly good extension services exists in the command area and number of commercial banks and co-operative banks also have their branches there. Branches of land development banks are also located in some rural areas of the command. Moreover, the agricultural materials like seeds, fertilizers, insecticide, pesticides, etc. are provided to the farmers by the concerned government department at subsidized rates through different sale booths or fair price shops. 9.11.1.16 Ayacut Roads
Suitable provisions for CD structures will be made to avoid traffic disruption through ayacut roads. 9.11.1.17 Benefits (i) Crop-wise Increase in Yield per ha and Total Estimated Output from the enroute Command The irrigation under Par-Tapi-Narmada link project has been planned such a way that the diverted water will be utilized judiciously and optimally to bring more area under irrigation for benefitting as many farmers as possible. To achieve this objective an intensity of irrigation of 100% has been adopted for the entire command area of the link project. The cropping pattern is proposed keeping in view the existing crop practices in the command area and the need for optimum utilization of water for obtaining better yields and returns. Pressurized Irrigation method has been adopted for the command area covered by lift irrigation. And also, cropping pattern with good mix of Food and Commercial crops has been adopted to maximize crop yields and returns in the post project scenario. The crop-wise yields per ha under pre and post project scenarios in the command areas are furnished below.

706
The crop-wise yields from the enroute command in pre & post project
scenarios are given in Table-9.37:
Table-9.37 Crop-wise Yield under Pre and Post Project Scenarios in En-route
CCA: 59920 ha Sl. No.
Name of Crop
Pre Project Scenario Post Project Scenario Area (ha)
Yield per ha in qtls
Gross Yield in
qtls
Area (ha)
Yield per ha in qtls
Gross Yield in
qtls A Kharif 1. Paddy 5992 16.40 98269 4794 40.00 191760
2. Jowar 9587 13.33 127795 4794 20.00 95880
3. Pulses 599 4.36 2612 2397 10.00 23970
4. Groundnut 3595 11.00 39545 4794 20.00 95880
5. Oilseeds 2397 12.23 29315 4794 12.93 61986
6. Vegetables 7191 80.00 575280 2397 130.00 311610
7. Fodder 13182 30.00 395460 0 0 0
8. LS Cotton 0 0 0 2397 17.90 42906
9. SS Cotton 0 0 0 4794 17.90 85813
Sub-total 42543 1268276 31161 909805 B Rabi 10. Wheat 599 17.43 10441 4794 32.00 153408
11. Jowar 0 0 0 2397 20.00 47940
12. Maize 0 0 0 2397 20.00 47940
13. Vegetables 0 0 0 2397 130.00 311610
14. Tur 10786 11.70 126196 0 0 0
15. Pulses 2996 6.68 20013 4794 10.00 47940

707
Sl. No.
Name of Crop
Pre Project Scenario Post Project Scenario Area (ha)
Yield per ha in qtls
Gross Yield in
qtls
Area (ha)
Yield per ha in qtls
Gross Yield in
qtls 16. Oil seed 0 0 0 2397 12.90 30921
17. Groundnut 0 0 0 2397 20.00 47940
Sub-total 14381 156650 21573 687699 C Hot
Weather
18. Bajra 0 0 0 1197 20.00 23940
19. Vegetables 0 0 0 1197 130.00 155610
20 Soyabean 0 0 0 1197 12.93 15477
Sub-total 0 0 3591 195027 D Perennial 21. Sugarcane 2996 69.76 209001 2397 800.00 1917600
22. Fruits 0 0 0 1198 20.00 23960
Sub-total 2996 209001 3595 1942560 Total 59920 1633927 59920 3734091 (ii) Estimated Value of Increased Production
The gross yield in pre and post project scenarios has been presented
above in Tables-9.39.Based on the increased production; Value of increased production has been assessed in Annexure: 13.10.5 in Volume–VI (B).
(iii) Likely Socio-economic Aspects
Due to increase in food grain production, the socio-economic
condition of farmers will improve in general. Agricultural labourers will get employment in the nearby area. Situation of livestock will improve. Farmers will try to establish agro-based industries in the area.

708
9.11.2 Command Area Proposed Under Feeder Pipe lines The Command Area proposed under Dabdar (630 ha) and Kelwan
(640 ha) Feeder pipe lines is very small as the area is mostly covered by dense forests. Not much Command Area Development work need to be done in the areas as the areas are already under cultivation, but rain-fed. The major part of the Command Area proposed under Feeder pipe lineslie in Ahwa Taluka of The Dangs District and small patches lie in Navsari & Tapi Districts. The Agro-climatic and Socio-economic conditions in the proposed Command area under Feeder pipe linesare more or less similar to the en route Command Area, so no separate details are given. The details of benefits from the Command are presented below. 9.11.2.1 Benefits (i) Crop-wise Increase in Yield per ha and Total Estimated Output
from the Command The crop-wise yields under feeder pipe lines in pre & post project
scenarios are given in Table-9.38:
Table-9.38 Crop-wise Yield under Pre and Post Project Scenarios
CCA: 1270 ha Sl. No.
Name of Crop
Pre Project Scenario Post Project Scenario Area (ha)
Yield per
ha in qtls
Gross Yield in
qtls
Area (ha)
Yield per ha in qtls
Gross Yield in
qtls
A Kharif 1. Paddy 368 16.40 6035 102 40.00 4080
2. Jowar 89 13.33 1186 102 20.00 2040
3. Pulses 89 4.36 388 51 10.00 510
4. Groundnut 114 11.00 1254 102 20.00 2040
5. Oil seeds 38 12.23 465 102 12.93 1319

709
Sl. No.
Name of Crop
Pre Project Scenario Post Project Scenario Area (ha)
Yield per
ha in qtls
Gross Yield in
qtls
Area (ha)
Yield per ha in qtls
Gross Yield in
qtls
6. Vegetables 13 80.00 1040 51 130.00 6630
7. Other cereals
330 10.00 3300 0 0 0
8. Fodder 64 30.00 1920 0 0 0
9. L S Cotton 0 0 0 51 17.90 913
10. SS Cotton 0 0 0 102 17.90 1826
Sub-total 1105 15588 663 19358 B Rabi 11. Wheat 0 0 0 102 32.00 3264
12. Gram 25 11.00 275 0 0 0
13. Jowar 0 0.00 0 51 20.00 1020
14. Maize 51 13.28 677 51 20.00 1020
15. Vegetables 0 0 0 51 130.00 6630
16. Tur 89 11.70 1041 0 0 0
17. Pulses 0 0.00 0 102 10.00 1020
18. Oil seeds 0 0.00 0 51 12.93 659
19. Groundnut 0 0 0 51 20.00 1020
Sub-total 165 1993 459 14633 C Hot
Weather
20. Bajra 0 0 0 24 20.00 480
21. Vegetables 0 0 0 24 130.00 3120
22. Soyabean 0 0 0 24 12.93 310
Sub-total 0 0 72 3910 C Perennial
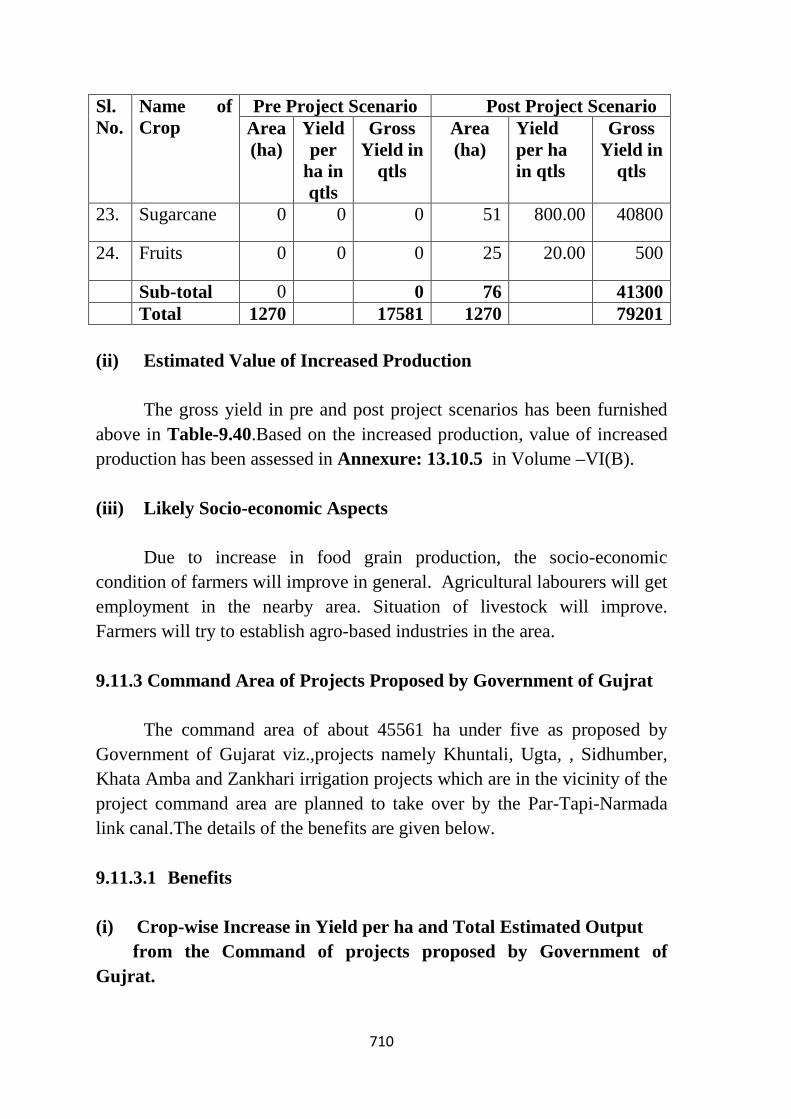
710
Sl. No.
Name of Crop
Pre Project Scenario Post Project Scenario Area (ha)
Yield per
ha in qtls
Gross Yield in
qtls
Area (ha)
Yield per ha in qtls
Gross Yield in
qtls
23. Sugarcane 0 0 0 51 800.00 40800
24. Fruits 0 0 0 25 20.00 500
Sub-total 0 0 76 41300 Total 1270 17581 1270 79201 (ii) Estimated Value of Increased Production
The gross yield in pre and post project scenarios has been furnished
above in Table-9.40.Based on the increased production, value of increased production has been assessed in Annexure: 13.10.5 in Volume –VI(B).
(iii) Likely Socio-economic Aspects
Due to increase in food grain production, the socio-economic
condition of farmers will improve in general. Agricultural labourers will get employment in the nearby area. Situation of livestock will improve. Farmers will try to establish agro-based industries in the area.
9.11.3 Command Area of Projects Proposed by Government of Gujrat
The command area of about 45561 ha under five as proposed by
Government of Gujarat viz.,projects namely Khuntali, Ugta, , Sidhumber, Khata Amba and Zankhari irrigation projects which are in the vicinity of the project command area are planned to take over by the Par-Tapi-Narmada link canal.The details of the benefits are given below.
9.11.3.1 Benefits (i) Crop-wise Increase in Yield per ha and Total Estimated Output from the Command of projects proposed by Government of Gujrat.

711
The crop-wise yields from the command of projects proposed by Government of Gujrat. in pre & post project scenarios are given in Table-9.40:
Table-9.39 Crop-wise Yield under Pre and Post Project Scenarios in Command of
projects proposed by Government of Gujrat. CCA: 45561 ha
Sl. No.
Name of Crop
Pre Project Scenario Post Project Scenario Area (ha)
Yield per ha in qtls
Gross Yield in
qtls
Area (ha)
Yield per ha in qtls
Gross Yield in
qtls A Kharif 1. Paddy 4556 16.40 74718 3645 40.00 145800
2. Jowar 7290 13.33 97176 3645 20.00 72900
3. Pulses 455 4.36 1984 1823 10.00 18230
4. Groundnut 2734 11.00 30074 3645 20.00 72900
5. Oilseeds 1823 12.23 22295 3645 12.93 47130
6. Vegetables 5467 80.00 437360 1823 130.00 236990
7. Fodder 10023 30.00 300690 0 0 0
8. LS Cotton 0 0 0 1823 17.90 32632
9. SS Cotton 0 0 0 3645 17.90 65246
Sub-total 32345 964297 23694 691828 B Rabi 10. Wheat 456 17.43 7948 3645 32.00 116640
11. Jowar 0 0 0 1823 20.00 36460
12. Maize 0 0 0 1823 20.00 36460
13. Vegetables 0 0 0 1823 130.00 236990
14. Tur 8201 11.70 95952 0 0 0
15. Pulses 2278 6.68 15217 3645 10.00 36450

712
Sl. No.
Name of Crop
Pre Project Scenario Post Project Scenario Area (ha)
Yield per ha in qtls
Gross Yield in
qtls
Area (ha)
Yield per ha in qtls
Gross Yield in
qtls 16. Oil seed 0 0 0 1823 12.90 23517
17. Groundnut 0 0 0 1823 20.00 36460
Sub-total 10935 119117 16405 522977 C Hot
Weather
18. Bajra 0 0 0 910 20.00 18200
19. Vegetables 0 0 0 910 130.00 118300
20 Soyabean 0 0 0 910 12.93 11766
Sub-total 0 0 2730 148266 D Perennial 21. Sugarcane 2278 69.76 158913 1822 800.00 1457600
22. Fruits 0 0 0 910 20.00 18200
Sub-total 2278 158913 2732 1475800 Total 45561 1242327 45561 2838871 (ii) Estimated Value of Increased Production
The gross yield in pre and post project scenarios has been presented
above in Table-9.41. Based on the increased production, value of increased production has been assessed in Annexure:13.10.5 in Volume –VI(B).
(iii) Likely Socio-economic Aspects
Due to increase in food grain production, the socio-economic
condition of farmers will improve in general. Agricultural labourers will get employment in the nearby area. Situation of livestock will improve. Farmers will try to establish agro-based industries in the area.

713
9.11.4 Command of Tribal area enroute right side of canal, Tribal area in vicinity of reservoirs and Tribal area on right side of Narmada Main canal
Tribal areas to an extent of 36200 ha at four different locations
enroute on Right side of the PTN link canal have been identified as requested by Government of Gujarat for providing irrigation in tribal areas. About 12514 ha of command area in the vicinity of six proposed reservoirs which lies in Tribal dominant districts is proposed to bring under irrigation. It is also proposed to provide irrigation to 34342 ha predominantly in tribal areas by lift, directly from Narmada Main Canal, on substitution basis. The details of the benefits are given below.
9.11.4.1 Benefits (i) Crop-wise Increase in Yield per ha and Total Estimated Output
from the Irrigated Area in Command of Tribal area enroute right side of canal, Tribal area in vicinity of reservoirs and Tribal area on right side of Narmada Main canal The crop-wise yields in pre & post project scenarios in the Command
of Tribal area enroute right side of canal, Tribal area in vicinity of reservoirs and Tribal area on right side of Narmada Main canal are given in Table-9.41:
Table-9.40 Crop-wise Yield under Pre and Post Project Scenarios in Command of Tribal area enroute right side of canal, Tribal area in vicinity of reservoirs and Tribal area on right side of Narmada Main canal
CCA: 83056 ha Sl. Name of Crop Pre Project Scenario Post Project Scenario No. Area
(ha) Yield per ha in qtls
Gross Yield in
qtls
Area (ha)
Yield per ha in qtls
Gross Yield in
qtls A Kharif 1 Late Paddy 831 16.40 13628 0 0 0 2 Early Paddy 0 0 0 0 0 0 3 Maize / Bajra 0 0 0 0 0 0 4 Oil seed 4983 12.23 60942 8306 12.93 107396.6 5 Groundnut 831 11.00 9141 0 0 0

714
Sl. Name of Crop Pre Project Scenario Post Project Scenario No. Area
(ha) Yield per ha in qtls
Gross Yield in
qtls
Area (ha)
Yield per ha in qtls
Gross Yield in
qtls 6 Other Cereals 1661 10.00 16610 0 0 0 Sub-total 8306 100321 8306 107396.6 B Rabi 7 Wheat 7475 17.43 130289 45681 32 1461792 8 Jowar 9136 13.33 121783 0 0 0 9 Pulses/
Vegetable 4153 6.68 27742 16611 10 166110
10 Potato 0 0 0 4983 230 1146090 11 Gram 831 11.00 9141 0 0 0 12 Tur 18272 11.70 213782 0 0 0 Sub-total 39867 502737 67275 2773992 C Two seasonal 13 SS Cotton 0 0 0 0 0 0 14 LS Cotton 32392 5.17 167467 0 0 0 15 Tobacco 0 0 0 0 0 0 16 Lucene 0 0 0 0 0 0 Sub-total 32392 167467 0 0 D Hot Weather 17 Bajra 0 0 0 0 0 0 18 Fodder 2491 30.00 74730 4983 80 398640 Sub-total 2491 74730 4983 398640 Perennial 19 Sugarcane 0 0 0 0 0 0 20 Fruits 0 0 0 2492 20 49840 Sub-total 0 0 2492 49840 Total 83056 845255 83056 3329868.6
(ii) Estimated Value of Increased Production
The gross yield in pre and post project scenarios has been presented
above in Table-9.42. Based on the increased production, Value of increased production has been assessed in Annexure: 13.10.5 in Volume –VI(B).

715
(iii) Likely Socio-economic Aspects
Due to increase in food grain production, the socio-economic condition of farmers will improve in general. Agricultural labourers will get employment in the nearby area. Situation of livestock will improve. Farmers will try to establish agro-based industries in the area. 9.11.5Command Area of Narmada Main Canal (NMC) of SSP to be
taken over by the Link Canal – Additional Irrigation in SaurashtraRegion (Target Command) and Benefits
In irrigation planning, it is proposed to take overthe part Command
Area of existing Miyagam Branch Canal of Narmada Canal System of SSP(CCA: 42368 ha and irrigation intensity 100%) by utilizing 161MCMof waterthrough the Par-Tapi-Narmada Link Canal by substitution. Thus saved water of Narmada canal will be utilized in Saurashtra regionthrough substitution to provide irrigation to 42368 ha with irrigation intensity of 100%. The details of the benefits are given below. 9.11.5.1 Benefits (i) Crop-wise Increase in Yield per ha and Total Estimated Output
from the Irrigated Area in Saurashtra Region (Target Command) The crop-wise yields in pre & post project scenarios in the Target
Command are given in Table-9.42:
Table-9.41 Crop-wise Yield under Pre and Post Project Scenarios
in Target Command CCA: 42368 ha
Sl. Name of
Crop Pre Project Scenario Post Project Scenario
No. Area (ha)
Yield per ha in qtls
Gross Yield in
qtls
Area (ha)
Yield per ha in qtls
Gross Yield in
qtls A Kharif 1 Late Paddy 424 16.40 6954 0 0 0 2 Early Paddy 0 0 0 0 0 0

716
Sl. Name of Crop
Pre Project Scenario Post Project Scenario No. Area
(ha) Yield per ha in qtls
Gross Yield in
qtls
Area (ha)
Yield per ha in qtls
Gross Yield in
qtls 3 Maize / Bajra 0 0 0 0 0 0 4 Oil seed 2542 12.23 31089 4237 12.93 54784 5 Groundnut 424 11.00 4664 0 0 0 6 Other Cereals 847 10.00 8470 0 0 0 Sub-total 4237 51177 4237 54784 B Rabi 7 Wheat 3813 17.43 66461 23302 32 745664 8 Jowar 4661 13.33 62131 0 0 0 9 Pulses/
Vegetable 2118 6.68 14148 8474 10 84740
10 Potato 0 0 0 2542 230 584660 11 Gram 424 11.00 4664 0 0 0 12 Tur 9321 11.70 109056 0 0 0 Sub-total 20337 256460 34318 1415064 C Two
seasonal
13 SS Cotton 0 0 0 0 0 0 14 LS Cotton 16523 5.17 85424 0 0 0 15 Tobacco 0 0 0 0 0 0 16 Lucene 0 0 0 0 0 0 Sub-total 16523 85424 0 0 D Hot Weather 17 Bajra 0 0 0 0 0 0 18 Fodder 1271 30.00 38130 2542 80 203360 Sub-total 1271 38130 2542 203360 Perennial 19 Sugarcane 0 0 0 0 0 0 20 Fruits 0 0 0 1271 20 25420 Sub-total 0 0 1271 25420 Total 42368 431191 42368 1698628
(ii) Estimated Value of Increased Production
The gross yield in pre and post project scenarios has been presented
above in Tables-9.39 to 9.42. Based on the increased production, Value of

717
increased production has been assessed and details are furnished at Annexure: 13.10.5 in Volume –VI(B).
From the above, it could be assessed that the gross yield of various crops per hectare in post project scenario in the enroute command and in the command area of 5 proposed projects of Government of Gujarat is 62 quintals/ha against 27 quintals/ha in the pre-project scenario. In case of command area under Feeders the gross yield of crops in post project scenario is 62 quintals/ha against 14 quintals/ha in the pre-project scenario. The gross crop yield in the Target command (Saurashtra region) is 40 quintals/ha against 10 quintals/ha in pre-project scenario. Hence, there will be significant increase in crop production with the proposed irrigation under the Link Project.
The net annual value of crop production under the Link Project is
assessed as Rs. 111176.70 lakhs. (iii) Likely Socio-economic Aspects
Due to increase in food grain production, the socio-economic condition of farmers will improve in general. Agricultural labourers will get employment in the nearby area. Situation of livestock will improve. Farmers will try to establish agro-based industries in the area.

844
Chapter – 11 Environment Impact Assessment and
Environment Management Plan
11.0 General The water is an essential element in all the developmental activities of the mankind which is required throughout the year. Water is also required for sustenance of the surrounding environment. Precipitation is the only source of fresh water supply which is unevenly distributed both in space and time confined to mainly in monsoon season ie June to Sept only. As such building storage dams to store flood waters are necessary so that the availability of water could be ensured throughout the year for various requirements including drinking water. Though reservoirs increase the water availability leading to various developmental activities and prosperity in the area, but some adverse impacts on the environment are also inevitable. As such, it is necessary to identify the adverse impacts along with the positive benefits of the reservoirs to mitigate or ameliorate the anticipated adverse impacts on the environment.
To identify both positive and adverse environmental impacts due to the proposed Par-Tapi-Narmada link project and to suggest measures to mitigate or ameliorate the anticipated adverse impacts on the environment, the Environmental Impact Assessment study of this link project has been carried out through Water and Power Consultancy Services India Limited. Brief report of the study indicating baseline information on various environmental aspects, Environmental Impact Assessment of the project, Environmental Management Plan and Environmental Monitoring Plan along with the costs to implement the Environmental Management Plan are presented in the following paragraphs: 11.1 The Proposed Project 11.1.1 Project Background Par-Tapi-Narmada Link Project has been planned to transfer surplus waters of West flowing Par, Auranga, Ambica and Purna river basins of South Gujarat and neighbouring Maharashtra to provide irrigation facilities to: the

845
areas on its enroute: tribal areas enroute right side of the link canal; tribal dominant districts of Dang and Valsad of Gujarat and Nasik district of Maharashtra; command area of five projects proposed by Government of Gujarat in its initial reaches to caters the water demands for irrigation and drinking purposes in its enroute; and take over the part command area of existing Miyagam Branch Canal of Narmada Canal System. The Narmada waters so saved in Sardar Sarovar Project would be utilized to provide irrigation facilities: in tribal areas of Naswadi, Kavant, Sankheda, Jetpur Pavi, Chhota Udepur talukas of Chhota Udepur district and Halol, Ghogamba and Kalol talukas of Panchmahal district by lift directly from Narmada Main Canal on substitution basis; and in drought affected Saurashtra region of Gujarat on substitution basis through Narmada Canal System to meet irrigation, domestic and other requirements. In addition to this, all possible Panchayat / village tanks coming in the vicinity of the project will be filled up. The project will also provide drinking water to tribal population in the vicinity.
The Union Ministry of Water Resources in the year 1980 had
prepared a National Perspective Plan for Water Resources Development in the country, which comprises two components: Himalayan Rivers Development Component and Peninsular Rivers Development Component. The Par-Tapi-Narmada link is one of the 16 link proposals coming under the peninsular rivers development component of National Perspective Plan, involving the States of Maharashtra and Gujarat which will provide water for irrigation and drinking purposes as specified in preceedind para.
Par-Tapi-Narmada Link project envisages transfer of about 1330 Million Cubic metres (MCM) surplus water available in west flowing Par, Auranga, Ambica and Purna river basins of South Gujarat and Maharashtra to North Gujarat. The project envisages construction of 6 dams and 6 power houses involving submergence of about 6065 ha of land affecting about 2500 families in 61 villages in Gujarat and Maharashtra.
The earlier DPR of Par-Tapi-Narmada Link Project - Aug, 2015 has
been revised based on decisions taken at various Meetings in light of the suggestions of Government of Gujarat to consider the water demands for

846
irrigation and drinking water purposes in the vicinity of the project as specified above. The following are the broad changes incorporated in the Revised DPR of Par-Tapi-Narmada Link Project..
1. An additional area of 45561 ha of five projects viz., Ugta, Sidhumber, Khata Amba, Zankhari and Khuntali is included in the PTN link project.
2. An area of about 36,200 ha benefitting the tribal areas on the right side of PTN link canal by lift is included.
3. Command area 12514 ha in the vicinity of six proposed reservoirs through lift directly from reservoirs in Dang and Valsad districts of Gujarat and Nasik district of Maharashtra.
4. An area of about 23750 ha and 10592 ha is included in the command area in Chhota Udepur and Panchmahal districts respectively by substitution through lift from Narmada Main Canal.
5. Out of a total Culturable Command Area of about 2.32 lakh ha, about 68% of the area (1.57 lakh ha) is now benefitting the tribal areas.
6. Provision is made for drinking water needs of all villages in Dangs district and villages in Dharmapur and Kaparada talukas of Valsad district.
7. Provision is made for filling up of all village tanks in the benefitted tribal areas.
8. Open channels has been replaced with closed pipeline system in the feeder canals (totalling about 37 km length) as well as in the distribution system in the command areas to reduce the land acquisition.
11.1.2 Project Justification
The rainfall in Saurashtra and Kutch regions of Gujarat is very scanty and the area is frequently affected by droughts. The annual normal rainfall (1951-2000) in Saurashtra and Kutch region is 507 mm and whereas the average annual Rainfall in Par, Auranga, Ambica and Purna river basins is assessed to be 2180, 2055, 1830 and 1472 mm respectively. The rivers in Saurashtra and Kutch region are mostly dry throughout the year. Whereas, sizable quantum of flows of Par, Auranga, Ambica and Purna rivers are going to sea unutilised every year. The water availability studies of these
847
basins carried out by Central Water Commission indicates availability of sizable surplus waters. The available surplus waters shall be stored in the reservoirs to be constructed on these rivers and diverted to Saurashtra and Kutch regions for meeting irrigation, drinking and other needs. However, before considering any water transfer from these basins the water requirements of the peoples in the vicinity of the proposed reservoirs and en-route of the link canal will be met on top priority basis. The Par-Tapi-Narmada link project is one of the viable options to divert the surplus flows of Par, Auranga, Ambica and Purna rivers to Provide irrigation benefits in Tribal areas as well as in drought prone Saurashtra and Kutch regions of Gujarat etc.
Accordingly, Preliminary Feasibility study to ascertain whether the project is feasible was carried out for the diversion of surplus waters of West flowing Par, Auranga, Ambica and Purna rivers of South Gujarat to provide the irrigation benefits in tribal areas as well as in the drought prone Saurashtra and Kutch regions of Gujarat etc. While working out the quantity of water that can be diverted through Par-Tapi-Narmada link, the in-basin requirements of water up-stream and down-stream of the proposed dams at the ultimate stage of development have been considered for justifying the diversion of water through the proposed Par-Tapi-Narmada link project. 11.1.3 Project Description The Par-Tapi-Narmada link project envisages construction of the following components at the DPR preparation stage: i) A 808.32 m long composite embankment (concrete face rock fill)
cum concrete dam across river Par near village Jheri with FRL 246.00 m and corresponding gross storage capacity 206.03 MCM. The length of concrete face rock fill portion of the dam is 663.32 m and the length of concrete non-overflow section and spill way is 145.00 m. The dam axis is located at Latitude 20°22'25" N and Longitude 73°25'51" E.
ii) A 1431.85 m long composite embankment (concrete face rock fill)
cum concrete dam across river Nar (a tributary of Par river) near

848
village Paikhed with FRL 248.00 m and corresponding gross storage capacity of 229.53 MCM. The length of concrete face rock fill portion of the dam is 1310.85 m and the length of concrete non-overflow section and spill way is 121.00 m. The dam axis is located at Latitude 20°27'42" N and Longitude 73°23'37" E;
iii) A power house of 9.0 MW installed capacity at the toe of Paikhed
dam with 3 units each of 3 MW. iv) A 2781.00 m long composite embankment (concrete face rock fill)
cum concrete dam across river Tan (a tributary of Auranga river) near village Chasmandva with FRL 214.00 m and corresponding gross storage capacity of 83.63 MCM. The length of concrete face rock fill portion of the dam is 2703.00 m and the length of concrete non overflow section and spill way is 78.00 m. The dam axis is located at Latitude 20°37'02" N and Longitude 73°22'36" E.
v) A power house of 2.0 MW installed capacity at the toe of
Chasmandva dam with 2 units each of 1 MW. vi) A 1887.00 m long composite embankment (concrete face rock fill)
cum concrete dam across river Ambica near village Chikkar with FRL 210.00 m and corresponding gross storage capacity of 141.99 MCM. The length of concrete face rock fill portion of the dam is 1736.00 m and the length of concrete non overflow section and spill way is 151.00 m. The dam axis is located at Latitude 20°42'00" N and Longitude 73°30'50" E.
vii) A power house of 2.0 MW installed capacity at the toe of Chikkar
dam with 2 units each of 1 MW. viii) A 1170.00 m long composite embankment (concrete face rock fill)
cum concrete dam across river Kapri (a tributary of Ambica river) near village Dabdar with FRL 169.00 m and corresponding gross storage capacity 222.38 MCM. The length of concrete face rock fill portion of the dam is 1035.00 m and the length of concrete non

849
overflow section and spill way is 135.00 m. The dam axis is located at Latitude 20°48'58" N and Longitude 73°32'05" E.
ix) A power house of 3.2 MW installed capacity at the toe of Dabdar dam
with 2 units each of 1.60 MW. x) A 1330.00 m long composite embankment (concrete face rock fill)
cum concrete dam across river Purna near village Kelwan with FRL 164.00 m and corresponding gross storage capacity of 282.17 MCM. The length of concrete face rock fill portion of the dam is 1141.00 m and length of concrete non overflow section and spill way is 189.00 m. The main dam axis is located at Latitude 20°55'30" N and Longitude 73°32'00" E.
xi) A power house of 2.5 MW installed capacity at the toe of Kelwan
dam with 2 units each of 1.25 MW. xii) A power house of 2.0 MW installed capacity at the fall of feeder pipe
line connecting Kelwan dam with main link canal with 2 units each of 1 MW.
xiii) A tunnel of about 12.70 km long with 3.00 m diameter (D shape) and
bed slope of 1:875 connecting Jheri reservoir with Paikhed reservoir. xiv) A 147.50 m long barrage in the downstream of Paikhed dam with
crest level of 136.00 m. xv) A 128.00 m long barrage in the downstream of Chasmandva dam
with crest level of 123.00 m. xvi) A 369.043 km long link canal off-taking from Paikhed barrage at FSL
142.80 m. xvii) A 100 m long tunnel No.1 at RD 14.650 to 14.750 km; A 350 m long
tunnel No.2 at RD 24.000 to 24.350 km; A 200 m long tunnel No.3 at RD 32.350 to 32.550 km; A 50 m long tunnel No.4 at RD 37.750 to

850
37.800 km; and A 450 m long tunnel No.5 at RD 51.500 to 51.950 km;
xviii) A 2.859 km feeder pipe line connecting main canal with Chasmandva
barrage. xix) A 14.342 km pipe line inter connecting Chikkar and Dabdar
reservoirs. xx) A 12.258 km feeder pipe line connecting main canal with Dabdar
dam. xxi) A 7.616 km feeder pipe line connecting main canal with Kelwan dam.
xxii) Cross Drainage / Cross Masonry works including Regulators, Escapes, Road / Railway bridges
11.2 Study Area
The study area to be considered for the Environmental Impact Assessment study and preparation of Environmental Management Plan for the proposed Par-Tapi-Narmada link project is given as under: i) Area to be acquired for various project appurtenances including
reservoir submergence. ii) 10 km on either side of the canal. iii) 10 km radius around the project area from the periphery of the project
site. iv) Catchment area intercepted at each dam site. v) Command area of the project. 11.3 Legal Status of the Project
The Water Resources Project, when implemented provides the immense benefits to the society in the form of increased availability of water for irrigation, domestic, industrial and other uses. On the other hand,

851
these projects have impacts, both positive and negative on the environment of the project area and in the near vicinity and also affect the socio-economic conditions of the population in the specific region. The project before implementation required statutory clearance from the Ministry of Environment and Forests and Climate Change. As stipulated in the Environmental Impact Assessment Notification of 14th Sept 2006, the Terms and Conditions for carrying out the Environmental Impact Assessment study of Par-Tapi-Narmada link project were submitted to the Ministry for approval. The Ministry vide letter No.J-12011/55/2008-IA.I, dated 8th June 2009 (Annexure-1.10, Vol-II) accorded clearance for pre-construction activities at the proposed site as per the provisions of EIA Notification-2006 alongwith the TORs for preparation of EIA report.
The Par-Tapi-Narmada link project comprises of 6 dams, 2 barrages,
6 power houses and canal. This will involve the shifting of the families residing in the villages likely to be affected by these dams / reservoirs. These project affected families are required to be resettled at the new locations. Therefore, with a view to compensate the Project Affected Families ensuring that the proper facilities in the re-settlement colonies are provided, a Rehabilitation and Resettlement Plan has been evolved. While formulating the Rehabilitation and Resettlement Plan, the provisions of National Policy on Rehabilitation and Resettlement–2007 have been kept in view. Various provisions of Rehabilitation and Resettlement Policies of Gujarat and Maharashtra are compared with the provision of National Policy on Rehabilitation and Resettlement – 2007 and best of the provision have been adopted. The project is lying in the tribal area as such the Rehabilitation and Resettlement plan required clearance from Ministry of Tribal Affairs.
The Par-Tapi-Narmada link project is required about 4439 ha of
forest land as such forest clearance under Forest (Conservation) Act, 1980 is required. A provision for afforestation in double the area in de-graded forests region has been kept as per the Forests (Conservation) Act, 1980. The project will also require Techno-economic clearance from Central Water Commissioner; investment clearance from Ministry of Water Resources, RD and GR; and Consent to Establish from Maharashtra and Gujarat Pollution Control Boards under Water (Prevention and Control of

852
Pollution) Act 1974 and the Air (Prevention and Control of Pollution) Act 1981.
The Geological Survey of India (GSI), Jaipur vide their letter No. 171/G-1/EG/WR/GSI/08-09 dated 9th April, 2009 (Annexure 4.3, Vol-II) had indicated that the area of Par-Tapi-Narmada link project are occupied by the different basaltic flows and associated rocks belonging to the Deccan Traps. No significant minerals have been reported from the area, except construction material and a few minor minerals like zeolites. Similarly, the Archaeological Survey of India, Vadodara vide their letter No. 36/10/MIS/08-09/4078 dated 19th June 2009 (Annexure 4.2.1, Vol-II) and Archaeological Survey of India, Aurangabad vide their letter No. 12/2009-10/Tech-3036 dated 17th Feb 2011 (Annexure 4.2.2, Vol-II) have submitted brief report on archaeological exploration and informed that no monuments or any remains of archaeological importance were noticed in the areas of the 6 reservoirs viz Jheri, Paikhed, Chasmandva, Chikkar, Dabdar and Kelwan dams and none of the centrally protected monuments are located in the area likely to be submerged due to the construction of the 6 proposed dams in the area of Par-Tapi-Narmada link project. As such, No Objection Certificates from Ministry of Coal and Mines and Archaeological Survey of India are not required. 11.4 Baseline Environmental Data
It is essential that the baseline levels of environmental parameters which could be significantly affected by the implementation of the project are to be ascertained before implementation of the project. The baseline status shall involve both field work and review of data collected from secondary sources. A similar approach has been adopted for conducting comprehensive environmental impact assessment study for the proposed Par-Tapi-Narmada link project.
The baseline survey planning commenced with the short listing of impacts and identification of parameters for which the data needs to be collected. Baseline status has been ascertained for air environment, water environment, land environment, public health and biological (terrestrial and aquatic) environment. The baseline status has been divided into three

853
categories: Physio-chemical aspects; Ecological aspects; and Socio-Economic aspects. 11.4.1 Air Environment 11.4.1.1 Ambient Air Quality
The sources of air pollution in the study area are vehicular traffic, dust arising from unpaved village roads and domestic fuel burning. The prime objective of the baseline air quality study was to establish the existing ambient air quality of the area. The baseline status of the ambient air quality has been established through a scientifically designed ambient air quality monitoring network. The monitoring of ambient air quality has been done for summer and winter seasons. The Ambient Air Quality in the project area has been monitored at 24 locations. The parameters such as Suspended Particulate Matter (SPM), Respirable Suspended Particulate Matter (PM10), Sulphur dioxide (SO2) and Oxides of Nitrogen (NOx) have been monitored. List of ambient air quality monitoring stations is given at Table- 11.1.
Table- 11.1
Location of Ambient Air Quality Monitoring Stations Station (s) Sampling
Location Dam site Direction
wrt Site Distance
(km ) A1 Dharampur Chasmandva SW 23.4 A3 Ulhaspedi Paikhed NW 6.0 A5 Sadarvera Paikhed N 6.0 A6 Bopi Chasmandva SW 7.0 A7 Man Kuniya Chasmandva NE 10.0 A8 Khambhla Dabdar SW 4.0 A9 Ahwa Chikkar NE 11.0 A10 Davdahad Dabdar E 1.0 A11 Sarvar Dabdar N 2.0 A12 Bheshkatri Kelwan N 1.0 A13 Chikkar Kelwan W 0.5 A14 Dungarda Dabdar SW 0.5 A15 Jamlapada Chikkar N 0.5 A16 Dhangdi Chikkar SE 2.0
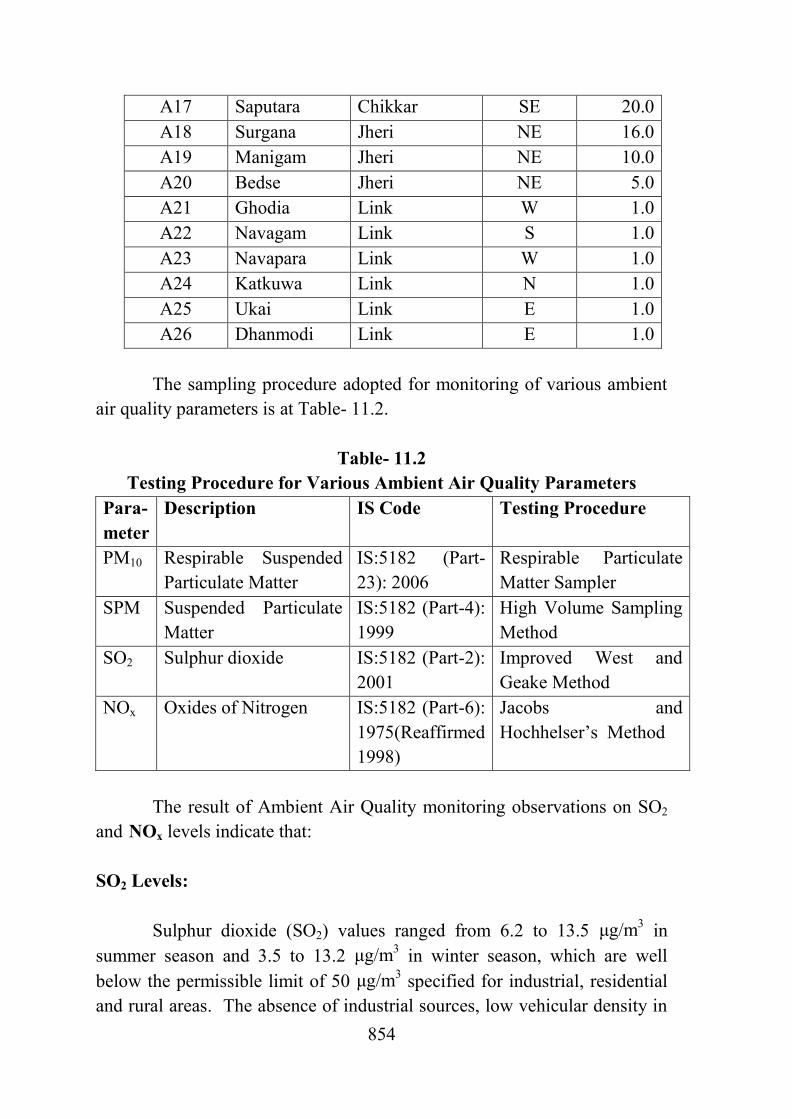
854
A17 Saputara Chikkar SE 20.0 A18 Surgana Jheri NE 16.0 A19 Manigam Jheri NE 10.0 A20 Bedse Jheri NE 5.0 A21 Ghodia Link W 1.0 A22 Navagam Link S 1.0 A23 Navapara Link W 1.0 A24 Katkuwa Link N 1.0 A25 Ukai Link E 1.0 A26 Dhanmodi Link E 1.0
The sampling procedure adopted for monitoring of various ambient
air quality parameters is at Table- 11.2.
Table- 11.2 Testing Procedure for Various Ambient Air Quality Parameters
Para-meter
Description IS Code Testing Procedure
PM10 Respirable Suspended Particulate Matter
IS:5182 (Part-23): 2006
Respirable Particulate Matter Sampler
SPM Suspended Particulate Matter
IS:5182 (Part-4): 1999
High Volume Sampling Method
SO2 Sulphur dioxide IS:5182 (Part-2): 2001
Improved West and Geake Method
NOx Oxides of Nitrogen IS:5182 (Part-6): 1975(Reaffirmed 1998)
Jacobs and Hochhelser’s Method
The result of Ambient Air Quality monitoring observations on SO2
and NOx levels indicate that: SO2 Levels:
Sulphur dioxide (SO2) values ranged from 6.2 to 13.5 μg/m3 in summer season and 3.5 to 13.2 μg/m3 in winter season, which are well below the permissible limit of 50 μg/m3 specified for industrial, residential and rural areas. The absence of industrial sources, low vehicular density in

855
the project area can be attributed to low SO2 level. NOx Levels:
Average NOx values ranged from 9.8 to 13.1 μg/m3 in summer season and 6.7 to 19.4 μg/m3 in winter season, which are well below the permissible limit of 40 μg/m3 specified for industrial, residential and rural areas. The absence of pollution sources in the study area is the reason of low NOx level. Observations on Ambient Respirable Particulate Matter Levels:
Average RPM values ranged from 25.1 to 36.8 μg/m3 in summer season and 24.4 to 34.2 μg/m3 in winter season, which are well below the permissible limit of 60 μg/m3 specified for industrial, residential and rural areas. The RPM level was marginally higher in summer season as compared to winter season because lower moisture content in soil and vegetal cover in summer season. Conclusions:
Based on the findings of the ambient air quality survey conducted for the summer and winter seasons, it can be concluded that the ambient air quality is quite good in the area. The values of these parameters were well below the permissible limits specified for residential, rural and other areas. The absence of industries and low vehicular traffic has attributed for the good ambient air quality in the project area. 11.4.1.2 Noise Environment
Noise level was monitored at 9 locations: Dharampur, Sarvar, Dhangdi, Motikorwad, Davdahad, Mankuniya, Chikkar, Surgana and Dhankawal in the study area. Monitoring was conducted for two seasons namely summer (June 2010) and winter (December 2010). The noise levels were monitored continuously for 24 hours at each location and hourly equivalent noise level was measured.

856
At each station, hourly noise level was monitored. These values were then used to estimate the day time and night time equivalent noise levels.
The day time equivalent noise level at various sampling stations ranged from 37.23 to 58.88 and 47.40 to 58.70 dB(A) in summer and winter seasons respectively. The noise levels in residential areas are well within the permissible limit of 55 dB(A) specified for commercial area (65 dB(A)), industrial area (70 dB(A) and silence zone (50 dB(A)).The night time equivalent noise levels at various sampling stations ranged from 28.62 to 40.70 dB(A) and 30.50 to 42.63 dB(A) in summer and winter seasons respectively, which are well within the permissible limit specified for various categories.
11.4.1.3 Meteorology
Climatologically, the calendar year in the project area can be categorized into:
Winter November to February Summer March to May Monsoon June to September Post-monsoon / Transition October
Temperature: Mean maximum temperature is observed in Vadodara 39.9 0C and Surat 36.8 0C. The mean minimum temperature observed at Vadodara is 13.2 0C and Surat is 14.7 0C . Rainfall: The monsoon rainfall occurs mainly during mid June to Sept. Maximum rainfall is received in months July and August. The annual average rainfall values observed at the India Meteorological Department stations of Vadodara and Surat are used for the command area and are 923 mm and 1209 mm respectively. Majority of the rainfall is received under the influence of south –west monsoons. Humidity: Monthly mean maximum and minimum relative humidity recorded at Surat and Vadodara stations are 90% and 53% and 94% and 44% respectively.

857
11.4.2 Water Quality 11.4.2.1 Surface Water Quality Monitoring
As a part of the primary study, water samples were collected and analyzed for ascertaining the water quality status in the study area during the period of summer season (June 2010), winter season (Dec 2010) and monsoon (Aug 2011). The quality of surface water has been ascertained from the physico-chemical analyses of water samples collected from different river bodies. Grab sampling method was used for the collection of water samples. Ground water samples were taken from the hand pumps. The methods adopted for water testing are given at Table-11.3 and water sampling locations are listed at Table-11.4(A) and 11.4(B).
Table- 11.3 Protocols Adopted for Analysis of Various Water Quality Parameters
Parameter Unit Protocol Testing Procedure pH @ 25 oC - IS :2488 Part – 1, 1966 Electrometric method
Temperature (0C) APHA (21st Edition)- 2550 B : Page 2-61
Thermometry method
Dissolved Oxygen (DO)
mg/l IS – 3025 (Part–38): 1989
Wrinkler's method
Biological Oxygen Demand (BOD)
mg/l
IS – 3025 (Part–44): 1993 (Reaffirmed 1999) Edition 2.1 (2000 - 10)
Modified Wrinkler's method
Chemical Oxygen Demand (COD)
mg/l APHA (21st Edition)- Open Reflux Method 5220 B Page 5-15
Dichromate Reflux Technique
Total Dissolved Solids (TDS)
mg/l IS: 3025 (Part-16) 1984 (Reaffirmed 1996)
Water bath Evaporation method
Total Suspended Solids (TSS)
mg/l IS: 3025 (Part-17) 1984 (Reaffirmed 2002)
Filtration and Water bath Evaporation
Calcium (Ca+) mg/l APHA (21st Edition) – 3500 – Ca B: Page 3-65
EDTA method
Calcium Hardness
mg/l APHA (21st Edition) – 3500 – Ca B: Page 3-65
Calculation method
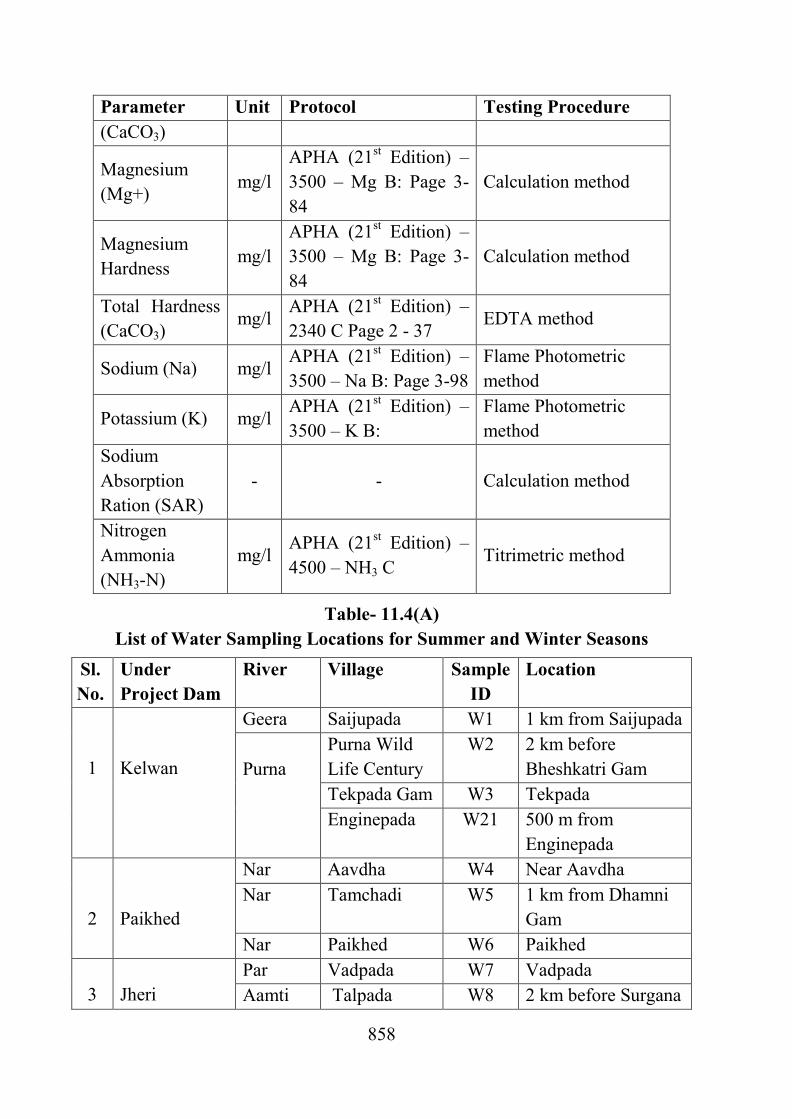
858
Parameter Unit Protocol Testing Procedure (CaCO3)
Magnesium (Mg+)
mg/l APHA (21st Edition) – 3500 – Mg B: Page 3-84
Calculation method
Magnesium Hardness
mg/l APHA (21st Edition) – 3500 – Mg B: Page 3-84
Calculation method
Total Hardness (CaCO3)
mg/l APHA (21st Edition) – 2340 C Page 2 - 37
EDTA method
Sodium (Na) mg/l APHA (21st Edition) – 3500 – Na B: Page 3-98
Flame Photometric method
Potassium (K) mg/l APHA (21st Edition) – 3500 – K B:
Flame Photometric method
Sodium Absorption Ration (SAR)
- - Calculation method
Nitrogen Ammonia (NH3-N)
mg/l APHA (21st Edition) – 4500 – NH3 C
Titrimetric method
Table- 11.4(A) List of Water Sampling Locations for Summer and Winter Seasons
Sl. No.
Under Project Dam
River Village Sample ID
Location
1
Kelwan
Geera Saijupada W1 1 km from Saijupada Purna
Purna Wild Life Century
W2 2 km before Bheshkatri Gam
Tekpada Gam W3 Tekpada Enginepada W21 500 m from
Enginepada 2
Paikhed
Nar Aavdha W4 Near Aavdha Nar Tamchadi W5 1 km from Dhamni
Gam Nar Paikhed W6 Paikhed
3
Jheri
Par Vadpada W7 Vadpada Aamti Talpada W8 2 km before Surgana

859
Sl. No.
Under Project Dam
River Village Sample ID
Location
4
Chasmandva
Kaveri Khambhla Gam
W10 Khambhla Gam
Tan Bopi W11 1 km from Bopi Bore well
Mankuniya W13 Hand Pump Bopi W14 Bopi Primary School
Auranga Pandavkhadak W15 Near Pandavkhadak 5 Chikkar Ambica Nanivadhai W18 Nanivadhai 6
Dabdar
Kapri Dholakpada W19 2 km from Dhodhlpada
Kapri Khudkas W12 Near Kudkas Gram Kapri Bhavannagar W20 Bhavannagar Lake Ahwa W9 Baddara lake
Table- 11.4(B) List of Water Sampling Locations for Monsoon Season
Sl. No.
Dam Site Sample Location
Village Taluka District Location Details
1
Jheri
Dam site Jheri -- -- W 1 U/s Gondka/Kank
bari -- -- W 2
D/s Khelda Kaprada Valsad W 3 2 Paikhed U/s Tamachadi Dharam
pur Valsad W 7
D/s Amada pulsan
Surgana Nasik W8
3 Chasmandva D/s Bopi -- -- W 11 4
Chikkar
Dam site Chikkar -- -- W 12 U/s Dhanjudi -- -- W 13
5 Dabdar Dam site Dabdar -- -- W 15 U/s Davdhad -- -- W 16 D/s Pungwda -- -- W 17
6 Kelwan Dam site Mheskatri -- -- W 18 U/s Kalibel -- -- W 19 D/s Dhamandevi -- -- W 20
7 Either side of Link Amreshwar Dabhoi Vadodara W21

860
link canal Link Garudeshwar Nr. Kevadia
Narmada W22
Link Mangrol Mangrol Surat W23 Link Nani Narol Mangrol Surat W24 Link Amhia Vyara Tapi W25 Link Bhurivel Songadh Tapi W26
The result of Water Quality Monitoring indicates that:
i) The pH level in the study area ranged from 6.95 to 8.32 in summer season and 7.3 to 8.2 in winter season and 7.2 to 8.1 in monsoon season at the samples sites considered in the study area. The pH level indicates neutral nature of the water and is well within the permissible limit of 6.5 to 8.5 specified for meeting the drinking water quality requirements. ii) The TDS level in summer, winter and monsoon seasons are ranged from 150 to 1010 mg/l, 56 to 340 mg/l and 72 to 220 mg/l. TDS level in monsoon seasons for ground water are ranged from 108 to 304 mg/l. The TDS levels observed in some of the samples sites were above the permissible limit of 500 mg/l specified for the drinking water quality and also within the rejection limit of 1500 mg/l. For irrigation water, the permissible limit is 2250 μmhos/cm, which is equivalent to the TDS level of about 1600-1700 mg/l. As the TDS level was below this limit, the water quality is found suitable for meeting the irrigation requirements. iii) The hardness level ranged from 50 to 230 mg/l, 20 to 110 mg/l and 52 to 120 mg/l in summer, winter and monsoon seasons respectively indicating soft nature and for ground water hardness level ranged from 54 to 160 mg/l indicating soft nature. The hardness level generally was well below the permissible limit of 200 mg/l specified for drinking water. In only one sample, hardness level was 230 mg/l, which is well within the cause for rejection limit of 600 mg/l. Hardness is caused by divalent metallic cations. The principal hardness causing cations are calcium, magnesium, strontium and ferrous and iron. The low levels of calcium and magnesium are mainly responsible for the soft nature of water.

861
iv) The concentration of various cations, viz sodium, calcium and magnesium was observed to be within the permissible limits. This is also reflected by the low SAR value, which ranged from 1.44 to 20.16 and 6.5 to 29.2 in summer and winter seasons respectively. Permissible limit SAR for irrigation purpose is 26. The DO level ranged from 5.1 to 8.8 mg/l at various sampling locations. The BOD values are well within permissible limit, which indicates that the organic pollution loading entering the water bodies is well within the carrying capacity. The low COD values also indicate the absence of chemical pollution loading in the area. The marginal quantity of pollution load which enters the water bodies gets diluted. 11.4.2.2 Ground Water Quality Monitoring
The Ground water quality monitoring in the study area was done during monsoon season at 4 sampling locations. The analysis of the collected samples was carried out in the laboratory as per the standard respective protocols. The summary of summer and winter seasons ground water monitoring is given below:
pH level in the study area ranged from 6.95 to 7.34 in summer season and 7.30 to 7.80 in winter season which indicates the neutral nature of the water, and are within the permissible limit of 6.5 to 8.5 specified for meeting drinking water requirements; TDS level ranged from 240 to 525 mg/l in summer and 172 to 228 mg/l in winter season, which is well within the permissible limit of 500 mg/l specified for drinking water and also within the cause for rejection limit of 1500 mg/l; hardness level ranged 100 mg/l in summer season and 70 to 90 mg/l in winter season, indicating soft nature. The hardness level generally is well below the permissible limit of 200 mg/l specified for drinking water.
The concentration of various cations, viz sodium, calcium and magnesium was observed to be within the permissible limits. This is also reflected by the low SAR value, which ranged from 3.17 to 4.32 in summer season and 13.8 to 17.00 in winter season. Permissible limit of SAR for irrigation purpose is 26. The DO level ranged from 7.5 to 8.70 mg/l in summer season and 5.2 to 5.6 mg/l in winter season at various sampling locations. The BOD values are well within permissible limit, which

862
indicates that the organic pollution loading entering the water bodies is well within the carrying capacity. The low COD values also indicate the absence of chemical pollution loading in the area. The marginal quantity of pollution load which enters the water bodies gets diluted. 11.4.3 Land Environment 11.4.3.1 Land Use
The land use and land cover information of the catchment area of the 6 dams has been mapped using the digital satellite data of IRS 1C-LISS III. Various major categories like Agricultural land, Wasteland, Water body, etc were identified and mapped. Area statistics is calculated for different Land use / Land cover categories and furnished at Table- 11.5 for the catchment area of the 6 dam sites:
Table- 11.5 Catchment Area of Dams – Land Use / Land Cover Statistics
Sl. No. Description Area (km2) %age Area I Jheri dam 1 Built-up Residential 4.42 1.04 2 Mine / Quarry 0.26 0.06 3 Agricultural Land 244.68 57.57 4 Dense scrub 0.14 0.03 5 Open scrub 2.20 0.52 6 Dense Forest 121.40 28.56 7 Open Forest 38.75 9.12 8 Scrub Forest 1.98 0.47 9 Lake / Pond 1.45 0.34
10 Reservoir 0.18 0.04 11 River 9.54 2.24
Total 425.00 100.00 II Paikhed dam 1 Built-up Residential 2.78 0.88 2 Agricultural Land 211.74 67.22 3 Dense scrub 3.44 1.09 4 Open scrub 0.21 0.07 5 Dense Forest 78.96 25.07 6 Open Forest 7.10 2.26

863
Sl. No. Description Area (km2) %age Area 7 Scrub Forest 1.52 0.48 8 Lake / Pond 0.54 0.17 9 River 8.71 2.76 Total 315.00 100.00
III Chasmandva dam 1 Built-up Residential 0.68 0.76 2 Agricultural Land 55.15 61.96 3 Dense scrub 0.20 0.22 4 Open scrub 0.26 0.29 5 Dense Forest 27.76 31.19 6 Open Forest 2.77 3.11 7 Scrub Forest 0.91 1.03 8 Lake / Pond 0.07 0.08 9 River 1.21 1.36 Total 89.00 100.00
IV Chikkar dam 1 Built-up Residential 2.52 0.78 2 Agricultural Land 135.38 41.91 3 Dense scrub 2.37 0.73 4 Open scrub 0.07 0.02 5 Dense Forest 162.55 50.32 6 Open Forest 12.03 3.72 7 Scrub Forest 0.001 0.00 8 Lake / Pond 0.05 0.02 9 River 8.03 2.49 Total 323.00 100.00
V Dabdar dam 1 Built-up Residential 3.99 0.83 2 Agricultural Land 151.01 31.33 3 Dense Forest 301.07 62.46 4 Open Forest 11.83 2.45 5 Scrub Forest 2.37 0.49 6 Lake / Pond 0.32 0.07 7 Reservoir 0.17 0.03 8 River 11.25 2.33
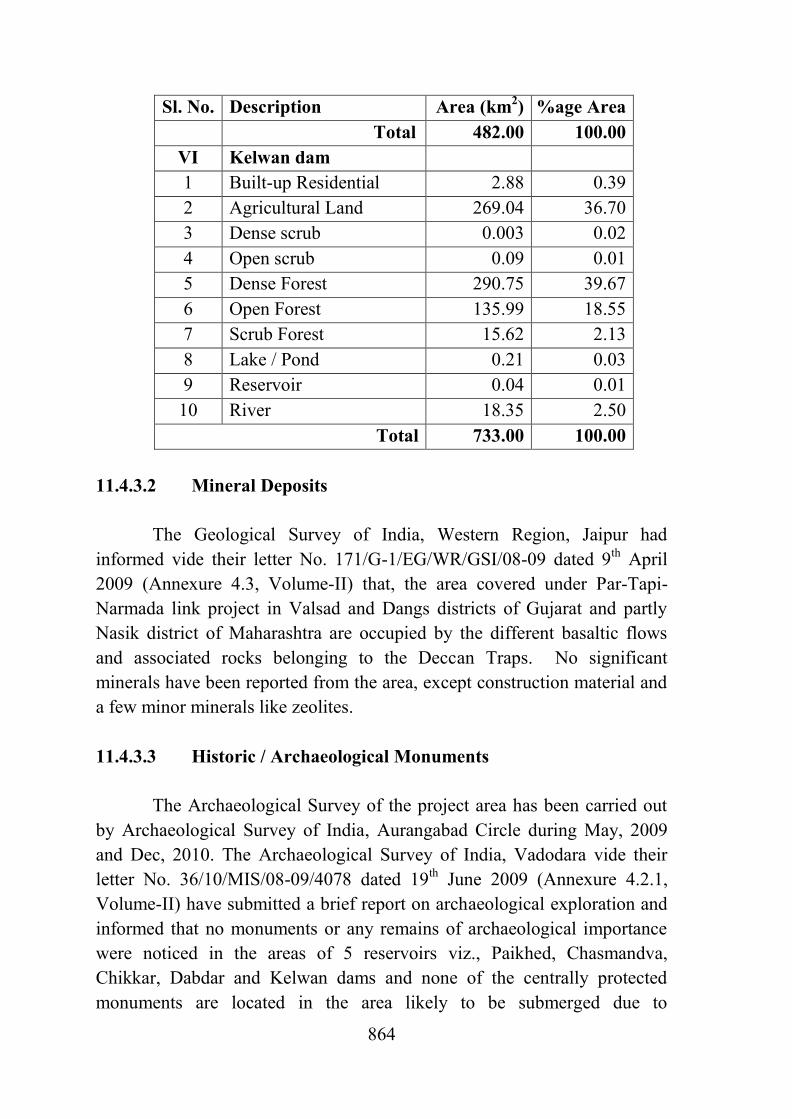
864
Sl. No. Description Area (km2) %age Area Total 482.00 100.00
VI Kelwan dam 1 Built-up Residential 2.88 0.39 2 Agricultural Land 269.04 36.70 3 Dense scrub 0.003 0.02 4 Open scrub 0.09 0.01 5 Dense Forest 290.75 39.67 6 Open Forest 135.99 18.55 7 Scrub Forest 15.62 2.13 8 Lake / Pond 0.21 0.03 9 Reservoir 0.04 0.01
10 River 18.35 2.50 Total 733.00 100.00
11.4.3.2 Mineral Deposits
The Geological Survey of India, Western Region, Jaipur had informed vide their letter No. 171/G-1/EG/WR/GSI/08-09 dated 9th April 2009 (Annexure 4.3, Volume-II) that, the area covered under Par-Tapi-Narmada link project in Valsad and Dangs districts of Gujarat and partly Nasik district of Maharashtra are occupied by the different basaltic flows and associated rocks belonging to the Deccan Traps. No significant minerals have been reported from the area, except construction material and a few minor minerals like zeolites. 11.4.3.3 Historic / Archaeological Monuments
The Archaeological Survey of the project area has been carried out by Archaeological Survey of India, Aurangabad Circle during May, 2009 and Dec, 2010. The Archaeological Survey of India, Vadodara vide their letter No. 36/10/MIS/08-09/4078 dated 19th June 2009 (Annexure 4.2.1, Volume-II) have submitted a brief report on archaeological exploration and informed that no monuments or any remains of archaeological importance were noticed in the areas of 5 reservoirs viz., Paikhed, Chasmandva, Chikkar, Dabdar and Kelwan dams and none of the centrally protected monuments are located in the area likely to be submerged due to

865
construction of proposed dams in the area of Par-Tapi-Narmada link project. Similarly, the Superintending Archaeologist, Archaeological Survey of India, Aurangabad Circle vide their F No.12/2009-10/Tech-3036 dated 17th Feb 2011 (Annexure 4.2.2, Volume-II) submitted the brief report on the archaeological survey and informed that no monuments or any remains of archaeological importance were noticed at dam site and in the submergence area of Jheri reservoir proposed under Par-Tapi-Narmada link project 11.4.3.4 Geology
The geology of the Par-Tapi-Narmada link project area, which forms a part of the peninsular shield of India, is mostly covered by basaltic rock formed by eruption and solidification of lava flows (Misra, 2005). The Indian sub-continent has experienced at least 5 continental flood basalt eruptions ranging in age from Middle Proterozoic to Late Cretaceous and Early Tertiary. The youngest of these is the Deccan Flood Basalt of Cretaceous to Eocene age. The series of eruptions proceeded from fissures and cracks in the surface of the earth, from where lava welled out intermittently till a thick sheet of basalt was formed. This obliterated the previously existing topography of the country and converted it into an immense volcanic plateau. This epochal volcanic formation is known in Indian geology as the Deccan Trap formation. Most of the land around the project site is covered by Deccan Traps, which almost entirely constitute the exposed rock unit of this terrain.
The most prominent rock formations at all the 6 dam sites of Par-Tapi-Narmada link project are of Deccan trap represented by Amygdaloidal basalt. The Par and Auranga basins, where Jheri, Paikhed and Chasmandva dam sites are located, belong to the Precambrian, melipozoice, tertiary and quaterniary ages. Deccan traps in this region are of two types; one being dark grey to bluish black, which are hard, compact and massive; and the other being light brown to pink, which are soft. The Ambica basin wherein Chikkar and Dabdar dams are proposed belong to the Quaternary and Tertiary ages. Deccan traps with dykes alluvial plains. Rocks found in Purna basin, where Kelwan dam is proposed are Neogene, Paleogene and early Paleogene. In the east of Purna basin, there are high ridges and deep

866
valleys; which towards west merge into the lower reach composed of recent and sub-recent alluvium.
11.4.3.5 Soils
The Par-Tapi-Narmada link in the western part of India is planned to transfer water from the surplus regions of Western Ghats to the water deficit regions of Saurashtra and Kutch regions. Soil is the product of geological, chemical and biological interactions. The soils of district Vadodara are shallow to deep and are dominantly fine textured (clayey) followed by medium textured (loamy). The soils in southern region are very deep, well drained, fine to medium textured. The soils in district Bharuch, Narmada, Surat and Valsad are mainly very deep followed by shallow depths. Soil depths in Tapi district are mainly shallow followed by very deep and in Dangs district are dominantly distributed in shallow depths. The soil quality was monitored at various locations in the project area. The monitoring has been conducted for 3 seasons viz summer (June 2010), winter (Dec 2010) and monsoon (Aug-2011). As per EIA manual, the soil sample has been collected once in a season. The list of parameters monitored along with Protocols used for analysis is given in Table- 11.6. The list of Sampling Locations for command area is given at Table- 11.7(A) for Summer and Winter seasons; 11.7 (B) for Monsoon season; 11.7 (C) for dams in Monsoon season; 11.7 (D) for canal / catchment area in Monsoon season.
Table- 11.6 Soil Quality Parameters Monitored alongwith List of Protocols
Sl. No. Parameter Protocol 1 pH @ 25 oC Electrometric method 2 Electrical Conductivity (EC) Electrometric method 3 Texture Field method 4 Porosity Calculation method 5 Available Moisture Content Evaporation method 6 Calcium (Ca+) EDTA method 7 Magnesium (Mg+) Calculation method 8 Sodium (Na) Flame photometric method 9 Potassium (K) Flame photometric method
10 Sodium Absorption Ratio Calculation method

867
Sl. No. Parameter Protocol (SAR)
11 Total Phosphorus Colorimetric method 12 Total Nitrogen Modified Kjeldahl method
Table- 11.7 (A)
Samples in Par-Tapi-Narmada Command Area for Summer and Winter Seasons
Sl. No. Location Dam Sample ID 1 Dharampur Chasmandva S1 2 Ulaspedhi Paikhed S3 3 Sadarvera Paikhed S5 4 Bopi Chasmandva S6 5 Mankuniya Chasmandva S7 6 Khambhla Dabdar S8 7 Ahwa Chikkar S9 8 Davdahad Dabdar S10 9 Sarwar Dabdar S11 10 Mheskatri Kelwan S12 11 Dabdar Dabdar S13 12 Dungarda Dabdar S14 13 Jamalpada Chikkar S15 14 Dhangdi Chikkar S16 15 Saputara Chikkar S17 16 Surgana Jheri S18 17 Manigam Jheri S19 18 Bedse Jheri S20
Table- 11.7 (B) Samples in Par-Tapi-Narmada Command Area for Monsoon Season
Sl. No. Village Taluka District Sample ID 1 Moti Vahial Kaparada Valsad S1 2 Bhensadara Dharampur Valsad S2 3 Tumbi Dharampur Valsad S3 4 Pendha Dharampur Valsad S4 5 Mindbhari Vasada Navsari S5 6 Kelia Vasada Navsari S6

868
Sl. No. Village Taluka District Sample ID 7 Motivelzar Vasada Navsari S7 8 Moti Dabhas Dang Dang S8 9 Vgulwchali Dang Dang S9
10 Amhia Vyara Tapi S11 11 Dhamodi Vyara Tapi S12 12 Bhurivel Songadh Tapi S13 13 Parvat Mandvi Tapi S15 14 Mangrol Mangrol Surat S16 15 Nani Narol Mangrol Surat S17 16 Supdahad Ahwa Dang S19
Table- 11.7 (C)
Samples in Par-Tapi-Narmada Dams for Monsoon Season Sl. No.
Dam Site River Sample location Sample ID
1
Jheri Par Bedse S20 Kankavani S 21
2 Paikhed Par Moti Korval S 22 3 Chasmandva Auranga Bopi S 25
Nirpa or Chorvan
S 26
4 Chikkar Ambica Jamalpad S 27 Dhangdi S 28
5 Dabdar Ambica Davdhad S 29 Chikkar S 30
6 Kelwan Purna Mheskatri S 31
Table- 11.7 (D) Samples in Par-Tapi-Narmada Canal for Monsoon Season
Sl. No. Village Taluka District Sample ID 1 Ukai Songadh Tapi S 33 2 Kantol Jaghadia Bharuch S 34 3 Dharoli Jaghadia Bharuch S 35 4 Garudeshwar Near Kevadia Narmada S 36 5 Amreshwar Dabhoi Vadodara S 37

869
6 Mangrol Mangrol Surat S16 7 Nani Narol Mangrol Surat S17 8 Amhia Vyara Tapi S11 9 Bhurivel Songadh Tapi S13
10 Chelwas Mandvi Tapi S14 The season wise findings of soil monitoring are briefly described below: i) Summer Season: The pH @ 25 oC ranged from 5.99 to 7.64 located at Dharampur and Saputara. The Electrical Conductivity ranged between 72.60 μS/cm and 1670.00 μS/cm located at Manigam and Khambla. The Porosity ranged between 32.66% and 58.18% located at Dhangdi and Moti-Korwad. The Available Moisture Content ranged from 0.46% to 6.72% located at Manigam and Ahwa. The concentration of Calcium is in range between 240.48 mg/kg and 11382.72 mg/kg located at Moti-Korwad and Khambhla. The concentration of Magnesium is in range between 45.78 mg/kg and 825.03 mg/kg located at Sadarvera and Surgana. The concentration of Sodium is in range between 33.00 mg/kg and 2126.40 mg/kg located at Manigam and Chikkar. The concentration of Potassium is in range between 2 mg/kg and 227 mg/kg located at Bheskatri and Sadervera. The concentration of SAR is in range between 0.28 and 15.42 located at Manigam and Chikkar. The concentration of Total Phosphorus is in range between 0.12% and 0.37% located at Jamalpada, Dhangdi and Surgana. The concentration of Total Nitrogen is in range between 0.04% and 0.43% located at Dungarda, Saputara and Bheskatri. ii) Winter Season: The range of pH @ 25 oC is in between 6.4 and 7.3 located at Dungarda, Dhankwad and Chikkar. The Electrical Conductivity is in range between 101 μS/cm and 1670 μS/cm located at Surgana and Khambhla. The Porosity is in range between 35.1% and 54.0% located at Surgana and Moti-Korwada. The Available Moisture Content is in range between 1.1% and 5.8% located at Manigam and Sarvar. The concentration of Calcium is in range between 287 mg/kg and 2584 mg/kg located at Moti-Korwad and Sadarvera. The concentration of Magnesium is in range between 54 mg/kg and 680 mg/kg located at Sadarvera and Surgana. The concentration of Sodium is in range between 80 mg/kg and 2150 mg/kg located at Mankuniya and Khambhla. The concentration of Potassium is in

870
range between 2 mg/kg and 246 mg/kg located at Bheskatri, Dungarda and Sadarvera. The concentration of SAR is in range between 0.089 and 2.256 located at Dhangdi and Chikkar. The concentration of Total Phosphorus is in range between 0.12% and 0.35% located at Jamalpada, Khambhala and Davdahad. The concentration of Total Nitrogen is in range between 0.05% and 0.30% located at Manigam and Bedse. iii) Monsoon Season (Command Area): The range of pH @ 25 oC is in between 7.1 and 6.6 located at Mheskatri, Chikkar and Dungarda. The Electrical Conductivity is in range between 180 μS/cm and 1470 μS/cm located at Dhangdi and Sadarvera. The Porosity is in range between 39.1% and 46.2% located at Dhangdi and Jamalpada. The Available Moisture Content is in range between 2.5% and 4.5% located at Dhangdi and Jamalpada. The concentration of Calcium is in range between 0.82 gm/kg and 2.45 gm/kg located at Dhankwal and Sarwar. The concentration of Magnesium is in range between 0.055 gm/kg and 0.50 gm/kg located at Dhankwal and Jamalpada. The concentration of Sodium is in range between 0.061 gm/kg and 0.992 gm/kg located at Dhankwal and Bopi. The concentration of Potassium is in range between 0.002% and 0.273% located at Jamalpada and Dharampur. The concentration of Total Phosphorus is in range between 0.17% and 0.28% located at Jamalpada and Mheskatri. The concentration of Total Nitrogen is in range between 0.07% and 0.25% located at Mheskatri and Jamalpada.
iv) Monsoon Season (at Dam Site): The range of pH @ 25 oC is in between 6.7 and 7.2 located at Nirpan and Chikkar. The Electrical Conductivity is in range between 165 μS/cm and 1370 μS/cm located at Jamalpad and Bopi. The Porosity is in range between 36.8% and 50.6% located at Dhangdi and Mheskatri. The Available Moisture Content is in range between 1.9% and 4.8% located at Dhangdi and Chikkar. The concentration of Calcium is in range between 0.36 gm/kg and 2.56 gm/kg located at Bedse and Mheskatri. The concentration of Magnesium is in range between 0.065 gm/kg and 0.525 gm/kg located at Nirpa and Mheskatri. The concentration of Sodium is in range between 0.088 gm/kg and 1.75 gm/kg located at Nirpa and Chikkar. The concentration of Potassium is in range between 0.002% and 0.26% located at Chikkar and Girnaru. The concentration of Total Phosphorus is in range between 0.16%

871
and 0.37% located at Jamalpada and Davdhad. The concentration of Total Nitrogen is in range between 0.06% and 0.32% located at Bopi and Bedse.
v) Monsoon season (in Canal /Catchment area): The range of pH @ 25 oC is in between 6.8 and 7.0 located at Kantol and Dharoli. The Electrical Conductivity is in range between 1130 μS/cm and 1260 μS/cm located at Garudeshwar and Ukai. The Porosity is in range between 39.9% and 44.9% located at Kantol and Dharoli. The Available Moisture Content is in range between 3.9% and 4.6% located at Garudeshwar and Ukai. The concentration of Calcium is in range between 2.2 gm/kg and 2.62 gm/kg located at Dharoli and Amreshwar. The concentration of Magnesium is in range between 0.48 gm/kg and 0.52 gm/kg located at Dharoli and Amreshwar. The concentration of Sodium is in range between 0.50 gm/kg and 1.75 gm/kg located at Amreshwar and Kantal. The concentration of Potassium is in range between 0.48% and 0.52% located at Dharoli and Amreshwar. The concentration of Total Phosphorus is in range between 0.24% and 0.27% located at Garudeshwar and Dharoli. The concentration of Total Nitrogen is in range between 0.25% and 0.28% located at ukai and Garudeshwar. 11.4.4 Terrestrial Ecology 11.4.4.1 Delineation of Flora in Study Area
According to Champion and Seth’s revised (1986) classification of forest types, the study area falls in the South Indian Tropical Moist Deciduous forests (Group 3A/C1). The main two categories of the forest types existing in the study area are:
Southern Indian Moist Deciduous Forests and Southern Dry Deciduous Forests
These two broad categories are further divided into eight sub types viz: 3B/C1a Very moist teak forests 3B/C1b Moist teak forests 3B/C1c Slightly moist teak forests 3B/C2 Southern moist mixed deciduous forests 5A/C1b Dry teak forests

872
5A/C3 Dry mixed deciduous forests 5E9 Dry Bamboo brakes 5/1S1 Dry tropical riverine forests
A rapid reconnaissance survey was conducted to understand the
existing ecosystem types and to identify the presence of ecologically sensitive areas in the study area. In intensive survey, status of flora was assessed using circular plot of various sizes for trees, shrubs, herbs and grass species. Ten and one m radius plots were used to quantify trees, shrubs and herbaceous (herb and grass) species respectively. Trees with > 25 cm GBH were considered as matured trees and rest were classified in the recruitment and regeneration classes. Within the plots all the trees and shrubs were identified and enumerated. For grass and herbs species list and cover availability were estimated visually.
During rapid survey, identified the plants from the fresh material; those that could not be satisfactorily identified in the field were brought to the laboratory and identified by checking it with monographs, herbarium specimens and other available literature on regional and State floras. The forests of the study sites belong to the subgroup Southern moist deciduous forest, and within this are more specifically classified as moist teak forests (Champion and Seth, 1968). According to the classification followed by Puri et. al., (1983) these forests are classified as deciduous teak forest types which are intermediate between dry and moist categories. They are named as the Tectona-Terminalia-Adina-Anogeissus series. The forests are known to be the richest in Gujarat and contain many invaluable timber species as well as medicinally important species (presently Dangs occupy about 30% of the forest area of Gujarat and generate 50% of its forest revenue and flora of Dangs is richest in Gujarat) (WWF, 2005). Teak (Tectona grandis) is the most dominant species in study sites and occurs throughout the area. Other dominating tree species are bamboo, shisam (Dalbergia sisoo), khair (Acacia catectu), dhavdo (Anogeissus latifolia) and kadam (Anthocaphalus sp.). The other indigenous tree species available in the forest are Anogeissus sps. (dhav, dhavdo), Bauhinia racemosa (asitro), Butea monosperma (khakharo, kesudo), Terminalia crenulata (sadad), Lannea coromandelica (modad, golado), Boswellia serrata (salai, halar, gugur), Diospyros melanoxylon (timaru, bidi patta), Cassia fistula (garmaro), Syzygium cumini

873
(jamu), Prosopis juliflora (gando bavar), Eucalyptus sp (nilgiri)., Gmelina arborea (shevan), Termenelia arjuna (arjun sadad), Cassia auriculata (avar), Emblica officinalis (amara) etc. (Shah, 1978).
During rapid assessment of ecosystems, the overall study area is categorized into different land uses under the land ownership and different levels of productive potential. However, for the study purpose they have been delineated into five major habitat types according to the nature of vegetation existing in it. 1) Stream Beds; this includes the area on the banks of seasonal rivers, stream and small nallah. 2) Wetland: Since these water bodies (manmade village ponds) are located within the buffer zone of the proposed dams/reservoirs in area, aquatic plants were counted and discussed under wetland habitats (at preliminary level). 3) Agro-ecosystem; it means areas under the agriculture use (irrigated lands, un-irrigated lands, cultivable waste/fallow land) and its surrounding hedge vegetation (locally known as – khetars or wadis) owned by the private people. 4) Open scrub or degraded Forest; mainly small patches of waste lands and Gauchar lands with scrub vegetation and scattered tree species which belongs to revenue or government. 5) Moist deciduous Forest; all the categories of forest lands including species specific as well as composition of dominant tree species belongs to forest department. Visible observation of study area, tree and shrub covers suggest that: The visibility observation during the visit to all project sites, tree and
shrub covers suggest that the maximum diversity in buffer zone beyond 2-5 km radius from the proposed dam sites. The density and diversity of tree and shrub covers decrease away from the proposed sites. The forest

874
lands found to be most suitable habitat for all floral components which was followed by degraded-open lands.
Different types of forests that constitute varied habitats are moist mixed deciduous forest, moist teak forest and very rarely seen bamboo brakes. Bamboo forms thick middle storey in large area with tree cover having moderately dense canopy.
The natural vegetation of the proposed project sites is a three-tiered forest
adapted to the monsoon and dry season climate. The forests typically have an upper canopy at 10–15 meters, 5-10 meter understory of smaller trees and large shrubs, and 3-4 meter undergrowth.
Based on rapid survey in and around the agricultural area and dialogue
with the local farmers a total of more than 20 species have been listed as crop species. The crops list includes 7 grains, 5 fruits and 5 vegetable species. Fruit and vegetable crops were found cultivated along the agricultural hedges in a small extent of area (as visible). In addition 2 cash, 2 timber crop also observed to grow in the area.
11.4.4.2 Status of Fauna
As per the survey conducted on major bird species observed in the study area are Pea fowl, Indian cuckoo, Blue rock pigeon, King fisher, Griffon vulture. As per the secondary data available, the common mammals found in the project area are Leopard, Jungle Cat, Indian Fox, Jackal, Four horned Antelope, Woodpeckers, Barking Deer, Chital, Pangolin, Lizard etc.
11.4.4.3 Status of Fish Fauna
Major fish species reported in the study area are Catlacatla, Labeo frimbriatus, Labeo calabasu, Cirrhinus reba, Puntius sarana, Mystus senghala, M. aor, M. cavasius, Wallago attu, Channa spp, Mastacembalus armatus. Among these only two species of fishes ie Channa spp and Mastacembalus armatus are observed during the survey. None of the fish species appear to have long migration pattern.

875
11.4.5 Public Health Facilities
The information regarding health facilities including availability of hospital, maternity and child welfare centre and Primary Health Centre (PHC) etc. are collected and found that Hospital facility is available for all the villages but its average distance is more than 10 km. Similarly, Maternity and Child Welfare Centre are also available at the average distance of more than 10 km. Village wise availability of medical facilities in the affected villages are given at Table - 11. 8 to 11. 13.
Table – 11.8
Village-wise Medical Facilities in Jheri Reservoir Area Sl. No.
Village Medical Facilities (Within Range (in km) Allopathic Hospital
Maternity and Child welfare
Centre
Primary Health Centre
1 Kirdi >10 >10 >10 2 Khokarvihir >10 >10 >10 3 Kayare >10 >10 >10 4 Gandole >10 >10 >10 5 ModhalPada >10 >10 5 to 10 6 Ambe >10 >10 x
Table – 11.9
Village-wise Medical Facilities in Paikhed Reservoir Area Sl. No.
Village Medical Facilities (Within Range (in km) Allopathic Hospital
Maternity and Child welfare
Centre
Primary Health Centre
1 Paikhed >10 >10 >10 2 Gundiya >10 >10 >10 3 Khudki >10 >10 >10 4 Madhuri >10 >10 >10 5 Chavra >10 >10 >10

876
Sl. No.
Village Medical Facilities (Within Range (in km) Allopathic Hospital
Maternity and Child welfare
Centre
Primary Health Centre
6 Khapatiya >10 >10 >10 7 Satvankal >10 >10 >10 8 Tutrkhed >10 >10 >10 9 Karanjul >10 >10 >10 10 Rkshabhuwan >10 >10 >10 11 Bhendval >10 >10 >10
Table – 11.10
Village-wise Medical Facilities in Chasmandva Reservoir Area Sl. No.
Village Medical Facilities (Within Range (in km) Allopathic Hospital
Maternity and Child welfare
Centre
Primary Health Centre
1 Chasmandva >10 >10 >10 2 Jugiri >10 >10 >10 3 Chorvani >10 >10 >10 4 Nirpan >10 >10 >10 5 Nadagheri >10 >10 >10 6 Mandhu >10 5 to 10 >10 7 Ragatvihir >10 >10 5 to 10
Table – 11.11
Village-wise Medical Facilities in Chikkar Reservoir Area Sl. No.
Village Medical Facilities (Within Range (in km) Allopathic Hospital
Maternity and Child welfare
Centre
Primary Health Centre
1 Baj >10 >10 within 5 2 Barkhdya
(Barkhandhia) >10 >10 >10
3 Eanbhas (Ranbhas)
>10 >10 >10

877
4 Khirnani >10 >10 >10
5 Khirdi (Chikkar)
>10 >10 >10
6 Kundu >10 within 5 within 5 7 Laha Dabdar >10 within 5 within 5 8 Sakarpatal >10 Available Available 9 Susarda >10 x x
Table – 11.12
Village-wise Medical Facilities in Dabdar Reservoir Area Sl. No.
Village Medical Facilities (Within Range (in km) Allopathic Hospital
Maternity and Child Welfare Centre
Primary Health Centre
1 Bhavadi >10 >10 >10 2 Chinchingarvtha >10 >10 5 to 10 3 Dabdar >10 >10 5 to 10 4 Dhadhra 5 to 10 5 to 10 5 to 10 5 Ghodi >10 >10 5 to 10 6 Ghoghalpada >10 >10 >10 7 Gira >10 >10 within 5 8 Malin >10 >10 >10 9 Kudkas 5 to 10 >10 >10
10 Kukadnakhi 5 to 10 >10 >10 11 Pimpri >10 >10 >10
Table – 11.13
Village-wise Medical Facilities in Kelwan Reservoir Area Sl. No.
Village Medical Facilities (Within Range (in km) Allopathic Hospital
Maternity and Child Welfare Centre
Primary Health Centre
1 Balkhet >10 >10 within 5 2 Bhogadiya >10 >10 5 to 10

878
(Bhongdya) 3 Bhujad >10 >10 within 5 4 Chikhala >10 >10 >10 5 Chikar >10 >10 >10 6 Divdayavan >10 >10 5 to 10 7 Engin Pada >10 >10 >10 8 Godadiya >10 >10 >10 9 Kakarda >10 >10 within 5 10 Kalibel >10 >10 Available 11 Masli >10 >10 x 12 Khatal >10 >10 Available 13 Khopriamba >10 >10 Available 14 Pandharmal >10 >10 x 15 Patli >10 >10 x 16 Tekpada >10 >10 Available 17 Wankan >10 >10 x
11.4.6 Drinking Water Supply Data on sources of water for drinking purpose indicates that the villages fetch water from different sources including hand pumps followed by wells, tanks and rivers. It was further observed that in most of the villages of the study area during summer season, the hand pumps are getting dry for almost 2 to 4 months annually and then the study area population is mainly depending on wells, tanks and rivers as drinking water sources. 11.5 Environmental Impact Assessment
Environmental Impact Assessment is a process of assessment of both positive and negative impacts on the environment due to implementation of the developmental projects. The primary objective of Environmental Impact Assessment is to encourage the inclusion of environmental considerations in planning and decision making and to ultimately arrive at actions that are environmentally more compatible. Based on the project details and the baseline environmental status, potential impacts as a result of the construction and operation of the proposed Par-Tapi-Narmada link project have been identified. The Impact Assessment

879
for quite a few disciplines is subjective in nature and cannot be quantified. Wherever possible, impacts have been quantified and otherwise, qualitative assessment has been undertaken. The impacts on various aspects of Environment have been assessed for construction as well as operation phases of project. 11.5.1 Impacts on Air Environment 11.5.1.1 Impact on Air Quality i) Construction Phase: The air pollution Impact on surroundings shall be mainly during construction phase- a) Pollution Due to Fuel Combustion in Various Equipments: The operation of various construction equipments requires combustion of fuel. Normally, diesel is used in such equipment. The major pollutant which gets emitted as a result of diesel combustion is SO2. The SPM emissions are minimal due to low ash content in diesel. The short-term increase in SO2, even assuming that all the equipment is operating at a common point is quite low ie of the order of less than 1 μg/m3. Hence, no major impact is anticipated on this account. b) Fugitive Emissions from Various Sources: During construction phase, there will be increased vehicular movement and a lot of construction material like sand, fine aggregate is stored at various sites. Normally, due to blowing of winds, especially when the environment is dry, some of the stored material can get entrained in the atmosphere. However, such impacts are visible only in and around the storage sites. The impacts on this account are generally, insignificant in nature. c) Impacts Due to Vehicular Movement: During construction phase, increase in number of vehicles is anticipated for transportation of construction material. The increase in number of vehicles is expected to be a maximum of 35 / hour. As such; no major impact on ambient air quality is anticipated due to increase in vehicular movement during construction phase.

880
ii) Operation Phase: During operation phase, no major impacts are envisaged. 11.5.1.2 Impacts on Noise Environment i) Construction Phase: The impacts on ambient noise levels are expected during the project construction phase only due to earth moving machinery, increased vehicular movement etc. The present noise level was monitored at 9 locations in the project area. No increase in noise level is anticipated as a result of various activities during the project construction phase. There could be marginal impact on the population residing in proximity to the canal alignment during construction phase as a result of various activities. However, based on past experience, in similar project, the impact however, is not expected to be significant.
During construction phase, there will be significant increase in vehicular movement for transportation of construction material. The vehicular movement is expected to increase upto a maximum of 45 to 50 trucks / hour. The impact on noise level due to increased vehicular movement was studied Federal Highway Administration model. No significant impact other than the above on this account is anticipated. ii) Operation Phase: Noise pollution occurs mainly during project construction phase. During project operation phase, no major impacts are envisaged. 11.5.2 Impacts on Water Resources and Quality
i) Construction Phase a) Impacts Due to Sewage Generation from Labour Camps: The major sources of water pollution during project construction phase are the sewage generated from the labour camps / colonies. The project construction is likely to last for a period of 7 years. About 5000 workers and 800 technical staff are likely to migrate during project construction phase. The employment opportunities in the area are limited. Thus, during

881
the project construction phase, many of the locals may get employment. It has been observed during construction phase of many of the projects, the major works are contracted out, and who bring their own skilled labour. However, it is only in the unskilled category, that locals get employment. The construction phase also leads to mushrooming of various allied activities to meet the demands of the immigrant labour population in the project area. The increase in the population is expected to be of the order of 14000. The total domestic water requirement of the labour population (including families) is expected to be of the order of 0.98 mld @ 70 lpcd. It is assumed that about 80% of the water supplied will be generated as sewage. Thus, the total quantum of sewage generated is expected to be of the order of 0.8 mld. The total BOD load contributed by various labour camps/colonies will be about 630 kg/day. The above pollution loading is likely to be spread over 3 to 4 labour camps. The disposal of sewage without treatment could lead to adverse impacts on land environment or water environment in which the effluent from the labour camps / colonies are disposed.
Disposal of Sewage Water is an essential part of the EMP. One community toilet needs to be provided for 20 persons. The wastewater generated from the colonies will be collected and disposed in specifically designed Soak pits and Septic tanks. The wastewater and sewage generated will not be allowed to flow into the rivers and streams of the area. The sanitary facilities at the colonies should be of standard municipal design for hill areas. However, efforts shall be made to ensure, that treated effluent is disposed only in these water bodies, which are not used for meeting domestic water requirements.

882
b) Impacts Due to Runoff from Construction Sites: Substantial quantities of water would be used in the construction activities. With regards to water quality, waste water from construction activities would mostly contain suspended impurities. Adequate care should be taken so that excess suspended solids in the waste water are removed before these are disposed into water body or over land. Similarly, effluents due to washing from truck parking area, workshop, etc. would have high concentration of oil and grease. The effluent quality is too small to cause any adverse impact. However, it is still recommended to treat the effluent from these units / areas by oil and separator unit, to ameliorate even the marginal adverse impacts likely to accrue on this account. ii) Operation Phase a) Impacts on Downstream Users: A total quantity of 1330 MCM is proposed for diversion from 6 reservoirs in Par, Auranga, Ambica and Purna river basins against the net yield in an average year for 6 reservoirs 1425 MCM. It is planned to utilise the water proposed to be transferred, for various command areas in the vicinity of the project, viz., in the en-route command, command area of five projects proposed by Government of Gujarat, command area in the vicinity of of reservoirs, en-route command right side of canal by lift, Command area in Chhota Udepur and Panchmahal districts, drinking water supply and filling of tanks, and Target command to the tune of about 382 MCM, 285MCM, 48 MCM, 138 MCM , 130 MCM, 76 MCM, 50 MCMand 161 MCM respectively. Thus, the quantity of water saved in Sardar Sarovar project to the tune of 291 MCM
will be available for irrigation in target command i.e. in drought prone area of Saurashtra and Kutch regions.
The diversion of water for meeting irrigation and other requirements could lead to following impacts:
Modification of hydrologic regime Impacts on downstream water quality due to diversion of water from
various dams Impacts due to change in waste assimilation capacity of the river

883
system including downstream of dam Impacts on downstream water users for various dams Impacts on drainage system due to canal network Impacts due to siltation Impacts on performance of existing projects due to diversion of water
for irrigation
The reservoir formation on account of construction of 6 dams could lead to impacts on present and future ground water and surface water use in the upstream and the impacts on water availability of the project. The impacts envisaged are:
Impacts on existing water bodies upstream of dams in the project area:
No water body / tank / pond / lake are likely to submerge due to the submergence of the proposed six reservoirs. Hence, no impacts on existing water bodies upstream of dam are envisaged.
b) Impacts on Water Logging and Soil Salinity: The main cause of water logging in a command area due to irrigation could be as follows:
Developmental activities such as construction of roads, bridges, railway lines, buildings etc. resulting in choking of natural drainage.
Poor natural drainage as consequences of topography or unfavourable sub-soil geology like existence of hard pan at shallow depths.
Heavy storm and rainfall coupled with poor natural drainage. Heavy losses of water due to seepage from canals, distributaries and
water courses. Excess application of water particularly in the initial years when the
command is not fully developed. Poor on-farm water management resulting in poor application
efficiencies. Inadequate drainage and poor maintenance of existing drainage
system and outlets. Lack of conjunctive use of surface and ground waters.

884
The imbalance of air and water in root zone leads to adverse impacts on crop growth and are listed as under:
Depletion of oxygen in the root zone and increase/saturation of
carbon dioxide due to water logging. This anaerobic condition has an adverse effect on the growth of useful micro-organisms and harmful organisms proliferate and create several problems in the plant growth.
Physio-chemical and biological activities in the soil and disturbed on account of low temperature which is the result of water logging conditions. This also creates the problem of increase in pests and diseases.
Field operations also become either impossible or difficult in such soils.
c) Changes in Water Quality due to Increased Use of Fertilizers: The fertilizer dose is likely to increase once irrigation is introduced in the command area. Under the best farming practices, only 40 - 50% of the applied fertilizers is used by the crop and the balance finds its way into the aquatic environment through drainage runoff. An unexpected intense shower immediately after the spread of fertilizers may bring even greater amount of nutrients as a part of the runoff into the receiving water body.
To compensate the nutrient removal by crops, additional dose of nutrients, ie fertilizers dosing needs to be given. Wash down of fertilizers and organic matter rich in nutrients from the surrounding agricultural fields cause eutrophication of water bodies. Overgrowth of aquatic weeds affects the survival of aquatic organisms through depletion of oxygen, change in odour and taste of water. With the introduction of irrigation, use of fertilizers is likely to increase, to maintain the increased levels of production. The drainage system (natural or man-made) is likely to contain much higher level of nutrients. The climatic conditions in the project area too are suitable for the proliferation of eutrophication in the project area. Thus, in the project operation phase, there will be increased probability of eutrophication in the water bodies receiving agricultural runoff. d) Impacts due to Effluent from Project Colony: During project operation phase, due to absence of any large scale construction activities, the

885
cause and source of water pollution will be much different. Since, only a small number of OandM staff will reside in the area in a well designed colony which will have a Sewage Treatment Plant and other infrastructure facilities, the problems of water pollution due to disposal of sewage are not anticipated. e) Recharge of Ground Water: Par-Tapi-Narmada link project envisages creation of Jheri, Paikhed, Chasmandva, Chikkar, Dabdar and Kelwan reservoirs and link canal. Due to these reservoirs and link canal, recharge of ground water in the area of downstream of dams and en-route link canal will take place. This will be a positive impact of the project. 11.5.3 Impacts on Land Environment i) Construction Phase: The construction of the proposed Par-Tapi-Narmada link project is expected to be completed in about 7 years. Majority of the environmental impact during construction phase are temporarily in nature, lasting mainly during the construction phase and for small duration beyond the construction period. The major impacts anticipated on land environment during construction phase are as follows: Environmental degradation due to immigration of labour population Operation of construction equipment Soil erosion Impacts due to construction of roads a) Environmental Degradation due to Immigration of Labour Population: The peak labour and technical staff congregation would be of the order of 5000 and 800 respectively. The population of construction labour, technical and other work force for construction and related activities and service providers including their families is expected to be 14000. Separate accommodation and related facilities for workers, service providers and technical staff are to be provided as a part of the project. Congregation of labour force is likely to create problems of sewage disposal, solid waste management and falling of trees for meeting fuel requirements etc.

886
b) Operation of Construction Equipment: During construction phase, various types of equipment will be brought to the site. These include batching plant, earth movers, etc. The sitting and storage of these construction equipments would require significant amount of space. The site for storage of construction material and equipment will be selected such that it causes minimum adverse impacts on various aspects of environment. Efforts shall be made that such facilities are located on government or panchayat land only, so that hardships caused as a result of land acquisition, though temporarily on this account are minimized to the extent possible. c) Soil Erosion: Due to various construction activities such as construction of colonies / houses / toilet blocks etc. Soil erosion in the project area is bound to increase. During construction activities, the share of the forest cover will be adversely affected which in turn will cause loosening of the soil particles, thus increasing the rate of soil erosion and hence degradation of land environment. Substitute Plantation will mitigate the adverse affect of soil erosion. Impacts due to Construction of Roads: Roads are the only main mode of communication in the area. Waghai- Saputara National Highway (NH-360) passes in the submergence area of Chikkar dam. In addition, there is a wide network of Major roads, village roads and cart tracks. The status of village roads and cart tracks will have to be improved and new approach roads to quarries, labour colony, stores and construction sites will have to be constructed. Frequent movement of heavy vehicle loaded with construction material will cause air pollution in terms of SPM, noise and gases. To mitigate the pollution effects, preventive measures such as sprinkling of water, plantation of trees etc. have to be taken in right earnest. ii) Operation Phase: a) Acquisition of Land: The proposed project envisages construction of 6 reservoirs, 2 barrages, link channels and canal network. About 6065 ha of land will be acquired for proposed Jheri, Paikhed, Chasmandva, Chikkar, Dabdar and Kelwan reservoirs. Details are given at Table- 11.14:

887
Table- 11.14 Land to be Acquired under Reservoir Submergence of Various Dams Dam site Submergence Area (ha)
Forest Land
Culturable and Other Land
River Portion
Total
Jheri 408 256 172 836 Paikhed 317 589 88 994 Chasmandva
300 255 60 615
Chikkar 300 332 110 742 Dabdar 614 482 153 1249 Kelwan 890 450 289 1629
Total 2829 2364 872 6065
About 2509 families will be affected due to the submergence of these reservoirs, of which 98, 331, 379, 345, 563 and 793 families will be affected due to Jheri, Paikhed, Chasmandva, Chikkar, Dabdar and Kelwan reservoirs respectively.
The land to be acquired for link canal including feeder pipe lines for Par-Tapi-Narmada link canal is 4554 ha. Details are given in Table-11.15:
Table-11.15 Details of Land to be Acquire for Link Canal and Feeder Pipe lines
Link Details of Land (ha) Forest
Land Culturable
Land Uncultivable
Land River
Portion Total
Par- Tapi 964.30 855.00 133.80 26.60 1979.70 Tapi-Narmada 402.00 1457.70 188.50 60.10 2108.30 Feeder Pipe lines
244.10 152.60 0.90 9.10 406.70
Total 1610.40 2465.30 323.20 95.80 4494.70

888
11.5.4 Impact on Biological Environment 11.5.4.1 Terrestrial Environment 11.5.4.1.1 Impacts on Forest Cover i) Construction Phase: During project construction phase, labour population is likely to congregate near various construction sites. The workers and other population groups residing in the area may use fuel wood (if no alternate fuel is provided). To minimize impacts, community kitchens will be provided. These community kitchens shall use Liquefied Petroleum Gas or kerosene as fuel. ii) Operation Phase: Total forest land to be acquired in the reservoir submergence of 6 dams viz Jheri, Paikhed, Chasmandva, Chikkar, Dabdar and Kelwan is 2829 ha. Details are given at Table- 11.16(A).
Table- 11.16(A) Details of forest land to be acquired for the reservoirs
Sl. No. Dam site Forest land (ha) Maharashtra Gujarat Total
1 Jheri 408 0 408 2 Paikhed 0 317 317 3 Chasmandva 0 300 300 4 Chikkar 0 300 300 5 Dabdar 0 614 614 6 Kelwan 0 890 890
Total 408 2421 2829 Total forest land to be acquired in the canal alignment is 1610 ha.
Details are given at Table- 11.16(B).
Table-11.16(B) Details of forest land to be acquired for link canal and feeder pipe line.
Sl No. Canal Reach Forest land (ha) 1 Par- Tapi 964.30 2 Tapi-Narmada 402.00 3 Feeder Pipe lines 244.10
Total 1610.40 Say 1610.00

889
As per the findings of the study, rare, endangered and threatened
species are not reported in the study area. The impacts due to acquisition of forest land shall be mitigated through compensatory afforestation measures and implementation of a detailed set of bio-diversity conservation measures outlined in the Environmental Management Plan. 11.5.4.2 Impacts on Wildlife i) Construction Phase: The area to be brought under irrigation within the command area is devoid of forests. The project area is interspersed with settlements and agricultural land. In such settings large scale faunal population is not observed. Thus, no significant impact on wildlife is anticipated due to the project.
Purna and Vansda Wildlife Sanctuaries are falling within the study area. The project shall not be acquired any land from these sanctuaries. However, adverse impacts on account of increased human interferences will take place during project construction phase. A detailed anti-poaching plan including surveillance measures outlined in Environmental Management Plan. ii) Operation Phase: The following impacts on account of forest land acquisition and canal alignment shall be studied:
a) Impact due to habitat change having effect like corridor loss and loss of migratory path for wildlife including birds.
b) Impact on breeding grounds of species. c) Impacts on access of animals to food and shelter. d) Impacts on rare, endangered, threatened and endemic species.
11.5.4.3 Impacts on Aquatic Ecology i) Construction Phase a) Impact Due to Excavation of Construction Material from River Bed: During the construction phase a large quantity of construction material

890
like stones, pebbles, gravel and sand would be extracted from the Borrow areas in the river bed. The extraction of construction material may affect the river water quality due to increase in the turbidity levels. This is mainly because the dredged material gets released during one or all the operations mentioned below: Excavation of material from the river bed. Loss of material during transport to the surface. Overflow from the dredger while loading. Loss of material from the dredger during transportation.
The dredging and deposition of dredged material may affect the
survival and propagation of benthic organisms. The macro-benthic life which remains attached to the stones, boulders etc. gets dislodged and is carried away downstream by turbulent flow. The areas from where construction material is excavated, benthic fauna get destroyed. In due course of time, however, the area gets re-colonized, with fresh benthic fauna. The density and diversity of benthic fauna, will however, be less as compared with the pre-dredging levels.
The second important impact is on the spawning areas of fishes. The spawning areas of various fish species are found amongst pebbles, gravel, sand etc. The eggs are sticky in nature and remain embedded in the gravel and subsequently hatch. Any disturbance of stream bottom will result in adverse impacts on fish eggs.
Thus, if adequate precautions during dredging operations are not
undertaken, then significant adverse impacts on aquatic ecology are anticipated.
ii) Operation Phase a) Impacts Due to Damming of River: The damming of river due to construction of various dams will result in creation of reservoir of varied areas. The dam will change the fast flowing river to a quiescent lacustrine environment. The creation of a pond will bring about a number of alterations in physical, abiotic and biotic parameters both in upstream and

891
downstream directions of the proposed dam site. The micro and macro benthic biota is likely to be most severely affected as a result of the proposed project. b) Impacts on Migratory Fish Species: The obstruction created by the dam would hinder migration of various migratory species. These fishes undertake annual migration for feeding and breeding. Therefore, fish migration path may be obstructed due to the dams and fishes are expected to congregate below the dam wall. Under this situation poaching activities may increase in the area. Most of the species will shift to the section of the river where they find favourable environment for breeding. However, it is proposed that the artificial seed production in hatchery may be adopted which can be stocked in the river stretches downstream and upstream of the proposed dams. 11.5.4.4 Impacts on Socio-Economic Environment i) Construction Phase a) Impact of Influx or Migration of Labour: The construction phase will last for about 7 years. The peak labour force and technical staff required is estimated at about 5800. The total number of persons inhabiting the area including the service population will be about 14000. The project will open a large number of jobs to the local population. Job opportunities drastically improve in this area. The availability of infrastructure is generally a problem during the initial construction phase. Though the construction workers can be subsidized for certain facilities like health, education etc. The facilities of desired quality are often not made available in the initial stages. The adequacy of water supply, sewage treatment, housing, etc should therefore, be ensured before and adequate measures would be taken at the very start of the project. e) Impacts on Public Health due to Water Borne Diseases: Construction Phase- The construction phase of the project could lead to increase incident of various water borne and vector borne diseases if adequate precautions / control measures are not under taken. The health

892
risk specific to water resources projects emanate from congregation of labour at various construction sites. During construction phase, new groups come and go constantly keeping the human population in a flux. These groups are usually housed temporary dwelling without proper sanitary conditions and water supply. In the final stages, colonies for project maintenance, town ships are built. Population migration indicated by actual or possible opportunity for work can aggregate problems as a result of housing difficulties, overcrowding, raise in cost of living and some un-predicted social problems as well introduction of new sources of diseases or immigrants immunologically susceptible to the endemic diseases prevalent in the areas of development.
Many of the immigrant population could be reservoir of infection for various communicable diseases. Once they settle in labour camps / colonies, there could be increased incidence of various diseases. This aspect needs to be looked into with caution, and efforts must be made to ensure that a thorough check up of the labour population congregating in the area is conducted. Those affected by any ailments need to be properly quarantined depending on the ailment with which they are suffering. Operation Phase- Improvement in availability of water for various uses, increased agricultural production, availability of diversified food, strengthening of educational and health facilities significantly improves public health in project area. On the other hand, water resources development also has negative impacts, since it could increase the habitat of certain vectors like mosquitoes. Malaria is a common vector borne disease in the project area. The project may create favourable conditions for breeding of new pathogens or vectors such as mosquitoes, etc. Most of the water borne diseases can largely be prevented by adequate hygiene. With the increased water availability, quality of water being supplied is expected to improve and the incidence of water borne diseases will reduce. However, adequate measures in the form of strict public health measures are proposed.

893
11.5.5 Impacts on Micro Climate
The increase in surface area of water, irrigation and vegetation cover in the project area may on a local level moderate the temperature, ie lead to reduction in the number of days of high temperature, if not in the maximum temperature itself. The higher humidity as a result of higher evapotranspiration is likely to raise the minimum temperature and increased occurrence of fogs during the cooler months. The increased humidity level may also increase the instances of fog due to increased moisture content in the atmosphere. At the current level of knowledge a qualitative assessment on the above item is not possible. 11.5.6 Greenhouse Gas Emissions
The major Green House Gases (GHGs) are carbon dioxide (CO2), methane (CH4) and nitrous oxide (N2O). These gases are emitted from both natural aquatic (lakes, rivers, estuaries, wetlands) and terrestrial ecosystems (forest, soils) as well as from anthropogenic sources. CO2 emissions account for the largest share of GHGs equivalent of ±80-85% of the emissions. Fossil fuel combustion for transportation and electricity generation are main source of CO2 contributing to more than 50% of the emissions. Thermal power plants represent 66% of the world's electric generation capacity. Hydropower represents about 20% of the world's electricity generation capacity and emits 35 to 70 times less GHGs per TWh than thermal power plants.
In last few years GHG emissions from freshwater reservoirs and their contribution to the increase of GHGs in the atmosphere are also being considered as a source of greenhouse gas emissions. In the case of reservoirs, it is known that the amount of GHGs emitted at the air water interface varies over time. In fact, there is an initial peak which occurs immediately after impoundment. The increase of GHG emissions in reservoirs shortly after flooding is related to the release of nutrients, enhanced bacterial activity and decomposition of liable carbon. Magnitude of emissions for both reservoirs and natural aquatic systems depend on physico-chemical characteristics of the water body and on the incoming carbon from the watershed.

894
The issue of reservoir emissions has been recognized at the
international level by the Clean Development Mechanism Executive Board (UNFCCC, 2006b) as well as the Intergovernmental Panel for Climate Change-2006. Beyond such preliminary developments, progress in the policy remains at a very early stage and is generally held back by a number of scientific uncertainties.
Based on available literature, greenhouse details of gas emissions from reservoirs in India are given at Table- 11.17:
Table- 11.17
Gas emissions from Reservoirs in Tropical Countries Sl. No.
Project Predicted Gross* Annual CO2
Diffusive Flux (mg C-CO2 m-2d-1)
Predicted Gross* Annual CH4
Diffusive Flux (mg C-CH4 m-2d-1)
Predicted
Value
67% Confidence Interval
Predicted
Value
67% Confidence Interval
Lower Limit
Upper Limit
Lower Limit
Upper Limit
1 Sardar Sarovar 1156 503 2659 238 67 846 2 Pong 361 157 829 55 15 195 3 Bhadra 354 154 815 62 17 220 4 Sabarigiri 361 157 830 56 16 200 5 Madhikhera 1115 485 2565 231 65 820 6 Doyang 744 324 1712 19 5 67 7 Hirakud 679 295 1561 75 21 266
11.6 Environmental Management Plan 11.6.1 Pollution Control at Construction Sites 11.6.1.1 Air Pollution Control Control of Emissions: Minor air quality impacts will be caused by emissions from construction vehicles, equipment and DG sets, and emissions from transportation traffic. Frequent truck trips will be required during the construction period for removal of excavated material and delivery of construction equipment and material.

895
The following measures are recommended to control air pollution:
The contractor will be responsible for maintaining properly functioning construction equipment to minimize exhaust.
Construction equipment and vehicles will be turned off when not used for extended periods of time.
Unnecessary idling of construction vehicles to be prohibited. Effective traffic management to be undertaken to avoid significant
delays in and around the project area. Road damage caused by sub-project activities will be promptly
attended to with proper road repair and maintenance work. Air Pollution Control due to DG Sets: The Central Pollution Control Board (CPCB) has issued emission limits for generators upto 800 KW. Details are given at Table- 11.18:
Table- 11.18
Emission Limits for DG Sets Prescribed by CPCB Parameter Emission Limits (gm/kwhr)
NOx 9.2 HC 1.3 CO 2.5 PM 0.3
Smoke limit* 0.7 Note: *Light absorption co-efficient at full load (M
-1)
The above standards needed to follow by the contractor while
operating the DG sets. The other measures are recommended as below:
Location of DG sets and other emission generating equipment should be decided keeping in view the predominant wind direction so that emissions do not effect nearby residential areas.
Stack height of DG sets to be kept in accordance with CPCB norms, which prescribes the minimum height of stack to be provided with each generator set to be calculated using the following formula:
H = h+0.2 x √ KVA

896
H = Total height of stack in meter h = Height of the building in meters where the generator set is installed KVA = Total generator capacity of the set in KVA Dust Control: The authorities will work closely with representatives from the community living in the vicinity of project area to identify areas of concern and to mitigate dust-related impacts effectively (eg through direct meeting, utilization of construction management and inspection program, and / or through the complaint response program).
Identification of constructions limits (minimal area required for construction activities).
When practical, excavated spoils will be removed as the contractor proceeds along the length of the activity.
When necessary, stockpiling of excavated material will be covered or staged offsite location with muck being delivered as needed during the course of construction.
Excessive soil on paved areas will be sprayed (wet) and / or swept and unpaved areas will be sprayed and / or mulched. The use of petroleum products or similar products for such activities will be strictly prohibited.
Contractors will be required to cover stockpiled soils and trucks hauling soil, sand and other loose materials (or required truck to maintain at least two feet of freeboard).
Contractor shall ensure that there is effective traffic management at site. The number of trucks / vehicles to move at various construction sites to be fixed.
Dust sweeping – The construction area and vicinity (access roads, and working areas) shall be swept with water sweepers on a daily basis or as necessary to ensure there is no visible dust.
Budget: An amount of Rs. 159.38 lakh is earmarked for air pollution control. Details are given at Table- 11.19:

897
Table- 11.19 Cost Estimate for Implementation of Air Pollution Control Measures
S.No. Activity Cost(Rs.) Lakh
1 5 Traffic managers @ Rs. 20000 per month per person for 7 years including 10% escalation per year
113.84
2 5 sweepers @ Rs. 8000 per month per person for 7 years including 10% escalation per year
45.54
Total 159.38 11.6.1.2 Noise Control Measures i) Noise Generation from Construction Equipments: The construction equipments, vehicles, DG sets etc shall be properly maintained and occupational safety and health standards shall be complied. The construction equipment will be required to use available noise suppression devices and properly maintained mufflers.
Vehicles to be equipped with mufflers recommended by the vehicle manufacturer.
Staging of construction equipment and unnecessary idling of equipment within noise sensitive areas to be avoided whenever possible.
Notification will be given to residents within 100 m of major noise generating activities. The notification will describe the noise abatement measures that will be implemented.
Monitoring of noise levels will be conducted during the construction phase of the project.
A proper routine and preventive maintenance procedure for the DG set should be set and followed in consultation with the manufacturer which would help prevent noise levels from deteriorating with use.
ii) Noise Generation from Controlled Blasting Operations
Controlled blasting will be done as per the provisions of Indian Explosives Act.
Blasting will not be undertaken in night hours.

898
Workers at blasting sites will be provided with proper earplugs and helmets.
Explosives used for controlled blasting will be kept in safest custody under lock and key as per the provisions of Indian Explosives Act
iii) Noise Due to Crusher: The exposure of labour operating with crushers shall be restricted upto 30 minutes on a daily basis. Alternatively, the workers need to be provided with ear muffs or plugs, so as to attenuate the noise level near the crusher by at least 15 dB(A). The exposure to noise level in such a scenario to be limited upto 4 hours per day. 11.6.2 Water Pollution
Sewage generated from various labour camps during project construction phase shall be treated in a sewage treatment plant prior to disposal. Efforts shall be made to discharge the treated effluent only in these water bodies, which are not used for meeting domestic water requirements.
The effluent generated from the crushers will have high-suspended solids and needs to be treated before disposal. Settling tanks of appropriate size for treatment of effluent from various crushers should be provided. The sludge from the various settling tanks can be collected once in 15 days and disposed at the site designed for disposal of municipal solid wastes from the labour camps. The sludge after drying could also be used as cover material for landfill disposal site. An amount of Rs. 60 lakh needs to be earmarked for construction of various settling tanks.
11.6.3 Land Management Plan 11.6.3.1 Disposal of Muck and Reclamation of Muck Disposal Sites
The Par-Tapi-Narmada link project envisages construction of 6 dams, 2 barrages, 6 power houses, 1 tunnel of 12.70 km long and 406.118 km long link canal system including 5 Nos. of tunnels along the canal alignment of total length of 1.15 km and large number of CD/CM structures. A large quantity of muck is expected to be generated as a result of tunnelling operations and excavations for foundation of these dams barrages

899
and canal. Based on the geological nature of the rocks and engineering properties of the soil, a part of the muck can be used as construction material and balance muck requires being suitably disposed in muck disposal sites in the project area. The muck disposal sites are planned along the river course and in low level areas or depressions. The dumping of muck will be done in the scientific manner by providing appropriate protection walls with deep foundations so that muck will not flow and washed away in the river. Protection structures in the form of masonry work, crate work and check dam will also be provided wherever necessary in order to avoid the chances of soil erosion and to ensure flow of silt free water. Besides these engineering measures, proper plantation will be done at the dumping sites for reclamation of the dumping areas.
Muck generally lacks nutrients and therefore, is difficult to re-
vegetate. However, if no attempts to vegetate the slopes are made, the muck could slide lower down during rain and may eventually wash off the check dams also. Bio-fertilizer technique developed by National Environmental Engineering Research Institute can be adopted in the proposed project. Unused excavated material will be piled and stacked with proper slopes at the designated muck disposal sites. The slopes are broken up by creating benches across them. This is done to provide stability to the slopes and also to provide ample space for planting of trees that would further help in holding and consolidating biotechnological approach. The afforestation with suitable plant species shall be done in consultation with the forest Departments of Gujarat and Maharashtra. A provision of Rs. 870 lakh has been kept towards restoration of muck disposal sites near dam sites and a provision of Rs.2391.67 lakh along the link canal. 11.6.3.2 Restoration Plan for Quarry Sites
The proposed Par-Tapi-Narmada link project would involve construction of dams, barrages, canal, tunnels / adits, power houses, colonies for staff and labourers, and other various components. During construction, these activities could also result in accumulation of large amount of unused material at various sites which require proper restoration measures. This land also includes areas likely to be disturbed due to quarries and dumping of unused muck, dam area. The existing landscape will be

900
totally modified or changed due to proposed project. Therefore, all areas disturbed by construction activity will be landscaped to reflect natural contours and encourage the re-establishment of vegetation. Disturbed Sites and their Restoration: Construction activities like roads, quarry sites, project colonies, workshops, offices etc. will change the existing land use / land cover in the region. After completion of the construction work, it is required to restore the disturbed areas to its original condition wherever it is possible. Various engineering and biological measures have been suggested for the restoration of these areas. Proposed mitigation measures will also help to arrest soil erosion in the region. Quarrying Operation: A project of this magnitude would require significant amount of construction material. The aggregate requirement for concrete is proposed to be met from nearby quarries. The proposed project would require significant amount of fine material, which shall be met by crushing the aggregates.
The quarrying operations are semi-mechanised in nature. Quarrying is normally done by cutting a face of the hill. A permanent scar is likely to be left, once quarrying activities are over. With the passage of time, the rock from the exposed face of the quarry under the action of wind and other erosion forces, get slowly weathered and after some time, they become a potential sources of landslide. Thus it is necessary to implement appropriate slope stabilisation measures to prevent the possibility of soil erosion and landslides in the quarry sites.
After excavation of the required material, these quarry sites will require restoration. Appropriate engineering, bio-engineering and biological methods are proposed for effective restoration of the quarry sites. Engineering and Bio-Engineering Measures: Opening of the quarries will cause visual impacts because they remove a significant part of the hills. Other impacts will be the noise generated during aggregate acquisition through explosive and crushing, which could affect wildlife in the area, dust produced during the crushing operation to get the aggregates to the appropriate size and transport of the aggregates and transport of material to

901
the nearby project sites. The quarrying for rock material in the proposed project would lead to removal of vegetation cover, top soil and leave the area barren. After the completion of mining activity, these areas will be restored to their normal habitat conditions.
Standard mitigation measures against erosion and sedimentation, noise and air pollution will be taken in particular for the use of explosive. At the end of the exploitation, quarries will be rehabilitated. This will include re-establishment of vegetation, restoration of natural watercourses, avoidance of flooding of the excavated areas, achievement of stable slopes, and avoidance of features, which would otherwise constitute a risk to health and safety or a source of environmental pollution. The measures adopted for landscaping of these quarry sites and borrow area have been described in the following paragraphs. Measures to be Adopted before Quarrying: The top soil (top 6 – 12 inch soil) should be removed before excavating the sand or rocks from the quarry sites. This soil contains all microbes (including earthworms) and important nutrients and organic matters which will be required at the time of restoration of these quarry sites. Measures to be adopted after Quarrying:
Diversion of Run-off- Effective drainage system will be provided to avoid the infiltration of run-off and surface waters into the ground of quarry sites.
Filling of Depressions- The craters formed at the quarry sites will be filled with dumping materials consisting of boulders, rocks, gravels and soil from the nearby sites. After filling these craters, the top soil collected prior to quarrying will be spread as top layer. The top soil then should be covered with geo-textiles like coir, jute or by other locally available bio-degradable material. This will protect the top soil from erosion.

902
Construction of Retaining Walls- Retaining walls will be constructed at the filled up depressions of quarry sites to provide necessary support particular where there are moderately slopes.
Rocks for Landscaping- After the quarrying activities are over, these
sites will be splattered with the leftovers of rocks and boulders. These boulders and rocks can support the growth of mosses and lichens, which will act as ecological pioneers and initiate the process of succession and colonization. The boulders of moderate size will be used to line the boundary of a path.
Laying of the Top Soil- The depressions / craters filled up with rock aggregates will be covered with top soils. Fungal spores naturally present in top soil will aid plant growth and natural plant succession. The top soil will be further enriched by organic manure and Vesicular-Arbuscular Mycorrhizal (VAM) fungi. This will help in the process of soil reclamation and the early establishment of juvenile seedlings.
Re-vegetation- The work plan for re-vegetation of the dumping sites through ‘Integrated Biological and Biotechnological Approach’ would be based upon the following parameters: i) Evaluation of rock material for their physical and chemical
properties to assess the nutrient status to support vegetation. ii) Formulation of appropriate blends of organic waste and soil to
enhance the nutrient status of rhizosphere. iii) Isolation and screening of specialized strains of mycorrhizal
fungi, rhizobium, azotobacter and phosphate solubilizers (bio-fertilizers inoculums) suitable for the mined out sites.
iv) Mass culture flant specific biofertilizer and mycorrihizal fungi to be procured from different institutions / organizations which are engaged in the phyto-remediation activity of degraded areas.
v) Plantation at quarry sites / areas using identified blend and biofertilizer inoculums.

903
A provision of Rs. 736 lakh has been earmarked for quarry slope stabilization. Details are given at Table- 11.20:
Table- 11.20 Cost Estimate for Restoration of Quarry Site and Borrow Area
Sl. No.
Activities / Purpose Cost (Rs. in lakh)
1 Filling up the land with soil 129 2 Cost of green manure 43 3 Cost of sapling (10000 saplings / ha) 26 4 Cost of fertilizers and pesticides 86 5 Fencing with RCC pillars and barbed wire 214 6 Maintenance activities including cleaning of weeds
@ Rs. 2 lakh / year for 5 years 21
7 Digging of pits 3 8 Construction of garland drains 214 Total 736
11.6.3.3 Restoration of Colony and Office Complex
The working area of dam site, Labour colony, Project colony areas have been selected for beautification of the project area after construction is over. The reservoir created due to the construction of dam may be a local point of tourist attraction. This could be used for sport fishing, so there is a need to construct benches for sitting, development of resting sheds and footpath. The beautification would be carried out by developing flowering beds for plantation of ornamental plant and flower garden.
There would be sufficient open space in power house complex and colony area. Forested area in the power house complex would provide aesthetic view and add to natural seismic beauty. The beautification in the colony area would be carried out by development of flowering beds for plantation of ornamental plant, creepers, flower garden and a small park, construction of benches for sitting, resting sheds, walk way and fountain.
A provision of Rs. 102 lakh has been earmarked for landscaping and beautification of the area.

904
Implementing Agency: It should be mandatory in the scope of work
of the contractor to restore the construction sites and implement various reclamation measures.
Budget: A total provision of (736 + 102) Rs. 838 lakh has been earmarked for Restoration of quarry and borrow area, reclamation of construction sites landscaping and beautification.
A provision of Rs.42 lakh has been earmarked towards landscaping along the link canal.
11.6.4 Biodiversity Conservation and Management Plan 11.6.4.1 Compensatory Afforestation
As already described in preceding paras total 4439.40 ha (2829 ha due to submergence of 6 reservoirs and 1610.40 ha due to canal alignment) forest area will be affected. No rare, endangered and threatened species are reported in the project area. To compensate the forest land the afforestation will be done in 8878.80 ha (double the area of forest land likely to be affected ie due to reservoirs 5658 ha and for canal alignment 3220.80 ha) in degraded forest land as per the provisions of Forest (Conservation) Act, 1980. The afforestation work is to be done by the Forest Department of concerned State Governments. A provision of Rs. 11459.76 lakh (Rs. 6789.60 lakh towards reservoirs plus Rs.4670.16 towards canal alignment) has been kept for compensatory afforestation. In addition the NPV and cost of trees will be paid to the Forest Department, which shall be estimated by the Forest Department, as a part of Forestry clearance.
11.6.4.2 Biodiversity Management Plan i) Forest Protection Plan: About 4439.40 ha (2829 ha due to submergence of 6 reservoirs and 1610.40 ha due to canal alignment) of forest area is proposed to be acquired for Par-Tapi-Narmada link project. The following measures are proposed as a part of Forest Protection Plan:
Under the reward for informers programme, it is proposed to engage the workers who are well acquainted with the area and will be resourceful in gathering information for anti-poaching and better vigilance. These youth could be hired on a contractual basis.

905
Arrangement of an office for this purpose would be essential to monitor all these activities. Organizing public awareness programmes, conducting training
camps, preparation of pamphlets, brochures, hoardings etc. Provision of fire lines within critical areas to protect the forest from
accidental fires. For improvement of vigilance and measures to check poaching, check
posts and watch towers will be needed. In order to strengthen the working capacity of the officers the equipments such as a camera, wireless, binoculars and other minor equipments (spot scope, search lights, sleeping bags, health kits etc) shall be provided.
Construction of bridges, roads, inspection paths for more effective and meaningful patrolling of the staff shall be undertaken.
Improvement of vigilance by procurement of field vehicles and motorbikes.
Creation of veterinary facilities and rescue camps for healthcare of wild animals and for controlling diseases. For this purpose it is essential to maintain a stock of medicines in addition to setting up of a mobile-rescue-cum-publicity-van.
An amount of Rs.1200 lakh has been earmarked for implementation of Forest Protection Plan. Details are given at Table- 11.21:
Table- 11. 21
Cost Estimates for the Forest Protection Plan Sl. No.
Measure Budget (Rs.in lakh)
1 Provision of fire lines within critical areas 429 2 Construction of bridges and patrolling paths 257 3 Mobile rescue van 206 4 Creation of veterinary facilities and rescue camps 308 Total 1200
ii) Safeguards during Construction Phase: During the construction phase, various adverse impacts on the forests and wildlife are anticipated in the surrounding areas of the proposed project in terms of increased noise levels, land vibrations during controlled blasting, air pollution etc. To avoid and minimize the negative impacts from these activities project authorities are

906
advised to prepare strict guidelines as follows:
Strict restrictions shall be imposed on the workers at project sites to ensure that they do not harvest any species / produce from the forests and cause any danger or harm to animals and birds in wilderness area.
The fuel wood to the labourers shall be provided by the project proponents so that there is no pressure for cutting of trees to meet fuel wood requirements.
The interference of human population would be kept to a minimum in the adjacent forest areas and it would be ensured that the contractors do not set up labour colonies / camps in the vicinity of forests and wilderness areas.
Only well maintained / new equipment that produces lesser noise would be installed at the work sites.
The best way to control the noise is at source. Certain equipment that needs to be placed permanently at one place like generators etc would be housed in enclosed structures to cut off the noise.
The heavy equipment like rotating or impacting machines will be mounted on anti-vibration mountings.
Wherever combustion engines are required they will be fitted with silencers.
The traffic (trucks etc) used by the project works will be managed to produce a smooth flow instead of a noise producing stop and start flow. Necessary training / orientation will be provided to the traffic operators / drivers. Sounding of loud horns etc in the forested areas should be banned. Project authorities will use water sprinklers on the road to avoid the dust from constructions activities.
While clearing the land of vegetation for any project work, the project authorities will ensure that the work area has sufficient layer of tree cover around it. It will act as an effective noise absorber and dust barrier. The tree layer will act as buffer zone and these are known to cut off noise by about 5 – 20 dB at a site depending upon the density of vegetation. These measures will be planned in advance and well before starting operation at any site.
iii) Measures to Improve Habitat of Avi-fauna: Forests are vital for survival, foraging, breeding and nesting of avifauna. Natural forests provide

907
a variety of food material to birds not only in the form of nectar of flowers, fruits, seeds etc. in the trees, shrubs, herbs and grasses but they also contain a large number of insects eaten by birds. In the forests, food is always available for the faunal component. Although most floral species flower during spring through summer but fruit maturation and seed ripening takes place in them throughout the year. Therefore, first strategy of improvement of habitat for birds is avoiding nest predation or brood parasitism through maintenance of large contiguous forest tract. These areas have ability to support the largest number of forest interior birds and will also be more likely to provide habitat for area sensitive species. It is more practicable to protect existing forest area rather than creating new forest area.
Another measure for habitat improvement for avifauna is to be installation of artificial nest boxes in the influence zone and catchment area of the project after consultation with the forest department as well as local Non-Governmental Organisations. These nest boxes have been found to be quite beneficial for attracting hole nester birds. The size and capacity of boxes vary from one species to another.
It is proposed to provide wooden boxes around water bodies in the study area. About 200 nest boxes are proposed to be kept along the periphery of six reservoirs. It is proposed that five qualified person be hired for a period of 7 years. An amount of Rs. 171.84 lakh can be earmarked for habitat improvement of avi-fauna in the study area. Details are given at Table-11.22:
Table- 11.22 Cost of Habitat Improvement for Avi-fauna in the Study Area
Sl. No.
Particulars Amount (Rs. in lakh)
A Non-recurring cost 1 Cost of nests of different sizes (10’x10’x to
20’x20’) average cost Rs. 1000 per wooden box and installation of 1200 wooden boxes
12.00
2 Repair and maintenance of the nests 6.00 B Recurring cost (for 7 years) 1 Salary for 5 skilled persons @ Rs. 20000 per month 113.84

908
Sl. No.
Particulars Amount (Rs. in lakh)
for implementation and data collection including 10% escalation for 7 years
2 Contingencies (including avifaunal biodiversity awareness programme for the local inhabitants)
40.00
Total (A+B) 171.84 iv) Wildlife Management Plan: An amount of Rs.500 lakh has been earmarked for implementation of Wildlife Management Plan. Details are given at Table- 11.23:
Table- 11.23 Cost estimates for Wildlife Management Plan
Sl. No.
Measure Budget (Rs. in lakh)
1 Wildlife survey 100 2 Immunization of wildlife 100 3 Rehabilitation of a small wildlife health cum ex-situ
conservations centre 200
4 Awareness, education and training 100 Total 500
v) Anti-poaching Measures: There are no ecologically sensitive areas around the project sites. However, the forests at the site and in the vicinity serve as a habitat for wildlife. Due to construction activities and increased human interferences, as a result of immigration of large labour population and their family members, some adverse impacts may take place on wildlife during construction phase; the increased human interferences can have adverse impact on wildlife in and around the project area
It is recommended that check posts should be installed near major construction sites and labour camps which shall be operational during construction phase. It is proposed to develop 10 (ten) check posts to implement anti-poaching measures during project construction phase. Each check post shall have 3 guards to ensure that poaching does not take place in the area. The guards will be supervised by a range officer. It is also

909
recommended that the staff manning these check posts have adequate communication equipment and other facilities. Apart from inter-linking of check posts, communication link needs to be extended to Divisional Forest Office and the local police station also. vi) Purchase of Anti-poaching Kits: To capture and translocate wild animals out of human habitations or agricultural lands, various trapping equipments pertaining to anti-poaching activities are needed. In the absence of these the staff faces difficulties and all efforts made on this behalf are futile. For this an amount of Rs.60 lakh has been earmarked. The anti-poaching kits will include equipments for self defence of the staff as well. vii) Infrastructure Development: This includes anti-poaching huts, rock shelters development and residential quarters for forest guards. For effective monitoring, one watch tower is also proposed to be established at an identified place having high pressure of biotic interference. These are the basic amenities for the field staff to enable them to do effective patrolling in the areas. For watch tower and accommodation an amount of Rs.100 lakh has been earmarked. viii) Purchase of Survey Equipment and Vehicle: In order to improve network and vigilance it is required to procure equipment like V-SAT and to document and develop a database IT infrastructure like laptops, LCD projectors, altimeters, GPS, spot scope, binoculars, video as well as digital still cameras are essential. Purchase of field vehicle will help in increased vigilance. For better communication and purchase of survey equipment an amount of Rs.200 lakh has been earmarked. ix) Construction of Check Posts: To improve vigilance for anti-poaching, better protection, enforcement for control grazing practices is necessary. For the construction of control-grazing-cum-anti poaching checks posts, amount of Rs.50 lakh has been earmarked. Total Rs. 706 lakh has been earmarked for this purpose. Details are given below:

910
a) Salary i) 30 Guards @ Rs. 8000 per month for 1 year 28.80 ii) 1 Range officer @ Rs. 20000 per month for 1 year 2.40
Total cost for one year 31.20 Cost for 7 years (assuming 10% increase per year) 296.09
b) Purchase of anti-poaching kits 60.00 c) Infrastructure development 100.00 d) Purchase of Survey equipment and Vehicles 200.00 e) Construction of check posts 50.00
Total Rs.706.09 lakh Say Rs. 706 lakh
x) Eco-Tourism: The reservoirs will have great tourism potential and it can create many income generating resources to the local people in many ways viz; boating, angling competition, guide, creation of the paying guest houses, travellers’ tour packages to the nearby sightseeing places, development of camping sites, birds watching etc. This shall be linked with the ecology environment of the reservoir. For tourism development, brochures, pamphlets, signage, models, opening of the tourism information centres, Telescopes, Binoculars, computerized data, trekking routes and their stay arrangements etc shall be required.
The following activities are proposed for the development of the eco-tourism zone:
Create interest for birds by Bird watching Develop infrastructure for perform various water sports activities
such as Boating etc. Infrastructure for stay of tourists Provision of house boats, paddle boats Distribution of plants for plantation on community and private lands Distribution of fruit tray for planting on private lands Training to locals viz Bird watching, Boating, Catering, Tourist
guides etc.
As such, proposed reservoirs will be developed as Eco-tourist spot. A provision of Rs.418 lakh has been earmarked for development of eco-tourism. Details are given at Table- 11.24:

911
Table- 11.24 Budgetary Estimate for Development of Eco-tourism
Sl. No. Items of Expenditure Amount (Rs. in lakh)
1 Purchase of House boat, Battery operated boat and Motor boat, computers, GPS etc.
300
2 POL for vehicles, boats, generators etc including hiring of vehicle in apprehending of poaching cases
60
3 Training to locals viz Bird watching, Boating, Catering, Tourist guides etc
58
Total 418
xi) Budget for Biodiversity Conservation and Management Plan: A total provision of Rs.2995.93 lakh has been earmarked for biodiversity conservation. Details are given at Table- 11.25:
Table- 11.25 Budgetary Estimate for Biodiversity Conservation and Management
Plan Sl. No.
Particulars Amount (Rs. in
lakh) 1 Forest Protection Plan 1200.00 1 Measures to improve habitat of avi-founa 171.84 3 Wildlife Management Plan 500.00 4 Anti-poaching measures 706.09 4 Tourism Development 418.00 Total 2995.93
11.6.5 Green Belt Development Plan
Forest loss due to reservoir submergence and other project appurtenances have been compensated as a part of compensatory afforestation. However in addition to above, it is proposed to develop greenbelt around the periphery of various project appurtenances, selected stretches along reservoir periphery, etc. The greenbelt development plan

912
aims to overall improvement in the environmental conditions of the region. The plan with a five-fold objective addresses issues such as prevention of land degradation due to activities during construction phase; enhancing the forest cover for increasing the biodiversity of the region; providing aesthetic value to the project area and consequently inviting a proportionate tourist flux; enhancing the ecological equilibrium of the area; and to a large proportion in combating soil erosion. A provision of Rs.216 lakh has been kept for Green belt Development on the periphery of reservoirs and Rs.480 lakh has been kept for green belt plantation along link canal. The plantation for this purpose will be carried out by Forest Departments of Gujarat and Maharashtra. 11.6.6 Environmental Management in Labour Camps
The aggregation of large number of workers in the project area during the construction phase is likely to put considerable stress on the prevailing biotic and abiotic environment of the area. The stress could be on account of increased water demand, sewage and solid waste generation, fuel wood requirements etc. The aim of the Environmental Management Plan is to minimize these stresses. The construction activities are likely to be concentrated at various locations at dam sites and along the canal alignment. The estimated peak labour force including technical staff for the proposed project is around 5800. The total increase in population considering the fact that some of the labour will be staying along with their families shall be about 14000. Community kitchens will be provided to worker families and the kerosene / Liquefied Petroleum Gas will be provided at subsidised rates.
It is proposed that each of the labour family involved in the construction activities shall be provided living units of 30-40 m2 with proper ventilation. Adequate facilities for water supply and sanitation shall also be provided. One community toilet needs to be provided for 20 persons. The wastewater generated from the colonies will be collected and disposed in specifically designed soak pits and Septic tank. The wastewater and sewage generated will not be allowed to flow into the rivers and streams of the area. The sanitary facilities at the colonies should be of standard municipal design for hill areas. However, efforts shall be made to ensure, that treated effluent is disposed only in these water bodies, which are not used for meeting domestic water requirements. Adequate facilities for collection and

913
conveyance of municipal wastes generated to the disposal site shall be developed. At each labour camp, covered trailers to collect the solid waste from the common collection point and transfer it to the disposal site needs to be put to service.
All necessary safety appliances such as helmets, masks, ear plugs, etc. shall be provided to the workers and staff. The regulations regarding working platforms, excavations, trenches and safe means of entry and egress shall be strictly complied. Efficient lighting and safety signs shall be installed on temporary roads during construction and adequate traffic regulations shall be adopted and implemented for temporary roads. All facilities to be constructed shall be fully equipped with the fire protection equipments as per IS standards. A provision of Rs. 6217.61 lakh is kept for implementation of various environmental measures in labour camps.
11.6.7 Public Health i) Control of Malaria: Increase in water fringe area provides suitable habitats for the growth of vectors of various diseases, which is likely to increase the incidence of water-related diseases. Malaria could be the major in the months of Sept and March. The preferred habitat is stagnant or slow moving fresh water open to vector-borne disease in the area. The main breeding seasons of the anopheline mosquito (malaria vector) is sunshine or moderate shade. Mosquito control and mosquito proofing measures have been recommended to control malaria. The anti-malarial operations can be coordinated by various Primary Health Centres located in villages close to the submergence area of the dams. ii) Development of Medical Facilities: It is proposed to develop 3 first-aid posts manned by a doctor each and supporting staff during construction phase. The first-aid posts should be located such that they are close to major construction sites. The doctor posted at the first-aid posts shall also coordinate the anti-malarial campaign be carried out under his immediate personal supervision. A systematic campaign shall be conducted in the months of March and Sept which are the breeding months of mosquito.
There shall be regular fumigation and sprays of insecticides in the areas where water is likely to be stagnant, to prevent the growth of malarial

914
larvae. The project proponents shall seek an expert opinion before selecting the appropriate insecticide for malaria control. The National Centre for Communicable Diseases, Delhi can provide assistance to the State government in the matter. iii) Health Extension Activities: The health extension activities will have to be carried out in the villages situated close to the dams being developed as a part of the project. There would be possibility of the transmission of communicable diseases due to migration of labour population from other areas at the construction site. The doctors from the dispensary constructed as a part of the project and other dispensaries in various villages in the project area will make regular visits to the villages and organize health promotional activities with the active participation of the local village leaders, Non-Governmental Organisations and available local health functionaries. iv) Water-borne Diseases: Following measures are recommended for control of water-borne diseases: Details of incidence of various water-borne diseases in the project
areas be collected and analysed to defect any particular trend. A detailed water quality monitoring programme be designed and
implemented. In areas showing incidence of water-borne diseases, intensive water quality monitoring shall be done.
v) Disposal of Bio-Medical Waste: Dispensaries use a variety of drugs including antibiotics, cytotoxics, corrosive chemicals etc. a part of which is generated as a solid waste. With greater emphasis on disposables, the quantum of solid waste generated in a hospital is quite high. The bio-medical waste must be segregated in accordance to the guidelines laid under Schedule-I of Bio-medical Waste (Management and Handling) rules notified by Ministry of Environment and Forests. The bio-medical waste shall be treated prior to its disposal. vi) Cost Estimates: The total budget earmarked for Public Health delivery system shall be Rs. 2062.98 lakh towards labour camps at head works and Rs.7665 lakh towards camps along the link canal. Provision of free fuel or at

915
subsidized rate to labour engaged departmentally at camps along link to avert biological loss shall be Rs.50.00 lakh. 11.6.8 Catchment Area Treatment Plan 11.6.8.1 Approach for the Study
Various thematic maps have been used in preparation of the Catchment Area Treatment Plan. Due to the spatial variability of site parameters such as soils, topography, land use and rainfall, not all areas contribute equally to the erosion problems. In order to ensure that latest and accurate data is used for the analysis, satellite data has been used for deriving land use data and ground truth studies too have been conducted. The various steps covered in the study are as follows:
Data Acquisition The requirement of the study was first defined and the outputs
expected were noted. The various data layers of the catchment area used for the study are as follows. Slope map Soil map Land use classification map Current management practices Catchment area map
Data preparation
The ground maps, contour information etc were scanned, digitized and registered as per the requirement. In the present study, IRS 1C-LISS III digital satellite data was used for interpretation and classification. The classified land use map of the catchment area considered for Jheri, Paikhed, Chasmandva, Chikkar, Dabdar and Kelwan reservoirs.
Output presentation The result of the modelling was interpreted in pictorial form to
identify the areas with high soil erosion rates. The primary and secondary data collected as a part of the field studies were used as an input for the model.

916
11.6.8.2 Estimation of Soil Loss using Silt Yield Index (SYI) Method
The Silt Yield Index is defined as the yield per unit area and Silt Yield Index value for hydrologic unit is obtained by taking the weighted arithmetic mean over the entire area of the hydrologic unit by using suitable empirical equation. Details are given at Table- 11.26:
Table- 11.26
List Showing Priority Categories and SYI Values Priority categories SYI Values Very high >1300 High 1200 – 1299 Medium 1100 – 1199 Low 1000 – 1099 Very low <1000
11.6.8.3 Catchment Area Treatment Measures
The erosion category of various watersheds in the catchment area as per a SYI index for Jheri, Paikhed, Chasmandva, Chikkar, Dabdar and Kelwan reservoirs is given at Table- 11.27:
Table- 11.27
Erosion Intensity Categorization as per SYI Classification in Catchment Area
Watershed Number Area (ha) SYI Value Category Jheri Dam
W1 1787 1160 Medium W2 1602 1220 High W3 3545 1230 High W4 885 1110 Medium W5 1444 1170 Medium W6 2434 1220 High W7 1305 1150 Medium W8 1113 1160 Medium W9 1955 1230 High

917
Watershed Number Area (ha) SYI Value Category W10 1827 1180 Medium W11 1205 1170 Medium W12 937 1180 Medium W13 1667 1150 Medium W14 943 1210 High W15 1971 1170 Medium W16 3686 1240 High W17 1169 1150 Medium W18 1796 1210 High W19 1222 1220 High W20 2134 1230 High W21 1918 1240 High W22 1689 1220 High W23 1402 1150 Medium W24 1265 1210 High W25 1600 1160 Medium
Total 42500 Paikhed Dam
W1 1889 1170 Medium W2 823 1180 Medium W3 1387 1150 Medium W4 1765 1160 Medium W5 1759 1210 High W6 2182 1220 High W7 1194 1240 High W8 3433 1180 Medium W9 3456 1210 High W10 2595 1170 Medium W11 1421 1220 High W12 2314 1220 High W13 3071 1210 High W14 1347 1170 Medium W15 932 1180 Medium W16 812 1150 Medium W17 1122 1150 Medium

918
Watershed Number Area (ha) SYI Value Category Total 31500
Chasmandva Dam W1 597 1240 High W2 1078 1180 Medium W3 1171 1170 Medium W4 957 1150 Medium W5 486 1090 Low W6 1108 1210 High W7 895 1210 High W8 1300 1180 Medium W9 889 1240 High W10 419 1250 High
Total 8900 Chikkar Dam
W1 668 1070 Medium W2 1869 1120 High W3 2006 1220 High W4 644 1210 Medium W5 949 1220 Medium W6 832 1150 High W7 705 1180 Medium W8 725 1220 Medium W9 1328 1180 High W10 1772 1170 Medium W11 1454 1210 Medium W12 1358 1230 Medium W13 834 1260 Medium W14 1220 1180 High W15 596 1220 Medium W16 1449 1210 High W17 1422 1210 Medium W18 1778 1180 High W19 1772 1090 High W20 1216 1120 High W21 1351 1180 High

919
Watershed Number Area (ha) SYI Value Category W22 1206 1150 High W23 1407 1150 Medium W24 801 1220 High W25 888 1140 Medium W26 1420 1180 Medium W27 630 1130 Medium
Total 32300 Dabdar Dam
W1 2219 1250 High W2 2295 1210 High W3 4093 1210 High W4 823 1170 Medium W5 938 1220 High W6 1566 1180 Medium W7 2052 1230 High W8 3085 1150 Medium W9 2096 1180 Medium W10 2052 1160 Medium W11 3069 1220 High W12 1856 1170 Medium W13 3981 1260 High W14 2330 1150 Medium W15 2753 1210 High W16 2094 1220 High W17 1640 1160 Medium W18 2681 1130 Medium W19 2236 1140 Medium W20 1407 1230 High W21 1474 1160 Medium W22 1459 1150 Medium
Total 48200 Kelwan Dam
W1 3034 1120 Medium W2 1974 1050 Low W3 2978 1080 Low

920
Watershed Number Area (ha) SYI Value Category W4 2447 1210 High W5 1945 1040 Low W6 1087 1170 Medium W7 3840 1220 High W8 3372 1180 Medium W9 3332 1150 Medium W10 2200 1230 High W11 2767 1230 High W12 2606 1050 Low W13 1991 1050 Low W14 3711 1090 Low W15 3315 1150 Medium W16 2952 1210 High W17 6180 1250 High W18 2309 1210 High W19 3399 1220 High W20 3085 1180 Medium W21 3863 1120 Medium W22 2071 1170 Medium W23 3100 1180 Medium W24 2448 1210 High W25 3294 1150 Medium
Total 73300
Area under different Erosion Categories upto Jheri, Paikhed, Chasmandva, Chikkar, Dabdar and Kelwan dam catchments is summarised at Table- 11.27:
Table- 11.27
Area under Different Erosion Categories Unit: ha
Dam Category Very Low
Low Medium High Very High
Total
Jheri Area(ha) - - 18311 24189 - 42500 %age - - 43.09 56.91 - 100.00

921
Dam Category Very Low
Low Medium High Very High
Total
Paikhed Area(ha) - - 16105 15395 - 31500 %age - - 51.13 48.87 - 100.00
Chasmandva Area(ha) - 486 4506 3908 - 8900 %age - 5.46 50.63 43.91 - 100.00
Chikkar Area(ha) - - 15472 16828 - 32300 %age - - 47.90 52.10 - 100.00
Dabdar Area(ha) - - 23298 24902 - 48200 %age - - 48.34 51.66 - 100.00
Kelwan Area(ha) - 15205 29553 28542 - 73300 %age - 20.74 40.32 38.94 - 100.00
The Objective of the SYI method is to prioritize sub-water shed in a
catchment area for treatment. Area under high erosion category in Jheri dam 24189 ha, in Paikhed dam 15395 ha, in Chasmandva dam 3908 ha, in Chikkar dam 12238 ha, in Dabdar dam 24902 ha and in Kelwan dam 28542 ha. Various engineering and biological measures have been suggested for catchment area treatment categorised in the high erosion category of watersheds upto Jheri 12, Paikhed 7, Chasmandva 5, Chikkar 12, Dabdar 10 and Kelwan 9. Total cost of the catchment area treatment plan worked out as Rs. 4814 lakh.
11.6.8.4 Silt Transfer
The yield received from rains in the catchment area would be stored in reservoir and then let out into the link canal through the upper level tunnel. Normally, the silt transported from the catchment area would settle down into the lower layers and finally to the bottom and the top silt free water would be admitted into the link canal. However, during monsoon season the flood waters due to heavy rain fall would be laden with more suspended silt which would require mitigative measures. Silt excluders need to be built at the head regulator of main canal and branch canals. The silt excluders shall extract silt from the water and lead it to the river or other natural drainage through a tail race.

922
Silt escape or bed escapes, provided with vents and gates, need to be provided on the link canal nearer to the streams or rivers at suitable location. Even after providing silt excluders and silt escapes, some quantity of suspended silt still shall get deposited on the bed of link canal. Every year during the closure period of the canal, the deposited silt would have to be removed from the bed of the canal in order to avoid growth of weeds. Since the bed of the canal shall be entirely lined, desilting can be done with ease. A provision of Rs.2436.67 lakh has been kept for measures to arrest transportation of silt across basins.
11.6.9 Disaster Management Plan
Dam Break may be summarized as partial or catastrophic failure of a dam leading to uncontrolled release of water. Such an event can have a major impact on the land and communities downstream of the failed structure. A dam break may result in a flood wave up to several meters high travelling along the valley at very high speed. The impact of such a flood wave on the inhabitation downstream areas can be disastrous and may sweep away infrastructure such as roads, railways, bridges and buildings, in addition to endangering several human lives and livestock. Such destructive force results in heavy loss of life and property, if advance warning and evacuation is not made. Keeping all these in view, the disaster preparedness for such likely events is necessary.
The disaster Management Planning for dam break scenario consist of: Identification / construction of Evacuation path; setting up of alarms and warning systems at appropriate locations; establishing communication system; Dam safety and maintenance manual; Emergency Action Plan (EAP); Administration and procedural aspects; Preventive action; Evacuations plans; Evacuations team; Public awareness for disaster mitigation; Notifications; Notification procedures and Management after receding of flood water.
In the event that the failure is imminent or the failure has occurred or a potential emergency conditions is developing, the observer at the site is required to report it to the Junior Engineer / Assistant Engineer who will report to the Executive Engineer / Superintending Engineer for their

923
reporting to the Chief Engineer through a wireless system or by any available fastest communication system. The Engineer-in-Charge is usually responsible for making cognizant with the developing situation to the Civil Administration viz., District Magistrate and concerned sub-divisional magistrates and tehsildars.
The Engineer-in-Charge will be responsible for the entire operation including prompt determination of the flood situation time to time. Once the red alert is declared the whole State machinery will come into swing and will start evacuating people in the inundation areas delineated in the inundation maps. For successful execution, annually demo exercise will be done. The District Magistrate is to monitor the entire operation. A provision of Rs. 654 lakh has been kept for implementation of dam break management plan for mitigation and prevention of hazard from the dams. 11.6.10 Energy Conservation Measures
Various construction and other activities of the proposed Par-Tapi-Narmada link project would lead to increased demand for fuel wood in the project area and its vicinity and would therefore exert pressure on forest areas located around the project. The major source of energy in the villages of the project area is fuel wood, acquirement of which is one of the main causes of ecological degradation and human drudgery. It is estimated that during the construction of the project, which would last for about 7 years, around 5000 labourers will be working. Majority of the labour force will be outsiders and it will be very important to meet their energy requirement in an ecologically sustainable manner.
To provide an alternate for the energy requirement of the workers, contractor/s will be made responsible to provide subsidized kerosene/LPG to their workers which will in turn discourage them from illegal tree felling and removal of fuel wood and timber from the adjoining forests. Further, community kitchen facilities would also be provided to the labourers by the contractors. In addition to above, efforts would be made towards energy conservation by installing non-conventional energy sources. Energy conservation measures would be implemented to ensure that the use of non-renewable resources is minimized. A key component of achieving energy

924
conservation would be the development of an Energy Management Action Plan. This plan would be included as part of the Construction and Operational EMPs. The Energy Management Action Plan would be consistent with the energy conservation measures during both construction and operation phase. 11.6.10.1 Energy Conservation during Construction Phase
The following energy conservation measures would be undertaken during construction works:
Efficient work scheduling and methods that minimize equipment idle
time and double handling of material Throttling down and switching off construction equipment when not
in use Switching off truck engines while they are waiting to access the site
and while they are waiting to be loaded and unloaded Switching off site office equipment and lights and using optimum
lighting intensity for security and safety purposes. Careful design of temporary roads to reduce transportation distance Regular maintenance of equipment to ensure optimum operations and
fuel efficiency. The specification of energy efficient construction equipment.
11.6.10.2 Energy Conservation during Operation Phase
The following energy conservation measures would be implemented during operation phase:
Use of CFL lights up to maximum possible extent. Awareness about the use of CFL lights by locals. Development of heating, cooling and lighting use in buildings
through climate-responsive design and conservation practices. Employing renewable energy sources such as day lighting and passive
solar heating. Optimizing building performance and system control strategies, such
as controlling lights with occupancy sensors and controlling comfort.
925
Maximizing the use of solar power for signage and pedestrian lighting.
Designing roads on site to reduce transportation distances. 11.6.10.3 Budget
An amount of Rs. 440 lakh has been earmarked for implementation of Energy Conservation Measures. 11.6.11 Environmental Monitoring Programme
Environmental Monitoring is an essential tool in relation to environmental management as it provides the basis for rational management decisions regarding impact control. Environmental monitoring shall be performed during construction, commissioning and operation phases to ensure that the adverse impacts have been mitigated efficiently and to verify the impact predictions. The monitoring program will indicate where changes to procedures or operations are required, in order to reduce impacts on the environment or local population. The monitoring program will be undertaken to meet the following objectives: To monitor the environmental conditions of reservoirs areas and areas
benefited and impacted by the project To check on whether mitigation and benefit enhancement measures
have actually been adopted, and are proving effective in practice To provide information on the actual nature and extent of key impacts Effectiveness of mitigation and benefit enhancement measures which, through a feedback mechanism, can improve the planning and
execution of future, similar projects.
From the monitoring point of view, the important parameters are water quality, air quality, noise, erosion and siltation, afforestation, fishery, etc. An attempt will be made to establish early warning of indicators of stress on the environment. Suggested environmental monitoring plans are described in the following sections. The environmental monitoring programme during construction phase is at Table- 11.29:

926
Table- 11.29 Environmental Monitoring Programme during Construction Phase
Sl. No.
Particulars Parameters Frequency Location
1 Treated waste water from STPs
pH, BOD, COD, TSS and Oil and Grease
Once in a month
Before and after treatment from STPs at various labour camps
2 Ambient Air quality
SPM, RPM, SO2, NOx and CO
Once in a season
Major Construction sites
3 Noise Equivalent noise level (Leq)
Every month Major Construction sites
4 Water-related diseases
Identification of water related diseases, adequacy of local control and curative measure, etc.
Once in a season
Labour camps and nearby settlements
The Environmental monitoring programme during project operation
phase is at Table- 11.30:
Table- 11.30 Environmental Monitoring Programme during Project Operation
Phase Sl. No.
Particulars Parameters Frequency Location
1 Water pH, turbidity, total dissolved solids, calcium, magnesium, chlorides, sulphate, nitrates, iron, DO, BOD, COD etc.
Pre and Post monsoon seasons
Reservoirs
2 Treated waste water from STP
pH, BOD, COD, TSS and Oil and Grease.
Once in a month
Before and after treatment from STP
3 Ecology Status of afforestation Once in 5 -
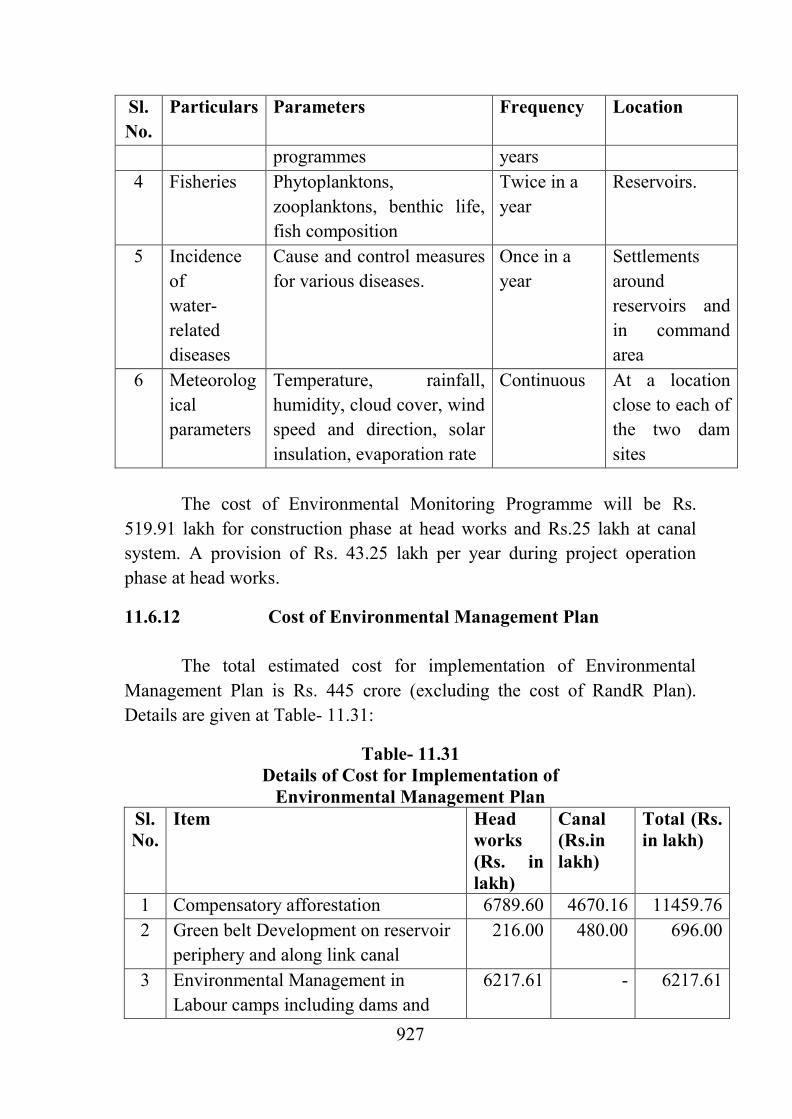
927
Sl. No.
Particulars Parameters Frequency Location
programmes years 4 Fisheries Phytoplanktons,
zooplanktons, benthic life, fish composition
Twice in a year
Reservoirs.
5 Incidence of water-related diseases
Cause and control measures for various diseases.
Once in a year
Settlements around reservoirs and in command area
6 Meteorological parameters
Temperature, rainfall, humidity, cloud cover, wind speed and direction, solar insulation, evaporation rate
Continuous At a location close to each of the two dam sites
The cost of Environmental Monitoring Programme will be Rs.
519.91 lakh for construction phase at head works and Rs.25 lakh at canal system. A provision of Rs. 43.25 lakh per year during project operation phase at head works.
11.6.12 Cost of Environmental Management Plan The total estimated cost for implementation of Environmental
Management Plan is Rs. 445 crore (excluding the cost of RandR Plan). Details are given at Table- 11.31:
Table- 11.31 Details of Cost for Implementation of
Environmental Management Plan Sl. No.
Item Head works (Rs. in lakh)
Canal (Rs.in lakh)
Total (Rs. in lakh)
1 Compensatory afforestation 6789.60 4670.16 11459.76 2 Green belt Development on reservoir
periphery and along link canal 216.00 480.00 696.00
3 Environmental Management in Labour camps including dams and
6217.61 - 6217.61

928
Sl. No.
Item Head works (Rs. in lakh)
Canal (Rs.in lakh)
Total (Rs. in lakh)
canal
4 Public health and health delivery system and disposal of Bio medical waste
2062.98 7665.00 9727.98
5 Restoration of Quarry sites and land scaping
838.00 42.00 880.00
6 Stabilisation of Muck Disposal management / Land management
870.00 2391.67 3261.67
7 Implementation of water pollution Control measures
60.00 0.00 60.00
8 Implementation of Air pollution Control measures
159.38 0.00 159.38
9 Implementation of energy conservation measure
440.00 0.00 440.00
10 Catchment Area Treatment plan 4814.00 0.00 4814.00 11 Implementing Disaster management
plan 654.00 0.00 654.00
12 Implementing Environmental Monitoring Programme
563.16 25.00 544.91
13 Biodiversity Management Plan 2995.93 0.00 2995.93 14 Measures to arrest transportation of
silt across basins 0.00 2436.67 2436.67
15 Provision of free fuel or at subsidized rate to labour engaged departmentally at camps along link to avert biological loss
0.00 50.00 50.00
16 Purchase of noise meter 1.00 0.00 1.00 17 Purchase of meteorogical instruments 18.00 0.00 18.00
Grand Total 26699.66 17760.50 44460.66 Say 445 crore

1003
Chapter - 13 Cost Estimate, Benefit Cost Ratio and Financial Aspects
13.0 General: The Par-Tapi-Narmada link project envisages construction of the following components at DPR stage: i) A 808.32 m long composite embankment (concrete face rock fill)
cum concrete dam across river Par near village Jheri with FRL 246.00 m and corresponding gross storage capacity 206.03 MCM. The length of concrete face rock fill portion of the dam is 663.32 m and the length of concrete non-overflow section and spill way is 145.00 m. The dam axis is located at Latitude 20°22'25" N and Longitude 73°25'51" E.
ii) A 1431.85 m long composite embankment (concrete face rock fill)
cum concrete dam across river Nar (a tributary of Par river) near village Paikhed with FRL 248.00 m and corresponding gross storage capacity of 229.53 MCM. The length of concrete face rock fill portion of the dam is 1310.85 m and the length of concrete non-overflow section and spill way is 121.00 m. The dam axis is located at Latitude 20°27'42" N and Longitude 73°23'37" E;
iii) A power house at the toe of Paikhed dam with 3 units each of 3 MW
installed capacity. iv) A 2781.00 m long composite embankment (concrete face rock fill)
cum concrete dam across river Tan (a tributary of Auranga river) near village Chasmandva with FRL 214.00 m and corresponding gross storage capacity of 83.63 MCM. The length of concrete face rock fill portion of the dam is 2703.00 m and the length of concrete non overflow section and spill way is 78.00 m. The dam axis is located at Latitude 20°37'02" N and Longitude 73°22'36" E.
v) A power house at the toe of Chasmandva dam with 2 units each of 1
MW installed capacity. vi) A 1887.00 m long composite embankment (concrete face rock fill)
cum concrete dam across river Ambica near village Chikkar with FRL 210.00 m and corresponding gross storage capacity of 141.99 MCM. The length of concrete face rock fill portion of the dam is

1004
1736.00 m and the length of concrete non overflow section and spill way is 151.00 m. The dam axis is located at Latitude 20°42'00" N and Longitude 73°30'50" E.
vii) A power house at the toe of Chikkar dam with 2 units each of 1 MW
installed capacity. viii) A 1170.00 m long composite embankment (concrete face rock fill)
cum concrete dam across river Kapri (a tributary of Ambica river) near village Dabdar with FRL 169.00 m and corresponding gross storage capacity 222.38 MCM. The length of concrete face rock fill portion of the dam is 1035.00 m and the length of concrete non overflow section and spill way is 135.00 m. The dam axis is located at Latitude 20°48'58" N and Longitude 73°32'05" E.
ix) A power house at the toe of Dabdar dam with 2 units each of 1.60
MW installed capacity. x) A 1330.00 m long composite embankment (concrete face rock fill)
cum concrete dam across river Purna near village Kelwan with FRL 164.00 m and corresponding gross storage capacity of 282.17 MCM. The length of concrete face rock fill portion of the dam is 1141.00 m and the length of concrete non overflow section and spill way is 189.00 m. The main dam is located at Latitude 20°55'30" N and Longitude 73°32'00" E.
xi) A power house at the toe of Kelwan dam with 2 units each of 1.25
MW installed capacity. xii) A power house at the canal fall of feeder pipe line connecting Kelwan
dam with main link canal with 2 units each of 1 MW installed capacity.
xiii) A tunnel of about 12.70 km long with 3.00 m diameter (D shape) and
bed slope of 1:875 connecting Jheri reservoir with Paikhed reservoir. xiv) A 147.50 m long barrage in the downstream of Paikhed dam with
crest level of 136.00 m xv) A 128.00 m long barrage in the downstream of Chasmandva dam
with crest level of 123.00 m.
1005
xvi) A 369.043 km long link canal off-taking from Paikhed barrage at FSL 142.50 m.
xvii) A 100 m long tunnel No.1 at RD 14.650 to 14.750 km; A 350 m long
tunnel No.2 at RD 24.000 to 24.350 km; A 200 m long tunnel No.3 at RD 32.350 to 32.550 km; A 50 m long tunnel No.4 at RD 37.750 to 37.800 km; and A 450 m long tunnel No.5 at RD 51.500 to 51.950 km;
xviii) A 2.859 km feeder pipe line connecting main canal with Chasmandva
barrage. xix) A 14.342 km pipe line inter connecting Chikkar and Dabdar
reservoirs. xx) A 12.258 km feeder pipe line connecting main canal with Dabdar
dam. xxi) A 7.616 km feeder pipe line connecting main canal with Kelwan dam. xxii) Cross Drainage / Cross Masonry works including Regulators, Escapes, Road/ Railway bridges (469 No).
The Ministry of Water Resources has issued “Guidelines for preparation of Detailed Project Reports of Irrigation and Multipurpose Projects” in the year 2010. These guidelines have been followed in preparation of estimate of Par-Tapi-Narmada link project. The quantities of various material and works involved in the various components have been worked out based on the engineering drawings. To work out the rates of various items the rate analysis has been carried out using the rates of various materials, manpower etc from schedule of rates for South Gujarat region of Water Resource Department, Government of Gujarat for the year 2012-13 and enhanced to 2014-15 price level by considering 5% escalation per annum to arrive the cost of the project components.
13.1 Classification of Units:
The cost estimate of Par-Tapi-Narmada link project has been broadly grouped into following units.

1006
Unit – I: Head works: Includes the cost of 6 dams viz Jheri,
Paikhed, Chasmandva, Chikkar, Dabdar and Kelwan, 2 barrages viz., Paikhed and Chasmandva.
Unit – II: Canals: Includes the cost of main canal, feeder pipe lines, branch canals etc and canal structures and tunnels.
Unit – III: Power House: There are 6 Power houses of which, 5 Power houses at the toes of Paikhed, Chasmandva, Chikkar, Dabdar and Kelwan dams and 1 Power house at the canal fall of Feeder canal connecting Kelwan dam with main link canal.
Unit – IV: Navigation: Navigation is not proposed under this project, as such, no provision is required under this sub-head.
Unit – V: Water Supply: Water supply for domestic and industrial needs are proposed under periphery of the project. Water will be supplied through main canals and various branch canals, whose cost is considered under Unit-II: Canal system. However, water supply network to the local areas will be the responsibility of the local development body / local administration. Hence, no provision towards water supply works at local level has been kept under this head.
Unit–VI: Command Area Development: Includes the cost of command area proposed en-route of the link canal, feeder pipe lines, projects proposed by Governmentof Gujarat, tribal areas in the vicinity of reservoirs, trible area in enroute right side of the canal, tribal area on right side of Narmada main canal and target command in the drought prone Saurashtra and Kutch regions, and cost of lifting arrangements consisting of pumps and raising mains and its structures.

1007
The Abstract of cost of the Par-Tapi-Narmada Link project is given below.
Sl. No. Unit Amount
(Rs. in lakh) 1 I - Head works 474773 2 II – Canals including feeder pipe lines 455710 3 III – Power House 18091 4 IV – Navigation 0.00 5 V – Water supply for domestic and
industrial needs 0.00
6 VI – Command area development 72547 Total 1021121 Say 10211 crore
Thus, the total cost of the link project works out to be Rs. 10211
crore at 2014-15 price level, which includes Environmental Management Plan and Socio-economic Survey and Rehabilitation and Resettlement Plan. The general abstract of the cost of the project is given in Annexure – 13 in Annexure Volume-VI (A). The details under various heads are described in the following paragraphs:
13.1.1 Unit – I: Head Works: Unit - I includes cost of the
following components / structures of project.
i) Jheri dam including concrete faced rock fill portion, concrete non-over flow section, spillway and energy dissipation arrangements.
ii) Paikhed dam including concrete faced rock fill portion, concrete non-over flow section with construction spillway and energy dissipation arrangements, intake structure of Paikhed dam power house etc.
iii) Chasmandva dam including concrete faced rock fill portion, concrete non-over flow section with construction spillway and energy dissipation arrangements, intake structure of Chasmandva dam power house etc.

1008
iv) Chikkar dam including concrete faced rock fill portion, concrete non-
over flow section with construction spillway and energy dissipation arrangements, intake structure of Chikkar dam power house etc.
v) Dabdar dam including concrete faced rock fill portion, concrete non-
over flow section with construction spillway and energy dissipation arrangements, intake structure of Dabdar dam power house etc.
vi) Kelwan dam including concrete faced rock fill portion, concrete non-
over flow section with construction spillway and energy dissipation arrangements, intake structure of Kelwan dam power house etc.
vii) Two barrages with main concrete structure, guide bunds, gates etc. Total Cost of Unit-I: Head Works is estimated to be Rs.474773 lakh. Details are given in Annexure 13.1 of Volume-VI(A) and Volume –II. The sub-head wise details are given below. 13.1.1.1 Direct Charges The direct charges include the following sub- heads.
I- Works, II- Establishment, III- Tools and Plant, IV- Suspense and V- Receipts and recoveries. The details are described below: I-Works A- Preliminary: Rs.8726 lakh
Provision under this sub- head has been kept to cover the actual expenditure incurred on various survey and investigation works, collection and procurement of data / maps / remote sensing data, cost of consultancy works through various expert agencies, Environmental Impact Assessment etc for preparation of this Detailed Project Report of Par-Tapi-Narmada link project consists of:

1009
i) Topographical surveys and investigations, ii) Hydrological and meteorological surveys, iii) Geological and Geotechnical surveys, iv) Construction material survey, v) Borrow area survey, vi) Seismic studies, vii) Morphological studies, viii) Sedimentation studies of reservoirs, ix) Construction of access Roads to facilitate site investigations, x) Procurement of data / maps, xi) Procurement of Remote sensing data, xii) Environmental Impact Assessment study, xiii) Charges for consultancy works for various studies and xiv) Preparation of Detailed Project Report.
However, for detailed survey and investigations for establishing the
final locations of different project components at pre-construction stage, a lump-sum provision @ of 2% of I-Works has been considered under this sub-head. The details are given at Annexure 13.1.1 in Appendix Volume-VI (A). B- Land: Rs.54545 lakh
Under this sub-head the provisions for cost of acquisition of land to be acquired for submergence and for construction of the project components, colonies, offices, stores, stock yards, working area and approach roads etc, compensation for private and forest lands, houses, solatium charges, standing crops and other immovable properties, cost of relocation of communication network, cost of Rehabilitation and Resettlement of Project Affected Families etc have been considered. The details are given at Annexure 13.1.2 in Appendix Volume-VI(A). C- Works: Rs.304488 lakh
Under this sub-head the provisions have been made to cover the cost of various components of Jheri, Paikhed, Chasmandva, Chikkar, Dabdar and Kelwan dams, concrete faced rock fill dam, non- overflow concrete dam, spillway, energy dissipation arrangements, various outlets and intake for

1010
dam toe powerhouses etc, two barrages with main concrete structures, guide bunds, gates etc.
The design of various components of the project such as Concrete
faced rock fill dam, non- overflow concrete dam, spillway, various outlets and intake for dam toe powerhouses and tunnels etc are carried out by various design Directorates, Central Water Commission as consultancy work. The quantities and the cost of the various components have been evaluated as per the drawings given by the Central Water Commission, New Delhi. The details are given at Annexure 13.1.3 in Appendix Volume-VI(A). K- Buildings: Rs.28111 lakh
Provision has been made under this sub-head for construction of temporary and permanent buildings for both residential and non-residential buildings and hostel accommodation for various categories of staff and offices, inspection bungalows, circuit houses, workshops, stores, sheds as well as other service buildings like hospitals, schools, police stations, post office and welfare centers etc. The details under this sub-head are given at Annexure 13.1.4 in Appendix Volume – VI(A).
M- Plantation: Rs.50 lakh
Under this sub- head, cost of proposed plantation in the colony areas, parks downstream of Jheri, Paikhed, Chasmandva, Chikkar, Dabdar and Kelwan dams and along the approach roads have been considered. The details under this sub-head are given at Annexure 13.1.5 in Appendix Volume – VI (A). O- Miscellaneous: Rs.8797 lakh
Under this sub head provisions have been made to cover the cost of the following works.
i) Capital cost of electrification, water supply, purification and distribution system, sewage disposal, medical and fire fighting equipments, furniture and crockery for inspection bungalows and circuit houses, recreation facilities, initial camp equipments for hospital, primary and secondary schools, community centers etc.

1011
ii) Running and Maintenance of above equipments / infrastructural
facilities etc and inspection vehicles.
iii) Provision has also been made for other miscellaneous items such as inaugural / foundation stone laying ceremony, compensation to work men, visit of VVIPs / VIPs and other dignitaries, documentation of technical records and project history including photographic records, security arrangements for dam sites, flood lighting, data processing machines etc. The details are given at Annexure 13.1.6 in Appendix Volume-VI(A).
P- Maintenance: Rs.3367 lakh i) Provisions have been made under this sub-head to cover the cost of
maintenance of all works during the construction period. A provision of 1% of the cost of I works less A – Preliminary, B- Land, O – Miscellaneous, M- Plantation, Q – Special TandP, X – Environment and Ecology, and Y – Loss on stock has been made. The details are given at Annexure 13.1.7 in Appendix Volume-VI(A).
Q- Special Tools and Plant: Rs. Nil No provision has been made under this head as the cost of special
Tools and Plant will be borne by the contractors. R- Communication: Rs.693 lakh
Under this sub-head necessary provision has been kept to cover the cost of approach roads to the dam sites, quarry roads, temporary roads in the work area, widening of existing roads in the near vicinity of the project area etc. The details are given at Annexure 13.1.8 in Appendix Volume-VI(A). X- Environment and Ecology: Rs.26700 lakh
Provisions under this sub-head have been made toward the cost of extensive management measures to sustain environment and ecology such as catchment area treatment, compensatory afforestation, soil erosion control and water conservation measures, reservoirs rim treatment / green belt development, land management plan (stabilization of muck disposal sites etc), restoration of quarry sites, tourism development plan, provision

1012
for free fuel to labourers, Bio-diversity management plan, restoration and land scapping of project sites, fisheries development plan, ground water management plan, Public Health management, implementation of Environmental Monitoring Programme and Dam Break Disaster Management Plan etc. The details are given at Annexure 13.1.9 in Appendix Volume – VI(A). Y. Losses on Stock and Unforeseen Items: Rs.833 lakh
Provision under this sub- head has been made @ 0.25% of the cost of I- works less A- preliminary, B- land, O- miscellaneous, M- plantation, P- Maintenance, Q- special Tools and Plant and X - Environment and ecology.
The total cost of I –works of Unit – I (Head works) works out to Rs. 436310 lakh.
II-Establishment: Rs.30541 lakh The Par-Tapi-Narmada link project is planned to be completed in a
period of 7 years. Provision towards establishment charges has been made @ 8% of I-Works excluding B- land. III-Ordinary Tools and Plant: Rs.4363 lakh
Provision has been made under this head @ 1% of I-Works towards ordinary Tools and Plant to cover the cost of survey instruments, camp equipment and other small tools and plant. This provision is distinct from the Q- special Tools and Plant.
IV – Suspense: Rs. Nil
It is assumed that all the outstanding suspense would be cleared by adjustment to appropriate heads on completion of the project. As such no provision has been kept under this head. V- Receipt and Recoveries: Rs. (-) 2627 lakh
Under this head estimated recoveries by way of resale or transfer of temporary buildings, generator sets, electrical installation, telephone lines, water supply fittings, and other accessories, miscellaneous receipt like rent

1013
charges of buildings are accounted for and provision has been made accordingly.
13.1.1.2 B - Indirect Charges: Rs.6186 lakh Provision for abatement of land revenue and Audit and Account
charges are covered under ‘Indirect Charges’ at the following rates: • Abatement of land revenue – 5% of cost of land • Audit and Account charges – 1% of I-Works
Total cost of Head works (Unit-I) works out to Rs. 474773 lakh.
13.1.2 Unit – II: Canal system Unit – II Canal system covers the cost of the following components along
with their appurtenants works • A tunnel of about 12.70 km long with 3.00 m diameter (D shape) connecting Jheri reservoir with Paikhed reservoir. • A 369.043 km long canal off taking from Paikhed barrage. • A 2.859 km feeder pipe line connecting main canal with Chasmandva dam • A 14.342 km pipe line inter connecting Chikkar and Dabdar
reservoirs. • A 12.258 km feeder pipe line connecting main canal with Dabdar dam • A 7.616 km feeder pipe line connecting main canal with Kelwan dam • Total 5 no. of tunnels of total length 1.15 km along the link alignment. • 469 No. of CD structures The total cost of Unit – II: Canal system is estimated to be Rs. 455710
lakh at 2014-15 price level. Details are appended in Annexure 13.2 of Volume-VI(A) and Volume –II. The sub-head wise details are discussed in the following paragraphs.

1014
13.1.2.1 Direct charges I-Works A- Preliminary: Rs.8222 lakh
Provision under this sub- head has been kept to cover the actual expenditure incurred on various survey and investigation works mentioned below for preparation of Detailed Project Report of this project.
i) Topographical surveys and investigations, ii) Geological and Geotechnical surveys, iii) Construction material survey, iv) Vehicle charges for inspecting officers for site investigations, v) Survey and Camp equipments, vi) Charges for consultation for various studies, vii) Actual expenditure on Establishment and viii) Preparation of Detailed Project Report.
However, for detailed survey and investigations for establishing the
final locations of different project components at pre-construction stage, a lump-sum provision @ of 2% of I-Works has been considered under this sub-head. B- Land: Rs.50695 lakh
Under this sub-head the provisions for cost of acquisition of land to be acquired for canals and canal structures etc., compensation for property and standing crops, solatium charges, diversion of communication systems and other immovable properties, rent for use of land prior to acquisition, economic rehabilitation measures etc., have been considered. The details are appended in Annexure 13.2.1 in Appendix Volume-VI(A). C-Works: Rs.13408 lakh Under this sub-head provisions for Tunnels, Tunnel Intake structures, Tunnel outfall structures considered. The cost of tunnels worked out based on Design drawings of tunnels given by Central Water Commission, New Delhi. The details are given in Annexure 13.2.2 in Appendix Volume-VI(A).

1015
D-Regulator: Rs.7478 lakh
Under this sub-head, provision for cross regulator at appropriate locations where branch canals take off from main canal, desilting chamber at begging of canal has been made. Provision for Head regulator for branch canal has also been made. The cost of regulators is arrived from cost curve of regulators. The details are appended in Annexure 13.2.3 in Appendix Volume-VI(A). E-Falls: Rs.78 lakh
There is no canal drop in the main canal. However, canal drops at Kelwan feeders have been provided to cope up with the topography and to join at suitable level of main canal. The cost of canal drop on Kelwan feeder have been estimated from the cost curves of canal falls. The details are given in Annexure 13.2.4 in Appendix Volume-VI(A). F-Cross drainage works: Rs.29152 lakh
The cross drainage works proposed across the main canals are aqueducts, syphon aqueducts, canal syphons to facilitate the crossing of river / streams. The costs of the structures have been estimated from the cost curves. Details are appended in Annexure 13.2.5 in Appendix Volume-VI(A). G-Bridges: Rs.1597 lakh
A number of bridges (major and minor) are required to be constructed in the Par-Tapi-Narmada link canal of the project to facilitate crossing of various roads. Necessary provision has been made towards construction of these bridges. The estimates are prepared based on the cost curves. Details are appended in Annexure 13.2.6 in Volume-VI(A). H-Escapes: Rs.227 lakh
Under this sub-head provision has been made for canal escapes at suitable locations where drainage facilities exist to take care of the discharges in the eventuality of canal breaches. The details are appended in Annexure 13.2.7 in Volume-VI(A).

1016
K- Buildings: Rs.18541 lakh Provision has been made under this sub-head for construction of
temporary and permanent buildings for both residential and non-residential buildings for various categories of staff, offices, inspection bungalow, stores, club cum welfare hall, laboratory and research station etc. Rates have been adopted for these buildings based on the plinth area and prevailing market rates. Details under this sub-head are given in Annexure 13.2.8 in Volume-VI(A). L- Earthwork and Lining: Rs.162842 lakh
The earthwork quantities involved in cutting based on the type of soils are separately worked out. The quantity of earthwork required for embankment from borrow areas are separately worked out. The detailed estimates are prepared considering the cross sections taken at 50 m interval along the canals and detailed drawings supplied by Central Water Commission, New Delhi at various sections. Lining is provided for bed and side slopes in the entire length of canals as per the drawings. Details under this sub-head are appended in Annexure 13.2.9 in Volume-VI(A). M- Plantation: Rs.215 lakh
Under this sub-head, cost of plantation in the colony areas and along the main canals and branch canals on both sides has been provided. Details are given in Annexure 13.2.10 in Volume-VI(A). O- Miscellaneous: Rs.1017 lakh
Under this sub-head provision has been made to cover the cost of the following works:
• Capital cost of electrification, water supply purification and
distribution arrangements, sewage disposal, fire fighting equipment, telephones, wireless sets, equipment for quality control and field labs, initial equipment and other accessories for hospitals etc.
• RandM of above equipments / infrastructural facilities etc. • RandM of inspection vehicles, inspection bungalow etc.

1017
Provision has also been made for other miscellaneous items such as inaugural foundation laying ceremony, compensation to work men, flood lighting, model exhibits etc. Details are given in Annexure 13.2.11 in Volume-VI(A). P- Maintenance: Rs.2840 lakh
Under this sub-head provision has been made to cover the cost of maintenance of all works during the construction of canals. A provision of 1% cost of I-Works less A-Preliminary, B-Land, M-Plantation, O-Miscellaneous, Q-Special Tools and Plant, X-Environment and Ecology and Y-Loss on stock has been made. Details are appended in Annexure 13.2.12 in Volume-VI(A). Q- Special Tools and Plant: Nil
No provision has been made under this head as the cost of special Tools and Plant will be borne by the contractors. R- Communication: Rs.1279 lakh
Under this sub-head, provision for construction of temporary roads and remodelling of existing roads for approach to canal and regulatory system, quarry sites and other working areas has been kept. Details are given in Annexure 13.2.13 in Volume-VI(A).
U- Distributaries and Minors: V- Water Courses and Field Channels: Rs.89854 lakh
Under this sub-head, provision has been made for providing branch canals, distributaries and minors and courses and field channels considering a cost of Rs.38701/- per ha for the culturable command area of Canal. The details are appended in Annexure 13.2.14 in Volume-VI(A) and 13.10.4 in Volume VI (B) W- Drainage: Rs.5060 lakh
Under this sub-head, provision has been made at the rate of Rs. 6665/- per ha for total command area for field drainage. Details are given in Annexure 13.2.15 in Volume-VI(A).

1018
X- Environment and Ecology: Rs.17761 lakh Provisions under this sub-head have been made towards the cost of
extensive management measures to sustain environment and ecology such as land management plan (stabilisation of muck disposal management), measures to arrest transportation of silt across basin, provision for free fuel to department engaged labour, Public Health Management, Environmental Monitoring Programme (EMP). The details are given in Annexure 13.2.16 in Volume-VI(A). Y- Losses on Stock and Unforeseen: Rs.824 lakh
Provision has been made for losses on stock and unforeseen @ 0.25% on all sub-heads under I-Works excluding sub-heads A-Preliminary, B-Land, O- Miscellaneous, M-Plantation, P-maintenance and X-Environment and Ecology.
The total cost of I –works of Unit – II (Canals) works out to Rs. 411090 lakh. II- Establishment: Rs.36040 lakh
Provision has been made as per norms @ 10% of I-Works excluding B-Land towards establishment and pensionary charges. III- Ordinary Tools and Plant: Rs.4111 lakh
Provision has been made under this head for ordinary Tools and Plant @ 1% of I-Works. This provision is distinct from the Q-Special Tools and Plant and is meant to cover the cost of survey instruments, camp equipment and other small Tools and Plant. IV- Suspense: Rs. Nil
It is assumed that all the outstanding suspense would be cleared by adjustment to appropriate heads on completion of the project. As such no provision has been kept under this head. V- Receipt and Recoveries: (-)Rs.1017.00 lakh
Under this head, estimated recovery by way of resale or transfer of temporary buildings, special Tools and Plant and by resale or transfer of

1019
generator sets, electrical lines, telephone lines and other accessories are accounted for and provision has been made accordingly 13.1.2.2 B - Indirect Charges: Rs.5486 lakh
Provision for abatement of land revenue and Audit and Account charges are covered under ‘Indirect Charges’ at the following rates:
• Abatement of land revenue – 5% of cost of land • Audit and Account charges – 1% of I-Works
Total cost of Canals (Unit-II) works out to Rs. 455710 lakh.
13.1.3 Unit – III: Hydroelectric Installation
Par-Tapi-Narmada link project envisages construction of 6 power houses out of which, 5 power schemes at the toe of Paikhed, Chasmandva, Chikkar Dabdar and Kelwan dams and the other one at the drop of feeder pipe line canal originating from Kelwan reservoir to Main canal. The total installed capacity for power generation from all the power schemes is 21 MW.
Provision for expenditure towards installation of these 6 power
houses, penstocks, switch-yards, tail race channel, various electro-mechanical equipments, transmission lines etc have been made under Unit-III “Hydro electric installation”. Total cost of unit – III for above powerhouses is estimated to be Rs. 18091 lakh at 2014-15 price level. The details are given at Annexure 13.3 of Volume-VI(A) and Volume –II. The sub-head wise details are given hereunder. 13.1.3.1 Direct Charges I – Works A-Preliminary: Rs.329 lakh
Provision for preliminary surveys and investigations works carried out to arrive at optimum designs for the project components including consultancy charges for Power Potential and Environmental and

1020
Management studies at Detailed Project Report stage and design works at pre construction stage has been made at 2% of I-Works Under this sub-head. B-Land: Rs.0.00 lakh
Provision for acquisition of land for construction of power houses, Penstocks, Switchyards, Tailrace Channel, approach roads etc have been considered in the cost of Head works (Unit – I).
J-Power Plant Civil Works: Rs.8086 lakh
Under this sub head, provision has been made towards civil engineering structures comprising of intake structure, penstocks, power house complexes and tail race channel etc. The details are given in Annexure 13.3.1 in Volume-VI(A). P-Maintenance: Rs.161 lakh
Provisions have been made under this sub-head to cover the cost of maintenance of all works during the construction of power houses. A provision of 1% of the cost of I-works less A-Preliminary, B-Land, and Q- special Tools and Plant O-Miscellaneous and Y- Loss on stock has been considered. The details are given in Annexure 13.3.2 in Volume VI (A) Q-Special Tools and Plant: Rs. Nil
No provision has been made under this head as the cost of special Tools and Plant will be borne by the contractors. S-Power Plant and Electro Mechanical Works: Rs.7831 lakh
The provisions under this sub-head have been made towards the cost of power plant equipments, switch yard, transmission lines and other items connected with the installation at the power houses. The Electro-mechanical studies / designs of the power houses have been carried out through Tehri Hydro Development Corporation (India) Limited, Rishikesh. Provisions made under this sub-head for various components are based on the Electro Mechanical studies carried out by Tehri Hydro Development Corporation (India) Limited, Rishikesh. The details under this sub-head are given in Annexure 13.3.3 in Volume-VI(A).

1021
Y. Losses on Stock and Unforeseen Items: Rs.40 lakh Provision under this sub- head has been made @ 0.25% of the cost of I- works less A- Preliminary, B- Land, P- Maintenance, Q- Special Tools and Plant, O-Miscellaneous and X- Environment and Ecology
The total cost of I –works of Unit – III (Hydro- electric Installation) works out to Rs. 16447 lakh. II-Establishment: Rs.1316 lakh
Provision towards establishment charges has been made @ 8% of I-Works excluding B- land. III- Ordinary Tools and Plant: Rs.164 lakh
Provision has been made under this head @ 1% of I-Works towards ordinary Tools and Plant to cover the cost of survey instruments, camp equipment and other small tools and plant. This provision is distinct from the Q- special Tools and Plant. IV – Suspense: Rs. Nil
It is assumed that all the outstanding suspense would be cleared by adjustment to appropriate heads on completion of construction of the power houses. As such no provision has been kept under this head. V- Receipt and Recoveries: Rs. Nil
No provision for special Tools and Plant has been kept under the sub-head. Also the provision for K- Buildings has been considered in the cost of Head works. As such there will be no recoveries on the account of resale of special Tools and Plant and also buildings. 13.1.3.2 Indirect Charges: Rs.164 lakh
Provision for abatement of land revenue and Audit and Account charges are covered under ‘Indirect Charges’ at the following rates:
• Abatement of land revenue – 5% of cost of land • Audit and Account charges – 1% of I-Works

1022
Total cost of Hydro - electric Installation (Unit-III) works out to Rs. 18091 lakh. 13.1.4 Unit–IV: Navigation
Navigation is not proposed under this project and hence, no provision is required under this sub-head. 13.1.5 Unit–V: Water Supply Works
Water supplies for domestic and industrial needs are proposed under periphery of the project. Water will be supplied through main canals and various branch canals, whose cost is considered under Unit-II: Canal system. However, water supply network to the local areas will be the responsibility of the local development body / local administration. Hence, no provision towards water supply works at local level has been kept under this head. 13.1.6 Unit–VI: Command Area Development: Provision for expenditure towards command is development including lifting arrangement consisting of pumps and raising mains and its structure have been made under Unit-IV command area development. The total cost of command area development is estimated to be Rs. 72547 lakh. The details are given at Annexure 13.4 of Volume-VI (A). The sub-head wise details are given below.
13.1.6.1 Direct charges I-Works ‘A’ Preliminaries The total probable expenditure involved under this minor head is taken as 2% of the cost of I-Works. This works out to Rs. 1331 lakh. The provision covers the probable expenditure on investigations to be conducted during execution, surveys, design studies, field tests, etc.

1023
‘B’ Land Provision made under this sub-head covers the cost of land acquisition for raising mains, pump houses, sumps and delivery cisterns etc. This works out to Rs. 2184 lakh. The details are furnished in Annexure 13.4.1 in Volume VI (A) ‘C’ Civil Works Provision made under this sub-head covers the cost of intake structure, pump houses, sump wells, raising mains, Delivery cisterns and supporting structures for raising mains etc. This works out to Rs. 52427 lakh. The details are furnished in Annexure 13.4.2 in Volume VI (A) ‘L’ Earth Work The total culturable command area covered under par-Tapi-Narmada link project is 232175 ha. This area is covered by enroute command (61190 ha) feeder pipeline command (1270 ha), project proposed by Governmentof Gujarat(45561 ha), tribal area in enroute right side of canal (36620 ha) tribal area in vicinity of reservoir (12514 ha), tribal area on right side of Narmada main canal (34342 ha) and target command area (42368 ha) in Saurashtra and Kutch region in lieu of part command area of existing Miyagaon Branch Canal of Narmada canal system of Sardar Sarovar Project to be taken over by the link canal. The total 24470 ha of command area considered for land levelling and shaping to facilitate irrigation and also to prevent soil loss due to erosion in undulating area. This works out to Rs 2090 lakh. Details are given in Annexure 13.4.3 in Volume VI (A) ‘M’ Plantation The total probable expenditure involved under this minor head is taken as 0.5% of the cost of I-Works. This works out to Rs. 333 lakh. ‘O’ Miscellaneous The total probable expenditure involved are twords miscellaneous works related to lifting arrangements i.e., Pumps, rasing mains and its supporting structures etc., under this minor head is taken as 4% of the cost of I-Works. This works out to Rs. 2662 lakhs.

1024
‘P’ Maintenance A provision of Rs. 578 lakh is made under this minor head for the maintenance of all works during construction period at 1% of I-works less preliminaries, land, plantation, miscellaneous special tools and plants, loss on stocks charges. ‘R’ Communications The total probable expenditure involved under this minor head I kept as 499.00 lakh which is 0.75% of the cost of I-Works. ‘S’ Power Plant and Electrical Mechanical Systems. The provision made under this minor head towards cost of pumps works out to Rs. 4308.00 lakh. The details are furnished at Annexure 13.4.4 in Volume VI (A) ‘Y’ Losses on Stock and Unforeseen A provision of Rs. 149 lakh at 0.25% of I-works less Preliminaries, land, Miscellaneous, Plantation and Special T and P is made under this minor head in the estimate. II. Establishment An amount of Rs. 5150 lakh is made under this sub-head for establishment including leave and pension charges at 8% on I-works less B-Land. III. Tools and Plants (Ordinary) A sum of Rs. 666 lakh is made under this sub-head to cover the cost of survey instrument, camp equipment, office furniture and equipment and other small tools at 1% of the cost of I-Works. IV Receipts and Recoveries An amount of Rs. 532 lakh is expected to be recovered by way of sale of special TandP at 75% of the provision under Q-Special Tools and Plants, resale/transfer of accessories under capital cost of O-Miscellaneous @ 20%.

1025
Indirect Charges (a) Abatement of Land Revenue
A provision Rs. 36 lakh at 5% of the land cost is provided towards abatement of land revenue due to land acquisition for raising mains. (b) Audit and Account Charges A provision of Rs. 666 is made under this minor head at 1% of the cost of I-Works cover the establishment charges of the Accounts staff. 13.2 Revenues 13.2.1 Yearly Programme of Development with respect to the Date
of Starting of Construction of the Project The link project is scheduled to be completed in 7 years. Yearly
programme of construction of the project has been discussed in detail in Chapter - 10 “Construction Programme, Manpower Deployment and Plant Planning”. This programme has been planned by CMO Directorate, Central Water Commission, New Delhi. 13.2.2 Sources of Revenue
The Par-Tapi-Narmada link project has been planned to provide irrigation in the new areas in its en-route Irrigation, projects proposed by Governmentof Gujarat, tribal area in the vicinity of reservoirs, tribal area in enroute right side of the canal, tribal area on right side of Narmada main canal and drought prone Saurashtra and Kutch regions by substitution (in lieu of taken over part command areas of existing Miyagam Branch Canal of Narmada Canal Systems of Sardar Sarovar Project). Also, the project envisages power generation and domestic water supply to the villages in the periphery of the proposed reservoirs and also along the canal. Accordingly, following would be the source of revenue from the link project.
• Irrigation water charges • Irrigation cess

1026
• Sale of water for domestic water supply and • Sale of hydro power
Other than the above, fisheries development in the proposed
reservoirs can also be one of the major sources of revenue on account of this project. 13.2.2.1 Water Rates – Irrigation Cess
Water rates: A large infrastructural network such as this project being created for making water available in the proposed command areas for irrigation and drinking purposes besides power generation, needs to be self sustainable. Therefore, appropriate water pricing is quite necessary, so that cost of operation and management of project could be recovered from the beneficiaries of the project upto some extent. Water rates may be different from irrigation and non-irrigation use. Water rates for irrigation use can be applied on the basis of per unit area irrigated. On the other hand, for drinking water supply, rates may be applied on the basis of per unit volume of water supplied, while power can be charged per unit basis. 13.2.2.2 Auction of Ferry Service, Inundated Land Lease, Auction for Fruit Bearing Trees along Canals, Lease of Land for Shops in Colony Area, Navigational Permits
Vacant lands on either side of canals may be leased for plantation of fruit bearing trees. Similarly, in project colony areas, land for shops may also be leased. 13.2.2.3 Revenue from Hydro-power
There are 6 power houses proposed to generate the hydropower. The Power Potential Studies of 6 power houses have been carried out through Tehri Hydro Development Corporation (India) Ltd, Rishikesh. The total installed capacity of the proposed power houses is 21 MW and annual energy generation will be 102 Million Units. The revenue from sale of hydro power generation will be Rs. 6120 lakh annually.
13.2.2.4 Revenue from Water Supply

1027
The annual local domestic and industrial demands considered through @ 10.0 MCM each of the proposed reservoirs. The total water supply is 76 MCM. The revenue from sale of water will be Rs. 8987 lakh annually. 13.2.2.5 Navigation
Navigation facilities are not envisaged in Par-Tapi-Narmada link project. 13.2.2.6 Other Sources (Pisciculture, Tourism etc.)
Due to formation of Jheri, Paikhed, Chasmandva, Chikkar, Dabdar and Kelwan réservoirs, the naturel Fish production will increase. The revenue from sale of fish will be Rs. 303 lakh annually.
Tourism activities will also increase in the project area due to
formation of water bodies. The benefits from these activities have not been quantified as such, the likely benefits have not been considered in the benefit-cost analysis of the project. 13.2.3 Concession in Water Rates (Irrigation), Cargo and
Passenger Rates, etc. As the water rates (Irrigation) prescribed by the States are highly
subsidized, there appears to be no rationale for further concession of these rates in the project commands. 13.2.4 Administrative Charges for Supply of Water and Collection
of Revenues etc. Suitable provision has been made for running and maintenance of the
canals, which include administrative charges for supply of water. 13.2.5 If the Area to be Irrigated is Prone to Scarcity, the
Expenditure Normally Incurred to Redress the Scarcity The main aim of the Par-Tapi-Narmada link project is to provide irrigation in the draught prone areas of Saurashtra and Kutch regions and along the areas in en-route of the link canal which needed assured water supply.
13.2.6 Year in which Revenue Would Start Accruing from Various Sources Counting from First Year of Construction

1028
The construction of project is scheduled to be completed in 7 years. The irrigation development in all the commands is also expected to be completed by then. Revenue from irrigation is expected to start accruing in full from beginning of 8th year i.e after completion of the project. Power benefits from Power Houses also start accruing from beginning of 8th year 13.2.7 Total Income from Various Sources
The total revenue from various sources will be Rs. 126586.70 lakh. The details are furnished in Table 13.2.
Table 13.2
Revenue Generation from Par-Tapi-Narmada Link Project
Source of Revenue from Revenue (Rs. in
lakh) Agricultural produce ( see para no.9.11.5.1(ii) i chapter 9 )
111176.70
Sale of Power 6120.00 Domestic water supply 8987.00 Fisheries 303.00 Tourism 0.00
Total 126586.70 13.2.8 Details of Staff Proposed for Collection of Revenues and its
Basis The revenue will be collected by the District / Tehsil administration
through their existing system / staff. Hence, no provision has been made. 13.2.9 Net Revenue Expected from Different Components of Project
The total net amount of income / benefit from various sources is estimated to be Rs. 126586.70 lakh. 13.2.10 Productivity of Project in Terms of Percentage Financial Returns

1029
The details of productivity in the command area at pre and post project scenarios are as follows:

1030
Details of Productivity in the Command Area Unit: Qtl
Crop
En-route Canal Government of Gujrat projects
Feeder Pipe line Tribal area enroute Right side of Canal and Vicinity of Reservoirs and right side of NMC
Target command in Saurashtra
Pre-project
Post-project
Pre-project
Post-project
Pre-project
Post-project
Pre-project
Post-project
Pre-project
Post-project
Kharif 1268276 909805 964297 691828 15588 19358 100321 107397 51177 54784 Rabi 156650 687699 119117 522977 1993 14633 502737 2773992 256460 1415064 Two seasonal
0 0 0 0 0 0 167467 0 85424 0
Hot weather
0 195027 0 148266 0 3910 74730 398640 38130 203360
Perennial 209001 1942560 158913 1475800 0 41300 0 49840 0 25420 Total 1633927 3734091 1242327 2838871 17581 79201 845255 3329869 431191 1698628
Net increase in produce
2100164 (128.53%)
1596544 (128.51%)
61620 (350.49%)
2484614 (293.95%)
1267437 (293.94%)
Total increase
7510379

1031
13.3 Benefit–Cost Ratio and Internal Rate of Return 13.3.1 Estimate of Annual Cost
The details of annual cost of the project are given below: Sl. No.
Description Annual Cost (Rs. in lakh)
A Annual Cost of Par-Tapi-Narmada link project 1 Interest @ 10% on Capital cost of the project
including cost of land development 102112.10
2 Depreciation of the project @ 1% cost of the project for 100 years of life (Irrigation component)
9304.83
3 Depreciation of the project @ 1.20% cost of the power component for 75 years of life
217.09
4 Annual OandM charges @ Rs. 600/- per ha of CCA
1393.05
5 Annual OandM charges for power houses @ 5% cost of EandM works of power houses
391.55
6 Maintenance of head works @ 1% of the cost of head works
4747.73
7 Depreciation of pumping system and raising mains a) Pump and Equipment at 8.33% on 4308 b) Raising mains at 3.33% on 47353 c) Civil Works of Pumping station at 1% of Rs.5074
358.86 1576.85 50.74
8 Power Charges at Rs.1.80 per unit for 122.88MU 2211.84 Total annual cost 122364.64
13.3.2 Benefit-Cost Ratio As described in the above paras, the net annual benefits from various components of the project work out to Rs. 126586.70 lakh and the annual costs works out to Rs. 122364.64 lakh. Thus, the Benefit-Cost Ratio of the project works out to 1.035. Details are given in Annexure 13.5 of Volume –II.(Annexure)

1032
13.3.3 Internal Rate of Return (IRR) The project has been planned to be completed in a period of 7 years including pre construction year. The phasing of the expenditure has been planned accordingly. The details of yearly expenditure chargeable to link project have been given in Annexure 13.6 of Volume-II. Considering life of the project as 100 years, the Internal Rate of Return of Par-Tapi-Narmada link project has been computed as 10.172%. Details are given in Annexure 13.6 of Volume –II.(Annexure)
13.3.4 Benefit-Cost Ratio for Flood Control Component of Projects
No cushion in the reservoir storage is provided exclusively for flood control. Hence, no Benefit-Cost Ratio for flood control component of the project is worked out. 13.3.5 Benefits other than those considered in the Benefit- Cost Ratio and Internal Rate of Return
Benefits from Irrigation, power, water supply and fisheries have been considered for assessing the Benefit-Cost ratio. The project will go a long way by enhancing the socio-economic status of the people of that area. It would provide the impetus to industrialization and overall economic development of the region. In addition to above benefits, lot of employment will be generated during construction period which will enhance the socio economic conditions of the people living in the nearby area. So many new secondary and tertiary economic activities will be generated in that region due to coming up of this project, which will lead to overall development of that area. In addition to this, following recreational facilities will be available on completion of the project.
• Parks/gardens in downstream of dams. • Children parks in the township. • Tourist spot with boating facilities. • Guest house, inspection bungalow and dormitory accommodation.
These facilities will ensure tourism development in the area. The water-fall located just downstream of the dam site may further enhances the tourism potential.