foreword - ministry of education
TRANSCRIPT


Foreword
It is acknowledged that thorough planning is essential for effective teaching and learning. Such planning is even more critical today when one considers the limited resources, both human and material, which are available. The Ministry of Education, through the Secondary School Reform Project (SSRP), has developed curriculum materials that have been designed to improve the quality, equity and efficiency of secondary education. The curriculum materials include Levels 7-9 curriculum guides and teachers’ guides for Language Arts, Mathematics, Science, Social Studies, Reading and Practical Activities for Science. These materials have been tested in secondary-age schools nationwide and are considered useful in providing teachers with a common curriculum framework for planning, monitoring and evaluating the quality of teaching and learning. The curriculum materials also provide a basis for continuous student assessment leading to the National Third Form Examination (NTFE). The initial draft curriculum materials have been subjected to evaluation, by respective Heads of Departments, from all ten Administrative Regions and Georgetown and they have been subsequently revised to reflect the views expressed by teachers. The revised curriculum materials are now published as National Curriculum documents to provide consistency and support for teachers in the process of planning for an effective delivery of the curriculum. All secondary teachers must ensure that they make good use of these curriculum materials so that the quality of teaching and learning can be improved in all schools. Ed Caesar Chief Education Officer

PREFACE
This is the Revised Curriculum Guide for Level 9. This document fulfils the objective of making Mathematics accessible to all students at Level 9. Hence teachers of Level 9 students should make a conscious effort to see how best they could utilize the ideas contained to plan for instruction. This document can serve as a focal point for departmental and regional subject committee meetings, where methodologies and strategies for both teaching and assessing are deliberated on. Lessons should be delivered in an environment in which there is opportunity for active and creative participation by both students and teacher. This Guide has a direct focus on an integrated approach to curriculum delivery, in which the teacher is not unduly restricted by the subject content. The student’s total development as a person should be of foremost concern to the teacher. In the curriculum process, feedback is a necessary condition for change and improvement, and I would urge all of our mathematics teachers to provide such feedback to the curriculum staff as they visit to provide support that will enhance your classroom teaching. Ingrid Barker Head (ag) Curriculum Development and Implementation Unit National Centre for Educational Resource Development December 2002

ACKNOWLEDGEMENTS
The following persons were involved in writing and revising the Level 8 Curriculum Guide:
Jean Holder-Lynch Vice Principal (Administration) Cyril Potter College of Education
Joan Persaud Deputy Headmistress Annandale Secondary School
Mohan Lall Sookdeo Deputy Headmaster Charity Primary School Dirk McAulay Brickdam Secondary School Sydney Binda Queenstown Community High School (Retired) Shirley Klass Subject Specialist, Mathematics, NCERD (Retired)
Alicia Fingal Assistant Chief Education Officer, Primary (Retired)
Flavio Camacho Subject Specialist Mathematics (SSRP)
Joseph Mckenzie Senior Subject Specialist Mathematics (SSRP)

CONTENTS
PAGE Sets 1 Number Theory 12 Computation 16 Measurement 24 Algebra 1 33 Consumer Arithmetic 1 35 Geometry 1 40 Relations & Functions 44 Statistics 49 Algebra 2 59 Consumer Arithmetic 2 61 Geometry 2 68 Relations & Functions 2 77 Introduction to Trigonometry 81

SETS
Topic Objectives Content Activities/ Evaluation Areas ofSkills Knowledge Understanding Attitude Materials/ Integration
StrategiesSet-Builder Notation
Use set-builder notation to describe a set whose elements are given.
Set-builder notation is a way of describing a set using an algebraic expression. E.g. A = {x: -2 � x � 2, x � Z} This is read as: A is a set of all integers x such that x lies between -2 and 2, inclusive. Symbols that are used in set-builder notation: � - is less than � - is greater than � - is less than or equal to � - is greater than or equal to : - such that � - is an element of W - Whole numbers N - Natural numbers Z - Integers Q - Rational numbers R - Real numbers
Small group activity: Using set-builder notation to describe sets.
Can students use set-builder notation to describe a set?
Social Studies, e.g. establishing links with the family union/family tree.
1
Topic Objectives Content Activities/ Evaluation Areas of
Skills Knowledge Understanding Attitude Materials/ IntegrationStrategies
Appreciatethe use of set-builder notation to describe sets whose elements are given.
Do studentsappreciate the use of set-builder notation to describe sets whose elements are given?
Subsets Use the symbols � and � to make statements about pairs of sets.
Identify subsets of a given set.
Experience satisfaction in selecting subsets of a given set.
If all the elements of a set B can be found in a set A, then B is a subset of A, e.g. A = {0, 1, 2, 3, 4, 5} B = {1, 2, 3} B is a subset of A. B � A is read as ‘B is a subset of A’. A � B is read as ‘A contains B.’
Have students identify other subsets of set A and set B. Using the symbols � and � to make statements about pairs of sets.
Can students: � identify subsets of a given set? Use the symbols � and � to make statements about pairs of sets? Do students experience satisfaction in selecting subsets of a given set?
Social Studies, e.g. classifying groups and identifying subsets of groups.
2

Topic Objectives Content Activities/ Evaluation Areas of
Skills Knowledge Understanding Attitude Materials/ IntegrationStrategies
Construct subsets of a given set.
Recognise that the empty set is a subset of every set.
Enjoy constructing subsets of given set.
There is a relationship between the number of elements in a set and the number of subsets that can be formed from that set. If a set contains ‘n’ elements, then the number of subsets = 2n, where n represents the number of elements in the given set. The empty set is a subset of every set.
Given the number of elements in a set, have students determine the number of subsets that can be constructed. Have students construct subsets from a given set and then take out all the elements. Let students observe that what remains is the empty set.
Can students construct subsets from a given set? Do students recognise that the empty set is a subset of every set? Do students enjoy constructing subsets of given sets?
Social Studies, e.g. classifying sets. Integrated Science, e.g. grouping of insects with particular characteristics.
3

Topic Objectives Content Activities/ Evaluation Areas of
Skills Knowledge Understanding Attitude Materials/ Integration Strategies
Recognisethat every set is a subset of itself.
All members of a set can be defined as a subset of the set under consideration.
Have students construct as many subsets as possible from given sets. The subsets can be with one element, two elements, three elements, etc.
Do students recognise that every set is a subset of itself?
Intersection and Union of Sets
Use the number line to show the intersection and union of pairs of sets.
The number line can be used to show the intersection and union of pairs of sets, e.g. given A = {x: -4 � x � 4, x � Z} B = {x: -2 � x � 5, x � Z} These can be shown diagrammatically as: B � � � � � � � � A � � � � � � � -5 -4 -3 -2 -1 0 1 2 3 4 5 A � B = {-2, -1, 0, 1, 2, 3} A � B = {-3, -2, -1, 0, 1, 2, 3, 4, 5}
Have students draw number lines and use dots to show the intersection and union of pairs of sets.
Can students Use the number line to show the intersection and union of pairs of sets?
4

Topic Objectives Content Activities/ Evaluation Areas of
Skills Knowledge Understanding Attitude Materials/ IntegrationStrategies
Describe theintersection and union of two sets using set-builder notation.
If A ={-2, -1, 0, 1, 2} and B ={-2, -1, 0, 1, 2, 3} Then A B = {x: -2 � x � 2, x � Z} A B = {x: -2 � x � 3, x � Z}
Describing the intersection and union of sets using set-builder-notation. Have students do written exercises involving the use of set-builder notation to describe the intersection and union of sets.
Can students describe the intersection and union of two sets using set-builder notation?
Social Studies, e.g. working parents sharing roles within the home.
Identifyelements in the intersection and union of:
(a) two sets (b) three sets
The intersection of two sets contains only elements common to both sets. The union of sets represents all elements contained in each set. The union is formed by including the elements of each set only once.
Displaying examples showing elements in the intersection and union of: (a) two sets (b) three sets
Can students identify elements in the intersection and union of: (a) two sets (b) three sets?
Social Studies, e.g. family union through marriage.
5

Topic Objectives Content Activities/ Evaluation Areas of
Skills Knowledge Understanding Attitude Materials/ Integration Strategies
Differentiate between the intersection and union of two or three sets.
The intersection and union of two sets is commutative, e.g. A B = B A A B = B A The intersection and union of three sets are associative, e.g. (A B) C = A (B C) (A B) C = A (B C) The distributive law holds for intersection over union and union over intersection. E.g. A (B C) = (A B) (A C) also A (B C) = (A B) (A C)
Demonstrations to show that: � the intersection and union of two sets are commutative. � the intersection and union of three sets are associative. � the distributive law holds both for intersection over union and union over intersection.
Can students differentiate between the intersection and union of two or three sets?
6

Topic Objectives Content Activities/ Evaluation Areas of
Skills Knowledge Understanding Attitude Materials/ Integration Strategies
Shade the regions that represent intersection or union on a Venn diagram.
Set operations can be represented diagrammatically, e.g. Given any two sets A and B, A B = {all elements common to both A and B}. A B = {all elements found in both A and B} These can be represented on Venn diagrams as follows:
Shading regions that represent intersection or union on Venn diagrams.
Can students shade regions that represent intersection or union on a Venn diagram?
Integrated Science, e.g. combining elements. Social Studies, e.g. representing a distribution from data collected in numerical terms.
7
Topic Objectives Content Activities/ Evaluation Areas of
Skills Knowledge Understanding Attitude Materials/ Integration Strategies
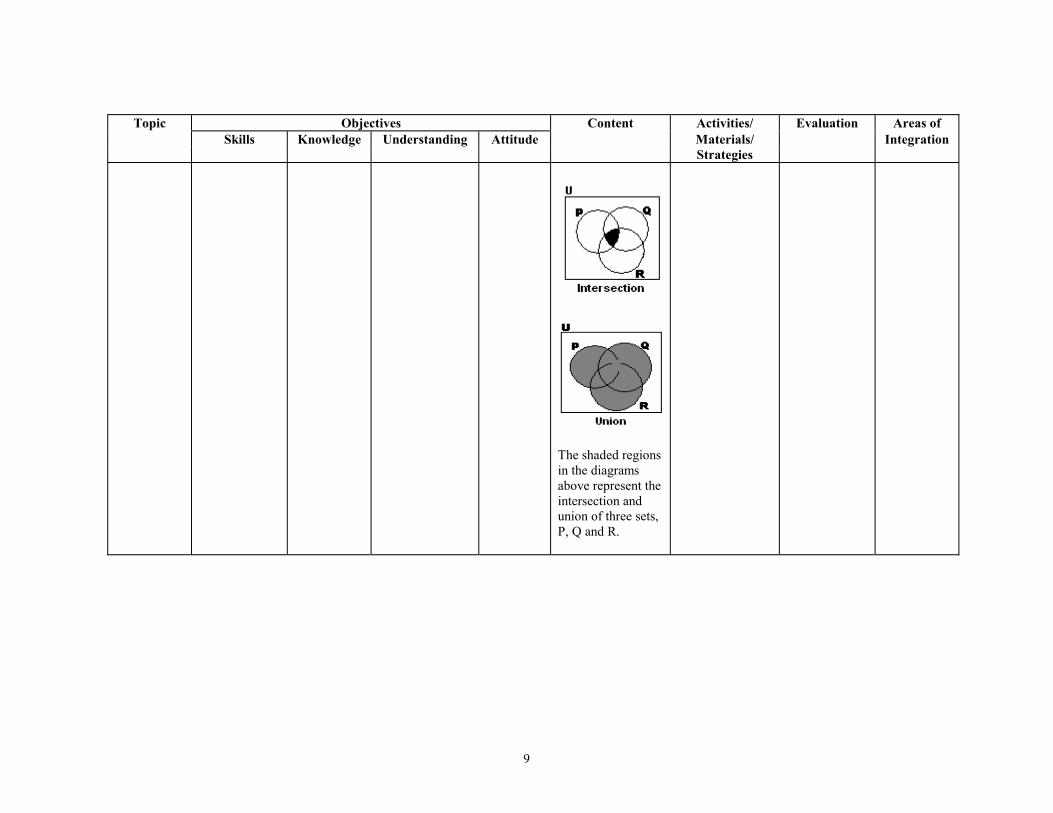
The shaded regions in the diagrams above represent the intersection and union of two sets, A and B. Given any three sets, P, Q and R. P Q R = {all the elements common to P, Q and R} P Q R = {all the elements found in P, Q and R} These can be represented on Venn diagrams as follows:
8
Topic Objectives Content Activities/ Evaluation Areas of
Skills Knowledge Understanding Attitude Materials/ Integration Strategies
The shaded regions in the diagrams above represent the intersection and union of three sets, P, Q and R.
9

Topic Objectives Content Activities/ Evaluation Areas of
Skills Knowledge Understanding Attitude Materials/ Integration Strategies
Apply the result of n(A B) = n(A) + n(B) – n(A B) to solve numerical problems.
U
The following conclusions can be made from the Venn diagram above: n(P) =10 + 6 = 16 n(Q) =14 + 6 = 20 n(PQ) = 6 n(PQ) = 10 + 6 + 14 = 30 n(P) + n(Q) - n(P Q) = 16 + 20 - 6 = 30 Then n(P Q) = n(P)+ n(Q) - n(P Q ) The number of elements in the union of two sets is equal to the sum of the number of elements in both sets minus the number of elements in the intersection of the two sets.
Have students do exercises involving the application of the result of n(A B) = n(A) + n(B) –n(A B) to solve numerical problems
Can students apply the result of n(A B) = n(A) + n(B) –n(A B) to solve numerical problems?
Environmental Education, e.g. Everyday problem solving situations.
10
Topic Objectives Content Activities/ Evaluation Areas of
Skills Knowledge Understanding Attitude Materials/ Integration Strategies
Construct and use Venn diagrams to solve numerical problems.
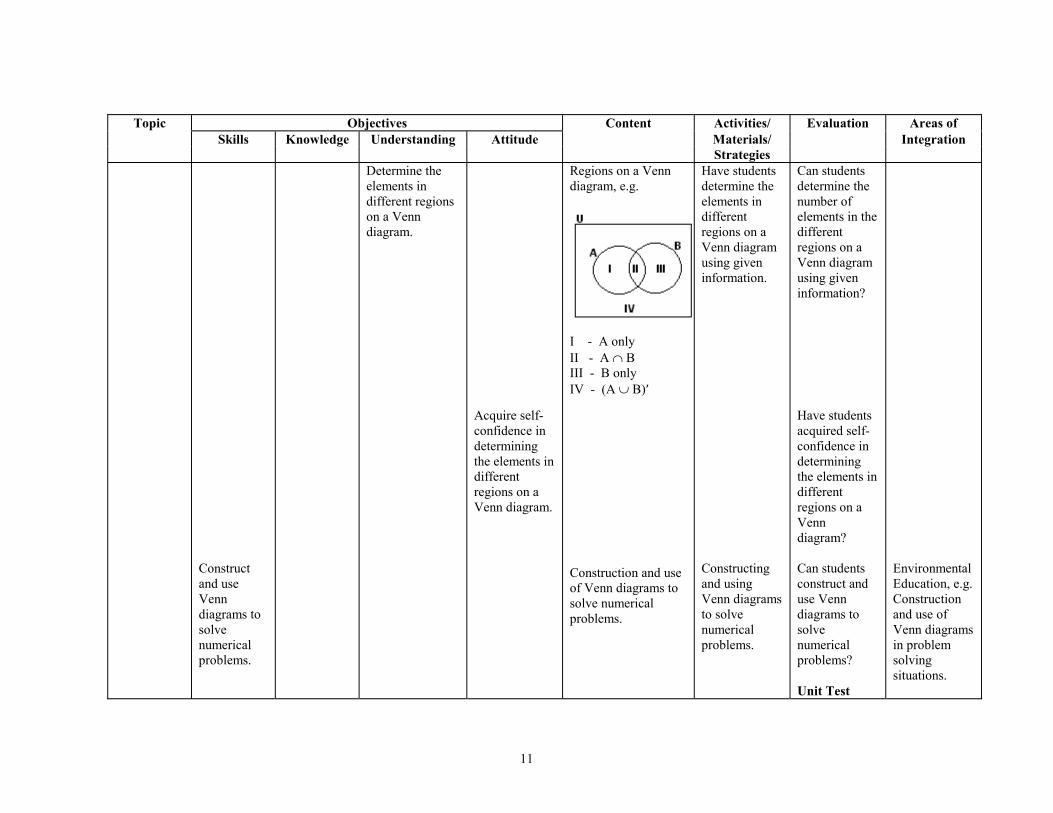
Determine theelements in different regions on a Venn diagram.
Acquire self-confidence in determining the elements in different regions on a Venn diagram.
Regions on a Venn diagram, e.g.
I - A only II - A B III - B only IV - (A B)� Construction and use of Venn diagrams to solve numerical problems.
Have students determine the elements in different regions on a Venn diagram using given information. Constructing and using Venn diagrams to solve numerical problems.
Can students determine the number of elements in the different regions on a Venn diagram using given information? Have students acquired self-confidence in determining the elements in different regions on a Venn diagram? Can students construct and use Venn diagrams to solve numerical problems? Unit Test
Environmental Education, e.g. Construction and use of Venn diagrams in problem solving situations.
11

NUMBER THEORY
Topic Objectives Content Activities/ Evaluation Areas ofSkills Knowledge Understanding Attitude Materials/ Integration
StrategiesPlace Value State the place
value of a digit in a number.
Justify the importance of place value.
Place value means that each position in a number has a different value associated with it. In the number 486, there are 4 hundreds, 8 tens and 6 ones. In the number 654.123, the digits to the left of the decimal point are whole numbers, while the digits to the right of the decimal point are decimal fractions. Starting from the digit on the extreme left and moving to the right, the place value of each digit is as follows: 6 - Hundreds 5 - Tens 4 - Ones 1 - tenths 2 - hundredths 3 - thousands
Demonstrating on chalk board the place value of digits in numbers. Discussion on the usefulness of the place value system. Investigating changes in the positions of digits using the place value chart.
Can students: � state the place value of a digit in a number? � justify the importance of place value?
Language Arts, e.g. explaining the importance of the place value system.
12
Topic Objectives Content Activities/ Evaluation Areas of
Skills Knowledge Understanding Attitude Materials/ IntegrationStrategies
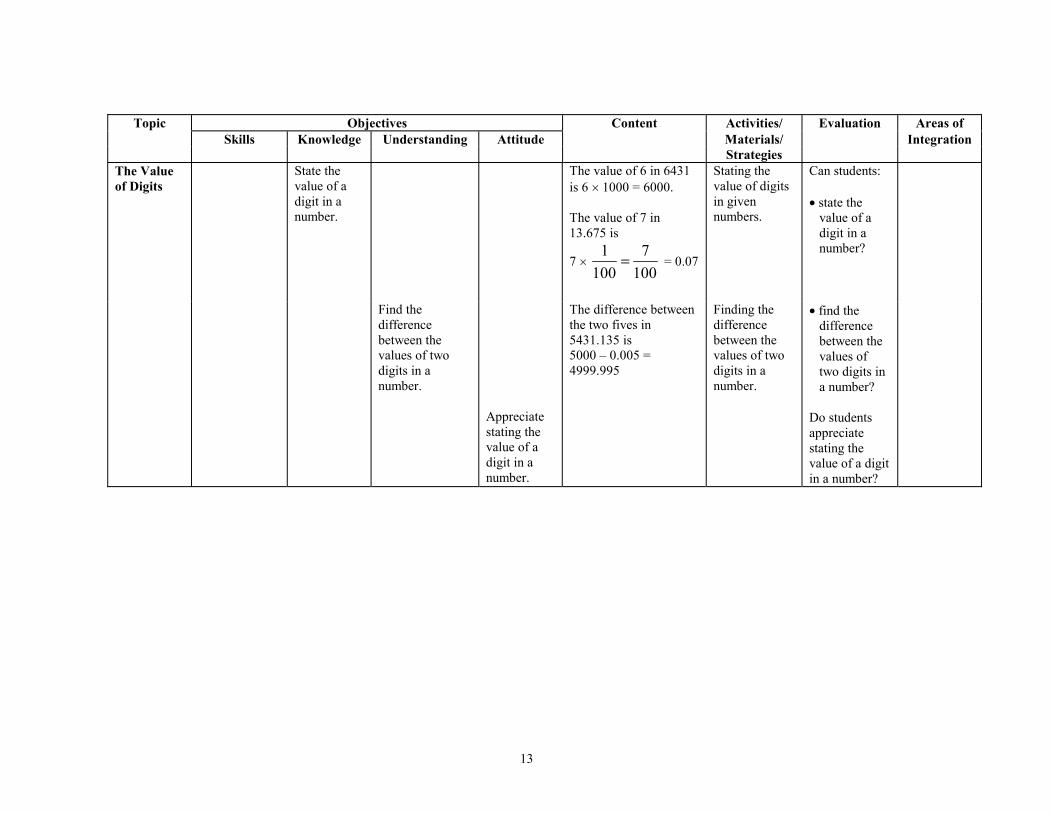
The Value of Digits
State thevalue of a digit in a number.
The value of 6 in 6431 is 6 � 1000 = 6000. The value of 7 in 13.675 is
7 � 1 7
100 100� = 0.07
Stating the value of digits in given numbers.
Can students: � state the value of a digit in a number?
Find thedifference between the values of two digits in a number.
Appreciate stating the value of a digit in a number.
The difference between the two fives in 5431.135 is 5000 – 0.005 = 4999.995
Finding the difference between the values of two digits in a number.
� find the difference between the values of two digits in a number? Do students appreciate stating the value of a digit in a number?
13

Topic Objectives Content Activities/ Evaluation Areas of
Skills Knowledge Understanding Attitude Materials/ IntegrationStrategies
Number Bases
Multiplynumbers in base two. Multiply numbers in base five.
Appreciate multiplying numbers in base two. Appreciate multiplying numbers in base five.
Multiplication of numbers in base two, e.g. 111two � 11two 111 11 1110 111 10101two When we multiply in base five, we do an ordinary multiplication in base ten, then convert each stage of our answer to the required base, e.g. 234five � 4five 234 16 = 31five � 4 15 = 30five 2101five 11 = 21five
Multiplying numbers in base two. Multiplying numbers in base five.
Can students multiply numbers in base two? Do students appreciate multiplying numbers in base two? Can students multiply numbers in base five? Do students appreciate multiplying numbers in base five?
14
Topic Objectives Content Activities/ Evaluation Areas of
Skills Knowledge Understanding Attitude Materials/ IntegrationStrategies
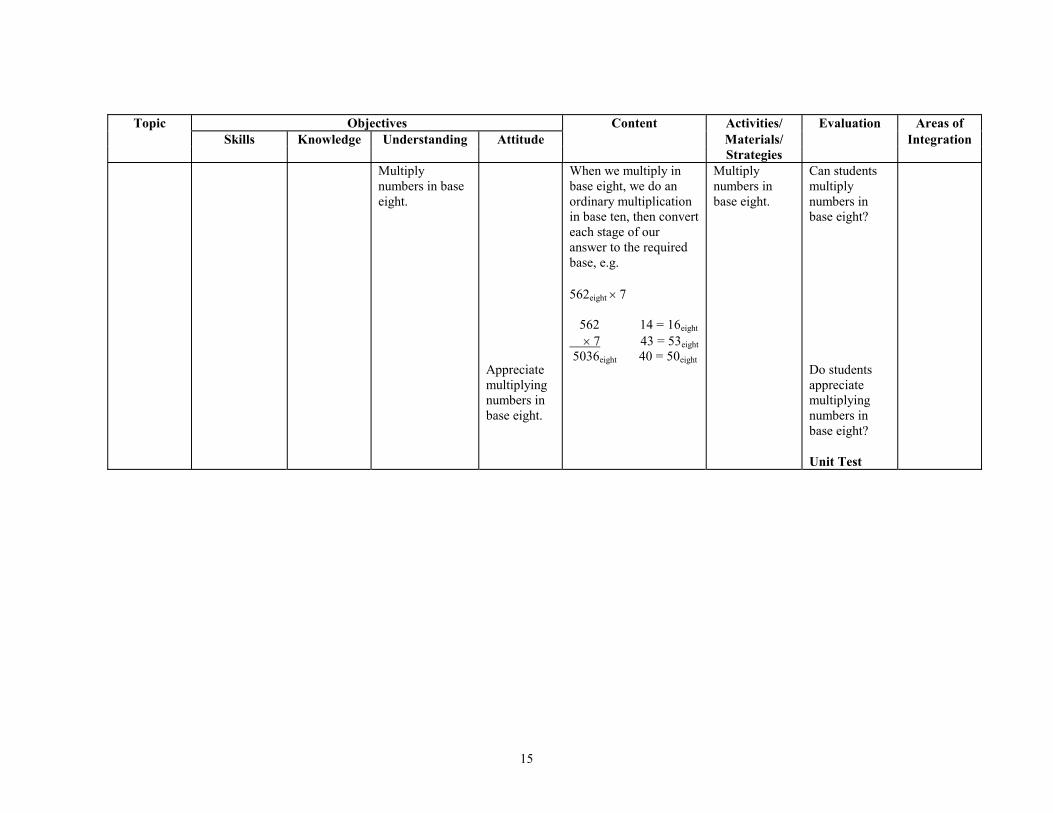
Multiplynumbers in base eight.
Appreciate multiplying numbers in base eight.
When we multiply in base eight, we do an ordinary multiplication in base ten, then convert each stage of our answer to the required base, e.g. 562eight � 7 562 14 = 16eight � 7 43 = 53eight 5036eight 40 = 50eight
Multiply numbers in base eight.
Can students multiply numbers in base eight? Do students appreciate multiplying numbers in base eight? Unit Test
15
COMPUTATION
Topic Objectives Content Activities/ Evaluation Areas ofSkills Knowledge Understanding Attitude Materials/ Integration
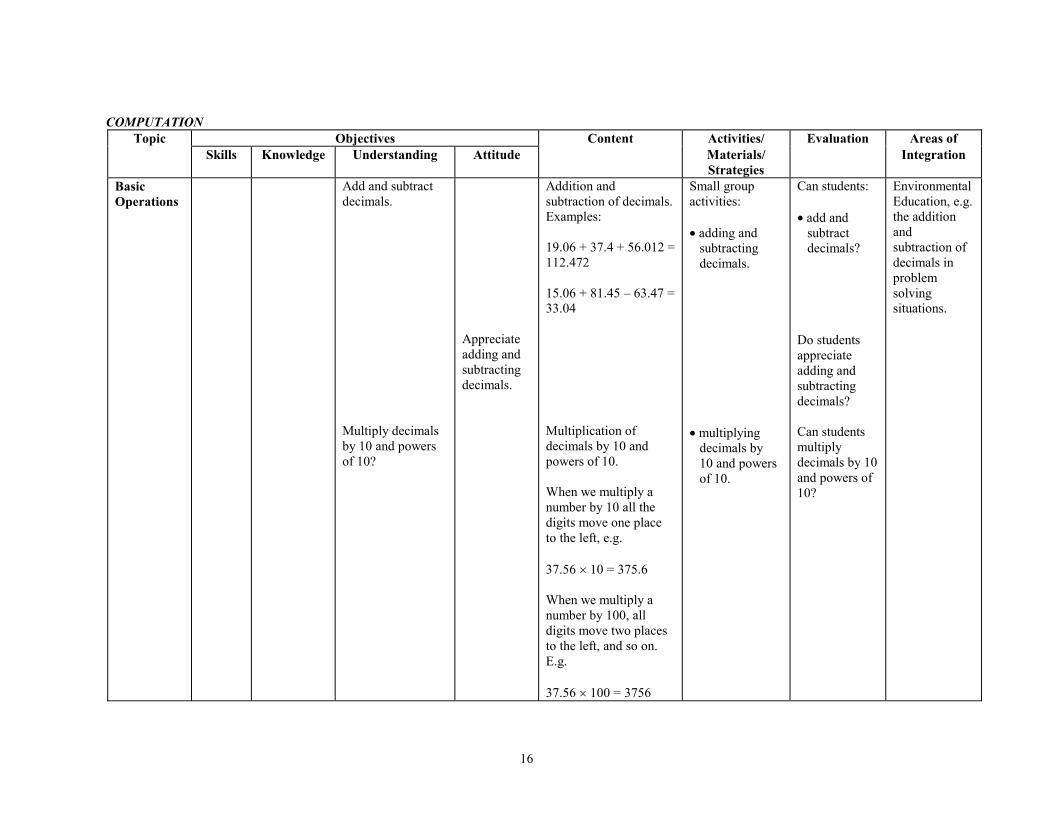
Strategies Basic Operations
Add and subtract decimals. Multiply decimals by 10 and powers of 10?
Appreciate adding and subtracting decimals.
Addition and subtraction of decimals. Examples: 19.06 + 37.4 + 56.012 = 112.472 15.06 + 81.45 – 63.47 = 33.04 Multiplication of decimals by 10 and powers of 10. When we multiply a number by 10 all the digits move one place to the left, e.g. 37.56 � 10 = 375.6 When we multiply a number by 100, all digits move two places to the left, and so on. E.g. 37.56 � 100 = 3756
Small group activities: � adding and subtracting decimals. � multiplying decimals by 10 and powers of 10.
Can students: � add and subtract decimals? Do students appreciate adding and subtracting decimals? Can students multiply decimals by 10 and powers of 10?
Environmental Education, e.g. the addition and subtraction of decimals in problem solving situations.
16
Topic Objectives Content Activities/ Evaluation Areas of
Skills Knowledge Understanding Attitude Materials/ Integration Strategies
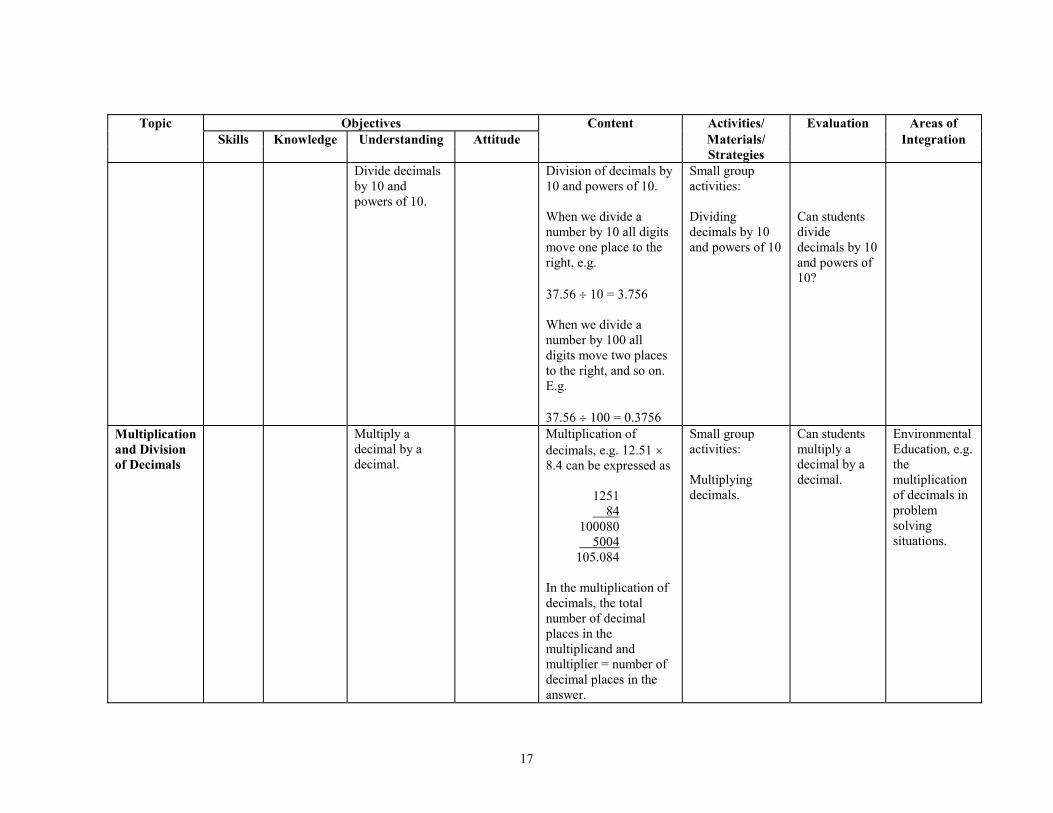
Divide decimalsby 10 and powers of 10.
Division of decimals by 10 and powers of 10. When we divide a number by 10 all digits move one place to the right, e.g. 37.56 10 = 3.756 When we divide a number by 100 all digits move two places to the right, and so on. E.g. 37.56 100 = 0.3756
Small group activities: Dividing decimals by 10 and powers of 10
Can students divide decimals by 10 and powers of 10?
Multiplication and Division of Decimals
Multiply adecimal by a decimal.
Multiplication ofdecimals, e.g. 12.51 � 8.4 can be expressed as
1251 84 100080 5004 105.084 In the multiplication of decimals, the total number of decimal places in the multiplicand and multiplier = number of decimal places in the answer.
Small group activities: Multiplying decimals.
Can students multiply a decimal by a decimal.
Environmental Education, e.g. the multiplication of decimals in problem solving situations.
17

Topic Objectives Content Activities/ Evaluation Areas of
Skills Knowledge Understanding Attitude Materials/ Integration Strategies
Divide a decimal by a decimal.
Appreciate multiplying and dividing decimals.
Division of decimals, e.g. 1.44 1.2 can be expressed as:
1.2
12 14.4
12 24 24 00 12 � 1.2 = 14.4, i.e. Divisor � Quotient = Dividend. In the division of decimals it is necessary that the divisor be a whole number.
Discussion: When dividing decimals: � make the divisor a whole number by multiplying it by a power of 10. � multiply the dividend by the same power of 10, then � do a normal division.
Can students divide a decimal by a decimal? Do students appreciate multiplying and dividing decimals?
Environmental Education, e.g. the division of decimals in problem solving situations.
18

Topic Objectives Content Activities/ Evaluation Areas of
Skills Knowledge Understanding Attitude Materials/ Integration Strategies
Estimation Demonstrate anunderstanding of estimation.
Justify the importance of estimation in mathematics.
Estimation is a good guess at length, mass or some other aspect of an item. It is usually made by reference to an amount or standard that is already known, e.g. estimating the: � number of students in a class. � mass of a packet or object. � time taken to complete a task.
Discussion on the importance of estimation in mathematics. Have students do exercises involving the estimation of: � lengths, e.g. the length of a pencil. � distances, e.g. the distance from Georgetown to Linden. � the number of objects within a given area, e.g. the number of students on the play- field.
Do students demonstrate an understanding of estimation? Can students justify the importance of estimation in mathematics?
Industrial Arts e.g. the preparation of quantities of various materials.
19
Topic Objectives Content Activities/ Evaluation Areas of
Skills Knowledge Understanding Attitude Materials/ IntegrationStrategies
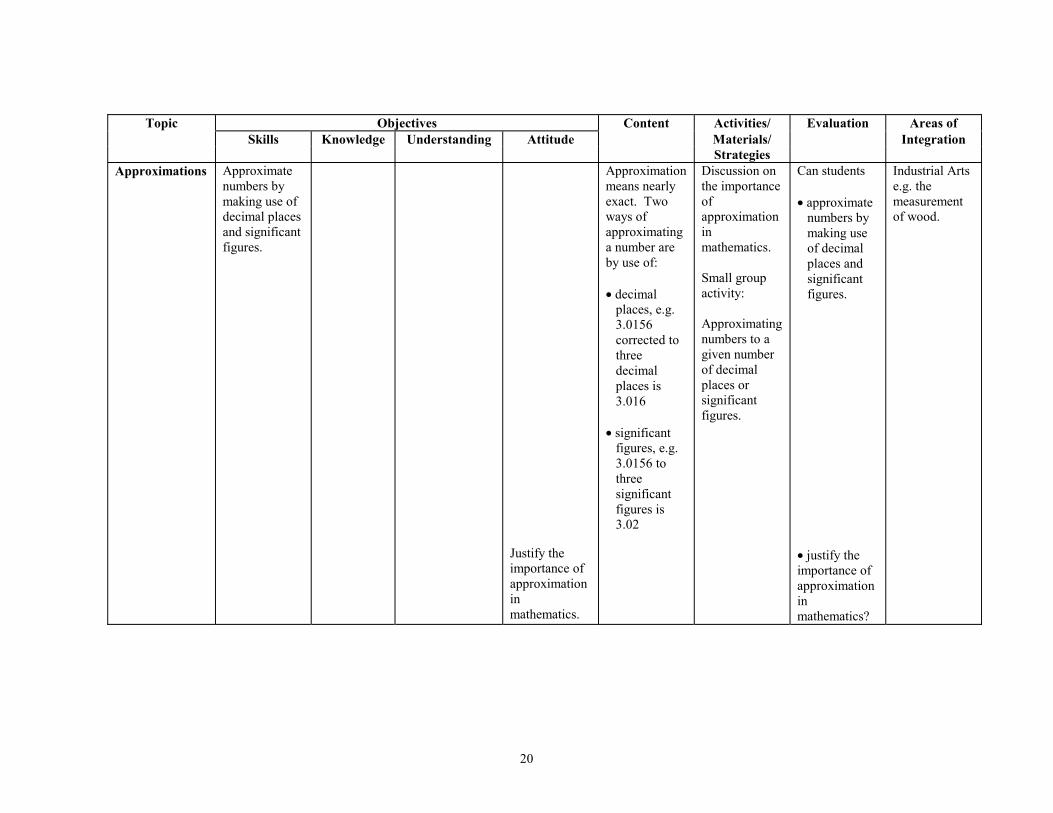
Approximations Approximate numbers by making use of decimal places and significant figures.
Justify the importance of approximation in mathematics.
Approximation means nearly exact. Two ways of approximating a number are by use of: � decimal places, e.g. 3.0156 corrected to three decimal places is 3.016 � significant figures, e.g. 3.0156 to three significant figures is 3.02
Discussion on the importance of approximation in mathematics. Small group activity: Approximating numbers to a given number of decimal places or significant figures.
Can students � approximate numbers by making use of decimal places and significant figures. � justify the importance of approximation in mathematics?
Industrial Arts e.g. the measurement of wood.
20

Topic Objectives Content Activities/ Evaluation Areas of
Skills Knowledge Understanding Attitude Materials/ IntegrationStrategies
Squares Use the table of squares to find the squares of large numbers.
Calculate thesquares of numbers without the use of tables or calculators.
Acquire confidence in calculating the squares of numbers accurately.
When a number is multiplied by itself, the result is the square of the number, e.g. 2 � 2 = 4 The table of squares gives the squares of numbers between 0 and 100. The following guidelines can be used for finding the squares of numbers larger than 100: 164.4 = 1.64 � 102
(164.4)2 = (1.64)2 � 102 � 102 = 2.69 � 104 = 26 900
Have students calculate squares of given numbers by multiplying each number by itself. Demonstrate how the table of squares can be used to find the squares of large numbers. Have students use the table of squares to find the squares of large numbers.
Can students calculate the squares of numbers without the use of tables or calculators? Have students acquired confidence in calculating the squares of numbers accurately? Can students use the table of squares to find the squares of large numbers?
Industrial Arts, e.g. the calculation of the area of square shapes.
21

Topic Objectives Content Activities/ Evaluation Areas of
Skills Knowledge Understanding Attitude Materials/ Integration Strategies
Accept theuse of tables to find the squares of large numbers.
Do studentsaccept the use of tables to find the squares of large numbers?
Square Roots Calculate thesquare roots of numbers that are perfect squares.
The square root of 36 is 6 because 6 � 6 = 36, also
36 = 6 The symbol that represents the square root of a number is�.
Have students calculate the square roots of numbers that are perfect squares
Can students � find the square roots of numbers that are perfect squares?
Use square root tables to find the square root of any number.
The table of square roots gives the square root of numbers from 1 to 99. The following guidelines can be used for finding the square root of numbers greater than 100 and less than 1 456 = 4.56 � 102
456 = 56.4
� 100 = 2.14 � 10 = 21.4
Demonstrate how to use the table of square roots to find the square root of numbers greater than 100. Have students use the table of square roots to find the square root of numbers greater than 100.
� use square root tables to find the square root of any number?
Environmental Education, e.g. using square root tables to find the square root of numbers in problem solving situations.
22
Topic Objectives Content Activities/ Evaluation Areas of
Skills Knowledge Understanding Attitude Materials/ Integration Strategies
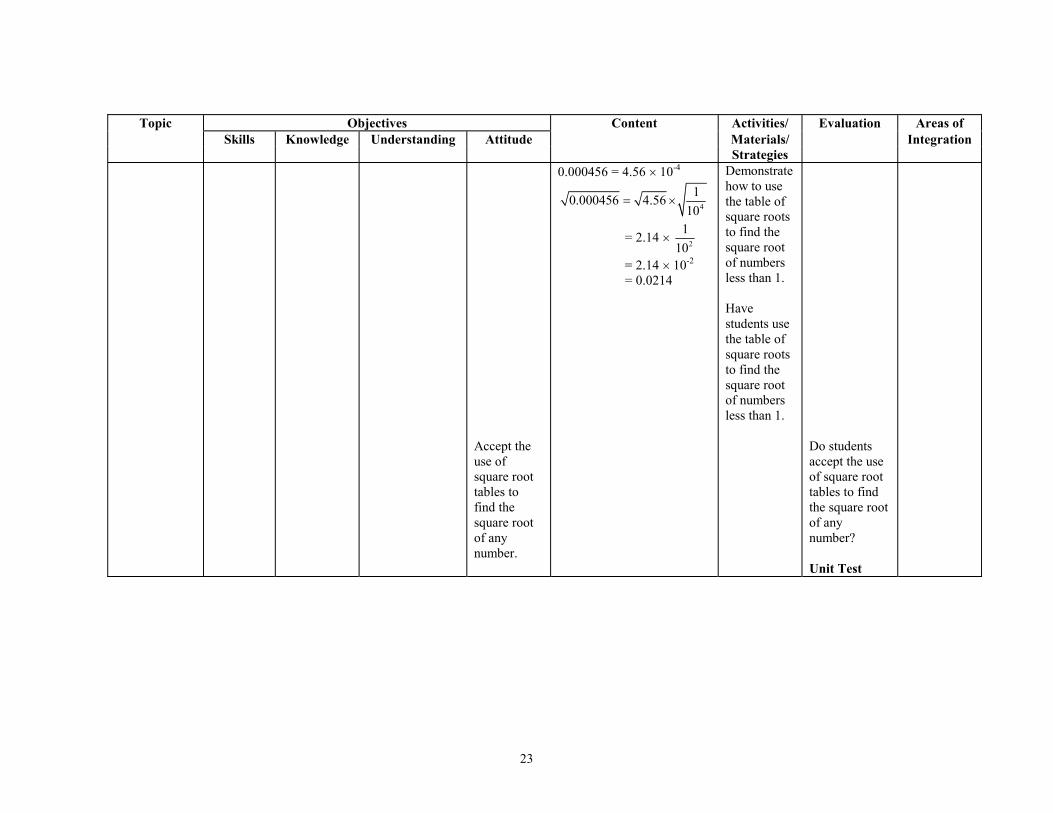
Accept the use of square root tables to find the square root of any number.
0.000456 = 4.56 � 10-4
4
10.000456 4.5610
� �
= 2.14 � 2
110
= 2.14 � 10-2 = 0.0214
Demonstrate how to use the table of square roots to find the square root of numbers less than 1. Have students use the table of square roots to find the square root of numbers less than 1.
Do students accept the use of square root tables to find the square root of any number? Unit Test
23

MEASUREMENT
Topic Objectives Content Activities/ Evaluation Areas ofSkills Knowledge Understanding Attitude Materials/ Integration
StrategiesPerimeter of Polygons
Calculate theperimeter of a square, rectangle, triangle, parallelogram and trapezium.
Perimeter is the total length around a flat shape.
Small group activities: � Have students measure the sides of their desktops, chalkboard, triangles, squares, etc., and calculate the perimeter. � Let the students derive formulae for perimeter from measurement done. � Have students use the derived formulae to find the perimeter of other shapes. � Project involving the calculation of perimeter.
Can students calculate the perimeter of a square, rectangle, triangle, parallelogram and trapezium?
English Language, e.g. A written explanation of what is perimeter. Industrial Arts: e.g. calculating the perimeter of shapes.
24

Topic Objectives Content Activities/ Evaluation Areas of
Skills Knowledge Understanding Attitude Materials/ IntegrationStrategies
Solve problems involving the calculation of the perimeter of polygons.
Acquire self-confidence in calculating the perimeter of polygons.
Solvingproblems involving the calculation of the perimeter of polygons.
Can students solve problems involving the calculation of the perimeter of polygons? Have students acquired self-confidence in calculating the perimeter of polygons?
Physical Education, e.g. calculating the perimeter of a basket-ball court.
Circumference of Circles
Identify thecircumference of a circle.
Circumferenceis the outside edge of a circle or the perimeter.
Small group activities:
� drawing a circle and naming its parts.
Can student identify the circumference of a circle?
Industrial Arts, e.g. calculating the circumference of a circular shape.
25
Topic Objectives Content Activities/ Evaluation Areas of
Skills Knowledge Understanding Attitude Materials/ IntegrationStrategies
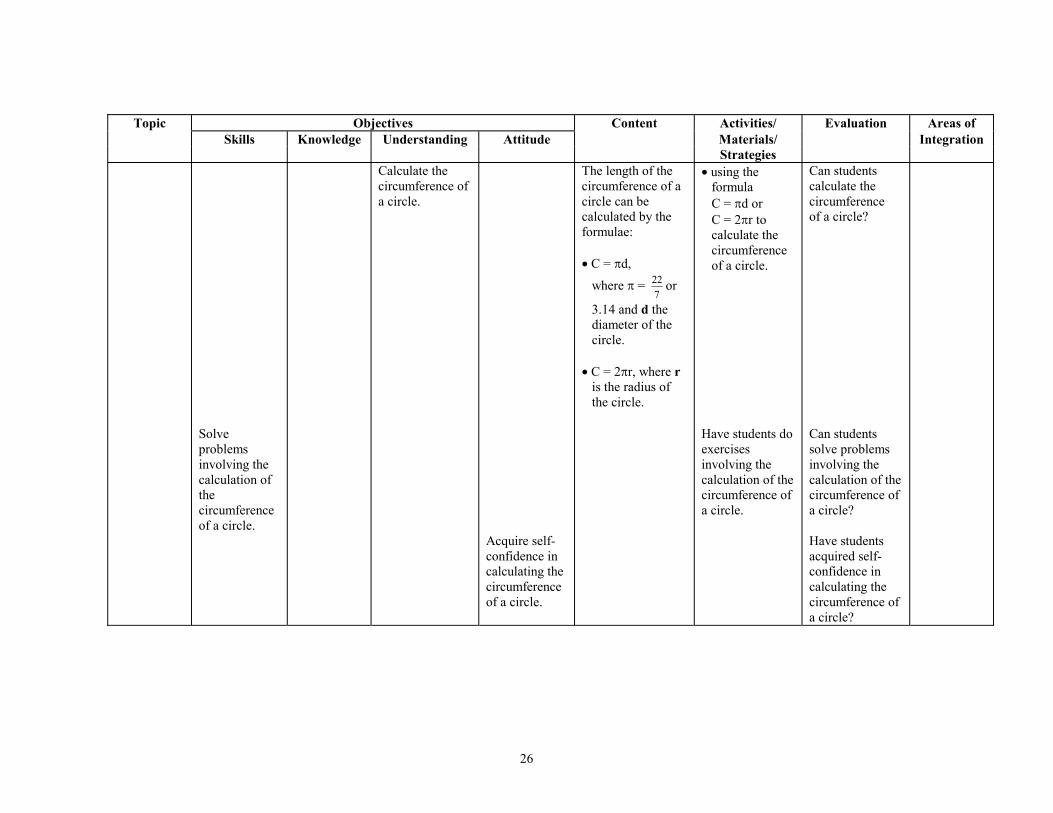
Calculate thecircumference of a circle.
The length of the circumference of a circle can be calculated by the formulae: � C = �d,
where � = 227
or
3.14 and d the diameter of the circle. � C = 2�r, where r is the radius of the circle.
� using the formula C = �d or C = 2�r to calculate the circumference of a circle.
Can students calculate the circumference of a circle?
Solve problems involving the calculation of the circumference of a circle.
Acquire self-confidence in calculating the circumference of a circle.
Have students do exercises involving the calculation of the circumference of a circle.
Can students solve problems involving the calculation of the circumference of a circle? Have students acquired self-confidence in calculating the circumference of a circle?
26

Topic Objectives Content Activities/ Evaluation Areas of
Skills Knowledge Understanding Attitude Materials/ IntegrationStrategies
Areas of Polygons
Calculate thearea of a rectangle. Calculate the area of a parallelogram.
Acquire self-confidence in calculating the areas of rectangles and parallelograms
The area of a rectangle = l � b, where l is the length and b is the breadth. Area of a parallelogram = b � h, where b represents the base and h the perpendicular height.
Small group activities: � calculating the areas of rectangles. � calculating the areas of parallelograms.
Can students calculate the: � area of a rectangle? � area of a parallelogram? Have students acquired self-confidence in calculating the areas of rectangles and parallelograms?
Industrial Arts, e.g. calculation of the area of shapes in the form of a: � rectangle. � parallelogram.
27

Topic Objectives Content Activities/ Evaluation Areas of
Skills Knowledge Understanding Attitude Materials/ Integration Strategies
Calculate thearea of a triangle.
Acquire self-confidence in calculating the areas of triangles.
Area of a triangle
=21 b � h
If the sides of a triangle are given, the area of the triangle =
))()(( csbsass ���
where a, b and c represent the sides of a triangle and s the semi perimeter.
s = 21 (a + b + c)
Small group activities: � calculating the areas of triangles given the length of : - base and height? - each side? Have students acquired self-confidence in calculating the areas of triangles?
Can students calculate the area of a triangle?
Industrial Arts, e.g. calculation of the area of shapes in the form of a triangle.
28

Topic Objectives Content Activities/ Evaluation Areas of
Skills Knowledge Understanding Attitude Materials/ Integration Strategies
Solve problems involving the calculation of the area of polygons.
Calculate thearea of a trapezium. Calculate the surface area of a prism.
Acquire self-confidence in calculating the area of trapeziums and the surface area of prisms.
Area of a trapezium
= 21 (a + b) � h,
where a and b represent the lengths of the parallel sides and h the perpendicular height of the trapezium. The surface area of a prism = Total area of the faces.
Small group activities: � calculating the area of trapeziums � calculating the surface area of prisms Solving problems involving the calculation of the area of polygons.
Can students calculate the: � area of a trapezium? � surface area of a prism? � solve problems involving the calculation of the area of polygons? Have students acquired self-confidence in calculating the area of trapeziums and the surface area of prisms?
Industrial Arts, e.g. � calculation of the area of shapes in the form of a: trapezium. � calculation of the surface area of prisms.
29
Topic Objectives Content Activities/ Evaluation Areas of
Skills Knowledge Understanding Attitude Materials/ Integration Strategies
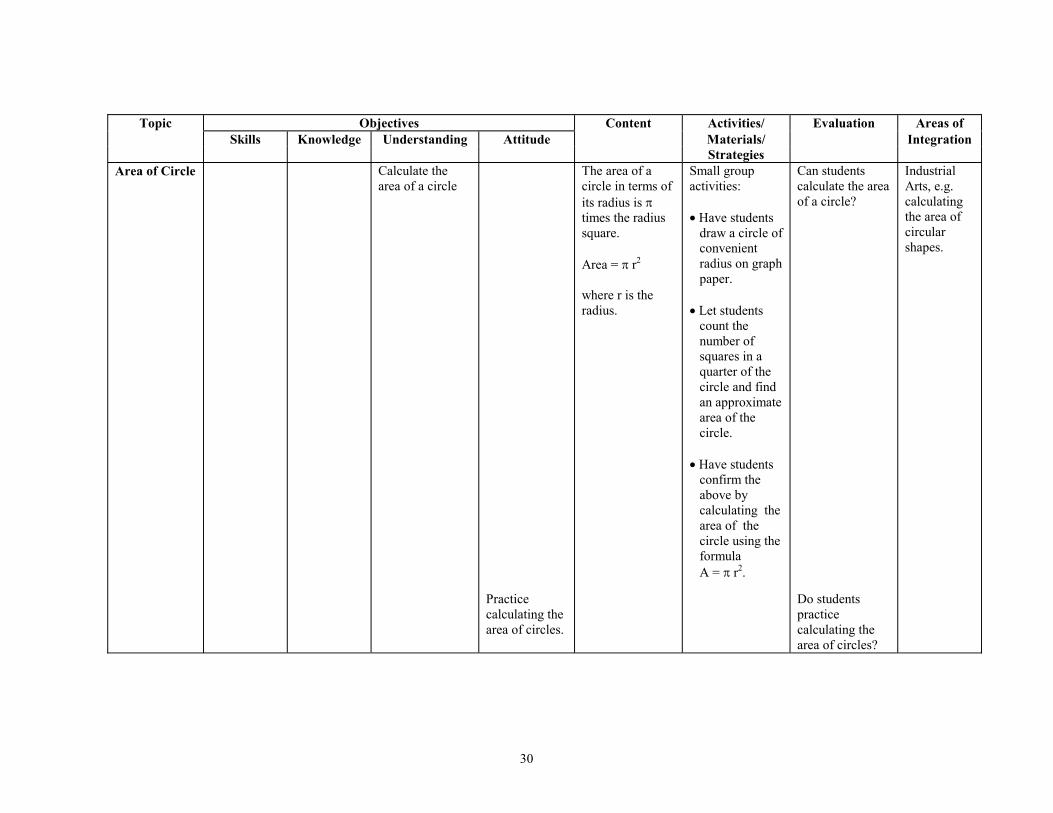
Area of Circle Calculate thearea of a circle
Practice calculating the area of circles.
The area of a circle in terms of its radius is � times the radius square. Area = � r2 where r is the radius.
Small group activities: � Have students draw a circle of convenient radius on graph paper. � Let students count the number of squares in a quarter of the circle and find an approximate area of the circle. � Have students confirm the above by calculating the area of the circle using the formula A = � r2.
Can students calculate the area of a circle? Do students practice calculating the area of circles?
Industrial Arts, e.g. calculating the area of circular shapes.
30

Topic Objectives Content Activities/ Evaluation Areas of
Skills Knowledge Understanding Attitude Materials/ IntegrationStr
Scale Drawing Use scales to calculate actual areas.
RepresentativeFractions (RF) usually give the scale of large objects. A Representative Fraction =
size of drawing size of object Both the numerator and denominator of the fraction must be in the same units, e.g. when 1 cm on the drawing represents 5 km on the object, then the size of drawing = 1 cm and the size of object = 5 km = 500 000 cm.
R.F. = 1500000
= 1:500 000
Small group activities: � Measuring the classroom or play- field. � Finding suitable Representative Fractions. � Calculating actual areas using the following guidelines: - Writing down the scale in the form of a ratio or Representative Fraction. - Checking that the numerator and denominator of the fraction are in the same units. - Squaring both parts of the ratio or fraction.
Can students use scales to calculate actual areas?
Industrial Arts, e.g. the reduction or enlargement of the area of plane figures by a given ratio. Social Studies e.g. map reading.
ategies
31
Topic Objectives Content Activities/ Evaluation Areas of
Skills Knowledge Understanding Attitude Materials/ IntegrationStr
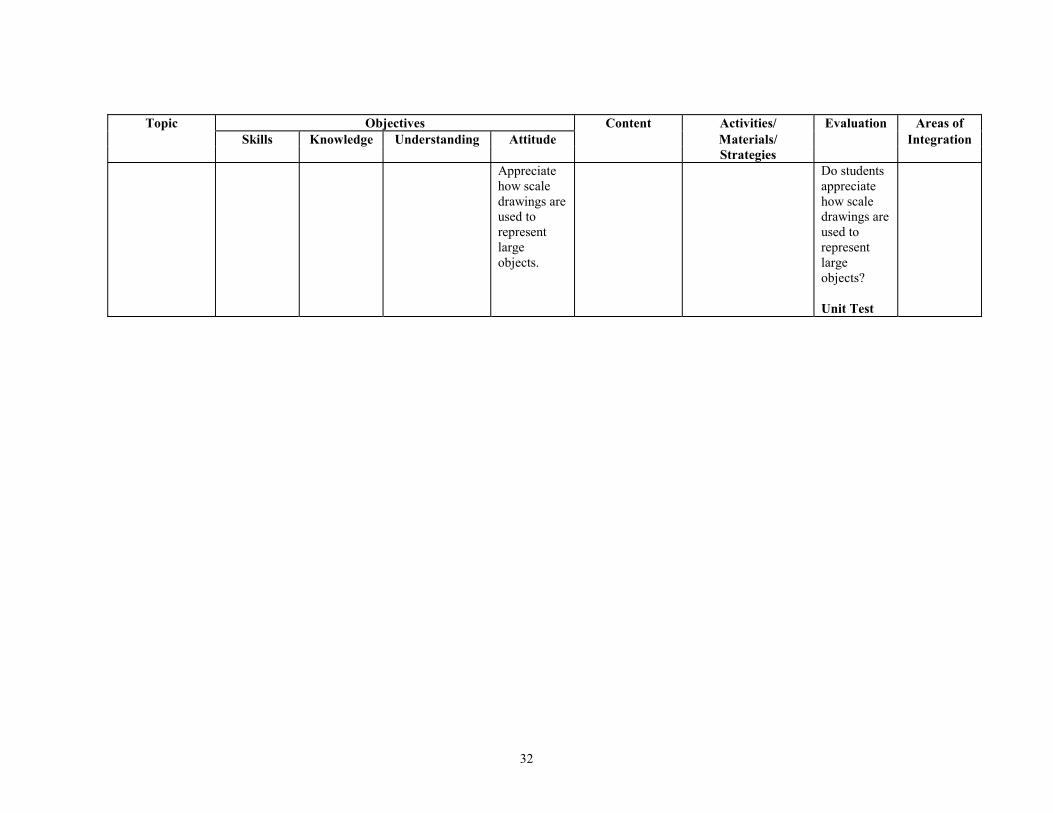
Appreciatehow scale drawings are used to represent large objects.
Do studentsappreciate how scale drawings are used to represent large objects? Unit Test
ategies
32

ALGEBRA 1
Topic Objectives Content Activities/ Evaluation Areas ofSkills Knowledge Understanding Attitude Materials/ Integration
StrategiesIndices Apply the
rules of indices to manipulate algebraic expressions with positive integral, negative integral and fractional indices.
Differentiate between positive integral, negative integral and fractional indices.
Rules of indices: 1) xa � xb = xa+b 2) xa � ya = (xy)a 3) xa xb = xa-b 4) (xa)b = xab
5) x-a = ax
1
6) (yx )-a = (
xy )a
7) xa/b = b ax 8) x0 = 1
Small group activity: Applying the rules of indices to simplify algebraic expressions with positive integral, negative integral and fractional indices.
Can students: � apply the rules of indices to simplify algebraic expressions with positive integral, negative integral and fractional indices? � differentiate between positive integral, negative integral and fractional indices?
Environmental Education, e.g. Applying the rules of indices to simplify algebraic expressions with positive integral, negative integral and fractional indices in problem solving situations.
33

Topic Objectives Content Activities/ Evaluation Areas of
Skills Knowledge Understanding Attitude Materials/ IntegrationStrategies
Simultaneous Equations
Solve word problems using pairs of linear simultaneous equations.
Solve linearsimultaneous equations by the methods of substitution and elimination.
Appreciate that a pair of simultaneous linear equations can be satisfied by a single ordered pair (x, y) Appreciate that word problems can be transformed into equations.
The substitution and elimination methods for solving linear simultaneous equations. The use of pairs of linear simultaneous equations to solve word problems.
Solving pairs of linear simultaneous equations by the methods of substitution and elimination. Using pairs of linear simultaneous equations to solve word problems.
Can students solve pairs of linear simultaneous equations by the methods of substitution and elimination? Do students appreciate that a pair of simultaneous linear equations can be satisfied by a single ordered pair (x, y) Can students use pairs of linear simultaneous equations to solve word problems? Do students appreciate that word problems can be transformed into equations?
Environmental Education, e.g. solving pairs of linear simultaneous equations in problem solving situations.
34

Consumer Arithmetic
Topic Objectives Content Activities/ Evaluation Areas ofSkills Knowledge Understanding Attitude Materials/ Integration
StrategiesDiscounts Calculate
discount.
When stores have sales they often reduce prices. The amount by which the original price is reduced is called discount. Discount is often expressed as a percentage of the original price. E.g. a discount of 20% is the same as 80% of the original price.
Have students collect newspaper clippings of advertisements offering discounts. Discussion on discounts and sales. Have students ‘role-play’ on sales situations to lead to an understanding that ‘discounts’ are reduction in prices. Transform the classroom into a shopping MART – make believe business that offers discounts. Project in which students are required to interview vendors/ Shop-keepers to determine why discounts are given and how prices are adjusted to cater for the discount prices.
Drama, e.g. role play. English Language, e.g. the writing of a report on class project. Social Studies e.g. a class visit to a nearby shopping centre.
35

Topic Objectives Content Activities/ Evaluation Areas of
Skills Knowledge Understanding Attitude Materials/ Integration Strategies
Solve word problems involving the calculation of discount.
Calculate sale price. Calculate rate of discount.
Discuss discount. .
Calculation of discount Calculation of sale price when percentage discount is stated. Calculation of the rate of discount given the original and reduced prices.
Calculating: � discount � sale prices when percentage discount is given. � the rate of discount when the original and reduced prices are given.
Are students willing to discuss discount? Can students calculate: � sale price? � rate of discount? � solve word problems involving the calculation of rate of discount?
Problem solving situations.
Sales Tax and Income Tax
Calculate salestax.
Acquire an awareness of our civil responsibilities to pay taxes.
Sales tax is a tax collected by government on goods purchased.
Invite a resource person to explain how sales tax is implemented.
Can students calculate sales tax?
English Language, e.g. oral or written explanation on how government tax is collected.
36

Topic Objectives Content Activities/ Evaluation Areas of
Skills Knowledge Understanding Attitude Materials/ Integration Strategies
Calculate the rate of sales tax.
Calculation of the rate of sales tax. E.g. An electric cooker costs $10 000 and has a sales tax of $500. Calculate the rate of sales tax. Rate of Sales Tax =
(10000
500 � 100)%
= 5% Rate is given in terms of percentage.
Small group activities: Have students: � construct cardboard price tags for items with sales tax added. E.g. Cost + Sales tax = Amount paid for an item. � Calculate the amount inclusive of sales tax to be fixed to an item. Calculating the rate of sales tax.
Can students: � calculate the amount inclusive of sales tax to be fixed to an item. � calculate the rate of sales tax?
Everyday problem solving situations. Social Studies, e.g. emphasising the importance of sale taxes.
37

Topic Objectives Content Activities/ Evaluation Areas of
Skills Knowledge Understanding Attitude Materials/ Integration Strategies
Calculate taxesfrom instructions:
Acquire a willingness to pay taxes in the future.
� Income tax � Custom tax
Accept the need to be careful with income and expenditure.
Calculation of income and other taxes according to instructions.
Small group activities: � Listing types of taxation. E.g. Sales Tax, Income Tax, Custom Duty. � Examining and discussing individual Income Tax Returns. � Calculating taxes from given instructions. � Project on how taxes are collected in Guyana.
Can students calculate taxes from instructions? Do students accept the need to be careful with income and expenditure?
Social Studies e.g. examining the benefit of taxes.
Cost Price & Selling Price
Calculate: � Cost Price � Selling Price
Cost Price = Selling Price – Profit Selling Price = Cost Price + Profit
Discussion on cost price and selling price. Calculating cost price and selling price.
Can students calculate: � cost price? � selling price?
English Language, e.g. oral or written explanations on cost price, selling price, profit and loss.
38

Topic Objectives Content Activities/ Evaluation Areas of
Skills Knowledge Understanding Attitude Materials/ Integration Strategies
Solve word problems involving the calculation of cost price, selling price percentage profit and percent loss.
Calculate percentage profit or loss when cost price and selling price are given.
Profit = Selling Price – Cost Price Loss = Cost Price – Selling Price Percent Profit =
iceCost ProfitPr
� 100%
Percent Loss =
iceCost PrLoss
� 100%
Simulating business transactions involving profit and loss. Calculating percent profit or loss when cost price and selling price are given.
Can students calculate percentage profit or loss when cost price and selling price are given? Can students Solve word problems involving the calculation of cost price, selling price percentage profit and percent loss? Unit Test
Drama, e.g. role playing business transactions involving profit and loss. Everyday problem solving situations. Everyday problem solving situations.
39

Geometry 1
Topic Objectives Content Activities/ Evaluation Areas ofSkills Knowledge Understanding Attitude Materials/ Integration
StrategiesTranslation
Carry out a translation.
Describe a translation.
A translation is a movement, sometimes called a glide of an object from one point to another, e.g. the sliding of a book across a table. When an object under goes a translation its shape and size remains unchanged. The co-ordinates of a point are normally written in row form, e.g. (x, y). A translation vector is written in column form, e.g.
xy
� ��� �
� , where x is the
horizontal displacement and y is the vertical displacement.
Describing the translation of line segments in terms of distance moved in the x-direction and distance moved in the y-direction. Writing the co-ordinates of the point (x, y) after a given translation.
Can students : � describe a translation? � carry out a translation?
Industrial Arts e.g. moving objects from one place to the other.
40

Topic Objectives Content Activities/ Evaluation Areas of
Skills Knowledge Understanding Attitude Materials/ Integration Strategies
Follow themovement of the translation of an object.
Can studentsfollow the
movement of the translation of an object?
Reflection Carry out reflections in the x and y-axes.
Aware of reflections in the x and y-axes.
When a reflection is carried out: � the object and its image are at equal distances from the mirror line or line of reflection. � the line joining the object and its image is perpendicular to the mirror line. � Points on the mirror line remain unchanged. � The object and its image are on opposite sides of the mirror line.
Small group activities: � Folding a piece of paper along a mirror line and by pricking with a pin, form any shape on the folded paper. � Opening the paper, joining the points and looking at the shapes, students discuss their observations.
Are students aware of reflections in the x and y-axes?
41

Topic Objectives Content Activities/ Evaluation Areas of
Skills Knowledge Understanding Attitude Materials/ Integration Strategies
Carry out reflections in the co-ordinate plane about any axis.
� Reflection of points in the x-axis, e.g. (x, y) � (x, -y) � Reflection of points in the y -axis, e.g. (x, y) � (-x, y) � Reflection of points in any axis.
� Reflecting given points on a co-ordinate plane in the x-axis and writing down the co-ordinates of the images. � Reflecting given points on a co-ordinate plane in the y-axis and writing down the co-ordinates of the images. � Plotting given points on a co-ordinate plane, joining the points and finding the images of these shapes after reflection in an axis other than the x or y axis, e.g. the lines: - y = x - y = -x - any line parallel to the x or y-axis.
Can students: � carry out reflection of points in the x and y-axes? � Carry out reflection of points in the co-ordinate plane about any axis?
English Language, e.g. writing a paragraph to explain the reflection of points in an axis.
42

Topic Objectives Content Activities/ Evaluation Areas of
Skills Knowledge Understanding Attitude Materials/ Integration Strategies
Follow theimages of reflection in: � the x-axis � the y-axis � any axis
Successive reflections in two parallel mirror lines are equivalent to a translation.
Do studentsfollow the images of reflection in: � the x-axis � the y-axis � any axis? Unit Test
43

Relations & Functions 1
Topic Objectives Content Activities/ Evaluation Areas ofSkills Knowledge Understanding Attitude Materials/ Integration
StrategiesRelations & Functions
Identify afunction.
Aware of a function.
When a relation is a function, as: � an arrow diagram, one and only one arrow leaves each member of the domain. � a set of ordered pairs, no two ordered pairs have the same first element, e.g. (2, 4), (4, 1), (7, 1) � a graph, if vertical lines pass through only one point.
Small group activities: � Observing and discussing the various forms of representing functions. � Identifying similarities or common features of functions. � Applying the vertical line test.
Are students aware of functions?
Social Studies, e.g. Drawing graphs.
44

Topic Objectives Content Activities/ Evaluation Areas of
Skills Knowledge Understanding Attitude Materials/ Integration Strategies
Linear Functions
Identifylinear functions.
Differentiate between linear relations and linear functions.
Aware of linear functions.
Functions whose points lie on the same straight line are called linear functions. Linear relations and linear functions in the form of: � sets of ordered pairs � points plotted � graphs
Demonstration and discussion on linear functions. Drawing graphs of sets of ordered pairs and identifying those that are linear functions.
Are students aware of linear functions? Can students differentiate between linear relations and linear functions?
Social Studies, e.g. Drawing graphs.
Functional Notation
Interpret functional notation.
Symbols can be used to describe a function, e.g. f: x � 3x + 2 means that f is a function such that x is mapped onto 3x + 2.
Representing a relation using the notation: x � 3x +2: 0 2 1 5 2 8 3 11
Can students interpret functional notation?
English Language, e.g. oral interpretations of functional notation.
45

Topic Objectives Content Activities/ Evaluation Areas of
Skills Knowledge Understanding Attitude Materials/ Integration Strategies
Use functional notation to find solutions to problems.
Aware of the various forms of functional notation.
The function f: x� 3x + 2 can be expressed as f(x) = 3x + 2 or y = 3x + 2 The use of functional notation to find solutions to problems, e.g. using f: x � 3x +2 to find the element in the range for 3 in the domain. f(x) = 3x + 2, then f(3) = 3(3) + 2 = 11 The range for 3 under f(x) is 11. This can be written as an ordered pair, e.g. (3, 11)
Let students deduce the fact that the symbol f can be used to represent functions. E.g. we can have f(x) � 3x + 2 or f: x � 3x + 2 or when expressed as an equation y = 3x + 2 Writing the elements in the range of functions given the domain and vice versa.
Are students aware of the various forms of functional notation? Can students use functional notation to find solutions to problems?
Environmental Education, e.g. using functional notation in problem solving situations.
46

Topic Objectives Content Activities/ Evaluation Areas of
Skills Knowledge Understanding Attitude Materials/ Integration Strategies
The set ordered pairs: {(0, 2), (1, 5), (2, 8), (3, 11)} that expresses the function f: x � 3x + 2 can be written in the form of a table, e.g.
x 0 1 2 33x 0 3 6 93x + 2 2 5 8 11f(x) 2 5 8 11
Completing a table and using functional notation to state the rule that was applied.
The graph of a Linear Function
Construct the graph of a linear function.
A function such as y = 3x + 2 is called a linear equation. When plotted on a graph all points on the line will satisfy the equation y = 3x + 2. The co-ordinates of any point will satisfy the rule y = 3x + 2. The function y = 4 is a linear function in which all the points along the line have y-co ordinate equal to 4. The equation of the line is y = 4.
Show students that a convenient way to find ordered pairs is to solve the given equation for ‘y’ before making replacements for x, e.g. 3x + 2y = 6
y = 2� 36 x
Let students examine the graph of this equation.
Can students construct the graph of a linear function?
47

Topic Objectives Content Activities/ Evaluation Areas of
Skills Knowledge Understanding Attitude Materials/ Integration Strategies
Appreciate the neatness and accuracy in the construction of graphs of linear functions.
When plotting the graph of a linear function, at least three ordered pairs should satisfy the rule of the function.
Have students plot the points of linear functions and by taking a ruler or any straight edge, let them observe that the points, when joined, form a straight line.
Do students appreciate the neatness and accuracy in the construction of graphs of linear functions? Unit Tests
48

Statistics
Topic Objectives Content Activities/ Evaluation Areas ofSkills Knowledge Understanding Attitude Materials/ Integration
StrategiesMean Calculate the
mean of a set of values.
Acquire confidence in calculating the mean of a set of values.
The mean is found by adding the values of all data entries and dividing this sum by the total number of data entries. E.g. the mean of 2, 4, 6, 8, 10 is
5���� 108642 =
530
= 6
Discussion: Citing situations in which the mean is used, e.g. cricket. Small group activities: � Have students calculate the mean of given numbers. � Have students calculate the mean age of group members. � Have students collect data and calculate the mean.
Can students calculate the mean of a set of values? Have students acquired confidence in calculating the mean of a set of values?
Agriculture Science, e.g. calculation of the mean (average) of daily milk production of a particular breed of cattle.
49

Topic Objectives Content Activities/ Evaluation Areas of
Skills Knowledge Understanding Attitude Materials/ IntegrationStrategies
Construct frequency tables from given information.
Practice constructing frequency tables.
A Frequency Table lists classes or categories of values along with frequencies of the number of values that falls within each class. It is a way of summarising a large amount of data. E.g.
x Tally f f � x 1 111 3 3 2 11 2 43 1111 1 6 18
11 25 In the table above, x represents the scores, f the frequency and
the sum. �
Small group activities: � Have students set out given data in a regular pattern, e.g. 1, 2, 3, 4 … � Have students check the number of times each item occurs. � Have students construct a frequency table to show the data.
Can students construct frequency tables? Do students practice constructing frequency tables?
Social Studies e.g. the construction of frequency tables to show given data.
�
50
Topic Objectives Content Activities/ Evaluation Areas of
Skills Knowledge Understanding Attitude Materials/ Integration Strategies
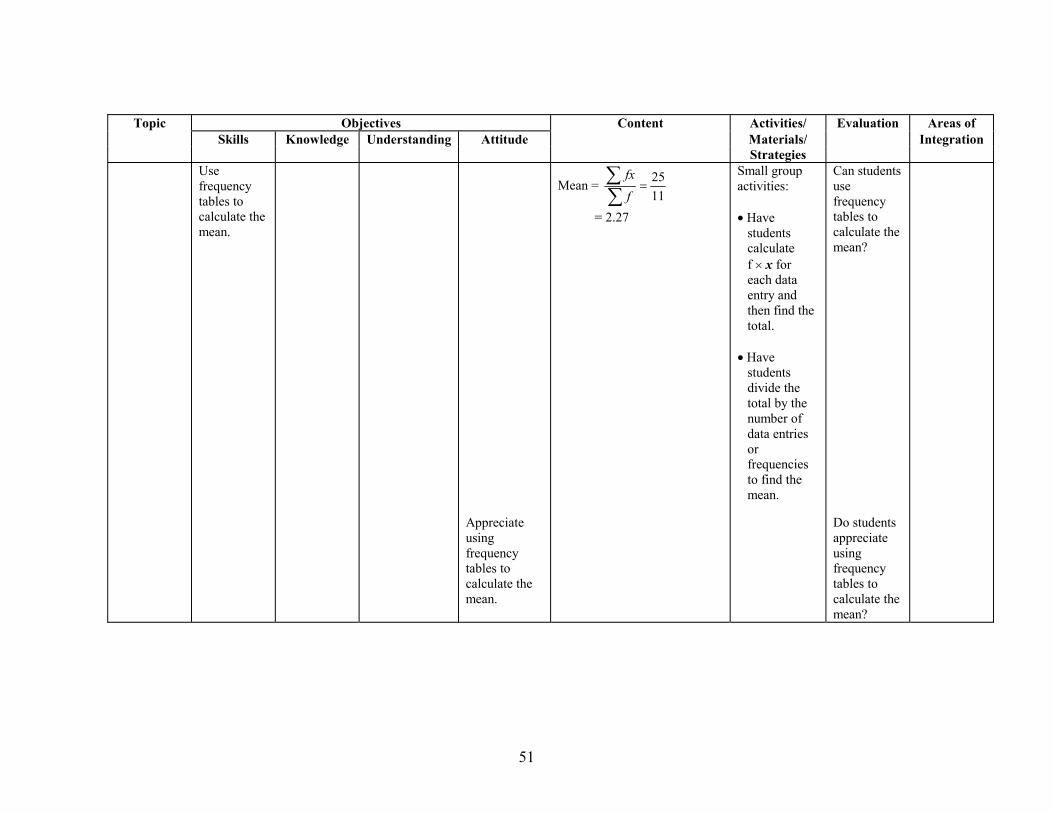
Use frequency tables to calculate the mean.
Appreciate using frequency tables to calculate the mean.
Mean = 1125
�
��
ffx
= 2.27
Small group activities: � Have students calculate f � x for each data entry and then find the total. � Have students divide the total by the number of data entries or frequencies to find the mean.
Can students use frequency tables to calculate the mean? Do students appreciate using frequency tables to calculate the mean?
51

Topic Objectives Content Activities/ Evaluation Areas of
Skills Knowledge Understanding Attitude Materials/ Integration Strategies
The Median Determine themedian of a given set of data:
� when the number of items is odd. � when the number of items is even.
Select the median from a given set of data.
When the number of entries is odd the median is the middle value, e.g. the median of 12, 13, 14, 15, 16 is 14. When the number of entries is even, the median is obtained by finding the mean of the two middle values, e.g. the median of
2, 4, 6, 8, 10, 12 is 72
86�
�
The median of a given set of data cannot be specified if the data is not measured numerically.
Forming lines of odd number of students and have them identify the one that is in the middle. Have students record the ages of their class-mates and determine the median age. Students can then discuss/compare the mean age with the median age. Discussion on the advantages and disadvantages of the median.
Can students determine the median of a given set of data � when the number of items is odd? � when the number of items is even? Can students select the median from a given set of data?
Social Studies, e.g. finding the median age of a group of subjects.
52

Topic Objectives Content Activities/ Evaluation Areas of
Skills Knowledge Understanding Attitude Materials/ Integration Strategies
Mode Determine themode of a given set of values.
Aware of the mode of a set of values.
Mode is an average. It is the value that occurs with the greatest frequency, e.g. in the set of values: 3, 4, 6, 4, 9, 4, 6, 3, 2, the mode is 4. When the values are all different, e.g. 10, 11, 12, 13, 14, there is no mode. When the values are the same, e.g. 1, 1, 1 or 9, 9, 9, 9, there is no mode. When there are two or more values as modes, the data is said to be bi-modal, e.g. 2, 2, 4, 5, 5, 6, 7, 8, 8...The values 2, 5 and 8 are modes.
Using bar charts to identify the mode. Discussion on the advantages/ disadvantages and usefulness of the mode. Constructing frequency tables and finding the mode.
Can students determine the mode of a given set of values? Are students aware of the mode of a set of values?
English Language e.g. a discussion on the advantages /disadvantages and usefulness of the mode of a set of values.
53

Topic Objectives Content Activities/ Evaluation Areas of
Skills Knowledge Understanding Attitude Materials/ Integration Strategies
Class Intervals
Recogniseclass intervals. Identify: � discrete data � continuous data
Accept the importance of class intervals in the organisation of data.
Frequency Table:
x Tally f0 - 9 11 2
10 –19 111 3 20 - 29 1111
111 8
In the table above, the class intervals are: 0 – 9, 10 – 19, 20 – 29, etc. Discrete data refer to definite known values that can be identified, e.g. 0, 7, 15 or shoe
sizes: 4, 6, 8, 1021 etc.
Data collection, e.g. the scores of 40 students on a test. Discussion on a suitable size for class intervals. Arranging data into class intervals.
Can students recognise class intervals? Do students accept the importance of class intervals in the organisation of data?
Social Studies, e.g. arranging data into class intervals.
54

Topic Objectives Content Activities/ Evaluation Areas of
Skills Knowledge Understanding Attitude Materials/ Integration Strategies
Differentiatebetween discrete and continuous data. Determine: class boundaries.
Discrete data takes exact values, e.g. the number of trials necessary in order to pass a driving test. These can only take discrete values such as 1, 2, 3, etc. Continuous data refers to data that have no exact values. These values usually arise from situations that involve measuring, e.g. the masses of four men: 74.2 kg, 67.4 kg, 57.7 kg, 70.4 kg. These can take values along a continuum. In discrete data the lower class boundary of a class interval is the lowest value that an item in the class interval can have, e.g. in the class interval 10 -19, the lower value is 9.5. The upper boundary of a class interval is the highest value that an item in a class interval can have, e.g. in the class interval 10 – 19, the upper boundary is 19.5.
Presenting students with different types of data and have them differentiate between the discrete and continuous data. Ask students to calculate the number half way between 9 and 10. This is 9.5 Let students recognise that 9.5 is the lower boundary for the class interval 10 - 19.
Can students � differentiate between discrete and continuous data? � determine class boundaries?
55
Topic Objectives Content Activities/ Evaluation Areas of
Skills Knowledge Understanding Attitude Materials/ Integration Strategies
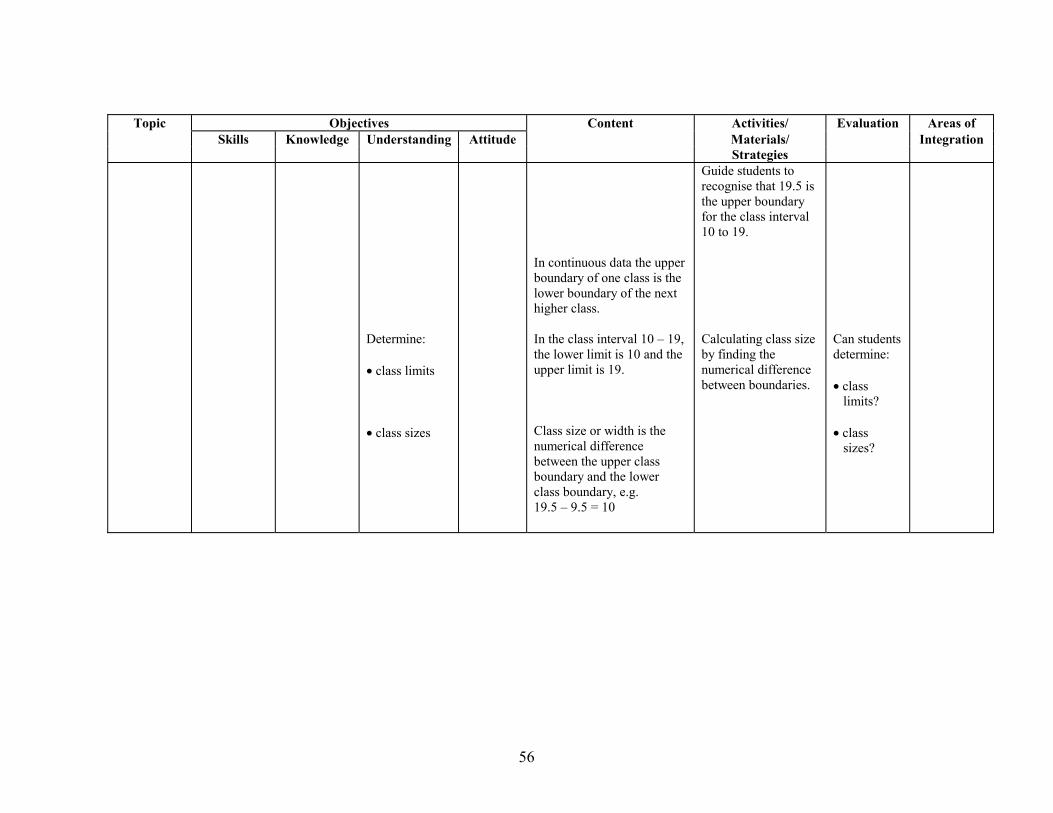
Determine: � class limits � class sizes
In continuous data the upper boundary of one class is the lower boundary of the next higher class. In the class interval 10 – 19, the lower limit is 10 and the upper limit is 19. Class size or width is the numerical difference between the upper class boundary and the lower class boundary, e.g. 19.5 – 9.5 = 10
Guide students to recognise that 19.5 is the upper boundary for the class interval 10 to 19. Calculating class size by finding the numerical difference between boundaries.
Can students determine: � class limits? � class sizes?
56
Topic Objectives Content Activities/ Evaluation Areas of
Skills Knowledge Understanding Attitude Materials/ Integration Strategies
Histogram and Frequency Polygon
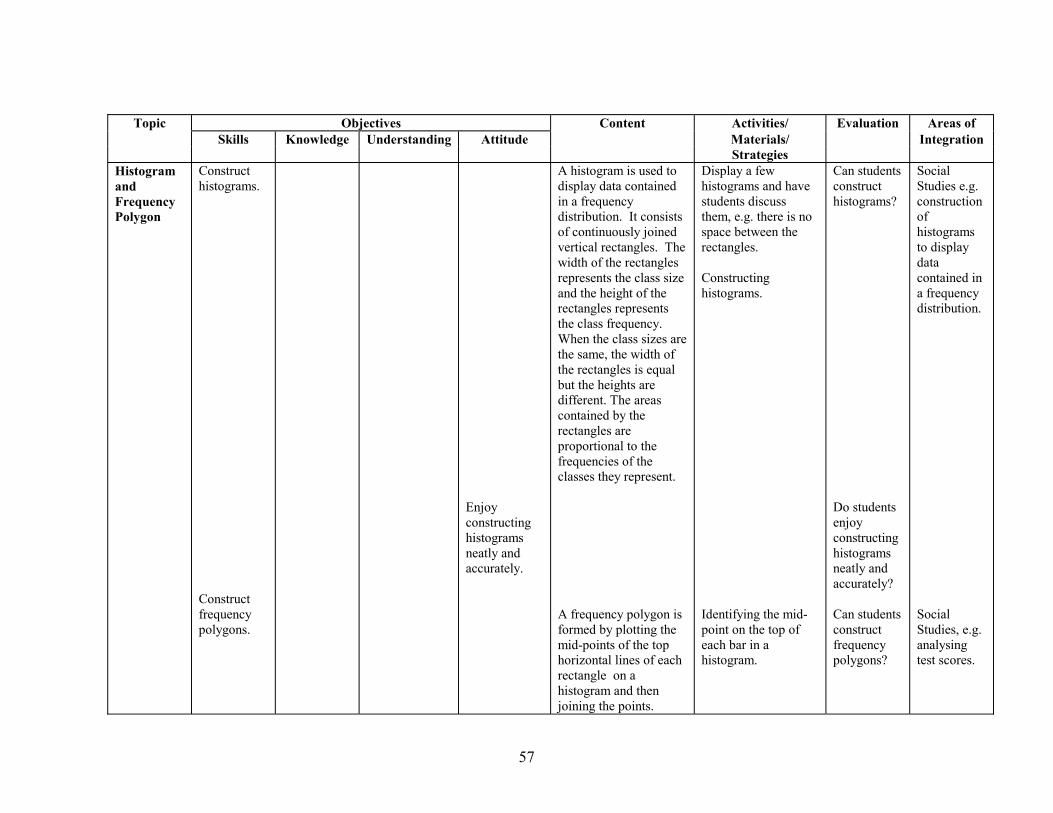
Construct histograms. Construct frequency polygons.
Enjoy constructing histograms neatly and accurately.
A histogram is used to display data contained in a frequency distribution. It consists of continuously joined vertical rectangles. The width of the rectangles represents the class size and the height of the rectangles represents the class frequency. When the class sizes are the same, the width of the rectangles is equal but the heights are different. The areas contained by the rectangles are proportional to the frequencies of the classes they represent. A frequency polygon is formed by plotting the mid-points of the top horizontal lines of each rectangle on a histogram and then joining the points.
Display a few histograms and have students discuss them, e.g. there is no space between the rectangles. Constructing histograms. Identifying the mid-point on the top of each bar in a histogram.
Can students construct histograms? Do students enjoy constructing histograms neatly and accurately? Can students construct frequency polygons?
Social Studies e.g. construction of histograms to display data contained in a frequency distribution. Social Studies, e.g. analysing test scores.
57

Topic Objectives Content Activities/ Evaluation Areas of
Skills Knowledge Understanding Attitude Materials/ Integration Strategies
Obtain satisfaction in constructing frequency polygons neatly and accurately.
Inserting dotted lines to join the mid-point on the top of each rectangle. Have students construct frequency polygons using scores as data. Let students show an empty interval at the end of each distribution and draw the polygon down to the mid-point of each empty interval.
Do students Obtain satisfaction in constructing frequency polygons neatly and accurately? Unit Test
58

Algebra 2
Topic Objectives Content Activities/ Evaluation Areas ofSkills Knowledge Understanding Attitude Materials/ Integration
StrategiesFactorisation Factorise expressions
of the form: � a2 – b2 � ax2 + bx + c, where a, b and c are integers.
An expressionrepresenting the difference of two squares can be expressed as the product of two factors: e.g. a2 – b2 = (a – b)(a + b) Expressions of the form ax2 + bx + c are called quadratic expressions because the highest power of the unknown is 2. Examples of quadratic expressions are : x2 + 5x + 6 2x2 + 5x + 2 To factorise such expressions, we can re-write them as expressions of four terms.
Illustrate with examples the difference of two squares. Discussion on the factorisation of 2x2 + 5x + 2 along the following guidelines: � Multiplying the coefficient of x2 by 2 i.e. 2 � 2 = 4 � Writing the factors of 4 i.e.
1 and 4 2 and 2 4 and 1
� Summing the factors of 1 and 4 i.e. 5 � Re-write 2x2 + 5x + 2 as 2x2 + x + 4x + 2 = x(2x + 1) + 2(2x + 1) = (2x + 1)(x + 2)
Can students factorise expressions of the form: � a2 – b2 � ax2 + bx + c, where a, b and c are integers.
Problem solving situations.
59
Topic Objectives Content Activities/ Evaluation Areas of
Skills Knowledge Understanding Attitude Materials/ Integration Strategies
Changing the Subject of the Formula
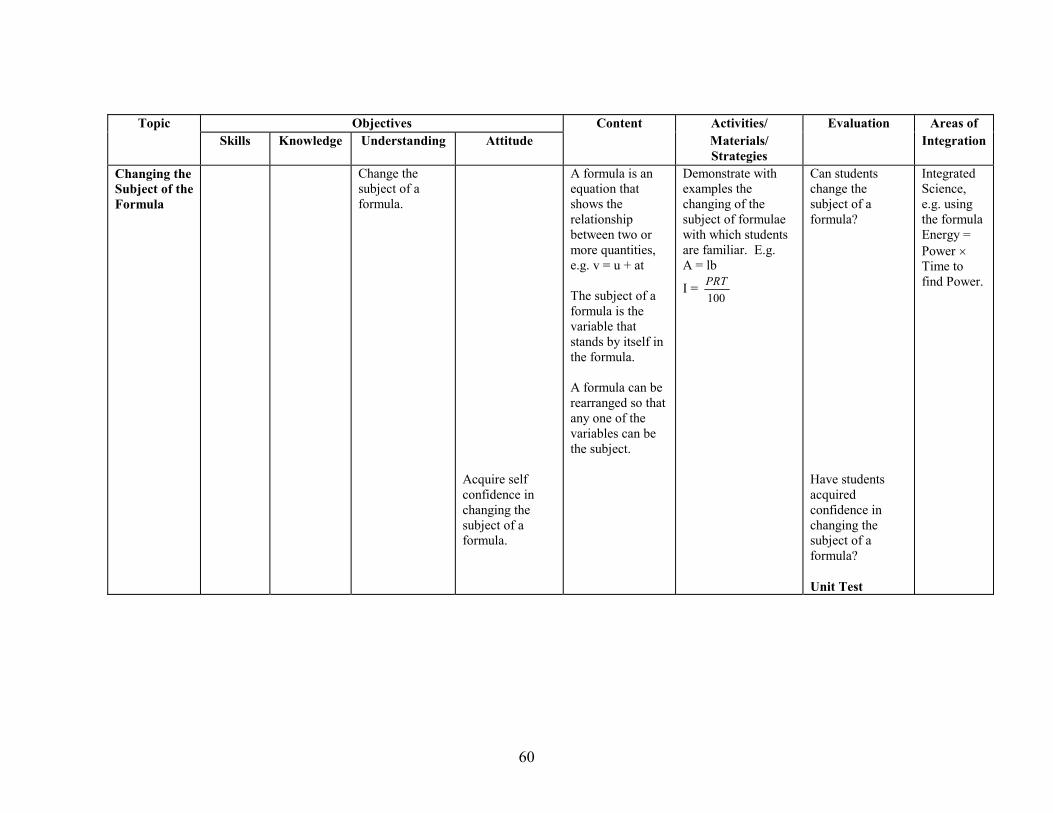
Change thesubject of a formula.
Acquire self confidence in changing the subject of a formula.
A formula is an equation that shows the relationship between two or more quantities, e.g. v = u + at The subject of a formula is the variable that stands by itself in the formula. A formula can be rearranged so that any one of the variables can be the subject.
Demonstrate with examples the changing of the subject of formulae with which students are familiar. E.g. A = lb
I = 100PRT
Can students change the subject of a formula? Have students acquired confidence in changing the subject of a formula? Unit Test
Integrated Science, e.g. using the formula Energy = Power � Time to find Power.
60

Consumer Arithmetic
Topic Objectives Content Activities/ Evaluation Areas ofSkills Knowledge Understanding Attitude Materials/ Integration
StrategiesHire Purchase
Calculate : � monthly instalments on hire purchase. � interest rates on hire purchase.
Hire purchase involves a loan with interest repayments. In a hire purchase arrangement the customer pays more than the cash price for the article. Calculations:
� deposits � instalments � interest rates
Small group activities: A visit to stores that offer the hire purchase plan or have students use the advertisement from news papers relating to hire purchase offers to calculate: � interest as a percentage of cost price. � total amount paid, i.e. deposit plus instalments. � interest paid, i.e. subtracting cash
price from total amount paid. � the interest rate:
R=TP �
�I 100 ,
where R is the interest rate, I the interest, P the principal and T the time.
Can students calculate: � monthly instalments on hire purchase? � interest rates on hire purchase?
Business Studies e.g. Hire Purchase arrangements.
61

Topic Objectives Content Activities/ Evaluation Areas of
Skills Knowledge Understanding Attitude Materials/ Integration Strategies
Compare cashpayments against hire purchase payments.
Can studentscompare cash payments against hire purchase payments?
Mortgages Calculatemortgages. Calculate deposits on mortgages. Calculate total mortgage repayments. Calculate the interest on mortgages.
Mortgage is a claim on property as security for a loan from a bank or person with provision that the money is repaid within an agreed time. Calculation of mortgages. Calculation of deposits on mortgages. Calculation of total mortgage repayments. Calculation of interest on mortgages.
Use the hire purchase method to introduce the concept of mortgage. Collecting information from a bank on mortgages Calculating mortgages. Calculating deposits on mortgages. Calculating total mortgage repayments. Calculating interest on mortgages.
Can students calculate: � mortgages? � deposits on mortgages? � total mortgage repayments? � interest on mortgages?
Business Studies, e.g. the calculation of mortgages.
Calculatemonthly payments on mortgages.
Calculation of monthly payments on mortgages.
Calculating monthly payments on mortgages.
� calculate monthly payments on mortgages?
62

Topic Objectives Content Activities/ Evaluation Areas of
Skills Knowledge Understanding Attitude Materials/ Integration Strategies
Acquire selfconfidence in doing calculations involving mortgages accurately.
Have studentsacquired self confidence in doing calculations involving mortgages accurately?
Compound Interest
Calculatecompound interest.
In compound interest, the interest for one year is added to the principal for that year, the total (principal + interest) becomes the principal for the next year. The interest changes each year, as the yearly interest is added. This method pays a higher amount than simple interest.
Discussion on compound interest. Solving simple problems on compound interest dealing with loan repayments.
Can students calculate compound interest?
63

Topic Objectives Content Activities/ Evaluation Areas of
Skills Knowledge Understanding Attitude Materials/ Integration Strategies
Acquire self-confidence in calculating compound interest.
When calculating compound interest over a number of years, it is useful to use the compound interest formula:
A = P(1 + 100
r )n,
where A represents the amount, P the principal, r the rate percent and n the number of years.
Discussion on the formula
A = P(1 + 100
r )n
Calculating compound interest using the compound interest formula
Have students acquired self-confidence in calculating compound interest?
64

Topic Objectives Content Activities/ Evaluation Areas of
Skills Knowledge Understanding Attitude Materials/ Integration Strategies
Depreciation Calculatedepreciation of an item. Calculate appreciation of an item.
Acquire self -confidence in calculating the depreciation value of an item. Acquire self -confidence in calculating the depreciation and appreciation value of an item.
Depreciation is the reduction in the value of assets. Appreciation is the increase in the value of assets.
Reducing the value of an item by stated amounts over a number of years, e.g. cost of calculator = $2000. Depreciation after first year = $100 Value of calculator at the beginning of the second year = $2000 - $100 = $1900 Using given percentages to calculate the depreciation of an article over a number of years. Calculating the appreciation or the increase in the value of an item over a number of years.
Can students Calculate: � depreciation of an item? � appreciation of an item? Have students acquired self -confidence in calculating the depreciation and appreciation value on an item?.
Business studies, e.g. Calculation of the depreciation of assets.
65

Topic Objectives Content Activities/ Evaluation Areas of
Skills Knowledge Understanding Attitude Materials/ IntegrationStrategies
Ready Reckoners
Use ready reckoners to calculate: � cost of an item. � amount earned at compound interest. � monthly instalments on hire purchase arrangements.
. Sometimes theresult of a computation can be obtained from a table constructed specially for the purpose. Such a table is called a ready reckoner.
Discussion on what is a ready reckoner and the use of ready reckoners.
A ready reckoner is useful for doing calculations quickly. Use of ready reckoners to calculate: � cost price of an item given the unit cost. � amount earned at compound interest given the rate and time. � monthly instalments on hire purchase arrangements.
A few ready reckoners should be in the classroom for viewing by students. Constructing ready reckoners. Using ready reckoners to calculate: � cost price of items given the unit cost. � amount earned at compound interest given the rate and time � monthly instalments on hire purchase arrangements.
Can students use ready reckoners to calculate: � cost of an item? � amount earned at compound interest? � monthly instalments on hire purchase arrangements?
Accounts, e.g. the use of ready reckoners to calculate the cost of items.
66

Topic Objectives Content Activities/ Evaluation Areas of
Skills Knowledge Understanding Attitude Materials/ IntegrationStrategies
Enjoy using readyreckoners to do calculations.
Do studentsenjoy using ready reckoners to do calculations? Unit Test
67

Geometry 2
Topic Objectives Content Activities/ Evaluation Areas ofSkills Knowledge Understanding Attitude Materials/ Integration
StrategiesPythagoras Theorem
StatePythagoras theorem.
Accept Pythagoras theorem.
Pythagoras Theorem states that in any right-angled triangle the square on the hypotenuse is equal to the sum of the squares on the other two sides. A c b B a C In the right angled triangle above, c2 = a2 + b2
c = 2 2a b� Pythagorean triples satisfy Pythagoras Theorem. Examples are: {3, 4, 5} {5, 12, 13} {8, 15, 17}
Have students draw on graph paper a right-angled triangle whose sides are 3 cm, 4 cm and 5 cm. Have students draw a square on each side of the triangle and find their areas. Discuss findings and have students formulate a rule from the findings. Have students investigate other Pythagorean triples as a Project. Do students accept Pythagoras theorem?
Can students state Pythagoras theorem?
68

Topic Objectives Content Activities/ Evaluation Areas of
Skills Knowledge Understanding Attitude Materials/ IntegrationStrategies
Apply Pythagoras Theorem to calculate the length of an unknown side of a right-angled triangle.
Accept the application of Pythagoras Theorem to calculate the length of an unknown side of a right-angled triangle.
Application of Pythagoras theorem.
Have students calculate the length of the unknown sides of given right-angled triangles.
Can students apply Pythagoras Theorem to find the length of an unknown side of a right-angled triangle? Do students accept the application of Pythagoras Theorem to calculate the length of an unknown side of a right-angled triangle?
69

Topic Objectives Content Activities/ Evaluation Areas of
Skills Knowledge Understanding Attitude Materials/ IntegrationStrategies
Similar Triangles
Identify similartriangles and shapes State the properties of similar triangles and shapes.
Calculate the length of the unknown sides of similar triangles.
Triangles andother shapes are similar if:
Display examples of similar triangles and.
� their corresponding angles are equal. � their corresponding sides are in the same ratio. The symbol for similarity is ~
shapes Have students measure the sides and angles of cardboard shapes that are similar and verify the properties for similar shapes, e.g. triangles ABC and XYZ,
YZBC
XZAC
XY��
AB
XA ��� YB ��� ZC ���
Can students: � identify similar triangles and shapes? � state the properties of similar triangles and shapes ? � calculate the length of the unknown sides of similar triangles?
Industrial Arts, e.g. Joinery.
70

Topic Objectives Content Activities/ Evaluation Areas of
Skills Knowledge Understanding Attitude Materials/ Integration Strategies
Angles in a circle
Identify thesector of a circle. Identify the segment of a circle.
Aware of the sector of a circle. Aware of the segment of a circle.
Sector: the part of the circle bounded by two radii and an arc. Segment: the part of the circle bounded by a chord and an arc.
Have students locate a sector of a circle on a circular geoboard. Have students locate a segment of a circle on a circular geoboard.
Can students: � identify the sector of a circle? � identify the segment of a circle? � are students aware the sector of a circle? � are students aware of the segment of a circle?
Technical Drawing e.g. � drawing the sector of a circle. � drawing the segment of a circle.
71
Topic Objectives Content Activities/ Evaluation Areas of
Skills Knowledge Understanding Attitude Materials/ IntegrationStrategies
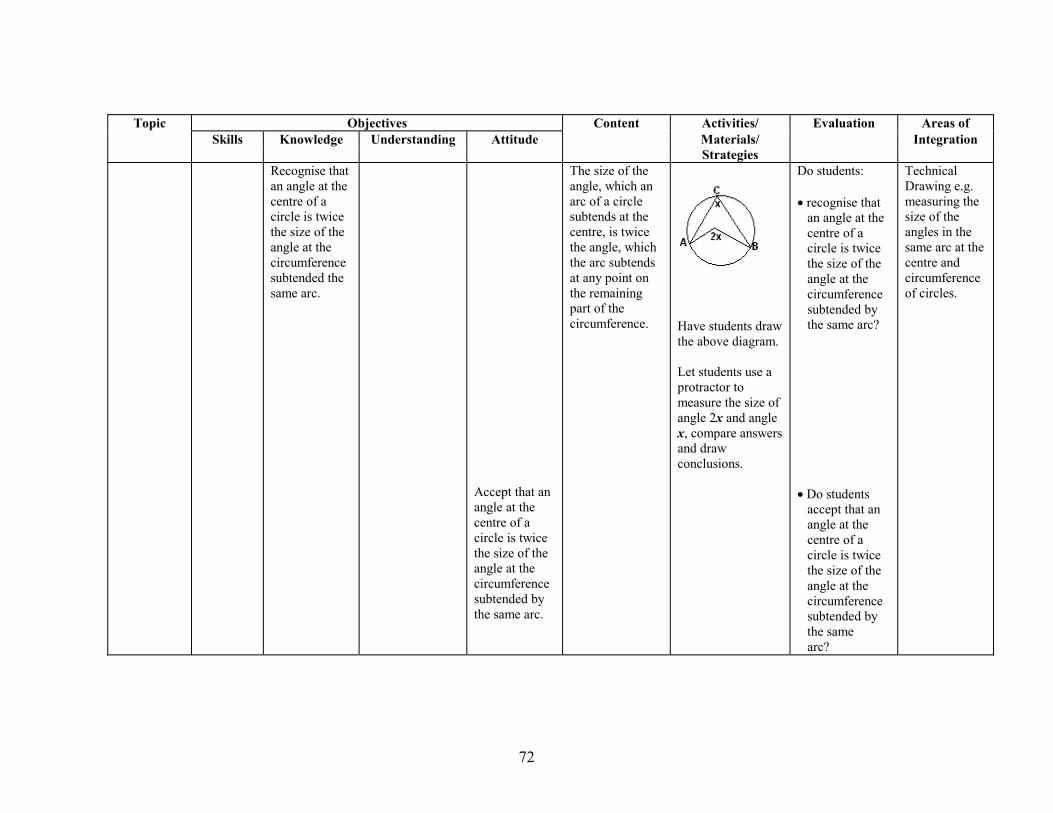
Recognise thatan angle at the centre of a circle is twice the size of the angle at the circumference subtended the same arc.
Accept that an angle at the centre of a circle is twice the size of the angle at the circumference subtended by the same arc.
The size of the angle, which an arc of a circle subtends at the centre, is twice the angle, which the arc subtends at any point on the remaining part of the circumference.
Have students draw the above diagram. Let students use a protractor to measure the size of angle 2x and angle x, compare answers and draw conclusions.
Do students: � recognise that an angle at the centre of a circle is twice the size of the angle at the circumference subtended by the same arc? � Do students accept that an angle at the centre of a circle is twice the size of the angle at the circumference subtended by the same arc?
Technical Drawing e.g. measuring the size of the angles in the same arc at the centre and circumference of circles.
72

Topic Objectives Content Activities/ Evaluation Areas of
Skills Knowledge Understanding Attitude Materials/ IntegrationStrategies
Recognise thatthe angle in a semi circle is a right angle. Recognise that angles in the same segment of a circle are equal.
Accept that angles in a semi circle are right angles. Accept that angles in the same segment of a circle are equal.
The angle in a semi circle is a right angle. Angles is the same segment of a circle are equal.
Have students construct a triangle in a semi circle using the diameter as the base. Let students measure the angle in the semi circle with a protractor and compare results. Have students draw angles in the same segment of a circle. Let students measure the angles with a protractor and compare results.
Do students recognise that the angle in a semi circle is a right angle? Do students accept that angles in a semi circle are right angles? Do students recognise that angles in the same segment of a circle are equal? Do students accept that angles in the same segment of a circle are equal?
73

Topic Objectives Content Activities/ Evaluation Areas of
Skills Knowledge Understanding Attitude Materials/ Integration Strategies
Tangent Properties of a Circle
Draw a tangent to a circle.
Recognise the tangent properties of a circle.
A tangent is a line that touches the circumference of a circle at one point only. The point is called the point of contact or point of tangency. The tangent is always perpendicular to the radius of the circle. Tangent properties: � If two circles touch internally or externally, then the line that passes through their centres also passes through the point of tangency. � A tangent to a circle is perpendicular to the radius drawn through the point of tangency.
Demonstrate how to draw tangents to a circle. Let student draw tangents to circles. Demonstration and discussion involving the tangent properties of a circle. Use diagrams during demonstration.
Can students draw a tangent to a circle?
Technical Drawing e.g. drawing a tangent to a circle.
74

Topic Objectives Content Activities/ Evaluation Areas of
Skills Knowledge Understanding Attitude Materials/ Integration Strategies
� If two tangents are drawn from a point outside the circle, then the: - tangents are equal.
- tangents make equal angles with the chord joining the points of tangency.
- a line passing through the centre of a circle and the external point bisects the angle between the tangents.
� The angle between a tangent to a circle and a chord drawn from the point of tangency is equal to one-half the angle at the centre of the circle subtended by the chord.
75

Topic Objectives Content Activities/ Evaluation Areas of
Skills Knowledge Understanding Attitude Materials/ Integration Strategies
Willing todiscuss the tangent properties of circles.
Are students willing to discuss the tangent properties of circles? Unit Test
76

Relations & Functions 2
Topic Objectives Content Activities/ Evaluation Areas ofSkills Knowledge Understanding Attitude Materials/ Integration
StrategiesGradient of a Straight Line
Calculate thegradient of a straight line.
The gradient or slope of a straight line is the change in the vertical distance � the change in the horizontal distance. If P(x1, y1) and Q(x2, y2) are two points on a line, then the gradient of the
line is 12
12
xx �
� yy
Small group activities: � Determining the gradient of straight lines that pass through pairs of points. � Investigating the slope in relation to the size of the gradient.
Can students calculate the gradient of a straight line?
Industrial Arts, e.g. the calculation of gradient of straight lines.
When the gradient of a line is positive, the line rises from left to right. When the gradient of a line is negative, the line descends from left to right. The gradient of a horizontal line is zero.
Discussing the direction of a line when the gradient is positive, negative or zero.
77

Topic Objectives Content Activities/ Evaluation Areas of
Skills Knowledge Understanding Attitude Materials/ Integration Strategies
Aware of the gradient of a straight line.
Determining thevalue of an unknown co-ordinate when two points and the gradient are given.
Are students aware of the gradient of a straight line.
Equation of a Straight Line
Write theequation of a straight line in the form y = mx + c.
y = mx + c is an equation of a straight line that cuts the y-axis at the point (0, c) and m is the gradient of the line. E.g. in the equation y = 2x + 3, the gradient is 2 and the line y = 2x + 3 cuts the y axis at the point (0, 3)
Small group activities: � Constructing a table of values for equations of straight lines in the form y = mx + c. � Determining from graphs the x-intercept, y-intercept and gradient of straight lines. � Stating the gradient and y-intercept for given equations of straight lines.
Can students write the equation of a straight line in the form y = mx + c?
78

Topic Objectives Content Activities/ Evaluation Areas of
Skills Knowledge Understanding Attitude Materials/ IntegrationStrategies
Appreciate writing equations of straight lines in the form y = mx + c.
� Writing equations of straight lines given the gradient and y-intercepts. � Writing the equations of lines that pass through pairs of points.
Do students appreciate writing equations straight lines in the form y = mx + c?
Use of Graphs to Solve Linear Simultaneous Equations
Solve linear simultaneous equations graphically.
Use of graphs to solve pairs of linear simultaneous equations. The solution to a pair of linear simultaneous equations lies at the point of intersection of the lines that represent the equations.
Small group activities: � Constructing tables of values for given linear equations. � Checking ordered pairs. � Plotting points and joining them.
Can students solve linear simultaneous equations graphically?
Problem solving situations.
79

Topic Objectives Content Activities/ Evaluation Areas of
Skills Knowledge Understanding Attitude Materials/ IntegrationStrategies
Develop an appreciation for solving simultaneous equations graphically.
� Extending the lines until they intersect. � Writing the co- ordinates of the point of intersection.
Have students developed an appreciation for solving simultaneous equations graphically?
Graphs of Linear Inequalities
Draw graphs of linear inequalities.
Enjoy drawing the graphs of linear inequalities.
Graphs of linear inequalities. The solution set to a linear inequality in two variables is represented by a infinite set of points. The solution set cannot be listed, hence the need for shading.
Drawing graphs of linear inequalities. Shading the regions that represent the solutions.
Can students graph linear inequalities? Do students enjoy drawing the graphs of linear inequalities? Unit Test
80

Introduction to Trigonometry
Topic Objectives Content Activities/ Evaluation Areas ofSkills Knowledge Understanding Attitude Materials/ Integration
StrategiesThe Sine Ratio
Identify thesine ratio.
hyp. opp. � adj In the right-angled triangle above, sin � = side opposite hypotenuse In any right-angled triangle the sine of an angle = side opposite hypotenuse
Presenting students with right angled-triangles in various positions and have them recognise that the sine of any one of the acute angles is side opposite hypotenuse
Can students: � identify the sine ratio?
Select the sine ratio.
� select the sine ratio?
81

Topic Objectives Content Activities/ Evaluation Areas of
Skills Knowledge Understanding Attitude Materials/ IntegrationStrategies
Use tables of natural sines. Apply the sine ratio to find the unknown lengths of sides and the size of angles of a right-angled triangle.
Tables of natural sines Calculation of unknown sides and angles of right-angled triangles.
Given an angle have students use tables of natural sines to find its value. Given the value of the sine, have students use tables of natural sines to find the size of the angle.
Can students use tables of natural sines to find the: � value of a sine ratio given its angle? � size of an angle given the value of its sine? � apply the sine ratio to find the unknown lengths of sides and the size of angles of a right- angled triangle?
Problem solving situations.
82

Topic Objectives Content Activities/ Evaluation Areas of
Skills Knowledge Understanding Attitude Materials/ IntegrationStrategies
Obtainsatisfaction from applying the sine ratio to find the unknown lengths of sides and size of angles of a right-angled triangle.
Do studentsobtain satisfaction from applying the sine ratio to find the unknown lengths of sides and the size of angles of a right-angled triangle?
The Cosine Ratio
Identify thecosine ratio.
hyp. opp. � adj In the right-angled triangle above, cos � = side adjacent hypotenuse In any right-angled triangle the cosine of an angle = side adjacent hypotenuse
Presenting students with right-angled triangles in various positions and have them recognise that the cosine of any one of the acute angles is side adjacent hypotenuse
Can students: � identify the cosine ratio?
Select thecosine ratio.
� select the cosine ratio?
83

Topic Objectives Content Activities/ Evaluation Areas of
Skills Knowledge Understanding Attitude Materials/ IntegrationStrategies
Use tables of natural cosine. Apply the cosine ratio to find the unknown lengths of sides and the size of angles of a right-angled triangle.
Tables of natural cosine Calculation of unknown sides and angles of right-angled triangles
Given an angle have students use tables of natural cosines to find its value. Given the value of the cosine, have students use tables of natural cosines to find the size of the angle.
Can students use tables of natural cosines to find the: � value of a cosine given its angle? � size of an angle given the value of its cosine? � apply the cosine ratio to find the unknown lengths of sides and the size of angles of a right- angled triangle?
Problem solving situations.
84
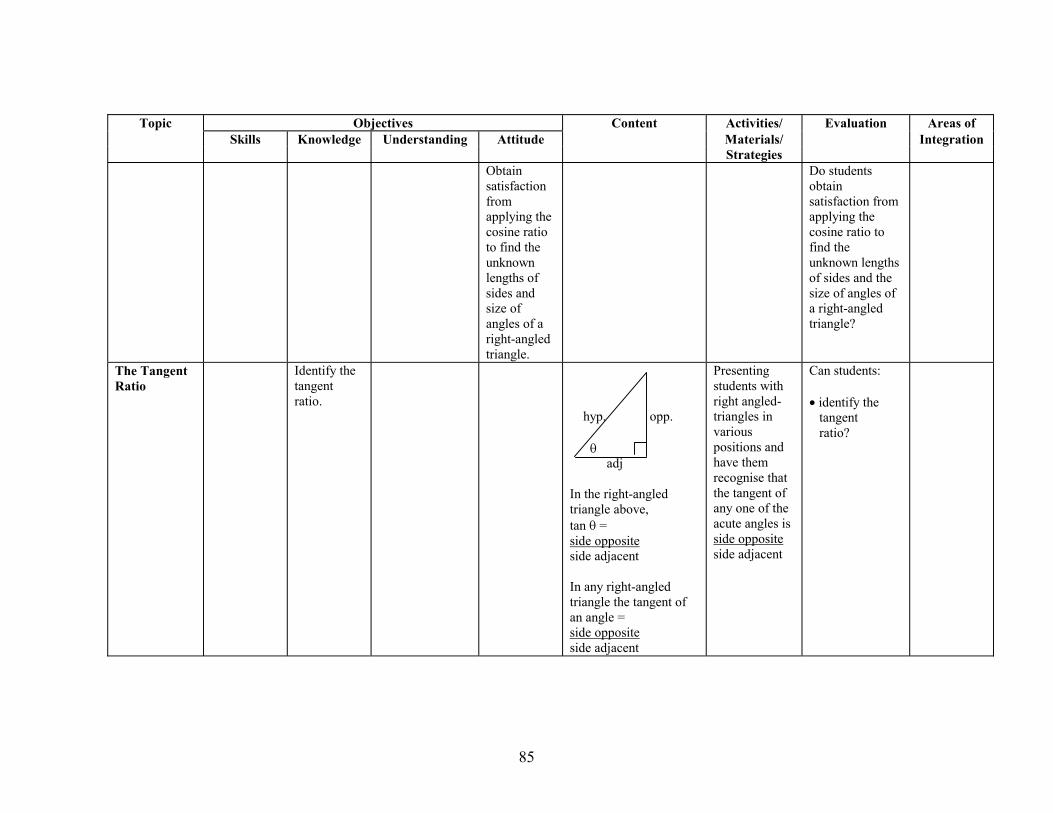
Topic Objectives Content Activities/ Evaluation Areas of
Skills Knowledge Understanding Attitude Materials/ IntegrationStrategies
Obtainsatisfaction from applying the cosine ratio to find the unknown lengths of sides and size of angles of a right-angled triangle.
Do studentsobtain satisfaction from applying the cosine ratio to find the unknown lengths of sides and the size of angles of a right-angled triangle?
The Tangent Ratio
Identify thetangent ratio.
hyp. opp. � adj In the right-angled triangle above, tan � = side opposite side adjacent In any right-angled triangle the tangent of an angle = side opposite side adjacent
Presenting students with right angled-triangles in various positions and have them recognise that the tangent of any one of the acute angles is side opposite side adjacent
Can students: � identify the tangent ratio?
85
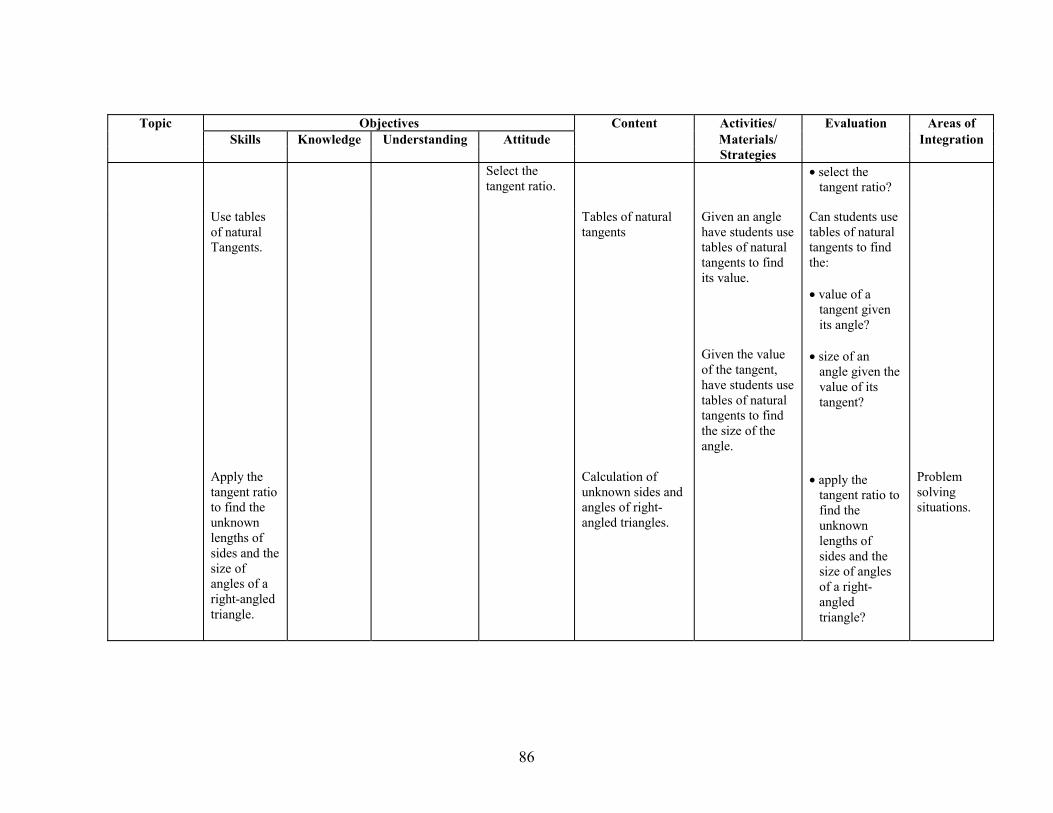
Topic Objectives Content Activities/ Evaluation Areas of
Skills Knowledge Understanding Attitude Materials/ IntegrationStrategies
Select thetangent ratio.
� select the tangent ratio?
Use tables of natural Tangents. Apply the tangent ratio to find the unknown lengths of sides and the size of angles of a right-angled triangle.
Tables of natural tangents Calculation of unknown sides and angles of right-angled triangles.
Given an angle have students use tables of natural tangents to find its value. Given the value of the tangent, have students use tables of natural tangents to find the size of the angle.
Can students use tables of natural tangents to find the: � value of a tangent given its angle? � size of an angle given the value of its tangent? � apply the tangent ratio to find the unknown lengths of sides and the size of angles of a right- angled triangle?
Problem solving situations.
86

Topic Objectives Content Activities/ Evaluation Areas of
Skills Knowledge Understanding Attitude Materials/ IntegrationStrategies
Obtain satisfactionfrom applying the tangent ratio to find the unknown lengths of sides and size of angles of a right-angled triangle.
Do studentsobtain satisfaction from applying the tangent ratio to find the unknown lengths of sides and the size of angles of a right-angled triangle?
Unit Test
87