forging closer asean -china economic relations in the twenty -first century€¦ · ·...
TRANSCRIPT

FORGING CLOSER ASEAN-CHINA ECONOMIC RELATIONS
IN THE TWENTY-FIRST CENTURY
A Report Submitted by the ASEAN-China Expert Group on Economic Cooperation
October 2001

TABLE OF CONTENTS
MAIN REPORT
EXECUTIVE SUMMARY 1
INTRODUCTION 4
CURRENT STATE OF ASEAN-CHINA ECONOMIC RELATIONS 7 ASEAN-CHINA TRADE RELATIONS 7
Structure of ASEAN-China Trade 9 Possible Reasons for Strong Growth 11
FOREIGN DIRECT INVESTMENTS 12 SERVICES 13 FUTURE PROSPECTS 13
SECTION TWO 15
IMPLICATIONS OF CHINA’S ENTRY INTO THE WTO 15 ACCESSION COMMITMENTS OF CHINA TO WTO 15 IMPACT ON THE CHINESE ECONOMY 17 IMPACT OF CHINA’S WTO ACCESSION ON ASEAN 19
Enhanced Market Opportunities 19 Impact on Domestic Markets 20 Impact on Third Country Markets 21
IMPACT ON FDI FLOWS 22 CONCLUSIONS 24
SECTION THREE 25
ENHANCEMENT OF ECONOMIC RELATIONS 25
BETWEEN ASEAN AND CHINA 25 EXISTING TRADE AND INVESTMENT BARRIERS 25 A FRAMEWORK FOR ASEAN-CHINA ECONOMIC RELATIONS 27 FEASIBILITY OF AN ASEAN-CHINA FREE TRADE AREA 30
Economic Benefits and Challenges of an FTA between ASEAN and China 30 Beyond the Economic Benefits of an FTA 32 Possible Timeframe for an ASEAN-China FTA 32
SECTION FOUR 34
CONCLUSIONS AND RECOMMENDATIONS 34
REFERENCES 37

ANNEXES
ANNEX 1: ASEAN MEMBER COUNTRIES NATIONAL REPORTS
BRUNEI DARUSSALAM 38 CAMBODIA 42
INDONESIA 47 LAO PDR 51
MALAYSIA 57 MYANMAR 79
PHILIPPINES 82 SINGAPORE 100
THAILAND 114 VIETNAM 134
ANNEX 2: FEASIBILITY OF A FREE TRADE AREA BETWEEN ASEAN AND CHINA 145

MAIN REPORT

Page 1
EXECUTIVE SUMMARY
1. At their Summit in November 2000, the Leaders of ASEAN and China agreed to look into the implications of China’s accession to the WTO and at measures to further enhance economic cooperation and integration between the two sides, including the possibility of establishing a free trade area (FTA) between ASEAN and China. The decision by the Leaders to look into these two issues was a natural response to a number of important global and regional developments during the course of the past decade. 2. During that period, we have seen the acceleration of the process of globalization, the rise of regional trading arrangements, China’s emergence as a global economic force and the growing interdependence between ASEAN and China. ASEAN-China economic relations have grown dramatically, benefiting from the dynamism of their economies, the liberalization of their trade regimes and the changes in their trade structure. 3. ASEAN-China trade totalled US $39.5 billion in the year 2000. ASEAN’s share in China’s foreign merchandise trade has been continuously on the rise, increasing from 5.8 per cent in 1991 to 8.3 per cent in 2000. ASEAN is now China’s fifth biggest trading partner. Meanwhile, the share of China in ASEAN’s trade has grown from 2.1 per cent in 1994 to 3.9 per cent in 2000. China is now the sixth largest trade partner of ASEAN. 4. The potential for further expanding these trade and investment links is apparent if we consider that despite the rapid growth of ASEAN-China trade, the major markets for their exports continue to be the developed countries. In addition, both ASEAN and China are major destinations for foreign direct investments rather than significant investors in each other’s economy. Both ASEAN and China have also identified existing measures that hamper their trade and investments. If appropriate measures are taken to open up market opportunities, the trade and investment potentials between ASEAN and China could be fully met. 5. In the negotiations of the entry into WTO, China has committed a very comprehensive package of market liberalization measures, which will be implemented immediately after its accession to WTO. The accession to the WTO represents a new stage in China’s economic reform and opening to the outside world, i.e. from selective liberalization to comprehensive liberalization, from unilateral liberalization to WTO rules-based liberalization. China will strictly adhere to all WTO rules and accommodate its domestic laws and regulations with those of the WTO. China’s policy and regulations will become more transparent and accountable. 6. WTO accession will make the Chinese economy more efficient through its integration with the global economy and standardization of management and regulations on an international level. It provides China with an opportunity for improving its technology to accelerate domestic industrial restructuring and to raise the level of Chinese participation in the international division of production. However, China will also meet challenges from foreign competition due to its speedy and comprehensive liberalization.

Page 2
7. China’s entry into WTO will provide new opportunities for ASEAN-China trade relations. We expect expansion in bilateral trade, particularly in such areas as, oil and gas, food, natural resource-based products and agricultural commodities, textiles and clothing, electrical and electronic products, tourism, consulting services, educational services and construction. At the same time, we also noted the possible challenges to ASEAN and China in third country markets as an outcome of the WTO accession of China. 8. The financial crisis, which started in 1997, significantly changed the economic environment of the region for FDI flows. The confidence of foreign investment was significantly eroded by the economic turmoil and social uncertainty. But it is expected that confidence will gradually return with the improvement of ASEAN’s domestic economic environment. 9. The impact of the financial crisis on China appeared to be smaller. The great potential of China’s domestic market was a fundamental impetus for FDI inflows. Now China’s WTO accession has become an additional factor in attracting FDI into China. Great concern has been raised about the impact of FDI flows to China on ASEAN. In the future, as China’s economy gathers strength China’s investment abroad will increase. In fact, investment abroad by Chinese companies is encouraged by the policy of the Chinese government. ASEAN will be a priority market for China’s investment in overseas countries in the future, especially if a closer economic relationship between the two sides could be established. 10. Both sides should now build on the important changes that will take place in China, the momentum of the fast growing economic linkage between ASEAN and China and the challenges posed by globalization. These joint actions must enhance the opportunities arising from China’s accession to the WTO and minimize the negative impacts. They should also reduce and finally eliminate existing barriers to trade and investments. 11. We noted that the establishment of a FTA between ASEAN and China will create an economic region with 1.7 billion consumers, a regional GDP of about US $ 2 trillion and total trade estimated at US $ 1.23 trillion. We believe that the removal of trade barriers between ASEAN and China will lower costs, increase intra-regional trade and increase economic efficiency. The establishment of a ASEAN-China FTA will create a sense of community among ASEAN members and China. It will provide another important mechanism for supporting economic stability in East Asia and allow both ASEAN and China to have a larger voice in international trade affairs on issues of common interest. 12. We recognize that there will be challenges arising from the establishment of a FTA between ASEAN and China. There would be intensified competition in each region’s domestic market given the similarity in industrial structures. There would also be the need for adjustments to be made by enterprises, particularly the small and medium enterprises. The removal of trade barriers would bring with it some loss of tariff revenue. 13. We recommend that ASEAN and China adopt a framework of economic cooperation to forge closer economic relations in the 21st century. The framework we have recommended is both comprehensive and forward-looking. It will not only enhance the current economic links between the two regions, but it will also chart the future direction of those relations. Given the

Page 3
current global economic weakness and the increased risks of a downturn, the adoption of the framework will help shore up confidence, particularly in East Asia, and contribute to counteracting the forces of gloom. 14. The framework of economic cooperation will contain six major elements, some of which could be implemented on an accelerated basis.
14.1 Trade and investment facilitation measures, which include:
§ Enhanced transparency; § Removal of non-tariff barriers; § Liberalization of state-trading rights; § Simplification of customs procedures; § Mutual acceptance of standards and conformity assessment procedures; § Facilitation of visa arrangements to promote the flow of business
personnel; § Conclusion of investment and avoidance of double taxation agreements; § Holding of trade policy and business sector dialogues; § Promotion and facilitation of trade in ICT products, e-commerce, and
adoption of common standards and practices and technological cooperation, so as to raise all countries’ application level; and
§ Promotion of trade in services.
14.2 Provision of technical assistance and capacity building to ASEAN members, particularly to the new members in order to expand their trade with China.
14.3 Positive consideration in the form of promotion measures, consistent with WTO
rules, be given to the non-WTO members of ASEAN. 14.4 Expansion of cooperation in areas such as finance, tourism, agriculture, HRD,
SMEs, industrial cooperation, intellectual property rights, environment, forestry and forestry products, energy and sub-regional development.
14.5 Establishment of an ASEAN-China FTA within ten years, with special and
differential treatment and flexibility given to ASEAN’s new members. 14.6 Establishment of appropriate institutions between ASEAN and China to carry out
the framework of cooperation given its comprehensiveness and the high level of integration to be achieved between ASEAN and China.
15. We are confident that the adoption of this framework of economic cooperation between ASEAN and China will catapult ASEAN-China relations forward and establish a solid foundation for East Asian growth and stability over the years.

Page 4
INTRODUCTION
At their Summit in November 2000, the Leaders of ASEAN and China agreed to look into the implications of China’s accession to the WTO and at measures to further enhance integration and economic cooperation between the two regions, including the possibility of establishing a free trade area. The decision by the Leaders to look into these two issues was a natural response to important global and regional developments during the course of the past decade.
First, there has been a dramatic growth in the number of regional trading arrangements.
In the period 1948-1994, the General Agreement on Tariffs and Trade (GATT), which was the predecessor to the WTO, received 124 notifications of regional trading arrangements (RTAs) relating to trade in goods. But since the creation of the WTO in 1995, 90 additional arrangements covering trade in goods or services have been notified (see Figure 1). These included the North American Free Trade Agreement (NAFTA), Mercado Comun del Sur (MERCOSUR) and the ASEAN Free Trade Area (AFTA). Although not all RTAs notified in the last half century are still in force today, most of the discontinued RTAs have, however, been superseded by redesigned agreements among the same signatories. Out of the total of 214 agreements or enlargements so far notified to the GATT/WTO, 134 are deemed to be currently in force. The emergence of RTAs, particularly among developed countries, constitute an important challenge to ASEAN and China as preferential tariff rates negotiated among RTA members would seriously undermine their comparative advantage.
The second development was the emergence of China as an economic force in the global economic system. Fittingly, its economic emergence would culminate in China’s accession to the World Trade Organization. During the last decade, China’s real GDP growth had averaged 10.1 per cent, the fastest rate of real GDP growth in the world.1 During the same period, China’s exports grew threefold from US $ 62.1 billion in 1990 to US $ 249.2 billion in 2000, making China the seventh largest exporter in the world.2 . In addition, FDI inflows into China had grown more than tenfold from US $ 3.5 billion in 1990 (about 10 per cent of all FDI flows to developing countries) to US $ 40.77 billion in 2000 (17 per cent of all FDI flows to developing countries).3 The dynamism of China’s economy, its rise as a major exporter and as a magnet of FDI was in some sense similar to the experience of a number of ASEAN countries, but it was occurring at a much faster pace and at a much larger scale.
1 International Monetary Fund. World Economic Outlook database. 2 World Trade Organization (2001). Annual Report 2001. (Geneva: World Trade Organization). 3 United Nations Conference on Trade and Development (2001). World Investment Report 2001: Promoting Linkages. (New York and Geneva: United Nations).

Page 5
FIGURE 1
THE NUMBER OF RTAS NOTIFIED EACH YEAR 1948-1999
Source: World Trade Organization The third important development was the financial and economic crisis of 1997, which brought a temporary end to the rapid growth and development of the ASEAN countries and underscored the economic interdependence between ASEAN and China. Up to the mid-90s, real GDP growth was also quite rapid for the ASEAN countries, averaging 6.8 per cent per annum between 1990-97. Total exports were growing rapidly, more than doubling from US $ 144.1 billion in 1990 to US $ 352.6 billion in 1997. In 1990, FDI flows to ASEAN was US $ 12.2 billion (more than 35.5 per cent of all FDI flows to developing countries). By 1997, this had more than doubled to US $ 32.5 billion, although this now represented a smaller share (17.4 per cent to be precise) of all FDI flows to developing countries. But the advent of the financial and economic crisis brought these achievements to a standstill. As a result of the crisis, the ASEAN + China, Japan and Korea process has gained momentum. The Leaders of ASEAN and the three countries of Northeast Asia now meet annually. Drawing from the lessons of the financial contagion of 1997, a network of bilateral swap arrangements, to provide standby credit in the event of balance of payments difficulties are

Page 6
being negotiated among the countries of East Asia. East Asian finance ministers and their deputies are meeting on a regular basis to hammer out the basis of the swap arrangements. Discussions are also now being conducted on a regular basis among the trade ministers of East Asia focused largely on the issue of greater cooperation in trade, investment and information technology. Economic links between ASEAN and China through trade, investments and tourism have prospered throughout the 1990s. Perhaps, equally important, China's maintenance of the value of the renminbi during the economic crisis of 1997, served as a regional anchor preventing what could possibly have been successive rounds of competitive devaluations. This clearly prevented the crisis from becoming more acute for ASEAN countries and yet this put China’s own exports at risk, as much cheaper goods from the crisis-plagued region competed with Chinese goods. The Summit initiative therefore represents a convergence of these developments and underscores the opportunities for economic cooperation between China and ASEAN. For ASEAN, the conduct of this study offers an important chance for deepening links to what is undoubtedly going to continue to be a strong, dynamic economy, particularly with China’s accession to the WTO. As ASEAN comes upon the full realization of AFTA, it runs up against the limits of regional integration. The next step may involve reaching beyond the confines of the South China Sea and moving towards an East Asian destiny. The study is divided into four major sections. The first section reviews the more recent developments of ASEAN-China economic relations. The second section analyses the impact on the Chinese economy of its accession to the WTO and looks at the impact on ASEAN economies, both the benefits and the challenges. The third section proposes a new framework of ASEAN-China economic relations to respond to the challenges facing the two regions and examines the feasibility of an ASEAN-China free trade area. The final section contains some concluding remarks on closer ASEAN-China economic relations.

Page 7
SECTION ONE CURRENT STATE OF ASEAN-CHINA ECONOMIC RELATIONS
ASEAN and China have important and rapidly growing trade and investment relations. The importance of trade with China is particularly true for ASEAN countries with common borders with China – Laos, Myanmar and Viet Nam. However, the bulk of ASEAN and China’s exports are still largely focused on the major markets of the US, Europe and Japan. There is also considerable overlap in the composition of their major export items, particularly in textiles and apparel and other labour-intensive manufactures. As China’s manufacturers climb the technology ladder, the overlap is spilling over into electrical and electronic products, where a number of ASEAN countries had initially established a lead. ASEAN and China are also competing for foreign direct investments in the manufacturing sector. There is little cross-border investments between ASEAN and China, although investors from Southeast Asia have made some important investments in China. As China prepares for accession to the WTO, this competitive relationship is likely to intensify even more. ASEAN will have to build on market opportunities that arise from China’s liberalization efforts as well as the dynamism of the Chinese economy to ensure that economic cooperation can continue to grow and prosper. The initiative by Premier Zhu Rongji for ASEAN and China to study the implications of China’s accession to the WTO and the possibility of establishing a free trade area between the two regions presents an important step forward in seeking to find areas of complementarities, while building on existing strengths.
ASEAN-China Trade Relations
Foreign trade is an important driving force for the economic development of China and ASEAN. In the 1990s, both China and ASEAN achieved high growth rates in foreign trade. During the decade from 1991 to 2000, China’s foreign trade grew at an average annual rate of 15 per cent. In 2000, China’s exports amounted to US $249.2 billion and its imports totalled US $225.1 billion. During the period from 1993 to 2000, ASEAN’s foreign trade grew at an average annual rate of 10.9 per cent, although the rate was lowered during the financial crisis.
In 2000, ASEAN-China trade totalled US $39.5 billion growing by an average of 20.4
percent annually since 1991 when overall trade amounted to only US $ 7.9 billion (see Figure 2). China’s exports to ASEAN grew from US $ 4.1 billion in 1991 to US $ 17.3 billion in 2000 while its imports from ASEAN grew from US $ 3.8 billion in 1991 to US $ 22.2 in 2000.

Page 8
FIGURE 2 ASEAN-CHINA TRADE, 1991-2000
(US $ Millions)
05
1015202530354045
1991 1992 1993 1994 1995 1996 1997 1998 1999 2000
YEAR
US
$ B
ILLI
ON
S
China's Exports China's Imports
Source: Chinese Academy of International Trade and Economic Cooperation. FIGURE 3A FIGURE 3B ASEAN’S SHARE IN CHINA’S TRADE CHINA’S SHARE IN ASEAN’S TRADE 1991-2000 1991-2000
0
2
4
6
8
10
12
Exports Imports
PER
CEN
T
1991 2000
0
1
2
3
4
5
6
Exports Imports
PER
CEN
T
1991 2000
ASEAN’s position in China’s market has been on the rise with its proportion in China’s
total exports increasing from 5.7 per cent in 1991 to 6.9 per cent in 2000 and its proportion in China’s total imports rising from 6 per cent in 1991 to 9.9 per cent in 2000. ASEAN is now China’s fifth biggest trading partner, next only to Japan, the USA, the European Union and Hong

Page 9
Kong. On the other hand, the share of China in ASEAN-64 exports grew from 2.2 per cent in 1993 to 3.14 per cent in 2000 while the share of China in ASEAN-6 imports grew from 1.9 per cent in 1993 to 5.2 per cent in 2000. The relatively small share of China in the trade of the older and more developed ASEAN countries has to be balanced with the appreciation of the importance of China to the border trade of Laos, Myanmar and Viet Nam, all of whom share a common border with China. Anecdotal evidence suggests that it is an important element of the economic relationship of the new ASEAN members5 with China.
There is potential for further growth in these shares given that both regions’ trade are largely oriented to the developed countries. Exports to the US, EU and Japan were 20.5 percent, 16.3 percent and 11.0 percent respectively of ASEAN-6 exports in the year 1999. The three countries also represented 16.3 percent, 12.3 percent and 18.3 percent of ASEAN-6 imports in the year 1999. In the case of China, exports to the US, EU and Japan accounted for 21.5 percent, 15.5 percent and 16.6 percent respectively of its exports in 1999. Structure of ASEAN-China Trade In the early 1990s, the top five ASEAN exports to China were oil and fuel, wood, vegetable oils and fats, computer/machinery and electrical equipment. Collectively, the share of these five products amounted to 75.7 per cent of all ASEAN exports to China.
TABLE 1
STRUCTURE OF ASEAN EXPORTS TO CHINA, 1993, 1999 1993 1999
PRODUCT EXPORTS (US $ Billion)
SHARE PRODUCT EXPORTS (US $ Billion)
SHARE
Lubricants/Fuels/Oil 1.46 32.3% Computer/Machinery 1.94 20.3% Wood 1.03 22.6% Electrical Equipment 1.71 17.9% Fats and Oils 0.38 8.4% Lubricants/Fuels/Oil 1.09 11.4% Computer/Machinery 0.29 6.4% Fats and Oils 0.52 5.4% Electrical Equipment 0.29 6.0% Wood 0.51 5.1% SUB-TOTAL 3.43 75.7% SUB-TOTAL 5.77 60.3% Source: ASEAN Secretariat. By 1999, the order of importance had changed, away from commodities and towards manufactured products. Computers/machinery and electrical equipment grew from 12.4 per cent to 38.2 per cent of ASEAN’s exports to China. In addition, ASEAN’s exports to China had diversified, with the top five exports making up only 60.3 per cent of total exports to China. ASEAN’s imports from China were always more diversified. In 1993, the top five ASEAN imports from China were electrical equipment, computer/machinery, oil and fuel, cotton and tobacco. Collectively, they made up a little less than 40 per cent of ASEAN imports from
4 The ASEAN-6 includes Brunei Darussalam, Indonesia, Malaysia, Philippines, Singapore and Thailand. 5 The new ASEAN members are Cambodia, Lao PDR, Myanmar and Viet Nam.

Page 10
China. By 1999, electrical equipment and computers/machinery continued to be the top imports, but their share had jumped to nearly half of all ASEAN imports from China. The exports where China enjoys the greatest advantage are base metal and metal articles, textile and apparel, footwear, vegetable products and prepared foodstuffs, vehicles, stone/cement/ceramics and miscellaneous manufactured articles. They account for 38 per cent of China’s exports to ASEAN but only for 8.8 per cent of China’s imports from ASEAN in 2000.
TABLE 2
STRUCTURE OF ASEAN IMPORTS FROM CHINA, 1993, 1999 1993 1999
PRODUCT IMPORTS (US $
Billion)
SHARE PRODUCT IMPORTS (US $
Billion)
SHARE
Electrical Equipment 0.48 11.1% Electrical Equipment 3.24 26.6% Computer/Machinery 0.42 9.7% Computer/Machinery 2.44 20.0% Lubricants/Fuels/Oil 0.39 9.0% Cereals 0.52 4.3% Cotton 0.24 5.6% Lubricants/Fuels/Oil 0.43 3.6% Tobacco 0.18 4.2% Ships/Boats 0.30 2.5% SUB-TOTAL 1.72 39.6% SUB-TOTAL 6.9 57.0% Source: ASEAN Secretariat.
The machinery and electrical appliances exported by China to ASEAN are mostly those
for general or special use. On the other hand, a substantial part of the machinery and electrical appliances China imports from ASEAN are electronic components and devices. For example, of the US $ 2.88 billion worth of machinery and electrical alliances that China imported from Malaysia, more than half of them were kinescopes, transistors and integrated circuits and more than 40 per cent were machinery and electrical appliances. Imports of transistors, integrated circuits and other electronic components and devices accounts for a high percentage in China’s imports of machinery and electrical appliances from the Philippines, Singapore and Thailand.
The exports where ASEAN enjoys the greatest advantage are mineral products (including
mineral fuels), plastics/rubber, wood and wood articles, pulp and paper and fats and oils. They account for 42 per cent of China’s imports from ASEAN. But these commodities constitute only 11.6 per cent of China’s exports to ASEAN in 2000. Other sectors where intra-industry trade is large include machinery and electrical appliances, chemicals, optical, and precision and musical instruments. Among them, machinery and electrical appliances account for 39 per cent of China’s exports to ASEAN and 41 per cent of China’s imports from ASEAN. Over the course of the last decade, the strongest rate of growth has been in the trade of manufactured products, with trade in computers/machinery and electrical equipment rising the most. The fact that these products were both the leading exports and imports of both ASEAN and China suggests the importance of intra-industry trade, brought about by product differentiation and economies of scale. It is also important to note that over the past few years, the proportion of trade-related investment has been growing. A large part of the trade in manufactured goods occurs internally

Page 11
through multinational corporations (MNCs) and, therefore, trade will follow the strategic investment allocations and operations of MNCs in the region. Most of the electronic components exported by ASEAN, for example, are products of foreign-owned enterprises. Considering the high proportion of FDI-related foreign trade in China’s total foreign trade, this linkage will grow even stronger in the future and will have a significant influence on ASEAN-China bilateral trade. Possible Reasons for Strong Growth A major reason for the rapid growth of ASEAN-China trade during the 1990s was the dynamism of the economies of ASEAN and China. During the period from 1990-2000, China’s real GDP grew by an average of 10.1 per cent, and up until 1997, ASEAN’s regional GDP was growing at an annual average rate of 6.8 per cent. Secondly, MFN tariff rates have been falling in both ASEAN and China. At the beginning of 1993, China reduced its tariffs on 3,371 import items and abolished import control s on more than 367 commodities. This action reduced the trade-weighted average tariffs of China by 7.3 percent (Zhang and Warr, 1995).6 At the 1995 Asia Pacific Economic Cooperation meeting, China's President Jiang Zemin further made a commitment to cut average tariffs to 15% by 2000. This new liberalization effort includes substantial tariff cuts on 4,998 tariff lines. China has also eliminated quotas, licensing and other import controls on 176 tariff lines, or more than 30 percent of commodities subject to these restrictions. Based on available data, the average tariff rate in China is 15.1 percent. However, the maximum tariff rate does not exceed 80 percent. About thirty percent of the tariff lines have rates above 20 percent and the highest tariff rates are applied to prepared foodstuffs, vehicles, textiles and apparel, footwear, fats and oils. Except for fats and oils, the other products have not figured highly as major ASEAN exports to China.
A number of the ASEAN countries have also embarked on deregulation and liberalization measures over the course of the 1990s.
§ Brunei's applied MFN tariffs are low, averaging 3.1 per cent in 2000, zero for agriculture, and 3.6 per cent for non-agricultural products.7
§ Indonesia has undertaken a significant reduction of applied tariffs, with the
lowering of rates going well beyond Indonesia's WTO commitments. Applied MFN tariffs have been reduced from an unweighted average of about 20 per cent in 1994 to 9.5 per cent in 1998. Further unilateral tariff cuts are scheduled up to 2003 in accordance with a clearly defined program of tariff reduction. By 2003, the maximum applied tariff for nearly all products will not exceed
6 Zhang, Xiaoguang and Peter G. Warr, "China's Re-entry to GATT: A General Equilibrium Analysis of Tariff Reduction", China and East Asia Trade Policy, Pacific Economic Papers No.250, Australia-Japan Research Center, Canberra. (1995). 7 World Trade Organization (2001). Trade Policy Review of Brunei Darussalam.

Page 12
10 per cent. Already in 1998, tariffs on food items have been reduced to a maximum of 5 per cent.8
§ Malaysia has cut its import tariffs by almost one half since 1993, reducing
protection for most agricultural and manufactured goods. The average applied MFN tariff rate has declined from 15.2 per cent in 1993 to 8.1 per cent in 1997. Furthermore, whereas only 13 per cent of tariff lines were exempt from import duty in 1993, over half of all lines now bear duty-free applied rates.9
§ In the Philippines, tariffication and reduction in tariff rates over the past six
years have significantly opened the economy. Applied tariffs were more than halved between 1992 and 1999 - from 26 per cent to just over 10 per cent.10 The Philippines is in the midst of a tariff rationalization program that will effect a uniform tariff structure for manufactured products of no higher than 5 per cent.
§ For Thailand, applied MFN tariffs averaged 18 per cent in September 1999,
compared with 23 per cent in 1995. Tariff peaks were reduced to 60 per cent, down from 100 per cent in 1995.11 Thailand is also in the midst of a tariff review program to consider further liberalization of its trade regime.
Furthermore, five ASEAN members – Indonesia, Malaysia, Philippines, Singapore and Thailand – are signatories to the Information Technology Agreement (ITA 1) and are therefore scheduled to eliminate MFN duties on a fast-growing segment of their trade.
Foreign Direct Investments Both ASEAN and China are major destinations for foreign direct investments rather than significant investors in each other’s economy.
Among developing countries, China was the single most important destination of FDI for nearly a decade (1987 to 1998). This period marked the acceleration of economic reform in China and the rapid growth of its economy. Chinese investments in ASEAN amounted to only US$ 135.8 million in 1999, representing less than 1 percent of all FDI flows to ASEAN. In fact, given the investments made into China by ASEAN members, until now ASEAN is a net investor in China. For that reason, ASEAN interest in investment cooperation with China would probably be weighed more towards protecting the interests of ASEAN investors in China, lowering transaction costs and red tape and further opening up China’s investment regime for ASEAN investors.
8 World Trade Organization (1998). Trade Policy Review of Indonesia. 9 World Trade Organization (1997). Trade Policy Review of Malaysia. 10 World Trade Organization (1999). Trade Policy Review of Philippines. 11 World Trade Organization (1999). Trade Policy Review of Thailand.

Page 13
TABLE 3 PRC INVESTMENTS IN ASEAN, 1995-99
(US $ Millions) YEAR PRC FDI
FLOWS TO ASEAN
TOTAL FDI FLOWS TO ASEAN
SHARE OF PRC IN FDI FLOWS INTO ASEAN
1995 114.36 25,278.0 0.45% 1996 127.1 30,867.0 0.41% 1997 49.37 32,541.0 0.15% 1998 302.47 18,270.0 1.66% 1999 135.8 14,703.0 0.92%
Sources: Statistics of Foreign Direct Investment in ASEAN (Extended Data Set), ASEAN Secretariat; World Investment Report 2001.
Services In 2000, China exported US $ 30.15 billion and imported US $ 35.86 billion worth of commercial services.12 They represented 2.1 per cent and 2.5 per cent of global commercial services exports and imports respectively. On the other hand, ASEAN’s13 total exports and imports of commercial services in 1999 amounted to US $ 62.5 billion and US $ 69.75 billion respectively.14 They represented 4.6 per cent and 5.1 per cent of global commercial services exports and imports respectively. While there is information on aggregate level of commercial services trade by China and ASEAN, there is little statistics on bilateral or ASEAN-China trade in services. However, we do know that China is among the developing world’s major generating/source markets of tourists, with 8.4 million Chinese travellers taking international trips in 1998. It is also true that they are a fast-growing component of the tourist arrivals in ASEAN. In 1999, China accounted for 5.6 percent of all ASEAN tourist arrivals, or a total of 1,919,340 tourists. Thailand, Viet Nam, Singapore and Malaysia are the popular destinations, with estimated arrivals of 775,626, 484,102, 372,881 and 190,851 respectively from China. Themed tours have emerged as a new trend in China’s outbound market. Thailand is promoted as a sightseeing, eco-tourism and beach resort destination, including spa and honeymoon tours. Singapore is seen as a destination of study and business tours while Malaysia is seen as a shopping and sightseeing destination. Joint promotions and facilitation of movement of tourists between ASEAN and China could be an area of potential cooperation. This will also lead to increased flows of investment between ASEAN and China in tourism-related areas such as hotel and restaurant businesses, health services, educational services and construction.
Future Prospects
The past decade has seen an acceleration of trade, services and investment flows between the two regions, largely as a result of their rapid rates of growth and ongoing liberalization initiatives. China’s growth over the next decade is projected to average 7 per cent annually. 12 World Trade Organization (2001). 13 Excludes Brunei Darussalam for which no figures on trade in services are available from the WTO. 14 World Trade Organization (2001).

Page 14
However, the prospects for ASEAN countries is more clouded as they have seen a deceleration in their growth since the 1997 crisis. China’s liberalization as a result of its accession to the WTO would provide an important opportunity for expanding current trade and investment levels between ASEAN and China.
The potential for further expanding these trade and investment links is apparent if we consider that despite the rapid growth of ASEAN-China trade, the major markets for their exports continue to be the developed countries. In addition, both ASEAN and China are major destinations for foreign direct investments rather than significant investors in each other’s economy. If both regions could agree on a program of further trade and investment liberalization and facilitation measures, the prospects for ASEAN-China economic relations could be further bolstered.

Page 15
SECTION TWO IMPLICATIONS OF CHINA’S ENTRY INTO THE WTO
The accession of the seventh biggest exporter in the world to the WTO is expected to have significant impacts on the international trading system. The most important impact will be felt by the Chinese economy itself as it is opened up to foreign competition and as its exports are given greater protection by WTO rules. As major participants in the international trading system, the ASEAN countries will also face important opportunities and challenges from China’s WTO accession. The two subjects are discussed in this section. The market access commitments made by China leading to its accession to the WTO will increase the entry of foreign goods, firms and investments into the country heightening the level of competition. At the same time, China will gain access to foreign technology and management know-how. All of this will increase the efficiency of China’s economy but it will also put pressure on domestic firms and require restructuring of China’s product, services and labour markets. On the macroeconomic front, the opening up of China’s economy might lead to a short-term to medium-term deterioration in the balance of payments. But on the whole, the analysis in this paper suggests that China will benefit from the process of liberalization and deregulation following its entry into the WTO. ASEAN countries will gain market access to China as the latter implements its WTO accession commitments. These countries are, however, expected to experience inroads by Chinese products in their domestic markets. At the same time, there could be increased competition in third country markets, such as the US, the EU and Japan, which are the major markets of both China and ASEAN. Finally, there is a need to look at the impact on FDI flows, which may show a greater tendency to move to China as a result of the deregulation of investment measures in that country.
Accession Commitments of China to WTO
In the negotiations of the entry into WTO, China has committed a very comprehensive package of market liberalization measures, which will be implemented immediately after its accession to WTO. Generally, China is given about 5 years to fulfil its commitments. The key points of the commitments are:
§ The average statutory tariff rate of agricultural products will be reduced
from 19 percent to 14.5 percent. A tariff-rate quota system for key products, such as wheat, corn, rice, soybean oil, cotton etc, will be established and all non-tariff barriers to imports will be replaced by tariffs. Agricultural subsidies will be reduced, with the commitment of “amber

Page 16
box”15 subsidies not exceeding 8.5% of the total value of agricultural products.
§ The average tariff level for all industrial goods will be reduced to 10
percent within 5 years from the current 15 percent. China will bind all of its tariffs, i.e., commit not to raise tariff levels.
§ Nearly all administrative examination and approval procedures for the
import of goods, i.e. quotas, licenses and other non-tariff quantitative restrictions will be abolished within five years. Trading rights for foreign companies will be granted.
§ A broad range of professional services, such as wholesale and retail trade,
as well as after sale service, repair, maintenance and transportation will be liberalized, with foreign ownership allowed up to 49 percent.
§ By participating in the WTO Information Technology Agreement (ITA),
all tariffs on IT equipments, computers and other IT products will be eliminated by 2005.
§ With acceptance of the principles of the WTO Agreement on Basic
Telecommunications, China will allow the provision of any basic telecommunication service, including local, long distance and international service by any means of technology within 2-6 years, allowing 49 percent foreign investment in all services and 50 percent foreign ownership for value added and paging services.
§ Financial services will be liberalized, thus opening the market in banking,
insurance, securities, fund management and other financial services. Licenses will be awarded solely on the basis of prudential criteria, with no economic-needs test or quantitative limits on the number licenses issued. All geographical restrictions on where foreign banks can offer domestic currency service will be lifted and there will be no numerical limits on the number of foreign banks and insurance companies that will be licensed as of 2005.
§ China has made comprehensive liberalization commitments in the WTO
negotiations with ASEAN members. According to the agreements, the average tariff level for ASEAN products will be reduced by 34 per cent to
15 Under the WTO Agreement on Agriculture, there are basically two categories of domestic support: support with no, or minimal, distortive effect on trade (Green Box measures) and trade-distorting support (Amber Box measures). For example, government provided agricultural research or training is considered to be of the former type, while government buying-in at a guaranteed price falls into the latter category. The aggregate monetary value of Amber Box measures is, with certain exceptions, subject to reduction commitments as specified in the schedule of each WTO Member providing such support.

Page 17
47 per cent within 5 years, faster than the average reduction. Thus, trade barriers on ASEAN products will be largely reduced.
Impact on the Chinese Economy
Accession to the WTO represents a new stage of China’s economic reform and opening
to the outside world, i.e. from a kind of selective liberalization to comprehensive liberalization, from unilateral liberalization to WTO rules-based liberalization. China’s accession to the WTO will make its economy fully integrated with the international trading system.
Liberalization will enhance China’s economic efficiency and promote industrial progress.
Competition will force Chinese enterprises to improve technology and management. The WTO is a rules-based international organization. As a WTO member, China will
strictly adhere to all WTO rules and ensure conformity of its domestic laws and regulations to those of the WTO’s. The changes that are required to be made to the Chinese legal system is one of the most important impacts of WTO accession. China’s policies and regulations will become more transparent and accountable, creating a favourable and fair environment for foreign traders, investors and partners.
WTO accession will provide benefits to China in terms of the security of its access to world markets. By virtue of the WTO’s MFN provision, Chinese products will enjoy equal rights to enter others’ markets. At the same time, market access and trade disputes will be governed by WTO rules, meaning that Chinese companies will not face unfair treatment or discrimination in other markets.
Nevertheless, by quickly liberalizing its market, including those sensitive and infant sectors, Chinese companies will face fierce competition from foreign competitors. It is expected that imports will increase much faster than exports, which will dramatically reduce China’s trade surplus, or even turn it to deficit, especially in the first several years after joining the WTO. A large number of Chinese enterprises in less competitive sectors, such as chemicals, medicine, automobiles and agriculture may be forced to closed down, thus increasing unemployment. In addition, some services sectors such as banking, insurance, as well as telecommunications, which used to be highly protected, may find themselves in a very disadvantageous situation in competing with foreign competitors. Considering the problems left over from the old centralized-planning system and the transition towards a market economy, the banking and insurance sectors need more time to adjust and change. There is worry that China’s financial markets may become vulnerable in face of fierce competition from foreign banks and insurance companies.
China is facing increased regional disparity and growing gaps in the income level of different groups of the population. This is one of the most serious social problems arising from the development process. The acceleration of liberalization and competition arising from China’s implementation of its WTO commitments may make those problems worse.
However, from its past experience of successful reform and opening to the outside world, China has the capability to meet the challenges and manage the economic and social

Page 18
transformation. The long process of negotiations for WTO accession has given China experience and time to learn and to prepare for the changes to come.
WTO accession will make the Chinese economy more efficient through its integration with the global economy and standardization of management and regulations to an international level. It provides China with an opportunity for improving its technology to accelerate domestic industrial restructuring and to raise the level of Chinese participation in the international division of production. WTO accession will help enhance China’s industrial technologies through a kind of “competitive improvement”. Domestic companies will have to improve their technology in order to compete with foreign rivals, while more FDI will focus on the capital-intensive and technology-intensive sectors in order to gain a larger share of the Chinese market. Due to the elimination of the restrictions on business activities, FDI will become drawn to sectors with large potential, like telecommunication, which will force local companies to upgrade their technological and management level quickly. Thus, WTO membership will have significant implications for promoting Chinese economic growth. According to a World Bank study, China’s WTO accession will create positive welfare gains. The most significant impact is on its foreign trade, with China’s share in world exports and imports rising to 6.8 per cent and 6.6 per cent respectively by 2005, two percentage points higher than without accession.16 A study by the Development Research Centre (DRC) using a CGE model, and only assuming tariff reductions, shows that WTO entry would boost China's average annual growth rate by a full percentage point while exports and imports will be 24 and 18 percent higher respectively. 17 However, the potential may be even larger since the assumptions of those studies were based on the economic conditions of the mid-1990s and did not take into account the substantial changes of later years prior to WTO accession. It is expected that industries such as garments, footwear, metals, electronics, utilities and other light manufactures would benefit the most from WTO accession. According to the World Bank study, garment exports will benefit the most, rising more than 1.5 times higher than without WTO accession.18 But at the same time, China’s exports of some labour-intensive products may lose their competitive edge since labour costs will increase rapidly. In addition, sub-regional agreements, such as NAFTA, provide preferential access to its members, which will constrain China’s exports to North America. On the other hand, FDI will probably shift direction from the labour-intensive sectors to the capital-intensive and technology-intensive sectors or services. However, the effects on the capital-intensive, technology-intensive sectors may differ and the real benefits will depend on their capability to meet the challenges. WTO accession will create important challenges for China. Due to market liberalization, China’s imports will increase faster. Thus, the trade balance may become worse in the first years after joining the WTO. Import surges may force many inefficient small- and medium-sized companies to go bankrupt. It is expected that imports of textiles, food grains, feed grains,
16 Elana Lanchovichina & Will Martin, Trade liberalization in China’s accession to WTO, World Bank paper, 2001. 17 Li Shangtong & Zhai Fan: Impact of WTO accession on China’s economy—a Dynamic General Equilibrium analysis, 2000, Beijing, China. 18 Elena Lanchovichina, Will Martin.

Page 19
beverage, metals, petrochemicals, as well as automobiles will increase significantly. 19 The challenge to China’s agricultural sector comes from the pressure of cheaper imported goods and reduction of government subsidies, which may cause a decline in rural incomes and the rise of surplus labour. The challenge to China’s services sector will be very significant. While China’s service sector has been gradually opened, the level of liberalization is relatively lower compared to other sectors. The challenges for China will not just come from the changes in the trade environment, but from the need for domestic industrial upgrading. Although China has experienced rapid economic growth for the past 20 years, the major source of economic growth came from the rapid accumulation of productive factors, such as labour and capital, and the extraordinarily high rates of resource mobilization from the less efficient agricultural sector to the more efficient non-agricultural sectors. Improvement in total factor productivity associated with increasing efficiency in the use of scarce resources contributed to economic growth much less than those in the developed countries such as the US, Japan and at the same time led to a much slower pace of industrial transformation.
Impact of China’s WTO Accession on ASEAN The potential impact on ASEAN of China’s accession to the WTO is assessed on four important dimensions. First, is the enhanced market opportunity made available to ASEAN countries as a consequence of the implementation of China’s accession commitments. Second, is the enhanced market opportunity available to China in the domestic markets of ASEAN countries. This arises because as a WTO member, China is entitled to enjoy the same rights as other WTO members, and discriminatory treatment by ASEAN countries against China would no longer be possible. Third, is the enhanced competition in third country markets, particularly those which figure prominently in the trade of both ASEAN and China - the US, Japan and the EU. Finally, the possible impact on FDI flows to ASEAN in the light of China’s admission to the WTO is considered. More detailed, country-by-country assessments of the impact on ASEAN members of China’s accession to the WTO are provided in Annex 1 of this main report.
Enhanced Market Opportunities
ASEAN exports of agricultural or natural resource based products and electronics are likely to benefit the most from China’s accession to the WTO. ASEAN will continue to export oil and natural gas to China, which is a net oil importer, to meet the needs of its rapid industrialisation. Exports of food, natural resource based products and agricultural commodities would also expand. Examples of these include rice, seafood, food preparations, tropical fruits, vegetable fats and oils, wood and wood products, natural rubber and tin. But given that electrical and electronic equipment now constitutes nearly half of the exports of ASEAN countries like the Philippines, Malaysia and Singapore, these are also likely to expand into China once it accedes to the WTO.
There are essentially several reasons for this. On the demand side, accession to the WTO
is expected to provide a large positive stimulus to China’s economy and enhance its shift towards 19 Elena Lanchovichina, Will Martin

Page 20
manufactures. This would increase China’s demand for energy (oil), raw material inputs to feed its industrial sector and food. China’s labour-intensive industries are raw material- and intermediate-product-intensive industries. In China’s textile and light industries, the proportion of raw materials accounts for more than 75 per cent of their cost, and the workers’ wages only account for 7 per cent20. Likewise, China’s processing trade, which engages itself mainly in producing labour-intensive products, accounts for half of the country’s total export, but it also needs to import large quantities of intermediate products. Therefore, expansion of China’s exports of labour-intensive products will lead to substantial growth of its imports of the related raw materials and intermediate products. Second, the biggest falls in tariffs and liberalization of non-tariff measures will fall on Chinese agriculture. On the supply side, analysis of the cost structure of the ASEAN economies through revealed comparative advantage (RCA) indices suggest the region’s continuing strengths in food, commodities, energy and electronics, compared with China.
Some estimates of the increase in Chinese demand for ASEAN products have been provided. It is estimated that after WTO accession, China’s imports will grow at an average annual rate of 10 per cent. On the basis of this estimate, China’s imports from ASEAN is forecast to reach US$ 35.5 billion in 2005, an increase of US$ 13.3 billion from year 2000, of which about US$ 4 billion will result from China’s entry into the WTO. However, given the higher average annual growth rate of China’s imports from ASEAN (21 per cent) since 1990 than its gross imports from the world (15 per cent), this trend will most probably continue, i.e. the growth rate of China’s imports from ASEAN will continue to exceed that of its gross imports and the actual volume of China’s imports from ASEAN will continue to be bigger than the above-mentioned forecast.
An important concern though is that the WTO commitments by China will not be enjoyed by the three non-WTO ASEAN members – Cambodia, Lao PDR and Viet Nam. In addition, the ability of the four new ASEAN members to quickly shift resources to their export sectors to take advantage of any market opening in China is likely to be limited. In this regard, provision of capacity building and technical assistance to these four countries may be needed in order to expand their trade with China. Positive consideration in the form of promotion measures, consistent with WTO rules, can be given to the non-WTO members of ASEAN. Impact on Domestic Markets Increased market access into ASEAN by Chinese exporters, particularly if they lead to competitive prices, is seen as benefiting ASEAN countries. However, there is also great concern about the possible disruptive effects on domestic producers. The sectors where the greatest challenges are expected are textiles and clothing, labour-intensive manufactures and more labour-intensive electronics, where the RCA indicators collected show the strengths of China in these sectors. 20 Development Report of china’s Industries 2000, Edited by Shi Qingqi and others, published by China Light Industries Publishing House, January 2000, P.27.

Page 21
Textiles and garments, footwear, food, grains, building materials, and miscellaneous
products account for 21 per cent of ASEAN’s gross imports from China in 1999. Judging from the developments in the 1990s, which witnessed a rather high growth rate of ASEAN’s import of most of these products from China, it should be possible for China to maintain its advantageous position in the ASEAN market in the coming years.
The main products where China enjoys potential advantage in the ASEAN market are:
machinery and electrical appliances, optical instruments/clocks/watches, means of transports, metal products and chemicals. These products account for 70 per cent of ASEAN’s gross imports from China, among which machinery and electrical appliances alone account for 51.5 per cent in 1999. During the period from 1993 to 1999, ASEAN rapidly increased its imports of these products from China, at a growth rate much higher than that of ASEAN’s gross import of these products from the world as a whole. Therefore, it can be expected that China’s share in the ASEAN market will continue to grow. Impact on Third Country Markets
ASEAN and China both rely on the same large markets, namely, the US, EU and Japan. Furthermore, there is significant overlap in the exports of ASEAN and China (see Table 4). In the US market, ASEAN and China are major exporters of textiles and apparel and machinery and electrical appliances. In the Japanese market, ASEAN and China are major exporters of machinery and electrical appliances.
TABLE 4 SHARES OF ASEAN AND CHINA IN TEXTILES/APPAREL AND
MACHINERY/ELECTRICAL APPLIANCES IMPORTS OF USA, EU AND JAPAN ( %)
From Textile and Apparel Machinery and Electrical Appliances
USA EU Japan USA EU Japan ASEAN 1999 10.37 4.76 8.36 15.58 5.57 23.46
1996 10.98 4.27 8.93 17.31 5.74 22.01 1993 11.81 4.32 7.83 14.41 4.34 17.08
China 1999 11.21 6.74 61.68 8.33 2.69 12.36 1996 12.48 5.40 51.38 5.56 1.84 8.86 1993 16.07 6.64 43.72 3.72 1.58 5.02
Source: Calculations based on data compiled from UN COMTRADE database available from International Economic Databank, Australian National University.
Currently, China is not entitled to the benefits of the phased integration of textiles and
clothing exports under the WTO’s Agreement on Textiles and Clothing. However, China’s accession to the WTO would allow her exports of textiles and clothing to be fully integrated into WTO rules by 2008. A recent study by Walmsley and Hertel (2000)21 suggests that China’s
21 Walmsley, Terrie and Thomas Hertel (2000). “China’s Accession to the WTO: Timing is Everything” (Purdue University: Center of Global Trade Analysis).

Page 22
competitors in textiles and clothing will suffer as a result of increased competition when China joins the WTO. The delayed implementation of the Agreement on Textiles and Clothing does little to improve this situation, from the perspective of the developing countries. In North America, imports, driven by abolition of the textile and apparel quotes, increase. China’s competitors in the wearing apparel market (India, South Asia and Indonesia) experience an overall decline in exports.
At the same time, it is important to recognize that other developments can have important impacts on third country markets. During the last decade, China’s share of US imports of textiles and garments actually decreased from 16.1 per cent in 1993 to 11.2 per cent in 1999 at the same time that ASEAN’s share decreased from 11.8 per cent to 10.4 per cent. The main reason for the decrease of the shares held by China and ASEAN was Mexico’s preferential access to the US market through NAFTA. Mexico’s exports of garments grew at an average annual rate of 33 per cent in the 1990s and Mexico has now replaced China as the foremost source of garment imports in the USA.22
Impact on FDI Flows Global foreign direct investment (FDI) flows grew rapidly in the 1990’s. From 1987 to 1992, the world annual average FDI flow was about US$ 173.5 billion. This surged to US$ 865.4 billion in 1999. The FDI flowing into Asian developing countries also increased to US$ 105.6 billion in 1999 from US$ 54.8 billion in 1993, even though its percentage of world FDI declined to 12 per cent in 1999 from 27 per cent in 1994. Both China and ASEAN were large recipients of FDI before the East Asian financial crisis. The annual average FDI flow into China and ASEAN in 1987-1992 was US$ 4.6 billion and US$ 9.5 billion respectively, soaring to US$ 41.7 billion and US$ 27.6 billion in 1996 respectively. Both economies had experienced high growth rates before 1997. China adopted a ‘pro-FDI policy’ after its reform and opening up. Due to its large population and economic dynamics, China’s huge domestic market potential became a magnet attracting FDI.
The financial crisis significantly changed the economic environment of ASEAN for FDI flows. FDI flows to the region have decreased sharply since 1997 (see Figure 4). The absolute value of FDI inflows fell from US $ 32.5 billion in 1997 to US $ 13.8 billion in 2000. The share of ASEAN in FDI flows to all developing countries declined from 17.4 per cent in 1997 to 5.8 per cent in 2000. The decline in the relative attractiveness of the ASEAN countries as host economies can be attributed to the erosion of specific locational advantages such as low wages and deteriorating infrastructure conditions as well as increasing competition from China and other developing host economies. The financial crisis in 1997 served to exacerbate this declining share as the economic contraction reduced corporate profits and the subsequent investment decisions of MNCs that were affected by the crisis. The concern for ASEAN countries is that as China liberalizes and deregulates further its huge economy, FDI that would have gone to the ASEAN
22 World Trade Organization. International Trade Statistics 2000, p. 152.

Page 23
region would move to China. This concern is particularly acute for FDI in the manufacturing sector, the most vulnerable being automotive and electronics.
FIGURE 4
FDI FLOWS TO ASEAN, 1997-2000
0
5
10
15
20
25
30
35
US
$ B
ILLI
ON
S
1997 1998 1999 2000
YEAR
Source: UNCTAD. World Investment Report 2001.
The impact of the financial crisis on China appeared to be less severe. From 1997-2000,
the average annual FDI to China exceeded US $40 billion, though real inflows in 1999 showed an 11 per cent decline compared to that in 1997.23 However, the share of FDI in China as a percentage of the developing world declined progressively to 19.5 per cent in 1999 due to increasing competition from other developing economies. In particular, Latin America has re-emerged as an attractive location for FDI since the mid-1990s. Internally, the drop since 1997 can be attributed to the slow-down in economic growth and excess capacity in some of the manufacturing industries due to over-investment in the past decade. However, because of China’s continuous high economic growth and stable financial situation after the financial crisis, it continued to be the most attractive destination for FDI in Asia. In the future, as China’s economy gathers strength China’s investment abroad will increase. In fact, investment abroad by Chinese companies is encouraged by the policy of the Chinese government. Currently, ASEAN is not yet a major market for China’s FDI receiving only less than US $100 million a year. Most of the investments go to the four ASEAN new members, i.e., Vietnam, Lao PDR, Cambodia and Myanmar. ASEAN will be a priority market for China’s investment in overseas countries in the future, especially if a closer economic relationship between the two sides could be established.
23 China Statistical Yearbook, 2000.

Page 24
Conclusions
China’s entry into WTO will provide new opportunities and challenges to China-ASEAN trade relations. WTO accession will increase the degree of openness of China’s economy, prompt a major adjustment in China’s economic structure and make the economy more efficient. However, Chinese enterprises will face fierce competition from the dramatic growth of imports. With accession to the WTO, China will be a more powerful driver of growth and that momentum could, in turn, be harnessed by the ASEAN countries. Market opportunities for both regions will be created by China’s liberalization and industrial restructuring. Those market opportunities will also mean more import competition for domestic enterprises in ASEAN. Competition in third country markets will likely intensify particularly for labour-intensive manufactures given overlaps in the major export products and in the markets targeted by ASEAN and China.
The long-term trend of FDI flows into ASEAN is one of steady erosion in both relative
and absolute amounts. This trend is likely to continue after China’s accession to the WTO. In the case of China, FDI flows are likely to remain at their current high levels or increase some more. Apart from the traditional FDI that searches out low-cost production sites, the opening up of telecommunication, finance, insurance, and services, would provide more opportunities for FDI to flow into those sectors that used to be protected.

Page 25
SECTION THREE ENHANCEMENT OF ECONOMIC RELATIONS
BETWEEN ASEAN AND CHINA
The previous section identified some of the opportunities of both ASEAN and Chinese products, services and investments arising from China’s accession to the WTO. However, China’s WTO accession does not mean that all barriers to trade, investments and services are eliminated much in the same way that the ASEAN countries’ trade and investment regimes are not entirely free from measures that may hamper the trade interests of other WTO members. The forging of ASEAN-China economic relations in the 21st century should take the potentials created by China’s accession to the WTO as an important first step in freeing up trade and investment flows between the two regions. Both sides would benefit further from being able to identify measures which, from the other partner’s standpoint, hamper its trading interests, but if properly addressed, would significantly improve economic relations. Future ASEAN-China cooperation could involve programs intended to reduce or remove these perceived impediments to trade and investments.
It is recommended that ASEAN and China adopt a framework of economic cooperation to forge closer economic relations in the 21st century. The framework should be both comprehensive and forward-looking. It should not only enhance the current economic links between the two regions, but it should also chart the future direction of those relations. Given the current global economic weakness and the increased risks of a downturn, the adoption of the framework will help shore up confidence, particularly in East Asia. In the longer run, an ASEAN-China free trade area, by dismantling all tariff and non-tariff barriers between the two regions, promises a comprehensive approach for furthering economic links and integration. At the present time, ASEAN is close to completing its free trade area. In order to provide a thorough examination of how economic relations between the two regions can be enhanced, this section of the paper also looks into the feasibility of an FTA in the long-term between ASEAN and China and considers the possible modalities for putting it into place.
Existing Trade and Investment Barriers The comprehensive liberalization commitments made by China in its negotiations with WTO members would create a significantly more open economy. The ASEAN countries, for their part, have been unilaterally liberalizing their economies since the 1990s and the process of regional economic liberalization through AFTA has supplemented this process.

Page 26
However, there are measures maintained by both ASEAN and China, which have been identified as hampering trade and investment flows and which would need to be addressed in a comprehensive way.
§ High tariff rates, particularly on some products of export interest to the other region Average tariffs in China are higher than average MFN rates in the WTO members of ASEAN. Tariffs on some major export items of ASEAN are of particular concern. For example, China imposes tariffs of 85 per cent on out quota (3 percent on in-quota) imports of rice from Thailand.. Thailand’s exports of vegetable and fruit, meat products, poultry and seafood, processed rice, sugar, textile, wearing apparel and chemical, rubber and plastic products to China face import tariffs of over 20 per cent. On the other hand, some ASEAN members’ high tariff structure remains a major impediment to China’s market access in many sectors, such as float glass, rice, motorcycles, alcoholic beverages, certain grains, livestock and meat products, sugar and certain vegetables. Several tariff lines have rates well over 100 percent. In addition to import duties, some ASEAN countries levy a sales tax on most imported goods.
§ Non-tariff barriers in the forms of quotas, licensing requirement and other
form of import control measures The major problems identified by ASEAN countries are the existence of quotas, licensing requirements and other import control measures on products of export interest to ASEAN countries. Of particular concern to some ASEAN countries is the control over imports of palm oil. Only the government or state enterprises can import vegetable oils and these imports are subject to quotas. At present, for example, six corporations have received licenses to import Indonesian palm oil. Several import control measures are also maintained in certain ASEAN countries to protect their sensitive local industries, for example, import quotas and licensing systems on imported motor vehicles and motor vehicle parts, rice and coal, etc. Import of some items not requiring licenses must comply with applicable regulations of concerned agencies, including extra fees and certificate of origin requirements. Importers in certain countries face complex procedures before they can import some products. Such procedures appear to limit imports. Also, the importers usually face excessive paperwork and formalities, and lack of coordination between customs and other import regulating agencies
§ Burdensome process in standards. In standards, testing, labelling and
certification requirements, the cost, duration and complexity of the permitting processes are burdensome. For example, food and pharmaceutical import licenses in certain ASEAN country must be renewed every 1 to 3 year(s) with payment of required fees.
§ Restrictions on trade in services While there is keen interest among ASEAN
investors and service suppliers in China, barriers in the service sector
Page 27
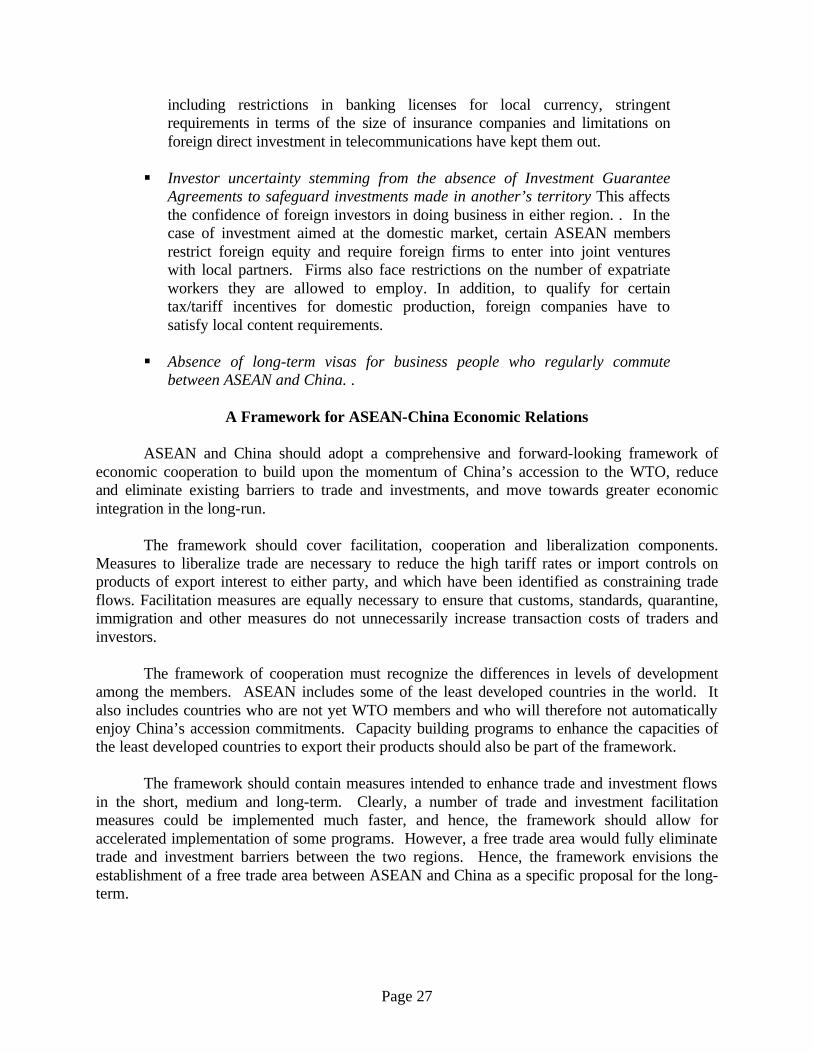
including restrictions in banking licenses for local currency, stringent requirements in terms of the size of insurance companies and limitations on foreign direct investment in telecommunications have kept them out.
§ Investor uncertainty stemming from the absence of Investment Guarantee
Agreements to safeguard investments made in another’s territory This affects the confidence of foreign investors in doing business in either region. . In the case of investment aimed at the domestic market, certain ASEAN members restrict foreign equity and require foreign firms to enter into joint ventures with local partners. Firms also face restrictions on the number of expatriate workers they are allowed to employ. In addition, to qualify for certain tax/tariff incentives for domestic production, foreign companies have to satisfy local content requirements.
§ Absence of long-term visas for business people who regularly commute
between ASEAN and China. .
A Framework for ASEAN-China Economic Relations
ASEAN and China should adopt a comprehensive and forward-looking framework of economic cooperation to build upon the momentum of China’s accession to the WTO, reduce and eliminate existing barriers to trade and investments, and move towards greater economic integration in the long-run. The framework should cover facilitation, cooperation and liberalization components. Measures to liberalize trade are necessary to reduce the high tariff rates or import controls on products of export interest to either party, and which have been identified as constraining trade flows. Facilitation measures are equally necessary to ensure that customs, standards, quarantine, immigration and other measures do not unnecessarily increase transaction costs of traders and investors. The framework of cooperation must recognize the differences in levels of development among the members. ASEAN includes some of the least developed countries in the world. It also includes countries who are not yet WTO members and who will therefore not automatically enjoy China’s accession commitments. Capacity building programs to enhance the capacities of the least developed countries to export their products should also be part of the framework.
The framework should contain measures intended to enhance trade and investment flows in the short, medium and long-term. Clearly, a number of trade and investment facilitation measures could be implemented much faster, and hence, the framework should allow for accelerated implementation of some programs. However, a free trade area would fully eliminate trade and investment barriers between the two regions. Hence, the framework envisions the establishment of a free trade area between ASEAN and China as a specific proposal for the long-term.

Page 28
The framework should build synergies by allowing cooperation to expand to include areas of common interest such as agriculture, energy, finance, HRD, etc. Finally, the framework should create the necessary institutional mechanisms to ensure effective implementation of the framework.
The adoption of this framework of economic cooperation between ASEAN and China will move ASEAN-China relations forward and establish a solid foundation for East Asian growth and stability over the years. The proposed framework of economic cooperation contains six major elements, some of which could be implemented on an accelerated basis. The elements are:

Page 29
FRAMEWORK OF ASEAN-CHINA ECONOMIC COOPERATION
I. Trade and investment facilitation measures, which include:
§ Enhanced transparency; § Removal of non-tariff barriers; § Liberalization of state-trading rights; § Simplification of customs procedures; § Mutual acceptance of standards and conformity assessment procedures; § Facilitation of visa arrangements to promote the flow of business
personnel; § Conclusion of investment and avoidance of double taxation agreements; § Holding of trade policy and business sector dialogues; § Promotion and facilitation of trade in ICT products, e-commerce, and
adoption of common standards and practices and technological cooperation, so as to raise all countries’ application level; and
§ Promotion of trade in services.
II. Provision of technical assistance and capacity building to ASEAN members, particularly to the new members in order to expand their trade with China.
III. Positive consideration in the form of promotion measures, consistent with WTO
rules, be given to the non-WTO members of ASEAN. IV. Expansion of cooperation in areas such as finance, tourism, agriculture, HRD,
SMEs, industrial cooperation, intellectual property rights, environment, forestry and forestry products, energy and sub-regional development.
V. Establishment of an ASEAN-China FTA within ten years, with special and differential treatment and flexibility given to ASEAN’s new members.
VI. Establishment of appropriate institutions between ASEAN and China to carry out
the framework of cooperation given its comprehensiveness and the high level of integration to be achieved between ASEAN and China.

Page 30
Feasibility of an ASEAN-China Free Trade Area
The proposal for an ASEAN-China free trade area deserves special attention and discussion given the political and economic implications of the recommendation.
Of the 142 members of the WTO, 90 percent have formed or entered into regional
economic cooperation organizations. In recent years, the world has also witnessed the development of economic cooperation arrangements between different trading blocs. These regional trading arrangements are thought to play an important role in promoting regional and global economic development. However, free trade areas have been a rare and recent phenomenon in East Asia. In fact, only ASEAN has embarked on, and is now close to achieving, a free trade area.24 There are now ongoing FTA discussions between Singapore and Japan and between Japan and Korea. An AFTA-CER High level Task Force was established in 1999 to look at the feasibility of a free trade area between ASEAN and the Common Economic Relations (CER) countries of Australia and New Zealand. Although the Task Force concluded that an “AFTA-CER free trade area was both feasible and desirable”, the Ministers decided to pursue a less ambitious program of “closer economic partnership”. There have been past sub-regional arrangements such as the Mekong River Valley Cooperation and Tumen River Development Project. However, these have limited economic objectives and do not envision the establishment of a free trade area. Since 1997, ASEAN and China, Japan and Korea have developed a number of economic cooperation programs, particularly in the areas of finance. The broad framework for this cooperation was contained in the “Joint Statement on East Asian Cooperation” announced by the Leaders in November 1999 in Manila, Philippines. While the East Asian cooperation framework has a solid foundation, given the disparity in levels of economic development and social systems, the long-term goal of economic cooperation through this framework might take rather a longer period to fully develop. Hence, an ASEAN-China free trade area would represent an important move forward in terms of economic integration in East Asia. It would serve as a foundation for the more ambitious vision of an East Asia Free Trade Area, encompassing ASEAN, China, Japan and Korea. Economic Benefits and Challenges of an FTA between ASEAN and China The establishment of a free trade area (FTA) between ASEAN and China will create an economic region with 1.7 billion consumers, regional GDP of about US $ 2 trillion and total trade estimated at US $ 1.23 trillion. It will be the biggest FTA in the world in terms of population size. It will also be the largest FTA, made up of developing countries, in terms of population, GDP and trade.
24 The ASEAN Free Trade Area was agreed upon in the Fourth ASEAN Summit of 1992 in Singapore. Tariff reductions under the Common Effective Preferential Tariff (CEPT) Scheme began in January 1994. By 1 January 2002, all products in the Inclusion List of the original six members would have their tariffs reduced to 0-5%, with some exceptions.

Page 31
The removal of trade barriers between ASEAN and China will lower costs, increase intra-regional trade and increase economic efficiency. The FTA will lead to greater specialization in production based on comparative advantage. Trade creation occurs when some domestic production in one FTA member is replaced by lower-cost imports from another member. This will boost real income in both regions as resources flow to sectors where they can be more efficiently and productively utilized. The simulations conducted by the ASEAN Secretariat using the Global Trade Analysis Project (GTAP) suggest that an ASEAN-China FTA will increase ASEAN’s exports to China by 48 percent and China’s exports to ASEAN by 55.1 percent. The FTA increases ASEAN’s GDP by 0.9 percent or by US $ 5.4 billion while China’s real GDP expands by 0.3 percent or by US$ 2.2 billion in absolute terms. The study appears in Annex 2 of this report. Protected by trade barriers, domestic enterprises face little competition and pressure. As a result, they operate inefficiently. With the formation of an FTA and with trade barriers among members eliminated, enterprises in each member must become more efficient to meet the competition of other enterprises within the FTA. The fierce competition will further promote specialization, and as a result increase productivity and economic welfare. Not only would competition intensify between ASEAN and Chinese companies, but strategic alliances between them would also be created in many sectors. The surviving enterprises might become globally competitive. The formation of an ASEAN-China FTA should also attract more investments into the region. Not only will more ASEAN and Chinese companies be willing to invest within the integrated market, since market risk and uncertainty are lowered, but US, European and Japanese companies, which are interested in making inroads into the Asian market, will also be attracted to invest in the integrated market. The integration of ASEAN with China can entice more foreign corporations, which each market alone cannot otherwise attract. With a larger market, more intense competition, increased investment and economies of scale, enterprises will invest more in research and development, hence promoting technological innovation. On the other hand, there will be challenges arising from the establishment of a FTA between ASEAN and China. There would be intensified competition in each region’s domestic market given the similarity in industrial structures. A more liberalized environment under the proposed FTA may entail short-run costs in the form of displacement of workers and rationalization of some industries and firms. There would be the need for adjustments to be made by workers and enterprises, particularly the small and medium enterprises. It should also be noted that trade diversion, in terms of a shift from lower-cost non-FTA members to higher-cost FTA members, could occur due to the preferential tariff reduction and elimination among the FTA members. Shifting away from producers having natural comparative advantage constitute implicit economic costs. Closely associated with this would be the loss of tariff revenues.

Page 32
Beyond the Economic Benefits of an FTA The establishment of an ASEAN-China FTA will create a sense of community between ASEAN members and China. Their geographic closeness, long historical ties and shared culture lays a good foundation for further cooperation. The sense of community engendered by an ASEAN-China FTA will contribute immensely to peace and stability in the Asia Pacific region. The crisis of 1997 has exposed the need for effective cooperation in the region to forestall economic contagion and collapse. Although the crisis-hit ASEAN countries are now on the way to recovery, more effective regional cooperation mechanisms should be put in place. Besides the Chiang Mai Initiative, which creates a network of bilateral swap arrangements among the countries of ASEAN and East Asia, an ASEAN-China FTA would provide another important mechanism for shoring up economic stability in East Asia and provide a basis for maintaining economic growth. ASEAN members and China are all developing countries with limited economic power and high dependency on outside markets for their economic growth. The developments in the global economy can have a large impact on their economies, as the current global slowdown aptly demonstrates. The two regions also have the same concern about rising protectionism in developed countries arising from the establishment of regional arrangements such as the EU and NAFTA, and the future development of the Free Trade Area of the Americas (FTAA). By creating an ASEAN-China FTA, and developing the appropriate institutions to carry out their cooperation, both regions can have a larger voice in international trade affairs on issues of common interest. Possible Timeframe for an ASEAN-China FTA In the event that ASEAN and China agree to establish a free trade area, the simplest modality would be considering the current mechanisms and timeframe of the ASEAN Free Trade Area. This might reduce the extent of renegotiating the parameters of the FTA with the ten members of ASEAN and China. The approach might involve ASEAN countries extending their CEPT commitments, with perhaps some modifications, to China and the latter drawing up product lists25 similar to that in the Common Effective Preferential Tariff (CEPT) Scheme of AFTA and working out the tariff reduction program.
25 There are four product lists under the CEPT Scheme. These are: Inclusion List. Products in the Inclusion List are those that have to undergo immediate liberalization through reduction in intra-regional (CEPT) tariff rates, removal of quantitative restrictions and other non-tariff barriers. Tariffs on these products should be brought down to 0-5% by the year 2002. The new Members of ASEAN have up to 2006 (Viet Nam), 2008 (Laos and Myanmar) and 2010 (Cambodia) to meet this deadline. Temporary Exclusion List (TEL). Products in the Temporary Exclusion List can be shielded from trade liberalization for a temporary period. However, all these products would have to be transferred into the Inclusion List and begin a process of tariff reduction so that tariffs are reduced to 0-5%. For the six original members of ASEAN, annual instalments of products from the TEL have been transferred into the Inclusion List since 1 January 1996. The new Members of ASEAN shall begin the annual transfers beginning in 1999 (Viet Nam), 2001 (Laos and Myanmar) and 2003 (Cambodia). Sensitive List. This contains unprocessed agricultural products, which are given a longer period for integration into the free trade area. The commitment to reduce tariffs to 0-5%, remove quantitative restrictions and other non-tariff

Page 33
The timeframe of an ASEAN-China FTA will need to consider existing benchmarks. On the one hand, the Bogor goal under APEC envisions free and open trade and investments in the developing member economies of APEC by 2020. Hence, since seven of the ASEAN members and China are also APEC members, the year 2020 sets an absolute deadline. On the other hand, the first six ASEAN members (Brunei Darussalam, Indonesia, Malaysia, Philippines, Singapore and Thailand) have up to 2010 to eliminate duties on products in their Inclusion Lists. The new members (Cambodia, Lao PDR, Myanmar and Viet Nam) have up to 2015 with flexibility granted to 2018 for some sensitive products. This means that the timeframe of an ASEAN-China FTA will need to be consistent with these dates. ASEAN and China should work towards the establishment of a free trade area within 10 years, but with flexibility given to the newer members of ASEAN.
barriers is extended up to the year 2010. The new members of ASEAN have up to 2013 (Viet Nam), 2015 (Laos and Myanmar) and 2017 (Cambodia) to meet this deadline. General Exception (GE) List. These products are permanently excluded from the free trade area for reasons of national security, protection of human, animal or plant life and health and articles of artistic, historic and archaeological value.

Page 34
SECTION FOUR CONCLUSIONS AND RECOMMENDATIONS
The last decade has seen the acceleration of the process of globalization, the rise of regional trading arrangements, China’s emergence as a global economic force and the growing interdependence between ASEAN and China. ASEAN-China economic relations have grown dramatically, benefiting from the dynamism of their economies, the liberalization of their trade regimes and the changes in their trade structure. China’s WTO accession will create market opportunities and challenges for both ASEAN and China. Both sides should now build on the important changes that will take place in China and the momentum of their fast growing economic linkage. These joint actions must enhance the opportunities arising from China’s accession to the WTO and minimize the negative impacts. They should also reduce and finally eliminate existing barriers to trade and investments. The joint actions should be comprehensive and forward-looking. They should address not only current economic relations but offer a future direction for closer partnership between ASEAN and China. It is within this context and the objective of forging closer ASEAN-China economic cooperation in this century that a comprehensive and forward-looking framework of cooperation has been put forward. The framework, whose core elements were outlined in the previous section, is further elaborated below. I. Trade and Investment Facilitation A. Transparency
§ Exchange of information on legal enactments, regulations, product standards, sanitary and phytosanitary measures.
§ Conduct annual trade policy dialogue between ASEAN and China.
B. Removal of Non-tariff barriers
§ Reduce and finally eliminate quotas, licensing requirements and other import controls on products of interest to both parties.
C. State-trading Enterprises
§ Liberalize trading/distribution rights in the imports of products of interest to either party.

Page 35
D. Customs procedures
§ Simplify customs procedures and facilitate the entry of products of both parties into each other’s markets.
E. Standards and conformity assessment
§ Mutual acceptance of the results of compatibility assessment procedures carried out in the other party, while mutually recognizing each other’s system and conformity assessment. The two parties should also cooperate in aligning domestic standards with international standards.
F. Flow of Business Personnel
§ Facilitate visa arrangements to promote the flow of business personnel. G. Investment Agreement
§ Conclude investment and avoidance of double taxation agreements which facilitate and protect investments.
H. E-Commerce
§ Promote and facilitate trade in ICT products, work towards adoption of common standards and practices and technological cooperation, so as to raise all countries’ application level.
I. Business Sector Dialogue
§ Facilitate the business sectors of both sides to meet regularly and network with one another.
II. Trade in Services
Identify areas to promote trade in services, such as tourism, educational services, consulting services, management technology, health services and construction.
III. Capacity Building and Technical Assistance
Promote the capacity of ASEAN members, particularly the newer Members, to expand their trade with China.
IV. Promotion Measures (In Response To China’s Accession To WTO) Positive consideration will be provided to the non-WTO members of ASEAN.

Page 36
V. Establishment of a WTO-Consistent ASEAN-China FTA within Ten Years VI. Cooperation in Other Areas
A. Finance B. Tourism C. Agriculture D. HRD E. SMEs F. Industrial Cooperation G. Intellectual property rights H. Environment I. Forestry and Forestry products J. Energy K. Sub-Regional Development
Cooperation in these fields will help underpin and complement the deepening of trade and investment links between the two sides. VII. Institutional Arrangements A. Reinvigorate already existing institutional mechanisms under ASEAN-China
cooperation to carry out the work program described in I-VI; and B. Where necessary, establish appropriate institutional bodies to carry out the work
program described in I-VI.
In the implementation of the framework of cooperation, the following elements: I. Trade and Investment Facilitation; II. Trade in Services; III. Capacity Building and Technical Assistance; and IV. Promotion Measures
may be carried out at an earlier date than the others. The adoption of this framework of economic cooperation between ASEAN and China will push ASEAN-China relations forward and establish a solid foundation for East Asian growth and stability over the years.

Page 37
REFERENCES
Lanchovichina, Elena and Will Martin (2001). Trade liberalization in China’s Accession to
WTO, World Bank paper. Li Shangtong and Zhai Fan (2000). “Impact of WTO Accession on China’s Economy—a
Dynamic General Equilibrium Analysis” Beijing, China. Shi Qingqi, et al, Editors (2000). Development Report of China’s Industries (China Light
Industries Publishing House). United Nations Conference on Trade and Development (2001). World Investment Report 2001:
Promoting Linkages. (New York and Geneva: United Nations). Walmsley, Terrie and Thomas Hertel (2000). “China’s Accession to the WTO: Timing is
Everything” (Purdue University: Center of Global Trade Analysis). World Trade Organization (1997). Trade Policy Review of Malaysia. (Geneva: World Trade
Organization). World Trade Organization (1998). Trade Policy Review of Indonesia. (Geneva: World Trade
Organization). World Trade Organization (1999). Trade Policy Review of Philippines. (Geneva: World Trade
Organization). World Trade Organization (1999). Trade Policy Review of Thailand. (Geneva: World Trade
Organization). World Trade Organization (2000). International Trade Statistics. (Geneva: World Trade
Organization) World Trade Organization (2001). Annual Report 2001. (Geneva: World Trade Organization). World Trade Organization (2001). Trade Policy Review of Brunei Darussalam. (Geneva: World
Trade Organization). Yu Yongding, et al, Editors (2000). The Research Report on China’s Entry into WTO. (Social
Sciences Documentation Publishing House). Zhang, Xiaoguang and Peter G. Warr (1995). "China's Re-entry to GATT: A General
Equilibrium Analysis of Tariff Reduction", China and East Asia Trade Policy, Pacific Economic Papers No.250, Australia-Japan Research Center, Canberra.

ANNEX 1
ASEAN MEMBER COUNTRIES NATIONAL REPORTS

Page 38
FORGING CLOSER ASEAN-CHINA ECONOMIC RELATIONS IN THE TWENTY-FIRST CENTURY
NATIONAL REPORT
BRUNEI DARUSSALAM
Hjh Mayfa’ezah Hj Ahmad Ariffin Department of Economics
Faculty of Business, Economics and Policy Studies Universiti Brunei Darussalam
Introduction Within the past 3 years, there has been a dramatic increase in trade relation between Brunei and China, particularly in terms of Brunei’s export to China. Total exports to China have increased from a mere B$30,615 in 1998 to B$93.4 million in 2000. More than 90 percent of the total exports are mineral fuel consisting of mainly petroleum crude. Evidently, Brunei began its oil export to China in 1999. Total imports from China, on the other hand, have been constant in the past three years with only a slight increase from B$34.3 million in 1998 to B$39.2 million in 2000. The main imports from China are manufactured goods, food and manufactured articles. Table 1.1 shows Brunei’s total exports to and imports from China in 1998 to 2000.
Table 1.1: Total exports and total imports to China (Brunei dollars) Commodity Total exports Total Imports
Section 1998 1999 2000* 1998 1999 2000* Food 2,040 22,987 9,666,452 12,037,608 11,404,419 Beverages & tobacco 66,288 38,411 9,287 13,745 Crude Materials Inedible
2,224,703 622,747 432,049
Mineral fuels 169 18,454,166 92,196,568 4,371 2,342 454 Animals & vegeta-bles Oils and Fats
156,212 327,527 480,721 64,429
Chemicals 936 3,870 964 1,140,607 1,099,910 960,196 Manufactures goods 19,767 1,053,675 11,130,904 9,486,846 12,577,406 Machinery & Trans-port equipment
6,174 882 3,509,174 1,901,134 2,757,654
Miscellaneous Manufactured Articles
1,559 540 10,733 6,323,724 6,983,576 11,008,126
Miscellaneous trans-actions
82,123 5,105
TOTAL 30,615 18,637,775 93,411,233 34,371,078 32,624,169 39,218,484 Source: Trade section, Economic Development Board, Ministry of Finance. Note: * provisional.

Page 39
Market Access Opportunities Oil and gas, for years, account for more than half of Brunei’s economic activity and about 80% of its exports. 95% of the crude oil produced is exported while the rest is processed for domestic use. On the other hand, about 90% of the gas is converted to Liquefied Natural Gas (LNG) for export while the other 10% is used to generate electricity and for domestic use. Major customers for Brunei’s oil and gas include Japan, South Korea, Taiwan, Singapore and Thailand. Brunei started its oil export to China in 1999 with a value of B$19.4 million. In 2000, oil export to China increased to B$ 92.2 million, however, exports to China only account about 2.7% of Brunei’s total oil exports. According to a report by an international research and financial risk Analysis Company, Vitrade (2001), China must import some oil to meet its economic growth due to its rapid industrialisation and its conspicuous oil consumption. Therefore it is hoped that Brunei may increase its oil supply to meet at least some of China’s oil demand, at the same time en-hancing cooperation in energy. Challenges Faced to Increased Competition by China A) Challenges faced in the internal market. Currently there has been no indication that any negative impacts are likely to arise in the internal market as a result of China’s accession to WTO. This is mainly due to the fact that nearly 80% of consumer goods are imported. Among the main imported goods are food, machinery and transport equipment and manufactured goods. As a matter of fact, some views expressed that Brunei will probably enjoy the benefit of cheaper products from China. The competition, therefore, will be between China and Brunei’s other trading partners (exporting countries). B) Challenges faced in third country market. After oil and gas, garments rapidly form Brunei’s second largest export. Between 1995 and 2000, the average annual growth rate for this sector is 38.8%, an increase from B$60.1million in 1995 to B$309.9 million in 2000. Nevertheless, in relation to other ASEAN countries and China, Brunei has yet to improve its international competitiveness. To have a comparative advantage in any production, certain criteria apply including a high export share in the world market and more exports of the product than imports. Brunei, however, does not meet any of the above criteria which means Brunei has a comparative disadvantage in the production of garments. Furthermore, Brunei is faced with many disadvantages in many of its manufactur-ing industries including its garments production. Among them include heavy reliance on foreign workers and lack of raw materials making the industry highly vulnerable to external distortions. In relation to China’s accession to WTO, this particular industry is identified as the most sensitive industry and has a higher risk of being affected from the Chinese competi-tion in the international market. In the past five years, the major export destinations of Brunei’s garments are US, Canada, EC and Singapore.

Page 40
IMPACT ON FDI FLOWS INTO BRUNEI As far as FDI is concerned, for years, Brunei has not been successful in its effort to diversify its economic base away from oil and gas through FDI. Disadvantaged with a less-competitive nature of economy including, among others, a lack in both skilled and unskilled workers and high wage rate, Brunei has been struggling to overcome the problem of attracting FDI into the non-oil and gas sectors. To date nearly 50% of FDI flow in Brunei came mainly from ASEAN of which about 70% came from Singapore. It is rather difficult to conclude that China’s accession to WTO will aggravate the FDI problem in Brunei because Brunei has never been fortunate enough in attracting a substantial amount of FDI. Nevertheless, Brunei will continue its efforts in facilitating the needs of foreign investment. With or without China’s accession to WTO, Brunei like other ASEAN countries will have to compete globally. Recommendations The following areas are among the possible cooperation opportunities between Brunei and China: Hydrocarbon Industry Brunei currently is looking at options for investment opportunities in the downstream oil and gas sector. These include the production of natural gas petrochemicals such as ammonia, urea and methanol, aluminum smelter and oil refining. Nevertheless because of Brunei’s heavy reliance on imported skills and technology and given the high cost and infrastructure needs, such proposed projects to be ventured alone, are hardly viable. On the other hand, it has been known that China has been a world-class player in the petrochemical industry. In fact China has designated this sector as one of the 4 ‘pillars’ industries toward achieving its development goals. It is therefore hoped that a door of opportunity for cooperation will open between Brunei and China. Brunei should see to an increase oil export to China and in return, able to receive assistance in the areas of petrochemicals. Agriculture There has been an initial proposal made by China to develop Wasan area for rice production. The project will be operated through a Joint Venture between a China company and a local partner. It is still at its infant stage and to date no agreement has been signed. Nevertheless, since one of Brunei’s development goals is to meet self-sufficiency in the production of agricultural products, especially rice, Brunei should reap from this opportunity. Cooperation such as this should be embarked the soonest possible. Other areas of cooperation that are needed include the Technological Transfer Programmes such as food processing/packaging (post-harvest handling), functional food production, resources conservation, high-yield crops and product development.

Page 41
According to the Department of Agriculture, Brunei has also been actively participating in workshops organised through the ASEAN-China Cooperation as well as by invitation from China. These include Workshop in Agricultural machinery and Adaptability, Workshop on Development of Edible Mushroom Industry and many others. Tourism A Memorandum of Understanding (MOU) between China National Tourism Administration (CNTA) and Ministry of Industry and Primary Resources (MIPR) has been signed in 2000, toward an effort to have cooperation in tourism. As tourism is one of the services that is being highly encouraged as part of plans to develop Brunei as a service hub for trade and tourism (ShuTT) by 2003, cooperation such as this, are welcomed and certainly will help Brunei towards achieving its goal. There has been a significant increase in the number of Chinese tourists to Brunei since the signing of the MOU. In 1998, there were only 91 Chinese tourists. In 2000, the number peaked to 1464 tourists. The Table below shows the statistics of Chinese visitors to Brunei in the past three years.
Table 1.2 Chinese Visitors Arrival by Purpose of Visits Year Transit Conference Tourist Business Friends &
Relatives Official
Visit Others Total
1998 105 7 91 56 171 45 232 707
1999 481 3 178 44 278 65 389 1,438
2000 2,187 102 1,464 86 805 334 1,231 6,209
Source: Tourism Unit, Ministry of industry and Primary Resources. CONCLUSION There is certainly no doubt that China’s accession to WTO has triggered a lot of concerns from many economies around the world, including ASEAN. However, from Brunei’s point of view, China’s WTO entry will present more opportunities rather than challenges in terms of both trade and investment. It is hoped that cooperation in many areas can be established between the two countries particularly in hydrocarbon and agriculture. Nevertheless, from Brunei’s part, more studies should be conducted to identify the relevant sectors that can benefit from cooperation with one of the giant economies of the world.

Page 42
IMPACT OF CHINA’S ACCESSION TO WTO ON THE CAMBODIA'S ECONOMY
NATIONAL REPORT
CAMBODIA
Bou Chanphirou ASEAN and International Organisation Department
Ministry of Commerce Cambodia
Market opportunities for Cambodia's products/services/investments in China China with her largest population is a potential market for importers. Her membership in WTO will attract foreign investment to the country and with her massive labour force the investment will focus on labour-intensive industry. Therefore, China's accession to WTO will produce both challenges and opportunities to Cambodia in terms of trade. China's market, which is relatively small compared with ASEAN, US and EU markets, cap-tures 1.74 per cent of the total exports of Cambodia with the value of USD23 million in the year 2000. With the China's entry into WTO, market access will be gained and exports to China would be expanded to the China's large market, particularly agricultural products such as rice, maize etc. However, Cambodia is not a member of WTO yet, thus she can not enjoy the commitments of China under WTO rules, specifically tariff reduction. Simultaneously, the challenges in price would occur from the boom in investment in labour intensive industry in China. Based on the current structure of Cambodia's export to China,, agricultural products are the main export items to China's market followed by Garments. Both of the main items are labour-intensive, so they would strongly compete with the domestic products.
Cambodia’s Export to China by Products (US Dollars) Products 1995 1996 1997 1998 Garments - 166,601.86 147,338.42 165,201.11 Processed Wood 2,538,556.24 4,311,863.34 34,076,947.75 40,053,764.00 Nutural Rubber 162,404.36 769,929.85 2,701,255.72 1,196,563.81 Cigarette 171,576.00 - - 38,448.00 Personal Effect 1,519.80 - 3,311.11 504.67 Rattan - 15,644.14 138,551.82 137,579.20 Fishing Products - 2,947.01 52,750.07 382,763.54 Fruits - 14,469.33 - - Grain - - 65,993.85 - Maize - 7,930.22 - -

Page 43
Products 1995 1996 1997 1998 Medical - - - 28,387.53 Skin 169,418.40 100,427.78 - - Textile Products - - 48,269.85 - Others 427,756.67 132,002.68 75,987.82 143,771.59 Total 3,471,231.47 5,521,816.21 37,310,406.41 42,146,983.45
Market Opportunities for Chinese Products/Services/Investments in Cambodia The trade data of the two countries shown in following table, illustrates the sectors with high competition, particularly agricultural sector which penetrated Cambodia's market from 3.54 per cent of the total imports in 1995 to 6.92 per cent in 1999 and reached the 2nd ranking in the year 2000 accounted for 7.96% of the Cambodia's total imports. Therefore, the accession of the China would highly compete with the domestic producers as well as farmers in Cambodia in the sector of agriculture and labour-intensive products. Although the Cambodia's market is only about 12 million, as the investment bounces due to the commitments under the WTO rules the China's exports to Cambodia would more or less increase and it would, certainly, impact the Cambodia economy. The positive effect is conveyed to consumers who would enjoy the decrease in price of prod-ucts imported from China and the impact would be negative to domestic producers or farmers who have to struggle in the competition with the labour-based products from China. However, the impact will not imply much to Cambodia because of non-membership of Cambodia into World Trade Organisation.
Market Distribution of Cambodia’s Import Year ASEAN EU China US Japan Others
1995 38.65% 7.60% 3.54% 2.10% 11.17% 36.94%
1996 45.57% 11.07% 5.00% 3.49% 9.43% 25.44%
1997 44.57% 7.75% 5.08% 2.41% 7.51% 32.69%
1998 38.21% 7.85% 8.48% 3.45% 6.30% 35.71%
1999 38.98% 7.41% 6.92% 3.06% 5.96% 37.66%
2000 39.10% 6.61% 7.96% 2.31% 4.12% 39.90% Source: Foreign Trade Department, Ministry of Commerce, Cambodia Impact on Third Country Markets Since 1995, US market has increasingly captured the large share of Cambodia's exports. In 1995, 1.76% of the total exports was exported to the US market and drastically increased to 52.81% in 1999. It kept increasing to the highest percentage of 54.04% in the year 2000. The

Page 44
major products to the US market are garments, shoes, textile and footware accounted for more than 50% of the total exports to US. Also, EU market takes second position in the Cambodia's export markets. It grabbed 16.88% of the total exports in 2000. The same as of the products to US, garments, shoes are the main export items to EU. Considering the major export items of China to the US and EU markets are overlapping those of Cambodia. It addresses the severe challenges to Cambodia's trade structure occurring from the China's accession. As stated in the study conducted by the ASEAN Secretariat, for the 1993-98 period labour-intensive manufactures like textiles and apparel, footwear and other miscellaneous manufactures (such as toys, games and sports requisites, and furniture furnishings) constituted a considerable proportion of China's total exports, accounting for about 36 percent of its total exports. Therefore, the strong competitive products among the two countries are garment, wood, textile, agricultural items and footwear in the third market.
Cambodia's Export Value, by Products (US Dollars) Products 1995 1996 1997 1998 Garments 24,800,775.80 79,016,543.58 126,691,638.84 419,700,533.92 Processed Wood 70,480,924.77 51,315,618.03 82,540,173.81 102,354,482.38 Natural Rubber 34,061,416.58 31,347,750.63 33,382,367.06 25,336,628.48 Cigarette 171,576.00 3,320,667.74 6,293,724.31 35,912,530.37 Furniture 76,899.60 82,274.47 60,027.45 3,468.72 Beer 11,843.03 616,890.42 59,158.47 49,887.76 Personal Effect 1,444,800.74 2,528,274.72 1,669,684.78 1,525,389.27 Rattan 905,744.78 1,328,293.64 230,374.60 490,988.21 Fishing Products 4,907,526.38 2,124,357.14 753,190.53 4,337,105.67 Shoes 27,961.11 345,833.62 1,536,371.05 8,912,025.41 Soy Beans 100,000.00 106,482.96 399,025.50 147,412.14 Tobacco 200,556.52 838,604.97 1,096,039.25 176,661.73 Bran of Wheat - 44,009.97 - Candle - 9,687.96 Cap - - - 745,085.69 Cigar 2,266,179.89 - - - Fruits - 427,661.90 - - Gloves - - 466,766.42 - Grain 70,183.67 6,082.84 - 259,758.18 Hats 5,316.67 288,879.32 228,519.07 - Hemp - 5,083.97 - - Kapok Fiber - - 460,810.56 - Maize 1,018,771.60 615,704.14 212,786.32 - Medical 1,095.19 - - 50,304.83 Paper - 141,592.57 - - Rice - 941,694.55 832,853.91 189,418.62 Rubber Trees 23,125.94 - 25,573,411.35 1,687,876.62 Rush Mat - 336,852.40 - -

Page 45
Products 1995 1996 1997 1998 Skin 213,316.80 138,650.66 - 34,200.40 Textile Products - 1,325,664.08 - 185,344.82 Wine - 1,617,714.14 - - Others 232,751,245.56 198,826,336.79 128,718,710.68 192,778,224.22 Total 373,539,260.63 377,687,519.25 411,205,633.96 794,887,015.40
Source: Foreign Trade Department, Ministry of Commerce, Cambodia
Market Distribution of Cambodia's Exports Year ASEAN EU China US Japan Others
1995 80.11% 6.86% 0.93% 1.76% 1.13% 9.22%
1996 66.01% 24.47% 1.46% 0.70% 1.33% 6.03%
1997 50.30% 14.00% 9.07% 17.04% 1.25% 8.33%
1998 32.91% 16.48% 5.30% 36.80% 1.00% 7.52%
1999 23.43% 15.52% 0.94% 52.81% 0.98% 6.32%
2000 5.57% 16.88% 1.74% 54.04% 0.78% 20.99%
Source: Foreign Trade Department, Ministry of Commerce, Cambodia Impact on Direction of Foreign Direct Investment into Cambodia Due to the financial crisis in 1997, internal issues and recently the slowdown of the world economy, Foreign Direct Investment (FDI) flow to Cambodia seemingly decreased from USD2 billion in 1995 to USD 160 million in 2000. The main investors to Cambodia are 32.33% from ASEAN countries, 17.73% from China, 13.69% from European Union and 7.95% from United States.
FDI Flow to Cambodia, by Countries (US Dollars) Year ASEAN EU US CHINA OTHERS TOTAL
1995 1,534,970,764 198,694,272 148,055,500 2,937,531 24,939,297 1,909,597,364
1996 292,480,804 68,812,981 7,517,260 37,318,703 211,787,300 617,917,048
1997 109,461,684 21,100,438 97,007,558 36,157,049 314,382,277 578,109,006
1998 185,494,541 10,427,874 10,921,313 104,729,155 242,329,632 553,902,515
1999 36,869,267 4,444,413 20,000,827 46,034,912 88,884,473 196,233,892
2000 51,776,671 21,928,498 12,732,404 28,405,062 45,327,849 160,170,484 Source: Cambodia Investment Board, Cambodia After being a member of WTO, China will strictly adhere to all of its rules and accommodate its domestic rules and regulations with those of the WTO's. Furthermore, the great potential of China's domestic market is a fundamental impetus for FDI inflow. Certainly, the accession

Page 46
will impact the FDI flow to Cambodia in two scenarios- FDI diversion and the moving of existing investment to China.
- FDI would be diverted to China where investors can enjoy the China's commit-ments to WTO's rules rather than coming to Cambodia who is not the WTO's member
- The existing investors in Cambodia would move to China, particularly the garment industry that is easily movable. With it, Cambodia's economy, which fundamentally relies on the garment industry, will be severely affected in terms of employment.
However, Cambodia will not be much influenced in the short run because Cambodia has General Preferential System (GSP scheme) from US, EU and other countries
Capital Investment in Cambodia, by Sectors Year Agriculture Industry Service Tourism Total
1995 0.27% 13.35% 18.94% 67.44% 100.00%
1996 15.55% 54.05% 14.76% 15.63% 100.00%
1997 8.81% 68.82% 16.79% 5.58% 100.00%
1998 6.07% 76.16% 4.60% 13.17% 100.00%
1999 14.26% 36.05% 11.33% 38.35% 100.00%
2000 4.43% 27.92% 31.38% 36.27% 100.00%
Source: Council Investment Board, Cambodia Conclusions and Recommendations In principle, to get rid off the challenges being the implication of China's accession to WTO, the economic cooperation with China should be closely considered. The fields of cooperation are:
1. Technical assistance in agriculture 2. Capacity building in forms of training and long-term education- scholarship students,
particularly to new members of ASEAN 3. Improving the cooperation in tourism to promote the flow of tourist to both sides
4. Cooperation in environmental protection, particularly in the Great Mekong Sub-region (GMS)
5. The Establishment of Free Trade Area should be considered.

Page 47
INDONESIA-CHINA ECONOMIC AND TRADE RELATIONS
NATIONAL REPORT INDONESIA
Abdurrahman Gunadirdja Former Head of Research and Development Department
Ministry of Foreign Affairs Indonesia
Referring to the consensus made by the Joint Research Team (JRT) in its meeting on 6 July 2001, the following is data on Indonesia-China economic and trade relations. Based on the Constraints for its import of goods, as described below, one will get the impression that China's basic trade policy is to find more markets for its commodities, while limiting its import. Obviously, the quota and license system it is applying should first be eliminated or reformed before it could enjoy free trade with ASEAN member countries. Nevertheless, the following data shows also the benefits Indonesia could acquire from its economic and trade relations with China as is pointed out in its export opportunities to China and its schemes in various fields of cooperation. I. Bilateral Cooperation a. Basis of Relationship Trade relation between Indonesia and China had experienced different phases of development related to the political relationship between the two countries, namely: 1. The period of the suspension of diplomatic relation commencing in 1967,
2. The reopening of direct trade between the two countries from 1985 on,
3. The increasing economic and trade cooperation after the normalization of diplomatic relation.
Aside from Indonesia's need to expend its non-oil export commodities, the reopening of direct trade with China in 1985, was the first step towards the normalization of diplomatic relation. After that, the increase of trade with China became a priority. b. Trade Data 1. The balance of trade between the two countries from 1996 to 2000 consistently showed a
surplus for Indonesia. The balance of trade on non-oil commodities, however, had always manifested in a deficit for Indonesia, except in 1998 and 1999. In 1999, the balance of trade had a surplus of US$ 0.77 billion for Indonesia; a decrease of 17.34% compared with that of 1998 which was US$ 0.93 billion. In 2000, the balance of trade was US$ 0.75 billion, decreasing by 2.75% compared with that of the previous year.

Page 48
2. In 1999, the total trade between Indonesia and China was US$ 3.25 billion, an increase of 18.73% compared with 1998, which was US$ 2.74 billion. Li 2000, it was US$ 4.79 billion, an increase of 47.32% compared with that of the previous year.
3. In 1999, Indonesian export to China totaled US$ 2.01 billion, an increase of 9.66% compared with the 1998 export, which totaled US$ 1.83 billion. In 2000, the Indonesian export to that country reached US$ 2.77 billion, an increase of 37.77% compared with that of 1999. Indonesian main export to China are, among other things, pulp and waste paper; paper and paperboard, veneer; plywood; improved or reconstituted wood; fixed vegetable fats and oils, solid, crude, refined/fractioned: carboxyl acids and their anhydrides; fish, fresh, chilled, or frozen; wood manufacturing; textile yarn; and natural rubber latex.
4. In 1999, Indonesian import from China reached US$ 1.24 billion, 37.06% more than that of 1998, which was US$ 0.91 billion. In 2000, Indonesian import was US$ 2.02 billion, 62.77% more than that of 1999. Indonesian import from China were mainly rice; tobacco; fertilizer; cotton; unmilled maize; sugar, molasses and honey; electrical machin-ery and apparatus.
5. In 1999, China is number 5 in the list of Indonesia's export countries, and number 7 in that of its import.
6. Until the end of July 2000, China has invested in 84 projects, worth US$ 395.4 million, which is the 28th among investors in Indonesia. The project s cover mainly the following sectors: basic metal industry, fishery, real estate, chemical industry, and non-metal mineral industry.
c. Escalating Bilateral Trade 1. Chinese Aid and Export Credit. Within the framework of escalating bilateral trade, the Chinese government has offered aid to Indonesia in the form of: 1. A grant of US$ 3 million for food and medicines. The Indonesian government has
suggested that the grant be used wholly for medical raw materials and has submitted to the Chinese side a list of medical raw materials. The Health Department will handle the technical implementation. During President Abdurrahman Wahid's visit to China in November 1999, the Chinese government gave an additional grant of RMB 40 million (US$ 4.6 million).
2. An export credit facility worth US$ 200 million for a period of two years, suggested for the import of rice, maize, soya beans and cane sugar from China. In providing this credit, the Chinese government requested an Indonesian government guarantee as contained in the MOU signed in November 1998 by the Department of Finance and the Chinese government. So far, Indonesia has not yet used the export credit facility.
2. Counter Purchase Trading The MoU on counter purchase trading has been agreed on and signed between the Indonesian chamber of commerce and industry and the China Native Produce and Animal Byproduct Import and Export Corporation (TUHSU). MOFTEC Director General Hu Guocai and his delegation visited Jakarta on 25 November 1998 to discuss in detail counter purchase trading with the Department of Industry and Trade. Until now, its implementation has not been

Page 49
realized. On 12 October 2000, Indonesia established a working committee for this purpose and obtained the support of Bank Ekspor Indonesia, Bank Mandiri, and Bank BCA. The government expects the three banks together with Bank BNI to facilitate the scheme. d. Indonesian Export's Opportunities and Constraints to China On 23-25 0ctober 2000, the Indonesia-China Joint Commission held its fifth meeting in Beijing. Minister of Industry and Trade Luhut B.Panjaitan led the Indonesian delegation, while MOFTEC Minister Shi Guangsheng led the Chinese delegation. The result of the meeting was, among other things, agreements on the following: 1. Cooperation in trade and investment, comprising the increase of the Chinese quota on the
import of CPO, cooperation in the development of the aircraft industry of the CN 235 and N 250 types; the follow-up of the MoU on counter purchase trading, and the increase of the two countries' investment.
2. Cooperation in the fields of finance and technology, covering the plan to establish a Bank of China branch in Indonesia, the export credit facilitation, the evasion of double taxa-tions; the offer of LNG from Irian Jaya oil fields, and the development of projects, covering power, transportation, telecommunication and infrastructure, agriculture and fishery.
3. Cooperation in the elevation of small and medium enterprises in Indonesia. 4. The two sides also agreed to implement grants provided by the Chinese government,
totaling RMB 40 million (equal to US$ 4.6 million). The Indonesian side was expected to submit a list of needed goods.
As the follow-up of the Indonesia-China Joint Commission's fifth meeting and the discussion between the Minister of Industry and Trade with Chinese officials, the China sent a delega-tion, including Chinese entrepreneurs, to Indonesia on 20-30 November 2000. During the visit, the delegation met with Indonesian businessmen, and conducted surveys in the fields related to: 1. Cooperation in the wood and bamboo industries (producing chopsticks),
2. Cooperation in the Karimun island ship yard, 3. Cooperation in agriculture between CITIC and PT. Agro Manunggal in South Sulawesi,
4. Cooperation in developing a toll road in Central Java, Cooperation in developing electric power stations.
II. Export's Constraints to China Despite the fact that it has implemented economic reformation, since it opened the country to the outside world in 1979, China still put into effect non-tariff regulations for 35 Indonesian commodities. It is applying the quota and license regulation for the import of commodities. To import commodities in this category, the importer must submit an application to the Ministry of Foreign Trade and Economic Cooperation (MOFTEC) in Beijing or in the
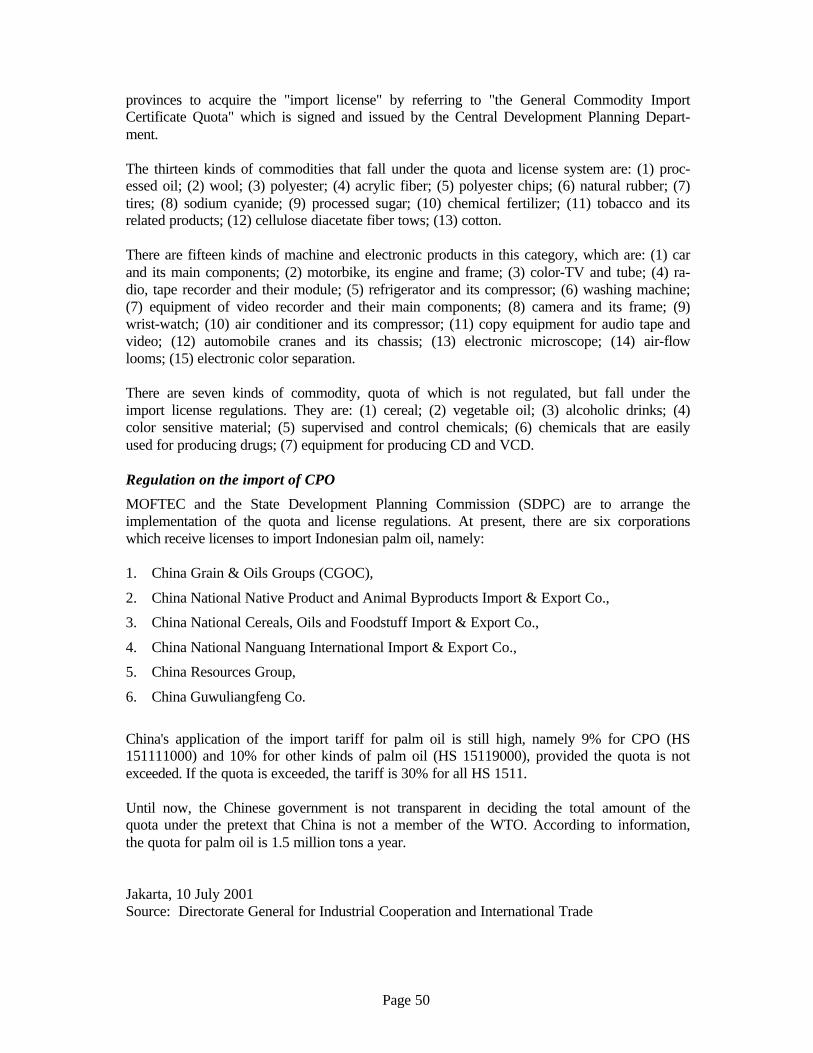
Page 50
provinces to acquire the "import license" by referring to "the General Commodity Import Certificate Quota" which is signed and issued by the Central Development Planning Depart-ment. The thirteen kinds of commodities that fall under the quota and license system are: (1) proc-essed oil; (2) wool; (3) polyester; (4) acrylic fiber; (5) polyester chips; (6) natural rubber; (7) tires; (8) sodium cyanide; (9) processed sugar; (10) chemical fertilizer; (11) tobacco and its related products; (12) cellulose diacetate fiber tows; (13) cotton. There are fifteen kinds of machine and electronic products in this category, which are: (1) car and its main components; (2) motorbike, its engine and frame; (3) color-TV and tube; (4) ra-dio, tape recorder and their module; (5) refrigerator and its compressor; (6) washing machine; (7) equipment of video recorder and their main components; (8) camera and its frame; (9) wrist-watch; (10) air conditioner and its compressor; (11) copy equipment for audio tape and video; (12) automobile cranes and its chassis; (13) electronic microscope; (14) air-flow looms; (15) electronic color separation. There are seven kinds of commodity, quota of which is not regulated, but fall under the import license regulations. They are: (1) cereal; (2) vegetable oil; (3) alcoholic drinks; (4) color sensitive material; (5) supervised and control chemicals; (6) chemicals that are easily used for producing drugs; (7) equipment for producing CD and VCD. Regulation on the import of CPO MOFTEC and the State Development Planning Commission (SDPC) are to arrange the implementation of the quota and license regulations. At present, there are six corporations which receive licenses to import Indonesian palm oil, namely: 1. China Grain & Oils Groups (CGOC),
2. China National Native Product and Animal Byproducts Import & Export Co., 3. China National Cereals, Oils and Foodstuff Import & Export Co.,
4. China National Nanguang International Import & Export Co., 5. China Resources Group,
6. China Guwuliangfeng Co. China's application of the import tariff for palm oil is still high, namely 9% for CPO (HS 151111000) and 10% for other kinds of palm oil (HS 15119000), provided the quota is not exceeded. If the quota is exceeded, the tariff is 30% for all HS 1511. Until now, the Chinese government is not transparent in deciding the total amount of the quota under the pretext that China is not a member of the WTO. According to information, the quota for palm oil is 1.5 million tons a year. Jakarta, 10 July 2001 Source: Directorate General for Industrial Cooperation and International Trade

Page 51
FORGING CLOSER ASEAN-CHINA ECONOMIC RELATIONS IN THE TWENTY-FIRST CENTURY
NATIONAL REPORT
LAO PDR
Kienkhammanh Khottavong Economic Affairs Department Ministry of Foreign Affairs
Lao PDR
Introduction China’s accession to the World Trade Organization (WTO) has become a fashion for many researchers and policy makers to investigate how would affect the structure of the world economy. Many ASEAN members see China as a strong competitor in major export to the rest of the world such as Garments, electronics, miscellaneous manufacture products with lower cost of labour. However, the studies might be focussing on the short, medium and long term effect. Lao PDR has share the border with China, both countries have signed many bilateral agreements on various fields of cooperation included increasing further economic exchanges and coordinating efforts in the fight against cross-border illegal trade, immigration and crimes like drug trafficking. The feasibility study of establishing ASEAN-China Free Trade Area (FTA), CGE approach is considered to be the plausible economic model for analysing whether the outcome of the study be positive or negative for individual ASEAN member. Lao PDR is among the least developed countries relying on tariff levied on the traded commodities in order to cure its deficit. On the other hand, the country needs economic stability first, then it can be gradually open up to liberalize trade, flows of capital. First, we could look at the bilateral cooperation in various fields between Lao PDR and People’s Republic of China. The bilateral agreements on Lao-China economic cooperation The bilateral agreements on Lao-China economic cooperation can be listed as follows: 1. The bilateral agreement for the avoidance of double taxation and the prevention of fiscal
evasion with respect to taxes on income. 2. Agreement on enhancement of investment and protection between Lao PDR and PR of
China. 3. Agreement on establishing Lao-China committee on Economic-Trade-Technical
cooperation. 4. Agreement on a preferential loan for Lao PDR , the amount of the loan will not exceed
100 million Yuan.

Page 52
5. Agreement on tourism cooperation; Cargo and passenger transport on Lancang-Mekong River; Cross border agreement.
In addition, agriculture and forestry is one of the key sectors singled out for further coopera-tion between the two countries, which covered the areas of exploitation of natural resources, technology and machinery, processing industry, prevention and detection of plant diseases and insect pets, and environment protection. The two initial projects could be highlighted: 1. Exploiting mineral resource-based export such as potassium in the area of Vientiane
province, Lao PDR. The mineral is highly demanded for the markets in China.
2. Rubber plantation in the northern of Lao PDR. Lao PDR has received grant from China for constructing National Culture Hall and Hospital, technical assistance amounted 145 million yuan. China also promised to list Lao PDR as the recommended tourism destination to Chinese people. Lao PDR remains a predominantly rural economy, which is virtually undiversified and depends largely on the country’s natural resource base. It’s about 80% of the population living in the rural area, most of them are relying on subsistence agriculture. The social aspects of Laos’ agriculture are predominantly those of individual household using family labour on small plots. Simple commodity production developed on slash and burn basis using primitive farming techniques. In the short and medium term of economic development, the China’s accession to WTO would have not much influence on such small scale of Laos’ economy. However, if China is successful in becoming a member of WTO and peaceful environment is created in the future, China’s chare of export in the world market could be lager, then Laos’s people may enjoy consuming products at the lower prices.
Table 1: Laos ’s Bilateral Trade with China, 1995-2000 EXPORT IMPORT
Value in US$
% Total Export
Value in US$
% Total Import
Total Value of Export
Total Value of Import
6,450,000 1.73% 47,770,000 6.85% 372,555,947 697,676,027 8,160,000 3.30% 26,680,000 3.89% 247,127,337 686,093,320 5,820,000 2.68% 22,930,000 3.40% 217,454,036 675,323,682 7,900,000 3.15% 17,830,000 2.98% 251,054,235 599,323,042 9,555,000 3.53% 22,161,000 4.46% 271,059,676 497,042,526 6,420,000 1.98% 34,420,000 6.37% 323,974,602 540,000,000
Source: Statistic Department, Ministry of Trade of Lao PDR Note: 1. The major of export products to China: Logs, Timber, wood processing, agriculture
Product, forestry product and ...
2. The major imported Goods from China: Construction materials, Electrical appliances, Machinery, Motorbikes, Automobile, Cloths, Garment and ...

Page 53
From the table 1, it can be seen that the trade deficit is occurred in every year for Lao PDR due to many obstacles to trade expansion. However, to tighten economic and trade ties of the two countries are committed to increasing China-Laos border trade Obstacles to trade encompassing problems in export markets, infrastructure, human capacities, institutional bottlenecks, trade financing problems and gaps in trade information can inhibit a least devel-oped country from taking full advantage of trading opportunities. Laos is landlocked country faces the high freight charges for transit goods, poor infrastructure, lack of specialized educa-tion and training, research and development ... It is quite complicated to classify of commodities in order to identify the Revealed Compara-tive Advantage Indexes (RCAs) for the Lao case due to the standard of technical data collec-tion at the local provincial level is limited. When the operation comes across which is arising the same problem as mentioned by the World Bank paper that trade data for Laos is not reliable. The world Bank paper used trade com data, under UN system the classification of commodities are differed from the others such as HS, while the later used SITC. The export data by products are limited which can be provided as follows:
Table 2: Lao PDR exports by products in millions of US dollar 1995 1996 1997 1998 1999 1st semi 2000
Logs 28.7 34.3 16.7 10.5 20 13 Timber 51.5 78.7 67.4 87.4 26.9 20.6 Wood Products 8.1 11.6 5.6 17.5 8 4.9 Coffee 21.3 25 19.2 48 15.2 9.7 Agriculture/forestry products
13.7 17.8 18.1 8.4 8.3 2.8
Garment 76.7 64.1 90.5 70.2 65.5 40 Motorcycles 17.7 12.5 17.1 17.8 38.3 0 Electricity 24.2 29.7 20.8 66.5 90.5 50.5 … Source: Bank of Lao PDR & Customs Department From the table 2, Garment and Motorcycles have seen as the less comparative advantage sectors, since most of the materials and spare parts are imported from abroad. Then those products are re-exported to EU and its neighboring countries. Revealed Comparative Advantage Revealed Comparative Advantage formula can be written as:
Where EiA = CountryA’s exports of commodity i
EA = Total export of country A
EiW = World total of commodity i exports
EW = Total world exports
EE
EERCA W
W
iA
A
iA
i≡

Page 54
If the value of RCA are bigger than 1, it means that the country’s export of that commodity is more than the world average. It implies that the country has a comparative advantage in production of that commodity, and vise versa. RCAs can tell us what group of Laos’ commodity export will perform better/worse of export which include tariff or some other distortions. This will hide the real comparative advantage. Alternatively, it can be estimated by the CGE model or the so-called simulation or scenarios experiment which can also use data from Laos’ trading partner. The CGE model is a system of equations that may be classified into 4 groups: 1. Demand equation for imported intermediate and capital goods, etc. In other words,
demand can be divided into many groups of SITC or HS depending on how many commodities under investigations.
2. Supply is similar to 1.
3. Equilibrium conditions, this group we could do the analysis. Since the model is based on the existing trade protection system (tariff). The experiment is change tariff figure, if SITC 1 is subject to certain level of tariffs, then by reducing it to lower rate of tariffs. Then from the experiment we could find the answer to the questions such as how lower tariff is going to affect trade aversion or creation Government revenue, the flow of FDI, etc.
4. Equation that provides us the formula for the variables mentioned in 3, i.e. Government revenue, etc.
The CGE model is the theoretical model, the coefficient is derived from calibration. It is useful for trade policy analysis. To do the analysis, it will take for some time and need more assistance.
Table 3: Lao PDR Export Products in US$ Classification 1995 1996 1997 1998 1999 1st semi
2000 Animals & animal Products n.a n.a n.a 1,720,897 2,924,916 n.a Vegetable products n.a n.a n.a 7,681,065 15,298,693 n.a Animals & Vegetable oils n.a n.a n.a 1,104,103 n.a Processed food, drink & tobacco n.a n.a n.a 20,901,043 549,656 n.a Oil & mineral products n.a n.a n.a 25,530,441 12,615,600 n.a Chemical products n.a n.a n.a 9,059 170,864 n.a Plastic & Rubber products n.a n.a n.a 9,059 79,756 n.a Skin & furs and products n.a n.a n.a 407,669 204,063 n.a Wood & wood products n.a n.a n.a 44,224,932 47,556,631 n.a Pulp of wood & paper n.a n.a n.a 188,304 387,885 n.a Textiles n.a n.a n.a 42,053 n.a Apparel (Clothing) n.a n.a n.a 44,325 85,523 n.a Shoes, hats, umbrellas, ect. n.a n.a n.a n.a Jewely & precious metal products n.a n.a n.a 911,932 n.a Stone, ceramic & class products n.a n.a n.a 6,155 1,879 n.a Base metals & their products n.a n.a n.a 198,244 485,057 n.a Electrical & mechanical machines n.a n.a n.a 143,640 n.a Transport equipment 7,320 n.a Arms & munitions 227,010

Page 55
Classification 1995 1996 1997 1998 1999 1st semi 2000
Coffee 25,000,000 24,250,000 49,250,000 31,164,000 29,030,000 3,013,521 Electricity 29,693,000 27,080,000 32,700,000 57,102,000 107,000,000 32,640,000 Gypsum & tin 441,250 445,200 589,235 767,000 5,993,248 2,922,540
Cardamom 162,937 184,544 332,180 378,684
Benzoin 730,000 710,000 996,091 1,030,000 ….
Source: Customs Department & Ministry of Trade In realizing that Customs Department of Lao PDR has done better job on classification of commodities since 1998, but the better way should follow the international standardize in light of 50 classification commodities. Investment Yearly report of investment to Lao PDR:
Table 4: Investment flows to Lao PDR in $US Year China The rest
of the world Total
1991 849,271 1,584,693,365 1,585,542,636 1992 2,841,307 127,286,090 130,127,397 1993 10,521,900 145,558,187 156,080,087 1994 8,120,500 2,587,622,005 2,595,742,505 1995 8,772,930 794,178,316 802,951,246 1996 3,150,000 1,289,354,111 1,292,504,111 1997 3,533,396 138,885,205 142,418,601 1998 6,991,727 116,847,933 123,839,660 1999 24,443,671 92,047,460 116,491,131 2000 5,260,691 28,686,759 33,947,450
Source: FIMC As can be seen clearly that after financial crises in southeast Asia, the investment flow to Laos fell sharply and the process has continued to fall for the recent years. On the other hand, thank to the commitment of the strengthening cooperation and encouraging the two-way investment between two nations, the investment flow from China continued to growth up to 1999, but again fell sharply in 2000. The occurrence of the Phenomenon which is come from internal and external causation: There are a number of reasons for the inadequacy of investment in the production goods and services such as: no clear industry policy; difficulty in attracting foreign investors, firstly due to lack of adequate infrastructure facilities, excess demand of skilled labour, inaccurate data; lack of bank financing facilities in both local and foreign currencies; high domestic interest rate. The crowding out of investment from the coastal area to mainland China due to the rapid growth of GDP, large market and labour intensive.

Page 56
Recommendations 1. The possibility to include four ASEAN members in the CGE model may evidence of
more precise answer to above mentioned titles. To do so, the technical assistance should be provided in order to meet international standardize dealing with data collection.
2. Capacity building of human resources through education and training , technology trans-fer development for least developed countries are needed for further strategies of en-forcement of Free Trade Area. The trade deficit is still large which is ending up with the full trade liberalization will lead to collapse the whole system.
Conclusion The accession of China to WTO will create good environment of continuing economic growth in both ASEAN and China, more investment to the new liberalized sectors, new baskets of products will be introduced, high growth of GDP then the investment flow from China to the ASEAN countries will be continually expanded even though there will increase of export competition for both region. The abolishment of trade barriers between two region will expand the world output, but the right steps of liberalization must be taken as the serious matter, other wise we could step on the area of land mines.

Page 57
IMPACT OF CHINA'S ACCESSION INTO THE WTO ON THE MALAYSIAN ECONOMY
NATIONAL REPORT
MALAYSIA
Tham Siew Yean Faculty of Economics
The National University of Malaysia Selangor, Malaysia
1. Introduction The protracted process of China becoming a member of the World Trade Organization (WTO) is expected to conclude soon as it enters the final phase of negotiations for its acces-sion (Eglin, 2000). The prospect of China's deeper integration with the world economy has generated considerable interest on the potential impact of this accession, given China's already large and rapidly expanding trade sector even without WTO membership. In 2000, China was already ranked as the 7th largest exporting and 8th largest importing country (WTO, 2001). Liberalization of trade under WTO commitments will undoubtedly increase the trading position of China in the world economy, thereby providing new opportunities and challenges for other economies. However, most of the studies have focused on the impact of this accession on China's economy itself and there are limited studies that have investigated its impact on other countries (Wang, 1999). This study represents an attempt to fill in the research gap in this area by assessing the implications of China's impending entry into the WTO on Malaysia. 2. Market Access Opportunities available for Malaysian Exporters in China While Malaysia’s total exports grew rapidly at an average growth rate of 6.3 per cent between 1980-1988, it grew even more rapidly between 1988-96 as the average growth rate escalated to 17.8 per cent (Table 1). Exports to China grew even faster than the overall rate, registering an average growth rate of 8.4 per cent in the first period (1980-88) and 20.8 per cent in the second period (1988-96). Total imports also followed the same pattern in that the first period exhibited a lower average growth rate (5.5 per cent) as compared with the second period (21.5 per cent). However, while the average growth rate of imports from China grew at a higher rate than the overall import growth rate (6.7 per cent) in the first period, it grew at a slightly slower rate than the overall import rate for the second period (20.5 per cent). Although the crisis in 1997 caused import growth to turn negative, export growth continued to be positive though it was much smaller than the average export growth that was attained between 1988-96. Post-crisis in 1999, export growth at 16.2 per cent far exceeded the import growth for the same year. Nonetheless while trade with China is growing rapidly, it constitutes a relatively small percentage of total exports and imports of Malaysia. Before the crisis in 1997, at its peak, exports to China was only 3.3 per cent of total exports of Malaysia while imports from China comprised of 1.9 per cent for the same year (Palanca, 2001). In 1999, exports and imports,

Page 58
respectively, comprised of 2.7 and 2.6 per cent of total exports and imports as Malaysia’s major trading partners are USA, Japan, EU and other ASEAN member countries. Neverthe-less, the balance of trade with China has shifted from a deficit between 1981-86 to a surplus between 1987-96 (Table 2). Although a deficit resurfaced in 1997 due to the fall in exports for the third consecutive year since 1995, subsequent recovery in exports together with the fall in imports due to the recession yielded a surplus again in 1998. As the Malaysian econ-omy recovered in 1999, the surplus widened due to the strong growth in exports relative to import growth in Malaysia’s trade with China. In terms of the commodity structure in Malaysia’s trade with China, it can be seen from Table 3 that both exports and imports have changed over time as Malaysia’s production structure shifted out of agriculture to manufacturing. Thus, in 1980, Malaysia’s trade with China comprised mainly of agricultural and resource-based products. However, by 1996, while exports to China still included resource-based products such as wood and rubber, exports of electrical goods have increased significantly, while by 1999, exports of electronic goods have emerged. Similarly in imports, by 1996, agricultural goods have been replaced by electrical and electronics goods. By 1999, 7 out of the top 10 import products belong to this particular product group. The commodity structure therefore indicates Malaysian exports to and imports from China have converged toward similar product groups within the electri-cal and electronic sub-sector. This is probably due to the global production networks that have evolved within this product group under MNC production. Accordingly, the production process is separated into different segments with the production of each segment located at different host economies based on the locational advantages offered there. This implies that exports and imports within the same commodity group will dominate the trade pattern with intra-industry and intra-firm trade increasing in importance. Increased export opportunities in China, post accession, is identified as the export niches for Malaysia in product groups where Malaysia’s RCA is greater than 2 (arbitrarily chosen) and where China’s RCA is less than 1. Comparing Tables 4 and 5, new export niches identified in 1998 are spices, telecommunication equipment parts and sound recorders. It should be noted that the export niches for Malaysia are considerably smaller in number than the import niches due to Malaysia’s highly skewed production and export structure whereby 51 per cent of Malaysia’s manufacturing exports are concentrated in the exports of computers-office machines and electronics-telecommunications alone (Tham, 2000). Since China’s production and export structure is more dispersed, there are more product groups where China’s RCA is greater than 2 while Malaysia’s RCA for the corresponding product group is less than 1, which is the criteria used to identify the import niches for Malaysia in Tables 4 and 5. Hence, new import niches identified in 1998 include rice, road vehicles, non-motor and plastic, nes. 3. Challenges faced by Malaysia due to increased Competition from China Products where both China and Malaysia have a RCA that is greater than 1 are listed in Table 6, indicating the product groups that Malaysia will have to compete against China for third country markets, regardless whether the accession materializes or not. The accession will, however, imply that the Multi-fiber Arrangement (MFA) quotas on China’s exports will be lifted. Ianchovichina et al; (2000) estimated that at the sectoral level, the most important impact of accession will be on China's output of apparel. Moreover, China’s export of this good is estimated to increase dramatically by 330 per cent over a ten-

Page 59
year period post-accession. Thus China's share in the world export markets for apparel is also estimated to increase substantially to over 44 per cent over the same duration. Since Malay-sia is already experiencing falling RCA in wearing apparel between 1986-96, it is expected that the expansion in exports from China will only serve to accelerate the decline in Malay-sia’s export share (Tham and Loke, 1998). Similarly the export of textiles, yarn and thread (based on Table 6) from Malaysia to third country markets may also be affected by the expected increase in exports from China in this product group as well. Apart from clothing and textiles, it can also be observed that China and Malaysia also competes in the electrical and electronic (e & e) sub-sector. In fact about 1/3 of the compet-ing product groups listed in Table 6 belongs to this particular sub-sector. Further, as noted by Tham (2001), China registered the highest average annual rate of growth in technology-inten-sive products between 1995-99 as compared with the other product groups. Moreover, dis-aggregating this product group into high technology-intensive products, based on the defini-tion adopted by Hatzichronoglou (1997), it can be seen that China has acquired a RCA in the computers-office machines product group by 1998. In fact, China’s RCA grew by almost two fold from 0.64 in 1995 to 1.23 in 1998 while Malaysia’s RCA grew from 2.14 to 3.24 for the same period for this product group. This does not imply that China is at the same stage of industrial re-structuring as the rest of the ASEAN-5, especially Singapore and Malaysia. As observed by Wang (1999), more than half of China’s exports in machinery and electronics are processing exports with low-value-added rate such as radio cassette players and telephone sets. These products are basically produced from imported semi-processed materials and assembled by spare parts from abroad for re-export. Therefore the portion of the production process conducted in China is essen-tially labor-intensive in nature. Hence the extent of structural changes based on China’s exports of high technology products may be exaggerated. Malaysia's experience is different and unique due to its dualistic industrial structure. On the one hand, some of the top MNCs in the world consumer electronics industry that are produc-ing for exports in Malaysia have shifted their process technologies to use state-of-the art automated facilities. The technology content of these operations has also been upgraded from assembly to low-level design and engineering. Furthermore, the local content of this export-oriented sector has increased over time with the formation of some local linkages. On the other hand, there are also other MNCs as well as domestic producers that co-exist with the export-oriented MNCs that are primarily involved in assembly-type operations for the domestic market. The future of exports for this very important sub-sector in Malaysian manufacturing depends therefore on Malaysia’s ability to increase the technology content in this sub-sector before China does likewise. Given that MNCs are the primary agents for the creation of dynamic comparative advantage, especially in the case of manufactured products and the dependence of Malaysia on MNCs for technology deepening, the issue is thus related to the future of FDI flows into both these countries. 4. Impact on FDI flows into Malaysia Locational advantages, be it in terms of macroeconomic and political stability, infrastructure conditions, availability and cost of specific inputs, market size, and FDI as well as trade

Page 60
regulatory measures, have enabled China and the ASEAN-5, excluding Philippines, to be among the 10 largest developing host economies to FDI inflows and stock in 1993 (Tham, 1998). The share of FDI accruing to the ASEAN-5 economies, as a percentage of the developing world was the highest between 1987-92 (23.3 per cent, Table 7). Subsequently, its share fell to 18.7 per cent in 1993 and declined again slightly to 18.2 per cent in 1996. The decline in the relative attractiveness of the ASEAN-5 as host economies can be attributed to the erosion of specific locational advantages such as low wages and deteriorating infrastructure condi-tions as well as increasing competition from China and other developing host economies (Tham, 1998). The financial crisis in 1997 served to exacerbate this declining share as the economic contraction reduced corporate profits and the subsequent investment decisions of MNCs that were affected by the crisis. Hence ASEAN’s share fell further to 9.5 per cent in 1998. With economic recovery in 1999, ASEAN’s share has continued to decline to 6.8 per cent due to sharp drop for Indonesia as well as the decline in Philippines and Thailand. Inflows of FDI have recovered for Malaysia and Singapore but stands at 48 per cent and 78 per cent, respectively, of the FDI levels in 1996. China emerged as the single largest FDI host economy in the developing world in the 1990s, a position that it has maintained up to 1999. However, inflows of FDI have contracted for 2 consecutive years from US$44.2 billion in 1997 to US$40.4 billion in 1999 (Table 7). Moreover its share in the total inflows of FDI to the developing world has declined continu-ously since 1993. The share of FDI in China as a percentage of the developing world, increased significantly from an average of 13.2 per cent between 1987-92 to 35 per cent in 1993, but subsequently declined progressively to 19.5 per cent in 1999 due to increasing competition from other developing economies. In particular, Latin America has re-emerged as an attractive location for FDI since the mid-1990s. Internally, the drop since 1997 can be attributed to the slow-down in economic growth and excess capacity in some of the manu-facturing industries due to over-investment in the past decade (UNCTAD, 2000a). Given the importance of Japanese Direct Investment (JDI) in China and the ASEAN-5 economies, particularly in the electronics sub-sector, the future of JDI in these countries will undoubtedly affect the process and pace of industrial re-structuring. Based on Table 8, JDI in the ASEAN-5 economies have fluctuated over time. As analyzed in Tham (2001), JDI in these economies were affected by the macro-economic conditions in Japan as well as the strength of the yen. For example, the decline in the rate of growth of JDI for the ASEAN-5 can be traced to the fall in outflows of JDI due to the bursting of the bubble economy in 1991 and its subsequent impact on the ability of Japanese corporations’ ability to invest abroad. In contrast the strong yen caused the second boom in JDI after 1993 while the financial crisis reduced JDI sharply in 1998. Post-crisis, JDI still registered a negative growth rate for 1999 in the ASEAN-5 economies as a whole, although both Malaysia and Singapore have recovered inflows of JDI in their respective economies (Table 8). In contrast, JDI in China exhibited strong growth in the first half of the 1990s and continuous negative growth between 1996-99 (Table 8). The initial decline in 1996/97 may be attributed to the removal of the duty-free status on capital goods imports for foreign investment in April 1996. Subsequent decline in 1998 may in turn be contributed by the adverse impact of the financial crisis on the corporate profits of Japanese MNCs. But, post-crisis, JDI in China has continued to decline in 1999.
Page 61
It would therefore appear that JDI in 1999 is less concentrated in the ASEAN-5 and China than in 1995. In fact Japan has renewed its manufacturing interest in the EU after the Asian financial crisis. Given the current economic problems in the Japanese economy and the projected low growth rates not just for this year but also for the near future, the prospect of recovering high rates of growth of JDI in the ASEAN-5 in total remains dim. As China's manufacturing sector is already largely open to foreign investors, the accession is not expected to generate further massive inflows of FDI into this sector in the immediate term. Increasing inflows of FDI in China's manufacturing sector will require improvements in areas that can affect the FDI environment such as the legal and physical infrastructure of the country. On the other hand, inflows of FDI will increase for the service sector in China, as the accession will undoubtedly open up this sector eventually. More importantly, the future ability to compete in technology-intensive exports, particularly in high-technology exports rests on the respective government’s ability to provide the suitable environment for the kind of FDI that each aspires to attract in order to upgrade the technology capabilities of their countries. In this context, both the human resource base and technologi-cal effort of the countries play critical roles in attracting and absorbing the requisite technol-ogy from the MNCs (UNCTAD, 2000b). Table 9 shows foreign investment from China into the Malaysian manufacturing sector between 1986-98. In 1987, this investment was a mere RM0.1 million that was channeled into only one sector, that is the rubber products sub-sector. By 1998, investment from China amounted to RM87.1 million or 0.1 per cent of total foreign investment in Malaysia. While rubber products continue to be the focus of this investment, investment in basic metal products have taken first place, accounting for 44 per cent of total investment from China while the share of rubber products was 40 per cent in 1998. The other 2 sectors of interest to investors from China are plastic products and food manufacturing. In 2000, the Malaysian Industrial Development Authority (MIDA) reported a new investment project from China was approved for a large-scale pulp and paper mill, involving RM2,708 million or 9 per cent of the total FDI approved for that year. Nevertheless, with a large domestic market at home, it does not seem likely that China will be interested in the much smaller Malaysian market, except perhaps for FDI that is in search of natural resources such as rubber or wood. However the enlarged AFTA market may attract market-seeking investment, although Malaysia will face competition from other ASEAN member countries in this area. Investment outflows from Malaysia or reverse investment, gained prominence after the reces-sion in 1985. Malaysian investors were encouraged to venture into business and investment opportunities abroad with the higher income and profits realized as a result of a decade of strong growth (1987-97) as well as the need to form strategic alliances. Furthermore, rising labor costs and labor shortages domestically have led Malaysian investors to relocate to labor surplus economies. This has, simultaneously, been accelerated by the liberalization of pre-viously closed economies like China and Vietnam. The government, concurrently, has also actively encouraged reverse investment via the provision of various incentives. Nevertheless the accession may not imply greater opportunities for Malaysian investors. First, as shown in Table 10, the main destinations for Malaysian investors are Singapore, United States, United Kingdom and Hong Kong. Investment in China constituted 1.5 per cent of total Malaysian investment abroad in 1992 and this peaked at 6.8 per cent in 1996.

Page 62
Subsequently its share fell to 3.1 per cent in 1997 and further still to 0.9 per cent with the economic downturn in that year. With the recovery of the economy in 1999, its share increased to 1.9 per cent although the absolute amount is smaller than that achieved for 1994. So from a historical perspective, China is a relatively unimportant destination. Second, Malaysia is also a minor player in the China market. Henley, et al; (1999) reported that the main investor in China between 1985-96 is Hong Kong and Macau, which together accounted for 58 per cent of FDI flows into China. Second was Taiwan (8.4 per cent), followed by Japan (8.0 per cent) and the USA (7.9 per cent). Therefore many foreign competitors that are global players have already established a presence in China since the economy first opened up in the late 1970s. In 1995, the Economic Intelligence Unit (EIU, 1995) already reported intense competition with crowded sectors and low margins. This together with mounting competition from local players, particularly from the construction and consumer products sectors, imply that new start-ups will end up either chasing competition or are being chased out. 5. Trade and Investment Barriers Malaysia faces with China The main trade barriers reported by MATRADE are tariffs, value-added and other taxes and non-tariff barriers. In particular palm oil (an export niche in 1995 and 1998) is subject to import quota, licensing, special register, import check and inspection. Moreover, tariffs for import of palm oil outside the quota are 30 per cent with 13 per cent VAT. For non-tariff barriers (NTBs), a total of 372 items or 5 per cent of the total import tariff lines are reported to be subject to quota, licensing and other import control measures. The main NTBs reported are:
§ Lack of customs uniformity § Unnecessary import licensing requirements § Restrictions on trading activities § Uncertain standards, testing, labeling, and certification requirements, § Unpredictable laws between federal, provincial, and state government for joint-
venture co-operations § Processing trade § Export Subsidies § Non-transparent government procurement § Infringement of Intellectual Property Rights
5.1 Survey Response1 During August/September 2001, a survey of Malaysian companies was conducted to elicit their opinions on this issue2. A questionnaire was sent out to the different associations to be forwarded to their respective members for response. However out of the 55 companies that responded, only 40 have trading and or investment ties with China. Table 11 profiles the 40 respondents who participated in this survey. The majority of the respondents (67.5 per cent) have some form of trading ties (that is export and/ import) with China, while 25 per cent have
1 The assistance of C.S. Liew from the Statistics Department in the Faculty of Economics, The National University of Malaysia, in processing the survey response, is gratefully acknowledged. 2 According to MATRADE record, the number of registered companies that have trading ties with China are 372 and according to MITI record, there are 31 companies that have investment in China.

Page 63
both trading and investment ties with China. Out of the 22 companies with subsidiaries, 30 per cent have their corporate headquarters in Malaysia and another 12.5 per cent have their headquarters in Japan. In terms of the vintage, 38.5 per cent are between 11-20 years old, while an equal number of companies are either more than 20 years old or less than 11 years old. Further 59 per cent of the companies are wholly local owned with the majority (71.4 per cent) being private companies. Hence, in summary, the respondents are mainly Malaysian private companies that have been operating between 11-20 years. The main activity of the majority of these companies are in manufacturing (82 per cent) with 12.8 per cent, respectively, in textiles and textile products, chemical and chemical products, and electrical and electronic products. However, in terms of the main activities in China, non-manufacturing activities predominate (39 per cent) while in the case of manufacturing activities, 15.4 per cent of the respondents are located in the electrical and electronic sub-sector. Other manufacturing activities include food manufacturing, beverages and tobacco, furniture and fixtures, chemical and chemical products, machinery manufacturing and trans-port equipment (7.7 per cent each respectively). In Table 12, out of the 27 companies with only trading ties with China, 55.6 per cent are engaged in exports only while 33.2 per cent import only from China. Only 11 per cent have both export and import ties with China. Similarly there are more companies that are export-ing to China than importing in the case of the companies with both investment and trading ties with China. However, the amount exported and imported is rather small (less than 10 per cent) for 48 per cent of the companies that export only with China and 40 per cent of compa-nies that have both exports and imports with China. Similarly, imports constitute less than10 per cent of the total imports for 46 per cent of the companies that import only from China and 60 per cent of the companies that import and export from China. Thus China is a minor trading partner for the majority of these companies. Table 13 tabulates the response of the companies with regards to tariff and non-tariff barriers. More than 1/3 of the respondents listed tariffs as a very important barrier. Of the non-tariff barriers, more than 1/3 chose uncertain standards, testing, labeling and certification require-ments, lack of customs uniformity, and restrictions on trading activities as very important barriers. However, unpredictable laws have the largest number of respondents (43 per cent) who chose this barrier as very important. Of all the barriers listed, 20-23 per cent of the respondents did not find quotas, and export subsidies to be relevant at all. In the case of investment barriers, 62 per cent of the respondents found the weak legal infrastructure to be a very important barrier while 38 per cent found the quality of the workforce to be a very important barrier (Table 14). More than half (54 per cent) found the poor physical infra-structure to be a moderately important barrier. In Table 15, between 50-55 per cent of the respondents found the use of international standards as well as simplifying customs proce-dures to be very important measures for facilitating trade with China. 52.5 per cent of the respondents also listed the formation of an ASEAN-China Free Trade Area to be another very important measure for facilitating trade. To summarize, in the case of trade barriers, unpredictable laws and uncertain standards have the largest number of respondents that rated it as a very important trade barrier. Weak legal infrastructure has the largest number of respondents that ranked it as a very important barrier. Trade and facilitation measures that have the largest number of respondents rating it as very important are simplifying customs procedures, using international standards, and the forma-tion of an ASEAN-China Free Trade Area.

Page 64
6. Recommendations While China’s revealed comparative advantage is growing rapidly in several product groups, Malaysia still has higher RCA for some of the products. Given the current relatively small percentage of trade between Malaysia and China, short and medium-term measures should target at improving the export opportunities for Malaysian companies to China. While tariff reductions have been scheduled under the bilateral negotiations between Malaysia and China, based on the survey response, the facilitation of trade between the two countries will be greatly enhanced by using international standards as well as by simplifying customs proce-dures in China. In this respect, it will assist Malaysian exporters and at the same time increase transparency, if China improves the dissemination of information on the standards and customs procedures used across the board and adhere to these specified standards and procedures. Any changes should be transmitted rapidly to all relevant government depart-ments of the trading partners with China (for example, MITI and MATRADE in Malaysia) for circulation among the Malaysian companies that are exporting or planning to export to China. At the level of the WTO, among the new issues that have been brought up for further nego-tiations in the New Round, trade facilitation measures that aim at cutting red tape and bureau-cratic formalities will also assist Malaysia and other countries that export to China (Laird, 2000). Certainly the establishment of a simplified clearance system for exports and imports such as one-stop shops or single windows for documentation will attract the support of the business community. While the formation of an ASEAN-China Free Trade Area (FTA) is also deemed as very important, this is a long-term measure and the actual modalities for an FTA are beyond the current scope of this study. Given that the legal infrastructure has also been rated as a very important trade and investment barrier, China’s accession into the WTO will also expedite improvements in this area, especially in the area of protection for investors and intellectual property. This will be an increasingly important issue as changes in technology further increases the rapid growth in using electronic commerce for facilitating international trade.

Page 65
References Economic Intelligence Unit, 1995. Moving China Ventures out of the Red into the Black:
Insights from the Best and Worst Performers. Custom Publishing Reports, Anderson Consulting.
Eglin, R., 2000. Challenges and Implications of China joining the WTO: What WTO Acces-
sion Means. WTO Secretariat, Geneva. Hatzichronoglou, T., 1997. Revision of the High Technology Sector and Product Classifica-
tion. STI Working Papers 1997/2. Paris: OECD. Henley, J., Kirkpatrick, C. and G. Wilde, 1999. Foreign Direct Investment in China: Recent
Trends and Current Policy Issues. The World Economy. Vol. 22, No. 2 March: 223-243. Ianchovichina, E., Martin, W., and Fukase, E., 2000. Assessing the Implications of Merchan-
dise Trade Liberalization in China's Accession to WTO. Paper presented at the Round-table on China's Accession to the WTO, Shanghai, July, 10-11.
International Monetary Fund, 2000. Direction of Trade Statistics. Washington D.C. Laird, S., 2000. The WTO Agenda and the Developing Countries. CREDIT Research Paper,
00/5. University of Nottingham. Malaysia, 2000. External Trade Statistics. Kuala Lumpur. Malaysian Industrial Development Authority (MIDA), 2001. Statistics on the Manufacturing
Sector. Kuala Lumpur: MIDA. Palanca, Ellen, 2001. China’s Changing Trade Patterns: Implications for ASEAN-China
Trade. Chapter 4 in Palanca, E. (ed.), China’s Economic Growth and the ASEAN. Manila: PASCN.
Ragayah Hj Mat Zin, 1999. Malaysian Reverse Investments: Trends and Strategies. Asia
Pacific Journal of Management, Vol. 16: 469-496. --------------------------, 2001. Pelaburan Malaysia di Pentas Global. (Malaysian Investment in
the Global Arena). Mimeo. Tham, S.Y. and Loke, W.H., 1998. WTO and Regionalism: Opportunities and Challenges
for Malaysian Industries. Paper presented at Workshop on Community Development in the Global Environment, 9-10 December, Bangi.
Tham, S.Y., 1998. Competition and Cooperation for Foreign Direct Investment: An ASEAN
Perspective. Asia-Pacific Development Journal, Vol. 5, No. 1, June:9-36. Tham, S.Y., 2000. Competitiveness of Malaysian Exports. Paper presented at the MIER
National Outlook 2001 Conference, Shangri-La Hotel, Kuala Lumpur, 20-22 November.

Page 66
--------------, 2001. Can Malaysian Manufacturing Compete with China in the WTO? Asia-Pacific Development Journal (forthcoming).
UNCTAD, 2000a. World Investment Report, 2000. Geneva: UNCTAD. UNCTAD, 2000b. The Competitiveness Challenge: Transnational Corporations and Indus-
trial Restructuring in Developing Countries. Geneva: UNCTAD. Wang, Z., 1999. The Impact of China's WTO Entry on the World Labour-Intensive Export
Market: A Recursive Dynamic CGE Analysis. The World Economy, Vol. 22, No.3, May: 379-405.
World Trade Organization, 2001. Annual Report, 2001. Geneva: WTO.

Page 67
Table 1. Malaysia’s Trade with China: Average Growth Rate: 1980-99 (in per cent) 1980-1988 1988-1996 1997 1998 1999 Malaysia Export to China Total export
8.44 6.28
20.80 17.80
-1.6 0.5
7.7 -6.9
16.2 15.2
Malaysia China’s export to Malaysia Malaysia’s total import
6.69 5.51
20.50 21.47
39.81 0.78
-17.02 -26.2
5.02 11.3
Source: 1980-96 - Palanca (2001), 1997-99 - International Monetary Fund 2000
Table 2. Balance of Trade: China and Malaysia 1980 -1999 (In US$ million)
Export to Malaysia Import from China Balance of Trade 1980 217 184 33 1985 161 186 -25 1990 619 370 249 1991 639 528 111 1992 772 645 127 1993 1204 704 500 1994 1933 1118 815 1995 1889 1281 608 1996 1882 1374 508 1997 1852 1921 -69 1998 1994 1594 400 1999 2318 1674 644
Source: International Monetary Fund

Page 68
Table 3. Malaysia-China Trade Commodity Structure, 1980-1999
Rank 1980 1988 1996 1999*
China’s Top 10 Export Commodities to Malaysia
1 292 Crude Veg Matrls Nes 221 Oil Seeds Nuts Kernls 722 Elec Pwr Mach Switch 764 2 054 Veg Etc Frsh Smply Prsvd 081 Animal Feed Stuff 891 Sound Recorders 044 3 013 Meat Tinned Nes or Prepd 321Coal Coke Briq 719 Mach Nes Nonelec 772 4 641 Paper Paperbrd 044 Maize Unmill 729 Elec Mach Nes 759 5 042 Rice 652 Cotton Fabrics Woven 661 Cement Etc Bldg prod 776 6 081 Animal Feed Stuff 641 Paper Paperbrd 514 Othr Inorganic Chemls 716 7 051 Fruit Frsh Nuts Frsh Dry 653 Woven Textl Noncot 724 Telecom Eqpt 778 8 652 Cotton Fabrics Woven 541 Medicl Etc Prods 673 Iron Steel Shapes 523 9 075 Spices 283 Nonfer Base Mtl Ore Conc 652 Cotton Fabrics Woven 793 10 653 Woven Textl Noncot 514 Othr Inorganic Chemls 715 Metal Work Mach 042
China’s Top 10 Export Commodities to Malaysia
1 231 Rubber Crude Synth 231 Rubber Crude Synth 422 Fixed Veg Oil Nonsoft 422 2 242 Wood Rough 242 Wood Rough 631 Veneers Plywood Etc 776 3 422 Fixed Veg Oil Nonsoft 422 Fixed Veg Oil Nonsoft 729 Elec Mach Nes 247 4 266 Synth Regen Febre 631 Veneers Plywood Etc 231 Rubber Crude Synth 634 5 684 Aluminium 732 Road Motor Veh 651 Textl Yarn and Thread 759 6 332 Petrolm Prods 652 Cotton Fabrics Woven 581 Plastic Matrls Etc 764 7 243 Wood Shaped 331 Crude Petrolm Etc 719 Mach Nes Nonelec 334 8 262 Wool Animal Hair 243 Wood Shaped 714 Office Mach 342 9 729 Elec Mach Nes 072 Cocoa 242 Wood Rough 752 10 653 Woven Textl Noncot 719 Mach Nes Nonelec 653 Woven Textl Noncot 431
Source: 1980-1996 – Palanca (2001); 1999 – Malaysian External Trade Statistics, 2000.

Page 69
Table 4. Export & Import Niches for Malaysia, 1995
EXPORT NICHES IMPORT NICHES Malaysia, 1995 Cocoa
Margarine, shortening Crude rubber Wood Uranium, thorium ore conc. Gas Fixed vegetable oils non-soft Processed animal & vegetable oil Materials of rubber Veneers, plywood, etc. Non-metal mineral manufactures Tin Office mach. Elec. mach. nes.
Fish tinned prepared Vegetables, etc. pres. prep. Tea Silk Other crude minerals Crude animal matter nes. Coal coke briq. Other inorganic chemicals Explsvs. pyrotech. prods. Leather manufactures Fur skins Cotton fabrics woven Woven textl. noncotton Textiles etc prods. nes. Floor covr. tapestry etc. Cement etc. bldg. prod. Pottery Iron Lead Nonfer base metals nes. Cutlery Base mtl. hhold eqpt. Dom. elec eqpt. Railway veh. Plumb heatlight eqpt. Travel goods hbags Cloth not fur Fur etc.clothes prod. Footwear Watches and clocks Toys sporting goods etc. Gold & silver jewelry Other manfact. goods Zoo animals, pets
Source: Based on RCA tables from NAPES Database

Page 70
Table 5. Export & Import Niches for Malaysia, 1998
Malaysia, 1998 Cocoa
Spices Margarine, shortening Crude rubber Wood Gas Fixed Veg. Oil non-soft Processed animal & vegetable oil Veneers, plywood, etc. Tin Office Mach. Telecom equipment parts Sound recorders
Fish etc. tinned prepared Rice Veg. etc. prsvd. prepd. Tea mate Silk Other crude minrls Crude animal matter nes. Coal, coke briq. Other inorganic chems. Explsvx pyrotech prod. Leather manufactures Fur skins Cotton fabrics woven Woven textl. noncot. Textile etc prod. nes. Cement etc bldg. prod. Pottery Iron, Lead, Zinc Nonfer. Base metals nes. Cutlery Base mtl. hhold. eqpt. Dom. elec. eqpt. Railway veh. Road veh. nonmotor Plumb heat lght eqpt. Travel goods hbags Cloth not fur Fur etc.clothes prod. Footwear Watches and clocks Plastic nes. Toys sporting goods etc. Other manfact. goods
Source: Based on RCA tables from NAPES Database

Page 71
Table 6. Potential Competing Product Groups, 1995 & 1998.
1995 1998
Live Animals Eggs Spices Wood manuf. nes. Textile, yarn and thread Tin Elec. pwr. mach. switch Telecom. eqpt. Dom. elec.eqpt. Furniture Sound recorders Gold, silver jewelry
Live animals Spices Fuel wood charcoal Wood manufac.nes. Textile, yarn and thread Tin Elec. pwr. mach. switch Telecom. eqpt. Furniture Sound recorders Gold, silver jewelry
Source: Same as in Table 2 and 3
Table 7. Foreign Direct Investment Inflows in ASEAN-5 and China, 1987-99 (US$ m)
1987-92 (Ann.Av.)
1993 1994 1995 1996 1997 1998
1999
Indonesia 999 2,004 2,109 4,346 6,194 4,677 -356 -3270 Malaysia 2,387 5,006 4,581 5,816 7,296 6,513 2,700 3,532 Philippines 518 1,238 1,591 1,459 1,520 1,249 1,752 737 Singapore 3,674 4,686 8,550 7,206 8,984 8,085 5,493 6,984 Thailand 1,656 1,805 1,343 2,000 2,405 3,732 7,449 6,078 ASEAN-5 Total 8,235 14,739 18,174 20,827 26,399 24,256 17,038 14,064 China 4,652 27,515 33,787 35,849 40,180 44,236 43751 40400 Developing Countries 35,326 78,813 104,920 111,884 145,030 178,789 179,481 207,619 World 173,530 219,421 255,988 331,844 377,516 473,052 680,082 865,487 China as % of developing world
13.2 34.9 32.2 32.0 27.7 24.7 24.4 19.5
ASEAN as % of developing world
23.3 18.7 17.3 18.6 18.2 13.6 9.5 6.8
Ratio of ASEAN to China 1.8 0.5 0.5 0.6 0.7 0.5 0.4 0.3 Source: UNCTAD, World Investment Report, 1999 and 2000

Page 72
Table 8. Japan’s Manufacturing Investment To ASEAN Countries and China, 1990-1999
Year 1990
1991
1992
1993
1994
1995
1996
1997
1998
1999
Country Y100j % Y100j % Y100j % Y100j % Y100j % Y100j % Y100j % Y100j % Y100j % Y100j %
1. Thailand 1045 0 816 -21.9 389 -52.3 485 24.7 583 20.2 966 65.7 1047 8.4 1662 58.7 987 -40.6 686 -30.5 2. Indonesia 781 0 795 1.8 1187 49.3 277 76.7 833 200.7 1005 20.6 1606 59.8 1381 -14 694 -49.7 559 -19.5 3. Philippines 290 0 217 -25.2 138 -36.4 146 5.8 321 119.9 558 73.8 434 -22 441 1.6 404 -8.4 383 -5.2 4. Malaysia 857 0 839 -2.1 607 -27.7 759 25 583 -23.2 481 -17.5 467 -2.9 559 19.7 487 -12.9 513 5.3 5. Singapore 394 0 240 -39.1 177 -26.3 227 28.2 353 55.5 449 27.2 481 7.1 1184 146 197 -83.4 567 187.8 6. Vietnam 1 0 0 0 9 0 18 100 143 694.4 161 12.6 301 87 346 15 32 -90.8 72 125 ASEAN 3368 0 2907 -13.7 2507 -13.8 1912 -23.7 2816 47.3 3620 28.6 4336 19.8 5573 28.5 2801 -49.7 2780 -6.7
7. China 237 0 420 77.2 838 99.5 1587 89.4 1942 22.4 3368 73.4 2032 -39.7 1857 -8.6 1027 -44.7 603 -41.3 * Total Japanese Manufacturing Investment 22718 16919 13038 12766 14426 18236 22821 23731 15686 47193 Note: Figures in % show the investment growth rate for each country from year to year Source: Japan’s Statistics, Ministry of Finance, http://www.mof.go.jp/english/fdi/

Page 73
Table 9. Foreign Investment from China (Paid-Up) in Companies in Production by Industry in Malaysia, 1986-1998
1986 1987 1988 1989 1990 1991 1992 Industry RM
million % RM
million % RM
million % RM
million % RM
million % RM
million % RM
million %
Food Manufacturing 0 0 0 0 0 0 0 0 0 0 0 0 0 0 Beverages & Tobacco 0 0 0 0 0 0 0 0 0.0 1.7 0 0 0 0 Textiles & Textiles Product 0 0 0 0 0 0 0 0 0 0 0 0 0 0 Leather & Leather Products 0 0 0 0 0 0 0 0 0 0 0 0 0 0 Wood & Wood Products 0 0 0 0 0 0 0 0 0 0 0.4 10.6 0.4 6.3 Furniture & Fixtures 0 0 0 0 0 0 0 0 0 0 0 0 0 0 Paper, Printing, Publishing 0 0 0 0 0 0 0 0 0 0 0 0 0 0 Chemicals & Chemicals Product 0 0 0 0 0 0 0 0 1.3 90.8 0 0 0 0 Petroleum & Coal 0 0 0 0 0 0 0 0 0 0 0 0 0 0 Rubber Products 0 0 0.1 100 0 0 0 0 0.1 7.5 2.6 68.9 5.2 81.2 Plastic Products 0 0 0 0 0 0 0 0 0 0 0 0 0 0 Non-Metallic Mineral Products 0 0 0 0 0 0 0 0 0 0 0 0 0 0 Basic Metal Products 0 0 0 0 0 0 0 0 0 0 0 0 0 0 Fabricated Metal Products 0 0 0 0 0 0 0 0 0 0 0 0 0 0 Machinery Manufacturing 0 0 0 0 0 0 0 0 0 0 0.8 20.5 0.8 12.5 Electrical & Electronic Products 0 0 0 0 0 0 0 0 0 0 0 0 0 0 Transport Equipment 0 0 0 0 0 0 0 0 0 0 0 0 0 0 Scientific & Measuring Equipment 0 0 0 0 0 0 0 0 0 0 0 0 0 0 Miscellaneous 0 0 0 0 0 0 0 0 0 0 0 0 0 0 Total 0 0 0.1 100 0 0 0 0 1.4 100 3.8 100 6.4 100

Page 74
Table 9. Continued 1993 1994 1995 1996 1997 1998
Industry RM million
% RM million
% RM million
% RM million
% RM million
% RM million
%
Food Manufacturing 0 0 0.5 5.7 0.4 1.7 0.4 1.9 0.5 1.5 0.5 2.2 Beverages & Tobacco 0 0 0 0.0 0.0 0.0 0 0.0 0 0.0 0 0.0 Textiles & Textiles Product 0 0 0 0.0 0.0 0.0 0 0.0 0 0.0 0 0.0 Leather & Leather Products 0 0 0 0.0 0.0 0.0 0 0.0 0 0.0 0 0.0 Wood & Wood Products 0.4 5.7 0.4 4.6 0.5 2.2 0.4 1.9 0.4 1.2 0.4 1.8 Furniture & Fixtures 0 0.0 0 0.0 0.4 1.6 0 0.0 0 0.0 0 0.0 Paper, Printing, Publishing 0 0.0 0 0.0 0.0 0.0 0 0.0 0 0.0 0 0.0 Chemicals & Chemicals Product 0 0.0 0 0.0 13.5 58.7 0 0.0 0 0.0 0 0.0 Petroleum & Coal 0 0.0 0 0.0 0.0 0.0 0 0.0 0 0.0 0 0.0 Rubber Products 5.8 82.9 5.7 65.5 5.7 24.8 8.2 38.1 7.9 24.3 7.9 35.1 Plastic Products 0 0.0 0 0.0 0.0 0.0 0 0.0 2.5 7.7 2.5 11.1 Non-Metallic Mineral Products 0 0.0 0.3 3.4 0.0 0.0 0 0.0 0 0.0 0 0.0 Basic Metal Products 0 0.0 0 0.0 0.0 0.0 10 46.5 18.7 57.5 8.7 38.7 Fabricated Metal Products 0 0.0 0 0.0 0.0 0.0 0 0.0 0 0.0 0 0.0 Machinery Manufacturing 0.8 11.4 0.8 9.2 0.8 3.4 0.8 3.7 0.8 2.5 0.8 3.6 Electrical & Electronic Products 0 0 1 11.5 1.0 4.3 1 4.7 1 3.1 1 4.4 Transport Equipment 0 0 0 0.0 0.7 3.0 0.7 3.3 0.7 2.2 0.7 3.1 Scientific & Measuring Equipment 0 0 0 0.0 0.0 0.0 0 0.0 0 0.0 0 0.0 Miscellaneous 0 0 0 0.0 0.0 0.0 0 0.0 0 0.0 0 0.0 Total 7 100 8.7 100.0 23.0 100.0 21.5 100.0 32.5 100.0 22.5 100.0
Source: MIDA, Statistics On The Manufacturing Sector, Various Years

Page 75
Table 10. Gross Malaysian Investment Overseas in Selected Countries, 1992-96
1992 1993 1994 1995 1996 1997 1998 1999 Countries
RM million Singapore 258.6 686.1 995 2185 1806 1783 2081 1634 USA 93.9 627.6 624 544 1416 1334 1650 1017 UK 63.0 372.2 444 793 1308 1716 512 568 Hong Kong 336.7 733.9 1892 816 769 936 162 160 People’s Republic of China
20.1 112.2 217 331 514 327 75 201
Total 1312.7 3412.4 6799 7936 10715 10458 8413 10368 Source: Ragayah, 1999 and 2001

Page 76
Table 11. Profile of Malaysian Firms Trading & / Investing in China, 2001
Number (%) Number % Status of company Investment only Trading only Investment &Trade Total Corporate Headquarters Malaysia Japan Austria Italy Singapore U.K. USA No Subsidiary Total Year Established* Less than 11 years 11-20 years More than 20 years Total Ownership Structure* Wholly Local Wholly Foreign Majority Local Majority Foreign Total Type of Ownership* Partnership Private Firm Public Listed Total
3 27 10 40
12 5 1 1 1 1 1
18 40
12 15 30 39
23 7 5 4 39
6 25 4 35
7.5 67.5 25.0
100.0
30.0 12.5
2.5 2.5 2.5 2.5 2.5
45.0 100.0
30.7 38.5 30.8
100.0
59.0 17.9 12.8 10.3
100.0
17.1 71.4 11.4
100.0
Main activity of Company* Food Manufacturing Beverages & Tobacco Textiles & Textile Products Wood & Wood Products Furniture & Fixtures Chemicals & Chemical Products Plastic Products Non-Metallic Min. Products Fabricated Metal Products Machinery Manufacturing Electrical & Electronic Products Transport Equipment Scientific & Measuring Equipt. Other Manufacturing Non-Manufacturing Total Main Activity in China Food Manufacturing Beverages & Tobacco Furniture & Fixtures Chemical & Chemical Products Machinery Manufacturing Electrical & Electronic Products Transport Equipment Non-Manufacturing Total
2 1 5 2 3 5 1 1 1 1 5 1 1 3 7
39
1 1 1 1 1 2 1 5
13
5.1 2.6
12.8 5.1 7.7
12.8 2.6 2.6 2.6 2.6
12.8 2.6 2.6 7.7
17.9 100.0
7.7 7.7 7.7 7.7 7.7
15.4 7.7
38.5 100.0
Note: *Does not add up to 40 due to missing values Source: Survey Response, 2001

Page 77
Table 12. Trade with China Status of company
Export Only Import Only Export & Import
Total
Trading with China only
15 (55.6)
9 (33.3)
3 (11.1)
27 (100.0)
Investment &
Trading 6
(60.0) 2
(20.0) 2
(20.0) 10
(100.0)
Total 21 (56.8)
11 (29.7)
5 (13.5)
37 (100.0)
Notes: Numbers in parenthesis show as percentage of the total Source: Survey response, 2001
Table 13. Tariff and Non-Tariff Barriers
not relevant at all
not important
slightly important
moderately important
very important
not applicable Total
Tariffs 2 2 5 14 15 2 40 Quotas 9 5 7 9 7 3 40 Import Licensing Reqts. 7 2 4 15 10 2 40 VAT 4 5 10 10 7 4 40 Customs 2 1 8 13 14 2 40 Restrictions on Trading 3 3 7 9 14 4 40 Uncertain Stds. Etc. 3 2 7 11 16 1 40 Unpredictable Laws 1 1 3 16 17 2 40 Export Subsidies 8 1 7 11 9 4 40 Govt. Procurement 6 1 10 10 9 4 40 Infringement of IPR 5 3 3 12 15 2 40 Inefficient Bureaucracy 1 2 11 12 13 1 40 Poor Enforcement 1 1 10 12 14 2 40
Source: Survey response, 2001
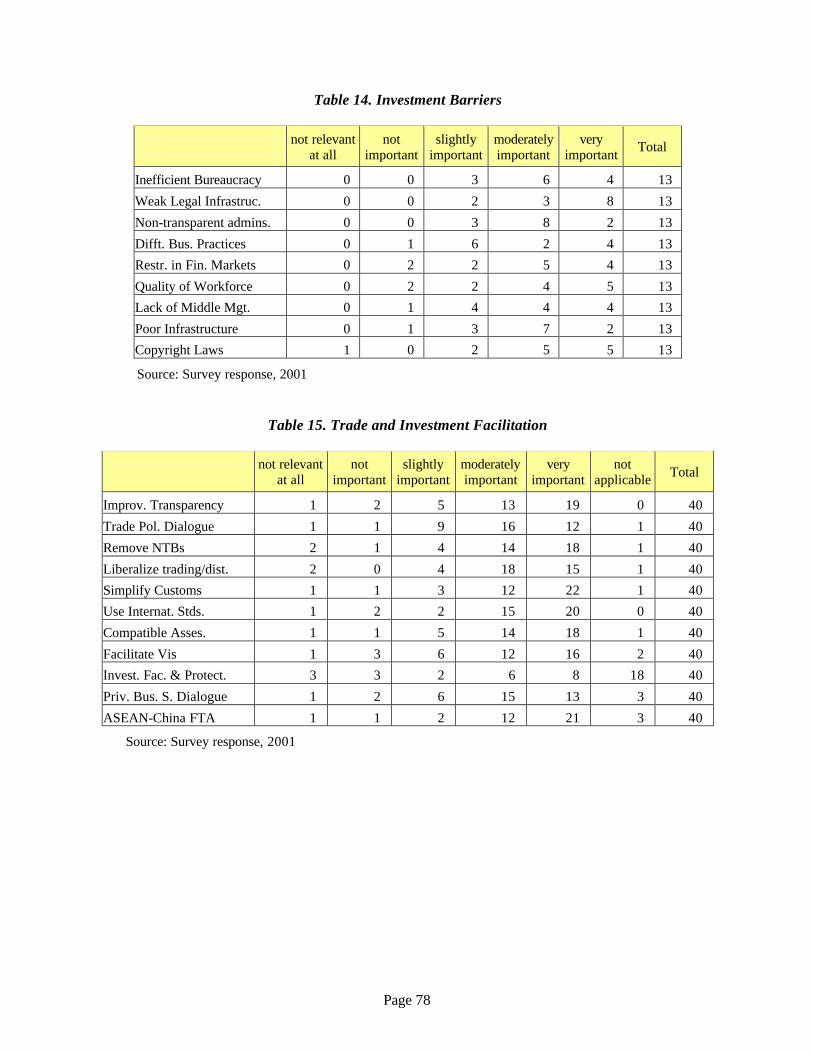
Page 78
Table 14. Investment Barriers
not relevant at all
not important
slightly important
moderately important
very important Total
Inefficient Bureaucracy 0 0 3 6 4 13 Weak Legal Infrastruc. 0 0 2 3 8 13 Non-transparent admins. 0 0 3 8 2 13 Difft. Bus. Practices 0 1 6 2 4 13 Restr. in Fin. Markets 0 2 2 5 4 13 Quality of Workforce 0 2 2 4 5 13 Lack of Middle Mgt. 0 1 4 4 4 13 Poor Infrastructure 0 1 3 7 2 13 Copyright Laws 1 0 2 5 5 13
Source: Survey response, 2001
Table 15. Trade and Investment Facilitation
not relevant at all
not important
slightly important
moderately important
very important
not applicable Total
Improv. Transparency 1 2 5 13 19 0 40 Trade Pol. Dialogue 1 1 9 16 12 1 40 Remove NTBs 2 1 4 14 18 1 40 Liberalize trading/dist. 2 0 4 18 15 1 40 Simplify Customs 1 1 3 12 22 1 40 Use Internat. Stds. 1 2 2 15 20 0 40 Compatible Asses. 1 1 5 14 18 1 40 Facilitate Vis 1 3 6 12 16 2 40 Invest. Fac. & Protect. 3 3 2 6 8 18 40 Priv. Bus. S. Dialogue 1 2 6 15 13 3 40 ASEAN-China FTA 1 1 2 12 21 3 40
Source: Survey response, 2001

Page 79
FORGING CLOSER ASEAN-CHINA ECONOMIC RELATIONS IN THE TWENTY-FIRST CENTURY
NATIONAL REPORT
MYANMAR
Khin Ohn Thant National AFTA Unit
Ministry Of National Planning and Economic Development Myanmar
General Background Myanmar has been trading with China since time immemorial. Myanmar shares over 1,200 kilometers long border with China. The border had been amicably demarcated in 1960. Trade along this border has always been brisk and friendly. Current State of Myanmar-China Economic Relations Trade relations between Myanmar and China is typical of that between a least developed and a developing country. Myanmar exports agricultural produce and imports in return, machin-ery and electrical appliances. Overall, Myanmar trades more with ASEAN member countries than with China as indicated by Tables 1 and 2. During the past five years, Myanmar exports 32 percent of the total to ASEAN as compared to 9 percent to China, on the average. The same pattern appears with regards to imports. Myanmar .imports, on the average over the five years, 49 percent of the total from ASEAN in contrast to 11 percent from China. But, one must always bear in mind that Myanmar shares a very long border with China, and given the rough terrain, it is very porous. In terms of FDI, China have not invested much in Myanmar. Over the past five years, it invested to a relatively small tune of U.S. dollars 26 millions. This does not mean China has not helped On the contrary, it has given agricultural and manufacturing machinery and equipment with numerous soft loans and supplier credits. Market Access Opportunities Available to Myanmar Exporters in China At this stage of Myanmar's development, it seems quite meaningless to calculate Revealed Comparative Advantage to identify sectors where market opportunities are likely to open up due to China's accession to the WT0. However, a subjective analysis or some conjecture can be made. Two major areas where Myanmar has a comparative advantage are laid and labour. Myanmar still has a little over 26 million acres of cultivable and fallow land. The Chinese officials have approached Myanmar Government to cultivate our Northeast Region. Myanmar also has abundant cheap and relatively high 1Q and EQ (emotional intelligence) labour resources.
Page 80
This labour force can easily be trained for work that requires higher skills. It is a hunch that labour cost in Myanmar will be lower than that of China. In the ASEAN Secretariat's paper on China's Membership in the. WT0, China’s unit labour cost for textiles and electronics is given as US dollar 0,07. For textiles and apparel, one of two major sectors where China has an edge, preliminary estimates for Myanmar's textiles and garment sectors are US dollar 0.045 and 0.023 respectively The Land and Resources Minister of the People's Republic of China, during a visit to Yangon in July 2001, said that arable land is one quarter of an acre per capita, and that China will not be able to say it has food sufficiency for quite some tune. Myanmar has been filling that "food-gap" in the past and at present. The Minister's words indicate Myanmar can continue its agricultural exports for some time in rite future. Energy is another sector with some prospects. Myanmar has already discovered about 11 trillion cubic feet of gas reserves and exploration work is ongoing under production sharing contracts with international companies Myanmar also has an abundance of hydel electric power, with an estimated potential of 37 thousand megawatts. China, as is known, is a net user of crier There are a number of specialty items for niche markets in China. For example, Myanmar is exporting earthern glaced jars, velvet Myanmar style slippers and decorative items of jade. These products use native skills and know-how, as well as indigenous raw materials. This situation can be exploited for the demand for novelties is bound to increase as China climbs up the economic development ladder. As of now, Myanmar lacks marketing expertise and design capacity. Challenges Faced by Myanmar to Increased Competition by China To start with, Myanmar is not competitive, "period". With inadequate infrastructure, information system and management know-how, Myanmar plays a passive role. Myanmar is a follower instead of being a leader. In the internal market, trade is expected to continue as it is today. Trade between China and Myanmar is more complementary than competitive. Myanmar imports electrical goods, machinery and equipment which are not produced in the country. What Myanmar needs to do is to process the agricultural and forest products to improve the balance of trade with China. Instead of exporting raw vegetables and wood, it can export processed food and value-added timber products. The third country markets for Myanmar will be the ASEAN member countries, not EU, Japan and the US. Moreover, the impact will probably be in the medium term and not now. Myanmar's exports to ASEAN member countries are not duplicating those of China's. China's accession to the WTO will have negative impact on labour - intensive products - deteriorating the terms of trade and pulling down their prices - as supply increase. These will be the products that Myanmar will be promoting in an effort to earn more foreign currency through exporting value-added products.

Page 81
Impact on FDI Flows into Myanmar China's leadership has consistently followed its economic programmes and The international investors know it. Thus, there has been a diversion of investment to China at the expense of ASEAN member countries (excluding Viet Nam), even before the 1997 crisis. After China's membership in the WTO, the momentum of FDI flow will accelerate and the threat of investment diversion will increase as it will become an even more attractive destination of FDI. How much of this threat will apply to Myanmar will depend on the situation on the political front. Despite the economic sanctions and the embargoes, some FDI flowed into Myanmar since it adopted a market oriented economic policy in late 1988. About one-third of the total foreign investment received since then is in the oil and gas sector which requires heavy initial outlays. Leaving this sector aside, the manufacturing sector received the most, around 25 percent of the total. ASEAN member countries accounted for an average 56 percent of the total FDI in the past five years. Recommendations China's accession to the WTO will have a complementary impact on export volumes and terms of trade of labour-intensive products which are, or will be, important export products of Myanmar. China and other more developed countries should Help Myanmar in export diver-sification, capital and human resources development, and infrastructure. The common border between China and Myanmar can provide gateway to land-locked Southwest China. It will be much cheaper for products of this region to reach either South Asia or Europe, via Myanmar. Myanmar already has the basic road, railway and liver networks. What is needed is the improvement and extension of these networks. Improvement of the transport sector will also be consistent with the ON MS Protocol for the development of the quadrangle area. If Myanmar is to act as a gateway to China, it will also need telecommunications. Helping build the physical structures will be a win-win situation. It will facilitate China's exports on the one hand, and help bridge the digital gap for Myanmar on the other hand. Myanmar will do all it can to facilitate the Chinese goods in transit. Trying to implement the ASEAN Agreement on Facilitation of Goods in Transit has given Myanmar the experience in this matter. In as much as Myanmar needs external assistance to maximize the opportunities and mitigate the challenges of what is to come, the country needs to also help itself. It is necessary to bet its house in order 11th economic and export restructuring a matter of top priority.

Page 82
FORGING CLOSER ASEAN-CHINA ECONOMIC RELATIONS IN THE TWENTY-FIRST CENTURY
NATIONAL REPORT
PHILIPPINES
Ellen H. Palanca Department of Economics
Ateneo de Manila University Quezon City, Philippines
I. Philippines-China Trade: 1980-1996 Since the opening up of China in 1979, trade of the ASEAN countries with China has steadily increased at a rate faster than their trade with the rest of the world. The growth has been particularly rapid since the late eighties when China liberalized its trade sector. A decline due to the economic crisis in the region is observed for 1998 but rapid growth in both exports to and imports from China resumed since 1999. The Philippines’ bilateral trade with China followed the same trend of growth. From 1980 to 1996, the Philippines’ exports to China grew at an average annual rate of 13% while imports from China grew at 9%. Most of the increase was from 1988 to 1996 when exports and imports grew at an average annual rate of 22% and 18% respectively (Table 1). Trade balance since 1980 has been in China’s favor, reflecting the negative balance of Philippine total external trade. The commodity structure of the Philippines’ bilateral trade with China from 1980 to 1996 developed from a generally inter-industry basis to a more intra-industry basis. Imports from China were essentially resource-based products and industrial manufactures. On the other hand, the composition of exports to China evolved from food items and resource-based products to industrial manufactures. Substantial intra-industrial trade in the “machine and equipment” category occurred in 1996. China exported “non-electrical machines and tele-communication equipment” while the Philippines exported to China “office and electrical machines.” (Palanca 2001) II. Philippines-China Trade: Recent Developments Total volume of Philippines-China trade is US$1.431 billion for the year 2000. This trade magnitude grew from US$354 million for 1993, at an average annual rate of 22%. This is higher than growth of the total external trade of the Philippines, which was at an annual aver-age of 13% for the same period. The implied increase in the share of China in the Philippines’ external trade has been from 1.22% in 1993 to 2.61% in 1998 and 2.06% in 2000. The share is still not substantial, despite the significant increase in trade volume in last decade. (See Tables 2 & 3.)

Page 83
With respect to trade with China, the Philippines remains a net importer. China is considered to be a source of raw materials, consumer and industrial manufactured products more than it is a market for Philippine products. The negative trade balance with China for the Philip-pines, however, has declined in the last few years. This is due to the rapid increase in total exports and some decline/slower growth in total imports the Philippines experienced in years 1998, 1999, and 2000. Such development can be attributed to the slowdown in domestic eco-nomic activities and a substantial depreciation of the Philippine currency during this period. Trade Structure The structural composition of Philippines-China trade has changed significantly in the last five years. Tables 4 and 5 show merchandise exports and imports respectively of Philippine trade with China from 1996 to 2000 based on the following product groupings: consumer manufactures, food and food preparations, resource-based products, and industrial manufac-tures. In 1996 and 1997, Philippine exports to China were mostly resource-based products, which made up more than 60% of the total. However, in the last few years, these products dropped considerably in their share and were overtaken by industrial manufactures whose share in the total rose from 11% in 1996 to 57% in 2000. Imports from China on the other hand have been mainly industrial manufactures and resource-based products. Collectively these two categories of products occupied 83.4% in 1996 and 74.5% in 20000. The decline in the share of these two categories gave way to more imports of consumer manufactures and food products. The share of the two together increased from 16.1% to 25.0% of its import from 1996 to 2000. Based on the latest statistics, among the industrial manufactured exports of the Philippines to China, most are electronics products, which alone constitute 52% of its total exports to China. Moreover, 97% of the exported electronics products to China are made up of only two items: “semiconductors and other components” and “electronics data processing.” This concentra-tion reflects the structure of the total exports of the Philippines where the concentration of electronics products is even higher—more than 70% in 2000. Major Export Items to China Consumer manufactures to China constitute less than three percent of total Philippine exports to China. In this category of exports to China, apparel for men/boys and women/girls consti-tutes the main item, followed by paper and paper products and furniture. Fresh and processed foods and marine products are important items under food and food preparations which make up 7.7% of the total Philippine exports to China in 2000. Export values for fresh fruits (mangoes and bananas) and processed fruits, as well as fish (particu-larly canned tuna) are significant. Another significant food category is “sauces, condiments, spices, mixes and others.” The Philippines’ exports of resource-based products to China decreased very significantly from 67% in 1996 to only 28% in 2000. The main items in this category are: coconut oil and other coconut products; mineral products which include gold, copper and chrome ores, and other base metal ores and concentrates; seaweeds; marble products; textile yarns, twine and

Page 84
cordages; non-metallic mineral; petroleum products; natural rubber; and refined copper cathodes. The share of industrial manufactured products in total exports to China grew from 11% in 1996 to 57% in 2000. As mentioned earlier, exports in the category are predominantly semi-conductors and electronic data processing items, which collectively constitute 88% of the Philippines’ exports of industrial manufactured products to China. Major Import Items from China Similar to the structure of Philippine exports to China, industrial manufactures also constitute the biggest share (49% in 2000) of China’s exports to the Philippines. However, while Phil-ippine industrial manufactures exports to China concentrates only on electronics (semi-conductors in particular), China’s industrial manufactures to the Philippines cover more items—electronics, machineries and transport equipment; metal manufactures; construction materials; and chemicals. The Philippines’ imports of electronics products cover more than semi-conductors and electronics data processing, but include also medical and industrial electronics, as well as consumer electronics. Resource-based products make up a quarter of China’s total exports to the Philippines. There is evidence of intra-industrial exchanges in many of the resource-based products: mineral products, forest products, textile yarns, twine and cordages, non-metallic mineral, and petro-leum products. A significant resource-based import from China is unmanufactured tobacco. China’s consumer manufactures exported to the Philippines almost doubled in share from 7.2% in 1996 to 13.4% in 2000. They include garments, housewares, toys and dolls, fashion accessories, furniture, footwear, paper and paper products, pharmaceutical products, medical supplies, cosmetics and personal care, cutlery sporting goods, school and office supplies, timepieces, umbrellas and sunshades, cameras and lenses, etc. Food and food preparations from China consist of processed meat, cereals, fresh and processed fruits, processed vegetables, nuts, and fresh fish. The share of this category rose from 8.8% to 11.6% in the last five years. III. Market Access Opportunities in China Available to Philippine Exporters The upcoming entry of China to the World Trade Organization is a milestone in the world economy. Given the production capacity of China’s economy and the size of its market, the implications to the global economy of China trading in a liberalized, transparent and rules-based setting are complex. As a trading partner of China and a competitor in third markets, the Philippines faces both opportunities and challenges. China’s WTO accession commitments are comprehensive ranging from tariff reduction for a wide range of commodities to granting of trading rights to foreign companies to lifting of restrictions on the geographical areas for service operations of foreign banks and insurance, etc. The comprehensive package of market liberalization is expected to increase the opportu-nities of trade with China. Another reason why opportunities are expected to rise after China’s WTO accession is the higher economic growth predicted to follow it. China’s integration into the world economy

Page 85
means greater marketization as well as more trade liberalization and other economic reforms, all of which will contribute to greater efficiency and economic growth. Economic growth implies greater demand for consumer products and services as well as raw materials and other production inputs. Hence with China’s economy becoming more open and its market more expanded there will be more incentives for producers to explore trade areas and fill in niches. A number of products which the Philippines has greater comparative advantage over China are subject to tariff reduction as committed by China in the WTO accession negotiations. Some of these products are already among the Philippines’ major export products to China while others can become potential export products with the reduction/elimination of the present market access barriers. (The tariff reductions for these products are presented as Table 6.) Major Export Products The following are some of the major Philippine exports to China the tariff rates for which have been reduced significantly:
− Seafoods: fish − Fruits: bananas, mangoes, pineapples − Vegetable fats and oils − Coconut milk − Garments − Electronic calculating machines − Accounting machines − Sound-recording tapes − Video tapes − Magnetic discs − Paper and paper products − Input or output units
Potential Export Products There are commodities that, despite the Philippines’ relative comparative advantage in pro-ducing them, may not be part of its exports to China or may not yet have a large market there. One can expect greater market access opportunities for these potential export products following China’s accession to WTO. The lower prices resulting from lower tariffs, plus the expected higer income of the Chinese consumers, who are gradually exposed to foreign cultures, can ensure greater demand for these products. The following products are some of such potential exports:
− Seafoods: shrimps and prawns, mussels, octopus, sea-cucumbers, and jelly fish − Coconuts − Roasted coffee − Chocolates and cocoa products − Biscuits − Prepared and preserved fruits: jams and jellies − Seaweeds and carrageenan − Beer and gin − Tobacco − Jewelry

Page 86
− Furniture − TV and refrigerators − Toys: dolls and accessories, − Video games − Wood products: doors, windows, shingles − Tubes, pipes and hoses − Paper products − Plastics manufactures: office and school supplies, ornamental articles
Trade in Services With China’s accession to WTO, open access is ensured throughout the territory for service trade. Professionals comprise a good part of Philippine labor exports. At present there are many Filipino business professionals such as managers and accountants working for multina-tional corporations and joint ventures in China. Because English is the major medium of instruction in higher education in the Philippines, professionals trained in the country can fit easily into international corporations. When China becomes integrated into the world econ-omy, foreign professionals will not only be allowed access to practice in China, the demand for them will also rise. Job opportunities for professionals like legal consultants, managers, architects, teachers, accountants, and bankers will definitely increase. While most of service exports require cross-border movement, some services to be exported can be performed in the Philippines. Examples are accounting service and publishing service which can be performed in the Philippines with the end products delivered to China through internet or via messenger services. Tourism is another important service trade that the Philippines can promote. Tourism is a service export provided and consumed in the country. The Philippines lags behind Thailand, Malaysia, and Singapore as a destination for the growing number of Chinese tourists. The Philippines can be a potential tourist destination since it is closer to China than these coun-tries and also has a lot of beautiful scenic spots and beaches to offer. The commercial presence in China, the consuming country, of service providers is important for better market information. Such information will benefit the Filipino professionals wanting to work abroad as well as the Chinese companies where the services are needed. IV. Challenges Faced by the Philippines to Increased Competition by China China has many products that it can produce more cheaply than the Philippines. Following accession to WTO, China will face less restriction in its exports. This will create not only a possible “flooding” of China-made goods in the Philippine market, but also the greater need for the Philippines to compete with such cheap goods in the world market. The products (based on SITC categories) that have revealed comparative advantage (RCA value)1 higher for China than the Philippines are: 1. Food and food preparations: canned fish and preserved vegetables, tea, and spices.
1 RCA = (Xij/ Xwj) / (Xi / Xw ) where Xij is country i’s exports of commodity j, Xwj is world’s export of commodity j, Xi is total exports of country i, and Xw is total exports of the world.

Page 87
2. Resource-based products: silk, textile yarn, cotton fabrics, textile products, pottery, pig iron, lead, zinc, tin, non-ferrous base metals, cutlery and base metal household equip-ment.
3. Consumer manufactures: leather manufactures, travel goods, handbags, cloth, footwear, watches and clocks, sound recorders, toys sporting goods, and gold and silver jewelry.
4. Industrial manufactures: inorganic chemicals, explosives and pyrotech products, domes-tic electrical equipment, and railway vehicles.
Increasingly, manufactured goods (consumer and industrial) have constituted a major part of the exchanges between the Philippines and China. Manufactured goods are in general highly differentiated products. A challenge for the Philippines will be to find niches in which it can develop its competitive edge in terms of product differentiation and specialization. One major challenge the Philippines faces is in the area of semi-conductors and other compo-nents which make up more than two-thirds of its total exports. These exports, most of which are manufactured by foreign-funded enterprises, are also the Philippines’ primary exports to China. The concern is that, with the expected increase in foreign investment inflow to China after its accession to the WTO, some of the foreign enterprises in semi-conductor production in the Philippines may move to China. On the other hand, China is emerging as a major global player in information and communication technology. Electronic products involve thousands of items, parts, and accessories and the potential of China as a market for them seems to be increasing. Electronic inputs and products of the Philippines exported to China in the last two years have more than doubled. The demand for information technology is slow-ing down in the United States but experiencing a boom in China. The greater demand for I.T. components in China due to the rise in this sector there may in fact avert some of the negative effect of the current development in the I.T. sector in the United States on the Philippines’ electronics export. V. Impact on FDI Flows To and From China Philippine Direct Foreign Investments to China China is presently the second largest recipient of global capital, the first among developing countries. Further economic liberalization in China after its WTO entry will mean that more of its sectors and territories will be open up for capital inflows. Moreover, operating within the rules-based WTO system, China will address the issues of transparency and consistency in approvals and regulatory processes regarding foreign investments. China’s economic growth, huge population, and incentive package for direct foreign invest-ments have attracted investors from all over the world. Philippine investments in China have been mostly by the ethnic Chinese although the largest investment made in the eighties was by San Miguel Corporation, a non-ethnic Chinese business, in the beer manufacturing. Profit-ability is of course not guaranteed. In the early nineties, a couple of ethnic Chinese invest-ments in the snack foods manufacturing have been very profitable. However, a number of investments in the same period in the real estate sector were not profitable due to the market glut.

Page 88
Recent statistics on Philippine investment projects made in Guangdong and Xiamen reveal that from 1996 to 2000 the number of projects contracted was 35 in the former while the latter had 13. The average contracted amount for investments in both cities is approximately two million U.S. dollars. The information on Guangdong further shows that most of projects were by ethnic Chinese and all 35 of them were in the manufacturing sector. Investing in manufacturing in China may be the solution to the difficulty of selling in China some manu-factured exports, given the cheap production cost of Chinese companies. The greater consumption power of the Chinese after China’s accession to the WTO will be an important incentive to invest in China. Investment inflows will also be allowed in more sectors, particularly service sectors like finance, insurance, and telecommunications. The Philippine government should not consider outward investments of the ethnic Chinese to China as capital flight since the profits from these investments have generally been repatri-ated back to the Philippines. Moreover, for the ASEAN countries in the last couple of decades, it has been observed that those with more investments in China tend also to export more to China (Palanca 2001). This is most likely due to the backward linkage effects on the inputs and services that can be exported to China by the investing country. China’s Direct Foreign Investment Flows to the Philippines China’s foreign direct investments abroad have been very limited. Nevertheless with the excess funds that it has accumulated from the rapid economic growth in the past couple of decades, FDIs from China are gradually increasing. As China becomes integrated with the global economy, the increasing economic liberalization, which means that restructions on outward FDIs will be lifted will certainly have a positive effect on the investment outflows. In the last few years, China’s investments in the Philippines have increased in value (Table 7). At the height of the Asian economic crisis in 1998, when total capital inflow to the Philip-pines dipped significantly, inflow from China increased substantially, reaching over 8% of the Philippines’ total registered FDIs. In 1999 the value of such investments from China rose to over US$111 million, from approximately US$2 million in 1997 and US$72 million in 1998. The majority of such investments are in the commerce sector while the manufacturing and financial sectors also received some significant amounts. Presently some investments in infrastructure development based on build-operate-transfer (BOT) arrangement are under negotiation. VI. Recommendations Specialization, Differentiation and Competitiveness The global integration of China is expected to create more competition for the Philippines with respect to export market and FDI inflows. The effect however does not necessarily have to be negative. Studies have shown that the rise of China in the international economy in the eighties and nineties (before the regional crisis) did not have a negative effect on the competitiveness of the Southeast Asian countries both for trade and investments (Palanca 2001, Tan 2001). During this period China’s rapid growth in exports and FDI inflows was not at the expense of the ASEAN countries. In fact, trade between China and these countries thrived, based on horizontal division of labor in manufactured goods and complementarity in resource-based products. With respect to trade with third countries, China also did not pose a competitive force for the Southeast Asian countries. The total trade volume of each of the

Page 89
ASEAN-5 countries increased at rates higher than that of China. Labor-intensive products dominate China’s and the ASEAN countries’ trade with other countries. However, the market share in third countries have been sustained for the ASEAN countries essentially because their products are sufficiently differentiated from those produced by China. The principle of specialization and innovative differentiation should continue to be the basis for Philippines-China trade relations even as China becomes integrated into the global econ-omy. Competitiveness can be enhanced by specialization and focusing on certain aspects of products such as quality, design and marketing techniques in which the Philippines may have comparative advantage. Such competitive edges will enable the Philippines to compete with China in the Philippines’ internal market, in third country markets, and even in China’s market. Through differentiation and specialization the Philippines has been able to export to third countries and China products the RCAs of which are higher for China than the Philip-pines’. For example, finding it difficult to compete with China in the exports of garments, the Philippines has been specializing in higher-end apparel, focusing on quality and design in which the Philippines has a higher comparative advantage. Competition with China in manufactured exports necessitates that the Philippines achieves a level of basic global competitiveness in terms of labor productivity, efficiency of the government bureaucracy, infrastructure, and even the exchange rate that is comparable with China. Improving global competitiveness is also important in attracting FDIs. In a study on foreign investments in the Philippines, the finding shows that the country’s “attractiveness will no longer be based on a highly protected domestic market but on a combination of several factors which together foster efficiency, productivity and competitiveness in the international market.” (Austria 1998) The recent events in the Philippines demonstrate that the political stability and peace and order situation are also extremely important for foreign investment inflows. Cooperation in Specific Projects The Philippines will be competing with other countries for trade and investment opportunities expected from China’s WTO accession. While developing competitiveness is a necessary condition for the Philippines to compete for these opportunities, engaging in specific coop-eration projects with China can facilitate tapping the increasing economic opportunities. Through such cooperation, both countries will be able to benefit more from China’s further liberalization. Projects focusing on areas of commodity trade, professional service trade, tourism, and investments are recommended.
1. Commodity Trade Enhancement Cooperation The market access opportunities arising from China’s WTO accession are expectedly diverse and wide-range. A systematic identification of market access opportunities can provide information on the product and market niches for traders. This can be done through joint research projects and trade missions. Joint research with China will help Philippine traders explore and identify market and product niches. Exchanges of trade missions will also provide information on products and proce-dures as well as opportunities for contacts with people involved. Philippine trade with China is for the most part limited to the southern part of China. Attempts should be made to target the fast-growing northeastern China, which will probably find Philip-pine tropical products scarce and thus have a higher demand for them.

Page 90
2. Service Export Cooperation China’s WTO entry will mean increased market access for professional services as well as increased needs for them. The Philippines on the other hand is a leading exporter of professional services. Cooperation between the two countries in this respect can facilitate operations of the markets of professional services—i.e., joining the demand and supply forces. One mode of operation to facilitate service export for the Philippines is to have service providers in the host country. Philippine-China cooperation in this respect can be made through joint-venture service provider companies. These companies can more efficiently identify China’s needs and match them with the available supply in the Philippine labor market. Taking actual foothold on China can provide commercial presence and capture niches in the Chinese market for different fields of professional services. Such commercial presence is desirable not only for cross-border services, but also for services that can be performed in the Philippines but the consumption of which will be in China. For professionals who have to move to China, both the Philippines and China, through the service provider companies, can cooperate to make adjustment easier by preparing them with basic language skills and knowledge of the Chinese culture.
3. Tourism Cooperation One special service trade is tourism where service is not “exported” but instead its consumption is done in the country providing the service. Both the Philippines and China have many tourist spots to offer. The marketing of tours available in a country however is best done where the consumers are. The Philippines’ Department of Tourism can cooperate with China’s International Travel Service for exchanges of information and marketing of tours. The two sides can also cooperate to develop tourist spots and infrastructure for tourism. For the Philippines, to tap the Chinese market for its tourism, some factors to focus on are: competitive pricing, visa facilita-tion, and the social and political stability in the country.
4. Investment and Development Cooperation Joint ventures and other forms of investment cooperation have been going on since China opened up two decades ago. Strengthening such cooperation has become more essential than before since greater liberalization will mean increased opportunities for China’s foreign direct investments, both inflows and outflows. Investment coopera-tion between the Philippines and China not only provides capital for the receiving country but also technology that may be more appropriate than those from the advanced countries. While both the Philippines and China are considered developing countries, their technology expertise is complementary. China generally adopts less capital- intensive indigenous production techniques. It excels more in engineering and technical expertise while the Philippines has more experts in accounting, management and marketing.
The investment cooperation need not be limited to commercial ventures. Investments may be in the form of development assistance in areas of environment protection, infrastructure, and agriculture.
Forming an ASEAN-China FTA China’s economic growth and the impending WTO accession are expected to increase competition to the Philippines, particularly for labor-intensive manufactures exporters. How-

Page 91
ever, the opportunities for trade and investments are also expected to multiply. In this respect we can expect that, through greater regional cooperation, bilateral cooperation can be strengthened to tap the trade and investment opportunities more efficiently. Moreover, in the last few decades we witnessed shifts toward regional trade groups in North America and Europe. These trade groups are growing both in terms of the number of members as well as their activities. To a certain extent the multilateral principle of interna-tional trade has been eroded by such regionalism. In the wake of the Asian economic crisis, the value of regional integration for the area has also become more evident. For the ASEAN countries faster economic integration of the member countries may have to be considered together with coordination of economic development and policies with other Asian countries. This has led to the ASEAN+ 3, the formed alliance between ASEAN and China, Japan and South Korea. Collectively an Asian trade group will be able to bargain more strongly with the industrialized. In this regard, presently there is an absence of leadership from Japan. China, on the other hand, played an important role during the economic crisis by not devaluating its currency. It also increased its trade and investment in the region during this period when the rest of the world decreased theirs. An ASEAN-China free trade area can be the start of a trade group that ultimately can involve more Asian countries. The strong dependence of the ASEAN as well as China on the U.S. market is a source of instability for the region. Promoting the ASEAN-China intraregional market through the free trade arrangement is a means toward the promotion of regional self-reliance and stability. The growth in export and investment of the Asian economies, which includes the ASEAN and the Philippines, in the last few decades has been highly dependent on the U.S. demand. The downturn of the U.S. in the past year should induce Asian governments to work together and focus their market towards regional demand. The domestic demand of individual ASEAN countries is small. On the other hand, China’s huge market continues to grow as the country continues to go through very rapid economic growth and urbanization. Through liberalization and deregulation, countries can further release the spending power of their consumers. This intraregional trade will make it easier for the Philippines and the other ASEAN countries as well as China to further expand their manufactured exports and continue with their open industrialization.

Page 92
References: Austria, Myrna S. “The Emerging Philippine Investment Environment,” Journal of Philip-pine Development. First Semester 1998. De Dios, Loreli C. “Technical Barriers to Philippine Exports,” Trade and Investment Policy Analysis and Advocacy Support Project. Palanca, Ellen H. “China’s Changing Trade Patterns: Implications for ASEAN-China Trade,” in Ellen Palanca (ed.), China’s Economic Growth and the ASEAN. Philippine APEC Study Center Network and Philippine Institute for Development Studies, 2001. Tan, Rosalina P. “Direct Foreign Investment Flows To and From China,” in Ellen Palanca (ed.), China’s Economic Growth and the ASEAN. Philippine APEC Study Center Network and Philippine Institute for Development Studies, 2001. Yang, Shiu-Chin. “Open Industrialization in East Asia and the Quest for Regional Coopera-tion: An Overview.” In Shiu-Chin Yang (ed.). Manufactured Exports of East Asian Industri-alizing Economies: Possible Regional Cooperation. M.E. Sharpe, 1994.

Page 93
Table 1. The Philippines' Bilateral Trade with China, 1980-1996 (In $US million)
Exports to
China %Share in
Total Exports Imports1
from China %Share in
Total Imports Total Trade
with China %Share in
Total Trade Balance
of Trade
1980 45 0.78 258 3.11 303 2.15 -213 1981 78 1.36 255 3.01 333 2.35 -177 1982 105 2.09 236 2.86 341 2.57 -131 1983 22 0.45 143 1.79 165 1.28 -121 1984 60 1.12 223 3.47 283 2.40 -163 1985 81 1.76 314 5.75 395 3.92 -233 1986 101 2.10 157 2.91 258 2.53 -56 1987 88 1.54 245 3.43 333 2.59 -157 1988 67 0.95 268 3.07 335 2.13 -201 1989 50 0.64 239 2.14 289 1.53 -189 1990 62 0.76 205 1.57 267 1.26 -143 1991 128 1.45 253 1.98 381 1.76 -125 1992 114 1.16 209 1.35 323 1.28 -95 1993 167 1.50 281 1.50 448 1.50 -114 1994 164 1.23 476 2.10 640 1.78 -312 1995 209 1.19 1030 3.63 1239 2.70 -821 1996 328 1.61 1015 2.97 1343 2.46 -687
Average Annual Growth 1980-1988 5.10 0.48 1.26 1988-1996 21.96 18.11 18.95 1980-1996 13.22 8.94 9.75
1 Import values are in cif. Source of data: Direction of Trade Statistics, International Monetary Fund, various issues.

Page 94
Table 2. The Philippines' Bilateral Trade with China, 1993-2000. (In $US million, FOB)
Exports to China
%Share in Total
Exports
Imports from
China
%Share in Total
Imports
Total Trade with China
%Share in Total Trade
Balance of Trade
1993 173.87 1.53 180.66 1.03 354.54 1.22 -6.79 1994 164.48 1.22 294.27 1.38 458.75 1.32 -129.78 1995 213.97 1.23 578.62 2.18 792.58 1.80 -364.65 1996 327.92 1.60 684.20 2.07 1012.12 1.89 -356.28 1997 244.41 0.97 871.59 2.43 1116.00 1.82 -627.18 1998 343.68 1.17 1198.89 4.04 1542.57 2.61 -855.21 1999 574.81 1.64 1038.43 3.38 1613.24 2.45 -463.62 2000 663.26 1.74 767.67 2.45 1430.93 2.06 -104.40
Average Annual
Growth 21.08 22.96 22.06
Source of data: Department of Trade and Industry, Republic of the Philippines.
Table 3. Total Trade of the Philippines, 1993-2000. (In $US million, FOB)
Total Exports
Total Imports
Total Trade
Balance of Trade
1993 11374.81 17597.40 28972.21 -6222.60 1994 13482.90 21332.57 34815.46 -7849.67 1995 17447.19 26537.48 43984.66 -9090.29 1996 20542.55 33028.72 53571.27 -12486.17 1997 25227.72 35933.82 61161.54 -10706.10 1998 29496.35 29659.88 59156.23 -163.52 1999 35032.67 30723.14 65755.81 4309.52 2000 38077.95 31386.84 69464.79 6691.11
Average Annual
Growth 18.84 8.62 13.31
Source of data: Department of Trade and Industry, Republic of the Philippines.
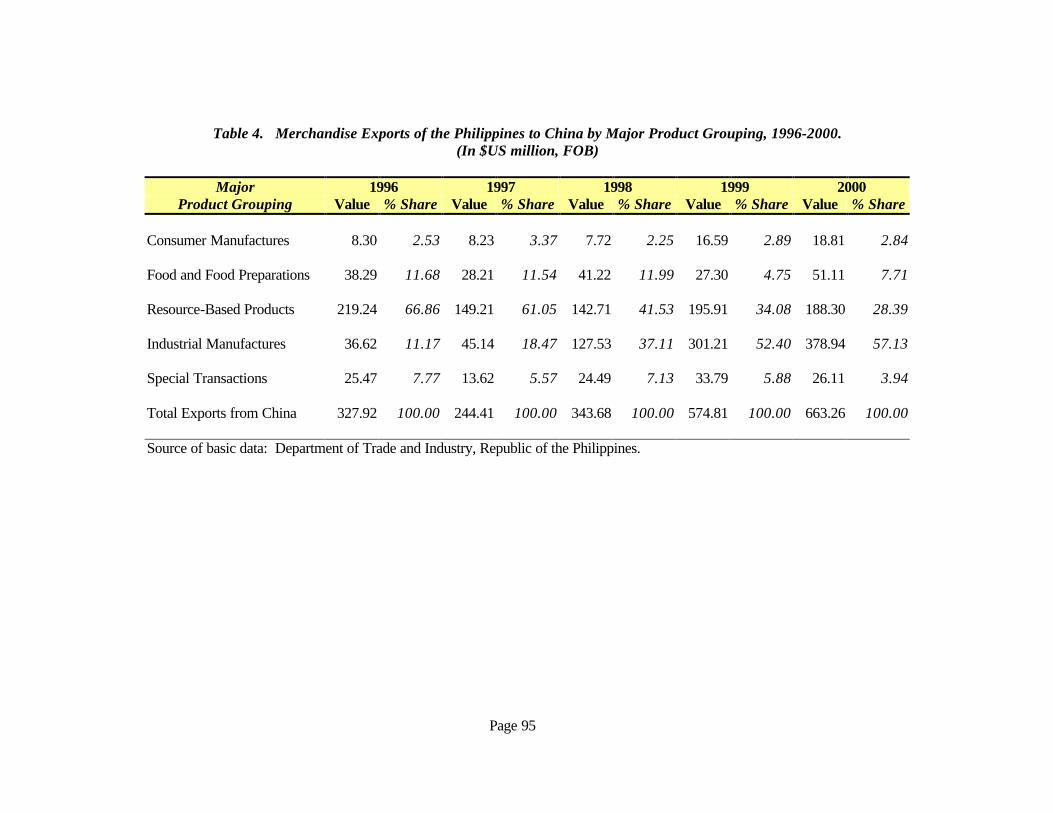
Page 95
Table 4. Merchandise Exports of the Philippines to China by Major Product Grouping, 1996-2000. (In $US million, FOB)
Major 1996 1997 1998 1999 2000
Product Grouping Value % Share Value % Share Value % Share Value % Share Value % Share Consumer Manufactures 8.30 2.53 8.23 3.37 7.72 2.25 16.59 2.89 18.81 2.84 Food and Food Preparations 38.29 11.68 28.21 11.54 41.22 11.99 27.30 4.75 51.11 7.71 Resource-Based Products 219.24 66.86 149.21 61.05 142.71 41.53 195.91 34.08 188.30 28.39 Industrial Manufactures 36.62 11.17 45.14 18.47 127.53 37.11 301.21 52.40 378.94 57.13 Special Transactions 25.47 7.77 13.62 5.57 24.49 7.13 33.79 5.88 26.11 3.94 Total Exports from China 327.92 100.00 244.41 100.00 343.68 100.00 574.81 100.00 663.26 100.00 Source of basic data: Department of Trade and Industry, Republic of the Philippines.

Page 96
Table 5. Merchandise Imports of the Philippines from China by Major Product Grouping, 1996-2000. (In $US million, FOB)
Major 1996 1997 1998 1999 2000
Product Grouping Value % Share Value % Share Value % Share Value % Share Value % Share Consumer Manufactures 49.49 7.23 77.03 8.84 72.10 6.01 123.00 11.84 102.89 13.40
Food and Food Preparations 60.44 8.83 132.76 15.23 423.42 35.32 153.34 14.77 88.76 11.56
Resource-Based Products 195.79 28.62 167.08 19.17 154.89 12.92 154.36 14.86 197.98 25.79
Industrial Manufactures 377.64 55.19 492.49 56.50 545.33 45.49 447.42 43.09 373.83 48.70
Special Transactions 0.84 0.12 2.23 0.26 3.15 0.26 160.32 15.44 4.21 0.55
Total Imports from China 684.20 100.00 871.59 100.00 1198.89 100.00 1038.43 100.00 767.67 100.00 Source of basic data: Department of Trade and Industry, Republic of the Philippines.

Page 97
Table 6. Tariff Reduction for Major and Potential Exports to China
HS No. Goods Base
Rate of Duty
Bound Rate of Duty
Implementation Period
Upon Accession Year 1 Year 2 Year 3 Year 4 Year 5 Year 6 Year 7 Year 8 Year 9 Year 10
0803 Bananas 25 10 Year 4 22 19 16 13 10 10 10 10 10 10 10
0804 Pineapples 20 12 Year 4 18.4 16.8 15.2 13.6 12 12 12 12 12 12 12
08045010 Mangoes 25 15 Year 4 23 21 19 17 15 15 15 15 15 15 15
15162000 Vegetables Fats and Oils
40 25 Year 4 37 34 31 28 25 25 25 25 25 25 25
21069090 Coconut milk 35 20 Year 4 25 25 20 15 10 10 10 10 10 10 10
85231320 Sound recording tapes
35 0 Year 5 29.2 23.3 17.5 11.7 5.8 0 0 0 0 0 0
85231390 Magnetic discs 30 0 Year 5 25 20 15 10 5 0 0 0 0 0 0
06052000 Shrimps and Prawns
25 5 Year 4 21 17 13 9 5 5 5 5 5 5 5
72900 Mussels 30 14 Year 4 26.8 23.6 20.4 17.2 14 14 14 14 14 14 14
03074900 Octopus 25 12 Year 3 21.81 18 18.5 15.3 12 12 12 12 12 12 12
03079920 Sea Cucumber 30 10 Year 5 26.7 23.3 20 16.7 13.3 10 10 10 10 10 10
06059010 Jelly Fishes 25 15 Year 4 23 21 19 17 15 15 15 15 15 15 15
0801 Coconuts
1806 Chocolates and cocoa products
10 10 Upon accession 10 10 10 10 10 10 10 10 10 10 10
1905 Biscuits -- -- -- -- -- -- -- -- -- -- -- -- -- --

Page 98
HS No. Goods Base
Rate of Duty
Bound Rate of Duty
Implementation Period
Upon Accession Year 1 Year 2 Year 3 Year 4 Year 5 Year 6 Year 7 Year 8 Year 9 Year 10
2007 Prepared and preserved fruits
-- -- -- -- -- -- -- -- -- -- -- -- -- --
13023100 Agar-agar 20 10 Year 3 17.5 15 12.5 10 10 10 10 10 10 10 10
02030000 Beer 70 0 Year 4 47 44 41 38 35 35 35 35 35 35 35
02085000 Gin 65 10 Year 5 46.7 37.5 28.3 19.2 10 10 10 10 10 10 10
2401 Tobacco 40 10 Year 4 34 28 22 16 10 10 10 10 10 10 10
7113 Jewellery -- -- -- -- -- -- -- -- -- -- -- -- -- --
9502 Dolls and accessories
21 0 Year 5 17.5 14 10.5 7 3.5 0 0 0 0 0 0
95043010 Video games 35 0 Year 5 29.2 23.3 17.5 11.7 5.8 0 0 0 0 0 0
9403 Furniture 22 0 Year 5 18.3 14.7 11 7.3 3.7 0 0 0 0 0 0
8528 TV -- -- -- -- -- -- -- -- -- -- -- -- -- --
8418 Refrigerators -- -- -- -- -- -- -- -- -- -- -- -- -- --
7304 Tubes, pipes and hoses
14 4 Year 4 12 10 8 6 4 4 4 4 4 4 4
3926 Ornamental Articles
20 10 Year 4 18 16 14 12 10 10 10 10 10 10 10

Page 99
Table 7. Registered Inward Foreign Direct Equity Investments in the Philippines (In Million US Dollars)
1997 1998 1999 2000
Registered Total 1,053.378 884.714 1,894.176 1,398.203 People's Republic of China 1.970 72.057 111.405 48.485
Agriculture, Fishery & Forestry .000 .075 .450 .300 Commerce 1.440 32.497 70.023 34.948 Construction .115 .597 .524 .253 Financial Institutions .187 .492 1.849 1.447 Manufacturing .220 2.235 4.087 .551 Mining .000 .000 .092 .000 Public Utility .000 .176 .526 .151 Services .008 .379 .478 .335 Others .000 35.606 33.376 10.500
% share of PROC's FDIs 0.19% 8.14% 5.88% 3.47% Source: Bangko Sentral ng Pilipinas.

Page 100
FORGING CLOSER SINGAPORE-CHINA ECONOMIC RELATIONSHIP IN THE LIGHT OF
CHINA’S ACCESSION TO WORLD TRADE ORGANIZATION
NATIONAL REPORT SINGAPORE
Toh Mun Heng Department of Business Policy
Faculty of Business Administration National University of Singapore
1. Introduction The aim of this paper is to provide a concise assessment of the impact, opportunities as well as threat arising from the China being admitted as a member of the World trade Organization (WTO). The paper is divided into six sections. Following this introduction, a brief review of the Singapore economic linkages in terms of trade, foreign direct investment (FDI) and tour-ist flow is provided. Section 3 discusses the opportunities and threat, China’s accession to WTO will pose to Singapore and countries in Southeast Asia. Section 4 considers the impact on FDI flows into ASEAN as a result of China’s WTO accession. Trade and investment barriers which are currently impeding greater economic linkage between China and Singa-pore are discussed in section 5. In the concluding section 6, some suggestions as to how economic relationship between Singapore and China can be further promoted are made. 2. Singapore- China Economic Linkages Singapore economic linkages with China has intensified since the late 1970s when China embarked on a “open door” policy together with economy-wide economic deregulation and reform. Some salient features relating to trade, investments and tourism between China and Singapore are presented in Table 1. Trade China is currently Singapore’s seventh largest trading partner. Bilateral trade grew at an annual rate of 15 per cent during the last decade. Between 1990-2000, exports to China rose by 20 percent per annum while imports from China increased by 13 per cent. Bilateral trade reached an all time high of S$22 billion in 20000, with exports to China growing by 40 per cent to hit S$9.3 billion, while imports from China increased by 27 per cent to reach S$12 billion. Trade in electronic products experience phenomenal growth over the last 10 years. The increase in electronic trade from China is in part a consequence of the increased outsourcing of commoditised electronic manufacturing by Singapore based companies to their subsidiar-ies in China.

Page 101
A more detailed list of top 20 commodities in which Singapore imported from and exported to China during the last 10 years is presented in Table A1 and Table A2 in the Appendix. FDI The rapid expansion of bilateral trade was partly the result of an increase in Singapore’s FDI to China. In 1997, China overtook Malaysia to become Singapore’s top investment destina-tion in cumulative terms. Singapore is now the 5th largest foreign investor in China, with cumulative investment reaching $9 Billion in 1998 and expects to exceed $12 billion in 2000. Most of Singapore FDI to China is in the manufacturing related field (60%), follows by that in real estate (20%) and general commerce (8%).
Table 1: Singapore’s Economic Linkages with China 1990 2000 % Growth
Trade Total Merchandise Trade (S$b) 5.2 21.6 14.2 Exports (S$b) 1.4 9.3 18.9 Top 5 Domestic Exports (% of total)
Petroleum (refined) 38.6 19.2 -7.0 Electronic valves 2.3 12.2 16.7 Data Processing machines 0.4 10.2 32.4 Parts of Office and data processing Machines
0.4 9.5 31.7
Heating and Cooling Equipment 0.3 3.7 25.1 Imports (S$b) 3.8 12.3 11.7 Top 5 Imports (% of total)
Parts of Office and data processing Machines
0.0 15.2 100.9
Data Processing machines 0.2 7.7 36.5 Telecommunication Equipment 0.4 7.4 29.2 Petroleum (refined) 13.7 6.4 -7.6 Electronic valves 0.1 5.7 40.4
Foreign Direct Investments FDI to China from Spore (S$m) 240 8896 36.1
Manufacturing (% of total) 60 - Real Estate (% of total) 18 - Commerce (% of total) 8 - Transport (% of total) 5 - Financial Services (% of total) 5 -
Tourism Number of tourists to China (million) 1.75 10.24 17.7
% of Singaporean visitors 4.1 3.9 17.2 Source: MTI, Quarterly Economic Survey, First Quarter 2001.
Tourism With growing affluence in China, there is an increasing flow of Chinese tourists visiting Singapore. It is currently the fifth largest tourist market for Singapore. Visitors from China

Page 102
registered an average annual growth of 31 per cent between 1900-2000. At the same time, about one in every ten Singaporean travelling abroad has China as the destination. 3. Implications of China’s Accession to WTO More markets and segments of the Chinese economy are expected to become available to Singaporean investors to make investments, and export their products when China becomes a member of WTO. China has also become a very attractive location for investment following its impending WTO accession. China and ASEAN economies have enjoyed a steady expan-sion in trade and investment since the early 1980s. China has a growing demand for raw materials, grains and processed foods and industrial items from Southeast Asia. The flow of Chinese manufactured products and services (primarily in construction and public works) in the other direction has been increasing. And China’s dramatic turnaround in agricultural output is enhancing its prospects as an important exporter of grains and produce to Southeast Asia in the foreseeable future. From the Singapore’s perspective, China’s accession to WTO will present avenues for increasing economic interaction in the services sector. If WTO accession indeed leads to higher level of economic activity and investments in China, then the construction of infra-structure, residential and office buildings will certainly offer many opportunities for Singa-porean construction companies. China successful bid for the 2008 Olympic Games reinforces the optimism for prosperous development in that sector. Transportation and logistics industry which are currently much restricted in China will offer another window of opportunities to Singapore logistics operators. An expanding economy needs an efficient transportation and logistic support system to deliver the production to the ultimate customers. Under present circumstances, China does not allow FDI in its telecommunication services. With its accession to WTO, China will phase in 49% foreign ownership in all telecommuni-cation services in 6 years, and 51% foreign ownership for paging and value-added services in 4 years. Singapore education services providers have enjoyed good reputation in China and many developing countries. Being able to offer curriculum that cover and integrate the best of Western and Eastern management skill, technological competence and market practices, Singapore will be able to either export its education services to China by having Chinese workers and students studying in Singapore, or to set up training centres in China. Many business service providers as in the field of information technology, legal services, engineering consultancy services are looking forward to a more liberal environment condu-cive for investments or joint ventures when China becomes a member of WTO. China’s impending entry into the World Trade Organization (WTO) presents opportunities as well as challenges to ASEAN economies. While opportunities abounds, ASEAN must also expect increased competition from other countries. ASEAN companies will have to compete with enterprises from countries of both the developed and developing worlds for businesses in the large Chinese market. At the same time, indigenous companies in these Southeast Asia economies will also have to compete with Chinese companies for share of the export markets particularly in the developed economies in American and Europe. Competition will also be

Page 103
intensified in the arena of foreign direct investments (FDI). Even without WTO membership, China had been attracting more FDI in recent years than the rest of Asia combined. In the past two decades, the opening up of the Chinese economy has indeed provided more export and investment opportunities for ASEAN countries. China’s imports from ASEAN countries increased by more than 10 times from 1985 to 1998 (Mai, 2000). With overseas Chinese network and geographic proximity, ASEAN has become an important source of imports for China. China’s imports from ASEAN economies have grown faster than its total imports from the world. Share of China’s imports from ASEAN rose from 2.7 per cent in 1985 to 8.9 per cent in 1998. Nevertheless, a number of areas will be open for business that currently are not. But in-creasingly, China’s producers will become more market-savvy, technologically advanced and competitive. Already, there is evidence that they have stolen a march on Southeast Asian producers in areas ranging from toys and shoes to garments, motor bicycles to electronic components. The competition could now start to get wider, and stiffer. In that sense, China’s entry into WTO is yet another wake-up call for Southeast Asia’s economies, which must accelerate their own restructuring and seek new avenues of competitive advantage. 3.1 Revealed Comparative Advantage The revealed comparative advantage index of a country’s given product category is defined as the quotient of two ratios. The numerator is the share of the product category’s export in the country’s total exports, while the denominator is the share of the world’s total exports of the product category in the world’s total exports of all products. An index greater than unity in a particular product category ‘reveals’ that the country has a ‘comparative advantage’ in the production of that product category, whereas an index smaller than unity ‘reveals’ that the country has a “comparative disadvantage.” As the magnitude of an index becomes larger, its comparative advantage increases or its comparative advantage decreases, whichever the case may be. Other things being equals, the larger is the index, the greater is the comparative advantage or the smaller is the comparative advantage. We should caution the interpretation of the indices of revealed comparative advantage. They are calculated from actual export statistics of any given country and the corresponding export statistics for the world as a whole. As such they may reflect the underlying ‘real’ comparative advantages or disadvantages of the economy, but they may also reflect the success or failure to deploy its resources efficiently. Moreover, changes in the indices over time may reflect the economy’s success or failure in upgrading its production technology and its accumulation of human capital. The upgrading of production technology depends not only on domestic re-search and development activities, but also on direct importation of technology and technol-ogy transfer via foreign direct investment and the ability to have skilled manpower from other part of the world working and contributing in the economy. A country may begin with abso-lutely zero level of export in electronic components. Yet, with a successful effort in attract-ing export-oriented direct foreign investments in the electronic sector may catapult an economy into a significant player in the international electronic components market. In the APEC (1999) study, commodity exports are aggregated into four product categories, namely, (a) natural resource intensive products; (b) unskilled labor intensive products; (c) technology intensive products, and (d) human capital intensive products. The RCA indexes abstracted from the APEC study for Singapore and China are shown in Tables 2 and 3 respectively. Singapore had a comparative advantage in natural resource intensive products

Page 104
(which reflects the comparative advantage of the Southeast Asian economies that used Singa-pore as their entrepot) until 1986, and it had a comparative disadvantage in labor intensive products throughout the period. Singapore acquired a comparative advantage in technology intensive products beginning in 1983.
Table 2: Revealed Comparative Advantage for Singapore
Year
Natural Resource Intensive Products
Unskilled Labor
Intensive Products
Technology Intensive Products
Human Capital
Intensive Products
1980 1.0390 1.0100 0.9050 0.6341 1983 1.0824 0.9093 1.0384 0.5840 1986 1.1250 0.7848 1.2097 0.5490 1989 0.9945 0.7241 1.4621 0.5995 1990 0.9854 0.6589 1.4979 0.6012 1991 0.9547 0.6450 1.5133 0.5991 1992 0.8645 0.6103 1.6100 0.5854 1993 0.8170 0.5284 1.6622 0.5672 1994 0.7149 0.4558 1.7586 0.5291 1995 0.5955 0.4079 1.8191 0.5216
Source: APEC(1999) Table 8, page 53. Note: Natural resource intensive products include food and live animals (chiefly for food); beverage and tobacco; crude materials, mineral fuels; animal and vegetable oils; manufactured goods classified by material such as leather, wood manufactures, pearls, precious stones, pig iron. Unskilled labour intensive products will include textile and textile products; manufactured goods like furniture, clothing, footwear, toys. Technology intensive products include chemicals; machinery and transport equipment; telecommuni-cation equipment; office machines; computers; aircraft; scientific instruments. Human capital intensive products include dyes and paints; steel; paper; non-electrical parts, tools; watches and clocks; printed matters; musical instruments.
Table 3: Revealed Comparative Advantage for China
Year
Natural Resource Intensive Products
Unskilled Labor
Intensive Products
Technology Intensive Products
Human Capital
Intensive Products
1980 1.0766 2.6888 0.3115 0.3594 1983 1.1080 2.8739 0.2615 0.3384 1986 1.5058 2.8276 0.2731 0.2908 1989 1.3104 3.0858 0.3610 0.4742 1990 1.0198 2.9725 0.3754 0.7878 1991 0.9696 3.1008 0.3832 0.8083 1992 0.9134 3.4273 0.4331 0.5943 1993 0.8575 3.5213 0.4567 0.6009 1994 0.8548 3.5167 0.4835 0.5934 1995 0.8382 3.3774 0.5748 0.6742
Source: APEC(1999) Table 8, page 51.

Page 105
In the case of China, it still has obvious comparative advantage in the production of labor intensive products throughout the period. Worthy of note is that, while China still has value of RCA indices less than unity for technology and human capital intensive products, how-ever, these indices are trending positively to reduce the state of comparative disadvantage. This point can be made more explicit in Table 4, where the RCA of Singapore is divided by the RCA of China for respective product. Basically, this expressed the ratio of share of export of product ith in Singapore exports to the share of export of product ith in China exports.
Table 4: Ratio of Singapore to China RCA
Year
Natural Resource Intensive Products
Unskilled Labor
Intensive Products
Technology Intensive Products
Human Capital
Intensive Products
1980 0.9651 0.3756 2.9053 1.7643 1983 0.9769 0.3164 3.9709 1.7258 1986 0.7471 0.2775 4.4295 1.8879 1989 0.7589 0.2347 4.0501 1.2642 1990 0.9663 0.2217 3.9901 0.7631 1991 0.9846 0.2080 3.9491 0.7412 1992 0.9465 0.1781 3.7174 0.9850 1993 0.9528 0.1501 3.6396 0.9439 1994 0.8363 0.1296 3.6372 0.8916 1995 0.7105 0.1208 3.1648 0.7737
Singapore still enjoys relative comparative advantage in terms of technology intensive product. For the other three categories of product, it is obvious from the table that there is a declining trend in the relative RCA ratios. In fact, it is this development that will pose the greatest challenges to Singapore as well as other ASEAN economies which are also pursuing similar strategies to upgrade their econo-mies. It has becoming conventional wisdom among ASEAN economies to sustain further growth by intensifying their efforts to convert their industrial structure towards one that is more technology intensive and more human capital oriented. As noted in the recent study by Palanca (2001), with the rank correlation coefficients between China and the ASEAN-5’s RCAs have generally increased over the years. This indicates the similarity in the export profiles of these countries and it augurs keen competition among themselves for markets especially in the developed economies in America and Europe. Further growth of trade between China and the ASEAN economies will be more dependent on intra-industry trade which capitalizes on the comparative advantage and complementarities within categories of products. Singapore is not spared the competitive pressure in the coming years. China’s technological competence in the industries is growing rapidly. Currently, there is no wafer fabrication plants in China. However, this cannot be extrapolated to the future. As technical sophistica-tion improves in China, its advantages in terms of lower labor cost and large domestic market will soon become dominant in the decision of locating wafer production plants in Asia. This will directly challenge the dominance of current market leaders such as Taiwan, South Korea and Singapore. It is imperative that these economies are nimble and equipped with the neces-

Page 106
sary skill to harvest the benefits in the next link of value-added chain. The duration for learning and adaptation is becoming shorter in tandem with shorter product cycle. 3.2 Impact Presented in CGE Model Studies Over the last couple of years, several researchers individually or as a group have estimated the impact of China’s entry into WTO using multi-sector, multi regional computable general equilibrium (CGE) models. These models are largely based on neoclassical economic theory that assumes an efficient functioning of the price mechanism to reallocate resources in the economy. Altering tariff rates is equivalent to changing the relative prices of products traded and factors of production used. A new equilibrium is established and is compared with the old equilibrium to assess the improvement or otherwise in terms of macroeconomic indicators such as GDP, consumer surplus, trade volume and income distribution. The results of two recent studies on China’s accession are shown in Table 5. While the abso-lute value of the changes in welfare (quantified as the changes in consumption level) differ, the percentage distribution of the benefits or losses is similar in the two studies.
Table 5: Welfare Change Due to China’s Accession to the WTO Walmsley & Hertel Ianchovichina, Martin & Fukase
Welfare (US$ mil) % Welfare (US$ mil) % Total World 68059 100.0 35695 100.0 China 35604 52.3 23707 66.4 Taiwan 5517 8.1 2887 8.1 Korea Singapore Hong Kong
5600
8.2
1717
4.8
Indonesia -149 -0.2 -598 -1.7 Other SE Asia -288 -0.4 -1517 -4.2 North America 11845 17.4 5648 15.8 Europe 10430 15.3 5246 14.7
The real GDP and welfare impacts on the developing economies in Southeast and South Asia declines as a result of China’s accession (Walmsley and Hertel, 2000) This is the result of increased competition from China in the labor intensive markets. This competition is most significant in the wearing apparel market. However it also has an effect on other markets, including electronics and other manufactures. While a delay in the elimination of textile and wearing apparel quotas by North America and Europe does help to reduce competition, this is at best temporary and tends to intensify competition in other (non-wearing apparel) labor intensive sectors, such as other manufactures and electronics. Ignoring the negative impact of China’s WTO accession is something that none of the ASEAN economies can afford. Rather than to adopt retrogressive measures of protection and self denial, it will be a wise and pro-active to manage the challenges faced, by engaging China in greater economic cooperation and partnership. ASEAN has the tradition and institu-tion established after more than thirty years of hardwork to stand in unison and cooperation to meet new international challenges. There will be adjustment and restructuring in every ASEAN economy. The stress of change can possibly be reduced and turn into long term benefits if collaborative strategies can be jointly established.

Page 107
4. Impact on FDI flows into the ASEAN country Singapore is rated as the least restrictive place in Asia for foreigners to do business. The country’s physical infrastructure, legal framework and public policies have always been foreign investor-friendly. Singapore has long maintained a highly open investment regime in order to overcome land, resource and labor constraints. Multinational corporations (MNCs) generally use Singapore as a base for high-end manufacturing and product development. Taking advantage of Singapore’s modern and efficient infrastructure as well as its productive workforce, many have established regional headquarters in Singapore to coordinate procure-ment, marketing and distribution operations. Other MNCs use their offices in Singapore to complement lower end assembly operations in other Southeast Asian countries. China’s entry to the WTO will not affect Singapore adversely in terms of the volume of FDI coming to Singapore. It is opined that China’s WTO accession will certainly pulled more labor intensive foreign investments into China by virtue of its low labor cost and attractive large domestic market. This is likely to pose greater competition to emerging economies in Southeast Asia than Singapore. Singapore efforts in attracting FDI have shifted over the years to high-end, capital and technologically intensive manufacturing activities. However, complacency must not be allowed to set in as the analysis of RCA in earlier section has indicated that rapid development of Chinese economy is also transforming itself into a formi-dable exporter of technology intensive and human capital intensive products. In terms of FDI in services, there is an expectation that more services industries in the Chinese economies will be liberalised or deregulated when China becomes a WTO members. Banking, insurance and securities industries are expected to be opened for more foreign participation. Similarly in the transportation sectors and civil engineering sectors, infrastruc-ture development and management of airports and seaports, opportunities for foreign and local joint ventures are in the pipeline. For several film production companies in Southeast Asia, cultural similarity and proximity has offered new market avenues to their creative culturally oriented products. The possibility of selling films and documentaries to various provinces in China has injected new hope and vigor into local film producing companies in Singapore and other countries with sizeable Chinese communities. Investment in China becomes a viable option. While China is currently perceived by many as a strong magnet diverting FDI coming from the developed West away from Southeast Asia, it is not inconceivable that China itself may soon may be a source of FDI for ASEAN economies. In fact by the middle of 1980s, some large Chinese state owned companies with credible management has evolved into big Chinese transnational corporations. For instance China National metals and Minerals Import and Export Corporation and China National Chemical Import and Export Corporation are setting up overseas subsidiaries. Between 1979 and 1996, the number of Chinese invested overseas enterprises had totaled 1985 with accumulated value of US$2,152 million.(Tan, 2001) 16.2 per cent of these enterprises amounting to 6.2 per cent of the investment value were established in Southeast Asia. While the scale of overseas Chinese investments is still relatively small, but the potential for growth is promising. Chinese enterprise involvement in international foreign investments will have positive influence on China to be more transpar-ent and ‘fair’ in the treatment of foreign companies operating in China.

Page 108
5. Trade and Investment Barriers ASEAN faces with China China’s imports from ASEAN countries increased by more than 10 times from 1985 to 1998. With overseas Chinese network and geographic proximity, ASEAN has become an important source of imports for China. China’s imports from ASEAN economies have grown faster than its total imports from the world (Table 6). Share of China’s imports from ASEAN rose from 2.7 per cent in 1985 to 8.9 per cent in 1998. Investment from ASEAN economies in China increased from US$64 million in 1985 to US$4,197 million in 1998. Again, FDI flow from ASEAN grew faster than the total FDI flow into China. By 1998, ASEAN countries accounted for more than 9 per cent of total FDI in China, rising from less than 2 per cent in 1985 (Mai, 2000)
Table 6 China: Imports from Asian Transitional Economies, 1985-98 Values of imports
1985 US$million
Values of imports 1998
US$million
Average annual growth 1985-98
Per cent Thailand 262 2414 18.6 Indonesia 332 2461 16.7 Malaysia 200 2674 22.1 Philippines 98 514 13.6 Vietnam 6 217 50.2 Singapore 243 4235 24.6 ASEAN 1141 12516 20.2 World 42253 140237 9.7 Source: State Bureau of Statistics, 1979-91 China Foreign Economic Statistics.
China Foreign Economic Statistical Yearbook, 1999. Barriers exist primarily in the service sector, such as banking (restriction in banking license for local currency), insurance (stringent requirements in terms of size) and telecommunica-tions (no foreign direct investment allowed). Other “soft” barriers are related to nature of Singapore businesses (small in comparison with MNCs) and unfamiliarity of Singapore companies with China’s business environment. A recent study by Wee et. al (1999) Singaporean business enterprises in China are still very much concerned about inefficient bureaucracy, low quality of work; low protection of intel-lectual properties, financial market restrictions, and poor enforcement of legislation. (Table 7)
Table 7: Factors of Concern for Singaporean Companies investing in China Concern factors China (Host) Singapore (Home)
1 Cost 1.87 1.15 2 Workforce quality 1.53 1.98 3 Business practice difference 1.58 2.42 4 Copyright Laws 2.02 2.64 5 Bureacracy 1.30 2.83 6 Political stability 1.77 2.72 7 Financial market restrictions 1.60 2.45 8 Exchange Rate Risk 1.64 2.31

Page 109
Concern factors China (Host) Singapore (Home) 9 Policy Consistency at
National level Formulation Local government Implementation
1.62 1.44
2.69 2.76
10 Business Dispute Resolution 1.70 2.75 11 Administrative Transparency 1.67 2.63 12 Infrastructure development 1.95 2.64
Notes: Scale of concern is: 1=High Concern; 2=Medium Concern; 3=Low Concern Source: Adapted from Wee CH, Chow KB, Lim SK, and Lai, J.(1999)
6. Recommendations There is a need to formulate a ‘mechanism’ or ‘framework’ to promulgate closer economic relationship between China and ASEAN countries. FTA can be accepted as a long term goal. But there are many areas in which China and ASEAN countries can cooperate to engender greater mutual benefits. Serious considerations will have to be given to design measures that will contribute to: (a) Protection of investment; (b) Building good investment environment in both home and host countries. In particular
rules and benefits applicable to local investors should be available to foreign investors; (c) Transparency in all transactions; (d) Prohibition of demand related to performance in granting investment approvals; (e) Freedom to remission of profits; (f) Dispute settlement process; (g) Standardization of certification and custom procedures ; (h) Protection of intellectual property rights; (i) Harmonization in the application of investigation procedures following any trade
dispute that arise; (j) Cooperation in drawing up international rules as in international organization : WTO,
WIPO, ILO, etc. Feedback from the non-public sector, such as the private business sector, academic as well as those from the civic groups should not be ignored. Some opine that a more formal structure of closer economic cooperation between China and ASEAN, such as a FTA will contribute to the security of Southeast Asia. And it is desirable to embark on a framework that is broader than a traditional FTA that confines narrowly on tariff and non-tariff barriers reduction. A broader framework that encompasses economic cooperation in many other not directly trade related fields is considered desired and more feasible. It is recommended to be one that includes promotion of investment and mutual recognition of rules and standards that foster greater economic linkages. Certain designated areas of cooperation, as in information tech-nology (IT), energy, measures to ease or facilitate greater tourist flows are viewed to provide more instantaneous results. So easier procedure for visa application and increasing the number of flights between capital cities are positive measures of cooperation that should not take elongated negotiations to settle. China’s WTO accession will certainly increase its profile as an important player in interna-tional trade and investments. It will force-march the pace of development in several South-

Page 110
east Asian economies which do not want to be left behind in the development race. However, by virtue of its market size and abundance of relatively cheap resources, China development may offer opportunities for Southeast Asian economies to hitch a ride on the growth mo-mentum and swing to a higher gear of development. Establishing closer economic relation with China will offer more information and possibilities for ASEAN countries to adapt to changes and facing challenges than doing otherwise.

Page 111
Appendix Table A1: Top 20 Commodities Singapore Imported from China for 1990, 1995 and 2000
Ranking 1990 1995 2000 1 Petroleum Crude Telecommunications
Equipment Parts for Office & DP Machines
2 Petroleum Products Refined Electrical Circuit Apparatus Data Processing Machines 3 Fabrics Woven Man-made
Fabrics Electric Plant & Parts Nes Telecommunications
Equipment 4 Vegetable Roots Tubers
Prepared/ Preserved Radio Broadcast Receivers Petroleum Products Refined
5 Cotton Fabrics Woven Ships & Boats Electronic Valves 6 Fruits & Nuts Fresh Dried Data Processing Machines Electrical Circuit Apparatus 7 Articles of Textile Tobacco Manufactures Electrical Power Machinery 8 Ships & Boats Petroleum Products Refined Electric Plant & Parts Nes 9 Crude Veg Materials Nes Petroleum Crude Electrical Machinery Nes 10 Tobacco Manufactures Fabrics Woven Man-made
Fbrs Video & Sound Recorders etc
11 Metal Manufactures Nes Electrical Power Machinery Zinc 12 Veg Fresh Chilled Video & Sound Recorders
etc Petroleum Crude
13 Articles of Paper Office Machines Office Machines 14 Meat Offal Prepd Prsd Parts for Office & DP
Machines Electy Distributing Eqpt
15 Spices Electronic Valves Radio Broadcast Receivers 16 Steel Bar Shape Metal Manufactures Nes Television Receivers 17 Electric Plant & Parts Nes Electy Distributing Eqpt Toys Games etc 18 Toys Games etc Electrical Machinery Nes Apparel Articles of Textile 19 Telecommunications
Equipment Watches & Clock Watches & Clock
20 Zinc Zinc Footwear

Page 112
Table A2: Top 20 Commodities Singapore Exported to China for 1990, 1995 and 2000 Ranking 1990 1995 2000
1 Petroleum Products Refined Petroleum Products Refined Electronic Valves 2 Crude Rubber Natural
Gums Copper Parts for Office & DP
Machines 3 Other Animal Veg Oils Parts for Office & DP
Machines Petroleum Products Refined
4 Polyethylene Primary Electronic Valves Data Processing Machines 5 Other plastics primary Telecommunications
Equipment Heating & Cooling Eqpt
6 Alcohols Phenols & Deriv Nes
Paints Varnishes etc Telecommunications Equipment
7 Other Resins etc Primary Other plastics primary Polyethylene Primary 8 Other Fixed Veg Oils &
Fats Specialised Machinery Nes Other plastics primary
9 Telecommunications Equipment
Data Processing Machines Specialised Machinery Nes
10 Piston Engines Residual Petroleum Prodt Nes
Electrical Circuit Apparatus
11 Data Processing Machines Civil Engineering Eqpt Parts
Electrical Machinery Nes
12 Electronic Valves Electrical Circuit Apparatus Measuring Instruments 13 Aircraft Tobacco Manufactures Residual Petroleum Prodt
Nes 14 Specialised Machinery Nes Electrical Machinery Nes Paints Varnishes etc 15 Measuring Instruments Other Resins etc Primary Alcohols Phenols & Deriv
Nes 16 Nitrogen-Function
Compounds Polyethylene Primary Electric Plant & Parts Nes
17 Engines & Motor Non-electric
Heating & Cooling Eqpt Photographic Supplies
18 Residual Petroleum Prodt Nes
Aircraft Aircraft
19 Paints Varnishes etc Musical Instrument & Parts Lub Preps Anti-Knock Preps etc
20 Copper Motor Cars Chemical Products Nes

Page 113
References Asia Pacific Economic Cooperation (APEC) (1999) “Aspects of Market Integration in APEC: Trade, Foreign Direct Investment and Labor Migration”, APEC Economic Committee, APEC Secretariat, Singapore. Website: http://www.apecsec.org.sg Ianchovichina E., Martin W., and Fukase E.(2000) “Comparative Study of Trade Liberalisa-tion Regimes: The Case of China’s Accession to the WTO,” Paper presented at the Third annual Conference on Global Economic Analysis, Melbourne, Australia, June 27-30, 2000. Mai, Yin H.(2000) “China in WTO: Challenges and Opportunities for South East Asian Countries”, paper presented at Review and retrospect: Seminar on the 10th Anniversary of the Establishment of the Diplomatic Relations Between China and Singapore”, 18 September 2000, Mandarin Singapore. Palanca, E.H.(2001) “China’s Changing Trade Patterns: Implications for ASEAN-China Trade,” in China’s Economic Growth and ASEAN edited by E.H. Palanca, Philippine Institute of Development Studies, Manila, Philippines. Tan, Rosalina (2001) “ Direct Foreign Investment Flows To and From China,” in China’s Economic Growth and ASEAN edited by E.H. Palanca, Philippine Institute of Development Studies, Manila, Philippines. Walmsley T.L. and Hertel T.W. (2000) “China’s Accession to the WTO: Timing is Every-thing”, Centre of Global Trade Analysis, Purdue University. Email:[email protected] Wee CH, Chow KB, Lim SK, and Lai, J.(1999) “Performance and Success Factors of Singa-pore, Hong Kong and Taiwan Investors in China”, Research paper of Centre for Business research and Development (CBRD), Faculty of Business Administration, National University of Singapore.

Page 114
FORGING CLOSER ASEAN-CHINA ECONOMIC RELATIONS IN THE TWENTY-FIRST CENTURY
NATIONAL REPORT
THAILAND
Chayodom Sabhasri Chulalongkorn Economic Research Center
Chulalongkorn University Bangkok, Thailand
1. Background of the Thai Economy The Thai economy grew rapidly during the period of 1988 to 1995. The growth rates reached the double digits for three years from 1988 to 1990. Several reasons explaining the booming economy were the foreign direct investment, the relatively lower cost of production particu-larly labor cost, and the competitiveness in the export industries. The consequences of the high growth rate affected not only to the high level of domestic investment but also to the increases in the imported raw materials and capital for manufacturing sector as well as private consumption goods. Not for too long, the economy has experienced the reverse trend as the chronic severe current account deficit occurred for at least 5 years prior to the drastic drop in export growth of 1996. The booming period was ended in 1997 with the burst of the bubbling economy. As a result, the economic growth dove to the bottom a year later with the large depreciation of the Baht. However, on the positive side, the trade balance suddenly improved due to large reduction in imports and increase in the export performance resulting from the price bargaining. Rising from the bottom of 1998, the economic recovery has showed some light even though it is so dim for the long-term recovery. Still, economists are searching for the best exit solution from the crisis and international trade could be an engine of exit solu-tion. 2. Trade statistics with China How important is our trading in goods and services with China? In 2000, China is the 6th important exporting market for Thailand after the US, Japan, Singapore, Hong Kong, and Malaysia. China is the 4th important importing destination of Thailand after Japan, US and Singapore. Consider the trade between Thailand and China by sectors, i.e., agriculture, agro-industry, and manufacturing sectors, the most important sector for the export of Thailand is manufacturing sector whereas the import of manufactured products from China shared the largest part in the total imports. The trade statistics, the shares of export classified by agri-culture, agro-industry, and manufacture are 18, 6, and 70%, respectively. On the other hand, the share of import classified by agriculture, agro-industry, and manufacture are 0.6, 6.5 and 88%, respectively. Therefore, the intra-industry trade for the manufactured goods is proven to be crucial. During the period of 1994 and 1995, the agricultural exports increased dramati-cally1. However, this phenomenon was not due to the change in the trade pattern but rather
1 The export of sugar increased from 8 million US dollars to 122 million US dollars and the export of rice increased from 45.4 million US dollars to 187.5 million US dollars from 1993 to 1994. The data of shares excluded the import and export of the energy sector.

Page 115
the sudden shortage of supply of sugar and rice in China. In sum, the pattern of import from China has gradually changed from the beginning of the 1990s, as the import of manufactured products tends to rise faster than the import of agro-industry, resulting in the reduction in the agro-industry share of total import. For the past decade, Thailand has her overall annual trade deficits with China. The trade deficits hiked to the peak in 1992 during the period of economic booming of Thailand. The import of manufactured products was the main attributes to the deficit. The exports of agri-cultural and agro-industry products ease the overall trade deficits because the exports of agri-cultural sectors, including both agricultural and agro-industry sectors, have outperformed the imports since 1993, resulting in the surplus. Importantly, the agricultural sector has been the dominated part in trade surplus since the beginning of 1990s. However, the amounts of the surplus in agricultural sector have declined after the 1997 economic crisis and there has been no sign of improvement while the agro-industry experienced the trade deficit for the first time. In sum, it can be said that the trade advantages from the agricultural and argo-industry sectors tend to decline in particular after the economic crisis. Though the Chinese economy has only slightly slow down in 1997, the negative impacts on trade to Thailand are observa-bly substantial. For the manufacturing sector, there is a clear tendency that Thailand will continuously have higher trade deficit with China. The growth of manufacturing imports from China declined only in a single year (1998) after the 1997 economic crisis and the import growth has later continued on its track and the growth rates became even higher and higher. Thai trade deficit with China persists for a past decade. Noticeably, the intra-industry trade in manufactured products is very intense and the manufacturing sector is the main reason causing the trade deficit for Thailand in addition to the deficit from the agro–industry since 1998. Besides, the trend of gains in trade surplus from the agricultural sector has shown a sign of deterioration since 1997. The economic crisis that hit hardly the East Asian economy seems to affect the pattern of trade between Thailand and China. Most importantly, while overall trade account of Thailand with all trading partners turned to the surplus in 1997, Thailand still keeps on having trade deficit with China. Expectedly, the price competitive-ness is the main reason for the attractiveness of the Chinese manufactured products. The Thais turned to enjoy cheaper manufactured products from China by substituting them for the more expensive products from other trading partners or relatively expensive local products. For the export of agricultural products, rice, shrimps and prawn, fish and fruits are the important export items. In 2000, the export values of these items were 121.7, 40.3, 25.6 million US dollars, respectively. Sugar led the export of the agro-industry in 2000. Besides, the export values of sugar was at its highest in 1995 when the China experienced the natural disaster resulting in the sudden shortage of supply. The manufactured products generated the export values over 2 billion US dollars in 2000 and the export values took a drastic jump in 1996. The export product of parts and accessories was the major contributor and was worth 408 million US dollar and the export earning of these products is greater than the sum of the export earning from both agriculture and agro-industry sectors. Since 1998, the earning from parts and accessories of computers has become the top earning by taking over the place of rubber and rubber products that is the second most important manufactured exports. Consider the import products from China, maize and fresh apples are the most important import agricultural products. Their values were accounted to 31.5 and 18.5 million US dollars in 2000. Thai importers did not rely on Chinese maize at all during 1995 to 1998 but the

Page 116
maize imports have sharply increased in 1999 and the import values went up more than two folds a year later. The import of apples seems to grow continuously in the past decade from 0.5 million US dollars in 1992 to 18.5 million US dollars in 2000. Regarding the import of the agro-industry products, oil cake from rape and colza seeds shared the highest values in the Thai import and it was amounted to 18.8 million US dollars in 2000. The most important import products based on the manufacturing sector includes parts and accessories of computers, articles of plastic, electrical motors, semi-finished products of iron or non-alloy steel. The import of computer parts and accessories has been double in the last five years and the import values in 2000 reached almost 500 million US dollars that was five folds over the values of the second highest imported products, i.e. plastics. The pattern of increases in the import of parts and accessories of computers has a very close correlation with the export of the same products to China. The intra-industry trades in the computer parts and accessories have become even closer related since 1998. 3. Investment Statistics with China The flows of FDI between Thailand and China are very limited as compared to other invest-ment partners of Thailand such as the US, the EU, and Japan. The streams of inwards FDIs from China have been rather constant as the FDIs had their values ranging from 4 million US dollars to 6 million US dollars between 1995 to 1999. The Board of Investment statistical data shows that the net application from China were 5 projects as compared to the total appli-cation of 597 projects in the first 9 months of 2000. The numbers of project application were 9 and 13 in 1998 and 1999. Interestingly, there were only few projects that got the promotion certificates issues, i.e. 3 projects in 1998 and 4 projects in 1999. The sectors that the Chinese investors are interested in investing consisted of agriculture, and chemical and paper sectors. The start-up projects brought the sum of investment accounted for less than 200 million Baht (approximately 5 million US dollars) in 1998 and 1999. In the first 9 months of 2000, 2 projects decided to start up with the sum of investment 434 million Baht (approximately 10 million US dollars). As compared to the overall FDIs, the Chinese FDIs in Thailand were less than 0.3% of the total FDI values. The inflows were over 6 million US dollars in 1998 when the Thai Baht reached the historical lowest value. The financial institution was the main target of the FDI because the Thai financial system was very weak and not only several of them were forced to close down but many financial institutions were needed to be re-capital-ized to keep their business going. The outward FDIs to China was only 3.3 million US dollars in 1995 and 6.2 million US dollars in 1999. The outflows of FDI reached its peak in 1997 during 1995 to 1999 when the large sum of FDIs went into the electrical appliances industry. The FDIs in the trade sector has seized since 1998 after the economic crisis after reaching its highest point in 1997. Thailand and China have maintained good relationship on investment over years. The gov-ernment of both countries signed the agreement on the Promotion and Protection of invest-ments in 1985 and the Double Taxation Agreement in 1986 to encourage more investment. Those agreements are intended to create favourable conditions and to stimulate business initiatives for achieving greater economic cooperation between the two countries. So far, the statistics from Chinese Authority of Foreign Direct Promotion, reveal that Thai investment has increased in China with the total number of 130 projects in 2000 accountable of 204 million US$. From 1998-2000, the average FDI projects per year were 128 projects with an average per year of 186 million US$ in value. Thai investors ranked 8th-9th among

Page 117
major investors in China. Particular industries which have higher investment interests than others are animal feeding industry, agricultural products, brewery industry, petrochemical industry, electric generating industry, parts and accessories of motor vehicle and motorcycle, service industries (banking, hotels and gas stations) and joint venture in real properties. Thai investors also have high potential in agriculture processing products, food products and infra-structures. Major cities or provinces: Beijing, Shanghai, Liaoning, Sichuan, Jiangsu, Zhejiang, Fujian, Guangdong, Hainan, Yunnan and Guangxi, are main destinations for Thai investments. However, there is a positive trend of higher investments toward the western and middle China, the region of natural resources abundance. Moreover, the great west development has become one of the important policies stipulated by the Chinese government. This results in higher investments in the western-middle regions particularly from those big-famous enter-prises of the world. Although financial crisis since 1997 has shadowed the increase in Thai investment toward China, there is a tendency of the increase of Thai investments due to Thailand’s economic recovery particularly from CP Group, the major Thai investor. Their main interests fall on agricultural sector and industrial sector (motorcycle production) and service sector (Lotus department stores). 4. Barriers to Trade and Investment between Thailand and China Tariff Measures According to the Individual Action Plan submitted to APEC, China has the average tariff rate of 15% in 2000 while Thailand has that of 18.4%. However, after having been weighted by the import value of the top 200 trading goods between the both countries, the weighted-average tariff rate of China will be at 12.34%, whereas that of Thailand is at 10.52%. The table below shows Thailand's and China's tariff rates applied to the top 20 trading goods between the two countries.
Thailand China HS
Code Descriptions MFN
rate WTO rate
HS Code
Descriptions MFN rate
1 2 3 4
847330
854230
392690
551611
Parts and accessories of automatic data processing machines Other monolithic integrated circuits Other articles of plastics Unbleached or bleached woven fabrics of containing 85% or more by weight of artificial staple fibres
3 1
30
20
20 - - -
1 2 3 4
847330
271119
390319
320210
Parts and accessories of automatic data processing machines Other liquefied petroleum gas Other polystyrene Polypropylene
9
6,10
16
16

Page 118
Thailand China HS
Code Descriptions MFN
rate WTO rate
HS Code
Descriptions MFN rate
5 6 7 8 9
10 11 12
13
14
15
16
17
853400
850110
852290
850450
720712
600292
520100
850490
854219
271000
854290
270900
551511
Printed circuits Motors of an output not exceeding 37.5 W Parts and accessories of record-players and video players Other inductors Other, of rectangular (other than square) cross-section semi-finished products of iron Other knitted or crocheted cotton fabrics Cotton, not carded or combed Parts of other electrical transformers Other monolithic digital integrated circuits Benzene and similar oils for engines Parts of digital integrated circuits Petroleum oils and oils obtained from bituminous minerals, crude Other woven fabrics of
10
10
30
20 5
20 0 3 1 0 1 0
20
- -
30 -
30 - - - - - - - -
5 6 7
8 9
10
11
12
13
14
15
16
17
100630
390330
400121
854040
291736
841430
847170
390110
854230
470329
400122
390410
480510
Semi-milled or wholly milled rice, whether or not polished or glazed Acrylonitrile-butadiene-styrene (ABS) copolymers Smoked rubber sheets Data display tubes, colour Terephthalic acid and its salts Compressors of a kind used in refrigerating equipment Storage units of automatic data processing machines Polyethylene having a specific gravity of less than 0.94 Other monolithic integrated circuits Non-coniferous chemical wood pulp Technically specified natural rubber (TSNR) Polyvinyl chloride, not mixed with any other substances Semi-chemical
114*
16
90*
12
14
16,19
9
16
6
0
90*
16
12

Page 119
Thailand China HS
Code Descriptions MFN
rate WTO rate
HS Code
Descriptions MFN rate
18
19
20
410129
520932
283620
mixed mainly or solely with viscose rayon staple fibres Other hides and skins of bovine animals 3-thread or 4-thread twill, including cross twill Disodium carbonate
0
20 1
- -
30
18
19
20
390120
400110
400129
fluting paper Polyethylene having a specific gravity of 0.94 or more Natural rubber latex, whether or not pre-vulcanised Natural rubber in primary forms
16
90*
90*
Note: *goods under quota Tariff-quota Measures The current system of quota is aimed at regulating the volume of imports which is likely affecting domestic industries or the balance of exchanges (i.e. the balance would be lost in case of excessive imports)
China's Tariff-quota rates in the year 2001 Commodity In-quota tariff Out-quota tariff
Rice Maize Barley Wheat Cereal flours Maize oil Palm oil Sun flower oil Groundnut oil Soya bean oil Cotton Rubber Wool Sugar
0,1 0,1 0,3 0,1
0-40 18
9,10 40 9.7 13 3
5,12 1,3
20,30
114 40,114
91.2 114
40-114 91.2 30
91.2 75
121.6 90 90 42 90
Source: Customs Import and Export Tariff of the People's Republic of China 2001 Non-tariff Measures China's non-tariff measures can be generally divided into 3 groups as follows: 1. Import Bans
− Clothing, Used motors equipment and motorcycles − Seeds of plants, Plants − Chemical fertilizers, Animal foods, Antibiotic to accelerate the growth of plants and
animals

Page 120
− Radioactive materials and waste − Magazines relating to national security and morals
2. Quantitative Restrictions
− Plastic materials of unprocessed polyester, and polyester granules − Polyester fibres, Synthetic cotton fibres − Cotton, Cotton fibres and Grey cotton − Rods of iron, and Stainless steel in H-shaped and L-shaped
3. Quota
− Rice and Cereal − Vegetable oil − Rubber − Sugar
Non-Tariff Barriers
− Import of these products such as vegetable seed, chemical, motor vehicle, electronic equipment, and camera, importers are required for import licensing and import quota issued by central government.
− Only the government or state enterprise must conduct import and Export of these products such as vegetable oil, sugar, spirit, petrochemical, seed, tobacco, cotton, rubber, wood, wool, steel, and acrylic.
− Exporters must pay the compensation, in term of damaging of goods, to the importers for trading goods such as air transport, motor vehicle, and telecommunication equip-ment.
− The regulations of technology transfer and intelligence property right must cover processed industries.
− The government assigns the minimum quantity of production for exporting motor vehicle, electronic, processed food, machinery, and textile.
− The government assigns the proportion for using local content to the products such as motor vehicle, telecommunication equipment, processed food, electronic, and textile.
− The foreign investors are under the regulations of balance of trade and balance of foreign exchange.
− The restrictions of trade in services. The list of the products which China imposes NTB measures to Thai’s export products Products Measures Informations Fish and crustaceans Sanitary measure All fish and crustaceans shall be
strictly inspected by State Administration for Entry-Exit Inspection and Quarantine before entry to China.
Crocodile meat Sanitary measure Strictly inspected for bacteria contaminated which cause to Crocodile meat disease.

Page 121
Products Measures Informations Snapping turtle Sanitary measure and
import licensing Importers are required for the non-bacteria contaminated certification issued by Department of Fishery of China.
Rice Import quota Import quota is assigned by Cereal Foods.
Rubber smoked sheets Import quota, import licensing, and standard and conformance
Importing of Rubber smoked sheets are required for import quota and import licensing given by central government. The distribution channel must be made by import and export companies that are authorized by the central government. And product itself must be strictly quality inspected.
Plastic product Import licensing Importer must be given the permission for importing plastic product by central government.
Cigarette Import condition Importing cigarettes from exporting country would be allowed if that country had plan to import cigarette from China.
Cotton Import restrictions Import of cotton must be made by state enterprise or Chinese authorized firms or other firms which willing to pay for recognizance to Department of Custom of China.
Poly Import restrictions Import of cotton must be made by state enterprise or Chinese authorized firms or other firms which willing to pay for recognizance to Department of Custom of China.
Chemical Stable Fiber Import restrictions Import of Chemical Stable Fiber must be made by state enterprise or Chinese authorized firms or other firms which willing to pay for recognizance to Department of Custom of China.
Iron and steel Import restrictions Import of Iron and steel must be made by state enterprise or Chinese authorized firms or other firms which willing to pay for recognizance to Department of Custom of China.
Air-conditioning machines Standard and conformance Minimum Efficiency Standard : MES

Page 122
Products Measures Informations Refrigerator Standard and conformance Minimum Efficiency Standard :
MES 5. China’s Accession to the WTO After China becomes an official member of the WTO, this agreement expectedly brings greater access for Thailand's agricultural, industrial products and some service sectors to the Chinese market. China will reduce both tariff and non-tariff barriers to items of priority to Thailand and will convert the quota to tariff quota particularly in some agricultural items. As a result, many Thai farming industries will receive direct beneficiaries from this agreement. The bilateral agreement was signed on March 10, 2000. 5.1 The Competitiveness of Thai Products in the Chinese Market Thailand has international competitiveness in some major export products, by analyzing the Revealed Comparative Advantage (RCA) and the Trade Specialization Coefficients. For the case that RCA>1, and TSC>0, these products are Rice (RCA=24.94, in 1997), Natural Rubber (RCA=13.95, 1997), Sugar (RCA=4.25, 2001), Motor Cars, Motor Vehicles, parts and accessories2 (RCA=1.86, 2001), Automatic data processing machine and parts3, Garments (RCA=1.92, 2001), and Radios (RCA 1.18, 2001). Additionally, there are other products that have high level of competitiveness but their current export values are quite low. Those products consisted of Vegetables and Fruit (RCA=1.83, 2001) Fish and preparations (RCA=8.86, 2001) Meat and meat preparations (RCA=1.45, 2001) and Miscellaneous edible products.
Thailand International Competitiveness RCA 8 Thailand’s Top 20 Products A4 B5 C6 D7 Thailand China
1. Automatic data processing machines and parts
- Analog computers - Parts of computers - Digital computer
× ×
×
8.37 4.57 0.03
0.01 0.94 0.30
2. Electronic integrated circuits 3. Motor cars, motor vehicles, parts and accessories - Motor vehicles for goods transport - Motor cycles and bicycles - Parts of road vehicles
×
××
×
1.86
1.86 0.22
0.03
2.31 0.15
4. Garments ×× 1.92 5.00 5. Fresh, Chilled or frozen, prawns and
lobster
2 Such as motor vehicles for goods, transport (1500-3000 CC) motor cycles and bicycle 3 Such as analogue computers (RCA 8.37,2001) and part of computer (RCA=4.57,2001) 4 TSC>0 and RCA>1 5 TSC>0 and RCA>1 6 TSC<0 and RCA<1 7 TSC<0 and RCA<1 8 RCA-regular, Source: Survey on Recent Competitive Industries in the Region, IDB -italic, Source: RCA National Asia Pacific Economic and Scientific Database, 2001

Page 123
RCA 8 Thailand’s Top 20 Products A4 B5 C6 D7 Thailand China 6. Polymers of ethylene, propylene, etc in
primary forms
7. Precious stones and jewelry 1.24 n.a. 8. Air conditioning machine and parts 9. Radio-broadcast receivers, television
receiver and parts ×× 1.18 4.42
10. Rice 24.94 n.a. 11. Rubber 13.95 n.a. 12. Iron or steel products 13. Rubber Products 1.28 n.a. 14. Chemical products × 0.51 0.54 15. Other electric equipment and parts 16. Sugar × 4.25 0.51 17. Footwear and parts 2.31 n.a. 18. Plastic products 1.11 n.a. 19. Electrical transformers and parts n.a. n.a. 20. Printed circuits n.a. n.a. - Fish and preparations × 8.86 1.92 - Television sets × 2.85 0.94 - Electric power machinery ×× 2.50 2.85 - Fabric of man-made textile ×× 1.87 2.50 - Vegetables and fruit × 1.83 1.23 - Sound recorders and reproducers ×× 1.69 2.26 - Tulles, lace, embroidery, etc × 1.68 1.36 - Typewriters, photocopy machines, and
other office machines
××
1.64
2.63 - Textile yarn 1.60 2.31 - Household electrical machinery ×× 1.57 2.30 - Cotton fabrics, woven ×× 1.47 4.16 - Meat and meat preparations × 1.45 0.65 - Miscellaneous edible products × 1.44 0.77 5.2 Selected Issues from the Agreement and their Implications China accepts our requests to reduce her tariff rates on 136 items: 39 agricultural goods, 12 fish and fishery products, and 85 industrial products. Her duties on these agricultural, fish and fishery, and industrial products will be decreased from a simple average base rate of 30.2 % to 13% or from 37.6% to 13.1% in trade weighted average. The details are as follows.
Unit : Millions of US$
Products HS Averaged
exporting Value (1997-2000)
1. Rice and Rice Products -Rice -Rice Products
100610, 100620, 100630, 100640 1102300105, 1102300206, 1902190019, 190510, 19059002
122 0.7
2. Natural Rubber 4001 221.75 3. Tapioca Products 0714100204, 0714100906, 1106200100, 1106200200,
110814350510, 0714100109, 190300014, 2303100105 221.75
4. Fresh, Chilled or frozen shrimps, prawns and lobsters
030611, 030612, 030613, 030621, 030622 95.4
5. Sugar 1701 22

Page 124
Unit : Millions of US$
Products HS Averaged
exporting Value (1997-2000)
6. Fresh or frozen fruit (Longans, Durian, Pamelos, Mangoes, Lichee, Bananas, Citrus fruits, Rambutans, Mangosteens
0810900102, 0810900304, 0805900102, 0804500200, 0810902506, 0803011118, 080300120, 0803000194, 0805900904, 080510, 080520, 080530, 080540, 081091020, 0804500301, 0804300106, 08100007, 0804500104, 081500000, 0810900405, 0810900904, 080410, 080420, 080440, 080610, 081020, 081030, 0807, 0808, 0809, 081040, 081190, 081110, 081120
4.2
7. Parts and accessories of motor vehicles
8512300100, 8512300908, 8512400001, 851290000, 8703210999, 8703222999, 8703229999, 8703232999, 870339999, 87032429999, 8703249999, 8703312999, 8703319999, 8703322999, 8703329999, 8703332999, 8703339999, 8703900999, 8704211999, 8704219999, 8704311999, 8704901999, 8707100008
9.9
8. Automatic data processing machines and parts
-Automatic data processing machines and parts
-Parts and accessories of computer
-Electric conductors, fitted with connectors
8471 847330 854441
382.8
a. Agricultural Products By the year 2004, the average base rate of these 39 agricultural products will be decreased from 41.9 % to 16.9 %. These reductions include many agricultural items of particular inter-est to Thailand such as tapioca and tapioca products, dextrin and modified starch, fresh longan, canned longan, rice and rice products, sugar, bean vermicelli, pineapple in airtight containers, pineapple juice and other fruits, prepared and preserved. The selected export items are discussed as follows.
a.1 Rice and rice product: China is the 4th largest rice importer from Thailand. The average import values between 1997 to 2000 was accounted to 122 million US dollars. Non-glutinous rice flour, glutinous rice flour, crisp bread, and rice noodles are the important rice products exporting to China and their values were totaled to 0.7 million US dollars in the same period.
According to the bilateral agreement, China agreed to remove the country quota to the global quota. The global quota for rice and rice products will increase from 2.66 million tons in 2000 to the global quota of 5.32 million tons in 2004 (half of which will be for short and medium grains and the other half will be for long grains). In addition to the tariff reduction, the out-quota tariffs of rice and rice product are to reduce from 40-80% in 2000 to 10-65%s in 2004. Implication: The Thai rice shared 99.7% of the Chinese imported rice. The rice that Thai exports to China is “Hom Mali” that is the highest quality rice. Not only the quality of rice that catches the Chinese market but also the price competitiveness is another success factor. With the relaxing quota, Thai rice will definitely gain in an increased foreign income earning while the market share is to maintain at close to 100%. Currently, there is no close substitute by Chinese grown rice to “Hom Mali”.

Page 125
Nevertheless, due to the advanced agricultural science development in China, the high quality rice may soon be developed to replace the imported Thai rice.
a.2 Sugar: Thai exported sugar to China worth on average of 22 million US dollar during 1997 to 2000. China will initially give a global quota of 1.6 million tons for sugar (includ-ing re-export) in the year 2000 and will expand to 1.945 million tons in the year 2004. The in-quota tariff rate will be 30% in the year 2000 and it will be lowered to 20% in the year 2004 while the out-quota tariff rate will be at 76% in the year 2000 and 65% in the year 2004. Implication: sugar price is determined at the global market. The only advantage from the sugar export is not the price competitiveness but it is the location advantages as compared to other competitive nations. Thai sugar shared 11.87% in the Chinese market and we will definitely benefit from the global share with increases in both shares and export values.
a.3 Tapioca: The leading tapioca and tapioca products include manioc pellet, manioc shredded or sliced, and manioc flour. The total export values were totaled to 34.33 million US dollars in the 4 years average between 1997 to 2000.
China agreed to reduce the tariff on manioc pellet, shredded, and slides from 10 to 5%, manioc flour from 30 to 20%, manioc starch from 20 to 10%, Sago obtained from cassava from 25 to 15%, and dextrin and modified starch from 20 to 12%. Thailand is the world most biggest tapioca exporter and shares over 50% in the Chinese market with Vietnam and Indonesia as major competitors. Implications: Thailand is the major producer of tapioca in the world and shares the largest proportion in the world market. The competitiveness is very high with no credible threat from competitors. Thai tapioca export is expected to increase.
a.4 Fresh and Frozen Fruits: Thai exports several varieties of fruits to China such as Longans, bananas, pamelos, and durian and the export values have risen from 2.1 million dollars in 1997 to 10.2 million dollars in 2000.
China has her tariff reduction plan on 5 fresh fruit items, i.e. cashew nuts, mangoes, mangosteen, guava, longans, and other fresh fruits, and another dried fruit, namely, dried longans. The tariff rates of cashew nuts, and other fresh fruits are to reduce from 30 to 20% and the reduction on mangoes, mangosteen, and guava from 25 to 20% in 2004. Particularly, tariff on longans receives the highest cut from 30 to 12% but the implementation will be in 2005.
Implications: under a strong assumption that Chinese consumers love the varieties of the topical fruits, it is a great opportunity for the Thai exporters to launch the new types of fruits to the Chinese market. Currently, Thai has almost 100% share in the Chinese market and has high reputation in terms of the varieties and quality. Thai exporters are expected to gain substantially in the future. However, the fruits from the other parts of the world are likely to be competitors but it will take sometimes for the Chinese consumers to be familiar with. Longan is our highest earner and the exports

Page 126
should increase sharply. However, the Chinese fruit growers are developing their own longan and could be the threat to Thai exporters.
b. Agro-industry Products China agrees to lower her average base rate of 12 fish and fishery products, namely, frozen shelled shrimps, fresh or chilled prawns, frozen lobsters, and unfrozen shrimps and prawns from 22.9% to 10.3%.
b.1 Frozen Shrimp: During 1997 and 2000, the average values of export to China was 95.4 million US dollars. The tariff rates were reduced from 30-35% in 2000 to 10-20% in 2004. Implication: China is not the main importer of the Thai shrimp and Thai shrimp shared only less than 8% of the Chinese market. Thai exports to China is only 3% of our total export. Japan and North American are our dominant importers. We do not expect that the China’s accession to the WTO will be greatly beneficial to the Thai shrimp exporters because the market is very competitive. Additionally, we also have competitors in the same region such as India where the cost of production is very low.
c. Industrial Products China agrees to reduce her average base rate of 85 industrial goods from 25.9% to 11.8%. The items of particular interest to Thailand include textiles, furniture, natural rubber, smoked sheets of natural rubber, tableware, and kitchenware.
c1. Rubber: China agrees to set her global quota for rubber at 429,000 tons a year and will expand this quantity by 15% annually. Its tariff rate will be at 20% immediately after her accession to WTO. Four years afterwards, this quota will be eliminated and her market for this particular product will be totally liberalized.
Implication: Thai natural rubber has the share of 67% in the Chinese market. With the higher quota in the future, it is a great opportunity for the Thai exporters. The Chinese importers use the natural rubber as raw materials for several industries. Due to the fact that the Chinese economy is growing, the demand for the natural rubber will be higher. Although it seems to be that Malaysia and Indonesia are our competi-tors in China, the products are not quite close substitutes due to the differences in quality. The Malaysian products contain higher value added as using high technology in their products. So, this is the opportunity for the Thai.
c.2 Auto parts and accessories: China is not the main market destination for Thailand. The total export values have increased from 3.8 million US dollars in 1997 to 14.6 million dollars in 2000. The main exports of auto parts and accessories include auto tyres, engines and parts, ignition wiring set used in vehicles, electrical equipment for spark-ignition, and spark-ignition reciprocating internal combustion piston engines.

Page 127
China’s tariff reduction measures
Item Before WTO WTO 2001 1. Printers
- Dot matrix - Parts and accessories
9 30 25
0 0 0
2. Keyboards and Mouse 20 0 3. Hard Disk Driver
- Size not exceeding 120 MD - exceeding 120 MD 4. Soft Disk and CD-ROM Driver
30 9 9 9
0 0 0 0
5. Analogue and digital automatic data processing machines and processing unit of minicomputer and mainframe
9 0
6. Terminal, Scanner, Digitiser 9 0 7. Other storage units 9 0 8. Input or output units, other units of automatics data
processing machines 30 0
9. Digital processing units of work station 50 0 10. Work Station, Microprocessor, Input-Output, Digital
processing units of Microprocessor, others 20 0
11. Maineframes, Minicomputer in the form of systems 21 0 12. Distributed control system 20 0
Implications: We trade with China mainly in parts and accessories. Intra-industry trade seems to increasingly strengthen. The Chinese and the Thais are not naturally the end-users but the reason for closer intra-industry trade is that both countries are the production bases for the FDI of the 3rd country. We expect a net gain from the new economic environment since the reduction of tariff leads to the lower cost of production and Thai and Chinese producers should be able to export to the third market even at the lower cost. Therefore, we do expect to observe higher trade relationship between the two countries.
d. Services According to the bilateral agreement, foreign investment will be given better access in the service sectors including hotels and restaurants, travel agencies and tour operators, distribu-tion (wholesale and retail) in which Thailand has an interest. China will immediately allow foreigners to own majority shares in the hotel and restaurant businesses once she becomes a WTO member. 5.3 Impact on the third country market Since Thailand and China produce and export similar products especially industrial goods which Thailand exports almost 75%. So, it’s unavoidable for Thai products to compete with China in the common trading destinations (third country) particularly in the USA, the EU and Japan. 5.3.1 US Market Among the top 20 exported goods from Thailand to the US, 18 out of them mainly rely on the US market. That is, for each item, we export more than a quarter of the total export to the US

Page 128
market. Moreover, having considered the 18 products, there are 6 products that China also highly relies on the US market. Those products are ADP input or output, Automatic data processing, Shrimps and prawns prepared or preserved, Articles of jewelry, Indirect electro-static, and Wooden furniture, which Thailand has to inevitably compete with China in the US market. In addition to this list, many more products are still a huge concern in Thailand's exports, for example, Jewelry and parts, Electronic, Monolithic, Static converters, and Travel goods. This is because of the fact that China's export value of these products to the US market is very high, though the US market is not a major market for these products from China.
Export of China and Thailand to US market ( 2000 ) Descriptions China Thailand
( Top 20 items from Thailand to US) Value (m.US$) (%) Value (m.US$) (%) 1. ADP input or output 2,182 34 1,117 40 2. Automatic data processors 640 25 1,097 56 3. Shrimps and prawns frozen 67 21 945 49 4. Metal oxcide semiconductor 9 2 849 34 5. Shrimps and prawns prepared 57 54 550 57 6. Color TV 75 7 505 43 7. Jewelry and parts 230 16 449 48 8. Electronic monolithic 148 17 279 27 9. Surgical & medical glove 0.4 7 259 31 10. Static converters 342 22 249 49 11. Babies’ garments & accessories 14 5 217 83 12. Parts & accessories 793 14 208 17 13. Travel goods 275 13 195 90 14. Articles of jewelry 28 44 175 46 15. Insulated wire, cable Etc. 53 20 160 66 16. Technically specific ( rubber ) - - 154 0.3 17. Sweaters, pullovers 96 9 152 51 18. Tuna, etc, not minced 0.02 2 151 27 19. Indirect electrostatic 269 34 142 58 20. Wooden furniture 355 46 141 43
Remark: (%) is the share of export to US market/country’s total export 5.3.2. Japan Market Out of the top 20 products from Thailand to Japan, there is a list of 10 products relying mainly on the Japanese market. The importance of Japanese market for the 10 products is equal to or more than one-quarter of Thailand's total export of these specific products to the world market. 6 out of the 10 products are China's important exports to the Japanese market, which are Chicken cuts and edible offal, Chicken meat prepared, Dog and cat food, Fish fillet fresh or chilled, Cane sugar (raw), and Molluscs frozen or dried. Inevitably, Thailand has to compete with China in exporting these products to the Japanese market. Furthermore, various products are also expected to be affected by China's exports such as Colour TV, ADP input or output unit, and Electric apparatus.

Page 129
Export of China and Thailand to Japan market (2000) Description China Thailand
(Top 20 items from Thailand to Japan) Value (b.yen) (%) Value (b.yen) (%) 1. Automatic data processing 20 6 78 7 2. Natural rubber in smoked sheets - - 31 96 3. Shrimps and prawns frozen 15 39 29 22 4. ADP input or output unit 76 9 26 13 5. Shrimps and prawns prepared 3 26 25 19 6. Color TV 46 36 24 17 7. Chicken cuts and edible offal 36 74 23 53 8. Electric apparatus 17 16 22 28 9. Part & accessories 150 8 18 9 10. Chicken meat prepared 31 91 18 25 11. Dog and cat food 2 26 17 69 12. Fish fillet fresh or chill 6 44 17 76 13. Cane sugar, raw 0.2 33 15 34 14. Seats wooden frames 6 12 14 68 15. Facsimile machines 4 29 14 12 16. Molluscs Etc, frozen or dried 7 76 13 25 17. Combined refrigerator 4 10 11 2 18. Wooden furniture 24 14 11 33 19. Metal oxcide semiconductor 33 36 10 0.3 20. Supported catalysis 2 10 -
Remark: (%) is the share of export to Japan market/country’s total export. 5.3.3 EU market Having considered the list of Thailand's top 20 products to EU market, there are 13 products having the value of more than one-quarter of Thailand's total exports. 5 out of the 13 products are also very important to China's exports to EU market. These items comprise of ADP input or output units, Other non-industrial diamonds, Facsimile machines, Radio broadcast, and Air conditioning machines. The following products such as Colour TV and parts and accessories are also Thailand's concern due to China's high exports.
Descriptions China Thailand ( Top 20 items from Thailand to EU) Value (m.US$) (%) Value (m.US$) (%)
1. Parts and accessories 613 11 993 15 2. Other motor Vehicles 0.04 0.6 532 45 3. Other digital monolithic 0.03 0.01 525 21 4. ADP input or output units 2,165 34 406 29 5. Other monolithic IC 82 9 268 28 6. Printed circuits 85 6 218 19 7. Sundries - - 178 14 8. Monioc roots fresh or dried - - 177 92 9. Other non-industrial diamonds 257 55 161 53 10. Facsimile machines 125 39 142 33 11. Other prepared meat 0.1 0.04 141 64 12. Radio – broadcast 103 26 140 72 13. Color TV 100 9 140 13

Page 130
Descriptions China Thailand 14. Article of Jewelry 42 3 139 24 15. Cuts and offal frozen 5 1 136 35 16. Window or wall air conditioning 36 10 136 30 17. Air conditioning machines 89 40 110 40 18. Pet Toy 15 16 103 57 19. Parts and accessories 76 4 97 21 20. Articles of jewelry 4 7 96 38
Remark: (%) is the share of export to EU market/country’s total export. 6. FTA with China (zero tariff and no NTMs) : Impact of ASEAN-China Free
Trade Area on Thailand This section is to investigate the impact of ASEAN-China Free Trade Area on Thailand at both macro and industry levels. Under the assumption of no tariff and the elimination of non-tariff measures for intra-trade within the ASEANs, we assume that establishment of ASEAN-China Free Trade Area reduce both types of barriers to zero level. The impacts of tariff and non-tariff reductions will be separately analyzed. We adopt GTAP model version 4.0 for this policy analysis with tariff and non-tariff rates from TRAINS database of UNCTAD. Tariff Barriers On average, the bilateral trade between Thailand and China has experienced high import tariff. Thailand has imposed tariffs of over 20% on imported goods from China such as vegetable and fruit, crops, meat products, food products, textiles and wearing apparel. While exports of Thailand to China face import tariff over 20% include vegetable and fruit, meat products, poultry and seafood, processed rises, sugar, textile, wearing apparel and chemical, rubber and plastic products. It should be noted that China imposes high tariff 113% on imported rice from Thailand. Non-tariff Barriers According to TRAINS database of UNCTAD, in 1999, Thailand imposed no non-tariff barrier on import of goods. China, however, impose very high rate of non-tariff barriers on Thailand’s products. The high non-tariff rates include 80% for crops, 52% for vegetable oil, 100% for processed rice, and 96% for sugar, 52% for textiles, 93% for leather products, 84% for wood products, 93% for paper products, 86% for chemical, rubber and plastic products and 88% for ferrous metals. 6.1 Impact of Tariff Reduction This section shows the impact of tariff elimination between ASEAN and China on Thailand’s macroeconomic performance, trade flows, and sectoral outputs. 6.1.1 Macroeconomic Level We find that the reduction of import tariff increase Thailand’s export opportunities, particu-larly for agricultural related products. Consequently, higher demand on land and labor result in higher rental price of land of 9.9% and higher wage rate of 0.93%. Cheaper import of capital goods cause a decline in rental price of capital by 0.6%. Increases in export and local demand for goods will cause an increase in overall price level or GDP deflator by 0.4%.
Page 131
The establishment of the FTA will increase Thailand’s export by 1.05% and this conse-quently rises the real GDP by 0.32%. As the result, real private consumption and investment surge by 0.48% and 0.75% respectively. The rises in local absorption and export result in a 1.45 percent increase in import demand and $59.9 million trade deficit. The FTA will create a surge in trade relationship between Thailand and China. Even though total export and import of Thailand change just slightly, we find there are substantial trade diversions. Namely, Thailand’ s export to China will expand by 63% while Thailand’s import of Chinese goods will increase by 55%. Overall, even though tariff barriers between Thailand and China are relatively high, ASEAN-China Free Trade Area benefits Thailand’s economy only moderately due to small existing trade relation. 6.1.2 Industry Level The tariff reduction of the FTA between ASEAN and China has both positive and negative impacts on Thailand’s production sectors. In the agricultural sector, processed rice and sugar are expected to gain benefit for export opportunities into China. Outputs of these products will grow by 8.89% and 14.78% respectively. The increases in outputs of rice and sugar cause high demand for land and their prices which consequently result in higher costs and prices of all agricultural products. Output of vegetables and fruits, other crops may decline by 1.55% and 3.04% due to higher rental price of land. While the output and trade balance of food product sector of Thailand, which is one of the most competitive sector, will instead decline slightly. For manufacturing sector, chemical, rubber, and plastic product will yield higher export of 5.4% and higher output of 1.89% while the export and output of ferrous metals are expected to grow by 5.85% and 1.79%. Surprisingly, the FTA will benefit Thailand’s textile sector while hurting wearing apparel sector. The privilege of tariff reduction for ASEAN textile products will increase the export by 13% and the output by 2.91%. Electronic equipment will expand by 0.79% There are a number of manufacturing sectors that may experience negative impacts due to cheaper imported goods from China. The output of wearing apparel and leather products will decline by 0.89% and 0.57%, respectively. Output of other transport equipment and other manufacturing sector will shrink by 1.31% and 0.86%. 6.2 Impact of Non-tariff Reduction This section shows impacts of non-tariff elimination on Thailand macroeconomic perform-ance, trade flow and sectoral outputs. 6.2.1 Macroeconomic Level We find that the reduction of non-tariff increase Thailand’s export substantially. This export demand would lead to higher demand on land and labor. As the result, rental price of land and wage rate increase by 15.1%and 4.62%. On average, the price of primary factors will increase by 2.57%. An expansion in export as well as local demand for goods will increase in overall price level or GDP deflator by 2.44%.

Page 132
The elimination of non-tariff will increase Thailand’s export by 3.25% and this consequently rises the real GDP by 2.61%. As the result, real private consumption and investment surge by 3.61% and 3.97% respectively. The rise in local absorption and export result in a 5.1 percent increase in import and $389 million trade deficit. Zero non-tariff measure environment under The FTA will create a surge in trade relationship between Thailand and China. Even though Thailand’s total export and import change just slightly, we find there could be a substantial trade diversion. Namely, Thailand’ s export to China will expand by 269% while Thailand’s import of Chinese goods will increase by 2.96%. In sum, China has imposed a very high non-tariff rate on a number of Thailand’s exports in both agricultural and manufacturing sectors. Thus, the non-tariff elimination of FTA will lead to a substantial benefit to Thailand’s economy by expanding export opportunities. 6.2.2 Industry level The FTA elimination of non-tariff barriers has strong impacts on the outputs of agricultural and manufacturing sectors. Agricultural related sectors, forestry output, sugar, vegetable oil and processed rice will experience a substantial benefit of export opportunity to China. As the result, their total exports are expected to surge by 274%, 68%, 11% and 8% respectively. Very strong export demand for above agricultural products lead to a 15% increase in rental price of land, consequently reducing the competitiveness in other land intensive outputs. Namely, vegetables and fruit and other crops experience higher prices of 6.6% and 6.1% and lower outputs of 2.97% and 3.12% respectively. In addition, the output of poultry and seafood and other food products will fall by 11.37% and 4.84% respectively. For manufacturing sector, textile, leather products, paper, chemical, rubber and plastic product and ferrous metal will substantially gain from lower non-tariff barrier of China. For textile and leather product which currently face the non-tariff barrier at the rate of 52.7% and 93%, their export will grow by 38.9% and 90% while the output will expand by 11.9% and 67.5%. Moreover, chemical, rubber and plastic products and ferrous metals, which face the barrier of 86.3% and 88%, will grow 13% and 38.9% in term of output. The FTA may create negative impacts for a number of manufacturing sectors when the overall increase in demand rises local price of goods and inputs and, thus, reduce the competitiveness of Thailand’s manufacturing outputs. For example, local price of wearing apparel increases by 1.6%. This causes decline in exports and outputs by 13.14% and 3.87% respectively. Moreover, transport equipment, electronic equipment, machinery & equipment as well as other manufacturing sectors face significantly decline in export and output due to low competitiveness. 7. Recommendation Objective of our study is that we are looking for the closer relationship between Thai and China. Under the following recommendation, it will only be the Thai aspects on the coopera-tion with China. Cooperation can be conducted in many levels and it can be done timely step by step.

Page 133
1. The simplest form of cooperation is the information exchange such as exchange informa-tion for the transparency, for instance, in the legal issues, regulations, restrictions, statis-tics, product standards, and many more. That is to say all of the basic information. An objective of the information exchange is to eliminate the hidden NTBs.
2. The cooperation in technical assistance and the provision of the trade and investment facilitation: for instance the technological transfers among the academics as well as official authorities. The private sector is encouraged to take part in the cooperation. The motivation is to increase both countries’ competitiveness and the product quality so as to rise up the quality of living for both residents. The trade and investment facilitation includes the loosing up of the regulation on trade and investment such as the custom regulation by shortening the processes, the restriction on the job market for the Chinese and the Thai people. The improvement in the legal system for the better transparency is to keep the level of playing field for both local and foreign firms to enhance the goodness of the consumers. That is to say, the competition leads to the higher economic welfare from the cost-effective production and the lower prices.
3. The partial cooperation that implies the specific condition in the cooperation with less than the full cooperation. China should allow for different level of playing field in some areas for the Thai as a handicap. This is in the case that the economic cooperation such as FTA has the negative impact and causes the collapses of some industries. The areas must be identified and the system must be consistent with the WTO regulation. The EU has gone through these adjustments with the great financial and technical assistance to the Southern European countries or even the assistance program, namely the structural funds. Further study on the EU should be done and some results could be our model.
4. The full cooperation implies the FTA by completely eliminating the TBs and NTMs. This FTA is still a long way and the timeframe must be completed before 2020 (under APEC commitment).

Page 134
VIETNAM'S NATIONAL STUDY ON THE POSSIBLE IMPLICATION OF CHINA'S ACCESSION TO THE WTO ON VIETNAM
NATIONAL REPORT
VIETNAM
Tran Dong Phuong Multilateral Trade Policy Department
Ministry of Trade Hanoi, Vietnam
Introduction The South East Asian economies will continue to develop into an important economic center in Asia in particular and the world in general in the 21st century. The fast development and economic integration of China and its accession to the WTO in the coming time will make this area all the more important. This will form a new economic order in the world in this century. China's accession to the WTO is of great significance to Vietnam, as China is a huge neighboring country who shares various relations, first of all, economic ones, with similar institutions and development levels. Since China is not only an important trading partner but a potential competitor, China's accession to the WTO and its acceleration of trade liberaliza-tion will bring forward quite a few challenges and opportunities to trade relations between the two countries. I. The impact of China's accession to Vietnam's trade activities. 1. Current situation of trade relations between two countries The trade relations between Vietnam and China started to develop both in size and depth since the 1990s, in a way the two countries are becoming more and more dependent on each other. The year 1992 marked a milestone in their trading relation and cooperation with the signing of the Vietnam - China Trade Agreement. After this Agreement, some other impor-tant agreements have been signed such as agreement on transportation, agreement on terms of payment, agreement on the travelling of citizens of both countries, etc. The current trade activities between the two countries are limited at exchange of goods only. There has not any statistical data on the value of service activities. Therefore, this analysis will focus on the trade activities of goods only. Sine 1995, trade activities between the two countries have increased steadily from US$691 million to over US$1,400 million in 2000 with trade surplus on the Vietnamese side (see table). This figure is equivalent to around 0.4% of China's total trade turnover and 10% of Vietnam's total trade turnover. This means trading activities between China and Vietnam play a significant role in Vietnam's trading activities. However, these figures only reflect the

Page 135
official trade activities. A large amount of goods traded in other forms are not taken into statistics. Therefore, current statistical data on bilateral trade relations only allow a relative evaluation of informal trade through the borders between the two countries. The import and export structures reflect rather fully the economic characteristics and devel-opment levels of Vietnam and China. Vietnam's exports to China mainly consist of raw materials or semi-processed products such as minerals, food, several types of cereals and tropical fruits. Export items are very diversified with unstable export turnover. Except for natural rubber, there is no spearhead item. Imports from China consist of engineering production lines, machinery, construction materi-als, temperate fruits and consumption goods. Many imported goods from China, especially consumption goods, have lower quality than those domestically produced. However, as they have much lower prices, they are imported to serve the needs of the population with low income. The growth rate of imports and exports is relatively fast, but not stable, especially exports, as they are mainly agricultural goods, thus are highly dependent on productivity and crop time. Imports of complete equipment are conducted with ODA capital from China, which are still very unstable.
Table 1: Trade Turnover between Vietnam and China (1995 – 2000) Unit: million US$
Year Exports Imports Total Trade Turnover Trade balance
1995 361.9 329.7 691.6 32.2 1996 340.2 329.0 669.2 11.2 1997 474.1 404.4 878.5 69.7 1998 440.1 515.0 955.1 -74.9 1999 859.0 683.0 1,542.0 176.0 2000 430.0 507.0 937.0 -77.0
Source: Ministry of Trade
Table 2: Import and Export Structure between Vietnam and China China's exports to Vietnam (%)
No. Items 1997 1998 1999 2000 1 2 3 4 5 6 7 8 9
10 11 12
Garments and textiles Minerals Machinery, electronic and telecommunication goods Ferrous metal and its products Chemicals Fruits and vegetables Ceramic, porcelain and glass - ware Vegetable and animal oil Plastic and rubber products Food industries Leather and leather products Paper and paper products Transport equipment
26.3 14.9 14.0 13.0 12.0 3.2 2.9 2.4 2.2 2.1 1.4 1.2 1.2 1.1
27.4 8.5 14.8 12.8 16.0 4.4 1.7 1.4 4.0 2.9 0.2 1.1 1.4 1.2
19.6 12.0 15.0 12.5 17.7 5.9 1.6 0.0 3.3 1.4 0.4 0.6 6.3 1.4
11.3 16.9 12.1 12.2 14.6 4.8 2.4 0.0 2.4 1.1 0.4 1.0
17.9 0.9

Page 136
China's Imports from Vietnam (%)
No. Items 1997 1998 1999 2000* 1 2 3 4 5 6 7 8 9
10 11 12
Minerals (Crude oil and coal) Vegetable and animal oil Vegetables and fruits Plastic and rubber products Garments Ferrous metal and its products Machinery, electronic and telecommuni-cation goods Food industries Wood and wood products Live animals and their products Footwear and other processed products
72.3 6.1 5.0 3.5 2.9 2.3 1.9 1.6 1.5 1.3 0.6
57.1 10.4 7.3 9.5 4.1 1.3 2.7 0.8 1.4 1.8 0.4
66.6 6.0 6.4 8.0 2.9 0.2 1.3 0.3 2.1 1.2 0.3
76.3 2.5 3.8 6.0 3.1 0.1 1.6 0.2 0.4 0.9 0.4
* Statistical data for the first half of 2000 Source: China's customs office According to Table 2, Vietnam exports to China largely raw material goods, of which crude oil accounts for a large percentage. China is a big importer of minerals: in 1999, it imported US$11.6 billion worth of minerals and exported US$ 5.8 billion minerals. In contrary, Chinese exports to Vietnam are very diversified, from agricultural goods to industrial goods and raw materials for producing other products. Different from China, Vietnam imports goods that can be produced domestically, especially light industrial goods due to their competitive prices. During the period 1997 - 1999 and the first half of 2000, China increased its exports of transport equipment to Vietnam. An outstanding feature in trade relations between the two countries is that they are develop-ing strongly across the border in the forms of formal and informal trade, including smuggling. For Vietnam, while formal trade balance is always in import surplus situation, informal trade balance is export surplus. China keeps consistent and flexible policy to encourage cross border trade. Its main measure is to impose lower tariff on informally traded goods than formally traded ones. Meanwhile, the Vietnamese government's policy is to develop formally trade and restrict informal trade. Informal trade is closely controlled in many ways. In order to promote cross border trade and encourage formal trade, Vietnam is going to establish open economic zones in border adjacent areas. 2. Opportunities and challenges and for Vietnam's trade activities when China accede
to the WTO 2.1. Opportunities The influence of China's accession to the WTO is only visible when Vietnam also join this organization nearly at the same time with China. As long as Vietnam has yet to be a WTO member, its trade and economic relations with China will still be governed by bilateral agreements and each other's laws and regulations. Thus, the following analysis is made with hypothesis of the first case.
Page 137
Firstly, in the next 10 years, trade turnover between the two countries will keep increasing. This is due to the fast growth of the two economies, which stimulates demands. In particular, cross border trade will develop fast once open economic areas are established. Secondly, trade liberalization will not bring about much influence. In terms of exports, with the removal of tariff and non-tariff barriers, Vietnam has opportunities to increase its exports of foods and other grain products such as soybeans and oil carrying grains. At the moment, China imposes a tariff rate of 100% on agricultural products. When it joins the WTO, China will reduce this rate to 3% to 20% and gradually remove non-tariff restriction. The demand for food in China from now until that time is still very high while its production capacity is limited (according to the ASEAN Secretariat, the RCA of China's product group including grains, vegetables and fruits is less than 1, which means China do not have competitive advantage over other countries in producing these products). Therefore, this will be a big potential market for Vietnam's food exports. According to international organizations, in order to ensure adequate supply of food for national demands at prices equivalent with international market prices, China's agricultural sector need significant renovation, which require 30 years and an 500 times increase of productivity. This is to say, at least in the next 30 years, China will have to import food in huge quantity. Apart from food, China's demand for tropical vegetables and fruits also bring about opportu-nities for Vietnam to increase its export turnover for the following reasons: (i) China's accession to the WTO will open up opportunities for Vietnam to export fresh vegetables and fruits to its market as in the future, the Chinese people's income will increase, thus leading to an increase in their demand for these products; (ii) It is possible that Vietnam will enjoy tariff reduction for vegetables and fruits due to China's concessions to join the WTO. 2.2. Challenges In the domestic market Apart from the opportunities for Vietnamese goods to enter China's market when it joins the WTO, Vietnam will face quite a few challenges. It will face a stronger competition with Chinese export products not only in third countries but in its domestic markets as well because China has competitive advantages in terms of capital, labor force and agricultural land. Even when China does not enter the WTO, its goods has been flooding the Vietnamese market due to its competitive prices, especially that of consumer goods. With a hypothesis that Vietnam will join the WTO almost at the same time with China, Vietnamese goods will have to compete fiercely with Chinese ones even in the domestic markets, as Vietnam will also have to cut its tariff then. On the other hands, most of imported goods from China are subject to a lower or equivalent tariff rates as according to the WTO's regulations. They include equipment and machinery, facilities for agricultural production, which accounts for a major percentage of import turnovers. Particularly, imports of transport facilities will rise substantially. However, this item will have to compete strongly with imports from other countries as well as domestically manufactured products. The entry of Chinese goods into the Vietnamese market is evaluated in Table 3. According to this table, Chinese products accounted for an increasing part in Vietnam's total import turnover since 1996. This shows China has established a firm foothold in the Vietnamese market. This trend will all the more increase when China accede to the WTO as China will,

Page 138
with its open market concessions and a more transparent economic environment, attract more foreign investment to manufacturing, processing and labour intensive sectors such as garments and textiles, leather and shoes, electricity, electronics, and automobile assemble. With its abundant labor force and large-scale economy, the prices of Chinese goods will be very competitive over the same ones in Vietnamese markets.
Table 3: China's Influences on Vietnamese Economy The percentage of Chinese goods in
Vietnam's total import turnover The percentage of Chinese imported
goods in Vietnam's GDP 1995 4.0 1996 3.0 1997 3.5 1998 4.5 1999 5.9 2000 7.4
1.6 1.4 1.5 1.9 n.a n.a
Source: Vietnamese customs Influence on Vietnamese exports in the international markets When China join the WTO, the competition between the two countries' exports will be determined by several factors: natural resources, land areas, labor force market size and demand, and capital. China has competitive advantages over Vietnam for all these five factors. Due to the similarity in development level but difference in economic scale, export items of both countries are rather similar. They are exported to the same market, but China has abso-lute competitive advantage in terms of export quantity for most items. The competition among major products depends on two factors, competitive advantage and tariff as well as trade prevention measures applied on each country by consumption markets. When China join the WTO, the advantage will be on China's side, even in case Vietnam can enjoy similar trade conditions. The first reason is that Chinese goods account for major or leading share in these markets. Secondly, the cost of producing these goods in China is lower than in Vietnam as they use most of domestic production materials. Thirdly, China's labor cost is lower than Vietnam. Fourthly, Chinese products have higher local contents and most of them bear Chinese trademarks. For example, Vietnamese garment sector use only 15 - 20% domestic materials while major inputs are imported and the average salaries of the workers in this sector are three times higher than in China. Therefore, the product costs are 15 - 20% higher than the same products in China. Among Vietnam's ten biggest export items, four are China's major export items, including garments and textiles, footwear, ceramic and porcelain and electronic goods. These items are exported to key markets including Japan, ASEAN, EU and the United States. It is certain that when China join the WTO, competition of the above mention products, especially garments and textiles between the two countries will be all the more strongly. For Vietnam's two major export items, garments and textiles and footwear, the advantage belongs to China. In the future, when China is eligible for normal trading regimes, its advantages will be higher, affecting Vietnam's export turnover for these products. Generally, ceramic and porcelain will not be much affected, as China's accession to the WTO will not change the tariff rate for China. However, the regular and stable enjoyment of MFN

Page 139
rate will promote exports of Chinese products, especially handicrafts and household products made from ceramic and porcelain, which have taken leading position in the US market. For electronic goods, Vietnam enjoys the same treatment in the Japanese and EU markets. In the US market, the tariff rate applied to Vietnamese products is very high. Yet, in fact, Vietnamese products are not present in this market. In the ASEAN market, Vietnam has advantage over China. According to ASEAN tariff reduction schedule, the rates for ASEAN electronic goods will be reduced to 5% while the rate for this product of China is 25 - 30% according to the WTO regulations. According to the ASEAN Secretariat's study, the general result of the above mentioned influence is Vietnam's export turnover will decrease by around US$8 million, nearly 0.05% of the year 2000's total export turnover. If this is equally distributed to product groups which face hardest competition, garment and textiles and footwear, their export turnovers will be reduced by 0.3%. This is a considerable, but not too serious influence, as export growth of these two sectors is around 30%. The main reason for this small reduction is that although not being a WTO member, China has signed bilateral trade agreements with other WTO members and is thus given preferential tariff system. Therefore, its export products have already been as competitive as when the WTO tariff schedule is applied. In fact, its accession to the WTO is only an official affirmation of its current preferences and addition of what is not completed. Regarding Vietnam's potential export goods, apart from household electronic goods, infor-mation and communication technology (ICT) products, though not being present in the international market, also have to face with competition with Chinese products. Besides direct competition among similar products, Vietnam and China's exports are competing indirectly, i.e. a competition among substitute goods. As these products are diver-sified and Vietnam's export turnover is small, this kind of competition will be analyzed in another study. Another issue, which has not been given adequate concern, is the fluctuation of the NDT exchange rate when China accedes to the WTO. In principal, when it becomes a full member of the WTO, China will have to implement a floating exchange rate policy. This policy will have short term and long term effect. The short-term effect will be that when China keeps a free exchange rate system, there will be an abrupt change in the exchange rate of the NDT against the US dollar, usually in the depreciating trend. This results into a substantial increase in the competitiveness of its exports, which helps increase its market share. The long term effect will be, as the NDT exchange rate fluctuate regularly on the world market, there will be unpredictable changes in markets where Chinese export goods are competing. Therefore, it is hard for Vietnamese exports to enter the world market actively if they are not competitive and stable enough.

Page 140
Table 4a: List of China's 15 Product Groups with Biggest Export Turnover in 1998 Product groups Export value
1995 (000 US$)
Export value 1996
(000 US$)
Export value 1997
(000 US$)
Export value 1998
(000 US$) 1 Garments and
textiles 47,643,079 47,123,264 57,606,281 54,586,540
2 Electrical and electronic goods
17,811,523 20,012,757 25,089,165 28,904,441
3 Games 5,922,810 6,501,141 8,104,010 8,437,084 4 Plastic products 2,475,120 2,687,280 3,490,440 3,822,429 5 Office equipment 1,650,465 1,909,227 2,524,292 3,482,429 6 House ware 1,391,409 1,669,900 2,113,146 2,277,853 7 Watches 2,095,541 1,963,675 2,043,900 1,981,757 8 Ships and boats 878,890 1,153,987 1,630,003 1,860,581 9 Trucks 1,286,762 1,156,005 1,145,331 1,719,890 10 Jewelry 1,208,186 1,009,887 1,398,578 1,673,985 11 Crude oil 2,236,366 2,789,285 2,734,130 1,523,013 12 Generators 1,080,420 1,156,482 1,449,134 1,522,651 13 Pharmaceutical
products 1,259,973 1,204,454 1,241,812 1,393,213
14 Ceramic-ware 1,029,015 1,013,430 1,356,300 1,329,701 15 Office machine 850,747 1,117,132 1,357,780 1,297,529
Table 4b: List of China's Ten Biggest Export Markets in 1999 Exports of 1999
No.
Markets Turnover (billion US$)
Percentage growth over 1998
1 United States 30.03 10.7 2 Japan 22.45 6.7 3 German 5.52 5.3 4 South Korea 5.34 19.5 5 Holland 3.73 -0.3 6 England 3.36 2.5 7 Singapore 3.18 16.7 8 Taiwan 2.79 1.4 9 France 2.09 2.9
10 Australia 1.90 13.7
Table 5a: List of Vietnam's 15 Product Groups with Biggest Export Turnover (Unit: million US$)
No. Products 1997 1998 1999 1 Crude oil 1.413,4 1.232,2 2.091,6 2 Garment and textiles 1.349,3 1.351,4 1.747,3 3 Footwear 965,4 1.000,8 1.391,6 4 Rice 870,1 1.024,0 1.025,1 5 Sea-products 780,8 818,0 951,1 6 Machinery and parts 400,9 472,29 7 Coffee 490,9 593,8 585,2 8 Rubber 190,9 127,5 146,8

Page 141
No. Products 1997 1998 1999 9 Cashew nuts 133,3 117,0 109,8
10 Handicrafts 121,3 112,0 168,2 11 Coal 110,8 101,5 96,0 12 Fruits and vegetables 68,3 53,4 104,9 13 Pepper 62,8 64,5 137,3 14 Tea 47,9 50,5 45,2 15 Ground nuts 44,7 42,1 32,8
Table 5b: List of Vietnam's Biggest Export Markets
Markets 1996 (%) 1997 (%) 1998 (%) Asia 70,9 63,8 61,2 ASEAN 24,5 21,2 25,1 Japan 21,3 17,7 15,8 Taiwan 7,4 8,5 7,1 Hongkong 4,3 5,2 3,4 South Korea 3,4 3,9 2,5 China 4,7 5,7 5,1 Europe 15,4 22,7 27,7 SEV countries 2,3 2,3 2,0 EU 11,0 16,8 22,5 North America 3,3 3,7 5,9 The United States 2,8 3,0 5,0 South America 0,0 0,1 0,6 Africa 0,2 0,1 0,2 Oceania 1,0 2,2 5,3 II. The Influence of China's Accession to the WTO on Vietnam in the Field of
Investment China ranks 7th in terms of GDP and 9th in terms of trade in the world. It has also attracted a large amount of FDI in recent years, second only to the US. Without China, the WTO can be hardly regarded as a global organization. China's accession to the WTO would significantly expand the world trade and strengthen the multilateral trade system integrity and credibility. While the welfare gains for China would be linked with significant gains to China's major trading partners such as the US, the EU and Japan, there would be some relatively small losses to countries such as India and Indonesia that compete strongly with China in a range of products. There is also concern that developing countries including Vietnam would be facing much more tense increase in competition with China in attracting FDI. Firstly, let's take a look at the trend and role of FDI to Vietnam and China in the following table.

Page 142
Table 6: FDI in China and Vietnam (Unit: billion US Dollar) 91 92 93 94 95 96 97 98 99 00
China 4.37 11.16 27.5 33.8 35.8 40.2 44.2 45.5 40.4 37.0 Vietnam 0.22 0.26 0.30 1.05 1.40 1.83 2.59 1.85 1.48 1.80 East Asia 15.8 28.0 42.8 52.6 56.9 65.5 71.5 69.9 70.0 Developing countries
35.0 46.6 68.3 105 112 145 179 179 192 >200
World - - 219 254 329 359 464 644 865 1000 Note: Figures for 2000 are estimated Source: Various sources Table 6 shows that during 1993 - 1996, FDI flows to East Asia surged and this surge was mostly explained by the enormous increase to China. During 1994 - 1997, FDI flows to Vietnam also increased considerably. In recent years, the FDI flows to both China and Vietnam declined while those to developing countries kept growing due to the regional crisis and structural weaknesses. In absolute terms, FDI flows to Vietnam is relatively small, but the ratio of FDI flows to GDP in Vietnam is quite high and much higher than in China (Table 7).
Table 7: Gross FDI as percentage of GDP (average 1991 - 1999) % GDP Low & middle income countries 0.9 High income countries 3.9 Malaysia 3.2 China 3.6 Mexico 1.2 South Korea 0.8 Vietnam (2001 - 2000) 5.4 Vietnam's target (2001 - 2010) 3 - 5
As for FDI sources, in the 1980s, the Asian countries not including Japan dominated FDI flows into China. In 1990s, FDI increasingly consisted of investments by the EU, North America and Japan. It is notable that Overseas Chinese have played a significant role in FDI in China. As for Vietnam, between 1988 and 1999, about 60% of all FDI came from five countries, Singapore, Taiwan, Japan, Korea, and Hongkong (they are also five largest single investing countries in Vietnam). East Asian investments account for more than 2/3 of the total disbursed capital of FDI, the EU for 12% and the US for only about 2%. In 1999 and 2000, for the first time, the largest source of new commitments was from the EU. In terms of FDI by industry, for China, up to mid-1990s, FDI concentrated in export-processing activities. Since mid-1990s, FDI have directed more towards the domestic markets than towards export and in sectors in which China has not revealed comparative advantage. Generally, FDI in the service sector have been tightly restricted. As for Vietnam, more than half of cumulative FDI went to import-substituting and capital intensive industries. Light manufacturing and manufactured exports received a much lower share of FDI to Vietnam than was in the case of China. In order to accede to the WTO, China has committed to open up trade and distribution rights to domestic and foreign firms, to reduce tariffs, to abolish all NTBs (except state trading for a
Page 143
short list of mainly agricultural commodities), to liberalize trade in a wide range of services including banking, insurance and telecommunications, and to provide intellectual property protection consistent with the TRIPs. Of course, the membership will allow China to enjoy the WTO's "rule of the game". With a complete and more transparent legal system, more liberal investment and trade environment together with a huge consumption market, China's accession to the WTO will help absorb a large sum of FDI from foreign investors. It is forecast that till 2005, China would attain foreign investment of US$100 billion (in 1990s, all FDI to China was less than US$250 billion). The FDI inflows to service sectors would be very substantial and this would enhance competition and efficiency not only within the service sector but also in manufac-turing through the link with advanced and high value-added service activities. According to its commitments in AFTA, Vietnam will achieve a tariff of 0 - 5% for goods imported from other ASEAN countries and eliminate all NTBs. From 2001, tariff reduction will be more intense. By 2003, Vietnam is expected to reduce most of the tariffs to at most 20% and remove quotas except for a few products. Meanwhile, ASEAN member countries' commitments in the field of investment are not of much influence. Although AFTA imple-mentation is important as a stepping stone to the wider liberalization, its economic benefits for Vietnam are likely to be small. According to the Vietnam - US trade agreement signed in 2000, Vietnam has committed to abolish NTBs, to reduce tariffs, to protect intellectual property rights, to liberalize trading rights for enterprises, services trade and investment and to have transparency in the trade regime. In return, the US has committed to apply the MFN tariff (the Normal Trading Status tariffs) to Vietnam. The Vietnam - US trade agreement was signed on the basis of the WTO principals. When it is effective, it will contribute to the formation of a more liberal and transparent legal framework in Vietnam. After it is ratified by the two governments, it would expand substantially Vietnam's labor intensive exports such as clothing and textiles, would generate income gains to Vietnam, and act as a step to force Vietnam's stronger implementation of its legal and trade system. It can be said that with the signing of the said agreement, Vietnam is expected to be a more attractive place for FDI inflows, first of all, from the United States. From the above analysis, the following conclusion can be made: The opening of its huge service market and an improved economic environment after acced-ing to the WTO will help attract more FDI to China, diverting the FDI flows from Vietnam as well as other ASEAN countries if they make no efforts to improve their investment environ-ment. However, past experience, the possible outcomes of further integration of Vietnam and China together with the available amount of global FDI and the new requirements for devel-opment have shown that the attraction of FDI of both countries is not a problem of sharing "the same cake". Both economies can gain substantial benefits from the deeper international integration. The problem of FDI attraction should be viewed in a broader context of the need for increasing efficiency and competitiveness of Vietnam and China's economies. In that sense, there is now a real running for a better economic institution. With a much smaller market, higher labor and investment costs and more limited resources, Vietnam stays in a disadvantage position over China in attracting FDI. Its later integration into the WTO than China will worsen this disadvantage and increase the possibility of

Page 144
lagging behind this country. Therefore, Vietnam will have to make every effort in order to further improve its economic situation and institutional system so as to become more attrac-tive in the eyes of investors. In this sense, China's accession to the WTO has positive influence on Vietnam. Firstly, it is an impetus for Vietnam to be better off if it wants not to be left behind. Secondly, Vietnam can learn from China's experience in its negotiation to join the WTO. III. Recommendation The above analysis shows China's accession to the WTO will bring forward huge challenges to the world trade as well as to trade relations with ASEAN. However, despite the difficul-ties, Vietnam and other ASEAN countries have quite a few opportunities to expand its export market in the world and in the Chinese market as well. In essence, China's accession to the WTO means it has joined the world globalization and integrates fully and deeply into the world's economy. Integration and globalization does not aim at an equal or average division of benefits among participating countries. First of all, it aims at an equal division among participating countries of the opportunities to achieve benefits. Therefore, it needs common rules of the games. China's accession to the WTO is integration into the process of sharing the economic opportunities. Therefore, the essence of the so-called challenges and opportunities for each ASEAN economies and for ASEAN in general is that whether they recognize their opportu-nities or whether they truly participate in the said process. Thus, ASEAN and China need to cooperate in all fields, which help them share economic opportunities equally. This means the two sides should cooperate on the principal that ASEAN countries would be facilitated to enter the Chinese market and vice versa. ASEAN and China need to cooperate comprehensively in all areas such as trade, service, investment, agriculture, transportation and finance. Details are as follows: - Trade: Tariff, non-tariff and trade facilitation. - Investment: Cooperate to improve investment environment. Establish joint ventures
with China to export to a third market. - Services: Priority areas can be selected for prior cooperation such as tourism. - Agriculture: SPS, post-harvest technology. - Transportation: All transportation modes. - Financial cooperation.

ANNEX 2
FEASIBILITY OF A FREE TRADE AREA BETWEEN ASEAN AND CHINA
Page 145
Introduction
The ASEAN-China Expert Group on Economic Cooperation (ACEGEC) agreed to conduct a joint study on two main issues: a) the implications of China’s accession to the WTO and b) the feasibility of an FTA between ASEAN and China.
This paper addresses the second issue – the feasibility of an ASEAN-China FTA. The paper proceeds on the assumption that a computable general equilibrium approach to the problem provides the most useful tool for addressing the question.
Global Trade Analysis Project (GTAP) Model
To simulate the effects of a free trade area between ASEAN and China, this paper makes use of the Global Trade Analysis Project (GTAP) model developed by Hertel and associates and which is described in detail in Hertel (1997). The advantage of using this model is that it has been widely used for simulating a number of important global trade scenarios, such as a new round of WTO negotiations and global energy use and climate change. Hence, it is already familiar to a large number of international trade economists and applied general equilibrium modellers and provides a widely shared platform for investigating international trade issues.
We give s short description of the GTAP model below. Regional Household The GTAP model is a multi-region and multisector model. The GTAP version 4 database contains 45 countries and 50 production sectors.
In each region, there is a representative household whose Cobb-Douglas preferences are defined over composite private expenditures, composite public sector expenditures and savings. The regional household derives income from ownership and sales of primary factors of production - capital, skilled and unskilled labour, land and natural resources. It turns out that the intertemporal, extended linear expenditure system could be derived from an equivalent, static maximization problem, in which savings enters the utility function (Howe, 1975). This result provides a justification for the inclusion of savings in the regional utility function. Demand
Private expenditures are governed by a Constant Difference of Elasticity (CDE) function which was first proposed by Hanoch (1975). The CDE function has the desirable property that the resulting preferences are not homothetic and is more parsimonious in its parameter requirements than functional flexible forms. It can also be shown that the CES and the Cobb-Douglas are special cases of the CDE function. Government expenditures are governed by a Cobb-Douglas preference function. Finally, there is inter-industry demand whose technical specifications are described by the usual input-output matrix.

Page 146
Production
Production is assumed to be described by a multi-level production function (see Figure 1). The upper nest is a Leontief-type production function involving value added and intermediate inputs. The technical coefficients of this top-level nest are generated from the Social Accounting Matrix (SAM) constructed for each region. Value added is produced through a Constant Elasticity of Substitution (CES) function of the five primary factors of production. Each intermediate input is in turn produced using domestic and imported components (the so-called Armington assumption) with the technical process described by a CES function. Finally, imported components are a mix of imports from the other regions in the global model with the technical process again described by a CES function. OUTPUT Leontief Value Added Intermediate Inputs CES CES Capital Land Natural Resources S. labor U. Labor Domestic Foreign Intermediates Intermediates CES Region 1 Region 2 Region 3
FIGURE 1: PRODUCTION STRUCTURE Households own all factor supplies – land, natural resources, capital, skilled and unskilled labour and sell their services to firms. In the GTAP model, sluggishness of some factors is allowed so that it is possible for factor prices not to be equalized within a region. Firms are supposed to sell output and purchase inputs (whether primary factors or intermediates) in competitive markets. Hence, firms make no economic profits. Prices and Taxes The GTAP model allows for factor taxes, production and consumption taxes, export taxes and import tariffs which are in turn distinguished by production sector, by agent (regional household, firm, government) and by region.

Page 147
Savings and Investment Given the Cobb-Douglas assumption about preferences of the regional household, savings are a constant proportion of regional household income. The pool of savings is what becomes available for investments. There is a capital goods sector in each region, which produces the investment goods. The rate of return on capital goods is assumed to be inversely related to the stock of capital. The allocation of investment across regions and sectors is done in such a way that expected regional rates of return change by the same percentage. In the model, the pooling of savings and the global allocation of investment is done costlessly.
Methodology The simulations conducted for this paper uses the protection structure contained in the GTAP database. The benchmark year is 1995 and therefore has not been updated with recent tariff changes. Aggregation We have used a smaller 10 region and 10-sector aggregation of the larger 45 region and 50-sector GTAP model. The data employed in the study is version 4 which uses 1995 data as the benchmark. The data is described in detail in McDougall, R. et al (1999). The 10 regions used in our simulation are Indonesia, Malaysia, Philippines, Singapore, Thailand, Vietnam, China, USA, EU, Japan and the Rest of the World. The GTAP database does not include all ASEAN countries, and hence, Brunei Darussalam, Cambodia, Laos and Myanmar have not been included. This represents an important limitation which may require some caution in interpreting the outcome of the simulations.
The 10 production sectors are cereals and crops, food, vegetable oils and fats, other agricultural products, textiles and apparel, petrochemicals, electronics and machinery, motor vehicles, other manufactures and services. The particular aggregation employed highlights important sectors of interest to the ASEAN countries. The mapping from the 45 country and 50-sector grouping of GTAP to our 10x10 structure appears in Annex 1. Baseline The baseline scenario is where ASEAN countries establish the ASEAN Free Trade Area (AFTA). For simplicity, we have assumed that rates of protection are reduced to zero instead of 0-5%. The Third ASEAN Informal Summit of November 1999 has already agreed that the ultimate goal of AFTA is the elimination of all duties. This is to be achieved by 2010 for the first six members and by 2015 for the new members. The level of GDP in this baseline scenario for the 10 regions is shown in Table 1.

Page 148
TABLE 1 GROSS DOMESTIC PRODUCT
US $ Millions COUNTRY GDP
Indonesia 201,763.6 Malaysia 96,898.9 Philippines 70,937.9 Singapore 71,981.6 Thailand 164,842.4 Viet Nam 15,771.8 USA 7,123,060.0 Japan 5,083,156.5 China 812,948.1 ROW 14,663,298.0 Total 28,304,659.0
ASEAN’ regional GDP is US $ 606.4 billion and accounts for 2.1% of global GDP. China’s GDP is US $ 812.9 billion and represents about 2.87% of global GDP. World Exports The structure of world exports is shown in three separate tables (Tables 2-3). Table 2 shows the absolute amount of exports by pair of countries while Table 3 reflects the same information as export shares. In the baseline scenario, ASEAN and China take up 6.6% and 5% of global trade. These trade shares are about twice their shares of global GDP. ASEAN’s exports to China amounts to US $ 27.1 billion, which represents 7.27% of ASEAN’s total exports. China’s export to ASEAN is US $ 19.3 billion, which represents 6.78% of her total exports. This is to be contrasted with the share of exports of both ASEAN and China going to the US and Japan. ASEAN’s exports to the US and Japan account for 17.8% and 15.3% respectively of total ASEAN exports. China’s exports to the US and Japan account for 22.7% and 16.6% respectively of total Chinese exports. Clearly, neither region (ASEAN and China) is a major trading partner of the other. Most of their exports are targeted to the larger markets of the US and Japan.

Page 149
TABLE 2 BILATERAL EXPORTS AT WORLD PRICES
US $ Millions TO
FROM Indonesia Malaysia Philippines Singapore Thailand Viet Nam USA Japan China ROW Total
Indonesia
-
1,762.4
1,137.6
3,996.8
1,935.9
426.1
7,555.0
13,613.1
3,432.6
20,398.8
54,258.3
Malaysia
1,255.7
-
2,336.7
17,638.2
5,173.3
349.0
17,240.7
11,330.2
5,349.8
27,045.7 87,719.3
Philippines
399.7
639.6
-
1,332.7
2,945.7
131.7
8,168.0
4,624.0
1,537.0
8,867.3
28,645.7
Singapore
2,884.6
18,746.7
5,015.8
-
7,381.8
3,728.4
20,997.7
12,353.0
11,625.1
43,064.2
125,797.2
Thailand
1,200.9
2,940.6
1,475.2
6,300.8
-
1,041.6
12,211.7
13,396.6
4,677.9
25,490.6
68,735.8
Viet Nam
200.7
874.3
436.1
470.7
121.4
-
264.5
1,809.7
475.3
2,710.1
7,362.9
USA
3,826.3
9,321.7
5,520.7
19,014.0
9,014.1
220.7
-
85,810.8
27,512.8
557,112.4
717,353.6
Japan
9,615.7
15,655.8
6,526.6
26,887.2
18,768.3
709.4
132,276.3
-
50,601.7
222,544.6
483,585.6
China
2,654.2
2,530.5
1,998.6
8,302.0
3,116.1
676.4
64,444.8
47,163.4 30,168.3 123,339.1 284,393.4
ROW
26,994.6
27,530.6
14,971.5
48,351.0
35,027.5
2,199.9
584,918.7
224,874.7 132,498.8
2,720,745.8
3,818,113.0 5,675,964.9
TABLE 3 BILATERAL EXPORT SHARES
TO FROM Indonesia Malaysia Philippines Singapore Thailand Viet Nam USA Japan China ROW
Indonesia 0.00% 3.25% 2.10% 7.37% 3.57% 0.79% 13.92% 25.09% 6.33% 37.60% Malaysia 1.43% 0.00% 2.66% 20.11% 5.90% 0.40% 19.65% 12.92% 6.10% 30.83% Philippines 1.40% 2.23% 0.00% 4.65% 10.28% 0.46% 28.51% 16.14% 5.37% 30.96% Singapore 2.29% 14.90% 3.99% 0.00% 5.87% 2.96% 16.69% 9.82% 9.24% 34.23% Thailand 1.75% 4.28% 2.15% 9.17% 0.00% 1.52% 17.77% 19.49% 6.81% 37.09% Viet Nam 2.73% 11.87% 5.92% 6.39% 1.65% 0.00% 3.59% 24.58% 6.46% 36.81% USA 0.53% 1.30% 0.77% 2.65% 1.26% 0.03% 0.00% 11.96% 3.84% 77.66% Japan 1.99% 3.24% 1.35% 5.56% 3.88% 0.15% 27.35% 0.00% 10.46% 46.02% China 0.93% 0.89% 0.70% 2.92% 1.10% 0.24% 22.66% 16.58% 10.61% 43.37% ROW 0.71% 0.72% 0.39% 1.27% 0.92% 0.06% 15.32% 5.89% 3.47% 71.26%
Simulation Results
To simulate the effect of an FTA between ASEAN and China, the baseline scenario is shocked by reducing rates of protection between the ASEAN countries and China to zero. We focus the results of the simulation on two key areas: (a) impact on trade, both among members of the FTA and with the rest of the world and (b) impact on real GDP.

Page 150
Change in Exports Countries gain from preferential trading arrangements because of trade creation, as the reduction in intra-regional barriers, stimulate more trade. However, there are also costs associated with preferential trading arrangements as some imports may now be sourced from higher cost regional partners instead of lower-cost non-regional trade partners. In addition, there may also be welfare gains or losses associated with terms of trade changes as the shifts in demand and supply affect export and import prices in international markets. The reduction of tariffs between ASEAN and China results in both regions trading more heavily with one another. ASEAN’s exports to China increase by US $ 13 billion or by 48% while China’s exports to ASEAN rises by US $ 10.6 billion or 55.1%. Among the ASEAN countries, the biggest gains in exports are Indonesia, Malaysia, Singapore and Thailand. China’s exports make the biggest inroads in the Philippines (US $ 3.1 billion increase) and Thailand (US $ 3.1 billion increase).
TABLE 4 CHANGE IN EXPORTS WITH AN FTA
(US $ Millions) TO
FROM Indonesia Malaysia Philippines Singapore Thailand Viet Nam USA Japan China ROW Total Indonesia 0.00 -69.00 -117.05 -106.35 -141.49 -40.05 -209.99 -313.66 2,656.09 -547.45 1,111.05 Malaysia -45.59 0.00 -245.11 -312.71 -219.41 -20.97 -416.56 -246.27 3,207.28 -688.07 1,012.60 Philippines -2.82 16.57 0.00 46.89 -24.97 -3.00 413.49 39.16 330.80 104.46 920.57 Singapore -47.27 -392.60 -329.26 0.00 -233.84 -430.61 -321.22 -200.07 3,639.18 -745.43 938.89 Thailand -29.13 -65.56 -118.87 -101.24 0.00 -52.49 -252.78 -271.30 2,907.76 -525.48 1,490.90 Viet Nam -10.53 -31.02 -18.62 -15.08 -5.69 0.00 -12.07 -19.01 267.04 -59.24 95.79 USA 8.29 11.17 -152.88 208.02 -75.46 -1.19 0.00 123.37 -501.03 100.00 -279.69 Japan -16.76 -1.68 -266.16 325.30 -342.10 -23.38 393.97 0.00 -823.79 472.17 -282.44 China 1,371.60 1,456.34 3,057.17 643.94 3,140.16 944.81 -813.34 -511.53 -889.91 -1,557.07 6,842.16 ROW -13.82 119.73 -543.70 417.50 -365.92 -89.28 482.25 467.77 -2,679.26 844.00 -1,360.75
10,489.12 However, both ASEAN and China see a reduction in their trade with other partners – the US, Japan and the rest of the world. Hence, the overall effect is a modest rise in exports. Taking these trade diversion effects into account, ASEAN’s exports only increase by US $5.6 billion or 1.5% from the baseline. The biggest gainers in absolute terms are Thailand, Indonesia and Malaysia. China’s exports rises by US $ 6.8 billion or only by 2.4% from the baseline. Decomposing the changes in ASEAN’s exports to China by country and by sector, we see that the biggest gainers for ASEAN are textiles and apparel, electrical appliances and machinery and other manufactures. Indonesia’s exports of other manufactures to China rises by US $ 1.3 billion. Singapore’s exports of electrical appliances and machinery to China rises by US $ 1.3 billion. Thai exports of textiles and apparel to China rises by US $ 1.7 billion.
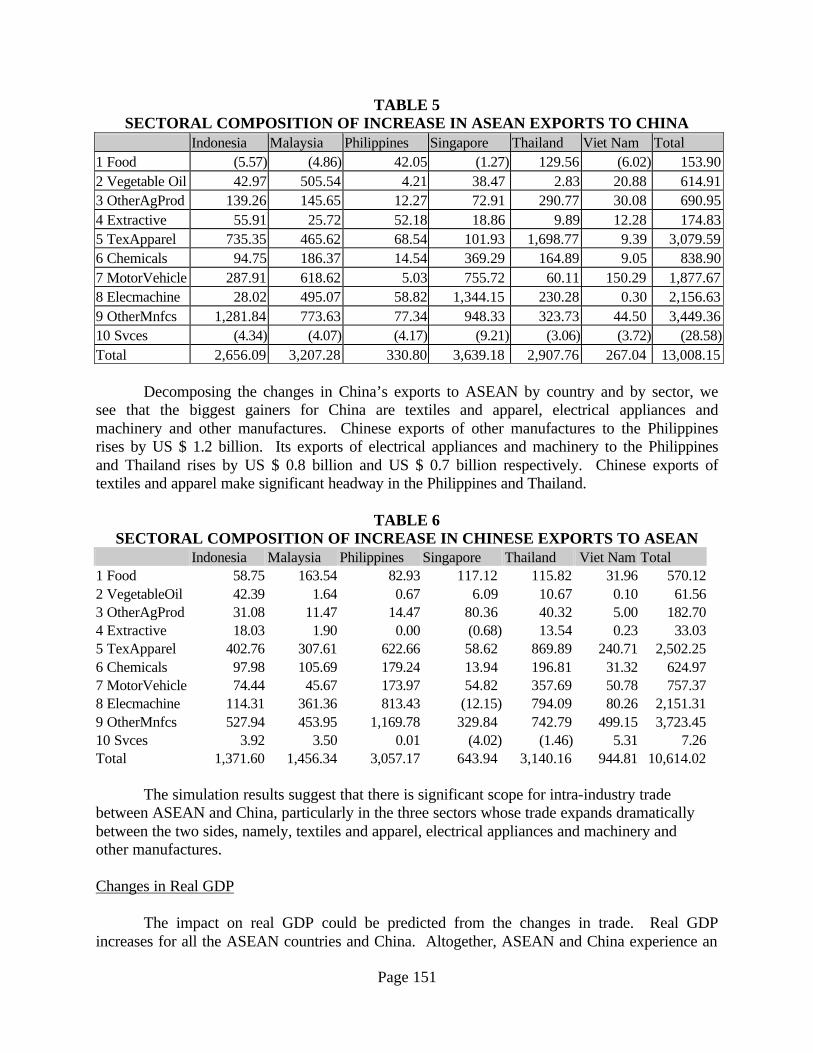
Page 151
TABLE 5 SECTORAL COMPOSITION OF INCREASE IN ASEAN EXPORTS TO CHINA
Indonesia Malaysia Philippines Singapore Thailand Viet Nam Total 1 Food (5.57) (4.86) 42.05 (1.27) 129.56 (6.02) 153.90 2 Vegetable Oil 42.97 505.54 4.21 38.47 2.83 20.88 614.91 3 OtherAgProd 139.26 145.65 12.27 72.91 290.77 30.08 690.95 4 Extractive 55.91 25.72 52.18 18.86 9.89 12.28 174.83 5 TexApparel 735.35 465.62 68.54 101.93 1,698.77 9.39 3,079.59 6 Chemicals 94.75 186.37 14.54 369.29 164.89 9.05 838.90 7 MotorVehicle 287.91 618.62 5.03 755.72 60.11 150.29 1,877.67 8 Elecmachine 28.02 495.07 58.82 1,344.15 230.28 0.30 2,156.63 9 OtherMnfcs 1,281.84 773.63 77.34 948.33 323.73 44.50 3,449.36 10 Svces (4.34) (4.07) (4.17) (9.21) (3.06) (3.72) (28.58) Total 2,656.09 3,207.28 330.80 3,639.18 2,907.76 267.04 13,008.15 Decomposing the changes in China’s exports to ASEAN by country and by sector, we see that the biggest gainers for China are textiles and apparel, electrical appliances and machinery and other manufactures. Chinese exports of other manufactures to the Philippines rises by US $ 1.2 billion. Its exports of electrical appliances and machinery to the Philippines and Thailand rises by US $ 0.8 billion and US $ 0.7 billion respectively. Chinese exports of textiles and apparel make significant headway in the Philippines and Thailand.
TABLE 6 SECTORAL COMPOSITION OF INCREASE IN CHINESE EXPORTS TO ASEAN
Indonesia Malaysia Philippines Singapore Thailand Viet Nam Total 1 Food 58.75 163.54 82.93 117.12 115.82 31.96 570.12 2 VegetableOil 42.39 1.64 0.67 6.09 10.67 0.10 61.56 3 OtherAgProd 31.08 11.47 14.47 80.36 40.32 5.00 182.70 4 Extractive 18.03 1.90 0.00 (0.68) 13.54 0.23 33.03 5 TexApparel 402.76 307.61 622.66 58.62 869.89 240.71 2,502.25 6 Chemicals 97.98 105.69 179.24 13.94 196.81 31.32 624.97 7 MotorVehicle 74.44 45.67 173.97 54.82 357.69 50.78 757.37 8 Elecmachine 114.31 361.36 813.43 (12.15) 794.09 80.26 2,151.31 9 OtherMnfcs 527.94 453.95 1,169.78 329.84 742.79 499.15 3,723.45 10 Svces 3.92 3.50 0.01 (4.02) (1.46) 5.31 7.26 Total 1,371.60 1,456.34 3,057.17 643.94 3,140.16 944.81 10,614.02
The simulation results suggest that there is significant scope for intra-industry trade between ASEAN and China, particularly in the three sectors whose trade expands dramatically between the two sides, namely, textiles and apparel, electrical appliances and machinery and other manufactures. Changes in Real GDP The impact on real GDP could be predicted from the changes in trade. Real GDP increases for all the ASEAN countries and China. Altogether, ASEAN and China experience an

Page 152
increase of US $ 7.6.billion in real GDP. On the ASEAN side, the biggest percentage increase is experienced by Viet Nam while Indonesia’s GDP increases the most in absolute terms. In the case of China, her GDP grows by only 0.27% although it represents about US $ 2.2 billion in absolute terms.
TABLE 7
IMPACT ON REAL GDP OF AN ASEAN-CHINA FTA
COUNTRY REAL GDP
(US $ Millions)
ABSOLUTE INCREASE
(US $ Millions) PERCENTAGE
INCREASE Indonesia 204,031.4 2,267.8 1.12% Malaysia 98,032.3 1,133.5 1.17% Philippines 71,167.1 229.1 0.32% Singapore 72,734.9 753.3 1.05% Thailand 165,516.0 673.6 0.41% Viet Nam 16,110.9 339.1 2.15% USA 7,120,465.5 -2,594.5 -0.04% Japan 5,078,704.5 -4,452.0 -0.09% China 815,163.0 2,214.9 0.27% ROW 14,657,026.0 -6,272.0 -0.04% Total 28,298,952.1 -5,706.9 -0.02% It is worth emphasizing that the absolute or percentage changes may not be all that important. What is important is the sign of the changes, which is positive for all ASEAN countries and China. The implication of the simulation is that an FTA will increase real GDP for all participants. However, there are negative repercussions for other countries and regions. The US, Japan and the rest of the world all suffer a decline in real GDP. In value terms, the biggest decline is suffered by the rest of the world and Japan. For the global economy as a whole, the FTA has a small negative impact on global GDP. The increases experienced by ASEAN and China are not enough to offset the losses suffered by other trading partners.
Conclusion
The results of the simulation exercise suggest the following conclusions: § Trade between ASEAN and China will grow dramatically with the establishment of an
FTA. ASEAN exports to China are predicted to expand by 48% while Chinese exports to ASEAN rises by 55.1%. The sectors where bilateral trade expands coincide: textiles and apparel, electrical appliances and machinery, and other manufactures suggesting scope for intra-industry trade.

Page 153
§ Real GDP will also grow for both ASEAN countries and China, with ASEAN countries getting about two thirds of the increase and China the remaining third.
§ There are significant trade diversion effects, which will have a negative impact on other
trading partners. It is possible therefore that an FTA between ASEAN and China may not be seen positively by other trading partners.
§ From the point of view of trade and GDP impacts, an FTA between ASEAN and China is
feasible. All sides gain from the linkage. However, a move towards an FTA between ASEAN and China must be sensitive to and attempt to address the concerns of other trading partners.
Finally, we must end by recognizing the limitations of the GTAP database in not including four ASEAN countries – Brunei Darussalam, Cambodia, Myanmar and Lao PDR. Our conclusion that an FTA between ASEAN and China is feasible would have been stronger if the simulations had included these four countries and showed that they gained from the FTA.

Page 154
ANNEX 1
I. SECTORAL AGGREGATION
SECTORS GTAP SECTORS
1. Food Paddy rice; Wheat; Cereal grains nec; Vegetables, fruit, nuts; Sugar cane, sugar beet; Fishing; Bovine cattle, sheep and goat, horse meat products; Meat products nec; Dairy products; Processed rice; Sugar; Food products nec
2. Vegetable Oils and Fats Oil seeds; Vegetable oils and fats 3. Other Agricultural Products Plant-based fibers; Crops nec; Bovine cattle,
sheep and goats, horses; Animal products nec; Raw milk; wool, silk-worm cocoons;
4. Extractive Forestry; Coal; Oil; Gas; Minerals nec; 5. Textiles and Apparel Textiles; wearing apparel 6. Chemicals Petroleum, coal products; Chemical, rubber,
plastic products 7. Motor Vehicles Motor vehicles and parts; Transport equipment
nec 8. Electronics and Machinery Electronic equipment; Machinery and
equipment nec 9. Other Manufactures Beverages and tobacco products; Leather
products; Wood products; Paper products, publishing; Ferrous metals; Metals nec; metal products; Manufactures nec
10. Services Electricity; Gas manufacture, distribution; Water; Construction; Trade, transport; Financial, business, recreational services; Public administration and defence, education, health; Dwellings

Page 155
II. REGIONAL AGGREGATION
REGIONS
GTAP REGIONS
1. Indonesia Indonesia 2. Malaysia Malaysia 3. Philippines Philippines 4. Singapore Singapore 5. Thailand Thailand 6. Vietnam Vietnam 7. China China and Hong Kong 8. USA United States of America 9. Japan Japan 10. Rest of the World Argentina, Australia, Brazil, Canada, Central
America and the Caribbean, Central European Associates, Chile, China, Colombia, Denmark, EFTA, Finland, Former Soviet Union, Germany, India, Korea, Mexico, Morocco, New Zealand, South African Customs Union, Sri Lanka, Sweden, Taiwan, Turkey, United Kingdom, Uruguay, Venezuela, Rest of the Andean Pact, Rest of European Union, Rest of Middle East, Rest of North Africa, Rest of South America, Rest of South Asia, Rest of Southern Africa, Rest of Sub-Saharan Africa, Rest of World