forlab tool and quantification country examples ... · programmatic influences ... presentation...
TRANSCRIPT

ForLab tool and quantification
country examples: historical
procurement informing
forecasts for 2016-2017 and
programmatic influences
Farouk Adams UMARU, PhD

PEPFAR Implementing Partner
Presentation outline
• Brief description of ForLab tool
• ForLab implementation in developing
countries
• Historical procurement trends for CD4,
viral load, and EID
• Considerations for 2016–2017 forecast
and program influencers in developing
countries
2

PEPFAR Implementing Partner
Description of ForLab tool
3
• Forecasting and quantification tool for laboratory
commodities
• Collaboratively developed by CHAI and SCMS, funded
by USAID
• Employs a multi-method forecast approach, using
patient demographic information, historical test
numbers, and historical product consumption
• Compares multi-method forecasts to identify
efficiencies in laboratory programs
• Predicts instrument utilization, diagnostics contribution,
and diversity
• Conducts site-level and national aggregate forecasts

PEPFAR Implementing Partner
ForLab implementation in developing countries
4
SCMS Country
CHAI Country Trainer Version of ForLab used in
country Botswana Yes No SCMS 1.6.9 Burundi Yes No SCMS 1.6.9 Cambodia CHAI 1.6.9 Cameroon No Yes CHAI 1.6.9 Cote d'Ivoire Yes No SCMS 1.6.9 DRC Yes No SCMS 1.6.5 Ethiopia Yes Yes SCMS and
CHAI 1.6.9
Haiti Yes No SCMS 1.6.9 Kenya No Yes CHAI 1.6.9 Laos CHAI 1.6.9 Lesotho No Yes CHAI 2.0.0 Malawi No Yes CHAI 1.6.9 Mozambique Yes SCMS 1.6.9 Myanmar Yes CHAI 1.6.9 Nigeria Yes Yes SCMS and
CHAI 1.6.9
Papua New Guinea CHAI 1.6.9 Rwanda Yes SCMS 1.6.9 Swaziland No Yes CHAI 2.0.0 Tanzania Yes Yes SCMS 1.6.9 Uganda Yes Yes CHAI Vietnam Yes CHAI 1.6.9 Zambia Yes Yes CHAI and
SCMS 1.6.9
Zimbabwe Yes Yes SCMS 1.6.9

PEPFAR Implementing Partner
Historical procurement trends for
CD4, viral load, and EID
5

PEPFAR Implementing Partner
Value (US$) and percentage of CD4 reagents by
instruments, 2010–2015
6
0.0%
10.0%
20.0%
30.0%
40.0%
50.0%
60.0%
70.0%
$-
$10
$20
$30
$40
$50
$60
$70
$80
Beckman Cyflow Dynal FACSCalibur FACSCount FACSPresto Guava PIMA Pointcare
Mill
ion
s
2010 2011 2012 2013 2014 2015 Percent Total

PEPFAR Implementing Partner
Value (US$) and percentage of CD4 reagents by
country, 2010–2015
7
0.0%
5.0%
10.0%
15.0%
20.0%
25.0%
$-
$5
$10
$15
$20
$25
$30M
illio
ns
2010 2011 2012 2013 2014 2015 Percent by country

PEPFAR Implementing Partner
Historical trend in volume and value of CD4 in
developing countries, 2010–2015
8
$-
$5
$10
$15
$20
$25
$30
-
1
2
3
4
5
6
2010 2011 2012 2013 2014 2015
Mill
ion
s
Mill
ion
s
Annual Volume Trend Annual Value Trend

PEPFAR Implementing Partner
Annual value (US$) of viral load reagents by
instrument, 2010–2015
9
$-
$1
$1
$2
$2
$3
$3
$4
$4
$5
$5
2010 2011 2012 2013 2014 2015
Mill
ion
s
COBAS - Amplicor COBAS - Taqman M2000

PEPFAR Implementing Partner
Value (US$) of viral load tests by country,
2010–2015
10
$-
$500 000
$1 000 000
$1 500 000
$2 000 000
$2 500 000
$3 000 000
2010 2011 2012 2013 2014 2015
PEPFAR Implementing Partner
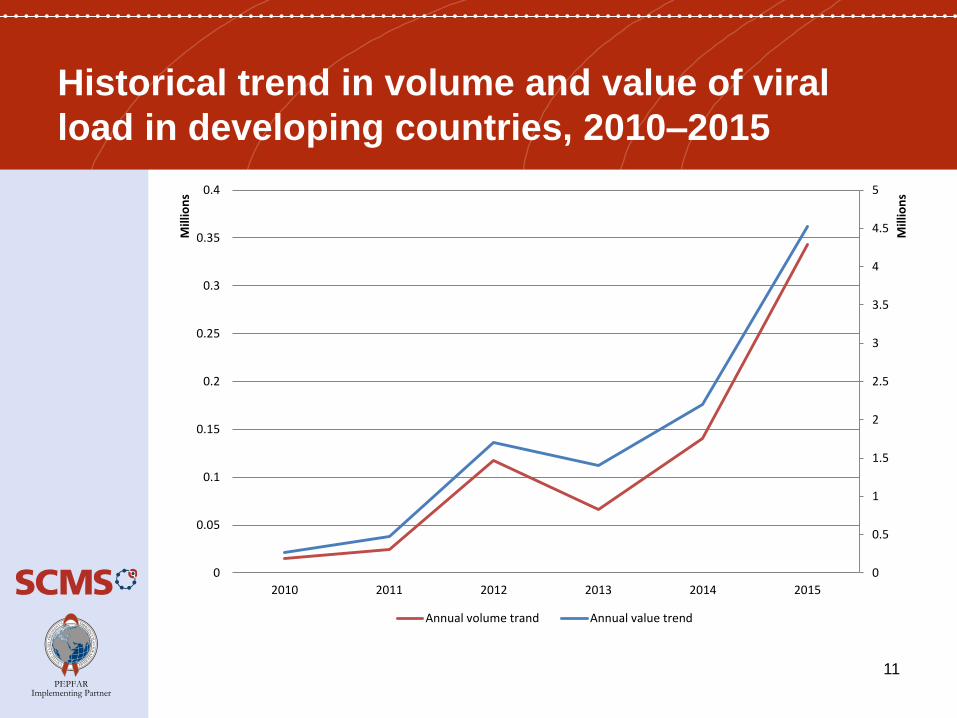
Historical trend in volume and value of viral
load in developing countries, 2010–2015
11
0
0.5
1
1.5
2
2.5
3
3.5
4
4.5
5
0
0.05
0.1
0.15
0.2
0.25
0.3
0.35
0.4
2010 2011 2012 2013 2014 2015
Mill
ion
s
Mill
ion
s
Annual volume trand Annual value trend

PEPFAR Implementing Partner
Annual value (US$) of EID reagents by
instrument, 2010–2015
12
$-
$1
$1
$2
$2
$3
$3
$4
2010 2011 2012 2013 2014 2015
Mill
ion
s
COBAS - Amplicor COBAS - Taqman M2000

PEPFAR Implementing Partner
Value of EID tests by country, 2010–2015
13
0
0.5
1
1.5
2
2.5M
illio
ns
2010 2011 2012 2013 2014 2015

PEPFAR Implementing Partner
Historical trend in volume and value of EID in
developing countries, 2010–2015
14
-
500
1 000
1 500
2 000
2 500
3 000
3 500
-
50
100
150
200
250
300
2010 2011 2012 2013 2014 2015
Tho
usa
nd
s
Tho
usa
nd
s
Annual tests volumes Annual value trend

PEPFAR Implementing Partner
Comparative uptake of CD4 and viral load tests in
developing countries, 2010–2015
15
2010 2011 2012 2013 2014 2015
CD4 tests 2 767 150 3 779 210 4 616 670 5 076 300 4 633 250 3 734 500
Viral load tests 14 544 24 576 117 672 66 576 140 064 343 152
-
1 000 000
2 000 000
3 000 000
4 000 000
5 000 000
6 000 000
Test
s

PEPFAR Implementing Partner
Considerations for 2016–2017 forecast and
program influencers in developing countries
16
• Use of multi-data and multi-method forecasting
technique:
• Demographic or patient information
• Procurement data / Central-level issues data / Facility-
level consumption information
• Service or test information (DHIS, LMIS, etc.)
• Assessing existing country capacity to rapidly adopt
new guidelines
• Use of appropriate forecast assumptions (simple
linear growth, accelerated growth, etc.)
• Government and international donor commitments
