form 10-k -...
TRANSCRIPT

UNITED STATESSECURITIES AND EXCHANGE COMMISSION
Washington, D.C. 20549
FORM 10-K
x Annual report pursuant to Section 13 or 15(d) of the Securities Exchange Act of 1934 for the fiscal year ended September 25, 2016; or ¨ Transition report pursuant to Section 13 or 15(d) of the Securities Exchange Act of 1934 for the transition period from ________ to ________
Commission File Number: 0-19797
WHOLE FOODS MARKET, INC.(Exact name of registrant as specified in its charter)
Texas 74-1989366(State of incorporation) (I.R.S. Employer Identification No.)
550 Bowie Street, Austin, Texas 78703
(Address of principal executive offices) (Zip code)
Registrant’s telephone number, including area code: 512-477-4455
Securities registered pursuant to section 12(b) of the Act:
Title of each class Name of each exchange on which registeredCommon Stock, no par value NASDAQ Global Select Market
Indicate by check mark if the registrant is a well-known seasoned issuer, as defined in Rule 405 of the Securities Act.Yes x No ¨
Indicate by check mark if the registrant is not required to file reports pursuant to Section 13 or Section 15(d) of the Act.Yes ¨ No x
Indicate by check mark whether the registrant (1) has filed all reports required to be filed by Section 13 or 15(d) of the Securities Exchange Act of 1934 during thepreceding 12 months (or for such shorter period that the registrant was required to file such reports), and (2) has been subject to such filing requirements for thepast 90 days. Yes x No ¨
Indicate by check mark whether the registrant has submitted electronically and posted on its corporate Web site, if any, every Interactive Data File required to besubmitted and posted pursuant to Rule 405 of Regulation S-T (§ 232.405 of this chapter) during the preceding 12 months (or for such shorter period that theregistrant was required to submit and post such files). Yes x No ¨
Indicate by check mark if disclosure of delinquent filers pursuant to Item 405 of Regulation S-K (§ 229.405 of this chapter) is not contained herein, and will not becontained, to the best of registrant’s knowledge, in definitive proxy or information statements incorporated by reference in Part III of this Form 10-K or anyamendment to this Form 10-K. ¨
Indicate by check mark whether the registrant is a large accelerated filer, an accelerated filer, a non-accelerated filer, or a smaller reporting company. Seedefinitions of “large accelerated filer,” “accelerated filer” and “smaller reporting company” in Rule 12b-2 of the Exchange Act.

Large accelerated filer x Accelerated filer ¨ Non-accelerated filer ¨ Smaller reporting company ¨
Indicate by check mark whether the registrant is a shell company (as defined in Rule 12b-2 of the Exchange Act). Yes ¨ No x
The aggregate market value of all common stock held by non-affiliates of the registrant as of April 10, 2016 was $9,736,323,562 . The number of shares of theregistrant’s common stock, no par value, outstanding as of November 11, 2016 was 318,405,710 shares.
DOCUMENTS INCORPORATED BY REFERENCEThe information required by Part III of this report, to the extent not set forth herein, is incorporated by reference from the registrant’s definitive Proxy Statementfor the Annual Meeting of the Stockholders to be held February 17, 2017 .

Whole Foods Market, Inc.Annual Report on Form 10-KFor the Fiscal Year Ended September 25, 2016Table of Contents
Page
PART I Item 1. Business. 1Item 1A. Risk Factors. 10Item 1B. Unresolved Staff Comments. 13Item 2. Properties. 14Item 3. Legal Proceedings. 14Item 4. Mine Safety Disclosures. 14 PART II Item 5. Market for Registrant’s Common Equity, Related Stockholder Matters and Issuer Purchases of Equity Securities. 15Item 6. Selected Financial Data. 17Item 7. Management’s Discussion and Analysis of Financial Condition and Results of Operations. 18Item 7A. Quantitative and Qualitative Disclosures About Market Risk. 29Item 8. Financial Statements and Supplementary Data. 31Item 9. Changes in and Disagreements with Accountants on Accounting and Financial Disclosure. 63Item 9A. Controls and Procedures. 63Item 9B. Other Information. 64 PART III Item 10. Directors, Executive Officers and Corporate Governance. 65Item 11. Executive Compensation. 65Item 12. Security Ownership of Certain Beneficial Owners and Management and Related Stockholder Matters. 65Item 13. Certain Relationships and Related Transactions, and Director Independence. 65Item 14. Principal Accounting Fees and Services. 65 PART IV Item 15. Exhibits, Financial Statement Schedules. 66 SIGNATURES 68

Table of Contents
Disclaimer on Forward-looking StatementsCertain statements in this Report on Form 10-K and from time to time in other filings with the Securities and Exchange Commission, news releases, reports, andother written and oral communications made by us and our representatives, constitute forward-looking statements within the meaning of the U.S. Private SecuritiesLitigation Reform Act of 1995. These forward-looking statements are often identified by words such as “anticipate,” “believe,” “intend,” “estimate,” “expect,”“continue,” “could,” “can,” “may,” “will,” “likely,” “depend,” “would,” “plan,” “project,” “predict,” “goal,” “target,” “sustain,” “seek” and similar expressions,and include references to assumptions and relate to our future prospects, developments and business strategies. Except for the historical information containedherein, the matters discussed in this report are forward-looking statements that involve risks and uncertainties that may cause our actual results to be materiallydifferent from such forward-looking statements and could materially adversely affect our business, financial condition, operating results and cash flows. Theserisks and uncertainties include general business conditions, changes in overall economic conditions that impact consumer spending, the impact of competition andother factors which are often beyond the control of the Company, as well other risks listed in Part I, “Item 1A. Risk Factors,” of this report and risks anduncertainties not presently known to us or that we currently deem immaterial. We wish to caution you that you should not place undue reliance on such forward-looking statements, which speak only as of the date on which they were made. We do not undertake any obligation to update forward-looking statements.
This information should be read in conjunction with the consolidated financial statements and the accompanying notes included in this report.
Unless otherwise specified, references to “Whole Foods Market,” “Company,” or “we” in this report include Whole Foods Market, Inc. and its consolidatedsubsidiaries.
PART I
Item 1. Business.
GeneralWhole Foods Market is the leading natural and organic foods supermarket, the first national “Certified Organic” grocer, and uniquely positioned as America’sHealthiest Grocery Store™. The Company incorporated in 1978, opened the first Whole Foods Market store in 1980, and is based in Austin, Texas. We completedour initial public offering in January 1992, and our common stock trades on the NASDAQ Global Select Market under the symbol “WFM.”
Whole Foods Market is a mission-driven company that aims to set the standards of excellence in food retailing. Our motto – Whole Foods, Whole People, WholePlanet – emphasizes that our vision reaches far beyond food retailing. Our success is measured by customer satisfaction, team member happiness and excellence,return on invested capital, active environmental stewardship, service in our local and global communities, and win-win supplier partnerships, among other things.Through our growth, we have had a significant and positive impact on the natural and organic foods movement throughout the United States, helping lead theindustry to nationwide acceptance over the last 38 years.
We have one operating segment, natural and organic foods supermarkets. We are the largest natural and organic foods supermarket in the U.S., the 5th largestpublic food retailer, and the 10th largest food retailer overall based on 2015 sales rankings from Progressive Grocer. As of September 25, 2016 , we operated 456stores in the United States (“U.S.”), Canada, and the United Kingdom (“U.K.”), averaging over eight million customer visits each week. Our stores average 39,000square feet in size and are supported by our global headquarters, regional offices, distribution centers, bakehouse facilities, commissary kitchens, seafood-processing facilities, a produce procurement center, and a specialty coffee and tea procurement and roasting operation.
1

Table of Contents
The following is a summary of our annual percentage sales and net long-lived assets by geographic area for the fiscal years indicated:
2016 2015 2014
Sales: United States 97% 97% 97%Canada and United Kingdom 3 3 3
Total sales 100% 100% 100%
Long-lived assets, net: United States 98% 97% 96%Canada and United Kingdom 3 3 4
Total long-lived assets, net 100% 100% 100%Figures may not sum due to rounding.
A five-year summary of certain financial and operating information can be found in Part II, “Item 6. Selected Financial Data,” of this report. See also Part II, “Item8. Financial Statements and Supplementary Data.”
Industry OverviewAccording to Nielsen TDLinx and Progressive Grocer , the U.S. supermarket industry, which includes conventional supermarkets, supercenters, warehousegrocery stores, military commissaries and limited-assortment and natural/gourmet-positioned supermarkets, had approximately $649.1 billion in sales in 2015, a2% increase over the prior year. Within this broader category, natural product sales through retail channels were approximately $107.9 billion , a 9% increase overthe prior year, according to Natural Foods Merchandiser , a leading trade publication for the natural foods industry. We believe the growth in sales of natural andorganic foods is being driven by numerous factors, including:
• heightened awareness of the role that healthy eating plays in long-term wellness;• a better-educated and wealthier populace whose median age is increasing each year;• a highly influential younger generation that values health, sustainability, organic, local and ethical trade;• increasing consumer concern over where and how food is produced; and• various environmental concerns.
Our Purpose and Core ValuesWe believe that much of our success to date is because we remain a uniquely mission-driven company. The purpose of our business is not only to generate profitsbut to create value for all of our major stakeholders, each of which is linked interdependently. Our Core Values succinctly express this purpose:
• We sell the highest quality natural and organic products available.• We satisfy, delight and nourish our customers.• We support team member happiness and excellence.• We create wealth through profits and growth.• We serve and support our local and global communities.• We practice and advance environmental stewardship.• We create ongoing win-win partnerships with our suppliers.• We promote the health of our stakeholders through healthy eating education.
Our Quality Standards and Differentiated Product OfferingWe believe our high quality standards differentiate our stores from other supermarkets and enable us to attract and maintain a broad base of loyal customers. Ourgroundbreaking quality standards ban hundreds of ingredients commonly found in products sold by other retailers, as well as products grown or produced bymanufacturing, farming, fishing and ranching practices that don’t measure up. Here are a few highlights:
• We ban more than 120 food ingredients commonly found in other stores.• We sell only food with no artificial flavors, colors, preservatives or sweeteners, and no hydrogenated fats or high-fructose corn syrup.• All of our fresh meat is from animals that have been assessed for animal welfare and have never been given hormones or antibiotics. No synthetic nitrates
are added to our cured meat.• All of our seafood is sourced from responsibly-managed fish farms and sustainable fisheries.• All eggs in our dairy case and used in our kitchens and bakeries are from cage-free hens.
2

Table of Contents
• We ban 75 ingredients in our body care products due to human health and environmental concerns.• We only sell eco-friendly cleaning products with full ingredient disclosure labeling.
We offer the broadest selection of high-quality natural and organic products, with a strong emphasis on perishable foods. Our stores also feature a wide variety ofnon-GMO, vegan, gluten-free, dairy-free and other special diet foods. An average store carries approximately 35,000 SKUs, with certain of our larger storescarrying up to 55,000 SKUs.
The following is a summary of annual percentage sales by product category for the fiscal years indicated:
2016 2015 2014
Perishables: Prepared foods and bakery 19% 19% 19%Other perishables 48 48 48
Total perishables 67 67 67Non-perishables 34 34 33
Total sales 100% 100% 100%Figures may not sum due to rounding.
Certified Organic RetailerWhile retailers of organic products are not required by the U.S. Department of Agriculture (“USDA”) to become certified, Whole Foods Market’s decision tovoluntarily certify all of our stores and operations shows our deep commitment to organic consumers and to the preservation of organic integrity. In 2003, webecame the first national “Certified Organic” grocer and to this day remain the only national supermarket with all store departments and operations certified.
Whole Foods Market is certified by California Certified Organic Farmers (“CCOF”), an independent, USDA-accredited, third-party certifier. CCOF’s OrganicCertification Program for retailers verifies we handle organic goods according to stringent USDA guidelines. The CCOF audit process confirms that we:
• examine the current organic certification status of our organic products;• maintain an extensive record-keeping process that demonstrates a fully traceable audit trail for our organic products;• ensure our organic products are appropriately protected from commingling with conventional products and contamination with prohibited materials;• train team members in the handling practices of organic product; and• open our stores to on-site inspections by CCOF.
All Whole Foods Market retail stores in North America are “Certified Organic.” Additionally, certain facilities and product lines have been certified organicthrough their own organic handling plans, including all of our regional distribution centers and several of our bakehouses; our 365 Organic Everyday Value™private label product line; and our Allegro Coffee™ line.
We offer more than 30,000 unique organic SKUs company-wide, covering all areas of our store including produce, packaged goods, bulk, frozen, dairy, meat,bakery, prepared foods, coffee, tea, beer, wine, cheese, nutritional supplements, vitamins, body care, pet foods, and household goods. More than 30% of our sales,outside of prepared foods and bakery, were organic in fiscal year 2016.
Exclusive BrandsOur exclusive brands program, which generated approximately $2.3 billion in sales in fiscal year 2016 and currently features approximately 5,300 SKUs, is a keycomponent of our value platform and essential to our product innovation and differentiation strategy. Led by our 365 Everyday Value® brand, exclusive brandsaccounted for approximately 15% of total retail sales in fiscal year 2016, up from 14% of total retail sales in fiscal year 2015. Approximately 55% of our exclusivebrand food offerings are either certified organic or “Non-GMO Project Verified.” Other exclusive brands include, but are not limited to, Allegro Coffee, WholeFoods Market, Whole Paws, and Engine 2 Plant-Strong. In addition to our exclusive brands, we regularly offer approximately 400 temporary exclusives, which arebranded products that are unique to Whole Foods Market in terms of flavor, size or other attributes.
Health Starts Here®Our Health Starts Here logo is featured on products in our prepared foods departments that meet nutritional guidelines rooted in four principles: Focus on WholeFoods, Eat Plant-Strong™, Choose Healthy Fats, and Consider Nutrient Density. These
3

Table of Contents
guidelines were created by doctors and registered dietitians based on scientific research as well as guidelines proposed by the USDA, U.S. Food and DrugAdministration (“FDA”), World Health Organization and American Heart Association.
Responsibly GrownUsing a science-based index, our Responsibly Grown label assesses performance on important sustainable farming issues, including pest management, farm workerwelfare, pollinator protection, water conservation and protection, soil health, ecosystems and biodiversity, waste, air, energy and climate.
Whole Trade® GuaranteeProducts with our Whole Trade Guarantee label are sourced from developing countries and have been third-party certified to meet certain standards in terms ofbetter wages and working conditions, sound environmental practices and community development projects. We donate 1% of our Whole Trade product sales toWhole Planet Foundation® to help alleviate world poverty.
Commitment to LocalWhole Foods Market currently purchases produce grown locally on more than 1,400 U.S. farms. Buying local allows us to offer our shoppers the freshest, mostflavorful pick of seasonal products; it bolsters local economies by keeping money in the pockets of community growers; and it contributes to responsible landdevelopment and the preservation of viable green spaces. For some stores, “local” is defined as within a certain mile radius, and for others, it means within themetro, state, or tri-state area. In addition to featuring local products in our stores, we have disbursed approximately $21 million in loans to 260 local producersunder our Local Producer Loan Program as of September 25, 2016 .
Meat Standards and Animal WelfareFor 35 years, our quality standards have prohibited the administration of hormones of any type to animals raised for meat in our stores, including beef cattle andlamb (the only two species for which the USDA permits the use of hormones). Beta agonists, which are used to enhance growth and develop lean muscle tissue inlivestock, are also prohibited. In 2002, we extended our standards to prohibit the use of therapeutic antibiotics for treating disease or infection. Sick animals arerequired to be treated, but they cannot then be sold to Whole Foods Market. In addition, since 2000, we have worked diligently with our suppliers to continuallyimprove our animal welfare standards. In 2008, we implemented the Global Animal Partnership’s 5-Step® Animal Welfare Rating program in all of our stores inthe U.S. and Canada. All beef, chicken, pork and turkey in our fresh meat cases must meet at least 100 animal welfare standards for a Step 1 rating.
Seafood Standards and SustainabilityWe set strict requirements for the seafood we source, with full traceability from fishery or farm to store. All wild-caught seafood we sell is from fisheries that arecertified sustainable by the Marine Stewardship Council or rated either “Green” or “Yellow” by the Monterey Bay Aquarium and The Safina Center. We don’t sellany red-rated seafood. All of our farmed seafood is third-party verified to meet our strict Responsibly Farmed standards, which prohibit antibiotics, parasiticides inthe water or feed, and antifoulants on the nets. We also prohibit treating wild and farmed seafood with carbon monoxide or phosphate and sulfite preservatives. Wehave earned the top spot three years in a row on Greenpeace’s “Carting Away the Oceans” seafood sustainability report.
GMO TransparencyWe announced our GMO (“genetically modified organism”) Transparency Initiative in 2013 and are well on our way to providing GMO transparency for the foodwe sell by September 1, 2018. Currently, we offer more than 30,000 certified organic items (which must be non-GMO to meet USDA organic standards) and morethan 13,500 “Non-GMO Project Verified” products in our stores.
Body Care StandardsWe never sell body care products that have been tested on animals, and we ban 75 ingredients commonly found in conventional body care products, includingphthalates, formaldehyde, microbeads, triclosan, BHT, BHA and aluminum chlorohydrate. Body care products making an organic claim must be certified under theUSDA’s National Organic Program or NSF International’s 305 Standard for Personal Care Products Containing Organic Ingredients. Additionally, our standardsfor dietary supplements and oral care products prohibit certain ingredients such as artificial colors, flavors and sweeteners.
Eco-Scale™Our Eco-Scale rating system requires all household cleaning product ingredients to be listed on packaging, allowing shoppers to easily identify a product’senvironmental impact and safety based on a red-orange-yellow-green color scale. All products in our stores must meet our minimum orange standard.
4

Table of Contents
Growth StrategyWe are a Fortune 500 company, ranking number 181 on the 2016 list. Our sales have grown rapidly through strong comparable store sales growth, acquisitions andnew store openings from approximately $93 million in fiscal year 1991, excluding the effect of pooling-of-interests transactions completed since 1991, toapproximately $15.7 billion in fiscal year 2016.
Our growth strategy is to expand primarily through new store openings, and while we may pursue acquisitions of smaller chains that provide access to desirablegeographic areas and experienced team members, such acquisitions are not expected to significantly impact our future store growth or financial results. We have adisciplined, opportunistic real estate strategy, opening stores in existing trade areas as well as new areas, including international locations. We typically targetpremium real estate sites, and while new stores may be as small as 20,000 square feet or as large as 75,000 square feet, the majority fall in the range of 30,000 to45,000 square feet.
Our historical store growth for the fiscal years indicated is summarized below:
2016 2015 2014 2013 2012
Stores at beginning of fiscal year 431 399 362 335 311Stores opened 28 38 34 26 25Acquired stores — — 4 6 —Relocated stores (3) (6) (1) (5) (1)Stores at end of fiscal year 456 431 399 362 335
Total gross square footage at end of fiscal year 17,800,000 16,625,000 15,162,000 13,779,000 12,735,000Year-over-year growth 7.1% 9.7% 10.0% 8.2% 7.6%
Our historical store development pipeline as of the dates indicated is summarized below:
November 2,
2016November 4,
2015November 5,
2014November 6,
2013November 7,
2012
Stores in development 98 111 114 94 79Average size (gross square feet) 42,000 43,000 41,000 38,000 37,000Total gross square footage in development 4,136,000 4,810,000 4,723,000 3,605,000 2,896,000
Store DescriptionWe strive to transform food shopping from a chore into a dynamic experience by designing and operating stores with a lively, inspirational atmosphere, mission-oriented décor and well-trained team members. We offer an exciting product mix that emphasizes our high quality standards and healthy eating, with a range ofchoices at every price level, ever-changing selections, samples, open kitchens, scratch bakeries, hand-stacked produce, bulk departments and extensive preparedfoods stations featuring wood-burning pizza ovens; burrito stations and ethnic foods; juicing and handcrafted coffee stations; and greens, beans and grains cookingbars, among others. To meet our customers’ evolving needs and preferences, we carefully evaluate and balance the blend between full- and self-service options.We also incorporate environmentally sustainable aspects into our store design, and many stores have bicycle racks and electric vehicle charging stations. Our storestypically include sit-down eating areas and customer service booths, and many stores offer special services such as personal shopping, online ordering, and homedelivery through customer service or Instacart. Many of our urban stores offer sit-down wine bars and tap rooms featuring local and/or craft beer and wine, creatinga destination for customer gathering. We believe our stores play a unique role as a third place, besides the home and office, where people can gather, interact andlearn while at the same time discovering the many joys of eating and sharing food.
In selecting store locations, we use an internally developed model to analyze potential sites based on various criteria such as education levels, interest in andawareness of natural and organic foods, population density and other demographic information within certain drive times. After we have selected a target site, ourdevelopment group does a comprehensive site study and sales projection and works with our regional teams to develop construction and operating cost estimates.Each project must meet an internal Economic Value Added (“EVA®”) hurdle return, which for new stores generally is expected to be cumulative positive EVA infive years or less. In its simplest definition, EVA is equivalent to net operating profits after taxes minus a charge on the cost of invested capital necessary togenerate those profits. The Company’s calculated weighted average cost of capital can vary with changes to the capital structure and is currently below 6%. Forreal estate purposes, however, the Company takes a more conservative approach, continuing to use an internal metric of 8%.
The required cash investment for new stores varies depending on the size of the store, geographic location, degree of landlord incentives and complexity of sitedevelopment issues. To a significant degree, it also depends on how the project is structured,
5

Table of Contents
including costs for elements that often increase or decrease rent, e.g., lease acquisition costs, shell and/or garage costs, and landlord allowances. Because of thesedifferences, the average development cost per square foot may vary significantly from project to project.
365 by Whole Foods Market™In fiscal year 2016, we launched a value store format, 365 by Whole Foods Market. As a second growth vehicle, 365 complements the Whole Foods Market brand,allowing us to address the value-quality proposition through a convenient, smaller footprint and curated product selection. Our 365 stores feature a streamlinedoperating model, centralized buying, and inventory auto-replenishment. We are using our many learnings from our first three 365 openings to shape and evolve notonly future 365 stores but Whole Foods Market stores as well.
SeasonalityThe Company’s average weekly sales and gross profit as a percentage of sales are typically highest in the second and third fiscal quarters, and lowest in the fourthfiscal quarter due to seasonally slower sales during the summer months. Gross profit as a percentage of sales is also lower in the first fiscal quarter due to theproduct mix of holiday sales. For this reason, results in a quarter are not necessarily indicative of the results that may be achieved in other quarters or for the fullfiscal year.
Purchasing and DistributionWe are committed to buying from local, regional and national producers who meet our high quality standards. The majority of our purchasing occurs at theregional and national levels, enabling us to negotiate better discounts, innovate categories, and improve the supply chain, while allowing our store buyers to focuson shelf replenishment, local products, and the unique product mix necessary to keep the neighborhood market feel in our stores.
Our produce procurement center facilitates the procurement and distribution of the majority of the produce we sell. We also operate three seafood processing anddistribution facilities, a specialty coffee and tea procurement and roasting operation, and 11 regional distribution centers that focus primarily on perishablesdistribution to our stores across the U.S., Canada and the U.K. In addition, we have three regional commissary kitchens and four bakehouse facilities, all of whichdistribute products to our stores. Other products are typically procured through a combination of specialty wholesalers and direct distributors.
United Natural Foods, Inc. (“UNFI”) is our single largest third-party supplier, accounting for approximately 32% of our total purchases in fiscal year 2016. Weentered into a distribution agreement in fiscal year 2016 which generally extends our long-term relationship with UNFI as our primary supplier of dry grocery andfrozen food products through 2025.
Store OperationsWhole Foods Market stores each employ between approximately 50 and 600 team members who generally comprise up to 10 self-managed teams per store,depending on store size and sales volume. The store team leader works closely with one or more associate store team leaders, as well as the department teamleaders, to operate the store as efficiently and profitably as possible.
We strive to create a company-wide consciousness of “shared fate” by uniting the interests of team members as closely as possible with those of our shareholders.One way we reinforce this concept is through our Gainsharing program. Under Gainsharing, each team receives a labor budget expressed as a percentage of theirteam’s sales, with leverage built into the budgets on an overall company basis. When teams come in under budget due either to higher sales or lower labor costs, aportion of the surplus is divided among the team members and paid out every four weeks, and a portion is set aside in a savings pool, which is paid out annually.When teams are over budget, no Gainsharing is paid, and the overage is taken out of the team’s savings pool or paid back using future surpluses. Depending onsales volume, some stores operate under a “One Store” Gainsharing program which allows team members to work wherever they are needed most. Rewarding ourteam members for increases in labor productivity – something they can control – gives them a direct stake in the success of our business. We also encourage stockownership among team members through our broad-based team member stock option plan, stock purchase plan and 401(k) plan.
Team MembersAs of September 25, 2016 , we had approximately 87,000 team members. Full-time team members accounted for approximately 69% of all permanent positions,and full-time voluntary turnover was approximately 18%.
For the past 19 years, our team members have helped Whole Foods Market become one of FORTUNE magazine’s “100 Best Companies to Work for in America.”We are one of only 11 companies to make the “100 Best” list every year since its inception. All of our team members are non-union, and we consider our teammember relations to be very strong.
6

Table of Contents
We believe in empowering our team members to make Whole Foods Market not only a great place to shop but a great place to build a career. Our salary andbenefits programs reflect our philosophy of egalitarianism. To ensure they are perceived as fundamentally fair to all stakeholders, our books are open to our teammembers, including our annual individual compensation report. We also have a salary cap that limits the total cash compensation paid to any team member in acalendar year to 19 times the average annual wage, including bonuses, of all full-time team members. We have increased this multiple only three times since thesalary cap policy was first adopted approximately 30 years ago. Additionally, in 2007, our co-founder and co-Chief Executive Officer, John Mackey, voluntarilyreduced his annual salary to $1 and elected to forgo any future bonuses or equity awards.
All full-time and part-time team members are eligible to receive stock options through annual leadership grants or through service-hour grants once they haveaccumulated 6,000 service hours (approximately three years of full-time employment). Approximately 94% of the equity awards granted under the Company’sstock plan since its inception in 1992 have been granted to team members who are not executive officers.
As medical costs continue to rise, we periodically restructure how costs are shared between the Company and team members to ensure our health plan remainssustainable. Under the current medical plan, Whole Foods Market provides health care coverage at no cost to full-time team members working 30 or more hoursper week and having a minimum of 20,000 service hours, representing roughly 10 years of full-time employment. Full-time team members with 800 to 19,999service hours pay a premium of $20 per paycheck for individual coverage. In addition, the Company provides personal wellness dollars in the form of either ahealth reimbursement arrangement (“HRA”) or health savings account (“HSA”). Based on service hours, team members can receive up to $1,800 per year to helpcover the cost of deductibles and other allowable out-of-pocket health care expenses not covered by insurance.
We promote the health of our team members through two voluntary programs. The Total Health Immersion Program provides educational opportunities for teammembers that are paid by the Company. The Healthy Discount Incentive Program offers additional store discounts of up to 35%, going beyond the standard storediscount that all team members receive, based on meeting designated biometric criteria for cholesterol/LDL, BMI or waist-height ratio, blood pressure, and beingnicotine-free.
CompetitionFood retailing is a large, intensely competitive industry. Our competition includes but is not limited to local, regional, national and international conventional andspecialty supermarkets, natural foods stores, warehouse membership clubs, online retailers, smaller specialty stores, farmers’ markets, restaurants, and homedelivery and meal solution companies, each of which competes with us on the basis of store ambiance and experience, product selection and quality, customerservice, price, convenience or a combination of these factors.
TechnologyWe are replacing our core legacy systems with scalable solutions, and leveraging technology to operate more efficiently and deliver an improved end-to-endshopping experience. Major milestones achieved over the last year included the launch of digital coupons and a national digital sales flyer within the Whole FoodsMarket mobile app; completion of the rollout of a new labor scheduling tool for all U.S. customer service teams; and completion of the U.S. rollout within ourcustomer platform centered around a unified point-of-sale system. We also expanded our Instacart partnership, offering delivery in more U.S. cities and additionalzip codes in existing markets; market test launched our new Rewards program in Dallas and Fort Worth, building upon our initial pilot in Philadelphia; and beganthe testing phase for the first item management release of our new cloud-based product platform through our partnership with Infor.
MarketingWe are growing our investment in global marketing to increase the efficiency and effectiveness of our programming. We continue to develop our reach across allchannels - paid, owned and earned - with a focus on accelerating our social media presence. Currently, we have over 13 million fans and followers acrossFacebook, Twitter and Instagram. Additionally, we have sharpened our focus on lifecycle marketing through engagement and basket-driving programs to createdeeper connections with our customers on a one-to-one basis. Staying true to our roots, we remain committed to having a strong voice in the communities we servethrough an emphasis on nonprofit partnerships that help grow our business and our communities at the same time.
Value ProgramsIn addition to our 365 Everyday Value exclusive products, we offer thousands of competitively-priced branded items and regularly promote thousands of productseach month, including the widest array of organic and non-GMO sale items available. Our website and Whole Foods Market mobile app feature current store sales,budget-friendly recipes and money-saving tips. Our app also
7

Table of Contents
features digital coupons and a national digital weekly sales flyer. In addition, we offer Rewards programs at Whole Foods Market stores in Philadelphia, Dallas andFort Worth and at our 365 by Whole Foods Market stores.
Global ResponsibilityWe seek to be a deeply responsible company in the communities where we do business around the world, providing ethically sourced, high-quality products andtransparent information to our customers, reducing our impact on the environment, and actively participating in our local communities. Each store retains aseparate budget for making contributions to a variety of philanthropic and community activities, fostering goodwill and developing a high profile within thecommunity. Our goal is to contribute at least 5% of our after-tax profits annually to nonprofit organizations. In addition, we cover all operating costs for our threefoundations, allowing 100% of public donations to be dedicated to program support.
Whole Planet FoundationCreated in 2005, Whole Planet Foundation (www.wholeplanetfoundation.org) is an independent, nonprofit organization whose mission is to empower the poorthrough microcredit, with a focus on developing-world communities that supply our stores with product. Program grants are funded in part by the sale of productsunder the Company’s Whole Trade Guarantee Program, along with support from customers, suppliers and team members. As of June 30, 2016, Whole PlanetFoundation has partnered with 83 unique microfinance institutions to facilitate more than $70 million in various donor-funded grants for 143 projects in 69countries where the Company sources products. Over 1.5 million borrower families (88% women) have received loans, which are being used for home-basedbusinesses.
Whole Kids Foundation™Whole Kids Foundation (www.wholekidsfoundation.org), an independent nonprofit organization founded in 2011, is dedicated to improving children’s nutrition bysupporting schools and inspiring families. The foundation provides grants for school gardens and salad bars and offers cooking and nutrition education for teachersand staff. Through the generosity of Whole Foods Market customers, suppliers and community donors, approximately 3,650 schools in the U.S. and Canada havereceived school garden grants, and over 70 have received honey bee hive grants. In addition, Whole Foods Market and Whole Kids Foundation, in partnership withLet’s Move Salad Bars to Schools, have provided approximately 4,700 salad bars to schools around the country, and more than 11,000 teachers and staff havereceived nutrition inspiration.
Whole Cities Foundation™Founded in 2014, Whole Cities Foundation (www.wholecitiesfoundation.org) is an independent nonprofit dedicated to individual and community health throughcollaborative partnerships, education and broader access to nutritious food in underserved communities. Specifically, Whole Cities Foundation invests inpartnerships with grassroots organizations creating innovative solutions to food access and health in their communities. Urban farms that collaborate with nutritioneducation programs to offer affordable healthy food, cooking classes, and health and wellness information are one example. To date, Whole Cities Foundation hasinvested in partnerships in Englewood (Chicago), IL; New Orleans, LA; Detroit, MI; and Jackson, MS, with partnerships underway in Newark, NJ and other cities.
Green Mission®We are committed to practicing and advancing environmental stewardship, earning seven Environmental Protection Agency (“EPA”) Green Power awards. In2014, we announced our commitment to reduce energy consumption 20% by 2020 as an official partner in the Department of Energy’s Better Buildings Challenge.Many of our stores and facilities use or host rooftop solar systems, wind turbines, combined heat and power (CHP) systems, non-HFC refrigeration, and rooftopfarms. We also have installed electric vehicle charging stations at more than 75 U.S. stores. We build our new stores with the environment in mind, using greenbuilding innovations whenever possible. Dozens of stores have received Leadership in Energy and Environmental Design (“LEED”) certification by the U.S.Green Building Council; earned Green Globes certification from the Green Building Initiative; and received GreenChill Certification awards from the EPA. Thisincludes one store in Dublin, CA that was honored in 2016 with the EPA’s “Best of the Best” GreenChill Award for its state-of-the-art refrigeration system.
Since 2008, we no longer offer disposable plastic grocery bags at the checkouts in our stores, and we offer a refund of at least a nickel per reusable bag. We werethe first national retailer to provide Forest Stewardship Council certified paper bags originating from 100% post-consumer recycled fiber. Unless located in acommunity that does not support recycling and composting, all of our stores are involved in a recycling program, and most participate in a composting programwhere food waste and compostable paper items are regenerated into compost. Twenty-eight of our stores have been Zero Waste Certified (defined as having a 90%overall diversion rate of waste from landfills) by the U.S. Zero Waste Business Council. In addition, we continue to partner with packaging suppliers and vendorsto ensure the highest standards for sustainable quality packaging, including the use of fiber packaging in many of our prepared foods departments as a compostablealternative to traditional petroleum and wood- or tree-
8

Table of Contents
based materials. We also are working to eliminate the use of Styrofoam in packing materials shipped to our Company and in product packaging in our stores.
RecognitionsWhole Foods Market was recognized on a number of lists in fiscal year 2016, including but not limited to: FORTUNE ’s “World’s Most Admired Companies,”“100 Best Companies to Work for in America” and “Blue Ribbon Companies” lists; Forbes ’ “America’s Best Employers” list and its list of “Top 10 Brands WithWhich U.S. Consumers Have the Most Intimacy” based on reporting by brand consultancy MBLM; Business Insider ’s list of “24 Brands that Improve the Qualityof Everyday Life” based on a survey by polling site Ranker.com, and the “Business Insider 100: The Creators” list; and LinkedIn’s “North America’s 2015 Top100 InDemand Employers” list. FORTUNE also named us to its “20 Best Workplaces in Retail,” “10 Best Workplaces in the Fortune 500,” and “100 BestWorkplaces for Millennials” lists.
TrademarksTrademarks owned by the Company or its subsidiaries include, but are not limited to: “Whole Foods Market” and the “Whole Foods Market” logo, “365 by WholeFoods Market” and the “365 by Whole Foods Market” logos, “365” and the “365” logo, “365 Everyday Value” and the “365 Everyday Value” logos, “AFA,”“Allegro Coffee Company” and the “Allegro” logo, “America’s Healthiest Grocery Store,” “Awesome Eats,” “Bread & Circus,” “Eco-Scale,” “Food from a HappyPlace,” “Fresh & Wild,” “Fresh Fields,” “Friends of 365,” “Green Mission,” “Greenlife Grocery,” “Harry’s Farmers Market,” “Health Starts Here” and the “HealthStarts Here” logo, “Ideal Market,” “Improving Lives with Every Purchase,” the Leafy “O” logo, the “Local Producer Loan Program” logo, “Merchant of Vino,”“Mrs. Gooch’s,” “My Street Grocery” and the “My Street Grocery” logo, the “Responsibly Grown” logo, “Vine Buys,” “Wellspring,” “Whole Body” and the“Whole Body” logo, “Whole Catch,” “Whole Cities Foundation,” “The Whole Deal,” “Whole Foods, Whole People, Whole Planet,” “Whole Foods MarketBrewing Company,” “Whole Kids,” “Whole Kids Foundation,” “Whole Paws” and the “Whole Paws” logo, “Whole Planet Foundation,” “Whole Story,” and“Whole Trade”. The Company and its subsidiaries have registered or applied to register numerous trademarks, service marks, stylized logos, and brand names inthe U.S. and in many additional countries throughout the world. In addition, the Company licenses certain trademarks, including “ENGINE 2” and “PLANT-STRONG,” which are trademarks owned by Engine 2 for Life, LLC. The Company considers certain of its trademarks to be of material importance and activelydefends and enforces such trademarks. The duration of trademark registrations varies from country to country; however, trademarks are generally valid and may berenewed indefinitely as long as they are in use and/or their registrations are properly maintained.
Executive Officers of the RegistrantThe following table sets forth the name, age, and position of each of the persons who was serving as an executive officer of the Company as of November 11, 2016:
Name Age Position
John Mackey 63 Co-Chief Executive OfficerWalter Robb 62 Co-Chief Executive OfficerA.C. Gallo 63 President and Chief Operating OfficerGlenda Flanagan 62 Executive Vice President and Chief Financial OfficerJames Sud 64 Executive Vice President of Growth and Business DevelopmentDavid Lannon 50 Executive Vice President of OperationsKenneth Meyer 48 Executive Vice President of OperationsJason Buechel 38 Executive Vice President and Chief Information Officer
John Mackey, co-founder of the Company, has served as co-Chief Executive Officer since May 2010, was the Chief Executive Officer from 1978 to May 2010,and was President from June 2001 to October 2004. Mr. Mackey co-authored Conscious Capitalism: Liberating the Heroic Spirit of Business, a 2013 New YorkTimes and Wall Street Journal best seller. To date, profits from books sold at Whole Foods Market stores, along with 100% of the royalties received by Mr.Mackey, have resulted in donations of nearly $190,000 to Whole Planet Foundation.
Walter Robb has served as co-Chief Executive Officer since May 2010. Mr. Robb also served as the co-President and co-Chief Operating Officer from 2004 toMay 2010, as Chief Operating Officer from 2001 to September 2004, and as Executive Vice President from 2000 to February 2001. Since joining the Company in1991, Mr. Robb has also served as Store Team Leader and President of the Northern California Region. On November 2, 2016, we announced that Mr. Robb willresign as co-Chief Executive Officer effective as of December 31, 2016. Mr. Robb will continue to serve as a senior advisor to the Company from January 1, 2017to September 24, 2017.
9

Table of Contents
A.C. Gallo has served as President and Chief Operating Officer of the Company since May 2010. Prior to that, he was co-President and co-Chief Operating Officersince September 2004. Mr. Gallo also served as Chief Operating Officer from December 2003 to September 2004. Mr. Gallo has held various positions with theCompany and with Bread & Circus, Inc., which was acquired by the Company in October 1992, including Vice President and President of the North AtlanticRegion, and Executive Vice President of Operations.
Glenda Flanagan has served as Executive Vice President and Chief Financial Officer of the Company since December 1988. On November 2, 2016, we announcedthat Ms. Flanagan intends to retire from her role, effective the end of the Company’s 2017 fiscal year. Ms. Flanagan will continue to serve the Company in a senioradvisor capacity.
James Sud has served as Executive Vice President of Growth and Business Development of the Company since February 2001. Mr. Sud joined the Company inMay 1997 and served as Vice President and Chief Operating Officer until February 2001. Mr. Sud served as a director of the Company from 1980 to 1997.
David Lannon has served as Executive Vice President of Operations of the Company since February 2012. Prior to that, Mr. Lannon had served as President of theNorthern California Region since December 2007 and President of the North Atlantic Region from March 2001 to December 2007. Mr. Lannon has held variouspositions with the Company and with Bread & Circus, Inc., which was acquired by the Company in October 1992, including Store Team Leader, Director of StoreOperations and Vice President of the North Atlantic Region.
Kenneth Meyer has served as Executive Vice President of Operations of the Company since February 2012. Mr. Meyer also served as President of the Mid-Atlantic Region from October 2004 to February 2012. Mr. Meyer has held various positions with the Company and with Fresh Fields Market, which was acquiredby the Company in August 1996, including Store Team Leader, Vice President of the Southwest Region, and President of the South Region.
Jason Buechel has served as Executive Vice President and Chief Information Officer of the Company since July 2015. Mr. Buechel joined the Company in 2013and served as Global Vice President and Chief Information Officer until July 2015. Prior to that, he spent 12 years at Accenture, where he served as ManagingDirector and Partner in the company’s retail operations practice, including leading the retail channels practice for North America.
Available InformationOur corporate website is www.wholefoodsmarket.com. We make available through the Investor Relations section of this site, free of charge, the Company’sSecurities and Exchange Commission (“SEC”) filings, including annual reports on Form 10-K, quarterly reports on Form 10-Q, interactive data, current reports onForm 8-K, proxy statement, Section 16 filings, and all amendments to those reports. We also make available our corporate governance documents, Code ofBusiness Conduct, and Board of Directors committee charters and policies. We have included our website as an inactive textual reference only. Informationcontained on our website is not incorporated by reference into this Report on Form 10-K.
Item 1A. Risk Factors.
Business and Operating RisksOur growth depends on increasing sales in comparable stores and on new store openings, and our failure to achieve these goals could negatively impact ourresults of operations and financial condition.Our continued growth depends on our ability to increase sales in our comparable stores and open new stores. Our operating results may be materially impacted byfluctuations in our comparable store sales. Our comparable store sales growth could be lower than our historical average for many reasons including the impact ofnew and acquired stores entering into the comparable store base, the opening of new stores that cannibalize store sales in existing areas, general economicconditions, increased competition, price changes in response to competitive factors, possible supply shortages, and cycling against any year of above-average salesresults.
Our growth strategy includes opening new stores in existing and new areas and operating those stores successfully. Successful implementation of this strategy isdependent on finding suitable locations, and we face competition from other retailers for such sites. There can be no assurance that we will continue to growthrough new store openings. We may not be able to open new stores timely or operate them successfully. Also, we may not be able to successfully hire and trainnew team members or integrate those team members into the programs and policies of the Company. We may not be able to adapt our distribution, managementinformation and other operating systems to adequately supply products to new stores at competitive prices so that we can operate the stores in a successful andprofitable manner.
10

Table of Contents
A failure to maintain the privacy and security of customer-related and business information could damage our reputation and business.A compromise of our security systems or those of our business associates that results in our customers’, team members’ or suppliers’ information being obtainedby unauthorized persons or a breach of information security laws and regulations could adversely affect our reputation with our customers, team members andothers, as well as our operations, results of operations, financial condition and liquidity, and could result in litigation against us or the imposition of penalties. Inaddition, a security breach could require that we expend significant additional resources related to remediation, including changes in the information securitysystems, and could result in a disruption of our operations, particularly our online business.
Disruptions in our information systems could harm our ability to run our business.We rely extensively on information systems for point-of-sale processing in our stores, supply chain, financial reporting, human resources and various otherprocesses and transactions. Our information systems are subject to damage or interruption from power outages, computer and telecommunications failures,computer viruses, security breaches, including breaches of our transaction processing or other systems that could result in the compromise of confidential customerdata, catastrophic events, and usage errors by our team members. If our systems are breached, damaged or cease to function properly, we may have to makesignificant investments to fix or replace them, suffer interruptions in our operations, and face costly litigation, and our reputation with our customers may beharmed. Any material interruption in our information systems may have a material adverse effect on our operating results.
Disruption of significant supplier relationships could negatively affect our business.United Natural Foods, Inc. (“UNFI”) is our single largest third-party supplier, accounting for approximately 32.5% of our total purchases in fiscal year 2016 . Dueto this concentration of purchases from a single third-party supplier, the cancellation of our distribution arrangement or the disruption, delay or inability of UNFI todeliver product to our stores may materially and adversely affect our operating results while we establish alternative distribution channels.
The loss of key management or difficulties recruiting and retaining qualified team members could negatively affect our business.We are dependent upon a number of key management and other team members. If we were to lose the services of a significant number of key team memberswithin a short period of time, this could have a material adverse effect on our operations. We do not maintain key person insurance on any team member. Ourcontinued success also is dependent upon our ability to attract and retain qualified team members to meet our future growth needs. We face intense competition forqualified team members, many of whom are subject to offers from competing employers. We may not be able to attract and retain necessary team members tooperate our business.
A loss in consumer confidence in the safety and quality of certain food products could materially impact our results of operations.We believe our high quality standards differentiate our stores from other supermarkets and enable us to attract and maintain a broad base of loyal customers.Concerns regarding the quality or safety of our food products or our food supply chain, whether true or not, could cause consumers to avoid purchasing certainproducts from us, or to seek alternative food sources. Any report linking the Company to food contamination, food tampering, mislabeling, or other food safetyissues could adversely impact sales and possibly lead to product liability claims or litigation.
Claims under our self-insurance program may differ from our estimates, which could materially impact our results of operations.The Company uses a combination of insurance and self-insurance plans to provide for the potential liabilities for workers’ compensation, general liability, propertyinsurance, director and officers’ liability insurance, vehicle liability and team member health care benefits. Liabilities associated with the risks that are retained bythe Company are estimated, in part, by considering historical claims experience, demographic factors, severity factors and other actuarial assumptions. In addition,a significant number of our stores are in locations that could be affected by natural disasters. In the event of a natural disaster, the Company could incur significantlosses and significant expenditures in order to resume operations. Our results could be materially impacted by claims and other expenses related to such plans iffuture occurrences and claims differ from these assumptions and historical trends.
Market and Other External RisksIncreased competition may adversely affect our revenues and profitability.Our competitors include but are not limited to local, regional, national and international supermarkets, natural food stores, warehouse membership clubs, onlineretailers, small specialty stores, farmers’ markets, restaurants, home delivery and meal solution companies. Their businesses compete with us for products,customers and locations. In addition, some are expanding more aggressively in offering a range of natural and organic foods. Some of these competitors may havebeen in business longer or may have greater financial or marketing resources than we do and may be able to devote greater resources to sourcing,
11

Table of Contents
promoting and selling their products. As competition in certain areas intensifies, our operating results may be negatively impacted through a loss of sales, reductionin margin from competitive price changes, and/or greater operating costs such as marketing.
Adverse publicity may reduce our brand value and negatively impact our business.We believe our Company has built an excellent reputation as a food retailer, socially responsible corporation and employer, and we believe our continued successdepends on our ability to preserve, grow and leverage the value of our brand. Brand value is based in large part on perceptions of subjective qualities, and evenisolated incidents can erode trust and confidence, particularly if they result in adverse publicity, governmental investigations or litigation, which can negativelyimpact these perceptions and our business. We believe that many customers choose to shop our stores because of their interest in health, nutrition and food safetyand that they hold us to a higher food safety standard than other supermarkets. There is increasing governmental scrutiny of and public awareness regarding foodsafety. The real or perceived sale of contaminated food products by us could result in government enforcement action, private litigation, product recalls and otherliabilities, the settlement or outcome of which might have a material adverse effect on our operating results and brand value.
Economic conditions that adversely impact consumer spending could materially impact our business.Our operating results may be materially impacted by changes in overall economic conditions that impact consumer confidence and spending, includingdiscretionary spending. Future economic conditions affecting disposable consumer income such as employment levels, business conditions, changes in housingmarket conditions, the availability of credit, interest rates, tax rates, fuel and energy costs, the impact of natural disasters or acts of terrorism, and other matterscould reduce consumer spending or cause consumers to shift their spending to lower-priced competitors. In addition, there can be no assurance that variousgovernmental activities to stimulate the economy will restore consumer confidence or change spending habits.
Changes in the availability of quality natural and organic products could impact our business.We source our products from a variety of local, regional, national and international suppliers, and we rely on them to meet our quality standards and supplyproducts in a timely and efficient manner. There is, however, no assurance that quality natural and organic products will be available to meet our needs.Competition has increased for natural, organic, sustainably-sourced, and responsibly-grown products. As other competitors significantly increase their natural andorganic product offerings, if new laws require the reformulation of certain products to meet tougher standards, or if natural disasters or other catastrophic eventsoccur, the supply of these products may be constrained.
A widespread health epidemic could materially impact our business.The Company’s business could be severely impacted by a widespread regional, national or global health epidemic. Our stores are a place where customers cometogether, interact and learn and at the same time discover the many joys of eating and sharing food. A widespread health epidemic may cause customers to avoidpublic gathering places or otherwise change their shopping behaviors. Additionally, a widespread health epidemic could also adversely impact our business bydisrupting production and delivery of products to our stores and by impacting our ability to appropriately staff our stores.
Financial Reporting, Legal and Other Regulatory RisksPending or future legal proceedings could materially impact our results of operations.From time to time, we are party to legal proceedings, including matters involving personnel and employment issues, personal injury, product liability, protectingour intellectual property, acquisitions, and other proceedings arising in the ordinary course of business. Additionally, we are occasionally subject to industry-wideor class-action claims arising from the products we carry or industry-specific business practices. Further, we are involved in several securities class action litigationmatters. Additional volatility in the price of our securities could result in additional securities class action litigation matters. Our results could be materiallyimpacted by the decisions and expenses related to pending or future proceedings.
Our indebtedness or inability to comply with debt covenants could materially impact our future cash flows.During fiscal year 2016, we entered into a $500 million revolving line of credit that extends to 2020, and we completed an offering of $1.0 billion aggregateprincipal amount of 5.2% senior notes due 2025. Changes in our credit ratings, or in the interest rate environment, could have an adverse impact on our financingcosts. A significant portion of our future cash flow from operating activities may be dedicated to the repayment of our indebtedness. Our indebtedness could limitour ability to obtain additional financing for working capital, capital expenditures, debt service requirements, acquisitions or other purposes in the future. There isno guarantee that we will be able to meet our debt service obligations. If we fail to comply with our debt covenants, we will be in default, in which case there canbe no assurance that we would be able to cure the default, receive waivers from our lenders, amend the loan agreement or refinance the debt. See Note 9 of theNotes to Consolidated Financial Statements in Part II, “Item 8. Financial Statements and Supplementary Data,” of this report.
12

Table of Contents
Changes in accounting standards and estimates could materially impact our results of operations.Generally accepted accounting principles and related accounting pronouncements, implementation guidelines, and interpretations for many aspects of our business,such as accounting for insurance and self-insurance, inventories, goodwill and intangible assets, store closures, leases, income taxes and share-based payments, arehighly complex and involve subjective judgments. Changes in these rules or their interpretation or changes in underlying estimates, assumptions or judgments byour management could significantly change or add significant volatility to our reported earnings without a comparable underlying change in cash flow fromoperations.
Effective tax rate changes and results of examinations by taxing authorities could materially impact our results of operations.Our future effective tax rates could be adversely affected by the earnings mix being lower than historical results in states or countries where we have lowerstatutory rates and higher-than-historical results in states or countries where we have higher statutory rates, by changes in the valuation of our deferred tax assetsand liabilities, or by changes in tax laws or interpretations thereof. In addition, we are subject to periodic audits and examinations by the Internal Revenue Service(“IRS”) and other state and local taxing authorities. Our results could be materially impacted by the determinations and expenses related to proceedings by the IRSand other state and local taxing authorities. See Note 11 of the Notes to Consolidated Financial Statements in Part II, “Item 8. Financial Statements andSupplementary Data,” of this report.
Unfavorable changes in governmental regulation could harm our business.The Company is subject to various local, state, federal and international laws, regulations and administrative practices affecting our business, and we must complywith provisions regulating health and sanitation standards, weights and measures, food labeling, equal employment, minimum wages, and licensing for the sale offood and, in some stores, alcoholic beverages. Our new store openings could be delayed or prevented or our existing stores could be impacted by difficulties orfailures in our ability to obtain or maintain required approvals or licenses. Changes in existing laws, changes in the enforcement of existing laws, orimplementation of new laws, regulations and practices could have a significant impact on our business.
The USDA’s Organic Rule facilitates interstate commerce and the marketing of organically produced food, and provides assurance to our customers that suchproducts meet consistent, uniform standards. Compliance with this rule could pose a significant burden on some of our suppliers, which may cause a disruption insome of our product offerings.
We cannot predict the nature of future laws, regulations, interpretations or applications, or determine what effect either additional government regulations oradministrative orders, when and if promulgated, or disparate local, state, federal and international regulatory schemes would have on our business in the future.They could, however, require the reformulation of certain products to meet new standards, the recall or discontinuance of certain products not able to bereformulated, additional recordkeeping, expanded documentation of the properties of certain products, expanded or different labeling and/or scientificsubstantiation. Any or all of such requirements could have an adverse effect on our operating results.
A failure or our internal control over financial reporting could materially impact our business or stock price.The Company’s management is responsible for establishing and maintaining adequate internal control over financial reporting. An internal control system, nomatter how well designed and operated, can provide only reasonable, not absolute, assurance that the objectives of the control system are met. Further, the designof a control system must reflect the fact that there are resource constraints, and the benefits of controls must be considered relative to their costs. Because of theinherent limitations in all internal control systems, internal control over financial reporting could limit our ability to report our financial results accurately andtimely or to detect and prevent fraud, and could expose us to litigation or adversely affect the market price of our common stock. The Company’s managementconcluded that its internal control over financial reporting was effective as of September 25, 2016. See Management’s Report on Internal Control over FinancialReporting in Part 11, “Item 9A. Controls and Procedures,” of this report.
Item 1B. Unresolved Staff Comments.
Not applicable.
13

Table of Contents
Item 2. Properties.
As of September 25, 2016 , we operated 456 stores: 436 stores in 42 U.S. states and the District of Columbia; 11 stores in Canada; and 9 stores in the U.K. We own18 stores and three distribution facilities. We also own four properties leased to third parties; a building on leased land, which is leased to third parties; and aparking facility on leased land. All other stores, distribution centers, bakehouses and administrative facilities are leased, and we have options to renew most of ourleases in five-year increments. In addition, as of September 25, 2016 , we had 21 leased properties and adjacent spaces that are not being utilized in currentoperations, of which 15 are related to our acquisition of Wild Oats Markets in August 2007. We are actively negotiating to sublease or terminate leases related tothese locations.
The following table shows the number of our stores by U.S. state, the District of Columbia, Canada and the U.K. as of September 25, 2016 :
LocationNumberof stores Location
Numberof stores Location
Numberof stores
Alabama 3 Kansas 4 New York 17Arizona 11 Kentucky 2 North Carolina 12Arkansas 2 Louisiana 6 Ohio 9California 85 Maine 1 Oklahoma 3Canada 11 Maryland 9 Oregon 9Colorado 20 Massachusetts 31 Pennsylvania 10Connecticut 9 Michigan 7 Rhode Island 3District of Columbia 4 Minnesota 6 South Carolina 4Florida 26 Mississippi 1 Tennessee 6Georgia 10 Missouri 3 Texas 29Hawaii 3 Nebraska 2 United Kingdom 9Idaho 1 Nevada 5 Utah 5Illinois 26 New Hampshire 2 Virginia 13Indiana 4 New Jersey 15 Washington 10Iowa 1 New Mexico 4 Wisconsin 3
Item 3. Legal Proceedings.
Information related to our legal proceedings is discussed in Note 16 of the Notes to Consolidated Financial Statements in Part II, “Item 8. Financial Statements andSupplementary Data,” of this report.
Item 4. Mine Safety Disclosures.
Not applicable.
14

Table of Contents
PART II
Item 5. Market for Registrant’s Common Equity, Related Stockholder Matters and Issuer Purchases of Equity Securities.
Whole Foods Market’s common stock is traded on the NASDAQ Global Select Market under the symbol “WFM.”
The Company is a member of the Standard & Poor’s S&P 500 Index and the NASDAQ-100 ® Index.
The following table sets forth the intra-day quarterly high and low sale prices of the Company’s common stock for fiscal years 2016 and 2015 :
High Low
Fiscalyear2016: September 28, 2015 to January 17, 2016 $ 34.84 $ 28.61January 18, 2016 to April 10, 2016 34.61 27.94April 11, 2016 to July 3, 2016 35.43 28.06July 4, 2016 to September 25, 2016 34.67 27.67
Fiscalyear2015: September 29, 2014 to January 18, 2015 $ 52.40 $ 36.24January 19, 2015 to April 12, 2015 57.57 50.70April 13, 2015 to July 5, 2015 52.16 39.10July 6, 2015 to September 27, 2015 41.97 30.18
As of November 11, 2016 , there were 1,326 holders of record of Whole Foods Market’s common stock, and the closing stock price was $30.30 .
DividendsThe following table provides a summary of dividends declared per common share during fiscal years 2016 and 2015 (in millions, except per share amounts):
Date of declarationDividend per common share Date of record Date of payment Total amount
Fiscalyear2016: November 4, 2015 $ 0.135 January 15, 2016 January 26, 2016 $ 44March 9, 2016 0.135 April 8, 2016 April 19, 2016 44June 7, 2016 0.135 July 1, 2016 July 12, 2016 43September 22, 2016 (1) 0.135 October 3, 2016 October 14, 2016 43
Fiscalyear2015: November 5, 2014 $ 0.13 January 16, 2015 January 27, 2015 $ 47March 10, 2015 0.13 April 10, 2015 April 21, 2015 47June 9, 2015 0.13 July 2, 2015 July 14, 2015 47September 15, 2015 0.13 October 2, 2015 October 13, 2015 45(1) Dividend accrued at September 25, 2016
On November 2, 2016, the Company’s Board of Directors authorized an increase in the Company’s quarterly dividend to $0.14 per common share from $0.135 percommon share, payable on January 24, 2017, to shareholders of record at the close of business on January 13, 2017. The Company will pay future dividends at thediscretion of the Company’s Board of Directors. The continuation of these payments, the amount of such dividends, and the form in which dividends are paid (cashor stock) depend on many factors, including the results of operations and the financial condition of the Company. Subject to these qualifications, the Companycurrently expects to pay dividends on a quarterly basis.
15

Table of Contents
Performance GraphThe following graph and accompanying table show the cumulative five-year total return to shareholders of Whole Foods Market, Inc.’s common stock relative tothe cumulative total returns of the S&P 500 Index, and the S&P Consumer Staples Index. The graph tracks the performance of a $100 investment in our commonstock and in each of the indices (with the reinvestment of all dividends) from September 30, 2011 to September 30, 2016. The stock price performance included inthis graph is not necessarily indicative of future stock price performance.
9/30/2011 9/30/2012 9/30/2013 9/30/2014 9/30/2015 9/30/2016
Whole Foods Market, Inc. 100.00 150.11 185.79 122.34 102.88 93.80S&P 500 100.00 130.20 155.39 186.05 184.91 213.44S&P Consumer Staples 100.00 124.30 141.77 165.19 176.92 204.82Copyright© 2016 S&P, a division of McGraw Hill Financial. All rights reserved.
Issuer Purchases of Equity SecuritiesThe following table provides information about the Company’s share repurchase activity during the twelve weeks ended September 25, 2016 .
Period (1)Total number of shares
purchased Average price paid per
share
Total number of sharespurchased as part ofpublicly announced
plans or programs (2)
Approximate dollarvalue of shares that mayyet be purchased under
the plans or programs (2)
July 4, 2016 - July 31, 2016 — $ — — $ 457,947,710August 1, 2016 - August 28, 2016 — — — 457,947,710August 29, 2016 - September 25, 2016 516,285 27.98 516,285 443,504,390Total 516,285 $ 27.98 516,285 (1) Periodic information is presented by reference to our fiscal periods during the fourth quarter of fiscal year 2016 .(2) On November 4, 2015, the Board authorized a share repurchase program whereby the Company may make up to $1.0 billion in stock purchases of outstanding
shares of common stock of the Company. The repurchase program does not have an expiration date. Under the share repurchase programs, purchases can bemade from time to time using a variety of methods, which may include open market purchases. The specific timing, price and size of purchases will depend onprevailing stock prices, general economic and market conditions, and other considerations. Purchases may be made through a Rule 10b5-1 plan pursuant topre-determined metrics set forth in such plan. The Board’s authorization of the share repurchase program does not obligate the Company to acquire anyparticular amount of common stock, and the program may be suspended or discontinued at any time at the Company’s discretion.
16

Table of Contents
Item 6. Selected Financial Data.
Whole Foods Market, Inc.Summary Financial Information(In millions, except per share amounts and operating data)
The following selected financial data are derived from the Company’s consolidated financial statements and should be read in conjunction with “Item 7.Management’s Discussion and Analysis of Financial Condition and Results of Operations” and “Item 8. Financial Statements and Supplementary Data” of thisreport.
Sept. 25, 2016 Sept. 27, 2015 Sept. 28, 2014 Sept. 29, 2013 Sept. 30, 2012
Consolidated Statements of Operations Data (1) Sales $ 15,724 $ 15,389 $ 14,194 $ 12,917 $ 11,699Cost of goods sold and occupancy costs 10,313 9,973 9,150 8,288 7,543
Gross profit 5,411 5,416 5,044 4,629 4,156Selling, general and administrative expenses 4,477 4,472 4,032 3,682 3,355Pre-opening expenses 64 67 67 52 47Relocation, store closure and lease termination costs 13 16 11 12 10
Operating income 857 861 934 883 744Interest expense (41) — — — Investment and other income 11 17 12 11 8
Income before income taxes 827 878 946 894 752Provision for income taxes 320 342 367 343 286
Net income $ 507 $ 536 $ 579 $ 551 $ 466
Basic earnings per share $ 1.55 $ 1.49 $ 1.57 $ 1.48 $ 1.28
Weighted average shares outstanding 326.1 358.5 367.8 371.2 364.8
Diluted earnings per share $ 1.55 $ 1.48 $ 1.56 $ 1.47 $ 1.26
Weighted average shares outstanding, diluted basis 326.9 360.8 370.5 374.5 368.9
Dividends declared per common share $ 0.54 $ 0.52 $ 0.48 $ 1.40 $ 0.28
Consolidated Balance Sheets Data Net working capital $ 634 $ 292 $ 499 $ 892 $ 1,126Total assets 6,341 5,741 5,744 5,538 5,294Long-term debt (including current maturities) 1,051 65 62 27 24Shareholders’ equity 3,224 3,769 3,813 3,878 3,802 Operating Data
—
Number of stores at end of fiscal year 456 431 399 362 335Average store size (gross square footage) 39,000 39,000 38,000 38,000 38,000Average weekly sales per store $ 682,000 $ 715,000 $ 722,000 $ 711,000 $ 682,000Comparable store sales increase (decrease) (2) (2.5)% 2.5% 4.4% 7.0% 8.8%(1) Fiscal years 2016, 2015, 2014, and 2013 were 52-week years and fiscal year 2012 was a 53-week year.
(2) Sales of a store are deemed to be comparable commencing in the fifty-seventh full week after the store was opened or acquired. Stores closed for eight or moredays are excluded from the comparable store base from the first full week of closure until re-opened for a full fiscal week. Comparable store sales growth iscalculated on a same-calendar-week to same-calendar-week constant currency basis.
17

Table of Contents
Item 7. Management’s Discussion and Analysis of Financial Condition and Results of Operations.
OverviewWhole Foods Market is the leading natural and organic foods supermarket, the first national “Certified Organic” grocer, and uniquely positioned as America’sHealthiest Grocery Store™. We are a mission-driven company that aims to set the standards of excellence in food retailing. Our success is measured by customersatisfaction, team member happiness and excellence, return on invested capital, active environmental stewardship, service in our local and global communities, andwin-win supplier partnerships, among other things. Through our growth, we have had a significant and positive impact on the natural and organic foods movementthroughout the United States, helping lead the industry to nationwide acceptance. The Company incorporated in 1978, opened the first Whole Foods Market storein 1980, and as of September 25, 2016 , operated 456 stores: 436 stores in 42 U.S. states and the District of Columbia; 11 stores in Canada; and 9 stores in theUnited Kingdom. We have one operating segment, natural and organic foods supermarkets.
Our continued growth depends on our ability to increase sales in our comparable stores and open new stores. Our growth strategy includes opening new stores inexisting and new areas and operating those stores successfully. The Company’s average weekly sales and gross profit as a percentage of sales are typically highestin the second and third fiscal quarters, and lowest in the fourth fiscal quarter due to seasonally slower sales during the summer months. Gross profit as a percentageof sales is also lower in the first fiscal quarter due to the product mix of holiday sales.
Sales of a store are deemed to be comparable commencing in the fifty-seventh full week after the store was opened or acquired. Stores closed for eight or moredays are excluded from the comparable store base from the first fiscal week of closure until re-opened for a full fiscal week. Comparable store sales growth iscalculated on a same-calendar-week to same-calendar-week constant currency basis. Companies define comparable store sales differently; thus growth rates acrosscompanies may not be comparable.
The Company reports its results of operations on a 52- or 53-week fiscal year ending on the last Sunday in September. Fiscal years 2016, 2015 and 2014 were 52-week years.
Economic and Industry FactorsFood retailing is a large, intensely competitive industry. According to Nielsen TDLinx and Progressive Grocer , the U.S. supermarket industry, which includesconventional supermarkets, supercenters, warehouse grocery stores, military commissaries and limited-assortment and natural/gourmet-positioned supermarkets,had approximately $649.1 billion in sales in 2015, a 2% increase over the prior year. Within this broader category, natural product sales through retail channelstotaled approximately $107.9 billion , a 9% increase over the prior year, according to Natural Foods Merchandiser . Our competition includes but is not limited tolocal, regional, national and international conventional and specialty supermarkets, natural foods stores, warehouse membership clubs, online retailers, smallerspecialty stores, farmers’ markets, restaurants, home delivery and meal solution companies, each of which competes with us on the basis of store ambiance andexperience, product selection and quality, customer service, price, convenience or a combination of these factors.
We offer the broadest selection of high-quality natural and organic products, with a strong emphasis on perishable foods. We believe our high quality standardsdifferentiate our stores from other supermarkets and enable us to attract and maintain a broad base of loyal customers. Our groundbreaking quality standards banhundreds of ingredients commonly found in products sold by other retailers, as well as products grown or produced by manufacturing, farming, fishing andranching practices that don’t measure up.
Overview of Fiscal Year 2016During fiscal year 2016, we achieved record total sales of $15.7 billion , a 2.2% increase over the prior year. Comparable store sales decreased 2.5% . Averageweekly sales per store were $682,000 , translating to sales per gross square foot of approximately $915 . Net income was $507 million , or 3.2% of sales, dilutedearnings per share were $1.55 , and EBITDA totaled $1.4 billion , or 8.6% of sales. For the fiscal year, the Company produced $1.1 billion in cash flow fromoperations and invested $716 million in capital expenditures. This resulted in free cash flow of $400 million . In addition, the Company paid $177 million inquarterly dividends to shareholders and repurchased $944 million , or 31.7 million shares of common stock. At November 2, 2016, the Company had $443 millionremaining in repurchase authority.
On November 2, 2016, the Board of Directors declared an increase in the Company’s quarterly dividend to $0.14 per share from $0.135 per share, representing anannual return to shareholders of approximately $179 million. The next dividend is payable on January 24, 2017 to shareholders of record as of January 13, 2017.
18

Table of Contents
Our progress on strategic initiatives during fiscal year 2016 included:
• More than half way towards two-year $300 million expense reduction goal• Successful launch of new value format, 365 by Whole Foods Market™• Sales of over $5 billion in Exclusive Brands, prepared foods and bakery• Enhanced Whole Foods Market app, including digital coupons and sales flyer• Pilot of new Rewards program in the Dallas/Fort Worth area• Over 13 million followers on social media and first grocer to utilize chatbot technology• Instacart ordering now available through the Whole Foods Market website, offering fresh grocery delivery to more homes in the U.S. than any other food
retailer• New unified point-of-sale system, including EMV technology, across all of our U.S. stores
Fiscal Year 2017 OutlookThe Company remains focused on the metrics it believes are key to the long-term health of its business and for fiscal year 2017 is targeting:
• Sales growth of 2.5% to 4.5%;• Comparable store sales of -2% to 0%;• Ending square footage growth of approximately 6%, reflecting approximately 30 new stores, including up to six relocations and four 365 stores;• Diluted EPS of $1.42 or greater, excluding any potential share repurchases;• EBITDA margin of approximately 8.2%;• Capital expenditures of 4% of sales; and• ROIC of 11% or greater.
The Company has seen stability in comparable store sales over the last two quarters of fiscal year 2016 and an improvement in trends first quarter to date of fiscalyear 2017 for both traffic and basket size. The Company is encouraged that its value and marketing efforts appear to be gaining traction with customers andbelieves it will see momentum as its sales-building initiatives are rolled out in fiscal year 2017. The competitive landscape is very dynamic, however, and it isuncertain how long the deflationary environment will continue. The high end of the comp range reflects a -2.5% two-year comp, slightly better than the -2.8% inthe fourth quarter of fiscal year 2016, while the low end reflects the possibility that two-year trends could get marginally worse before they get better, as theCompany has seen in the first quarter to date of fiscal year 2017.
The Company plans to further reduce its cost structure this year but expects these savings to be more than offset by investments to drive traffic and sales, as well ashigher occupancy, depreciation and other costs. Therefore, the Company expects a decline in operating margin of up to 60 basis points for the year, with greaterdeclines in the first half primarily related to higher year-over-year pre-opening in the first quarter and marketing expense in the first and second quarters. Theearnings per share outlook of $1.42 or greater excludes potential buybacks and reflects a 39% tax rate for the fiscal year.
Subsequent to the end of fiscal year 2016, the Company announced certain structure and leadership changes. In the first quarter of fiscal year 2017, the Companyexpects to incur a charge of approximately $13 million associated with Walter Robb’s separation agreement. The estimated $0.03 impact of this charge is notreflected in fiscal year 2017 guidance.
19

Table of Contents
Results of OperationsThe following table sets forth the Company’s consolidated statements of operations data expressed as a percentage of sales:
2016 2015 2014
Sales 100.0 % 100.0% 100.0%Cost of goods sold and occupancy costs 65.6 64.8 64.5
Gross profit 34.4 35.2 35.5Selling, general and administrative expenses 28.5 29.1 28.4Pre-opening expenses 0.4 0.4 0.5Relocation, store closure and lease termination costs 0.1 0.1 0.1
Operating income 5.5 5.6 6.6Interest expense (0.4) — —Investment and other income 0.1 0.1 0.1
Income before income taxes 5.3 5.7 6.7Provision for income taxes 2.0 2.2 2.6
Net income 3.2 % 3.5% 4.1%Figures may not sum due to rounding.
SalesSales totaled approximately $15.7 billion , $15.4 billion and $14.2 billion in fiscal years 2016 , 2015 and 2014 , respectively, representing increases of 2.2% , 8.4%and 9.9% over the previous fiscal years, respectively. Comparable store sales are reflected in the table below for the fiscal years indicated.
2016 2015 2014
Comparable store sales (2.5)% 2.5% 4.4%Change in transactions (2.6)% 0.8% 2.3%Change in basket size 0.1 % 1.7% 2.1%
The rapidly increasing availability of fresh, healthy foods across many existing as well as new channels has had a negative impact on our comparable store salesgrowth over the last two years. During fiscal year 2016, the decline in transaction count was partially offset by an improvement in basket size over the prior fiscalyear. The improvement in items per basket more than offset decreases in the average price per item. In a heightened competitive and promotional environment, wehave remained focused on our initiatives to build sales over the long term and are seeing encouraging signs of customers responding, as reflected in our improvingitems per basket. As our value, personalization and marketing efforts gain traction and new sales-building initiatives roll out throughout fiscal year 2017, weexpect our traffic trends to improve as well. Comparable store sales contributed approximately 94.3% , 93.3% and 94.0% to total sales in fiscal years 2016 , 2015and 2014 , respectively. As of September 25, 2016 , there were 427 locations in the comparable store base as compared to 390 locations and 358 locations as ofSeptember 27, 2015 and September 28, 2014 , respectively.
Gross ProfitGross profit totaled approximately $5.4 billion , $5.4 billion and $5.0 billion in fiscal years 2016 , 2015 and 2014 , respectively. Gross profit as a percentage ofsales decreased 78 basis points in fiscal year 2016 compared to the prior fiscal year. Net LIFO inventory reserves decreased approximately $7 million during fiscalyear 2016 compared to an increase of approximately $1 million and $16 million in fiscal years 2015 and 2014, respectively. The decrease in fiscal years 2016 and2015 was driven by an increase in cost of goods sold as a percentage of sales, primarily reflecting our ongoing value strategy. During fiscal year 2014, gross profitas a percentage of sales decreased 30 basis points compared to the prior fiscal year and was the result of the decision not to pass through all product cost increasesto customers. Results during fiscal year 2015 also include a supplier credit of approximately $9 million. Excluding these charges, gross profit as a percentage ofsales decreased 77 basis points and 51 basis points in fiscal years 2016 and 2015, respectively, compared to the prior fiscal year.
Our gross profit may increase or decrease slightly depending on the mix of sales from new stores, our value strategy, or the impact of commodity costs or a host ofother factors, including possible supply shortages and extreme weather-related disruptions. Relative to existing stores, gross profit margins tend to be lower fornew stores and increase as stores mature, reflecting lower shrink as volumes increase, as well as increasing experience levels and operational efficiencies of thestore teams.
20
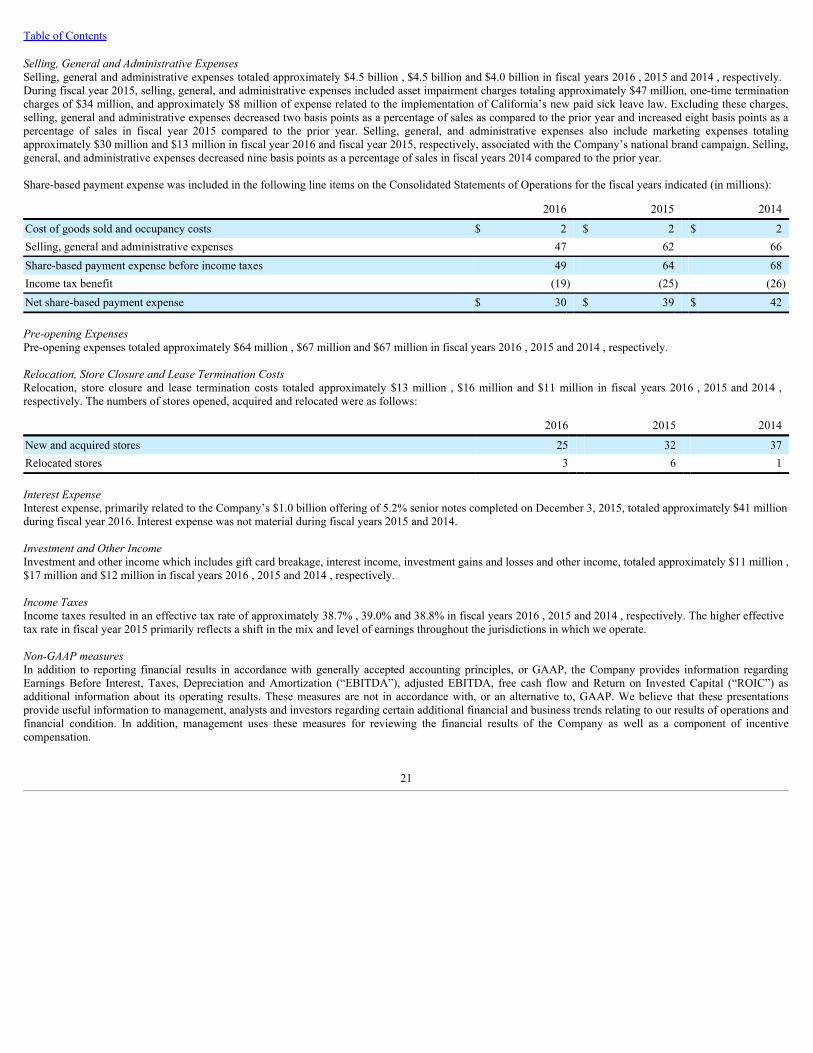
Table of Contents
Selling, General and Administrative ExpensesSelling, general and administrative expenses totaled approximately $4.5 billion , $4.5 billion and $4.0 billion in fiscal years 2016 , 2015 and 2014 , respectively.During fiscal year 2015, selling, general, and administrative expenses included asset impairment charges totaling approximately $47 million, one-time terminationcharges of $34 million, and approximately $8 million of expense related to the implementation of California’s new paid sick leave law. Excluding these charges,selling, general and administrative expenses decreased two basis points as a percentage of sales as compared to the prior year and increased eight basis points as apercentage of sales in fiscal year 2015 compared to the prior year. Selling, general, and administrative expenses also include marketing expenses totalingapproximately $30 million and $13 million in fiscal year 2016 and fiscal year 2015, respectively, associated with the Company’s national brand campaign. Selling,general, and administrative expenses decreased nine basis points as a percentage of sales in fiscal years 2014 compared to the prior year.
Share-based payment expense was included in the following line items on the Consolidated Statements of Operations for the fiscal years indicated (in millions):
2016 2015 2014
Cost of goods sold and occupancy costs $ 2 $ 2 $ 2Selling, general and administrative expenses 47 62 66Share-based payment expense before income taxes 49 64 68Income tax benefit (19) (25) (26)Net share-based payment expense $ 30 $ 39 $ 42
Pre-opening ExpensesPre-opening expenses totaled approximately $64 million , $67 million and $67 million in fiscal years 2016 , 2015 and 2014 , respectively.
Relocation, Store Closure and Lease Termination CostsRelocation, store closure and lease termination costs totaled approximately $13 million , $16 million and $11 million in fiscal years 2016 , 2015 and 2014 ,respectively. The numbers of stores opened, acquired and relocated were as follows:
2016 2015 2014
New and acquired stores 25 32 37Relocated stores 3 6 1
Interest ExpenseInterest expense, primarily related to the Company’s $1.0 billion offering of 5.2% senior notes completed on December 3, 2015, totaled approximately $41 millionduring fiscal year 2016. Interest expense was not material during fiscal years 2015 and 2014.
Investment and Other IncomeInvestment and other income which includes gift card breakage, interest income, investment gains and losses and other income, totaled approximately $11 million ,$17 million and $12 million in fiscal years 2016 , 2015 and 2014 , respectively.
Income TaxesIncome taxes resulted in an effective tax rate of approximately 38.7% , 39.0% and 38.8% in fiscal years 2016 , 2015 and 2014 , respectively. The higher effectivetax rate in fiscal year 2015 primarily reflects a shift in the mix and level of earnings throughout the jurisdictions in which we operate.
Non-GAAP measuresIn addition to reporting financial results in accordance with generally accepted accounting principles, or GAAP, the Company provides information regardingEarnings Before Interest, Taxes, Depreciation and Amortization (“EBITDA”), adjusted EBITDA, free cash flow and Return on Invested Capital (“ROIC”) asadditional information about its operating results. These measures are not in accordance with, or an alternative to, GAAP. We believe that these presentationsprovide useful information to management, analysts and investors regarding certain additional financial and business trends relating to our results of operations andfinancial condition. In addition, management uses these measures for reviewing the financial results of the Company as well as a component of incentivecompensation.
21

Table of Contents
The Company defines adjusted EBITDA as EBITDA plus non-cash share-based payment expense and deferred rent. The following is a tabular reconciliation of thenon-GAAP financial measure adjusted EBITDA to GAAP net income, which the Company believes is the most directly comparable GAAP financial measure.Adjusted EBITDA for the fiscal years indicated was as follows (in millions):
2016 2015 2014
Net income $ 507 $ 536 $ 579Provision for income taxes 320 342 367Interest expense 41 — —Investment and other income, net of interest expense (11) (17) (12)
Operating income 857 861 934Depreciation and amortization 498 439 377
EBITDA 1,355 1,300 1,311Share-based payment expense 49 64 68Deferred rent 48 34 40
Adjusted EBITDA $ 1,452 $ 1,398 $ 1,419
The Company defines free cash flow as net cash provided by operating activities less capital expenditures. The following is a tabular reconciliation of the non-GAAP financial measure free cash flow for the fiscal years indicated (in millions):
2016 2015 2014
Net cash provided by operating activities $ 1,116 $ 1,129 $ 1,088Development cost of new locations (395) (516) (447)Other property and equipment expenditures (321) (335) (263)
Free cash flow $ 400 $ 278 $ 378
The Company defines ROIC as adjusted earnings divided by average invested capital. Adjustments to earnings are defined in the following tabular reconciliation.Invested capital reflects a trailing four-quarter average. ROIC for the fiscal years indicated was as follows (in millions):
2016 2015 2014
Net income $ 507 $ 536 $ 579Interest expense, net of tax 25 — —
Adjusted earnings 532 536 579Total rent expense, net of tax (1) 285 261 241Estimated depreciation on capitalized operating leases, net of tax (2) (190) (174) (161)
Adjusted earnings, including the effect of capitalized operating leases $ 627 $ 623 $ 659
Average working capital, excluding current portion of long-term debt $ 615 $ 472 $ 744Average property and equipment, net 3,296 3,066 2,670Average other assets 987 1,084 1,108Average other liabilities (698) (637) (573)
Average invested capital 4,200 3,985 3,949
Average estimated asset base of capitalized operating leases (3) 3,718 3,417 3,154Average invested capital, including the effect of capitalized operating leases $ 7,918 $ 7,402 $ 7,103
ROIC 12.7% 13.4 14.7%
ROIC, including the effect of capitalized operating leases 7.9% 8.4 9.3%(1) Total rent includes minimum base rent of all tendered leases(2) Estimated depreciation equals two-thirds of total rent expense(3) Estimated asset base equals eight times total annualized rent expense
22

Table of Contents
Liquidity and Capital Resources and Changes in Financial ConditionThe following table summarizes the Company’s cash and short-term investments as of the dates indicated (in millions):
September 25,
2016 September 27,
2015
Cash and cash equivalents $ 351 $ 237Short-term investments - available-for-sale securities 379 155Total $ 730 $ 392
Additionally, the Company held long-term investments in available-for-sale securities totaling approximately $63 million at September 27, 2015 . The Companyheld no long-term investments in available-for-sale securities at September 25, 2016.
We generated cash flows from operating activities totaling approximately $1.1 billion in fiscal years 2016 , 2015 and 2014 . Cash flows from operating activitiesresulted primarily from our net income plus non-cash expenses and changes in operating working capital. Depreciation and amortization was the primary non-cashexpense included in cash flows from operating activities totaling approximately $498 million , $439 million , and $377 million in fiscal years 2016, 2015, and2014, respectively. Depreciation and amortization in fiscal years 2016 and 2015 included approximately $10 million and $25 million , respectively, of depreciationexpense related to technology assets associated with the replacement of our disparate core legacy platforms with unified scalable solutions.
Net cash used in investing activities totaled approximately $895 million , $455 million and $484 million for fiscal years 2016 , 2015 and 2014 , respectively. Netpurchases of available-for-sale securities totaled approximately $162 million in fiscal year 2016 as compared to net sales and maturities of available-for-salesecurities totaling $434 million and $334 million in fiscal years 2015 and 2014 , respectively. Our principal historical capital requirements have been the funding ofthe development or acquisition of new stores and acquisition of property and equipment for existing stores. Net payments for the purchase of acquired entitiestotaled approximately $11 million in fiscal year 2016 related to the acquisition of certain land and buildings, which have cash flows from existing tenants. Netpayments for the purchase of acquired entities were not material in fiscal year 2015. Net payments for the purchase of acquired entities totaled approximately $73million in fiscal year 2014 related to the acquisition of certain land and buildings, which have cash flows from existing tenants, and four retail locations. Therequired cash investment for new stores varies depending on the size of the new store, geographic location, degree of work performed by the landlord andcomplexity of site development issues. Capital expenditures for fiscal years 2016 , 2015 and 2014 totaled approximately $716 million , $851 million and $710million , respectively, of which approximately $395 million , $516 million and $447 million , respectively, was for the development of new locations andapproximately $321 million , $335 million and $263 million , respectively, was for remodels and other property and equipment expenditures.
The following table provides information about the Company’s store growth and development activities for Whole Foods Market and 365 by Whole Foods Marketstores scheduled to open through fiscal year 2021:
Stores opened Leases signed as of Nov. 2, 2016
During fiscal
year 2015During fiscal
year 2016
During fiscal year2017 as of Nov. 2,
2016 WFM 365 Total
Number of stores (including relocations) 38 28 9 79 19 98Number of relocations 6 3 1 18 — 18Percentage in new markets 11% 21% 56% 11% 32% 15%Total square footage 1,653,000 1,190,000 391,000 3,585,000 551,000 4,136,000
As of November 2, 2016 , the Company operated 464 stores totaling approximately 18.2 million square feet.
We believe we will produce operating cash flows in excess of the capital expenditures needed to open the 98 stores in our current store development pipeline. Wehave a disciplined, opportunistic real estate strategy, opening stores in existing trade areas as well as new areas, including international locations. Our growthstrategy is to expand primarily through new store openings, and while we may pursue acquisitions of smaller chains that provide access to desirable geographicareas and experienced team members, such acquisitions are not expected to significantly impact our future store growth or financial results.
23
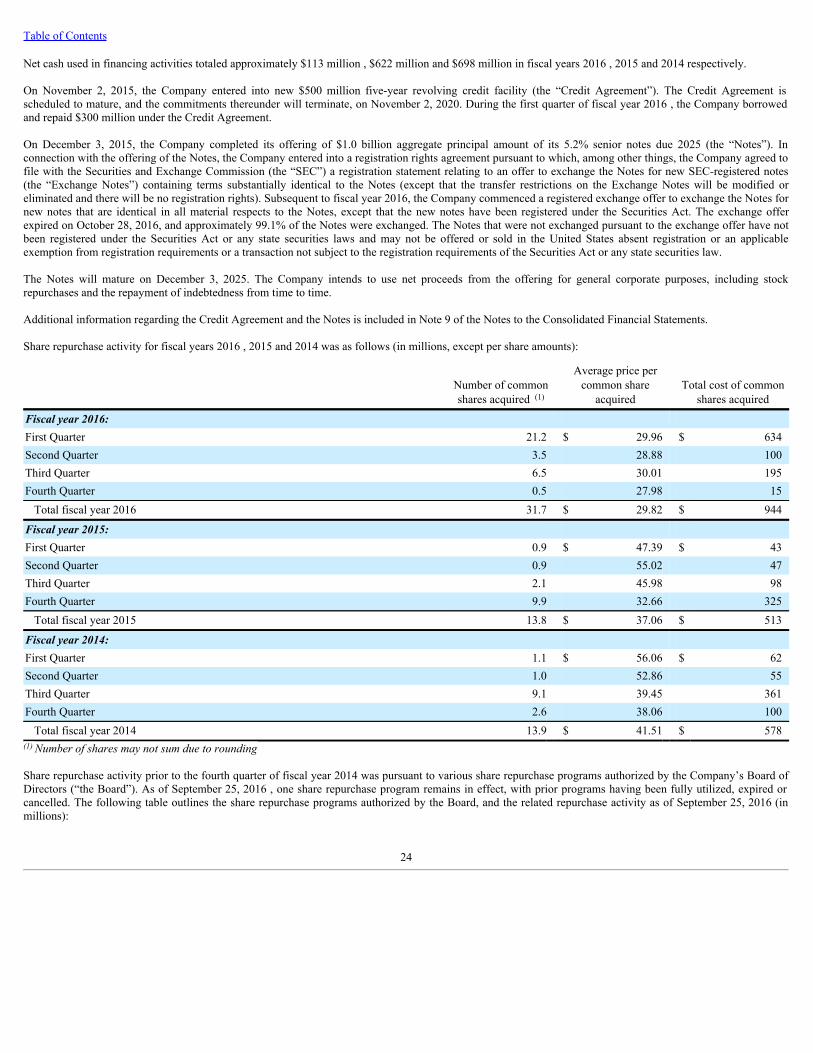
Table of Contents
Net cash used in financing activities totaled approximately $113 million , $622 million and $698 million in fiscal years 2016 , 2015 and 2014 respectively.
On November 2, 2015, the Company entered into new $500 million five-year revolving credit facility (the “Credit Agreement”). The Credit Agreement isscheduled to mature, and the commitments thereunder will terminate, on November 2, 2020. During the first quarter of fiscal year 2016 , the Company borrowedand repaid $300 million under the Credit Agreement.
On December 3, 2015, the Company completed its offering of $1.0 billion aggregate principal amount of its 5.2% senior notes due 2025 (the “Notes”). Inconnection with the offering of the Notes, the Company entered into a registration rights agreement pursuant to which, among other things, the Company agreed tofile with the Securities and Exchange Commission (the “SEC”) a registration statement relating to an offer to exchange the Notes for new SEC-registered notes(the “Exchange Notes”) containing terms substantially identical to the Notes (except that the transfer restrictions on the Exchange Notes will be modified oreliminated and there will be no registration rights). Subsequent to fiscal year 2016, the Company commenced a registered exchange offer to exchange the Notes fornew notes that are identical in all material respects to the Notes, except that the new notes have been registered under the Securities Act. The exchange offerexpired on October 28, 2016, and approximately 99.1% of the Notes were exchanged. The Notes that were not exchanged pursuant to the exchange offer have notbeen registered under the Securities Act or any state securities laws and may not be offered or sold in the United States absent registration or an applicableexemption from registration requirements or a transaction not subject to the registration requirements of the Securities Act or any state securities law.
The Notes will mature on December 3, 2025. The Company intends to use net proceeds from the offering for general corporate purposes, including stockrepurchases and the repayment of indebtedness from time to time.
Additional information regarding the Credit Agreement and the Notes is included in Note 9 of the Notes to the Consolidated Financial Statements.
Share repurchase activity for fiscal years 2016 , 2015 and 2014 was as follows (in millions, except per share amounts):
Number of commonshares acquired (1)
Average price percommon share
acquired Total cost of common
shares acquired
Fiscalyear2016: First Quarter 21.2 $ 29.96 $ 634Second Quarter 3.5 28.88 100Third Quarter 6.5 30.01 195Fourth Quarter 0.5 27.98 15
Total fiscal year 2016 31.7 $ 29.82 $ 944
Fiscalyear2015: First Quarter 0.9 $ 47.39 $ 43Second Quarter 0.9 55.02 47Third Quarter 2.1 45.98 98Fourth Quarter 9.9 32.66 325
Total fiscal year 2015 13.8 $ 37.06 $ 513
Fiscalyear2014: First Quarter 1.1 $ 56.06 $ 62Second Quarter 1.0 52.86 55Third Quarter 9.1 39.45 361Fourth Quarter 2.6 38.06 100
Total fiscal year 2014 13.9 $ 41.51 $ 578(1) Number of shares may not sum due to rounding
Share repurchase activity prior to the fourth quarter of fiscal year 2014 was pursuant to various share repurchase programs authorized by the Company’s Board ofDirectors (“the Board”). As of September 25, 2016 , one share repurchase program remains in effect, with prior programs having been fully utilized, expired orcancelled. The following table outlines the share repurchase programs authorized by the Board, and the related repurchase activity as of September 25, 2016 (inmillions):
24

Table of Contents
Effective date Expiration date Amount authorized Cost of repurchases Authorization
available
August 1, 2014 August 1, 2016 $ 1,000 $ 1,000 $ —November 4, 2015 Not applicable $ 1,000 $ 556 $ 444
Under the share repurchase programs, purchases can be made from time to time using a variety of methods, which may include open market purchases. Thespecific timing, price and size of purchases will depend on prevailing stock prices, general economic and market conditions, and other considerations. Purchasesmay be made through a Rule 10b5-1 plan pursuant to pre-determined metrics set forth in such plan. The Board’s authorization of the share repurchase programdoes not obligate the Company to acquire any particular amount of common stock, and the program may be suspended or discontinued at any time.
During the first quarter of fiscal year 2016 , the Board authorized an increase in the Company’s quarterly dividend to $0.135 per common share from $0.13 percommon share. The following table provides a summary of dividends declared per common share during fiscal years 2016 and 2015 (in millions, except per shareamounts):
Date of declarationDividend per
common share Date of record Date of payment Total amount
Fiscalyear2016: November 4, 2015 $ 0.135 January 15, 2016 January 26, 2016 $ 44March 9, 2016 0.135 April 8, 2016 April 19, 2016 44June 7, 2016 0.135 July 1, 2016 July 12, 2016 43September 22, 2016 (1) 0.135 October 3, 2016 October 14, 2016 43
Fiscalyear2015: November 5, 2014 $ 0.13 January 16, 2015 January 27, 2015 $ 47March 10, 2015 0.13 April 10, 2015 April 21, 2015 47June 9, 2015 0.13 July 2, 2015 July 14, 2015 47September 15, 2015 0.13 October 2, 2015 October 13, 2015 45(1) Dividend accrued at September 25, 2016
On November 2, 2016, the Board authorized an increase in the Company’s quarterly dividend to $0.14 per common share from $0.135 per common share. TheCompany will pay future dividends at the discretion of the Board. The continuation of these payments, the amount of such dividends, and the form in whichdividends are paid (cash or stock) depend on many factors, including the results of operations and the financial condition of the Company. Subject to thesequalifications, the Company currently expects to pay dividends on a quarterly basis.
Net proceeds to the Company from the exercise of stock options by team members are driven by a number of factors, including fluctuations in our stock price, andtotaled approximately $19 million , $66 million and $42 million in fiscal years 2016 , 2015 and 2014 , respectively. The Company intends to keep its broad-basedstock option program in place, but also intends to limit the number of shares granted in any one year so that annual earnings dilution from share-based paymentexpense will not exceed 10%. The Company believes this strategy is best aligned with its stakeholder philosophy because it limits future earnings dilution fromoptions and at the same time retains the broad-based stock option plan, which the Company believes is important to team member morale, its unique corporateculture and its success. At September 25, 2016 , September 27, 2015 and September 28, 2014 approximately 29.8 million shares, 32.9 million shares and 37.6million shares of our common stock, respectively, were available for future stock incentive grants.
The Company is committed under certain capital leases for rental of certain buildings, land and equipment, and certain operating leases for rental of facilities andequipment. These leases expire or become subject to renewal clauses at various dates through 2054. The following table shows payments due by period oncontractual obligations as of September 25, 2016 (in millions):
Total Less than 1
year 1-3
years 3-5
years More than 5
years
Capital lease obligations (including interest) $ 90 $ 6 $ 9 $ 10 $ 65Operating lease obligations (1) 9,134 433 1,079 1,137 6,485Total $ 9,224 $ 439 $ 1,088 $ 1,147 $ 6,550(1) Amounts exclude taxes, insurance and other related expense
Gross unrecognized tax benefits and related interest and penalties at September 25, 2016 were not material. Although a reasonably reliable estimate of the period ofcash settlement with respective taxing authorities cannot be determined due to the high degree
25

Table of Contents
of uncertainty regarding the timing of future cash outflows associated with the Company’s unrecognized tax benefits, as of September 25, 2016 , the Companydoes not expect tax audit resolution will reduce its unrecognized tax benefits in the next 12 months.
We periodically make other commitments and become subject to other contractual obligations that we believe to be routine in nature and incidental to the operationof the business. Management believes that such routine commitments and contractual obligations do not have a material impact on our business, financial conditionor results of operations.
Our principal historical sources of liquidity have included cash generated by operations, available cash and cash equivalents, and short-term investments. Absentany significant change in market conditions, we expect planned expansion and other anticipated working capital and capital expenditure requirements for the next12 months will be funded by these sources. There can be no assurance, however, that the Company will continue to generate cash flows at or above current levelsor that other sources of capital will be available to us in the future.
Off-Balance Sheet ArrangementsOur off-balance sheet arrangements at September 25, 2016 consisted of operating leases disclosed in the above contractual obligations table, as well as the CreditAgreement discussed above. Additionally, we enter into forward purchase agreements for certain products in the ordinary course of business. Purchasecommitments do not exceed anticipated use within an operating cycle. We have no other off-balance sheet arrangements that have had, or are reasonably likely tohave, a material current or future effect on our consolidated financial statements or financial condition.
Critical Accounting PoliciesThe preparation of our financial statements in conformity with generally accepted accounting principles requires us to make estimates and assumptions that affectthe reported amounts of assets, liabilities, revenues, expenses and related disclosures of contingent assets and liabilities. Actual amounts may differ from theseestimates. We base our estimates on historical experience and on various other assumptions and factors that we believe to be reasonable under the circumstances.On an ongoing basis, we evaluate the continued appropriateness of our accounting policies and resulting estimates to make adjustments we consider appropriateunder the facts and circumstances.
We have chosen accounting policies that we believe are appropriate to report accurately and fairly our operating results and financial position, and we apply thoseaccounting policies in a consistent manner. Our significant accounting policies are summarized in Note 2 of the Notes to Consolidated Financial Statements in“Item 8. Financial Statements and Supplementary Data” of this report. We believe that the following accounting policies are the most critical in the preparation ofour financial statements because they involve the most difficult, subjective or complex judgments about the effect of matters that are inherently uncertain.
InventoriesThe Company values inventories at the lower of cost or market. Cost was determined using the dollar value retail last-in, first-out (“LIFO”) method forapproximately 91.8% and 92.2% of inventories in fiscal years 2016 and 2015 , respectively. Under the LIFO method, the cost assigned to items sold is based on thecost of the most recent items purchased. As a result, the costs of the first items purchased remain in inventory and are used to value ending inventory. The excess ofestimated current costs over LIFO carrying value, or LIFO reserve, was approximately $42 million and $49 million at September 25, 2016 and September 27, 2015, respectively. Costs for remaining inventories are determined by the first-in, first-out method. Cost before the LIFO adjustment is principally determined using theitem cost method, which is calculated by counting each item in inventory, assigning costs to each of these items based on the actual purchase cost (net of vendorallowances) of each item and recording the actual cost of items sold.
Goodwill and Intangible AssetsGoodwill consists of the excess of cost of acquired enterprises over the sum of the amounts assigned to identifiable assets acquired less liabilities assumed.Goodwill is reviewed for impairment annually at the Company’s fiscal year end, or more frequently if impairment indicators arise, on a reporting unit level. Weallocate goodwill to one reporting unit for goodwill impairment testing. A qualitative assessment, based on macroeconomic factors, industry and market conditionsand company-specific performance, is performed to determine whether it is more likely than not that the fair value of the reporting unit is impaired. If it is morelikely than not, we compare our fair value, which is determined utilizing both a market value method and discounted projected future cash flows, to our carryingvalue for the purpose of identifying impairment. Our annual impairment review requires extensive use of accounting judgment and financial estimates. Applicationof alternative assumptions and definitions, such as reviewing goodwill for impairment at a different organizational level, could produce significantly different
26

Table of Contents
results. Because of the significance of the judgments and estimation processes, it is possible that materially different amounts could be recorded if we useddifferent assumptions or if the underlying circumstances were to change.
Impairment of Long-Lived Assets and Long-Lived Assets to be Disposed ofThe Company evaluates long-lived assets for impairment whenever events or changes in circumstances, such as unplanned negative cash flow, short lease life, or aplan to close is established, indicate that the carrying amount of an asset may not be recoverable. Recoverability of assets to be held and used is measured by acomparison of the carrying amount of an asset to future undiscounted cash flows expected to be generated by the asset. If such assets are determined to beimpaired, the impairment to be recognized is measured by the amount by which the carrying amount of the assets exceeds the fair value of the assets. The fairvalue, based on hierarchy input Level 3, is determined using management’s best estimate based on a discounted cash flow model based on future store operatingresults using internal projections of future net sales and comparable store sales, or based on a review of the future benefit the Company anticipates receiving fromthe related assets. Additionally for closing locations, the Company estimates net future cash flows based on its experience and knowledge of the area in which theclosed property is located and, when necessary, utilizes local real estate brokers. Estimates of future net sales and comparable store sales may vary based uponcurrent and anticipated business trends, including increased competition and the opening of new stores that cannibalize store sales in existing areas. Changes inthese forecasts could significantly change the amount of impairment recorded, if any. Assets to be disposed of are reported at the lower of the carrying amount orfair value less costs to sell. Application of alternative assumptions, such as changes in estimates of future cash flows, could produce significantly different results.Because of the significance of the judgments and estimation processes, it is likely that materially different amounts could be recorded if we used differentassumptions or if the underlying circumstances were to change.
Insurance and Self-Insurance LiabilitiesThe Company uses a combination of insurance and self-insurance plans to provide for the potential liabilities for workers’ compensation, general liability, propertyinsurance, director and officers’ liability insurance, vehicle liability, and employee health care benefits. Liabilities associated with the risks that are retained by theCompany are estimated, in part, by considering historical claims experience, demographic factors, severity factors and other actuarial assumptions. While webelieve that our assumptions are appropriate, the estimated accruals for these liabilities could be significantly affected if future occurrences and claims differ fromthese assumptions and historical trends.
We have not made any changes in the accounting methodology used to establish our insurance and self-insured liabilities during the past three fiscal years.
Because of the significance of the judgments and estimation processes, it is likely that materially different amounts could be recorded if we used differentassumptions or if the underlying circumstances were to change. A 10% change in our insurance and self-insured liabilities at September 25, 2016 would haveaffected net income by approximately $11 million for fiscal year 2016 .
LeasesThe Company generally leases stores, non-retail facilities and administrative offices under operating leases. Store lease agreements generally include rent holidays,rent escalation clauses and contingent rent provisions for percentage of sales in excess of specified levels. We recognize rent on a straight-line basis over theexpected term of the lease, which includes rent holiday periods and scheduled rent increases. The expected lease term begins with the date the Company has theright to possess the leased space for construction and other purposes. The expected lease term may also include the exercise of renewal options if the exercise ofthe option is determined to be reasonably assured. The expected lease term is also used in the determination of whether a store is a capital or operating lease.Amortization of land and building under capital lease is included with occupancy costs, while the amortization of equipment under capital lease is included withdepreciation expense. Additionally, we review leases for which we are involved in construction to determine whether build-to-suit and sale-leaseback criteria aremet. For those leases that trigger specific build-to-suit accounting, developer assets are recorded during the construction period with an offsetting liability. Sale-leaseback transactions are recorded as financing lease obligations. We record tenant improvement allowances and rent holidays as deferred rent liabilities, andamortize the deferred rent over the expected lease term to rent. We record rent liabilities for contingent percentage of sales lease provisions when we determinethat it is probable that the specified levels as defined by the lease will be reached.
Reserves for Closed PropertiesThe Company maintains reserves for retail stores and other properties that are no longer being utilized in current operations. The Company provides for closedproperty operating lease liabilities using a discount rate to calculate the present value of the remaining noncancelable lease payments and lease termination feesafter the closing date, net of estimated subtenant income. The closed property lease liabilities are expected to be paid over the remaining lease terms, whichgenerally range from four
27

Table of Contents
months to 8 years . The reserves for closed properties include management’s estimates for lease subsidies, lease terminations and future payments on exited realestate. The Company estimates subtenant income and future cash flows based on the Company’s experience and knowledge of the area in which the closedproperty is located, the Company’s previous efforts to dispose of similar assets, existing economic conditions and when necessary utilizes local real estate brokers.
Adjustments to closed property reserves primarily relate to changes in estimated subtenant income or actual exit costs differing from original estimates.Adjustments are made for changes in estimates in the period in which the changes become known.
Because of the significance of the judgments and estimation processes, it is likely that materially different amounts could be recorded if we used differentassumptions or if the underlying circumstances were to change. A 10% change in our closed property reserves at September 25, 2016 would not have materiallyaffected net income for fiscal year 2016 .
Share-Based PaymentsThe Company maintains several share-based incentive plans. We grant both options to purchase common stock and restricted common stock under our WholeFoods Market 2009 Stock Incentive Plan. Options outstanding are governed by the original terms and conditions of the grants, unless modified by a subsequentagreement. Options are granted at an option price equal to the market value of the stock at the grant date and generally vest ratably over a four- or nine-year periodbeginning one year from grant date and have a five, seven or ten year term. The grant date is established once the Company’s Board of Directors approves the grantand all key terms have been determined. Stock option grant terms and conditions are communicated to team members within a relatively short period of time. OurCompany generally approves one primary stock option grant annually, occurring during a trading window. Restricted common stock is granted at the market priceof the stock on the day of grant and generally vests over a four- or six-year period.
The Company uses the Black-Scholes multiple option pricing model which requires extensive use of accounting judgment and financial estimates, includingestimates of the expected term team members will retain their vested stock options before exercising them, the estimated volatility of the Company’s commonstock price over the expected term, and the number of options that will be forfeited prior to the completion of their vesting requirements. The related share-basedpayment expense is recognized on a straight-line basis over the requisite service period. The tax savings resulting from tax deductions in excess of expensereflected in the Company’s financial statements are reflected as a financing cash flow.
The Company intends to keep its broad-based stock option program in place, but also intends to limit the number of shares granted in any one year so that annualearnings per share dilution from share-based payment expense will not exceed 10%.
We do not believe there is a reasonable likelihood that there will be a material change in the future estimates or assumptions we use to determine share-basedpayment expense. However, if actual results are not consistent with our estimates or assumptions, we may be exposed to changes in share-based payment expensethat could be material.
Because of the significance of the judgments and estimation processes, it is likely that materially different amounts could be recorded if we used differentassumptions or if the underlying circumstances were to change. A 10% change in our share-based payment expense would not have materially affected net incomefor fiscal year 2016 .
Income TaxesWe recognize deferred income tax assets and liabilities by applying statutory tax rates in effect at the balance sheet date to differences between the book basis andthe tax basis of assets and liabilities. Deferred tax assets and liabilities are measured using enacted tax rates expected to apply to taxable income in the years inwhich those temporary differences are expected to reverse. Deferred tax assets and liabilities are adjusted to reflect changes in tax laws or rates in the period thatincludes the enactment date. Significant accounting judgment is required in determining the provision for income taxes and related accruals, deferred tax assets andliabilities. In the ordinary course of business, there are transactions and calculations where the ultimate tax outcome is uncertain. In addition, we are subject toperiodic audits and examinations by the Internal Revenue Service (“IRS”) and other state and local taxing authorities. Although we believe that our estimates arereasonable, actual results could differ from these estimates.
The Company recognizes the tax benefit from an uncertain tax position only if it is more likely than not that the tax position will be sustained on examination bythe taxing authorities, based on the technical merits of the position. The tax benefits recognized in the financial statements from such a position should be measuredbased on the largest benefit that has a greater than 50% likelihood of being realized upon ultimate settlement.
28

Table of Contents
To the extent we prevail in matters for which reserves have been established, or are required to pay amounts in excess of our reserves, our effective income tax ratein a given financial statement period could be materially affected. An unfavorable tax settlement would require use of our cash and would result in an increase inour effective income tax rate in the period of resolution. A favorable tax settlement would be recognized as a reduction in our effective income tax rate in theperiod of resolution.
Item 7A. Quantitative and Qualitative Disclosures About Market Risk.
We are primarily exposed to interest rate changes on our investments. We do not use financial instruments for trading or other speculative purposes. We are alsoexposed to foreign exchange fluctuations on our foreign subsidiaries.
The analysis presented for each of our market risk sensitive instruments is based on a 10% change in interest or currency exchange rates. These changes arehypothetical scenarios used to calibrate potential risk and do not represent our view of future market changes. As the hypothetical figures discussed below indicate,changes in fair value based on the assumed change in rates generally cannot be extrapolated because the relationship of the change in assumption to the change infair value may not be linear. The effect of a variation in a particular assumption is calculated without changing any other assumption. In reality, changes in onefactor may result in changes in another, which may magnify or counteract the sensitivities.
Interest Rate RiskWe seek to minimize the risks from interest rate fluctuations through ongoing evaluation of the composition of our investments.
The Company holds short-term investments that are classified as cash equivalents. We had cash equivalent investments totaling approximately $138 million and$32 million at September 25, 2016 and September 27, 2015 , respectively. The Company also holds available-for-sale securities generally consisting of state andlocal municipal obligations and corporate bonds and commercial paper which hold high credit ratings. We had short-term investments totaling approximately $379million at September 25, 2016 . At September 27, 2015, we held short-term and long-term investments totaling approximately $155 million and $63 million ,respectively.
We have outstanding $1.0 billion aggregate principal amount of senior notes due 2025 (the “Notes”). The Notes bear interest at a fixed rate equal to 5.2% per year,payable semiannually. The interest rate payable on the Notes is subject to adjustment upon the occurrence of certain credit rating events described in theagreement. A downgrade in credit rating from either Moody’s or S&P would not materially affect annual interest payments.
We also have outstanding a $500 million revolving line of credit (the “Credit Agreement”) that extends to 2020, which may be increased from time to time by upto $250 million in the aggregate pursuant to an expansion feature set forth in the Credit Agreement. At September 25, 2016 , the Company had no amountsoutstanding.
Additional information on the Notes and Credit Agreement as of September 25, 2016 are as follows (in millions):
September 25,
2016
Senior notes: Outstanding balance $ 1,000Fixed interest rate 5.200%
Line of credit:
Outstanding balance $ —Variable interest rate n/aApplicable margin 0.125%
The Notes and Credit Agreement were entered into during the first quarter of fiscal year 2016. No debt was outstanding as of September 27, 2015. The nature andamount of our long-term debt may vary as a result of future business requirements, market conditions, and other factors. Fluctuations in interest rates may affectthe fair value of the fixed-rate debt. The estimated fair value of the Company’s long-term debt is included in Note 9 of the Notes to the Consolidated FinancialStatements.
These investments are recorded at fair value and are generally short term in nature, and therefore changes in interest rates would not have a material impact on thevaluation of these investments. During fiscal years 2016 and 2015 , a hypothetical 10% increase or decrease in interest rates would not have materially affectedinterest income earned on these investments.
29

Table of Contents
Foreign Currency RiskThe Company is exposed to foreign currency exchange risk. We own and operate eleven stores in Canada and nine stores in the U.K. Sales made from stores inCanada and the U.K. are made in exchange for Canadian dollars and Great Britain pound sterling, respectively. The Company does not currently hedge against therisk of exchange rate fluctuations.
At September 25, 2016 , a hypothetical 10% change in value of the U.S. dollar relative to the Canadian dollar or Great Britain pound sterling would not havematerially affected our consolidated financial statements.
30

Table of Contents
Item 8. Financial Statements and Supplementary Data.
Whole Foods Market, Inc.Index to Consolidated Financial Statements
Page
Report of Independent Registered Public Accounting Firm 32Report of Independent Registered Public Accounting Firm on Internal Control over Financial Reporting 33Consolidated Balance Sheets at September 25, 2016 and September 27, 2015 34Consolidated Statements of Operations for the fiscal years ended September 25, 2016, September 27, 2015 and September 28, 2014 35Consolidated Statements of Comprehensive Income for the fiscal years ended September 25, 2016, September 27, 2015 and September 28,2014 36Consolidated Statements of Shareholders’ Equity for the fiscal years ended September 25, 2016, September 27, 2015 and September 28, 2014 37Consolidated Statements of Cash Flows for the fiscal years ended September 25, 2016, September 27, 2015 and September 28, 2014 38Notes to Consolidated Financial Statements 39
31

Table of Contents
Whole Foods Market, Inc.Report of Independent Registered Public Accounting Firm
The Board of Directors and Shareholders of Whole Foods Market, Inc.
We have audited the accompanying consolidated balance sheets of Whole Foods Market, Inc. as of September 25, 2016 and September 27, 2015, and the relatedconsolidated statements of operations, comprehensive income, shareholders' equity and cash flows for each of the three years in the period ended September 25,2016. These financial statements are the responsibility of the Company's management. Our responsibility is to express an opinion on these financial statementsbased on our audits.
We conducted our audits in accordance with the standards of the Public Company Accounting Oversight Board (United States). Those standards require that weplan and perform the audit to obtain reasonable assurance about whether the financial statements are free of material misstatement. An audit includes examining,on a test basis, evidence supporting the amounts and disclosures in the financial statements. An audit also includes assessing the accounting principles used andsignificant estimates made by management, as well as evaluating the overall financial statement presentation. We believe that our audits provide a reasonable basisfor our opinion.
In our opinion, the financial statements referred to above present fairly, in all material respects, the consolidated financial position of Whole Foods Market, Inc. atSeptember 25, 2016 and September 27, 2015, and the consolidated results of its operations and its cash flows for each of the three years in the period endedSeptember 25, 2016, in conformity with U.S. generally accepted accounting principles.
We also have audited, in accordance with the standards of the Public Company Accounting Oversight Board (United States), Whole Foods Market, Inc.'s internalcontrol over financial reporting as of September 25, 2016, based on criteria established in Internal Control-Integrated Framework issued by the Committee ofSponsoring Organizations of the Treadway Commission (2013 framework) and our report dated November 18, 2016 expressed an unqualified opinion thereon.
/s/ Ernst & Young LLP
Austin, Texas
November 18, 2016
32

Table of Contents
Whole Foods Market, Inc.Report of Independent Registered Public Accounting Firm on Internal Control over Financial Reporting
The Board of Directors and Shareholders of Whole Foods Market, Inc.
We have audited Whole Foods Market, Inc.’s internal control over financial reporting as of September 25, 2016, based on criteria established in Internal Control-Integrated Framework issued by the Committee of Sponsoring Organizations of the Treadway Commission (2013 framework) (the COSO criteria). Whole FoodsMarket, Inc.’s management is responsible for maintaining effective internal control over financial reporting, and for its assessment of the effectiveness of internalcontrol over financial reporting included in the accompanying Management’s Report on Internal Controls over Financial Reporting. Our responsibility is to expressan opinion on the company’s internal control over financial reporting based on our audit.
We conducted our audit in accordance with the standards of the Public Company Accounting Oversight Board (United States). Those standards require that weplan and perform the audit to obtain reasonable assurance about whether effective internal control over financial reporting was maintained in all material respects.Our audit included obtaining an understanding of internal control over financial reporting, assessing the risk that a material weakness exists, testing and evaluatingthe design and operating effectiveness of internal control based on the assessed risk, and performing such other procedures as we considered necessary in thecircumstances. We believe that our audit provides a reasonable basis for our opinion.
A company’s internal control over financial reporting is a process designed to provide reasonable assurance regarding the reliability of financial reporting and thepreparation of financial statements for external purposes in accordance with generally accepted accounting principles. A company’s internal control over financialreporting includes those policies and procedures that (1) pertain to the maintenance of records that, in reasonable detail, accurately and fairly reflect thetransactions and dispositions of the assets of the company; (2) provide reasonable assurance that transactions are recorded as necessary to permit preparation offinancial statements in accordance with generally accepted accounting principles, and that receipts and expenditures of the company are being made only inaccordance with authorizations of management and directors of the company; and (3) provide reasonable assurance regarding prevention or timely detection ofunauthorized acquisition, use, or disposition of the company’s assets that could have a material effect on the financial statements.
Because of its inherent limitations, internal control over financial reporting may not prevent or detect misstatements. Also, projections of any evaluation ofeffectiveness to future periods are subject to the risk that controls may become inadequate because of changes in conditions, or that the degree of compliance withthe policies or procedures may deteriorate.
In our opinion, Whole Foods Market, Inc. maintained, in all material respects, effective internal control over financial reporting as of September 25, 2016, based onthe COSO criteria.
We also have audited, in accordance with the standards of the Public Company Accounting Oversight Board (United States), the consolidated balance sheets ofWhole Foods Market, Inc. as of September 25, 2016 and September 27, 2015, and the related consolidated statements of operations, comprehensive income,shareholders’ equity and cash flows for each of the three years in the period ended September 25, 2016 of Whole Foods Market, Inc. and our report datedNovember 18, 2016 expressed an unqualified opinion thereon.
/s/ Ernst & Young LLP
Austin, Texas
November 18, 2016
33

Table of Contents
Whole Foods Market, Inc.Consolidated Balance Sheets(In millions)
AssetsSeptember 25,
2016 September 27,
2015
Current assets: Cash and cash equivalents $ 351 $ 237Short-term investments - available-for-sale securities 379 155Restricted cash 122 127Accounts receivable 242 218Merchandise inventories 517 500Prepaid expenses and other current assets 167 108Deferred income taxes 197 199
Total current assets 1,975 1,544Property and equipment, net of accumulated depreciation and amortization 3,442 3,163Long-term investments - available-for-sale securities — 63Goodwill 710 710Intangible assets, net of accumulated amortization 74 79Deferred income taxes 100 144Other assets 40 38
Total assets $ 6,341 $ 5,741
Liabilities and Shareholders’ Equity
Current liabilities: Current installments of long-term debt and capital lease obligations $ 3 $ 3Accounts payable 307 295Accrued payroll, bonus and other benefits due team members 407 436Dividends payable 43 45Other current liabilities 581 473
Total current liabilities 1,341 1,252Long-term capital lease obligations, less current installments 1,048 62Deferred lease liabilities 640 587Other long-term liabilities 88 71
Total liabilities 3,117 1,972 Commitments and contingencies Shareholders’ equity: Common stock, no par value, 1,200 shares authorized; 377.0 and 377.1 shares issued; 318.3 and 348.9 shares outstanding at 2016 and 2015, respectively 2,933 2,904Common stock in treasury, at cost, 58.7 and 28.2 shares at 2016 and 2015, respectively (2,026) (1,124)Accumulated other comprehensive loss (32) (28)Retained earnings 2,349 2,017
Total shareholders’ equity 3,224 3,769Total liabilities and shareholders’ equity $ 6,341 $ 5,741
The accompanying notes are an integral part of these consolidated financial statements.
34

Table of Contents
Whole Foods Market, Inc.Consolidated Statements of OperationsFiscal years ended September 25, 2016 , September 27, 2015 and September 28, 2014(In millions, except per share amounts)
2016 2015 2014
Sales $ 15,724 $ 15,389 $ 14,194Cost of goods sold and occupancy costs 10,313 9,973 9,150
Gross profit 5,411 5,416 5,044Selling, general and administrative expenses 4,477 4,472 4,032Pre-opening expenses 64 67 67Relocation, store closure and lease termination costs 13 16 11
Operating income 857 861 934Interest expense (41) — —Investment and other income 11 17 12
Income before income taxes 827 878 946Provision for income taxes 320 342 367
Net income $ 507 $ 536 $ 579
Basic earnings per share $ 1.55 $ 1.49 $ 1.57
Weighted average shares outstanding 326.1 358.5 367.8
Diluted earnings per share $ 1.55 $ 1.48 $ 1.56
Weighted average shares outstanding, diluted basis 326.9 360.8 370.5
Dividends declared per common share $ 0.54 $ 0.52 $ 0.48
The accompanying notes are an integral part of these consolidated financial statements.
35

Table of Contents
Whole Foods Market, Inc.Consolidated Statements of Comprehensive IncomeFiscal years ended September 25, 2016 , September 27, 2015 and September 28, 2014(In millions)
2016 2015 2014
Net income $ 507 $ 536 $ 579Other comprehensive loss, net of tax:
Foreign currency translation adjustments (4) (21) (8)Other comprehensive loss, net of tax (4) (21) (8)Comprehensive income $ 503 $ 515 $ 571
The accompanying notes are an integral part of these consolidated financial statements.
36

Table of Contents
Whole Foods Market, Inc.Consolidated Statements of Shareholders’ EquityFiscal years ended September 25, 2016 , September 27, 2015 and September 28, 2014(In millions)
Shares
outstandingCommon
stock
Commonstock intreasury
Accumulatedother
comprehensiveincome (loss)
Retainedearnings
Totalshareholders’
equity
Balances at September 29, 2013 372.4 $ 2,765 $ (153) $ 1 $ 1,265 $ 3,878Net income — — — — 579 579Other comprehensive loss, net of tax — — — (8) — (8)Dividends ($0.48 per common share) — — — — (176) (176)Issuance of common stock pursuant to team memberstock plans 1.9 21 20 — — 41Purchase of treasury stock (13.9) — (578) — — (578)Tax benefit related to exercise of team memberstock options — 9 — — — 9Share-based payment expense — 68 — — — 68Balances at September 28, 2014 360.4 2,863 (711) (7) 1,668 3,813Net income — — — — 536 536Other comprehensive loss, net of tax — — — (21) — (21)Dividends ($0.52 per common share) — — — — (186) (186)Issuance of common stock pursuant to team memberstock plans 2.3 (34) 100 — — 66Purchase of treasury stock (13.8) — (513) — — (513)Tax benefit related to exercise of team memberstock options — 11 — — — 11Share-based payment expense — 64 — — — 64Other — — — — (1) (1)Balances at September 27, 2015 348.9 2,904 (1,124) (28) 2,017 3,769Net income — — — — 507 507Other comprehensive loss, net of tax — — — (4) — (4)Dividends ($0.54 per common share) — — — — (174) (174)Issuance of common stock pursuant to team memberstock plans 1.1 (23) 42 — — 19Purchase of treasury stock (31.7) — (944) — — (944)Tax benefit related to exercise of team memberstock options — 3 — — — 3Share-based payment expense — 49 — — — 49Other — — — — (1) (1)Balances at September 25, 2016 318.3 $ 2,933 $ (2,026) $ (32) $ 2,349 $ 3,224
The accompanying notes are an integral part of these consolidated financial statements.
37

Table of Contents
Whole Foods Market, Inc.Consolidated Statements of Cash FlowsFiscal years ended September 25, 2016 , September 27, 2015 and September 28, 2014(In millions)
2016 2015 2014
Cash flows from operating activities Net income $ 507 $ 536 $ 579Adjustments to reconcile net income to net cash provided by operating activities:
Depreciation and amortization 498 439 377Impairment of long-lived assets 5 48 1Share-based payment expense 49 64 68LIFO expense (benefit) (7) 1 16Deferred income tax expense (benefit) 47 (43) (78)Excess tax benefit related to exercise of team member stock options (4) (11) (9)Accretion of premium/discount on marketable securities 1 17 27Deferred lease liabilities 43 32 36Other 11 5 11Net change in current assets and liabilities:
Accounts receivable (24) (21) (14)Merchandise inventories (11) (61) (41)Prepaid expenses and other current assets (59) (9) (4)Accounts payable 13 20 30Accrued payroll, bonus and other benefits due team members (29) 58 12Other current liabilities 62 47 54
Net change in other long-term liabilities 14 7 23Net cash provided by operating activities 1,116 1,129 1,088
Cash flows from investing activities Development costs of new locations (395) (516) (447)Other property and equipment expenditures (321) (335) (263)Purchases of available-for-sale securities (593) (494) (720)Sales and maturities of available-for-sale securities 431 928 1,054Purchases of intangible assets (2) (3) (20)Decrease (increase) in restricted cash 4 (19) 2Payment for purchase of acquired entities, net of cash acquired (11) (4) (73)Other investing activities (8) (12) (17)
Net cash used in investing activities (895) (455) (484)Cash flows from financing activities Purchases of treasury stock (944) (513) (578)Common stock dividends paid (177) (184) (170)Issuance of common stock 19 66 42Excess tax benefit related to exercise of team member stock options 4 11 9Proceeds from long-term borrowings 999 — —Proceeds from revolving line of credit 300 — —Payments on long-term debt and capital lease obligations (306) (1) (1)Other financing activities (8) (1) —
Net cash used in financing activities (113) (622) (698)Effect of exchange rate changes on cash and cash equivalents 6 (5) (6)Net change in cash and cash equivalents 114 47 (100)Cash and cash equivalents at beginning of period 237 190 290Cash and cash equivalents at end of period $ 351 $ 237 $ 190
Supplemental disclosure of cash flow information: Federal and state income taxes paid $ 377 $ 383 $ 429Interest paid $ 27 $ — $ —

The accompanying notes are an integral part of these consolidated financial statements.
38
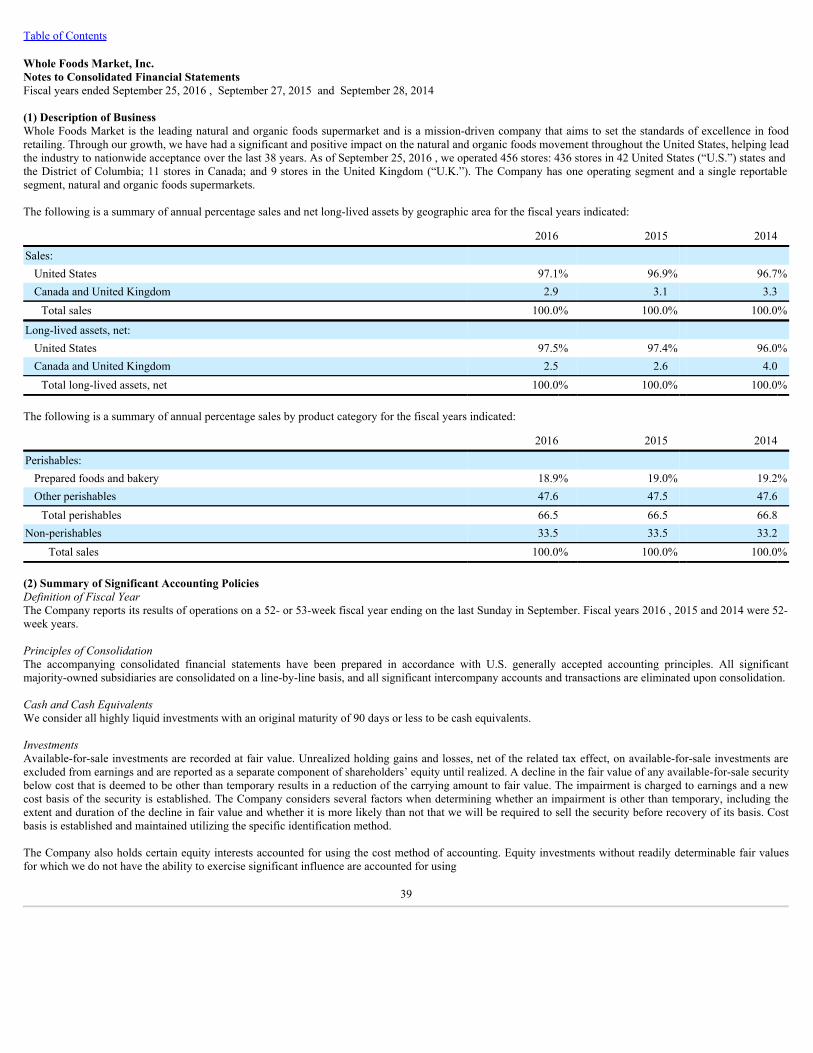
Table of Contents
Whole Foods Market, Inc.Notes to Consolidated Financial StatementsFiscal years ended September 25, 2016 , September 27, 2015 and September 28, 2014
(1) Description of BusinessWhole Foods Market is the leading natural and organic foods supermarket and is a mission-driven company that aims to set the standards of excellence in foodretailing. Through our growth, we have had a significant and positive impact on the natural and organic foods movement throughout the United States, helping leadthe industry to nationwide acceptance over the last 38 years. As of September 25, 2016 , we operated 456 stores: 436 stores in 42 United States (“U.S.”) states andthe District of Columbia; 11 stores in Canada; and 9 stores in the United Kingdom (“U.K.”). The Company has one operating segment and a single reportablesegment, natural and organic foods supermarkets.
The following is a summary of annual percentage sales and net long-lived assets by geographic area for the fiscal years indicated:
2016 2015 2014
Sales: United States 97.1% 96.9% 96.7%Canada and United Kingdom 2.9 3.1 3.3
Total sales 100.0% 100.0% 100.0%
Long-lived assets, net: United States 97.5% 97.4% 96.0%Canada and United Kingdom 2.5 2.6 4.0
Total long-lived assets, net 100.0% 100.0% 100.0%
The following is a summary of annual percentage sales by product category for the fiscal years indicated:
2016 2015 2014
Perishables: Prepared foods and bakery 18.9% 19.0% 19.2%Other perishables 47.6 47.5 47.6
Total perishables 66.5 66.5 66.8Non-perishables 33.5 33.5 33.2
Total sales 100.0% 100.0% 100.0%
(2) Summary of Significant Accounting PoliciesDefinition of Fiscal YearThe Company reports its results of operations on a 52- or 53-week fiscal year ending on the last Sunday in September. Fiscal years 2016 , 2015 and 2014 were 52-week years.
Principles of ConsolidationThe accompanying consolidated financial statements have been prepared in accordance with U.S. generally accepted accounting principles. All significantmajority-owned subsidiaries are consolidated on a line-by-line basis, and all significant intercompany accounts and transactions are eliminated upon consolidation.
Cash and Cash EquivalentsWe consider all highly liquid investments with an original maturity of 90 days or less to be cash equivalents.
InvestmentsAvailable-for-sale investments are recorded at fair value. Unrealized holding gains and losses, net of the related tax effect, on available-for-sale investments areexcluded from earnings and are reported as a separate component of shareholders’ equity until realized. A decline in the fair value of any available-for-sale securitybelow cost that is deemed to be other than temporary results in a reduction of the carrying amount to fair value. The impairment is charged to earnings and a newcost basis of the security is established. The Company considers several factors when determining whether an impairment is other than temporary, including theextent and duration of the decline in fair value and whether it is more likely than not that we will be required to sell the security before recovery of its basis. Costbasis is established and maintained utilizing the specific identification method.
The Company also holds certain equity interests accounted for using the cost method of accounting. Equity investments without readily determinable fair valuesfor which we do not have the ability to exercise significant influence are accounted for using
39

Table of Contents
the cost method of accounting and classified as “Other assets” on the Consolidated Balance Sheet. Under the cost method, investments are carried at cost and areadjusted only for other-than-temporary declines in fair value, certain distributions, and additional investments. Additionally, the Company holds certain equityinterests accounted for using the equity method of accounting. The Company’s share of income and losses from equity method investments is included in “Selling,general and administrative expenses” on the Consolidated Statements of Operations.
Restricted CashRestricted cash primarily relates to cash held as collateral to support a portion of our projected workers’ compensation obligations. Additionally, the Companyholds restricted cash as a rent guarantee on certain operating leases through fiscal year 2020 .
Accounts ReceivableAccounts receivable are shown net of related allowances and consist primarily of credit card receivables, vendor receivables, customer purchases, and occupancy-related receivables. Vendor receivable balances are generally presented on a gross basis separate from any related payable due. Allowance for doubtful accounts iscalculated based on historical experience, customer credit risk and application of the specific identification method and was not material in fiscal year 2016 or 2015.
InventoriesThe Company values inventories at the lower of cost or market. Cost was determined using the dollar value retail last-in, first-out (“LIFO”) method forapproximately 91.8% and 92.2% of inventories in fiscal years 2016 and 2015 , respectively. Under the LIFO method, the cost assigned to items sold is based on thecost of the most recent items purchased. As a result, the costs of the first items purchased remain in inventory and are used to value ending inventory. The excess ofestimated current costs over LIFO carrying value, or LIFO reserve, was approximately $42 million and $49 million at September 25, 2016 and September 27, 2015, respectively. Costs for remaining inventories are determined by the first-in, first-out method. Cost before the LIFO adjustment is principally determined using theitem cost method, which is calculated by counting each item in inventory, assigning costs to each of these items based on the actual purchase cost (net of vendorallowances) of each item and recording the actual cost of items sold.
Property and EquipmentProperty and equipment is stated at cost, net of accumulated depreciation and amortization. The Company provides depreciation of equipment over the estimateduseful lives (generally 3 to 15 years) using the straight-line method, and provides amortization of leasehold improvements and real estate assets under capital leaseson a straight-line basis over the shorter of the estimated useful lives of the improvements or the expected terms of the related leases. The Company providesdepreciation of buildings over the estimated useful lives (generally 20 to 50 years) using the straight-line method. Costs related to a projected site determined to beunsatisfactory and general site selection costs that cannot be identified with a specific store location are charged to operations currently. The Company recognizes aliability for the fair value of a conditional asset retirement obligation when the obligation is incurred. Repair and maintenance costs are expensed as incurred. Uponretirement or disposal of assets, the cost and related accumulated depreciation are removed from the balance sheet and any gain or loss is reflected in earnings.
LeasesThe Company generally leases stores, non-retail facilities and administrative offices under operating leases. Store lease agreements generally include rent holidays,rent escalation clauses and contingent rent provisions for percentage of sales in excess of specified levels. We recognize rent on a straight-line basis over theexpected term of the lease, which includes rent holiday periods and scheduled rent increases. The expected lease term begins with the date the Company has theright to possess the leased space for construction and other purposes. The expected lease term may also include the exercise of renewal options if the exercise ofthe option is determined to be reasonably assured. The expected lease term is also used in the determination of whether a store lease is a capital or operating lease.Amortization of land and building under capital lease is included with occupancy costs, while the amortization of equipment under capital lease is included withdepreciation expense. Additionally, we review leases for which we are involved in construction to determine whether build-to-suit and sale-leaseback criteria aremet. For those leases that trigger specific build-to-suit accounting, developer assets are recorded during the construction period with an offsetting liability.Developer assets recorded as of September 25, 2016 totaling approximately $14 million , with the offsetting liability included in the “Other current liabilities” lineitem on the Consolidated Balance Sheets. As of September 27, 2015 , developer assets were not material. Sale-leaseback transactions are recorded as financinglease obligations. We record tenant improvement allowances and rent holidays as deferred rent liabilities, and amortize the deferred rent over the expected leaseterm to rent. We record rent liabilities for contingent percentage of sales lease provisions when we determine that it is probable that the specified levels as definedby the lease will be reached.
40

Table of Contents
Goodwill and Intangible AssetsGoodwill consists of the excess of cost of acquired enterprises over the sum of the amounts assigned to identifiable assets acquired less liabilities assumed.Goodwill is reviewed for impairment annually at the Company’s fiscal year end, or more frequently if impairment indicators arise, on a reporting unit level. Weallocate goodwill to one reporting unit for goodwill impairment testing. A qualitative assessment, based on macroeconomic factors, industry and market conditionsand company-specific performance, is performed to determine whether it is more likely than not that the fair value of the reporting unit is impaired. If it is morelikely than not, we compare our fair value, which is determined utilizing both a market value method and discounted projected future cash flows, to our carryingvalue for the purpose of identifying impairment.
Intangible assets include acquired leasehold rights, favorable lease assets, trade names, brand names, patents, liquor licenses, license agreements, and non-competition agreements. The Company amortizes definite-lived intangible assets on a straight-line basis over the period the intangible asset is expected to generatecash flows, generally the life of the related agreement. Currently, the weighted average life is approximately 15 years for contract-based intangible assets andapproximately 1 years for marketing-related and other identifiable intangible assets. Indefinite-lived intangible assets are reviewed for impairment quarterly, orwhenever events or changes in circumstances indicate the carrying amount of an intangible asset may not be recoverable.
Impairment of Long-Lived Assets and Long-Lived Assets to be Disposed ofThe Company evaluates long-lived assets for impairment whenever events or changes in circumstances, such as unplanned negative cash flow, short lease life, or aplan to close is established, indicate that the carrying amount of an asset may not be recoverable. Recoverability of assets to be held and used is measured by acomparison of the carrying amount of an asset to future undiscounted cash flows expected to be generated by the asset. If such assets are determined to beimpaired, the impairment to be recognized is measured by the amount by which the carrying value of the assets exceeds the fair value of the assets. The fair value,based on hierarchy input Level 3, is determined using management’s best estimate based on a discounted cash flow model based on future store operating resultsusing internal projections of future net sales and comparable store sales, or based on a review of the future benefit the Company anticipates receiving from therelated assets. Additionally for closing locations, the Company estimates net future cash flows based on its experience and knowledge of the area in which theclosed property is located and, when necessary, utilizes local real estate brokers. Estimates of future net sales and comparable store sales may vary based uponcurrent and anticipated business trends, including increased competition and the opening of new stores that cannibalize store sales in existing areas. Changes inthese forecasts could significantly change the amount of impairment recorded, if any. Assets to be disposed of are reported at the lower of the carrying amount orfair value less costs to sell. When the Company impairs assets related to an operating location, a charge to write down the related assets is included in the “Selling,general and administrative expenses” line item on the Consolidated Statements of Operations. When the Company commits to relocate, close, or dispose of alocation, a charge to write down the related assets to their estimated recoverable value is included in the “Relocation, store closure and lease termination costs” lineitem on the Consolidated Statements of Operations.
Fair Value of Financial InstrumentsThe Company records its financial assets and liabilities at fair value in accordance with the framework for measuring fair value in generally accepted accountingprinciples. This framework establishes a fair value hierarchy that prioritizes the inputs used to measure fair value:
• Level 1: Observable inputs that reflect unadjusted quoted prices for identical assets or liabilities traded in active markets.• Level 2: Inputs other than quoted prices included within Level 1 that are observable for the asset or liability, either directly or indirectly.• Level 3: Inputs that are generally unobservable. These inputs may be used with internally developed methodologies that result in management’s best
estimate of fair value.
The Company holds money market fund investments that are classified as cash equivalents that are measured at fair value on a recurring basis based on quotedprices in active markets for identical assets. The Company also holds available-for-sale securities generally consisting of state and local municipal obligations andcorporate bonds and commercial paper which hold high credit ratings. These instruments are valued using a series of multi-dimensional relational models andseries of matrices with standard inputs obtained from readily available pricing sources and other observable market data, such as benchmark yields and basespread. Investments are stated at fair value with unrealized gains and losses, net of related tax effect, included as a component of shareholders’ equity untilrealized. Declines in fair value below the Company’s carrying value deemed to be other than temporary are charged against net earnings.
The carrying amounts of accrued payroll, bonuses and other benefits due team members, and other accrued expenses approximate fair value because of their shortmaturities. Store closure reserves and estimated workers’ compensation claims are recorded at net present value to approximate fair value.
41

Table of Contents
Insurance and Self-Insurance ReservesThe Company uses a combination of insurance and self-insurance plans to provide for the potential liabilities for workers’ compensation, general liability, propertyinsurance, director and officers’ liability insurance, vehicle liability, and employee health care benefits. Liabilities associated with the risks that are retained by theCompany are estimated, in part, by considering historical claims experience, demographic factors, severity factors and other actuarial assumptions. The Companyhad insurance liabilities totaling approximately $180 million and $170 million at September 25, 2016 and September 27, 2015 , respectively, included in the “Othercurrent liabilities” line item on the Consolidated Balance Sheets.
Reserves for Closed PropertiesThe Company maintains reserves for retail stores and other properties that are no longer being utilized in current operations. The Company provides for closedproperty operating lease liabilities using the present value of the remaining noncancelable lease payments and lease termination fees after the closing date, net ofestimated subtenant income. The closed property lease liabilities are expected to be paid over the remaining lease terms, which generally range from four months toeight years . The Company estimates subtenant income and future cash flows based on the Company’s experience and knowledge of the area in which the closedproperty is located, the Company’s previous efforts to dispose of similar assets and existing economic conditions. Reserves for closed properties are included in the“Other current liabilities” and “Other long-term liabilities” line items on the Consolidated Balance Sheets.
The reserves for closed properties include management’s estimates for lease subsidies, lease terminations and future payments on exited real estate. Adjustments toclosed property reserves primarily relate to changes in existing economic conditions, subtenant income or actual exit costs differing from original estimates.Adjustments are made for changes in estimates in the period in which the changes become known.
Revenue RecognitionWe recognize revenue for sales of our products at the point of sale. Discounts provided to customers at the point of sale are recognized as a reduction in sales as theproducts are sold. Sales taxes are not included in revenue.
Cost of Goods Sold and Occupancy CostsCost of goods sold includes cost of inventory sold during the period (net of discounts and allowances), distribution and food preparation costs, and shipping andhandling costs. The Company receives various rebates from third-party vendors in the form of purchase or sales volume discounts and payments under cooperativeadvertising agreements. Purchase volume discounts are calculated based on actual purchase volumes. Volume discounts and cooperative advertising discounts inexcess of identifiable advertising costs are recognized as a reduction of cost of goods sold when the related merchandise is sold. The Company utilizes forwardpurchases to limit its exposures to changes in commodity prices. All forward purchase commitments are established at current prices and recorded through cost ofgoods sold at settlement. Occupancy costs include store rental costs, property taxes, utility costs, repair and maintenance costs, and property insurance. Our largestsupplier, United Natural Foods, Inc., accounted for approximately 32.5% , 32.0% and 31.8% of our total purchases in fiscal years 2016 , 2015 and 2014 ,respectively.
Selling, General and Administrative ExpensesSelling, general and administrative expenses consist of retail operational expenses, marketing, and corporate and regional administrative support costs. Advertisingexpense for fiscal years 2016 , 2015 and 2014 was approximately $96 million , $89 million and $63 million , respectively. Advertising costs are charged to expensewhen incurred, except for certain production costs that are charged to expense when the advertising first takes place.
Pre-opening ExpensesPre-opening expenses include rent expense incurred during construction of new facilities and costs related to new location openings, including costs associatedwith hiring and training personnel, smallwares, supplies and other miscellaneous costs. Rent expense is generally incurred approximately nine months prior to astore’s opening date. Other pre-opening expenses are incurred primarily in the 60 days prior to a new store opening. Pre-opening costs are expensed as incurred.
Relocation, Store Closure and Lease Termination CostsRelocation costs consist of moving costs, estimated remaining net lease payments, accelerated depreciation costs, related asset impairment, and other costsassociated with replaced facilities. Store closure costs consist of estimated remaining lease payments, accelerated depreciation costs, related asset impairment, andother costs associated with closed facilities. Lease termination costs consist of estimated remaining net lease payments for terminated leases and idle properties,and associated asset impairments.
42

Table of Contents
Share-Based PaymentsThe Company maintains several share-based incentive plans. We grant both options to purchase common stock and restricted common stock under our WholeFoods Market 2009 Stock Incentive Plan. Options outstanding are governed by the original terms and conditions of the grants, unless modified by a subsequentagreement. Options are granted at an option price equal to the market value of the stock at the grant date and generally vest ratably over a four - or nine -yearperiod beginning one year from grant date and have a five , seven , or ten year term. The grant date is established once the Company’s Board of Directors approvesthe grant and all key terms have been determined. Stock option grant terms and conditions are communicated to team members within a relatively short period oftime. The Company generally approves one primary stock option grant annually, occurring during a trading window. Restricted common stock is granted at themarket price of the stock on the day of grant and generally vests over a four - or six -year period.
The Company uses the Black-Scholes multiple option pricing model which requires extensive use of accounting judgment and financial estimates, includingestimates of the expected term team members will retain their vested stock options before exercising them, the estimated volatility of the Company’s commonstock price over the expected term, and the number of options that will be forfeited prior to the completion of their vesting requirements. The related share-basedpayment expense is recognized on a straight-line basis over the requisite service period. The tax savings resulting from tax deductions in excess of expensereflected in the Company’s financial statements are reflected as a financing cash flow.
All full-time team members with a minimum of 400 hours of service may purchase our common stock through payroll deductions under the Company’s TeamMember Stock Purchase Plan (“TMSPP”). The TMSPP provides for a 5% discount on the shares’ purchase date market value, which meets the share-basedpayment “Safe Harbor” provisions, and therefore is non-compensatory. As a result, no compensation expense is recognized for our team member stock purchaseplan.
Income TaxesThe Company recognizes deferred income tax assets and liabilities by applying statutory tax rates in effect at the balance sheet date to differences between thebook basis and the tax basis of assets and liabilities. Deferred tax assets and liabilities are measured using enacted tax rates expected to apply to taxable income inthe years in which those temporary differences are expected to reverse. Deferred tax assets and liabilities are adjusted to reflect changes in tax laws or rates in theperiod that includes the enactment date. The Company may recognize the tax benefit from an uncertain tax position if it is more likely than not that the tax positionwill be sustained by the taxing authorities based on technical merits of the position. The tax benefits recognized in the financial statements from such a position aremeasured based on the largest benefit that has a greater than 50% likelihood of being realized upon settlement. Significant accounting judgment is required indetermining the provision for income taxes and related accruals, deferred tax assets and liabilities. The Company believes that its tax positions are consistent withapplicable tax law, but certain positions may be challenged by taxing authorities. In the ordinary course of business, there are transactions and calculations wherethe ultimate tax outcome is uncertain. In addition, we are subject to periodic audits and examinations by the IRS and other state and local taxing authorities.Although we believe that our estimates are reasonable, actual results could differ from these estimates.
Treasury StockUnder the Company’s stock repurchase program, the Company can repurchase shares of the Company’s common stock on the open market that are held in treasuryat cost. Shares held in treasury may be reissued to satisfy exercises of stock options and issuances of restricted stock awards. The Company does not currentlyintend to retire its treasury shares. The Company’s common stock has no par value.
Earnings per ShareBasic earnings per share are calculated by dividing net income available to common shareholders by the weighted average number of common shares outstandingduring the fiscal period. Diluted earnings per share are based on the weighted average number of common shares outstanding plus, where applicable, the additionalcommon shares that would have been outstanding related to dilutive share-based awards using the treasury stock method. Dilutive potential common shares includeoutstanding stock options and unvested restricted stock awards.
Comprehensive IncomeComprehensive income consists of: net income; foreign currency translation adjustments; and unrealized gains and losses on available-for-sale securities, net ofincome tax, and is reflected in the Consolidated Statements of Comprehensive Income.
Foreign Currency TranslationThe Company’s operations in Canada and the U.K. use their local currency as their functional currency. Foreign currency transaction gains and losses related toCanadian intercompany operations are charged to net income in the period incurred.
43

Table of Contents
Foreign currency gains and losses were not material in fiscal year 2016 , 2015 or 2014 . Intercompany transaction gains and losses associated with our U.K.operations are excluded from the determination of net income since these transactions are considered long-term investments in nature. Assets and liabilities aretranslated at exchange rates in effect at the balance sheet date. Income and expense accounts are translated at the average exchange rates during the fiscal year.Resulting translation adjustments are recorded as a separate component of accumulated other comprehensive income.
Use of EstimatesThe preparation of financial statements in conformity with generally accepted accounting principles requires management to make estimates and assumptions thataffect the reported amounts of assets and liabilities and disclosure of contingent assets and liabilities at the date of the financial statements, and revenues andexpenses during the period reported. Actual amounts could differ from those estimates.
ReclassificationsWhere appropriate, we have reclassified prior years’ financial statements to conform to current year presentation.
Recent Accounting PronouncementsThe following table provides a brief description of recently issued accounting pronouncements:
Standard Description Effective Date
Effect on financialstatements and othersignificant matters
ASU No. 2016-13Measurement of Credit Losses on FinancialInstruments(Topic 326)
The amendments guide on reporting credit losses for assetsheld at amortized cost basis and available-for-sale debtsecurities. The amendments require a financial asset measuredat amortized cost basis to be presented at the net amountexpected to be collected. The amendments also require thatcredit losses on available-for-sale debt securities be presentedas an allowance. The amendments should be applied on eithera prospective transition or modified-retrospective approachdepending on the subtopic.
First quarter of fiscalyear ending September29, 2021
We are currently evaluatingthe impact that the adoptionof these provisions willhave on the Company’sconsolidated financialstatements.
ASU No. 2016-09Improvements to Employee Share-BasedPayment Accounting (Topic 718)
The amendments aim to simplify several aspects of theaccounting for share-based payment transactions, including theincome tax consequences, forfeitures, and certainclassifications on the statement of cash flows. Theamendments should be applied on either a prospective,retrospective, or modified-retrospective basis depending on thesubtopic.
First quarter of fiscalyear ending September30, 2018
We are currently evaluatingthe impact that the adoptionof these provisions willhave on the Company’sconsolidated financialstatements.
ASU No. 2016-08Principal versus Agent Considerations(Reporting Revenue Gross versus Net)(Topic 606)
The amendments, which do not change the core principle ofthe guidance in Topic 606, clarify the implementationguidance on principal versus agent considerations, includinghow an entity should identify the unit of accounting (i.e., thespecified good or service) for the principal versus agentevaluation and how it should apply the control principle tocertain types of arrangements, such as service transactions.The amendments may be applied on either a full or modifiedretrospective basis.
First quarter of fiscalyear ending September29, 2019
We are currently evaluatingthe impact that the adoptionof these provisions willhave on the Company’sconsolidated financialstatements.
ASU No. 2016-07Simplifying the Transition to the EquityMethod of Accounting (Topic 323)
The amendments eliminate the requirement to retroactivelyapply the equity method of accounting when an investmentqualifies for the use of the equity method due to an increase inthe level of ownership interest or degree of influence. Theamendments should be applied on a prospective basis.
First quarter of fiscalyear ending September30, 2018
We do not expect theadoption of these provisionsto have a significant impacton the Company’sconsolidated financialstatements.
44

Table of Contents
Standard Description Effective Date
Effect on financialstatements and othersignificant matters
ASU No. 2016-04Recognition of Breakage for CertainPrepaid Stored-Value Products (a consensusof the Emerging Issues Task Force)(Subtopic 405-20)
The amendments require entities to recognize liabilities relatedto the sale of prepaid stored-value products redeemable forgoods, services or cash as financial liabilities in the scope ofASC 405. Additionally, the new guidance amends ASC 405-20 to include a narrow scope exception requiring entities torecognize breakage for these liabilities in a way that isconsistent with how gift card breakage will be recognizedunder the new revenue recognition standard. The amendmentsmay be applied on either a full or modified retrospective basis.
First quarter of fiscalyear ending September29, 2019
We are currently evaluatingthe impact that the adoptionof these provisions willhave on the Company’sconsolidated financialstatements.
ASU No. 2016-02Leases (Topic 842)
The amendments require lessees to recognize a right-of-useasset and lease liability for all leases with terms of more than12 months. Recognition, measurement and presentation ofexpenses will depend on classification as a finance oroperating lease. The amendments also require certainquantitative and qualitative disclosures. Accounting guidancefor lessors is largely unchanged. The amendments should beapplied on a modified retrospective basis.
First quarter of fiscalyear ending September27, 2020
We are currently evaluatingthe impact that the adoptionof these provisions willhave on the Company’sconsolidated financialstatements.
ASU No. 2016-01Recognition and Measurement of FinancialAssets and Financial Liabilities (Subtopic825-10)
The amendments address certain aspects of recognition,measurement, presentation, and disclosure of financialinstruments. The amendments should be applied by means of acumulative-effect adjustment to the balance sheet in year ofadoption. Early adoption is permitted for only certainamendments of the update.
First quarter of fiscalyear ending September29, 2019
We are currently evaluatingthe impact that the adoptionof these provisions willhave on the Company’sconsolidated financialstatements.
ASU No. 2015-17Balance Sheet Classification of DeferredTaxes (Topic 740)
The amendments simplify the presentation of deferred incometaxes by requiring that all deferred tax liabilities and assets beclassified as noncurrent in the statement of financial position.The amendments may be applied on either a prospective orretrospective basis.
First quarter of fiscalyear ending September30, 2018
We do not expect theadoption of these provisionsto have a significant impacton the Company’sconsolidated financialstatements.
ASU No. 2015-16Simplifying the Accounting forMeasurement-Period Adjustments (Topic805)
The amendments require that an acquirer recognizeadjustments to provisional amounts identified during themeasurement period in the reporting period in which theadjustments are determined and eliminate the requirement toretrospectively revise prior periods. Additionally, an acquirershould record in the same period the effects on earnings of anychanges in the provisional accounts, calculated as if theaccounting had been completed at the acquisition date. Theamendments should be applied on a prospective basis.
First quarter of fiscalyear ending September24, 2017
We do not expect theadoption of these provisionsto have a significant impacton the Company’sconsolidated financialstatements.
ASU No. 2015-11Simplifying the Measurement of Inventory(Topic 330)
The amendments, which apply to inventory that is measuredusing any method other than the last-in, first-out (LIFO) orretail inventory method, require that entities measure inventoryat the lower of cost and net realizable value. The amendmentsshould be applied on a prospective basis.
First quarter of fiscalyear ending September30, 2018
We do not expect theadoption of these provisionsto have a significant impacton the Company’sconsolidated financialstatements.
45

Table of Contents
Standard Description Effective Date
Effect on financialstatements and othersignificant matters
ASU No. 2015-05Customer’s Accounting for Fees Paid in aCloud Computing Arrangement (Topic 350)
The amendments provide guidance as to whether a cloudcomputing arrangement (e.g., software as a service, platformas a service, infrastructure as a service, and other similarhosting arrangements) includes a software license and, basedon that determination, how to account for such arrangements.The amendments may be applied on either a prospective orretrospective basis.
First quarter of fiscalyear ending September24, 2017
We do not expect theadoption of these provisionsto have a significant impacton the Company’sconsolidated financialstatements.
ASU No. 2015-02Amendments to the Consolidation Analysis(Topic 810)
The amendments revise the consolidation analysis related tolimited partnerships and similar legal entities, variable interestentities, and certain investment funds. The amendments maybe applied on either a full or modified retrospective basis.
First quarter of fiscalyear ending September24, 2017
We do not expect theadoption of these provisionsto have a significant impacton the Company’sconsolidated financialstatements.
ASU No. 2014-09Revenue from Contracts with Customers(Topic 606)
The core principle of the new guidance is that an entity willrecognize revenue to depict the transfer of promised goods orservices to customers in an amount that reflects theconsideration to which the entity expects to be entitled inexchange for those goods or services. Additionally, theguidance requires disclosures related to the nature, amount,timing, and uncertainty of revenue that is recognized. Theamendments may be applied on either a full or modifiedretrospective basis.
First quarter of fiscalyear ending September29, 2019
We are currently evaluatingthe timing, method, andimpact that the adoption ofthese provisions will haveon the Company’sconsolidated financialstatements.
(3) Fair Value MeasurementsAssets Measured at Fair Value on a Recurring BasisThe Company held the following financial assets measured at fair value on a recurring basis based on the hierarchy levels indicated (in millions):
September 25, 2016 Level 1 Inputs Level 2 Inputs Level 3 Inputs Total
Cash equivalents: Money market fund $ 62 $ — $ — $ 62Commercial paper — 30 — 30Municipal bonds — 46 — 46
Marketable securities - available-for-sale: Commercial paper — 30 — 30Municipal bonds — 26 — 26Variable-rate demand notes — 323 — 323
Total $ 62 $ 455 $ — $ 517
September 27, 2015 Level 1 Inputs Level 2 Inputs Level 3 Inputs Total
Cash equivalents: Money market fund $ 32 $ — $ — $ 32
Marketable securities - available-for-sale: Asset-backed securities — 13 — 13Certificates of deposit — 2 — 2Corporate bonds — 30 — 30Municipal bonds — 173 — 173
Total $ 32 $ 218 $ — $ 250
Assets Measured at Fair Value on a Nonrecurring BasisAssets recognized or disclosed at fair value on a nonrecurring basis include items such as property and equipment, intangible assets, and other assets. These assetsare measured at fair value if determined to be impaired. Fair value adjustments, based on hierarchy input Level 3, were not material during fiscal year 2016 or2014. During fiscal year 2015, the Company recorded fair
46

Table of Contents
value adjustments, based on hierarchy input Level 3, totaling approximately $46 million related to certain locations for which asset value exceeded expected futurecash flows, which were primarily included in the “Selling, general and administrative expenses” line item on the Consolidated Statements of Operations. Theseasset impairment charges reduced the carrying value of related long-term assets to fair value of zero.
(4) InvestmentsThe Company holds investments primarily in marketable securities that are classified as either short- or long-term available-for-sale securities. The Company heldthe following investments at fair value as of the dates indicated (in millions):
September 25,
2016 September 27,
2015
Short-term marketable securities - available-for-sale: Asset-backed securities $ — $ 10Certificates of deposit — 2Commercial paper 30 —Corporate bonds — 15Municipal bonds 26 128Variable rate demand notes 323 —
Total short-term marketable securities $ 379 $ 155
Long-term marketable securities - available-for-sale: Asset-backed securities $ — $ 3Corporate bonds — 15Municipal bonds — 45
Total long-term marketable securities $ — $ 63
Gross unrealized holding gains and losses were not material at September 25, 2016 or September 27, 2015 . Available-for-sale securities totaling approximately$33 million and $58 million were in unrealized loss positions at September 25, 2016 and September 27, 2015 , respectively. The aggregate value of available-for-sale securities in a continuous unrealized loss position for greater than 12 months was not material at September 25, 2016 or September 27, 2015 . The Companydid not recognize any other-than-temporary impairments during the last three fiscal years. At September 25, 2016 , the average effective maturity of theCompany’s short-term available-for-sale securities was less than one month. The average effective maturity of the Company’s short- and long-term available-for-sale securities was approximately 7 months and 16 months, respectively, at September 27, 2015 .
The Company held approximately $19 million and $14 million in equity interests that are accounted for using the cost method of accounting at September 25, 2016and September 27, 2015 , respectively. Equity interests accounted for using the equity method were not material at September 25, 2016 or September 27, 2015 .
(5) Property and EquipmentBalances of major classes of property and equipment were as follows (in millions):
September 25,
2016 September 27,
2015
Land $ 161 $ 151Buildings and leasehold improvements 3,390 3,116Capitalized real estate leases 80 81Fixtures and equipment 2,499 2,330Construction in progress and equipment not yet in service 284 176Property and equipment, gross 6,414 5,854Less accumulated depreciation and amortization (2,972) (2,691)Property and equipment, net of accumulated depreciation and amortization $ 3,442 $ 3,163
Depreciation and amortization expense related to property and equipment totaled approximately $478 million , $422 million and $360 million for fiscal years 2016, 2015 and 2014 , respectively. Asset impairment charges related to property and equipment were not material in fiscal year 2016 . During fiscal year 2015 , assetimpairment charges related to property and equipment totaled approximately $48 million , including approximately $46 million related to locations as discussed inNote 3, Fair Value Measurements. These charges were incurred because future estimated cash flows were less than the carrying value of assets. The Companyreduced the future estimated cash flows based on current comparable store sales trends and reductions in estimated future net sales projections based on future andanticipated business trends, including increased competition. Development costs
47

Table of Contents
of new locations totaled approximately $395 million , $516 million and $447 million in fiscal years 2016 , 2015 and 2014 , respectively. Construction accrualsrelated to development sites, remodels, and expansions were included in the “Other current liabilities” line item on the Consolidated Balance Sheets and totaledapproximately $94 million and $54 million at September 25, 2016 and September 27, 2015 , respectively.
(6) Goodwill and Other Intangible AssetsThere were no additions or adjustments to goodwill during fiscal year 2016. Additions and adjustments to goodwill during fiscal year 2015 were not material.There were no impairments of goodwill during fiscal years 2016 , 2015 or 2014 . Additions of other intangible assets were not material during fiscal years 2016and 2015. The components of intangible assets as of the dates indicated were as follows (in millions):
September 25, 2016 September 27, 2015
Gross carrying
amount Accumulatedamortization
Gross carryingamount
Accumulatedamortization
Definite-lived contract-based $ 120 $ (55) $ 122 $ (50)Indefinite-lived contract-based 9 — 7 —Total $ 129 $ (55) $ 129 $ (50)
Amortization expense associated with intangible assets was not material during fiscal year 2016 , 2015 or 2014 . Future amortization expense associated with thenet carrying amount of definite-lived intangible assets is estimated to be as follows (in millions):
Fiscal year 2017 $ 6Fiscal year 2018 5Fiscal year 2019 5Fiscal year 2020 5Fiscal year 2021 4Future fiscal years 40Total $ 65
(7) One-Time Termination BenefitsDuring fiscal year 2015, the Company recorded one-time termination benefits totaling $34 million , included in the “Selling, general, and administrative expenses”line item on the Consolidated Statements of Operations as part of its ongoing commitment to lower prices for its customers and invest in technology upgradeswhile improving its cost structure. The Company reduced more than 2,000 positions, which represented approximately 2.1% of its workforce at the time of thereduction. Affected team members were offered several options, including transition pay, severance pay, or the opportunity to apply for other jobs. The plan wassubstantially completed during the first quarter of fiscal year 2016, and adjustments to the related restructuring charges were not material.
(8) Reserves for Closed PropertiesThe following table provides a summary of activity in reserves for closed properties during the fiscal years indicated (in millions):
2016 2015
Beginning balance $ 28 $ 31Additions 6 9Usage (10) (13)Adjustments 2 1Ending balance $ 26 $ 28
Additions to store closure reserves primarily relate to the accretion of interest on existing reserves. Additions related to six and seven new closures during fiscalyears 2016 and 2015 , respectively, were not material. Usage primarily related to ongoing cash rental payments totaled approximately $10 million and $13 millionfor fiscal years 2016 and 2015 , respectively.
(9) Long-Term DebtCredit AgreementOn November 2, 2015 , the Company entered into a credit facility (the “Credit Agreement”) that provides for an unsecured revolving credit facility in the aggregateprincipal amount of $500 million , which may be increased from time to time by up to $250 million in the aggregate pursuant to an expansion feature set forth inthe Credit Agreement. The Credit Agreement also
48

Table of Contents
provides for a letter of credit subfacility of up to $250 million and a swingline subfacility of up to $50 million . The Credit Agreement is scheduled to mature, andthe commitments thereunder will terminate, on November 2, 2020 .
Under the Credit Agreement, Eurodollar borrowings bear interest at a variable rate equal to an adjusted London interbank offered rate (“Adjusted LIBO Rate”) fora one, two, three, or six month interest period , plus a margin between 1.125% to 1.750% . Other borrowings, including swingline loans, bear interest at a variablerate equal to the greatest of the Prime Rate , the Federal Funds Rate plus 0.5% , and the Adjusted LIBO Rate for a one-month interest period plus 1% , in each caseplus a margin of 0.125% to 0.750% . For all borrowings, the applicable margin is based on the Company’s leverage ratio. Additionally, the Company will pay acommitment fee ranging from 0.125% to 0.300% , based on the Company’s leverage ratio, on the average daily amount of the undrawn commitments under theCredit Agreement payable quarterly .
The Credit Agreement includes customary representations and warranties, certain affirmative covenants including the maintenance of certain financial ratios,certain negative covenants including limitations on additional indebtedness and payments as defined in the agreement, and events of default. At September 25,2016 , we were in compliance with all applicable debt covenants. Subject to certain exceptions, obligations under the Credit Agreement are guaranteed by certainof the Company’s material domestic subsidiaries.
During the first quarter of fiscal year 2016 , the Company borrowed and repaid $300 million under the Credit Agreement. At September 25, 2016 , the Companyhad no amounts outstanding. Commitment fees paid on undrawn amounts were not material during the fifty-two weeks ended September 25, 2016 .
Senior NotesOn December 3, 2015 , the Company completed the offering of $1.0 billion of 5.2% senior notes due 2025 (the “Notes”). The Notes were offered in the UnitedStates to qualified institutional buyers pursuant to Rule 144A under the Securities Act of 1933, as amended (the “Securities Act”), and outside the United Statespursuant to Regulation S under the Securities Act. Subsequent to fiscal year 2016, the Company commenced a registered exchange offer to exchange the Notes fornew notes that are identical in all material respects to the Notes, except that the new notes have been registered under the Securities Act. The exchange offerexpired on October 28, 2016, and approximately 99.1% of the Notes were exchanged. The Notes that were not exchanged have not been registered under theSecurities Act or any state securities laws and may not be offered or sold in the United States absent registration or an applicable exemption from registrationrequirements or a transaction not subject to the registration requirements of the Securities Act or any state securities laws.
The Notes bear interest at a fixed rate equal to 5.2% per year, payable semiannually , and mature on December 3, 2025 . The interest rate payable on the Notes issubject to adjustment upon the occurrence of certain credit rating events described in the indenture. The Notes are guaranteed on an unsecured, unsubordinatedbasis by certain subsidiaries of the Company.
The Notes are subject to customary covenants restricting the Company’s and its subsidiaries’ ability, subject to certain exceptions, to incur debt secured by liens orto enter into sale and leaseback transactions and restricting the Company’s ability to merge or consolidate with another entity or sell substantially all of its assets toanother person. On or after September 3, 2025, the Company may redeem the Notes at the Company’s option at any time either in whole or in part for a redemptionprice equal to 100% of the aggregate principal amount of the Notes to be redeemed, plus accrued and unpaid interest thereon.
The components of long-term debt as of the dates indicated were as follows (in millions):
September 25,
2016 September 27,
2015
5.2% senior notes due 2025 $ 1,000 $ —Less: unamortized discount and debt issuance costs related to senior notes (7) —
Carrying value of senior notes 993 —Capital lease obligations 58 65
Total long-term debt and capital lease obligations 1,051 65Less: current installments (3) (3)
Total long-term debt and capital lease obligations, less current installments $ 1,048 $ 62
The Notes are recorded at cost net of discount and issuance costs. The effective interest rate of the Notes, which includes interest on the Notes and amortization ofdiscount and issuance costs, is approximately 5.28% . The estimated fair value of the Notes at September 25, 2016 , based on observable market prices (Level 2),exceeded the carrying value by approximately $92 million .
49
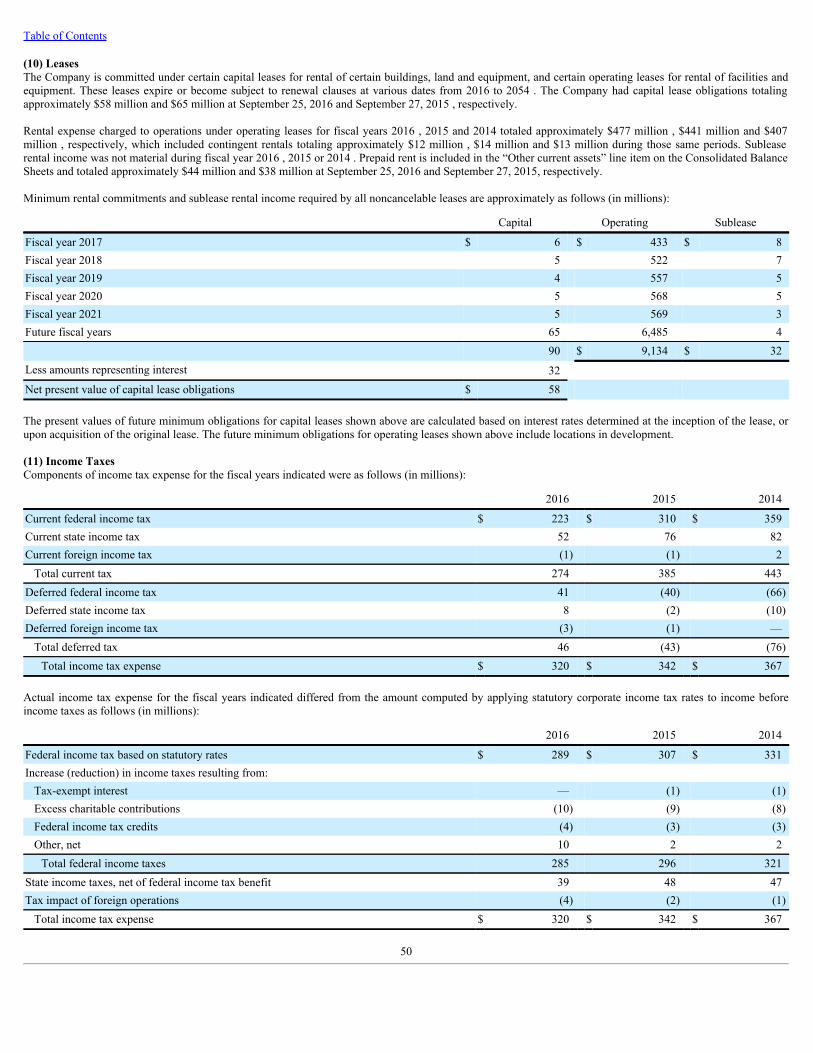
Table of Contents
(10) LeasesThe Company is committed under certain capital leases for rental of certain buildings, land and equipment, and certain operating leases for rental of facilities andequipment. These leases expire or become subject to renewal clauses at various dates from 2016 to 2054 . The Company had capital lease obligations totalingapproximately $58 million and $65 million at September 25, 2016 and September 27, 2015 , respectively.
Rental expense charged to operations under operating leases for fiscal years 2016 , 2015 and 2014 totaled approximately $477 million , $441 million and $407million , respectively, which included contingent rentals totaling approximately $12 million , $14 million and $13 million during those same periods. Subleaserental income was not material during fiscal year 2016 , 2015 or 2014 . Prepaid rent is included in the “Other current assets” line item on the Consolidated BalanceSheets and totaled approximately $44 million and $38 million at September 25, 2016 and September 27, 2015, respectively.
Minimum rental commitments and sublease rental income required by all noncancelable leases are approximately as follows (in millions):
Capital Operating Sublease
Fiscal year 2017 $ 6 $ 433 $ 8Fiscal year 2018 5 522 7Fiscal year 2019 4 557 5Fiscal year 2020 5 568 5Fiscal year 2021 5 569 3Future fiscal years 65 6,485 4
90 $ 9,134 $ 32Less amounts representing interest 32 Net present value of capital lease obligations $ 58
The present values of future minimum obligations for capital leases shown above are calculated based on interest rates determined at the inception of the lease, orupon acquisition of the original lease. The future minimum obligations for operating leases shown above include locations in development.
(11) Income TaxesComponents of income tax expense for the fiscal years indicated were as follows (in millions):
2016 2015 2014
Current federal income tax $ 223 $ 310 $ 359Current state income tax 52 76 82Current foreign income tax (1) (1) 2
Total current tax 274 385 443Deferred federal income tax 41 (40) (66)Deferred state income tax 8 (2) (10)Deferred foreign income tax (3) (1) —
Total deferred tax 46 (43) (76)Total income tax expense $ 320 $ 342 $ 367
Actual income tax expense for the fiscal years indicated differed from the amount computed by applying statutory corporate income tax rates to income beforeincome taxes as follows (in millions):
2016 2015 2014
Federal income tax based on statutory rates $ 289 $ 307 $ 331Increase (reduction) in income taxes resulting from:
Tax-exempt interest — (1) (1)Excess charitable contributions (10) (9) (8)Federal income tax credits (4) (3) (3)Other, net 10 2 2
Total federal income taxes 285 296 321State income taxes, net of federal income tax benefit 39 48 47Tax impact of foreign operations (4) (2) (1)
Total income tax expense $ 320 $ 342 $ 367
50

Table of Contents
Current income taxes receivable were not material at September 25, 2016 or September 27, 2015 .
The tax effects of temporary differences that give rise to significant portions of the deferred tax assets and deferred tax liabilities were as follows (in millions):
September 25,
2016 September 27,
2015
Deferred tax assets: Compensation-related costs $ 215 $ 207Insurance-related costs 60 59Inventories 5 2Lease and other termination accruals 10 11Lease negotiation legal fees 7 6Rent differential 189 170Tax basis of fixed assets in excess of financial basis 8 11Net domestic and international operating loss carryforwards 14 23Other 13 9
Gross deferred tax assets 521 498Valuation allowance (23) (35)
Deferred tax assets 498 463Deferred tax liabilities:
Financial basis of fixed assets in excess of tax basis (197) (117)Capitalized costs expensed for tax purposes (4) (3)
Deferred tax liabilities (201) (120)Net deferred tax asset $ 297 $ 343
Deferred taxes have been classified on the Consolidated Balance Sheets as follows (in millions):
September 25,
2016 September 27,
2015
Current assets $ 197 $ 199Noncurrent assets 100 144Net deferred tax asset $ 297 $ 343
At September 25, 2016 , the Company had international operating loss carryforwards totaling approximately $71 million , all of which have an indefinite life. TheCompany provided a valuation allowance totaling approximately $23 million for deferred tax assets associated with international operating loss carryforwards,federal credit carryforwards, and deferred tax assets associated with unrecognized tax benefits, for which management has determined it is more likely than not thatthe deferred tax asset will not be realized. Management believes that it is more likely than not that we will fully realize the remaining domestic deferred tax assetsin the form of future tax deductions based on the nature of these deductible temporary differences and a history of profitable operations.
The Company intends to utilize earnings in foreign operations for an indefinite period of time, or to repatriate such earnings only when tax-efficient to do so. Ifthese amounts were distributed to the United States, in the form of dividends or otherwise, the Company would be subject to additional U.S. income taxes.Determination of the amount of unrecognized deferred income tax liabilities on these earnings is not practicable because such liability, if any, is dependent oncircumstances existing if and when remittance occurs. The Company’s total gross unrecognized tax benefits are classified in the “Other long-term liabilities” lineitem on the Consolidated Balance Sheets and were not material during the last three fiscal years.
The Company and its domestic subsidiaries file income tax returns with federal, state and local tax authorities within the United States. The Company’s foreignaffiliates file income tax returns in Canada and the United Kingdom. The IRS of the United States completed its examination of the Company’s federal tax returnsfor fiscal year 2014 during the first quarter of fiscal year 2016 . With limited exceptions, the Company is no longer subject to federal income tax examinations forfiscal years before 2015 and is no longer subject to state and local income tax examinations for fiscal years before 2009. Additionally, the Company entered into aCompliance Agreement Program (“CAP”) with the IRS under which the Company’s federal income tax return is reviewed and accepted by the Internal RevenueService in conjunction with the filing of its tax return.
51

Table of Contents
(12) Shareholders’ EquityDividends per Common ShareThe following table provides a summary of dividends declared per common share during fiscal years 2016 and 2015 (in millions, except per share amounts):
Date of declarationDividend per
common share Date of record Date of payment Total amount
Fiscalyear2016: November 4, 2015 $ 0.135 January 15, 2016 January 26, 2016 $ 44March 9, 2016 0.135 April 8, 2016 April 19, 2016 44June 7, 2016 0.135 July 1, 2016 July 12, 2016 43September 22, 2016 0.135 October 3, 2016 October 14, 2016 43
Fiscalyear2015: November 5, 2014 $ 0.13 January 16, 2015 January 27, 2015 $ 47March 10, 2015 0.13 April 10, 2015 April 21, 2015 47June 9, 2015 0.13 July 2, 2015 July 14, 2015 47September 15, 2015 0.13 October 2, 2015 October 13, 2015 45(1) Dividend accrued at September 25, 2016
Treasury StockShare repurchase activity prior to the fourth quarter of fiscal year 2014 was pursuant to various share repurchase programs authorized by the Company’s Board ofDirectors (“the Board”). As of September 25, 2016 , one share repurchase program remains in effect, with prior programs having been fully utilized, expired orcancelled. The following table outlines the share repurchase programs authorized by the Board, and the related repurchase activity as of September 25, 2016 (inmillions):
Effective date Expiration date Amount authorized Cost of repurchases Authorization
available
August 1, 2014 August 1, 2016 $ 1,000 $ 1,000 $ —November 4, 2015 Not applicable $ 1,000 $ 556 $ 444
Under the share repurchase program, purchases can be made from time to time using a variety of methods, which may include open market purchases. The specifictiming, price and size of purchases will depend on prevailing stock prices, general economic and market conditions, and other considerations. Purchases may bemade through a Rule 10b5-1 plan pursuant to pre-determined metrics set forth in such plan. The Board’s authorization of the share repurchase program does notobligate the Company to acquire any particular amount of common stock, and the program may be suspended or discontinued at any time at the Company’sdiscretion.
Share repurchase activity for the fiscal years indicated was as follows (in millions, except per share amounts):
2016 2015
Number of common shares acquired 31.7 13.8Average price per common share acquired $ 29.82 $ 37.06Total cost of common shares acquired $ 944 $ 513
The Company reissued approximately 1.1 million treasury shares at cost of approximately $42 million and approximately 2.3 million treasury shares at cost ofapproximately $100 million to satisfy the issuance of common stock pursuant to team member stock plans during fiscal years 2016 and 2015 , respectively. AtSeptember 25, 2016 and September 27, 2015 , the Company held in treasury approximately 58.7 million shares and 28.2 million shares, respectively, totalingapproximately $2.0 billion and $1.1 billion , respectively.
(13) Earnings per ShareThe computation of basic earnings per share is based on the number of weighted average common shares outstanding during the period. The computation of dilutedearnings per share includes the dilutive effect of common stock equivalents consisting of incremental common shares deemed outstanding from the assumedexercise of stock options and the dilutive effect of restricted stock awards. A reconciliation of the numerators and denominators of the basic and diluted earningsper share calculations follows (in millions, except per share amounts):
52

Table of Contents
2016 2015 2014
Net income (numerator for basic and diluted earnings per share) $ 507 $ 536 $ 579
Weighted average common shares outstanding(denominator for basic earnings per share) 326.1 358.5 367.8
Incremental common shares attributable to dilutiveeffect of share-based awards 0.8 2.3 2.7
Weighted average common shares outstanding and potential additional common sharesoutstanding(denominator for diluted earnings per share) 326.9 360.8 370.5
Basic earnings per share $ 1.55 $ 1.49 $ 1.57
Diluted earnings per share $ 1.55 $ 1.48 $ 1.56
The computation of diluted earnings per share for fiscal years 2016 , 2015 and 2014 does not include share-based awards to purchase approximately 21.8 millionshares, 12.0 million shares and 9.1 million shares of common stock, respectively, due to their antidilutive effect.
(14) Share-Based PaymentsShare-based payment expense, primarily included in the “Selling, general and administrative expenses” line item on the Consolidated Statements of Operations,totaled approximately $49 million , $64 million and $68 million , respectively, during fiscal years 2016 , 2015 and 2014 . At September 25, 2016 , September 27,2015 and September 28, 2014 approximately 29.8 million shares, 32.9 million shares and 37.6 million shares of the Company’s common stock, respectively, wereavailable for future stock incentive grants.
Stock OptionsThe following table summarizes stock option activity (in millions, except per share amounts and contractual lives in years):
Number of options outstanding
Weighted average
exercise price
Weighted average
remaining contractual life
Aggregate intrinsic
value
Outstanding options at September 29, 2013 19.2 $ 36.90 Options granted 5.3 40.25 Options exercised (1.5) 24.13 Options expired (0.1) 36.10 Options forfeited (0.6) 42.32 Outstanding options at September 28, 2014 22.3 $ 38.37 Options granted 5.3 44.30 Options exercised (2.2) 27.81 Options expired (0.3) 42.88 Options forfeited (0.8) 42.66 Outstanding options at September 27, 2015 24.3 $ 40.45 Options granted 5.0 30.31 Options exercised (0.9) 15.23 Options expired (0.9) 41.73 Options forfeited (1.2) 41.72 Outstanding options at September 25, 2016 26.3 $ 39.35 4.17 $ 13Vested/expected to vest at September 25, 2016 25.2 $ 39.53 4.09 $ 12Exercisable options at September 25, 2016 14.8 $ 40.47 3.01 $ 11
The weighted average grant date fair value of options granted during fiscal years 2016 , 2015 and 2014 was $6.71 , $10.19 and $9.67 , respectively. The aggregateintrinsic value of stock options at exercise, represented in the table above, was approximately $16 million , $46 million and $36 million during fiscal years 2016 ,2015 and 2014 , respectively. The Company realized a tax benefit from stock options exercised during fiscal years 2016 , 2015 and 2014 totaling approximately$15 million , $46 million and $36 million , respectively. The total fair value of shares vested during fiscal years 2016 , 2015 and 2014 was approximately $141million , $209 million and $192 million , respectively, including the value of vested options exercised during those same periods. As of the end of fiscal years 2016and 2015 , there was approximately $73 million and $95 million of unrecognized
53

Table of Contents
share-based payment expense, respectively, related to unvested stock options, net of estimated forfeitures, related to approximately 10.5 million shares and 11.5million shares, respectively. The Company anticipates this expense to be recognized over a weighted average period of 2.9 years.
Share-based payment expense related to vesting stock options recognized during fiscal years 2016 , 2015 and 2014 totaled approximately $45 million , $60 millionand $63 million , respectively.
A summary of stock options outstanding and exercisable at September 25, 2016 follows (share amounts in millions):
Range of Exercise Prices Options Outstanding Options Exercisable
From To
Numberof options
outstanding
Weightedaverage
exercise price
Weighted averageremaining
life (in years)
Numberof optionsexercisable
Weightedaverage
exercise price
$ 20.42 $ 29.55 1.6 $ 20.49 1.62 1.4 $ 20.4330.30 38.50 11.0 33.00 4.78 4.4 33.9840.81 46.28 9.2 43.73 3.98 6.0 44.0651.25 59.15 4.5 52.40 3.96 3.0 52.12
26.3 $ 39.35 4.17 14.8 $ 40.47
The fair value of stock option grants has been estimated at the date of grant using the Black-Scholes option pricing model with the following weighted averageassumptions:
2016 2015 2014
Expected dividend yield 1.73% 1.00% 0.95%Risk-free interest rate 1.08% 1.20% 1.18%Expected volatility 31.30% 29.73% 30.96%Expected life, in years 4.05 4.04 4.04
Risk-free interest rate is based on the U.S. Treasury yield curve on the date of the grant for the time period equal to the expected term of the grant. Expectedvolatility is calculated using a ratio of implied volatility based on the Newton-Raphson method of bisection, and four or six year historical volatilities based on theexpected life of each tranche of options. The Company determined the use of blended volatility versus historical or implied volatility represents a more accuratecalculation of option fair value. Expected life is calculated in two tranches based on weighted average percentage of unexpired options and exercise-after-vestinginformation over the last five or seven years. Unvested options are included in the term calculation using the “mid-point scenario” which assumes that unvestedoptions will be exercised halfway between vest and expiration date. The assumptions used to calculate the fair value of options granted are evaluated and revised,as necessary, to reflect market conditions and experience. In addition to the above valuation assumptions, the Company estimates an annual forfeiture rate forunvested options and adjusts fair value expense accordingly. The Company monitors actual forfeiture experience and adjusts the rate from time to time asnecessary.
(15) Quarterly Results (unaudited)The Company’s first fiscal quarter consists of 16 weeks, the second and third fiscal quarters each are 12 weeks, and the fourth fiscal quarter is 12 or 13 weeks.Fiscal years 2016 and 2015 were 52-week years with twelve weeks in the fourth quarter. Because the first fiscal quarter is longer than the remaining quarters, ittypically represents a larger share of the Company’s annual sales from existing stores. Quarter-to-quarter comparisons of results of operations have been and maybe materially impacted by the timing of new store openings. The Company believes that the following information reflects all adjustments, consisting of normalrecurring accruals, necessary for a fair presentation. The operating results for any quarter are not necessarily indicative of results for any future period.
During the fourth quarter of fiscal year 2015, “Selling, general, and administrative expenses” included asset impairment charges totaling approximately $46 millionrelated to certain locations for which asset value exceeded expected future cash flows and a one-time termination charge of $34 million related to restructuring.
54

Table of Contents
The following tables set forth selected unaudited quarterly Consolidated Statements of Operations information for the fiscal years ended September 25, 2016 andSeptember 27, 2015 (in millions, except per share amounts):
First
Quarter SecondQuarter
ThirdQuarter
FourthQuarter
Fiscal Year 2016 (1) Sales $ 4,829 $ 3,696 $ 3,703 $ 3,497Cost of goods sold and occupancy costs 3,188 2,406 2,417 2,303
Gross profit 1,641 1,290 1,286 1,194Selling, general and administrative expenses 1,373 1,028 1,057 1,019Pre-opening expenses 13 18 18 15Relocation, store closure and lease termination costs 3 3 2 5
Operating income 252 241 209 155Interest expense (7) (11) (12) (11)Investment and other income (expense) 4 5 (1) 3
Income before income taxes 249 235 196 147Provision for income taxes 92 93 76 59
Net income $ 157 $ 142 $ 120 $ 88
Basic earnings per share $ 0.47 $ 0.44 $ 0.37 $ 0.28
Diluted earnings per share $ 0.46 $ 0.44 $ 0.37 $ 0.28
Dividends declared per common share $ 0.135 $ 0.135 $ 0.135 $ 0.135
First
Quarter SecondQuarter
ThirdQuarter
FourthQuarter
Fiscal Year 2015 (1) Sales $ 4,671 $ 3,647 $ 3,632 $ 3,438Cost of goods sold and occupancy costs 3,045 2,337 2,339 2,252
Gross profit 1,626 1,310 1,293 1,186Selling, general and administrative expenses 1,330 1,029 1,032 1,080Pre-opening expenses 21 20 12 14Relocation, store closure and lease termination costs 4 6 2 4
Operating income 271 255 247 88Interest expense — — — —Investment and other income 3 4 5 4
Income before income taxes 274 259 252 92Provision for income taxes 107 101 98 36
Net income $ 167 $ 158 $ 154 $ 56
Basic earnings per share $ 0.46 $ 0.44 $ 0.43 $ 0.16
Diluted earnings per share $ 0.46 $ 0.44 $ 0.43 $ 0.16
Dividends declared per common share $ 0.13 $ 0.13 $ 0.13 $ 0.13(1) Sum of quarterly amounts, including per share amounts, may not equal fiscal year totals due to the effect of rounding and the independent quarterly computationof per share amounts.
(16) Commitments and ContingenciesThe Company is exposed to claims and litigation matters arising in the ordinary course of business and uses various methods to resolve these matters in a mannerthat we believe best serves the interests of our stakeholders. From time to time we are a party to legal proceedings including matters involving shareholder claims,personnel and employment issues, personal injury, product liability, protecting our intellectual property, acquisitions and other proceedings arising in the ordinarycourse of business. These matters have not resulted in any material losses to date. Certain litigation cases have been certified as class or collective actions and mayseek substantial damages.
Our primary contingencies are associated with insurance and self-insurance obligations and litigation matters. Additionally, the Company has retention agreementswith certain members of Company management which provide for payments under certain circumstances including change of control. Estimation of our insuranceand self-insurance liabilities requires significant

55

Table of Contents
judgments, and actual claim settlements and associated expenses may differ from our current provisions for loss. We have exposures to loss contingencies arisingfrom pending or threatened litigation for which assessing and estimating the outcomes of these matters involve substantial uncertainties.
The Company evaluates contingencies on an ongoing basis and has established loss provisions for matters in which losses are probable and the amount of loss canbe reasonably estimated, and is not currently a party to any legal proceeding that management believes could have a material adverse effect on our results ofoperations. Insurance and legal settlement liabilities are included in the “Other current liabilities” line item on the Consolidated Balance Sheets. We believe therecorded reserves in our consolidated financial statements are adequate in light of the probable and estimable liabilities.
(17) Guarantor Financial Statement InformationThe Notes issued on December 3, 2015 are fully and unconditionally guaranteed, jointly and severally, on an unsecured, unsubordinated basis by certain whollyowned domestic subsidiaries of the Company (the “Guarantors”). Supplemental condensed consolidating financial information of the Company, including suchinformation for the Guarantors, is presented below. The information is presented in accordance with the requirements of Rule 3-10 under the SEC’s Regulation S-X. The financial information may not necessarily be indicative of results of operations, cash flows or financial position had the non-Guarantor subsidiaries operatedas independent entities. Investments in subsidiaries are presented using the equity method of accounting. The principal elimination entries eliminate investments insubsidiaries and intercompany balances and transactions. Separate financial statements of the Guarantors are not provided as the consolidating financialinformation contained herein provides a more meaningful disclosure to allow investors to determine the nature of the assets held by, and the operations of, thecombined groups.
56

Table of Contents
Consolidated Balance Sheets(In millions)
September 25, 2016
Assets Parent/IssuerGuarantorSubsidiaries
Non-guarantorSubsidiaries Eliminations Consolidated Total
Current assets: Cash and cash equivalents $ — $ 254 $ 97 $ — $ 351Short-term investments - available-for-sale securities — 379 — — 379Restricted cash — 114 8 — 122Accounts receivable — 216 26 — 242Intercompany receivable — 649 — (649) —Merchandise inventories — 441 76 — 517Prepaid expenses and other current assets — 150 17 — 167Deferred income taxes — 197 — — 197
Total current assets — 2,400 224 (649) 1,975Property and equipment, net of accumulated depreciation and amortization — 3,063 379 — 3,442Long-term investments - available-for-sale securities — — — — —Investments in consolidated subsidiaries 4,593 103 472 (5,168) —Goodwill — 702 8 — 710Intangible assets, net of accumulated amortization 1 63 10 — 74Deferred income taxes — 94 6 — 100Other assets — 16 24 — 40
Total assets $ 4,594 $ 6,441 $ 1,123 $ (5,817) $ 6,341
Liabilities and Shareholders’ Equity Current liabilities:
Current installments of capital lease obligations $ — $ 3 $ — $ — $ 3Accounts payable — 227 80 — 307Intercompany payable 316 — 333 (649) —Accrued payroll, bonus and other benefits due team members — 381 26 — 407Dividends payable 43 — — — 43Other current liabilities 17 536 28 — 581
Total current liabilities 376 1,147 467 (649) 1,341Long-term capital lease obligations, less current installments 993 48 7 — 1,048Deferred lease liabilities — 592 48 — 640Other long-term liabilities — 87 1 — 88
Total liabilities 1,369 1,874 523 (649) 3,117
Commitments and contingencies Total shareholders’ equity 3,225 4,567 600 (5,168) 3,224
Total liabilities and shareholders’ equity $ 4,594 $ 6,441 $ 1,123 $ (5,817) $ 6,341
57

Table of Contents
Consolidated Balance Sheets(In millions)
September 27, 2015
Assets Parent/IssuerGuarantorSubsidiaries
Non-guarantorSubsidiaries Eliminations
ConsolidatedTotal
Current assets: Cash and cash equivalents $ — $ 147 $ 90 $ — $ 237Short-term investments - available-for-sale securities — 155 — — 155Restricted cash — 115 12 — 127Accounts receivable — 194 24 — 218Intercompany receivable — 533 — (533) —Merchandise inventories — 430 70 — 500Prepaid expenses and other current assets — 96 12 — 108Deferred income taxes — 199 — — 199
Total current assets — 1,869 208 (533) 1,544Property and equipment, net of accumulated depreciation and amortization — 2,832 331 — 3,163Long-term investments - available-for-sale securities — 63 — — 63Investments in consolidated subsidiaries 4,060 93 445 (4,598) —Goodwill — 703 7 — 710Intangible assets, net of accumulated amortization — 69 10 — 79Deferred income taxes — 141 3 — 144Other assets 10 18 10 — 38
Total assets $ 4,070 $ 5,788 $ 1,014 $ (5,131) $ 5,741
Liabilities and Shareholders’ Equity Current liabilities:
Current installments of capital lease obligations $ — $ 3 $ — $ — $ 3Accounts payable — 216 79 — $ 295Intercompany payable 256 — 277 (533) $ —Accrued payroll, bonus and other benefits due team members — 411 25 — $ 436Dividends payable 45 — — — $ 45Other current liabilities — 452 21 — $ 473
Total current liabilities 301 1,082 402 (533) 1,252Long-term capital lease obligations, less current installments — 55 7 — 62Deferred lease liabilities — 544 43 — 587Other long-term liabilities — 69 2 — 71
Total liabilities 301 1,750 454 (533) 1,972
Commitments and contingencies Total shareholders’ equity 3,769 4,038 560 (4,598) 3,769
Total liabilities and shareholders’ equity $ 4,070 $ 5,788 $ 1,014 $ (5,131) $ 5,741
58

Table of Contents
Consolidated Statements of Operations(In millions)
September 25, 2016
Parent/IssuerGuarantorSubsidiaries
Non-guarantorSubsidiaries Eliminations Consolidated Total
Sales $ — $ 14,928 $ 949 $ (153) $ 15,724Cost of goods sold and occupancy costs — 9,798 664 (149) 10,313
Gross profit — 5,130 285 (4) 5,411Selling, general and administrative expenses — 4,224 253 — 4,477Pre-opening expenses — 58 6 — 64Relocation, store closure and lease termination costs — 10 3 — 13
Operating income — 838 23 (4) 857Interest expense (41) — — — (41)Investment and other income (expense) (1) 12 (4) 4 11Equity in net income of subsidiaries 533 10 28 (571) —
Income before income taxes 491 860 47 (571) 827Provision for income taxes (16) 329 7 — 320
Net income $ 507 $ 531 $ 40 $ (571) $ 507
September 27, 2015
Parent/IssuerGuarantorSubsidiaries
Non-guarantorSubsidiaries Eliminations Consolidated Total
Sales $ — $ 14,565 $ 968 $ (144) $ 15,389Cost of goods sold and occupancy costs — 9,433 679 (139) 9,973
Gross profit — 5,132 289 (5) 5,416Selling, general and administrative expenses — 4,182 290 — 4,472Pre-opening expenses — 65 2 — 67Relocation, store closure and lease termination costs — 15 1 — 16
Operating income (loss) — 870 (4) (5) 861Interest expense — — — — —Investment and other income (expense) — 16 (3) 4 17Equity in net income of subsidiaries 536 9 38 (583) —
Income before income taxes 536 895 31 (584) 878Provision for income taxes — 345 (3) — 342
Net income $ 536 $ 550 $ 34 $ (584) $ 536
September 28, 2014
Parent/IssuerGuarantorSubsidiaries
Non-guarantorSubsidiaries Eliminations Consolidated Total
Sales $ — $ 13,408 $ 920 $ (134) $ 14,194Cost of goods sold and occupancy costs — 8,648 632 (130) 9,150
Gross profit — 4,760 288 (4) 5,044Selling, general and administrative expenses — 3,780 252 — 4,032Pre-opening expenses — 60 7 — 67Relocation, store closure and lease termination costs — 10 1 — 11
Operating income — 910 28 (4) 934Interest expense — — — — —Investment and other income (expense) — 10 (2) 4 12Equity in net income of subsidiaries 579 11 48 (638) —
Income before income taxes 579 931 74 (638) 946Provision for income taxes — 357 10 — 367
Net income $ 579 $ 574 $ 64 $ (638) $ 579
59

Table of Contents
Consolidated Statements of Comprehensive Income(In millions)
September 25, 2016
Parent/IssuerGuarantorSubsidiaries
Non-guarantorSubsidiaries Eliminations Consolidated Total
Net income $ 507 $ 531 $ 40 $ (571) $ 507Other comprehensive income (loss), net of tax:
Foreign currency translation adjustments — (12) 8 — (4)Other comprehensive income (loss), net of tax — (12) 8 — (4)Comprehensive income $ 507 $ 519 $ 48 $ (571) $ 503
September 27, 2015
Parent/IssuerGuarantorSubsidiaries
Non-guarantorSubsidiaries Eliminations Consolidated Total
Net income $ 536 $ 550 $ 34 $ (584) $ 536Other comprehensive loss, net of tax:
Foreign currency translation adjustments — (7) (14) — (21)Other comprehensive loss, net of tax — (7) (14) — (21)Comprehensive income $ 536 $ 543 $ 20 $ (584) $ 515
September 28, 2014
Parent/IssuerGuarantorSubsidiaries
Non-guarantorSubsidiaries Eliminations Consolidated Total
Net income $ 579 $ 574 $ 64 $ (638) $ 579Other comprehensive loss, net of tax:
Foreign currency translation adjustments — — (8) — (8)Other comprehensive loss, net of tax — — (8) — (8)Comprehensive income $ 579 $ 574 $ 56 $ (638) $ 571
60

Table of Contents
Condensed Consolidated Statements of Cash Flows(In millions)
September 25, 2016
Parent/IssuerGuarantorSubsidiaries
Non-guarantorSubsidiaries Eliminations Consolidated Total
Net cash provided by (used in) operating activities $ (27) $ 1,114 $ 29 $ — $ 1,116Cash flows from investing activities Purchases of property, plant and equipment — (643) (73) — (716)Purchases of available-for-sale securities — (593) — — (593)Sales and maturities of available-for-sale securities — 431 — — 431Purchases of intangible assets — (2) — — (2)Increase in restricted cash — 4 — — 4Payment for purchase of acquired entities, net of cash acquired — — (11) — (11)Intercompany activity 140 — — (140) —Other investing activities — (8) — — (8)
Net cash provided by (used in) investing activities 140 (811) (84) (140) (895)Cash flows from financing activities Purchases of treasury stock (944) — — — (944)Common stock dividends paid (177) — — — (177)Issuance of common stock 19 — — — 19Excess tax benefit related to exercise of team member stock options 4 — — — 4Proceeds from long-term borrowings 999 — — — 999Proceed for revolving line of credit 300 — — — 300Payments on long-term debt and capital lease obligations (306) — — — (306)Intercompany activity — (196) 56 140 —Other financing activities (8) — — — (8)
Net cash provided by (used in) financing activities (113) (196) 56 140 (113)Effect of exchange rate changes on cash and cash equivalents — — 6 — 6Net change in cash and cash equivalents — 107 7 — 114Cash and cash equivalents at beginning of period — 147 90 — 237Cash and cash equivalents at end of period $ — $ 254 $ 97 $ — $ 351
61

Table of Contents
Condensed Consolidated Statements of Cash Flows(In millions)
September 27, 2015
Parent/IssuerGuarantorSubsidiaries
Non-guarantorSubsidiaries Eliminations Consolidated Total
Net cash provided by operating activities $ — $ 1,095 $ 34 $ — $ 1,129Cash flows from investing activities Purchases of property, plant and equipment — (803) (48) — (851)Purchases of available-for-sale securities — (494) — — (494)Sales and maturities of available-for-sale securities — 928 — — 928Purchases of intangible assets — (3) — — (3)Increase in restricted cash — (19) — — (19)Payment for purchase of acquired entities, net of cash acquired — — (4) — (4)Intercompany activity 622 — — (622) —Other investing activities — (12) — — (12)
Net cash provided by (used in) investing activities 622 (403) (52) (622) (455)Cash flows from financing activities Purchases of treasury stock (513) — — — (513)Common stock dividends paid (184) — — — (184)Issuance of common stock 66 — — — 66Excess tax benefit related to exercise of team member stock options 11 — — — 11Proceeds from long-term borrowings — — — — —Proceeds from revolving line of credit — — — — —Payments on long-term debt and capital lease obligations (1) — — — (1)Intercompany activity — (641) 19 622 —Other financing activities (1) — — — (1)
Net cash provided by (used in) financing activities (622) (641) 19 622 (622)Effect of exchange rate changes on cash and cash equivalents — — (5) — (5)Net change in cash and cash equivalents — 51 (4) — 47Cash and cash equivalents at beginning of period — 96 94 — 190Cash and cash equivalents at end of period $ — $ 147 $ 90 $ — $ 237
62

Table of Contents
Condensed Consolidated Statements of Cash Flows(In millions)
September 28, 2014
Parent/IssuerGuarantorSubsidiaries
Non-guarantorSubsidiaries Eliminations Consolidated Total
Net cash provided by operating activities $ — $ 977 $ 111 $ — $ 1,088Cash flows from investing activities Purchases of property, plant and equipment — (623) (87) — (710)Purchases of available-for-sale securities — (720) — — (720)Sales and maturities of available-for-sale securities — 1,054 — — 1,054Purchases of intangible assets — (20) — — (20)Decrease in restricted cash — 2 — — 2Payment for purchase of acquired entities, net of cash acquired — (32) (41) — (73)Intercompany activity 698 — — (698) —Other investing activities — (17) — — (17)
Net cash provided by (used in) investing activities 698 (356) (128) (698) (484)Cash flows from financing activities Purchases of treasury stock (578) — — — (578)Common stock dividends paid (170) — — — (170)Issuance of common stock 42 — — — 42Excess tax benefit related to exercise of team member stock options 9 — — — 9Proceeds from long-term borrowings — — — — —Proceeds from revolving line of credit — — — — —Payments on long-term debt and capital lease obligations (1) — — — (1)Intercompany activity — (730) 32 698 —Other financing activities — — — — —
Net cash provided by (used in) financing activities (698) (730) 32 698 (698)Effect of exchange rate changes on cash and cash equivalents — — (6) — (6)Net change in cash and cash equivalents — (109) 9 — (100)Cash and cash equivalents at beginning of period — 205 85 — 290Cash and cash equivalents at end of period $ — $ 96 $ 94 $ — $ 190
(18) Subsequent EventsSubsequent to the end of fiscal year 2016, the Company announced certain structure and leadership changes including the resignation of Walter Robb, theCompany’s Co-Chief Executive Officer effective December 31, 2016. In the first quarter of fiscal year 2017, the Company expects to incur a charge ofapproximately $13 million associated with Mr. Robb’s separation agreement. Mr. Robb will remain on the Company’s Board of Directors and will serve as asenior advisor of the Company from January 1, 2017 to September 24, 2017.
Item 9. Changes in and Disagreements with Accountants on Accounting and Financial Disclosure.
None.
Item 9A. Controls and Procedures.
Evaluation of Disclosure Controls and ProceduresThe Company’s management, with the participation of the Company’s co-Chief Executive Officers and Chief Financial Officer, has evaluated the effectiveness ofthe Company’s disclosure controls and procedures (as defined in Rules 13a-15(e) and 15d-15(e) under the Securities Exchange Act of 1934, as amended (the“Exchange Act”)) as of the end of the period covered by this report. Based on such evaluation, the Company’s co-Chief Executive Officers and Chief FinancialOfficer have concluded that, as of the end of such period, the Company’s disclosure controls and procedures were effective as of the end of the period covered bythis report.
63

Table of Contents
Changes in Internal Control over Financial ReportingThere have been no changes in the Company’s internal control over financial reporting (as defined in Rules 13a-15(f) and 15d-15(f) under the Exchange Act)during the most recently completed fiscal quarter that have materially affected, or are reasonably likely to materially affect, the Company’s internal control overfinancial reporting.
Management’s Report on Internal Control over Financial ReportingThe Company’s management is responsible for establishing and maintaining adequate internal control over financial reporting as defined in Rules 13a-15(f) and15d-15(f) under the Exchange Act.
Because of its inherent limitations, internal control over financial reporting may not prevent or detect misstatements. Also, projections of any evaluation ofeffectiveness to future periods are subject to the risk that controls may become inadequate because of changes in conditions, or that the degree of compliance withthe policies or procedures may deteriorate.
Under the supervision and with the participation of the Company’s management, including our principal executive officers and principal financial officer, theCompany conducted an evaluation of the effectiveness of its internal control over financial reporting based on criteria established in the framework in InternalControl – Integrated Framework issued by the Committee of Sponsoring Organizations of the Treadway Commission (2013 framework). Based on this evaluation,the Company’s management concluded that its internal control over financial reporting was effective as of September 25, 2016 .
The Company’s independent registered public accounting firm, Ernst & Young LLP, audited the effectiveness of our internal control over financial reporting. Ernst& Young LLP has issued their attestation report which is included in “Item 8. Financial Statements and Supplementary Data” of this Report on Form 10-K.
Item 9B. Other Information.
Not applicable.
64

Table of Contents
PART III
Item 10. Directors, Executive Officers and Corporate Governance.
The information required by this item about our Company’s Executive Officers is included in Part I, “Item 1. Business,” of this Report on Form 10-K under thecaption “Executive Officers of the Registrant.” All other information required by this item is incorporated herein by reference from the registrant’s definitive ProxyStatement for the Annual Meeting of Shareholders to be held February 17, 2017 to be filed with the Commission pursuant to Regulation 14A (“Proxy Statement”).
The Company has adopted a Code of Business Conduct (the “Code”) for all team members and directors pursuant to section 406 of the Sarbanes-Oxley Act. Acopy of the Code is publicly available on our Whole Foods Market website at http://investor.wholefoodsmarket.com/investors/corporate-governance/governance-documents/default.aspx and the Company will provide disclosure of future updates, amendments or waivers by posting them to our website. The Code applies tothe Company’s principal executive officers, principal financial officer, principal accounting officer, controller and other persons who perform similar functions forthe Company, in addition to the corporate directors and employees of the Company. The information contained on our website is not incorporated by reference intothis Report on Form 10-K.
Item 11. Executive Compensation.
The information required by this item is incorporated herein by reference from the registrant’s Proxy Statement.
Item 12. Security Ownership of Certain Beneficial Owners and Management and Related Stockholder Matters.
The following table summarizes information about the Company’s equity compensation plans by type as of September 25, 2016 (in millions, except per shareamounts):
Plan category
Number of securities to be issuedupon exercise of outstanding
options Weighted average exercise price
of outstanding options
Number of securities remainingavailable for future issuance
under equity compensation plans(excluding securities reflected in
column (a)) (a) (b) (c)
Approved by security holders (1) 26.3 $ 39.35 30.8Not approved by security holders — — —Total 26.3 $ 39.35 30.8(1) The number in column (c) reflects (1) 29.8 million shares under the 2009 Stock Incentive Plan and (2) one million shares under the 2007 Team Member StockPurchase Plan.
All other information required by this item is incorporated herein by reference from the registrant’s Proxy Statement.
Item 13. Certain Relationships and Related Transactions, and Director Independence.
The information required by this item is incorporated herein by reference from the registrant’s Proxy Statement.
Item 14. Principal Accounting Fees and Services.
The information required by this item is incorporated herein by reference from the registrant’s Proxy Statement.
65

Table of Contents
PART IV
Item 15. Exhibits, Financial Statement Schedules.
(a) The following documents are filed as part of this report: (1) Consolidated Financial Statements: See Item 8. Financial Statements and Supplementary Data. (2) Financial statement schedules: No schedules are required. (3) Exhibits are incorporated herein by reference or are filed with this report as indicated below. (b) Exhibits: 3.1 Amended and Restated Articles of Incorporation of the Registrant, dated September 15, 2015 (14)3.2 Amended and Restated By-laws of the Registrant adopted June 26, 2015 (3)4.1 Amended and Restated Indenture, dated as of September 8, 2016, between the Registrant and U.S. Bank National Association, as Trustee (5)4.2 First Supplemental Indenture, dated December 3, 2015, among Registrant, the Guarantors, and U.S. Bank National Association (4)4.3 Form of 5.200% Senior Notes due 2025 (included in Exhibit 4.2) (4)10.1 2009 Stock Incentive Plan (1)10.2 2007 Team Member Stock Purchase Plan (10)10.3 Form of Executive Retention Plan and Non-Compete Arrangement by and between the executive leadership team of the Registrant and the
Registrant (12)10.4 Form of Director & Officer Indemnification Agreement (2)10.5 Agreement for Distribution of Products by and between Whole Foods Market Distribution, Inc. and United Natural Foods, Inc. (Portions of this
agreement have been omitted pursuant to a request for confidential treatment filed with the Securities and Exchange Commission) (9)10.6 Form of Non-Qualified Stock Option Agreement for WFLN and Directors under the 2009 Stock Incentive Plan (7)10.7 Form of Non-Qualified Stock Option Agreement for U.S. WFLN and Directors under the 2009 Stock Incentive Plan (8)10.8 Form of Non-Qualified Stock Option Agreement for U.S. WFLN and Directors under the 2009 Stock Incentive Plan (10)10.9 Form of Restricted Share Award Agreement under the 2009 Stock Incentive Plan (13)10.10 Form of Restricted Share Award Agreement under the 2009 Stock Incentive Plan (15)10.11 Separation, Advisory and Noncompetition Agreement, dated as of November 2, 2016, by and between Whole Foods Market, Inc. and Walter Robb
(6)10.12 Amendment to the Whole Foods Executive Retention Plan and Non-Compete Arrangement Agreement, dated as of November 2, 2016, by and
between Whole Foods Market Services, Inc. and Walter Robb (6)10.13 Registration Rights Agreement, dated December 3, 2015, among Registrant, the Guarantors and J.P. Morgan Securities LLC and Morgan Stanley &
Co. LLC, as representatives of the several Initial Purchasers (4)10.14 Credit Agreement, dated as of November 2, 2015, among Registrant, the lenders party thereto, JPMorgan Chase Bank, N.A. as administrative
agent, and J.P. Morgan Securities LLC, as sole bookrunner and lead arranger (9)10.15 Amendment No. 1 to Credit Agreement, dated as of December 22, 2015 (9)10.16 Amendment No. 2 to Credit Agreement, dated as of May 2, 2016 (10)10.17 Amendment No. 3 to Credit Agreement, dated as of November 3, 2016 (15)12.1 Computation of Ratio of Earnings to Fixed Charges (15)21.1 Subsidiaries of the Registrant (15)23.1 Consent of Ernst & Young LLP (15)31.1 Certification by Co-Chief Executive Officer pursuant to 17 CFR 240.13a-14(a) (15)31.2 Certification by Co-Chief Executive Officer pursuant to 17 CFR 240.13a-14(a) (15)31.3 Certification by Chief Financial Officer pursuant to 17 CFR 240.13a-14(a) (15)32.1 Certification by Co-Chief Executive Officer pursuant to 18 U.S.C. Section 1350 (16)32.2 Certification by Co-Chief Executive Officer pursuant to 18 U.S.C. Section 1350 (16)32.3 Certification by Chief Financial Officer pursuant to 18 U.S.C. Section 1350 (16)
66

Table of Contents
101 The following financial information from the Company’s Annual Report on Form 10-K, for the period ended September 25, 2016, formatted ineXtensible Business Reporting Language: (i) Consolidated Balance Sheets, (ii) Consolidated Statements of Operations, (iii) ConsolidatedStatements of Comprehensive Income, (iv) Consolidated Statements of Shareholders’ Equity, (v) Consolidated Statements of Cash Flows, (vi)Notes to Consolidated Financial Statements (15)
(1) Filed as an exhibit to Registrant’s Form S-8 filed May 31, 2013 and incorporated herein by reference. (2) Filed as an exhibit to Registrant’s Form 8-K filed April 16, 2009 and incorporated herein by reference. (3) Filed as an exhibit to Registrant’s Form 8-K filed June 29, 2015 and incorporated herein by reference. (4) Filed as an exhibit to Registrant’s Form 8-K filed December 4, 2015 and incorporated herein by reference (5) Filed as an exhibit to Registrant’s Form 8-K filed September 9, 2016 and incorporated herein by reference (6) Filed as an exhibit to Registrant’s Form 8-K filed November 2, 2016 and incorporated herein by reference (7) Filed as an exhibit to Registrant’s Form 10-Q for the period ended July 7, 2013 filed August 9, 2013 and incorporated herein by reference. (8) Filed as an exhibit to Registrant’s Form 10-Q for the period ended July 6, 2014 filed August 8, 2014 and incorporated herein by reference.
(9) Filed as an exhibit to Registrant’s Form 10-Q for the period ended January 17, 2016 filed February 26, 2016 and incorporated herein by
reference. (10) Filed as an exhibit to Registrant’s Form 10-Q for the period ended April 10, 2016 filed May 13, 2016 and incorporated herein by reference.
(11) Filed as an exhibit to Registrant’s Form 10-K for the period ended September 24, 2006 filed December 8, 2006 and incorporated herein by
reference.
(12) Filed as an exhibit to Registrant’s Form 10-K for the period ended September 30, 2012 filed November 21, 2012 and incorporated herein by
reference.
(13) Filed as an exhibit to Registrant’s Form 10-K for the period ended September 29, 2013 filed November 22, 2013 and incorporated herein by
reference.
(14) Filed as an exhibit to Registrant’s Form 10-K for the period ended September 27, 2015 filed November 13, 2015 and incorporated herein by
reference (15) Filed herewith. (16) Furnished herewith.
67

Table of Contents
SIGNATURES
Pursuant to the requirements of Section 13 or 15(d) of the Securities Exchange Act of 1934, the registrant has duly caused this report to be signed on its behalf bythe undersigned thereunto duly authorized.
WHOLE FOODS MARKET, INC.
Date: November 18, 2016 By: /s/ Glenda Flanagan Glenda Flanagan Executive Vice President and Chief Financial Officer
Pursuant to the requirements of the Securities Exchange Act of 1934, this report has been signed below by the following persons on behalf of the registrant and inthe capacities indicated on November 18, 2016 .
Name Title /s/ John Mackey Co-Chief Executive Officer and DirectorJohn Mackey (Principal Executive Officer) /s/ Walter Robb Co-Chief Executive Officer and DirectorWalter Robb (Principal Executive Officer) /s/ Glenda Flanagan Executive Vice President and Chief Financial OfficerGlenda Flanagan (Principal Financial and Accounting Officer) /s/ Dr. John B. Elstrott Chairman of the BoardDr. John B. Elstrott /s/ Shahid M. Hassan DirectorShahid M. Hassan /s/ Stephanie Kugelman DirectorStephanie Kugelman /s/ Jonathan A. Seiffer DirectorJonathan A. Seiffer /s/ Morris J. Siegel DirectorMorris J. Siegel /s/ Jonathan D. Sokoloff DirectorJonathan D. Sokoloff /s/ Dr. Ralph Z. Sorenson DirectorDr. Ralph Z. Sorenson /s/ Gabrielle Sulzberger DirectorGabrielle Sulzberger /s/ William A. Tindell DirectorWilliam A. Tindell

68

Exhibit 10.10
WHOLE FOODS MARKET2009 STOCK INCENTIVE PLAN
RESTRICTED SHARE AWARD AGREEMENT
RECITALS
A. Whole Foods Market, Inc. (the “ Company”) has adopted the Whole Foods Market 2009 Stock Incentive Plan (the “ Plan”) for the purpose ofattracting and retaining the services of selected Team Members, Directors, and Consultants who contribute to the Company’s success by their ability, ingenuity,and industry and enabling such individuals to participate in the long-term success and growth of the Company by giving them a proprietary interest in theCompany through the grant of certain equity-based Awards.
B. Pursuant to Section 3.2 of the Plan, the Compensation Committee of the Board of Directors (the “ Committee”), in its capacity as Plan Administratorof the Plan, is authorized, in its sole and absolute discretion, to determine those Team Members, Directors and Consultants to whom Awards will be granted underthe Plan.
C. Grantee is expected to render substantial future services to the Company, and this Restricted Share Award Agreement (this “ Agreement”) isexecuted pursuant to, and is intended to carry out the purposes of, the Plan.
D. All capitalized terms in this Agreement shall have the meaning assigned to them in the Plan.
NOW, THEREFORE, it is hereby agreed as follows:
1. Award of Restricted Shares . The Company hereby grants to Grantee an Award of Restricted Shares. Restricted Shares are shares ofCommon Stock of the Company that are subject to restrictions, as set forth in this Agreement, until vested.
Grantee :
Award Date :
Number of Restricted Shares under Award :
Restrictions on Shares . Except as otherwise provided in the Plan and this Agreement, the restrictions on the Grantee’s unvested Restricted Shares are thatthe Shares shall be subject to forfeiture by the Grantee if the Grantee ceases to provide continuous service to the Company prior to the Vesting Date,except as specifically set forth below.
Vesting : The Restricted Shares shall vest, and the restrictions on such Shares shall lapse, in accordance with the following schedule:
25% of the original grant shall vest on the first anniversary of the Date of Grant, rounded up to the nearest wholeshare;25% of the original grant shall vest on the second anniversary of the Date of Grant, rounded up to the nearest wholeshare;25% of the original grant shall vest on the third anniversary of the Date of Grant, rounded up to the nearest wholeshare;the remaining shares shall vest on the fourth anniversary of the Date of Grant.
Notwithstanding the foregoing, all unvested Restricted Shares shall vest, and the restrictions on such Shares shall lapse, immediately upon Disability ordeath. Furthermore, notwithstanding the foregoing, in the event that the Grantee’s employment or service with the Company is terminated for any reasonother than death, Disability, or Cause, and the Company and the Grantee have entered or do enter into a separation agreement the terms of which providefor immediate or accelerated vesting of the Restricted Shares, then notwithstanding such termination of employment or service and notwithstanding theterms of any such separation agreement, the unvested Restricted Shares, if any, shall not become

immediately vested or have accelerated vesting but instead shall continue to vest on the dates and in the amounts set forth above, but only so long as theGrantee complies with the terms of such separation agreement (including any restrictive covenants therein). If the Grantee does not comply with the termsof such separation agreement (including any restrictive covenants therein), the Restricted Shares shall cease to vest on the first date on which theCommittee makes a determination of such noncompliance.
Shares Issued . The Company shall evidence the issuance of the Restricted Shares by book-entry registration or issuance of a certificate in the name ofGrantee for the number of Restricted Shares issued pursuant to this Agreement. If Restricted Shares are evidenced by book-entry registration, theCompany shall notate the restrictions on such Shares until the restrictions thereon have lapsed. If Restricted Shares are evidenced by certificates, theyshall be held in the custody of the Company (or an escrow agent designated by the Company) (the “ EscrowHolder”) until the restrictions thereon havelapsed and Grantee shall be required to submit all documents required by the Company or the Plan Administrator, including, without limitation, a stockpower, endorsed in blank, relating to the Shares covered by this Award. Upon the lapse of the restrictions, the Escrow Holder shall deliver to Grantee (orhis or her personal representative, estate or heirs, as the case may be) certificates for the vested Shares.
Stop-Transfer Instructions . Grantee acknowledges that to ensure compliance with the restrictions imposed by the Plan and this Agreement, the Companymay issue appropriate “stop-transfer” instructions to its transfer agent, if any, and if the Company transfers its own securities, it may make appropriatenotations to the same effect in its own records.
Refusal to Transfer . Grantee acknowledges that the Company will not be required to transfer on its books any Shares that have been sold or otherwisetransferred in violation of any of the provisions of the Plan or this Agreement or to treat as owner of such Shares, or to accord the right to vote or paydividends to, any purchaser or other transferee to whom such Shares have been so transferred.
1. Tax Reporting . The Company shall issue to Grantee a Form 1099, or its equivalent reflecting the amount to be reported by Grantee ascompensation income for the calendar year(s) in which all or any portion of the Restricted Shares vest or, if applicable, the calendar year with respect to whichGrantee makes a timely Section 83(b) Election with respect to all or a portion of such Restricted Shares.
2. Compliance with Laws and Regulations . Notwithstanding any other provision of the Plan or the Agreement to the contrary, the grant,vesting and holding of the Shares by Grantee is expressly conditioned upon compliance with the Securities Act and all applicable state securities laws. Granteeagrees to cooperate with the Company to ensure compliance with such laws.
3. Representations and Warranties of Grantee . Grantee represents and warrants to the Company that Grantee has received a copy of the Planand has read and understands the terms of the Plan and this Agreement, and agrees to be bound by their terms and conditions. Grantee acknowledges that there maybe adverse tax consequences upon the vesting of Restricted Shares or disposition of the Shares once vested, and that Grantee should consult a tax advisor prior tosuch time.
4. Restrictions on Transfer . Grantee may not sell, assign, pledge as security or otherwise transfer or encumber the unvested Restricted Shares,whether voluntary or involuntary, and if involuntary, whether by process of law in any civil or criminal suit, action or proceeding, whether in the nature of aninsolvency or bankruptcy proceeding or otherwise.
5. No Right to Continue Service . Nothing in the Plan or this Agreement shall confer on Grantee any right to continue in the service of, orrelationship with, the Company, or limit in any way the right of the Company to terminate Grantee’s service at any time, with or without cause.
6. Tax Consequences . Set forth below is a brief summary as of the Award Date of some of the federal and state tax consequences of this Awardof Restricted Shares. THIS SUMMARY IS NECESSARILY INCOMPLETE, AND THE TAX LAWS AND REGULATIONS ARE SUBJECT TO CHANGE.GRANTEE SHOULD CONSULT A TAX ADVISOR BEFORE ACCEPTING THIS AWARD.
(a) Lapse of Restrictions . Except to the extent a proper election under Code Section 83(b) has been made, the excess of the Fair MarketValue of the Shares on the date on which the restrictions lapse over the aggregate Purchase Price paid for the Shares, if any, shall be includible ascompensation income (taxable at ordinary income tax rates) in the Grantee’s taxable income for the calendar year in which the restrictions lapse. In theevent a proper Section 83(b) election has been made, the Grantee shall include as compensation income in the Grantee’s taxable income for the calendaryear in which the Restricted Shares were transferred to Grantee an amount equal to the excess of the Fair Market Value of the

Shares on the date on which the Restricted Shares were transferred over the aggregate Purchase Price paid for the Shares, if any.
(b) Holding Restricted Shares . There may be a regular federal and state income tax liability resulting from holding Restricted Shares.Except to the extent a proper election under Code Section 83(b) has been made, Grantee will be treated as having received income (taxable at ordinaryincome tax rates) equal to the dividends or other income paid with respect to Restricted Shares granted under this Agreement. In the event a proper Section83(b) election has been made, or following the lapse of the restrictions described in this Agreement, the Grantee shall be treated as having received income(taxable at income tax rates applicable to dividends) equal to the dividends or other income paid with respect to Restricted Shares granted under thisAgreement.
(c) Disposition of Shares . Any gain realized on disposition of Shares held for more than twelve (12) months following the Award Datewhen a Code Section 83(b) election has been made and more than twelve (12) months following the Vesting Date when no Code Section 83(b) electionhas been made will be treated as long-term capital gain.
7. Privileges of Stock Ownership and Repayment of Dividends . Except as otherwise provided herein, commencing upon the date theCompany transfers Restricted Shares to Grantee, Grantee shall have all the rights of a shareholder of the Company with respect to the Restricted Shares representedby share certificates registered in his name, including the right to vote such Restricted Shares and receive dividends and other distributions paid or made withrespect to such Restricted Shares. Any dividends payable during the vesting period of this Agreement will be paid on the same schedule as other dividendpayments made to all shareholders of record. So long as the Restricted Shares are held in escrow by the Company, dividends will be paid to Grantee’s account ofrecord with the transfer agent. For any Restricted Shares that are unvested (and not accelerated or subject to continued vesting, as provided in Section 1 above) atthe time Grantee ceases to provide continuous service to the Company, Grantee will be required to repay to the Company all prior related dividends on or beforethe 30th day following such termination of continuous service. For any Restricted Shares that are subject to continued vesting after the time that Grantee ceases toprovide continuous service to the Company, as provided in Section 1 above, and that subsequently cease to vest, Grantee will be required to repay to the Companyall prior related dividends on or before the 30 th day following the date on which vesting ceases. To the extent permitted under applicable law, the Company mayoffset amounts that the Company owes Grantee at such time by the amount of such prior related dividends.
8. Interpretation . Any dispute regarding the interpretation of this Agreement shall be submitted by Grantee or the Company to the PlanAdministrator for review. The resolution of such a dispute by the Plan Administrator shall be final and binding on the Company and Grantee.
9. Entire Agreement . This Agreement is subject to the terms of the Plan, which is incorporated herein by reference. This Agreement and thePlan constitute the entire agreement of the parties and supersede all prior undertakings and agreements with respect to the subject matter hereof. If anyinconsistency should exist between the nondiscretionary terms and conditions of this Agreement and the Plan, the Plan shall govern and control.
10. Notices . Any notice required to be given or delivered to the Company under the terms of this Agreement shall be in writing and addressed tothe Corporate Secretary of the Company at its principal corporate offices. Any notice required to be given or delivered to Grantee shall be in writing and addressedto Grantee at the address indicated below or to such other address as such party may designate in writing from time to time to the Company. All notices shall bedeemed to have been given or delivered upon: (a) personal delivery; (b) five (5) days after deposit in the United States mail by certified or registered mail (returnreceipt requested); (c) one (1) business day after deposit with any return receipt express courier (prepaid); or (d) one (1) business day after transmission byfacsimile or telecopier.
11. Successors and Assigns . The Company may assign any of its rights or obligations under this Agreement. This Agreement shall be bindingupon and inure to the benefit of the successors and assigns of the Company. Subject to the restrictions on transfer set forth herein, this Agreement shall be bindingupon Grantee’s transferees.
12. Governing Law . This Agreement shall be governed by and construed in accordance with the laws of the State of Texas without givingeffect to its conflict of law principles. If any provision of this Agreement is determined by a court of law to be illegal or unenforceable, then such provision will beenforced to the maximum extent possible and the other provisions will remain fully effective and enforceable.
IN WITNESS WHEREOF, the Company has caused this Agreement to be executed in duplicate by its duly authorized representative and Grantee hasexecuted this Agreement in duplicate, effective as of the Award Date.

WHOLE FOODS MARKET, INC.
By: _______________________________________ Name:Title:
GRANTEE
By: _______________________________________
Address:

Exhibit 10.17
AMENDMENT NO. 3TO
CREDIT AGREEMENT
THIS AMENDMENT NO. 3 TO CREDIT AGREEMENT (this “ Amendment ”), dated as of November 3, 2016 (the “ Amendment No. 3Effective Date ”), is entered into by and among Whole Foods Market, Inc., as the Borrower, the Lenders party hereto and JPMorgan Chase Bank, N.A., as theAdministrative Agent, Issuing Bank and Swingline Lender. Capitalized terms used but not otherwise defined herein shall have the meanings given to them in theCredit Agreement referenced below.
WITNESSETHWHEREAS, the Borrower, the Lenders and the Administrative Agent are parties to that certain Credit Agreement, dated as of November 2, 2015
(the “ Existing Credit Agreement ”, as amended by Amendment No. 1 to Credit Agreement, dated as of December 22, 2015, as amended by Amendment No. 2 toCredit Agreement, dated as of May 2, 2016 and as may be further amended, restated, supplemented or otherwise modified from time to time (including by thisAmendment), the “ Credit Agreement ”);
WHEREAS, the Borrower has requested that the Required Lenders and the Administrative Agent agree to certain amendments to the ExistingCredit Agreement; and
WHEREAS, the Lenders party hereto and the Administrative Agent have agreed to such amendments on the terms and conditions set forthherein;
NOW, THEREFORE, in consideration of the premises set forth above, the terms and conditions contained herein, and other good and valuableconsideration, the receipt and sufficiency of which are hereby acknowledged, the parties hereto hereby agree as follows:
Section 1. Amendments to Existing Credit Agreement . Subject to the satisfaction of the conditions precedent set forth in Section 2 below,the parties hereto agree that the Existing Credit Agreement is hereby amended as follows:
Section 5.01(d) of the Existing Credit Agreement is hereby amended and restated in its entirety to read as follows:
“(d) as soon as available, but in any event within seven (7) calendar days after the public issuance by the Borrower of its earnings release for the last fiscalquarter of each fiscal year of the Borrower, a copy of the plan and forecast (including a projected consolidated and consolidating balance sheet, incomestatement and funds flow statement) (collectively, the “ Projections ”) of the Borrower for each quarter of the upcoming fiscal year in form reasonablysatisfactory to the Administrative Agent;”
Section 2. Conditions of Effectiveness . This Amendment shall become effective on the Amendment No. 3 Effective Date upon the receiptby the Administrative Agent of counterparts to this Amendment duly executed by each of the Borrower, the Required Lenders and the Administrative Agent andwith the consent and reaffirmation attached hereto duly executed by each of the Subsidiary Guarantors.
Section 3. Representations and Warranties of the Borrower . The Borrower hereby represents and warrants as follows:(a) This Amendment has been duly executed and delivered by it and constitutes its legal, valid and binding obligation, enforceable in
accordance with its terms, subject to applicable bankruptcy, insolvency, moratorium or other laws affecting creditors’ rights generally and subject to generalprinciples of equity, regardless of whether considered in a proceeding at law or in equity.
(b) Immediately after giving effect to this Amendment, the representations and warranties of the Borrower set forth in the Credit Agreementare true and correct in all material respects (except for any representation and warranty that is qualified by materiality or reference to Material Adverse Effect,which such representation and warranty shall be true and correct in all respects), on and as of the date hereof, except to the extent any such representation orwarranty is stated to relate solely to an earlier date, in which case such representation or warranty is true and correct in all material respects (except for anyrepresentation and warranty that is qualified by materiality or reference to Material Adverse Effect, which such representation and warranty shall be true andcorrect in all respects) on and as of such earlier date.
(c) Immediately before and after giving effect to this Amendment, no Default or Event of Default shall exist.Section 4. Effect on Credit Agreement .

(a) Upon the effectiveness of this Amendment, on and after the date hereof, each reference in the Credit Agreement to “this Agreement,”“hereunder,” “hereof,” “herein” or words of like import shall mean and be a reference to such Agreement, as amended and modified hereby.
(b) Except as specifically amended and modified above, the Credit Agreement and all other documents, instruments and agreements executedand/or delivered in connection therewith shall remain in full force and effect, and are hereby ratified and confirmed.
(c) The execution, delivery and effectiveness of this Amendment shall neither, except as expressly provided herein, operate as a waiver of anyright, power or remedy of the Administrative Agent or any Lender, nor constitute a waiver of any provision of the Credit Agreement or any other documents,instruments and agreements executed and/or delivered in connection therewith.
(d) This Amendment shall be deemed to be a Loan Document.Section 5. Governing Law . This Amendment shall be governed by and construed in accordance with THE LAWS of the State of new
york.Section 6. Headings . Section headings in this Amendment are included herein for convenience of reference only and shall not constitute a
part of this Amendment for any other purpose.Section 7. Counterparts . This Amendment may be executed by one or more of the parties to this Amendment on any number of separate
counterparts and all of said counterparts taken together shall be deemed to constitute one and the same instrument. A facsimile or PDF copy of any signature heretoshall have the same effect as the original thereof.
[The remainder of this page is intentionally blank.]

IN WITNESS WHEREOF, this Amendment has been duly executed as of the day and year first above written.
BORROWER :
WHOLE FOODS MARKET, INC., as the Borrower
By: /s/ Glenda Flanagan Name: Glenda Flanagan Title: Executive Vice President and Chief Financial Officer
Signature Page to WFM Amendment No. 3

JPMORGAN CHASE BANK, N.A., as Administrative Agent, the IssuingBank, the Swingline Lender and a Lender
By: /s/ Laurie C. Tuzo Name: Laurie C. Tuzo Title: Managing Director
Signature Page to WFM Amendment No. 3

WELLS FARGO BANK, NATIONALASSOCIATION,as a Lender
By: /s/ Susan L. Coulter
Name: Susan L. Coulter
Title: Senior Vice President
Signature Page to WFM Amendment No. 3

BANK OF AMERICA, N.A.,as a Lender
By: /s/ Daniel H. Blakely
Name: Daniel H. Blakely
Title: Associate
Signature Page to WFM Amendment No. 3

MORGAN STANLEY BANK, N.A.,as a Lender
By: /s/ Lisa Vieira
Name: Lisa Vieira
Title: Authorized Signatory
Signature Page to WFM Amendment No. 3

ROYAL BANK OF CANADA,as a Lender
By: /s/ Janie Xie
Name: Janie Xie
Title: Vice President
Signature Page to WFM Amendment No. 3

U.S. BANK NATIONAL ASSOCIATION,as a Lender
By: /s/ Mark D. Rodgers
Name: Mark D. Rodgers
Title: Vice President
Signature Page to WFM Amendment No. 3

GOLDMAN SACHS BANK USA,as a Lender
By: /s/ Mehmet Barlas
Name: Mehmet Barlas
Title: Authorized Sigantory
Signature Page to WFM Amendment No. 3

CONSENT AND REAFFIRMATION
Each of the undersigned hereby (i) acknowledges receipt of a copy of Amendment No. 3 to Credit Agreement (the “ Amendment ”); (ii) consents to theBorrower’s execution and delivery of the Amendment; (iii) agrees to be bound by the Amendment; and (iv) reaffirms that the Subsidiary Guaranty and the otherLoan Documents to which it is a party shall continue to remain in full force and effect.
SUBSIDIARY GUARANTORS :
WHOLE FOODS MARKET CALIFORNIA, INC., aCalifornia corporation
By: /s/ Glenda Flanagan
Name: Glenda Flanagan
Title: Assistant Secretary
WHOLE FOODS MARKET PACIFIC NORTHWEST,INC., a Delaware corporation
By: /s/ Glenda Flanagan
Name: Glenda Flanagan
Title: Assistant Secretary
MRS. GOOCH'S NATURAL FOOD MARKETS, INC.,a California corporation
By: /s/ Glenda Flanagan
Name: Glenda Flanagan
Title: Assistant Secretary
Signature Page to WFM Amendment No. 3

WHOLE FOODS MARKET ROCKYMOUNTAIN/SOUTHWEST, L.P., a Texas limitedpartnership
By: WHOLE FOODS MARKET ROCKYMOUNTAIN/SOUTHWEST I, INC., it's generalpartner
By: /s/ Glenda Flanagan
Name: Glenda Flanagan
Title: Assistant Secretary
WHOLE FOODS MARKET GROUP, INC., a Delawarecorporation
By: /s/ Glenda Flanagan
Name: Glenda Flanagan
Title: Assistant Secretary
WFM-WO, Inc., a Delaware corporation
By: /s/ Glenda Flanagan
Name: Glenda Flanagan
Title: Assistant Secretary
WHOLE FOODS MARKET SERVICES, INC., a Delawarecorporation
By: /s/ Glenda Flanagan
Name: Glenda Flanagan
Title: Assistant Secretary
Signature Page to WFM Amendment No. 3

WHOLE FOODS MARKET IP, L.P., a Delawarelimited partnership
By: WHOLE FOODS MARKET ROCKYMOUNTAIN/SOUTHWEST I, INC., it's generalpartner
By: /s/ Glenda Flanagan
Name: Glenda Flanagan
Title: Assistant Secretary
WFM NORTHERN NEVADA, INC., a Delawarecorporation
By: /s/ Glenda Flanagan
Name: Glenda Flanagan
Title: Assistant Secretary
WFM SOUTHERN NEVADA, INC., a Delawarecorporation
By: /s/ Albert Percival
Name: Albert Percival
Title: Assistant Secretary
WFM HAWAII, LLC, a Hawaii limited liabilitycompany
By: MRS. GOOCH'S NATURAL FOODMARKETS, INC., its sole member
By: /s/ Glenda Flanagan
Name: Glenda Flanagan
Title: Assistant Secretary
Signature Page to WFM Amendment No. 3

WFM KANSAS, LLC, a Kansas limited liability company
By: WHOLE FOODS MARKET ROCKYMOUNTAIN/SOUTHWEST, LP., its solemember
By: WHOLE FOODS MARKET ROCKYMOUNTAIN
By: /s/ Glenda Flanagan
Name: Glenda Flanagan
Title: Assistant Secretary

Signature Page to WFM Amendment No. 3

Exhibit 12.1
Whole Foods Market, Inc.Computation of Ratio of Earnings to Fixed Charges(In millions, except ratio data)
September 25,
2016 September 27,
2015 September 28,
2014 September 29,
2013 September 30,
2012
Earnings: Income before income taxes $ 827 $ 878 $ 946 $ 752 $ 552 Rent expense 477 441 407 353 322 x 1/3 x 1/3 x 1/3 x 1/3 x 1/3One-third of rent expense 159 147 136 125 118Interest expense 41 — — — 4Fixed charges to add to earnings 200 147 136 125 122Total available earnings $ 1,027 $ 1,025 $ 1,082 $ 877 $ 674 Fixed charges: Interest expense $ 41 $ — $ — $ — $ 4Capitalized interest 3 — — 1 3Total interest 44 — — 1 7One-third of rent expense 159 147 136 125 118Total fixed charges $ 203 $ 147 $ 136 $ 126 $ 125 Ratio of earnings to fixed charges 5.06x 6.98x 7.97x 8.18x 7.33x

Exhibit 21.1
SUBSIDIARIES OF WHOLE FOODS MARKET, INC.
Name State or Jurisdiction of Incorporation or Organization
Allegro Coffee Company ColoradoBowie Strategic Investments, Inc. DelawareFresh & Wild Holding Limited England and WalesFresh & Wild Limited * England and WalesMrs. Gooch’s Natural Food Markets, Inc. * CaliforniaNature’s Heartland, Inc. MassachusettsThe Sourdough, A European Bakery, Inc. TexasWFM Beverage Corp.* TexasWFM Beverage Holding Company TexasWFM Cobb Properties Investments, LLC DelawareWFM Gift Card, LLC VirginiaWFM Hawaii, LLC* HawaiiWFM Intermediary New England Energy, LLC DelawareWFM IP Investments, Inc. DelawareWFM IP Management, Inc. DelawareWFM Kansas, LLC* KansasWFM Medical and Wellness Centers, Inc. DelawareWFM Nebraska, LLC DelawareWFM Northern Nevada, Inc.* DelawareWFM Online, Inc. DelawareWFM Private Label, L.P. DelawareWFM Private Label Management, Inc. DelawareWFM Procurement Investments, Inc. DelawareWFM Properties Holdings, Inc. DelawareWFM Purchasing, L.P. DelawareWFM Purchasing Management, Inc. DelawareWFM Southern Nevada, Inc.* DelawareWFM-WO, Inc. DelawareWhole Food Company, Inc.* LouisianaWhole Foods Market – WO, Inc. British ColumbiaWhole Foods Market California, Inc.* CaliforniaWhole Foods Market Canada, Inc. CanadaWhole Foods Market Distribution, Inc. DelawareWhole Foods Market Group, Inc.* DelawareWhole Foods Market IP, L.P. DelawareWhole Foods Market Pacific Northwest, Inc.* DelawareWhole Foods Market Procurement, Inc. DelawareWhole Foods Market Rocky Mountain/Southwest, L.P.* TexasWhole Foods Market Rocky Mountain/Southwest I, Inc. DelawareWhole Foods Market Services, Inc. DelawareWhole Foods Market Southwest Investments, Inc. Delaware* Doing business as Whole Foods Market

Exhibit 23.1
Consent of Independent Registered Public Accounting Firm
We consent to the incorporation by reference in the following Registration Statements:
(1) Registration Statement (Form S-3 No. 333-113476) of Whole Foods Market, Inc.,(2) Registration Statement (Form S-3 No. 333-156384) of Whole Foods Market, Inc.,(3) Registration Statement (Form S-3 No. 333-178638) of Whole Foods Market, Inc.,(4) Registration Statement (Form S-4 No. 333-213568) of Whole Foods Market, Inc.,(5) Registration Statement (Form S-8 No. 333-159443) pertaining to the 2009 Stock Incentive Plan, 2007 Team Member Stock Purchase
Plan, and Growing Your Future 401(K) Plan of Whole Foods Market, Inc.,(6) Registration Statement (Form S-8 No. 333-188973) pertaining to the 2009 Stock Incentive Plan and Growing Your Future 401(K) Plan of
Whole Foods Market, Inc., and(7) Registration Statement (Form S-8 No. 333-211345) pertaining to the 2007 Team Member Stock Purchase Plan and Growing Your Future
401(K) Plan of Whole Foods Market, Inc.;
of our reports dated November 18, 2016, with respect to the consolidated financial statements of Whole Foods Market, Inc., and theeffectiveness of internal control over financial reporting of Whole Foods Market, Inc., included in this Annual Report (Form 10-K) for theyear ended September 25, 2016.
/s/ Ernst & Young LLP
Austin, Texas
November 18, 2016

Exhibit 31.1
CERTIFICATIONS
I, John Mackey, certify that:
1. I have reviewed this Annual Report on Form 10-K of Whole Foods Market, Inc.;
2. Based on my knowledge, this report does not contain any untrue statement of a material fact or omit to state a material fact necessary to make the statementsmade, in light of the circumstances under which such statements were made, not misleading with respect to the period covered by this report;
3. Based on my knowledge, the financial statements, and other financial information included in this report, fairly present in all material respects the financialcondition, results of operations and cash flows of the registrant as of, and for, the periods presented in this report;
4. The registrant’s other certifying officer(s) and I are responsible for establishing and maintaining disclosure controls and procedures (as defined in ExchangeAct Rules 13a-15(e) and 15d-15(e)) and internal control over financial reporting (as defined in Exchange Act Rules 13a-15(f) and 15d-15(f)) for the registrantand have:
a. Designed such disclosure controls and procedures, or caused such disclosure controls and procedures to be designed under our supervision, to ensurethat material information relating to the registrant, including its consolidated subsidiaries, is made known to us by others within those entities,particularly during the period in which this report is being prepared;
b. Designed such internal control over financial reporting, or caused such internal control over financial reporting to be designed under our supervision,to provide reasonable assurance regarding the reliability of financial reporting and the preparation of financial statements for external purposes inaccordance with generally accepted accounting principles;
c. Evaluated the effectiveness of the registrant’s disclosure controls and procedures and presented in this report our conclusions about the effectivenessof the disclosure controls and procedures, as of the end of the period covered by this report based on such evaluation; and
d. Disclosed in this report any change in the registrant’s internal control over financial reporting that occurred during the registrant’s most recent fiscalquarter (the registrant’s fourth fiscal quarter in the case of an annual report) that has materially affected, or is reasonably likely to materially affect,the registrant’s internal control over financial reporting; and
5. The registrant’s other certifying officer(s) and I have disclosed, based on our most recent evaluation of internal control over financial reporting, to theregistrant’s auditors and the audit committee of the registrant’s board of directors (or persons performing the equivalent functions):
a. All significant deficiencies and material weaknesses in the design or operation of internal control over financial reporting which are reasonably likelyto adversely affect the registrant’s ability to record, process, summarize and report financial information; and
b. Any fraud, whether or not material, that involves management or other employees who have a significant role in the registrant’s internal control overfinancial reporting.
Date: November 18, 2016
/s/ John MackeyJohn MackeyCo-Chief Executive Officer

Exhibit 31.2
CERTIFICATIONS
I, Walter Robb, certify that:
1. I have reviewed this Annual Report on Form 10-K of Whole Foods Market, Inc.;
2. Based on my knowledge, this report does not contain any untrue statement of a material fact or omit to state a material fact necessary to make the statementsmade, in light of the circumstances under which such statements were made, not misleading with respect to the period covered by this report;
3. Based on my knowledge, the financial statements, and other financial information included in this report, fairly present in all material respects the financialcondition, results of operations and cash flows of the registrant as of, and for, the periods presented in this report;
4. The registrant’s other certifying officer(s) and I are responsible for establishing and maintaining disclosure controls and procedures (as defined in ExchangeAct Rules 13a-15(e) and 15d-15(e)) and internal control over financial reporting (as defined in Exchange Act Rules 13a-15(f) and 15d-15(f)) for the registrantand have:
a. Designed such disclosure controls and procedures, or caused such disclosure controls and procedures to be designed under our supervision, to ensurethat material information relating to the registrant, including its consolidated subsidiaries, is made known to us by others within those entities,particularly during the period in which this report is being prepared;
b. Designed such internal control over financial reporting, or caused such internal control over financial reporting to be designed under our supervision,to provide reasonable assurance regarding the reliability of financial reporting and the preparation of financial statements for external purposes inaccordance with generally accepted accounting principles;
c. Evaluated the effectiveness of the registrant’s disclosure controls and procedures and presented in this report our conclusions about the effectivenessof the disclosure controls and procedures, as of the end of the period covered by this report based on such evaluation; and
d. Disclosed in this report any change in the registrant’s internal control over financial reporting that occurred during the registrant’s most recent fiscalquarter (the registrant’s fourth fiscal quarter in the case of an annual report) that has materially affected, or is reasonably likely to materially affect,the registrant’s internal control over financial reporting; and
5. The registrant’s other certifying officer(s) and I have disclosed, based on our most recent evaluation of internal control over financial reporting, to theregistrant’s auditors and the audit committee of the registrant’s board of directors (or persons performing the equivalent functions):
a. All significant deficiencies and material weaknesses in the design or operation of internal control over financial reporting which are reasonably likelyto adversely affect the registrant’s ability to record, process, summarize and report financial information; and
b. Any fraud, whether or not material, that involves management or other employees who have a significant role in the registrant’s internal control overfinancial reporting.
Date: November 18, 2016
/s/ Walter RobbWalter RobbCo-Chief Executive Officer

Exhibit 31.3
CERTIFICATIONS
I, Glenda Flanagan, certify that:
1. I have reviewed this Annual Report on Form 10-K of Whole Foods Market, Inc.;
2. Based on my knowledge, this report does not contain any untrue statement of a material fact or omit to state a material fact necessary to make the statementsmade, in light of the circumstances under which such statements were made, not misleading with respect to the period covered by this report;
3. Based on my knowledge, the financial statements, and other financial information included in this report, fairly present in all material respects the financialcondition, results of operations and cash flows of the registrant as of, and for, the periods presented in this report;
4. The registrant’s other certifying officer(s) and I are responsible for establishing and maintaining disclosure controls and procedures (as defined in ExchangeAct Rules 13a-15(e) and 15d-15(e)) and internal control over financial reporting (as defined in Exchange Act Rules 13a-15(f) and 15d-15(f)) for the registrantand have:
a. Designed such disclosure controls and procedures, or caused such disclosure controls and procedures to be designed under our supervision, to ensurethat material information relating to the registrant, including its consolidated subsidiaries, is made known to us by others within those entities,particularly during the period in which this report is being prepared;
b. Designed such internal control over financial reporting, or caused such internal control over financial reporting to be designed under our supervision,to provide reasonable assurance regarding the reliability of financial reporting and the preparation of financial statements for external purposes inaccordance with generally accepted accounting principles;
c. Evaluated the effectiveness of the registrant’s disclosure controls and procedures and presented in this report our conclusions about the effectivenessof the disclosure controls and procedures, as of the end of the period covered by this report based on such evaluation; and
d. Disclosed in this report any change in the registrant’s internal control over financial reporting that occurred during the registrant’s most recent fiscalquarter (the registrant’s fourth fiscal quarter in the case of an annual report) that has materially affected, or is reasonably likely to materially affect,the registrant’s internal control over financial reporting; and
5. The registrant’s other certifying officer(s) and I have disclosed, based on our most recent evaluation of internal control over financial reporting, to theregistrant’s auditors and the audit committee of the registrant’s board of directors (or persons performing the equivalent functions):
a. All significant deficiencies and material weaknesses in the design or operation of internal control over financial reporting which are reasonably likelyto adversely affect the registrant’s ability to record, process, summarize and report financial information; and
b. Any fraud, whether or not material, that involves management or other employees who have a significant role in the registrant’s internal control overfinancial reporting.
Date: November 18, 2016
/s/ Glenda FlanaganGlenda FlanaganExecutive Vice President and Chief Financial Officer

Exhibit 32.1
Certification by Co-Chief Executive Officer pursuant to 18 U.S.C. Section 1350, as adopted pursuant to Section 906 of the Sarbanes-Oxley Act of 2002
In connection with the Annual Report on Form 10-K of Whole Foods Market, Inc. (the “Company”) for the period ending September 25, 2016 , as filed with theSecurities and Exchange Commission on the date hereof (the “Report”), I, John Mackey, Co-Chief Executive Officer of the Company, certify, pursuant to 18U.S.C. § 1350, as adopted pursuant to § 906 of the Sarbanes-Oxley Act of 2002, that:
1. The Report fully complies with the requirements of section 13(a) or 15(d) of the Securities Exchange Act of 1934 (15 U.S.C. 78m or 78o(d)); and
2. The information contained in the Report fairly presents, in all material respects, the financial condition and results of operations of the Company.
Date: November 18, 2016
/s/ John MackeyJohn MackeyCo-Chief Executive Officer

Exhibit 32.2
Certification by Co-Chief Executive Officer pursuant to 18 U.S.C. Section 1350, as adopted pursuant to Section 906 of the Sarbanes-Oxley Act of 2002
In connection with the Annual Report on Form 10-K of Whole Foods Market, Inc. (the “Company”) for the period ending September 25, 2016 , as filed with theSecurities and Exchange Commission on the date hereof (the “Report”), I, Walter Robb, Co-Chief Executive Officer of the Company, certify, pursuant to 18U.S.C. § 1350, as adopted pursuant to § 906 of the Sarbanes-Oxley Act of 2002, that:
1. The Report fully complies with the requirements of section 13(a) or 15(d) of the Securities Exchange Act of 1934 (15 U.S.C. 78m or 78o(d)); and
2. The information contained in the Report fairly presents, in all material respects, the financial condition and results of operations of the Company.
Date: November 18, 2016
/s/ Walter RobbWalter RobbCo-Chief Executive Officer

Exhibit 32.3
Certification by Chief Financial Officer pursuant to 18 U.S.C. Section 1350, as adopted pursuant to Section 906 of the Sarbanes-Oxley Act of 2002
In connection with the Annual Report on Form 10-K of Whole Foods Market, Inc. (the “Company”) for the period ending September 25, 2016 , as filed with theSecurities and Exchange Commission on the date hereof (the “Report”), I, Glenda Flanagan, Executive Vice President and Chief Financial Officer of the Company,certify, pursuant to 18 U.S.C. § 1350, as adopted pursuant to § 906 of the Sarbanes-Oxley Act of 2002, that:
1. The Report fully complies with the requirements of section 13(a) or 15(d) of the Securities Exchange Act of 1934 (15 U.S.C. 78m or 78o(d)); and
2. The information contained in the Report fairly presents, in all material respects, the financial condition and results of operations of the Company.
Date: November 18, 2016
/s/ Glenda FlanaganGlenda FlanaganExecutive Vice President and Chief Financial Officer