form 10-q - textron financial „.no. indicate by check mark whether the registrant has ... of form...
TRANSCRIPT
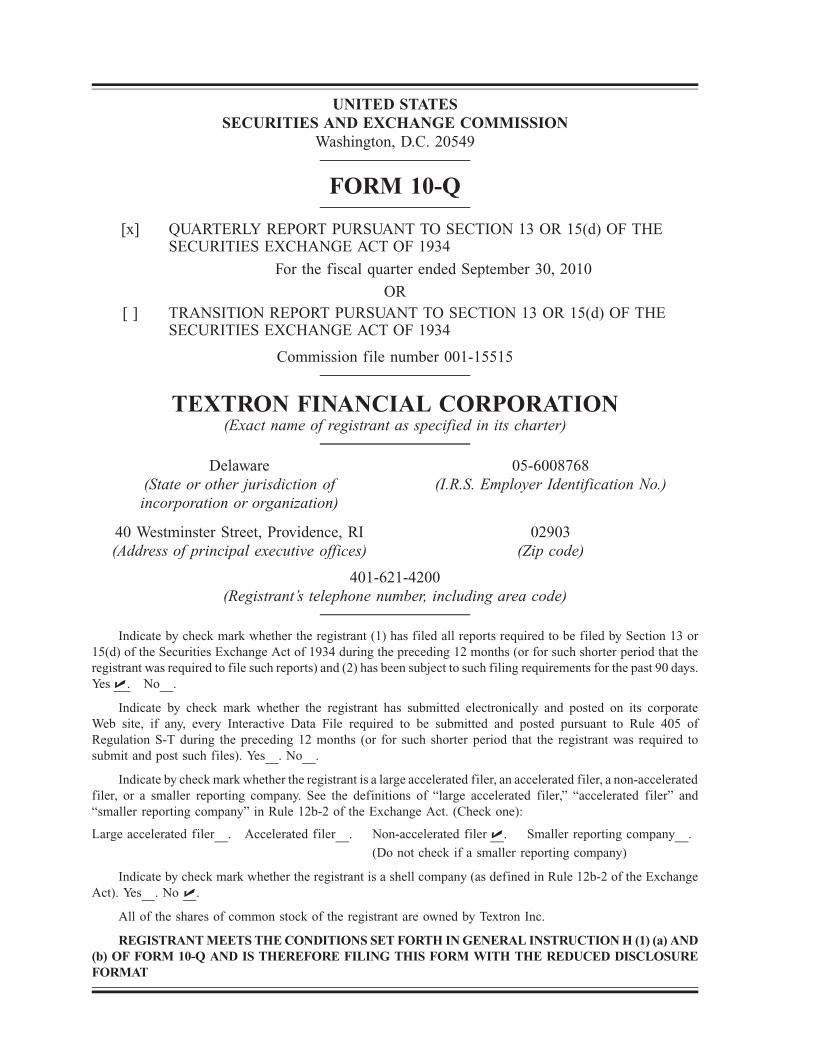
UNITED STATESSECURITIES AND EXCHANGE COMMISSION
Washington, D.C. 20549
FORM 10-Q
[x] QUARTERLY REPORT PURSUANT TO SECTION 13 OR 15(d) OF THESECURITIES EXCHANGE ACT OF 1934
For the fiscal quarter ended September 30, 2010
OR[ ] TRANSITION REPORT PURSUANT TO SECTION 13 OR 15(d) OF THE
SECURITIES EXCHANGE ACT OF 1934
Commission file number 001-15515
TEXTRON FINANCIAL CORPORATION(Exact name of registrant as specified in its charter)
Delaware(State or other jurisdiction ofincorporation or organization)
05-6008768(I.R.S. Employer Identification No.)
40 Westminster Street, Providence, RI 02903(Address of principal executive offices) (Zip code)
401-621-4200(Registrant’s telephone number, including area code)
Indicate by check mark whether the registrant (1) has filed all reports required to be filed by Section 13 or15(d) of the Securities Exchange Act of 1934 during the preceding 12 months (or for such shorter period that theregistrant was required to file such reports) and (2) has been subject to such filing requirements for the past 90 days.Yes „. No .
Indicate by check mark whether the registrant has submitted electronically and posted on its corporateWeb site, if any, every Interactive Data File required to be submitted and posted pursuant to Rule 405 ofRegulation S-T during the preceding 12 months (or for such shorter period that the registrant was required tosubmit and post such files). Yes . No .
Indicate by check mark whether the registrant is a large accelerated filer, an accelerated filer, a non-acceleratedfiler, or a smaller reporting company. See the definitions of “large accelerated filer,” “accelerated filer” and“smaller reporting company” in Rule 12b-2 of the Exchange Act. (Check one):
Large accelerated filer . Accelerated filer . Non-accelerated filer „. Smaller reporting company .
(Do not check if a smaller reporting company)
Indicate by check mark whether the registrant is a shell company (as defined in Rule 12b-2 of the ExchangeAct). Yes . No „.
All of the shares of common stock of the registrant are owned by Textron Inc.
REGISTRANT MEETS THE CONDITIONS SET FORTH IN GENERAL INSTRUCTION H (1) (a) AND(b) OF FORM 10-Q AND IS THEREFORE FILING THIS FORM WITH THE REDUCED DISCLOSUREFORMAT
TEXTRON FINANCIAL CORPORATION
TABLE OF CONTENTS
Page
PART I. FINANCIAL INFORMATION
Item 1. FINANCIAL STATEMENTS
Consolidated Statements of Operations for the three and nine months ended September 30, 2010 and2009 (unaudited) 2
Consolidated Balance Sheets at September 30, 2010 and January 2, 2010 (unaudited) 3
Consolidated Statements of Cash Flows for the nine months ended September 30, 2010 and 2009(unaudited) 4
Consolidated Statements of Changes in Equity through September 30, 2010 (unaudited) 5
Notes to the Consolidated Financial Statements (unaudited) 6
Item 2. MANAGEMENT’S DISCUSSION AND ANALYSIS OF FINANCIAL CONDITION ANDRESULTS OF OPERATIONS 19
Item 4. CONTROLS AND PROCEDURES 22
PART II. OTHER INFORMATION
Item 1A. RISK FACTORS 23
Item 6. EXHIBITS 23
1
PART I. FINANCIAL INFORMATION
Item 1. Financial Statements
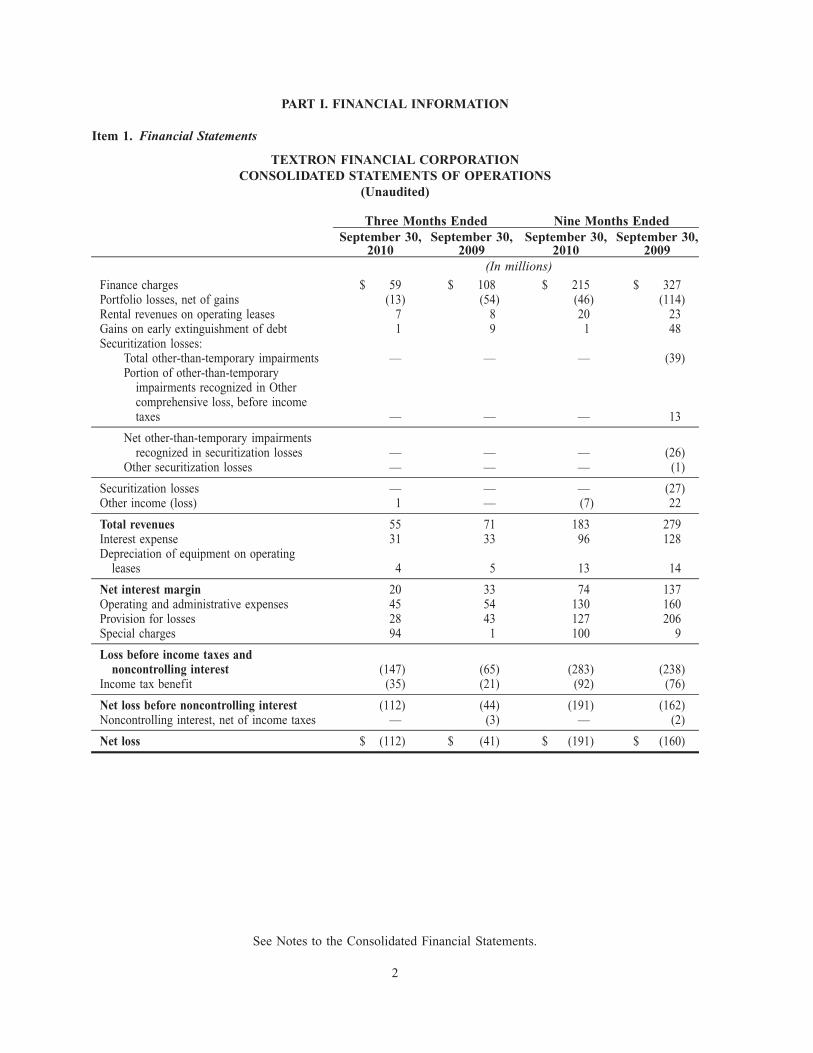
TEXTRON FINANCIAL CORPORATIONCONSOLIDATED STATEMENTS OF OPERATIONS
(Unaudited)
September 30,2010
September 30,2009
September 30,2010
September 30,2009
Three Months Ended Nine Months Ended
(In millions)
Finance charges $ 59 $ 108 $ 215 $ 327Portfolio losses, net of gains (13) (54) (46) (114)Rental revenues on operating leases 7 8 20 23Gains on early extinguishment of debt 1 9 1 48Securitization losses:
Total other-than-temporary impairments — — — (39)Portion of other-than-temporary
impairments recognized in Othercomprehensive loss, before incometaxes — — — 13
Net other-than-temporary impairmentsrecognized in securitization losses — — — (26)
Other securitization losses — — — (1)
Securitization losses — — — (27)Other income (loss) 1 — (7) 22
Total revenues 55 71 183 279Interest expense 31 33 96 128Depreciation of equipment on operating
leases 4 5 13 14
Net interest margin 20 33 74 137Operating and administrative expenses 45 54 130 160Provision for losses 28 43 127 206Special charges 94 1 100 9
Loss before income taxes andnoncontrolling interest (147) (65) (283) (238)
Income tax benefit (35) (21) (92) (76)
Net loss before noncontrolling interest (112) (44) (191) (162)Noncontrolling interest, net of income taxes — (3) — (2)
Net loss $ (112) $ (41) $ (191) $ (160)
See Notes to the Consolidated Financial Statements.
2

TEXTRON FINANCIAL CORPORATIONCONSOLIDATED BALANCE SHEETS
(Unaudited)
September 30,2010
January 2,2010
(In millions)
AssetsCash and equivalents $ 189 $ 144Finance receivables held for investment, net of unearned income:
Installment contracts 1,907 2,327Golf course, timeshare and hotel mortgages 917 1,073Revolving loans 812 1,137Distribution finance receivables 281 771Leveraged leases 281 313Finance leases 256 403
Total finance receivables held for investment 4,454 6,024Allowance for losses on finance receivables held for investment (352) (339)
Finance receivables held for investment — net 4,102 5,685Finance receivables held for sale 252 819Equipment on operating leases — net 194 216Other assets 442 460
Total assets $ 5,179 $ 7,324
Liabilities and equityLiabilitiesAccrued interest and other liabilities $ 365 $ 423Amounts due to Textron Inc. 276 472Deferred income taxes 147 137Debt 3,856 5,488
Total liabilities 4,644 6,520
Shareholder’s EquityCapital surplus 1,715 1,487Subsidiary preferred stock 1 1Investment in parent company preferred stock (25) (25)Accumulated other comprehensive loss — (49)Retained deficit (1,156) (610)
Total shareholder’s equity 535 804
Total liabilities and shareholder’s equity $ 5,179 $ 7,324
See Notes to the Consolidated Financial Statements.
3

TEXTRON FINANCIAL CORPORATIONCONSOLIDATED STATEMENTS OF CASH FLOWS
NINE MONTHS ENDED SEPTEMBER 30, 2010 AND 2009(Unaudited)
2010 2009(In millions)
Cash flows from operating activities:Net loss $ (191) $ (160)Net loss attributable to noncontrolling interest — (2)
Net loss before noncontrolling interest (191) (162)Adjustments to reconcile net loss before noncontrolling interest to net
cash provided by operating activities:Provision for losses 127 206Portfolio losses, net of gains 76 114Special charges 72 9(Decrease) increase in income taxes payable (43) 99Deferred income tax provision (23) (116)Depreciation and amortization 22 27Decrease in accrued interest and other liabilities (12) (28)Gains on early extinguishment of debt (1) (48)Impairments in excess of collections on securitizations and
syndications — 25Other — net 34 10
Net cash provided by operating activities 61 136
Cash flows from investing activities:Finance receivables originated or purchased (580) (3,044)Finance receivables repaid 1,825 3,937Proceeds from receivable sales 643 252Proceeds from disposition of other assets, including repossessed
assets and properties and operating leases 110 197Other investments 22 128
Net cash provided by investing activities 2,020 1,470
Cash flows from financing activities:Proceeds from line of credit — 1,740Principal payments on long-term debt (1,488) (1,250)Net decrease in commercial paper — (743)Principal payments on securitized on-balance sheet debt (194) (425)Principal payments on nonrecourse debt (36) (148)Net decrease in intercompany loan due to Textron Inc. (196) (115)Capital contributions from Textron Inc. 235 204Dividends paid to Textron Inc. (362) (291)Other — net 5 12
Net cash used by financing activities (2,036) (1,016)
Effect of exchange rate changes on cash — 10
Net increase in cash and equivalents 45 600Cash and equivalents at beginning of year 144 16
Cash and equivalents at end of period $ 189 $ 616
See Notes to the Consolidated Financial Statements.
4
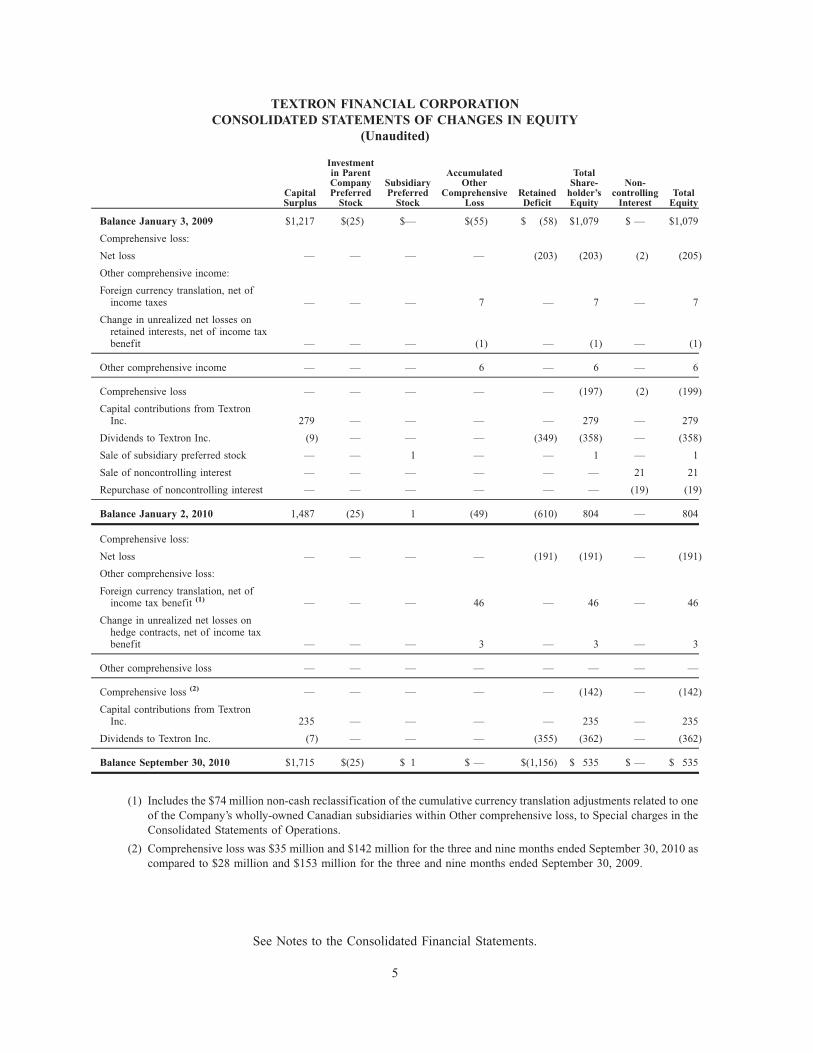
TEXTRON FINANCIAL CORPORATIONCONSOLIDATED STATEMENTS OF CHANGES IN EQUITY
(Unaudited)
CapitalSurplus
Investmentin ParentCompanyPreferred
Stock
SubsidiaryPreferred
Stock
AccumulatedOther
ComprehensiveLoss
RetainedDeficit
TotalShare-
holder’sEquity
Non-controlling
InterestTotal
Equity
Balance January 3, 2009 $1,217 $(25) $— $(55) $ (58) $1,079 $ — $1,079
Comprehensive loss:
Net loss — — — — (203) (203) (2) (205)
Other comprehensive income:
Foreign currency translation, net ofincome taxes — — — 7 — 7 — 7
Change in unrealized net losses onretained interests, net of income taxbenefit — — — (1) — (1) — (1)
Other comprehensive income — — — 6 — 6 — 6
Comprehensive loss — — — — — (197) (2) (199)
Capital contributions from TextronInc. 279 — — — — 279 — 279
Dividends to Textron Inc. (9) — — — (349) (358) — (358)
Sale of subsidiary preferred stock — — 1 — — 1 — 1
Sale of noncontrolling interest — — — — — — 21 21
Repurchase of noncontrolling interest — — — — — — (19) (19)
Balance January 2, 2010 1,487 (25) 1 (49) (610) 804 — 804
Comprehensive loss:
Net loss — — — — (191) (191) — (191)
Other comprehensive loss:
Foreign currency translation, net ofincome tax benefit (1) — — — 46 — 46 — 46
Change in unrealized net losses onhedge contracts, net of income taxbenefit — — — 3 — 3 — 3
Other comprehensive loss — — — — — — — —
Comprehensive loss (2) — — — — — (142) — (142)
Capital contributions from TextronInc. 235 — — — — 235 — 235
Dividends to Textron Inc. (7) — — — (355) (362) — (362)
Balance September 30, 2010 $1,715 $(25) $ 1 $ — $(1,156) $ 535 $ — $ 535
(1) Includes the $74 million non-cash reclassification of the cumulative currency translation adjustments related to oneof the Company’s wholly-owned Canadian subsidiaries within Other comprehensive loss, to Special charges in theConsolidated Statements of Operations.
(2) Comprehensive loss was $35 million and $142 million for the three and nine months ended September 30, 2010 ascompared to $28 million and $153 million for the three and nine months ended September 30, 2009.
See Notes to the Consolidated Financial Statements.
5
TEXTRON FINANCIAL CORPORATIONNOTES TO THE CONSOLIDATED FINANCIAL STATEMENTS
(Unaudited)
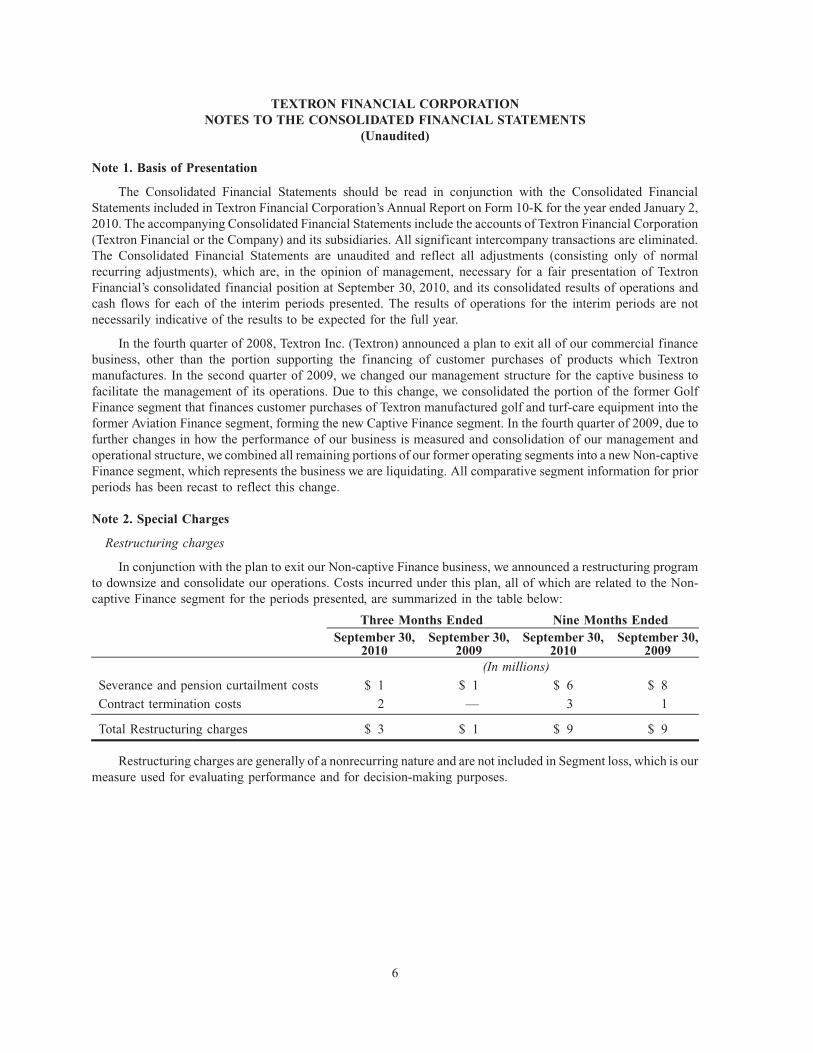
Note 1. Basis of Presentation
The Consolidated Financial Statements should be read in conjunction with the Consolidated FinancialStatements included in Textron Financial Corporation’s Annual Report on Form 10-K for the year ended January 2,2010. The accompanying Consolidated Financial Statements include the accounts of Textron Financial Corporation(Textron Financial or the Company) and its subsidiaries. All significant intercompany transactions are eliminated.The Consolidated Financial Statements are unaudited and reflect all adjustments (consisting only of normalrecurring adjustments), which are, in the opinion of management, necessary for a fair presentation of TextronFinancial’s consolidated financial position at September 30, 2010, and its consolidated results of operations andcash flows for each of the interim periods presented. The results of operations for the interim periods are notnecessarily indicative of the results to be expected for the full year.
In the fourth quarter of 2008, Textron Inc. (Textron) announced a plan to exit all of our commercial financebusiness, other than the portion supporting the financing of customer purchases of products which Textronmanufactures. In the second quarter of 2009, we changed our management structure for the captive business tofacilitate the management of its operations. Due to this change, we consolidated the portion of the former GolfFinance segment that finances customer purchases of Textron manufactured golf and turf-care equipment into theformer Aviation Finance segment, forming the new Captive Finance segment. In the fourth quarter of 2009, due tofurther changes in how the performance of our business is measured and consolidation of our management andoperational structure, we combined all remaining portions of our former operating segments into a new Non-captiveFinance segment, which represents the business we are liquidating. All comparative segment information for priorperiods has been recast to reflect this change.
Note 2. Special Charges
Restructuring charges
In conjunction with the plan to exit our Non-captive Finance business, we announced a restructuring programto downsize and consolidate our operations. Costs incurred under this plan, all of which are related to the Non-captive Finance segment for the periods presented, are summarized in the table below:
September 30,2010
September 30,2009
September 30,2010
September 30,2009
Three Months Ended Nine Months Ended
(In millions)
Severance and pension curtailment costs $ 1 $ 1 $ 6 $ 8
Contract termination costs 2 — 3 1
Total Restructuring charges $ 3 $ 1 $ 9 $ 9
Restructuring charges are generally of a nonrecurring nature and are not included in Segment loss, which is ourmeasure used for evaluating performance and for decision-making purposes.
6
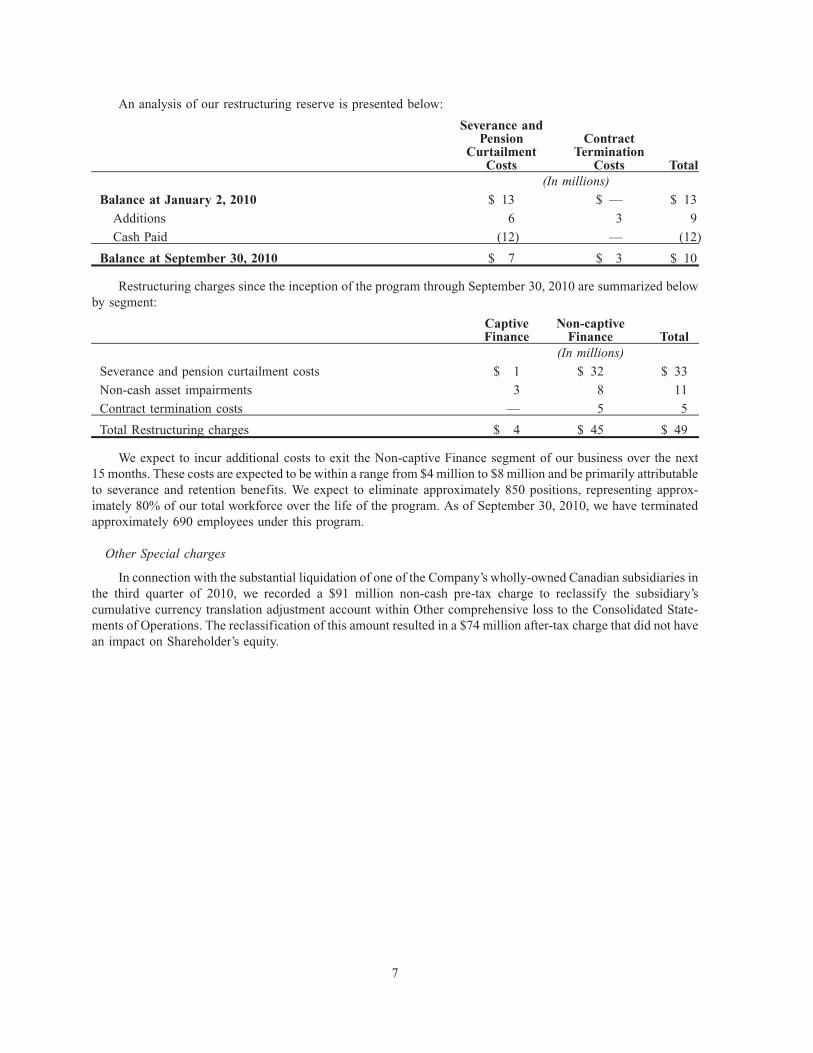
An analysis of our restructuring reserve is presented below:
Severance andPension
CurtailmentCosts
ContractTermination
Costs Total(In millions)
Balance at January 2, 2010 $ 13 $ — $ 13
Additions 6 3 9
Cash Paid (12) — (12)
Balance at September 30, 2010 $ 7 $ 3 $ 10
Restructuring charges since the inception of the program through September 30, 2010 are summarized belowby segment:
CaptiveFinance
Non-captiveFinance Total
(In millions)
Severance and pension curtailment costs $ 1 $ 32 $ 33
Non-cash asset impairments 3 8 11
Contract termination costs — 5 5
Total Restructuring charges $ 4 $ 45 $ 49
We expect to incur additional costs to exit the Non-captive Finance segment of our business over the next15 months. These costs are expected to be within a range from $4 million to $8 million and be primarily attributableto severance and retention benefits. We expect to eliminate approximately 850 positions, representing approx-imately 80% of our total workforce over the life of the program. As of September 30, 2010, we have terminatedapproximately 690 employees under this program.
Other Special charges
In connection with the substantial liquidation of one of the Company’s wholly-owned Canadian subsidiaries inthe third quarter of 2010, we recorded a $91 million non-cash pre-tax charge to reclassify the subsidiary’scumulative currency translation adjustment account within Other comprehensive loss to the Consolidated State-ments of Operations. The reclassification of this amount resulted in a $74 million after-tax charge that did not havean impact on Shareholder’s equity.
7
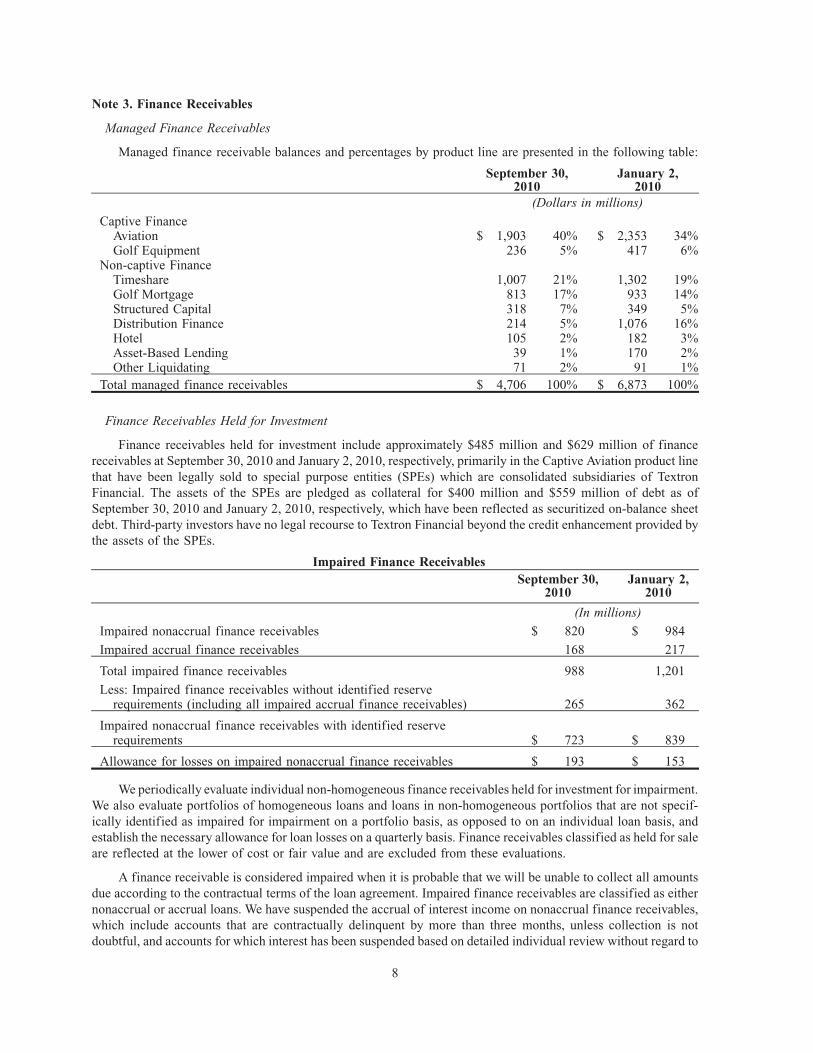
Note 3. Finance Receivables
Managed Finance Receivables
Managed finance receivable balances and percentages by product line are presented in the following table:
September 30,2010
January 2,2010
(Dollars in millions)
Captive FinanceAviation $ 1,903 40% $ 2,353 34%Golf Equipment 236 5% 417 6%
Non-captive FinanceTimeshare 1,007 21% 1,302 19%Golf Mortgage 813 17% 933 14%Structured Capital 318 7% 349 5%Distribution Finance 214 5% 1,076 16%Hotel 105 2% 182 3%Asset-Based Lending 39 1% 170 2%Other Liquidating 71 2% 91 1%
Total managed finance receivables $ 4,706 100% $ 6,873 100%
Finance Receivables Held for Investment
Finance receivables held for investment include approximately $485 million and $629 million of financereceivables at September 30, 2010 and January 2, 2010, respectively, primarily in the Captive Aviation product linethat have been legally sold to special purpose entities (SPEs) which are consolidated subsidiaries of TextronFinancial. The assets of the SPEs are pledged as collateral for $400 million and $559 million of debt as ofSeptember 30, 2010 and January 2, 2010, respectively, which have been reflected as securitized on-balance sheetdebt. Third-party investors have no legal recourse to Textron Financial beyond the credit enhancement provided bythe assets of the SPEs.
September 30,2010
January 2,2010
Impaired Finance Receivables
(In millions)
Impaired nonaccrual finance receivables $ 820 $ 984
Impaired accrual finance receivables 168 217
Total impaired finance receivables 988 1,201
Less: Impaired finance receivables without identified reserverequirements (including all impaired accrual finance receivables) 265 362
Impaired nonaccrual finance receivables with identified reserverequirements $ 723 $ 839
Allowance for losses on impaired nonaccrual finance receivables $ 193 $ 153
We periodically evaluate individual non-homogeneous finance receivables held for investment for impairment.We also evaluate portfolios of homogeneous loans and loans in non-homogeneous portfolios that are not specif-ically identified as impaired for impairment on a portfolio basis, as opposed to on an individual loan basis, andestablish the necessary allowance for loan losses on a quarterly basis. Finance receivables classified as held for saleare reflected at the lower of cost or fair value and are excluded from these evaluations.
A finance receivable is considered impaired when it is probable that we will be unable to collect all amountsdue according to the contractual terms of the loan agreement. Impaired finance receivables are classified as eithernonaccrual or accrual loans. We have suspended the accrual of interest income on nonaccrual finance receivables,which include accounts that are contractually delinquent by more than three months, unless collection is notdoubtful, and accounts for which interest has been suspended based on detailed individual review without regard to
8
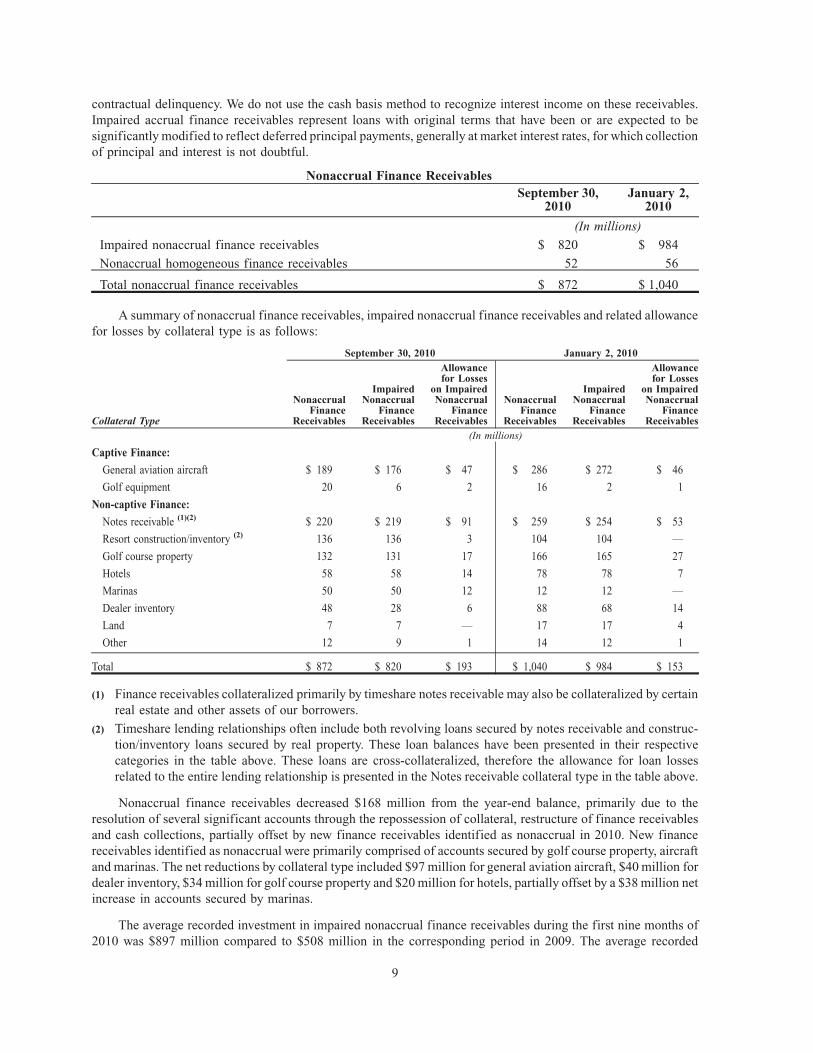
contractual delinquency. We do not use the cash basis method to recognize interest income on these receivables.Impaired accrual finance receivables represent loans with original terms that have been or are expected to besignificantly modified to reflect deferred principal payments, generally at market interest rates, for which collectionof principal and interest is not doubtful.
September 30,2010
January 2,2010
Nonaccrual Finance Receivables
(In millions)
Impaired nonaccrual finance receivables $ 820 $ 984
Nonaccrual homogeneous finance receivables 52 56
Total nonaccrual finance receivables $ 872 $ 1,040
A summary of nonaccrual finance receivables, impaired nonaccrual finance receivables and related allowancefor losses by collateral type is as follows:
Collateral Type
NonaccrualFinance
Receivables
ImpairedNonaccrual
FinanceReceivables
Allowancefor Losses
on ImpairedNonaccrual
FinanceReceivables
NonaccrualFinance
Receivables
ImpairedNonaccrual
FinanceReceivables
Allowancefor Losses
on ImpairedNonaccrual
FinanceReceivables
September 30, 2010 January 2, 2010
(In millions)
Captive Finance:
General aviation aircraft $ 189 $ 176 $ 47 $ 286 $ 272 $ 46
Golf equipment 20 6 2 16 2 1
Non-captive Finance:
Notes receivable (1)(2) $ 220 $ 219 $ 91 $ 259 $ 254 $ 53
Resort construction/inventory (2) 136 136 3 104 104 —
Golf course property 132 131 17 166 165 27
Hotels 58 58 14 78 78 7
Marinas 50 50 12 12 12 —
Dealer inventory 48 28 6 88 68 14
Land 7 7 — 17 17 4
Other 12 9 1 14 12 1
Total $ 872 $ 820 $ 193 $ 1,040 $ 984 $ 153
(1) Finance receivables collateralized primarily by timeshare notes receivable may also be collateralized by certainreal estate and other assets of our borrowers.
(2) Timeshare lending relationships often include both revolving loans secured by notes receivable and construc-tion/inventory loans secured by real property. These loan balances have been presented in their respectivecategories in the table above. These loans are cross-collateralized, therefore the allowance for loan lossesrelated to the entire lending relationship is presented in the Notes receivable collateral type in the table above.
Nonaccrual finance receivables decreased $168 million from the year-end balance, primarily due to theresolution of several significant accounts through the repossession of collateral, restructure of finance receivablesand cash collections, partially offset by new finance receivables identified as nonaccrual in 2010. New financereceivables identified as nonaccrual were primarily comprised of accounts secured by golf course property, aircraftand marinas. The net reductions by collateral type included $97 million for general aviation aircraft, $40 million fordealer inventory, $34 million for golf course property and $20 million for hotels, partially offset by a $38 million netincrease in accounts secured by marinas.
The average recorded investment in impaired nonaccrual finance receivables during the first nine months of2010 was $897 million compared to $508 million in the corresponding period in 2009. The average recorded
9
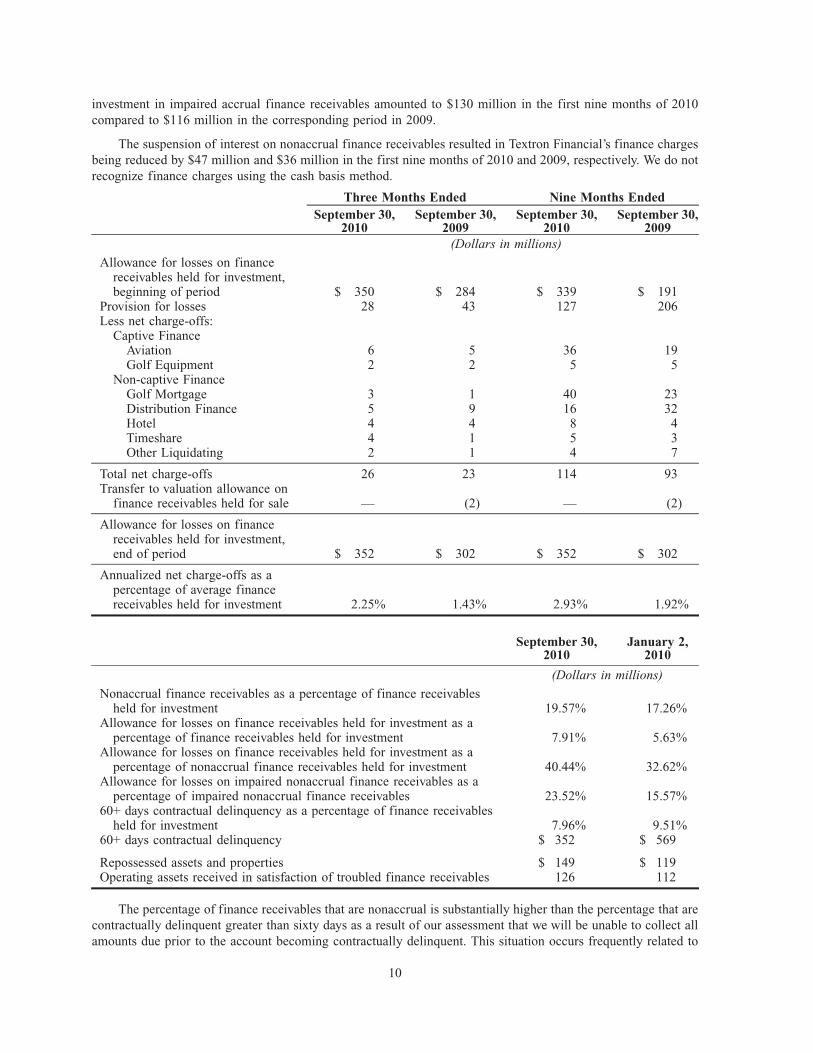
investment in impaired accrual finance receivables amounted to $130 million in the first nine months of 2010compared to $116 million in the corresponding period in 2009.
The suspension of interest on nonaccrual finance receivables resulted in Textron Financial’s finance chargesbeing reduced by $47 million and $36 million in the first nine months of 2010 and 2009, respectively. We do notrecognize finance charges using the cash basis method.
September 30,2010
September 30,2009
September 30,2010
September 30,2009
Three Months Ended Nine Months Ended
(Dollars in millions)
Allowance for losses on financereceivables held for investment,beginning of period $ 350 $ 284 $ 339 $ 191
Provision for losses 28 43 127 206Less net charge-offs:
Captive FinanceAviation 6 5 36 19Golf Equipment 2 2 5 5
Non-captive FinanceGolf Mortgage 3 1 40 23Distribution Finance 5 9 16 32Hotel 4 4 8 4Timeshare 4 1 5 3Other Liquidating 2 1 4 7
Total net charge-offs 26 23 114 93Transfer to valuation allowance on
finance receivables held for sale — (2) — (2)
Allowance for losses on financereceivables held for investment,end of period $ 352 $ 302 $ 352 $ 302
Annualized net charge-offs as apercentage of average financereceivables held for investment 2.25% 1.43% 2.93% 1.92%
September 30,2010
January 2,2010
(Dollars in millions)
Nonaccrual finance receivables as a percentage of finance receivablesheld for investment 19.57% 17.26%
Allowance for losses on finance receivables held for investment as apercentage of finance receivables held for investment 7.91% 5.63%
Allowance for losses on finance receivables held for investment as apercentage of nonaccrual finance receivables held for investment 40.44% 32.62%
Allowance for losses on impaired nonaccrual finance receivables as apercentage of impaired nonaccrual finance receivables 23.52% 15.57%
60+ days contractual delinquency as a percentage of finance receivablesheld for investment 7.96% 9.51%
60+ days contractual delinquency $ 352 $ 569
Repossessed assets and properties $ 149 $ 119Operating assets received in satisfaction of troubled finance receivables 126 112
The percentage of finance receivables that are nonaccrual is substantially higher than the percentage that arecontractually delinquent greater than sixty days as a result of our assessment that we will be unable to collect allamounts due prior to the account becoming contractually delinquent. This situation occurs frequently related to
10
revolving loans since we typically receive all cash collections from the underlying collateral and advance funds tothe borrower only when the borrower is not in default and has sufficient collateral under the terms of the contract.These cash collections are often sufficient to satisfy contractually required payments of interest and principal forlong periods of time subsequent to the borrower experiencing significant financial stress.
Note 4. Other Assets
Textron Financial’s Other assets are primarily composed of operating assets received in satisfaction of troubledfinance receivables, repossessed assets and properties, investments in other marketable securities, other long terminvestments and derivative financial instruments.
Operating assets received in satisfaction of troubled finance receivables are assets we intend to operate for asubstantial period of time and/or make substantial improvements to prior to sale. As of September 30, 2010, theyprimarily represent the assets of operating golf courses that have been repossessed and investments in real estateassociated with matured leveraged leases. These assets are initially recorded at the lower of net realizable value orthe previous carrying value of the related finance receivable. The assets are measured for impairment on an ongoingbasis by comparing the estimated future undiscounted cash flows to the current carrying value. If the sum of theundiscounted cash flows is estimated to be less than the carrying value, the Company records a charge to Portfoliolosses, net of gains, for the shortfall between estimated fair value and the carrying amount. The revenues andexpenses related to these assets, excluding investments made for capital improvements, are recorded in Operatingand administrative expenses. In the first nine months of 2010, revenues were $24 million and $11 million from golfcourses and other real estate, respectively, and expenses were $33 million and $11 million from golf courses andother real estate, respectively. In the first nine months of 2009, revenues were $19 million and $2 million from golfcourses and other real estate, respectively, and expenses were $25 million and $2 million from golf courses and otherreal estate, respectively.
Investments in other marketable securities represent investments in notes receivable issued by timesharesecuritization trusts. These investments were $55 million and $68 million at September 30, 2010 and January 2,2010, respectively. We have classified these investments as held to maturity as management has the intent andability to hold them until maturity. At September 30, 2010, unrealized losses were $3 million on $30 million of theseinvestments for which fair value was lower than our carrying value. These investments have been in a continuous,unrealized loss position for greater than twelve months. These unrealized losses are the result of market yieldexpectations and are considered temporary due to the continued performance of the underlying collateral of thetimeshare securitization trusts. In reaching our conclusion that the investments are not other-than-temporarilyimpaired, we relied on industry analyst reports, credit ratings specific to each investment and information ondelinquency, loss and payment experience of the collateral underlying each security.
Note 5. Derivative Financial Instruments
Textron Financial utilizes derivative instruments to mitigate its exposure to fluctuations in interest rates andforeign currencies. These instruments include interest rate exchange agreements and foreign currency exchangeagreements. The Company does not hold or issue derivative financial instruments for trading or speculativepurposes. The Company did not experience a significant net gain or loss in earnings as a result of the ineffec-tiveness, or the exclusion of any component from its assessment of hedge effectiveness, of its derivative financialinstruments in the first nine months of 2010. The Company recorded a $2 million gain in earnings during the firstnine months of 2009 as a result of the ineffectiveness of an interest rate exchange agreement. The fair values ofderivative instruments are included in either Other assets or Accrued interest and other liabilities in the Consol-idated Balance Sheets.
11
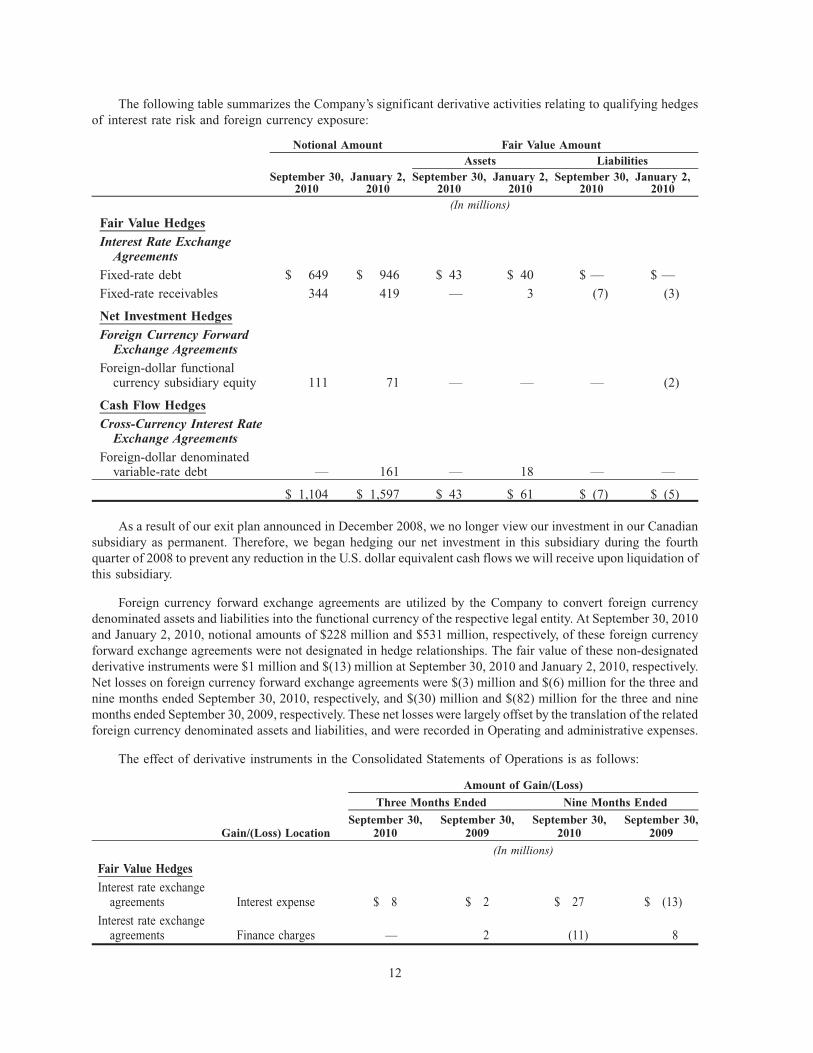
The following table summarizes the Company’s significant derivative activities relating to qualifying hedgesof interest rate risk and foreign currency exposure:
September 30,2010
January 2,2010
September 30,2010
January 2,2010
September 30,2010
January 2,2010
Assets LiabilitiesNotional Amount Fair Value Amount
(In millions)
Fair Value Hedges
Interest Rate ExchangeAgreements
Fixed-rate debt $ 649 $ 946 $ 43 $ 40 $ — $ —
Fixed-rate receivables 344 419 — 3 (7) (3)
Net Investment Hedges
Foreign Currency ForwardExchange Agreements
Foreign-dollar functionalcurrency subsidiary equity 111 71 — — — (2)
Cash Flow Hedges
Cross-Currency Interest RateExchange Agreements
Foreign-dollar denominatedvariable-rate debt — 161 — 18 — —
$ 1,104 $ 1,597 $ 43 $ 61 $ (7) $ (5)
As a result of our exit plan announced in December 2008, we no longer view our investment in our Canadiansubsidiary as permanent. Therefore, we began hedging our net investment in this subsidiary during the fourthquarter of 2008 to prevent any reduction in the U.S. dollar equivalent cash flows we will receive upon liquidation ofthis subsidiary.
Foreign currency forward exchange agreements are utilized by the Company to convert foreign currencydenominated assets and liabilities into the functional currency of the respective legal entity. At September 30, 2010and January 2, 2010, notional amounts of $228 million and $531 million, respectively, of these foreign currencyforward exchange agreements were not designated in hedge relationships. The fair value of these non-designatedderivative instruments were $1 million and $(13) million at September 30, 2010 and January 2, 2010, respectively.Net losses on foreign currency forward exchange agreements were $(3) million and $(6) million for the three andnine months ended September 30, 2010, respectively, and $(30) million and $(82) million for the three and ninemonths ended September 30, 2009, respectively. These net losses were largely offset by the translation of the relatedforeign currency denominated assets and liabilities, and were recorded in Operating and administrative expenses.
The effect of derivative instruments in the Consolidated Statements of Operations is as follows:
Gain/(Loss) LocationSeptember 30,
2010September 30,
2009September 30,
2010September 30,
2009
Three Months Ended Nine Months Ended
Amount of Gain/(Loss)
(In millions)
Fair Value Hedges
Interest rate exchangeagreements Interest expense $ 8 $ 2 $ 27 $ (13)
Interest rate exchangeagreements Finance charges — 2 (11) 8
12
Gains/(losses) included in earnings related to cash flow hedges were $6 million and $(4) million for the threeand nine months ended September 30, 2010, respectively, and $8 million and $(3) million for the three and ninemonths ended September 30, 2009, respectively. These gains/(losses) were largely offset by the translation of therelated foreign currency denominated debt. The Company did not experience a significant gain or loss in OtherComprehensive Income related to cash flow hedges during the first nine months of 2010 or 2009.
Note 6. Fair Value of Financial Instruments
We measure fair value at the price that would be received to sell an asset or paid to transfer a liability in anorderly transaction between market participants at the measurement date. We prioritize the assumptions that marketparticipants would use in pricing the asset or liability (the “inputs”) into a three-tier fair value hierarchy. This fairvalue hierarchy gives the highest priority (Level 1) to quoted prices in active markets for identical assets orliabilities and the lowest priority (Level 3) to unobservable inputs in which little or no market data exists, requiringcompanies to develop their own assumptions. Observable inputs that do not meet the criteria of Level 1, and includequoted prices for similar assets or liabilities in active markets or quoted prices for identical assets and liabilities inmarkets that are not active, are categorized as Level 2. Level 3 inputs are those that reflect our estimates about theassumptions market participants would use in pricing the asset or liability, based on the best information available inthe circumstances. Valuation techniques for assets and liabilities measured using Level 3 inputs may includemethodologies such as the market approach, the income approach or the cost approach, and may use unobservableinputs such as projections, estimates and management’s interpretation of current market data. These unobservableinputs are only utilized to the extent that observable inputs are not available or cost-effective to obtain.
Assets Recorded at Fair Value on a Recurring Basis
We measure our derivative financial instruments, net at fair value on a recurring basis using Level 2 inputs. Thenet balance of these derivative financial instruments was $35 million at September 30, 2010. The Company’sderivative contracts are not exchange-traded and are measured at fair value utilizing widely accepted, third-partydeveloped valuation models. The actual terms of each individual contract are entered into the model in addition tointerest rate and foreign exchange rate data which is based on readily observable market data published by third-party leading financial news and data providers. Credit risk is factored into the fair value of derivative assets andliabilities based on the differential between both the Company’s credit default swap spread for liabilities and thecounterparty’s credit default swap spread for assets as compared to a standard AA-rated counterparty, however, thishad no significant impact on the valuation as of September 30, 2010 and January 2, 2010.
13

Changes in Fair Value for Unobservable Input
The table below presents the change in fair value measurements that used significant unobservable inputs(Level 3) during each period presented:
September 30,2010
September 30,2009
September 30,2010
September 30,2009
Three Months Ended Nine Months Ended
(In millions)
Retained Interests in Securitizations
Balance, beginning of period $ — $ 3 $ 3 $ 12
Transfer from nonrecurring classification — 110 — 110
Reclassification to Finance receivablesheld for investment — — (3) —
Net losses for the period:
Change in value recognized inOther comprehensive loss — 12 — 11
Impairments recognized in earnings — — — (8)
Collections, net — (37) — (37)
Balance, end of period $ — $ 88 $ — $ 88
Assets Recorded at Fair Value on a Nonrecurring Basis
The table below presents the balance at September 30, 2010 and September 30, 2009 of those assets that weremeasured at fair value on a nonrecurring basis during the first nine months of 2010 and 2009, respectively, and therelated gain/(loss) recorded in the Consolidated Statements of Operations. These assets were measured usingsignificant unobservable inputs (Level 3).
September 30,2010
September 30,2009
September 30,2010
September 30,2009
September 30,2010
September 30,2009
Balance at Three Months Ended Nine Months Ended
Total Gain/(Loss)
(In millions)
Impaired finance receivables $ 521 $ 532 $ (26) $ (26) $ (130) $ (143)
Finance receivables held for sale 252 998 (2) (4) (17) (16)
Repossessed assets and properties 98 37 (12) (5) (29) (21)
Other investments 28 15 — (19) (9) (19)
Operating assets received insatisfaction of troubled financereceivables — 6 — (1) — (7)
Impaired Finance Receivables
Finance receivable impairment is measured by comparing the expected future cash flows discounted at thefinance receivable’s effective interest rate, or the fair value of the collateral if the finance receivable is collateraldependent, to its carrying amount. If the carrying amount is higher, we establish a reserve based on this difference.This evaluation is inherently subjective, as it requires estimates, including the amount and timing of future cashflows expected to be received on impaired finance receivables and the underlying collateral, which may differ fromactual results. Impaired nonaccrual finance receivables represent assets recorded at fair value on a nonrecurringbasis since the measurement of required reserves on our impaired finance receivables is significantly dependent onthe fair value of the underlying collateral. Fair values of collateral are determined based on the use of appraisals,industry pricing guides, input from market participants, our recent experience selling similar assets or internallydeveloped discounted cash flow models. Fair value measurements on impaired finance receivables are recorded toProvision for losses in the Consolidated Statements of Operations.
14
The evaluation of impaired Revolving loans collateralized by timeshare notes receivable is performed utilizinginternally developed cash flow models which incorporate the unique structural features of these loans. Timesharenotes receivables loans are loans to developers of resort properties which are collateralized by pools of consumernotes receivable. These notes receivable are originated by developers in connection with the sale of vacationintervals and typically bear interest at rates in excess of the rate on our loan to the developer. In addition to theinterest differential between the consumer notes and our loan to the developers, there are several features of ourloans which provide protection from credit losses in the pools of consumer notes. We have a priority interest in allcash flows from these pools of consumer notes, typically advance approximately 90% of the collateral value, have asecurity interest in either the underlying real estate or the right to use the resort property and often have personalguarantees from the principal of the borrower. Our impairment models incorporate management’s best estimate ofcredit losses in the pools of consumer notes based on historical trends as adjusted for our understanding of currenttrends in the developer’s underwriting practices and the developer’s ability to mitigate losses through the repurchaseor replacement of defaulted notes.
Finance Receivables Held for Sale
Finance receivables held for sale are recorded at the lower of cost or fair value. As a result of our plan to exit theNon-captive Finance business through a combination of orderly liquidation of finance receivables as they matureand selected sales, $252 million of finance receivables, net of a $37 million valuation allowance, have beenclassified as held for sale as of September 30, 2010. The finance receivables held for sale as of September 30, 2010are primarily assets in the Golf Mortgage product line. Golf course mortgages classified as held for sale wereidentified as a portion of a larger portfolio with common characteristics based on the intention to balance the sale ofcertain loans with the collection of others to maximize economic value. These finance receivables are recorded atfair value on a nonrecurring basis during periods in which the fair value is lower than the cost value. Fair valuemeasurements on finance receivables held for sale are recorded in Other income in the Consolidated Statements ofOperations. During the first nine months of 2010, we sold $375 million of finance receivables classified as held forsale in the Distribution Finance product line and recorded $26 million of gains related to these sales. In addition, wesold $84 million of finance receivables classified as held for sale in the Captive Golf equipment product line at bookvalue. Total gains related to finance receivable sales were $30 million for the first nine months of 2010.
There are no active, quoted market prices for our finance receivables. The estimate of fair value wasdetermined based on the use of discounted cash flow models to estimate the exit price we expect to receive in theprincipal market for each type of loan in an orderly transaction, which includes both the sale of pools of similarassets and the sale of individual loans. The models incorporate estimates of the rate of return, financing cost, capitalstructure and/or discount rate expectations of prospective purchasers combined with estimated loan cash flowsbased on credit losses, payment rates and credit line utilization rates. Where available, the assumptions related to theexpectations of prospective purchasers are compared to observable market inputs, including bids from prospectivepurchasers and certain bond market indices for loans of similar perceived credit quality. Although we utilize andprioritize these market observable inputs in our discounted cash flow models, these inputs are rarely derived frommarkets with directly comparable loan structures, industries and collateral types. Therefore, valuations of financereceivables held for sale involve significant management judgment, which can result in differences between our fairvalue estimates and those of other market participants.
Repossessed Assets and Properties / Operating Assets Received in Satisfaction of Troubled FinanceReceivables
The fair value of repossessed assets and properties and operating assets received in satisfaction of troubledfinance receivables is determined based on the use of appraisals, industry pricing guides, input from marketparticipants, the Company’s recent experience selling similar assets or internally developed discounted cash flowmodels. For repossessed assets and properties, which are considered assets held for sale, if the carrying amount ofthe asset is higher than the estimated fair value, the Company records a corresponding charge to income for thedifference. For operating assets received in satisfaction of troubled finance receivables, if the sum of theundiscounted cash flows is estimated to be less than the carrying value, the Company records a charge to income
15

for any shortfall between estimated fair value and the carrying amount. Fair value measurements on these assets arerecorded in Portfolio losses, net of gains, in the Consolidated Statements of Operations.
Other Investments
Other investments, which are accounted for under the equity method of accounting, are recorded at fair value ifthe sum of the undiscounted cash flows from the investment is estimated to be less than the carrying value. There areno active, quoted market prices for our equity method investments. The estimates of fair value are determinedutilizing internally developed discounted cash flow models, which incorporate assumptions specific to the nature ofthe investments’ business and underlying assets. These assumptions include industry valuation benchmarks such asdiscount rates, capitalization rates and cash flow multiples as well as assumptions more specifically related to theamount and timing of the businesses’ operating cash flow. Fair value measurements on these assets are recorded inPortfolio losses, net of gains, in the Consolidated Statements of Operations.
Assets and Liabilities Not Recorded at Fair Value
The carrying values and estimated fair values of Textron Financial’s financial instruments which are notrecorded at fair value are as follows:
CarryingValue
EstimatedFair Value
CarryingValue
EstimatedFair Value
September 30, 2010 January 2, 2010
(In millions)
Assets:
Installment contracts $ 1,796 $ 1,705 $ 2,204 $ 2,007
Golf course, timeshare and hotel mortgages 838 723 1,008 924
Revolving loans 700 600 1,058 902
Distribution finance receivables 245 237 709 690
Investment in other marketable securities 55 54 68 56
Retained interests in securitizations, excludinginterest-only securities — — 6 6
$ 3,634 $ 3,319 $ 5,053 $ 4,585
Liabilities:
Bank line of credit $ 1,740 $ 1,684 $ 1,740 $ 1,682
Fixed-rate debt 1,140 1,118 1,534 1,490
Securitized on-balance sheet debt 400 392 559 548
Subordinated debt 300 230 300 207
Variable-rate debt 276 277 1,355 1,333
Amounts due to Textron Inc. 276 274 472 469
$ 4,132 $ 3,975 $ 5,960 $ 5,729
Finance Receivables Held for Investment
There are no active, quoted market prices for these finance receivables. The estimate of fair value wasdetermined based on the use of discounted cash flow models which incorporate estimates of the rate of return,financing cost, capital structure and/or discount rate expectations of current market participants combined withestimated loan cash flows based on credit losses, payment rates and credit line utilization rates. Where available, theassumptions related to the expectations of current market participants are compared to observable market inputs,including bids from prospective purchasers of similar loans and certain bond market indices for loans of similarperceived credit quality. Although we utilize and prioritize these market observable inputs in our discounted cashflow models, these inputs are rarely derived from markets with directly comparable loan structures, industries and
16
collateral types. Therefore, all valuations of finance receivables involve significant management judgment, whichcan result in differences between our fair value estimates and those of other market participants. The carryingamounts of Textron Financial’s leveraged leases, finance leases and operating leases ($281 million, $256 millionand $194 million, respectively, at September 30, 2010 and $313 million, $403 million and $216 million,respectively, at January 2, 2010), are specifically excluded from this disclosure under generally accepted accountingprinciples. As a result, a significant portion of the assets that are included in the Company’s asset and liabilitymanagement strategy are excluded from this fair value disclosure.
Investments in Other Marketable Securities
Other marketable securities represent investments in notes receivable issued by securitization trusts whichpurchase timeshare notes receivable from timeshare developers. These notes are classified as held to maturity andare held at amortized cost. The estimate of fair value was based on observable market inputs for similarsecuritization interests in markets that are relatively inactive compared to the market environment in which theywere originally issued.
Debt
At September 30, 2010 and January 2, 2010, 44% and 54%, respectively, of the fair value of debt wasdetermined based on observable market transactions. The remaining fair values were determined based ondiscounted cash flow analyses using observable market inputs from debt with similar duration, subordinationand credit default expectations.
Note 7. Income taxes
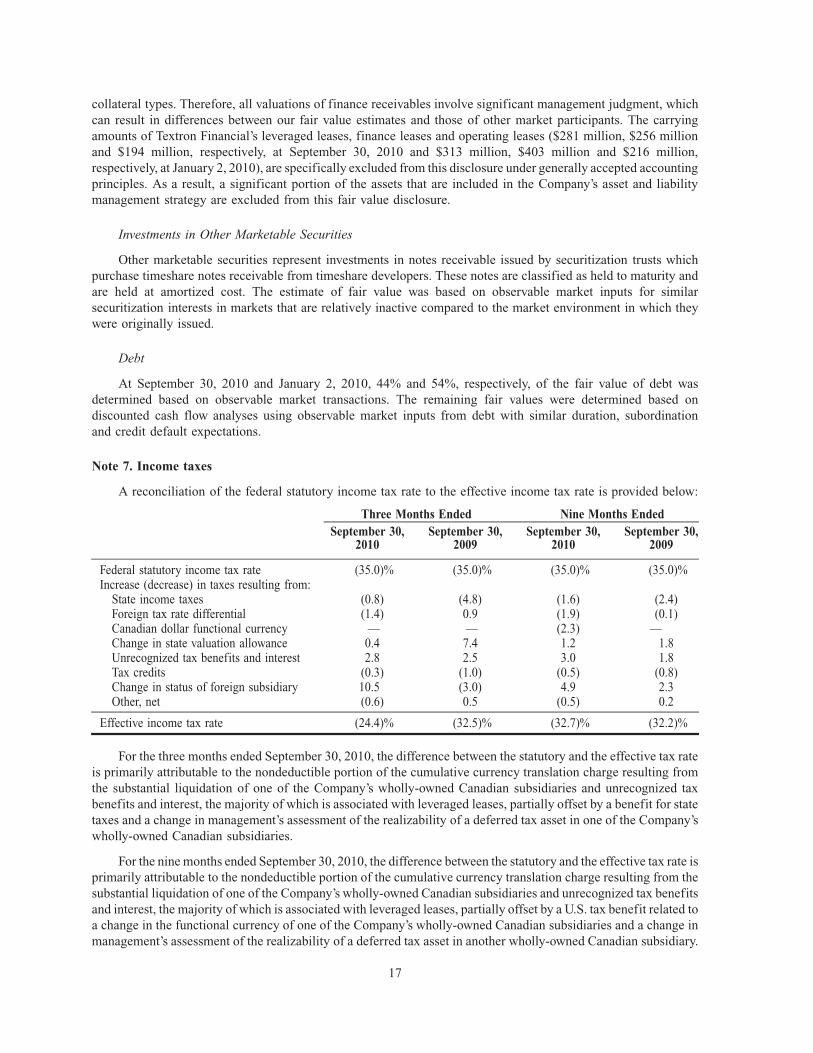
A reconciliation of the federal statutory income tax rate to the effective income tax rate is provided below:
September 30,2010
September 30,2009
September 30,2010
September 30,2009
Three Months Ended Nine Months Ended
Federal statutory income tax rate (35.0)% (35.0)% (35.0)% (35.0)%Increase (decrease) in taxes resulting from:
State income taxes (0.8) (4.8) (1.6) (2.4)Foreign tax rate differential (1.4) 0.9 (1.9) (0.1)Canadian dollar functional currency — — (2.3) —Change in state valuation allowance 0.4 7.4 1.2 1.8Unrecognized tax benefits and interest 2.8 2.5 3.0 1.8Tax credits (0.3) (1.0) (0.5) (0.8)Change in status of foreign subsidiary 10.5 (3.0) 4.9 2.3Other, net (0.6) 0.5 (0.5) 0.2
Effective income tax rate (24.4)% (32.5)% (32.7)% (32.2)%
For the three months ended September 30, 2010, the difference between the statutory and the effective tax rateis primarily attributable to the nondeductible portion of the cumulative currency translation charge resulting fromthe substantial liquidation of one of the Company’s wholly-owned Canadian subsidiaries and unrecognized taxbenefits and interest, the majority of which is associated with leveraged leases, partially offset by a benefit for statetaxes and a change in management’s assessment of the realizability of a deferred tax asset in one of the Company’swholly-owned Canadian subsidiaries.
For the nine months ended September 30, 2010, the difference between the statutory and the effective tax rate isprimarily attributable to the nondeductible portion of the cumulative currency translation charge resulting from thesubstantial liquidation of one of the Company’s wholly-owned Canadian subsidiaries and unrecognized tax benefitsand interest, the majority of which is associated with leveraged leases, partially offset by a U.S. tax benefit related toa change in the functional currency of one of the Company’s wholly-owned Canadian subsidiaries and a change inmanagement’s assessment of the realizability of a deferred tax asset in another wholly-owned Canadian subsidiary.
17
Note 8. Contingencies
There are pending or threatened lawsuits and other proceedings against Textron Financial and its subsidiaries.Some of these suits and proceedings seek compensatory, treble or punitive damages in substantial amounts. Thesesuits and proceedings are being defended by, or contested on behalf of, Textron Financial and its subsidiaries. On thebasis of information presently available, Textron Financial believes any such liability would not have a materialeffect on Textron Financial’s financial position or results of operations.
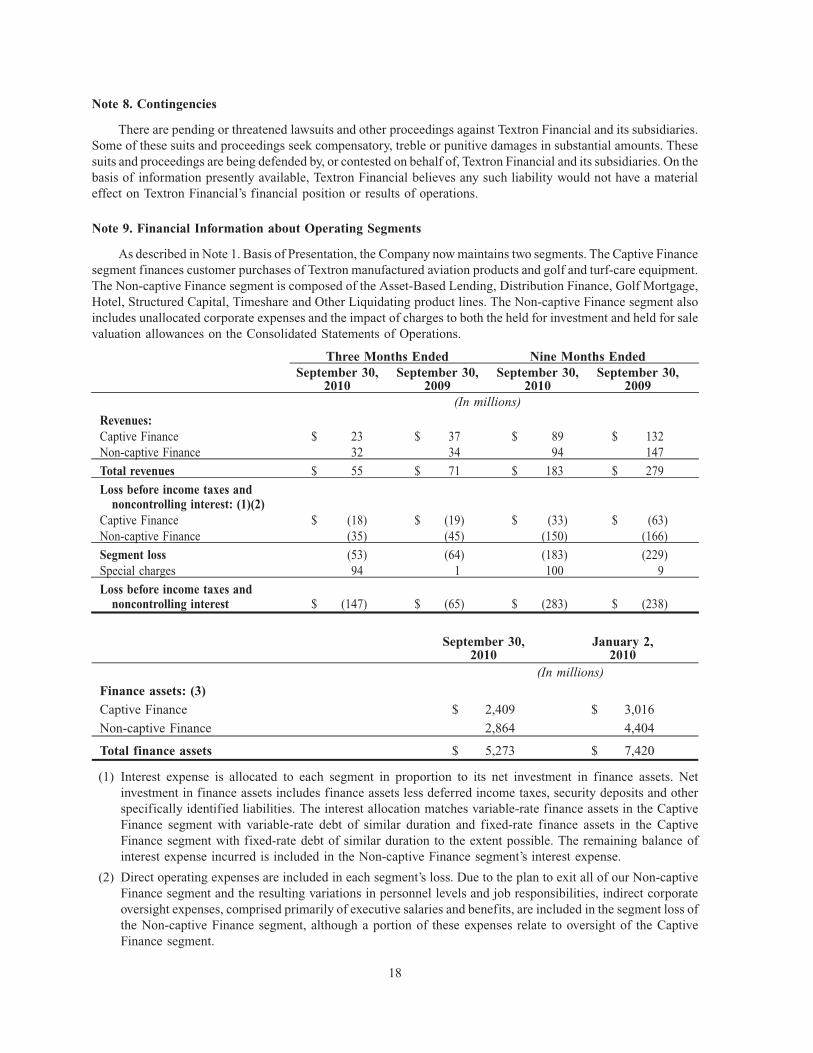
Note 9. Financial Information about Operating Segments
As described in Note 1. Basis of Presentation, the Company now maintains two segments. The Captive Financesegment finances customer purchases of Textron manufactured aviation products and golf and turf-care equipment.The Non-captive Finance segment is composed of the Asset-Based Lending, Distribution Finance, Golf Mortgage,Hotel, Structured Capital, Timeshare and Other Liquidating product lines. The Non-captive Finance segment alsoincludes unallocated corporate expenses and the impact of charges to both the held for investment and held for salevaluation allowances on the Consolidated Statements of Operations.
September 30,2010
September 30,2009
September 30,2010
September 30,2009
Three Months Ended Nine Months Ended
(In millions)
Revenues:Captive Finance $ 23 $ 37 $ 89 $ 132Non-captive Finance 32 34 94 147
Total revenues $ 55 $ 71 $ 183 $ 279
Loss before income taxes andnoncontrolling interest: (1)(2)
Captive Finance $ (18) $ (19) $ (33) $ (63)Non-captive Finance (35) (45) (150) (166)
Segment loss (53) (64) (183) (229)Special charges 94 1 100 9
Loss before income taxes andnoncontrolling interest $ (147) $ (65) $ (283) $ (238)
September 30,2010
January 2,2010
(In millions)
Finance assets: (3)
Captive Finance $ 2,409 $ 3,016
Non-captive Finance 2,864 4,404
Total finance assets $ 5,273 $ 7,420
(1) Interest expense is allocated to each segment in proportion to its net investment in finance assets. Netinvestment in finance assets includes finance assets less deferred income taxes, security deposits and otherspecifically identified liabilities. The interest allocation matches variable-rate finance assets in the CaptiveFinance segment with variable-rate debt of similar duration and fixed-rate finance assets in the CaptiveFinance segment with fixed-rate debt of similar duration to the extent possible. The remaining balance ofinterest expense incurred is included in the Non-captive Finance segment’s interest expense.
(2) Direct operating expenses are included in each segment’s loss. Due to the plan to exit all of our Non-captiveFinance segment and the resulting variations in personnel levels and job responsibilities, indirect corporateoversight expenses, comprised primarily of executive salaries and benefits, are included in the segment loss ofthe Non-captive Finance segment, although a portion of these expenses relate to oversight of the CaptiveFinance segment.
18

(3) Finance assets include: finance receivables; equipment on operating leases, net of accumulated depreciation;repossessed assets and properties; operating assets received in satisfaction of troubled finance receivables;investments in other marketable securities; retained interests in securitizations and other short- and long-terminvestments (some of which are classified in Other assets on Textron Financial’s Consolidated BalanceSheets).
Item 2. Management’s Discussion and Analysis of Financial Condition and Results of Operations
Liquidity and Capital Resources
In light of our plan to exit the Non-captive Finance business, we expect to substantially rely on cash fromfinance receivable collections to fund maturing debt obligations. During the first nine months of 2010, weliquidated $2.2 billion of managed finance receivables. These managed finance receivable reductions occurred inboth of our segments and all of our product lines, but were primarily driven by Non-captive Finance reductions,including $862 million in Distribution Finance and $295 million in Timeshare. These reductions resulted from thecombination of scheduled finance receivable collections, sales, discounted payoffs, repossession of collateral,charge-offs and impairment charges recorded as Portfolio losses, net of gains, in our Consolidated Statements ofOperations. Finance receivable reductions in the Distribution Finance product line included sales of $375 million offinance receivables. In addition, the reduction in managed finance receivables included $631 million of liquidationsin the Captive Finance segment primarily as a result of reduced loan and lease originations and a sale of $84 millionof finance receivables. During 2010, we expect to liquidate approximately $2.4 billion of managed financereceivables, net of originations. We expect a portion of the liquidations, net of originations, will be in the CaptiveFinance segment. The originations of the Captive Finance segment exclude finance receivables serviced on behalfof another finance subsidiary of Textron.
In order to meet our capital needs, we could access either secured or unsecured debt markets. However, wehave borrowed available cash from Textron during 2010 through an intercompany borrowing arrangement as it hasbeen in the collective economic interest of Textron Financial and Textron to do so. We decreased our outstandingintercompany loan balance with Textron to $263 million at September 30, 2010 from $447 million at January 2,2010. In addition, during the first nine months of 2010, we retired $1.7 billion of long-term and securitized on-balance sheet debt.
We measure the progress of our exit plan related to the Non-captive Finance segment, in part, based on thepercentage of managed finance receivable and other finance asset reductions converted to cash. During the firstnine months of 2010, the Non-captive Finance segment achieved a 94% cash conversion ratio as compared to 95%for the year ended January 2, 2010. This performance was primarily driven by sales of $375 million of financereceivables in the Distribution Finance product line during the first nine months of 2010. We expect this ratio tocontinue to decline over the duration of our exit plan due to the change in mix from shorter term assets in theDistribution Finance and Asset-Based Lending product lines to longer term assets in our Timeshare, Golf Mortgageand Structured Finance product lines and the existence of a higher concentration of nonaccrual finance receivables.
Under a Support Agreement between Textron Financial and Textron, Textron is required to ensure that TextronFinancial maintains fixed charge coverage of no less than 125% and consolidated shareholder’s equity of no lessthan $200 million. In the first nine months of 2010, Textron Financial’s fixed charge coverage ratio was below therequired 125%. Textron made cash payments of $155 million, $82 million and $71 million on October 12, 2010,July 12, 2010 and April 9, 2010, respectively, to Textron Financial, which were reflected as capital contributions, tomaintain compliance with the fixed charge coverage ratio. Textron also made a cash payment of $75 million onJanuary 12, 2010 to maintain compliance with the 2009 fixed charge coverage ratio.
19
Results of Operations
Revenues
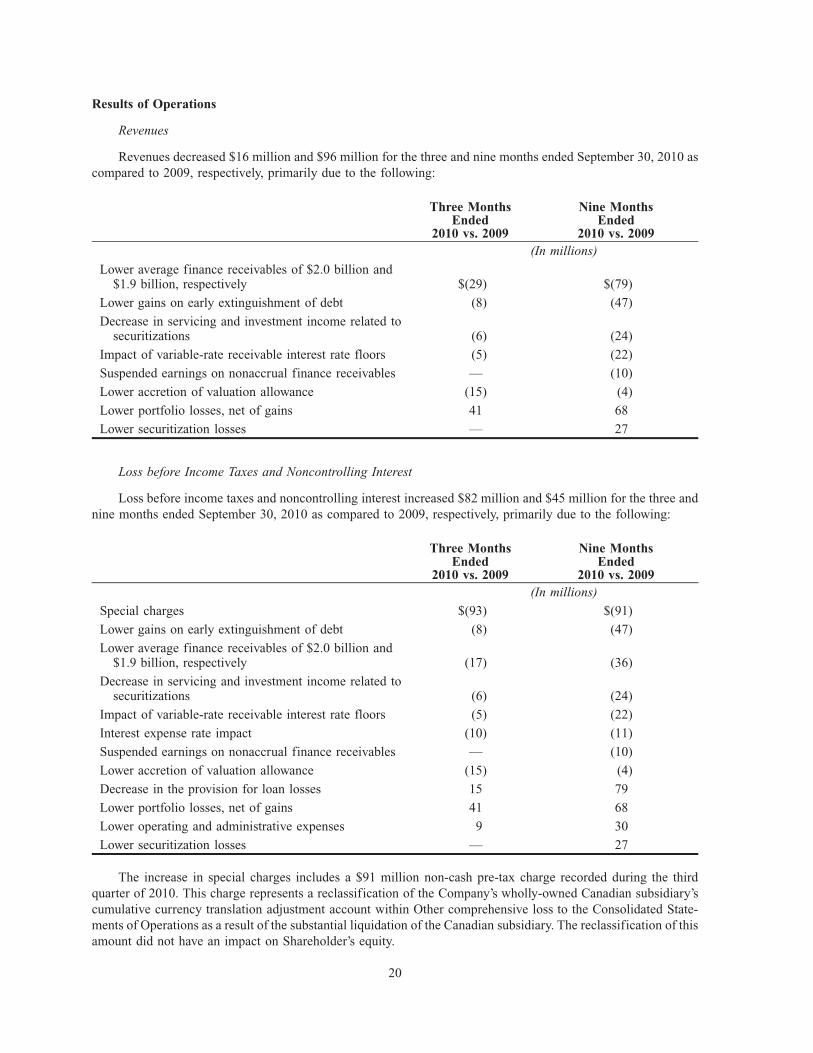
Revenues decreased $16 million and $96 million for the three and nine months ended September 30, 2010 ascompared to 2009, respectively, primarily due to the following:
Three MonthsEnded
2010 vs. 2009
Nine MonthsEnded
2010 vs. 2009(In millions)
Lower average finance receivables of $2.0 billion and$1.9 billion, respectively $(29) $(79)
Lower gains on early extinguishment of debt (8) (47)
Decrease in servicing and investment income related tosecuritizations (6) (24)
Impact of variable-rate receivable interest rate floors (5) (22)
Suspended earnings on nonaccrual finance receivables — (10)
Lower accretion of valuation allowance (15) (4)
Lower portfolio losses, net of gains 41 68
Lower securitization losses — 27
Loss before Income Taxes and Noncontrolling Interest
Loss before income taxes and noncontrolling interest increased $82 million and $45 million for the three andnine months ended September 30, 2010 as compared to 2009, respectively, primarily due to the following:
Three MonthsEnded
2010 vs. 2009
Nine MonthsEnded
2010 vs. 2009(In millions)
Special charges $(93) $(91)
Lower gains on early extinguishment of debt (8) (47)
Lower average finance receivables of $2.0 billion and$1.9 billion, respectively (17) (36)
Decrease in servicing and investment income related tosecuritizations (6) (24)
Impact of variable-rate receivable interest rate floors (5) (22)
Interest expense rate impact (10) (11)
Suspended earnings on nonaccrual finance receivables — (10)
Lower accretion of valuation allowance (15) (4)
Decrease in the provision for loan losses 15 79
Lower portfolio losses, net of gains 41 68
Lower operating and administrative expenses 9 30
Lower securitization losses — 27
The increase in special charges includes a $91 million non-cash pre-tax charge recorded during the thirdquarter of 2010. This charge represents a reclassification of the Company’s wholly-owned Canadian subsidiary’scumulative currency translation adjustment account within Other comprehensive loss to the Consolidated State-ments of Operations as a result of the substantial liquidation of the Canadian subsidiary. The reclassification of thisamount did not have an impact on Shareholder’s equity.
20
The provision for loan losses decreased during the three and nine month periods of 2010 as compared to 2009primarily due to a decrease in new accounts identified as nonaccrual during the period.
Portfolio losses, net of gains, decreased during the three and nine month periods of 2010 as compared to 2009primarily as a result of a decrease in discounts taken on the sale or early termination of finance receivable assetsassociated with the liquidation of Distribution Finance receivables, lower impairment charges in the StructuredCapital portfolio and $23 million of gains from the sale of two finance receivable portfolios in the DistributionFinance product line in the first and third quarters of 2010.
Operating and administrative expenses decreased during the first three and nine month periods of 2010 ascompared to 2009 mostly due to lower salaries and benefits expense associated with a reduction in workforce as aresult of our exit plan.
Accretion of valuation allowance represents the recognition of interest earnings in excess of a loan’scontractual rate as a result of the discount rate utilized to record the loan at fair value in previous periods. Theseinterest earnings are recognized over the remaining life of the portfolio to the extent the valuation allowance is notexpected to be utilized to absorb losses associated with sales, discounted payoffs or credit losses.
Income Tax Benefit
For the three months ended September 30, 2010, the difference between the statutory and the effective tax rateis primarily attributable to the nondeductible portion of the cumulative currency translation charge resulting fromthe substantial liquidation of one of the Company’s wholly-owned Canadian subsidiaries and unrecognized taxbenefits and interest, the majority of which is associated with leveraged leases, partially offset by a benefit for statetaxes and a change in management’s assessment of the realizability of a deferred tax asset in one of the Company’swholly-owned Canadian subsidiaries.
For the nine months ended September 30, 2010, the difference between the statutory and the effective tax rate isprimarily attributable to the nondeductible portion of the cumulative currency translation charge resulting from thesubstantial liquidation of one of the Company’s wholly-owned Canadian subsidiaries and unrecognized tax benefitsand interest, the majority of which is associated with leveraged leases, partially offset by a U.S. tax benefit related toa change in the functional currency of one of the Company’s wholly-owned Canadian subsidiaries and a change inmanagement’s assessment of the realizability of a deferred tax asset in another wholly-owned Canadian subsidiary.
Forward-looking Information
Certain statements in this Quarterly Report on Form 10-Q and other oral and written statements made by usfrom time to time are forward-looking statements, including those that discuss strategies, goals, outlook or othernon-historical matters, or project revenues, income, returns or other financial measures. These forward-lookingstatements speak only as of the date on which they are made, and we undertake no obligation to update or revise anyforward-looking statements. These forward-looking statements are subject to risks and uncertainties that may causeactual results to differ materially from those contained in the statements, such as the Risk Factors contained in ourAnnual Report on Form 10-K, our Quarterly Reports on Form 10-Q and including the following: (a) changes inworldwide economic, political or regulatory conditions that impact interest and foreign exchange rates; (b) theability to maintain portfolio credit quality and to realize full value of finance receivables and of assets acquiredupon foreclosure of finance receivables; (c) the ability to control costs and successful implementation of variouscost-reduction programs; (d) increases in pension expenses and employee and retiree medical benefits; (e) theimpact of changes in tax legislation; (f) the ability to maintain certain minimum levels of financial performancerequired under our committed bank line of credit and under our Support Agreement with Textron; (g) access tofinancing, including securitizations, at competitive rates; (h) access to equity in the form of retained earnings andcapital contributions from Textron; (i) uncertainty in estimating contingent liabilities and establishing reserves toaddress such contingencies; (j) risks and uncertainties related to dispositions, including difficulties or unantic-ipated expenses in connection with the consummation of dispositions or the disruption of current plans andoperations; (k) the ability to successfully exit from our commercial finance business, other than the captive financebusiness; (l) uncertainty in estimating the market value of our Finance receivables held for sale and our Allowancefor losses on finance receivables held for investment; (m) bankruptcy or other financial problems at major
21
customers that could cause disruptions or difficulty in collecting amounts owed by such customers; (n) legislative orregulatory actions impacting our operations; (o) difficult conditions in the financial markets which may adverselyimpact our ability to obtain financing which enables us to offer competitive terms for our new finance receivableoriginations and, with respect to businesses which we are exiting, our customers’ ability to obtain alternativefinancing negatively impacting their ability to repay amounts owed to us; and (p) continued volatility in theeconomy resulting in a prolonged downturn in the markets in which we do business.
Item 4. Controls and Procedures
We have carried out an evaluation, under the supervision and with the participation of our management,including our President and Chief Executive Officer (the “CEO”) and our Executive Vice President and ChiefFinancial Officer (the “CFO”), of the effectiveness of the design and operation of our disclosure controls andprocedures (as defined in Rule 13a-15(e) and 15d-15(e) under the Securities Exchange Act of 1934, as amended(the “Act”)) as of the end of the fiscal quarter covered by this report. Based upon that evaluation, our CEO and CFOconcluded that our disclosure controls and procedures are effective in providing reasonable assurance that (a) theinformation required to be disclosed by us in the reports that we file or submit under the Act is recorded, processed,summarized and reported within the time periods specified in the Securities and Exchange Commission’s rules andforms, and (b) such information is accumulated and communicated to our management, including our CEO andCFO, as appropriate to allow timely decisions regarding required disclosure.
There were no changes in Textron Financial’s internal control over financial reporting during the quarter endedSeptember 30, 2010 that have materially affected, or are reasonably likely to materially affect, our internal controlover financial reporting.
22
PART II. OTHER INFORMATION
Item 1A. Risk Factors
Our business, financial condition and results of operations are subject to various risks, including the riskfactors discussed below and in our Annual Report on Form 10-K for the fiscal year ended January 2, 2010, all ofwhich should be carefully considered by investors in our securities. The risks discussed in our SEC filings are thosethat we believe currently are the most significant, although additional risks not presently known to us or that wecurrently deem less significant also may impact our business, financial condition or results of operations, perhapsmaterially.
Difficult conditions in the financial markets have adversely affected our business and results of operationsand we do not expect these conditions to improve in the near future.
Our financial performance depends on the quality of loans, leases and other finance assets in our portfolio.Portfolio quality may be adversely affected by several factors, including finance receivable underwriting proce-dures, collateral quality, or geographic or industry concentrations, the ability of our customers to obtain alternativefinancing as we exit certain lines of business, the effect of the economic downturn on our customers’ businesses, aswell as the broader deterioration of the financial markets. As a result of the tumultuous conditions in the financialmarkets over the past two years, many lenders and institutional investors have reduced and, in some cases, ceased toprovide funding to borrowers. This market turmoil and tightening of credit have led to an increased level ofcommercial and consumer delinquencies and defaults, lack of consumer confidence, increased market volatility,widespread reduction of business activity and bankruptcy filings. Valuations of the types of collateral securing ourtimeshare and other portfolios have been and may continue to be adversely affected by increased consumerdelinquencies, the reduction in business activity and bankruptcy proceedings involving our borrowers. Valuations ofthe types of collateral securing our captive finance portfolio, particularly valuations of used aircraft, have decreasedsignificantly and may continue to decrease if weak economic conditions continue. Declining collateral values couldresult in greater delinquencies and foreclosures as customers elect to discontinue payments on loan balances whichexceed asset values. Bankruptcy proceedings involving our borrowers may prevent or delay our ability to exerciseour rights and remedies and realize the full value of our collateral. Our losses may increase if our collateral cannotbe realized or is liquidated at prices not sufficient to recover the full amount of our finance receivable portfolio. Inparticular, declining collateral values in the portion of our captive finance portfolio secured by non-Textronmanufactured aircraft may result in increased losses as we may have greater difficulty liquidating these assets.Further deterioration of our ability to successfully collect our finance receivable portfolio and to resolve problemaccounts may adversely affect our cash flow, profitability and financial condition. If these negative marketconditions persist or worsen, we could experience continuing or increased adverse effects on our financial conditionand results of operations.
Item 6. Exhibits
12 Computation of Ratio of Earnings to Fixed Charges
31.1 Certification of Chief Executive Officer Pursuant to Rule 13a-14(a)
31.2 Certification of Chief Financial Officer Pursuant to Rule 13a-14(a)
32.1 Certification of Chief Executive Officer Pursuant to 18 U.S.C. Section 1350
32.2 Certification of Chief Financial Officer Pursuant to 18 U.S.C. Section 1350
23

SIGNATURES
Pursuant to the requirements of the Securities Exchange Act of 1934, the registrant has duly caused this reportto be signed on its behalf by the undersigned thereunto duly authorized.
Textron Financial Corporation
/s/ Thomas J. Cullen
Thomas J. CullenExecutive Vice President and Chief Financial Officer(Principal Financial Officer)
Date: October 28, 2010
24
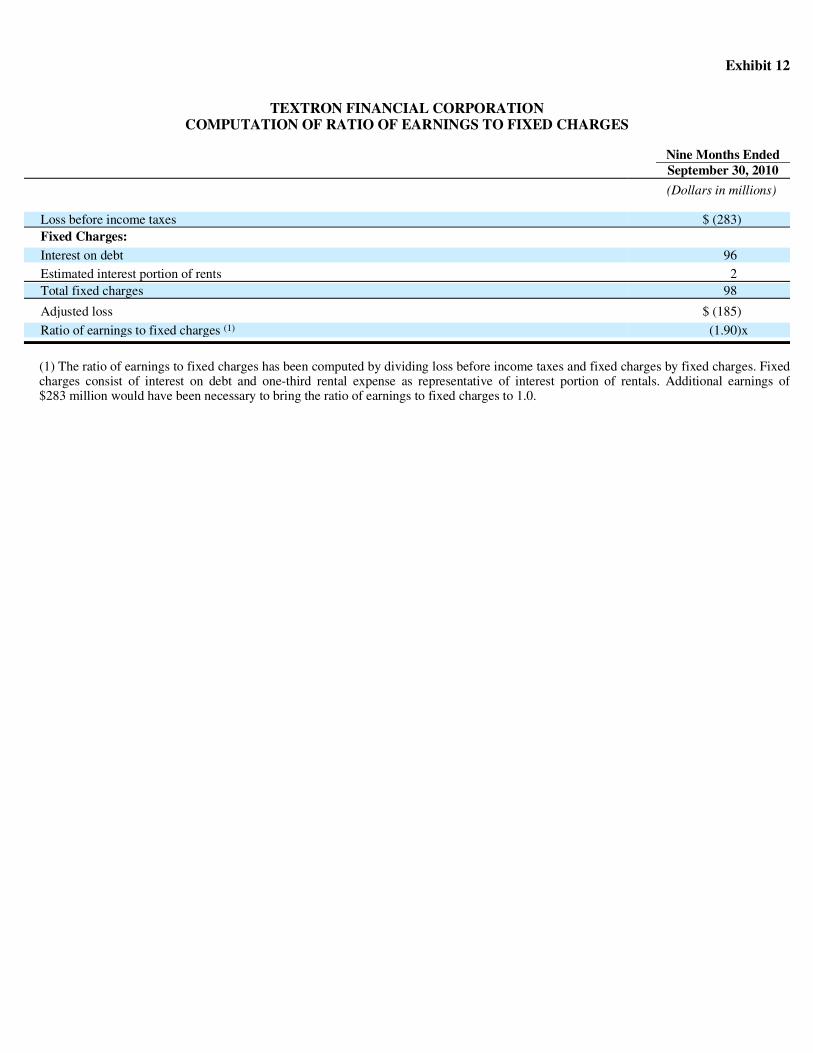
Exhibit 12
TEXTRON FINANCIAL CORPORATION COMPUTATION OF RATIO OF EARNINGS TO FIXED CHARGES
(1) The ratio of earnings to fixed charges has been computed by dividing loss before income taxes and fixed charges by fixed charges. Fixedcharges consist of interest on debt and one-third rental expense as representative of interest portion of rentals. Additional earnings of$283 million would have been necessary to bring the ratio of earnings to fixed charges to 1.0.
Nine Months Ended September 30, 2010
(Dollars in millions) Loss before income taxes $ (283)
Fixed Charges:
Interest on debt 96 Estimated interest portion of rents 2
Total fixed charges 98
Adjusted loss $ (185)
Ratio of earnings to fixed charges (1) (1.90)x

Exhibit 31.1TEXTRON FINANCIAL CORPORATION
CERTIFICATION OF CHIEF EXECUTIVE OFFICER PURSUANT TO RULE 13a-14(a)
I, Warren R. Lyons, President and Chief Executive Officer of Textron Financial Corporation certify that:
1. I have reviewed this quarterly report on Form 10-Q of Textron Financial Corporation;
2. Based on my knowledge, this report does not contain any untrue statement of a material fact or omit to state a material fact necessary tomake the statements made, in light of the circumstances under which such statements were made, not misleading with respect to the periodcovered by this report;
3. Based on my knowledge, the financial statements, and other financial information included in this report, fairly present in all materialrespects the financial condition, results of operations and cash flows of the registrant as of, and for, the periods presented in this report;
4. The registrant’s other certifying officer and I are responsible for establishing and maintaining disclosure controls and procedures (as definedin Exchange Act Rules 13a-15(e) and 15d-15(e)) and internal control over financial reporting (as defined in Exchange Act Rules 13a-15(f)and 15d-15(f)) for the registrant and have:
a) designed such disclosure controls and procedures, or caused such disclosure controls and procedures to be designed under oursupervision, to ensure that material information relating to the registrant, including its consolidated subsidiaries, is made known to us byothers within those entities, particularly during the period in which this report is being prepared;
b) designed such internal control over financial reporting, or caused such internal control over financial reporting to be designed under oursupervision, to provide reasonable assurance regarding the reliability of financial reporting and the preparation of financial statements forexternal purposes in accordance with generally accepted accounting principles;
c) evaluated the effectiveness of the registrant’s disclosure controls and procedures and presented in this report our conclusions about theeffectiveness of the disclosure controls and procedures, as of the end of the period covered by this report based on such evaluation; and
d) disclosed in this report any change in the registrant’s internal control over financial reporting that occurred during the registrant’s mostrecent fiscal quarter that has materially affected, or is reasonably likely to materially affect, the registrant’s internal control over financialreporting; and
5. The registrant’s other certifying officer and I have disclosed, based on our most recent evaluation of internal control over financialreporting, to the registrant’s auditors and the audit committee of registrant’s board of directors (or persons performing the equivalent function):
a) all significant deficiencies and material weaknesses in the design or operation of internal control over financial reporting which arereasonably likely to adversely affect the registrant’s ability to record, process, summarize and report financial information; and
b) any fraud, whether or not material, that involves management or other employees who have a significant role in the registrant’s internal control over financial reporting.
Date: October 28, 2010 /s/ Warren R. Lyons Warren R. Lyons President and Chief Executive Officer

Exhibit 31.2TEXTRON FINANCIAL CORPORATION
CERTIFICATION OF CHIEF FINANCIAL OFFICER PURSUANT TO RULE 13a-14(a)
I, Thomas J. Cullen, Executive Vice President and Chief Financial Officer of Textron Financial Corporation certify that:
1. I have reviewed this quarterly report on Form 10-Q of Textron Financial Corporation;
2. Based on my knowledge, this report does not contain any untrue statement of a material fact or omit to state a material fact necessary tomake the statements made, in light of the circumstances under which such statements were made, not misleading with respect to the periodcovered by this report;
3. Based on my knowledge, the financial statements, and other financial information included in this report, fairly present in all materialrespects the financial condition, results of operations and cash flows of the registrant as of, and for, the periods presented in this report;
4. The registrant’s other certifying officer and I are responsible for establishing and maintaining disclosure controls and procedures (as definedin Exchange Act Rules 13a-15(e) and 15d-15(e)) and internal control over financial reporting (as defined in Exchange Act Rules 13a-15(f)and 15d-15(f)) for the registrant and have:
a) designed such disclosure controls and procedures, or caused such disclosure controls and procedures to be designed under oursupervision, to ensure that material information relating to the registrant, including its consolidated subsidiaries, is made known to us byothers within those entities, particularly during the period in which this report is being prepared;
b) designed such internal control over financial reporting, or caused such internal control over financial reporting to be designed under oursupervision, to provide reasonable assurance regarding the reliability of financial reporting and the preparation of financial statements forexternal purposes in accordance with generally accepted accounting principles;
c) evaluated the effectiveness of the registrant’s disclosure controls and procedures and presented in this report our conclusions about theeffectiveness of the disclosure controls and procedures, as of the end of the period covered by this report based on such evaluation; and
d) disclosed in this report any change in the registrant’s internal control over financial reporting that occurred during the registrant’s mostrecent fiscal quarter that has materially affected, or is reasonably likely to materially affect, the registrant’s internal control over financialreporting; and
5. The registrant’s other certifying officer and I have disclosed, based on our most recent evaluation of internal control over financialreporting, to the registrant’s auditors and the audit committee of registrant’s board of directors (or persons performing the equivalent function):
a) all significant deficiencies and material weaknesses in the design or operation of internal control over financial reporting which arereasonably likely to adversely affect the registrant’s ability to record, process, summarize and report financial information; and
b) any fraud, whether or not material, that involves management or other employees who have a significant role in the registrant’s internal control over financial reporting.
Date: October 28, 2010 /s/ Thomas J. Cullen Thomas J. Cullen Executive Vice President and Chief Financial Officer
Exhibit 32.1TEXTRON FINANCIAL CORPORATION
CERTIFICATION PURSUANT TO 18 U.S.C. SECTION 1350,
AS ADOPTED PURSUANT TO SECTION 906 OF THE SARBANES-OXLEY ACT OF 2002
In connection with the Quarterly Report of Textron Financial Corporation (the “Company”) on Form 10-Q for the period ended September 30, 2010 as filed with the Securities and Exchange Commission on the Date hereof (the “Report”), I, Warren R. Lyons, President and Chief Executive Officer of the Company, certify, pursuant to 18 U.S.C. § 1350, as adopted pursuant to § 906 of the Sarbanes-Oxley Act of 2002, that to my knowledge:
(1) The Report fully complies with the requirements of section 13(a) or 15(d) of the Securities Exchange Act of 1934; and (2) The information contained in the Report fairly presents, in all material respects, the financial condition and results of operations of the
Company.
Textron Financial Corporation
Date: October 28, 2010 /s/ Warren R. Lyons Warren R. Lyons President and Chief Executive Officer
Exhibit 32.2TEXTRON FINANCIAL CORPORATION
CERTIFICATION PURSUANT TO 18 U.S.C. SECTION 1350,
AS ADOPTED PURSUANT TO SECTION 906 OF THE SARBANES-OXLEY ACT OF 2002
In connection with the Quarterly Report of Textron Financial Corporation (the “Company”) on Form 10-Q for the period ended September 30, 2010 as filed with the Securities and Exchange Commission on the Date hereof (the “Report”), I, Thomas J. Cullen, ExecutiveVice President and Chief Financial Officer of the Company, certify, pursuant to 18 U.S.C. § 1350, as adopted pursuant to § 906 of theSarbanes-Oxley Act of 2002, that to my knowledge:
(1) The Report fully complies with the requirements of section 13(a) or 15(d) of the Securities Exchange Act of 1934; and (2) The information contained in the Report fairly presents, in all material respects, the financial condition and results of operations of the
Company.
Textron Financial Corporation
Date: October 28, 2010 /s/ Thomas J. Cullen Thomas J. Cullen Executive Vice President and Chief Financial Officer