form 51-102f4 business acquisition report 1 · form 51-102f4 business acquisition report item 1 -...
TRANSCRIPT

Form 51-102F4
BUSINESS ACQUISITION REPORT
Item 1 - Identity of Company 1.1 Name and Address of Company
Constellation Software Inc. (“Constellation” or the “Company”) 20 Adelaide Street East, Suite 1200 Toronto, ON M5C 2T6
1.2 Executive Officer
Jamal Baksh, CFO (416) 861-9677
Item 2 - Details of Acquisition 2.1 Nature of Business Acquired
Constellation acquired 100% of the shares of Netherlands based Total Specific Solutions (TSS) B.V. (“TSS”). TSS is the largest vertical market software (“VMS”) business based in the Netherlands, with offerings for the general practitioner, pharmacy, long term care, mental care, property tax, and civil affairs markets. It also owns several non-VMS businesses, primarily involved in information technology services.
2.2 Date of Acquisition
December 31st , 2013 2.3 Consideration
Total consideration for the transaction was €240 million before adjusting for net tangible asset adjustments and claims under the representations and warranties of the purchase and sale agreement. Constellation amended its existing credit facility to add a new one year term loan in the amount of US$350 million which could only be used for the purposes of funding the TSS acquisition and related expenses. Constellation is in discussions with a number of European and North American financial institutions about providing stand-alone debt financing for TSS to replace a portion of the new one year term loan. In addition, in accordance with the terms of the purchase and sale agreement and

preliminary agreed upon terms sheets, Constellation and the sellers of TSS are currently negotiating in good faith to reach agreement on a shareholders agreement pursuant to which the sellers and members of TSS’ executive management team could acquire a significant minority stake in TSS.
2.4 Effect on Financial Position Included in this report is the unaudited pro forma consolidated statement of income for Constellation (the “Pro Forma Statement”), which is based upon the historical financial statements of Constellation and TSS, being the Acquired Business. The Pro Forma Statement is provided for illustrative purposes only and is not intended to represent, or be indicative of, the consolidated results of operations of Constellation that would have been reported had the acquisition of the Acquired Business been completed as of the date presented. Accordingly, the Pro Forma Statement should not be taken as representative of the future results of operations of the Company. Constellation’s statement of financial position dated as at December 31, 2013, as filed with Constellation’s consolidated financial statements for the year ended December 31, 2013, includes the Acquired Business and is available at www.sedar.com. The provisional acquisition accounting of the Acquired Business used in the Pro Forma Statement is based upon Constellation’s provisional estimates, and Constellation expects to make adjustments to the provisional accounting related to the application of the acquisition method between the date of this report and December 31, 2014. Differences between the provisional and final acquisition related accounting, including the measurement of identifiable assets and liabilities assumed could be material and, as such, may have a material impact on the Pro Forma Statement. The Pro Forma Statement does not reflect the impact of any potential operational efficiencies, cost savings or economies of scale that Constellation may achieve with respect to the combined operations of Constellation and the Acquired Business. The Pro Forma Statement should be read in conjunction with Constellation’s consolidated financial statements and accompanying notes for its fiscal year ended December 31, 2013 which are available at www.sedar.com, as well as in conjunction with the audited financial statements of the Acquired Business for the year ended December 31, 2013 included herein.
2.5 Prior Valuations
None.

2.6 Parties to Transaction
The transaction is not with an informed person, associate or affiliate of Constellation as such terms are defined under National Instrument 51-102 – Continuous Disclosure Obligations.
2.7 Date of Report
March 6, 2014 Item 3 - Financial Statements
The following financial statements and related notes thereto are included as part of this Business Acquisition Report:
a) Audited financial statements of the Acquired Business for the year ended December
31, 2013 and audited comparative financial statements for the year ended December 31, 2012.
b) Unaudited pro forma consolidated statement of income for Constellation for the year-
ended December 31, 2013, which is presented as if the acquisition occurred on January 1, 2013.
Forward Looking Statements
Certain statements in this report may contain “forward looking” statements that involve known and unknown risks, uncertainties and other factors that may cause the actual results, performance or achievements of the Company or industry to be materially different from any future results, performance or achievements expressed or implied by such forward-looking statements. Words such as “may”, “will”, “expect”, “believe”, “plan”, “intend”, “should”, “anticipate” and other similar terminology are intended to identify forward looking statements. These statements reflect current assumptions and expectations regarding future events and operating performance and speak only as of the date of this report. Forward looking statements involve significant risks and uncertainties, should not be read as guarantees of future performance or results, and will not necessarily be accurate indications of whether or not such results will be achieved. A number of factors could cause actual results to vary significantly from the results discussed in the forward looking statements, including, but not limited to, the factors discussed under “Risks and Uncertainties” as described in the Company’s most recently filed Management’s Discussion and Analysis (“MD&A”). Although the forward looking statements contained in this report are based upon what management of the Company believes are reasonable assumptions, the Company cannot assure investors that actual results will be consistent with these forward looking statements. The Company assumes no obligation, except as required by law, to update any forward looking statements to reflect new events or circumstances. This report should be viewed in conjunction with the Company’s other publicly available filings, copies of which can be obtained electronically on SEDAR at www.sedar.com.

Total Specific Solutions (TSS) B.V.
at Blaricum
Carve out Financial Statements 2013

2
Table of contents
Page
INCOME STATEMENT FOR THE YEAR ENDED 31 DECEMBER 2013 ....................................... 3 STATEMENT OF COMPREHENSIVE INCOME FOR THE YEAR ENDED 31 DECEMBER 2013 .............. 4 STATEMENT OF FINANCIAL POSITION AS AT 31 DECEMBER 2013 ....................................... 5 STATEMENT OF CHANGES IN EQUITY ....................................................................... 7 STATEMENT OF CASH FLOWS FOR THE YEAR ENDED 31 DECEMBER 2013 ............................. 8 NOTES TO THE CARVE OUT FINANCIAL STATEMENTS .................................................... 9

3
INCOME STATEMENT FOR THE YEAR ENDED 31 DECEMBER 2013
In thousands of euros Note 2013 2012
Revenue 6 175,893 177,292 Cost of sales -23,700 -26,258
Gross profit 152,193 151,034 Wages and salaries 7 -92,364 -85,007 Depreciation, amortisation and impairments -13,710 -15,955 Other operating expenses 31 -32,790 -30,472
Result from operating activities 13,329 19,600 Finance income 575 942 Finance expenses -58 -2,821
Result before tax 13,846 17,721 Income tax expenses 8 -3,733 -1,934
Result for the year 10,113 15,787

4
STATEMENT OF COMPREHENSIVE INCOME FOR THE YEAR ENDED 31 DECEMBER 2013
In thousands of euros Note 2013 2012
Result for the year 10,113 15,787 Items that will or may be reclassified to profit or loss Exchange result arising on translation of foreign operations -21 -25 Cash flow hedge 14, 23 627 77 Income tax relating to components of other comprehensive income 27 -157 -19
Total comprehensive income for the year 10,562 15,820
Result for the year attributable to: Owners of the parent 8,763
13,190 Non-controlling interest 1,350 2,597
10,113 15,787
Total comprehensive income attributable to: Owners of the parent 9,118
13,248
Non-controlling interest 1,444 2,572
10,562 15,820

5
STATEMENT OF FINANCIAL POSITION AS AT 31 DECEMBER 2013
In thousands of euros Note 31/12/2013 31/12/2012 ASSETS Property, plant and equipment 9 8,857 8,471 Intangible assets 10,11,12 104,665 107,467 Deferred tax assets 27 6,527 8,507 Loans receivables 15 555 1,180
Total non-current assets 120,604 125,625 Trade receivables 16 18,525 25,606 Prepaid expenses 17 5,349 5,333 Work in progress 3,771 4,736 Other receivables 16 2,128 7,329 Cash and cash equivalents 18 22,744 24,496 Total current assets 52,517 67,500
Total assets 173,121 193,125
6
In thousands of euros Note 31/12/2013 31/12/2012
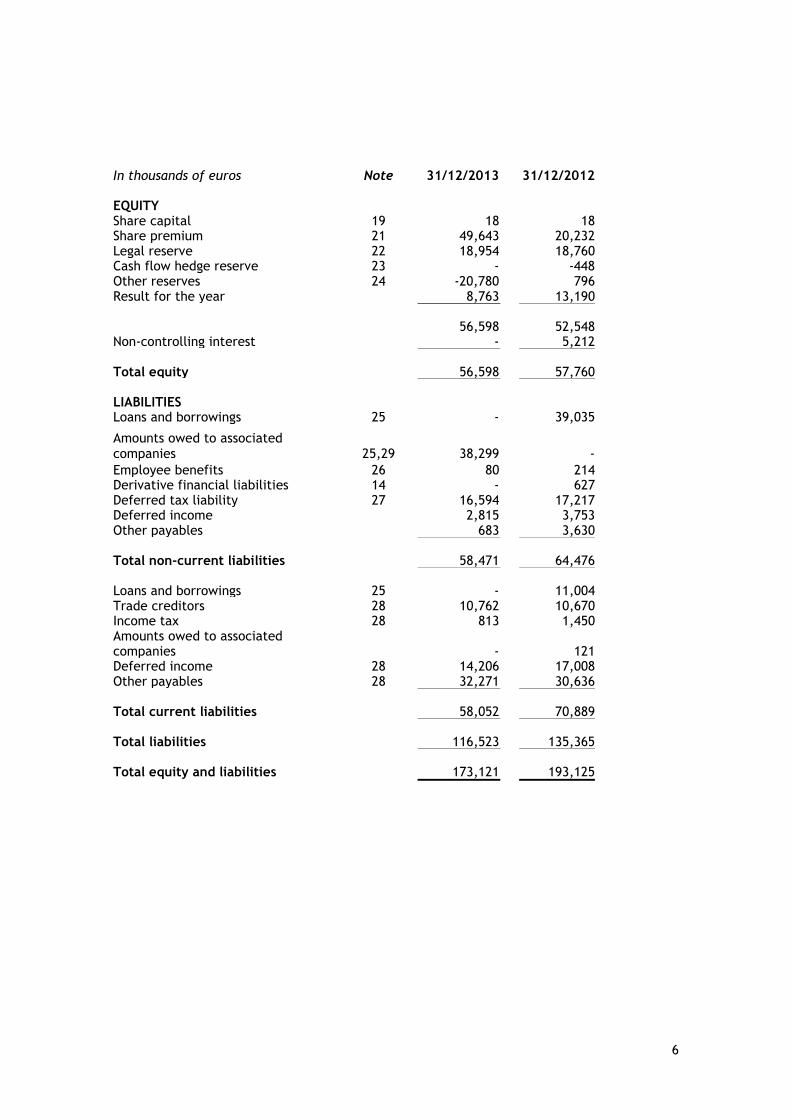
EQUITY Share capital 19 18 18 Share premium 21 49,643 20,232 Legal reserve 22 18,954 18,760 Cash flow hedge reserve 23 - -448 Other reserves 24 -20,780 796 Result for the year 8,763 13,190
56,598 52,548 Non-controlling interest - 5,212 Total equity 56,598 57,760 LIABILITIES Loans and borrowings 25 - 39,035
Amounts owed to associated companies 25,29 38,299 -
Employee benefits 26 80 214 Derivative financial liabilities 14 - 627 Deferred tax liability 27 16,594 17,217 Deferred income 2,815 3,753 Other payables 683 3,630 Total non-current liabilities 58,471 64,476 Loans and borrowings 25 - 11,004 Trade creditors 28 10,762 10,670 Income tax 28 813 1,450 Amounts owed to associated companies ondernemingen
- 121 Deferred income 28 14,206 17,008 Other payables 28 32,271 30,636 Total current liabilities 58,052 70,889 Total liabilities 116,523 135,365 Total equity and liabilities 173,121 193,125

7
STATEMENT OF CHANGES IN EQUITY
In thousands of euros
Share capital
Share premium
Legal reserve
Cash flow
hedge reserve
Other reserves
Result for the
year
Non control-
ling interest
Total
Balance at 1 January 2013 18 20,232 18,760 -448 796 13,190 5,212 57,760
Movement legal reserve - - 215 - -215 - - -
Result previous year - - - - 13,190 -13,190 - -
Result for the year - - - - - 8,763 1,350 10,113
Exchange results - - -21 - - - - -21
Contributed in kind - 29,411 - - - - - 29,411
Change of interests - - - - -34,497 - -6,562 -41,059
Cash flow hedge - - - 448 -54 - - 394
Balance at 31 December 2013 18 49,643 18,954 - -20,780 8,763 - 56,598
8
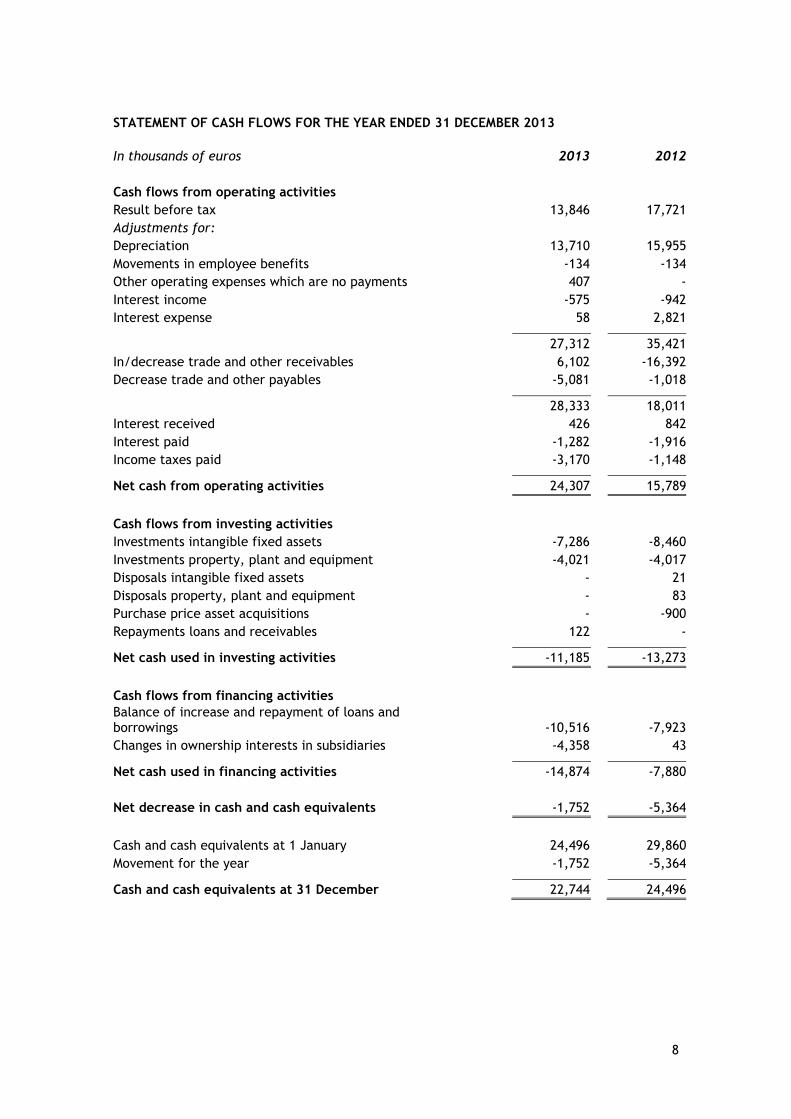
STATEMENT OF CASH FLOWS FOR THE YEAR ENDED 31 DECEMBER 2013
In thousands of euros 2013 2012
Cash flows from operating activities
Result before tax 13,846 17,721
Adjustments for:
Depreciation 13,710 15,955
Movements in employee benefits -134 -134
Other operating expenses which are no payments 407 -
Interest income -575 -942
Interest expense 58 2,821
27,312 35,421
In/decrease trade and other receivables 6,102 -16,392
Decrease trade and other payables -5,081 -1,018
28,333 18,011
Interest received 426 842
Interest paid -1,282 -1,916
Income taxes paid -3,170 -1,148
Net cash from operating activities 24,307 15,789
Cash flows from investing activities
Investments intangible fixed assets -7,286 -8,460
Investments property, plant and equipment -4,021 -4,017
Disposals intangible fixed assets - 21
Disposals property, plant and equipment - 83
Purchase price asset acquisitions - -900
Repayments loans and receivables 122 -
Net cash used in investing activities -11,185 -13,273
Cash flows from financing activities
Balance of increase and repayment of loans and borrowings
-10,516 -7,923
Changes in ownership interests in subsidiaries -4,358 43
Net cash used in financing activities -14,874 -7,880
Net decrease in cash and cash equivalents -1,752 -5,364
Cash and cash equivalents at 1 January 24,496 29,860
Movement for the year -1,752 -5,364
Cash and cash equivalents at 31 December 22,744 24,496

9
NOTES TO THE CARVE OUT FINANCIAL STATEMENTS 1. Reporting entity Total Specific Solutions (TSS) B.V. (further: the Company) is a company domiciled in the Netherlands and founded on 4 November 2008. The ultimate parent company of the Company was Strikwerda Investments B.V. At 31 December 2013 the shares of Total Specific Solutions (TSS) B.V. were acquired by Constellation Software Inc. (CSI). The address of the Company‟s registered office is Blaricum. The carve out financial statements of the Company for the year ended 31 December 2013 comprise the Company and its subsidiaries (together referred to as the “Group”). Comparative figures have been reclassified, where necessary, to reflect the current year's presentation. Group activities The Group is classified as an IT company. The Group advices and develops software solutions on information systems and supplies management advices and training in this field. 2. Accounting Policies Basis of preparation The principal accounting policies adopted in the preparation of the carve out financial statements are set out below. The policies have been consistently applied to all the years presented, unless otherwise stated. The carve out financial statements are presented in Euro, which is also the Group‟s functional currency. Amounts are rounded to the nearest thousand, unless otherwise stated. These carve out financial statements have been prepared in accordance with International Financial Reporting Standards, International Accounting Standards and Interpretations (collectively IFRSs). The preparation of financial statements in compliance with IFRS requires the use of certain critical accounting estimates. It also acquired Group management to exercise judgment in applying the Group‟s accounting policies. The areas where significant judgments and estimates have been made in preparing the carve out financial statements and their effect are disclosed in note 3. As before mentioned, the company was acquired by CSI, except for the following subsidiaries:
- TASS Holding B.V. - TASS B.V. - TASS Belgium N.V. - Rorema Beheer B.V. - Co-Maker B.V.
These carve out financial statements consist of the groups‟ consolidated figures, excluding the above mentioned companies. The following entities are included:
KZA Holding B.V., Blaricum Everest Holding B.V., Blaricum
Kwaliteitszorg in de Automatisering (KZA) B.V., Baarn Everest B.V., „s-Hertogenbosch
Co-Maker Holding B.V., „s-Gravenhage Blueriq B.V., „s-Hertogenbosch
Yonder Holding B.V., Blaricum TSS TH 5 B.V., Apeldoorn
Yonder Nederland B.V., Blaricum TSS TH 4 B.V., Apeldoorn
Yonder SRL, Cluj Napoca, Romania PinkRoccade Local Government B.V., ‟s-Hertogenbosch
PharmaPartners B.V., Oosterhout PinkRoccade Healthcare B.V., Apeldoorn
H.I. Systems B.V., Breda PinkRoccade Gezondheidszorg B.V., Apeldoorn
TSS TH 6 B.V., Apeldoorn Top Talent Consultancy B.V., Baarn

10
Basis of measurement The carve out financial statements have been prepared on a historical cost basis, except for the following items (refer to individual accounting policies for details):
- Financial instruments – cash flow hedge - Deferred tax assets and deferred tax liabilities
Changes in accounting policies The following new standards, interpretations and amendments, effective for the first time from 1 January 2013, have had no material effect on the carve out financial statements:
IFRS 10 Consolidated Financial Statements
IFRS 11 Joint Arrangements
IFRS 12 Disclosure of Interest of Other Entities
IFRS 13 Fair Value Measurement
IAS 19R Employee Benefits
Amended IAS 28 Investments in Associates and Joint Ventures Changes in the following standards, interpretations and amendments, as a result of improvements, have had no material effect on the carve out financial statements:
IFRS 1 First-time Adoption of International Financial Reporting Standards
IAS 1 Presentation of Financial Statements
IAS 16 Property, Plant and Equipment
IAS 32 Financial Instruments: Presentation
IAS 34 Interim Reporting
IAS 36 Recoverable Amount Disclosures for Non-Financial Assets
IAS 39 Novation of Derivatives and Continuation of Hedge Accounting The following new standards, interpretations and amendments, which have not been applied in these carve out financial statements, will or may have an effect on the Group's future financial statements:
Amended IAS 27 Separate Financial Statements
IFRIC 21 Levies
IFRS 9 Financial Instruments
Amended IAS 1 Financial Statement Presentation None of the other new standards, interpretations and amendments are expected to have a material effect on the Group's future financial statements. Basis of consolidation Where the company has control over an investee, it is classified as a subsidiary. The company controls an investee if all three of the following elements are present: power over the investee, exposure to variable returns from the investee, and the ability of the investor to use its power to affect those variable returns. Control is reassessed whenever facts and circumstances indicate that there may be a change in any of these elements of control.
De-facto control exists in situations where the company has the practical ability to direct the relevant activities of the investee without holding the majority of the voting rights. In determining whether de-facto control exists the company considers all relevant facts and circumstances, including:
- The size of the company‟s voting rights relative to both the size and dispersion of other parties who hold voting rights
- Substantive potential voting rights held by the company and by other parties - Other contractual arrangements - Historic patterns in voting attendance.

11
The carve out financial statements present the results of the company and its subsidiaries ("the Group") as if they formed a single entity. Intercompany transactions and balances between group companies are therefore eliminated in full.
The carve out financial statements incorporate the results of business combinations using the acquisition method. In the statement of financial position, the acquiree's identifiable assets, liabilities and contingent liabilities are initially recognised at their fair values at the acquisition date. The results of acquired operations are included in the statement of comprehensive income from the date on which control is obtained. They are deconsolidated from the date on which control ceases. Transactions eliminated on consolidation Intra-group balances and transactions, and any unrealised income and expenses arising from intra-group transactions, are eliminated in preparing the carve out financial statements. Foreign currency Transactions entered into by Group entities in a currency other than the currency of the primary economic environment in which they operate (their "functional currency") are recorded at the rates ruling when the transactions occur. Foreign currency monetary assets and liabilities are translated at the rates ruling at the reporting date. Exchange differences arising on the retranslation of unsettled monetary assets and liabilities are recognised immediately in profit or loss. On consolidation, the results of overseas operations are translated into Euro at rates approximating to those ruling when the transactions took place. All assets and liabilities of overseas operations, including goodwill arising on the acquisition of those operations, are translated at the rate ruling at the reporting date. Exchange differences arising on translating the opening net assets at opening rate and the results of overseas operations at actual rate are recognised in the income statement and accumulated in the foreign exchange reserve. Exchange differences recognised in profit or loss of Group entities' separate financial statements on the translation of long-term monetary items forming part of the Group's net investment in the overseas operation concerned are reclassified to other comprehensive income and accumulated in the foreign exchange reserve on consolidation. Intangible fixed assets - goodwill Goodwill represents the excess of the cost of a business combination over the Group‟s interest in the fair value of identifiable assets, liabilities and contingent liabilities acquired. For all business combinations cost comprised the fair value of assets given, liabilities assumed and equity instruments issued, plus the amount of any non-controlling interests in the acquiree plus, if the business combination is achieved in stages, the fair value of the existing equity interest in the acquiree. Contingent consideration is included in cost at its acquisition date fair value and, in the case of contingent consideration classified as a financial liability, remeasured subsequently through profit or loss. Direct costs of acquisition are recognised immediately as an expense. Goodwill is capitalised as an intangible asset with any impairment in carrying value being charged to the income statement. Where the fair value of identifiable assets, liabilities and contingent liabilities exceed the fair value of consideration paid, the excess is credited in full to the income statement on the acquisition date.

12
Externally acquired intangible assets Externally acquired intangible assets are initially recognised at cost and subsequently amortised on a straight-line basis over their useful economic lives. Intangible asset Useful economic Life Valuation method Licenses and trademarks 10 years Multiple of estimated revenues and profits Customer relationships 10 - 22 years Estimated discounted cash flow Intellectual property rights 5 – 10 years Multiple of estimated revenues and profits Internally generated intangible assets (development expenses) Expenditure on internally developed products is capitalised if it can be demonstrated that:
it is technically feasible to develop the product for it to be sold;
adequate resources are available to complete the development;
there is an intention to complete and sell the product;
the Group is able to sell the product;
sale of the product will generate future economic benefits; and
expenditure on the project can be measured reliably. Capitalised development costs are amortised over the periods the Group expects to benefit from selling the products developed. The amortisation expense is included within the depreciation in the income statement. In general this period amounts 7 years.
Development expenditure not satisfying the above criteria and expenditure on the research phase of internal projects are recognised in the income statement as incurred. Property, plant and equipment Recognition and measurement Items of property, plant and equipment are measured at cost less accumulated depreciation and accumulated impairment losses. Cost includes expenditure that is directly attributable to the acquisition of the asset. Purchased software that is integral to the functionality of the related equipment is capitalised as part of that equipment. When parts of an item of property, plant and equipment have different useful lives, they are accounted for as separate items (major components) of property, plant and equipment. Gains and losses on disposal of an item of property, plant and equipment are determined by comparing the proceeds from disposal with the carrying amount of property, plant and equipment and are recognised net within “depreciation” in profit or loss. Subsequent costs The cost of replacing part of an item of property, plant and equipment is recognised in the carrying amount of the item if it is probable that the future economic benefits embodied within the part will flow to the Group and its cost can be measured reliably. The carrying amount of the replaced part is derecognised. The costs of the day-to-day servicing of property, plant and equipment are recognised in profit or loss as incurred. Depreciation Depreciation is recognised in profit or loss on a straight-line basis over the estimated useful lives of each part of an item of property, plant and equipment. Freehold land is not depreciated. Depreciation on assets under construction (prepayments) does not commence

13
until they are complete and available for use. Depreciation is provided on all other items of property, plant and equipment so as to write off their carrying value over their expected useful economic lives. It is provided at the following rates:
Buildings 11.43-17.67% per annum
Plant and equipment 20-33.33% per annum
Other operating fixed assets 20-33.33% per annum Depreciation methods, useful lives and residual values are reviewed at each reporting date. In 2013 the useful life of certain Other operating fixed assets were changed from three to five years. Impact on 2013 depreciation amounts € 665,000 (lower depreciation). Impairment of non-financial assets (excluding deferred tax assets) Impairment tests on goodwill and other intangible assets with indefinite useful economic lives are undertaken annually at the financial year end. Other non-financial assets are subject to impairment tests whenever events or changes in circumstances indicate that their carrying amount may not be recoverable. Where the carrying value of an asset exceeds its recoverable amount (i.e. the higher of value in use and fair value less costs to sell), the asset is written down accordingly. Where it is not possible to estimate the recoverable amount of an individual asset, the impairment test is carried out on the smallest group of assets to which it belongs for which there are separately identifiable cash flows; its cash generating units („CGUs‟). Goodwill is allocated on initial recognition to each of the Group's CGUs that are expected to benefit from the synergies of the combination giving rise to the goodwill. Impairment charges are included in profit or loss, except for to the amounts previously recognised in other comprehensive income (if applicable). An impairment loss recognised for goodwill is not reversed. Financial assets The Group classifies its financial assets into the category loans and receivables, because of the purpose for which the asset was acquired. The Group has not classified any of its financial assets as held to maturity. Other than financial assets in a qualifying hedging relationship, the Group's accounting policy is as follows: Loans and receivables These assets are non-derivative financial assets with fixed or determinable payments that are not quoted in an active market. They arise principally through the provision of goods and services to customers (e.g. trade receivables), but also incorporate other types of contractual monetary asset. They are initially recognised at fair value plus transaction costs that are directly attributable to their acquisition or issue, and are subsequently carried at amortised cost using the effective interest rate method, less provision for impairment. Impairment provisions are recognised when there is objective evidence (such as significant financial difficulties on the part of the counterparty or default or significant delay in payment) that the concerning company will be unable to collect all of the amounts due under the terms receivable, the amount of such a provision being the difference between the net carrying amount and the present value of the future expected cash flows associated with the impaired receivable. For trade receivables, which are reported net, such provisions are recorded in a separate allowance account with the loss being recognised within other operating expenses in the income statement. On confirmation that the trade receivable will not be collectable, the gross carrying value of the asset is written off against the associated provision.
14
The Group's loans and receivables comprise trade and other receivables and cash and cash equivalents in the statement of financial position. Cash and cash equivalents includes cash in hand, deposits held at call with banks and other short term highly liquid investments with original maturities of three months or less. Bank overdrafts are shown within loans and borrowings in current liabilities on the statement of financial position. Financial liabilities The Group classifies its financial liabilities into the category other financial liabilities, because of the purpose for which the liability was acquired. Other than financial liabilities in a qualifying hedging relationship (see below), the Group's accounting policy is as follows: Bank borrowings are initially recognised at the amount advanced net of any transaction costs directly attributable to the issue of the instrument. Such interest bearing liabilities are subsequently measured at amortised cost using the effective interest rate method, which ensures that any interest expense over the period to repayment is at a constant rate on the balance of the liability carried in the balance sheet. “Interest expense” in this context includes initial transaction costs and premiums payable on redemption, as well as any interest or coupons payable while the liability is outstanding. Other non-derivative financial instruments are measured at amortised cost using the effective interest method, less any impairment losses. Hedge accounting Hedge accounting is applied to financial assets and financial liabilities only where all of the following criteria are met:
At the inception of the hedge there is formal designation and documentation of the hedging relationship and the Group's risk management objective and strategy for undertaking the hedge.
For cash flow hedges, the hedged item in a forecast transaction is highly probable and presents an exposure to variations in cash flows that could ultimately affect profit or loss.
The cumulative change in the fair value of the hedging instrument is expected to be between 80-125% of the cumulative change in the fair value or cash flows of the hedged item attributable to the risk hedged (i.e. it is expected to be highly effective).
The effectiveness of the hedge can be reliably measured.
The hedge remains highly effective on each date it is tested. The Group has chosen to test the effectiveness of its hedges on a yearly basis.
Cash flow hedges The effective portion of gains and losses on derivatives used to manage cash flow interest rate risk (such as floating to fixed interest rate swaps) are recognised in other comprehensive income and accumulated in the cash flow hedge reserve. However, if the Group closes out its position early, the cumulative gains and losses recognised in other comprehensive income are frozen and reclassified from the cash flow hedge reserve to profit or loss using the effective interest method. The ineffective portion of gains and losses on derivatives used to manage cash flow interest rate risk are recognised in profit or loss within interest expense or interest income. Share capital Financial instruments issued by the Group are classified as equity only to the extent that they do not meet the definition of a financial liability or financial asset. The Groups ordinary shares are classified as equity instruments.
15
Defined contribution schemes Contributions to defined contribution pension schemes are charged to the income statement in the year to which they relate. Termination benefits Termination benefits are payable when employment is terminated before the normal retirement date, or whenever an employee accepts voluntary redundancy in exchange for the benefits. The company recognises termination benefits when the company is demonstrably committed to either terminating the employment of current employees according to a detailed formal plan without possibility of withdrawal, or providing termination benefits as a result of an offer made to encourage voluntary redundancy. Benefits falling due more than 12 months after the balance sheet date are discounted to present value. Other long-term obligations These employee benefits include jubilee or other long-service benefits, long-term disability benefits and, if they are not fully payable within 12 months after the end of the period, bonuses and deferred compensation. The expected costs of these benefits are accrued over the period of employment using an accounting method similar to that for defined benefit pension plans, except that actuarial gains and losses and past-service costs are recognised immediately. Provisions The group has recognised provisions for liabilities of uncertain timing or amount. The provision is measured at the best estimate of the expenditure required to settle the obligation at the reporting date, discounted at a pre-tax rate reflecting current market assessments of the time value of money and risks specific to the liability. Revenue Revenue comprises the fair value of the consideration received or receivable for the sale of goods and services in the ordinary course of the Company‟s activities. Revenue is shown net of value added tax, rebates and discounts. Licenses The Company records revenue from software licenses and products when persuasive evidence of an arrangement exists, the software product has been shipped, there are no significant uncertainties surrounding product acceptance, the fees are fixed and determinable and collection is considered feasible. The Company uses the residual method to recognise revenue when a license agreement includes one or more elements to be delivered at a future date. Revenue for delivered elements is only recorded if evidence of the fair value of all undelivered elements exists. If an undelivered element exists under the license arrangement, all revenue is deferred when no vendor-specific objective evidence of the fair value of the undelivered element exists. As soon as all contractual obligations have been fulfilled or all elements have been delivered, revenue will be recognised. Services Customer support revenue consist of revenue derived from contracts to provide technical support to license holders. These revenues are recognised over the term of the contract. Network revenues consist of revenues earned from customers under an application service provider (ASP) model. Under this model, customers pay a monthly fee that entitles them to use the Company‟s software on a secure, hosted, third party server. These revenues are recognised as the services are provided on a monthly basis over the term of the customer‟s contract. Hardware Revenue on hardware is recognised as soon as all risk and rewards are transferred.

16
Government grants Government grants received on capital expenditure are generally deducted in arriving at the carrying amount of the development expenses recognised as they are incurred. Grants for cost of sales are netted against the cost incurred by the Group. Where retention of a government grant is dependent on the Group satisfying certain criteria, it is initially recognised as deferred income. When the criteria for retention have been satisfied, the deferred income balance is released to the income statement or netted against the asset purchased. Finance income and expense Finance income comprises interest income on funds invested and receivables from related companies. Interest income is recognised as it accrues in profit or loss, using the effective interest method. Finance expenses comprise interest expense on borrowings and on payables due to related companies. All borrowing costs are recognised in profit or loss
using the effective interest
method. Income tax Income tax expense comprises current and deferred tax. Income tax expense is recognised in profit or loss except to the extent that it relates to items recognised directly in equity, in which case it is recognised in equity. Current tax is the expected tax payable on the taxable income for the year, using tax rates enacted or substantively enacted at the reporting date, and any adjustment to tax payable in respect of previous years. Deferred tax is recognised using the balance sheet method, providing for temporary differences between the carrying amounts of assets and liabilities for financial reporting purposes and the amounts used for taxation purposes. Deferred tax is not recognised for the following temporary differences: the initial recognition of assets or liabilities in a transaction that is not a business combination and that affects neither accounting nor taxable profit, and differences relating to investments in subsidiaries and jointly controlled entities to the extent that it is probable that they will not reverse in the foreseeable future. In addition, deferred tax is not recognised for taxable temporary differences arising on the initial recognition of goodwill. Deferred tax is measured at the tax rates that are expected to be applied to the temporary differences when they reverse, based on the laws that have been enacted or substantively enacted by the reporting date. Deferred tax assets and liabilities are offset if there is a legally enforceable right to offset current tax liabilities and assets, and they relate to income taxes levied by the same tax authority on the same taxable entity, or on different tax entities, but they intend to settle current tax liabilities and assets on a net basis or their tax assets and liabilities will be realised simultaneously. Presentation of cash flow statement The cash flow statement is prepared using the indirect method. The funds in the cash flow statement consist of cash at bank and in hand. Cash flows in foreign currencies are translated at an estimated average rate. Exchange rate differences, finance income and expenses and the tax on income are accounted for as cash flows from operating activities. Dividends paid are included as cash flows from financing activities. 3. Critical accounting estimates and judgements The Group makes certain estimates and assumptions regarding the future. Estimates and judgements are continually evaluated based on historical experience and other factors, including expectations of future events that are believed to be reasonable under the circumstances. In the future, actual experience may differ from these estimates and assumptions. The estimates and assumptions that have a significant risk of causing a material

17
adjustment to the carrying amounts of assets and liabilities within the next financial year are discussed below. Judgements, estimates and assumptions (a) Fair value measurement A number of assets and liabilities included in the Group‟s carve out financial statements require measurement at, and/or disclosure of, fair value.
The fair value measurement of the Group‟s financial and non-financial assets and liabilities utilises market observable inputs and data as far as possible. Inputs used in determining fair value measurements are categorised into different levels based on how observable the inputs used in the valuation technique utilised are (the „fair value hierarchy‟):
- Level 1: Quoted prices in active markets for identical items (unadjusted) - Level 2: Observable direct or indirect inputs other than Level 1 inputs - Level 3: Unobservable inputs (i.e. not derived from market data).
The classification of an item into the above levels is based on the lowest level of the inputs used that has a significant effect on the fair value measurement of the item. Transfers of items between levels are recognised in the period they occur.
The Group measures the following items at fair value:
- Goodwill (note 11) (b) Impairment of goodwill The Group is required to test, on an annual basis, whether goodwill has suffered any impairment. The recoverable amount is determined based on value in use calculations. The use of this method requires the estimation of future cash flows and the choice of a discount rate in order to calculate the present value of the cash flows. Actual outcomes may vary. More information including carrying values is included in notes 11 and 12. (c) Impairment of intangible fixed assets The Group is required to test, on an annual basis, whether intangible fixed assets have suffered any impairment. The recoverable amount is determined based on value in use calculations. The use of this method requires the estimation of future cash outflows that is expected to be incurred before the asset is ready for use or for sale and the choice of a discount rate in order to calculate the present value of the cash flows. Actual outcomes may vary. More information including carrying values is included in notes 10, 11 and 12. (d) Pension assumptions The costs, assets and liabilities of the defined benefit schemes operating by the Group are determined using methods relying on actuarial estimates and assumptions. Details of the key assumptions are set out in note 27. The Group takes advice from independent actuaries relating to the appropriateness of the assumptions. Changes in the assumptions used may have a significant effect on the income statement and the statement of financial position. (e) Assumptions provision for jubilee The costs for jubilee are determined using methods relying on assumptions. Details of the key assumptions are set out in note 26. Changes in the assumptions used may have an effect on the income statement and the statement of financial position. (f) Determination of fair values of intangible assets acquired in business combinations The fair value of intangible assets is based on the discounted cash flows expected to be derived from the use and eventual sale of the asset.
18
(g) Assumptions provision for bad and doubtful debts The costs for bad and doubtful debts are determined using methods relying on assumptions. Impairment provisions are recognised when there is objective evidence (such as significant financial difficulties on the part of the counterparty or default or significant delay in payment) that the Group will be unable to collect all of the amounts due under the terms receivable, the amount of such a provision being the difference between the net carrying amount and the present value of the future expected cash flows associated with the impaired receivable.
4. Determination of fair values A number of the Group‟s accounting policies and disclosures require the determination of fair value, for both financial and non-financial assets and liabilities. Fair values have been determined for measurement and/or disclosure purposes based on the following methods. When applicable, further information about the assumptions made in determining fair values is disclosed in the notes specific to that asset or liability. Trade and other receivables The fair value of trade and other receivables is estimated as the present value of future cash flows, discounted at the market rate of interest at the reporting date. Fair value of financial instruments The group determines the fair value of financial instruments that are not quoted, such as interest rate swaps and caps, using valuation techniques. The stated market value of interest rate swaps and caps is derived from the bank‟s estimation of the mid-market price as of the date stated. For the estimation the bank used „close of business‟ market data. Those techniques are significantly affected by the assumptions used. In that regard, the derived fair value estimates cannot always be substantiated by comparison with independent markets and, in many cases, may not be capable of being realised immediately. 5. Financial instruments - risk management The Group‟s financial instruments, other than derivatives, comprise borrowings, loans receivables, cash and liquid resources, and various items, such as trade receivables and payables that arise directly from its operations. In common with all other businesses, the Group is exposed to risks that arise from its use of financial instruments. This note describes the Group's objectives, policies and processes for managing those risks and the methods used to measure them. Further quantitative information in respect of these risks is presented throughout these carve out financial statements. There have been no substantive changes in the Group's exposure to financial instrument risks, its objectives, policies and processes for managing those risks or the methods used to measure them from previous periods unless otherwise stated in this note.

19
Cash in bank A significant amount of cash is held with the following institutes:
Rating at 31 December 2013
Rating at 31 December 2012
ABN AMRO Bank N.V. A A
Rabobank AA- AA-
For the amounts of cash which are hold by these credit institutions we refer to note 18 en 25. Management monitors the utilisation of the credit limits regularly and at the reporting date does not expect any losses from non-performance by the counterparties. Risks The most important risks for the company are:
Interest rate risk, on its borrowings at floating interest rates;
Credit risks, on its outstanding balances with banks and debtors;
Liquidity risks regarding the ability to repay loans and borrowing. Interest rate risk The company has identified an interest rate risk on its loans and borrowings. Most of the loans have a floating interest rate risk. It is company policy to hedge the interest rate risk for anywhere between 75% and 100%. Therefore the company has a limited risk on interest rate fluctuation. The company is currently reconsidering the finance structure. At this moment a fixed interest rate is used. Credit risk The Group does not enter into derivatives to manage credit risk, although in certain isolated cases may take steps to mitigate such risks if it is sufficiently concentrated. The company has identified the risks that outstanding debts and banks will not be able to repay the receivables to the company. For cash which has been posted to banks, only banks with a minimum A rating are selected. Regarding other receivables the company actively manages outstanding debts. Quantitative disclosures of the credit risk exposure in relation to financial assets are set out below. Further disclosures regarding trade and other receivables, which are neither past due nor impaired, are provided in note 16. Liquidity risk Liquidity risk arises from the Group's management of working capital and the finance charges and principal repayments on its debt instruments. It is the risk that the Group will encounter difficulty in meeting its financial obligations as they fall due. The Group's policy is to ensure that it will always have sufficient cash to allow it to meet its liabilities when they become due. The company achieves this objective by maintaining an Net debt to EBITDA ratio below 3. The liquidity risk of each group entity is managed locally. Each operation has a facility based on the local budget. The budgets are set locally and agreed by the board in advance, enabling the Group's cash requirements to be anticipated. Where facilities of group entities need to be increased, approval must be sought from the group finance director. Where the amount of the facility is above a certain level agreement of the board is needed. Details are included in the respective notes:
Trade and payables – note 28
Loans and borrowings – note 24
20
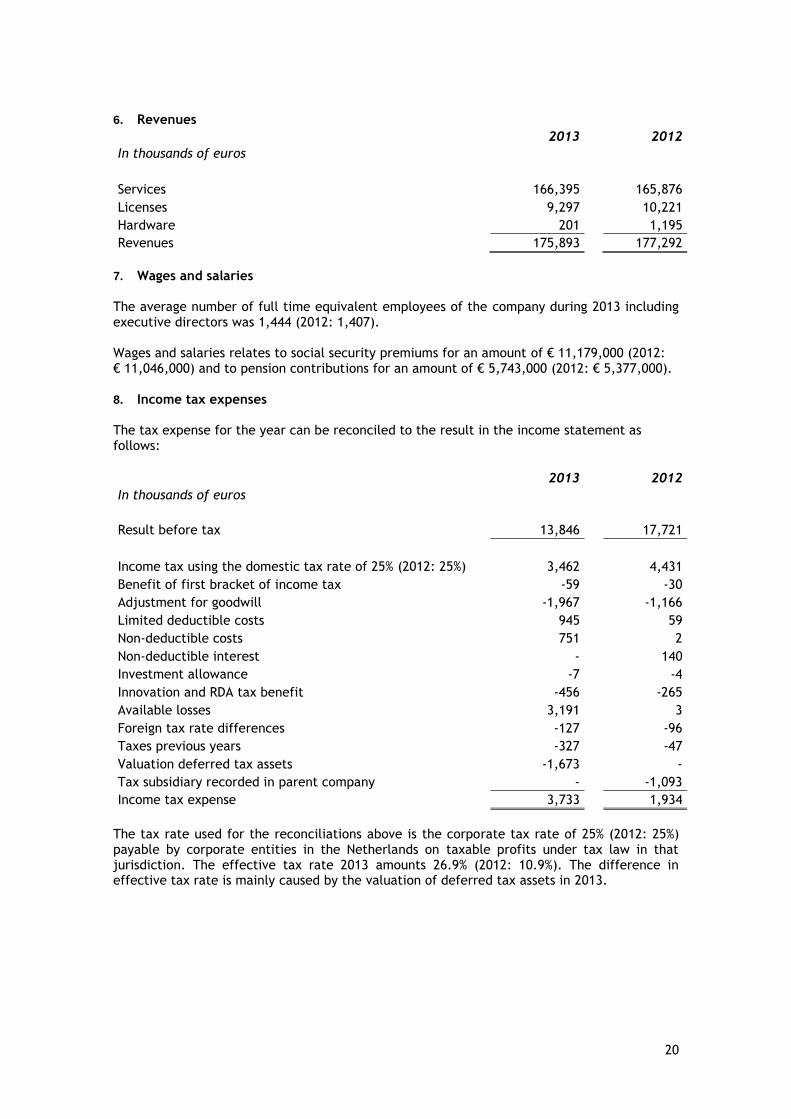
6. Revenues
2013 2012
In thousands of euros
Services 166,395 165,876
Licenses 9,297 10,221
Hardware 201 1,195
Revenues 175,893 177,292
7. Wages and salaries The average number of full time equivalent employees of the company during 2013 including executive directors was 1,444 (2012: 1,407). Wages and salaries relates to social security premiums for an amount of € 11,179,000 (2012: € 11,046,000) and to pension contributions for an amount of € 5,743,000 (2012: € 5,377,000). 8. Income tax expenses The tax expense for the year can be reconciled to the result in the income statement as follows:
2013 2012
In thousands of euros
Result before tax 13,846 17,721
Income tax using the domestic tax rate of 25% (2012: 25%) 3,462 4,431
Benefit of first bracket of income tax -59 -30
Adjustment for goodwill -1,967 -1,166
Limited deductible costs 945 59
Non-deductible costs 751 2
Non-deductible interest - 140
Investment allowance -7 -4
Innovation and RDA tax benefit -456 -265
Available losses 3,191 3
Foreign tax rate differences -127 -96
Taxes previous years -327 -47
Valuation deferred tax assets -1,673 -
Tax subsidiary recorded in parent company - -1,093
Income tax expense 3,733 1,934
The tax rate used for the reconciliations above is the corporate tax rate of 25% (2012: 25%) payable by corporate entities in the Netherlands on taxable profits under tax law in that jurisdiction. The effective tax rate 2013 amounts 26.9% (2012: 10.9%). The difference in effective tax rate is mainly caused by the valuation of deferred tax assets in 2013.

21
9. Property, plant and equipment
Plant Other
and operating
In thousands of euros Buildings equipment fixed assets Total
Cost Balance at 1 January 2012 2,108 149 31,142 33,399
Additions 162 38 3,815 4,015
Assets/liabilities transactions - - 20 20
Disposals -171 -4 -512 -687
Balance at 31 December 2012 2,099 183 34,465 36,747
Balance at 1 January 2013 2,099 183 34,465 36,747
Additions 562 93 3,366 4,021
Disposals - -73 -31 -104
Translation differences -2 -4 -5 -11
Balance at 31 December 2013 2,659 199 37,795 40,653
Depreciation
Balance at 1 January 2012 -1,233 -111
-22,910 -24,254
Depreciation for the year -256 -22 -4,348 -4,626
Disposals 169 3 432 604
Balance at 31 December 2012 -1,320 -130 -26,826 -28,276
Balance at 1 January 2013 -1,320 -130
-26,826 -28,276
Depreciation for the year -359 -39 -3,224 -3,622
Disposals - 72 31 103
Translation differences - 2 -3 -1
Balance at 31 December 2013 -1,679 -95 -30,022 -31,796
Carrying amounts
At 1 January 2012 875 38 8,232 9,145
At 31 December 2012 779 53 7,639 8,471
At 31 December 2013 980 104 7,773 8,857
22
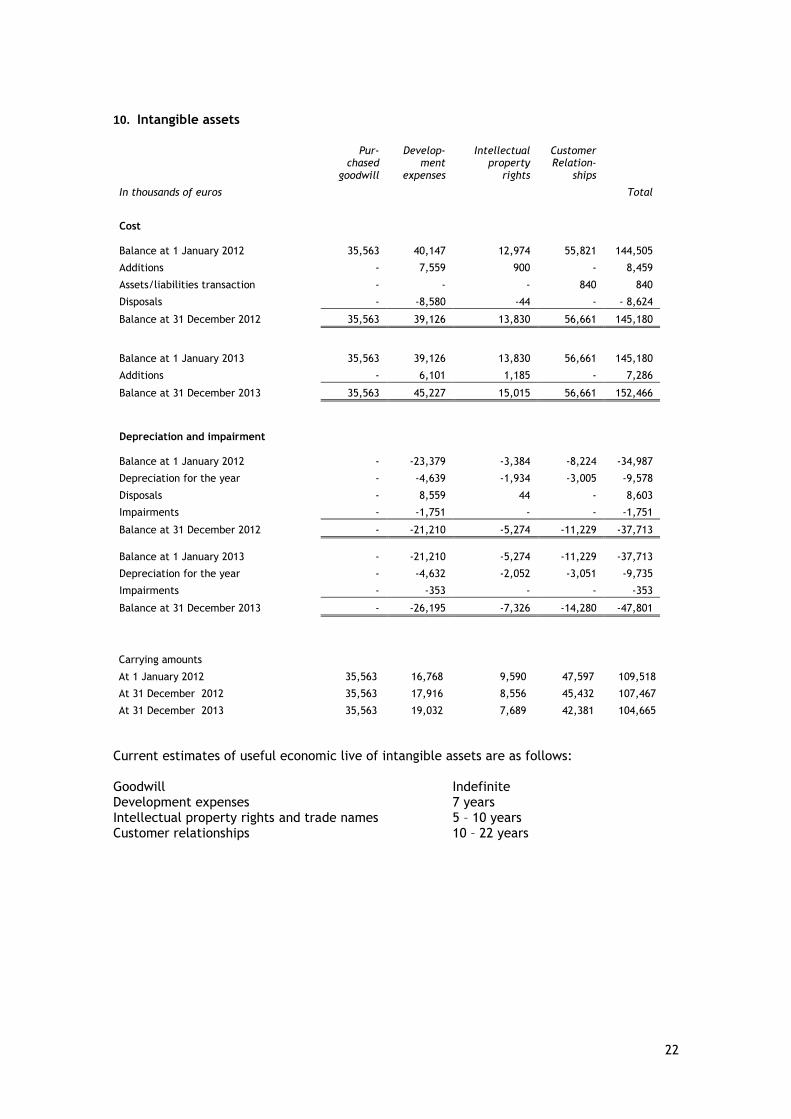
10. Intangible assets
Pur-chased
goodwill
Develop- ment
expenses
Intellectual property
rights
Customer Relation-
ships
In thousands of euros Total
Cost Balance at 1 January 2012 35,563 40,147 12,974 55,821 144,505
Additions - 7,559 900 - 8,459
Assets/liabilities transaction - - - 840 840
Disposals - -8,580 -44 - - 8,624
Balance at 31 December 2012 35,563 39,126 13,830 56,661 145,180
Balance at 1 January 2013 35,563 39,126 13,830 56,661 145,180
Additions - 6,101 1,185 - 7,286
Balance at 31 December 2013 35,563 45,227 15,015 56,661 152,466
Depreciation and impairment Balance at 1 January 2012 - -23,379 -3,384 -8,224 -34,987
Depreciation for the year - -4,639 -1,934 -3,005 -9,578
Disposals - 8,559 44 - 8,603
Impairments - -1,751 - - -1,751
Balance at 31 December 2012 - -21,210 -5,274 -11,229 -37,713
Balance at 1 January 2013 - -21,210 -5,274 -11,229 -37,713
Depreciation for the year - -4,632 -2,052 -3,051 -9,735
Impairments - -353 - - -353
Balance at 31 December 2013 - -26,195 -7,326 -14,280 -47,801
Carrying amounts
At 1 January 2012 35,563 16,768 9,590 47,597 109,518
At 31 December 2012 35,563 17,916 8,556 45,432 107,467
At 31 December 2013 35,563 19,032 7,689 42,381 104,665
Current estimates of useful economic live of intangible assets are as follows: Goodwill Indefinite Development expenses 7 years Intellectual property rights and trade names 5 – 10 years Customer relationships 10 – 22 years

23
11. Goodwill
The carrying amount of goodwill is allocated to the cash generating units (CGUs) as follows:
2013 2012
In thousands of euros
PinkRoccade Local Government 12,951 12,951
PharmaPartners 9,556 9,556
PinkRoccade Healthcare 8,409 8,409
Everest 3,971 3,971
Yonder 676 676 35,563 35,563
12. Impairments Goodwill Annually an impairment test is performed, based on the five-years budget of each cash generating unit. The value in use is estimated by using the discounted cash flow method. The WACC is calculated at 13.6% (2012: 13.6%). Based on impairment tests, performed as per year end, no impairment of goodwill was considered necessary. Other intangible fixed assets Regarding the capitalised development expenses, an impairment was considered necessary. In 2013 a number of projects appeared to be based on outdated technology. Therefore, this impairment was charged to the profit & loss account.
13. Subsidiaries
The principal subsidiaries of Total Specific Solutions (TSS) B.V., all of which have been included in these carve out financial statements, are as follows:
Interest at 31 December
Name company 2013 2012
KZA Holding B.V., Blaricum 100% 70.49%
Kwaliteitszorg in de Automatisering (KZA) B.V., Baarn 100% (indirect) 70.49% (indirect)
Top Talent Consultancy B.V., Baarn Liquidated 95.01%
Co-Maker Holding B.V., „s-Gravenhage 100% 100%
Yonder Holding B.V., Blaricum 100% 85%
Yonder Nederland B.V., Blaricum 100% (indirect) 85% (indirect)
Yonder SRL, Cluj Napoca, Romania 100% (indirect) 85% (indirect)
Everest Holding B.V., Blaricum 100% 51.02%
Everest B.V., „s-Hertogenbosch 100% (indirect) 51.02% (indirect)
Blueriq B.V., „s-Hertogenbosch 100% (indirect) -
PharmaPartners B.V., Oosterhout 100% 75%
H.I. Systems B.V., Breda 100% (indirect) 75% (indirect)
TSS TH 6 B.V., Apeldoorn 100% 100%
TSS TH 5 B.V., Apeldoorn 100% 92.82%
TSS TH 4 B.V., Apeldoorn 100% (indirect) 92.82% (indirect)
PinkRoccade Local Government B.V., ‟s-Hertogenbosch 100% (indirect) 97.5% (indirect)
PinkRoccade Healthcare B.V., Apeldoorn 100% (indirect) 88% (indirect)
PinkRoccade Gezondheidszorg B.V., Apeldoorn 100% (indirect) 88% (indirect)
Unless stated otherwise, the companies are located in the Netherlands.
24
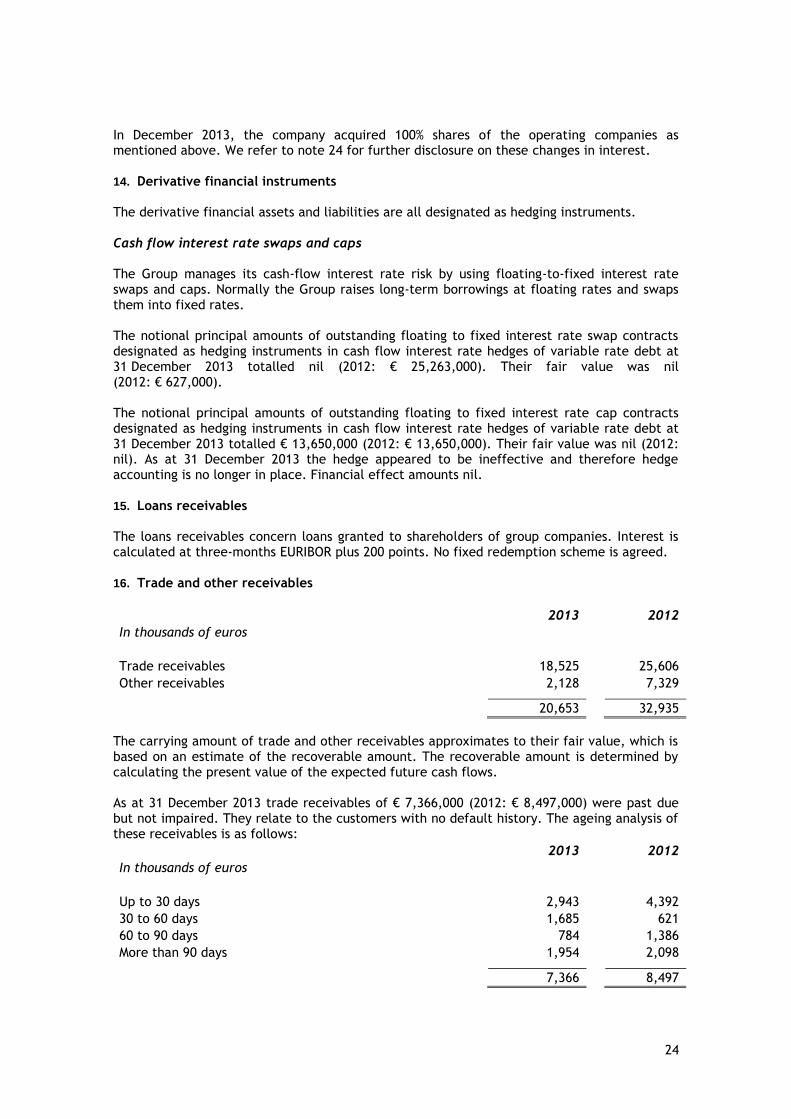
In December 2013, the company acquired 100% shares of the operating companies as mentioned above. We refer to note 24 for further disclosure on these changes in interest. 14. Derivative financial instruments The derivative financial assets and liabilities are all designated as hedging instruments. Cash flow interest rate swaps and caps The Group manages its cash-flow interest rate risk by using floating-to-fixed interest rate swaps and caps. Normally the Group raises long-term borrowings at floating rates and swaps them into fixed rates. The notional principal amounts of outstanding floating to fixed interest rate swap contracts designated as hedging instruments in cash flow interest rate hedges of variable rate debt at 31 December 2013 totalled nil (2012: € 25,263,000). Their fair value was nil (2012: € 627,000). The notional principal amounts of outstanding floating to fixed interest rate cap contracts designated as hedging instruments in cash flow interest rate hedges of variable rate debt at 31 December 2013 totalled € 13,650,000 (2012: € 13,650,000). Their fair value was nil (2012: nil). As at 31 December 2013 the hedge appeared to be ineffective and therefore hedge accounting is no longer in place. Financial effect amounts nil. 15. Loans receivables The loans receivables concern loans granted to shareholders of group companies. Interest is calculated at three-months EURIBOR plus 200 points. No fixed redemption scheme is agreed. 16. Trade and other receivables
2013 2012
In thousands of euros
Trade receivables 18,525 25,606
Other receivables 2,128 7,329 20,653 32,935
The carrying amount of trade and other receivables approximates to their fair value, which is based on an estimate of the recoverable amount. The recoverable amount is determined by calculating the present value of the expected future cash flows. As at 31 December 2013 trade receivables of € 7,366,000 (2012: € 8,497,000) were past due but not impaired. They relate to the customers with no default history. The ageing analysis of these receivables is as follows:
2013 2012
In thousands of euros
Up to 30 days 2,943 4,392
30 to 60 days 1,685 621
60 to 90 days 784 1,386
More than 90 days 1,954 2,098 7,366 8,497

25
As at 31 December 2013 trade receivables for an amount of € 1,280,000 (2012: € 285,000) were past due and impaired. The amount of the provision as at 31 December 2013 was € 1,058,000 (2012: € 236,000). Movements on the group provision for impairment of trade receivables are as follows:
2013 2012
In thousands of euros
At beginning of the year 236 284
Provided during the year 1,149 135 Receivable written off during the year as uncollectable -162
-
Unused amounts reversed -165 -183 1,058 236
The movement on the provision for impaired receivables has been included in the other operating expenses line in the income statement. Other classes of financial assets included within trade and other receivables do not contain impaired assets. 17. Prepaid expenses The prepaid expenses mainly consist of expenses incurred for other operating expenses for the next financial year. 18. Cash and cash equivalents
2013 2012
In thousands of euros
ABN AMRO Bank N.V. 15,241 17,339
Rabobank 7,451 6,490
Other 52 667
22,744 24,496
Of the cash and bank balances, € 101,000 is not freely disposable (2012: € 40,000). At year-end, the group has credit balances of an amount of nil (2012: € 2,322,000) with above mentioned credit institutions (note 25).

26
19. Share capital At 31 December 2012 the authorised share capital comprised of 9,000,000 ordinary shares with a par value of € 0.01. Issued are 1,800,000 shares.
Reserve Description and purpose
Share premium Amount subscribed for share capital in excess of nominal value.
Legal Reserve Development expenses
Gains/losses arising on development expenses incurred. The reserve is not freely disposable.
Legal Reserve Cash flow hedging reserve
Gains/losses arising on the effective portion of hedging instruments carried at fair value in a qualifying cash flow hedge.
Legal Reserve Foreign exchange reserve
Gains/losses arising on retranslating the net assets of overseas operations into Euros.
Other reserves All other net gains and losses and transactions with owners (e.g. dividends) not recognised elsewhere.
20. Analysis of amounts recognised in other comprehensive income
Cash
flo
w h
edge
rese
rve
Fore
ign e
xchange
rese
rve
Oth
er
rese
rves
In thousands of euros
Year to 31 December 2012
Gains recognised on hedging instruments 295 - - Exchange differences arising on translation of foreign operations - -42 -
Actuarial result on defined benefit pension schemes - - 1,102
Taxation -28 - -276
267 -42 826
Year to 31 December 2013
Exchange differences arising on translation of foreign operations - -63 -
- -63 -

27
21. Share premium
2013 2012
In thousands of euros
As at 1 January 20,232 19,848
Additions 29,411 -
Movement to legal reserve - 384 As at 31 December 49,643 20,232
22. Legal reserve The legal reserve concerns reserves which are formed by the subsidiaries for the capitalised development expenses and translation differences.
2013 2012
In thousands of euros
As at 1 January 18,760 19,165
Movement to other reserves 194 -21
Movement from share premium - -384 As at 31 December 18,954 18,760
The legal reserve can be specified as follows:
Reserve development expenses 19,012 18,798
Foreign exchange reserve -58 -38 Per 31 december 18,954 18,760
23. Cash flow hedging reserve
2013 2012
In thousands of euros
As at 1 January -448 -528
Gains recognised on hedging instruments 448 80 As at 31 December - -448

28
24. Other reserves
2013
In thousands of euros
As at 1 January 796
Result previous year 13,190
Movement to legal reserve -215
Changes in ownership interests in subsidiaries -34,497
Gains recognised on hedging instruments -54 As at 31 December -20,780
25. Loans and borrowings
2013 2012
In thousands of euros
Non-current
Amounts owed to credit institutions - 17,783
Amounts owed to associated companies 38,299 -
Other loans - 21,252
38,299 39,035
Current
Repayment obligation - 8,682
Amounts owed to credit institutions - 2,322
- 11,004 Total loans and borrowings 38,299 50,039
26. Employee benefits Liabilities for employee benefits comprise:
2013 2012
In thousands of euros
Provision for pensions - 40
Provision for jubilee 80 174
80 214
Provisions Jubilee Pensions Total
In thousands of euros
At 1 January 2013 174 40 214
Released in year 94 40 134
At 31 December 2013 80 - 80
29
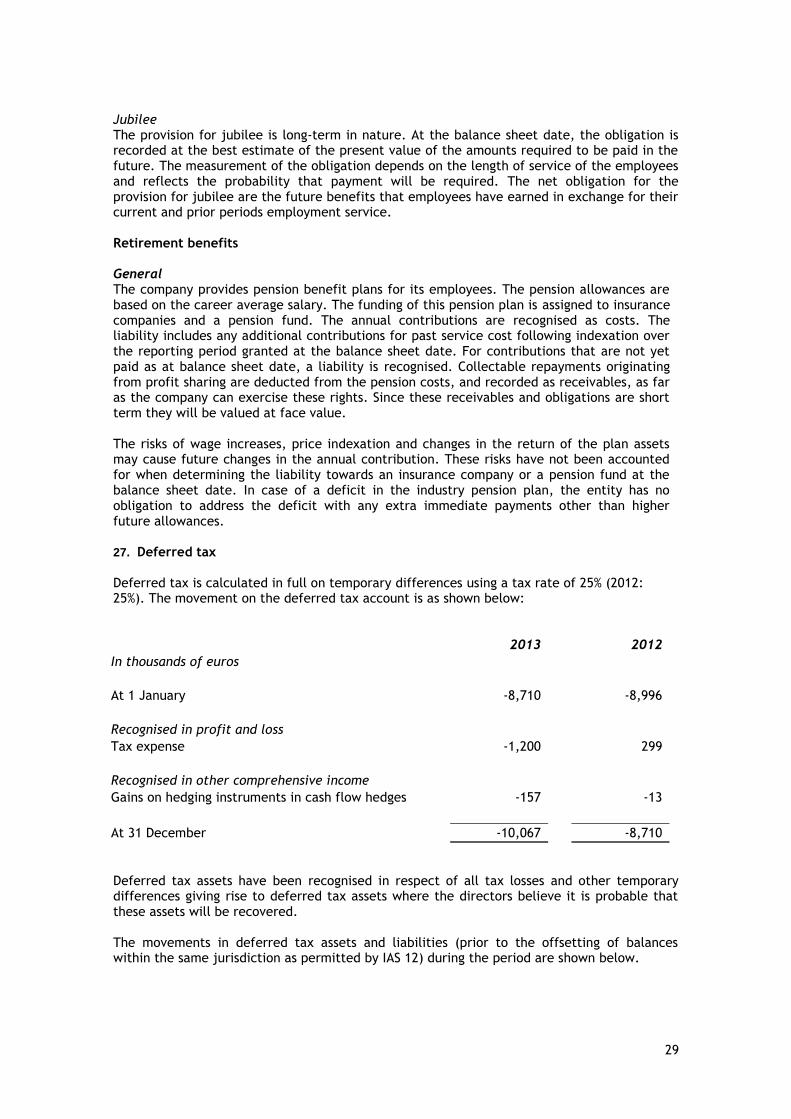
Jubilee The provision for jubilee is long-term in nature. At the balance sheet date, the obligation is recorded at the best estimate of the present value of the amounts required to be paid in the future. The measurement of the obligation depends on the length of service of the employees and reflects the probability that payment will be required. The net obligation for the provision for jubilee are the future benefits that employees have earned in exchange for their current and prior periods employment service. Retirement benefits
General The company provides pension benefit plans for its employees. The pension allowances are based on the career average salary. The funding of this pension plan is assigned to insurance companies and a pension fund. The annual contributions are recognised as costs. The liability includes any additional contributions for past service cost following indexation over the reporting period granted at the balance sheet date. For contributions that are not yet paid as at balance sheet date, a liability is recognised. Collectable repayments originating from profit sharing are deducted from the pension costs, and recorded as receivables, as far as the company can exercise these rights. Since these receivables and obligations are short term they will be valued at face value. The risks of wage increases, price indexation and changes in the return of the plan assets may cause future changes in the annual contribution. These risks have not been accounted for when determining the liability towards an insurance company or a pension fund at the balance sheet date. In case of a deficit in the industry pension plan, the entity has no obligation to address the deficit with any extra immediate payments other than higher future allowances. 27. Deferred tax
Deferred tax is calculated in full on temporary differences using a tax rate of 25% (2012: 25%). The movement on the deferred tax account is as shown below:
2013
2012
In thousands of euros
At 1 January -8,710 -8,996
Recognised in profit and loss
Tax expense -1,200 299
Recognised in other comprehensive income
Gains on hedging instruments in cash flow hedges -157 -13
At 31 December -10,067 -8,710
Deferred tax assets have been recognised in respect of all tax losses and other temporary differences giving rise to deferred tax assets where the directors believe it is probable that these assets will be recovered. The movements in deferred tax assets and liabilities (prior to the offsetting of balances within the same jurisdiction as permitted by IAS 12) during the period are shown below.

30
Details of the deferred tax liability, amounts recognised in profit or loss and amounts recognised in other comprehensive income are as follows:
Asset 2012
Liability 2012
Net 2012
(Charged) /Credited
to profit or loss
2012
(Charged)/Credited
to OCI 2012
In thousands of euros
Tangible assets (differences in depreciation) 297 -348 -51
309 -
Intangible assets (development costs fiscally not recognised) 318 -4,038 -3,720
-36 -
Intangible assets (as a result of PPA) 4,851 -13,102 -8,251 9 -
Available losses 3,117 - 3,117 34 -
Derivative financial liabilities 195 - 195 -17 -13
Tax assets/(liabilities) 8,778 -17,488 -8,710 299 -13
Set off of tax -271 271 -
- -
Net tax asset 8,507 -17,217 -8,710 299 -13
Asset 2013
Liability 2013
Net 2013
(Charged) /Credited
to profit or loss
2013
(Charged)/Credited
to OCI 2013
In thousands of euros
Tangible assets (differences in depreciation) 179 -211 -32
19 -
Intangible assets (development costs fiscally not recognised) - -4,572 -4,572
-852 -
Intangible assets (as a result of PPA) 6,526 -11,989 -5,463 2,788 -
Available losses - - - -3,117 -
Derivative financial liabilities - - - -38 -157
Tax assets/(liabilities) 6,705 -16,772 -10,067 -1,200 -157
Set off of tax -178 178 -
- -
Net tax asset 6,527 -16,594 -10,067 -1,200 -157
A deferred tax asset has not been recognised for the following:
2013 2012
In thousands of euros
Unused tax losses 13,137 8,978
13,137 8,978
A deferred tax asset for tax losses is only recognised as on the basis of the multi-year budgets is expected that those losses will be offset against future taxable profits.
31
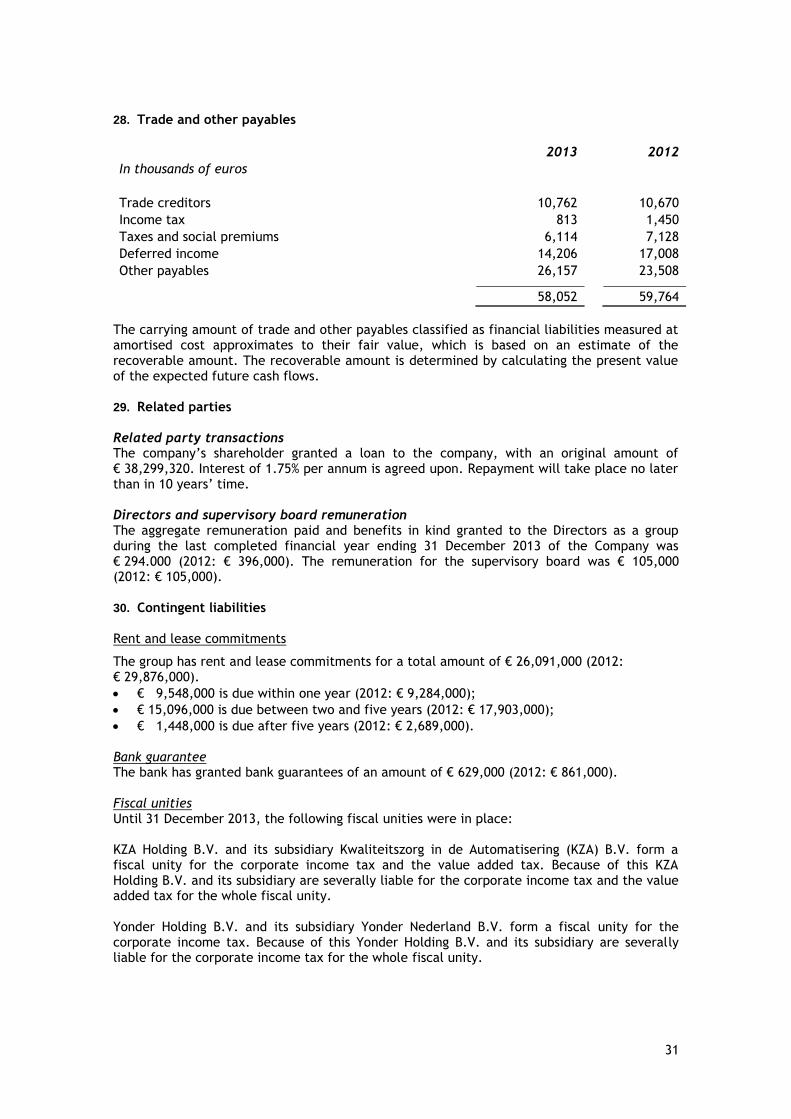
28. Trade and other payables
2013 2012
In thousands of euros
Trade creditors 10,762 10,670
Income tax 813 1,450
Taxes and social premiums 6,114 7,128
Deferred income 14,206 17,008
Other payables 26,157 23,508 58,052 59,764
The carrying amount of trade and other payables classified as financial liabilities measured at amortised cost approximates to their fair value, which is based on an estimate of the recoverable amount. The recoverable amount is determined by calculating the present value of the expected future cash flows. 29. Related parties Related party transactions The company‟s shareholder granted a loan to the company, with an original amount of € 38,299,320. Interest of 1.75% per annum is agreed upon. Repayment will take place no later than in 10 years‟ time. Directors and supervisory board remuneration The aggregate remuneration paid and benefits in kind granted to the Directors as a group during the last completed financial year ending 31 December 2013 of the Company was € 294.000 (2012: € 396,000). The remuneration for the supervisory board was € 105,000 (2012: € 105,000). 30. Contingent liabilities Rent and lease commitments
The group has rent and lease commitments for a total amount of € 26,091,000 (2012: € 29,876,000).
€ 9,548,000 is due within one year (2012: € 9,284,000);
€ 15,096,000 is due between two and five years (2012: € 17,903,000);
€ 1,448,000 is due after five years (2012: € 2,689,000). Bank guarantee The bank has granted bank guarantees of an amount of € 629,000 (2012: € 861,000). Fiscal unities Until 31 December 2013, the following fiscal unities were in place: KZA Holding B.V. and its subsidiary Kwaliteitszorg in de Automatisering (KZA) B.V. form a fiscal unity for the corporate income tax and the value added tax. Because of this KZA Holding B.V. and its subsidiary are severally liable for the corporate income tax and the value added tax for the whole fiscal unity. Yonder Holding B.V. and its subsidiary Yonder Nederland B.V. form a fiscal unity for the corporate income tax. Because of this Yonder Holding B.V. and its subsidiary are severally liable for the corporate income tax for the whole fiscal unity.

32
Everest Holding B.V. and its subsidiaries Everest B.V. and Blueriq B.V. form a fiscal unity for the corporate income tax and the value added tax. Because of this Everest Holding B.V. and its subsidiary are severally liable for the corporate income tax and the value added tax for the whole fiscal unity. TSS TH 5 B.V., TSS TH 4 B.V., PinkRoccade Local Government B.V., PinkRoccade Healthcare B.V. and PinkRoccade Gezondheidszorg B.V. form a fiscal unity for the corporate income tax. Because of this TSS TH 5 B.V. and its subsidiaries are severally liable for the corporate income tax for the whole fiscal unity. PharmaPartners B.V. and its subsidiary H.I. Systems B.V. form a fiscal unity for the corporate income tax and the value added tax. Because of this PharmaPartners B.V. and its subsidiary are severally liable for the corporate income tax and the value added tax for the whole fiscal unity. As of 1 January 2014, the above mentioned entities form one fiscal unity together with the Company. 31. Other operating Expenses In 2012 Co-Maker decided to sell IP rights. In 2013 this sale was effected with the result that the business was terminated. Because of the fact that the settlement of the bank facilities in Co-Maker was relevant in relation to the mentioned sale, the loan and interest rate swap were recognised at their realisable value. The total financial impact of this termination is accounted for as other operating expenses.
32. Events after the reporting date Subsequent to 31 December 2013, the Company acquired the net assets of another entity for aggregate cash consideration of € 2,400,000 on closing. The business acquisition include companies catering to the government market, and are all software companies similar to the existing business of the Company. Due to the timing of this acquisition completed subsequent to 31 December 2013, the Company is unable to provide additional disclosure as the accounting for these business combinations is incomplete.

For the year ended December 31, 2013
Pro Forma Consolidated Statement of Income(In U.S. dollars)
CONSTELLATIONSOFTWARE INC.
(Unaudited)
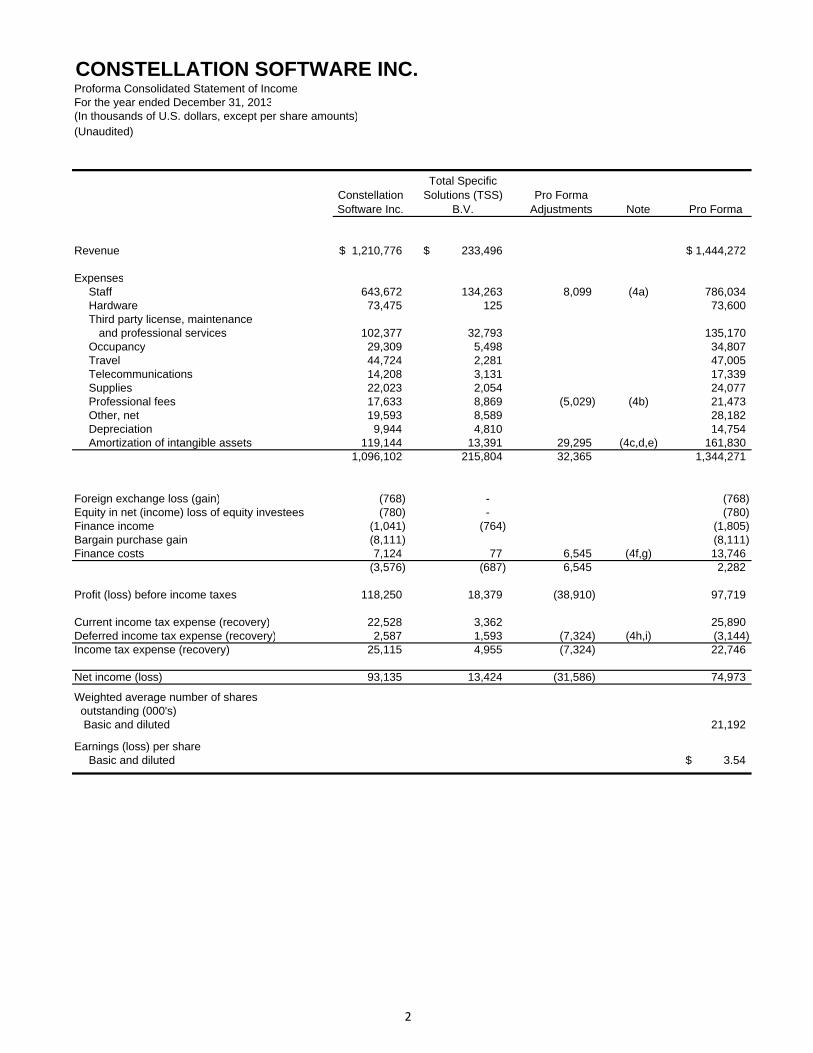
CONSTELLATION SOFTWARE INC.Proforma Consolidated Statement of IncomeFor the year ended December 31, 2013(In thousands of U.S. dollars, except per share amounts)(Unaudited)
Constellation Software Inc.
Total Specific Solutions (TSS)
B.V.Pro Forma
Adjustments Note Pro Forma
Revenue 1,210,776$ 233,496$ 1,444,272$
ExpensesStaff 643,672 134,263 8,099 (4a) 786,034 Hardware 73,475 125 73,600 Third party license, maintenance
and professional services 102,377 32,793 135,170 Occupancy 29,309 5,498 34,807 Travel 44,724 2,281 47,005 Telecommunications 14,208 3,131 17,339 Supplies 22,023 2,054 24,077 Professional fees 17,633 8,869 (5,029) (4b) 21,473 Other, net 19,593 8,589 28,182 Depreciation 9,944 4,810 14,754 Amortization of intangible assets 119,144 13,391 29,295 (4c,d,e) 161,830
1,096,102 215,804 32,365 1,344,271
Foreign exchange loss (gain) (768) - (768) Equity in net (income) loss of equity investees (780) - (780) Finance income (1,041) (764) (1,805) Bargain purchase gain (8,111) (8,111) Finance costs 7,124 77 6,545 (4f,g) 13,746
(3,576) (687) 6,545 2,282
Profit (loss) before income taxes 118,250 18,379 (38,910) 97,719
Current income tax expense (recovery) 22,528 3,362 25,890 Deferred income tax expense (recovery) 2,587 1,593 (7,324) (4h,i) (3,144) Income tax expense (recovery) 25,115 4,955 (7,324) 22,746
Net income (loss) 93,135 13,424 (31,586) 74,973
Weighted average number of shares outstanding (000's) Basic and diluted 21,192
Earnings (loss) per shareBasic and diluted 3.54$
2
CONSTELLATION SOFTWARE INC. Notes to the Pro Forma Consolidated Statement of Income (In thousands of U.S. dollars, except per share amounts and as otherwise indicated) Year ended December 31, 2013 (Unaudited)
3
1. Description of the Reporting Entity and Transaction
Constellation Software Inc. ("Constellation") is an entity domiciled in Canada. The pro forma consolidated statement of income is of Constellation and its subsidiaries (together referred to as the "Company") and the Company's interest in associates. On December 31, 2013, Constellation acquired 100% of the shares of Netherlands based Total Specific Solutions (TSS) B.V. (“TSS”) for approximately $342,000 (€248 million) including consideration paid for the preliminary fair value of the net tangible assets acquired. The purchase price was primarily funded through a new one-year term loan.
2. Basis of Presentation
The accompanying unaudited pro forma consolidated statement of income of Constellation for the year ended December 31, 2013 has been prepared by management of Constellation to give effect to the acquisition of TSS as if it had occurred on January 1, 2013.
The unaudited pro forma consolidated statement of income of Constellation has been prepared using the following information:
(a) The audited consolidated statement of income of Constellation for the year ended December 31, 2013;
(b) The audited financial statements of TSS as at and for the year ended December 31, 2013
The statements of income for both Constellation and TSS are prepared in accordance with International Financial Reporting Standards (IFRSs), issued and outstanding as of March 6, 2014. The accounting policies used in the preparation of the unaudited pro forma consolidated statement of income are consistent with those used by Constellation in the preparation of its audited consolidated financial statements for the year ended December 31, 2013 and as described therein. The unaudited pro forma consolidated statement of income is presented in U.S. dollars, which is Constellation’s functional currency. The functional currency of TSS is the Euro. For the purposes of the unaudited pro forma consolidated statement of income, TSS’ consolidated statement of income was translated from Euros to U.S. dollars at a rate of 1.3275 (representing the average foreign exchange conversion rate for the year ended December 31, 2013). The unaudited pro forma consolidated statement of income does not include any anticipated financial benefits from such items as costs savings, operating synergies or revenue enhancements that the combined company may achieve arising from the acquisition. The unaudited pro forma consolidated statement of income is not necessarily indicative of the results of operations that would have resulted had the acquisition been effected on January 1, 2013, or the results that may be obtained in the future. The unaudited pro forma consolidated statement of income has been prepared using the acquisition method of accounting in accordance with IFRS 3, Business Combinations (“IFRS 3”). The pro forma adjustments are determined based on available financial information and certain estimates and assumptions. The actual adjustments to the consolidated financial statements of Constellation will depend on a number of factors. Management of Constellation believes that such assumptions provide a reasonable basis for presenting all of the significant effects of the transaction and that the pro forma adjustments give appropriate effect to those assumptions and are properly applied in the unaudited pro forma consolidated statement of income.

CONSTELLATION SOFTWARE INC. Notes to the Pro Forma Consolidated Statement of Income (In thousands of U.S. dollars, except per share amounts and as otherwise indicated) Year ended December 31, 2013 (Unaudited)
4
With respect to the provisional estimates of fair value in respect of the acquisition of TSS and the application of IFRS 3, the unaudited pro forma consolidated statement of income has been prepared using the acquisition method of accounting as if the acquisition had been completed on January 1, 2013. Under the acquisition method of accounting, the estimated fair value of the underlying tangible and intangible assets acquired and liabilities assumed is determined as of the date of the acquisition. Any excess purchase consideration is allocated to goodwill. We have commenced the process necessary to estimate the fair values of the tangible and intangible assets acquired and liabilities assumed at the closing of the TSS acquisition. When we complete the necessary steps to finalize the acquisition accounting, the final recognition and measurement of assets acquired, liabilities assumed, and goodwill will be determined. The final acquisition accounting may be different than that reflected in the unaudited pro forma statement of income and those differences may be material.
The unaudited pro forma consolidated statement of income was prepared to conform with the presentation of the statement of income included in Constellation's consolidated financial statements and does not conform with the presentation of the TSS financial statements as presented in this Business Acquisition Report. The unaudited pro forma consolidated statement of income should be read in conjunction with the historical financial statements and notes thereto of Constellation (available on SEDAR at www.sedar.com) and the financial statements of TSS included elsewhere in the Business Acquisition Report.
3. Description of the Transaction and Acquisition Accounting
On December 31, 2013, the Company acquired 100% of the shares of Total Specific Solutions (TSS) B.V. (“TSS”) for aggregate cash consideration of $341,560. The purchase price may be adjusted for items such as net tangible asset adjustments and claims under the representations and warranties of the agreement. Pursuant to the terms of the purchase and sale agreement and preliminary agreed upon terms sheets, Constellation and the sellers of TSS are currently negotiating in good faith to reach agreement on a shareholders agreement pursuant to which the sellers and members of TSS’ executive management team could acquire a significant minority stake in TSS. The total transaction fees associated with the acquisition of TSS was $1,000. The transaction fees were expensed as part of professional fees in the consolidated statement of income of Constellation for the year ended December 31, 2013. TSS primarily operates in the healthcare and government markets and is a software business similar to certain existing businesses owned and operated by the Company. The acquisition has been accounted for using the acquisition method with the results of operations included in these consolidated financial statements of Constellation from the date of the acquisition. TSS has been included in Constellation’s Public reportable segment. The goodwill recognized in connection with this acquisition is primarily attributable to the application of Constellation’s best practices to improve the operations of TSS, synergies with existing businesses of Constellation, and other intangibles that do not qualify for separate recognition including assembled workforce. Due to the complexity and timing of the acquisition, the Company is in the process of determining and finalizing the estimated fair value of the net assets acquired as part of the acquisition. The amounts
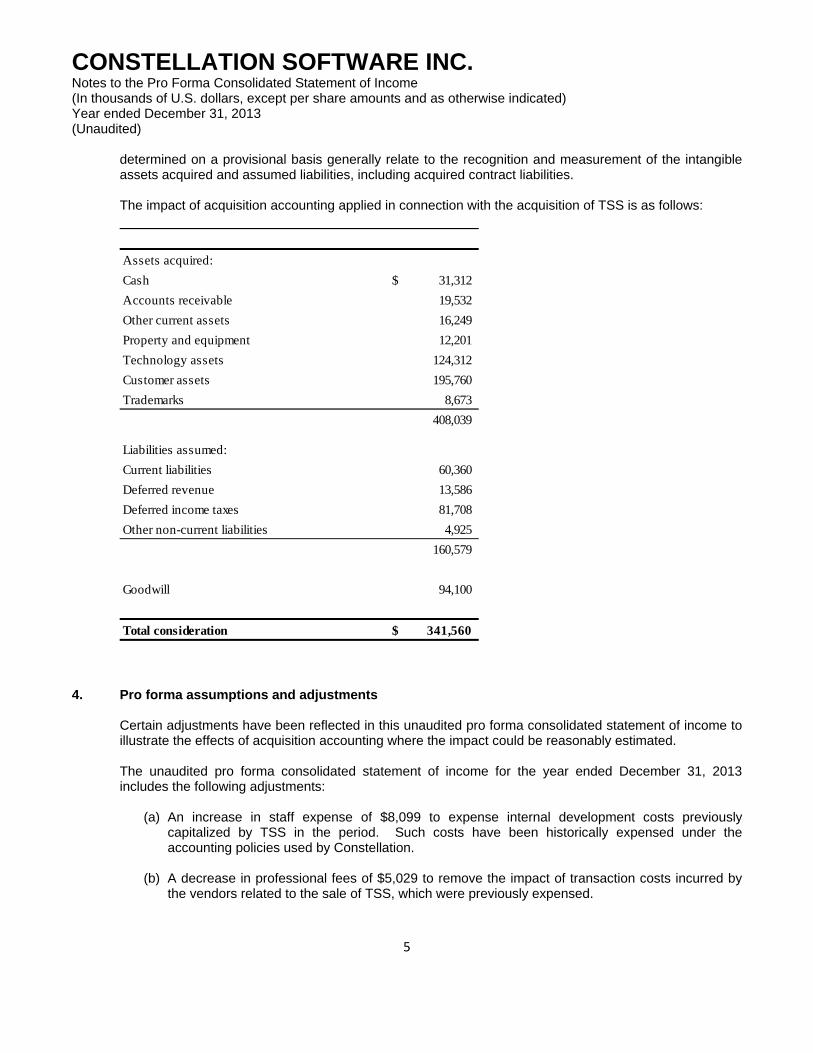
CONSTELLATION SOFTWARE INC. Notes to the Pro Forma Consolidated Statement of Income (In thousands of U.S. dollars, except per share amounts and as otherwise indicated) Year ended December 31, 2013 (Unaudited)
5
determined on a provisional basis generally relate to the recognition and measurement of the intangible assets acquired and assumed liabilities, including acquired contract liabilities. The impact of acquisition accounting applied in connection with the acquisition of TSS is as follows:
4. Pro forma assumptions and adjustments
Certain adjustments have been reflected in this unaudited pro forma consolidated statement of income to illustrate the effects of acquisition accounting where the impact could be reasonably estimated.
The unaudited pro forma consolidated statement of income for the year ended December 31, 2013 includes the following adjustments:
(a) An increase in staff expense of $8,099 to expense internal development costs previously
capitalized by TSS in the period. Such costs have been historically expensed under the accounting policies used by Constellation.
(b) A decrease in professional fees of $5,029 to remove the impact of transaction costs incurred by the vendors related to the sale of TSS, which were previously expensed.
Assets acquired:
Cash 31,312$
Accounts receivable 19,532
Other current assets 16,249
Property and equipment 12,201
Technology assets 124,312
Customer assets 195,760
Trademarks 8,673
408,039
Liabilities assumed:
Current liabilities 60,360
Deferred revenue 13,586
Deferred income taxes 81,708
Other non-current liabilities 4,925
160,579
Goodwill 94,100
Total consideration 341,560$
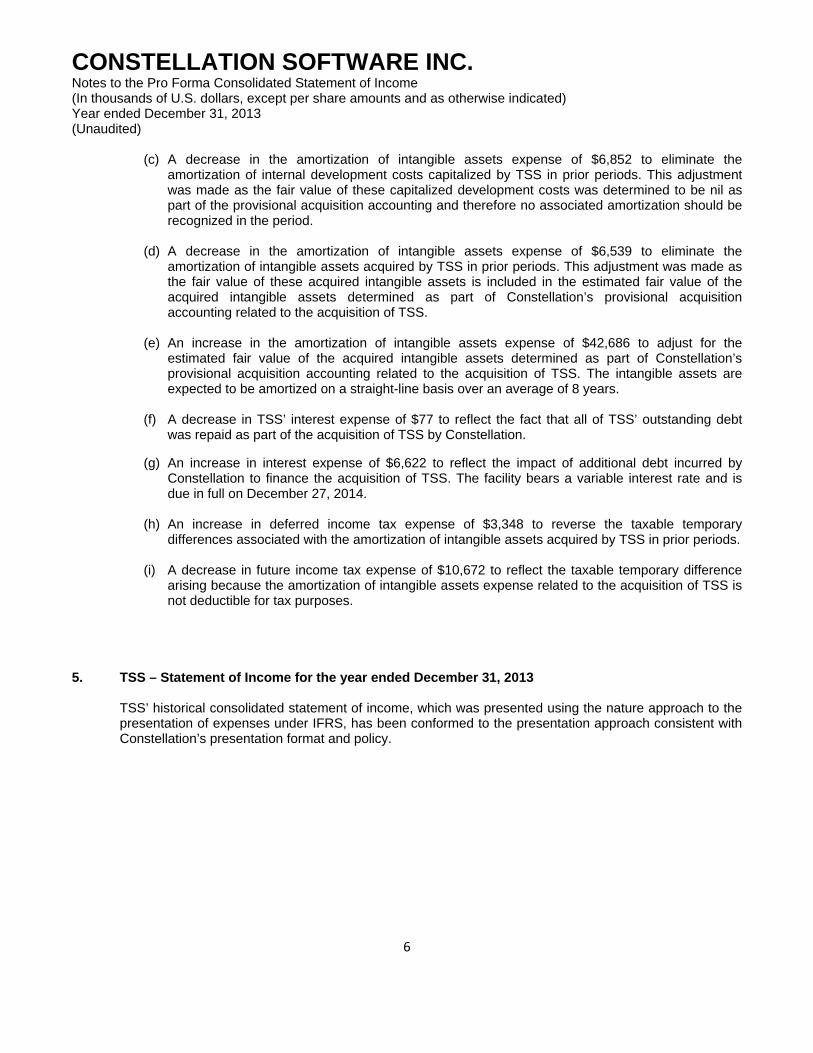
CONSTELLATION SOFTWARE INC. Notes to the Pro Forma Consolidated Statement of Income (In thousands of U.S. dollars, except per share amounts and as otherwise indicated) Year ended December 31, 2013 (Unaudited)
6
(c) A decrease in the amortization of intangible assets expense of $6,852 to eliminate the amortization of internal development costs capitalized by TSS in prior periods. This adjustment was made as the fair value of these capitalized development costs was determined to be nil as part of the provisional acquisition accounting and therefore no associated amortization should be recognized in the period.
(d) A decrease in the amortization of intangible assets expense of $6,539 to eliminate the
amortization of intangible assets acquired by TSS in prior periods. This adjustment was made as the fair value of these acquired intangible assets is included in the estimated fair value of the acquired intangible assets determined as part of Constellation’s provisional acquisition accounting related to the acquisition of TSS.
(e) An increase in the amortization of intangible assets expense of $42,686 to adjust for the estimated fair value of the acquired intangible assets determined as part of Constellation’s provisional acquisition accounting related to the acquisition of TSS. The intangible assets are expected to be amortized on a straight-line basis over an average of 8 years.
(f) A decrease in TSS’ interest expense of $77 to reflect the fact that all of TSS’ outstanding debt was repaid as part of the acquisition of TSS by Constellation.
(g) An increase in interest expense of $6,622 to reflect the impact of additional debt incurred by Constellation to finance the acquisition of TSS. The facility bears a variable interest rate and is due in full on December 27, 2014.
(h) An increase in deferred income tax expense of $3,348 to reverse the taxable temporary differences associated with the amortization of intangible assets acquired by TSS in prior periods.
(i) A decrease in future income tax expense of $10,672 to reflect the taxable temporary difference arising because the amortization of intangible assets expense related to the acquisition of TSS is not deductible for tax purposes.
5. TSS – Statement of Income for the year ended December 31, 2013
TSS’ historical consolidated statement of income, which was presented using the nature approach to the presentation of expenses under IFRS, has been conformed to the presentation approach consistent with Constellation’s presentation format and policy.
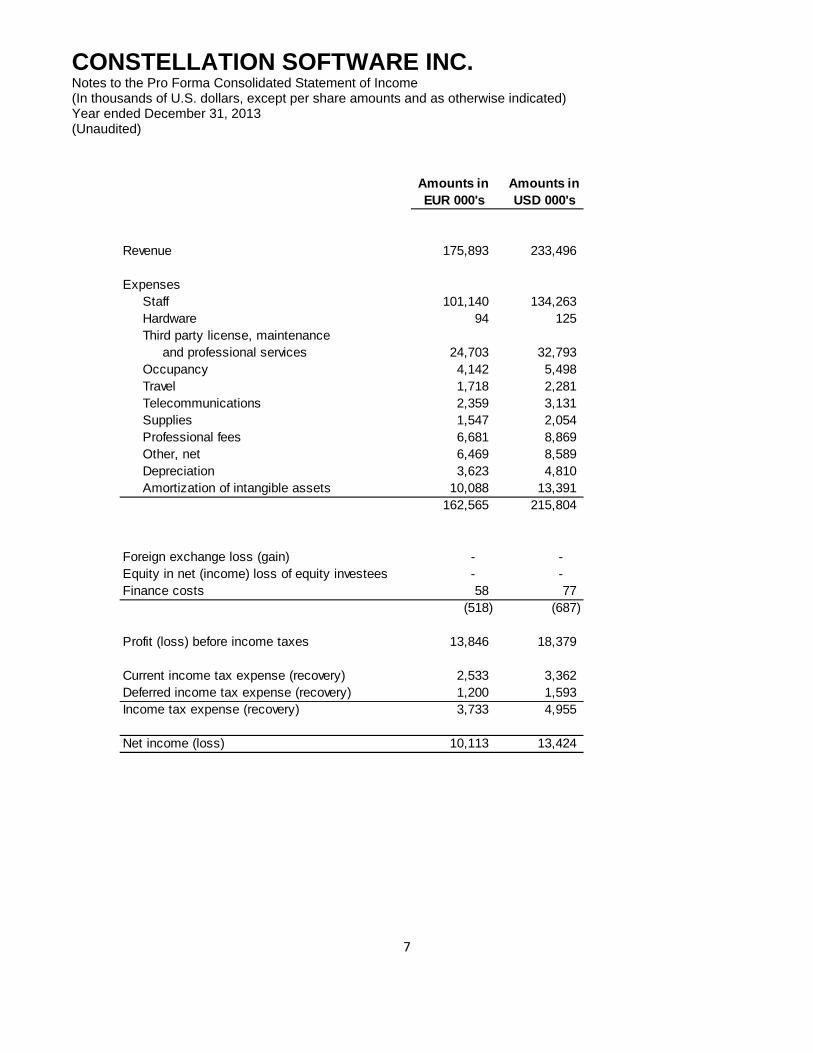
CONSTELLATION SOFTWARE INC. Notes to the Pro Forma Consolidated Statement of Income (In thousands of U.S. dollars, except per share amounts and as otherwise indicated) Year ended December 31, 2013 (Unaudited)
7
Amounts in EUR 000's
Amounts in USD 000's
Revenue 175,893 233,496
ExpensesStaff 101,140 134,263 Hardware 94 125 Third party license, maintenance
and professional services 24,703 32,793 Occupancy 4,142 5,498 Travel 1,718 2,281 Telecommunications 2,359 3,131 Supplies 1,547 2,054 Professional fees 6,681 8,869 Other, net 6,469 8,589 Depreciation 3,623 4,810 Amortization of intangible assets 10,088 13,391
162,565 215,804
Foreign exchange loss (gain) - - Equity in net (income) loss of equity investees - - Finance costs 58 77
(518) (687)
Profit (loss) before income taxes 13,846 18,379
Current income tax expense (recovery) 2,533 3,362 Deferred income tax expense (recovery) 1,200 1,593 Income tax expense (recovery) 3,733 4,955
Net income (loss) 10,113 13,424