form 8-k - general electric · united states securities and exchange commission washington, d.c....
TRANSCRIPT

FORM 8-KGENERAL ELECTRIC CO - GEFiled: October 08, 2008 (period: October 08, 2008)
Report of unscheduled material events or corporate changes.

Table of Contents
8-K - FORM 8-K
Item 8.01 Other Events
Item 9.01 Financial Statements and Exhibits
SIGNATURES
EX-23 (EXHIBIT 23)
EX-99.A (EXHIBIT 99(A))
EX-99.B (EXHIBIT 99(B))
EX-99.C (EXHIBIT 99(C0)

UNITED STATESSECURITIES AND EXCHANGE COMMISSION
Washington, D.C. 20549
FORM 8-K
CURRENT REPORT
Pursuant to Section 13 or 15(d) of The Securities Exchange Act of 1934
Date of Report (Date of earliest event reported) October 8, 2008 General Electric Company (Exact name of registrant as specified in its charter)
New York 001-00035 14-0689340(State or other jurisdiction
of incorporation) (Commission
File Number) (IRS Employer
Identification No.)
3135 Easton Turnpike, Fairfield, Connecticut 06828-0001(Address of principal executive offices) (Zip Code)
Registrant’s telephone number, including area code (203) 373-2211
(Former name or former address, if changed since last report.)
Check the appropriate box below if the Form 8-K filing is intended to simultaneously satisfy the filing obligation of the registrantunder any of the following provisions (see General Instructions A.2. below): � Written communications pursuant to Rule 425 under the Securities Act (17 CFR 230.425)� Soliciting material pursuant to Rule 14a-12 under the Exchange Act (17 CFR 240.14a-12)� Pre-commencement communications pursuant to Rule 14d-2(b) under the Exchange Act (17 CFR 240.14d-2(b))� Pre-commencement communications pursuant to Rule 13e-4(c) under the Exchange Act (17 CFR 240.13e-4(c))
(1)
Source: GENERAL ELECTRIC CO, 8-K, October 08, 2008

Item 8.01 Other Events General Electric Company (the “Company”) is filing this Form 8-K to update the financial information in the Company’s AnnualReport on Form 10-K for the year ended December 31, 2007 (“2007 10-K”) and segment results for the six quarters ended June 30,2008, to reflect our revised financial information and disclosures as a result of our segment reorganization and the effects of reportingour Japanese mortgage and card businesses as discontinued operations. As described in our Form 8-K filed July 25, 2008, we reorganized our businesses effective July 25, 2008. We believe that this neworganizational structure simplifies the company and aligns businesses for growth and efficiency. Our five operating segments as of July 25, 2008, were as follows:
• Technology Infrastructure – the combination of our previous Healthcare segment, the Aviation and Transportation businesses ofour previous Infrastructure segment and the Enterprise Solutions business of our previous Industrial Products segment
• Energy Infrastructure – the combination of our Energy (including our motors business which was previously reported in our
Industrial Products segment), Oil & Gas and Water & Process Technologies businesses of our previous Infrastructure segment
• Capital Finance – the combination of our previous Commercial Finance and GE Money segments and the Aviation FinancialServices, Transportation Finance and Energy Financial Services businesses of our previous Infrastructure segment
• NBC Universal − unchanged
• Consumer & Industrial – the Consumer & Industrial business (excluding our motors business) of our previous Industrial Products
segment More detailed business descriptions are presented in the exhibits referred to in Item 9.01. As required by Financial Accounting Standards Board (FASB) Statement of Financial Accounting Standards (SFAS) No. 131,Disclosures about Segments of an Enterprise and Related Information, consolidated financial statements issued by GE in the futurewill reflect modifications to our previous reportable segments resulting from these organizational changes, including reclassificationof all comparative prior period segment information. Accordingly, in this Form 8-K, we are providing the required reclassifiedinformation about this reorganization as it relates to prior periods. As previously reported in our second quarter 2008 Form 10-Q, subsequent to the end of the second quarter of 2008, we reached anagreement to sell GE Money Japan, which is comprised of our Japanese personal loan business (Lake) and our Japanese mortgage andcard businesses, excluding our minority ownership in GE Nissen Credit Co., Ltd. During the third quarter of 2008, we completed thesale of GE Money Japan. This Form 8-K also reflects GE Money Japan as discontinued operations and revises the financial position,results of operations and cash flows reported in the Statement of Financial Position, Statement of Earnings, and Statement of CashFlows for the addition of our Japanese mortgage and card businesses, excluding our minority ownership in GE Nissen Credit Co.,Ltd., to discontinued operations.
(2)
Source: GENERAL ELECTRIC CO, 8-K, October 08, 2008

Also, as previously reported in our second quarter 2008 Form 10-Q, during the course of an internal review in connection with ourongoing U.S. Securities and Exchange Commission investigation, we identified certain immaterial items with respect to the Statementof Cash Flows that we have corrected from amounts in previous filings. These items primarily relate to elimination of intercompanytransactions between GE and GECS and include effects of clerical errors, errors in elimination classifications among operating,investing and financing activities and transaction-reporting errors involving identification of intercompany transactions that had notpreviously been eliminated in the Consolidated Statement of Cash Flows. These errors had no effects on our total cash or cashequivalents, nor did they affect our financial position or results of operations. This Form 8-K reflects the effects of these immaterialcorrections for the Statement of Cash Flows for the years ended December 31, 2007, 2006 and 2005. Item 9.01 Financial Statements and Exhibits Exhibit 23 − Consent of KPMG LLP. The following exhibits filed with this Form 8-K and incorporated herein by reference update and supersede only our segment resultsfor the six quarters ended June 30, 2008 and those portions of our 2007 10-K that are most affected by our recent segmentreorganization and the reporting of our Japanese mortgage and card businesses as discontinued operations. All other information in our quarterly reports and the 2007 10-K has not been updated for events or developments thatoccurred subsequent to the filing of the 2007 10-K with the U.S. Securities and Exchange Commission. For developments sincethe filing of the 2007 10-K, please refer to the Company’s Quarterly Reports on Form 10-Q for the periods ended March 31,2008 and June 30, 2008, and the Company’s Forms 8-K filed since the filing of the 2007 10-K. For information concerning theeffects of recent conditions in the financial markets on the Company’s earnings guidance and operating plan, please refer tothe Company’s Forms 8-K filed on September 25, 2008 and October 1, 2008. The information in this Form 8-K, including theexhibits, should be read in conjunction with the 2007 10-K and subsequent SEC filings.
• Exhibit 99(a) − revised descriptions of our businesses based on our new organization.
• Exhibit 99(b) − revised segment results, with annual results for the five years ended December 31, 2007, and quarterly results forthe six quarters ended June 30, 2008.
• Exhibit 99(c) − complete revised Management’s Discussion and Analysis and consolidated financial statements from our 2007
10-K. Financial statements in this exhibit are now our historical financial statements. Forward-Looking Statements This document contains “forward-looking statements”– that is, statements related to future, not past, events. In this context,forward-looking statements often address our expected future business and financial performance, and often contain words such as“expect,” “anticipate,” “intend,” “plan,” “believe,” “seek,” or “will.” Forward-looking statements by their nature address matters thatare, to different degrees, uncertain. For us, particular uncertainties that could adversely or positively affect our future results include:the behavior of financial markets, including fluctuations in interest and exchange rates, commodity and equity prices and the value offinancial assets; continued volatility and further deterioration of the capital markets; the commercial and consumer credit environment;the impact of regulation and regulatory, investigative and legal actions; strategic actions, including acquisitions and dispositions;future integration of acquired businesses; future financial performance of major industries which we serve, including, withoutlimitation, the air and rail transportation, energy generation, media, real estate and healthcare industries; and numerous other mattersof national, regional and global scale, including those of a political, economic, business and competitive nature. These uncertaintiesmay cause our actual future results to be materially different than those expressed in our forward-looking statements. We have notupdated our forward-looking statements made as of the original filing date of our 2007 10-K to account for subsequent events.
Source: GENERAL ELECTRIC CO, 8-K, October 08, 2008

(3)
Source: GENERAL ELECTRIC CO, 8-K, October 08, 2008

SIGNATURES Pursuant to the requirements of the Securities Exchange Act of 1934, the registrant has duly caused this report to be signed on itsbehalf by the undersigned hereunto duly authorized. General Electric Company
(Registrant) Date: October 8, 2008 /s/ Jamie S. Miller
Jamie S. Miller Vice President and Controller
(4)
Source: GENERAL ELECTRIC CO, 8-K, October 08, 2008

Source: GENERAL ELECTRIC CO, 8-K, October 08, 2008

Exhibit 23
Consent of Independent Registered Public Accounting Firm The Board of DirectorsGeneral Electric Company:
We consent to the incorporation by reference in the registration statements on Form S-3 (Registration Nos. 33-50639, 33-39596,33-39596-01, 33-29024, 333-59671, 333-120155, 333-72566, and 333-130117), on Form S-4 (Registration No. 333-107556), and onForm S-8 (Registration Nos. 333-01953, 333-42695, 333-74415, 333-83164, 333-98877, 333-94101, 333-65781, 333-88233,333-117855, 333-99671, 333-102111, and 333-142452) of General Electric Company of our report dated February 20, 2008, except asto page 11 and notes 1, 2, 4, 5, 7, 8, 9, 10, 12, 13, 14, 15, 16, 17, 19, 20, 24, 25, 26, 27, 28, 29 and 30, which are as of October 1, 2008,with respect to the statement of financial position of General Electric Company and consolidated affiliates as of December 31, 2007and 2006, and the related statements of earnings, changes in shareowners’ equity and cash flows for each of the years in the three-yearperiod ended December 31, 2007, and the effectiveness of internal control over financial reporting as of December 31, 2007, whichreport appears in the Form 8-K of General Electric Company to be filed on or about October 7, 2008.
Our report refers to a change in the methods of accounting for uncertainty in income taxes and for a change or projected change in thetiming of cash flows relating to income taxes generated by leveraged lease transactions in 2007, and to a change in the methods ofaccounting for pensions and other postretirement benefits and for share-based compensation in 2006.
/s/ KPMG LLP
KPMG LLPStamford, Connecticut
October 7, 2008
Source: GENERAL ELECTRIC CO, 8-K, October 08, 2008

Exhibit 99(a)
Revised Descriptions of Our Businesses Based on Our New Organization
(Pages 1-11)
(1)
Source: GENERAL ELECTRIC CO, 8-K, October 08, 2008

Revised Descriptions of Our Businesses Based on Our New Organization (Pages 1-11)
Part I
Operating Segments As described in our Form 8-K filed July 25, 2008, we reorganized our businesses effective July 25, 2008. We believe that this neworganizational structure simplifies the company and aligns businesses for growth and efficiency. Our five operating segments as of July 25, 2008, were as follows:
• Technology Infrastructure – the combination of our previous Healthcare segment, the Aviation and Transportation businesses ofour previous Infrastructure segment and the Enterprise Solutions business of our previous Industrial Products segment
• Energy Infrastructure – the combination of our Energy (including our motors business which was previously reported in our
Industrial Products segment), Oil & Gas and Water & Process Technologies businesses of our previous Infrastructure segment
• Capital Finance – the combination of our previous Commercial Finance and GE Money segments and the Aviation FinancialServices, Transportation Finance and Energy Financial Services businesses of our previous Infrastructure segment
• NBC Universal − unchanged
• Consumer & Industrial – the Consumer & Industrial business (excluding our motors business) of our previous Industrial Products
segment A summary description of each of our operating segments follows. We will also continue our longstanding practice of providing supplemental information for certain businesses within the segments. Technology Infrastructure Technology Infrastructure (24.8%, 24.9% and 24.9% of consolidated revenues in 2007, 2006 and 2005, respectively) is one of theworld’s leading providers of essential technologies to developed, developing and emerging countries. Around the world, we arehelping build healthcare, transportation and technology infrastructure. Many of GE's fastest growing businesses are in this segment. Our operations are located in North America, Europe, Asia and South America.
(2)
Source: GENERAL ELECTRIC CO, 8-K, October 08, 2008

Aviation Aviation produces, sells and services jet engines, turboprop and turbo shaft engines, and related replacement parts for use in militaryand commercial aircraft. Our military engines are used in a wide variety of aircraft including fighters, bombers, tankers, helicoptersand surveillance aircraft, as well as marine applications, and our commercial engines power aircraft in all categories of range:short/medium, intermediate and long-range, as well as executive and regional aircraft. We also produce and market engines throughCFM International, a company jointly owned by GE and Snecma, a subsidiary of SAFRAN of France, and Engine Alliance, LLC, acompany jointly owned by GE and the Pratt & Whitney division of United Technologies Corporation. New engines are also beingdesigned and marketed in joint ventures with Rolls-Royce Group plc and Honda Aero, Inc., a division of Honda Motor Co., Ltd. Aviation is party to collaboration agreements that share the financial results of certain aircraft and marine engine lines. Thesecollaboration agreements take the form of both joint ventures and revenue sharing programs.
• Joint ventures market and sell particular aircraft engine lines, but require negligible direct investment because the venture partiesconduct essentially all of the development, production, assembly and aftermarket support activities. Under these agreements,Aviation supplies certain engine components and retains related intellectual property rights. The CFM56 engine line is the productof CFM International and the GP7000 engine line is the product of Engine Alliance, LLC.
• Revenue sharing programs are a standard form of cooperation for specific product programs in the aviation industry. These
businesses are controlled by Aviation, but counterparties have an agreed share of revenues as well as development and componentproduction responsibilities. At December 31, 2007, such counterparty interests ranged from 3% to 47% of various programs;associated distributions are accounted for as costs of production.
On May 4, 2007, Aviation acquired Smiths Aerospace from Smiths Group plc for approximately $5.2 billion in cash. SmithsAerospace is a $2.4 billion (sales) global aerospace systems and equipment company that provides airborne platform computingsystems, power generation and distribution products, mechanical actuation products and landing gear, plus various engine componentsand a global customer services organization. We provide maintenance, component repair and overhaul services (MRO), including sales of replacement parts, for many models ofengines, including repair and overhaul of engines manufactured by competitors. These MRO services are often provided underlong-term maintenance contracts. The worldwide competition in aircraft jet engines and MRO (including parts sales) is intense. Both U.S. and export markets areimportant. Product development cycles are long and product quality and efficiency are critical to success. Research and developmentexpenditures are important in this business, as are focused intellectual property strategies and protection of key aircraft engine design,manufacture, repair and product upgrade technologies. Our products and services are subject to a number of regulatory standards. Potential sales for any engine are limited by, among other things, its technological lifetime, which may vary considerably dependingupon the rate of advance in technology, the small number of potential customers and the limited number of relevant airframeapplications. Aircraft engine orders tend to follow military and airline procurement cycles, although these cycles differ from eachother.
(3)
Source: GENERAL ELECTRIC CO, 8-K, October 08, 2008
Enterprise Solutions Enterprise Solutions offers protection and productivity solutions to some of the most pressing issues that industries face: safe facilities,plant automation, power control and sensing applications in the operating environment. From home to industry to national security,our technology covers the full spectrum of security solutions, including card access systems, high-tech video monitoring, intrusion andfire detection, real estate and property control, and explosives and narcotics detection. We design and manufacture equipment andsystems that enable customers to monitor, protect, control and ensure the safety of their critical applications. These products includeprecision sensors for temperature, flow rate, pressure, humidity, gas, infrared and ultrasonic applications; high-quality handheld andportable field calibrators; equipment for detection of material defects; stand-alone measurement instrumentation; and systems thatprovide the end-to-end solutions necessary to validate or certify vital commercial and industrial processes. We deliver automationhardware and software designed to help users reduce costs, increase efficiency and enhance profitability through a diverse array ofcapabilities and products, including controllers, embedded systems, advanced software, motion control, computer numerical controls,operator interfaces, industrial computers, and lasers. We also provide products and services to protect and optimize assets such asgenerators, transmission lines and motors, to ensuring secure wireless data transmission and uninterruptible power. Healthcare Healthcare has expertise in medical imaging and information technologies, medical diagnostics, patient monitoring systems, diseaseresearch, drug discovery and biopharmaceutical manufacturing technologies. We are dedicated to predicting and detecting diseaseearlier, monitoring its progress and informing physicians, helping them to tailor individual treatment for individual patients.Healthcare manufactures, sells and services a wide range of medical equipment: diagnostic imaging systems including equipment formagnetic resonance (MR), computed tomography (CT), positron emission tomography (PET), nuclear and X-ray imaging. Clinicalsystems including patient monitoring, diagnostic cardiology, ultrasound, bone densitometry, anesthesiology and oxygen therapy,neonatal and critical care devices. Medical diagnostics and life sciences products include diagnostic imaging agents used in medicalscanning procedures, protein separation products including chromatography purification systems used in the manufacturing ofbio-pharmaceuticals, and high-throughput systems for applications in genomics, proteomics and bioassays. During 2006, we acquiredIDX Systems Corporation, a leading healthcare information technology provider and Biacore International AB, a leading provider ofsystems for protein interaction analysis. We sell products and product services to hospitals, medical facilities, pharmaceutical andbiotechnology companies and to the life science research market worldwide. Our product services include remote diagnostic andrepair services for medical equipment manufactured by GE and by others, as well as computerized data management and customerproductivity services. We compete with a variety of U.S. and non-U.S. manufacturers and services operations. Technological competence and innovation,excellence in design, high product performance, quality of services and competitive pricing are among the key factors affectingcompetition for these products and services. Throughout the world, we play a critical role in delivering new technology to improvepatient outcomes and productivity tools to help control healthcare costs. Our products are subject to regulation by numerous government agencies, including the FDA, and various laws apply to claimssubmitted under Medicare, Medicaid or other federally-funded healthcare programs.
(4)
Source: GENERAL ELECTRIC CO, 8-K, October 08, 2008

Transportation Transportation provides technology solutions for customers in a variety of industries including railroad, transit, mining, oil and gas,power generation and marine. We serve customers in more than 100 countries. Transportation manufactures high-horsepower diesel-electric locomotives, including the Evolution Series™, the most technologicallyadvanced and most fuel efficient locomotive, which meets or exceeds the U.S. Environmental Protection Agency’s Tier IIrequirements. We also offer leading drive technology solutions to the mining, transit, marine and stationary, and drilling industries.Our motors operate in thousands of applications, from electrical drives systems for large haulage trucks used in the mining industry totransit cars and drilling rigs, and our engines are used for marine power as well as stationary power generation applications. We alsoprovide gearing technology for critical applications such as wind turbines. Transportation also provides a portfolio of services offerings, designed to improve fleet efficiency and reduce operating expenses,including repair services, locomotive enhancements, modernizations, and information-based services like remote monitoring anddiagnostics. We provide train control products, railway management services, and signaling systems to increase service levels,optimize asset utilization, and streamline operations for railroad owners and operators. We deliver leading edge tools that improveasset availability and reliability, optimize network planning, and control network execution to plan. For information about orders and backlog, see page 13 of Item 7, Management’s Discussion and Analysis of Financial Condition andResults of Operations in Exhibit 99(c). Energy Infrastructure Energy Infrastructure (17.8%, 16.6% and 16.1% of consolidated revenues in 2007, 2006 and 2005, respectively) is a leader in the fieldof development, implementation and improvement of products and technologies that harness resources such as wind, oil, gas andwater. Our operations are located in North America, Europe, Asia, South America and Africa.
(5)
Source: GENERAL ELECTRIC CO, 8-K, October 08, 2008

Energy Energy serves power generation, industrial, government and other customers worldwide with products and services related to energyproduction, distribution and management. We offer wind turbines as part of our renewable energy portfolio, which also includes solartechnology. We also sell aircraft engine derivatives for use as industrial power sources. Gas turbines and generators are usedprincipally in power plants for generation of electricity and for industrial cogeneration and mechanical drive applications. We are aleading provider of Integrated Gasification Combined Cycle (IGCC) technology design and development. IGCC systems convert coaland other hydrocarbons into synthetic gas that, after cleanup, is used as the primary fuel for gas turbines in combined-cycle systems.IGCC systems produce fewer air pollutants compared with traditional pulverized coal power plants. We sell steam turbines andgenerators to the electric utility industry and to private industrial customers for cogeneration applications. Nuclear reactors, fuel andsupport services for both new and installed boiling water reactors are offered through joint ventures with Hitachi and Toshiba. Inaddition, we design and manufacture motors and control systems used in industrial applications primarily for oil and gas extractionand mining. We provide our customers with total solutions to meet their needs through a complete portfolio of aftermarket services,including equipment upgrades, long-term maintenance service agreements, repairs, equipment installation, monitoring anddiagnostics, asset management and performance optimization tools, remote performance testing and Dry Low NOx (DLN) tuning. Wecontinue to invest in advanced technology development that will provide more value to our customers and more efficient solutions thatcomply with today’s strict environmental regulations. Energy is party to revenue sharing programs that share the financial results of certain aero-derivative lines. These businesses arecontrolled by Energy, but counterparties have an agreed share of revenues as well as development and component productionresponsibilities. At December 31, 2007, such counterparty interests ranged from 5% to 49% of various programs; associateddistributions are accounted for as costs of production. Worldwide competition for power generation products and services is intense. Demand for power generation is global and, as a result,is sensitive to the economic and political environment of each country in which we do business. The balance of regional growth anddemand side management are important factors to evaluate as we plan for future development. Oil & Gas Oil & Gas supplies technology-based equipment and services for the entire oil and gas industry – from drilling and completion toproduction, transportation, refining, processing, petrochemicals and plastics. We offer a wide range of surface and subsea drilling andproduction systems, equipment for floating production platforms, compressors, turbines, turboexpanders and industrial powergeneration equipment. As a global business, Oil & Gas supports the world’s leading national and international oil companies withlatest technology products and services that drive improvements in productivity, efficiency and environmental performance. On February 23, 2007, Oil & Gas acquired Vetco Gray, one of the world’s leading suppliers of drilling, completion and productionequipment for onshore and subsea applications in oil and gas fields. The business supplies flow control valves (known as “Christmastrees”), control systems, wellheads, manifolds, risers and associated after-market services.
(6)
Source: GENERAL ELECTRIC CO, 8-K, October 08, 2008

The global demand for oil and gas, coupled with a geographic imbalance between supply and demand, is promoting investment in theexploration, production, transportation and processing segments of the industry. Water & Process Technologies Water offers water treatment solutions for industrial and municipal water systems including the supply and related services ofspecialty chemicals, water purification systems, pumps, valves, filters and fluid handling equipment for improving the performance ofwater, wastewater and process systems, including mobile treatment systems and desalination processes. During 2006, we acquiredZENON Environmental Inc., a global leader in advanced membranes for water purification and wastewater treatment. For information about orders and backlog, see page 14 of Item 7, Management’s Discussion and Analysis of Financial Condition andResults of Operations in Exhibit 99(c). Capital Finance Capital Finance (38.4%, 37.2% and 36.0% of consolidated revenues in 2007, 2006 and 2005, respectively) offers a broad range offinancial products and services worldwide. Services include commercial loans, operating leases, fleet management, financialprograms, home loans, insurance, credit cards, personal loans and other financial services. Our operations are located in North America, South America, Europe, Australia and Asia. Commercial Lending and Leasing (CLL) CLL offers a broad range of financial services worldwide. We have particular mid-market expertise, and offer loans, leases and otherfinancial services to customers, including manufacturers, distributors and end-users for a variety of equipment and major capitalassets. These assets include industrial-related facilities and equipment; vehicles; corporate aircraft; and equipment used in manyindustries, including the construction, manufacturing, transportation, telecommunications and healthcare industries. During 2007, wemade a number of acquisitions, the most significant of which were Trustreet Properties, Inc.; Diskont und Kredit AG and DiskoLeasing GmbH (DISKO) and ASL Auto Service-Leasing GmbH (ASL), the leasing businesses of KG Allgemeine Leasing GmbH &Co.; and Sanyo Electric Credit Co., Ltd. We operate in a highly competitive environment. Our competitors include commercial banks, investment banks, leasing companies,financing companies associated with manufacturers, and independent finance companies. Competition related to our lending andleasing operations is based on price, that is interest rates and fees, as well as deal structure and terms. Profitability is affected not onlyby broad economic conditions that affect customer credit quality and the availability and cost of capital, but also by successfulmanagement of credit risk, operating risk and market risks such as interest rate and currency exchange risks. Success requires highquality risk management systems, customer and industry specific knowledge, diversification, service and distribution channels, strongcollateral and asset management knowledge, deal structuring expertise and the ability to reduce costs through technology andproductivity.
(7)
Source: GENERAL ELECTRIC CO, 8-K, October 08, 2008

Energy Financial Services Energy Financial Services offers structured equity, debt, leasing, partnership financing, project finance and broad-based commercialfinance to the global energy and water industries and invests in operating assets in these industries. During 2007, we acquired acontrolling interest in Regency Energy Partners LP, a midstream master limited partnership engaged in the gathering, processing,transporting and marketing of natural gas and gas liquids. We operate in a highly competitive environment. Our competitors include banks, financial institutions, energy and water companies,and other finance and leasing companies. Competition is primarily based on price, that is interest rates and fees, as well as dealstructure and terms. As we compete globally, our success is sensitive to the economic and political environment of each country inwhich we do business. Real Estate Real Estate offers a comprehensive range of capital and investment solutions, including equity capital for acquisition or development,as well as fixed and floating rate mortgages for new acquisitions or re-capitalizations of commercial real estate worldwide. Ourbusiness finances, with both equity and loan structures, the acquisition, refinancing and renovation of office buildings, apartmentbuildings, retail facilities, parking facilities and industrial properties. Our typical real estate loans are intermediate term, may be eithersenior or subordinated, fixed or floating-rate, and are secured by existing income-producing commercial properties. Certain of ouroriginations of low loan-to-value loans are conducted for term securitization within one year; certain of our equity investments,including properties we acquire for investment, are sold under favorable market conditions. We invest in, and provide restructuringfinancing for, portfolios of mortgage loans, limited partnerships and tax-exempt bonds. In the normal course of our business operations, we sell certain real estate equity investments when it is economically advantageousfor us to do so. However, as real estate values are affected by certain forces beyond our control (e.g., market fundamentals anddemographic conditions), it is difficult to predict with certainty the level of future sales or sales prices. Rental income generallyapproximates operating expenses, which include depreciation and amortization. We operate in a highly competitive environment. Our competitors include banks, financial institutions, real estate companies, realestate investment funds and other financial companies. Competition in our equity investment business is primarily based on price, andcompetition in our lending business is primarily based on interest rates and fees, as well as deal structure and terms. As we competeglobally, our success is sensitive to the economic and political environment of each country in which we do business. GECAS GECAS is a global leader in commercial aircraft leasing and finance, delivering fleet and financing solutions for commercial aircraft.Our airport financing and development unit provides debt and equity solutions for airport acquisition, construction and expansion;project finance for airport facilities including terminals, cargo facilities and parking structures; and consulting services focusing on thedevelopment and investment in regional airports and terminals. GECAS also offers a wide array of products including leases, debt andequity investment to the global transportation industry (marine, rail and intermodal).
(8)
Source: GENERAL ELECTRIC CO, 8-K, October 08, 2008
We operate in a highly competitive environment. Our competitors include aircraft manufacturers, banks, financial institutions, equityinvestors, and other finance and leasing companies. Competition is based on lease rate financing terms, aircraft delivery dates,condition and availability, as well as available capital demand for financing. GE Money GE Money is a leading provider of financial services to consumers and retailers in over 50 countries around the world. We offer a fullrange of innovative financial products to suit customers’ needs. These products include private-label credit cards; personal loans; bankcards; auto loans and leases; mortgages; debt consolidation; home equity loans; corporate travel and purchasing cards; deposit andother savings products; and small and medium enterprise lending on a global basis. In December 2007, we sold our U.S. mortgage business (WMC). In September 2007, we committed to a plan to sell our Japanesepersonal loan business (Lake). During the second quarter of 2008, we committed to sell GE Money Japan, which is comprised of Lakeand our Japanese mortgage and card businesses, excluding our minority ownership in GE Nissen Credit Co., Ltd. During the thirdquarter of 2008, we completed the sale of GE Money Japan. In 2007, as part of our continued global expansion, we made a number of acquisitions, the most significant of which was a 33% stakein Bank of Ayudhya and private label credit card portfolios of Chevron and Lowe’s. Our operations are subject to a variety of bank and consumer protection regulations. Further, a number of countries have ceilings onrates chargeable to consumers in financial service transactions. We are subject to competition from various types of financialinstitutions including commercial banks, leasing companies, consumer loan companies, independent finance companies,manufacturers’ captive finance companies, and insurance companies. Industry participants compete on the basis of price, servicingcapability, promotional marketing, risk management, and cross selling. The markets in which we operate are also subject to the risksfrom fluctuations in retail sales, interest and currency exchange rates, and the consumer’s capacity to repay debt.
(9)
Source: GENERAL ELECTRIC CO, 8-K, October 08, 2008

NBC Universal NBC Universal (8.9%, 10.7% and 10.8% of consolidated revenues in 2007, 2006 and 2005, respectively) is one of the world’s leadingmedia and entertainment companies in the development, production and marketing of entertainment, news and information to a globalaudience. Formed in 2004 through the combining of NBC and Vivendi Universal Entertainment, NBC Universal owns and operates avaluable portfolio of news and entertainment networks, a premier motion picture company, significant television productionoperations, a leading television stations group and world-renowned theme parks. NBC Universal is 80-percent owned by GeneralElectric and 20-percent owned by Vivendi S.A. NBC Universal is principally engaged in the broadcast of network television servicesto affiliated television stations within the United States; the production and distribution of television programs and motion pictures;the operation, under licenses from the U.S. Federal Communications Commission (FCC), of television stations; the operation ofseveral cable/satellite television networks around the world; the operation of theme parks; and investment and programming activitiesin digital media and the Internet. The NBC television network is one of four major U.S. commercial broadcast television networks andserves 230 affiliated stations within the United States. Telemundo is our U.S. Spanish-language broadcast television network. AtDecember 31, 2007, we owned and operated 26 television stations. Broadcasting operations of the NBC television network, theTelemundo network and the company’s owned stations are subject to FCC regulation. Our cable/satellite television networkoperations principally include USA Network, Bravo, CNBC, the SciFi Channel, MSNBC, Oxygen, the Sundance Channel, UniHD,Chiller, Sleuth, mun2 and news, information and entertainment channels across Europe, Asia and Latin America. We have exclusiveU.S. television rights to the 2008, 2010 and 2012 Olympic Games, National Football League Sunday Night Football and the SuperBowl in 2009 and 2012. NBC Universal is subject to a wide range of factors, which could adversely affect our operations. Our broadcast networks, cabletelevision networks and television stations are subject to advertising patterns and changes in viewer taste and preference that can beunpredictable or unforeseen. In addition, future revenues in these properties are dependent upon our ability to obtain, renew orrenegotiate long-term programming contracts, including event-based sports programming and contracts for the distribution of ourprogramming to cable/satellite operators. Our television and motion pictures production and distribution businesses are affected by thetiming and performance of releases in the theatrical, home entertainment and television markets. Technological advances like digitalvideo recorders, Internet streaming and electronic sell-through offer entertainment options through new media, introducing uncertaintyto our operations. Other technologies enable the unauthorized copying and distribution of our motion pictures and televisionprogramming, increasing the risk of piracy. We continue to devote substantial resources to protect our intellectual property againstunauthorized use. NBC Universal’s headquarters are in New York, New York, with operations throughout North America, Europe, South America andAsia.
(10)
Source: GENERAL ELECTRIC CO, 8-K, October 08, 2008

Consumer & Industrial Consumer & Industrial (7.3%, 8.7% and 9.6% of consolidated revenues in 2007, 2006 and 2005, respectively) sells products that shareseveral characteristics − competitive design, efficient manufacturing and effective distribution and service. Strong global competitionrarely permits premium pricing, so cost control, including productivity, is key. Despite pricing pressures on many of our products, wealso invest in the development of differentiated, premium products that are more profitable. While some Consumer & Industrialproducts are primarily directed to consumer applications (major appliances, for example), and some primarily to industrialapplications (switchgear, for example), others are directed to both markets (lighting, for example). We sell and service major home appliances including refrigerators, freezers, electric and gas ranges, cooktops, dishwashers, clotheswashers and dryers, microwave ovens, room air conditioners, and residential water systems for filtration, softening and heating.Brands are Monogram®, GE Profile™, GE® and Hotpoint®. We manufacture certain products, and also source finished product and component parts from third-party global manufacturers. Alarge portion of our appliances sales are through a variety of retail outlets for replacement of installed units. Residential buildingcontractors installing units in new construction are our second major U.S. channel. We offer the largest OEM service organization inthe appliances industry, providing in-home repair, extended service plans and warranty administration. We also manufacture and sell avariety of lamp products for commercial, industrial and consumer markets, including full lines of incandescent, halogen, fluorescent,high-intensity discharge, light-emitting diode, automotive and miniature products. Consumer & Industrial also provides integrated electrical equipment and systems used to distribute, protect and control energy andequipment. We manufacture and distribute electrical distribution and control products including controls and drives, lighting andpower panels, switchgear and circuit breakers that are used to distribute and manage power in a variety of residential, commercial,consumer and industrial applications. We also provide customer-focused solutions centered on the delivery and control of electricpower, and market a wide variety of commercial lighting systems. The aggregate level of economic activity in markets for such products and services generally lags overall economic slowdowns as wellas subsequent recoveries. In the United States, industrial markets are undergoing significant structural changes reflecting, among otherfactors, increased international competition and continued commodity cost pressures. Our headquarters are in Louisville, Kentucky and our operations are located in North America, Europe, Asia and Latin America. Discontinued Operations Discontinued operations comprised GE Money Japan; WMC; Plastics; Advanced Materials; GE Life, our U.K.-based life insuranceoperation; the property and casualty insurance and reinsurance businesses and the European life and health operations of GE InsuranceSolutions Corporation (GE Insurance Solutions); and Genworth Financial, Inc. (Genworth), our formerly wholly-owned subsidiarythat conducted most of our consumer insurance business, including life and mortgage insurance operations.
(11)
Source: GENERAL ELECTRIC CO, 8-K, October 08, 2008

Source: GENERAL ELECTRIC CO, 8-K, October 08, 2008

Exhibit 99(b)
Revised Segment Results, with Annual Results for the Five Years EndedDecember 31, 2007, and Quarterly Results for the Six Quarters Ended June 30,
2008 (Pages 1-9)
(1)
Source: GENERAL ELECTRIC CO, 8-K, October 08, 2008

Revised Segment Results, with Annual Results for the Five Years Ended December 31, 2007, and Quarterly Results for the SixQuarters Ended June 30, 2008 (Pages 1-9)
Segment Operations Revenues and segment profit of our operating segments are shown below. As described in our Form 8-K filed July 25, 2008, wereorganized our businesses effective July 25, 2008. We believe that this new organizational structure simplifies the company andaligns businesses for growth and efficiency. Our five operating segments as of July 25, 2008, were as follows:
• Technology Infrastructure – the combination of our previous Healthcare segment, the Aviation and Transportation businesses ofour previous Infrastructure segment and the Enterprise Solutions business of our previous Industrial Products segment
• Energy Infrastructure – the combination of our Energy (including our motors business which was previously reported in our
Industrial Products segment), Oil & Gas and Water & Process Technologies businesses of our previous Infrastructure segment
• Capital Finance – the combination of our previous Commercial Finance and GE Money segments and the Aviation FinancialServices, Transportation Finance and Energy Financial Services businesses of our previous Infrastructure segment
• NBC Universal − unchanged
• Consumer & Industrial – the Consumer & Industrial business (excluding our motors business) of our previous Industrial Products
segment Segment profit is determined based on internal performance measures used by the Chief Executive Officer to assess the performanceof each business in a given period. In connection with that assessment, the Chief Executive Officer may exclude matters such ascharges for restructuring; rationalization and other similar expenses; in-process research and development and certain otheracquisition-related charges and balances; technology and product development costs; certain gains and losses from dispositions; andlitigation settlements or other charges, responsibility for which preceded the current management team. Segment profit always excludes the effects of principal pension plans, results reported as discontinued operations and accountingchanges. Segment profit excludes or includes interest and other financial charges and income taxes according to how a particularsegment’s management is measured – excluded in determining segment profit, which we sometimes refer to as “operating profit,” forTechnology Infrastructure, Energy Infrastructure, NBC Universal and Consumer & Industrial; included in determining segment profit,which we sometimes refer to as “net earnings,” for Capital Finance. All periods presented have been reclassified to conform to the changes in our organization effective July 25, 2008, and the effects ofreporting our Japanese mortgage and card businesses as discontinued operations. In addition to providing information on segments intheir entirety, we have also provided supplemental information for certain businesses within the segments for greater clarity.
(2)
Source: GENERAL ELECTRIC CO, 8-K, October 08, 2008

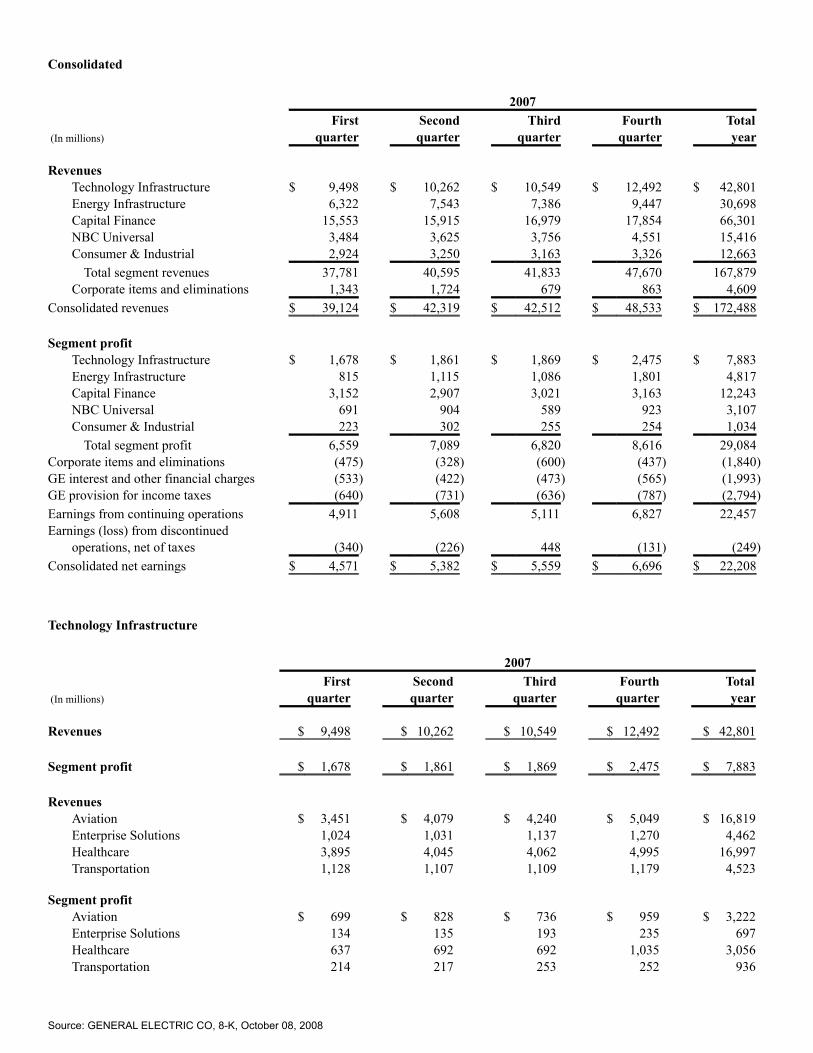
Consolidated For the years ended December 31 (In millions) 2007 2006 2005 2004 2003 Revenues
Technology Infrastructure $ 42,801 $ 37,687 $ 33,873 $ 30,142 $ 24,738 Energy Infrastructure 30,698 25,221 21,921 19,841 21,354 Capital Finance 66,301 56,378 49,071 43,750 34,915 NBC Universal 15,416 16,188 14,689 12,886 6,871 Consumer & Industrial 12,663 13,202 13,040 12,408 11,544
Total segment revenues 167,879 148,676 132,594 119,027 99,422 Corporate items and eliminations 4,609 2,892 3,668 4,787 4,915
Consolidated revenues $ 172,488 $ 151,568 $ 136,262 $ 123,814 $ 104,337
Segment profit
Technology Infrastructure $ 7,883 $ 7,308 $ 6,188 $ 5,412 $ 4,248 Energy Infrastructure 4,817 3,518 3,222 3,100 4,317 Capital Finance 12,243 10,397 8,414 6,593 5,325 NBC Universal 3,107 2,919 3,092 2,558 1,998 Consumer & Industrial 1,034 970 732 601 498
Total segment profit 29,084 25,112 21,648 18,264 16,386 Corporate items and eliminations (1,840) (1,548) (372) 165 353 GE interest and other financial charges (1,993) (1,668) (1,319) (901) (811)GE provision for income taxes (2,794) (2,552) (2,678) (1,937) (2,756)Earnings from continuing operations
before accounting changes 22,457 19,344 17,279 15,591 13,172 Earnings (loss) from discontinued
operations, net of taxes (249) 1,398 (559) 1,631 2,933
Earnings before accounting changes 22,208 20,742 16,720 17,222 16,105 Cumulative effect of accounting changes – – – – (587)Consolidated net earnings $ 22,208 $ 20,742 $ 16,720 $ 17,222 $ 15,518
(3)
Source: GENERAL ELECTRIC CO, 8-K, October 08, 2008

Consolidated 2008
(In millions)First
quarter Secondquarter
Sixmonths
Revenues
Technology Infrastructure $ 10,460 $ 11,851 $ 22,311 Energy Infrastructure 7,724 9,671 17,395 Capital Finance 16,969 17,981 34,950 NBC Universal 3,584 3,882 7,466 Consumer & Industrial 2,862 3,139 6,001
Total segment revenues 41,599 46,524 88,123 Corporate items and eliminations 629 316 945 Consolidated revenues $ 42,228 $ 46,840 $ 89,068
Segment Profit
Technology Infrastructure $ 1,701 $ 2,056 $ 3,757 Energy Infrastructure 1,070 1,579 2,649 Capital Finance 2,679 2,903 5,582 NBC Universal 712 909 1,621 Consumer & Industrial 144 138 282
Total segment profit 6,306 7,585 13,891 Corporate items and eliminations (595) (656) (1,251)GE interest and other financial charges (602) (554) (1,156)GE provision for income taxes (758) (981) (1,739)Earnings from continuing operations 4,351 5,394 9,745 Loss from discontinued operations, net of taxes (47) (322) (369)Consolidated net earnings $ 4,304 $ 5,072 $ 9,376
Technology Infrastructure 2008
(In millions)First
quarter Secondquarter
Sixmonths
Revenues $ 10,460 $ 11,851 $ 22,311 Segment profit $ 1,701 $ 2,056 $ 3,757 Revenues
Aviation $ 4,320 $ 4,923 $ 9,243 Enterprise Solutions 1,105 1,235 2,340 Healthcare 3,887 4,491 8,378 Transportation 1,148 1,202 2,350
Segment profit
Aviation $ 775 $ 914 $ 1,689 Enterprise Solutions 154 162 316 Healthcare 528 747 1,275 Transportation 254 241 495
Source: GENERAL ELECTRIC CO, 8-K, October 08, 2008

(4)
Source: GENERAL ELECTRIC CO, 8-K, October 08, 2008

Energy Infrastructure 2008
(In millions)First
quarter Secondquarter
Sixmonths
Revenues $ 7,724 $ 9,671 $ 17,395 Segment profit $ 1,070 $ 1,579 $ 2,649 Revenues
Energy $ 5,795 $ 7,180 $ 12,975 Oil & Gas 1,535 1,895 3,430
Segment profit
Energy $ 910 $ 1,222 $ 2,132 Oil & Gas 161 255 416
Capital Finance 2008
(In millions)First
quarter Secondquarter
Sixmonths
Revenues $ 16,969 $ 17,981 $ 34,950 Segment profit $ 2,679 $ 2,903 $ 5,582
Quarters ended (In millions)First
quarter Secondquarter
Total assets $ 620,038 $ 628,232
(5)
Source: GENERAL ELECTRIC CO, 8-K, October 08, 2008
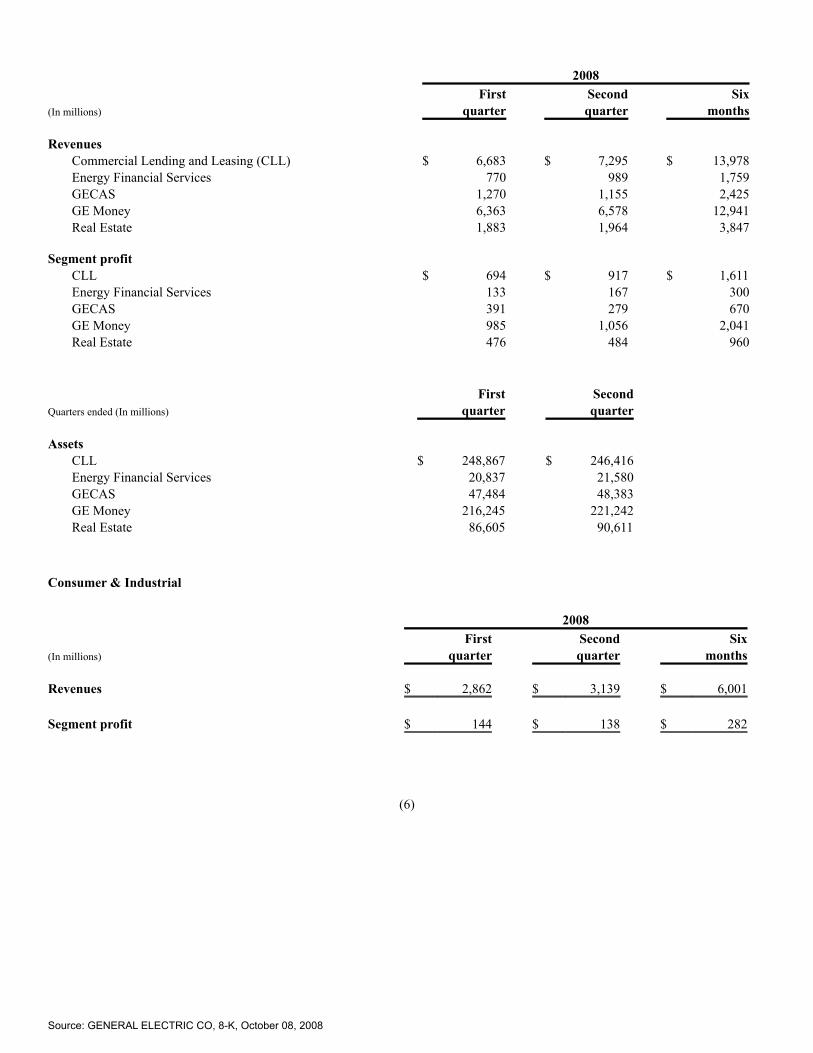
2008
(In millions)First
quarter Secondquarter
Sixmonths
Revenues
Commercial Lending and Leasing (CLL) $ 6,683 $ 7,295 $ 13,978 Energy Financial Services 770 989 1,759 GECAS 1,270 1,155 2,425 GE Money 6,363 6,578 12,941 Real Estate 1,883 1,964 3,847
Segment profit
CLL $ 694 $ 917 $ 1,611 Energy Financial Services 133 167 300 GECAS 391 279 670 GE Money 985 1,056 2,041 Real Estate 476 484 960
Quarters ended (In millions)First
quarter Secondquarter
Assets
CLL $ 248,867 $ 246,416 Energy Financial Services 20,837 21,580 GECAS 47,484 48,383 GE Money 216,245 221,242 Real Estate 86,605 90,611
Consumer & Industrial 2008
(In millions)First
quarter Secondquarter
Sixmonths
Revenues $ 2,862 $ 3,139 $ 6,001 Segment profit $ 144 $ 138 $ 282
(6)
Source: GENERAL ELECTRIC CO, 8-K, October 08, 2008
Consolidated 2007
(In millions)First
quarter Secondquarter
Thirdquarter
Fourthquarter
Totalyear
Revenues
Technology Infrastructure $ 9,498 $ 10,262 $ 10,549 $ 12,492 $ 42,801 Energy Infrastructure 6,322 7,543 7,386 9,447 30,698 Capital Finance 15,553 15,915 16,979 17,854 66,301 NBC Universal 3,484 3,625 3,756 4,551 15,416 Consumer & Industrial 2,924 3,250 3,163 3,326 12,663
Total segment revenues 37,781 40,595 41,833 47,670 167,879 Corporate items and eliminations 1,343 1,724 679 863 4,609
Consolidated revenues $ 39,124 $ 42,319 $ 42,512 $ 48,533 $ 172,488 Segment profit
Technology Infrastructure $ 1,678 $ 1,861 $ 1,869 $ 2,475 $ 7,883 Energy Infrastructure 815 1,115 1,086 1,801 4,817 Capital Finance 3,152 2,907 3,021 3,163 12,243 NBC Universal 691 904 589 923 3,107 Consumer & Industrial 223 302 255 254 1,034
Total segment profit 6,559 7,089 6,820 8,616 29,084 Corporate items and eliminations (475) (328) (600) (437) (1,840)GE interest and other financial charges (533) (422) (473) (565) (1,993)GE provision for income taxes (640) (731) (636) (787) (2,794)Earnings from continuing operations 4,911 5,608 5,111 6,827 22,457 Earnings (loss) from discontinued
operations, net of taxes (340) (226) 448 (131) (249)Consolidated net earnings $ 4,571 $ 5,382 $ 5,559 $ 6,696 $ 22,208
Technology Infrastructure 2007
(In millions)First
quarter Secondquarter
Thirdquarter
Fourthquarter
Totalyear
Revenues $ 9,498 $ 10,262 $ 10,549 $ 12,492 $ 42,801 Segment profit $ 1,678 $ 1,861 $ 1,869 $ 2,475 $ 7,883 Revenues
Aviation $ 3,451 $ 4,079 $ 4,240 $ 5,049 $ 16,819 Enterprise Solutions 1,024 1,031 1,137 1,270 4,462 Healthcare 3,895 4,045 4,062 4,995 16,997 Transportation 1,128 1,107 1,109 1,179 4,523
Segment profit
Aviation $ 699 $ 828 $ 736 $ 959 $ 3,222 Enterprise Solutions 134 135 193 235 697 Healthcare 637 692 692 1,035 3,056 Transportation 214 217 253 252 936
Source: GENERAL ELECTRIC CO, 8-K, October 08, 2008

(7)
Source: GENERAL ELECTRIC CO, 8-K, October 08, 2008

Energy Infrastructure 2007
(In millions)First
quarter Secondquarter
Thirdquarter
Fourthquarter
Totalyear
Revenues $ 6,322 $ 7,543 $ 7,386 $ 9,447 $ 30,698 Segment profit $ 815 $ 1,115 $ 1,086 $ 1,801 $ 4,817 Revenues
Energy $ 4,809 $ 5,368 $ 5,357 $ 6,922 $ 22,456 Oil & Gas 1,148 1,821 1,699 2,181 6,849
Segment profit
Energy $ 690 $ 902 $ 818 $ 1,425 $ 3,835 Oil & Gas 102 189 237 332 860
Capital Finance 2007
(In millions)First
quarter Secondquarter
Thirdquarter
Fourthquarter
Totalyear
Revenues $ 15,553 $ 15,915 $ 16,979 $ 17,854 $ 66,301 Segment profit $ 3,152 $ 2,907 $ 3,021 $ 3,163 $ 12,243
Quarters ended (In millions)First
quarter Secondquarter
Thirdquarter
Fourthquarter
Total assets $ 502,812 $ 528,826 $ 553,959 $ 583,965
(8)
Source: GENERAL ELECTRIC CO, 8-K, October 08, 2008

2007
(In millions)First
quarter Secondquarter
Thirdquarter
Fourthquarter
Totalyear
Revenues
CLL $ 6,416 $ 6,581 $ 6,862 $ 7,408 $ 27,267 Energy Financial Services 324 417 832 832 2,405 GECAS 1,316 1,149 1,195 1,179 4,839 GE Money 5,882 6,211 6,153 6,523 24,769 Real Estate 1,615 1,557 1,937 1,912 7,021
Segment profit
CLL $ 888 $ 840 $ 905 $ 1,168 $ 3,801 Energy Financial Services 89 157 255 176 677 GECAS 405 281 274 251 1,211 GE Money 1,206 1,153 947 963 4,269 Real Estate 564 476 640 605 2,285
Quarters ended (In millions)First
quarter Secondquarter
Thirdquarter
Fourthquarter
Assets
CLL $ 204,052 $ 214,231 $ 220,391 $ 229,608 Energy Financial Services 15,765 17,340 17,493 18,705 GECAS 45,586 45,936 47,038 47,189 GE Money 178,004 189,262 196,840 209,178 Real Estate 59,405 62,057 72,197 79,285
Consumer & Industrial 2007
(In millions)First
quarter Secondquarter
Thirdquarter
Fourthquarter
Totalyear
Revenues $ 2,924 $ 3,250 $ 3,163 $ 3,326 $ 12,663 Segment profit $ 223 $ 302 $ 255 $ 254 $ 1,034
(9)
Source: GENERAL ELECTRIC CO, 8-K, October 08, 2008

Source: GENERAL ELECTRIC CO, 8-K, October 08, 2008

Exhibit 99(c)
Complete Revised Management’s Discussion and Analysis andConsolidated Financial Statements from the 2007 Form 10-K.Financial Statements in this Exhibit are Now Our Historical
Financial Statements (Pages 1-127)
(1)
Source: GENERAL ELECTRIC CO, 8-K, October 08, 2008
Complete Revised Management’s Discussion and Analysis and Consolidated Financial Statements from the2007 Form 10-K. Financial Statements in this Exhibit are Now Our Historical Financial Statements
(Pages 1-127) Item 7. Management’s Discussion and Analysis of Financial Condition and Results of Operations Operations Our consolidated financial statements combine the industrial manufacturing, services and media businesses of General ElectricCompany (GE) with the financial services businesses of General Electric Capital Services, Inc. (GECS or financial services).
In the accompanying analysis of financial information, we sometimes use information derived from consolidated financialinformation but not presented in our financial statements prepared in accordance with U.S. generally accepted accounting principles(GAAP). Certain of these data are considered “non-GAAP financial measures” under the U.S. Securities and Exchange Commission(SEC) rules. For such measures, we have provided supplemental explanations and reconciliations in the Supplemental Informationsection.
We present Management’s Discussion of Operations in five parts: Overview of Our Earnings from 2005 through 2007,Global Risk Management, Segment Operations, Geographic Operations and Environmental Matters. Unless otherwise indicated, werefer to captions such as revenues and earnings from continuing operations simply as “revenues” and “earnings” throughout thisManagement’s Discussion and Analysis. Similarly, discussion of other matters in our consolidated financial statements relates tocontinuing operations unless otherwise indicated.
As described in our Form 8-K filed July 25, 2008, we reorganized our businesses effective July 25, 2008. We believe that thisnew organizational structure simplifies the company and aligns businesses for growth and efficiency. Our five operating segments as of July 25, 2008, were as follows:
• Technology Infrastructure – the combination of our previous Healthcare segment, the Aviation and Transportation businessesof our previous Infrastructure segment and the Enterprise Solutions business of our previous Industrial Products segment
• Energy Infrastructure – the combination of the Energy (including our motors business which was previously reported in our
Industrial Products segment), Oil & Gas and Water & Process Technologies businesses of our previous Infrastructure segment
• Capital Finance – the combination of our previous Commercial Finance and GE Money segments and the Aviation FinancialServices, Transportation Finance and Energy Financial Services businesses of our previous Infrastructure segment
• NBC Universal − unchanged
• Consumer & Industrial – the Consumer & Industrial business (excluding our motors business) of our previous Industrial
Products segment
(2)
Source: GENERAL ELECTRIC CO, 8-K, October 08, 2008

Certain prior-period amounts in this financial section have been reclassified to reflect this reorganization and the effects of reportingour Japanese mortgage and card businesses as discontinued operations. Overview of Our Earnings from 2005 through 2007 Our results for the last three years reflect our strategy to strengthen our position as a worldwide growth company operating in diverseindustries in which we maintain strong market-leader positions. During these three years, we increased revenues through organicgrowth (averaging 9% per year) and reallocated resources from nonstrategic operations to businesses that provide higher returns. As aresult, over the last three years our revenues grew 27% and earnings, 30%. Orders for products and services also increased. Emergingmarkets continued to provide us opportunities to grow as evidenced by a 42% increase in global revenues during this period. We alsoexperienced a weaker U.S. dollar and rising energy cost during this period.
Our debt continues to receive the highest ratings of the major rating agencies and has allowed us to consistently fund ouroperations in an efficient manner even through this difficult credit environment.
The information that follows will show how our global diversification and risk management strategies have helped us to growrevenues and earnings to record levels. We also believe that the disposition of our less strategic businesses, our restructuring actionsand our investment in businesses with strong growth potential position us well for the future.
Of our five segments, Energy Infrastructure (17% and 15% of consolidated three-year revenues and total segment profit,respectively) was one of the most significantly affected by the recent economic environment, growing revenue 40% and profit 50%over the three-year period. We continued to invest in market-leading technology and services at Energy, Oil & Gas and Water.
Technology Infrastructure (25% and 28% of consolidated three-year revenues and total segment profit, respectively) grewrevenue 26% and earnings 27% over the three-year period as we continued to invest in market-leading technologies and services atAviation and Transportation and strategic acquisitions at Healthcare. Healthcare realized benefits from the acquisitions of IDXSystems Corporation in 2006 and Amersham plc (Amersham) in 2004, expanding the breadth of our product and service offerings tothe healthcare industry. These increases were adversely affected by the effects of the Deficit Reduction Act on U.S. equipment sales.In addition, lower sales of surgical imaging equipment resulted from a regulatory suspension on shipments at one of our facilities. Webegan shipping these products in early 2008. We believe that Healthcare is positioned well for continued strong growth. Productservices and sales of our Evolution Series locomotives continue to be strong. Enterprise Solutions offers protection and productivitysolutions such as safe facilities, plant automation, power control and sensing applications.
(3)
Source: GENERAL ELECTRIC CO, 8-K, October 08, 2008

Capital Finance (37% and 41% of consolidated three-year revenues and total segment profit, respectively) is a large,profitable growth segment in which we continue to invest with confidence. In a competitive environment, this business grew earningsby $1.8 billion and $2.0 billion in 2007 and 2006, respectively, and has delivered strong results through solid core growth, disciplinedrisk management and successful acquisitions. The most significant acquisitions affecting Capital Finance results in 2007 were thecustom fleet business of National Australia Bank Ltd.; Sanyo Electric Credit Co., Ltd.; and Diskont und Kredit AG and Disko LeasingGmbH (DISKO) and ASL Auto Service-Leasing GmbH (ASL), the leasing businesses of KG Allgemeine Leasing GmbH & Co. Theseacquisitions collectively contributed $1.4 billion and $0.2 billion to 2007 revenues and net earnings, respectively. During the first halfof 2007, we faced margin compression as a decline in market risk premiums for new financing opportunities outpaced the decline incost of our investment grade debt. In the second half of 2007, we were able to capitalize on markets in transition, using our size,liquidity and financial flexibility for opportunistic originations, taking advantage of the liquidity conditions with which certaincompetitors contended. We continue to succeed despite the slowing U.S. economy, tightening credit conditions and limited liquidity.In mid-2007, as a result of pressures in the U.S. subprime mortgage industry, we decided to sell our U.S. mortgage business (WMC).This liquidity-challenged environment in which we operate continues to cause issues for some of our U.S. customers, and U.S.delinquencies increased in 2007. In response, we tightened underwriting standards related to the U.S. consumer. We will continue ourprocess of regularly reviewing and adjusting reserve levels in response to when it is probable that losses have been incurred in theportfolio. At December 31, 2007, we owned 1,479 commercial aircraft, of which all but five were on lease, and we held $20.0 billion(list price) of multiple-year orders for various Boeing, Airbus and other aircraft, including 75 aircraft ($5.1 billion list price) scheduledfor delivery in 2008, all under agreement to commence operations with commercial airline customers. Capital Finance is wellpositioned for growth in 2008 and beyond.
NBC Universal (10% and 12% of consolidated three-year revenues and total segment profit, respectively) has developed intoa diversified world-class media company. While the technology and business model for the entertainment media industry continues toevolve, in 2007, we made significant progress in our turnaround efforts and believe that NBC Universal is well positioned to competein this challenging environment.
Consumer & Industrial (8% and 4% of consolidated three-year revenues and total segment profit, respectively) is particularlysensitive to economic conditions. Despite pressure from a weaker housing market, the segment continued to grow through productinnovation and its focus on high-end appliances. During 2007, Consumer & Industrial launched a comprehensive, multi-yearrestructuring plan focused on reducing manufacturing capacity as it moved to a “design, source and sell” model and to make thebusiness more cost competitive by transferring work to lower-cost countries.
Overall, acquisitions contributed $7.7 billion, $3.9 billion and $9.3 billion to consolidated revenues in 2007, 2006 and 2005,respectively. Our consolidated earnings included approximately $0.5 billion in both 2007 and 2006, and $0.9 billion in 2005, fromacquired businesses. We integrate acquisitions as quickly as possible. Only revenues and earnings from the date we complete theacquisition through the end of the fourth following quarter are attributed to such businesses. Dispositions also affected our ongoingresults through lower revenues of $3.6 billion, $1.3 billion and $1.9 billion in 2007, 2006 and 2005, respectively. This resulted inhigher earnings of $0.4 billion in 2007 and $0.1 billion in 2006 and lower earnings of $0.1 billion in 2005.
Significant matters relating to our Statement of Earnings are explained below.
(4)
Source: GENERAL ELECTRIC CO, 8-K, October 08, 2008

DISCONTINUED OPERATIONS. In September 2007, we committed to a plan to sell our Japanese personal loan business (Lake)upon determining that, despite restructuring, Japanese regulatory limits for interest charges on unsecured personal loans did not permitus to earn an acceptable return. During the second quarter of 2008, we committed to sell GE Money Japan, which is comprised ofLake and our Japanese mortgage and card businesses, excluding our minority ownership in GE Nissen Credit Co., Ltd., resulting inthe addition of our Japanese mortgage and card businesses to discontinued operations. Subsequent to the end of the second quarter of2008, we reached an agreement to sell these businesses and completed the sale during the third quarter of 2008. This business waspreviously reported in the Capital Finance segment.
In August 2007, we completed the sale of our Plastics business, which had been reported in our previous Industrial Productssegment. We sold this business because of its cyclicality, rising costs of natural gas and raw materials, and the decision to redeploycapital resources into higher-growth businesses. During 2006, we sold our Advanced Materials business, which also had been reportedin our previous Industrial Products segment.
In December 2007, we completed the exit of WMC as a result of continued pressures in the U.S. subprime mortgage industry.
In 2006, we substantially completed our planned exit of the insurance businesses through the sale of the property and casualtyinsurance and reinsurance businesses and the European life and health operations of GE Insurance Solutions Corporation (GEInsurance Solutions) and the sale of GE Life, our U.K.-based life insurance operation, to Swiss Reinsurance Company (Swiss Re), andthe sale, through a secondary public offering, of our remaining 18% investment in Genworth Financial, Inc. (Genworth), our formerlywholly-owned subsidiary that conducted most of our consumer insurance business, including life and mortgage insurance operations.
We reported the businesses described above as discontinued operations for all periods presented. WE DECLARED $11.7 BILLION IN DIVIDENDS IN 2007. Per-share dividends of $1.15 were up 12% from 2006, following a13% increase from the preceding year. In December 2007, our Board of Directors raised our quarterly dividend 11% to $0.31 pershare. We have rewarded our shareowners with over 100 consecutive years of dividends, with 32 consecutive years of dividendgrowth.
Except as otherwise noted, the analysis in the remainder of this section presents the results of GE (with GECS included on aone-line basis) and GECS. See the Segment Operations section for a more detailed discussion of the businesses within GE and GECS. GE SALES OF PRODUCT SERVICES were $32.2 billion in 2007, a 9% increase over 2006. Increases in product services in 2007and 2006 were widespread, led by growth at Energy Infrastructure and Technology Infrastructure. Operating profit from productservices was $9.1 billion in 2007, up 9% from 2006, reflecting ongoing improvements at Energy Infrastructure. POSTRETIREMENT BENEFIT PLANS costs were $2.6 billion, $2.3 billion and $1.7 billion in 2007, 2006 and 2005, respectively.The cost increased in 2007 primarily because of plan benefit changes resulting from new U.S. labor agreements and increases inretiree medical and drug costs, partially offset by increases in discount rates for the year (principal pension plans’ discount rateincreased from 5.50% to 5.75%) and effects of recent investment gains. The cost increased in 2006 and 2005 primarily because of theeffects of prior years’ investment losses and lower discount rates.
(5)
Source: GENERAL ELECTRIC CO, 8-K, October 08, 2008

Considering the current and expected asset allocations, as well as historical and expected returns on various categories ofassets in which our plans are invested, we have assumed that long-term returns on our principal pension plan assets would be 8.5% forcost recognition in 2008, the same level as we assumed in 2005, 2006 and 2007. GAAP provides recognition of differences betweenassumed and actual returns over a period no longer than the average future service of employees.
We expect the costs of our postretirement benefit plans in 2008 to be about the same as the 2007 costs. The effects ofincreasing discount rates (principal pension plans’ discount rate increasing from 5.75% to 6.34%) and recent investment gains will beoffset by additional costs of plan benefits resulting from union negotiations and a pensioner increase for eligible retirees and survivingspouses.
Our principal pension plans had a surplus of $16.8 billion at December 31, 2007. We will not make any contributions to theGE Pension Plan in 2008. At December 31, 2007, the fair value of assets for our other pension plans was $1.6 billion less than therespective projected benefit obligations. We expect to contribute $0.5 billion to these plans in 2008, compared with actualcontributions of $0.7 billion and $0.5 billion in 2007 and 2006, respectively. Our principal retiree health and life plans obligationsexceeded the fair value of related assets by $11.2 billion at December 31, 2007. We fund our retiree health benefits on apay-as-you-go basis. We expect to contribute $0.7 billion to these plans in 2008 compared with actual contributions of $0.6 billion in2007 and 2006.
The funded status of our postretirement benefits plans and future effects on operating results depend on economic conditionsand investment performance. See note 6 for additional information about funded status, components of earnings effects and actuarialassumptions. GE OTHER COSTS AND EXPENSES are selling, general and administrative expenses. These costs were 14.2%, 14.3% and 15.1%of total GE sales in 2007, 2006 and 2005, respectively. INTEREST ON BORROWINGS AND OTHER FINANCIAL CHARGES amounted to $23.8 billion, $18.9 billion and $14.8billion in 2007, 2006 and 2005, respectively. Substantially all of our borrowings are in financial services, where interest expense was$22.7 billion, $17.8 billion and $14.0 billion in 2007, 2006 and 2005, respectively. Changes over the three-year period reflectedincreased average borrowings and increased interest rates attributable to rising credit spreads in line with general market conditions.GECS average borrowings were $456.4 billion, $389.0 billion and $346.1 billion in 2007, 2006 and 2005, respectively. GECS averagecomposite effective interest rate was 5.0% in 2007, 4.6% in 2006 and 4.1% in 2005. Proceeds of these borrowings were used in part tofinance asset growth and acquisitions. In 2007, GECS average assets of $589.4 billion were 17% higher than in 2006, which in turnwere 9% higher than in 2005. See the Financial Resources and Liquidity section for a discussion of interest rate risk management. INCOME TAXES are a significant cost. As a global commercial enterprise, our tax rates are affected by many factors, including ourglobal mix of earnings, legislation, acquisitions, dispositions and tax characteristics of our income. Our tax returns are routinelyaudited and settlements of issues raised in these audits sometimes affect our tax provisions.
(6)
Source: GENERAL ELECTRIC CO, 8-K, October 08, 2008

Income taxes on consolidated earnings from continuing operations before accounting changes were 15.6% in 2007 comparedwith 16.9% in 2006 and 18.1% in 2005. Our consolidated income tax rate decreased from 2006 to 2007 as the tax benefit on thedisposition of our investment in SES and an increase in favorable settlements with tax authorities more than offset a decrease in thebenefit from lower-taxed earnings from global operations, which in 2006 included one-time tax benefits from planning to usenon-U.S. tax net operating losses.
Our consolidated income tax rate decreased from 2005 to 2006 as growth in lower-taxed earnings from global operations,including one-time tax benefits from planning to use non-U.S. tax net operating losses, exceeded 2005 tax benefits from areorganization of our aircraft leasing business, a repatriation of non-U.S. earnings at a reduced rate of U.S. tax, and favorablesettlements with tax authorities.
A more detailed analysis of differences between the U.S. federal statutory rate and the consolidated rate, as well as otherinformation about our income tax provisions, is provided in note 7. The nature of business activities and associated income taxes differfor GE and for GECS and a separate analysis of each is presented in the paragraphs that follow.
Because GE tax expense does not include taxes on GECS earnings, the GE effective tax rate is best analyzed in relation toGE earnings excluding GECS. GE pre-tax earnings from continuing operations, excluding GECS earnings from continuing operations,were $12.8 billion, $11.7 billion and $11.0 billion for 2007, 2006 and 2005, respectively. On this basis, GE’s effective tax rate was21.8% in 2007, 21.9% in 2006 and 24.3% in 2005.
Resolution of audit matters reduced the GE effective tax rate throughout this period. The effects of such resolutions areincluded in the following captions in note 7:
Audit resolutions−
effect on GE ex. GECS tax rate 2007 2006 2005 Tax on global activities including exports (2.7)% (0.8)% (0.4)%All other − net (2.4) (0.8) (1.7) (5.1)% (1.6)% (2.1)%
The GE effective tax rate declined slightly from 2006 to 2007 because the 3.5 percentage point higher 2007 benefit from favorableaudit resolutions was largely offset by a 3.3 percentage point decrease in the benefit in lower-taxed earnings from global operations,excluding audit resolutions and the effect of tax law changes. The 2006 benefit from global operations included one-time tax benefitsfrom planning to use non--U.S. net operating losses against profitable operations.
The GE rate decreased from 2005 to 2006 primarily from growth in lower-taxed earnings from global operations, includingone-time tax benefits from planning to use non-U.S. net operating losses against profitable operations. These benefits, whichdecreased the 2006 GE rate by 3.7 percentage points compared with 2005, are included in note 7 in the line, “Tax on global activitiesincluding exports.” Partially offsetting these items was a 0.5 percentage point decrease in the benefit from favorable audit resolutionsand the lack of a counterpart to the 2005 repatriation of non--U.S. earnings at a reduced U.S. tax rate, discussed below, which reducedthe 2005 rate by 1.0 percentage point.
(7)
Source: GENERAL ELECTRIC CO, 8-K, October 08, 2008

The 2005 GE rate reflects audit resolutions and our 2005 repatriation of non-U.S. earnings at the reduced U.S. tax rateprovided in 2004 legislation.
The GECS effective tax rate was 9.9% in 2007, compared with 12.0% in 2006 and 11.4% in 2005. The GECS income taxrate decreased from 2006 to 2007 as the tax benefit on the disposition of our investment in SES and growth in lower-taxed globalearnings, which decreased the GECS effective tax rate 4.0 and 1.0 percentage points, respectively, were partially offset by higher nettax expense related to U.S. and non-U.S. audit activity and from the absence of the 2006 benefit of the reorganization, discussedbelow, of our aircraft leasing business which increased the rate 1.6 and 1.1 percentage points, respectively.
The GECS rate increased from 2005 to 2006 as increased benefits from growth in lower-taxed earnings from globaloperations was more than offset by a smaller benefit on the reorganization of our aircraft leasing business. The increased benefits fromlower-taxed earnings from global operations (1.3 percentage points) and the lower benefits on the reorganization of our aircraft leasingbusiness (2.1 percentage points) are included in the line, “Tax on global activities including exports” in note 7.
As a result of the repeal of the extraterritorial income (ETI) taxing regime as part of the American Jobs Creation Act of 2004(the Act), our aircraft leasing business no longer qualifies for a reduced U.S. tax rate. However, the Act also extended to aircraftleasing the U.S. tax deferral benefits that were already available to other GE non-U.S. active operations. These legislative changes,coupled with a reorganization of our aircraft leasing business and a favorable Irish ruling, decreased the GECS effective tax rate 1.1percentage points in 2006, compared with 3.2 percentage points in 2005. Global Risk Management A disciplined approach to risk is important in a diversified organization such as ours in order to ensure that we are executing accordingto our strategic objectives and that we only accept risk for which we are adequately compensated. It is necessary for us to manage riskat the individual transaction level, and to consider aggregate risk at the customer, industry, geographic and collateral-type levels,where appropriate.
The GE Board of Directors oversees the risk management process through clearly established delegation of authority. Boardand committee meeting agendas are jointly developed with management to cover risk topics presented to our Corporate RiskCommittee, including environmental, compliance, liquidity, credit and market risks.
The GECS Board of Directors oversees the risk management process for financial services, and approves all significantacquisitions and dispositions as well as borrowings and investments. All participants in the risk management process must complywith approval limits established by the Board.
The GECS Chief Risk Officer is responsible, with the Corporate Risk Function, for establishing standards for themeasurement, reporting and limiting of risk; for managing and evaluating risk managers; for approving risk management policies; andfor reviewing major risk exposures and concentrations across the organization. The GECS Corporate Risk Function analyzes certainbusiness risks and assesses them in relation to aggregate risk appetite and approval limits set by the GECS Board of Directors.
(8)
Source: GENERAL ELECTRIC CO, 8-K, October 08, 2008

Threshold responsibility for identifying, quantifying and mitigating risks is assigned to our individual businesses. We employproprietary analytic models to allocate capital to our financing activities, to identify the primary sources of risk and to measure theamount of risk we will take for each product line. This approach allows us to develop early signals that monitor changes in riskaffecting portfolio performance and actively manage the portfolio. Other corporate functions such as Financial Planning and Analysis,Treasury, Legal and our Corporate Audit Staff support business-level risk management. Businesses that, for example, hedge financialrisk with derivative financial instruments must do so using our centrally managed Treasury function, providing assurance that thebusiness strategy complies with our corporate policies and achieves economies of scale. We review risks periodically withbusiness-level risk managers, senior management and our Board of Directors.
GECS employs about 19,000 dedicated risk professionals, including 11,500 involved in collection activities and 500specialized asset managers who evaluate leased asset residuals and remarket off-lease equipment.
GE and GECS manage a variety of risks including liquidity, credit and market risks.
• Liquidity risk is the risk of being unable to accommodate liability maturities, fund asset growth and meet contractualobligations through access to funding at reasonable market rates. Additional information about our liquidity and how wemanage this risk can be found in the Financial Resources and Liquidity section and in notes 17 and 26.
• Credit risk is the risk of financial loss arising from a customer or counterparty failure to meet its contractual obligations. We
face credit risk in our investing, lending and leasing activities (see the Financial Resources and Liquidity and CriticalAccounting Estimates sections and notes 1, 9, 12, 13 and 28) and derivative financial instruments activities (see note 26).
• Market risk is the potential loss in value of investment and other asset and liability portfolios, including financial instruments
and residual values of leased assets. This risk is caused by changes in market variables, such as interest and currency exchangerates and equity and commodity prices. We are exposed to market risk in the normal course of our business operations as aresult of our ongoing investing and funding activities. Additional information can be found in the Financial Resources andLiquidity section and in notes 9, 12, 14 and 26.
Other risks include natural disasters, availability of necessary materials, guarantees of product performance and business interruption.These types of risks are often insurable, and success in managing these risks is ultimately determined by the balance between the levelof risk retained or assumed and the cost of transferring risk to others. Segment Operations Operating segments comprise our five businesses focused on the broad markets they serve: Technology Infrastructure, EnergyInfrastructure, Capital Finance, NBC Universal and Consumer & Industrial. In addition to providing information on segments in theirentirety, we have also provided supplemental information for certain businesses within the segments for greater clarity.
(9)
Source: GENERAL ELECTRIC CO, 8-K, October 08, 2008

Segment profit is determined based on internal performance measures used by the Chief Executive Officer to assess the
performance of each business in a given period. In connection with that assessment, the Chief Executive Officer may exclude matterssuch as charges for restructuring; rationalization and other similar expenses; in-process research and development and certain otheracquisition-related charges and balances; technology and product development costs; certain gains and losses from dispositions; andlitigation settlements or other charges, responsibility for which preceded the current management team.
(10)
Source: GENERAL ELECTRIC CO, 8-K, October 08, 2008

Summary of Operating Segments General Electric Company and consolidated affiliates (In millions) 2007 2006 2005 2004 2003 REVENUES
Technology Infrastructure $ 42,801 $ 37,687 $ 33,873 $ 30,142 $ 24,738 Energy Infrastructure 30,698 25,221 21,921 19,841 21,354 Capital Finance 66,301 56,378 49,071 43,750 34,915 NBC Universal 15,416 16,188 14,689 12,886 6,871 Consumer & Industrial 12,663 13,202 13,040 12,408 11,544
Total segment revenues 167,879 148,676 132,594 119,027 99,422 Corporate items and eliminations 4,609 2,892 3,668 4,787 4,915 CONSOLIDATED REVENUES $ 172,488 $ 151,568 $ 136,262 $ 123,814 $ 104,337
SEGMENT PROFIT Technology Infrastructure $ 7,883 $ 7,308 $ 6,188 $ 5,412 $ 4,248 Energy Infrastructure 4,817 3,518 3,222 3,100 4,317 Capital Finance 12,243 10,397 8,414 6,593 5,325 NBC Universal 3,107 2,919 3,092 2,558 1,998 Consumer & Industrial 1,034 970 732 601 498
Total segment profit 29,084 25,112 21,648 18,264 16,386 Corporate items and eliminations (1,840) (1,548) (372) 165 353 GE interest and other financial charges (1,993) (1,668) (1,319) (901) (811)GE provision for income taxes (2,794) (2,552) (2,678) (1,937) (2,756)Earnings from continuing operations before
accounting changes 22,457 19,344 17,279 15,591 13,172 Earnings (loss) from discontinued operations,
net of taxes (249) 1,398 (559) 1,631 2,933 Earnings before accounting changes 22,208 20,742 16,720 17,222 16,105 Cumulative effect of accounting changes − − − − (587)CONSOLIDATED NET EARNINGS $ 22,208 $ 20,742 $ 16,720 $ 17,222 $ 15,518
See accompanying notes to consolidated financial statements.
(11)
Source: GENERAL ELECTRIC CO, 8-K, October 08, 2008

Segment profit always excludes the effects of principal pension plans, results reported as discontinued operations and accountingchanges. Segment profit excludes or includes interest and other financial charges and income taxes according to how a particularsegment’s management is measured − excluded in determining segment profit, which we sometimes refer to as “operating profit,” forTechnology Infrastructure, Energy Infrastructure, NBC Universal and Consumer & Industrial; included in determining segment profit,which we sometimes refer to as “net earnings,” for Capital Finance.
In addition to providing information on segments in their entirety, we have also provided supplemental information forcertain businesses within the segments.
We have reclassified certain prior-period amounts to conform to the current period’s presentation. For additional informationabout our segments, see note 25. TECHNOLOGY INFRASTRUCTURE (In millions) 2007 2006 2005 REVENUES $ 42,801 $ 37,687 $ 33,873
SEGMENT PROFIT $ 7,883 $ 7,308 $ 6,188
(In millions) 2007 2006 2005 REVENUES
Aviation $ 16,819 $ 13,017 $ 11,826 Enterprise Solutions 4,462 3,951 3,454 Healthcare 16,997 16,560 15,016 Transportation 4,523 4,159 3,577
SEGMENT PROFIT Aviation $ 3,222 $ 2,802 $ 2,525 Enterprise Solutions 697 620 544 Healthcare 3,056 3,142 2,601 Transportation 936 774 524
Technology Infrastructure revenues rose 14%, or $5.1 billion, in 2007 on higher volume ($4.6 billion) and the effects of the weakerU.S. dollar ($0.6 billion), partially offset by lower prices ($0.1 billion). The increase in volume reflected the effects of acquisitions andincreased sales of commercial engines and services at Aviation; increased sales in the international diagnostic imaging, clinicalsystems and life sciences businesses of Healthcare; primarily the effects of acquisitions at Enterprise Solutions; and increased sales ofequipment and services at Transportation. The effects of the weaker U.S. dollar were primarily at Healthcare and Enterprise Solutions.
Segment profit rose 8% to $7.9 billion in 2007, compared with $7.3 billion in 2006, as higher volume ($0.8 billion),productivity ($0.4 billion) and higher sales of minority interests in engine programs ($0.1 billion) more than offset the effects ofhigher material and other costs ($0.7 billion) and lower prices ($0.1 billion). The increase in volume primarily related to Aviation,Healthcare and Enterprise Solutions. The effects of productivity were primarily at Healthcare and Transportation. The increase inmaterial costs was primarily at Aviation, partially offset by a decrease at Healthcare, and labor and other costs increased across allbusinesses of the segment.
(12)
Source: GENERAL ELECTRIC CO, 8-K, October 08, 2008

Technology Infrastructure revenues rose 11%, or $3.8 billion, in 2006 as higher volume ($4.3 billion) was partially offset bylower prices ($0.4 billion). The increase in volume reflected increased healthcare services, including the 2006 acquisition of IDXSystems Corporation, and stronger equipment sales at Healthcare; increased sales of commercial and military services and commercialengines at Aviation; primarily the effects of acquisitions at Enterprise Solutions; and increased sales of locomotives at Transportation.The decrease in price was primarily at Healthcare and Enterprise Solutions, partially offset by an increase at Transportation.
Segment profit rose 18% to $7.3 billion in 2006, compared with $6.2 billion in 2005, as productivity ($1.1 billion), andhigher volume ($0.8 billion) more than offset lower prices ($0.4 billion) and the effects of higher labor and other costs ($0.4 billion).The effects of productivity and volume increases were across all businesses of the segment. The effects of higher labor and other costswere primarily at Aviation and Healthcare.
Technology Infrastructure orders were $48.7 billion in 2007, up from $43.5 billion in 2006. The $35.5 billion total backlog atyear-end 2007 comprised unfilled product orders of $27.5 billion (of which 50% was scheduled for delivery in 2008) and productservices orders of $8.0 billion scheduled for 2008 delivery. Comparable December 31, 2006, total backlog was $25.6 billion, of which$18.4 billion was for unfilled product orders and $7.2 billion, for product services orders. See Corporate Items and Eliminations for adiscussion of items not allocated to this segment. ENERGY INFRASTRUCTURE (In millions) 2007 2006 2005 REVENUES $ 30,698 $ 25,221 $ 21,921
SEGMENT PROFIT $ 4,817 $ 3,518 $ 3,222
(In millions) 2007 2006 2005 REVENUES
Energy $ 22,456 $ 19,406 $ 17,108 Oil & Gas 6,849 4,340 3,598
SEGMENT PROFIT Energy $ 3,835 $ 2,918 $ 2,693 Oil & Gas 860 548 411
Energy Infrastructure revenues rose 22%, or $5.5 billion, in 2007 on higher volume ($4.0 billion), higher prices ($0.8 billion) and theeffects of the weaker U.S. dollar ($0.7 billion). The increase in volume reflected increased sales of thermal and wind equipment atEnergy, and the effects of acquisitions and increased sales of equipment and services at Oil & Gas. The increase in price was primarilyat Energy, while the effects of the weaker U.S. dollar were primarily at Oil & Gas and Energy.
Segment profit rose 37% to $4.8 billion in 2007, compared with $3.5 billion in 2006, as higher prices ($0.8 billion), highervolume ($0.7 billion) and productivity ($0.1 billion) more than offset the effects of higher material and other costs ($0.4 billion). Theincrease in volume primarily related to Energy and Oil & Gas.
(13)
Source: GENERAL ELECTRIC CO, 8-K, October 08, 2008

Energy Infrastructure revenues rose 15%, or $3.3 billion, in 2006 on higher volume ($3.0 billion), higher prices ($0.2 billion)and the effects of late 2006 weakening of the U.S. dollar ($0.2 billion). The increase in volume reflected increased sales of powergeneration equipment at Energy and equipment at Oil & Gas. The increase in price was primarily at Energy.
Segment profit rose 9% to $3.5 billion in 2006, compared with $3.2 billion in 2005, as higher volume ($0.2 billion) andhigher prices ($0.2 billion) were partially offset by higher labor and other costs ($0.1 billion). The increase in volume primarily relatedto Energy and Oil & Gas. Higher labor and other costs were primarily at Energy.
Energy Infrastructure orders were $36.9 billion in 2007, up from $28.2 billion in 2006. The $29.3 billion total backlog atyear-end 2007 comprised unfilled product orders of $21.0 billion (of which 75% was scheduled for delivery in 2008) and productservices orders of $8.3 billion scheduled for 2008 delivery. Comparable December 31, 2006, total backlog was $20.0 billion, of which$13.0 billion was for unfilled product orders and $7.0 billion, for product services orders. See Corporate Items and Eliminations for adiscussion of items not allocated to this segment. CAPITAL FINANCE (In millions) 2007 2006 2005 REVENUES $ 66,301 $ 56,378 $ 49,071
SEGMENT PROFIT $ 12,243 $ 10,397 $ 8,414
December 31 (In millions) 2007 2006 TOTAL ASSETS $ 583,965 $ 491,000
(In millions) 2007 2006 2005 REVENUES
Commercial Lending and Leasing (CLL) $ 27,267 $ 25,833 $ 23,781 Energy Financial Services 2,405 1,664 1,349 GECAS 4,839 4,353 3,695 GE Money 24,769 19,508 16,754 Real Estate 7,021 5,020 3,492
SEGMENT PROFIT CLL 3,801 3,503 3,252 Energy Financial Services 677 648 599 GECAS 1,211 1,174 829 GE Money 4,269 3,231 2,452 Real Estate 2,285 1,841 1,282
(14)
Source: GENERAL ELECTRIC CO, 8-K, October 08, 2008

December 31 (In millions) 2007 2006 TOTAL ASSETS
CLL $ 229,608 $ 197,596 Energy Financial Services 18,705 15,252 GECAS 47,189 46,925 GE Money 209,178 177,441 Real Estate 79,285 53,786
Capital Finance 2007 revenues and net earnings both increased 18%, compared with 2006. Revenues in 2007 included $3.5 billionfrom acquisitions and were reduced by $2.7 billion as a result of dispositions. Revenues in 2007 also increased $9.1 billion as a resultof organic revenue growth ($6.8 billion) and the weaker U.S. dollar ($2.3 billion). The increase in net earnings resulted primarily fromcore growth ($1.0 billion), higher securitization income ($0.4 billion) and the weaker U.S. dollar ($0.3 billion). Core growth included$0.5 billion representing the total year’s tax benefit on the disposition of our investment in SES, growth in lower-taxed earnings fromglobal operations ($0.4 billion) and the sale of part of our Garanti investment ($0.2 billion), partially offset by declines in fair value ofretained interests in securitizations ($0.2 billion).
Capital Finance 2006 revenues and net earnings increased 15% and 24%, respectively, compared with 2005. Revenues in2006 included $2.2 billion from acquisitions and were reduced by $0.1 billion as a result of dispositions. Revenues in 2006 alsoincreased $5.4 billion as a result of organic revenue growth ($5.6 billion), partially offset by the stronger U.S. dollar ($0.2 billion).The increase in net earnings resulted primarily from core growth ($1.6 billion), including growth in lower-taxed earnings from globaloperations, acquisitions ($0.3 billion) and higher securitizations ($0.1 billion). See Corporate Items and Eliminations for a discussionof items not allocated to this segment.
CLL 2007 revenues and net earnings increased 6% and 9%, respectively, compared with 2006. Revenues in 2007 and 2006included $2.1 billion and $0.1 billion from acquisitions, respectively, and in 2007 were reduced by $2.7 billion as a result ofdispositions. Revenues in 2007 also increased $1.9 billion as a result of organic revenues growth $1.2 billion and the weaker U.S.dollar ($0.7 billion). The increase in net earnings resulted from acquisitions ($0.2 billion), core growth ($0.1 billion) and the weakerU.S. dollar ($0.1 billion), partially offset by dispositions ($0.1 billion). Core growth included $0.5 billion representing the total year’stax benefit on the disposition of our investment in SES, partially offset by $0.2 billion of higher credit losses and $0.1 billion incharges related to mark-to-market adjustments to loans held-for-sale. Investment income included higher SES gains ($0.1 billion)offset by impairments of securitization retained interests ($0.1 billion).
CLL 2006 revenues and net earnings increased 9% and 8%, respectively, compared with 2005. Revenues in 2006 and 2005included $1.0 billion and $0.1 billion from acquisitions, respectively, and in 2006 were reduced by $0.1 billion as a result ofdispositions. Revenues in 2006 also increased as a result of organic revenue growth ($1.2 billion) and the second quarter 2006consolidation of GE SeaCo, an entity previously accounted for using the equity method ($0.2 billion). The increase in net earningsresulted from core growth ($0.2 billion), including growth in lower-taxed earnings from global operations, and acquisitions ($0.1billion).
(15)
Source: GENERAL ELECTRIC CO, 8-K, October 08, 2008

Energy Financial Services 2007 revenues and net earnings increased 45% and 4%, respectively, compared with 2006. Theincrease in revenues resulted primarily from acquisitions ($0.6 billion) and organic revenue growth ($0.1 billion). The increase in netearnings resulted primarily from core growth.
Energy Financial Services 2006 revenues and net earnings increased 23% and 8%, respectively, compared with 2005. Theincrease resulted primarily from organic revenue growth ($0.3 billion). The increase in net earnings resulted primarily from coregrowth.
GECAS 2007 revenues and net earnings increased 11% and 3%, respectively, compared with 2006. The increase in revenuesresulted primarily from organic revenue growth ($0.4 billion) and acquisitions ($0.1 billion). The increase in net earnings resultedprimarily from core growth.
GECAS 2006 revenues and net earnings increased 18% and 42%, respectively, compared with 2005. The increase isprimarily as a result of organic revenue growth ($0.6 billion). The increase in net earnings resulted primarily from core growth ($0.3billion), including growth in lower-taxed earnings from global operations that were more than offset by lower one-time benefits fromour aircraft leasing business reorganization.
GE Money 2007 revenues and net earnings increased 27% and 32%, respectively, compared with 2006. Revenues in 2007included $0.4 billion from acquisitions. Revenues in 2007 also increased $4.8 billion as a result of organic revenue growth ($3.5billion) and the weaker U.S. dollar ($1.4 billion). The increase in net earnings resulted primarily from core growth ($0.4 billion),higher securitization income ($0.4 billion) and the weaker U.S. dollar ($0.2 billion). Core growth included growth in lower-taxedearnings from global operations ($0.4 billion) and the sale of part of our Garanti investment ($0.2 billion), partially offset by declinesin fair value of retained interests in securitizations ($0.1 billion) and lower results in the U.S. reflecting the effects of higherdelinquencies.
GE Money 2006 revenues and net earnings increased 16% and 32%, respectively, compared with 2005. Revenues in 2006included $0.9 billion from acquisitions. Revenues in 2006 also increased $1.8 billion as a result of organic revenue growth. Theincrease in net earnings resulted primarily from core growth ($0.5 billion), including growth in lower-taxed earnings from globaloperations, acquisitions ($0.2 billion) and higher securitizations ($0.1 billion).
Real Estate 2007 revenues and net earnings increased 40% and 24%, respectively, compared with 2006. Revenues in 2007included $0.3 billion from acquisitions. Revenues in 2007 also increased $1.8 billion as a result of organic revenue growth ($1.5billion) and the weaker U.S. dollar ($0.2 billion). Real Estate net earnings increased 24% compared with 2006, primarily as a result ofa $0.5 billion increase in net earnings from sales of real estate investments.
Real Estate assets at December 31, 2007, increased $25.5 billion, or 47%, from December 31, 2006, of which $12.6 billionwas real estate investments, also up 47%. During 2007, we sold real estate assets with a book value totaling $7.0 billion, whichresulted in net earnings of $2.1 billion.
Real Estate 2006 revenues and net earnings both increased 44%, compared with 2005. Revenues in 2006 included $0.3billion from acquisitions. Revenues in 2006 also increased $1.3 billion as a result of organic revenue growth. Real Estate net earningsincreased 44% compared with 2005, primarily as a result of a $0.6 billion increase in net earnings from real estate investments.
(16)
Source: GENERAL ELECTRIC CO, 8-K, October 08, 2008

Real Estate assets at December 31, 2006, increased $18.5 billion, or 52%, from December 31, 2005, of which $12.4 billionwas real estate investments, up 76%. During 2006, we sold real estate assets with a book value totaling $4.2 billion, which resulted innet earnings of $1.4 billion. NBC UNIVERSAL revenues declined 5%, or $0.8 billion, in 2007, primarily from the lack of current-year counterparts to the 2006Olympic Games broadcasts ($0.7 billion) and 2006 sale of television stations ($0.2 billion), lower revenues in our broadcast networkand television stations as a result of lower advertising sales ($0.5 billion) and lower motion picture revenues ($0.1 billion), partiallyoffset by higher revenues for cable ($0.4 billion) and television production and distribution ($0.3 billion). Segment profit rose 6%, or$0.2 billion, in 2007 as improvements in cable ($0.2 billion), television production and distribution ($0.2 billion), motion pictures($0.1 billion) and the absence of Olympic broadcasts in 2007 ($0.1 billion) were partially offset by the lack of a current-yearcounterpart to the 2006 sale of four television stations ($0.2 billion) and lower earnings from our broadcast network and televisionstations ($0.2 billion).
Revenues rose 10%, or $1.5 billion, in 2006, primarily from the 2006 Olympic Games broadcasts ($0.7 billion),improvements in cable ($0.6 billion) and motion pictures ($0.2 billion), and the effects of exiting a film distribution agreement ($0.2billion), partially offset by the effects of lower broadcast network and television stations ratings and advertising sales ($0.1 billion)and the net effects of certain strategic actions in both years ($0.1 billion). Segment profit declined 6%, or $0.2 billion, in 2006 aslower earnings from broadcast network and television station operations ($0.4 billion), the 2006 Olympic Games broadcasts ($0.1billion), and the net effects of certain strategic actions in both years ($0.1 billion) were partially offset by higher earnings from cable($0.2 billion) and the effects of exiting a film distribution agreement ($0.1 billion). See Corporate Items and Eliminations for adiscussion of items not allocated to this segment. CONSUMER & INDUSTRIAL (In millions) 2007 2006 2005 REVENUES $ 12,663 $ 13,202 $ 13,040
SEGMENT PROFIT $ 1,034 $ 970 $ 732
Consumer & Industrial revenues decreased 4%, or $0.5 billion, in 2007 compared with 2006 as lower volume ($0.8 billion) waspartially offset by the effects of the weaker U.S. dollar ($0.2 billion) and higher prices ($0.1 billion). The decrease in volume reflectsthe sale of GE Supply in the third quarter of 2006. Segment profit rose 7%, or $0.1 billion, as productivity ($0.3 billion) and higherprices ($0.1 billion) were partially offset by higher material and other costs ($0.4 billion).
Consumer & Industrial revenues rose 1%, or $0.2 billion, in 2006 as higher prices ($0.2 billion) were partially offset by lowervolume. The decrease in volume reflects the sale of GE Supply in the third quarter of 2006, partially offset by volume increases at theother businesses within the segment. Segment profit rose 33% as productivity ($0.4 billion) and higher prices ($0.2 billion) werepartially offset by higher labor and other costs ($0.3 billion). See Corporate Items and Eliminations for a discussion of items notallocated to this segment.
(17)
Source: GENERAL ELECTRIC CO, 8-K, October 08, 2008

CORPORATE ITEMS AND ELIMINATIONS (In millions) 2007 2006 2005 REVENUES
Insurance activities $ 3,962 $ 3,692 $ 4,183 Eliminations and other 647 (800) (515)
Total $ 4,609 $ 2,892 $ 3,668
OPERATING PROFIT (COST) Insurance activities $ 145 $ 57 $ 159 Principal pension plans (755) (877) (329)Underabsorbed corporate overhead (437) (266) (426)Other (793) (462) 224
Total $ (1,840) $ (1,548) $ (372)
Corporate Items and Eliminations include the effects of eliminating transactions between operating segments; results of our insuranceactivities remaining in continuing operations; cost of, and cost reductions from, our principal pension plans; underabsorbed corporateoverhead; certain non-allocated amounts described below; and a variety of sundry items. Corporate Items and Eliminations is not anoperating segment. Rather, it is added to operating segment totals to reconcile to consolidated totals on the financial statements.
Certain amounts included in the line “Other” above are not allocated to segment results for internal measurement purposes. In2007, amounts primarily related to restructuring, rationalization and other charges were $0.5 billion at Technology Infrastructure, $0.4billion at each of Consumer & Industrial (including $0.1 billion of product quality issues) and Capital Finance, $0.3 billion at NBCUniversal, and $0.2 billion at Energy Infrastructure. Amounts in 2007 also included technology and product development costs of $0.1billion at NBC Universal. GECS amounts are on an after-tax basis. In 2006, amounts related principally to technology and productdevelopment and restructuring costs of $0.2 billion at NBC Universal, restructuring and other charges of $0.1 billion at Consumer &Industrial and principally for acquisition-related restructuring and other charges of $0.1 billion at Technology Infrastructure.
Other operating profit (cost) also reflects a $0.9 billion gain on sale of a business interest to Hitachi by the Energy businessand a $0.3 billion (after-tax basis) gain on sale of Swiss Re common stock. Other operating profit (cost) also reflects gains from salesof business interests of $0.4 billion in 2006, principally GE Supply, and $0.1 billion from the partial sale of an interest in Genpact in2005. DISCONTINUED OPERATIONS (In millions) 2007 2006 2005 Earnings (loss) from discontinued
operations, net of taxes $ (249) $ 1,398 $ (559)
Discontinued operations comprised GE Money Japan; WMC; Plastics; Advanced Materials; the property and casualty insurance andreinsurance businesses and the European life and health operations of GE Insurance Solutions and most of its affiliates; GE Life, ourU.K.-based life insurance operation; and Genworth, our formerly wholly-owned subsidiary that conducted most of our consumerinsurance business, including life and mortgage insurance operations. Results of these businesses are reported as discontinuedoperations for all periods presented.
Source: GENERAL ELECTRIC CO, 8-K, October 08, 2008

(18)
Source: GENERAL ELECTRIC CO, 8-K, October 08, 2008

In December 2007, we completed the sale of our WMC business for $0.1 billion in cash, recognizing an after-tax loss of $0.1billion. In connection with the transaction, certain contractual obligations and potential liabilities related to previously sold loans wereretained.
In September 2007, we committed to a plan to sell our Lake business and recorded an after-tax loss of $0.9 billion, whichrepresents the difference between the net book value of our Lake business and the projected sale price. During the second quarter of2008, we committed to sell GE Money Japan, resulting in the addition of our Japanese mortgage and card businesses to discontinuedoperations. Subsequent to the end of second quarter of 2008, we reached an agreement to sell these businesses and completed the saleduring the third quarter of 2008. In connection with this agreement, and primarily related to our Japanese mortgage and cardbusinesses, we recorded an incremental $0.2 billion impairment loss in the second quarter of 2008.
In August 2007, we completed the sale of our Plastics business to Saudi Basic Industries Corporation for $11.6 billion incash. As a result, we recognized an after-tax gain of $1.6 billion.
Loss from discontinued operations, net of taxes, in 2007 was $0.2 billion, reflecting a loss from operations at WMC ($0.9billion), an estimated after-tax loss on the planned sale of Lake ($0.9 billion), a loss from operations at GE Money Japan ($0.3billion), and an after-tax loss on sale of our WMC business ($0.1 billion), partially offset by a tax adjustment related to the 2004 initialpublic offering of Genworth ($0.1 billion). This was partially offset by an after-tax gain on sale of our Plastics business ($1.6 billion)and earnings from Plastics operations ($0.3 billion).
Earnings from discontinued operations, net of taxes, in 2006 were $1.4 billion, reflecting earnings at our Plastics andAdvanced Materials businesses ($1.0 billion). Also included in these earnings were earnings at GE Money Japan and WMC ($0.3billion), Genworth ($0.2 billion) and GE Insurance Solutions ($0.1 billion), partially offset by a loss at GE Life ($0.2 billion).
Loss from discontinued operations, net of taxes, in 2005 was $0.6 billion, reflecting a loss at GE Insurance Solutions ($2.8billion), partially offset by earnings at Genworth ($0.9 billion), Plastics and Advanced Materials ($0.8 billion) and GE Money Japanand WMC ($0.6 billion).
For additional information related to discontinued operations, see note 2. Geographic Operations Our global activities span all geographic regions and primarily encompass manufacturing for local and export markets, import and saleof products produced in other regions, leasing of aircraft, sourcing for our plants domiciled in other global regions and provision offinancial services within these regional economies. Thus, when countries or regions experience currency and/or economic stress, weoften have increased exposure to certain risks, but also often have new profit opportunities. Potential increased risks include, amongother things, higher receivable delinquencies and bad debts, delays or cancellations of sales and orders principally related to powerand aircraft equipment, higher local currency financing costs and slowdown in established financial services activities. New profitopportunities include, among other things, more opportunities for lower cost outsourcing, expansion of industrial and financialservices activities through purchases of companies or assets at reduced prices and lower U.S. debt financing costs.
Revenues are classified according to the region to which products and services are sold. For purposes of this analysis, U.S. ispresented separately from the remainder of the Americas. We classify certain operations that cannot meaningfully be associated withspecific geographic areas as “Other Global” for this purpose.
Source: GENERAL ELECTRIC CO, 8-K, October 08, 2008

(19)
Source: GENERAL ELECTRIC CO, 8-K, October 08, 2008

GEOGRAPHIC REVENUES (In billions) 2007 2006 2005 U.S. $ 86.2 $ 81.1 $ 75.7 Europe 39.9 32.6 29.1 Pacific Basin 21.8 17.7 15.4 Americas 12.6 11.5 9.6 Middle East and Africa 8.0 5.5 4.2 Other Global 4.0 3.2 2.3 Total $ 172.5 $ 151.6 $ 136.3
Global revenues rose 22% to $86.3 billion in 2007, compared with $70.5 billion and $60.6 billion in 2006 and 2005, respectively.Global revenues to external customers as a percentage of consolidated revenues were 50% in 2007, compared with 47% and 44% in2006 and 2005, respectively. The effects of currency fluctuations on reported results were to increase revenues by $4.0 billion, $0.1billion and $0.8 billion in 2007, 2006 and 2005, respectively.
GE global revenues in 2007 were $49.8 billion, up 16% over 2006, led by increases at Energy Infrastructure and TechnologyInfrastructure, primarily in the Middle East and Africa, Europe and the Pacific Basin. GE global revenues were $43.0 billion in 2006,up 15% over 2005, led by increases at Energy Infrastructure and Technology Infrastructure, primarily in Europe, Middle East andAfrica and the Pacific Basin.
GECS global revenues rose 33% to $36.5 billion in 2007, compared with $27.5 billion and $23.1 billion in 2006 and 2005,respectively. Global revenues as a percentage of total revenues were 51% in 2007, compared with 45% and 42% in 2006 and 2005,respectively. The effects of currency fluctuations on reported results were to increase revenues by $2.3 billion and $0.6 billion in 2007and 2005, respectively, compared with a decrease of $0.1 billion in 2006.
GECS revenues in the Middle East and Africa grew 42% in 2007, primarily as a result of organic revenue growth at GECAS.Revenues grew 37% in the Pacific Basin, 30% in Europe and 23% in the Americas in 2007, primarily as a result of organic revenuegrowth, acquisitions and the effects of the weaker U.S. dollar, primarily at Real Estate, CLL and GE Money.
Total assets of global operations on a continuing basis were $418.5 billion in 2007, an increase of $87.9 billion, or 27%, over2006. GECS global assets on a continuing basis of $361.8 billion at the end of 2007 were 21% higher than at the end of 2006,reflecting core growth, acquisitions and the effects of the weaker U.S. dollar in Europe, the Pacific Basin and the Americas, primarilyat Real Estate, CLL and GE Money.
Financial results of our global activities reported in U.S. dollars are affected by currency exchange. We use a number oftechniques to manage the effects of currency exchange, including selective borrowings in local currencies and selective hedging ofsignificant cross-currency transactions. Such principal currencies are the pound sterling, the euro, the Japanese yen and the Canadiandollar. Environmental Matters Our operations, like operations of other companies engaged in similar businesses, involve the use, disposal and cleanup of substancesregulated under environmental protection laws.
Source: GENERAL ELECTRIC CO, 8-K, October 08, 2008

(20)
Source: GENERAL ELECTRIC CO, 8-K, October 08, 2008

We are involved in a sizable number of remediation actions to clean up hazardous wastes as required by federal and statelaws. Such statutes require that responsible parties fund remediation actions regardless of fault, legality of original disposal orownership of a disposal site. Expenditures for site remediation actions amounted to $0.2 billion in both 2007 and 2006. We presentlyexpect that such remediation actions will require average annual expenditures in the range of $0.2 billion to $0.3 billion over the nexttwo years.
The U.S. Environmental Protection Agency (EPA) ruled in February 2002 that approximately 150,000 pounds ofpolychlorinated biphenyls (PCBs) must be dredged from a 40-mile stretch of the upper Hudson River in New York state. OnNovember 2, 2006, the U.S. District Court for the Northern District of New York approved a consent decree entered into between GEand the EPA that represents a comprehensive framework for implementation of the EPA’s 2002 decision to dredge PCB-containingsediments in the upper Hudson River. The dredging will be performed in two phases with an intervening peer review of performanceafter phase 1. Under this consent decree, we have committed up to $0.1 billion to reimburse the EPA for its past and future projectoversight costs and agreed to perform the first phase of dredging. We further committed that, subject to future agreement with theEPA about completion of dredging after completion of phase 1 and the peer review, we will be responsible for further costs, includingcosts of phase 2 dredging. Our Statement of Financial Position as of December 31, 2007 and 2006, included liabilities for theestimated costs of this remediation. Financial Resources and Liquidity This discussion of financial resources and liquidity addresses the Statement of Financial Position, the Statement of Changes inShareowners’ Equity, the Statement of Cash Flows, Contractual Obligations, Off-Balance Sheet Arrangements, and Debt Instruments,Guarantees and Covenants.
The fundamental differences between GE and GECS are reflected in the measurements commonly used by investors, ratingagencies and financial analysts. These differences will become clearer in the discussion that follows with respect to the moresignificant items in the financial statements. Overview of Financial Position Major changes in our financial position resulted from the following:
• We separately reported the assets and liabilities of Plastics, GE Money Japan and WMC as discontinued operations for allperiods presented. As of December 31, 2007, we have completed the sales of Plastics and WMC, reducing assets and liabilitiesof discontinued operations by $13.2 billion and $2.1 billion, respectively.
• During 2007, we completed the acquisitions of Smiths Aerospace Group Ltd.; Vetco Gray; Oxygen Media Corp.; Sondex
PLC; Sparrowhawk Holdings Ltd.; Phoenix; Dynamic Imaging, LLC; Sanyo Electric Credit Co., Ltd.; DISKO and ASL, theleasing businesses of KG Allgemeine Leasing GmbH & Co.; Trustreet Properties, Inc.; Dundee REIT; Crow Holdings; and acontrolling interest in Regency Energy Partners LP.
• Our principal pension plans had a surplus of $16.8 billion at December 31, 2007, compared with $11.5 billion at the
end of 2006, reflecting strong asset returns and an increase in the discount rate.
(21)
Source: GENERAL ELECTRIC CO, 8-K, October 08, 2008
• The U.S. dollar was weaker at December 31, 2007, than it was at December 31, 2006, increasing the translated levels of ournon-U.S. dollar assets and liabilities. Overall, on average, the U.S. dollar in 2007 was weaker than during the comparable 2006period, resulting in increasing the translated levels of our operations as noted in the preceding Operations section.
Statement of Financial Position Because GE and GECS share certain significant elements of their Statements of Financial Position − property, plant and equipmentand borrowings, for example − the following discussion addresses significant captions in the “consolidated” statement. Within thefollowing discussions, however, we distinguish between GE and GECS activities in order to permit meaningful analysis of eachindividual consolidating statement. INVESTMENT SECURITIES comprise mainly investment-grade debt securities supporting obligations to annuitants andpolicyholders in our run-off insurance businesses and holders of guaranteed investment contracts (GICs). Investment securities were$45.3 billion at December 31, 2007, compared with $47.8 billion at December 31, 2006. Of the amount at December 31, 2007, weheld mortgage-backed securities (MBS) and asset-backed securities (ABS) with estimated fair values of $8.4 billion and $2.2 billion,respectively. Such amounts included unrealized losses of $0.3 billion and $0.1 billion, respectively. Of the MBS amount, $5.5 billionrelated to residential MBS and $2.9 billion to commercial MBS.
At December 31, 2007 and 2006, we had approximately $1.7 billion of exposure to subprime credit supporting ourguaranteed investment contracts, a majority of which relates to residential MBS receiving credit ratings of Double A or better from themajor rating agencies. We purchased an insignificant amount of such securities in 2007. Our subprime investment securities werecollateralized primarily by pools of individual, direct mortgage loans, not other structured products such as collateralized debtobligations.
Monoline insurers (Monolines) provide credit enhancement for certain of our investment securities. The current creditenvironment could have a significant effect on the ability of such financial guarantors to fulfill their obligations. At December 31,2007, our investment securities insured by Monolines amounted to $3.5 billion, including $1.3 billion of our $1.7 billion investment insubprime residential MBS.
We regularly review investment securities for impairment using both quantitative and qualitative criteria. Quantitative criteriainclude length of time and amount that each security is in an unrealized loss position and, for fixed maturities, whether the issuer is incompliance with terms and covenants of the security. Qualitative criteria include the financial health of and specific prospects for theissuer, as well as our intent and ability to hold the security to maturity or until forecasted recovery. Our impairment reviews involveour finance, risk and asset management functions as well as the portfolio management and research capabilities of our internal andthird-party asset managers. Our qualitative review attempts to identify issuers’ securities “at-risk” of impairment, that is, with a greaterthan 50% chance of default in the following 12 months. At December 31, 2007, investment securities in an unrealized loss positionincluded $0.1 billion that was at risk of being charged to earnings in the next 12 months.
Impairment losses totaled $0.1 billion in both 2007 and 2006, primarily at Capital Finance. In 2007, we recognizedimpairments primarily for our retained interests in off-balance sheet arrangements. In 2006, we recognized impairments on securitiesof issuers in a variety of industries; we do not believe that any of the impairments indicate likely future impairments in the remainingportfolio. Investments in retained interests in off-balance sheet arrangements at Capital Finance also decreased by $0.1 billion during2007, reflecting declines in fair value accounted for in accordance with a new accounting standard that became effective at thebeginning of 2007.
(22)
Source: GENERAL ELECTRIC CO, 8-K, October 08, 2008
Gross unrealized gains and losses totaled $1.4 billion and $1.3 billion, respectively, at December 31, 2007, compared with$2.9 billion and $0.3 billion, respectively, at December 31, 2006, primarily reflecting a decrease in estimated fair values of U.S.corporate and MBS debt securities and a decrease caused by sale of certain equity securities. At December 31, 2007, available 2008accounting gains could be as much as $0.7 billion, net of consequential adjustments to certain insurance assets that are amortizedbased on anticipated gross profits. The market values we used in determining unrealized gains and losses are those defined by relevantaccounting standards and are not a forecast of future gains or losses. We presently intend to hold our investment securities that are inan unrealized loss position at December 31, 2007, at least until we can recover their respective amortized cost and we have the abilityto hold our debt securities until their maturities. See note 9. WORKING CAPITAL, representing GE inventories and receivables from customers, less trade payables and progress collections,was $5.2 billion at December 31, 2007, down $1.5 billion from December 31, 2006, reflecting higher progress collections at Energy.
We discuss current receivables and inventories, two important elements of working capital, in the following paragraphs. CURRENT RECEIVABLES for GE amounted to $15.1 billion at the end of 2007 and $13.8 billion at the end of 2006, and included$11.0 billion due from customers at the end of 2007 compared with $8.8 billion at the end of 2006. Turnover of customer receivablesfrom sales of goods and services was 9.9 in 2007, compared with 10.0 in 2006. Other current receivables are primarily amounts thatdid not originate from sales of GE goods or services, such as advances to suppliers in connection with large contracts. See note 10. INVENTORIES for GE amounted to $12.8 billion at December 31, 2007, up $2.9 billion from the end of 2006. This increasereflected higher inventories from acquisitions and at Technology Infrastructure and Energy Infrastructure, which is in line withanticipated growth. GE inventory turnover was 7.9 and 8.8 in 2007 and 2006, respectively. See note 11. FINANCING RECEIVABLES is our largest category of assets and represents one of our primary sources of revenues. The portfolioof financing receivables, before allowance for losses, was $388.3 billion at December 31, 2007, and $330.8 billion at December 31,2006. The related allowance for losses at December 31, 2007, amounted to $4.2 billion, compared with $3.9 billion at December 31,2006, representing our best estimate of probable losses inherent in the portfolio. The 2007 increase reflected overall growth in ourportfolio, increased delinquencies in the U.S. at GE Money, and the weaker U.S. dollar, primarily at GE Money; partially offset bycontinued strong credit quality at CLL and Real Estate.
A discussion of the quality of certain elements of the financing receivables portfolio follows. For purposes of that discussion,“delinquent” receivables are those that are 30 days or more past due; and “nonearning” receivables are those that are 90 days or morepast due (or for which collection has otherwise become doubtful).
CLL financing receivables, before allowance for losses, totaled $155.7 billion at December 31, 2007, compared with $133.2billion at December 31, 2006, and consisted of loans and financing leases to the equipment, commercial and industrial industries. Thisportfolio of receivables increased primarily from core growth ($57.7 billion), acquisitions ($9.1 billion), and the weaker U.S. dollar($5.0 billion), partially offset by securitizations and sales ($47.1 billion). Related nonearning receivables were $1.7 billion (1.1% ofoutstanding receivables) at December 31, 2007, and $1.5 billion (1.2% of outstanding receivables) at year-end 2006. CLL financingreceivables are generally backed by assets and there is a broad spread of geographic and credit risk in the portfolio.
(23)
Source: GENERAL ELECTRIC CO, 8-K, October 08, 2008

Real Estate financing receivables, before allowance for losses, totaled $32.2 billion at December 31, 2007, compared with$21.0 billion at December 31, 2006, and consisted of loans and financing leases to the real estate industry. This portfolio ofreceivables increased primarily from core growth ($5.6 billion), acquisitions ($5.2 billion) and the weaker U.S. dollar ($0.7 billion).Related nonearning receivables were insignificant at December 31, 2007 and 2006.
GE Money financing receivables, before allowance for losses, were $173.2 billion at December 31, 2007, compared with$148.6 billion at December 31, 2006, and consisted primarily of card receivables, installment loans, auto loans and leases, andresidential mortgages. This portfolio of receivables increased primarily as a result of core growth ($15.2 billion), the weaker U.S.dollar ($9.8 billion) and acquisitions ($1.4 billion), partially offset by loans transferred to assets held for sale ($1.0 billion) anddispositions ($1.0 billion). Related nonearning receivables were $3.7 billion at December 31, 2007, compared with $3.1 billion atDecember 31, 2006, both representing 2.1% of outstanding receivables. The increase was primarily related to the weaker U.S. dollar atthe end of the year and overall growth in the portfolio.
GECAS financing receivables, before allowance for losses, were $14.2 billion at December 31, 2007, compared with $13.6billion at December 31, 2006, and consisted primarily of loans and leases to the commercial aircraft industry. This portfolio ofreceivables increased primarily from core growth ($0.5 billion), partially offset by securitizations and sales ($0.2 billion). Relatednonearning receivables were insignificant at December 31, 2007 and 2006.
Energy Financial Services financing receivables, before allowance for losses, were $7.9 billion at December 31, 2007,compared with $7.6 billion at December 31, 2006, and consisted primarily of loans and leases to the energy industry. This portfolio ofreceivables increased primarily from core growth ($1.2 billion), partially offset by securitizations and sales ($0.6 billion). Relatednonearning receivables were insignificant at December 31, 2007 and 2006.
Other financing receivables, before allowance for losses, were $5.1 billion and $6.9 billion at December 31, 2007, andDecember 31, 2006, respectively, and consisted primarily of financing receivables in consolidated, liquidating securitization entities.This portfolio of receivables decreased because we have stopped transferring assets to these entities. Related nonearning receivables atDecember 31, 2007, were $0.1 billion (1.4% of outstanding receivables) compared with $0.1 billion (1.2% of outstanding receivables)at December 31, 2006.
Delinquency rates on managed equipment financing loans and leases and managed consumer financing receivables follow. December 31 2007 2006 2005 Equipment Financing 1.21% 1.22% 1.31%Consumer 5.38 5.22 5.37
U.S. 5.52 4.93 5.00 Non-U.S. 5.32 5.34 5.51
Delinquency rates on equipment financing loans and leases decreased from December 31, 2005, through December 31, 2007,reflecting continued strong credit quality.
(24)
Source: GENERAL ELECTRIC CO, 8-K, October 08, 2008

Delinquency rates on consumer financing receivables increased from December 31, 2006, to December 31, 2007, primarilyas a result of the deteriorating consumer credit environment in the U.S. At December 31, 2007, approximately one-third of ourU.S.-managed portfolio, which consisted of credit card, installment and revolving loans, was receivable from subprime borrowers. Wehad no U.S. subprime residential mortgage loans at December 31, 2007. The U.S. experience had not affected our non-U.S. portfoliosat December 31, 2007; those delinquency rates remained fairly stable. See notes 12 and 13. OTHER GECS RECEIVABLES totaled $22.1 billion at December 31, 2007, and $21.7 billion at December 31, 2006, and consistedprimarily of amounts due from GE (generally related to certain material procurement programs), insurance receivables, nonfinancingcustomer receivables, amounts due under operating leases, receivables due on sale of securities and various sundry items. PROPERTY, PLANT AND EQUIPMENT amounted to $77.9 billion at December 31, 2007, up $7.3 billion from 2006, primarilyreflecting acquisitions and additions of commercial aircraft at the GECAS business of Capital Finance and fleet vehicles at the CLLbusiness of Capital Finance. GE property, plant and equipment consisted of investments for its own productive use, whereas thelargest element for GECS was equipment provided to third parties on operating leases. Details by category of investment are presentedin note 14.
GE additions to property, plant and equipment during 2007 totaled $3.0 billion, compared with $2.9 billion in 2006. Totalexpenditures, excluding equipment leased to others, for the past five years were $13.2 billion, of which 32% was investment forgrowth through new capacity and product development; 33% was investment in productivity through new equipment and processimprovements; and 35% was investment for other purposes such as improvement of research and development facilities and safety andenvironmental protection.
GECS additions to property, plant and equipment were $15.2 billion and $13.2 billion during 2007 and 2006, respectively,primarily reflecting acquisitions and additions of vehicles at the CLL business and commercial aircraft at the GECAS business ofCapital Finance. GOODWILL AND OTHER INTANGIBLE ASSETS amounted to $81.1 billion and $16.1 billion, respectively, at December 31,2007. Goodwill increased $9.7 billion and other intangible assets increased $3.3 billion from 2006, primarily from acquisitions −
including Smiths Aerospace Group Ltd. by Technology Infrastructure, Vetco Gray by Energy Infrastructure, DISKO and ASL andSanyo Electric Credit Co., Ltd. by Capital Finance and Oxygen Media Corp. by NBC Universal − and from the weaker U.S. dollar.See note 15. ALL OTHER ASSETS totaled $122.8 billion at year-end 2007, an increase of $31.2 billion, reflecting increases from additionalinvestments and acquisitions in real estate, increases in associated companies, prepaid pension assets and assets held for sale. See note16. BORROWINGS amounted to $514.1 billion at December 31, 2007, compared with $432.8 billion at the end of 2006.
GE total borrowings were $15.8 billion at year-end 2007 ($4.1 billion short term, $11.7 billion long term) compared with$11.1 billion at December 31, 2006. The increase ($4.7 billion) is mainly attributable to long-term borrowings and will partially beused to repay maturing long-term debt in 2008. GE total debt at the end of 2007 equaled 11.4% of total capital compared with 8.7% atthe end of 2006.
(25)
Source: GENERAL ELECTRIC CO, 8-K, October 08, 2008

GECS borrowings amounted to $500.9 billion at December 31, 2007, of which $192.4 billion is due in 2008 and $308.5billion is due in subsequent years. Comparable amounts at the end of 2006 were $426.3 billion in total, $173.3 billion due within oneyear and $253.0 billion due thereafter. The increase in borrowings primarily resulted from new issuances of GE Capital long-term debt($90.3 billion), the weaker U.S. dollar ($15.8 billion), acquisitions ($11.0 billion) and increase in short-term borrowings ($6.4 billion),partially offset by maturities and other redemptions of long-term debt ($47.9 billion). Included in GECS total borrowings wereborrowings of consolidated, liquidating securitization entities amounting to $9.3 billion and $11.1 billion at December 31, 2007 and2006, respectively. A large portion of GECS borrowings ($101.1 billion and $93.8 billion at the end of 2007 and 2006, respectively)was issued in active unsecured commercial paper markets that we believe will continue to be a reliable source of short-term financing.The average remaining terms and interest rates of GE Capital commercial paper were 56 days and 4.79% at the end of 2007, comparedwith 48 days and 5.09% at the end of 2006. The GE Capital ratio of debt to equity was 8.10 to 1 at the end of 2007 and 7.52 to 1 at theend of 2006. See note 17. EXCHANGE RATE AND INTEREST RATE RISKS are managed with a variety of techniques, including match funding andselective use of derivatives. We use derivatives to mitigate or eliminate certain financial and market risks because we conduct businessin diverse markets around the world and local funding is not always efficient. In addition, we use derivatives to adjust the debt we areissuing to match the fixed or floating nature of the assets we are acquiring. We apply strict policies to manage each of these risks,including prohibitions on derivatives trading, derivatives market-making or other speculative activities. Following is an analysis of thepotential effects of changes in interest rates and currency exchange rates using so-called “shock” tests that model effects of shifts inrates. These are not forecasts.
• It is our policy to minimize exposure to interest rate changes. We fund our financial investments using debt or a combinationof debt and hedging instruments so that the interest rates and terms of our borrowings match the expected yields and terms onour assets. To test the effectiveness of our positions, we assumed that, on January 1, 2008, interest rates increased by 100 basispoints across the yield curve (a “parallel shift” in that curve) and further assumed that the increase remained in place for 2008.We estimated, based on the year-end 2007 portfolio and holding everything else constant, that our 2008 GE consolidated netearnings would decline by $0.1 billion.
• It is our policy to minimize currency exposures and to conduct operations either within functional currencies or using the
protection of hedge strategies. We analyzed year-end 2007 consolidated currency exposures, including derivatives designatedand effective as hedges, to identify assets and liabilities denominated in other than their relevant functional currencies. Forsuch assets and liabilities, we then evaluated the effects of a 10% shift in exchange rates between those currencies and the U.S.dollar. This analysis indicated that there would be an inconsequential effect on 2008 earnings of such a shift in exchange rates.
(26)
Source: GENERAL ELECTRIC CO, 8-K, October 08, 2008

Consolidated Statement of Changes in Shareowners’ Equity Shareowners’ equity increased by $4.1 billion and $2.9 billion in 2007 and 2006, respectively, and decreased by $1.5 billion in 2005.Changes over the three-year period were largely attributable to net earnings, partially offset by dividends declared of $11.7 billion,$10.7 billion and $9.6 billion in 2007, 2006 and 2005, respectively. In 2007, we purchased $13.9 billion of GE stock (357.9 millionshares) and in 2006, we purchased $7.8 billion of GE stock (229.4 million shares) under our share repurchase programs. Currencytranslation adjustments increased equity by $4.5 billion in 2007 and $3.6 billion in 2006, compared with a $4.3 billion decrease in2005. Changes in currency translation adjustments reflect the effects of changes in currency exchange rates on our net investment innon-U.S. subsidiaries that have functional currencies other than the U.S. dollar. During 2007 and 2006, the U.S. dollar weakenedagainst the pound sterling and euro, after strengthening in 2005. The U.S. dollar was also weaker against the Japanese yen in 2007,after strengthening in 2006 and 2005. See note 22. Overview of Our Cash Flow from 2005 through 2007 GE cash from operating activities (CFOA) is a useful measure of performance for our non-financial businesses and totaled $23.3billion in 2007, $23.8 billion in 2006 and $19.8 billion in 2005. Generally, factors that affect our earnings − for example, pricing,volume, costs and productivity − affect CFOA similarly. However, while management of working capital, including timing ofcollections and payments and levels of inventory, affects operating results only indirectly, the effect of these programs on CFOA canbe significant. Our GE Statement of Cash Flows shows CFOA in the required format. While that display is of some use in analyzing how variousassets and liabilities affected our year-end cash positions, we believe that it is also useful to supplement that display and to examine ina broader context the business activities that provide and require cash. December 31 (In billions) 2007 2006 2005 Operating cash collections $ 102.8 $ 90.6 $ 80.8 Operating cash payments (86.8) (76.6) (68.8)Cash dividends from GECS 7.3 9.8 7.8 GE cash from operating activities $ 23.3 $ 23.8 $ 19.8
The most significant source of cash in CFOA is customer-related activities, the largest of which is collecting cash following a productor services sale. GE operating cash collections increased by $12.2 billion in 2007 and $9.8 billion in 2006. These increases areconsistent with the changes in comparable GE operating segment revenues, comprising Technology Infrastructure, EnergyInfrastructure, NBC Universal and Consumer & Industrial. Analyses of operating segment revenues discussed in the precedingSegment Operations section is the best way of understanding their customer-related CFOA.
The most significant operating use of cash is to pay our suppliers, employees, tax authorities and others for the wide range ofmaterials and services necessary in a diversified global organization. GE operating cash payments increased by $10.2 billion in 2007and by $7.8 billion in 2006, comparable to the increases in GE total costs and expenses.
(27)
Source: GENERAL ELECTRIC CO, 8-K, October 08, 2008
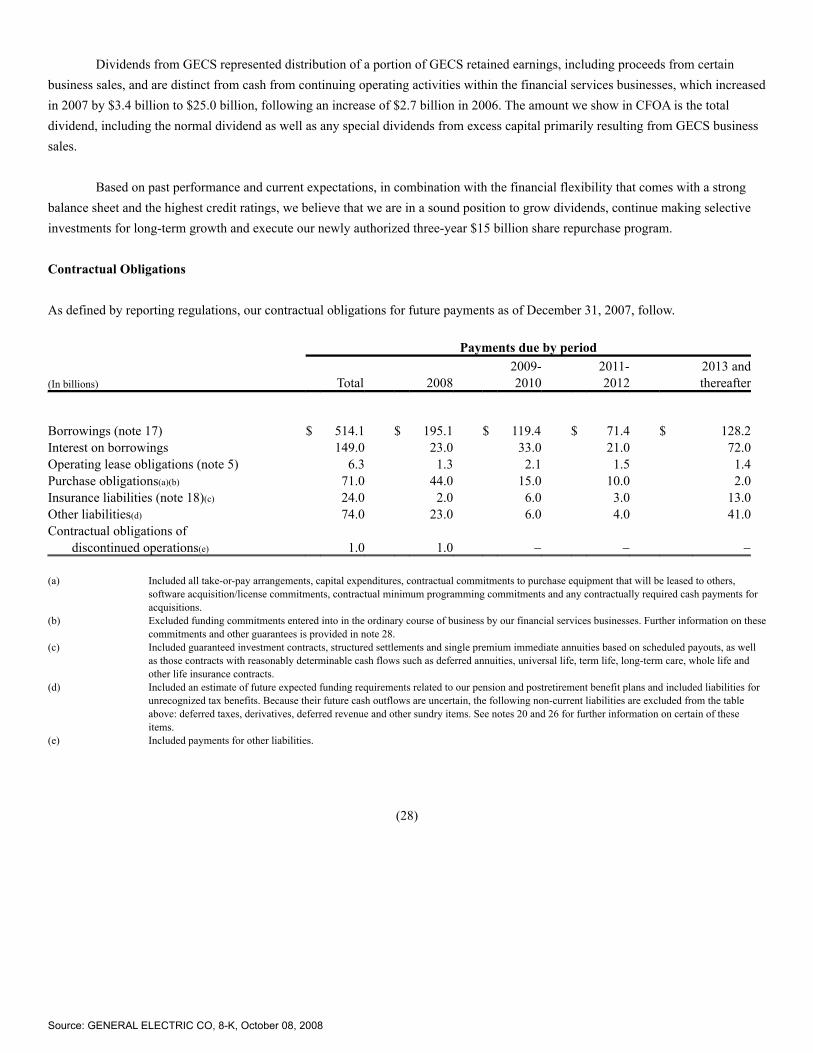
Dividends from GECS represented distribution of a portion of GECS retained earnings, including proceeds from certainbusiness sales, and are distinct from cash from continuing operating activities within the financial services businesses, which increasedin 2007 by $3.4 billion to $25.0 billion, following an increase of $2.7 billion in 2006. The amount we show in CFOA is the totaldividend, including the normal dividend as well as any special dividends from excess capital primarily resulting from GECS businesssales.
Based on past performance and current expectations, in combination with the financial flexibility that comes with a strongbalance sheet and the highest credit ratings, we believe that we are in a sound position to grow dividends, continue making selectiveinvestments for long-term growth and execute our newly authorized three-year $15 billion share repurchase program. Contractual Obligations As defined by reporting regulations, our contractual obligations for future payments as of December 31, 2007, follow. Payments due by period
(In billions) Total 2008 2009-2010
2011-2012
2013 andthereafter
Borrowings (note 17) $ 514.1 $ 195.1 $ 119.4 $ 71.4 $ 128.2 Interest on borrowings 149.0 23.0 33.0 21.0 72.0 Operating lease obligations (note 5) 6.3 1.3 2.1 1.5 1.4 Purchase obligations(a)(b) 71.0 44.0 15.0 10.0 2.0 Insurance liabilities (note 18)(c) 24.0 2.0 6.0 3.0 13.0 Other liabilities(d) 74.0 23.0 6.0 4.0 41.0 Contractual obligations of
discontinued operations(e) 1.0 1.0 − − −
(a) Included all take-or-pay arrangements, capital expenditures, contractual commitments to purchase equipment that will be leased to others,software acquisition/license commitments, contractual minimum programming commitments and any contractually required cash payments foracquisitions.
(b) Excluded funding commitments entered into in the ordinary course of business by our financial services businesses. Further information on thesecommitments and other guarantees is provided in note 28.
(c) Included guaranteed investment contracts, structured settlements and single premium immediate annuities based on scheduled payouts, as wellas those contracts with reasonably determinable cash flows such as deferred annuities, universal life, term life, long-term care, whole life andother life insurance contracts.
(d) Included an estimate of future expected funding requirements related to our pension and postretirement benefit plans and included liabilities forunrecognized tax benefits. Because their future cash outflows are uncertain, the following non-current liabilities are excluded from the tableabove: deferred taxes, derivatives, deferred revenue and other sundry items. See notes 20 and 26 for further information on certain of theseitems.
(e) Included payments for other liabilities.
(28)
Source: GENERAL ELECTRIC CO, 8-K, October 08, 2008

Off-Balance Sheet Arrangements Our securitization activity is primarily transacted through special purpose vehicles funded in the asset-backed commercial paper andterm bond markets. The assets that we securitize include receivables secured by equipment, commercial and residential real estate,credit card receivables, trade receivables and other assets originated and underwritten by us in the normal course of business. AtDecember 31, 2007, off-balance sheet securitization entities held $53.5 billion in financial assets, up $7.4 billion during the year.Assets held by these entities are underwritten based on the same criteria as our on-book assets. We monitor the underlying creditquality in accordance with our servicing role and apply rigorous controls to the execution of securitization. Based on our experience,we believe that, under any plausible future economic scenario, the likelihood is remote that the financial support arrangement weprovide to securitization entities could have a material adverse effect on our financial position or results of operations. Investors inthese entities usually have recourse to the underlying assets. In addition, we provide credit enhancements, most often by retaining asubordinated interest; the carrying value of our retained interests was $5.7 billion at December 31, 2007, up $1.0 billion during theyear. We recognized impairment losses on retained interests of $0.1 billion in 2007, at Capital Finance. Impairment losses on retainedinterests in 2006 were insignificant. Investments in retained interests at Capital Finance also decreased by $0.1 billion during 2007,reflecting declines in fair value accounted for in accordance with a new accounting standard that became effective at the beginning of2007. We have also entered into other various credit enhancement positions with these securitization entities, including liquidity andcredit support agreements and guarantee and reimbursement contracts, and have provided our best estimate of the fair value ofestimated losses on such positions. The estimate of fair value is based on prevailing market conditions at December 31, 2007. Shouldmarket conditions deteriorate, actual losses could be higher. Our exposure to loss under such agreements was limited to $2.8 billion atDecember 31, 2007. Debt Instruments, Guarantees and Covenants The major debt rating agencies routinely evaluate the debt of GE, GECS and GE Capital, the major borrowing affiliate of GECS.These agencies have given the highest debt ratings to GE and GE Capital (long-term rating AAA/Aaa; short-term rating A−1+/P−1).One of our strategic objectives is to maintain these ratings, as they serve to lower our cost of funds and to facilitate our access to avariety of lenders. We manage our businesses in a fashion that is consistent with maintaining these ratings.
GE, GECS and GE Capital have distinct business characteristics that the major debt rating agencies evaluate bothquantitatively and qualitatively. Quantitative measures include:
• Earnings and profitability, revenue growth, the breadth and diversity of sources of income and return on assets
• Asset quality, including delinquency and write-off ratios and reserve coverage
• Funding and liquidity, including cash generated from operating activities, leverage ratios such as debt-to-capital, marketaccess, back-up liquidity from banks and other sources, composition of total debt and interest coverage
• Capital adequacy, including required capital and tangible leverage ratios
(29)
Source: GENERAL ELECTRIC CO, 8-K, October 08, 2008

Qualitative measures include:
• Franchise strength, including competitive advantage and market conditions and position
• Strength of management, including experience, corporate governance and strategic thinking
• Financial reporting quality, including clarity, completeness and transparency of all financial performance communications GE Capital’s ratings are supported contractually by a GE commitment to maintain the ratio of earnings to fixed charges at a specifiedlevel as described below.
During 2007, GECS paid $2.4 billion of special dividends to GE, which were funded by the proceeds of the sale of Swiss Recommon stock and GE Life.
During 2007, GECS and GECS affiliates issued $84.6 billion of senior, unsecured long-term debt and $5.7 billion ofsubordinated debt. This debt was both fixed and floating rate and was issued to institutional and retail investors in the U.S. and 17other global markets. Maturities for these issuances ranged from one to 60 years. We used the proceeds primarily for repayment ofmaturing long-term debt, but also to fund acquisitions and organic growth. We anticipate that we will issue approximately $80 billionof long-term debt during 2008. The ultimate amount we issue will depend on our needs and on market conditions.
We target a ratio for commercial paper not to exceed 35% of outstanding debt based on the anticipated composition of ourassets and the liquidity profile of our debt. GE Capital is the most widely held name in global commercial paper markets. See ourForm 8-K filed on September 25, 2008.
We continue to believe that alternative sources of liquidity are sufficient to permit an orderly transition from commercialpaper in the unlikely event of impaired access to those markets. Funding sources on which we would rely would depend on the natureof such a hypothetical event, but include $64.8 billion of contractually committed lending agreements with 72 highly-rated globalbanks and investment banks. Total credit lines extending beyond one year increased $5.0 billion to $64.8 billion at December 31,2007. See note 17.
Beyond contractually committed lending agreements, other sources of liquidity include medium and long-term funding,monetization, asset securitization, cash receipts from our lending and leasing activities, short-term secured funding on global assetsand potential sales of other assets. PRINCIPAL DEBT CONDITIONS are described below. The following conditions relate to GE and GECS:
• Swap, forward and option contracts are required to be executed under standard master-netting agreements containing mutualdowngrade provisions that provide the ability of the counterparty to require assignment or termination if the long-term creditrating of either GE or GECS were to fall below A−/A3. Our related obligation, net of master-netting agreements would havebeen $3.4 billion at December 31, 2007.
• If GE Capital’s ratio of earnings to fixed charges, which was 1.56:1 at the end of 2007, were to deteriorate to 1.10:1, GE has
committed to contribute capital to GE Capital. GE also guaranteed certain issuances of GECS subordinated debt having a faceamount of $0.8 billion at December 31, 2007 and 2006.
(30)
Source: GENERAL ELECTRIC CO, 8-K, October 08, 2008
• In connection with certain subordinated debentures for which GECS receives equity credit by rating agencies, GE has agreedto forego dividends, distributions or other payments from GECS during events of default or interest extensions under suchsubordinated debentures. There were $8.1 billion of such debentures outstanding at December 31, 2007.
The following conditions relate to consolidated entities.
• If the short-term credit rating of GE Capital or certain consolidated entities discussed further in note 27 were to be reducedbelow A−1/P−1, GE Capital would be required to provide substitute liquidity for those entities or provide funds to retire theoutstanding commercial paper. The maximum net amount that GE Capital would be required to provide in the event of such adowngrade is determined by contract, and amounted to $7.2 billion at January 1, 2008.
• One group of consolidated entities holds high quality investment securities funded by the issuance of GICs. If the long-term
credit rating of GE Capital were to fall below AA−/Aa3 or its short-term credit rating were to fall below A−1+/P−1, GECapital could be required to provide up to $6.2 billion of capital to such entities.
In our history, we have never violated any of the above conditions at GE, GECS or GE Capital. We believe that under any reasonablefuture economic developments, the likelihood that any such arrangements could have a significant effect on our operations, cash flowsor financial position is remote. Critical Accounting Estimates Accounting estimates and assumptions discussed in this section are those that we consider to be the most critical to an understandingof our financial statements because they inherently involve significant judgments and uncertainties. For all of these estimates, wecaution that future events rarely develop exactly as forecast, and the best estimates routinely require adjustment. Also see note 1,Summary of Significant Accounting Policies, which discusses the significant accounting policies that we have selected fromacceptable alternatives. LOSSES ON FINANCING RECEIVABLES are recognized when they are incurred, which requires us to make our best estimate ofprobable losses inherent in the portfolio. Such estimate requires consideration of historical loss experience, adjusted for currentconditions, and judgments about the probable effects of relevant observable data, including present economic conditions such asdelinquency rates, financial health of specific customers and market sectors, collateral values, and the present and expected futurelevels of interest rates. Our risk management process, which includes standards and policies for reviewing major risk exposures andconcentrations, ensures that relevant data are identified and considered either for individual loans or financing leases, or on a portfoliobasis, as appropriate.
Our lending and leasing experience and the extensive data we accumulate and analyze facilitate estimates that have provenreliable over time. Our actual loss experience was in line with expectations for 2007, 2006 and 2005. While our equipment financingportfolio continues to experience strong credit quality, we currently expect higher delinquencies in the consumer U.S. portfolio.
Further information is provided in the Financial Resources and Liquidity − Financing Receivables section, the AssetImpairment section that follows and in notes 1, 12 and 13.
(31)
Source: GENERAL ELECTRIC CO, 8-K, October 08, 2008

REVENUE RECOGNITION ON LONG-TERM AGREEMENTS to provide product services (product services agreements)requires estimates of profits over the multiple-year terms of such agreements, considering factors such as the frequency and extent offuture monitoring, maintenance and overhaul events; the amount of personnel, spare parts and other resources required to perform theservices; and future billing rate and cost changes. We routinely review estimates under product services agreements and regularlyrevise them to adjust for changes in outlook. We also regularly assess customer credit risk inherent in the carrying amounts ofreceivables and contract costs and estimated earnings, including the risk that contractual penalties may not be sufficient to offset ouraccumulated investment in the event of customer termination. We gain insight into future utilization and cost trends, as well as creditrisk, through our knowledge of the installed base of equipment and the close interaction with our customers that comes with supplyingcritical services and parts over extended periods. Revisions that affect a product services agreement’s total estimated profitabilityresult in an immediate adjustment of earnings; such adjustments increased earnings by $0.3 billion, $0.7 billion and $0.4 billion in2007, 2006 and 2005, respectively. We provide for probable losses.
Carrying amounts for product services agreements in progress at December 31, 2007 and 2006, were $5.5 billion and $4.8billion, respectively, and are included in the line, “Contract costs and estimated earnings” in note 16.
Further information is provided in note 1. ASSET IMPAIRMENT assessment involves various estimates and assumptions as follows: INVESTMENTS. We regularly review investment securities for impairment based on both quantitative and qualitative criteria thatinclude the extent to which cost exceeds market value, the duration of that market decline, our intent and ability to hold to maturity oruntil forecasted recovery, and the financial health of and specific prospects for the issuer. We perform comprehensive market researchand analysis and monitor market conditions to identify potential impairments.
At December 31, 2007, our investment in preferred and common stock, $0.3 billion and $0.1 billion, respectively, of FGICCorporation (FGIC), a monoline credit insurer, was accounted for on the cost method and was in an insignificant unrealized lossposition. See note 16. During 2008, credit rating agencies downgraded FGIC; following the downgrades, various alternative outcomeswere possible. We continue to monitor this investment closely, including review for impairment.
Further information about actual and potential impairment losses is provided in the Financial Resources and Liquidity −
Investment Securities section and in notes 1, 9 and 16. LONG-LIVED ASSETS. We review long-lived assets for impairment whenever events or changes in circumstances indicate that therelated carrying amounts may not be recoverable. Determining whether an impairment has occurred typically requires variousestimates and assumptions, including determining which undiscounted cash flows are directly related to the potentially impaired asset,the useful life over which cash flows will occur, their amount, and the asset’s residual value, if any. In turn, measurement of animpairment loss requires a determination of fair value, which is based on the best information available. We derive the requiredundiscounted cash flow estimates from our historical experience and our internal business plans. To determine fair value, we use ourinternal cash flow estimates discounted at an appropriate interest rate, quoted market prices when available and independentappraisals, as appropriate.
(32)
Source: GENERAL ELECTRIC CO, 8-K, October 08, 2008
Commercial aircraft are a significant concentration of assets in Capital Finance, and are particularly subject to marketfluctuations. Therefore, we test recoverability of each aircraft in our operating lease portfolio at least annually. Additionally, weperform quarterly evaluations in circumstances such as when aircraft are re-leased, current lease terms have changed or a specificlessee’s credit standing changes. We consider market conditions, such as the continued global shortage of commercial aircraft.Estimates of future rentals and residual values are based on historical experience and information received routinely from independentappraisers. Estimated cash flows from future leases are reduced for expected downtime between leases and for estimated technicalcosts required to prepare aircraft to be redeployed. Fair value used to measure impairment is based on current market values fromindependent appraisers.
We recognized impairment losses on our operating lease portfolio of commercial aircraft of $0.1 billion in 2007 and 2006.Provisions for losses on financing receivables related to commercial aircraft were insignificant in 2007 and 2006.
Further information on impairment losses and our exposure to the commercial aviation industry is provided in the Operations− Overview section and in notes 14 and 28. REAL ESTATE. We review our real estate investment portfolio for impairment regularly or when events or circumstances indicatethat the related carrying amounts may not be recoverable. Our portfolio is diversified, both geographically and by asset type.However, the global real estate market is subject to periodic cycles that can cause significant fluctuations in market values. While thecurrent estimated value of our Capital Finance Real Estate investments exceeds our carrying value by about $3 billion, the same as lastyear, downward cycles could adversely affect our ability to realize these gains in an orderly fashion in the future and may necessitaterecording impairments. GOODWILL AND OTHER IDENTIFIED INTANGIBLE ASSETS. We test goodwill for impairment annually and wheneverevents or circumstances make it more likely than not that an impairment may have occurred, such as a significant adverse change inthe business climate or a decision to sell or dispose all or a portion of a reporting unit. Determining whether an impairment hasoccurred requires valuation of the respective reporting unit, which we estimate using a discounted cash flow method. For financialservices reporting units, these cash flows are reduced for estimated interest costs. Also, when determining the amount of goodwill tobe allocated to a business disposition for a financial services business, we reduce the cash proceeds we receive from the sale by theamount of debt which is allocated to the sold business in order to be consistent with the reporting unit valuation methodology. Whenavailable and as appropriate, we use comparative market multiples to corroborate discounted cash flow results. In applying thismethodology, we rely on a number of factors, including actual operating results, future business plans, economic projections andmarket data.
If this analysis indicates goodwill is impaired, measuring the impairment requires a fair value estimate of each identifiedtangible and intangible asset. In this case, we supplement the cash flow approach discussed above with independent appraisals, asappropriate.
(33)
Source: GENERAL ELECTRIC CO, 8-K, October 08, 2008

We test other identified intangible assets with defined useful lives and subject to amortization by comparing the carryingamount to the sum of undiscounted cash flows expected to be generated by the asset. We test intangible assets with indefinite livesannually for impairment using a fair value method such as discounted cash flows. For our insurance activities remaining in continuingoperations, we periodically test for impairment our deferred acquisition costs and present value of future profits.
Further information is provided in the Financial Resources and Liquidity − Goodwill and Other Intangible Assets section andin notes 1 and 15. PENSION ASSUMPTIONS are significant inputs to the actuarial models that measure pension benefit obligations and related effectson operations. Two assumptions − discount rate and expected return on assets − are important elements of plan expense andasset/liability measurement. We evaluate these critical assumptions at least annually on a plan and country-specific basis. Weperiodically evaluate other assumptions involving demographic factors, such as retirement age, mortality and turnover, and updatethem to reflect our experience and expectations for the future. Actual results in any given year will often differ from actuarialassumptions because of economic and other factors.
Accumulated and projected benefit obligations are expressed as the present value of future cash payments. We discount thosecash payments using the weighted average of market-observed yields for high quality fixed income securities with maturities thatcorrespond to the payment of benefits. Lower discount rates increase present values and subsequent-year pension expense; higherdiscount rates decrease present values and subsequent-year pension expense.
Our discount rates for principal pension plans at December 31, 2007, 2006 and 2005 were 6.34%, 5.75% and 5.50%,respectively, reflecting market interest rates.
To determine the expected long-term rate of return on pension plan assets, we consider the current and expected assetallocations, as well as historical and expected returns on various categories of plan assets. Assets in our principal pension plans earned13.6% in 2007, and had average annual earnings of 14.9%, 9.2% and 12.2% per year in the five-, 10- and 25-year periods endedDecember 31, 2007, respectively. We believe that these results, in connection with our current and expected asset allocations, supportour assumed long-term return of 8.5% on those assets.
At December 31, 2007, our principal pension plans had $1.0 billion of exposure to subprime credit, a majority of whichrelated to residential mortgage-backed securities receiving credit ratings of Double A or better from the major rating agencies.Monolines insured $0.5 billion, including $0.1 billion of residential mortgage-backed securities. Our subprime investment securitieswere collateralized primarily by pools of individual, direct mortgage loans, not other structured products such as collateralized debtobligations.
(34)
Source: GENERAL ELECTRIC CO, 8-K, October 08, 2008

Sensitivity to changes in key assumptions for our principal pension plans follows.
• Discount rate − A 25 basis point increase in discount rate would decrease pension cost in the following year by $0.2 billion.
• Expected return on assets − A 50 basis point increase in the expected return on assets would decrease pension cost in thefollowing year by $0.3 billion.
Further information on our pension plans is provided in the Operations − Overview section and in note 6. INCOME TAXES. Our annual tax rate is based on our income, statutory tax rates and tax planning opportunities available to us inthe various jurisdictions in which we operate. Tax laws are complex and subject to different interpretations by the taxpayer andrespective governmental taxing authorities. Significant judgment is required in determining our tax expense and in evaluating our taxpositions including evaluating uncertainties under Financial Accounting Standards Board Interpretation (FIN) 48, Accounting forUncertainty in Income Taxes. We review our tax positions quarterly and adjust the balances as new information becomes available.Deferred income tax assets represent amounts available to reduce income taxes payable on taxable income in future years. Such assetsarise because of temporary differences between the financial reporting and tax bases of assets and liabilities, as well as from netoperating loss and tax credit carryforwards. We evaluate the recoverability of these future tax deductions by assessing the adequacy offuture expected taxable income from all sources, including reversal of taxable temporary differences, forecasted operating earningsand available tax planning strategies. These sources of income inherently rely heavily on estimates.
We use our historical experience and our short and long-range business forecasts to provide insight. Further, our global anddiversified business portfolio gives us the opportunity to employ various prudent and feasible tax planning strategies to facilitate therecoverability of future deductions. Amounts recorded for deferred tax assets related to non-U.S. net operating losses, net of valuationallowance were $1.7 billion and $1.4 billion at December 31, 2007 and 2006, respectively. Such year-end 2007 amounts are expectedto be fully recoverable within the applicable statutory expiration periods. To the extent we do not consider it more likely than not thata deferred tax asset will be recovered, a valuation allowance is established.
Further information on income taxes is provided in the Operations − Overview section and in notes 7 and 20. DERIVATIVES AND HEDGING. We use derivatives to manage a variety of risks, including risks related to interest rates, foreignexchange and commodity prices. Accounting for derivatives as hedges requires that, at inception and over the term of the arrangement,the hedged item and related derivative meet the requirements for hedge accounting. The rules and interpretations related to derivativesaccounting are complex. Failure to apply this complex guidance correctly will result in all changes in the fair value of the derivativebeing reported in earnings, without regard to the offsetting changes in the fair value of the hedged item.
(35)
Source: GENERAL ELECTRIC CO, 8-K, October 08, 2008

In evaluating whether a particular relationship qualifies for hedge accounting, we first determine whether the relationshipmeets the strict criteria to qualify for exemption from ongoing effectiveness testing. For a relationship that does not meet these criteria,we test effectiveness at inception and quarterly thereafter by determining whether changes in the fair value of the derivative offset,within a specified range, changes in the fair value of the hedged item. This test is conducted each reporting period. If fair valuechanges fail this test, we discontinue applying hedge accounting to that relationship prospectively. Fair values of both the derivativeinstrument and the hedged item are calculated using internal valuation models incorporating market-based assumptions, subject tothird-party confirmation.
At December 31, 2007, derivative assets and liabilities were $3.6 billion and $2.6 billion, respectively. Further informationabout our use of derivatives is provided in notes 17, 22 and 26. OTHER LOSS CONTINGENCIES are recorded as liabilities when it is probable that a liability has been incurred and the amount ofthe loss is reasonably estimable. Disclosure is required when there is a reasonable possibility that the ultimate loss will materiallyexceed the recorded provision. Contingent liabilities are often resolved over long time periods. Estimating probable losses requiresanalysis of multiple forecasts that often depend on judgments about potential actions by third parties such as regulators.
Further information is provided in notes 19 and 28. Other Information New Accounting Standards On September 15, 2006, the Financial Accounting Standards Board (FASB) issued Statement of Financial Accounting Standards(SFAS) 157, Fair Value Measurements, which defines fair value, establishes a new framework for measuring that value and expandsdisclosures about fair value measurements. Broadly, SFAS 157 defines fair value as the exchange price that would be received for anasset or paid to transfer a liability (an exit price) in the principal or most advantageous market for the asset or liability in an orderlytransaction between market participants on the measurement date. SFAS 157 established market or observable inputs as the preferredsource of values, followed by assumptions based on hypothetical transactions in the absence of market inputs. SFAS 157 will require,among other things, expanded disclosure about fair value measurements that have a significant portion of the value determined usingunobservable inputs (level 3 measurements). The standard applies prospectively to new fair value measurements performed after therequired effective dates, which are as follows: on January 1, 2008, the standard applied to our measurements of the fair values offinancial instruments and recurring fair value measurements of non-financial assets and liabilities; on January 1, 2009, the standardwill apply to all remaining fair value measurements, including non-recurring measurements of non-financial assets and liabilities suchas measurement of potential impairments of goodwill, other intangible assets and other long-lived assets. It also will apply to fairvalue measurements of non-financial assets acquired and liabilities assumed in business combinations. On January 18, 2008, theFASB issued proposed FASB Staff Position (FSP) FAS 157-c, Measuring Liabilities under Statement 157, which will modify thedefinition of fair value by requiring estimation of the proceeds that would be received if the entity were to issue the liability at themeasurement date. Further revisions to the measurement guidance are possible and we are monitoring emerging interpretations anddevelopments. SFAS 157 will not have a material effect on our earnings or financial position and will have no effect on our cashflows.
(36)
Source: GENERAL ELECTRIC CO, 8-K, October 08, 2008

On February 15, 2007, the FASB issued SFAS 159, The Fair Value Option for Financial Assets and Financial Liabilities.Under this standard, we may elect to report individual financial instruments and certain other items at fair value with changes in valuereported in operations. Once made, this election is irrevocable for those items. SFAS 159 was effective for us on January 1, 2008, andwe made the election for $0.2 billion of assets.
On December 4, 2007, the FASB issued SFAS 141R, Business Combinations, which we will adopt on January 1, 2009. Thisstandard will significantly change the accounting for business acquisitions both during the period of the acquisition and in subsequentperiods. Among the more significant changes in the accounting for acquisitions are the following:
• Transaction costs will generally be expensed. Certain such costs are presently treated as costs of the acquisition.
• In-process research and development (IPR&D) will be accounted for as an asset, with the cost recognized as the research anddevelopment is realized or abandoned. IPR&D is presently expensed at the time of the acquisition.
• Contingencies, including contingent consideration, will generally be recorded at fair value with subsequent adjustments
recognized in operations. Contingent consideration is presently accounted for as an adjustment of purchase price.
• Decreases in valuation allowances on acquired deferred tax assets will be recognized in operations. Such changes previouslywere considered to be subsequent changes in consideration and were recorded as decreases in goodwill.
Generally, the effects of SFAS 141R will depend on future acquisitions.
On December 4, 2007, the FASB issued SFAS 160, Noncontrolling Interests in Consolidated Financial Statements, anamendment of ARB No. 51, which we will adopt on January1, 2009. This standard will significantly change the accounting andreporting related to noncontrolling interests in a consolidated subsidiary. After adoption, noncontrolling interests ($8.0 billion and $7.5billion at December 31, 2007 and 2006, respectively) will be classified as shareowners’ equity, a change from its current classificationbetween liabilities and shareowners’ equity. Earnings attributable to minority interests ($0.9 billion in each of the most recent threeyears) will be included in net earnings, although such earnings will continue to be deducted to measure earnings per share. Purchasesand sales of minority interests will be reported in equity, deferring, perhaps permanently, our recognition of the economic gain or losson partial dispositions. Gains on sales of minority interests that would not have been in net earnings under SFAS 160 amounted to$1.3 billion and $0.3 billion in 2007 and 2006, respectively. Selected Financial Data The facing page is divided into three sections: upper portion − consolidated data; middle portion − GE data that reflect variousconventional measurements for such enterprises; and lower portion − GECS data that reflect key information pertinent to financialservices businesses. GE’S TOTAL RESEARCH AND DEVELOPMENT expenditures were $4.1 billion in 2007, compared with $3.5 billion and $3.2billion in 2006 and 2005, respectively. In 2007, expenditures from GE’s own funds were $3.0 billion compared with $2.8 billion in2006. Expenditures funded by customers (mainly the U.S. government) were $1.1 billion in 2007 and $0.7 billion in 2006.
(37)
Source: GENERAL ELECTRIC CO, 8-K, October 08, 2008

Expenditures reported above reflect the definition of research and development required by U.S. generally acceptedaccounting principles. For operating and management purposes, we consider amounts spent on product and services technology toinclude our reported research and development expenditures, but also amounts for improving our existing products and services, andthe productivity of our plant, equipment and processes. On this basis, our technology expenditures in 2007 were $5.5 billion. GE’S TOTAL BACKLOG of firm unfilled orders at the end of 2007 was $65.6 billion, an increase of 42% from year-end 2006,reflecting increased demand at Technology Infrastructure and Energy Infrastructure. Of the total backlog, $49.4 billion related toproducts, of which 64% was scheduled for delivery in 2008. Product services orders, included in this reported backlog for only thesucceeding 12 months, were $16.2 billion at the end of 2007. Orders constituting this backlog may be cancelled or deferred bycustomers, subject in certain cases to penalties. See the Segment Operations section for further information.
(38)
Source: GENERAL ELECTRIC CO, 8-K, October 08, 2008

Selected Financial Data (Dollars in millions; per-share amounts in dollars) 2007 2006 2005 2004 2003 GENERAL ELECTRIC COMPANY AND CONSOLIDATED AFFILIATES
Revenues $ 172,488 $ 151,568 $ 136,262 $ 123,814 $ 104,337 Earnings from continuing operations before accounting changes 22,457 19,344 17,279 15,591 13,172 Earnings (loss) from discontinued operations, net of taxes (249) 1,398 (559) 1,631 2,933 Earnings before accounting changes 22,208 20,742 16,720 17,222 16,105 Net earnings 22,208 20,742 16,720 17,222 15,518 Dividends declared 11,713 10,675 9,647 8,594 7,759 Return on average shareowners’ equity(a) 20.4% 19.8% 18.1% 18.8% 21.3%Per share
Earnings from continuing operations before accounting changes − diluted $ 2.20 $ 1.86 $ 1.63 $ 1.49 $ 1.31
Earnings (loss) from discontinued operations − diluted (0.02) 0.13 (0.05) 0.16 0.29 Earnings before accounting changes − diluted 2.17 2.00 1.57 1.65 1.60 Net earnings − diluted 2.17 2.00 1.57 1.65 1.54 Earnings from continuing operations before accounting
changes − basic 2.21 1.87 1.63 1.50 1.31 Earnings (loss) from discontinued operations − basic (0.02) 0.14 (0.05) 0.16 0.29 Earnings before accounting changes − basic 2.18 2.00 1.58 1.66 1.61 Net earnings − basic 2.18 2.00 1.58 1.66 1.55 Dividends declared 1.15 1.03 0.91 0.82 0.77 Stock price range 42.15-33.90 38.49-32.06 37.34-32.67 37.75-28.88 32.42-21.30 Year-end closing stock price 37.07 37.21 35.05 36.50 30.98
Total assets of continuing operations 786,794 674,966 588,821 578,560 481,876 Total assets 795,683 697,273 673,210 750,252 647,395 Long-term borrowings 319,013 260,749 212,167 207,784 170,188 Shares outstanding − average (in thousands) 10,182,083 10,359,320 10,569,805 10,399,629 10,018,587 Shareowner accounts − average 608,000 624,000 634,000 658,000 670,000 Employees at year end
United States 155,000 155,000 161,000 165,000 155,000 Other countries 172,000 164,000 155,000 142,000 150,000
Total employees 327,000 319,000 316,000(b) 307,000 305,000 GE DATA
Short-term borrowings $ 4,106 $ 2,076 $ 972 $ 3,252 $ 2,398 Long-term borrowings 11,656 9,043 8,986 7,561 8,289 Minority interest 6,503 5,544 5,308 7,236 663 Shareowners’ equity 115,559 111,509 108,633 110,181 78,873
Total capital invested $ 137,824 $ 128,172 $ 123,899 $ 128,230 $ 90,223 Return on average total capital invested(a) 18.9% 18.5% 16.7% 16.9% 19.0%Borrowings as a percentage of total capital invested(a) 11.4% 8.7% 8.0% 9.0% 11.8%Working capital(a) $ 5,186 $ 6,649 $ 7,266 $ 7,163 $ 4,211
GECS DATA Revenues $ 71,936 $ 61,351 $ 54,889 $ 50,320 $ 41,509 Earnings from continuing operations before accounting changes 12,417 10,219 8,929 7,614 5,766 Earnings (loss) from discontinued operations, net of taxes (2,116) 439 (1,352) 1,114 2,547 Earnings before accounting changes 10,301 10,658 7,577 8,728 8,313 Net earnings 10,301 10,658 7,577 8,728 7,974 Shareowner’s equity 57,676 54,097 50,812 54,379 45,790 Total borrowings 500,922 426,262 362,042 355,463 316,553 Ratio of debt to equity at GE Capital 8.10:1 7.52:1 7.09:1 6.45:1 6.62:1 Total assets $ 646,485 $ 565,258 $ 540,584 $ 618,614 $ 554,877
Transactions between GE and GECS have been eliminated from the consolidated information.(a) Indicates terms are defined in the Glossary.(b) Excludes employees of Genworth in 2005 as a result of the third quarter deconsolidation.
(39)
Source: GENERAL ELECTRIC CO, 8-K, October 08, 2008

Source: GENERAL ELECTRIC CO, 8-K, October 08, 2008

Item 8. Financial Statement and Supplementary Data
Report of Independent Registered Public Accounting Firm To Shareowners and Board of Directors of General Electric Company: We have audited the accompanying statement of financial position of General Electric Company and consolidated affiliates (“GE”) asof December 31, 2007 and 2006, and the related statements of earnings, changes in shareowners’ equity and cash flows for each of theyears in the three-year period ended December 31, 2007. We also have audited GE’s internal control over financial reporting as ofDecember 31, 2007, based on criteria established in Internal Control – Integrated Framework issued by the Committee of SponsoringOrganizations of the Treadway Commission (“COSO”). GE management is responsible for these consolidated financial statements,for maintaining effective internal control over financial reporting, and for its assessment of the effectiveness of internal control overfinancial reporting. Our responsibility is to express an opinion on these consolidated financial statements and an opinion on GE’sinternal control over financial reporting based on our audits.
We conducted our audits in accordance with the standards of the Public Company Accounting Oversight Board (UnitedStates). Those standards require that we plan and perform the audits to obtain reasonable assurance about whether the financialstatements are free of material misstatement and whether effective internal control over financial reporting was maintained in allmaterial respects. Our audits of the consolidated financial statements included examining, on a test basis, evidence supporting theamounts and disclosures in the financial statements, assessing the accounting principles used and significant estimates made bymanagement, and evaluating the overall financial statement presentation. Our audit of internal control over financial reportingincluded obtaining an understanding of internal control over financial reporting, assessing the risk that a material weakness exists, andtesting and evaluating the design and operating effectiveness of internal control based on the assessed risk. Our audits also includedperforming such other procedures as we considered necessary in the circumstances. We believe that our audits provide a reasonablebasis for our opinions.
A company’s internal control over financial reporting is a process designed to provide reasonable assurance regarding thereliability of financial reporting and the preparation of financial statements for external purposes in accordance with generallyaccepted accounting principles. A company’s internal control over financial reporting includes those policies and procedures that (1)pertain to the maintenance of records that, in reasonable detail, accurately and fairly reflect the transactions and dispositions of theassets of the company; (2) provide reasonable assurance that transactions are recorded as necessary to permit preparation of financialstatements in accordance with generally accepted accounting principles, and that receipts and expenditures of the company are beingmade only in accordance with authorizations of management and directors of the company; and (3) provide reasonable assuranceregarding prevention or timely detection of unauthorized acquisition, use, or disposition of the company’s assets that could have amaterial effect on the financial statements.
Because of its inherent limitations, internal control over financial reporting may not prevent or detect misstatements. Also,projections of any evaluation of effectiveness to future periods are subject to the risk that controls may become inadequate because ofchanges in conditions, or that the degree of compliance with the policies or procedures may deteriorate.
(40)
Source: GENERAL ELECTRIC CO, 8-K, October 08, 2008

In our opinion, the consolidated financial statements appearing on pages 42, 44, 45, 47, 49-117 and the Summary ofOperating Segments table on page 11 present fairly, in all material respects, the financial position of GE as of December 31, 2007 and2006, and the results of its operations and its cash flows for each of the years in the three-year period ended December 31, 2007, inconformity with accounting principles generally accepted in the United States of America. Also, in our opinion, GE maintained, in allmaterial respects, effective internal control over financial reporting as of December 31, 2007, based on criteria established in InternalControl – Integrated Framework issued by COSO.
As discussed in note 1 to the consolidated financial statements, GE, in 2007, changed its methods of accounting foruncertainty in income taxes and for a change or projected change in the timing of cash flows relating to income taxes generated byleveraged lease transactions, and, in 2006, changed its methods of accounting for pension and other postretirement benefits and forshare-based compensation.
Our audits of GE’s consolidated financial statements were made for the purpose of forming an opinion on the consolidatedfinancial statements taken as a whole. The accompanying consolidating information appearing on pages 43, 46 and 48 is presented forpurposes of additional analysis of the consolidated financial statements rather than to present the financial position, results ofoperations and cash flows of the individual entities. The consolidating information has been subjected to the auditing proceduresapplied in the audits of the consolidated financial statements and, in our opinion, is fairly stated in all material respects in relation tothe consolidated financial statements taken as a whole. /s/ KPMG LLP
KPMG LLP Stamford, Connecticut
February 20, 2008, except as to page 11 and notes 1, 2, 4, 5, 7, 8, 9, 10, 12, 13, 14, 15, 16, 17, 19, 20, 24, 25, 26, 27, 28, 29, and 30,which are as of October 1, 2008
(41)
Source: GENERAL ELECTRIC CO, 8-K, October 08, 2008

AUDITED FINANCIAL STATEMENTS Statement of Earnings
General Electric Companyand consolidated affiliates
For the years ended December 31 (In millions; per-share amounts in dollars) 2007 2006 2005 REVENUES
Sales of goods $ 60,670 $ 55,181 $ 50,727 Sales of services 38,856 36,329 32,839 Other income (note 3) 3,019 2,154 1,673 GECS earnings from continuing operations − − − GECS revenues from services (note 4) 69,943 57,904 51,023
Total revenues 172,488 151,568 136,262 COSTS AND EXPENSES (note 5)
Cost of goods sold 47,309 43,279 39,169 Cost of services sold 25,816 23,494 20,615 Interest and other financial charges 23,762 18,879 14,795 Investment contracts, insurance losses and insurance
annuity benefits 3,469 3,213 3,374 Provision for losses on financing receivables (note 13) 4,431 3,062 3,193 Other costs and expenses 40,173 35,491 33,092 Minority interest in net earnings of consolidated affiliates 916 862 916
Total costs and expenses 145,876 128,280 115,154 EARNINGS FROM CONTINUING OPERATIONS
BEFORE INCOME TAXES 26,612 23,288 21,108 Provision for income taxes (note 7) (4,155) (3,944) (3,829)EARNINGS FROM CONTINUING OPERATIONS 22,457 19,344 17,279 Earnings (loss) from discontinued operations, net of taxes (note 2) (249) 1,398 (559)NET EARNINGS $ 22,208 $ 20,742 $ 16,720
Per-share amounts (note 8) Per-share amounts − earnings from continuing operations
Diluted earnings per share $ 2.20 $ 1.86 $ 1.63 Basic earnings per share $ 2.21 $ 1.87 $ 1.63
Per-share amounts − net earnings Diluted earnings per share $ 2.17 $ 2.00 $ 1.57 Basic earnings per share $ 2.18 $ 2.00 $ 1.58
DIVIDENDS DECLARED PER SHARE $ 1.15 $ 1.03 $ 0.91
(42)
Source: GENERAL ELECTRIC CO, 8-K, October 08, 2008

Statement of Earnings (Continued) GE GECS For the years ended December 31(In millions; per-share amounts in dollars) 2007 2006 2005 2007 2006 2005 REVENUES
Sales of goods $ 60,374 $ 53,221 $ 48,268 $ 718 $ 2,384 $ 2,528 Sales of services 39,422 36,698 33,139 − − − Other income (note 3) 3,371 2,307 1,754 − − − GECS earnings from continuing operations 12,417 10,219 8,929 − − − GECS revenues from services (note 4) − − − 71,218 58,967 52,361
Total revenues 115,584 102,445 92,090 71,936 61,351 54,889 COSTS AND EXPENSES (note 5)
Cost of goods sold 47,103 41,501 36,869 628 2,204 2,369 Cost of services sold 26,382 23,863 20,915 − − − Interest and other financial charges 1,993 1,668 1,319 22,706 17,840 14,029 Investment contracts, insurance losses and insurance
annuity benefits − − − 3,647 3,419 3,574 Provision for losses on financing receivables (note 13) − − − 4,431 3,062 3,193 Other costs and expenses 14,148 12,893 12,316 26,537 22,977 21,442 Minority interest in net earnings of consolidated affiliates 707 624 714 209 238 202
Total costs and expenses 90,333 80,549 72,133 58,158 49,740 44,809 EARNINGS FROM CONTINUING OPERATIONS
BEFORE INCOME TAXES 25,251 21,896 19,957 13,778 11,611 10,080 Provision for income taxes (note 7) (2,794) (2,552) (2,678) (1,361) (1,392) (1,151)EARNINGS FROM CONTINUING OPERATIONS 22,457 19,344 17,279 12,417 10,219 8,929 Earnings (loss) from discontinued operations,
net of taxes (note 2) (249) 1,398 (559) (2,116) 439 (1,352)NET EARNINGS $ 22,208 $ 20,742 $ 16,720 $ 10,301 $ 10,658 $ 7,577
In the consolidating data on this page, “GE” means the basis of consolidation as described in note 1 to the consolidated financial statements; “GECS” means GeneralElectric Capital Services, Inc. and all of its affiliates and associated companies. Transactions between GE and GECS have been eliminated from the “General ElectricCompany and consolidated affiliates” columns on page 42.See accompanying notes.
(43)
Source: GENERAL ELECTRIC CO, 8-K, October 08, 2008

Consolidated Statement of Changes in Shareowners’ Equity (In millions) 2007 2006 2005 CHANGES IN SHAREOWNERS’ EQUITY (note 22) Balance at January 1 $ 111,509 $ 108,633 $ 110,181 Dividends and other transactions with shareowners (23,102) (17,983) (13,249)Changes other than transactions with shareowners
Investment securities − net (1,484) (223) (437)Currency translation adjustments − net 4,527 3,649 (4,318)Cash flow hedges − net (539) 223 (47)Benefit plans − net 2,566 287 (217)Total changes other than earnings 5,070 3,936 (5,019)Increases attributable to net earnings 22,208 20,742 16,720 Total changes other than transactions with shareowners 27,278 24,678 11,701
Cumulative effect of changes in accounting principles(a) (126) (3,819) − Balance at December 31 $ 115,559 $ 111,509 $ 108,633
(a) The effect of the 2006 accounting change was previously included in the caption “Benefit plans − net.”See accompanying notes.
(44)
Source: GENERAL ELECTRIC CO, 8-K, October 08, 2008
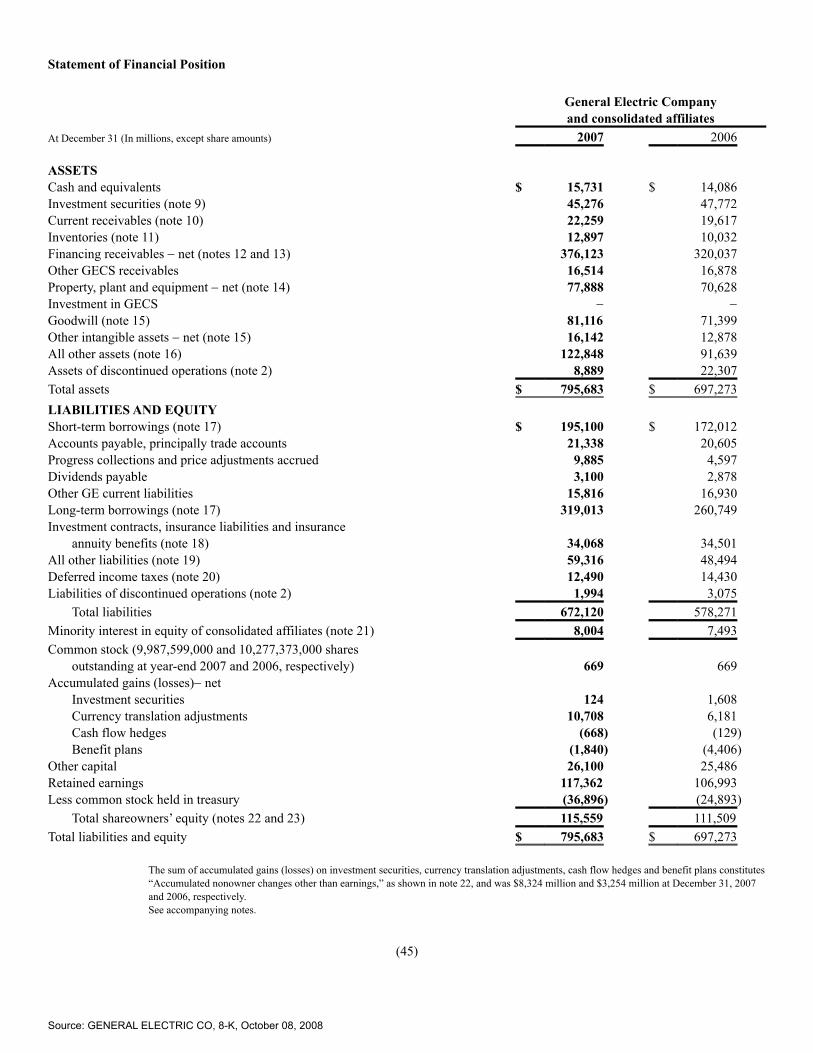
Statement of Financial Position
General Electric Companyand consolidated affiliates
At December 31 (In millions, except share amounts) 2007 2006 ASSETS Cash and equivalents $ 15,731 $ 14,086 Investment securities (note 9) 45,276 47,772 Current receivables (note 10) 22,259 19,617 Inventories (note 11) 12,897 10,032 Financing receivables − net (notes 12 and 13) 376,123 320,037 Other GECS receivables 16,514 16,878 Property, plant and equipment − net (note 14) 77,888 70,628 Investment in GECS − − Goodwill (note 15) 81,116 71,399 Other intangible assets − net (note 15) 16,142 12,878 All other assets (note 16) 122,848 91,639 Assets of discontinued operations (note 2) 8,889 22,307 Total assets $ 795,683 $ 697,273
LIABILITIES AND EQUITY Short-term borrowings (note 17) $ 195,100 $ 172,012 Accounts payable, principally trade accounts 21,338 20,605 Progress collections and price adjustments accrued 9,885 4,597 Dividends payable 3,100 2,878 Other GE current liabilities 15,816 16,930 Long-term borrowings (note 17) 319,013 260,749 Investment contracts, insurance liabilities and insurance
annuity benefits (note 18) 34,068 34,501 All other liabilities (note 19) 59,316 48,494 Deferred income taxes (note 20) 12,490 14,430 Liabilities of discontinued operations (note 2) 1,994 3,075
Total liabilities 672,120 578,271 Minority interest in equity of consolidated affiliates (note 21) 8,004 7,493 Common stock (9,987,599,000 and 10,277,373,000 shares
outstanding at year-end 2007 and 2006, respectively) 669 669 Accumulated gains (losses)− net
Investment securities 124 1,608 Currency translation adjustments 10,708 6,181 Cash flow hedges (668) (129)Benefit plans (1,840) (4,406)
Other capital 26,100 25,486 Retained earnings 117,362 106,993 Less common stock held in treasury (36,896) (24,893)
Total shareowners’ equity (notes 22 and 23) 115,559 111,509 Total liabilities and equity $ 795,683 $ 697,273
The sum of accumulated gains (losses) on investment securities, currency translation adjustments, cash flow hedges and benefit plans constitutes“Accumulated nonowner changes other than earnings,” as shown in note 22, and was $8,324 million and $3,254 million at December 31, 2007and 2006, respectively.
See accompanying notes.
(45)
Source: GENERAL ELECTRIC CO, 8-K, October 08, 2008

Statement of Financial Position (Continued) GE GECS At December 31 (In millions, except share amounts) 2007 2006 2007 2006 ASSETS Cash and equivalents $ 6,702 $ 4,480 $ 9,439 $ 12,439 Investment securities (note 9) 343 342 44,941 47,438 Current receivables (note 10) 15,093 13,766 − − Inventories (note 11) 12,834 9,978 63 54 Financing receivables − net (notes 12 and 13) − − 384,067 326,890 Other GECS receivables − − 22,078 21,665 Property, plant and equipment − net (note 14) 14,142 12,675 63,746 57,953 Investment in GECS 57,676 54,097 − − Goodwill (note 15) 55,689 48,645 25,427 22,754 Other intangible assets − net (note 15) 11,633 9,739 4,509 3,139 All other assets (note 16) 40,608 33,442 83,392 59,375 Assets of discontinued operations (note 2) 66 8,756 8,823 13,551 Total assets $ 214,786 $ 195,920 $ 646,485 $ 565,258
LIABILITIES AND EQUITY Short-term borrowings (note 17) $ 4,106 $ 2,076 $ 192,420 $ 173,312 Accounts payable, principally trade accounts 11,120 10,969 14,714 13,776 Progress collections and price adjustments accrued 10,374 5,248 − − Dividends payable 3,100 2,878 − − Other GE current liabilities 15,816 16,930 − − Long-term borrowings (note 17) 11,656 9,043 308,502 252,950 Investment contracts, insurance liabilities and insurance
annuity benefits (note 18) − − 34,359 34,807 All other liabilities (note 19) 32,859 27,944 26,522 20,661 Deferred income taxes (note 20) 3,391 1,540 9,099 12,890 Liabilities of discontinued operations (note 2) 302 2,239 1,692 816
Total liabilities 92,724 78,867 587,308 509,212 Minority interest in equity of consolidated affiliates (note 21) 6,503 5,544 1,501 1,949 Common stock (9,987,599,000 and 10,277,373,000 shares
outstanding at year-end 2007 and 2006, respectively) 669 669 1 1 Accumulated gains (losses) − net
Investment securities 124 1,608 110 1,594 Currency translation adjustments 10,708 6,181 7,472 4,837 Cash flow hedges (668) (129) (727) (171)Benefit plans (1,840) (4,406) (105) (278)
Other capital 26,100 25,486 12,574 12,537 Retained earnings 117,362 106,993 38,351 35,577 Less common stock held in treasury (36,896) (24,893) − −
Total shareowners’ equity (notes 22 and 23) 115,559 111,509 57,676 54,097 Total liabilities and equity $ 214,786 $ 195,920 $ 646,485 $ 565,258
In the consolidating data on this page, “GE” means the basis of consolidation as described in note 1 to the consolidated financial statements; “GECS” means GeneralElectric Capital Services, Inc. and all of its affiliates and associated companies. Transactions between GE and GECS have been eliminated from the “General ElectricCompany and consolidated affiliates” columns on page 45.
(46)
Source: GENERAL ELECTRIC CO, 8-K, October 08, 2008
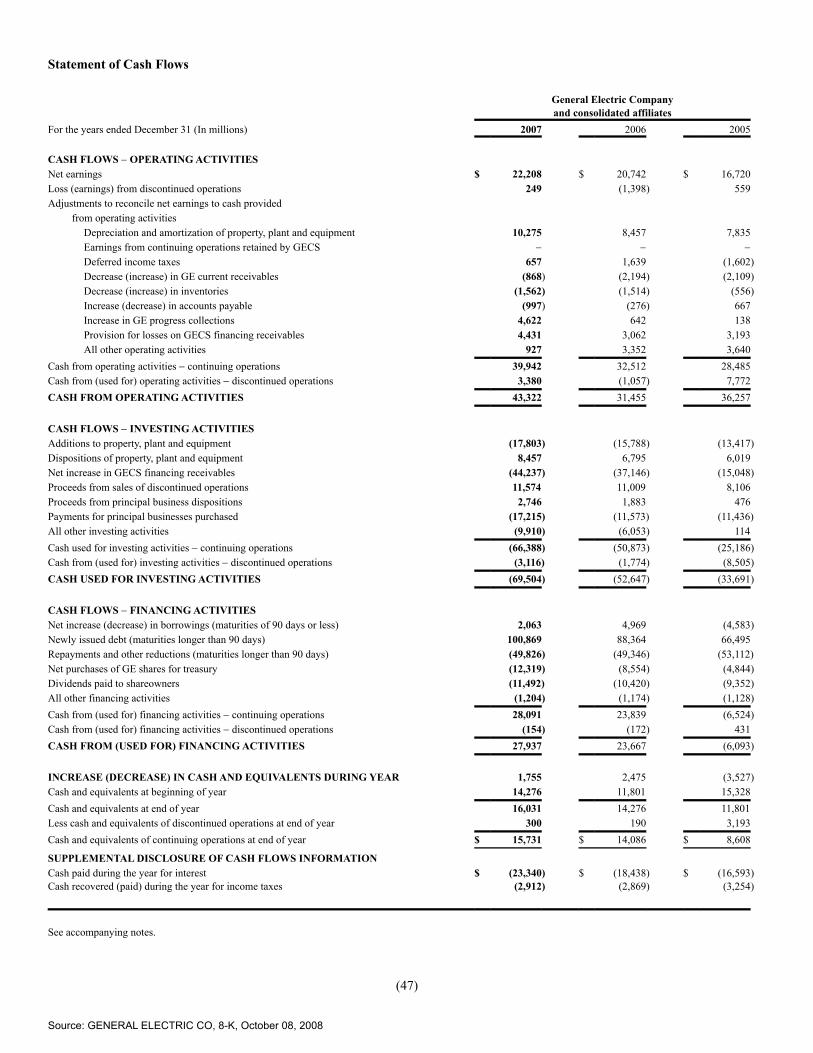
Statement of Cash Flows
General Electric Companyand consolidated affiliates
For the years ended December 31 (In millions) 2007 2006 2005 CASH FLOWS − OPERATING ACTIVITIES Net earnings $ 22,208 $ 20,742 $ 16,720 Loss (earnings) from discontinued operations 249 (1,398) 559 Adjustments to reconcile net earnings to cash provided
from operating activities Depreciation and amortization of property, plant and equipment 10,275 8,457 7,835 Earnings from continuing operations retained by GECS − − − Deferred income taxes 657 1,639 (1,602)Decrease (increase) in GE current receivables (868) (2,194) (2,109)Decrease (increase) in inventories (1,562) (1,514) (556)Increase (decrease) in accounts payable (997) (276) 667 Increase in GE progress collections 4,622 642 138 Provision for losses on GECS financing receivables 4,431 3,062 3,193 All other operating activities 927 3,352 3,640
Cash from operating activities − continuing operations 39,942 32,512 28,485 Cash from (used for) operating activities − discontinued operations 3,380 (1,057) 7,772 CASH FROM OPERATING ACTIVITIES 43,322 31,455 36,257 CASH FLOWS − INVESTING ACTIVITIES Additions to property, plant and equipment (17,803) (15,788) (13,417)Dispositions of property, plant and equipment 8,457 6,795 6,019 Net increase in GECS financing receivables (44,237) (37,146) (15,048)Proceeds from sales of discontinued operations 11,574 11,009 8,106 Proceeds from principal business dispositions 2,746 1,883 476 Payments for principal businesses purchased (17,215) (11,573) (11,436)All other investing activities (9,910) (6,053) 114 Cash used for investing activities − continuing operations (66,388) (50,873) (25,186)Cash from (used for) investing activities − discontinued operations (3,116) (1,774) (8,505)CASH USED FOR INVESTING ACTIVITIES (69,504) (52,647) (33,691)
CASH FLOWS − FINANCING ACTIVITIES Net increase (decrease) in borrowings (maturities of 90 days or less) 2,063 4,969 (4,583)Newly issued debt (maturities longer than 90 days) 100,869 88,364 66,495 Repayments and other reductions (maturities longer than 90 days) (49,826) (49,346) (53,112)Net purchases of GE shares for treasury (12,319) (8,554) (4,844)Dividends paid to shareowners (11,492) (10,420) (9,352)All other financing activities (1,204) (1,174) (1,128)Cash from (used for) financing activities − continuing operations 28,091 23,839 (6,524)Cash from (used for) financing activities − discontinued operations (154) (172) 431 CASH FROM (USED FOR) FINANCING ACTIVITIES 27,937 23,667 (6,093)
INCREASE (DECREASE) IN CASH AND EQUIVALENTS DURING YEAR 1,755 2,475 (3,527)Cash and equivalents at beginning of year 14,276 11,801 15,328 Cash and equivalents at end of year 16,031 14,276 11,801 Less cash and equivalents of discontinued operations at end of year 300 190 3,193 Cash and equivalents of continuing operations at end of year $ 15,731 $ 14,086 $ 8,608 SUPPLEMENTAL DISCLOSURE OF CASH FLOWS INFORMATION Cash paid during the year for interest $ (23,340) $ (18,438) $ (16,593)Cash recovered (paid) during the year for income taxes (2,912) (2,869) (3,254)
See accompanying notes.
(47)
Source: GENERAL ELECTRIC CO, 8-K, October 08, 2008
Statement of Cash Flows (Continued) GE GECS For the years ended December 31 (In millions) 2007 2006 2005 2007 2006 2005 CASH FLOWS − OPERATING ACTIVITIES Net earnings $ 22,208 $ 20,742 $ 16,720 $ 10,301 $ 10,658 $ 7,577 Loss (earnings) from discontinued operations 249 (1,398) 559 2,116 (439) 1,352 Adjustments to reconcile net earnings to cash
provided from operating activities Depreciation and amortization of property,
plant and equipment 2,149 1,953 1,845 8,126 6,504 5,990 Earnings from continuing operations retained by GECS (5,126) (372) (1,113) − − − Deferred income taxes 564 703 (119) 93 936 (1,483)Decrease (increase) in GE current receivables 14 760 (382) − − − Decrease (increase) in inventories (1,496) (1,458) (586) 2 (23) 30 Increase (decrease) in accounts payable (1,073) 289 798 485 (154) 348 Increase in GE progress collections 4,620 927 510 − − − Provision for losses on GECS financing receivables − − − 4,431 3,062 3,193 All other operating activities 1,192 1,626 1,577 (539) 1,035 1,843
Cash from operating activities − continuing operations 23,301 23,772 19,809 25,015 21,579 18,850 Cash from (used for) operating activities −
discontinued operations (857) 855 1,707 4,039 (2,041) 5,964 CASH FROM OPERATING ACTIVITIES 22,444 24,627 21,516 29,054 19,538 24,814 CASH FLOWS − INVESTING ACTIVITIES Additions to property, plant and equipment (2,968) (2,913) (2,132) (15,217) (13,168) (11,595)Dispositions of property, plant and equipment − − − 8,457 6,795 6,019 Net increase in GECS financing receivables − − − (44,164) (40,270) (16,743)Proceeds from sales of discontinued operations 10,826 1,987 − 117 9,022 8,106 Proceeds from principal business dispositions 1,047 1,497 267 1,699 386 209 Payments for principal businesses purchased (9,645) (4,274) (4,269) (7,570) (7,299) (7,167)All other investing activities (1,697) 100 1,519 (8,730) (5,995) (2,005)Cash used for investing activities − continuing operations (2,437) (3,603) (4,615) (65,408) (50,529) (23,176)Cash from (used for) investing activities −
discontinued operations 1,003 (914) (1,733) (3,921) (731) (6,671)CASH USED FOR INVESTING ACTIVITIES (1,434) (4,517) (6,348) (69,329) (51,260) (29,847)
CASH FLOWS − FINANCING ACTIVITIES Net increase (decrease) in borrowings (maturities of
90 days or less) (3,284) 1,233 (418) 3,397 6,470 (4,027)Newly issued debt (maturities longer than 90 days) 8,751 130 1,704 92,019 88,280 65,026 Repayments and other reductions (maturities longer
than 90 days) (298) (93) (3,424) (49,528) (49,253) (49,688)Net purchases of GE shares for treasury (12,319) (8,554) (4,844) − − − Dividends paid to shareowners (11,492) (10,420) (9,352) (7,291) (9,847) (7,816)All other financing activities − − − (1,204) (1,174) (1,128)Cash from (used for) financing activities −continuing operations (18,642) (17,704) (16,334) 37,393 34,476 2,367 Cash from (used for) financing activities −discontinued operations (146) 59 26 (8) (231) 405 CASH FROM (USED FOR) FINANCING ACTIVITIES (18,788) (17,645) (16,308) 37,385 34,245 2,772 INCREASE (DECREASE) IN CASH AND
EQUIVALENTS DURING YEAR 2,222 2,465 (1,140) (2,890) 2,523 (2,261)Cash and equivalents at beginning of year 4,480 2,015 3,155 12,629 10,106 12,367 Cash and equivalents at end of year 6,702 4,480 2,015 9,739 12,629 10,106 Less cash and equivalents of discontinued operations
at end of year − − − 300 190 3,193 Cash and equivalents of continuing operations at end of year $ 6,702 $ 4,480 $ 2,015 $ 9,439 $ 12,439 $ 6,913 SUPPLEMENTAL DISCLOSURE OF CASH
FLOWS INFORMATION Cash paid during the year for interest $ (1,466) $ (1,343) $ (1,075) $ (21,874) $ (17,095) $ (15,518)Cash recovered (paid) during the year for income taxes (4,036) (2,203) (1,829) 1,124 (666) (1,425)
Source: GENERAL ELECTRIC CO, 8-K, October 08, 2008

In the consolidating data on this page, “GE” means the basis of consolidation as described in note 1 to the consolidated financial statements; “GECS” means GeneralElectric Capital Services, Inc. and all of its affiliates and associated companies. Transactions between GE and GECS have been eliminated from the “General ElectricCompany and consolidated affiliates” columns on page 47.
(48)
Source: GENERAL ELECTRIC CO, 8-K, October 08, 2008
Notes to Consolidated Financial Statements NOTE 1 SUMMARY OF SIGNIFICANT ACCOUNTING POLICIES Accounting principles Our financial statements are prepared in conformity with U.S. generally accepted accounting principles (GAAP). Consolidation Our financial statements consolidate all of our affiliates − companies that we control and in which we hold a majority voting interest.Associated companies are companies that we do not control but over which we have significant influence, most often because we holda shareholder voting position of 20% to 50%. Results of associated companies are presented on a one-line basis. Investments in andadvances to associated companies are presented on a one-line basis in the caption “All other assets” in our Statement of FinancialPosition, net of allowance for losses that represents our best estimate of probable losses inherent in such assets. Financial statement presentation We have reclassified certain prior-year amounts to conform to the current year’s presentation.
Financial data and related measurements are presented in the following categories:
• GE This represents the adding together of all affiliates other than General Electric Capital Services, Inc. (GECS), whoseoperations are presented on a one-line basis.
• GECS This affiliate owns all of the common stock of General Electric Capital Corporation (GE Capital). GE Capital and its
respective affiliates are consolidated in the accompanying GECS columns and constitute the majority of its business.
• CONSOLIDATED This represents the adding together of GE and GECS, giving effect to the elimination of transactionsbetween GE and GECS.
• OPERATING SEGMENTS These comprise our five businesses, focused on the broad markets they serve: Technology
Infrastructure, Energy Infrastructure, Capital Finance, NBC Universal and Consumer & Industrial. Prior period informationhas been reclassified to be consistent with the current organization.
Unless otherwise indicated, information in these notes to consolidated financial statements relates to continuing operations. Certain ofour operations have been presented as discontinued. See note 2.
The effects of translating to U.S. dollars the financial statements of non-U.S. affiliates whose functional currency is the localcurrency are included in shareowners’ equity. Asset and liability accounts are translated at year-end exchange rates, while revenuesand expenses are translated at average rates for the respective periods.
Preparing financial statements in conformity with GAAP requires us to make estimates and assumptions that affect reportedamounts and related disclosures. Actual results could differ from those estimates.
(49)
Source: GENERAL ELECTRIC CO, 8-K, October 08, 2008

Sales of goods and services We record all sales of goods and services only when a firm sales agreement is in place, delivery has occurred or services have beenrendered and collectibility of the fixed or determinable sales price is reasonably assured. If customer acceptance of goods is notassured, we record sales only upon formal customer acceptance.
Sales of goods in the Consumer & Industrial segment typically do not include multiple product and/or services elements. Incontrast, sales of goods in the Technology Infrastructure and Energy Infrastructure segments sometimes include multiple components.In such agreements, the amount assigned to each component is based on the total price and the undelivered component’s objectivelydetermined fair value, determined from sources such as the separate selling price for that or a similar component or from competitorprices for similar components. If fair value of the undelivered component cannot be determined satisfactorily, we defer salesrecognition until it is delivered. When an undelivered performance obligation is inconsequential or perfunctory, we recognize sales onthe total contract and provide for the cost of the unperformed obligation.
Except as otherwise noted, we do not provide for anticipated losses before we record sales. We often sell consumer products,home videos and computer hardware and software products with a right of return. We use our accumulated experience to estimate andprovide for such returns when we record the sale. Except for goods sold under long-term agreements, we recognize sales of goodsunder the provisions of U.S. Securities and Exchange Commission Staff Accounting Bulletin 104, Revenue Recognition (SAB 104).Among other things, we recognize such sales when we have no risk of transit damage, a policy that in certain cases requires us todelay recognition of otherwise qualified sales until the goods have been physically delivered.
We account for revenue recognition on agreements for sales of goods and services under power generation unit and upratecontracts; nuclear fuel assemblies; larger oil drilling equipment projects; turbo-machinery unit contracts; military developmentcontracts; and long-term construction projects, including construction of information technology systems in our Healthcare business,under AICPA Statement of Position (SOP) 81-1, Accounting for Performance of Construction-Type and Certain Production-TypeContracts. Under SOP 81-1, we estimate total contract revenue net of price concessions as well as total contract costs. For goods soldunder power generation unit and uprate contracts, nuclear fuel assemblies, turbo-machinery unit contracts and military developmentcontracts, we recognize sales as we complete major contract-specified deliverables, most often when customers receive title to thegoods or accept the services as performed. For larger oil drilling equipment projects and long-term construction projects, we recognizesales based on our progress towards contract completion measured by actual costs incurred in relation to our estimate of total expectedcosts. We measure SOP 81-1 revenues by applying our contract-specific estimated margin rates to incurred costs. We routinely updateour estimates of future costs for agreements in process and report any cumulative effects of such adjustments in current operations.We provide for any loss that we expect to incur on these agreements when that loss is probable.
(50)
Source: GENERAL ELECTRIC CO, 8-K, October 08, 2008

We recognize revenue upon delivery for sales of aircraft engines, military propulsion equipment and related spare parts notsold under long-term product services agreements. Delivery of large and small commercial engines, non-U.S. military equipment andall related spare parts occurs on shipment; delivery of military propulsion equipment sold to the U.S. Government or agencies thereofoccurs upon receipt of a Material Inspection and Receiving Report, DD Form 250. Large commercial engines (CF6, CFM56, GE90,GEnx and GP7000) are complex aerospace equipment manufactured to customer order under a variety of sometimes-complex,long-term agreements. We measure sales of large commercial engines by applying our contract-specific estimated margin rates toincurred costs. We routinely update our estimates of future costs for large commercial engine agreements in process and report anycumulative effects of such adjustments in current operations. We measure revenue for small aircraft engines, military propulsionequipment and spare parts not subject to long-term product services agreements based on the specific contract on aspecifically-measured output basis, although no faster than ratably. We provide for any loss that we expect to incur on theseagreements when that loss is probable; consistent with industry practice, for commercial engines, we make such provision only if suchlosses are not recoverable from future highly probable sales of spare parts for those engines.
We sell product services under long-term agreements in our Technology Infrastructure and Energy Infrastructure segments,principally Aviation, Energy and Transportation, where costs of performing services are incurred on other than a straight-line basis.We also sell product services in Healthcare, where such costs are expected to be on a straight-line basis. All of these agreements areaccounted for under FASB Technical Bulletin (FTB) 90-1, Accounting for Separately Priced Extended Warranty and ProductMaintenance Contracts. For the Aviation, Energy and Transportation FTB 90-1 agreements, we recognize related sales based on theextent of our progress towards completion measured by actual costs incurred in relation to total expected costs. We routinely updateour estimates of future costs for agreements in process and report any cumulative effects of such adjustments in current operations.For the Healthcare FTB 90-1 agreements, we recognize revenues on a straight-line basis and expense related costs as incurred. Weprovide for any loss that we expect to incur on any of these agreements when that loss is probable.
NBC Universal records broadcast and cable television and Internet advertising sales when advertisements are aired, net ofprovision for any viewer shortfalls (make goods). We record sales from theatrical distribution of films as the films are exhibited; salesof home videos, net of a return provision, when the videos are delivered to and available for sale by retailers; fees from cable/satelliteoperators when services are provided; and licensing of film and television programming when we make the material available forairing. GECS revenues from services (earned income) We use the interest method to recognize income on all loans. Interest on loans includes origination, commitment and othernon-refundable fees related to funding (recorded in earned income on the interest method). We stop accruing interest at the earlier ofthe time at which collection of an account becomes doubtful or the account becomes 90 days past due. We recognize interest incomeon nonearning loans either as cash is collected or on a cost-recovery basis as conditions warrant. We resume accruing interest onnonearning, non-restructured commercial loans only when (a) payments are brought current according to the loan’s original terms and(b) future payments are reasonably assured. When we agree to restructured terms with the borrower, we resume accruing interest onlywhen reasonably assured that we will recover full contractual payments, and such loans pass underwriting reviews equivalent to thoseapplied to new loans. We resume accruing interest on nonearning consumer loans when the customer’s account is less than 90 dayspast due.
(51)
Source: GENERAL ELECTRIC CO, 8-K, October 08, 2008

We recognize financing lease income on the interest method to produce a level yield on funds not yet recovered. Estimatedunguaranteed residual values at the date of lease inception represent our initial estimates of the fair value of the leased assets at theexpiration of the lease and are based primarily on independent appraisals, which are updated periodically. Guarantees of residualvalues by unrelated third parties are considered part of minimum lease payments. Significant assumptions we use in estimatingresidual values include estimated net cash flows over the remaining lease term, anticipated results of future remarketing, and estimatedfuture component part and scrap metal prices, discounted at an appropriate rate.
We recognize operating lease income on a straight-line basis over the terms of underlying leases.
Fees include commitment fees related to loans that we do not expect to fund and line-of-credit fees. We record these fees inearned income on a straight-line basis over the period to which they relate. We record syndication fees in earned income at the timerelated services are performed, unless significant contingencies exist. Depreciation and amortization The cost of GE manufacturing plant and equipment is depreciated over its estimated economic life. U.S. assets are depreciated usingan accelerated method based on a sum-of-the-years digits formula; non-U.S. assets are depreciated on a straight-line basis.
The cost of GECS equipment leased to others on operating leases is amortized on a straight-line basis to estimated residualvalue over the lease term or over the estimated economic life of the equipment.
The cost of individually significant customer relationships is amortized in proportion to estimated total related sales; cost ofother intangible assets is amortized on a straight-line basis over the asset’s estimated economic life. We review long-lived assets forimpairment whenever events or changes in circumstances indicate that the related carrying amounts may not be recoverable. See notes14 and 15. NBC Universal film and television costs We defer film and television production costs, including direct costs, production overhead, development costs and interest. We do notdefer costs of exploitation, which principally comprise costs of film and television program marketing and distribution. We amortizedeferred film and television production costs, as well as associated participation and residual costs, on an individual production basisusing the ratio of the current period’s gross revenues to estimated total remaining gross revenues from all sources; we state such costsat the lower of amortized cost or fair value. Estimates of total revenues and costs are based on anticipated release patterns, publicacceptance and historical results for similar products. We defer the costs of acquired broadcast material, including rights to materialfor use on NBC Universal’s broadcast and cable/satellite television networks, at the earlier of acquisition or when the license periodbegins and the material is available for use. We amortize acquired broadcast material and rights when we broadcast the associatedprograms; we state such costs at the lower of amortized cost or net realizable value. Losses on financing receivables Our allowance for losses on financing receivables represents our best estimate of probable losses inherent in the portfolio. Our methodof calculating estimated losses depends on the size, type and risk characteristics of the related receivables. Write-offs are deductedfrom the allowance for losses and subsequent recoveries are added. Impaired financing receivables are written down to the extent thatwe judge principal to be uncollectible.
Source: GENERAL ELECTRIC CO, 8-K, October 08, 2008

(52)
Source: GENERAL ELECTRIC CO, 8-K, October 08, 2008

Our portfolio consists entirely of homogenous consumer loans and of commercial loans and leases. The underlyingassumptions, estimates and assessments we use to provide for losses are continually updated to reflect our view of current conditions.Changes in such estimates can significantly affect the allowance and provision for losses. It is possible to experience credit losses thatare different from our current estimates.
Our consumer loan portfolio consists of smaller balance, homogenous loans including card receivables, installment loans,auto loans and leases and residential mortgages. We collectively evaluate each portfolio for impairment. The allowance for losses onthese receivables is established through a process that estimates the probable losses inherent in the portfolio based upon statisticalanalyses of portfolio data. These analyses include migration analysis, in which historical delinquency and credit loss experience isapplied to the current aging of the portfolio, together with other analyses that reflect current trends and conditions. We also consideroverall portfolio indicators including nonearning loans, trends in loan volume and lending terms, credit policies and other observableenvironmental factors.
We write off unsecured closed-end installment loans at 120 days contractually past due and unsecured open-ended revolvingloans at 180 days contractually past due. We write down consumer loans secured by collateral other than residential real estate to thefair value of the collateral, less costs to sell, when such loans are 120 days past due. Consumer loans secured by residential real estate(both revolving and closed-end loans) are written down to the fair value of collateral, less costs to sell, no later than when they become360 days past due. During 2007, we conformed our reserving methodology in our residential mortgage loan portfolios. Unsecuredconsumer loans in bankruptcy are written off within 60 days of notification of filing by the bankruptcy court or within contractualwrite-off periods, whichever occurs earlier.
Our commercial loan and lease portfolio consists of a variety of loans and leases, including both larger balance,non-homogenous loans and leases and smaller balance homogenous commercial and equipment loans and leases. Losses on such loansand leases are recorded when probable and estimable. We routinely survey our entire portfolio for potential specific credit orcollection issues that might indicate an impairment. For larger balance, non-homogenous loans and leases, this survey first considersthe financial status, payment history, collateral value, industry conditions and guarantor support related to specific customers. Anydelinquencies or bankruptcies are indications of potential impairment requiring further assessment of collectibility. We routinelyreceive financial as well as rating agency reports on our customers, and we elevate for further attention those customers whoseoperations we judge to be marginal or deteriorating. We also elevate customers for further attention when we observe a decline incollateral values for asset-based loans. While collateral values are not always available, when we observe such a decline, we evaluaterelevant markets to assess recovery alternatives − for example, for real estate loans, relevant markets are local; for aircraft loans,relevant markets are global. We provide allowances based on our evaluation of all available information, including expected futurecash flows, fair value of collateral, net of disposal costs, and the secondary market value of the financing receivables. After providingfor specific incurred losses, we then determine an allowance for losses that have been incurred in the balance of the portfolio butcannot yet be identified to a specific loan or lease. This estimate is based on historical and projected default rates and loss severity,and it is prepared by each respective line of business.
Experience is not available with new products; therefore, while we are developing that experience, we set loss allowancesbased on our experience with the most closely analogous products in our portfolio.
When we repossess collateral in satisfaction of a loan, we write down the receivable against the allowance for losses.Repossessed collateral is included in the caption “All other assets” in the Statement of Financial Position and carried at the lower ofcost or estimated fair value less costs to sell.
(53)
Source: GENERAL ELECTRIC CO, 8-K, October 08, 2008

Source: GENERAL ELECTRIC CO, 8-K, October 08, 2008

The remainder of our commercial loans and leases are portfolios of smaller balance homogenous commercial and equipmentpositions that we evaluate collectively by portfolio for impairment based upon various statistical analyses considering historical lossesand aging. Partial sales of business interests We record gains or losses on sales of their own shares by affiliates except when realization of gains is not reasonably assured, inwhich case we record the results in shareowners’ equity. We record gains or losses on sales of interests in commercial and militaryengine and turbo-machinery equipment programs. Cash and equivalents Debt securities with original maturities of three months or less are included in cash equivalents unless designated as available-for-saleand classified as investment securities. Investment securities We report investments in debt and marketable equity securities, and equity securities in our insurance portfolio, at fair value based onquoted market prices or, if quoted prices are not available, discounted expected cash flows using market rates commensurate with thecredit quality and maturity of the investment. Unrealized gains and losses on available-for-sale investment securities are included inshareowners’ equity, net of applicable taxes and other adjustments. We regularly review investment securities for impairment basedon both quantitative and qualitative criteria that include the extent to which cost exceeds market value, the duration of that marketdecline, our intent and ability to hold to maturity or until forecasted recovery, and the financial health of and specific prospects for theissuer. Unrealized losses that are other than temporary are recognized in earnings. Realized gains and losses are accounted for on thespecific identification method. Unrealized gains and losses on investment securities classified as trading and certain retained interestsare included in earnings. Inventories All inventories are stated at the lower of cost or realizable values. Cost for a significant portion of GE U.S. inventories is determinedon a last-in, first-out (LIFO) basis. Cost of other GE inventories is determined on a first-in, first-out (FIFO) basis. LIFO was used for56% and 49% of GE inventories at December 31, 2007 and 2006, respectively. GECS inventories consist of finished products held forsale; cost is determined on a FIFO basis. Intangible assets We do not amortize goodwill, but test it annually for impairment using a fair value approach at the reporting unit level. A reportingunit is the operating segment, or a business one level below that operating segment (the component level) if discrete financialinformation is prepared and regularly reviewed by segment management. However, components are aggregated as a single reportingunit if they have similar economic characteristics. We recognize an impairment charge for any amount by which the carrying amountof a reporting unit’s goodwill exceeds its fair value. We use discounted cash flows to establish fair values. When available and asappropriate, we use comparative market multiples to corroborate discounted cash flow results. When all or a portion of a reporting unitis disposed of, goodwill is allocated to the gain or loss on disposition using the relative fair value method.
(54)
Source: GENERAL ELECTRIC CO, 8-K, October 08, 2008

Source: GENERAL ELECTRIC CO, 8-K, October 08, 2008

We amortize the cost of other intangibles over their estimated useful lives unless such lives are deemed indefinite. The costof intangible assets is amortized on a straight-line basis over the asset’s estimated economic life, except that individually significantcustomer-related intangible assets are amortized in relation to total related sales. Amortizable intangible assets are tested forimpairment based on undiscounted cash flows and, if impaired, written down to fair value based on either discounted cash flows orappraised values. Intangible assets with indefinite lives are tested annually for impairment and written down to fair value as required. GECS investment contracts, insurance liabilities and insurance annuity benefits Certain entities, which we consolidate, provide guaranteed investment contracts to states, municipalities and municipal authorities.
Our insurance activities also include providing insurance and reinsurance for life and health risks and providing certainannuity products. Three product groups are provided: traditional insurance contracts, investment contracts and universal life insurancecontracts. Insurance contracts are contracts with significant mortality and/or morbidity risks, while investment contracts are contractswithout such risks. Universal life insurance contracts are a particular type of long-duration insurance contract whose terms are notfixed and guaranteed.
For short-duration insurance contracts, including accident and health insurance, we report premiums as earned income overthe terms of the related agreements, generally on a pro-rata basis. For traditional long-duration insurance contracts including term,whole life and annuities payable for the life of the annuitant, we report premiums as earned income when due.
Premiums received on investment contracts (including annuities without significant mortality risk) and universal lifecontracts are not reported as revenues but rather as deposit liabilities. We recognize revenues for charges and assessments on thesecontracts, mostly for mortality, contract initiation, administration and surrender. Amounts credited to policyholder accounts arecharged to expense.
Liabilities for traditional long-duration insurance contracts represent the present value of such benefits less the present valueof future net premiums based on mortality, morbidity, interest and other assumptions at the time the policies were issued or acquired.Liabilities for investment contracts and universal life policies equal the account value, that is, the amount that accrues to the benefit ofthe contract or policyholder including credited interest and assessments through the financial statement date.
Liabilities for unpaid claims and claims adjustment expenses represent our best estimate of the ultimate obligations forreported and incurred-but-not-reported claims and the related estimated claim settlement expenses. Liabilities for unpaid claims andclaims adjustment expenses are continually reviewed and adjusted through current operations.
(55)
Source: GENERAL ELECTRIC CO, 8-K, October 08, 2008

Accounting changes On January 1, 2007, we adopted FASB Interpretation (FIN) 48, Accounting for Uncertainty in Income Taxes, and FASB Staff Position(FSP) FAS 13-2, Accounting for a Change or Projected Change in the Timing of Cash Flows Relating to Income Taxes Generated bya Leveraged Lease Transaction. Among other things, FIN 48 requires application of a “more likely than not” threshold to therecognition and derecognition of tax positions. FSP FAS 13-2 requires recalculation of returns on leveraged leases when there is achange in the timing or projected timing of cash flows relating to income taxes associated with such leases. The January 1, 2007,transition reduced our retained earnings by $126 million, $49 million associated with FIN 48 and $77 million with FSP FAS 13-2. Ofthis total, $89 million was a decrease in goodwill and $77 million was a decrease in financing receivables − net, partially offset by a$40 million decrease in income tax liabilities.
On January 1, 2007, we adopted FASB Statement of Financial Accounting Standards (SFAS) 155, Accounting for CertainHybrid Financial Instruments. This statement amended SFAS 133, Accounting for Derivative Instruments and Hedging Activities, asamended, to include within its scope prepayment features in newly created or acquired retained interests related to securitizations.SFAS 155 changed the basis on which we recognize earnings on these retained interests from level yield to fair value. See notes 9 and27.
We adopted SFAS 123 (Revised 2004), Share-Based Payment (SFAS 123R) and related FSPs, effective January 1, 2006.Among other things, SFAS 123R requires expensing the fair value of stock options, a previously optional accounting method that weadopted voluntarily in 2002, and classification of excess tax benefits associated with share-based compensation deductions as cashfrom financing activities rather than cash from operating activities. We chose the modified prospective transition method, whichrequires that the new guidance be applied to the unvested portion of all outstanding stock option grants as of January 1, 2006, and tonew grants after that date. We further applied the alternative transition method provided in FSP FAS 123(R)-3, Transition ElectionRelated to Accounting for the Tax Effects of Share-Based Payment Awards. The transitional effects of SFAS 123R and related FSPsconsisted of a reduction in net earnings of $10 million for the year ended December 31, 2006, to expense the unvested portion ofoptions granted in 2001; and classification of $173 million related to excess tax benefits from share-based compensation deductions ascash from financing activities in our Statement of Cash Flows beginning in 2006, which previously would have been included in cashfrom operating activities.
SFAS 158, Employers’ Accounting for Defined Benefit Pension and Other Postretirement Plans, became effective for us asof December 31, 2006, and requires recognition of an asset or liability in the statement of financial position reflecting the fundedstatus of pension and other postretirement benefit plans such as retiree health and life, with current-year changes in the funded statusrecognized in shareowners’ equity. SFAS 158 did not change the existing criteria for measurement of periodic benefit costs, planassets or benefit obligations. The incremental effect of the initial adoption of SFAS 158 reduced our shareowners’ equity at December31, 2006, by $3,819 million. NOTE 2 DISCONTINUED OPERATIONS Discontinued operations is comprised of our Japanese personal loan business (Lake) and our Japanese mortgage and card businesses,excluding our minority ownership in GE Nissen Credit Co., Ltd. (GE Money Japan), our U.S. mortgage business (WMC), Plastics,Advanced Materials, GE Life, Genworth Financial, Inc. (Genworth) and most of GE Insurance Solutions Corporation (GE InsuranceSolutions) as discontinued operations. Associated results of operations, financial position and cash flows are separately reported for allperiods presented.
Source: GENERAL ELECTRIC CO, 8-K, October 08, 2008

(56)
Source: GENERAL ELECTRIC CO, 8-K, October 08, 2008

WMC In December 2007, we completed the sale of our U.S. mortgage business for $117 million in cash. In connection with the transaction,certain contractual obligations and potential liabilities related to previously sold loans were retained. We sold this business because ofcontinued pressures in the U.S. subprime mortgage industry. As a result, we recognized an after-tax loss of $62 million during 2007.WMC revenues from discontinued operations were ($1,424) million, $536 million and $607 million in 2007, 2006 and 2005,respectively. In total, WMC’s loss from discontinued operations, net of taxes, was $987 million in 2007, compared with earnings of$29 million and $122 million in 2006 and 2005, respectively. GE Money Japan In September 2007, we committed to a plan to sell Lake upon determining that, despite restructuring, Japanese regulatory limits forinterest charges on unsecured personal loans did not permit us to earn an acceptable return. In connection with this exit, we recordedan after-tax loss of $908 million in 2007, which represents the difference between the net book value of our Lake business and theprojected sale price. During the second quarter of 2008, we committed to sell GE Money Japan, resulting in the addition of ourJapanese mortgage and card businesses to discontinued operations. Subsequent to the end of the second quarter of 2008, we reachedan agreement to sell these businesses and completed the sale during the third quarter of 2008. In connection with this agreement, andprimarily related to our Japanese mortgage and card businesses, we recorded an incremental $233 million impairment loss in thesecond quarter of 2008. GE Money Japan revenues from discontinued operations were $1,307 million, $1,715 million and $2,055million in 2007, 2006 and 2005, respectively. In total, GE Money Japan’s loss from discontinued operations, net of taxes, was $1,220million in 2007, compared with earnings of $247 million and $476 million in 2006 and 2005, respectively. Plastics and Advanced Materials In August 2007, we completed the sale of our Plastics business to Saudi Basic Industries Corporation for $11,577 million in cash. Wesold this business because of its cyclicality, rising costs of natural gas and raw materials, and the decision to redeploy capital resourcesinto higher-growth businesses. Also, during the fourth quarter of 2006, we sold our Advanced Materials business. As a result of thesesales, we recognized after-tax gains of $1,578 million and $441 million during 2007 and 2006, respectively. Plastics and AdvancedMaterials revenues from discontinued operations were $4,286 million, $8,795 million and $8,882 million in 2007, 2006 and 2005,respectively. In total, GE Plastics and Advanced Materials earnings from discontinued operations, net of taxes, were $1,867 million,$959 million and $793 million in 2007, 2006 and 2005, respectively. GE Life In December 2006, we completed the sale of GE Life, our U.K.-based life insurance operation, to Swiss Reinsurance Company (SwissRe) for $910 million. As a result, we recognized after-tax losses of $3 million and $267 million during 2007 and 2006, respectively.GE Life revenues from discontinued operations were $2,096 million and $2,286 million in 2006 and 2005, respectively. In total, GELife losses from discontinued operations, net of taxes, were $3 million, $178 million and $28 million in 2007, 2006 and 2005,respectively.
(57)
Source: GENERAL ELECTRIC CO, 8-K, October 08, 2008

GE Insurance Solutions In June 2006, we completed the sale of the property and casualty insurance and reinsurance businesses and the European life andhealth operations of GE Insurance Solutions to Swiss Re for $9,297 million, including the assumption of $1,700 million of debt. Wereceived $5,359 million in cash and $2,238 million of newly issued Swiss Re common stock, representing a 9% interest in Swiss Re.As a result of the exit, we recognized earnings of $16 million in 2007, compared with losses of $134 million and $934 million in 2006and 2005, respectively. GE Insurance Solutions revenues from discontinued operations were $2,815 million and $7,451 million in2006 and 2005, respectively. In total, GE Insurance Solutions earnings from discontinued operations, net of taxes, were $15 millionand $148 million in 2007 and 2006, respectively, compared with a loss of $2,850 million in 2005. Genworth In March 2006, we completed the sale of our remaining 18% investment in Genworth through a secondary public offering of 71million shares of Class A Common Stock and direct sale to Genworth of 15 million shares of Genworth Class B Common Stock. As aresult of initial and secondary public offerings, we recognized after-tax gains of $85 million (primarily from a tax adjustment relatedto the 2004 initial public offering), $220 million and $552 million in 2007, 2006 and 2005, respectively. Genworth revenues fromdiscontinued operations were $5 million and $7,908 million in 2006 and 2005, respectively. In total, Genworth earnings fromdiscontinued operations, net of taxes, were $79 million, $193 million and $928 million in 2007, 2006 and 2005, respectively.
(58)
Source: GENERAL ELECTRIC CO, 8-K, October 08, 2008
Summarized financial information for discontinued GE industrial operations is shown below. (In millions) 2007 2006 2005 OPERATIONS Total revenues $ 4,286 $ 8,795 $ 8,882
Earnings from discontinued operations before income taxes $ 233 $ 577 $ 875 Income tax benefit (expense) 56 (59) (82)Earnings from discontinued operations before
disposal, net of taxes $ 289 $ 518 $ 793
DISPOSAL Gain on disposal before income taxes $ 2,362 $ 357 $ − Income tax benefit (expense) (784) 84 − Gain on disposal, net of taxes $ 1,578 $ 441 $ −
EARNINGS FROM DISCONTINUED OPERATIONS, NET OF TAXES $ 1,867 $ 959 $ 793
December 31 (In millions) 2007 2006 ASSETS Inventories $ − $ 1,447 Property, plant and equipment − net 9 4,063 Intangible assets − net − 2,081 Other 57 1,165 Assets of discontinued operations $ 66 $ 8,756
LIABILITIES Accounts payable, principally trade accounts $ − $ 944 Other GE current liabilities 146 594 Other 156 701 Liabilities of discontinued operations $ 302 $ 2,239
(59)
Source: GENERAL ELECTRIC CO, 8-K, October 08, 2008

Summarized financial information for discontinued GECS operations is shown below. (In millions) 2007 2006 2005 OPERATIONS Total revenues $ (117) $ 7,167 $ 20,307
Earnings (loss) from discontinued operations before income taxes $ (2,225) $ 641 $ (1,387)Income tax benefit (expense) 981 (21) 417 Earnings (loss) from discontinued operations before disposal,
net of taxes $ (1,244) $ 620 $ (970)DISPOSAL Gain (loss) on disposal before income taxes $ (1,510) $ (75) $ 629 Income tax benefit (expense) 638 (106) (1,011)Loss on disposal, net of taxes $ (872) $ (181) $ (382)EARNINGS (LOSS) FROM DISCONTINUED
OPERATIONS, NET OF TAXES $ (2,116) $ 439 $ (1,352)
December 31 (In millions) 2007 2006 ASSETS Cash and equivalents $ 300 $ 190 Financing receivables − net 6,675 7,342 All other assets 129 4,835 Other 1,719 1,184 Assets of discontinued operations $ 8,823 $ 13,551
LIABILITIES Liabilities of discontinued operations $ 1,692 $ 816
Assets and liabilities at December 31, 2007, were primarily at our GE Money Japan business. NOTE 3 OTHER INCOME (In millions) 2007 2006 2005 GE Sales of business interests(a) $ 1,541 $ 878 $ 576 Associated companies 671 437 312 Interest income from GECS 329 145 110 Marketable securities and bank deposits 282 272 89 Licensing and royalty income 255 220 224 Other items 293 355 443 3,371 2,307 1,754 ELIMINATIONS (352) (153) (81)Total $ 3,019 $ 2,154 $ 1,673
(a) Included gain on sale of a business interest to Hitachi of $900 million in 2007.
Source: GENERAL ELECTRIC CO, 8-K, October 08, 2008

(60)
Source: GENERAL ELECTRIC CO, 8-K, October 08, 2008

NOTE 4 GECS REVENUES FROM SERVICES (In millions) 2007 2006 2005 Interest on loans $ 23,824 $ 20,505 $ 17,780 Equipment leased to others 15,260 12,940 11,587 Fees 6,533 5,358 4,886 Investment income(a) 4,724 3,115 3,134 Financing leases 4,699 4,298 3,990 Real estate investments 4,669 3,138 1,919 Premiums earned by insurance activities 2,232 2,084 2,333 Associated companies 2,172 2,079 1,320 Gross securitization gains 1,804 1,187 1,049 Other items 5,301 4,263 4,363 Total $ 71,218 $ 58,967 $ 52,361
(a) Included gain on sale of Swiss Re common stock of $566 million in 2007.
NOTE 5 SUPPLEMENTAL COST INFORMATION Total expenditures for research and development were $4,075 million, $3,480 million and $3,235 million in 2007, 2006 and 2005,respectively. The portion we funded was $3,009 million in 2007, $2,790 million in 2006 and $2,551 million in 2005.
Rental expense under operating leases is shown below. (In millions) 2007 2006 2005 GE $ 929 $ 854 $ 862 GECS 1,013 922 911
At December 31, 2007, minimum rental commitments under noncancellable operating leases aggregated $2,647 million and $3,637million for GE and GECS, respectively. Amounts payable over the next five years follow. (In millions) 2008 2009 2010 2011 2012 GE $ 509 $ 478 $ 416 $ 384 $ 338 GECS 743 685 512 393 334
Payments under revenue sharing partnerships amounted to $1.9 billion, $1.4 billion and $1.2 billion in 2007, 2006 and 2005,respectively, and are included in cost of goods sold. GE’s selling, general and administrative expenses totaled $14,148 million in2007, $12,893 million in 2006 and $12,316 million in 2005.
(61)
Source: GENERAL ELECTRIC CO, 8-K, October 08, 2008

NOTE 6 POSTRETIREMENT BENEFIT PLANS Retiree Health and Life Benefits We sponsor a number of retiree health and life insurance benefit plans (retiree benefit plans). Principal retiree benefit plans arediscussed below; other such plans are not significant individually or in the aggregate. We use a December 31 measurement date forour plans. PRINCIPAL RETIREE BENEFIT PLANS provide health and life insurance benefits to certain employees who retire under the GEPension Plan with 10 or more years of service. Eligible retirees share in the cost of healthcare benefits. These plans coverapproximately 235,000 retirees and dependents. COST OF PRINCIPAL RETIREE BENEFIT PLANS (In millions) 2007 2006 2005 Expected return on plan assets $ (125) $ (127) $ (138)Service cost for benefits earned 286 229 243 Interest cost on benefit obligation 577 455 507 Prior service cost amortization 603 363 326 Net actuarial loss (gain) amortization (17) 64 70 Retiree benefit plans cost $ 1,324 $ 984 $ 1,008
ACTUARIAL ASSUMPTIONS are described below. The discount rates at December 31 measured the year-end benefit obligationsand the earnings effects for the subsequent year. December 31 2007 2006 2005 2004 Discount rate(a) 6.31% 5.75% 5.25% 5.75%Compensation increases 5.00 5.00 5.00 5.00 Expected return on assets 8.50 8.50 8.50 8.50 Initial healthcare trend rate(b) 9.10 9.20 10.00 10.30
(a) Weighted average discount rate of 6.05% was used for determination of costs in 2007.(b) For 2007, gradually declining to 6% for 2025 and thereafter.
To determine the expected long-term rate of return on retiree life plan assets, we consider the current and expected asset allocations, aswell as historical and expected returns on various categories of plan assets. We apply our expected rate of return to a market-relatedvalue of assets, which stabilizes variability in the amounts to which we apply that expected return.
We amortize experience gains and losses as well as the effects of changes in actuarial assumptions and plan provisions over aperiod no longer than the average future service of employees. FUNDING POLICY. We fund retiree health benefits on a pay-as-you-go basis. We expect to contribute approximately $700 millionin 2008 to fund such benefits. We fund retiree life insurance benefits at our discretion.
Source: GENERAL ELECTRIC CO, 8-K, October 08, 2008

(62)
Source: GENERAL ELECTRIC CO, 8-K, October 08, 2008

Changes in the accumulated postretirement benefit obligation for retiree benefit plans follow. ACCUMULATED POSTRETIREMENT BENEFIT OBLIGATION (APBO) (In millions) 2007 2006 Balance at January 1 $ 8,262 $ 9,084 Service cost for benefits earned 286 229 Interest cost on benefit obligation 577 455 Participant contributions 47 43 Plan amendments 4,257 − Actuarial loss (gain) 320 (707)Benefits paid(a) (796) (810)Other 30 (32)Balance at December 31(b) $ 12,983 $ 8,262
(a) Net of Medicare Part D subsidy of $73 million and $75 million in 2007 and 2006, respectively.(b) The APBO for the retiree health plans was $10,847 million and $6,001 million at year-end 2007 and 2006, respectively.
In July 2007, we approved new four-year labor agreements that were negotiated with and ratified by most of our U.S. unions. Theagreements amended our retiree health plans in several ways, including eliminating provisions limiting our future contributions,increasing participants’ lifetime maximum coverage, increasing participant contributions and co-pays, and improving various otherbenefits.
A one percentage point change in the assumed healthcare cost trend rate would have the following effects.
(in millions) 1%
increase 1%
decrease APBO at December 31, 2007 $ 1,157 $ (986)Service and interest cost in 2007 102 (85)
FAIR VALUE OF PLAN ASSETS (In millions) 2007 2006 Balance at January 1 $ 1,710 $ 1,619 Actual gain on plan assets 221 222 Employer contributions 622 636 Participant contributions 47 43 Benefits paid(a) (796) (810)Balance at December 31 $ 1,804 $ 1,710
(a) Net of Medicare Part D subsidy.
(63)
Source: GENERAL ELECTRIC CO, 8-K, October 08, 2008

PLAN ASSET ALLOCATION 2007 2006
December 31Target
allocation Actual
allocation Actual
allocation U.S. equity securities 30-45% 33% 40%Non-U.S. equity securities 15-25 20 21 Debt securities 20-38 31 30 Real estate 1-10 6 3 Private equities 1-11 5 3 Other 1-11 5 3
Plan fiduciaries set investment policies and strategies for the trust and oversee its investment allocation, which includes selectinginvestment managers and setting long-term strategic targets. Long-term strategic investment objectives include preserving the fundedstatus of the plan and balancing risk and return. Target allocation ranges are guidelines, not limitations, and occasionally planfiduciaries will approve allocations above or below a target range.
Trust assets invested in short-term securities must generally be invested in securities rated A1/P1 or better, except for 15% ofsuch securities that may be rated A2/P2. GE common stock represented 5.9% and 6.1% of trust assets at year-end 2007 and 2006,respectively, and is subject to a statutory limit at 10% of total trust assets. RETIREE BENEFIT ASSET (LIABILITY) December 31 (In millions) 2007 2006 Funded status(a) $ (11,179) $ (6,552)Liability recorded in the Statement of Financial Position
Retiree health plans Due within one year $ (675) $ (681)Due after one year (10,172) (5,320)
Retiree life plans (332) (551)Net liability recognized $ (11,179) $ (6,552)Amounts recorded in shareowners’ equity
Prior service cost $ 5,700 $ 2,046 Net actuarial loss 210 4
Total $ 5,910 $ 2,050
(a) Fair value of assets less APBO, as shown in the preceding tables.
In 2008, we estimate that we will amortize $675 million of prior service cost and $40 million of net actuarial loss from shareowners’equity into retiree benefit plans cost. Comparable amortized amounts in 2007 were $603 million cost and $17 million cost reduction,respectively.
(64)
Source: GENERAL ELECTRIC CO, 8-K, October 08, 2008

ESTIMATED FUTURE BENEFIT PAYMENTS
(In millions) 2008 2009 2010 2011 2012 2013-2017
Gross $ 935 $ 990 $ 1,050 $ 1,105 $ 1,115 $ 5,850 Expected Medicare
Part D subsidy 85 90 100 105 115 675 Net $ 850 $ 900 $ 950 $ 1,000 $ 1,000 $ 5,175
Pension Benefits We sponsor a number of pension plans. Principal pension plans, together with affiliate and certain other pension plans (other pensionplans) detailed in this note, represent about 99% of our total pension assets. We use a December 31 measurement date for our plans. PRINCIPAL PENSION PLANS are the GE Pension Plan and the GE Supplementary Pension Plan.
The GE Pension Plan provides benefits to certain U.S. employees based on the greater of a formula recognizing careerearnings or a formula recognizing length of service and final average earnings. Certain benefit provisions are subject to collectivebargaining.
The GE Supplementary Pension Plan is an unfunded plan providing supplementary retirement benefits primarily tohigher-level, longer-service U.S. employees. OTHER PENSION PLANS in 2007 included 29 U.S. and non-U.S. pension plans with pension assets or obligations greater than $50million. These defined benefit plans provide benefits to employees based on formulas recognizing length of service and earnings. PENSION PLAN PARTICIPANTS
December 31, 2007 Total
Principalpension
plans
Otherpension
plans Active employees 182,000 135,000 47,000 Vested former employees 234,000 195,000 39,000 Retirees and beneficiaries 235,000 210,000 25,000 Total 651,000 540,000 111,000
(65)
Source: GENERAL ELECTRIC CO, 8-K, October 08, 2008

COST OF PENSION PLANS Total Principal pension plans Other pension plans (In millions) 2007 2006 2005 2007 2006 2005 2007 2006 2005 Expected return on plan assets $ (4,459) $ (4,211) $ (4,242) $ (3,950) $ (3,811) $ (3,885) $ (509) $ (400) $ (357)Service cost for benefits earned 1,727 1,719 1,618 1,355 1,402 1,359 372 317 259 Interest cost on benefit obligation 2,885 2,685 2,609 2,416 2,304 2,248 469 381 361 Prior service cost amortization 247 258 262 241 253 256 6 5 6 Net actuarial loss amortization 856 893 480 693 729 351 163 164 129 Pension plans cost $ 1,256 $ 1,344 $ 727 $ 755 $ 877 $ 329 $ 501 $ 467 $ 398
ACTUARIAL ASSUMPTIONS are described below. The discount rates at December 31 measured the year-end benefit obligationsand the earnings effects for the subsequent year. Principal pension plans Other pension plans (weighted average) December 31 2007 2006 2005 2004 2007 2006 2005 2004 Discount rate 6.34% 5.75% 5.50% 5.75% 5.65% 4.97% 4.74% 5.28%Compensation increases 5.00 5.00 5.00 5.00 4.50 4.26 4.20 4.03 Expected return on assets 8.50 8.50 8.50 8.50 7.51 7.44 7.47 7.67
To determine the expected long-term rate of return on pension plan assets, we consider the current and expected asset allocations, aswell as historical and expected returns on various categories of plan assets. For the principal pension plans, we apply our expected rateof return to a market-related value of assets, which stabilizes variability in the amounts to which we apply that expected return.
We amortize experience gains and losses as well as the effects of changes in actuarial assumptions and plan provisions over aperiod no longer than the average future service of employees. FUNDING POLICY for the GE Pension Plan is to contribute amounts sufficient to meet minimum funding requirements as set forthin employee benefit and tax laws plus such additional amounts as we may determine to be appropriate. We have not madecontributions to the GE Pension Plan since 1987 and will not make any such contributions in 2008. In 2008, we expect to payapproximately $150 million for benefit payments under our GE Supplementary Pension Plan and administrative expenses of ourprincipal pension plans and expect to contribute approximately $505 million to other pension plans. In 2007, comparative amountswere $136 million and $730 million, respectively. BENEFIT OBLIGATIONS are described in the following tables. Accumulated and projected benefit obligations (ABO and PBO)represent the obligations of a pension plan for past service as of the measurement date. ABO is the present value of benefits earned todate with benefits computed based on current compensation levels. PBO is ABO increased to reflect expected future compensation.
(66)
Source: GENERAL ELECTRIC CO, 8-K, October 08, 2008

PROJECTED BENEFIT OBLIGATION Principal pension plans Other pension plans (In millions) 2007 2006 2007 2006 Balance at January 1 $ 43,293 $ 43,331 $ 9,034 $ 8,097 Service cost for benefits earned 1,355 1,402 372 317 Interest cost on benefit obligations 2,416 2,304 469 381 Participant contributions 173 162 43 37 Plan amendments 1,470 80 26 (18)Actuarial loss (gain)(a) (3,205) (1,514) (665) 27 Benefits paid (2,555) (2,472) (370) (287)Acquisitions (dispositions) − net − − (311) (40)Exchange rate adjustments − − 416 520 Balance at December 31(b) $ 42,947 $ 43,293 $ 9,014 $ 9,034
(a) Principally associated with discount rate changes.(b) The PBO for the GE Supplementary Pension Plan was $3,437 million and $3,554 million at year-end 2007 and 2006, respectively.
ACCUMULATED BENEFIT OBLIGATION December 31 (In millions) 2007 2006 GE Pension Plan $ 38,155 $ 38,137 GE Supplementary Pension Plan 2,292 2,314 Other pension plans 8,175 8,053
PLANS WITH ASSETS LESS THAN ABO December 31 (In millions) 2007 2006 Funded plans with assets less than ABO
Plan assets $ 3,639 $ 4,833 Accumulated benefit obligations 3,974 5,828 Projected benefit obligations 4,595 6,667
Unfunded plans(a) Accumulated benefit obligations 3,111 3,052 Projected benefit obligations 4,283 4,310
(a) Primarily related to the GE Supplementary Pension Plan.
(67)
Source: GENERAL ELECTRIC CO, 8-K, October 08, 2008

FAIR VALUE OF PLAN ASSETS Principal pension plans Other pension plans (In millions) 2007 2006 2007 2006 Balance at January 1 $ 54,758 $ 49,096 $ 6,435 $ 5,213 Actual gain on plan assets 7,188 7,851 614 679 Employer contributions 136 121 730 451 Participant contributions 173 162 43 37 Benefits paid (2,555) (2,472) (370) (287)Acquisitions (dispositions) − net − − (372) 2 Exchange rate adjustments − − 331 340 Balance at December 31 $ 59,700 $ 54,758 $ 7,411 $ 6,435
PLAN ASSET ALLOCATION Principal pension plans 2007 2006
December 31Target
allocation Actual
allocation Actual
allocation U.S. equity securities 30-45% 32% 38%Non-U.S. equity securities 15-25 20 21 Debt securities 15-32 24 22 Real estate 4-10 9 5 Private equities 5-11 9 7 Other 1-10 6 7
Plan fiduciaries of the GE Pension Plan set investment policies and strategies for the GE Pension Trust and oversee its investmentallocation, which includes selecting investment managers, commissioning periodic asset-liability studies and setting long-termstrategic targets. Long-term strategic investment objectives include preserving the funded status of the plan and balancing risk andreturn. Target allocation ranges are guidelines, not limitations, and occasionally plan fiduciaries will approve allocations above orbelow a target range.
GE Pension Trust assets are invested subject to the following additional guidelines:
• Short-term securities must generally be rated A1/P1 or better, except for 15% of such securities that may be rated A2/P2.
• Real estate investments may not exceed 25% of total assets.
• Investments in restricted securities that are not freely tradable may not exceed 20% of total assets (actual was 15% oftrust assets at December 31, 2007).
• GE stock is subject to a statutory limit at 10% of total trust assets (actual was 5.6% and 6.1% at the end of 2007 and 2006,
respectively).
(68)
Source: GENERAL ELECTRIC CO, 8-K, October 08, 2008

At December 31, 2007, GE Pension Trust assets included exposure to $975 million of subprime residential mortgage-backedsecurities. A majority of these assets have received credit ratings of Double A or better from the major rating agencies. Our subprimeinvestment securities were collateralized primarily by pools of individual, direct mortgage loans, not other structured products such ascollateralized debt obligations. Other pension plans (weighted average) 2007 2006
December 31Target
allocation Actual
allocation Actual
allocation Equity securities 65% 67% 67%Debt securities 28 25 26 Real estate 4 4 3 Other 3 4 4
PENSION ASSET (LIABILITY) Principal pension plans Other pension plans December 31 (In millions) 2007 2006 2007 2006 Funded status(a) $ 16,753 $ 11,465 $ (1,603) $ (2,599)Pension asset (liability) recorded in the
Statement of Financial Position Pension asset $ 20,190 $ 15,019 $ 258 $ 46 Unfunded liabilities
Due within one year(b) (111) (106) (54) (49)Due after one year(b) (3,326) (3,448) (1,807) (2,596)
Net amount recognized $ 16,753 $ 11,465 $ (1,603) $ (2,599)Amounts recorded in shareowners’ equity
Prior service cost $ 2,060 $ 831 $ 65 $ 15 Net actuarial loss (gain) (4,974) 2,162 654 1,704
Total $ (2,914) $ 2,993 $ 719 $ 1,719
(a) Fair value of assets less PBO, as shown in the preceding tables.(b) For principal pension plans, represents the GE Supplementary Pension Plan liability.
In 2008, we estimate that we will amortize $325 million of prior service cost and $225 million of net actuarial loss for the principalpension plans from shareowners’ equity into pension cost. For other pension plans, the estimated prior service cost and net actuarialloss to be amortized over the next fiscal year are $10 million and $70 million, respectively. Comparable amortized amounts in 2007,respectively, were $241 million and $693 million for principal pension plans and $6 million and $163 million for other pension plans.
(69)
Source: GENERAL ELECTRIC CO, 8-K, October 08, 2008

ESTIMATED FUTURE BENEFIT PAYMENTS
(In millions) 2008 2009 2010 2011 2012 2013-2017
Principal pension
plans $ 2,650 $ 2,700 $ 2,750 $ 2,850 $ 2,900 $ 15,600 Other pension plans 335 345 350 350 375 2,025
Postretirement Benefit Plans 2007 COST OF POSTRETIREMENT BENEFIT PLANS AND CHANGES IN EQUITY OTHER THAN TRANSACTIONSWITH SHAREOWNERS
(In millions)
Totalpostretirement
benefit plans
Retireebenefit
plans
Principalpension
plans
Otherpension
plans Cost of postretirement benefit plans $ 2,580 $ 1,324 $ 755 $ 501
Changes in equity other than transactions with shareowners
Net actuarial loss (gain) − current year $ (7,111) $ 189 $ (6,443) $ (857)Prior service cost− current year 5,753 4,257 1,470 26 Prior service cost amortization (850) (603) (241) (6)Net actuarial gain (loss) amortization (839) 17 (693) (163)
Total changes in equity other than transactions with shareowners (3,047) 3,860 (5,907) (1,000)
Cost of postretirement benefit plans and changes in equity other than transactions with
shareowners $ (467) $ 5,184 $ (5,152) $ (499)
NOTE 7 PROVISION FOR INCOME TAXES (In millions) 2007 2006 2005 GE Current tax expense $ 2,230 $ 1,849 $ 2,797 Deferred tax expense (benefit) from temporary differences 564 703 (119) 2,794 2,552 2,678 GECS Current tax expense 1,268 456 2,634 Deferred tax expense (benefit) from temporary differences 93 936 (1,483) 1,361 1,392 1,151 CONSOLIDATED Current tax expense 3,498 2,305 5,431 Deferred tax expense (benefit) from temporary differences 657 1,639 (1,602)Total $ 4,155 $ 3,944 $ 3,829
Source: GENERAL ELECTRIC CO, 8-K, October 08, 2008

GE and GECS file a consolidated U.S. federal income tax return. The GECS provision for current tax expense includes its effect onthe consolidated return.
(70)
Source: GENERAL ELECTRIC CO, 8-K, October 08, 2008

Consolidated U.S. earnings from continuing operations before income taxes were $8,449 million in 2007, $10,154 million in2006 and $10,793 million in 2005. The corresponding amounts for non-U.S.-based operations were $18,163 million in 2007, $13,134million in 2006 and $10,315 million in 2005.
Consolidated current tax expense includes amounts applicable to U.S. federal income taxes of $64 million, $530 million and$2,784 million in 2007, 2006 and 2005, respectively, and amounts applicable to non-U.S. jurisdictions of $3,042 million, $1,549million and $2,425 million in 2007, 2006 and 2005, respectively. Consolidated deferred taxes related to U.S. federal income taxeswere expenses of $776 million and $1,529 million in 2007 and 2006, respectively, and a benefit of $728 million in 2005.
Deferred income tax balances reflect the effects of temporary differences between the carrying amounts of assets andliabilities and their tax bases, as well as from net operating loss and tax credit carryforwards, and are stated at enacted tax ratesexpected to be in effect when taxes are actually paid or recovered. Deferred income tax assets represent amounts available to reduceincome taxes payable on taxable income in future years. We evaluate the recoverability of these future tax deductions by assessing theadequacy of future expected taxable income from all sources, including reversal of taxable temporary differences, forecasted operatingearnings and available tax planning strategies. To the extent we do not consider it more likely than not that a deferred tax asset will berecovered, a valuation allowance is established. See note 20.
Our businesses are subject to a wide variety of U.S. federal, state and foreign tax laws and regulations. Changes to these lawsor regulations may affect our tax liability, return on investments and business operations. For example, GE’s effective tax rate isreduced because active business income earned and indefinitely reinvested outside the United States is taxed at less than the U.S. rate.A significant portion of this reduction depends upon a provision of U.S. tax law that defers the imposition of U.S. tax on certain activefinancial services income until that income is repatriated to the United States as a dividend. This provision is consistent withinternational tax norms and permits U.S. financial services companies to compete more effectively with foreign banks and otherforeign financial institutions in global markets. This provision, which is scheduled to expire at the end of 2008, has been scheduled toexpire on four previous occasions, and each time it has been extended by Congress. If this provision is not extended, the current U.S.tax imposed on active financial services income earned outside the United States would increase, making it more difficult for U.S.financial services companies to compete in global markets. If this provision were not extended, we expect our effective tax rate toincrease after 2010.
We have not provided U.S. deferred taxes on cumulative earnings of non-U.S. affiliates and associated companies that havebeen reinvested indefinitely. These earnings relate to ongoing operations and, at December 31, 2007, were approximately $62 billion.Because of the availability of U.S. foreign tax credits, it is not practicable to determine the U.S. federal income tax liability that wouldbe payable if such earnings were not reinvested indefinitely. Deferred taxes are provided for earnings of non-U.S. affiliates andassociated companies when we plan to remit those earnings.
The American Jobs Creation Act of 2004 (the Act) allowed U.S. companies a one-time opportunity to repatriate non-U.S.earnings through 2005 at a 5.25% rate of tax rather than the normal U.S. tax rate of 35%, provided that certain criteria, includingqualified U.S. reinvestment of those earnings, were met. Available U.S. foreign tax credits related to the repatriation are reduced underprovisions of the Act. Because the vast majority of our non-U.S. earnings have been permanently reinvested in active businessoperations, we repatriated only $1.2 billion of non-U.S. earnings. Because a U.S. tax provision at normal tax rates had been providedon the majority of this amount, the result was a reduction of the 2005 consolidated tax rates of approximately 0.5 percentage points.
(71)
Source: GENERAL ELECTRIC CO, 8-K, October 08, 2008

As discussed in note 1, on January 1, 2007, we adopted a new accounting standard, FIN48, Accounting for Uncertainty inIncome Taxes, resulting in a $49 million decrease in retained earnings, a $89 million decrease in goodwill and a $40 million decreasein income tax liability.
Annually, we file over 6,500 income tax returns in over 250 global taxing jurisdictions. We are under examination orengaged in tax litigation in many of these jurisdictions. During 2007, the IRS completed the audit of our consolidated U.S. income taxreturns for 2000-2002. The IRS is currently auditing our consolidated U.S. income tax returns for 2003-2005. In addition, certain otherU.S. tax deficiency issues and refund claims for previous years remain unresolved. It is reasonably possible that the 2003-2005 U.S.audit cycle will be completed during the next 12 months, which could result in a decrease in our balance of “unrecognized taxbenefits” − that is, the aggregate tax effect of differences between tax return positions and the benefits recognized in our financialstatements. We believe that there are no other jurisdictions in which the outcome of unresolved issues or claims is likely to be materialto our results of operations, financial position or cash flows. We further believe that we have made adequate provision for all incometax uncertainties.
The balance of unrecognized tax benefits, the amount of related interest and penalties we have provided and what we believeto be the range of reasonably possible changes in the next 12 months, were: 2007 (In millions) December 31 January 1 Unrecognized tax benefits $ 6,331 $ 6,806 Portion that, if recognized, would reduce tax expense
and effective tax rate(a) 4,268 4,302 Accrued interest on unrecognized tax benefits 923 1,281 Accrued penalties on unrecognized tax benefits 77 121 Reasonably possible reduction to the balance of
unrecognized tax benefits in succeeding 12 months 0-1,500 0-1,900 Portion that, if recognized, would reduce tax expense
and effective tax rate(a) 0-1,250 0-900
(a) Some portion of such reduction might be reported as discontinued operations.
A reconciliation of the beginning and ending amounts of unrecognized tax benefits is as follows: (In millions) 2007 Balance at January 1, 2007 $ 6,806 Additions for tax positions of the current year 434 Additions for tax positions of prior years 1,439 Reductions for tax positions of prior years (1,939)Settlements with tax authorities (330)Expiration of the statute of limitations (79)Balance at December 31, 2007 $ 6,331
We classify interest on tax deficiencies as interest expense; we classify income tax penalties as provision for income taxes. For theyear ended December 31, 2007, $(279) million of interest expense and $(34) million of tax expense related to penalties wererecognized in the statement of operations.
Source: GENERAL ELECTRIC CO, 8-K, October 08, 2008

(72)
Source: GENERAL ELECTRIC CO, 8-K, October 08, 2008

A reconciliation of the U.S. federal statutory income tax rate to the actual income tax rate is provided below. RECONCILIATION OF U.S. FEDERAL STATUTORY INCOME TAX RATE TO ACTUAL INCOME TAX RATE Consolidated GE GECS 2007 2006 2005 2007 2006 2005 2007 2006 2005 U.S. federal statutory income tax rate 35.0% 35.0% 35.0% 35.0% 35.0% 35.0% 35.0% 35.0% 35.0%Increase (reduction) in rate resulting from
Inclusion of after-tax earnings of GECS in before-tax earnings of GE − − − (17.2) (16.3) (15.7) – − −
Tax on global activities including exports (15.6) (16.7) (15.4) (5.0) (6.5) (5.0) (21.0) (21.1) (22.0)U.S. business credits (1.1) (1.4) (1.4) (0.3) (0.4) (0.2) (1.5) (2.2) (2.7)SES transaction (2.1) − − − − − (4.0) − −
All other − net (0.6) − (0.1) (1.4) (0.1) (0.7) 1.4 0.3 1.1 (19.4) (18.1) (16.9) (23.9) (23.3) (21.6) (25.1) (23.0) (23.6)Actual income tax rate 15.6% 16.9% 18.1% 11.1% 11.7% 13.4% 9.9% 12.0% 11.4%
NOTE 8 EARNINGS PER SHARE INFORMATION 2007 2006 2005 (In millions; per-share amounts in dollars) Diluted Basic Diluted Basic Diluted Basic CONSOLIDATED Earnings from continuing operations for per-share calculation(a) $ 22,457 $ 22,457 $ 19,345 $ 19,344 $ 17,280 $ 17,279 Earnings (loss) from discontinued operations for
per-share calculation(b) $ (249) $ (249) $ 1,399 $ 1,398 $ (570) $ (559)Net earnings available for per-share calculation $ 22,208 $ 22,208 $ 20,744 $ 20,742 $ 16,709 $ 16,720 AVERAGE EQUIVALENT SHARES Shares of GE common stock outstanding 10,182 10,182 10,359 10,359 10,570 10,570 Employee compensation-related shares, including stock options 36 − 35 − 41 − Total average equivalent shares 10,218 10,182 10,394 10,359 10,611 10,570 PER-SHARE AMOUNTS Earnings from continuing operations $ 2.20 $ 2.21 $ 1.86 $ 1.87 $ 1.63 $ 1.63 Earnings (loss) from discontinued operations $ (0.02) $ (0.02) $ 0.13 $ 0.14 $ (0.05) $ (0.05)Net earnings per share $ 2.17 $ 2.18 $ 2.00 $ 2.00 $ 1.57 $ 1.58
(a) Included dividend equivalents of approximately $1 million in each of the three years ended December 31, 2007.(b) Included dilutive effects of subsidiary-issued stock-based awards of approximately $11 million in 2005.
Earnings-per-share amounts are computed independently for earnings from continuing operations, earnings (loss) from discontinuedoperations and net earnings. As a result, the sum of per-share amounts from continuing operations and discontinued operations maynot equal the total per-share amounts for net earnings.
(73)
Source: GENERAL ELECTRIC CO, 8-K, October 08, 2008
NOTE 9 INVESTMENT SECURITIES Investment securities comprise mainly investment-grade debt securities supporting obligations to annuitants and policyholders in ourrun-off insurance businesses and holders of guaranteed investment contracts. 2007 2006
December 31 (In millions)Amortized
cost
Grossunrealized
gains
Grossunrealized
losses Estimatedfair value
Amortizedcost
Grossunrealized
gains
Grossunrealized
losses Estimatedfair value
GE
Debt − U.S. corporate $ 301 $ 23 $ − $ 324 $ 307 $ 24 $ − $ 331 Equity − available-for-sale 21 3 (5) 19 10 2 (1) 11
322 26 (5) 343 317 26 (1) 342 GECS
Debt U.S. corporate 21,896 725 (669) 21,952 21,095 1,039 (202) 21,932 State and municipal 1,106 28 (8) 1,126 826 38 (4) 860 Residential mortgage-backed(a) 5,677 22 (225) 5,474 6,476 18 (21) 6,473 Commercial mortgage-backed 2,930 15 (49) 2,896 2,322 18 (25) 2,315 Asset-backed 2,307 3 (89) 2,221 2,071 5 (11) 2,065 Corporate − non-U.S. 1,489 47 (11) 1,525 1,664 92 (5) 1,751 Government − non-U.S. 1,082 70 (10) 1,142 1,296 105 (3) 1,398 U.S. government and federal
agency 832 55 (37) 850 842 47 (6) 883 Retained interests(b)(c) 5,579 178 (57) 5,700 3,794 434 (13) 4,215 Equity
Available-for-sale 1,524 265 (120) 1,669 4,446 1,060 (14) 5,492 Trading 386 − − 386 54 − − 54
44,808 1,408 (1,275) 44,941 44,886 2,856 (304) 47,438 ELIMINATIONS (7) (1) − (8) (7) (1) − (8)Total $ 45,123 $ 1,433 $ (1,280) $ 45,276 $ 45,196 $ 2,881 $ (305) $ 47,772
(a) Substantially collateralized by U.S. mortgages.(b) Included $2,227 million of retained interests at December 31, 2007, accounted for in accordance with SFAS 155, Accounting for Certain Hybrid
Financial Instruments. See note 27.(c) Amortized cost and estimated fair value included $25 million of trading securities at December 31, 2007.
(74)
Source: GENERAL ELECTRIC CO, 8-K, October 08, 2008

The following tables present the gross unrealized losses and estimated fair values of our available-for-sale investment securities. In loss position for Less than 12 months 12 months or more
December 31 (In millions)Estimatedfair value
Grossunrealized
losses Estimatedfair value
Grossunrealized
losses 2007 Debt
U.S. corporate $ 5,766 $ (274) $ 4,341 $ (395)State and municipal 198 (3) 131 (5)Residential mortgage-backed 3,268 (160) 1,223 (65)Commercial mortgage-backed 1,483 (33) 848 (16)Asset-backed 1,417 (62) 478 (27)Corporate − non-U.S. 505 (8) 124 (3)Government − non-U.S. 29 (1) 311 (9)U.S. government and federal agency 255 (37) − −
Retained interests 548 (50) 10 (7)Equity 443 (105) 18 (20)Total $ 13,912 $ (733) $ 7,484 $ (547)2006 Debt
U.S. corporate $ 2,483 $ (52) $ 4,242 $ (150)State and municipal 149 (2) 70 (2)Residential mortgage-backed 1,149 (3) 776 (18)Commercial mortgage-backed 442 (2) 1,010 (23)Asset-backed 260 (2) 611 (9)Corporate − non-U.S. 112 (3) 93 (2)Government − non-U.S. 33 (3) − − U.S. government and federal agency 66 (1) 247 (5)
Retained interests 360 (12) 13 (1)Equity 40 (12) 3,895 (3)Total $ 5,094 $ (92) $ 10,957 $ (213)
At December 31, 2007, we held mortgage-backed securities (MBS) and asset-backed securities (ABS) with estimated fair values of$8,370 million and $2,221 million, respectively. Such amounts included unrealized losses of $274 million and $89 million,respectively. These amounts excluded retained interests in securitization entities. See note 27. Of the MBS amount, $5,474 million and$2,896 million related to residential MBS and commercial MBS, respectively. At December 31, 2007, we had approximately $1,719million of exposure to subprime credit supporting our guaranteed investment contracts, a majority of which relates to residential MBSreceiving credit ratings of Double A or better from the major rating agencies. We presently intend to hold our investment securitiesthat are in an unrealized loss position at December 31, 2007, at least until we can recover their respective amortized cost. We have theability to hold our debt securities until their maturities. Our subprime investment securities were collateralized primarily by pools ofindividual, direct mortgage loans, not other structured products such as collateralized debt obligations.
(75)
Source: GENERAL ELECTRIC CO, 8-K, October 08, 2008

CONTRACTUAL MATURITIES OF GECS INVESTMENT IN AVAILABLE-FOR-SALE DEBT SECURITIES(EXCLUDING MORTGAGE-BACKED AND ASSET-BACKED SECURITIES)
(In millions)Amortized
cost Estimatedfair value
Due in
2008 $ 1,830 $ 1,831 2009−2012 4,227 4,245 2013−2017 3,580 3,607 2018 and later 16,808 16,952
We expect actual maturities to differ from contractual maturities because borrowers have the right to call or prepay certain obligations.
Supplemental information about gross realized gains and losses on available-for-sale investment securities follows. (In millions) 2007 2006 2005 GE Gains $ 5 $ 125 $ 6 Losses, including impairments − (1) (5)
Net 5 124 1 GECS Gains(a) 1,026 313 509 Losses, including impairments (141) (181) (132)
Net 885 132 377 Total $ 890 $ 256 $ 378
(a) Included gain on sale of Swiss Re common stock of $566 million in 2007.
In the ordinary course of managing our investment securities portfolio, we may sell securities prior to their maturities for a variety ofreasons, including diversification, credit quality, yield and liquidity requirements and the funding of claims and obligations topolicyholders.
Proceeds from investment securities sales amounted to $18,993 million, $12,394 million and $14,047 million in 2007, 2006and 2005, respectively, principally from the short-term nature of the investments that support the guaranteed investment contractsportfolio and the 2007 sale of Swiss Re common stock.
We recognized pre-tax gains on trading securities of $292 million, $5 million and $3 million in 2007, 2006 and 2005,respectively. Investments in retained interests decreased by $102 million during 2007, reflecting declines in fair value accounted for inaccordance with SFAS 155.
(76)
Source: GENERAL ELECTRIC CO, 8-K, October 08, 2008

NOTE 10 CURRENT RECEIVABLES Consolidated(a) GE December 31 (In millions) 2007 2006 2007 2006 Technology Infrastructure $ 9,149 $ 8,014 $ 5,443 $ 5,482 Energy Infrastructure 7,065 5,566 5,934 4,296 NBC Universal 3,800 3,354 2,927 3,070 Consumer & Industrial 2,238 2,973 630 1,034 Corporate items and eliminations 526 220 642 364 22,778 20,127 15,576 14,246 Less allowance for losses (519) (510) (483) (480)Total $ 22,259 $ 19,617 $ 15,093 $ 13,766
(a) Included GE industrial customer receivables factored through a GECS affiliate and reported as financing receivables by GECS.
GE receivables balances at December 31, 2007 and 2006, before allowance for losses, included $11,008 million and $8,845 million,respectively, from sales of goods and services to customers, and $381 million and $175 million at December 31, 2007 and 2006,respectively, from transactions with associated companies.
GE current receivables of $252 million and $248 million at December 31, 2007 and 2006, respectively, arose from sales,principally of Aviation goods and services on open account to various agencies of the U.S. government, our largest single customer.About 4% of our sales of goods and services were to the U.S. government in 2007, 2006 and 2005. NOTE 11 INVENTORIES December 31 (In millions) 2007 2006 GE Raw materials and work in process $ 7,893 $ 5,870 Finished goods 5,025 4,263 Unbilled shipments 539 409 13,457 10,542 Less revaluation to LIFO (623) (564) 12,834 9,978 GECS Finished goods 63 54 Total $ 12,897 $ 10,032
(77)
Source: GENERAL ELECTRIC CO, 8-K, October 08, 2008

NOTE 12 GECS FINANCING RECEIVABLES (INVESTMENTS IN LOANS AND FINANCING LEASES) December 31 (In millions) 2007 2006 Loans, net of deferred income $ 313,290 $ 262,266 Investment in financing leases, net of deferred income 75,015 68,569 388,305 330,835 Less allowance for losses (note 13) (4,238) (3,945)Financing receivables − net $ 384,067 $ 326,890
Included in the above are $9,708 million and $11,509 million of the financing receivables of consolidated, liquidating securitizationentities at December 31, 2007 and 2006, respectively.
Details of financing receivables − net follow. December 31 (In millions) 2007 2006 COMMERCIAL LENDING AND LEASING (CLL) Equipment and leasing $ 89,239 $ 76,057 Commercial and industrial 58,853 50,186 Other 7,588 6,975 155,680 133,218 REAL ESTATE 32,228 20,969 GE MONEY Non-U.S. residential mortgages(a) 73,042 57,464 Non-U.S. installment and revolving credit 33,013 28,976 U.S. installment and revolving credit 29,570 29,007 Non-U.S. auto 27,368 25,088 Other 10,198 8,059 173,191 148,594 GECAS 14,197 13,626 ENERGY FINANCIAL SERVICES 7,898 7,574 OTHER(b) 5,111 6,854 388,305 330,835 Less allowance for losses (4,238) (3,945)Total $ 384,067 $ 326,890
(a) At December 31, 2007, net of credit insurance, approximately 26% of this portfolio comprised loans with introductory, below market rates thatare scheduled to adjust at future dates; with high loan-to-value ratios at inception; whose terms permitted interest-only payments; or whose termsresulted in negative amortization.
(b) Included loans and financing leases of $5,106 million and $6,853 million at December 31, 2007 and 2006, respectively, related to certainconsolidated, liquidating securitization entities.
(78)
Source: GENERAL ELECTRIC CO, 8-K, October 08, 2008

Source: GENERAL ELECTRIC CO, 8-K, October 08, 2008
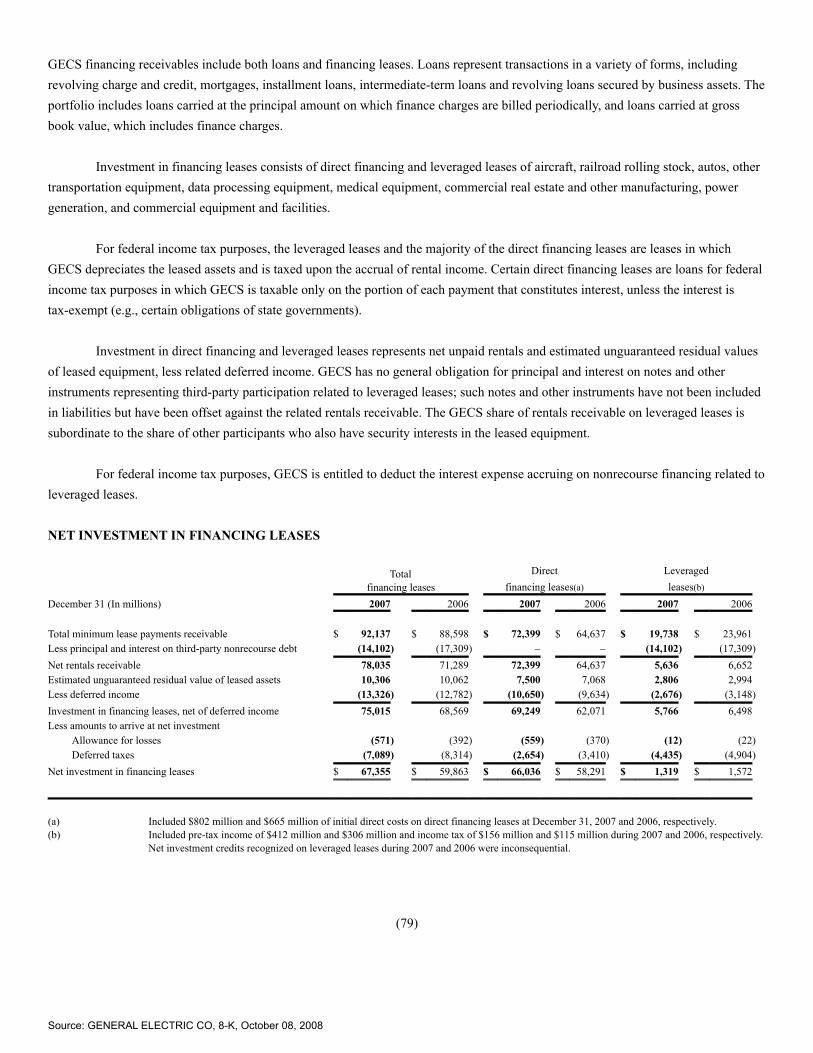
GECS financing receivables include both loans and financing leases. Loans represent transactions in a variety of forms, includingrevolving charge and credit, mortgages, installment loans, intermediate-term loans and revolving loans secured by business assets. Theportfolio includes loans carried at the principal amount on which finance charges are billed periodically, and loans carried at grossbook value, which includes finance charges.
Investment in financing leases consists of direct financing and leveraged leases of aircraft, railroad rolling stock, autos, othertransportation equipment, data processing equipment, medical equipment, commercial real estate and other manufacturing, powergeneration, and commercial equipment and facilities.
For federal income tax purposes, the leveraged leases and the majority of the direct financing leases are leases in whichGECS depreciates the leased assets and is taxed upon the accrual of rental income. Certain direct financing leases are loans for federalincome tax purposes in which GECS is taxable only on the portion of each payment that constitutes interest, unless the interest istax-exempt (e.g., certain obligations of state governments).
Investment in direct financing and leveraged leases represents net unpaid rentals and estimated unguaranteed residual valuesof leased equipment, less related deferred income. GECS has no general obligation for principal and interest on notes and otherinstruments representing third-party participation related to leveraged leases; such notes and other instruments have not been includedin liabilities but have been offset against the related rentals receivable. The GECS share of rentals receivable on leveraged leases issubordinate to the share of other participants who also have security interests in the leased equipment.
For federal income tax purposes, GECS is entitled to deduct the interest expense accruing on nonrecourse financing related toleveraged leases. NET INVESTMENT IN FINANCING LEASES
Total
financing leases Direct
financing leases(a) Leveragedleases(b)
December 31 (In millions) 2007 2006 2007 2006 2007 2006 Total minimum lease payments receivable $ 92,137 $ 88,598 $ 72,399 $ 64,637 $ 19,738 $ 23,961 Less principal and interest on third-party nonrecourse debt (14,102) (17,309) − − (14,102) (17,309)Net rentals receivable 78,035 71,289 72,399 64,637 5,636 6,652 Estimated unguaranteed residual value of leased assets 10,306 10,062 7,500 7,068 2,806 2,994 Less deferred income (13,326) (12,782) (10,650) (9,634) (2,676) (3,148)Investment in financing leases, net of deferred income 75,015 68,569 69,249 62,071 5,766 6,498 Less amounts to arrive at net investment
Allowance for losses (571) (392) (559) (370) (12) (22)Deferred taxes (7,089) (8,314) (2,654) (3,410) (4,435) (4,904)
Net investment in financing leases $ 67,355 $ 59,863 $ 66,036 $ 58,291 $ 1,319 $ 1,572
(a) Included $802 million and $665 million of initial direct costs on direct financing leases at December 31, 2007 and 2006, respectively.(b) Included pre-tax income of $412 million and $306 million and income tax of $156 million and $115 million during 2007 and 2006, respectively.
Net investment credits recognized on leveraged leases during 2007 and 2006 were inconsequential.
(79)
Source: GENERAL ELECTRIC CO, 8-K, October 08, 2008

CONTRACTUAL MATURITIES
(In millions)Totalloans
Netrentals
receivable Due in
2008 $ 93,953 $ 22,455 2009 36,176 15,534 2010 28,175 12,057 2011 21,215 8,778 2012 19,332 5,435 2013 and later 114,439 13,776
Total $ 313,290 $ 78,035
We expect actual maturities to differ from contractual maturities.
Individually “impaired” loans are defined by GAAP as larger balance or restructured loans for which it is probable that thelender will be unable to collect all amounts due according to original contractual terms of the loan agreement. An analysis of impairedloans follows. December 31 (In millions) 2007 2006 Loans requiring allowance for losses $ 986 $ 1,129 Loans expected to be fully recoverable 391 497 $ 1,377 $ 1,626 Allowance for losses $ 361 $ 388 Average investment during year 1,576 1,669 Interest income earned while impaired(a) 19 34
(a) Recognized principally on cash basis.
(80)
Source: GENERAL ELECTRIC CO, 8-K, October 08, 2008

NOTE 13 GECS ALLOWANCE FOR LOSSES ON FINANCING RECEIVABLES (In millions) 2007 2006 2005 BALANCE AT JANUARY 1 CLL $ 741 $ 928 $ 1,359 Real Estate 155 189 228 GE Money
U.S. 909 735 833 Non-U.S. 2,072 1,826 1,892
GECAS 15 179 477 Energy Financial Services 29 41 106 Other 24 22 5 3,945 3,920 4,900 PROVISION CHARGED TO OPERATIONS CLL 501 124 245 Real Estate 24 (5) 31 GE Money
U.S. 2,032 1,226 1,183 Non-U.S. 1,859 1,764 1,506
GECAS 16 (52) 244 Energy Financial Services (10) (12) (34)Other 9 17 18 4,431 3,062 3,193 SECURITIZATION (800) (195) (277)OTHER 360 203 (145)GROSS WRITE-OFFS CLL (652) (524) (830)Real Estate (25) (39) (71)GE Money
U.S. (1,584) (1,111) (1,264)Non-U.S. (3,225) (2,896) (2,437)
GECAS (23) (112) (541)Energy Financial Services – – (31)Other (17) (29) (39) (5,526) (4,711) (5,213)RECOVERIES CLL 141 189 185 Real Estate 8 5 2 GE Money
U.S. 369 275 258 Non-U.S. 1,308 1,195 1,013
GECAS – – – Energy Financial Services – – – Other 2 2 4 1,828 1,666 1,462 BALANCE AT DECEMBER 31 CLL 937 741 928 Real Estate 168 155 189 GE Money
U.S. 1,024 909 735 Non-U.S. 2,064 2,072 1,826
GECAS 8 15 179 Energy Financial Services 19 29 41 Other 18 24 22 Total $ 4,238 $ 3,945 $ 3,920
See note 12 for amounts related to consolidated, liquidating securitization entities.
Source: GENERAL ELECTRIC CO, 8-K, October 08, 2008

(81)
Source: GENERAL ELECTRIC CO, 8-K, October 08, 2008

SELECTED FINANCING RECEIVABLES RATIOS December 31 2007 2006 ALLOWANCE FOR LOSSES ON FINANCING RECEIVABLES
AS A PERCENTAGE OF TOTAL FINANCING RECEIVABLES CLL 0.60% 0.56%Real Estate 0.52 0.74 GE Money 1.78 2.01
U.S. 3.42 3.08 Non-U.S. 1.44 1.74
GECAS 0.06 0.11 Energy Financial Services 0.24 0.38 Other 0.35 0.35 Total 1.09 1.19 NONEARNING FINANCING RECEIVABLES AS A PERCENTAGE
OF TOTAL FINANCING RECEIVABLES CLL 1.1% 1.2%Real Estate 0.1 0.2 GE Money 2.1 2.1
U.S. 1.9 1.8 Non-U.S. 2.2 2.2
GECAS – – Energy Financial Services – – Other 1.4 1.2 Total 1.4 1.4
(82)
Source: GENERAL ELECTRIC CO, 8-K, October 08, 2008

NOTE 14 PROPERTY, PLANT AND EQUIPMENT
December 31 (Dollars in millions)
Estimateduseful
lives-new(years) 2007 2006
ORIGINAL COST
GE Land and improvements 8(a) $ 698 $ 523 Buildings, structures and related equipment 8-40 8,400 7,448 Machinery and equipment 4-20 20,129 19,091 Leasehold costs and manufacturing plant
under construction 1-10 2,121 1,928 31,348 28,990
GECS(b) Land and improvements, buildings, structures
and related equipment 2-40(a) 6,051 4,990 Equipment leased to others
Aircraft 20 37,271 36,146 Vehicles 1-14 32,079 26,937 Mobile equipment 12-25 2,964 4,059 Railroad rolling stock 5-36 3,866 3,509 Construction and manufacturing 2-25 3,031 1,932 All other 2-40 2,961 2,771
88,223 80,344 Total $ 119,571 $ 109,334
NET CARRYING VALUE GE Land and improvements $ 612 $ 457 Buildings, structures and related equipment 4,101 3,284 Machinery and equipment 7,634 7,317 Leasehold costs and manufacturing plant
under construction 1,795 1,617 14,142 12,675 GECS(b)
Land and improvements, buildings, structures and related equipment 3,703 2,737
Equipment leased to others Aircraft(c) 30,414 29,886 Vehicles 20,701 17,132 Mobile equipment 1,976 2,546 Railroad rolling stock 2,789 2,395 Construction and manufacturing 2,055 1,291 All other 2,108 1,966
63,746 57,953 Total $ 77,888 $ 70,628
(a) Estimated useful lives exclude land.(b) Included $1,513 million and $1,763 million of original cost of assets leased to GE with accumulated amortization of $315 million and $293
million at December 31, 2007 and 2006, respectively.(c) The GECAS business of Capital Finance recognized impairment losses of $110 million in 2007 and $51 million in 2006 recorded in the caption
“Other costs and expenses” in the Statement of Earnings to reflect adjustments to fair value based on current market values from independentappraisers.
Source: GENERAL ELECTRIC CO, 8-K, October 08, 2008

(83)
Source: GENERAL ELECTRIC CO, 8-K, October 08, 2008

Amortization of GECS equipment leased to others was $7,222 million, $5,839 million and $5,642 million in 2007, 2006 and 2005,respectively. Noncancellable future rentals due from customers for equipment on operating leases at December 31, 2007, are asfollows: (In millions) Due in
2008 $ 12,423 2009 7,594 2010 6,024 2011 4,601 2012 3,582 2013 and later 10,709
Total $ 44,933
NOTE 15 GOODWILL AND OTHER INTANGIBLE ASSETS December 31 (In millions) 2007 2006 GOODWILL
GE $ 55,689 $ 48,645 GECS 25,427 22,754
Total $ 81,116 $ 71,399
December 31 (In millions) 2007 2006 OTHER INTANGIBLE ASSETS
GE Intangible assets subject to amortization $ 9,278 $ 7,461 Indefinite-lived intangible assets(a) 2,355 2,278
11,633 9,739 GECS Intangible assets subject to amortization 4,509 3,139
Total $ 16,142 $ 12,878
(a) Indefinite-lived intangible assets principally comprised trademarks, tradenames and U.S. Federal Communications Commission licenses.
(84)
Source: GENERAL ELECTRIC CO, 8-K, October 08, 2008
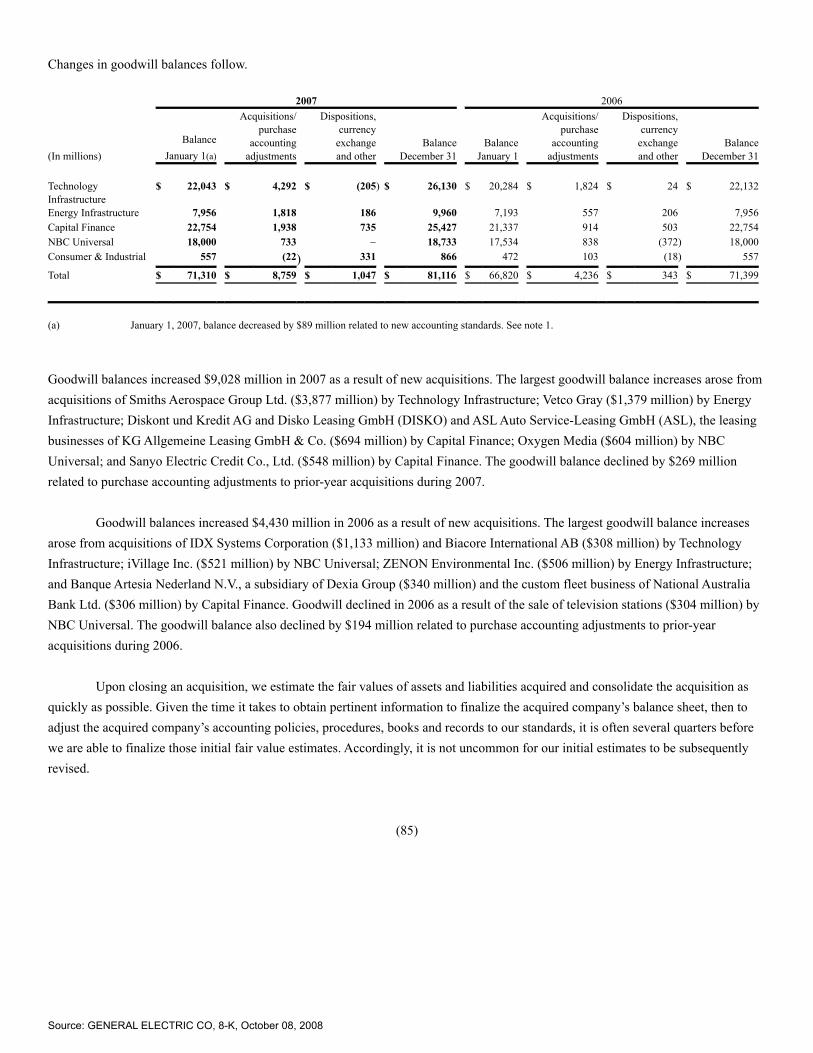
Changes in goodwill balances follow. 2007 2006
(In millions)Balance
January 1(a)
Acquisitions/purchase
accountingadjustments
Dispositions,currency
exchangeand other
BalanceDecember 31
BalanceJanuary 1
Acquisitions/purchase
accountingadjustments
Dispositions,currency
exchangeand other
BalanceDecember 31
TechnologyInfrastructure
$ 22,043 $ 4,292 $ (205) $ 26,130 $ 20,284 $ 1,824 $ 24 $ 22,132
Energy Infrastructure 7,956 1,818 186 9,960 7,193 557 206 7,956 Capital Finance 22,754 1,938 735 25,427 21,337 914 503 22,754 NBC Universal 18,000 733 − 18,733 17,534 838 (372) 18,000 Consumer & Industrial 557 (22) 331 866 472 103 (18) 557 Total $ 71,310 $ 8,759 $ 1,047 $ 81,116 $ 66,820 $ 4,236 $ 343 $ 71,399
(a) January 1, 2007, balance decreased by $89 million related to new accounting standards. See note 1.
Goodwill balances increased $9,028 million in 2007 as a result of new acquisitions. The largest goodwill balance increases arose fromacquisitions of Smiths Aerospace Group Ltd. ($3,877 million) by Technology Infrastructure; Vetco Gray ($1,379 million) by EnergyInfrastructure; Diskont und Kredit AG and Disko Leasing GmbH (DISKO) and ASL Auto Service-Leasing GmbH (ASL), the leasingbusinesses of KG Allgemeine Leasing GmbH & Co. ($694 million) by Capital Finance; Oxygen Media ($604 million) by NBCUniversal; and Sanyo Electric Credit Co., Ltd. ($548 million) by Capital Finance. The goodwill balance declined by $269 millionrelated to purchase accounting adjustments to prior-year acquisitions during 2007.
Goodwill balances increased $4,430 million in 2006 as a result of new acquisitions. The largest goodwill balance increasesarose from acquisitions of IDX Systems Corporation ($1,133 million) and Biacore International AB ($308 million) by TechnologyInfrastructure; iVillage Inc. ($521 million) by NBC Universal; ZENON Environmental Inc. ($506 million) by Energy Infrastructure;and Banque Artesia Nederland N.V., a subsidiary of Dexia Group ($340 million) and the custom fleet business of National AustraliaBank Ltd. ($306 million) by Capital Finance. Goodwill declined in 2006 as a result of the sale of television stations ($304 million) byNBC Universal. The goodwill balance also declined by $194 million related to purchase accounting adjustments to prior-yearacquisitions during 2006.
Upon closing an acquisition, we estimate the fair values of assets and liabilities acquired and consolidate the acquisition asquickly as possible. Given the time it takes to obtain pertinent information to finalize the acquired company’s balance sheet, then toadjust the acquired company’s accounting policies, procedures, books and records to our standards, it is often several quarters beforewe are able to finalize those initial fair value estimates. Accordingly, it is not uncommon for our initial estimates to be subsequentlyrevised.
(85)
Source: GENERAL ELECTRIC CO, 8-K, October 08, 2008

INTANGIBLE ASSETS SUBJECT TO AMORTIZATION
December 31 (In millions)
Grosscarryingamount
Accumulatedamortization Net
GE 2007 Customer-related $ 4,526 $ (698) $ 3,828 Patents, licenses and trademarks 4,561 (1,369) 3,192 Capitalized software 4,573 (2,589) 1,984 All other 436 (162) 274 Total $ 14,096 $ (4,818) $ 9,278
2006 Customer-related $ 2,853 $ (484) $ 2,369 Patents, licenses and trademarks 4,242 (1,071) 3,171 Capitalized software 4,184 (2,467) 1,717 All other 313 (109) 204 Total $ 11,592 $ (4,131) $ 7,461
GECS 2007 Customer-related $ 2,395 $ (869) $ 1,526 Patents, licenses and trademarks 428 (309) 119 Capitalized software 1,832 (1,095) 737 Lease valuations 1,841 (360) 1,481 Present value of future profits 818 (364) 454 All other 347 (155) 192 Total $ 7,661 $ (3,152) $ 4,509
2006 Customer-related $ 1,446 $ (646) $ 800 Patents, licenses and trademarks 413 (265) 148 Capitalized software 1,621 (955) 666 Lease valuations 851 (132) 719 Present value of future profits 829 (297) 532 All other 430 (156) 274 Total $ 5,590 $ (2,451) $ 3,139
During 2007, we recorded additions to intangible assets subject to amortization of $4,283 million. The components of finite-livedintangible assets acquired during 2007 and their respective weighted-average useful lives are: $2,277 million − Customer-related (17.5years); $299 million − Patents, licenses and trademarks (20.2 years); $587 million − Capitalized software (4.3 years); $992 million −
Lease valuations (7.6 years); and $128 million − All other (9.9 years).
Consolidated amortization related to intangible assets subject to amortization was $2,071 million and $1,739 million for 2007and 2006, respectively. We estimate that annual pre-tax amortization for intangible assets subject to amortization over the next fivecalendar years to be as follows: 2008 − $1,969 million; 2009 − $1,804 million; 2010−$1,635 million; 2011−$1,470 million; 2012 −
$1,320 million.
(86)
Source: GENERAL ELECTRIC CO, 8-K, October 08, 2008

NOTE 16 ALL OTHER ASSETS December 31 (In millions) 2007 2006 GE Investments
Associated companies $ 1,871 $ 1,543 Other(a) 1,243 733
3,114 2,276 Pension asset − principal plans 20,190 15,019 Contract costs and estimated earnings 5,983 5,164 Film and television costs 4,143 3,646 Long-term receivables, including notes 2,331 2,892 Derivative instruments 279 193 Other 4,568 4,252 40,608 33,442 GECS Investments
Real estate(b) 40,488 27,252 Associated companies 17,025 12,050 Assets held for sale(c) 10,690 7,738 Cost method(d) 2,742 2,348 Other 1,018 931
71,963 50,319 Derivative instruments 3,271 1,981 Advances to suppliers 2,046 1,714 Deferred acquisition costs 1,282 1,380 Other 4,830 3,981 83,392 59,375 ELIMINATIONS (1,152) (1,178)Total $ 122,848 $ 91,639
(a) The fair value of and unrealized loss on cost method investments in a continuous loss position at December 31, 2007 and 2006 wereinsignificant.
(b) GECS investment in real estate consisted principally of two categories: real estate held for investment and equity method investments. Bothcategories contained a wide range of properties including the following at December 31, 2007: office buildings (49%), apartment buildings(14%), industrial properties (11%), retail facilities (9%), franchise properties (7%), parking facilities (2%) and other (8%). At December 31,2007, investments were located in the Americas (48%), Europe (33%) and Asia (19%).
(c) Assets were classified as held for sale on the date a decision was made to dispose of them through sale, securitization or other means. Suchassets consisted primarily of real estate properties and credit card receivables, and were accounted for at the lower of carrying amount orestimated fair value less costs to sell. These amounts are net of valuation allowances of $153 million and $3 million at December 31, 2007 and2006, respectively.
(d) The fair value of and unrealized loss on those investments in a continuous loss position for less than 12 months at December 31, 2007, were$546 million and $93 million, respectively, which included $282 million fair value and $15 million unrealized losses related to our investment inFGIC Corporation (FGIC) preferred stock and $36 million fair value and $29 million unrealized losses related to our investment in FGICcommon stock. The fair value of and unrealized loss on those investments in a continuous loss position for 12 months or more at December 31,2007, were $18 million and $8 million, respectively. The fair value of and unrealized loss on those investments in a continuous loss position forless than 12 months at December 31, 2006, were $113 million and $25 million, respectively. The fair value of and unrealized loss on thoseinvestments in a continuous loss position for 12 months or more at December 31, 2006, were $38 million and $8 million, respectively.
(87)
Source: GENERAL ELECTRIC CO, 8-K, October 08, 2008

NOTE 17 BORROWINGS SHORT-TERM BORROWINGS 2007 2006
December 31 (Dollars in millions) Amount Average
rate(a) Amount Average
rate(a) GE Commercial paper
U.S. $ 1,798 4.73% $ 1,097 5.35%Non-U.S. 1 4.00 1 3.74
Payable to banks 189 5.07 184 5.61 Current portion of long-term debt 1,547 5.36 32 5.32 Other 571 762 4,106 2,076 GECS Commercial paper
U.S. Unsecured 72,392 4.69 67,423 5.37 Asset-backed(b) 4,775 4.94 6,430 5.35
Non-U.S. 28,711 4.99 26,328 4.38 Current portion of long-term debt(c) 56,301 5.01 44,550 4.86 Bank deposits(d) 11,486 3.04 9,731 3.50 GE Interest Plus notes(e) 9,590 5.23 9,161 5.43 Other 9,165 9,689 192,420 173,312 ELIMINATIONS (1,426) (3,376) Total $ 195,100 $ 172,012
(a) Based on year-end balances and year-end local currency interest rates. Current portion of long-term debt included the effects of related interestrate and currency swaps, if any, directly associated with the original debt issuance.
(b) Entirely obligations of consolidated, liquidating securitization entities. See note 12.(c) Included $1,106 million of asset-backed, liquidating securitization entities at December 31, 2007 and none at December 31, 2006.(d) Included $10,789 million and $9,731 million of deposits in non-U.S. banks at December 31, 2007 and 2006, respectively.(e) Entirely variable denomination floating rate demand notes.
(88)
Source: GENERAL ELECTRIC CO, 8-K, October 08, 2008

LONG-TERM BORROWINGS
December 31 (Dollars in millions)
2007Average
rate(a) Maturities 2007 2006 GE Senior notes 5.11% 2013-2017 $ 8,957 $ 6,488 Industrial development/pollution control bonds 3.69 2011-2027 266 265 Payable to banks, principally U.S. 5.90 2009-2023 1,988 1,836 Other(b) 445 454 11,656 9,043 GECS Senior notes
Unsecured 5.23 2009-2055 283,097 235,939 Asset-backed(c) 5.13 2009-2035 5,528 5,810
Extendible notes 5.10 2009-2012 8,500 6,000 Subordinated notes(d)(e) 6.08 2009-2067 11,377 5,201 308,502 252,950 ELIMINATIONS (1,145) (1,244)Total $ 319,013 $ 260,749
(a) Based on year-end balances and year-end local currency interest rates, including the effects of related interest rate and currency swaps, if any,directly associated with the original debt issuance.
(b) A variety of obligations having various interest rates and maturities, including certain borrowings by parent operating components and affiliates.(c) Included $3,410 million and $4,684 million of asset-backed senior notes, issued by consolidated, liquidating securitization entities at December
31, 2007 and 2006, respectively. See note 12.(d) Included $750 million of subordinated notes guaranteed by GE at December 31, 2007 and 2006.(e) Included $8,064 million and $2,019 million of subordinated debentures receiving rating agency equity credit at December 31, 2007 and 2006,
respectively.
Our borrowings are addressed below from the perspectives of liquidity, interest rate and currency risk management. Additionalinformation about borrowings and associated swaps can be found in note 26. LIQUIDITY is affected by debt maturities and our ability to repay or refinance such debt. Long-term debt maturities over the nextfive years follow. (In millions) 2008 2009 2010 2011 2012 GE $ 1,557 $ 1,713 $ 35 $ 58 $ 25 GECS 56,297(a) 63,371(b) 54,255 32,028 39,240
(a) Fixed and floating rate notes of $793 million contain put options with exercise dates in 2008, and which have final maturity dates in 2009 ($100million) and beyond 2012 ($693 million).
(b) Floating rate extendible notes of $6,500 million are due in 2009, but are extendible at the option of the investors to a final maturity in 2011($4,000 million) and 2012 ($2,500 million).
(89)
Source: GENERAL ELECTRIC CO, 8-K, October 08, 2008
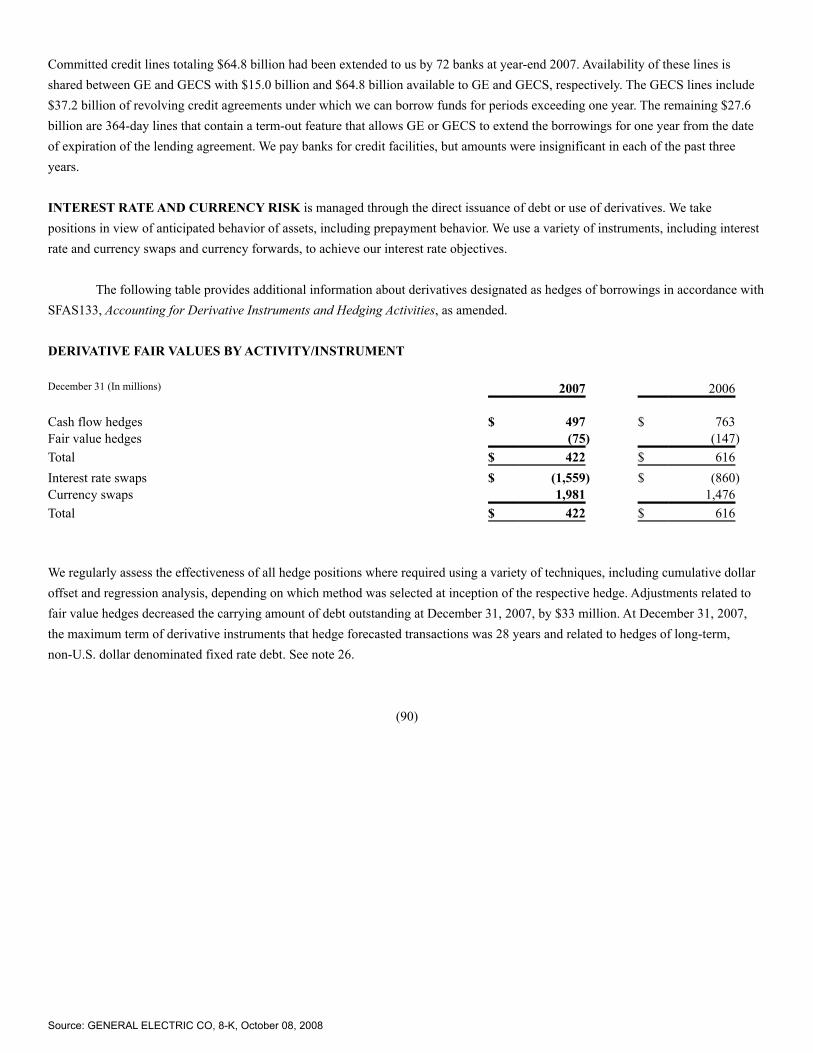
Committed credit lines totaling $64.8 billion had been extended to us by 72 banks at year-end 2007. Availability of these lines isshared between GE and GECS with $15.0 billion and $64.8 billion available to GE and GECS, respectively. The GECS lines include$37.2 billion of revolving credit agreements under which we can borrow funds for periods exceeding one year. The remaining $27.6billion are 364-day lines that contain a term-out feature that allows GE or GECS to extend the borrowings for one year from the dateof expiration of the lending agreement. We pay banks for credit facilities, but amounts were insignificant in each of the past threeyears. INTEREST RATE AND CURRENCY RISK is managed through the direct issuance of debt or use of derivatives. We takepositions in view of anticipated behavior of assets, including prepayment behavior. We use a variety of instruments, including interestrate and currency swaps and currency forwards, to achieve our interest rate objectives.
The following table provides additional information about derivatives designated as hedges of borrowings in accordance withSFAS133, Accounting for Derivative Instruments and Hedging Activities, as amended. DERIVATIVE FAIR VALUES BY ACTIVITY/INSTRUMENT December 31 (In millions) 2007 2006 Cash flow hedges $ 497 $ 763 Fair value hedges (75) (147)Total $ 422 $ 616
Interest rate swaps $ (1,559) $ (860)Currency swaps 1,981 1,476 Total $ 422 $ 616
We regularly assess the effectiveness of all hedge positions where required using a variety of techniques, including cumulative dollaroffset and regression analysis, depending on which method was selected at inception of the respective hedge. Adjustments related tofair value hedges decreased the carrying amount of debt outstanding at December 31, 2007, by $33 million. At December 31, 2007,the maximum term of derivative instruments that hedge forecasted transactions was 28 years and related to hedges of long-term,non-U.S. dollar denominated fixed rate debt. See note 26.
(90)
Source: GENERAL ELECTRIC CO, 8-K, October 08, 2008

NOTE 18 GECS INVESTMENT CONTRACTS, INSURANCE LIABILITIES AND INSURANCE ANNUITY BENEFITS December 31 (In millions) 2007 2006 Investment contracts $ 4,536 $ 5,089 Guaranteed investment contracts 11,705 11,870
Total investment contracts 16,241 16,959 Life insurance benefits(a) 14,360 14,054 Unpaid claims and claims adjustment expenses 2,782 2,714 Unearned premiums 656 740 Universal life benefits 320 340 Total $ 34,359 $ 34,807
(a) Life insurance benefits are accounted for mainly by a net-level-premium method using estimated yields generally ranging from 3.0% to 8.5% inboth 2007 and 2006.
When insurance affiliates cede insurance to third parties, they are not relieved of their primary obligation to policyholders. Losses onceded risks give rise to claims for recovery; we establish allowances for probable losses on such receivables from reinsurers asrequired.
We recognize reinsurance recoveries as a reduction of the Statement of Earnings caption “Investment contracts, insurancelosses and insurance annuity benefits.” Reinsurance recoveries were $104 million, $162 million and $183 million for the years endedDecember 31, 2007, 2006 and 2005, respectively. NOTE 19 ALL OTHER LIABILITIES This caption includes liabilities for various items including non-current compensation and benefits, deferred income, interest on taxliabilities, unrecognized tax benefits, accrued participation and residuals, environmental remediation, asset retirement obligations,derivative instruments, product warranties and a variety of sundry items.
Accruals for non-current compensation and benefits amounted to $22,322 million and $18,012 million for year-end 2007 and2006, respectively. These amounts include postretirement benefits, international and supplemental pension benefits, and othercompensation and benefit accruals such as deferred incentive compensation. The increase in 2007 was primarily the result of planbenefit changes resulting from new U.S. labor agreements and retiree health cost increases.
We are involved in numerous remediation actions to clean up hazardous wastes as required by federal and state laws.Liabilities for remediation costs, exclude possible insurance recoveries and, when dates and amounts of such costs are not known, arenot discounted. When there appears to be a range of possible costs with equal likelihood, liabilities are based on the low end of suchrange. Uncertainties about the status of laws, regulations, technology and information related to individual sites make it difficult todevelop a meaningful estimate of the reasonably possible aggregate environmental remediation exposure. However, even in theunlikely event that remediation costs amounted to the high end of the range of costs for each site, the resulting additional liabilitywould not be material to our financial position, results of operations or liquidity.
(91)
Source: GENERAL ELECTRIC CO, 8-K, October 08, 2008

Source: GENERAL ELECTRIC CO, 8-K, October 08, 2008
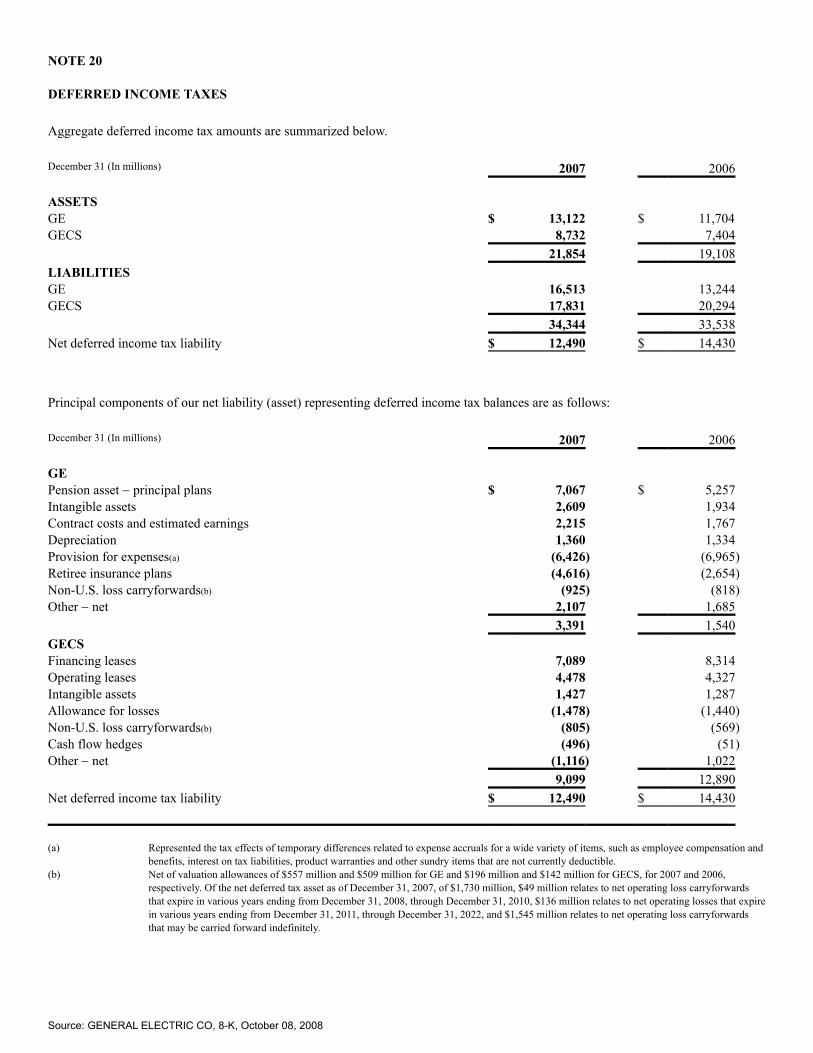
NOTE 20 DEFERRED INCOME TAXES Aggregate deferred income tax amounts are summarized below. December 31 (In millions) 2007 2006 ASSETS GE $ 13,122 $ 11,704 GECS 8,732 7,404 21,854 19,108 LIABILITIES GE 16,513 13,244 GECS 17,831 20,294 34,344 33,538 Net deferred income tax liability $ 12,490 $ 14,430
Principal components of our net liability (asset) representing deferred income tax balances are as follows: December 31 (In millions) 2007 2006 GE Pension asset − principal plans $ 7,067 $ 5,257 Intangible assets 2,609 1,934 Contract costs and estimated earnings 2,215 1,767 Depreciation 1,360 1,334 Provision for expenses(a) (6,426) (6,965)Retiree insurance plans (4,616) (2,654)Non-U.S. loss carryforwards(b) (925) (818)Other − net 2,107 1,685 3,391 1,540 GECS Financing leases 7,089 8,314 Operating leases 4,478 4,327 Intangible assets 1,427 1,287 Allowance for losses (1,478) (1,440)Non-U.S. loss carryforwards(b) (805) (569)Cash flow hedges (496) (51)Other − net (1,116) 1,022 9,099 12,890 Net deferred income tax liability $ 12,490 $ 14,430
(a) Represented the tax effects of temporary differences related to expense accruals for a wide variety of items, such as employee compensation andbenefits, interest on tax liabilities, product warranties and other sundry items that are not currently deductible.
(b) Net of valuation allowances of $557 million and $509 million for GE and $196 million and $142 million for GECS, for 2007 and 2006,respectively. Of the net deferred tax asset as of December 31, 2007, of $1,730 million, $49 million relates to net operating loss carryforwardsthat expire in various years ending from December 31, 2008, through December 31, 2010, $136 million relates to net operating losses that expirein various years ending from December 31, 2011, through December 31, 2022, and $1,545 million relates to net operating loss carryforwardsthat may be carried forward indefinitely.
Source: GENERAL ELECTRIC CO, 8-K, October 08, 2008

(92)
Source: GENERAL ELECTRIC CO, 8-K, October 08, 2008

NOTE 21 MINORITY INTEREST IN EQUITY OF CONSOLIDATED AFFILIATES Minority interest in equity of consolidated affiliates includes common shares in consolidated affiliates and preferred stock issued byaffiliates of GE Capital. Preferred shares that we are required to redeem at a specified or determinable date are classified as liabilities.The balance is summarized as follows: December 31 (In millions) 2007 2006 Minority interest in consolidated affiliates
NBC Universal $ 5,025 $ 4,774 Others(a) 2,748 1,487
Minority interest in preferred stock(b) GE Capital affiliates 231 1,232
Total $ 8,004 $ 7,493
(a) Included minority interest in partnerships and common shares of consolidated affiliates.(b) The preferred stock primarily pays cumulative dividends at variable rates. Dividend rates in local currency on the preferred stock ranged from
3.88% to 5.52% during 2007 and 3.28% to 5.49% during 2006.
(93)
Source: GENERAL ELECTRIC CO, 8-K, October 08, 2008
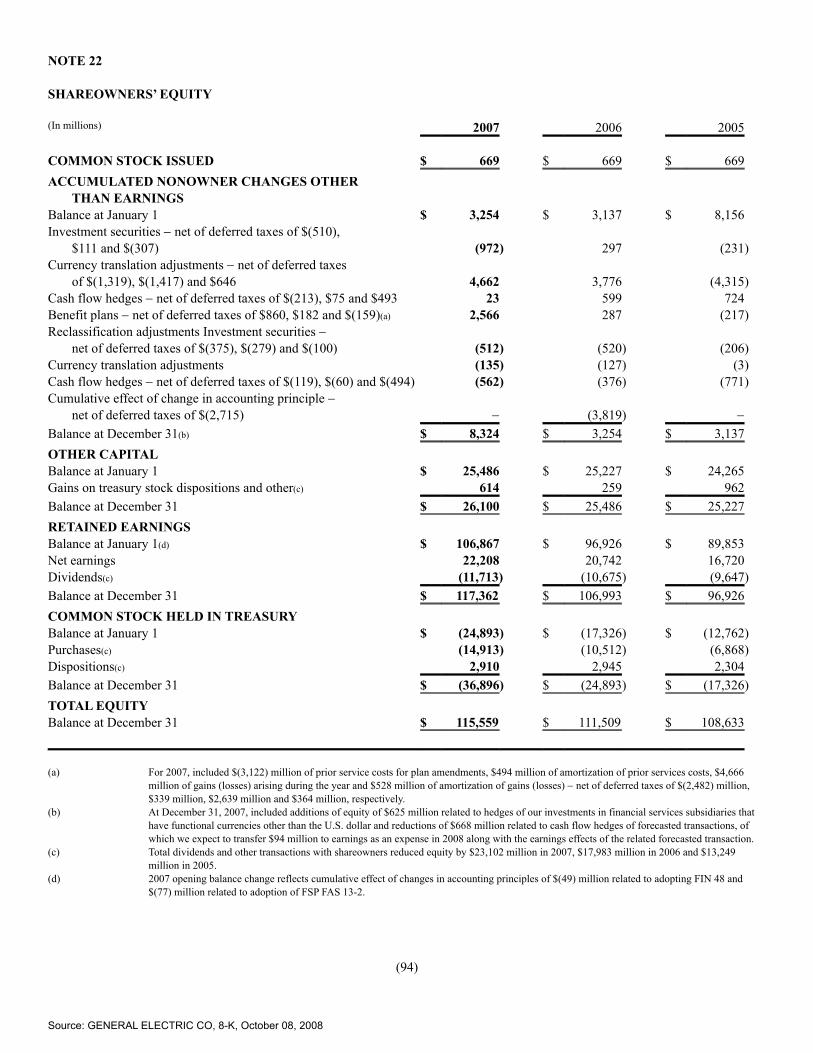
NOTE 22 SHAREOWNERS’ EQUITY (In millions) 2007 2006 2005 COMMON STOCK ISSUED $ 669 $ 669 $ 669
ACCUMULATED NONOWNER CHANGES OTHER THAN EARNINGS
Balance at January 1 $ 3,254 $ 3,137 $ 8,156 Investment securities − net of deferred taxes of $(510),
$111 and $(307) (972) 297 (231)Currency translation adjustments − net of deferred taxes
of $(1,319), $(1,417) and $646 4,662 3,776 (4,315)Cash flow hedges − net of deferred taxes of $(213), $75 and $493 23 599 724 Benefit plans − net of deferred taxes of $860, $182 and $(159)(a) 2,566 287 (217)Reclassification adjustments Investment securities −
net of deferred taxes of $(375), $(279) and $(100) (512) (520) (206)Currency translation adjustments (135) (127) (3)Cash flow hedges − net of deferred taxes of $(119), $(60) and $(494) (562) (376) (771)Cumulative effect of change in accounting principle −
net of deferred taxes of $(2,715) − (3,819) − Balance at December 31(b) $ 8,324 $ 3,254 $ 3,137
OTHER CAPITAL Balance at January 1 $ 25,486 $ 25,227 $ 24,265 Gains on treasury stock dispositions and other(c) 614 259 962 Balance at December 31 $ 26,100 $ 25,486 $ 25,227
RETAINED EARNINGS Balance at January 1(d) $ 106,867 $ 96,926 $ 89,853 Net earnings 22,208 20,742 16,720 Dividends(c) (11,713) (10,675) (9,647)Balance at December 31 $ 117,362 $ 106,993 $ 96,926
COMMON STOCK HELD IN TREASURY Balance at January 1 $ (24,893) $ (17,326) $ (12,762)Purchases(c) (14,913) (10,512) (6,868)Dispositions(c) 2,910 2,945 2,304 Balance at December 31 $ (36,896) $ (24,893) $ (17,326)TOTAL EQUITY Balance at December 31 $ 115,559 $ 111,509 $ 108,633
(a) For 2007, included $(3,122) million of prior service costs for plan amendments, $494 million of amortization of prior services costs, $4,666million of gains (losses) arising during the year and $528 million of amortization of gains (losses) − net of deferred taxes of $(2,482) million,$339 million, $2,639 million and $364 million, respectively.
(b) At December 31, 2007, included additions of equity of $625 million related to hedges of our investments in financial services subsidiaries thathave functional currencies other than the U.S. dollar and reductions of $668 million related to cash flow hedges of forecasted transactions, ofwhich we expect to transfer $94 million to earnings as an expense in 2008 along with the earnings effects of the related forecasted transaction.
(c) Total dividends and other transactions with shareowners reduced equity by $23,102 million in 2007, $17,983 million in 2006 and $13,249million in 2005.
(d) 2007 opening balance change reflects cumulative effect of changes in accounting principles of $(49) million related to adopting FIN 48 and$(77) million related to adoption of FSP FAS 13-2.
(94)
Source: GENERAL ELECTRIC CO, 8-K, October 08, 2008

At December 31, 2007 and 2006, the aggregate statutory capital and surplus of the insurance activities totaled $2.2 billion and $2.1billion, respectively. Accounting practices prescribed by statutory authorities are used in preparing statutory statements.
In December 2004, our Board of Directors authorized a three-year, $15 billion share repurchase program, expanded thatprogram in 2005 to $25 billion and extended it in July 2007 to $27 billion. In December 2007, our Board approved a new three-year,$15 billion share repurchase program. Under these share repurchase programs, on a book basis we repurchased 357.9 million sharesfor a total of $13.9 billion during 2007.
Common shares issued and outstanding are summarized in the following table. SHARES OF GE COMMON STOCK December 31 (In thousands) 2007 2006 2005 Issued 11,145,252 11,145,212 11,145,212 In treasury (1,157,653) (867,839) (660,944)Outstanding 9,987,599 10,277,373 10,484,268
GE has 50 million authorized shares of preferred stock ($1.00 par value), but has not issued any such shares as of December 31, 2007. NOTE 23 OTHER STOCK-RELATED INFORMATION We grant stock options, restricted stock units (RSUs) and performance share units (PSUs) to employees under the 2007 Long-TermIncentive Plan. This plan replaces the 1990 Long-Term Incentive Plan. In addition, we grant options and RSUs in limitedcircumstances to consultants, advisors and independent contractors (primarily non-employee talent at NBC Universal) under a planapproved by our Board of Directors in 1997 (the consultants’ plan). There are outstanding grants under one shareowner-approvedoption plan for non-employee directors. Share requirements for all plans may be met from either unissued or treasury shares. Stockoptions expire 10 years from the date they are granted and vest over service periods that range from one to five years. RSUs give therecipients the right to receive shares of our stock upon the lapse of their related restrictions. Restrictions on RSUs lapse in variousincrements and at various dates, beginning after one year from date of grant through grantee retirement. Although the plan permits usto issue RSUs settleable in cash, we have only issued RSUs settleable in shares of our stock. PSUs give recipients the right to receiveshares of our stock upon the achievement of certain performance targets.
All grants of GE options under all plans must be approved by the Management Development and Compensation Committee,which consists entirely of independent directors.
(95)
Source: GENERAL ELECTRIC CO, 8-K, October 08, 2008

STOCK COMPENSATION PLANS
December 31, 2007 (Shares in thousands)
Securitiesto be
issuedupon
exercise
Weightedaverageexercise
price
Securitiesavailablefor futureissuance
APPROVED BY SHAREOWNERS Options 212,669 $ 36.68 (a) RSUs 37,062 (b) (a) PSUs 1,330 (b) (a) NOT APPROVED BY SHAREOWNERS
(CONSULTANTS’ PLAN) Options 713 35.55 (c) RSUs 67 (b) (c) Total 251,841 $ 36.68 497,051
(a) In 2007, the Board of Directors approved the 2007 Long-Term Incentive Plan (the Plan). The Plan replaced the 1990 Long-Term Incentive Plan.The maximum number of shares that may be granted under the Plan is 500 million shares, of which no more than 250 million may be availablefor awards granted in any form provided under the Plan other than options or stock appreciation rights. The approximate 105.9 million sharesavailable for grant under the 1990 Plan were retired upon approval of the 2007 Plan. Total shares available for future issuance under the 2007Plan amounted to 473.0 million shares.
(b) Not applicable.(c) Total shares available for future issuance under the consultants’ plan amount to 24.0 million shares.
Outstanding options expire on various dates through December 6, 2017.
The following table summarizes information about stock options outstanding at December 31, 2007. STOCK OPTIONS OUTSTANDING (Shares in thousands) Outstanding Exercisable
Exercise price range Shares Average life(a)
Averageexercise
price Shares
Averageexercise
price
Under $27.00 12,555 0.8 $ 26.21 12,555 $ 26.21 27.01−32.00 44,764 5.0 28.44 40,599 28.22 32.01−37.00 65,080 5.7 34.72 41,054 35.04 37.01−42.00 34,197 5.8 39.18 16,834 39.62 42.01−47.00 44,451 3.0 43.29 44,451 43.29 Over $47.00 12,335 2.7 56.84 12,335 56.84
Total 213,382 4.5 $ 36.68 167,828 $ 36.98
At year-end 2006, options with an average exercise price of $35.93 were exercisable on 183 million shares.(a) Average contractual life remaining in years.
(96)
Source: GENERAL ELECTRIC CO, 8-K, October 08, 2008

STOCK OPTION ACTIVITY
Shares
(in thousands)
Weightedaverageexercise
price
Weightedaverage
remainingcontractual
term(in years)
Aggregateintrinsic
value(in millions)
Outstanding at January 1, 2007 232,420 $ 35.25
Granted 17,905 38.64 Exercised (28,966) 25.80 Forfeited (2,949) 33.10 Expired (5,028) 42.22
Outstanding at December 31, 2007 213,382 $ 36.68 4.5 $ 676
Exercisable at December 31, 2007 167,828 $ 36.98 3.5 $ 579
Options expected to vest 40,402 $ 35.50 8.3 $ 88
We measure the fair value of each stock option grant at the date of grant using a Black-Scholes option pricing model. The weightedaverage grant-date fair value of options granted during 2007, 2006 and 2005 amounted to $9.28, $7.99 and $8.87, respectively. Thefollowing assumptions were used in arriving at the fair value of options granted during 2007, 2006 and 2005, respectively: risk-freeinterest rates of 4.2%, 4.8% and 4.1%; dividend yields of 2.9%, 2.9% and 2.5%; expected volatility of 25%, 24% and 28%; andexpected lives of six years and ten months, six years and two months and six years. Risk free interest rates reflect the yield onzero-coupon U.S. Treasury securities. Expected dividend yields presume a set dividend rate. Expected volatilities are based on impliedvolatilities from traded options and historical volatility of our stock. The expected option lives are based on our historical experienceof employee exercise behavior.
The total intrinsic value of options exercised during 2007, 2006 and 2005 amounted to $375 million, $587 million and $731million, respectively. As of December 31, 2007, there was $234 million of total unrecognized compensation cost related to nonvestedoptions. That cost is expected to be recognized over a weighted average period of four years.
Cash received from option exercises during 2007, 2006 and 2005 was $747 million, $622 million and $403 million,respectively.
(97)
Source: GENERAL ELECTRIC CO, 8-K, October 08, 2008

OTHER STOCK-BASED COMPENSATION
Shares
(in thousands)
Weightedaverage
remainingcontractual
term(in years)
Aggregateintrinsic
value(in millions)
RSUs outstanding at January 1, 2007 34,327
Granted 10,145 Vested (5,105) Forfeited (2,238)
RSUs outstanding at December 31, 2007 37,129 3.2 $ 1,376
RSUs expected to vest 33,723 3.1 $ 1,250
The fair value of each restricted stock unit is the market price of our stock on the date of grant. The weighted average grant-date fairvalue of RSUs granted during 2007, 2006 and 2005 amounted to $38.84, $33.95 and $34.72, respectively. The total intrinsic value ofRSUs vested during 2007, 2006 and 2005 amounted to $181 million, $132 million and $90 million, respectively. As of December 31,2007, there was $638 million of total unrecognized compensation cost related to nonvested RSUs. That cost is expected to berecognized over a weighted average period of two years and two months. As of December 31, 2007, 1.3 million PSUs with a weightedaverage remaining contractual term of 2 years, an aggregate intrinsic value of $49 million and $14 million of unrecognizedcompensation cost were outstanding. NOTE 24 SUPPLEMENTAL CASH FLOWS INFORMATION Changes in operating assets and liabilities are net of acquisitions and dispositions of principal businesses.
Amounts reported in the “Payments for principal businesses purchased” line in the Statement of Cash Flows is net of cashacquired and included debt assumed and immediately repaid in acquisitions.
Amounts reported in the “All other operating activities” line in the Statement of Cash Flows consists primarily of adjustmentsto current and noncurrent accruals and deferrals of costs and expenses, adjustments for gains and losses on assets, increases anddecreases in assets held for sale and adjustments to assets. There were no significant non-cash transactions in 2007. Significantnon-cash transactions in 2006 and 2005 include the following: In 2006, in connection with our sale of GE Insurance Solutions, SwissRe assumed $1,700 million of debt, and GE received $2,238 million of newly issued Swiss Re common stock. See note 2. In 2005,NBC Universal acquired IAC/InterActiveCorp’s 5.44% common interest in VUE for a total purchase price that included $115 millionof non-cash consideration, representing the fair value of future services to be performed by NBC Universal.
(98)
Source: GENERAL ELECTRIC CO, 8-K, October 08, 2008

Certain supplemental information related to GE and GECS cash flows is shown below. December 31 (In millions) 2007 2006 2005 GE
NET DISPOSITIONS (PURCHASES) OF GE SHARES FOR TREASURY
Open market purchases under share repurchase program $ (13,896) $ (8,054) $ (5,024)Other purchases (1,017) (2,458) (1,844)Dispositions 2,594 1,958 2,024
$ (12,319) $ (8,554) $ (4,844)GECS
ALL OTHER OPERATING ACTIVITIES Net change in other assets $ (1,507) $ (1,709) $ (963)Amortization of intangible assets 879 599 438 Realized gains on sale of investment securities (885) (132) (377)Other 974 2,277 2,745
$ (539) $ 1,035 $ 1,843
NET INCREASE IN GECS FINANCING RECEIVABLES Increase in loans to customers $ (408,611) $ (371,835) $ (311,454)Principal collections from customers − loans 322,074 296,708 263,671 Investment in equipment for financing leases (26,489) (25,618) (23,508)Principal collections from customers − financing leases 20,868 18,791 21,770 Net change in credit card receivables (38,405) (25,787) (21,366)Sales of financing receivables 86,399 67,471 54,144
$ (44,164) $ (40,270) $ (16,743)ALL OTHER INVESTING ACTIVITIES Purchases of securities by insurance activities $ (13,279) $ (11,891) $ (8,825)Dispositions and maturities of securities by insurance activities 15,602 11,635 10,792 Other assets − investments (10,218) (6,242) (920)Other (835) 503 (3,052)
$ (8,730) $ (5,995) $ (2,005)NEWLY ISSUED DEBT HAVING MATURITIES
LONGER THAN 90 DAYS Short-term (91 to 365 days) $ 1,226 $ 1,237 $ 4,675 Long-term (longer than one year) 90,769 86,028 60,148 Proceeds − nonrecourse, leveraged lease 24 1,015 203
$ 92,019 $ 88,280 $ 65,026
REPAYMENTS AND OTHER REDUCTIONS OF DEBT HAVING MATURITIES LONGER THAN 90 DAYS
Short-term (91 to 365 days) $ (43,937) $ (42,273) $ (38,132)Long-term (longer than one year) (4,482) (5,576) (10,725)Principal payments − nonrecourse, leveraged lease (1,109) (1,404) (831)
$ (49,528) $ (49,253) $ (49,688)ALL OTHER FINANCING ACTIVITIES Proceeds from sales of investment contracts $ 12,641 $ 16,418 $ 15,806 Redemption of investment contracts (13,862) (17,603) (16,934)Other 17 11 −
$ (1,204) $ (1,174) $ (1,128)
(99)
Source: GENERAL ELECTRIC CO, 8-K, October 08, 2008

Source: GENERAL ELECTRIC CO, 8-K, October 08, 2008

NOTE 25 OPERATING SEGMENTS REVENUES Total revenues(a) Intersegment revenues(b) External revenues (In millions) 2007 2006 2005 2007 2006 2005 2007 2006 2005 Technology Infrastructure $ 42,801 $ 37,687 $ 33,873 $ 113 $ 216 $ 180 $ 42,688 $ 37,471 $ 33,693 Energy Infrastructure 30,698 25,221 21,921 351 488 478 30,347 24,733 21,443 Capital Finance 66,301 56,378 49,071 1,128 1,013 896 65,173 55,365 48,175 NBC Universal 15,416 16,188 14,689 35 52 − 15,381 16,136 14,689 Consumer & Industrial 12,663 13,202 13,040 143 235 438 12,520 12,967 12,602 Corporate items andeliminations
4,609 2,892 3,668 (1,770) (2,004) (1,992) 6,379 4,896 5,660
Total $ 172,488 $ 151,568 $ 136,262 $ − $ − $ − $ 172,488 $ 151,568 $ 136,262
(a) Revenues of GE businesses include income from sales of goods and services to customers and other income.(b) Sales from one component to another generally are priced at equivalent commercial selling prices.
Revenues from customers located in the United States were $86,247 million, $81,057 million and $75,655 million in 2007, 2006 and2005, respectively. Revenues from customers located outside the United States were $86,241 million, $70,511 million and $60,607million in 2007, 2006 and 2005, respectively.
Assets(a)(b) Property, plant and
equipment additions(c) Depreciation and
amortization
At December 31 For the years ended
December 31 For the years ended
December 31
(In millions) 2007 2006 2005 2007 2006 2005 2007 2006 2005
Technology Infrastructure $ 57,670 $ 49,641 $ 45,612 $ 1,954 $ 1,389 $ 955 $ 1,569 $ 1,269 $ 1,135 Energy Infrastructure 31,466 24,456 21,731 1,054 867 893 774 672 658 Capital Finance 583,965 491,000 408,341 17,832 14,489 11,820 8,864 6,971 6,325 NBC Universal 33,089 31,425 31,196 306 352 275 357 361 339 Consumer & Industrial 5,351 5,740 5,965 363 373 314 434 497 596 Corporate items andeliminations 84,142 95,011 160,365 247 195 226 310 262 210
Total $ 795,683 $ 697,273 $ 673,210 $ 21,756 $ 17,665 $ 14,483 $ 12,308 $ 10,032 $ 9,263
(a) Assets of discontinued operations are included in Corporate items and eliminations for all periods presented.(b) Total assets of the Technology Infrastructure, Energy Infrastructure, Capital Finance, NBC Universal and Consumer & Industrial operating
segments at December 31, 2007, include investment in and advances to associated companies of $613 million, $412 million, $16,915 million,$384 million and $378 million, respectively, which contributed approximately $92 million, $78 million, $2,172 million, $453 million and$48 million, respectively, to segment pre-tax income for the year ended December 31, 2007. Aggregate summarized financial information forsignificant associated companies assuming a 100% ownership interest included: total assets of $138,864 million, primarily financingreceivables of $83,087 million; total liabilities of $120,914 million, primarily bank deposits of $63,514 million; revenues totaling $22,446million; and net earnings totaling $3,979 million.
(c) Additions to property, plant and equipment include amounts relating to principal businesses purchased.
Source: GENERAL ELECTRIC CO, 8-K, October 08, 2008

Source: GENERAL ELECTRIC CO, 8-K, October 08, 2008

(100)
Source: GENERAL ELECTRIC CO, 8-K, October 08, 2008

Interest and other
financial charges Provision for
income taxes
(In millions) 2007 2006 2005 2007 2006 2005 Capital Finance $ 22,611 $ 17,079 $ 13,384 $ 1,225 $ 1,560 $ 1,228 Corporate items and eliminations(a) 1,151 1,800 1,411 2,930 2,384 2,601 Total $ 23,762 $ 18,879 $ 14,795 $ 4,155 $ 3,944 $ 3,829
(a) Included amounts for Technology Infrastructure, Energy Infrastructure, NBC Universal and Consumer & Industrial for which our measure ofsegment profit excludes interest and other financial charges and income taxes.
Property, plant and equipment − net associated with operations based in the United States were $27,213 million, $25,699 million and$24,262 million at year-end 2007, 2006 and 2005, respectively. Property, plant and equipment − net associated with operations basedoutside the United States were $50,675 million, $44,929 million and $38,084 million at year-end 2007, 2006 and 2005, respectively. Basis for presentation Our operating businesses are organized based on the nature of markets and customers. Segment accounting policies are the same asdescribed in note 1. Segment results for our financial services businesses reflect the discrete tax effect of transactions, but theintraperiod tax allocation is reflected outside of the segment unless otherwise noted in segment results.
Effects of transactions between related companies are eliminated and consist primarily of GECS services for tradereceivables management and material procurement; GE customer receivables sold to GECS; buildings and equipment (includingautomobiles) leased by GE from GECS; information technology (IT) and other services sold to GECS by GE; aircraft enginesmanufactured by GE that are installed on aircraft purchased by GECS from third-party producers for lease to others; medicalequipment manufactured by GE that is leased by GECS to others; and various investments, loans and allocations of GE corporateoverhead costs.
A description of our operating segments can be found on pages 116-117 and details of segment profit by operating segmentcan be found in the Summary of Operating Segments table on page 11 of this report.
(101)
Source: GENERAL ELECTRIC CO, 8-K, October 08, 2008

NOTE 26 FINANCIAL INSTRUMENTS 2007 2006 Assets (liabilities) Assets (liabilities)
December 31 (In millions)Notionalamount
Carryingamount (net)
Estimatedfair value
Notionalamount
Carryingamount (net)
Estimatedfair value
GE Assets
Investments and notes receivable $ (a) $ 538 $ 538 $ (a) $ 481 $ 481 Liabilities
Borrowings(b) (a) (15,762) (15,819) (a) (11,119) (11,026)GECS Assets
Loans (a) 309,623 307,425 (a) 258,713 258,189 Other commercial and residential mortgages
held for sale (a) 4,891 4,939 (a) 2,644 2,703 Loans held for sale (a) 3,808 3,809 (a) 3,498 3,498 Other financial instruments(c) (a) 2,778 3,164 (a) 2,439 2,883
Liabilities Borrowings(b)(d) (a) (500,922) (503,607) (a) (426,262) (432,258)Investment contract benefits (a) (4,536) (4,914) (a) (5,089) (5,080)Guaranteed investment contracts (a) (11,705) (11,630) (a) (11,870) (11,756)
Insurance – credit life(e) 1,500 (35) (24) 2,634 (81) (61)
(a) These financial instruments do not have notional amounts.(b) See note 17.(c) Principally cost method investments.(d) Included effects of interest rate and cross-currency derivatives.(e) Net of reinsurance of $2,815 million and $840 million at December 31, 2007 and 2006, respectively.
Assets and liabilities not carried at fair value in our Statement of Financial Position are discussed below. Apart from certain of ourborrowings and certain marketable securities, few of the instruments discussed below are actively traded and their fair values mustoften be determined using financial models. Realization of the fair value of these instruments depends upon market forces beyond ourcontrol, including marketplace liquidity. Therefore, the disclosed fair values may not be indicative of net realizable value or reflectfuture fair values.
A description of how we estimate fair values follows. Loans Based on quoted market prices, recent transactions and/or discounted future cash flows, using rates at which similar loans would havebeen made to similar borrowers. Borrowings Based on discounted future cash flows using current market rates which are comparable to market quotes.
(102)
Source: GENERAL ELECTRIC CO, 8-K, October 08, 2008
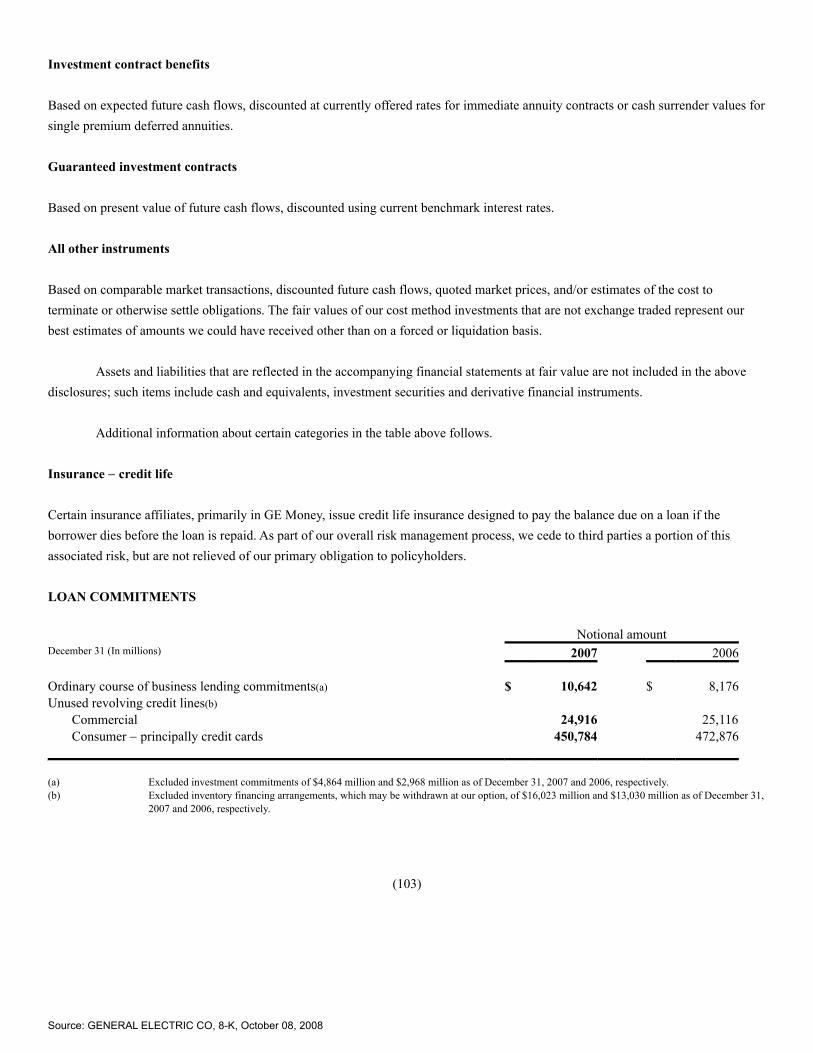
Investment contract benefits Based on expected future cash flows, discounted at currently offered rates for immediate annuity contracts or cash surrender values forsingle premium deferred annuities. Guaranteed investment contracts Based on present value of future cash flows, discounted using current benchmark interest rates. All other instruments Based on comparable market transactions, discounted future cash flows, quoted market prices, and/or estimates of the cost toterminate or otherwise settle obligations. The fair values of our cost method investments that are not exchange traded represent ourbest estimates of amounts we could have received other than on a forced or liquidation basis.
Assets and liabilities that are reflected in the accompanying financial statements at fair value are not included in the abovedisclosures; such items include cash and equivalents, investment securities and derivative financial instruments.
Additional information about certain categories in the table above follows. Insurance − credit life Certain insurance affiliates, primarily in GE Money, issue credit life insurance designed to pay the balance due on a loan if theborrower dies before the loan is repaid. As part of our overall risk management process, we cede to third parties a portion of thisassociated risk, but are not relieved of our primary obligation to policyholders. LOAN COMMITMENTS Notional amount December 31 (In millions) 2007 2006 Ordinary course of business lending commitments(a) $ 10,642 $ 8,176 Unused revolving credit lines(b)
Commercial 24,916 25,116 Consumer − principally credit cards 450,784 472,876
(a) Excluded investment commitments of $4,864 million and $2,968 million as of December 31, 2007 and 2006, respectively.(b) Excluded inventory financing arrangements, which may be withdrawn at our option, of $16,023 million and $13,030 million as of December 31,
2007 and 2006, respectively.
(103)
Source: GENERAL ELECTRIC CO, 8-K, October 08, 2008

Derivatives and hedging We conduct our business activities in diverse markets around the world, including countries where obtaining local funding issometimes inefficient. The nature of our activities exposes us to changes in interest rates and currency exchange rates. We managesuch risks using various techniques including debt whose terms correspond to terms of the funded assets, as well as combinations ofdebt and derivatives that achieve our objectives. We also are exposed to various commodity price risks and address certain of theserisks with commodity contracts. We value derivatives that are not exchange-traded with internal market-based valuation models.When necessary, we also obtain information from our derivative counterparties to validate our models and to value the few productsthat our internal models do not address.
We use interest rate swaps, currency derivatives and commodity derivatives to reduce the variability of expected future cashflows associated with variable rate borrowings and commercial purchase and sale transactions, including commodities. We use interestrate swaps, currency swaps and interest rate and currency forwards to hedge the fair value effects of interest rate and currencyexchange rate changes on local and non-functional currency denominated fixed-rate borrowings and certain types of fixed-rate assets.We use currency swaps and forwards to protect our net investments in global operations conducted in non-U.S. dollar currencies. Weintend all of these positions to qualify as hedges and to be accounted for as hedges.
We use swaps, futures and option contracts, including caps, floors and collars, as economic hedges of changes in interestrates, currency exchange rates and equity prices on certain types of assets and liabilities. We sometimes use credit default swaps toeconomically hedge the credit risk of various counterparties with which we have entered into loan or leasing arrangements. Weoccasionally obtain equity warrants as part of sourcing or financing transactions. Although these instruments are derivatives, theireconomic risks are similar to, and managed on the same basis as, risks of other equity instruments we hold. These instruments aremarked to market through earnings. Earnings effects of derivatives designated as hedges At December 31, 2007, approximately 53% of our total interest rate swaps designated as hedges were exempt from ongoing tests ofeffectiveness. The following table provides information about the earnings effects of derivatives designated and qualifying as hedges,but not qualifying for the assumption of no ineffectiveness. PRE-TAX GAINS (LOSSES) December 31 (In millions) 2007 2006 2005 CASH FLOW HEDGES Ineffectiveness $ (3) $ 10 $ (27)Amounts excluded from the measure of effectiveness (17) (16) 17 FAIR VALUE HEDGES Ineffectiveness 7 (47) 4 Amounts excluded from the measure of effectiveness (13) 33 (8)
In 2007, 2006 and 2005, we recognized insignificant gains and losses related to hedged forecasted transactions and firm commitmentsthat did not occur by the end of the originally specified period.
Additional information regarding the use of derivatives is provided in note 17 and note 22.
Source: GENERAL ELECTRIC CO, 8-K, October 08, 2008

(104)
Source: GENERAL ELECTRIC CO, 8-K, October 08, 2008

Counterparty credit risk We manage counterparty credit risk, the risk that counterparties will default and not make payments to us according to the terms of theagreements, on an individual counterparty basis. Thus, when a legal right of offset exists, we net certain exposures by counterpartyand include the value of collateral to determine the amount of ensuing exposure. When net exposure to a counterparty, based on thecurrent market values of agreements and collateral, exceeds credit exposure limits (see following table), we take action to reduceexposure. Such actions include prohibiting additional transactions with the counterparty, requiring collateral from the counterparty (asdescribed below) and terminating or restructuring transactions.
Swaps are required to be executed under master agreements containing mutual credit downgrade provisions that provide theability to require assignment or termination in the event either party is downgraded below A3 or A−. In certain cases we have enteredinto collateral arrangements that provide us with the right to hold collateral (cash or U.S. Treasury or other highly-rated securities)when the current market value of derivative contracts exceeds a specified limit. We evaluate credit risk exposures and compliancewith credit exposure limits net of such collateral.
Fair values of our derivatives assets and liabilities represent the replacement value of existing derivatives at market prices andcan change significantly from period to period based on, among other factors, market movements and changes in our positions. AtDecember 31, 2007, our exposure to counterparties, after consideration of netting arrangements and collateral, was about $2,000million.
Following is GECS policy relating to initial credit rating requirements and to exposure limits to counterparties. COUNTERPARTY CREDIT CRITERIA Credit rating Moody’s S&P Foreign exchange forwards and other derivatives less
than one year P-1 A-1 All derivatives between one and five years Aa3(a) AA-(a)
All derivatives greater than five years Aaa(a) AAA(a)
(a) Counterparties that have an obligation to provide collateral to cover credit exposure in accordance with a credit support agreement must have aminimum A3/A- rating.
(105)
Source: GENERAL ELECTRIC CO, 8-K, October 08, 2008

EXPOSURE LIMITS (In millions)
Minimum rating Exposure(a)
Without With collateral collateralMoody’s S&P arrangements arrangements Aaa AAA $100 $75Aa3 AA– 50 50A3 A– 5 −
(a) For derivatives with maturities less than one year, counterparties are permitted to have unsecured exposure up to $150 million with a minimumrating of A-1/P-1.
NOTE 27 OFF-BALANCE SHEET ARRANGEMENTS We securitize financial assets in the ordinary course of business to improve shareowner returns. The securitization transactions weengage in are similar to those used by many financial institutions. Beyond improving returns, these securitization transactions serve asfunding sources for a variety of diversified lending and securities transactions. Historically, we have used both GE-supported andthird-party entities to execute off-balance sheet securitization transactions funded in the commercial paper and term bond markets.Assets in off-balance sheet securitization entities amounted to $53,505 million and $46,105 million at December 31, 2007 and 2006,respectively.
In a typical securitization transaction, we sell assets to a special purpose entity, which has obtained cash by issuing beneficialinterests, usually debt, to third parties. These beneficial interests are credit enhanced, normally through over-collateralization, but alsowith other forms of liquidity and credit support arrangements.
Assets in off-balance sheet securitization entities comprise the following: December 31 (In millions) 2007 2006 Receivables secured by
Equipment $ 6,552 $ 7,568 Commercial real estate 9,244 7,865 Other assets 12,880 13,257
Credit card receivables 22,793 13,497 Trade receivables 2,036 3,918 Total securitized assets(a)(b) $ 53,505 $ 46,105
(a) At December 31, 2007 and 2006, liquidity support amounted to $2,810 million and $753 million, respectively. The December 31, 2006, amountis net of $3,034 million deferred beyond one year. Credit support amounted to $2,804 million and $3,815 million at December 31, 2007 and2006, respectively.
(b) Liabilities for recourse obligations related to off-balance sheet assets were $2 million and $15 million at December 31, 2007 and 2006,respectively.
Gross securitization gains amounted to $1,805 million in 2007, compared with $1,187 million in 2006 and $1,051 million in 2005.
Source: GENERAL ELECTRIC CO, 8-K, October 08, 2008

(106)
Source: GENERAL ELECTRIC CO, 8-K, October 08, 2008

Amounts recognized in our financial statements related to sales to off-balance sheet securitization entities are as follows: December 31 (In millions) 2007 2006 Retained interests $ 5,700 $ 4,740 Servicing assets 8 14 Servicing liabilities (10) (5)Recourse liabilities (2) (15)Total $ 5,696 $ 4,734
• RETAINED INTERESTS. When we securitize receivables, we determine fair value of retained interests based on discounted
cash flow models that incorporate, among other things, assumptions about loan pool credit losses, prepayment speeds anddiscount rates. These assumptions are based on our experience, market trends and anticipated performance related to theparticular assets securitized. We classify retained interests in securitized receivables as investment securities and mark them tofair value each reporting period, updating our models for current assumptions. These assets decrease as cash is received inpayment. We recorded a loss in operations of $102 million in 2007 to reflect decreases in fair value on retained interests inaccordance with SFAS 155, Accounting for Certain Hybrid Financial Instruments. When the carrying amounts of otherretained interests exceed their fair value, we evaluate whether the unrealized loss is other than temporary and, if it is, recordany indicated loss in operations. We recorded $113 million and $37 million of other than temporary losses in operations during2007 and 2006, respectively.
• SERVICING. Following a securitization transaction, we also may provide servicing for a market-based fee based on
remaining outstanding principal balances. Where the fee does not represent adequate compensation, a servicing asset orliability is recorded, as appropriate. Their value is subject to credit, prepayment and interest rate risk.
• RECOURSE LIABILITIES. Certain transactions involve credit support agreements. As a result, we provide for expected
credit losses at amounts that approximate fair value.
(107)
Source: GENERAL ELECTRIC CO, 8-K, October 08, 2008

The following table summarizes data related to securitization sales of revolving and long-term receivables that we completed during2007 and 2006.
(Dollars in millions) Equipment Commercial
real estate
Creditcard
receivables Otherassets
2007 Cash proceeds from securitization $ 2,648 $ 3,245 $ 12,359 $ 2,400 Proceeds from collections reinvested in
new receivables − − 24,109 32,509 Cash received on retained interests 155 117 3,268 449 Cash received from servicing and other sources 24 26 354 168 Weighted average lives (in months) 24 78 8 41 Assumptions as of sale date(a)
Discount rate 12.6% 12.8% 13.4% 12.0%Prepayment rate(b) 11.7 6.8 11.0 14.5 Estimate of credit losses 0.8 0.4 6.8 1.4
2006 Cash proceeds from securitization $ 2,784 $ 4,427 $ 5,251 $ 6,826 Proceeds from collections reinvested in
new receivables − − 16,360 30,584 Cash received on retained interests 236 80 2,307 341 Cash received from servicing and other sources 45 26 219 113 Weighted average lives (in months) 23 75 7 36 Assumptions as of sale date(a)
Discount rate 8.3% 12.8% 12.0% 7.0%Prepayment rate(b) 10.4 7.6 12.5 9.9 Estimate of credit losses 1.4 0.5 6.8 0.2
(a) Based on weighted averages.(b) Represented a payment rate on credit card receivables.
(108)
Source: GENERAL ELECTRIC CO, 8-K, October 08, 2008

Key assumptions used in measuring the fair value of retained interests in securitizations and the sensitivity of the current fair value ofresidual cash flows to changes in those assumptions related to all outstanding retained interests as of December 31, 2007 and 2006, arenoted in the following table.
(Dollars in millions) Equipment Commercial
real estate
Creditcard
receivables Otherassets
2007 Discount rate(a) 12.8% 15.2% 14.8% 14.5%Effect of
10% Adverse change $ (7) $ (20) $ (36) $ (5)20% Adverse change (13) (38) (72) (9)
Prepayment rate(a)(b) 11.7% 3.4% 10.8% 16.2%Effect of
10% Adverse change $ (2) $ (5) $ (80) $ (3)20% Adverse change (3) (9) (148) (5)
Estimate of credit losses(a) 1.7% 1.0% 9.0% 0.5%Effect of
10% Adverse change $ (5) $ (8) $ (110) $ (1)20% Adverse change (8) (13) (222) (2)
Remaining weighted average lives (in months) 22 53 8 26 Net credit losses $ 36 $ 1 $ 941 $ 19 Delinquencies 51 12 1,514 4 2006 Discount rate(a) 8.9% 13.2% 11.2% 6.4%Effect of
10% Adverse change $ (10) $ (19) $ (15) $ (5)20% Adverse change (21) (35) (30) (10)
Prepayment rate(a)(b) 11.7% 3.0% 12.0% 12.7%Effect of
10% Adverse change $ (5) $ (7) $ (59) $ (5)20% Adverse change (9) (13) (110) (10)
Estimate of credit losses(a) 2.3% 0.8% 6.6% 0.2%Effect of
10% Adverse change $ (7) $ (6) $ (48) $ (3)20% Adverse change (14) (8) (95) (6)
Remaining weighted average lives (in months) 31 47 8 18 Net credit losses $ 58 $ − $ 576 $ − Delinquencies 121 13 741 12
(a) Based on weighted averages.(b) Represented a payment rate on credit card receivables.
(109)
Source: GENERAL ELECTRIC CO, 8-K, October 08, 2008

NOTE 28 COMMITMENTS AND GUARANTEES Commitments, including guarantees In our Aviation business of Technology Infrastructure, we had committed to provide financial assistance on $1,607 million of futurecustomer acquisitions of aircraft equipped with our engines, including commitments made to airlines in 2007 for future sales under ourGE90 and GEnx engine campaigns. The GECAS business of Capital Finance had placed multiple-year orders for various Boeing,Airbus and other aircraft with list prices approximating $20,046 million and secondary orders with airlines for used aircraft ofapproximately $910 million at December 31, 2007.
At December 31, 2007, NBC Universal had $9,722 million of commitments to acquire motion picture and televisionprogramming, including U.S. television rights to future Olympic Games and National Football League games, contractualcommitments under various creative talent arrangements and various other arrangements requiring payments through 2014.
At December 31, 2007, we were committed under the following guarantee arrangements beyond those provided on behalf ofsecuritization entities. See note 27.
• CREDIT SUPPORT. We have provided $8,126 million of credit support on behalf of certain customers or associatedcompanies, predominantly joint ventures and partnerships, using arrangements such as standby letters of credit andperformance guarantees. These arrangements enable these customers and associated companies to execute transactions orobtain desired financing arrangements with third parties. Should the customer or associated company fail to perform under theterms of the transaction or financing arrangement, we would be required to perform on their behalf. Under most sucharrangements, our guarantee is secured, usually by the asset being purchased or financed, but possibly by certain other assetsof the customer or associated company. The length of these credit support arrangements parallels the length of the relatedfinancing arrangements or transactions. The liability for such credit support was $57 million for December 31, 2007.
• INDEMNIFICATION AGREEMENTS. These are agreements that require us to fund up to $608 million under residual
value guarantees on a variety of leased equipment and $1,718 million of other indemnification commitments arising primarilyfrom sales of businesses or assets. Under most of our residual value guarantees, our commitment is secured by the leased assetat termination of the lease. The liability for these indemnification agreements was $51 million at December 31, 2007.
• CONTINGENT CONSIDERATION. These are agreements to provide additional consideration in a business combination to
the seller if contractually specified conditions related to the acquired entity are achieved. At December 31, 2007, we had totalmaximum exposure for future estimated payments of $220 million, of which none was earned and payable.
(110)
Source: GENERAL ELECTRIC CO, 8-K, October 08, 2008

Our guarantees are provided in the ordinary course of business. We underwrite these guarantees considering economic, liquidity andcredit risk of the counterparty. We believe that the likelihood is remote that any such arrangements could have a significant adverseeffect on our financial position, results of operations or liquidity. We record liabilities for guarantees at estimated fair value, generallythe amount of the premium received, or if we do not receive a premium, the amount based on appraisal, observed market values ordiscounted cash flows. Any associated expected recoveries from third parties are recorded as other receivables; not netted against theliabilities. Product warranties We provide for estimated product warranty expenses when we sell the related products. Because warranty estimates are forecasts thatare based on the best available information− mostly historical claims experience − claims costs may differ from amounts provided. Ananalysis of changes in the liability for product warranties follows. (In millions) 2007 2006 2005 Balance at January 1 $ 1,339 $ 1,240 $ 1,481 Current year provisions 827 829 525 Expenditures(a) (763) (729) (766)Other changes 138 (1) − Balance at December 31 $ 1,541 $ 1,339 $ 1,240
(a) Primarily related to Technology Infrastructure and Energy Infrastructure.
(111)
Source: GENERAL ELECTRIC CO, 8-K, October 08, 2008

NOTE 29 QUARTERLY INFORMATION (UNAUDITED) First quarter Second quarter Third quarter Fourth quarter (In millions; per-share amounts in dollars) 2007 2006 2007 2006 2007 2006 2007 2006 CONSOLIDATED OPERATIONS Earnings from continuing operations $ 4,911 $ 4,011 $ 5,608 $ 4,659 $ 5,111 $ 4,737 $ 6,827 $ 5,937 Earnings (loss) from discontinued operations (340) 508 (226) 262 448 124 (131) 504 Net earnings $ 4,571 $ 4,519 $ 5,382 $ 4,921 $ 5,559 $ 4,861 $ 6,696 $ 6,441 Per-share amounts − earnings from
continuing operations Diluted earnings per share $ 0.48 $ 0.38 $ 0.54 $ 0.45 $ 0.50 $ 0.46 $ 0.68 $ 0.57 Basic earnings per share 0.48 0.38 0.55 0.45 0.50 0.46 0.68 0.58
Per-share amounts − earnings (loss) from discontinued operations
Diluted earnings per share (0.03) 0.05 (0.02) 0.03 0.04 0.01 (0.01) 0.05 Basic earnings per share (0.03) 0.05 (0.02) 0.03 0.04 0.01 (0.01) 0.05
Per-share amounts − net earnings Diluted earnings per share 0.44 0.43 0.52 0.47 0.54 0.47 0.66 0.62 Basic earnings per share 0.44 0.43 0.52 0.47 0.55 0.47 0.67 0.63
SELECTED DATA GE
Sales of goods and services $ 21,688 $ 21,143 $ 24,269 $ 22,041 $ 24,690 $ 22,180 $ 29,149 $ 24,555 Gross profit from sales 5,660 5,394 6,537 6,192 6,357 5,836 7,757 7,133
GECS Total revenues 17,409 14,327 17,170 14,869 18,066 15,507 19,291 16,648 Earnings from continuing operations 3,407 2,322 2,416 2,479 3,219 2,514 3,375 2,904
For GE, gross profit from sales is sales of goods and services less costs of goods and services sold.
Earnings-per-share amounts are computed independently each quarter for earnings from continuing operations, earnings(loss) from discontinued operations and net earnings. As a result, the sum of each quarter’s per-share amount may not equal the totalper-share amount for the respective year; and the sum of per-share amounts from continuing operations and discontinued operationsmay not equal the total per-share amounts for net earnings for the respective quarters. NOTE 30 IMMATERIAL CORRECTIONS As previously reported, we are conducting an internal review of revenue recognition matters in connection with an ongoing SECinvestigation. In the course of that review, we have identified certain immaterial non-cash items that we have corrected from amountsin previous annual reports. These items are as follows:
(112)
Source: GENERAL ELECTRIC CO, 8-K, October 08, 2008
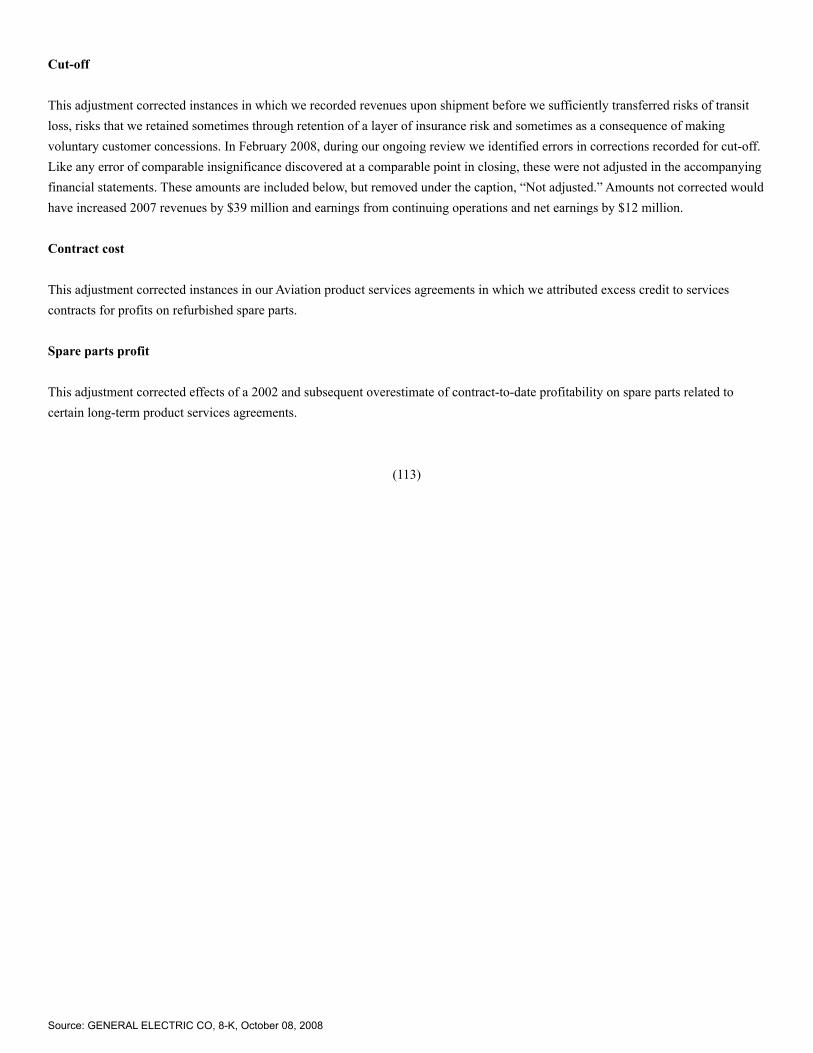
Cut-off This adjustment corrected instances in which we recorded revenues upon shipment before we sufficiently transferred risks of transitloss, risks that we retained sometimes through retention of a layer of insurance risk and sometimes as a consequence of makingvoluntary customer concessions. In February 2008, during our ongoing review we identified errors in corrections recorded for cut-off.Like any error of comparable insignificance discovered at a comparable point in closing, these were not adjusted in the accompanyingfinancial statements. These amounts are included below, but removed under the caption, “Not adjusted.” Amounts not corrected wouldhave increased 2007 revenues by $39 million and earnings from continuing operations and net earnings by $12 million. Contract cost This adjustment corrected instances in our Aviation product services agreements in which we attributed excess credit to servicescontracts for profits on refurbished spare parts. Spare parts profit This adjustment corrected effects of a 2002 and subsequent overestimate of contract-to-date profitability on spare parts related tocertain long-term product services agreements.
(113)
Source: GENERAL ELECTRIC CO, 8-K, October 08, 2008

Contract estimates This adjustment corrected effects of an error in applying revenue measurement principles in certain Technology Infrastructure andEnergy Infrastructure businesses subject to AICPA Statement of Position 81-1, Accounting for Performance of Construction-Type andCertain Production-Type Contracts. 2006 Year
Increase (decrease) (In millions) First
quarter Secondquarter
Thirdquarter
Fourthquarter Total 2005 2004 2003(a)
GE CONSOLIDATED Revenues
As reported(b) $ 35,247 $ 37,160 $ 37,801 $ 41,776 $ 151,984 $ 136,404 $ 123,654 $ 104,382 Cut-off 293 (128) 10 (536) (361) (177) 59 (15)Contract cost (25) (10) (24) (76) (135) (78) (19) (31)Spare parts profit 21 15 (9) 34 61 163 152 (39)Contract estimates − − − − − − (12) (1)Not adjusted (13) 6 8 18 19 (50) (20) 41 Adjusted $ 35,523 $ 37,043 $ 37,786 $ 41,216 $ 151,568 $ 136,262 $ 123,814 $ 104,337
Earnings from continuing operations before accounting changes As reported(b) $ 3,930 $ 4,686 $ 4,743 $ 6,071 $ 19,430 $ 17,268 $ 15,527 $ 13,214 Cut-off 81 (36) 8 (115) (62) (46) (12) (15)Contract cost (9) (2) (11) (45) (67) (30) (6) (14)Spare parts profit 13 9 (5) 21 38 102 96 (25)Contract estimates − − − − − − (8) − Not adjusted (4) 2 2 5 5 (15) (6) 12 Adjusted $ 4,011 $ 4,659 $ 4,737 $ 5,937 $ 19,344 $ 17,279 $ 15,591 $ 13,172
Net earnings As reported $ 4,440 $ 4,946 $ 4,867 $ 6,576 $ 20,829 $ 16,711 $ 17,160 $ 15,561 Cut-off 79 (34) 8 (116) (63) (48) (14) (16)Contract cost (9) (2) (11) (45) (67) (30) (6) (14)Spare parts profit 13 9 (5) 21 38 102 96 (25)Contract estimates − − − − − − (8) − Not adjusted (4) 2 2 5 5 (15) (6) 12 Adjusted $ 4,519 $ 4,921 $ 4,861 $ 6,441 $ 20,742 $ 16,720 $ 17,222 $ 15,518
(a) Amounts for 2003 have been revised to correct an error in the spare parts profit adjustments previously reported in our filing on Form 8-K datedJanuary 18, 2008. This correction decreased 2003 net earnings by $202 million, correcting an adjustment of the same amount previouslyattributed to one correction in 2002.
(b) As reported amounts reflect the GE Money Japan business as discontinued operations.
As previously reported in our second quarter 2008 Form 10-Q, during the course of an internal review in connection with our ongoingU.S. Securities and Exchange Commission (SEC) investigation, we identified certain immaterial items with respect to the Statement ofCash Flows that we have corrected from amounts in previous filings. These items primarily relate to elimination of intercompanytransactions between GE and GECS and include effects of clerical errors, errors in elimination classifications among operating,investing and financing activities and transaction-reporting errors involving identification of intercompany transactions that had notpreviously been eliminated in the Consolidated Statement of Cash Flows. These errors had no effects on our total cash or cashequivalents, nor did they affect our financial position or results of operations. The effects of these immaterial corrections for theStatement of Cash Flows for the years ended December 31, 2007, 2006 and 2005 follows.
(114)
Source: GENERAL ELECTRIC CO, 8-K, October 08, 2008
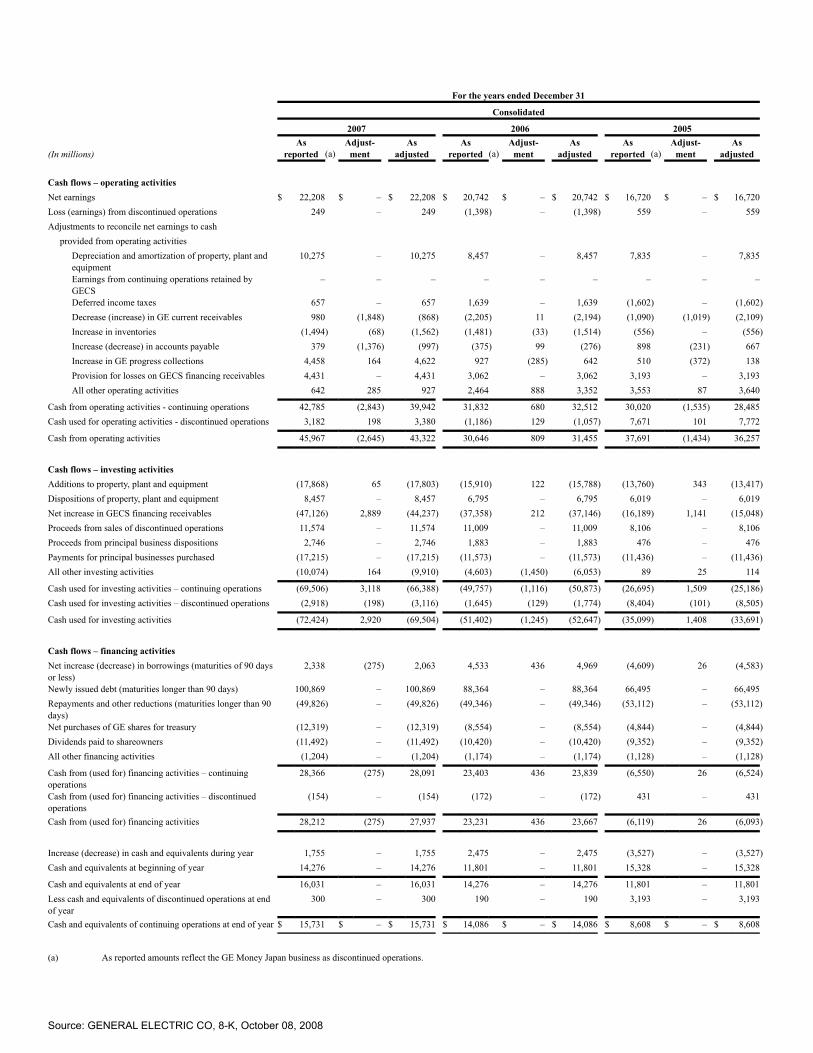
For the years ended December 31 Consolidated 2007 2006 2005
(In millions)As
reported (a)Adjust-
ment As
adjusted As
reported (a)Adjust-
ment As
adjusted As
reported (a)Adjust-
ment As
adjusted Cash flows – operating activities Net earnings $ 22,208 $ – $ 22,208 $ 20,742 $ – $ 20,742 $ 16,720 $ – $ 16,720 Loss (earnings) from discontinued operations 249 – 249 (1,398) – (1,398) 559 – 559 Adjustments to reconcile net earnings to cash
provided from operating activities Depreciation and amortization of property, plant andequipment
10,275 – 10,275 8,457 – 8,457 7,835 – 7,835 Earnings from continuing operations retained byGECS
– – – – – – – – – Deferred income taxes 657 – 657 1,639 – 1,639 (1,602) – (1,602)Decrease (increase) in GE current receivables 980 (1,848) (868) (2,205) 11 (2,194) (1,090) (1,019) (2,109)Increase in inventories (1,494) (68) (1,562) (1,481) (33) (1,514) (556) – (556)Increase (decrease) in accounts payable 379 (1,376) (997) (375) 99 (276) 898 (231) 667 Increase in GE progress collections 4,458 164 4,622 927 (285) 642 510 (372) 138 Provision for losses on GECS financing receivables 4,431 – 4,431 3,062 – 3,062 3,193 – 3,193 All other operating activities 642 285 927 2,464 888 3,352 3,553 87 3,640
Cash from operating activities - continuing operations 42,785 (2,843) 39,942 31,832 680 32,512 30,020 (1,535) 28,485 Cash used for operating activities - discontinued operations 3,182 198 3,380 (1,186) 129 (1,057) 7,671 101 7,772 Cash from operating activities 45,967 (2,645) 43,322 30,646 809 31,455 37,691 (1,434) 36,257 Cash flows – investing activities Additions to property, plant and equipment (17,868) 65 (17,803) (15,910) 122 (15,788) (13,760) 343 (13,417)Dispositions of property, plant and equipment 8,457 – 8,457 6,795 – 6,795 6,019 – 6,019 Net increase in GECS financing receivables (47,126) 2,889 (44,237) (37,358) 212 (37,146) (16,189) 1,141 (15,048)Proceeds from sales of discontinued operations 11,574 – 11,574 11,009 – 11,009 8,106 – 8,106 Proceeds from principal business dispositions 2,746 – 2,746 1,883 – 1,883 476 – 476 Payments for principal businesses purchased (17,215) – (17,215) (11,573) – (11,573) (11,436) – (11,436)All other investing activities (10,074) 164 (9,910) (4,603) (1,450) (6,053) 89 25 114 Cash used for investing activities – continuing operations (69,506) 3,118 (66,388) (49,757) (1,116) (50,873) (26,695) 1,509 (25,186)Cash used for investing activities – discontinued operations (2,918) (198) (3,116) (1,645) (129) (1,774) (8,404) (101) (8,505)
Cash used for investing activities (72,424) 2,920 (69,504) (51,402) (1,245) (52,647) (35,099) 1,408 (33,691)
Cash flows – financing activities Net increase (decrease) in borrowings (maturities of 90 daysor less)
2,338 (275) 2,063 4,533 436 4,969 (4,609) 26 (4,583)
Newly issued debt (maturities longer than 90 days) 100,869 – 100,869 88,364 – 88,364 66,495 – 66,495 Repayments and other reductions (maturities longer than 90days)
(49,826) – (49,826) (49,346) – (49,346) (53,112) – (53,112)
Net purchases of GE shares for treasury (12,319) – (12,319) (8,554) – (8,554) (4,844) – (4,844)Dividends paid to shareowners (11,492) – (11,492) (10,420) – (10,420) (9,352) – (9,352)All other financing activities (1,204) – (1,204) (1,174) – (1,174) (1,128) – (1,128)
Cash from (used for) financing activities – continuingoperations
28,366 (275) 28,091 23,403 436 23,839 (6,550) 26 (6,524)
Cash from (used for) financing activities – discontinuedoperations
(154) – (154) (172) – (172) 431 – 431
Cash from (used for) financing activities 28,212 (275) 27,937 23,231 436 23,667 (6,119) 26 (6,093)
Increase (decrease) in cash and equivalents during year 1,755 – 1,755 2,475 – 2,475 (3,527) – (3,527)Cash and equivalents at beginning of year 14,276 – 14,276 11,801 – 11,801 15,328 – 15,328 Cash and equivalents at end of year 16,031 – 16,031 14,276 – 14,276 11,801 – 11,801 Less cash and equivalents of discontinued operations at endof year
300 – 300 190 – 190 3,193 – 3,193
Cash and equivalents of continuing operations at end of year $ 15,731 $ – $ 15,731 $ 14,086 $ – $ 14,086 $ 8,608 $ – $ 8,608
(a) As reported amounts reflect the GE Money Japan business as discontinued operations.
Source: GENERAL ELECTRIC CO, 8-K, October 08, 2008

NOTE 31 SUBSEQUENT EVENT On February 4, 2008, we acquired most of Merrill Lynch and Co., Inc.’s wholly-owned middle-market commercial finance business,Merrill Lynch Capital. This acquisition of over $12 billion in assets expands our Capital Finance business, and was primarily fundedthrough the issuance of debt by GECS in the first quarter of 2008.
(115)
Source: GENERAL ELECTRIC CO, 8-K, October 08, 2008

Our Businesses A description of operating segments for General Electric Company and consolidated affiliates as of December 31, 2007, and the basisfor presentation in this report, follows. Technology Infrastructure Jet engines, aerospace systems and equipment, replacement parts and repair and maintenance services for all categories of commercialaircraft; for a wide variety of military aircraft, includ-ing fighters, bombers, tankers and helicopters; for marine appli-cations; and forexecutive and regional aircraft. Products and services are sold worldwide to airframe manufacturers, airlines and governmentagencies.
Diagnostic imaging systems such as magnetic resonance (MR), computed tomography (CT) and positron emissiontomography (PET) scanners, X-ray, nuclear imaging and ultrasound. Patient monitoring, diagnostic cardiology, bone densitometry,anesthe-sia, oxygen therapy, neonatal and critical care devices. Related services, including equipment monitoring and repair,information technologies and customer productivity services. Diagnostic imaging agents used in medical scanning procedures,products used in the purification of biopharmaceuticals, and tools for pro-tein and cellular analysis for pharmaceutical and academicresearch. Products and services are sold worldwide to hospitals, medical facilities, pharmaceutical and biotechnology companies, andto the life science research market.
Transportation products and maintenance services, including diesel electric locomotives, transit propulsion equipment,motor-ized wheels for off-highway vehicles, gearing technology for wind turbines, drill motors, marine and stationary powergenera-tion, and railway signaling and office systems. Measurement equipment (products and subsystems for sens-ing temperature, flow rates, humidity, pressure and inspectionequipment that monitors and tests materials without disassem-bly or damaging them). Security equipment and systems, includ-ingintrusion and access control systems, video surveillance and sensor monitoring equipment, integrated facility monitoring sys-tems andexplosive detection systems. A broad range of automa-tion hardware and software and electrical distribution and power controlproducts. Markets are extremely diverse. Products and services are sold to residential, commercial and industrial end-users, includingutilities; original equipment manu-facturers; electrical distributors; retail outlets; airports; railways; and transit authorities.Increasingly, products and services are developed for and sold in global markets. Energy Infrastructure Power plant products and services, including design, installa-tion, operation and maintenance services are sold into global markets.Gas, steam and aeroderivative turbines, generators, combined cycle systems, controls and related services, including total assetoptimization solutions, equipment upgrades and long-term maintenance service agreements are sold to power genera-tion and otherindustrial customers. Renewable energy solutions include wind turbines and solar technology. Advanced technology equipment,principally compressors and turbines, and associated services (including pipeline inspection and integrity solutions) for applicationsacross the oil and gas industry from the wellhead through distribution by pipeline. The acquisition of Vetco Gray has added products,systems and services for onshore and off-shore drilling, completion and production to the portfolio.
Water treatment services and equipment, including specialty chemical treatment programs, water purification equipment,mobile treatment systems and desalination processes.
Source: GENERAL ELECTRIC CO, 8-K, October 08, 2008

(116)
Source: GENERAL ELECTRIC CO, 8-K, October 08, 2008

Capital Finance Loans, leases and other financial services to customers, includ-ing manufacturers, distributors and end-users for a variety of equipmentand major capital assets. These assets include indus-trial-related facilities and equipment; commercial and residential real estate;vehicles; corporate aircraft; and equipment used in many industries, including the construction, manufacturing, transportation,telecommunications and healthcare industries.
Private-label credit cards; personal loans; bank cards; auto loans and leases; mortgages; debt consolidation; home equityloans; corporate travel and purchasing cards; deposits and other savings products; and small and medium enterprise lending on aglobal basis.
Financial products to airlines, aircraft operators, owners, lend-ers and investors, including leases, aircraft purchasing andtrad-ing, loans, engine/spare parts financing, fleet planning and financial advisory services.
Financial products to the global energy and water industries include structured and common equity, debt, leasing, projectfinance, broad-based commercial finance and investments in operating leases. NBC Universal Principal businesses are the broadcast of U.S. network television, production and distribution of motion pictures and televisionprograms, operation of 26 television stations, operation of cable/satellite television networks around the world, operation of themeparks, and investment and programming activities in digi-tal media and the Internet. Consumer & Industrial Major appliances and related services for products such as refrig-erators, freezers, electric and gas ranges, cooktops, dishwashers,clothes washers and dryers, microwave ovens, room air condition-ers and residential water system products. These products aredistributed both to retail outlets and direct to consumers, mainly for the replacement market, and to building contractors anddis-tributors for new installations. Lighting products include a wide variety of lamps and lighting fixtures, including light-emittingdiodes. Electrical distribution and control equipment includes controls and drives, lighting and power panels, switchgear, and circuitbreakers. Products and services are sold in North America and in global markets under various GE and private-label brands.
(117)
Source: GENERAL ELECTRIC CO, 8-K, October 08, 2008

Supplemental Information Financial Measures that Supplement Generally Accepted Accounting Principles We sometimes use information derived from consolidated financial information but not presented in our financial statements preparedin accordance with U.S. generally accepted accounting principles (GAAP). Certain of these data are considered “non-GAAP financialmeasures” under U.S. Securities and Exchange Commission rules. Specifically, we have referred, in various sections of this AnnualReport, to:
• Organic revenue growth in 2007, 2006, 2005, 2004 and 2003, and the average for the three years ended December 31, 2007
• Growth in industrial cash from operating activities (CFOA) in 2007
• Free cash flow in 2007, 2006, 2005, 2004 and 2003
• Average total shareowners’ equity, excluding effects of discontinued operations
• GE earnings from continuing operations before income taxes, excluding GECS earnings from continuing operations and thecorresponding effective tax rates, for the three years ended December 31, 2007
• GE income tax rate, excluding GECS earnings, for the three years ended December 31, 2007
• Delinquency rates on managed equipment financing loans and leases and managed consumer financing receivables for 2007,
2006 and 2005 The reasons we use these non-GAAP financial measures and the reconciliations to their most directly comparable GAAP financialmeasures follow. Organic Revenue Growth in 2007 (In millions) 2007 2006 % change GE consolidated revenues as reported $ 172,488 $ 151,568 Less the effects of Acquisitions, business dispositions (other than dispositions
of businesses acquired for investment)and currency exchange rates 12,803 4,992
The 2006 Olympics broadcasts − 684 Reclassification of discontinued operations (250) (275) GE consolidated revenues excluding the effects of
acquisitions, business dispositions (other than dispositions of businesses acquired for investment), currency exchange rates, the 2006 Olympics broadcasts and reclassifications
of discontinued operations (organic revenues) $ 159,935 $ 146,167 9%
(118)
Source: GENERAL ELECTRIC CO, 8-K, October 08, 2008

Organic Revenue Growth in 2006 (In millions) 2006 2005 % change GE consolidated revenues as reported $ 151,568 $ 136,262 Less the effects of
Acquisitions, business dispositions (other than dispositions of businesses acquired for investment) and currency exchange rates 5,213 2,750
The 2006 Olympics broadcasts 684 − Investigation-related adjustments
Revenue recognition (416) (142) GECS interest rate swaps 197 540
Reclassifications of discontinued operations (11,407) (11,552) GE consolidated revenues excluding the effects of acquisitions,
business dispositions (other than dispositions of businesses acquired for investment), currency exchange rates, the 2006 Olympics broadcasts, investigation- related adjustments and reclassifications of discontinued operations (organic revenues) $ 157,297 $ 144,666 9%
Organic Revenue Growth in 2005 (In millions) 2005 2004 % change GE consolidated revenues as reported $ 136,262 $ 123,814 Less the effects of
Acquisitions, business dispositions (other than dispositions of businesses acquired for investment) and currency exchange rates 8,275 3,818
The 2004 Olympics broadcasts − 927 Investigation-related adjustments
Revenue recognition (142) 160 GECS interest rate swaps 540 518 SFAS 133 − 503
Reclassifications of discontinued operations (11,552) (10,637) GE consolidated revenues excluding the effects of acquisitions,
business dispositions (other than dispositions of businesses acquired for investment), currency exchange rates, the 2004 Olympics broadcasts, investigation-related adjustments and reclassifications of discontinued operations (organic revenues) $ 139,141 $ 128,525 8%
Three-year average 9%
(119)
Source: GENERAL ELECTRIC CO, 8-K, October 08, 2008
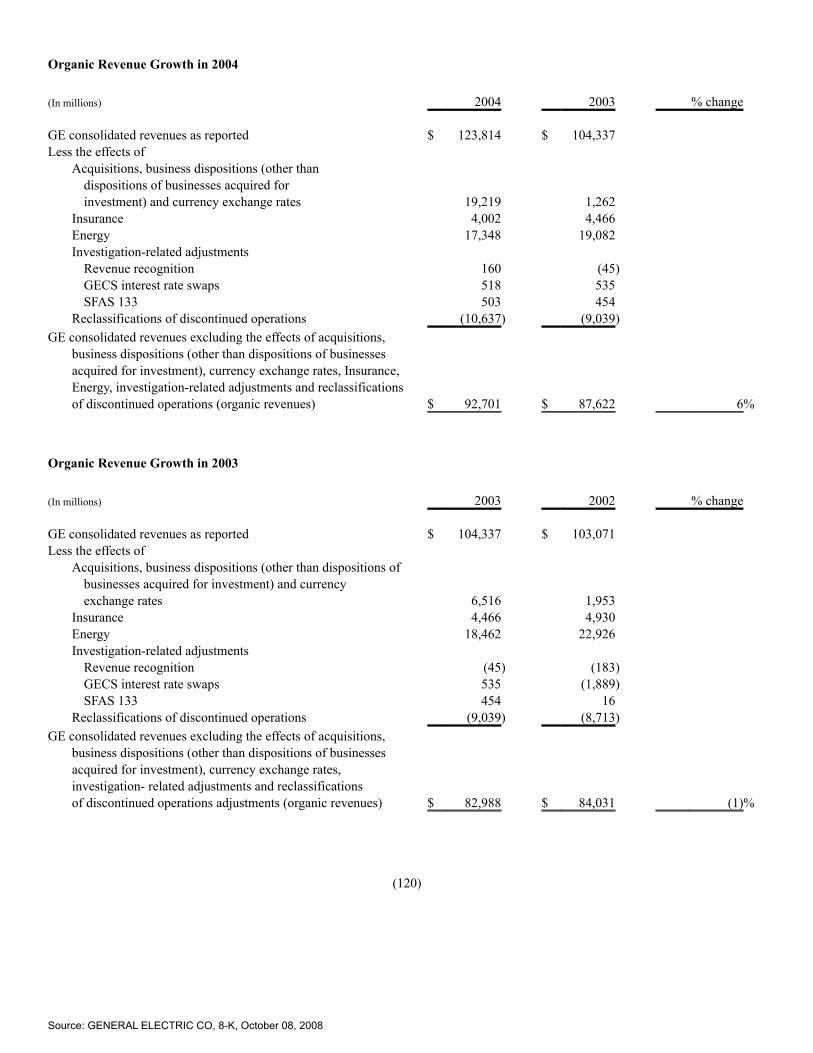
Organic Revenue Growth in 2004 (In millions) 2004 2003 % change GE consolidated revenues as reported $ 123,814 $ 104,337 Less the effects of
Acquisitions, business dispositions (other than dispositions of businesses acquired for investment) and currency exchange rates 19,219 1,262
Insurance 4,002 4,466 Energy 17,348 19,082 Investigation-related adjustments
Revenue recognition 160 (45) GECS interest rate swaps 518 535 SFAS 133 503 454
Reclassifications of discontinued operations (10,637) (9,039) GE consolidated revenues excluding the effects of acquisitions,
business dispositions (other than dispositions of businesses acquired for investment), currency exchange rates, Insurance, Energy, investigation-related adjustments and reclassifications of discontinued operations (organic revenues) $ 92,701 $ 87,622 6%
Organic Revenue Growth in 2003 (In millions) 2003 2002 % change GE consolidated revenues as reported $ 104,337 $ 103,071 Less the effects of
Acquisitions, business dispositions (other than dispositions of businesses acquired for investment) and currency exchange rates 6,516 1,953
Insurance 4,466 4,930 Energy 18,462 22,926 Investigation-related adjustments
Revenue recognition (45) (183) GECS interest rate swaps 535 (1,889) SFAS 133 454 16
Reclassifications of discontinued operations (9,039) (8,713) GE consolidated revenues excluding the effects of acquisitions,
business dispositions (other than dispositions of businesses acquired for investment), currency exchange rates, investigation- related adjustments and reclassifications of discontinued operations adjustments (organic revenues) $ 82,988 $ 84,031 (1)%
(120)
Source: GENERAL ELECTRIC CO, 8-K, October 08, 2008

Growth in Industrial CFOA (In millions) 2007 2006 % change Cash from GE’s operating activities as reported $ 23,301 $ 23,772 Less dividends from GECS 7,291 9,847 Cash from GE’s operating activities excluding dividends
from GECS (industrial CFOA) $ 16,010 $ 13,925 15%
Free Cash Flow (In millions) 2007 2006 2005 2004 2003 GE cash flow from operating activities
continuing operations as reported $ 23,301 $ 23,772 $ 19,809 $ 13,284 $ 11,465 Adjusted for the effects of
Additions to property, plant and equipment (2,968) (2,913) (2,132) (1,685) (1,733)Proceeds from sales of discontinued
operations 10,826 1,987 — — — Proceeds from principal business
dispositions 1,047 1,497 267 707 85 Dividends paid to shareowners (11,492) (10,420) (9,352) (8,278) (7,643)All other investing activities (1,697) 100 1,519 705 64 Investigation-related adjustments – – – 348 210
GE cash flow from operating activities continuing operations as reported less the effects of proceeds from sales of discontinued operations, additions to property,plant and equipment, proceeds
from principal business dispositions, dividends paid to shareowners, and all other investing activities (free cash flow) $ 19,017 $ 14,023 $ 10,111 $ 5,081 $ 2,448
Average Total Shareowners’ Equity, Excluding Effects of Discontinued Operations(a)
December 31 (In millions) 2007 2006 2005 2004 2003 Average total shareowners’ equity(b) $ 113,842 $ 109,174 $ 110,998 $ 94,521 $ 71,367 Less the effects of Cumulative earnings from discontinued operations − − 2,094 2,985 1,543 Average net investment in discontinued operations 3,640 11,658 13,298 8,743 8,054 Average total shareowners’ equity, excluding effects of
discontinued operations(a) $ 110,202 $ 97,516 $ 95,606 $ 82,793 $ 61,770
(a) Used for computing return on average shareowners’ equity and return on average total capital invested shown in the Selected Financial Datasection.
(b) On an annual basis, calculated using a five-point average.
(121)
Source: GENERAL ELECTRIC CO, 8-K, October 08, 2008

U.S. GAAP requires earnings of discontinued operations to be displayed separately in the Statement of Earnings. Accordingly, thenumerators used in our calculations of returns on average shareowners’ equity and average total capital invested, presented in theSelected Financial Data section, exclude those earnings (losses). Further, we believe that it is appropriate to exclude from thedenominators, specifically the average total shareowners’ equity component, the cumulative effect of those earnings for each of theyears for which related discontinued operations were presented, as well as our average net investment in discontinued operations sincethe second half of 2005. Had we disposed of these operations before mid-2005, proceeds would have been applied to reduceparent-supported debt at GE Capital; however, since parent-supported debt at GE Capital was retired in the first half of 2005, we haveassumed that any proceeds after that time would have been distributed to shareowners by means of share repurchases, thus reducingaverage total shareowners’ equity.
Definitions indicating how the above-named ratios are calculated using average total shareowners’ equity, excluding effectsof discontinued operations, can be found in the Glossary. GE Income Tax Rate, Excluding GECS Earnings (In millions) 2007 2006 2005 GE earnings from continuing operations before income taxes $ 25,251 $ 21,896 $ 19,957 Less GECS earnings from continuing operations 12,417 10,219 8,929 Total $ 12,834 $ 11,677 $ 11,028
GE provision for income taxes $ 2,794 $ 2,552 $ 2,678 GE effective tax rate, excluding GECS earnings 21.8% 21.9% 24.3%
Reconciliation of U.S. Federal Statutory Income Tax Rate to GE Income Tax Rate, Excluding GECS Earnings 2007 2006 2005 U.S. federal statutory income tax rate 35.0% 35.0% 35.0%Increase (reduction) in rate resulting from
Tax on global activities including exports (9.9) (12.2) (9.1)U.S. business credits (0.6) (0.7) (0.3)
All other − net (2.7) (0.2) (1.3) (13.2) (13.1) (10.7)GE income tax rate, excluding GECS earnings 21.8% 21.9% 24.3%
We believe that meaningful analysis of our financial performance requires an understanding of the factors underlying thatperformance and our judgments about the likelihood that particular factors will repeat. In some cases, short-term patterns andlong-term trends may be obscured by large factors or events. For example, events or trends in a particular segment may be sosignificant as to obscure patterns and trends of our industrial or financial services businesses in total. For this reason, we believe thatinvestors may find it useful to see our revenue growth without the effect of acquisitions, dispositions and currency exchange rates, andwithout the effects of the 2006 and 2004 Olympics broadcasts, the investigation-related adjustments and the reclassification ofdiscontinued operations, which if included would overshadow trends in ongoing revenues. Similarly, we believe that investors wouldfind it useful to compare our 2007 operating cash flow against our 2006 operating cash flow without the effects of GECS dividends,which can vary from period to period.
Source: GENERAL ELECTRIC CO, 8-K, October 08, 2008

(122)
Source: GENERAL ELECTRIC CO, 8-K, October 08, 2008
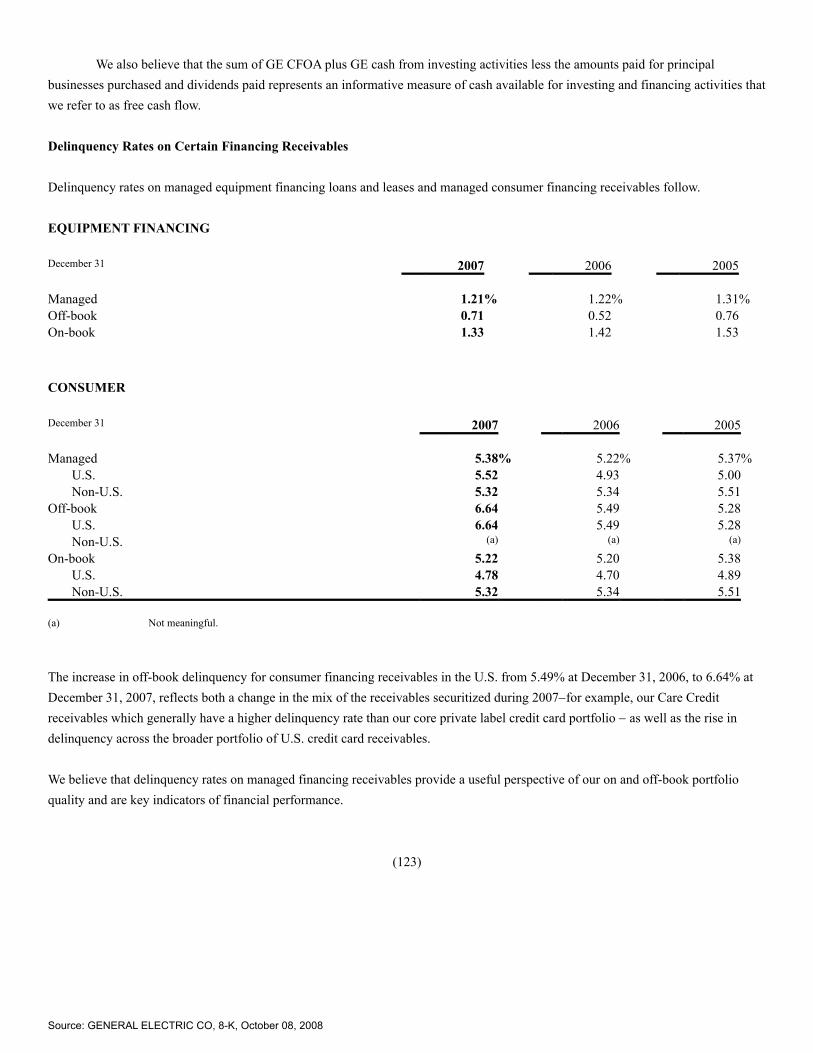
We also believe that the sum of GE CFOA plus GE cash from investing activities less the amounts paid for principalbusinesses purchased and dividends paid represents an informative measure of cash available for investing and financing activities thatwe refer to as free cash flow. Delinquency Rates on Certain Financing Receivables Delinquency rates on managed equipment financing loans and leases and managed consumer financing receivables follow. EQUIPMENT FINANCING December 31 2007 2006 2005 Managed 1.21% 1.22% 1.31%Off-book 0.71 0.52 0.76 On-book 1.33 1.42 1.53
CONSUMER December 31 2007 2006 2005 Managed 5.38% 5.22% 5.37%
U.S. 5.52 4.93 5.00 Non-U.S. 5.32 5.34 5.51
Off-book 6.64 5.49 5.28 U.S. 6.64 5.49 5.28 Non-U.S. (a) (a) (a)
On-book 5.22 5.20 5.38 U.S. 4.78 4.70 4.89 Non-U.S. 5.32 5.34 5.51
(a) Not meaningful.
The increase in off-book delinquency for consumer financing receivables in the U.S. from 5.49% at December 31, 2006, to 6.64% atDecember 31, 2007, reflects both a change in the mix of the receivables securitized during 2007−for example, our Care Creditreceivables which generally have a higher delinquency rate than our core private label credit card portfolio − as well as the rise indelinquency across the broader portfolio of U.S. credit card receivables. We believe that delinquency rates on managed financing receivables provide a useful perspective of our on and off-book portfolioquality and are key indicators of financial performance.
(123)
Source: GENERAL ELECTRIC CO, 8-K, October 08, 2008
Glossary BACKLOG Unfilled customer orders for products and product services (12 months for product services). BORROWING Financial liability (short or long-term) that obligates us to repay cash or another financial asset to another entity. BORROWINGS AS A PERCENTAGE OF TOTAL CAPITAL INVESTED For GE, the sum of borrowings and mandatorilyredeemable preferred stock, divided by the sum of borrowings, mandatorily redeemable preferred stock, minority interest and totalshareowners’ equity. CASH EQUIVALENTS Highly liquid debt instruments with original maturities of three months or less, such as commercial paper.Typically included with cash for reporting purposes, unless designated as available-for-sale and included with investment securities. CASH FLOW HEDGES Qualifying derivative instruments that we use to protect ourselves against exposure to volatility in futurecash flows. The exposure may be associated with an existing asset or liability, or with a forecasted transaction. See “Hedge.” COMMERCIAL PAPER Unsecured, unregistered promise to repay borrowed funds in a specified period ranging from overnight to270 days. DERIVATIVE INSTRUMENT A financial instrument or contract with another party (counterparty) that is structured to meet any ofa variety of financial objectives, including those related to fluctuations in interest rates, currency exchange rates or commodity prices.Options, forwards and swaps are the most common derivative instruments we employ. See “Hedge.” DISCONTINUED OPERATIONS Certain businesses we have sold or committed to sell within the next year and which will nolonger be part of our ongoing operations. The net earnings, assets and liabilities, and cash flows of such businesses are separatelyclassified on our Statement of Earnings, Statement of Financial Position and Statement of Cash Flows, respectively, for all periodspresented. EARNED PREMIUMS Portion of the premium, net of any amount ceded, pertaining to the segment of the policy period for whichinsurance coverage has been provided. EFFECTIVE TAX RATE Provision for income taxes as a percentage of earnings from continuing operations before income taxesand accounting changes. Does not represent cash paid for income taxes in the current accounting period. Also referred to as “actual taxrate” or “tax rate.” EQUIPMENT LEASED TO OTHERS Rental equipment we own that is available to rent and is stated at cost less accumulateddepreciation. FAIR VALUE HEDGE Qualifying derivative instruments that we use to reduce the risk of changes in the fair value of assets,liabilities or certain types of firm commitments. Changes in the fair values of derivative instruments that are designated and effectiveas fair value hedges are recorded in earnings, but are offset by corresponding changes in the fair values of the hedged items. See“Hedge.”
(124)
Source: GENERAL ELECTRIC CO, 8-K, October 08, 2008

FINANCING RECEIVABLES Investment in contractual loans and leases due from customers (not investment securities). FORWARD CONTRACT Fixed price contract for purchase or sale of a specified quantity of a commodity, security, currency orother financial instrument with delivery and settlement at a specified future date. Commonly used as a hedging tool. See “Hedge.” GOODWILL The premium paid for acquisition of a business. Calculated as the purchase price less the fair value of net assetsacquired (net assets are identified tangible and intangible assets, less liabilities assumed). GUARANTEED INVESTMENT CONTRACTS (GICS) Deposit-type products that guarantee a minimum rate of return, whichmay be fixed or floating. HEDGE A technique designed to eliminate risk. Often refers to the use of derivative financial instruments to offset changes in interestrates, currency exchange rates or commodity prices, although many business positions are “naturally hedged” − for example, fundinga U.S. fixed-rate investment with U.S. fixed-rate borrowings is a natural interest rate hedge. INTANGIBLE ASSET A non-financial asset lacking physical substance, such as goodwill, patents, licenses, trademarks andcustomer relationships. INTEREST RATE SWAP Agreement under which two counterparties agree to exchange one type of interest rate cash flow foranother. In a typical arrangement, one party periodically will pay a fixed amount of interest, in exchange for which that party willreceive variable payments computed using a published index. See “Hedge.” INVESTMENT SECURITIES Generally, an instrument that provides an ownership position in a corporation (a stock), a creditorrelationship with a corporation or governmental body (a bond), or rights to ownership such as those represented by options,subscription rights and subscription warrants. MANAGED RECEIVABLES Total receivable amounts on which we continue to perform billing and collection activities, includingreceivables that have been sold with and without credit recourse and are no longer reported on our balance sheet. MATCH FUNDING A risk control policy that provides funds for a particular financial asset having the same currency, maturity andinterest rate characteristics as that asset. Match funding ensures that we maintain initial financing spreads or margins for the life of afinancial asset, and is executed directly, by issuing debt, or synthetically, through a combination of debt and derivative financialinstruments. For example, when we lend at a fixed interest rate in the U.S., we can borrow those U.S. dollars either at a fixed rate ofinterest or at a floating rate executed concurrently with a pay-fixed interest rate swap. See “Hedge.” MONETIZATION Sale of financial assets to a third party for cash. For example, we sell certain loans, credit card receivables andtrade receivables to third-party financial buyers, typically providing at least some credit protection and often agreeing to providecollection and processing services for a fee. Monetization normally results in gains on interest-bearing assets and losses onnon-interest bearing assets. See “Securitization” and “Variable Interest Entity.” OPERATING PROFIT GE earnings from continuing operations before interest and other financial charges, income taxes and effectsof accounting changes.
(125)
Source: GENERAL ELECTRIC CO, 8-K, October 08, 2008
OPTION The right, not the obligation, to execute a transaction at a designated price, generally involving equity interests, interestrates, currencies or commodities. See “Hedge.” PREMIUM Rate that is charged under insurance/reinsurance contracts. PRODUCT SERVICES For purposes of the financial statement display of sales and costs of sales in our Statement of Earnings,“goods” is required by U.S. Securities and Exchange Commission regulations to include all sales of tangible products, and “services”must include all other sales, including broadcasting and other services activities. In our Management’s Discussion and Analysis ofOperations we refer to sales of both spare parts (goods) and related services as sales of “product services,” which is an important partof our operations. PRODUCT SERVICES AGREEMENTS Contractual commitments, with multiple-year terms, to provide specified services forproducts in our Technology Infrastructure and Energy Infrastructure installed base − for example, monitoring, maintenance, overhauland spare parts for a gas turbine/generator set installed in a customer’s power plant. PRODUCTIVITY The rate of increased output for a given level of input, with both output and input measured in constant currency.A decline in output for a given level of input is “negative” productivity. PROGRESS COLLECTIONS Payments received from customers as deposits before the associated work is performed or product isdelivered. REINSURANCE A form of insurance that insurance companies buy for their own protection. RETAINED INTEREST A portion of a transferred financial asset retained by the transferor that provides rights to receive portionsof the cash inflows from that asset. RETURN ON AVERAGE SHAREOWNERS’ EQUITY Earnings from continuing operations before accounting changes dividedby average total shareowners’ equity, excluding effects of discontinued operations (on an annual basis, calculated using a five-pointaverage). Average total shareowners’ equity, excluding effects of discontinued operations, as of the end of each of the years in thefive-year period ended December 31, 2007, is described in the Supplemental Information section. RETURN ON AVERAGE TOTAL CAPITAL INVESTED For GE, earnings from continuing operations before accountingchanges plus the sum of after-tax interest and other financial charges and minority interest, divided by the sum of the averages of totalshareowners’ equity (excluding effects of discontinued operations), borrowings, mandatorily redeemable preferred stock and minorityinterest (on an annual basis, calculated using a five-point average). Average total shareowners’ equity, excluding effects ofdiscontinued operations as of the end of each of the years in the five-year period ended December 31, 2007, is described in theSupplemental Information section. SECURITIZATION A process whereby loans or other receivables are packaged, underwritten and sold to investors. In a typicaltransaction, assets are sold to a special purpose entity, which purchases the assets with cash raised through issuance of beneficialinterests (usually debt instruments) to third-party investors. Whether or not credit risk associated with the securitized assets is retainedby the seller depends on the structure of the securitization. See “Monetization” and “Variable Interest Entity.”
(126)
Source: GENERAL ELECTRIC CO, 8-K, October 08, 2008

SUBPRIME For purposes of GE Money related discussion, subprime includes credit card, installment and revolving loans to U.S.borrowers whose FICO credit score is less than 660. FICO credit scores are a widely accepted rating of individual consumercreditworthiness. TURNOVER Broadly based on the number of times that working capital is replaced during a year. Accounts receivable turnover istotal sales divided by the five-point average balance of customer receivables from sales of goods and services (trade receivables).Inventory turnover is total sales divided by a five-point average balance of inventories. See “Working Capital.” UNEARNED PREMIUMS Portion of the premium received, net of any amount ceded, that relates to future coverage periods. UNPAID CLAIMS AND CLAIMS ADJUSTMENT EXPENSES Claims reserves for events that have occurred, including bothreported and incurred-but-not-reported (IBNR) reserves, and the expenses of settling such claims. VARIABLE INTEREST ENTITY Entity defined by Financial Accounting Standards Board Interpretation 46 (Revised), and thatmust be consolidated by its primary beneficiary. A variable interest entity has one or both of the following characteristics: (1) itsequity at risk is not sufficient to permit the entity to finance its activities without additional subordinated financial support from otherparties, or (2) as a group, the equity investors lack one or more of the following characteristics: (a) direct/indirect ability to makedecisions, (b) obligation to absorb expected losses, or (c) right to receive expected residual returns. WORKING CAPITAL Sum of receivables from the sales of goods and services, plus inventories, less trade accounts payables andprogress collections.
(127)
Source: GENERAL ELECTRIC CO, 8-K, October 08, 2008

_______________________________________________Created by 10KWizard www.10KWizard.com
Source: GENERAL ELECTRIC CO, 8-K, October 08, 2008