format for submission of monthly progress report by the
TRANSCRIPT


Format for Submission of Monthly Progress Report by the State of
Tamil Nadu
(Hon’ble NGT in the matter of OA No.673/2018 dated 06.12.2019)
October 2020
Sl.
No.
Progress report submitted by
department
Enclosures
1. Commissionerate of Municipal
Administration (CMA)
Enclosed vide Annexure –I
2. Director of Town Panchayat (DTP) Enclosed vide Annexure –II
3. Department of Panchayat Raj and
Rural Development (DRD&PR)
Enclosed vide Annexure –III
4. Public Works Department
PWD&WRD
Enclosed vide Annexure –IV
5. Tamil Nadu Pollution Control Board Enclosed vide Annexure –V

1
National Mission for Clean Ganga
Format for submission of Monthly Progress Report in the NGT Matter OA
No. 673 of 2018 (in compliance to NGT order dated 24.09.2020)
For the State of Tamil Nadu
Month :October 2020
Overall status of the State:
I. Total Population: Urban Population & Rural Population separately: 7,21,47,039 as per
2011 census
II. Estimated Sewage Generation (MLD): 3636.16 MLD
III. Details of Sewage Treatment Plant:
S.No. Details of Sewage Treatment Plant State PRS
1 Existing no. of STPs and Treatment Capacity (in
MLD)
69 &
1616.6
12 &
260.8
2 Capacity Utilization of existing STPs 881.8 116.8
3 MLD of sewage being treated through Alternate
technology
845 1.56
4 Gap in Treatment Capacity in MLD 673.62 114.82
5 No. of Operational STPs 55 12
6 No. of Complying STPs 53 12
7 No. of Non-complying STPs 2 -
1. Details of each existing STP in the Chennai-CMWSSB
No. Location Existing
STP
Capacity
Capacity
Being
Utilized
Operational
Status
of STP
Compliance Status of STP
1 Nesapakkam STP
Zone - IV 23 13 Operational Complied
2 Koyambedu STP
Zone - III 34 30 Operational Complied
3 Kodungaiyur STP
Zone II 80 65 Operational Complied
4 Kodungaiyur STP
Zone I 80 56 Operational Complied
5 Perungudi STP 12 11 Operational Complied

2
Zone - V
6 Koyambedu STP
Zone - III 60 17 Operational Complied
7 Kodungaiyur STP
Zone I& II 110 97 Operational Complied
8 Nesapakkam STP
Zone - IV 40 39 Operational Complied
9 Perungudi STP
Zone - V 54 50 Operational Complied
10 Perungudi STP
Zone – V 60 44 Operational Complied
11 Nesapakkam STP
Zone - IV 54 43 Operational Complied
12 Koyambedu STP
Zone – III 120 60 Operational Complied
13 Sholinganallur STP 18 5 Operational Complied
Total 745 530
2. Details of each existing STP in the State & PRS -CMA
S. No Location
Existing
Capacity of STP
(in MLD)
Capacity
being
Utilized
(in MLD)
Operational
Status of STP
Compliance
Status of
STP
1 Coimbatore
70.00 35.00 Operational Comply
60.00 5.00 Operational Comply
2 Vellore 10.28 7.50 Operational Comply
3 Dindigul 13.65 3.00 Operational Comply
4 Avadi 4.00 2.50
1 STP (4mld) -
Completed
Comply
36 MLD under
progress
5 Madurai
170.70 MLD
38.00 Operational Comply (45.70 + 125.00)
MLD
6 Thanjavur 28.05 14.15 Under Renovation Comply
7 Tiruppur 15.00 7.50 Operational Comply
8 Cuddalore 12.25 6.00 Operational Comply
9 Kanchipuram 14.50 13.50 Operational Comply

3
10 Maraimalai Nagar 2.20 1.80 Operational Comply
11 Pallavapuram
(CMWSSB STP
115@Perungudi) Operational Comply
12 Tiruvallur 6.20 3.60 Operational Comply
13 Chidambaram 9.44 2.10 Operational Comply
14 Thiruvannamalai 8.70 4.50 Operational Comply
15 Viluppuram - 2Nos 12.50 8.60 Operational Comply
16 Arakkonam 11.04 2.00 Under Trial run Comply
17 Thirupathur 11.43 0.50 Under Trial run Comply
18 Bodinayakkanur 12.08 4.00 Operational Comply
19 Chinnamanur 3.99 3.72 Operational Comply
20 Periyakulam 5.47 5.47 Operational Comply
21 Ramanathpuram 7.00 5.80 Operational Comply
22
Theni-
Allinagaram 12.05 6.50 Operational Comply
23 Dharmapuri 4.86 3.50 Operational Comply
24 Karur 15.00 6.50 Operational Comply
25 Krishnagiri 12.34 7.80 Operational Comply
26 Namakkal 5.00 5.00 Operational Comply
27
Nagapattinam
STP-1 9.63 4.50 Operational Comply
Nagapattinam
STP-2 2.69 0.40 Operational Comply
28 Tiruvarur 6.92 4.10 Operational Comply
29 Ariyalur 4.16 1.00 Operational Comply
30 Pudukkottai 10.62 4.00 Operational Comply
31 Perambalur 4.20 3.60 Operational Comply
32
Udhagamandala
m 5.00 4.00 Operational Comply
33 Udumalaipet 7.81 3.50 Operational Comply
34 Virudhunagar 7.65 3.70 Operational Comply
PRS (12 Nos)
35 Tiruchirappalli 58.00 58.00 Operational Comply
36
Salem -
Vellakuttai STP 13.00 7.00 Operational Comply
Salem -
Anaimedu STP 6.00 3.00 Operational Comply
Salem -
Mankuttai STP 35.00 1.00 Operational Comply

4
Salem -
Vandipattai STP 44.00 -
Completed & Power
connection to be
obtained -
37 Tirunelveli 24.20 8.50 Operational Comply
38 Erode 50.55 18.50 Operational Comply
39
Mettur STP-1 0.82 0.38 Opertional Comply
Mettur STP-2 0.92 0.19 Opertional Comply
Mettur STP-3 5.45 2.40 Opertional Comply
40 Kumbakonam 17.00 12.00 Operational Comply
41 Mayiladuthurai 5.85 5.85 Operational Comply
Total 49 nos 857.20 344.26
3. Details of each existing STP in the State-DTP
No. Location Existing
STP
Capacity
Capacity
Being
Utilized
Operational Status
of STP
Compliance
Status of STP
1 Mamallapuram TP
2.34 1.00 Operational Complied
2 Orathanadu TP
2.30 1.30 Operational Complied
3 Thiruchendur TP
3.90 1.40 Operational
Non-
Complied 4 Palanichettypatti TP
2.80 2.80 Operational
Non
Complied 5 Thirumazisai TP
3.00 1.00 Operational Complied
Septage Management
6 Karunguzhi 0.024 0.024 Operational Complied
7 Periyanaikanpalayam 0.03 0.03 Operational Complied
1. Details of under construction STPs in the Chennai-CMWSSB
No. Location Capacity of
the plant in
MLD
Physical
Progress in %
Status of I&D
or House
sewer
connections
Completion
Timeline
1 Sholinganallur STP 54 80 Nil Dec 2020
2 Thiruvottriyur STP 31 100 Nil -
3 Kodungaiyur STP
Zone - I 120 31 Nil Feb 2022
4 Kodungaiyur STP
Zone - II 120 33
Nil Feb 2022
5 Nesapakkam STP 50 28 Nil Feb 2022

5
Zone - IV
6 Perungudi STP
Zone - V 60 22
Nil Feb 2022
Total 435
2. Details of under construction STPs in the State & PRS-CMA
S.No Location
Capacity
of the
plant in
MLD
Physical
Progress
in %
Status of
I&D or
House
sewer
connections
Completion Timeline
1 Ambur 16.71 - -
Alternate site to be
identified & it will be
completed on Oct’22.
2 Avadi 36.00 80% - March-21
3
Coimbatore -
Nanjudapuram 40.00 70% - Feb-21
Coimbatore –
Kuruchi &
kuniyamuthur 30.53 23% - Jan-22
4 Karaikudi 16.00 70% - March-21
5 Nagercoil 17.66 90% - Dec-20
6 Pollachi 11.25 83% - Dec-20
7 Rajapalayam 21.85 - -
Work order issued &
Design under scrutiny
& it will be completed
on Dec’21.
8 Rameshwaram 4.08 35% - Dec’21
9 Rasipuram 6.96 100% -
Collection system will
be Completed on
Dec’20
10 Saththur 4.65 67% - March-21
11 Tambaram 30.00 96% 3930 December’20
12 Tiruppur (3nos) 70.00 30% - March-22
13 Tuticorin 28.00 45% - March-21
14 Vellore 50.00 39% - March-21
PRS (4 Nos)
15
Trichirapalli-
STP1 30.00 52% - July-21
Trichirapalli-
STP2 37.00 35% - Aug-21
16 Sathiyamangalam 4.08 99% - Dec’20

6
S.No Location
Capacity
of the
plant in
MLD
Physical
Progress
in %
Status of
I&D or
House
sewer
connections
Completion Timeline
17 Mettupalayam 8.65 82% - June- 21
Total (21 nos) 463.42
3. Details of under construction STPs in the State-DTP
No. Location Capacity of
the plant in
MLD
Physical
Progress in %
Status of I&D or
House sewer
connections
Completion
Timeline
1 Ulunderpettai TP
3.15
99% completed
6176 Dec-20
2 Sriperumbudur TP
8.50
80% completed
5028 Work in
progress
March-21 3 Velankanni TP
2.33
100%
completed 1320 Dec-20
4 Thiruporur TP 4.02
63%
completed 3288 Mar-21
5 Ponneri TP
6.52
30%
completed 1132 Mar-21
6 Manachanallur TP
6.41
95% completed
3671 1990
Dec-20 7 S.Kannanur TP
8 Vallam TP
2.35
97% completed
2967 Jan-21
9 Perundurai TP
3.14
90% completed
3390 Jan-21
10 Melachokanathapuram TP
2.00
40% completed
1270 May-21
Septage Management
11 Mudukulathur TP 0.015
65%
completed - Dec-20
12 Jalakandapuram TP 0.015
75%
completed - Dec-20
13 Pennagaram TP 0.015
20% completed
- Dec-20
14 Kaveripattinam TP 0.015
60% completed
- Dec-20
15 Chengam TP 0.020
70% completed
- Dec-20
16 Kurumbalur TP 0.010
45% completed
- Dec-20

7
No. Location Capacity of
the plant in
MLD
Physical
Progress in %
Status of I&D or
House sewer
connections
Completion
Timeline
17 Pennadam TP 0.010
25%
completed - Mar-21
18 Alangayam TP 0.015
30%
completed - Jan-21
1a.Details of proposed FSTPs in the State & PRS-CMA
49 Nos. of FSTPs are proposed & various of implementation. In which 5 Nos. of
FSTPs falls under polluted river stretches (Cauvery- 1, Vasista -1, Sarabanga – 1 &
Thamirabarani – 2.)
S.No Progress Number of FSTPs
1 Completed / Nearing completion 6
2 Intermediate / Advanced stage 20
3 Initial stage/ Preparatory Stage 19
4 Tendering stage DPR 4
Total 49
1b.Details of proposed 2 STPs in the State & PRS-CMA
No. Location Capacity of the
STP proposed in
MLD
Status of Project (at DPR
Stage/ Under Tendering/
Work to be Awarded)
Likely Date of
Completion
1 Sathiyamangalam 1.13 DPR Prepared -
2 Tirunelveli 34.00 Under DPR stage -
2a. Details of proposed STPs in the State-DTP
No. Location Capacity
of the STP
proposed
in MLD
Status of Project (at DPR Stage/ Under Tendering/
Work to be Awarded)
Likely Date
of
Completion
1 Mangadu
Opp to SWM, at
Pattur road
DPR stage-Comprehensive UGSS in Poonamallee cluster A
with Mangadu Town Panchayat and 12 Village Town
Panchayat
2 Chitlapakkam Detailed project Report prepared under TNUISFL for
Sembakkam cluster basis with 13 local bodies(Fund
assistance from Project Development Grant Fund)
3 Madampakkam Detailed project Report prepared under TNUISFL for
Sembakkam cluster basis with 13 local bodies(Fund

8
assistance from Project Development Grant Fund)
4 Peerkankaranai DPR has to be prepared through TNUISFL on cluster basis
5 Perungalathur DPR has to be prepared through TNUISFL on cluster basis
6 Thiruneermalai DPR as to be prepared through TNUISSL by cluster basis
2b. Details of proposed STPs/FSTPs in the PRS-(DTP)
S.
No Name of the ULB
STP/
FSTP
s
STP/F
STPs
capaci
ty in
MLD/
KLD
Status of
DPR
Preparation
Status
of
DPR
appro
val
Status
of
award
of
tender
Designa
ted
nodal
Agency
Treatm
ent
Technol
ogy
along
with
firm
complet
ion
timeline
s
Remarks
1 Musiri TP - - DPR Stage - - PWD -
The DPR is under
preparation by
WAPCOS/ PWD.
2 Sirugamani TP - - DPR Stage - - PWD - “
3 Mohanur TP - - DPR Stage - - PWD - “
4 Velur TP - - DPR Stage - - PWD - “
5 Punjai Pugalur TP - - DPR Stage - - PWD - “
6 Bhavani sagar TP - - DPR Stage - - PWD - “
7 Sirumugai TP - - DPR Stage - - PWD - “
8 Madathukulam TP - - DPR Stage - - PWD - “
9 Omalur TP - - DPR Stage - - PWD - “
10 Poallampatty TP - - DPR Stage - - DTP -
Tamilnadu Water
Investment Company
(M/s. TWIC) has been
appointed as consultant
for preparation of DPR.
The DPR will be
expected to be ready by
31.12.2020
11 Pethanaickenpalay
am TP - - DPR Stage - -
DTP -
“
12 Yethapur TP - - DPR Stage - - DTP - “
13 Belur TP - - DPR Stage - - DTP - “
14 Srivaikundam TP - - DPR Stage - - DTP - “
15 Authoor TP - - DPR Stage - - DTP - “
16 Eral TP - - DPR Stage - - DTP - “
17 Alwarthirunagari
TP - - DPR Stage - -
DTP -
“
18 Then Thiruperai
TP - - DPR Stage - -
DTP -
“
19 Arumuganeri TP - - DPR Stage - - DTP - “
20 Mukkudal TP - - DPR Stage - - DTP - “
21 Gopalasamudram - - DPR Stage - - DTP - “

9
TP
22 Kallidaikurichi TP - - DPR Stage - - DTP - “
23 Cheranmahadevi
TP - - DPR Stage - -
DTP -
“
24 Veeravanallur TP - - DPR Stage - - DTP - “
25 Patthamadai TP - - DPR Stage - - DTP - “
26 Mela Seval TP - - DPR Stage - - DTP - “
27 Kuthalam TP - - DPR Stage - - PWD
- The DPR is under
preparation by
WAPCOS/ PWD.
28 Thirukattupalli TP - - DPR Stage - - PWD - “
29 Thiruvaiyaru TP - - DPR Stage - - PWD - “
IV. Details of Industrial Pollution-TNPCB:
No. Details of Industries State PRS
1. No. of industries in the State: 46,401 7381
2. No. of water polluting industries in the
State:
11,445 1770
3. Quantity of effluent generated from the
industries in MLD:
2835.7 452.696
4. Quantity of Hazardous Sludge
generated from the Industries in TPD:
929250 MT/A (2019-
20)
-
5. Number of industrial units having
ETPs:
11,445 1770
6. Number of industrial units connected
to CETP:
1497 Nil
7. Number and total capacity of ETPs
(details of existing/ under construction
/ proposed)
- -
8. Compliance status of the ETPs: 11,445 Industrial
units having ZLD and
there is no discharge
into the water bodies
1770 Industrial units having
ZLD and there is no
discharge into the water
bodies
9. Number and total capacity of CETPs
(details of existing/ under construction
/ proposed)
Existing – 36,
Capacity -87350 KLD
Proposed – 10
Proposed – 10,

10
Capacity 41 MLD Capacity 41 MLD
10 Status of compliance and operation of
the CETPs
Details furnished below
10a. Status of compliance and operation of the CETPs in the State-TNPCB
S.No. Town No. of
industries
No. of
industrial units
connected to
CETP.
Industrial
Discharge
(KLD)
Status of ETPs Status of CETPs
(existing, under
construction &
proposed)
1 Trichy 1 7 201.4 Complying -
2 Dindigul 1 49 1517 Complying -
3 Perundurai 1 14 1000 Complying -
4 Ambur 1 49 1150 Complying -
5 Ambur 1 17 330 Complying -
6 Peranambut 1 36 600 Complying -
7 Vaniyambadi 1 110 2000 Complying -
8 Ranipet 1 82 3600 Complying -
9 Ranipet
1 79 1875 Complying -
10 Ranipet 1 40 700 Complying -
11 Melvisharam 1 36 600 Complying -
12 Madhavaram 1 15 400 Complying -
13 Pallavaram 1 144 3000 Not Complying -
14 Sivagangai 1 48 49.6 Not Complying -
15 Ambattur 1 211 200 Not Complying -
16 Tiruppur 1 75 7000 Complying -
17 Tiruppur 1 6 180 Complying -
18 Tiruppur 1 29 3555 Complying -
19 Tiruppur 1 12 3520 Complying -
20 Tiruppur 1 18 2750 Complying -
21 Tiruppur 1 60 4785 Complying -
22 Tiruppur 1 28 3748 Complying -
23 Tiruppur 1 69 10758 Complying -
24 Tiruppur 1 4 2250 Complying -

11
25 Tiruppur 1 17 4950 Complying -
26 Tiruppur 1 23 4500 Complying -
27 Tiruppur 1 12 2700 Complying -
28 Tiruppur 1 8 165 Complying -
29 Tiruppur 1 15 2750 Complying -
30 Tiruppur 1 15 2485 Complying -
31 Tiruppur 1 19 4500 Complying -
32 Tiruppur 1 25 3150 Complying -
33 Tiruppur 1 9 1350 Complying -
34 Perundurai 1 14 2681 Complying -
35 Kanchipuram 1 62 1500 Not complying
Under closure
-
36 Kodaikanal 1 40 850 Complying -
Total 36 1497 87350
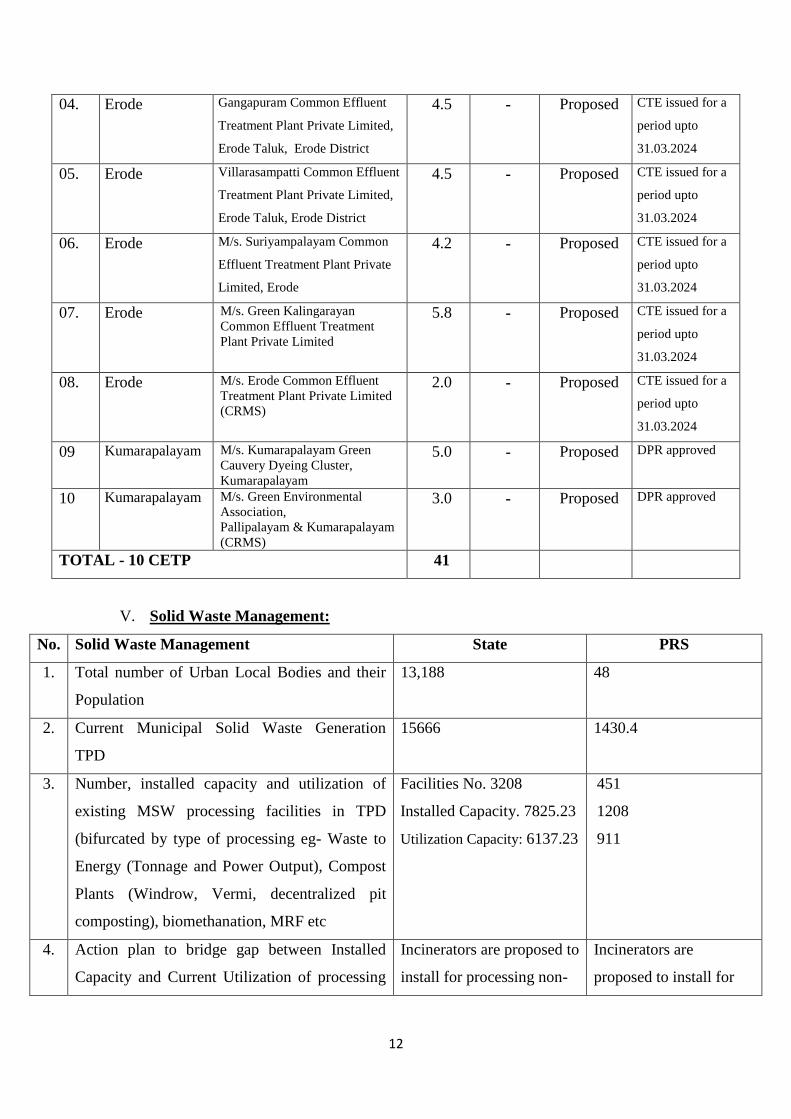
10b. Details of CETP under construction/tendering/proposed in the PRS-TNPCB
S.No. Town Name of CETPs CETP
Capacit
y
(MLD)
Whether
Complyi
ng or not
CETP
Proposed, if
any
Status (DPR/
tendering/
under
construction/
ETC etc.)
01. Perundurai Sree Bhavani Dyeing Cluster
Development Limited,
Perundurai Taluk, Erode District
4 - Proposed CTE issued for a
period upto
31.03.2024
02. Perundurai Kadayampatti Common Effluent
Treatment Plant Bhavani Private
Limited, Perundurai Taluk, Erode
District
6.25 - Proposed CTE issued for a
period upto
31.03.2024
03. Perundurai Kadayampatti Common Reject
Management Systems Private
Limited (CRMS), Perundurai
Taluk, Erode District
1.75 - Proposed CTE issued for a
period upto
31.03.2024
12
04. Erode Gangapuram Common Effluent
Treatment Plant Private Limited,
Erode Taluk, Erode District
4.5 - Proposed CTE issued for a
period upto
31.03.2024
05. Erode Villarasampatti Common Effluent
Treatment Plant Private Limited,
Erode Taluk, Erode District
4.5 - Proposed CTE issued for a
period upto
31.03.2024
06. Erode M/s. Suriyampalayam Common
Effluent Treatment Plant Private
Limited, Erode
4.2 - Proposed CTE issued for a
period upto
31.03.2024
07. Erode M/s. Green Kalingarayan
Common Effluent Treatment
Plant Private Limited
5.8 - Proposed CTE issued for a
period upto
31.03.2024
08. Erode M/s. Erode Common Effluent
Treatment Plant Private Limited
(CRMS)
2.0 - Proposed CTE issued for a
period upto
31.03.2024
09 Kumarapalayam M/s. Kumarapalayam Green
Cauvery Dyeing Cluster,
Kumarapalayam
5.0 - Proposed DPR approved
10 Kumarapalayam M/s. Green Environmental
Association,
Pallipalayam & Kumarapalayam
(CRMS)
3.0 - Proposed DPR approved
TOTAL - 10 CETP 41
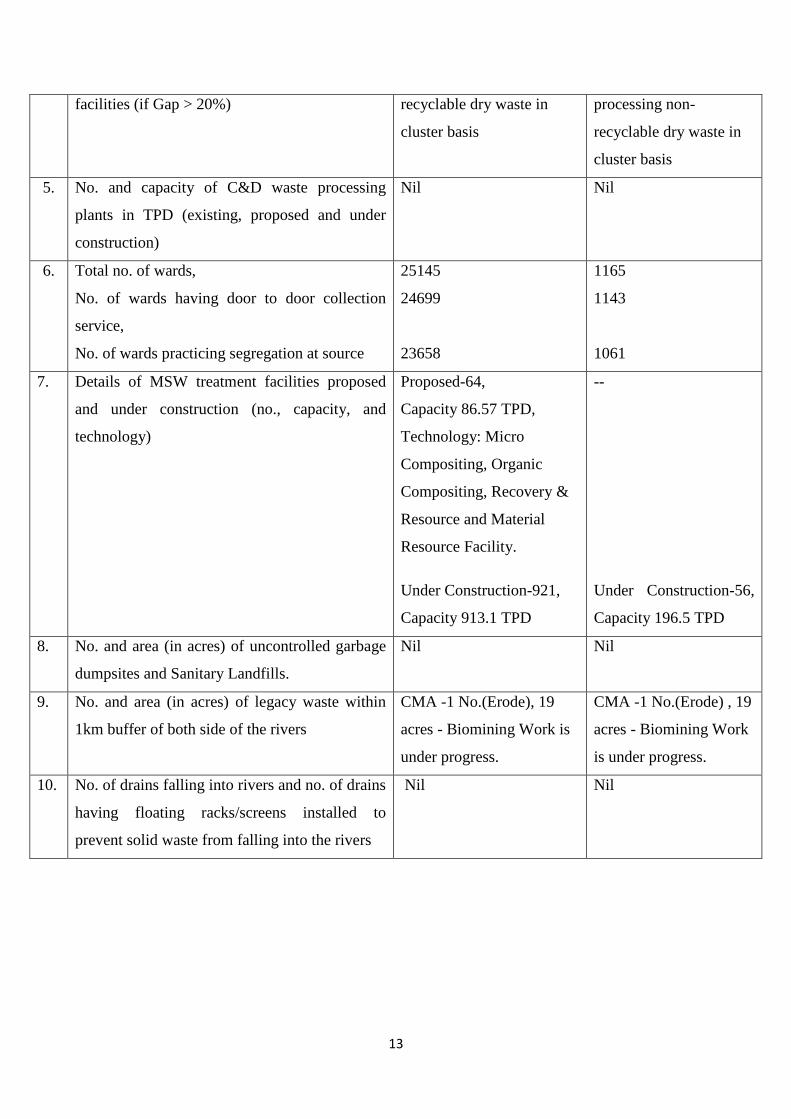
V. Solid Waste Management:
No. Solid Waste Management State PRS
1. Total number of Urban Local Bodies and their
Population
13,188
48
2. Current Municipal Solid Waste Generation
TPD
15666 1430.4
3. Number, installed capacity and utilization of
existing MSW processing facilities in TPD
(bifurcated by type of processing eg- Waste to
Energy (Tonnage and Power Output), Compost
Plants (Windrow, Vermi, decentralized pit
composting), biomethanation, MRF etc
Facilities No. 3208
Installed Capacity. 7825.23
Utilization Capacity: 6137.23
451
1208
911
4. Action plan to bridge gap between Installed
Capacity and Current Utilization of processing
Incinerators are proposed to
install for processing non-
Incinerators are
proposed to install for
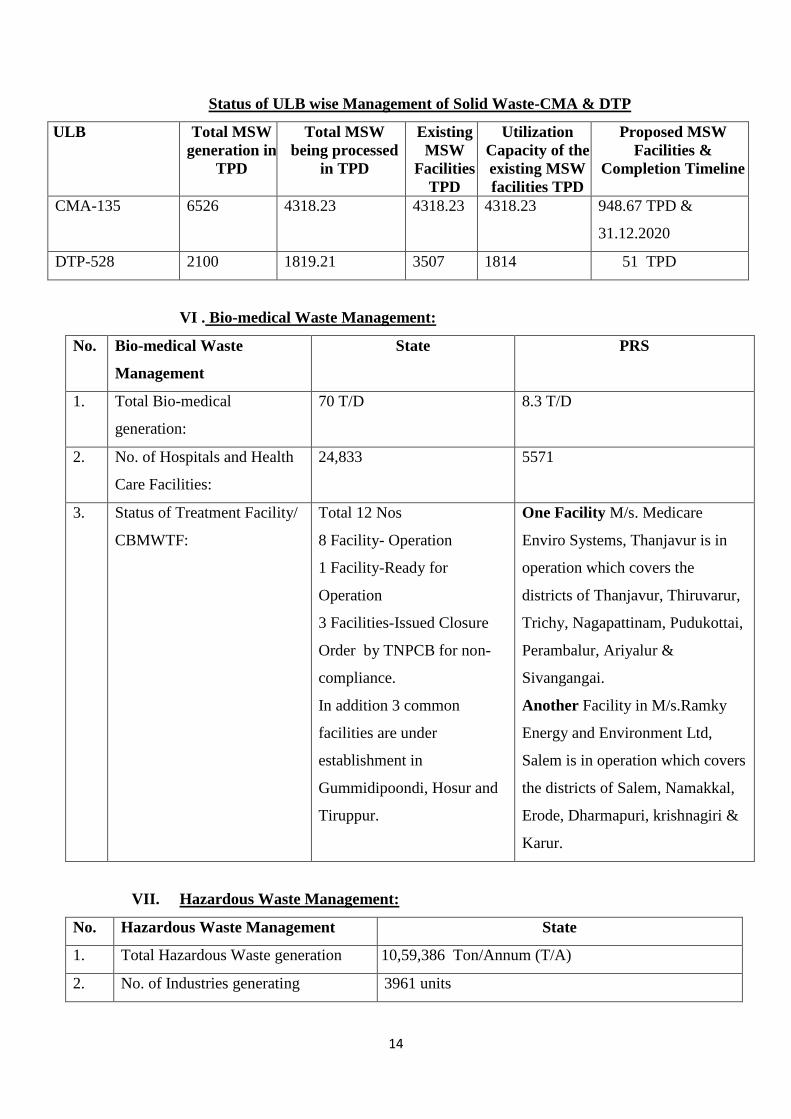
13
facilities (if Gap > 20%) recyclable dry waste in
cluster basis
processing non-
recyclable dry waste in
cluster basis
5. No. and capacity of C&D waste processing
plants in TPD (existing, proposed and under
construction)
Nil Nil
6. Total no. of wards,
No. of wards having door to door collection
service,
No. of wards practicing segregation at source
25145
24699
23658
1165
1143
1061
7. Details of MSW treatment facilities proposed
and under construction (no., capacity, and
technology)
Proposed-64,
Capacity 86.57 TPD,
Technology: Micro
Compositing, Organic
Compositing, Recovery &
Resource and Material
Resource Facility.
Under Construction-921,
Capacity 913.1 TPD
--
Under Construction-56,
Capacity 196.5 TPD
8. No. and area (in acres) of uncontrolled garbage
dumpsites and Sanitary Landfills.
Nil Nil
9. No. and area (in acres) of legacy waste within
1km buffer of both side of the rivers
CMA -1 No.(Erode), 19
acres - Biomining Work is
under progress.
CMA -1 No.(Erode) , 19
acres - Biomining Work
is under progress.
10. No. of drains falling into rivers and no. of drains
having floating racks/screens installed to
prevent solid waste from falling into the rivers
Nil
Nil
14
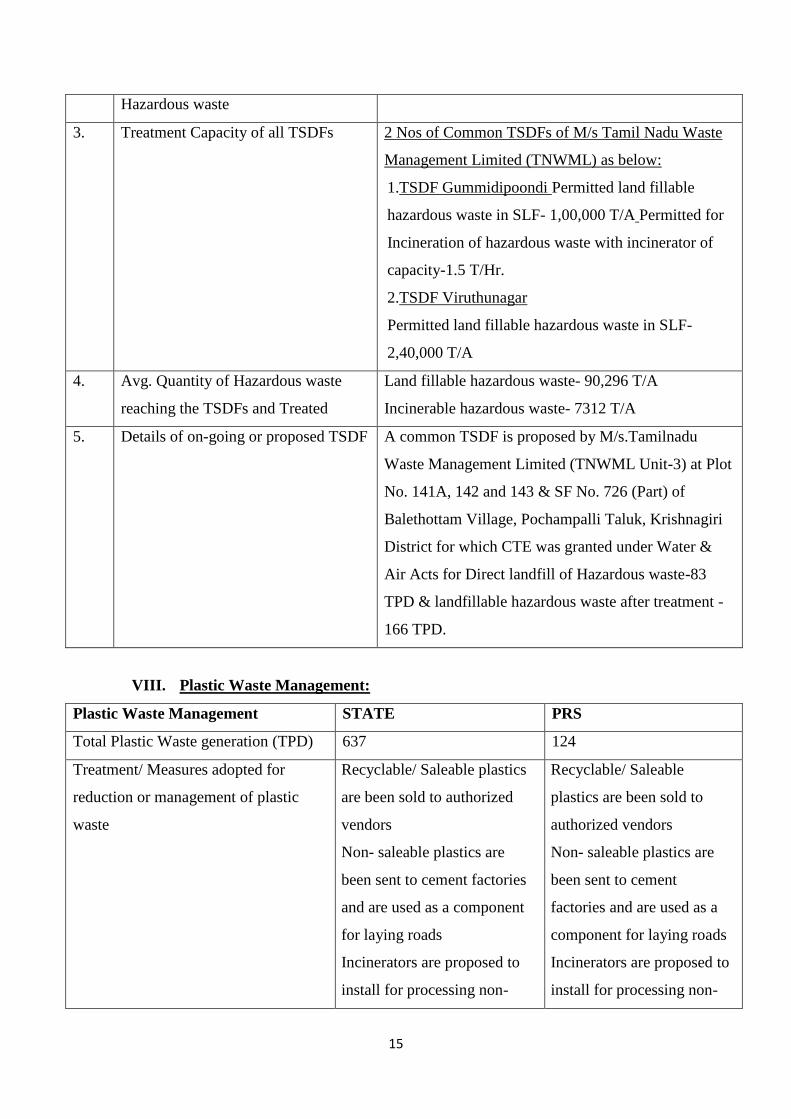
Status of ULB wise Management of Solid Waste-CMA & DTP
ULB Total MSW
generation in
TPD
Total MSW
being processed
in TPD
Existing
MSW
Facilities
TPD
Utilization
Capacity of the
existing MSW
facilities TPD
Proposed MSW
Facilities &
Completion Timeline
CMA-135 6526 4318.23 4318.23 4318.23 948.67 TPD &
31.12.2020
DTP-528 2100 1819.21 3507 1814 51 TPD
VI . Bio-medical Waste Management:
No. Bio-medical Waste
Management
State PRS
1. Total Bio-medical
generation:
70 T/D 8.3 T/D
2. No. of Hospitals and Health
Care Facilities:
24,833 5571
3. Status of Treatment Facility/
CBMWTF:
Total 12 Nos
8 Facility- Operation
1 Facility-Ready for
Operation
3 Facilities-Issued Closure
Order by TNPCB for non-
compliance.
In addition 3 common
facilities are under
establishment in
Gummidipoondi, Hosur and
Tiruppur.
One Facility M/s. Medicare
Enviro Systems, Thanjavur is in
operation which covers the
districts of Thanjavur, Thiruvarur,
Trichy, Nagapattinam, Pudukottai,
Perambalur, Ariyalur &
Sivangangai.
Another Facility in M/s.Ramky
Energy and Environment Ltd,
Salem is in operation which covers
the districts of Salem, Namakkal,
Erode, Dharmapuri, krishnagiri &
Karur.
VII. Hazardous Waste Management:
No. Hazardous Waste Management State
1. Total Hazardous Waste generation 10,59,386 Ton/Annum (T/A)
2. No. of Industries generating 3961 units
15
Hazardous waste
3. Treatment Capacity of all TSDFs 2 Nos of Common TSDFs of M/s Tamil Nadu Waste
Management Limited (TNWML) as below:
1. 1.TSDF Gummidipoondi Permitted land fillable
hazardous waste in SLF- 1,00,000 T/A Permitted for
Incineration of hazardous waste with incinerator of
capacity-1.5 T/Hr.
2. 2.TSDF Viruthunagar
3. Permitted land fillable hazardous waste in SLF-
2,40,000 T/A
4. Avg. Quantity of Hazardous waste
reaching the TSDFs and Treated
Land fillable hazardous waste- 90,296 T/A
Incinerable hazardous waste- 7312 T/A
5. Details of on-going or proposed TSDF A common TSDF is proposed by M/s.Tamilnadu
Waste Management Limited (TNWML Unit-3) at Plot
No. 141A, 142 and 143 & SF No. 726 (Part) of
Balethottam Village, Pochampalli Taluk, Krishnagiri
District for which CTE was granted under Water &
Air Acts for Direct landfill of Hazardous waste-83
TPD & landfillable hazardous waste after treatment -
166 TPD.
VIII. Plastic Waste Management:
Plastic Waste Management STATE PRS
Total Plastic Waste generation (TPD) 637 124
Treatment/ Measures adopted for
reduction or management of plastic
waste
Recyclable/ Saleable plastics
are been sold to authorized
vendors
Non- saleable plastics are
been sent to cement factories
and are used as a component
for laying roads
Incinerators are proposed to
install for processing non-
Recyclable/ Saleable
plastics are been sold to
authorized vendors
Non- saleable plastics are
been sent to cement
factories and are used as a
component for laying roads
Incinerators are proposed to
install for processing non-

16
recyclable dry waste in cluster
basis
Sold to Plastic Waste
Recyclers,
used in Road constructions
and sent to cement Industries
for co-processing
recyclable dry waste in
cluster basis
Sold to Plastic Waste
Recyclers,
used in Road constructions
and sent to cement
Industries for co-processing
IX. Details of Alternate Treatment Technology being adopted by the State/UT :
X. Identification of polluting sources including drains contributing to river
pollution and action as per NGT order on insitu treatment: Details furnished
below:
Sl.No. Name of the
river Name of the ULB
No. of
location
joining into
major
canal/river
Remarks
1 Cauvery Komarapalayam 5 I&D Work DPR is under preparation
2 Cauvery Pallipalayam 7 I&D Work DPR is under preparation
3. Cauvery Kulithalai 3 I&D Work DPR is under preparation
4 Cauvery Bhavani 6 I&D Work DPR is under preparation
5 Tamirabarani Ambasamudram 6 I&D Work DPR is under preparation
6 Tamirabarani Vickaramasingapuram 12 I&D Work DPR is under preparation
7 Vasista Attur 3 I&D Work DPR is under preparation
8 Vasista Narasingapuram 3 I&D Work DPR is under preparation
9 Sarabanga Idappadi 22 I&D Work DPR is under preparation
Total 67
Source:CMA
XI. Details of Nodal Officer appointed by Chief Secretary in the State/UT:
XII. Details of meetings carried under the Chairmanship Chief of Secretary in the
State/UT: Nil
XIII. Latest water quality of polluted river, its tributaries, drains with flow details and
ground water quality in the catchment of polluted river;

17
Latest water quality of the polluted river-TNPCB
Sl.No
.
Name of the
River
No of
Monitoring
Locations
Status of River during
October 2020
Remarks
1 Sarabanga 2 The subsurface water
quality meets the criteria.
No flow
2 Thirumanimutharu 2 The surface water quality
does not meets the
criteria, while sub-surface
water meets the criteria.
BOD 9.6 mg/l
Faecal Coliform
320 MPN/100 ml in
surface water.
3 Vasista 2 The surface water quality at
Thullukkanur does not
meet the criteria while sub-
surface water meets the
criteria.
BOD 7.5 mg/l
Faecal Coliform
2200 MPN/100 ml in
surface water.
4 Cauvery 19 The surface water quality
meets the criteria. --
5 Bhavani 7 The surface water quality
meets the criteria. --
6 Thamirabarani 12 The surface water quality
meets the criteria. --
BOD Standard limits (mg/l) <3
XIV. Ground water regulation-PWD
Name of the
River Ground water regulation
Sarabanga
For effective management of Ground Water, action is being initiated against
illegally operating water drawing companies as Per Honorable Madras High
Court order passed under WP No.16299 / 2018. Totally 683 packaged drinking
Thirumanimutharu
Vasista

18
Cauvery water firms who were illegally operating have been sealed and closed.
A Comprehensive Groundwater (Management and Development) Act., to regulate
and Manage the extraction of Groundwater is under active consideration of the
Government of Tamil Nadu.
Bhavani
Thamirabarani
XV. Good irrigation practices being adopted by the State-PWD:
Name of the River Good irrigation practices being adopted by the State
Sarabanga
Awareness meeting are conducted under TNIAMP, ADB & State Funds. In
some parts of the reach DRIP irrigation is practiced.
Thirumanimutharu
Vasista
Cauvery
Bhavani
Thamirabarani Village level awareness campaign are conducted periodically by PWD officials
to adopt the crop rotation to have a good irrigation practices. Rehabilitation and
modernization of Tanks, Anicuts and Supply channels are being carried out in
TNIAMP project vide GO Ms No: 140 PW (WR 1) Dept Dt: 21.06.2017 for an
amount of Rs.107.09 crores.
XVI. Rain Water Harvesting-PWD:
Name of the River Existing
Structure
Ongoing
Works
Proposed Works
Sarabanga 5 2 10-Recharge Wells
Thirumanimutharu 6 - 14-Recharge Wells
Vasista 16 - -
Cauvery 44 10 29
Bhavani 13 3 17
Thamirabarani 7 2 230
(Barrages 3 Nos at cost of Rs.
230 Crores.

19
Check dam 2 Nos at cost of
Rs. 76 Crores,
Artificial Recharge well
221 Nos and
Recharge shaft 4 Nos at a
cost of Rs. 88.496 Crores.)
TOTAL 91 17 300
XVII. Demarcation of Flood plain and removal of illegal encroachments - PWD:
Name of the River Demarcation of Floodplain and removal of illegal
encroachments
Sarabanga Drone Survey is to be conducted by WAPCOS during December 2020. DPR is
under preparation under Nadanthai Vaazhi Cauvery for conducting the above
survey for identification of flood plain zones and area for afforestation to
maintain Bio Diversity. The tentative cost of the DPR is Rs 2 crores. The DPR
will be completed in December 2020. Encroachment if any identified during
the survey will be evicted and other management works will be completed by
March 2022 after rehabilitation and resettlement.
Thirumanimutharu
Vasista No Flood plains zones have been identified. No Encroachment has also been
identified in the stretch. In case of any encroachments is reported in future by
Revenue department, action will be taken for immediate eviction.
Cauvery Drone Survey is to be conducted by WAPCOS during December 2020. DPR is
under preparation under Nadanthai Vaazhi Cauvery for conducting the above
survey for identification of flood plain zones and area for afforestation to
maintain Bio Diversity. The tentative cost of the DPR is Rs.20 crores. The DPR
will be completed in December 2020. Encroachment if any identified during the
survey will be evicted and other management works will be completed by
March 2022 after rehabilitation and resettlement.
Bhavani Drone Survey is to be conducted by WAPCOS during December 2020. DPR is
under preparation under Nadanthai Vaazhi Cauvery for conducting the above
survey for identification of flood plain zones and area for afforastation to
maintain Bio Diversity. The tentative cost of the DPR is Rs.2 crores. The DPR
will be completed in December 2020.
55 Nos of encroachments are to be removed which belong to fishing
community. Recommendations for alternate land has been sent to Secretary to

20
Government, Revenue department by Commissioner for Revenue
administration vide letter No F.2/41632/2005/Dt.15.2.2006.
Thamirabarani To prepare comprehensive flood protection plan for Thamirabarani River Rs.
4.00 Lakhs has been alloted vide GO Ms. No. 37 Revenue (DMII) Department
9.02.2017. Estimate has been prepared for Rs. 4.00 Lakhs for the demarcation
of Flood plain zone and steps are being taken for the protection and
management of Flood plain Zones of Thamirabarani River. Moreover, in
Tirunelveli Corporation, ProsopisJuliflora on the river stretches for a length of
10km from Vilagam to Naranammalpuram river bridge were removed at a cost
of 140.00 lakhs vide GO(2D) No. 14 PW (P2) Dept Dated 8.03.2019 to restore
the River course for a free flow of flood water.
XVIII. Maintaining minimum e-flow of river-PWD:
Name of the River Maintaining minimum e-flow of river
Sarabanga This river is only a flood carrier. The sewage water enters in to the river in
Edapaddi Municipality, Omalur Town Panchayat and Poolampatti Town Panchayat.
The above treatment plants are proposed under Nadanthai Vaazhi Cauvery. DPR
preparation is likely to the completed by December 2020. E flow will be maintained
in this river after completion sewage treatment plants by March 2021. The treated
water will flow as environmental flow.
Thirumanimutharu This river is only a flood carrier. The sewage water enters in to the river in Salem
Corporation. Treatment plants have been proposed under NadanthaiVaazhi
Cauvery. DPR preparation is to be completed by December 2020. E flow will be
maintained in this river after completion of sewage treatment plants by March
2021, the treated water will flow as environmental flow.
Vasista This river is only a flood carrier. But the sewage water enters in to the river in
Attur and Narasingapuram Municipality. After completion of sewage treatment
plants in the above location, the treated water will flow as environment flow.
Cauvery Mettur dam is opened for irrigation from June 12th to January 28th based on
availability of water every year. It is opened for drinking purpose in the remaining
days. Usually a monthly minimum average E flow of 0.10 TMC is maintained.
The E flow is maintained for more than 8 months. During the month of October an
E Flow of 1059 mcm was maintained.
Bhavani An E flow of 92718 cusecs (including Irrigation purpose) was maintained in the
river Bhavani during the Month of October 2020.
Thamirabarani Environmental flow (outflow) of Papanasam Reservoir is 718 mm3 for the month
of October 2020.

21
XIX. Plantation activities along the rivers-PWD:
Name of the River Plantation activities along the Rivers
Sarabanga It is proposed to plant around 32,400 samplings under Nadanthai Vaazhi
Cauvery for which DPR is under preparation. Plantation work will be completed
in March 2021.
Thirumanimutharu It is proposed to plant around 42,000 samplings under NadanthaiVaazhi
Cauvery for which DPR is under preparation. DPR preparation is likely to the
completed by December2020. Plantation work will be completed in March
2021.
Vasista There is no proposal at present.
Cauvery It is proposed to plant around 1,44,500 samplings under NadanthaiVaazhi
Cauvery for which DPR is under preparation. DPR preparation is likely to the
completed by December 2020. Plantation work will be completed in March
2021.
Bhavani It is proposed to plant around 86,500 samplings under NadanthaiVaazhi
Cauvery for which DPR is under preparation. DPR preparation is likely to the
completed by December 2020. Plantation work will be completed in March
2021.
Thamirabarani At present there is no proposal on plantation on the River Banks and
investigation works are being taken to implement it by Forest Department.
XX. Development of biodiversity park - PWD:
Name of the River Development of Biodiversity park
Sarabanga This is proposed to be taken up under Nadanthai Vaazhi Cauvery for which
DPR is under preparation. Drone Survey is proposed to be conducted by
WAPCOS during December 2020. DPR preparation is likely to the completed
by December 2020. This work will be completed in March 2022
Thirumanimutharu
Vasista There is no proposal at present.
Cauvery This is proposed to be taken up under NadanthaiVaazhi Cauvery for which
DPR is under preparation. Drone Survey is proposed to be conducted by
WAPCOS during December 2020. DPR preparation is likely to the completed
by December 2020. This work will be completed in March 2022.
Bhavani
Thamirabarani At present there is no proposal on biodiversity parks on the encroached River
stretches and investigation works are being taken to implement it.

22
XXI. Reuse of Treated Water - CMA:
The policy for promotion of use of Treated Waste Water is prepared with a
vision to maximize the collection & treatment of sewage generated and reuse of treated
waste water on a sustainable basis, thereby reducing dependency on fresh water
resources. Further, the policy promotes use of treated waste water as an economic
resource.
In this regard, Tamil Nadu Government has launched waste water reuse
policy during December 2019. At present Memorandum of Understanding (MoU) has
been executed between the ULB and the user agency for the re-use of secondary treated
effluent water (STEW).
S. No Name of the
ULB
Quantity (in
MLD) Usage/ Purpose
1 Nagapattinam 2.00 M/s KVK Power for cooling purpose
2 Dindugul 5.00 To maintain the TDS level of Tanners for
Agro- forestry.
3 Tirunelveli 24.00 Nanguneri Special Economic Zone (SEZ)
for Industries
4 Perambalur 3.00 MRF Industrial use
5 Ramanathapuram 3.00 NTC Infra
6 Coimbatore 15.00 Agricultural use to farmers association
7 Pollachi 11.50 Agricultural use to farmers association
8 Chinnamannur 3.00 Agricultural use
9 Karur 7.00 Agricultural use
10 Arakkonam 7.00 MRF Industrial use
Total 80.5
XXII. Model River being adopted by the State & Action Proposed for achieving the
bathing quality standards: River Bhavani

23
XXIII. Status of Preparation of Action Plan by the 13 Coastal States:
As per G.O. MS No.64 Environment and Forests (EC.2) Department dated
03.10.2020, action plan for the coastal and marine pollution will be prepared by
the Department of Environment, Government of Tamil Nadu.
XXIV. Regulation of Mining Activities in the State/UT:
XXV. Action against identified polluters, law violators and officers responsible for
failure for vigorous monitoring: Nil

1
National Mission for Clean Ganga
Format for submission of Monthly Progress Report in the NGT Matter OA
No. 673 of 2018 (in compliance to NGT order dated 24.09.2020)
For the State of Tamilnadu
Overall status of the CMA:
I. Total Population : 1,67,05,001
II. Estimated Sewage Generation (MLD) : 1523.98
III. Details of Sewage Treatment Plant:
S.No. Details of Sewage Treatment Plant State PRS
1 Existing no. of STPs and Treatment Capacity (in MLD) 49 Nos &
857.20
12Nos &
260.79
2 Capacity Utilization of existing STPs 344.26 116.82
3 MLD of sewage being treated through Alternate
technology
Nil
4 Gap in Treatment Capacity in MLD 666.78 114.82
5 No. of Operational STPs 37 nos 12 nos
6 No. of Complying STPs 37 nos 12 nos
7 No. of Non-complying STPs Nil
Details of each existing STP in the State & PRS
S. No Location
Existing
Capacity
of STP (in
MLD)
Capacity
being
Utilized
(in MLD)
Operational
Status of STP
Compliance
Status of STP
1 Coimbatore
70.00 35.00 Operational Comply
60.00 5.00 Operational Comply
2 Vellore 10.28 7.50 Operational Comply
3 Dindigul 13.65 3.00 Operational Comply
4 Avadi 4.00 2.50
1 STP (4mld)
- Completed
Comply
36 MLD under
progress

2
5 Madurai
170.70
MLD
38.00 Operational Comply
(45.70 +
125.00)
MLD
6 Thanjavur 28.05 14.15
Under
Renovation Comply
7 Tiruppur 15.00 7.50 Operational Comply
8 Cuddalore 12.25 6.00 Operational Comply
9 Kanchipuram 14.50 13.50 Operational Comply
10 Maraimalai Nagar 2.20 1.80 Operational Comply
11 Pallavapuram
(CMWSSB STP
115@Perungudi) Operational Comply
12 Tiruvallur 6.20 3.60 Operational Comply
13 Chidambaram 9.44 2.10 Operational Comply
14 Thiruvannamalai 8.70 4.50 Operational Comply
15 Viluppuram - 2Nos 12.50 8.60 Operational Comply
16 Arakkonam 11.04 2.00
Under Trial
run Comply
17 Thirupathur 11.43 0.50
Under Trial
run Comply
18 Bodinayakkanur 12.08 4.00 Operational Comply
19 Chinnamanur 3.99 3.72 Operational Comply
20 Periyakulam 5.47 5.47 Operational Comply
21 Ramanathpuram 7.00 5.80 Operational Comply
22 Theni-Allinagaram 12.05 6.50 Operational Comply
23 Dharmapuri 4.86 3.50 Operational Comply
24 Karur 15.00 6.50 Operational Comply
25 Krishnagiri 12.34 7.80 Operational Comply
26 Namakkal 5.00 5.00 Operational Comply
27
Nagapattinam
STP-1 9.63 4.50 Operational Comply
Nagapattinam
STP-2 2.69 0.40 Operational Comply
28 Tiruvarur 6.92 4.10 Operational Comply
29 Ariyalur 4.16 1.00 Operational Comply
30 Pudukkottai 10.62 4.00 Operational Comply
31 Perambalur 4.20 3.60 Operational Comply

3
32 Udhagamandalam 5.00 4.00 Operational Comply
33 Udumalaipet 7.81 3.50 Operational Comply
34 Virudhunagar 7.65 3.70 Operational Comply
PRS (12 Nos)
35 Tiruchirappalli 58.00 58.00 Operational Comply
36
Salem - Vellakuttai
STP 13.00 7.00 Operational Comply
Salem - Anaimedu
STP 6.00 3.00 Operational Comply
Salem - Mankuttai
STP 35.00 1.00 Operational Comply
Salem - Vandipattai
STP 44.00 -
Completed &
Power
connection to
be obtained -
37 Tirunelveli 24.20 8.50 Operational Comply
38 Erode 50.55 18.50 Operational Comply
39
Mettur STP-1 0.82 0.38 Opertional Comply
Mettur STP-2 0.92 0.19 Opertional Comply
Mettur STP-3 5.45 2.40 Opertional Comply
40 Kumbakonam 17.00 12.00 Operational Comply
41 Mayiladuthurai 5.85 5.85 Operational Comply
Total 49 nos 857.20 344.26
Details of under construction STPs in the State & PRS
S.No Location
Capacity
of the
plant in
MLD
Physical
Progress
in %
Status of
I&D or
House
sewer
connections
Completion Timeline
1 Ambur 16.71 - -
Alternate site to be
identified & it will be
completed on Oct’22.
2 Avadi 36.00 80% - March-21
3
Coimbatore -
Nanjudapuram 40.00 70% - Feb-21
Coimbatore –
Kuruchi &
kuniyamuthur 30.53 23% - Jan-22

4
S.No Location
Capacity
of the
plant in
MLD
Physical
Progress
in %
Status of
I&D or
House
sewer
connections
Completion Timeline
4 Karaikudi 16.00 70% - March-21
5 Nagercoil 17.66 90% - Dec-20
6 Pollachi 11.25 83% - Dec-20
7 Rajapalayam 21.85 - -
WO order issued &
Design under scrutiny
& it will be completed
on Dec’21.
8 Rameshwaram 4.08 35% - Dec’21
9 Rasipuram 6.96 100% -
Collection system will
be Completed on
Dec’20
10 Saththur 4.65 67% - March-21
11 Tambaram 30.00 96% 3930 December’20
12 Tiruppur (3nos) 70.00 30% - March-22
13 Tuticorin 28.00 45% - March-21
14 Vellore 50.00 39% - March-21
PRS (4 Nos)
15
Trichirapalli-
STP1 30.00 52% - July-21
Trichirapalli-
STP2 37.00 35% - Aug-21
16 Sathiyamangalam 4.08 99% - Dec’20
17 Mettupalayam 8.65 82% - June- 21
Total (21 nos) 463.42
In addition to above, 49 no. of FSTPs are proposed & various of implementation. In
which 5 no of FSTPs falls under polluted river stretches(Cauvery- 1no, Vasista -1 no,
Sarabanga – 1 no & Thamirabarani – 2 nos.)
S.No Progress Number of FSTPs
1 Completed / Nearing completion 6
2 Intermediate / Advanced stage 20
3 Initial stage/ Preparatory Stage 19
4 Tendering stage DPR 4
Total 49

5
Details of proposed STPs in the State (2 Nos) & PRS(2 Nos)
No. Location Capacity of the
STP proposed in
MLD
Status of Project (at DPR
Stage/ Under Tendering/
Work to be Awarded)
Likely Date of
Completion
1 Sathiyamangalam 1.13 DPR Prepared -
2 Tirunelveli 34.00 Under DPR stage -
V. Solid Waste Management:
Total number of Urban Local Bodies and their Population: 135 ULBs
&Population -1,67,05,001
Current Municipal Solid Waste Generation:6526 TPD& 1296 TPD
Number, installed capacity and utilization of existing MSW processing facilities
in TPD (bifurcated by type of processing eg- Waste to Energy (Tonnage and
Power Output), Compost Plants (Windrow, Vermi, decentralized pit composting),
biomethanation, MRF etc : Enclosed
Action plan to bridge gap between Installed Capacity and Current Utilization of
processing facilities (if Gap > 20%) Nil
No. and capacity of C&D waste processing plants in TPD (existing, proposed and
under construction) : Nil
Total no. of wards, no. of wards having door to door collection service, no. of
wards practicing segregation at source : Enclosed
Details of MSW treatment facilities proposed and under construction (no.,
capacity, and technology) : Enclosed
No. and area (in acres) of uncontrolled garbage dumpsites and Sanitary
Landfills.Nil
No. and area (in acres) of legacy waste within 1km buffer of both side of the
rivers- 1 no.(Erode)&19 acres – Biomining Work is under progress
No. of drains falling into rivers and no. of drains having floating racks/screens
installed to prevent solid waste from falling into the rivers – Nil.
Status of ULB wise Management of Solid Waste
ULB Total MSW
generation in
TPD
Total MSW
being processed
in TPD
Existing
MSW
facilities
Utilization
Capacity of the
existing MSW
facilities
Proposed MSW
Facilities &
Completion
Timeline

6
Enclosed
X. Identification of polluting sources including drains contributing to river
pollution and action as per NGT order on insitu treatment:
SI.
No
Name of the
River
Name of the ULB No. of
location
joining into
major canal/
river
Remarks
1 Cauvery Komarapalayam 5 I&D Work DPR under preparation
2 Cauvery Pallipalayam 7 I&D Work DPR under preparation
3 Cauvery Kulithalai 3 I&D Work DPR under preparation
4 Cauvery Bhavani 6 I&D Work DPR under preparation
5 Tamirabarani Ambasamudram 6 I&D Work DPR under preparation
6 Tamirabarani Vickaramasingapuram 12 I&D Work DPR under preparation
7 Vassista Attur 3 I&D Work DPR under preparation
8 Vassista Narasingapuram 3 I&D Work DPR under preparation
9 Sarabanga Idappadi 22 I&D Work DPR under preparation
XXI. Reuse of Treated Water:
The policy for promotion of use of Treated Waste Water is prepared with a vision to
maximise the collection & treatment of sewage generated and reuse of treated waste
water on a sustainable basis, thereby reducing dependency on fresh water resources.
Further, the policy promotes use of treated waste water as an economic resource.
In this regard, Tamil Nadu Government has launched waste water reuse policy on
December 2019. At present Memorandum of Understanding (MoU) has been executed
between the ULB and the user agency for the re-use of secondary treated effluent water
(STEW) .
S.
No
Name of the
ULB
Quantity (in
MLD) Usage/ Purpose

7
1 Nagapattinam 2.00 M/s KVK Power for cooling purpose
2 Dindugul 5.00 To maintain the TDS level of Tanners as well
for Agro- forestry.
3 Tirunelveli 24.00 Nanguneri SEZ for Industries
4 Perambalur 3.00 MRF Industrial use
5 Ramanathapuram 3.00 NTC Infra
6 Coimbatore 15.00 Agricultural use to farmers association
7 Pollachi 11.50 Agricultural use to farmers association
8 Chinnamannur 3.00 Agricultural use
9 Karur 7.00 Agricultural use
10 Arakkonam 7.00 MRF Industrial use

RRC / MRF
No.Capacity in
(MT)No.
Capacity in
(MT)No.
Capacity in
(MT)No
Capacity
in MTNo.
Capacity
in (MT)No.
1 2 3 4 5 6 7 8 9 10 11 12 13 14 15 16 17 18
VELLORE REGION
1 Ambur 36 36 30 40 24 1 15 0 0 0 0 2 8 2 4.00 1
2 Arakkonam 36 36 34 28 13 0 0 0 0 0 0 4 16 4 1.00 1
3 Arcot 30 30 26 19 13 0 0 0 0 1 3 3 9 7 3.50 1
4 Gudiyatham 36 36 34 26 15 0 0 0 0 0 0 2 8 9 4.500 1
5 Ranipet 30 30 25 17 10 0 0 0 0 0 0 3 10 3 1.50 2
6 Thirupathur 36 36 30 30 18 0 0 0 0 0 0 5 12 12 6.00 0
7 Vaniyambadi 36 36 32 33 14 0 0 0 0 0 0 6 24 8 7.50 2
8 Walajapet 24 24 20 14 9 0 0 0 0 0 0 3 8 6 3.00 1
9 Jolarpet 18 18 16 10 9 0 0 0 0 0 0 1 4 1 3.00 1
10 Melvisharam 21 21 18 18 11 0 0 0 0 0 0 3 12 0 0.00 1
11 Pernambut 21 21 17 15 12 0 0 0 0 0 0 0 0 4 0.00 1
12 Thiruvannamalai 39 39 35 55 31 0 0 0 0 1 5 12 36 18 2.00 1
13 Arani 33 33 26 27 19 0 0 0 0 0 0 5 20 3 1.50 1
14 Thiruvathipuram 27 27 22 13 11 0 0 0 0 0 0 3 12 3 1.50 1
15 Vandavasi 24 24 19 12 8 0 0 0 0 0 0 3 12.5 1 0.50 1
16 Villupuram 42 42 38 63 38 0 0 0 0 0 0 9 45 8 4.00 1
17 Tindivanam 33 33 30 23 15 0 0 0 0 0 0 4 16 4 2.00 1
18 Kallakurichi 21 21 18 20 14 0 0 0 0 0 0 3 12 12 6.00 1
543 543 471 463 282 1 15 0 0 2 8 71 265 105 52 19
MADURAI REGION
19 Tirumangalam 27 27 25 24 14 0 0 0 0 0 0 3 12 14 2.00 0
20 Melur 27 27 24 17 10 0 0 0 0 0 0 1 4 6 2.00 0
21 Usilampatti 24 24 15 10 6 0 0 0 0 0 0 1 5 0 0.00 1
22 Theni Allinagaram 33 33 30 33 18 1 8 1 2 0 0 2 8 9 2.00 1
23 Bodinayakanur 33 33 31 31 20 0 0 0 0 0 0 2 10 16 3.00 1
24 Chinnamanur 27 27 24 13 8 1 1 0 0 0 0 2 7 5 1.00 1
25 Cumbum 33 33 31 18 11 1 1.5 0 0 0 0 2 6 5 0.50 1
26 Gudalur 30 30 26 12 8 0 0 0 0 0 0 1 3 0 0.00 1
27 Periyakulam 21 21 16 16 10 1 6 1 2 0 0 0 0 3 0.36 1
28 Kodaikanal 27 22 18 11 9 1 1 0 0 0 0 0 0 4 0.23 0
29 Palani 36 36 31 41 19 1 4 0 0 1 5 1 10 5 2.00 1
0 0 0 0 0 0 1 2.00 0 0 0 0 0 3 7.5
31 Sivagangai 33 33 26 18 9 0 0 0 0 0 0 3 9 7 0.35 1
1 1 0 0 0 0 2 40 0 0 0 0 0 4 16
33 Devakottai 21 21 19 15 16 0 0 0 0 0 0 4 12 7 1.50 0
34 Ramanathapuram 21 21 20 20 17 1 4 0 0 0 0 1 4 5 1.00 1
35 Paramakudi 33 33 31 35 21 0 0 0 0 1 1 3 15 20 6.14 1
36 Rameswaram 24 24 22 13 8 1 5.5 1 1 1 1 1 3 3 3.00 1
37 Keelakarai 18 18 15 18 11 1 0.20 0 0 0 0 1 5 2 1.00 0
531 526 458 408 254 10 32 3 5 3 7 38 142.0 142 31 15
TIRUPPUR REGION
38 Pollachi 36 36 31 32 25 0 0.00 1 1.00 1 5 5 21 13 6.5 2
11
28
No of wards
practicing
segregation
at source
22
34 48
15
222 4.00
TOTAL
TOTAL
Oddanchatram30
Total Waste
Generated
(MT)
36Karaikudi 3632
27 27
Commissionerate of Municipal Administration,Chennai
Solid Waste Management Status Report
Vermi CompostTotal No.
of Wards
No of wards
in D2D
Collection
Service
Name of ULB'sS.NoOrganic
Waste (MT)
9 0.50
SWM Processing facilities
Windrow Compost
1
MCC OCCBiomethanation
plant

RRC / MRF
No.Capacity in
(MT)No.
Capacity in
(MT)No.
Capacity in
(MT)No
Capacity
in MTNo.
Capacity
in (MT)No.
No of wards
practicing
segregation
at source
Total Waste
Generated
(MT)
Vermi CompostTotal No.
of Wards
No of wards
in D2D
Collection
Service
Name of ULB'sS.NoOrganic
Waste (MT)
SWM Processing facilities
Windrow Compost MCC OCCBiomethanation
plant
39 Mettupalayam 33 31 29 22 12 0 0.00 0 0.00 1 3 2 8 3 1.5 1
40 Valparai 21 20 16 4 3 1 1.20 0 0.00 0 0 0 0 1 0.5 0
41 Udumalpet 33 31 27 19 12 0 0.00 0 0.00 0 0 3 12 13 6.5 1
42 Dharapuram 30 30 26 17 11 1 5.00 0 0.00 0 0 2 6 4 2.0 1
43 Kangeyam 18 18 15 11 7 1 4.50 0 0.00 0 0 1 2 1 0.5 1
44 Palladam 21 21 18 11 8 0 0.00 0 0.00 0 0 2 7.5 1 0.5 1
45 Vellakoil 18 18 16 13 7 1 2.35 0 0.00 0 0 2 4 1 0.5 1
46 Gobichettipalayam 30 30 26 18 12 1 9.00 0 0.00 1 3 2 7 7 3.5 1
47 Sathyamangalam 27 27 23 10 7 1 0.83 0 0.00 0 0 2 5 1 0.5 1
48 Bhavani 27 27 23 9 9 0 0.00 0 0.00 0 0 2 10 - - 1
49 Punjaipuliampatti 18 18 16 6 6 0 0.00 0 0.00 0 0 1 3 5 2.5 2
50 Udhagamandalam 36 34 29 32 25 0 0.00 0 0.00 1 5 6 15 - - 1
51 Coonoor 30 29 26 11 9 6 2.40 0 0.00 0 0 1 4 4 2.0 1
52 Gudalur 21 21 18 14 9 1 3.00 0 0.00 0 0 1 5 - - 1
53 Nelliyalam 21 17 17 3 3 1 2.50 0 0.00 0 0 0 0 - - 1
420 408 354 232 163 14 31 1 1 4 16 32 110 54 27 17
CHENGALPATTU REGION
54 Chengalpattu 33 28 25 65 11 0 0 0 0 0 0 2 7 7 2.85 1
55 Kancheepuram 51 43 43 22 33 0 0 0 0 1 5 4 20 25 12.50 2
56 Madurantakam 24 22 19 7 3 0 0 0 0 0 0 1 5 1 1.00 1
57 Pallavapuram 42 38 30 104 52 0 0 0 0 1 5 7 27 21 19.00 1
58 Tambaram 39 35 27 90 49 0 0 0 0 0 0 8 32 19 10.00 2
59 Anakaputhur 18 18 18 13 7 0 0 0 0 0 0 2 8 2 1.00 2
60 Maraimalainagar 21 17 14 23 11 0 0 0 0 0 0 4 20.00 2 1.00 1
61 Pammal 21 21 15 31 16 0 0 0 0 0 0 6 20 4 2.00 1
62 Sembakkam 15 15 15 24 12 0 0 0 0 0 0 2 10 7 6.00 1
63 Tiruvallur 27 27 19 24 11 0 0 0 0 0 0 2 9 17 6.50 3
64 Poonamallee 21 19 16 21 11 0 0 0 0 1 5 8 18.10 0 0.00 1
65 Tiruthani 21 18 18 12 6 0 0 0 0 1 5 2 6 0 0.00 1
66 Tiruverkadu 18 18 11 15 11 0 0 0 0 0 0 7 26.85 10 1.50 1
67 Chidambaram 33 31 25 17 7 0 0 0 0 0 0 4 14.00 3 2.50 1
68 Cuddalore 45 37 31 33 24 0 0 0 0 0 0 3 20 10 3.80 1
69 Nellikuppam 30 22 22 13 6 0 0 0 0 0 0 1 2 8 4.00 1
70 Panruti 33 28 21 17 9 0 0 0 0 0 0 2 8.00 4 3.00 2
71 Virudhachalam 33 30 24 24 10 0 0 0 0 0 0 2 7 6 4.00 1
525 466 393 553 287 0 0 0 0 4 20 67 260 146 81 24
THANJAVUR REGION
72 Kumbakonam 45 45 41 70 41 0 0.00 0 0.00 1 5 5 20 34 16.5 2
73 Pattukkotai 33 33 28 30 17 0 0.00 0 0.00 0 0 5 10 12 4 2
74 Nagappattinam 36 36 31 32 19 0 0.00 0 0.00 1 5 3 14 13 6.0 2
75 Mayiladuthurai 36 36 29 32 18 0 0.00 0 0.00 0 0 3 15 5 2.5 1
76 Sirkali 24 24 17 14 9 1 3.00 0 0.00 0 0 2 6 5 2 1
TOTAL
TOTAL

RRC / MRF
No.Capacity in
(MT)No.
Capacity in
(MT)No.
Capacity in
(MT)No
Capacity
in MTNo.
Capacity
in (MT)No.
No of wards
practicing
segregation
at source
Total Waste
Generated
(MT)
Vermi CompostTotal No.
of Wards
No of wards
in D2D
Collection
Service
Name of ULB'sS.NoOrganic
Waste (MT)
SWM Processing facilities
Windrow Compost MCC OCCBiomethanation
plant
77 Vedaranyam 21 21 19 12 6 0 0.00 0 0.00 0 0 2 6 0 0 0
78 Tiruvarur 30 30 21 22 13 0 0.00 0 0.00 0 0 1 3 5 2.5 1
79 Mannargudi 33 33 28 22 15 1 5.00 0 0.00 0 0 3 11 8 4 1
80 Thiruthuraipoondi 24 24 20 8 5 0 0.00 0 0.00 0 0 1 5 1 0.5 0
81 Koothanallur 24 24 19 7 5 1 1.00 1 1.00 0 0 1 2 4 2.0 1
82 Pudukkottai 42 42 38 70 42 0 0.00 1 2.00 0 0 5 13 21 10.75 1
83 Aranthangi 27 27 27 14 9 1 0.50 1 2.00 0 0 2 4 2 1 2
84 Manapparai 27 27 22 16 7 0 0.00 0 0.00 0 0 1 4 5 2.0 1
85 Thuraiyur 24 24 24 15 10 0 0.00 0 0.00 0 0 3 12 4 2 2
86 Thuvakudi 21 21 17 8 7 0 0.00 0 0.00 0 0 0 0 8 8.5 1
87 Perambalur 21 21 17 18 7 0 0.00 0 0.00 1 3 2 6 1 0.5 2
88 Ariyalur 18 18 16 14 8 0 0.00 0 0.00 0 0 1 5 5 2.5 1
89 Jayankondam 21 21 18 11 9 0 0.00 0 0.00 0 0 1 2 2 0.5 1
507 507 432 415 245 4 10 3 5 3 13 41 138 135 68 22
TIRUNELVELI REGION
90 Tenkasi 33 33 30 15 16 0 0.0 0.0 0.0 0 0 4 14 7 3.5 2
91 Sankarankovil 30 30 28 14 13 1 3.0 0.0 0.0 0 0 4 13 2 1.0 4
92 Kadayanallur 33 33 28 26 21 1 1.0 1.0 1.0 0 0 5 16 3 2.5 3
93 Puliangudi 33 33 26 18 11 1 2.2 0.0 0.0 0 0 4 12 1 0.5 3
94 Sengottai 24 24 22 6 8 1 0.5 1.0 1.0 0 0 3 6 2 0.5 1
95 Ambasamudram 21 21 19 9 9 0 0.0 0.0 0.0 0 0 3 9 5 1.0 1
96 V.K.Puram 21 21 20 14 13 1 3.0 0.0 0.0 0 0 4 11 0 0.0 1
97 Kovilpatti 36 36 34 26 21 0 0.0 0.0 0.0 0 0 5 18 6 4.0 3
98 Kayalpattinam 18 18 17 12 10 1 0.5 0.0 0.0 1 5 2 6 0 0.0 1
99 Kuzhithurai 21 21 19 7 4 0 0.0 0.0 0.0 0 0 1 4 1 0.5 1
100 Colachel 24 24 22 8 5 0 0.0 0.0 0.0 1 1 1 3 3 2.0 1
101 P.Puram 21 21 17 7 4 0 0.0 0.0 0.0 0 0 1 4 1 0.5 1
102 Virudhunager 36 36 27 18 20 0 0.0 0.0 0.0 0 0 5 20 2 1.0 1
103 Rajapalayam 42 42 38 49 28 1 3.0 0.0 0.0 1 5 2 7 4 6.0 1
104 Sivakasi 33 33 24 30 26 0 0.0 0.0 0.0 0 0 5 15 5 7.5 1
105 Srivilliputhur 33 33 24 20 14 0 0.0 0.0 0.0 0 0 2 8 0 0.0 1
106 Aruppukottai 36 36 27 25 21 0 0.0 0.0 0.0 0 0 5 16 3 1.8 3
107 Sattur 24 24 18 10 7 1 2.0 0.0 0.0 0 0 1 3 2 0.5 1
108 Thiruthangal 21 21 17 15 10 0 0.0 0.0 0.0 0 0 1 3 0 0.0 1540 540 455 330 259 8 15 2 2 3 11 58 188 47 33 31
SALEM REGION
109 Attur 33 33 33 12 10 0 0 0 0 0 0 4 12 4 0.388 1
110 Mettur 30 30 30 15 9 0 0 0 0 1 5 3 9 1 0.150 1
111 Idappadi 30 30 30 14 9 0 0 0 0 0 0 5 15 2 0.200 1
112 Narasingapuram 18 18 18 7.05 4 0 0 0 0 0 0 3 10 1 0.100 1
113 Namakkal 39 39 39 35 21 0 0 0 0 1 5 4 16 7 1.000 1
114 Tiruchengode 33 33 33 29 20 0 0 0 0 1 5 5 14 2 0.200 2
115 Rasipuram 27 27 27 14 10 0 0 0 0 0 0 1 5 3 0.300 1
116 2 5 10 0 00 0.15010 0
TOTAL
1533 14Komarapalayam 33 33
Total

RRC / MRF
No.Capacity in
(MT)No.
Capacity in
(MT)No.
Capacity in
(MT)No
Capacity
in MTNo.
Capacity
in (MT)No.
No of wards
practicing
segregation
at source
Total Waste
Generated
(MT)
Vermi CompostTotal No.
of Wards
No of wards
in D2D
Collection
Service
Name of ULB'sS.NoOrganic
Waste (MT)
SWM Processing facilities
Windrow Compost MCC OCCBiomethanation
plant
117 Pallipalayam 21 21 21 12 7 0 0 0 0 1 5 1 2 0 0.000 1
118 1 1 1
4 16
119 Krishnagiri 33 33 33 17 13 0 0 0 0 0 0 4 16 3 0.270 1
120 Karur 48 48 48 71 45 0 0 0 0 1 5 10 40 2 0.175 3
121 Kulithalai 24 24 24 7 4 1 2.40 1 1.60 0 0 1 2 1 0.118 2
Total 402 402 402 270 181 1 2 1 1.60 5 25 48 163 30 12 17
Region Total 3468 3392 2965 2671 1670 38 105 10 15 24 100 355 1265 659 302 145
Corporations
122 Coimbatore 100 78 60 915 417 1 80 4 6 25 102 25 12.00 5
123 Madurai 100 100 70 630 336 1 4 20 100 24 11.00 0
124 Salem 60 60 54 350 203 0 0 0 0 2 8 26 130 20 7.00 4
125 Erode 60 57 54 158 86 0 0 2 11 25 90 23 11.00 1
126 Tirunelveli 55 52 47 170 74 2 7 41 97 4 8.00 3
127 Dindigul 48 48 35 92 57 1 10 2 7 9 45 16 8.00 0
128 Vellore 60 60 54 230 97 0 0 0 0 1 1 51 163 18 1.00 42
129 Thanjavur 51 48 48 106 56 2 7 3 15 14 7.00 0
130 Trichy 65 65 62 351 222 0 0 2 7 34 170 22 8.00 0
131 Tiruppur 60 54 42 410 234 2 12 28 140 25 10.00 6
132 Thoothkudi 60 60 60 175 80 16 73 12 6.00 0
133 Nagercoil 52 52 37 106 66 0 0 0 0 1 5 11 55 10 5.00 0
134 Hosur 45 45 45 72 43 0 0 0 0 1 10 11 43 14 5.00 1
135 Avadi 48 47 41 90 45 0 0 0 0 1 5 17 65 21 10.00 1
Total 864 826 709 3855 2016 1 10 1 80 23 89 317 1288 248 109.00 63
Grant Total 4332 4218 3674 6526 3686 39 115 11 95 47 189 672 2553 907 411.23 208
00
0 0 0 0 3 0.27015Dhamapuri 223333 33

RRC / MRF
No.Capacity in
(MT)No.
Capacity in
(MT)No.
Capacity in
(MT)No
Capacity
in MTNo.
Capacity
in (MT)No.
1 2 3 4 5 6 7 8 9 10 11 12 13 14 15 16 17 18
TIRUPPUR REGION
1 Mettupalayam 33 31 29 22 12 0 0.00 0 0.00 1 3 2 8 3 1.5 1
2 Gobichettipalayam 30 30 26 18 12 1 9.00 0 0.00 1 3 2 7 7 3.5 1
3 Sathyamangalam 27 27 23 10 7 1 0.83 0 0.00 0 0 2 5 1 0.5 1
4 Bhavani 27 27 23 9 9 0 0.00 0 0.00 0 0 2 10 - - 1
THANJAVUR REGION
5 Kumbakonam 45 45 41 70 41 0 0.00 0 0.00 1 5 5 20 34 16.5 2
6 Mayiladuthurai 36 36 29 32 18 0 0.00 0 0.00 0 0 3 15 5 2.5 1
TIRUNELVELI REGION
7 Ambasamudram 21 21 19 9 9 0 0.00 0 0.00 0 0 3 9 5 1.000 1
8 V.K.Puram 21 21 20 14 13 1 3.00 0 0.00 0 0 4 11 0 0.000 1
SALEM REGION
9 Attur 33 33 33 12 10 0 0 0 0 0 0 4 12 4 0.388 1
10 Mettur 30 30 30 15 9 0 0 0 0 1 5 3 9 1 0.150 1
11 Idappadi 30 30 30 14 9 0 0 0 0 0 0 5 15 2 0.200 1
12 Narasingapuram 18 18 18 7.05 4 0 0 0 0 0 0 3 10 1 0.100 1
13 Komarapalayam 33 33 33 15 14 0 0 0 0 0 0 2 5 1 0.15 1
14 Pallipalayam 21 21 21 12 7 0 0 0 0 1 5 1 2 0 0.000 1
15 Kulithalai 24 24 24 7 4 1 2.40 1 1.60 0 0 1 2 1 0.118 2
Corporations
16 Salem 60 60 54 350 203 0 0 0 0 2 8 26 130 20 7.00 4
17 Erode 60 57 54 158 86 0 0 2 11 25 90 23 11.00 1
18 Tirunelveli 55 52 47 170 74 2 7 41 97 4 8.00 3
19 Trichy 65 65 62 351 222 0 0 2 7 34 170 22 8.00 0
Grant Total 669 661 616 1296 763 4 15 1 2 13 54 168 627 134 61 25
Commissionerate of Municipal Administration,Chennai
Solid Waste Management Status Report
Vermi Compost
SWM Processing facilities
Windrow CompostTotal No.
of Wards
No of wards
in D2D
Collection
Service
MCCName of ULB'sS.NoOrganic
Waste (MT)
No of wards
practicing
segregation
at source
Total Waste
Generated
(MT)
OCCBiomethanation
plant

Yes/No Status Yes/No Status Yes/No Status Yes/No
Wet Waste Panruti 6 6 Progress 20% 31.12.2020 - - - -Foundation work in
progress
Dry Waste Anakaputhur 5 5 Progress 90% 31.12.2020 - - - - Nearing Completion
Wet Waste 0 0 0 0 0 0 0 0 0 0 0 0 0 0
Dry Waste6 10
Basement work in
progress45 31.12.2020 0 0 0 0 0 0 0 0 0
Wet Waste 0 0 0 0 0 0 0 0 0 0 0 0 0 0
Dry Waste 0 0 0 0 0 25 25 YesTender Evaluation
stage Yes 0 No 0 No
Wet Waste 6 62 MCC Under
Construction60% 31.12.2020 - - - - - - - - - -
Dry Waste - - - - - - - - - - - - - - -
Wet Waste 5 5MCC Under
Construction
1 MCC 80%
1 MCC LITIGATION31.12.2020 - - - - - - - - - -
Dry Waste - - - - - - - - - - - - - - -
Wet Waste 3.5 MCC 5TPDUnder
Construction20% 31.12.2020 -
Dry Waste - - - - - - - - - - - - - - -
Wet Waste 4.5 6
1 MCC Under
Court Case & 1
MCC Under
Construction
40% 31.01.2021 - - - - - - - - - -
Dry Waste - - - - - - - - - - - - - - -Wet Waste - - - - - 4 MCC-4 No - - - - - - Proposal to be submitDry Waste - - - - - - - - - - - - - - -
Wet Waste 8 MCC -8
Tub work under
progress &
Flooring work
under progress
70 31.12.2020 - - - - - - - - - -
Dry Waste - - - - - - - - - - - - - - -
Wet Waste 10 MCC -10Physically
completed98 - - - - - - - - - -
Dry Waste - - - - - - - - - - - - - - -
Wet Waste 3 MCC -3 Ciel level work 20 31.12.2020 - - - - - - - - - -
Dry Waste - - - - - - - - - - - - - - -
Wet Waste 5 MCC -5civil work
completed 95 - - - - - - - - - -
Dry Waste - - - - - 4 RCC- 4 No - - - - - - Proposal to be submit
Wet Waste 2 MCC-2Finishing work
under progress95 31.12.2020 - - - - - - - - - -
Dry Waste 3 RCC-3Basement level
under progress30 31.12.2020 - - - - - - - - - -
Wet Waste 4 MCC-4 To be commenced - - - - - - - - - -
Dry Waste 3 RCC-3Roof level work
under progress70 31.12.2020 - - - - - - - - - -
Wet Waste 12 MCC-12Work under
progress60 31.12.2020 - - - - - - - - - -
Dry Waste - - - - - - - - - - - - - - -
Wet Waste - - - - - - - - - - - - - - -
Dry Waste 4.5 10.0
Plinth beam
completed, Brick
work in progress
20% 31.01.2021 - - - - - - - - -Incinerator of 10TPD
Capacity
Wet Waste 3.0 3.0Brick work in
progress60% 31.12.2020 - - - - - - - - - 1 MCC Work
Dry Waste - - - - - - - - - - - - - - 0
Dry Waste Palladam - - - - - 2.0 5.0 No - Yes - - - -1 RRC Work - Stopped
due to Court Case
Wet Waste - - - - - 0.5 3.0 No - Yes - No - No
1 MCC Work - Proposed
shifting of Site due to
court caseDry Waste - - - - - - - - - - - - - - -
Wet Waste 1.50 5.00 - - 1.5 5.0 - - Yes - - - -1 MCC Work & Compost
Yard WorkDry Waste - - - - - - - - - - - - - -Wet Waste
Dry Waste 1.70 Incineration Yes Tender stage yes No NoIncineration sanctioned
in cluster basisWet Waste
3.00 3.00
1 MCC
Construction work
in progress90% 31.12.2020
Dry Waste
Wet Waste
RemarksQuantity of
waste to be
treated (TPD)
Treatment
Components
with capacity
TPD
Status% of progressive
completion
Work
Order
Issued
Quantity of
waste to be
treated (TPD)
Treatment
Components
with capacity
Whether DPR prepared Funding Sanctioned Tendering Process
Completed
Solid Waste management facility proposed
1 Chengalpattu
Target date of
completion
Waste type Name of the ULBs
Solid Waste management facility under construction
S.No Region/Corporatio
n
Jayanklondam
Thanjavur 3
Idappadi
Karur
Salem2
Tiruvarur
Pudukottai
Thuvakudi
Karaikudi
Ramanathapuram
Court case
4 Maduarai
Melur
Theni Allinagaram
Bodinayakanur
Cumbum
Gudalur
Kodaikanal
6 Tirunelveli
Mettupalayam
Valparai
Punjai Puliampatti
Gudalur
Tiruppur5
Tenkasi
Kadayanallur
Puliangudi
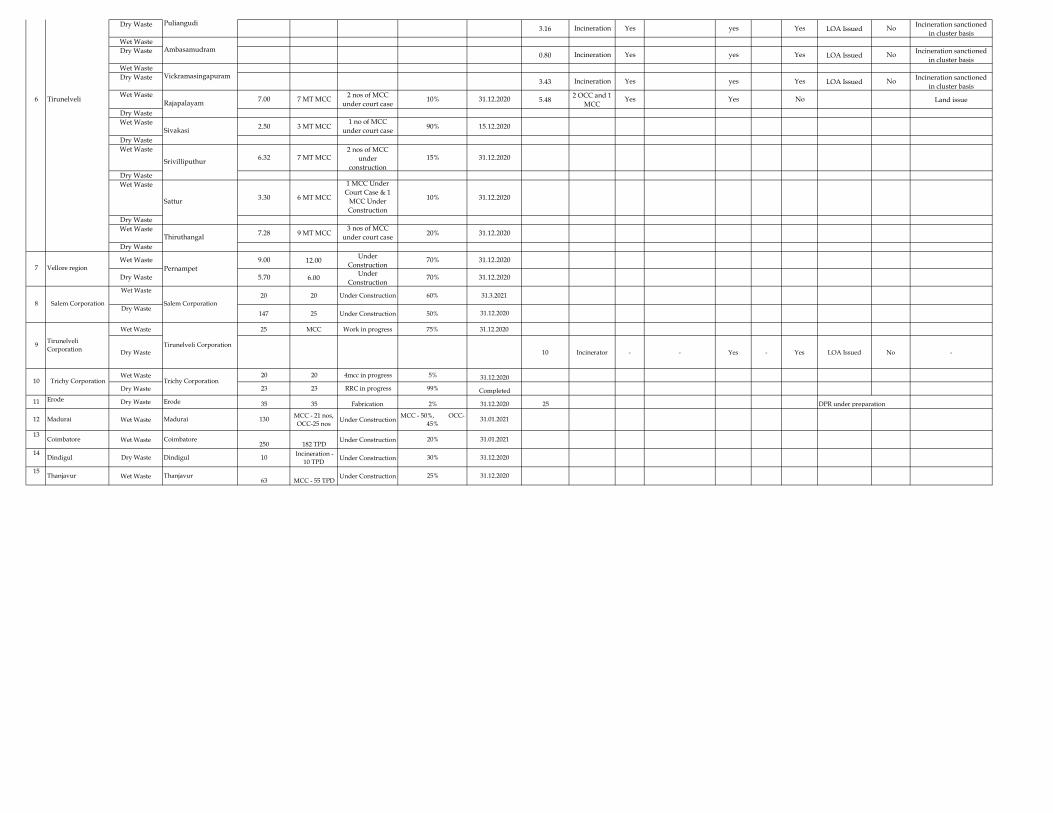
Dry Waste3.16 Incineration Yes yes Yes LOA Issued No
Incineration sanctioned
in cluster basisWet Waste
Dry Waste0.80 Incineration Yes yes Yes LOA Issued No
Incineration sanctioned
in cluster basisWet Waste
Dry Waste3.43 Incineration Yes yes Yes LOA Issued No
Incineration sanctioned
in cluster basisWet Waste
7.00 7 MT MCC2 nos of MCC
under court case10% 31.12.2020 5.48
2 OCC and 1
MCCYes Yes No Land issue
Dry Waste
Wet Waste2.50 3 MT MCC
1 no of MCC
under court case90% 15.12.2020
Dry Waste
Wet Waste6.32 7 MT MCC
2 nos of MCC
under
construction
15% 31.12.2020
Dry Waste
Wet Waste
3.30 6 MT MCC
1 MCC Under
Court Case & 1
MCC Under
Construction
10% 31.12.2020
Dry Waste
Wet Waste7.28 9 MT MCC
3 nos of MCC
under court case20% 31.12.2020
Dry Waste
Wet Waste 9.00 12.00Under
Construction70% 31.12.2020
Dry Waste 5.70 6.00Under
Construction70% 31.12.2020
Wet Waste20 20 Under Construction 60% 31.3.2021
Dry Waste147 25 Under Construction 50% 31.12.2020
Wet Waste 25 MCC Work in progress 75% 31.12.2020
Dry Waste 10 Incinerator - - Yes - Yes LOA Issued No -
Wet Waste 20 20 4mcc in progress 5% 31.12.2020
Dry Waste 23 23 RRC in progress 99% Completed
11 Erode Dry Waste Erode 35 35 Fabrication 2% 31.12.2020 25 DPR under preparation
12 Madurai Wet Waste Madurai 130MCC - 21 nos,
OCC-25 nosUnder Construction
MCC - 50%, OCC-
45%31.01.2021
13Coimbatore Wet Waste Coimbatore
250 182 TPDUnder Construction 20% 31.01.2021
14Dindigul Dry Waste Dindigul 10
Incineration -
10 TPDUnder Construction 30% 31.12.2020
15Thanjavur Wet Waste Thanjavur
63 MCC - 55 TPDUnder Construction 25% 31.12.2020
Vickramasingapuram
6 Tirunelveli
Puliangudi
Ambasamudram
8
9
Rajapalayam
Sivakasi
Srivilliputhur
Sattur
Thiruthangal
Vellore region Pernampet7
Salem Corporation Salem Corporation
Trichy Corporation10 Trichy Corporation
Tirunelveli CorporationTirunelveli
Corporation

upto Sep'20 upto Oct'20
upto
Sep'20
upto
Oct'20
Ukkadam
Lat : 10.98315765
Lon : 76.972522962012 Operational 70.00 35.00 35.00 SBR Let out into the
Noyyal river Comply
Ondiputhur
Lat : 10.9871063
Log : 77.0013272017 Operational 60.00 5.00 5.00 SBR Let out into the
Noyyal river Comply
2 Vellore
Muthumandapam
12.932166
79.135616
2015 Operational 9,014 9,067 10.28 7.50 7.50 ASPLet out into the
Velavaadi EriComply
3 Dindigul
10.35°N,
77.95°E 06.11.2013 Operational 13430 13450 13.65 3.00 3.00 ASP
1)For dilution
purpose
(1MLD)
2)Irrigation
purpose
(0.5MLD) Comply
4 Tiruchirappalli
Lat - 10.45'6"
Long -78.39'32"
01.01.1987
1) Operational
58.64 MLD
2) Under
rejuvenation - 30
MLD in Amrut
Phase II
3) Construction
of 37 MLD STP -
under Amrut
UGSS Phase II
(SBR
Technology)
61809 62144 58.00 58.00 58.00 WSP Koraiyar River Comply
5 Avadi
Paruthipattu
13.109258,
80.104765
Mukthapudupet
13.149045,
80.059462
July 2017 (Partly
commissioned)
1 STP (4mld) -
Completed
36 MLD under
progress 2026 3061 4.00 2.00 2.50 SBR
Afforeststation
near mittanmall
eri Coovam
River Comply
6 Madurai
Sakkimangalam
Lat: 9.899924
Long: 78.190997
Avaniyapuram
Lat: 9.871233
Long: 78.10473
01.03.2011
Operational 165414 165480
170.70 MLD
(45.70 +
125.00) MLD 38 38 SBR
Treated water
let out into
Grass land ComplyVellakuttai -
11°39'14" N -
78°10'12" E 01.03.2018 Operational
4677 4727 13.00 6.00 7.00 ASP Comply
Anaimedu -
11°39'42" N -
78°9'52"E01.03.2019 Operational
1158 1208 6.00 3.00 3.00 MBBR Comply
Coimbatore 59086
Complianc
e Status
(Comply/
Non- comp
/Patially
Comply.) Remarks
Date of
Commissioning
Status
(Operational /
Non-
Operational /
Under
Construction)
Location of STP
with Coordinates
(Latitute and
Longitude, if
available)
Actual Utilization of
installed Capacity (in
MLD)
City / TownS. No
56586
No. of HSCs effected
1
Technolog
y (UASB/
ASP/ OP/
SBR/ MBR
/ FAB
Etc.,)
Installed
Capacity of
STP (in MLD)
Use of treated
sewage with
Quantity
Name of the State : Tamilnadu
Commissionerate of Municipal Administration
Sewage Treatment Plant Utilization & House Service Connection details
Treated water
let out into
Thirumanimuth
aru River
Salem 7

upto Sep'20 upto Oct'20
upto
Sep'20
upto
Oct'20
Complianc
e Status
(Comply/
Non- comp
/Patially
Comply.) Remarks
Date of
Commissioning
Status
(Operational /
Non-
Operational /
Under
Construction)
Location of STP
with Coordinates
(Latitute and
Longitude, if
available)
Actual Utilization of
installed Capacity (in
MLD)
City / TownS. No
No. of HSCs effected
Technolog
y (UASB/
ASP/ OP/
SBR/ MBR
/ FAB
Etc.,)
Installed
Capacity of
STP (in MLD)
Use of treated
sewage with
Quantity
Mankuttai -
11°40'7" N -
78°7'35"E
29.08.2020 Operational
86 286 35.00 1.00 1.00 FAB Comply
Vandipettai-
11°39'0" N -
78°8'33"E 44.00 - - FAB -
8 Tirunelveli
8.7568547
77.6829877 2007 Operational 26223 26338 24.20 8.50 8.50 WSP
8 MLD let in to
water course Comply
9 Thanjavur
10.78512
79.157975 26.02.2003
Under
Renovation 23863 23880 28.05 14.15 14.15 ASP
Under
Rejunuvation Comply
10 Tiruppur
11o08'02'N,
77o24'45'E
9/1/2009
Operational 15617 15625 15.00 7.50 7.50 EASP
Let into Noyyal
river Comply
11 Erode
NL 11'20'18'
EL 77'44'22'
12/22/2018
Operational 17,950 18,100 50.55 18.5 18.5 MBBR Gardening Comply
12 Cuddalore
Devanampattinam
11.753832
79.780407 2016 Operational 14134 14134 12.25 6.00 6.50 ASP
Kediliam River Comply
13 Kanchipuram
Nathapettai
12.828724
79.722854
1972 Renovated
scheme -2011 April Operational 21934 21934 14.5 13.5 13.5 WSP
Nathapettai
Lake Comply
14 Maraimalai Nagar
Adigalar salai
Longtitude-80.03006
Latitude-
12.79923 28.02.2011 Operational 4980 4989 2.2 1.8 1.8 EASP Ninnakarai Eri Comply
15 Pallavapuram
Perungudi
Latitute: 12.9568105
Longitude:
80.2361331 2003 Operational 33180 33360 ASP
STP
@Perungudi
(CMWSSB)
Buckingam
canal Comply
16 Tiruvallur
Sivam Nagar
Latitute:13.12118
Longitude:79.9259 17.2.2017 Operational 6698 6742 6.20 3.60 3.60 MBBR
Irrigation
channel Comply
17 Thiruvannamalai
Manalurpet Road
Latitude-
12.21663355
Longitude-
79.06861122
2014 Operational 12328 12328 8.70 4.50 4.20 ASP
Let out in Olai
Yaru as per
design
Comply
Kakuppam
Lat - 11.957374
Lon - 79.504349
Erumanthangal
Lat - 11.944019
Lon - 79.514268
Treated
effluent is
discharged to
Lake
(Erumanthagal)
through
18 Viluppuram 6124 ASP12.50
115MLD
(CMWSSB STP - Perungudi)
8.60Operational 6109 8.60
Treated water
let out into
Thirumanimuth
aru River
Salem 7
Civil Work Completed. EB to be obtained
Comply26.06.2014

upto Sep'20 upto Oct'20
upto
Sep'20
upto
Oct'20
Complianc
e Status
(Comply/
Non- comp
/Patially
Comply.) Remarks
Date of
Commissioning
Status
(Operational /
Non-
Operational /
Under
Construction)
Location of STP
with Coordinates
(Latitute and
Longitude, if
available)
Actual Utilization of
installed Capacity (in
MLD)
City / TownS. No
No. of HSCs effected
Technolog
y (UASB/
ASP/ OP/
SBR/ MBR
/ FAB
Etc.,)
Installed
Capacity of
STP (in MLD)
Use of treated
sewage with
Quantity
19 Arakkonam
Silverpet
13.110069'N
79.698920'E
Trial run
commenced from
15.11.2019
Operational 4756 5085 11.04 1.5 2.00 ASP
The treated
sewage water
letout into near
by Thangal
ComplyTrial run in
progress
20 Bodinayakkanur Lat - 10.0179204,
Lon - 77.3590704
27.2.2019 Operational 10465 10465 12.08 4.00 4.00 ASP 3.00MLD
Agriculture
purpuse
Comply
21 Chinnamanur
Latitute-9.850333
Longitude-
77.385067
01.04.2012 Operational 6490 6497 3.99 3.72 3.72 ASP 3.70 MLD.
The treated
effluent are
being
discharged
with
Chinnavaikal
for agricultural
purpose.
Comply
22 Periyakulam Latitude-
10.1256415
Longitude-
77.561725
2017 Operational 2215 7249 5.47 5.47 5.47 ASP Agricultural
Purpose
Comply
23 Ramanathpuram Kaluguoorani
(Viilage)
Lat :9.369763,
Lon : 78.830838
06.11.2013 Operational 10312 10312 7.00 5.80 5.80 MASP Back water of
sea
Comply
24 Theni-Allinagaram Karuvelnayakan
Patti, Theni
( Veeranayakan
Patti ) 9.999, 77.502
08.06.2015 Operational 10370 10375 12.05 6.50 6.50 ASP 5.00 MLD of
treated sewage
is disposing in
Thamaraikula
m for
Agricultural
Purpose
Comply
25 Dharmapuri
12`9`1.85``
78`10`50.14`` 05.07.2014 Operational 6000 6000 4.86 3.50 3.50 ASP
Discharging
into nearby
river comlpy
26 Karur
Arasu Colony,
Panchama devi
Village
latitude :
10.97 997,
Longitude: 30.04.2007 Operational 15221 15262 15.00 6.50 6.50 EAP
Discharging
into Irrigation
channel Comply
27 Krishnagiri
Derasamuthiram Eri
Latitude 2 30'25.48"
N and Longitude 78
30'25.48" E 15.7.2017 Operational 6020 6020 12.34 7.80 7.80 ASP
Discharging
into Deva
samuththram comlpy
28 Namakkal
Sendamangalam
road,
Namakkal 01.10.2014 Operational 9078 9239 5.00 5.00 5.00 ASP
Discharging
into
Kosavampatti
Eri Comply
Mettur STP-1
Thangamapuripattin
am
Latitude=11.47'37"
Longitude-77.49'07" Aug-19 Opertional
340 340 0.823 0.30 0.38
ASP Comply
29
Discharging
into sewage
farm for
Agriculture
Purpose

upto Sep'20 upto Oct'20
upto
Sep'20
upto
Oct'20
Complianc
e Status
(Comply/
Non- comp
/Patially
Comply.) Remarks
Date of
Commissioning
Status
(Operational /
Non-
Operational /
Under
Construction)
Location of STP
with Coordinates
(Latitute and
Longitude, if
available)
Actual Utilization of
installed Capacity (in
MLD)
City / TownS. No
No. of HSCs effected
Technolog
y (UASB/
ASP/ OP/
SBR/ MBR
/ FAB
Etc.,)
Installed
Capacity of
STP (in MLD)
Use of treated
sewage with
Quantity
Mettur STP-2
Salem Camp
Latitude=11.47'20"
Longitude-77.47'45'' Jan-19 Opertional
330 330 0.924 0.15 0.19
ASP Comply
Mettur STP-3
Komburankadu
Latitude :11.46'60''
Longitude: 77.47'01" May-19 Opertional
3437 3508 5.452 2.40 2.40
ASP Comply
30 Kumbakonam
10'58'22.09"N
79'24'48.55" E 2009 Operational 19575 19582 17 12 12 ASP
Irrigation
channel comply
Lat: 10.757905
Long: 79.834479 11867 11867 4.5 4.5
Lat: 10.822428
Long: 79.844813 834 834 0.4 0.4
32 Tiruvarur
Kekkarai Village -
NL 10º48'29" and
EL79º38'17" 01.10.2014 Operational 6081 6091 6.92 4.1 4.1 ASP
Let Out in
Odambokki
River 3.40
MLD Comply
33 Ariyalur
Keezhapalur village.
11◦04'06.9"N
79◦03'19.8"E 28.05.2020 Operational 1886 1906 4.16 1 1 ASP
Disposal to
sembodai it will
be used for
Agriculture
purpose. Comply
34 Pudukkottai
Latitute : 10'21'36''
North
Longitude: 78'48'33'
East 27.7.2016 Operational 14828 14913 10.62 4 4 ASP
Discharging
into Irrigation
channel Comply
35 Mayiladuthurai
Latitute :
11.6'21" North
Longitude: 79.40'22"
East 01.01.2008 Operational 11151 11151 5.85 5.85 5.85 WSP
Discharging
into Irrigation
channel Comply
36 Perambalur
Neduvasal road,
Thuraimangalam
road. (Lat .
111410.9 N)
Long. 7852 57. E) 06.11.2013 Operational 11542 11595 4.20 3.60 3.60 ASP
To Kattuvaikal
cultivation
purpose & 3.60
MLD Comply
29
comply
9.63
Discharging
into sewage
farm for
Agriculture
Purpose
Nagapattinam 27.02.2016 Operational
Discharged
into Devanathi
river &
Proposed sale
of treated
effluent to
Nagai
Powerplant
comply
Nagore 31.05.2019
ASP
Operational 2.69 EASP
31

upto Sep'20 upto Oct'20
upto
Sep'20
upto
Oct'20
Complianc
e Status
(Comply/
Non- comp
/Patially
Comply.) Remarks
Date of
Commissioning
Status
(Operational /
Non-
Operational /
Under
Construction)
Location of STP
with Coordinates
(Latitute and
Longitude, if
available)
Actual Utilization of
installed Capacity (in
MLD)
City / TownS. No
No. of HSCs effected
Technolog
y (UASB/
ASP/ OP/
SBR/ MBR
/ FAB
Etc.,)
Installed
Capacity of
STP (in MLD)
Use of treated
sewage with
Quantity
37 Udhagamandalam
Kasthooribai colony
Latitude -11.408436
Longtitude -
76.679469
15.04.2000 Operational 16085 16097 5.00 4.00 4.00 ASPDisposal into
Grass landComply -
38 Udumalaipet
Kurinjeri
Latitude - 10.59812
Longtitude -
77.25447
30.06.2016 Operational 10856 10856 7.81 3.50 3.50 ASPDisposal into
Kurunjeri Odai Comply
39 Virudhunagar
lat -9.5654 long-
77.9603 19.10.2014 Operational 7210 7475 7.65 3.68 3.70 ASP
Disposal into
Kowsika river Comply
40 Chidambaram
Lat -11.421
Long- 79.6889 2020 Operational 1650 1812 9.44 2.1 2.10 ASP
Proposed to
discharge into
Pasimuthan
odai Comply
41 Thirupaththur
Latitude -
12°29'.05.540" N
Longtitude -
78°34'.25.101" E 2433 2650 11.43 0.50 0.5 ASP
Proposed to
discharge
treated effluent
through
pipeline to
Vegalapuram Comply
704357 709574 857.20 347.02 349.36
Trial Run starts from 30.09.2020
Total

1
National Mission for Clean Ganga
Format for submission of Monthly Progress Reportin the NGT Matter OA
No. 673 of 2018 (in compliance to NGT order dated 24.09.2020)
For the State of Tamil Nadu (Chennai)
Overall status of the State:
I. Total Population:Urban Population& Rural Population separately
II. Estimated Sewage Generation (MLD): 530
III. Details of Sewage Treatment Plant:
S.No. Details of Sewage Treatment Plant State PRS
1 Existing no. of STPs and Treatment Capacity (in MLD) 745
2 Capacity Utilization of existing STPs 530
3 MLD of sewage being treated through Alternate
technology
108
4 Gap in Treatment Capacity in MLD Nil
5 No. of Operational STPs 13
6 No. of Complying STPs 13
7 No. of Non-complying STPs Nil
Details of each existing STP in the State& PRS
No. Location Existing
STP
Capacity
Capacity
Being
Utilized
Operational
Status
of STP
Compliance Status of STP pH TSS COD BOD
1 Nesapakkam
STP Zone - IV
23 13 Operational 7.67 801 58 14
2 Koyambedu
STP Zone - III
34 30 Operational 7.65 950 85 16
3 Kodungaiyur
STP Zone II
80 65 Operational 7.55 1020 93 17
4 Kodungaiyur
STP Zone I
80 56 Operational 7.60 1015 95 16
5 Perungudi STP
Zone - V
12 11 Operational 7.60 960 96 17
6 Koyambedu 60 17 Operational 7.65 930 85 15

2
STP Zone - III
7 Kodungaiyur
STP Zone I& II 110
97 Operational 7.53 805 79 16
8 Nesapakkam
STP Zone - IV 40
39 Operational 7.57 776 74 15
9 Perungudi STP
Zone - V 54
50 Operational 7.66 1060 90 13
10 Perungudi STP
Zone – V 60
44 Operational 7.64 1040 150 17
11 Nesapakkam
STP Zone - IV 54
43 Operational 7.60 782 77 17
12 Koyambedu
STP Zone – III 120
60 Operational 7.65 810 79 16
13 Sholinganallur
STP 18
5 Operational
Total 745 530
Details of under construction STPs in the State& PRS
No. Location Capacity of the
plant in MLD
Physical
Progress in
%
Status of I&D or
House sewer
connections
Completion
Timeline
1 Sholinganallur
STP 54
80 Dec 2020
2 Thiruvottriyur
STP 31
100
3 Kodungaiyur
STP Zone - I 120
31 Feb 2022
4 Kodungaiyur
STP Zone - II 120
33 Feb 2022
5 Nesapakkam
STP Zone - IV 50
28 Feb 2022
6 Perungudi STP
Zone - V 60
22 Feb 2022
Total
Details of proposed STPs in the State& PRS

3
No. Location Capacity of the
STP proposed
in MLD
Status of Project (at DPR
Stage/ Under Tendering/
Work to be Awarded)
Likely Date of
Completion
Total
Details of proposed STPs in the State
No. Location Capacity of the
STP proposed
in MLD
Status of Project (at DPR
Stage/ Under Tendering/
Work to be Awarded)
Likely Date of
Completion
Total
IV. Details of Industrial Pollution:
No. of industries in the State& PRS:
No. of water polluting industries in the State& PRS:
Quantity of effluent generated from the industries in MLD:
Quantity of Hazardous Sludge generated from the Industries in TPD:
Number of industrial units having ETPs in State & PRS:
Number of industrial units connected to CETP:
Number and total capacity of ETPs (details of existing/ under construction / proposed)
Compliance status of the ETPs:
Number and total capacity of CETPs (details of existing/ under construction /
proposed)
Status of compliance and operation of the CETPs
Town No. of
industries
Industrial
discharge
Status of ETPs Status of CETPs
(existing, under
construction &
proposed)
V. Solid Waste Management:
Total number of Urban Local Bodies and their Population
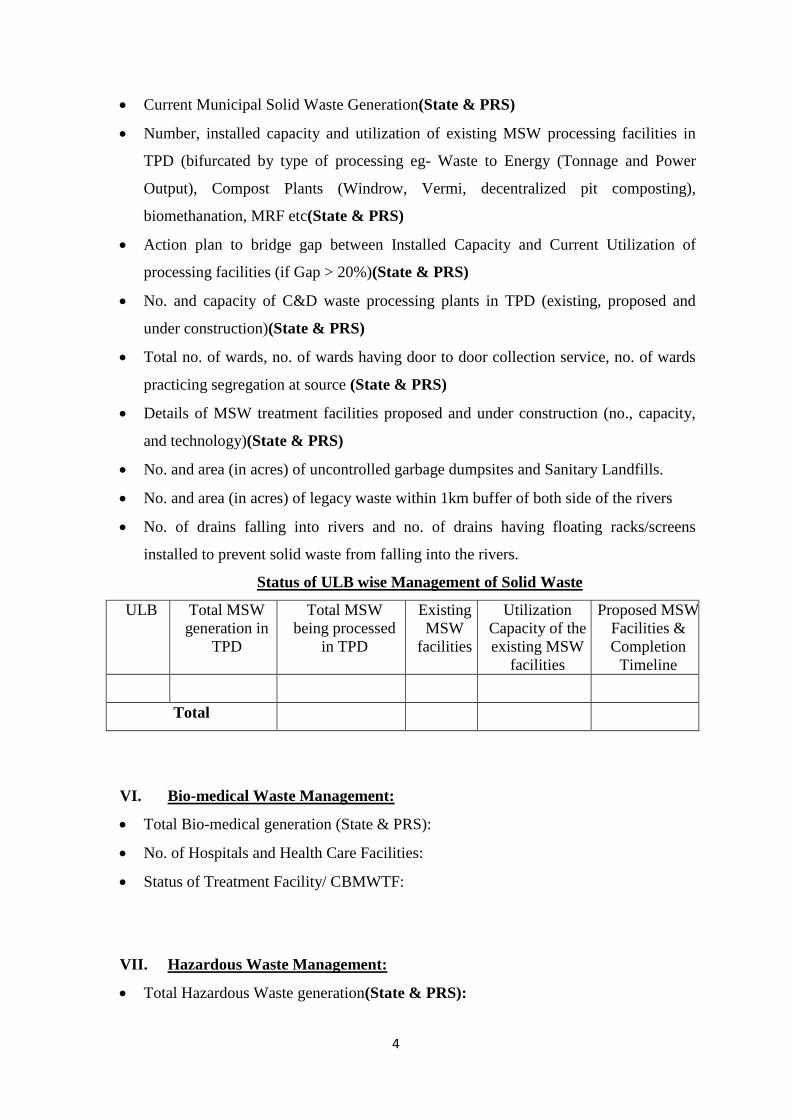
4
Current Municipal Solid Waste Generation(State & PRS)
Number, installed capacity and utilization of existing MSW processing facilities in
TPD (bifurcated by type of processing eg- Waste to Energy (Tonnage and Power
Output), Compost Plants (Windrow, Vermi, decentralized pit composting),
biomethanation, MRF etc(State & PRS)
Action plan to bridge gap between Installed Capacity and Current Utilization of
processing facilities (if Gap > 20%)(State & PRS)
No. and capacity of C&D waste processing plants in TPD (existing, proposed and
under construction)(State & PRS)
Total no. of wards, no. of wards having door to door collection service, no. of wards
practicing segregation at source (State & PRS)
Details of MSW treatment facilities proposed and under construction (no., capacity,
and technology)(State & PRS)
No. and area (in acres) of uncontrolled garbage dumpsites and Sanitary Landfills.
No. and area (in acres) of legacy waste within 1km buffer of both side of the rivers
No. of drains falling into rivers and no. of drains having floating racks/screens
installed to prevent solid waste from falling into the rivers.
Status of ULB wise Management of Solid Waste
ULB Total MSW
generation in
TPD
Total MSW
being processed
in TPD
Existing
MSW
facilities
Utilization
Capacity of the
existing MSW
facilities
Proposed MSW
Facilities &
Completion
Timeline
Total
VI. Bio-medical Waste Management:
Total Bio-medical generation (State & PRS):
No. of Hospitals and Health Care Facilities:
Status of Treatment Facility/ CBMWTF:
VII. Hazardous Waste Management:
Total Hazardous Waste generation(State & PRS):

5
No. of Industries generating Hazardous waste
Treatment Capacity of all TSDFs
Avg. Quantity of Hazardous waste reaching the TSDFs and Treated
Details of on-going or proposed TSDF
VIII. Plastic Waste Management:
Total Plastic Waste generation (State & PRS):
Treatment/ Measures adopted for reduction or management of plastic waste:
IX. Details of Alternate Treatment Technology being adopted by the State/UT
X. Identification of polluting sources including drains contributing to river pollution
and action as per NGT order on insitu treatment:
XI. Details of Nodal Officer appointed by Chief Secretary in the State/UT:
XII. Details of meetings carried under the Chairmanship Chief of Secretary in the
State/UT:
XIII. Latest water quality of polluted river, its tributaries, drains with flow details and
ground water quality in the catchment of polluted river;
XIV. Ground water regulation:
XV. Good irrigation practices being adopted by the State:
XVI. Rain Water Harvesting:
XVII. Demarcation of Floodplain and removal of illegal encroachments:
XVIII. Maintaining minimum e-flow of river:
XIX. Plantation activities along the rivers:
XX. Development of biodiversity park:
XXI. Reuse of Treated Water:
XXII. Model River being adopted by the State & Action Proposed for achieving the
bathing quality standards:
XXIII. Status of Preparation of Action Plan by the 13 Coastal States:
XXIV. Regulation of Mining Activities in the State/UT:
XXV. Action against identified polluters, law violators and officers responsible for
failure for vigorous monitoring

1
National Mission for Clean Ganga
Format for submission of Monthly Progress Report in the NGT Matter OA No. 673 of 2018
(in compliance to NGT order dated 24.09.2020)
Directorate of Town Panchayats
For the PRS
Overall status of the State:
I. Total Population: Urban Population & Rural Population separately - 569217
II. Estimated Sewage Generation (MLD): 12.775 MLD
III. Details of Sewage Treatment Plant:
Existing no. of STPs and Treatment Capacity (in MLD):
Capacity Utilization of existing STPs:
MLD of sewage being treated through Alternate technology:
Gap in Treatment Capacity in MLD:
No. of Operational STPs:
No. of Complying STPs:
No. of Non-complying STPs:
Details of each existing STP in the State
No. Location Existing STP
Capacity
Capacity Being
Utilized
Operational Status
of STP
Compliance
Status of STP
- - - - -
Details of under construction STPs in the State
No. Location Capacity of the
plant in MLD
Physical
Progress in
%
Status of I&D or
House sewer
connections
Completion
Timeline
- - - - -

2
IV. Details of proposed STPs/FSTPs in the State
S.No
Name of the ULB
STP/FSTPs
STP/FSTPs capacity in MLD/KLD
Status of DPR
Preparation
Status of DPR approv
al
Status of
award of
tender
Designated nodal Agenc
y
Treatment Technolog
y along with firm
completion
timelines
Remarks
1 Musiri TP - - DPR Stage
- - PWD - DPR is under preparation by
WAPCOS/ PWD.
2 Sirugamani TP - - DPR Stage
- - PWD
- “
3 Mohanur TP - - DPR Stage
- - PWD
- “
4 Velur TP - - DPR Stage
- - PWD
- “
5 Punjai Pugalur
TP - -
DPR Stage
- - PWD
- “
6 Bhavani sagar
TP - -
DPR Stage
- - PWD
- “
7 Sirumugai TP - - DPR Stage
- - PWD
- “
8 Madathukulam
TP - -
DPR Stage
- - PWD
- “
9 Omalur TP - - DPR Stage
- - PWD
- “
10 Poallampatty
TP - -
DPR Stage
- - DTP -
Tamilnadu Water Investment Company (M/s. TWIC) has been appointed as consultant for preparation of
DPR. The
DPR will be expected to be ready by 31.12.2020
11 Pethanaickenp
alayam TP - -
DPR Stage
- - DTP
- “
12 Yethapur TP - - DPR Stage
- - DTP
- “
13 Belur TP - - DPR Stage
- - DTP
- “
14 Srivaikundam
TP - -
DPR Stage
- - DTP
- “
15 Authoor TP - - DPR Stage
- - DTP
- “
16 Eral TP - - DPR Stage
- - DTP
- “

3
17 Alwarthirunaga
ri TP - -
DPR Stage
- - DTP
- “
18 Then
Thiruperai TP - -
DPR Stage
- - DTP
- “
19 Arumuganeri
TP - -
DPR Stage
- - DTP
- “
20 Mukkudal TP - - DPR Stage
- - DTP
- “
21 Gopalasamudr
am TP - -
DPR Stage
- - DTP
- “
22 Kallidaikurichi
TP - -
DPR Stage
- - DTP
- “
23 Cheranmahade
vi TP - -
DPR Stage
- - DTP
- “
24 Veeravanallur
TP - -
DPR Stage
- - DTP
- “
25 Patthamadai
TP - -
DPR Stage
- - DTP
- “
26 Mela Seval TP - - DPR Stage
- - DTP
- “
27 Kuthalam TP - - DPR Stage
- - PWD
- DPR is under preparation by
WAPCOS/ PWD.
28 Thirukattupalli
TP - -
DPR Stage
- - PWD
- “
29 Thiruvaiyaru
TP - -
DPR Stage
- - PWD
- “
V. Details of Industrial Pollution:
No. of industries in the State:
No. of water polluting industries in the State:
Quantity of effluent generated from the industries in MLD:
Quantity of Hazardous Sludge generated from the Industries in TPD:
Number of industrial units having ETPs:
Number of industrial units connected to CETP:
Number and total capacity of ETPs (details of existing/ under construction / proposed)
Compliance status of the ETPs:
Number and total capacity of CETPs (details of existing/ under construction / proposed)
Status of compliance and operation of the CETPs
Town No. of
industries
Industrial
discharge
Status of ETPs Status of CETPs
(existing, under
construction &
proposed)

4
VI. Solid Waste Management:
Total number of Urban Local Bodies and their Population - 29
Current Municipal Solid Waste Generation – 125.73 MT
Number, installed capacity and utilization of existing MSW processing facilities in TPD (bifurcated by
type of processing eg- Waste to Energy (Tonnage and Power Output), Compost Plants (Windrow, Vermi,
decentralized pit composting), biomethanation, MRF etc
Total MSW generated - 125.73 TPD
Total MSW processed - 109.47 TPD
Gap in processing - 16.26 TPD
S.No Description Nos Installed Capacity MT Utilization Capacity
TPD
1 Windrow & Vermi
Composting
43 402 110
2 De-Centralised 4 7 7
3 Bio-Gas / Bio-
Methanation
3 6 6
4 RRC 29 34 29
Action plan to bridge gap between Installed Capacity and Current Utilization of processing facilities (if
Gap > 20%)
Incinerators & Pyrolysis Plant are proposed to install for processing non-recyclable dry
waste in cluster basis
No. and capacity of C&D waste processing plants in TPD (existing, proposed and under construction)
Total no. of wards, no. of wards having door to door collection service, no. of wards practicing segregation
at source
Total no. of wards - 465
Door to Door collection – 451
Source segregation – 414
Details of MSW treatment facilities proposed and under construction (no., capacity, and technology)
Incinerators & Pyrolysis Plant are proposed to install for processing non-recyclable dry
waste in cluster basis.

5
No. and area (in acres) of uncontrolled garbage dumpsites and Sanitary Landfills.
No. and area (in acres) of legacy waste within 1km buffer of both side of the rivers
No. of drains falling into rivers and no. of drains having floating racks/screens installed to prevent solid
waste from falling into the rivers
Status of ULB wise Management of Solid Waste
ULB Total MSW
generation in
TPD
Total MSW
being processed
in TPD
Existing
MSW
Facilities
Plant Capacity of
the existing MSW
facilities
Proposed MSW
Facilities &
Completion
Timeline
29
125.73
109.47
1.windrow &
Vermi
compost
402 MT
Incinerators &
Pyrolysis Plant
are proposed to
install for
processing non-
recyclable dry
waste in cluster
basis
2.Decentralize
d composting
7 MT
3. Biogas 6 MT
4.Incinerators
& Pyrolysis
Plant
Under
construction will
be completed
before
March2021
VII. Bio-medical Waste Management:
Total Bio-medical generation:
No. of Hospitals and Health Care Facilities:
Status of Treatment Facility/ CBMWTF:
VIII. Hazardous Waste Management:
Total Hazardous Waste generation:
No. of Industries generating Hazardous waste
Treatment Capacity of all TSDFs
Avg. Quantity of Hazardous waste reaching the TSDFs and Treated
Details of on-going or proposed TSDF
IX. Plastic Waste Management:
Total Plastic Waste generation: 6 TPD
Treatment/ Measures adopted for reduction or management of plastic waste:

6
Recyclable/ Saleable plastics are been sold to authorized vendors
Non- saleable plastics are been sent to cement factories and are used as a component for laying
roads
Incinerators & Pyrolysis Plant are proposed to install for processing non-recyclable dry waste in
cluster basis
X. Details of Alternate Treatment Technology being adopted by the State/UT
XI. Identification of polluting sources including drains contributing to river pollution and action as per
NGT order on insitu treatment:
XII. Details of Nodal Officer appointed by Chief Secretary in the State/UT:
XIII. Details of meetings carried under the Chairmanship Chief of Secretary in the State/UT:
XIV. Latest water quality of polluted river, its tributaries, drains with flow details and ground water quality
in the catchment of polluted river;
XV. Ground water regulation:
XVI. Good irrigation practices being adopted by the State:
XVII. Rain Water Harvesting:
XVIII. Demarcation of Floodplain and removal of illegal encroachments:
XIX. Maintaining minimum e-flow of river:
XX. Plantation activities along the rivers:
XXI. Development of biodiversity park:
XXII. Reuse of Treated Water:
XXIII. Model River being adopted by the State & Action Proposed for achieving the bathing quality
standards:
XXIV. Status of Preparation of Action Plan by the 13 Coastal States:
XXV. Regulation of Mining Activities in the State/UT:
XXVI. Action against identified polluters, law violators and officers responsible for failure for vigorous
monitoring
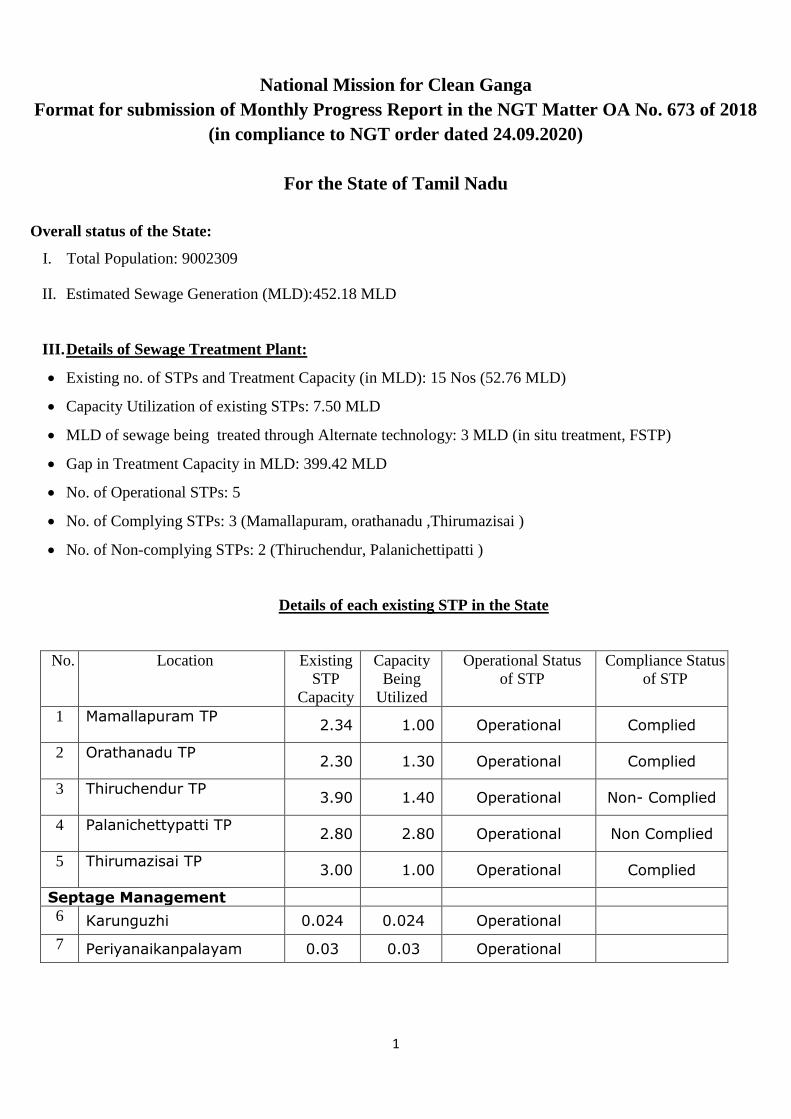
1
National Mission for Clean Ganga
Format for submission of Monthly Progress Report in the NGT Matter OA No. 673 of 2018
(in compliance to NGT order dated 24.09.2020)
For the State of Tamil Nadu
Overall status of the State:
I. Total Population: 9002309
II. Estimated Sewage Generation (MLD):452.18 MLD
III. Details of Sewage Treatment Plant:
Existing no. of STPs and Treatment Capacity (in MLD): 15 Nos (52.76 MLD)
Capacity Utilization of existing STPs: 7.50 MLD
MLD of sewage being treated through Alternate technology: 3 MLD (in situ treatment, FSTP)
Gap in Treatment Capacity in MLD: 399.42 MLD
No. of Operational STPs: 5
No. of Complying STPs: 3 (Mamallapuram, orathanadu ,Thirumazisai )
No. of Non-complying STPs: 2 (Thiruchendur, Palanichettipatti )
Details of each existing STP in the State
No. Location Existing
STP
Capacity
Capacity
Being
Utilized
Operational Status
of STP
Compliance Status
of STP
1 Mamallapuram TP
2.34 1.00 Operational Complied
2 Orathanadu TP
2.30 1.30 Operational Complied
3 Thiruchendur TP
3.90 1.40 Operational Non- Complied
4 Palanichettypatti TP
2.80 2.80 Operational Non Complied
5 Thirumazisai TP
3.00 1.00 Operational Complied
Septage Management
6 Karunguzhi 0.024 0.024 Operational
7 Periyanaikanpalayam 0.03 0.03 Operational

2
Details of under construction STPs in the State
No. Location Capacity of
the plant in
MLD
Physical
Progress in %
Status of I&D or
House sewer
connections
Completion
Timeline
1 Ulunderpettai TP
3.15
99% completed
6176 Dec-20
2 Sriperumbudur TP
8.50
80% completed
5028 Work in
progress
March-21 3 Velankanni TP
2.33
100%
completed 1320 Dec-20
4 Thiruporur TP 4.02
63%
completed 3288 Mar-21
5 Ponneri TP
6.52
30%
completed 1132 Mar-21
6 Manachanallur TP
6.41
95%
completed 3671 1990
Dec-20 7 S.Kannanur TP
8 Vallam TP
2.35
97% completed
2967 Jan-21
9 Perundurai TP
3.14
90% completed
3390 Jan-21
10 Melachokanathapuram TP
2.00
40% completed
1270 May-21
Septage Management
11 Mudukulathur TP 0.015
65%
completed - Dec-20
12 Jalakandapuram TP 0.015
75%
completed - Dec-20
13 Pennagaram TP 0.015
20%
completed - Dec-20
14 Kaveripattinam TP 0.015
60%
completed - Dec-20
15 Chengam TP 0.020
70%
completed - Dec-20
16 Kurumbalur TP 0.010
45%
completed - Dec-20
17 Pennadam TP 0.010
25% completed
- Mar-21
18 Alangayam TP 0.015
30% completed
- Jan-21

3
Details of proposed STPs in the State
No. Location Capacity of the
STP proposed
in MLD
Status of Project (at DPR Stage/ Under
Tendering/ Work to be Awarded)
Likely Date of
Completion
1 Mangadu Opp to SWM,
at pattur road
DPR stage-Comprehensive UGSS in
Poonamallee cluster A with Mangadu
Town Panchayat and 12 Village Town
Panchayat
2 Chitlapakkam Detailed project Report prepared under TNUISFL for Sembakkam
cluster basis with 13 local bodies(Fund assistance from Project
Development Grant Fund)
3 Madampakkam Detailed project Report prepared
under TNUISFL for Sembakkam cluster basis with 13 local bodies(Fund assistance from Project
Development Grant Fund)
4 Peerkankaranai DPR has to be prepared through
TNUISFL on cluster basis
5 Perungalathur DPR has to be prepared through
TNUISFL on cluster basis
6 Thiruneermalai DPR as to be prepared through
TNUISSL by cluster basis
IV. Details of Industrial Pollution:
No. of industries in the State:
No. of water polluting industries in the State:
Quantity of effluent generated from the industries in MLD:
Quantity of Hazardous Sludge generated from the Industries in TPD:
Number of industrial units having ETPs:
Number of industrial units connected to CETP:
Number and total capacity of ETPs (details of existing/ under construction / proposed)
Compliance status of the ETPs:
Number and total capacity of CETPs (details of existing/ under construction / proposed)
Status of compliance and operation of the CETPs
Town No. of
industries
Industrial
discharge
Status of ETPs Status of CETPs
(existing, under
construction &
proposed)

4
V. Solid Waste Management:
Total number of Urban Local Bodies and their Population - 528
Current Municipal Solid Waste Generation – 2100 MT
Number, installed capacity and utilization of existing MSW processing facilities in TPD (bifurcated by
type of processing eg- Waste to Energy (Tonnage and Power Output), Compost Plants (Windrow, Vermi,
decentralized pit composting), biomethanation, MRF etc
Total MSW generated - 2100 TPD
Total MSW processed - 1819.21 TPD
Gap in processing - 280.79 TPD
No Description Nos Installed Capacity (MT) Utilization Capacity
(TPD)
1 Windrow & Vermi
Composting
735 2630 1026
2 De-Centralised 42 118 118
3 Bio-Gas / Bio-
Methanation
20 167 167
4 RRC 527 592 503
Action plan to bridge gap between Installed Capacity and Current Utilization of processing facilities (if
Gap > 20%)
Incinerators are proposed to install for processing non-recyclable dry waste in cluster basis
No. and capacity of C&D waste processing plants in TPD (existing, proposed and under construction)
Total no. of wards, no. of wards having door to door collection service, no. of wards practicing segregation
at source
Total no. of wards - 8288
Door to Door collection – 7956
Source segregation - 7459
Details of MSW treatment facilities proposed and under construction (no., capacity, and technology)
So far 3 Incinerators has been completed remaining 7 Nos are under progress.
So far 2 Pyrolysis has been completed remaining 8 Nos are under progress.
For remaining Town Panchayats Incinerators & Pyrolysis are been proposed to install for
processing non-recyclable dry waste in cluster basis.
No. and area (in acres) of uncontrolled garbage dumpsites and Sanitary Landfills.
No. and area (in acres) of legacy waste within 1km buffer of both side of the rivers

5
No. of drains falling into rivers and no. of drains having floating racks/screens installed to prevent solid
waste from falling into the rivers
Status of ULB wise Management of Solid Waste
ULB Total
MSW
generation
in TPD
Total
MSW
being
processed
in TPD
Existing
MSW
Facilities
Plant Capacity of the
existing MSW facilities
Proposed MSW
Facilities &
Completion
Timeline
528
2100
1819
1.Windrow & Vermi
composting
2630 MT
Incinerators are
proposed to
install for
processing non-
recyclable dry
waste in cluster
basis
2.Decentralized
Composting 118 MT
3. Biogas 167 MT
4.Incinerator Under construction
will be completed
before March2021
5.Pyrolysis Under construction
will be completed
before March2021
VI. Bio-medical Waste Management:
Total Bio-medical generation:
No. of Hospitals and Health Care Facilities:
Status of Treatment Facility/ CBMWTF:
VII. Hazardous Waste Management:
Total Hazardous Waste generation:
No. of Industries generating Hazardous waste
Treatment Capacity of all TSDFs
Avg. Quantity of Hazardous waste reaching the TSDFs and Treated
Details of on-going or proposed TSDF
VIII. Plastic Waste Management
Total Plastic Waste generation: 120 TPD

6
Treatment/ Measures adopted for reduction or management of plastic waste:
Recyclable/ Saleable plastics are been sold to authorized vendors
Non- saleable plastics are been sent to cement factories and are used as a component for laying
roads
Incinerators are proposed to install for processing non-recyclable dry waste in cluster basis
IX. Details of Alternate Treatment Technology being adopted by the State/UT
X. Identification of polluting sources including drains contributing to river pollution and action as per
NGT order on insitu treatment:
XI. Details of Nodal Officer appointed by Chief Secretary in the State/UT:
XII. Details of meetings carried under the Chairmanship Chief of Secretary in the State/UT:
XIII. Latest water quality of polluted river, its tributaries, drains with flow details and ground water quality
in the catchment of polluted river;
XIV. Ground water regulation:
XV. Good irrigation practices being adopted by the State:
XVI. Rain Water Harvesting:
XVII. Demarcation of Floodplain and removal of illegal encroachments:
XVIII. Maintaining minimum e-flow of river:
XIX. Plantation activities along the rivers:
XX. Development of biodiversity park:
XXI. Reuse of Treated Water:
XXII. Model River being adopted by the State & Action Proposed for achieving the bathing quality
standards:
XXIII. Status of Preparation of Action Plan by the 13 Coastal States:
XXIV. Regulation of Mining Activities in the State/UT:
XXV. Action against identified polluters, law violators and officers responsible for failure for vigorous
monitoring


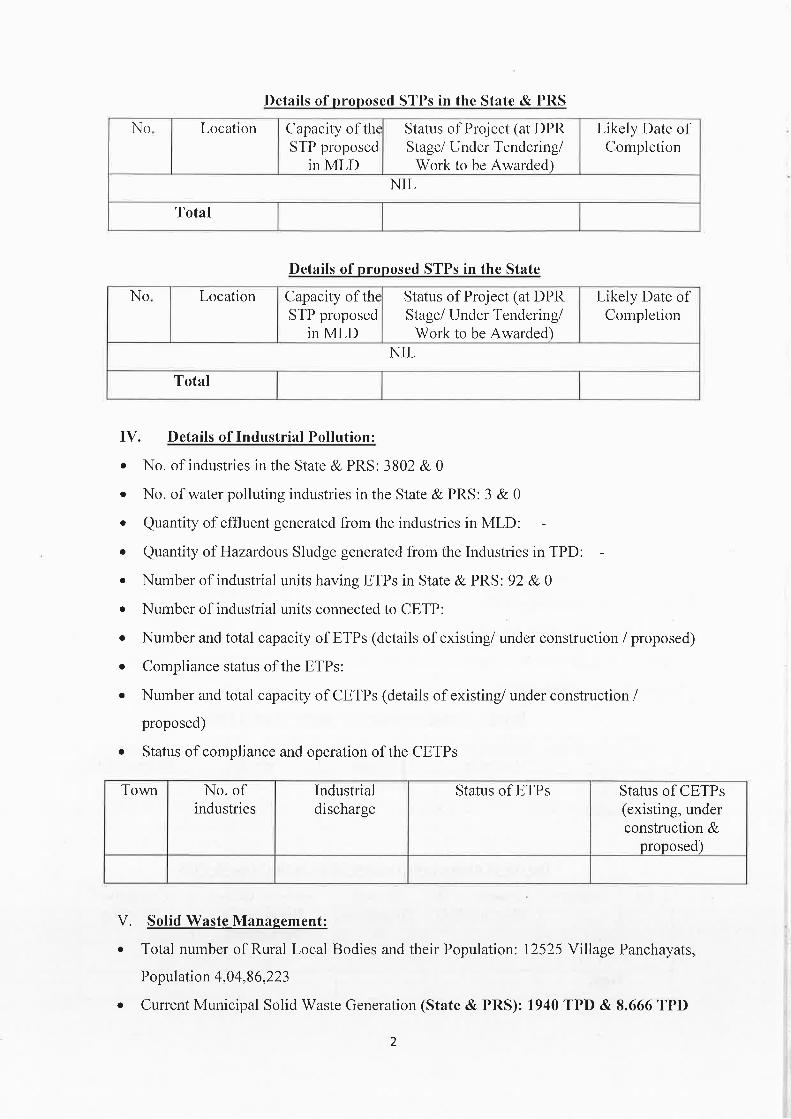


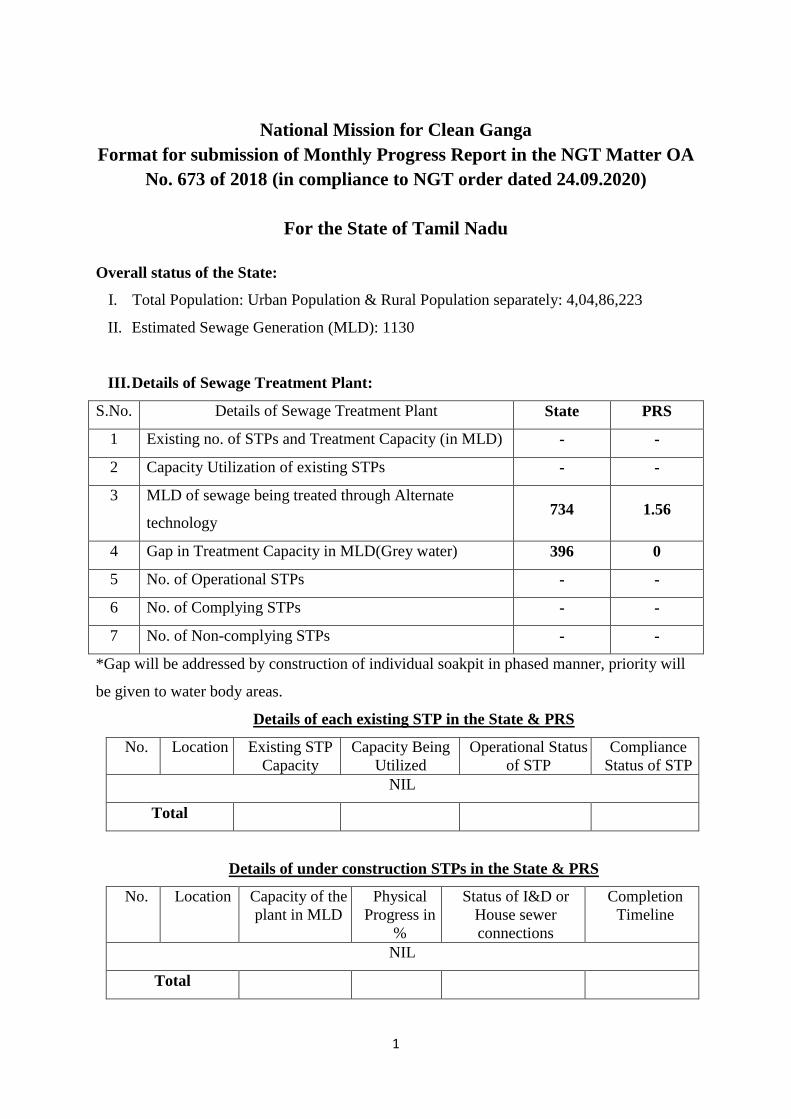
1
National Mission for Clean Ganga
Format for submission of Monthly Progress Report in the NGT Matter OA
No. 673 of 2018 (in compliance to NGT order dated 24.09.2020)
For the State of Tamil Nadu
Overall status of the State:
I. Total Population: Urban Population & Rural Population separately: 4,04,86,223
II. Estimated Sewage Generation (MLD): 1130
III. Details of Sewage Treatment Plant:
S.No. Details of Sewage Treatment Plant State PRS
1 Existing no. of STPs and Treatment Capacity (in MLD) - -
2 Capacity Utilization of existing STPs - -
3 MLD of sewage being treated through Alternate
technology 734 1.56
4 Gap in Treatment Capacity in MLD(Grey water) 396 0
5 No. of Operational STPs - -
6 No. of Complying STPs - -
7 No. of Non-complying STPs - -
*Gap will be addressed by construction of individual soakpit in phased manner, priority will
be given to water body areas.
Details of each existing STP in the State & PRS
No. Location Existing STP
Capacity
Capacity Being
Utilized
Operational Status
of STP
Compliance
Status of STP
NIL
Total
Details of under construction STPs in the State & PRS
No. Location Capacity of the
plant in MLD
Physical
Progress in
%
Status of I&D or
House sewer
connections
Completion
Timeline
NIL
Total

2
Details of proposed STPs in the State & PRS
No. Location Capacity of the
STP proposed
in MLD
Status of Project (at DPR
Stage/ Under Tendering/
Work to be Awarded)
Likely Date of
Completion
NIL
Total
Details of proposed STPs in the State
No. Location Capacity of the
STP proposed
in MLD
Status of Project (at DPR
Stage/ Under Tendering/
Work to be Awarded)
Likely Date of
Completion
NIL
Total
IV. Details of Industrial Pollution:
No. of industries in the State & PRS: 3802 & 0
No. of water polluting industries in the State & PRS: 3 & 0
Quantity of effluent generated from the industries in MLD: -
Quantity of Hazardous Sludge generated from the Industries in TPD: -
Number of industrial units having ETPs in State & PRS: 92 & 0
Number of industrial units connected to CETP:
Number and total capacity of ETPs (details of existing/ under construction / proposed)
Compliance status of the ETPs:
Number and total capacity of CETPs (details of existing/ under construction /
proposed)
Status of compliance and operation of the CETPs
Town No. of
industries
Industrial
discharge
Status of ETPs Status of CETPs
(existing, under
construction &
proposed)
V. Solid Waste Management:
Total number of Rural Local Bodies and their Population: 12525 Village Panchayats,
Population 4,04,86,223
Current Municipal Solid Waste Generation (State & PRS): 1940 TPD & 8.666 TPD

3
Number, installed capacity and utilization of existing MSW processing facilities in
TPD (bifurcated by type of processing eg- Waste to Energy (Tonnage and Power
Output), Compost Plants (Windrow, Vermi, decentralized pit composting),
biomethanation, MRF etc (State & PRS) : 12525 & 31
Action plan to bridge gap between Installed Capacity and Current Utilization of
processing facilities (if Gap > 20%) (State & PRS)
No. and capacity of C&D waste processing plants in TPD (existing, proposed and
under construction) (State & PRS)
Total no. of wards, no. of wards having door to door collection service, no. of wards
practicing segregation at source (State & PRS) : 12525 Village Panchayats & 31
Village Panchayats.
Details of MSW treatment facilities proposed and under construction (no., capacity,
and technology) (State & PRS) MCC – 321&1
No. and area (in acres) of uncontrolled garbage dumpsites and Sanitary Landfills- nil
No. and area (in acres) of legacy waste within 1km buffer of both side of the rivers-
nil
No. of drains falling into rivers and no. of drains having floating racks/screens
installed to prevent solid waste from falling into the rivers.
Status of ULB wise Management of Solid Waste
ULB Total MSW
generation in
TPD
Total MSW
being processed
in TPD
Existing
MSW
facilities
Utilization
Capacity of the
existing MSW
facilities
Proposed MSW
Facilities &
Completion
Timeline
Total
VI. Bio-medical Waste Management:
Total Bio-medical generation (State & PRS):
No. of Hospitals and Health Care Facilities: 1458
Status of Treatment Facility/ CBMWTF:
VII. Hazardous Waste Management:
Total Hazardous Waste generation (State & PRS):
No. of Industries generating Hazardous waste

4
Treatment Capacity of all TSDFs
Avg. Quantity of Hazardous waste reaching the TSDFs and Treated
Details of on-going or proposed TSDF
VIII. Plastic Waste Management:
Total Plastic Waste generation (State & PRS):
Treatment/ Measures adopted for reduction or management of plastic waste: Plastic
Shredding units available at 1 per Districts provided under SWM Scheme.
IX. Details of Alternate Treatment Technology being adopted by the State/UT
X. Identification of polluting sources including drains contributing to river pollution
and action as per NGT order on insitu treatment:
XI. Details of Nodal Officer appointed by Chief Secretary in the State/UT:
XII. Details of meetings carried under the Chairmanship Chief of Secretary in the
State/UT:
XIII. Latest water quality of polluted river, its tributaries, drains with flow details and
ground water quality in the catchment of polluted river;
XIV. Ground water regulation:
XV. Good irrigation practices being adopted by the State:
XVI. Rain Water Harvesting:
XVII. Demarcation of Floodplain and removal of illegal encroachments:
XVIII. Maintaining minimum e-flow of river:
XIX. Plantation activities along the rivers:
XX. Development of biodiversity park:
XXI. Reuse of Treated Water:
XXII. Model River being adopted by the State & Action Proposed for achieving the
bathing quality standards:
XXIII. Status of Preparation of Action Plan by the 13 Coastal States:
XXIV. Regulation of Mining Activities in the State/UT:
XXV. Action against identified polluters, law violators and officers responsible for
failure for vigorous monitoring


Format for Submission of Monthly Progress Report by States/ UTs
(Hon’ble NGT in the matter of OA No. 673/2018 dated 06.12.2019)
For the Month of October 2020 for TNPWD WRD
InVasista River (Thathayampatti to T.Konagapadi)
XIII. Latest water quality of polluted river, its tributaries, drains with flow
details and ground water quality in the catchment of polluted river;
The SG&SWRDC is having monitoring wells for observing water quality
data for the areas Papanaickenpatti, Yethapur, Athur and Thalaivasal. The
analytical reports of the ground water analysis of these areas reveals that
water quality is of the order of both good and moderate. The TDS values
of these areas ranging between 336 to 1029 mg/L.
The State Ground and Surface Water Resources Data centre is having
water quality data for lesser number of locations. Moreover this
department is mainly concerned with the analysis of inorganic parameters
and hence TDS is being used as a vital tool in determining the quality of
water as Good, Moderate or poor quality. But to identify pollution in an
area, the pollution parameters such as Dissolved Oxygen(DO),
Biochemical Oxygen Demand (BOD), Chemical Oxygen Demand (COD),
Total Coliform, Faecal Coliform has to be measured. With the water quality
data available in this Department, it can be inferred whether ground water
of a particular area is suitable for drinking or not.
Hence it is suggested that water samples may be collected along this
river stretch and analysis may be performed for pollution parameters to
identify the extent of pollution.
XIV. Ground water regulation:
1.
Control of illegal Groundwater Abstraction
For effective management of Ground Water, action is being initiated against illegally operating companies as Per Honorable Madras High Court order passed under WP No.16299 / 2018. Totally 683 packaged drinking water firms who were illegally operating have been sealed and closed.
A Comprehensive Groundwater (Management and Development) Act., to regulate and Manage the extraction of Groundwater is under active consideration of the Government..
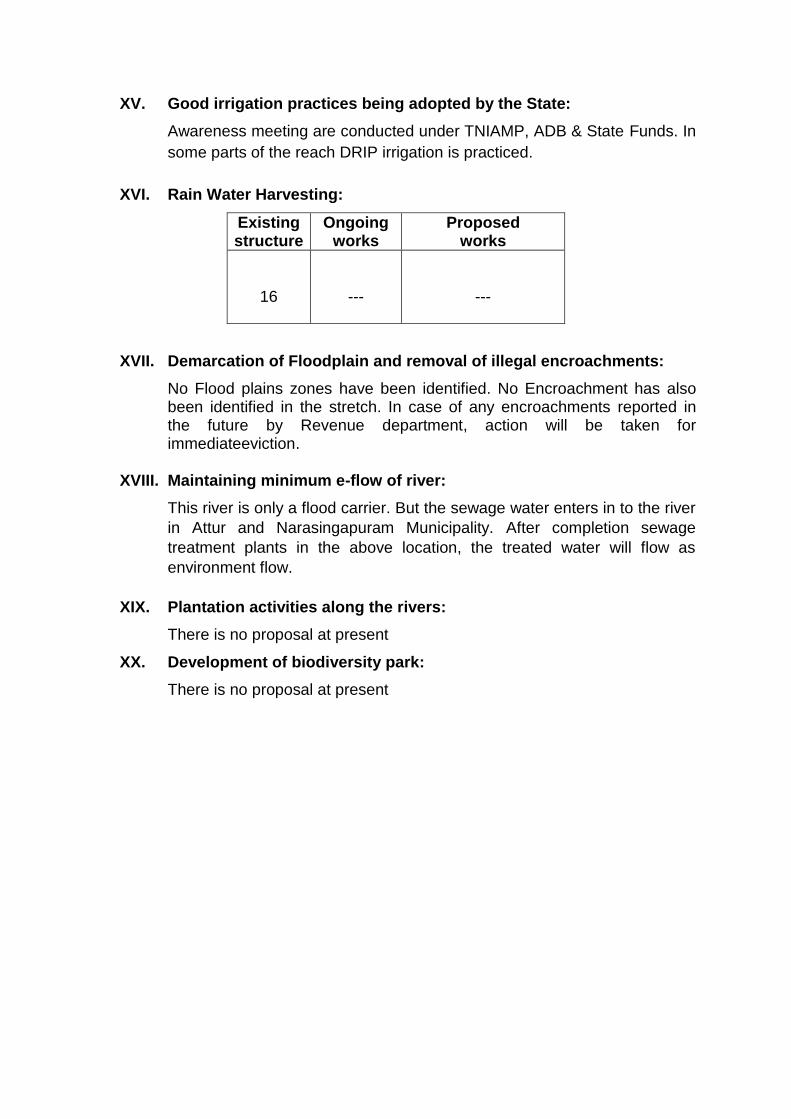
XV. Good irrigation practices being adopted by the State:
Awareness meeting are conducted under TNIAMP, ADB & State Funds. In
some parts of the reach DRIP irrigation is practiced.
XVI. Rain Water Harvesting:
Existing structure
Ongoing works
Proposed works
16
---
---
XVII. Demarcation of Floodplain and removal of illegal encroachments:
No Flood plains zones have been identified. No Encroachment has also been identified in the stretch. In case of any encroachments reported in the future by Revenue department, action will be taken for immediateeviction.
XVIII. Maintaining minimum e-flow of river:
This river is only a flood carrier. But the sewage water enters in to the river
in Attur and Narasingapuram Municipality. After completion sewage
treatment plants in the above location, the treated water will flow as
environment flow.
XIX. Plantation activities along the rivers:
There is no proposal at present
XX. Development of biodiversity park:
There is no proposal at present

Format for Submission of Monthly Progress Report by States/ UTs
(Hon’ble NGT in the matter of OA No. 673/2018 dated 06.12.2019)
For the Month of October 2020 for TNPWD WRD
InSarabanga River (Thathayampatti to T.Konagapadi)
XIII. Latest water quality of polluted river, its tributaries, drains with flow
details and ground water quality in the catchment of polluted river;
The State Ground and Surface Water Resources Data Centre is having
monitoring wells for observation of ground water quality inDanishpet,
Omalur, Idaipadi, Thevur and Tharamangalamareas.While considering the
Total dissolved solids of this stretch it is found to vary between 399mg/L to
1885 mg/L. Danishpet is having TDS of good quality whereas the rest of
the places having TDS value in the range of moderate quality.
The State Ground and Surface Water Resources Data centre is having
water quality data for the lesser number of locations. Moreover this
department is mainly concerned with the analysis of inorganic parameters
and hence TDS is being used as a vital tool in determining the quality of
water as Good, Moderate or poor quality. But to identify pollution in an
area, the pollution parameters such as Dissolved Oxygen(DO),
Biochemical Oxygen Demand (BOD), Chemical Oxygen Demand (COD),
Total Coliform, Faecal Coliform have to be measured. With the water
quality data available in this Department, it can be inferred whether ground
water of a particular area is suitable for drinking or not.
Hence it is suggested that surfacewater samples may be collected
along this river stretch and analysis may be performed for pollution
parameters to identify the extent of pollution.
XIV. Ground water regulation:
1.
Control of illegal Groundwater Abstraction
For effective management of Ground Water, action is being initiated against illegally operating companies as Per Honorable Madras High Court order passed under WP No.16299 / 2018. Totally 683 packaged drinking water firms who were illegally operating have been sealed and closed.
A Comprehensive Groundwater (Management and Development) Act., to regulate and Manage the extraction of Groundwater is under active consideration of the Government.

XV. Good irrigation practices being adopted by the State:
Awareness meeting are conducted under TNIAMP, ADB & State Funds. In
some parts of the reach DRIP irrigation is practiced.
XVI. Rain Water Harvesting:
Existing structure
Ongoing works
Proposed works
5
2
10 Recharge wells
XVII. Demarcation of Floodplain and removal of illegal encroachments:
Drone Surveyto be conducted by WAPCOS during December 2020. A DPR is under preparationunder NadanthaiVaazhi Cauvery for conducting the above survey for identification of flood plain zonesand area for Afforastation to maintain Bio Diversity. The tentative cost of the DPR is around 2 crores. The DPR will be completed in December 2020.Encroachmentif any identified during the survey will be evicted and other management works will be completed by March 2022 after rehabilitation and resettlement.
XVIII. Maintaining minimum e-flow of river:
This river is only a flood carrier. The sewage water enters in to the river in Edapaddi Municipality, Omalur Town Panchayat and Poolampatti Town Panchayat. The above treatment plants are proposed under NadanthaiVaazhi Cauvery. DPR preparation is likely to the completed by December 2020. E flow will be maintained in this river after completion sewage treatment plants by March 2021, as the treated water will flow as environmental flow.
XIX. Plantation activities along the rivers:
It is proposed to plant around 32,400 samplings under NadanthaiVaazhi
Cauvery for which DPR is under preparation. DPR preparation is likely to
the completed by December2020. Plantation work will be completed in
March 2021.
XX. Development of biodiversity park:
This is proposed to be taken up under NadanthaiVaazhi Cauvery for which
DPR is under preparation. Drone Survey is proposed to be conducted by
WAPCOS during December 2020. DPR preparation is likely to the
completed by December 2020. This work will be completed in March 2022.

Format for Submission of Monthly Progress Report by States/ UTs
(Hon’ble NGT in the matter of OA No. 673/2018 dated 06.12.2019)
For the Month of October 2020 for TNPWD WRD
Reach: Sirumugai to Kalingarayan stretch in Bhavani River
XIII. Latest water quality of polluted river, its tributaries, drains with flow
details and ground water quality in the catchment of polluted river;
The general distribution of ground water quality varies between Good to
moderate level. Especially Nilgiris is having good quality water.
The State Ground and Surface Water Resources Data centre is having
water quality data for number of locations. Moreover this department is
mainly concerned with the analysis of inorganic parameters and hence
TDS is being used as a vital tool in determining the quality of water as
Good, Moderate or poor quality. But to identify pollution in an area, the
pollution parameters such as Dissolved Oxygen (DO), Biochemical
Oxygen Demand (BOD), Chemical Oxygen Demand(COD), Total Coliform,
Faecal Coliform has to be measured. With the water quality data available
in this Department, it can be inferred whether ground water of a particular
area is suitable for drinking or not.
Hence it is suggested that water samples may be collected along this
river stretch and analysis may be performed for pollution parameters to
identify the extent of pollution.
XIV. Ground water regulation:
1. Control of illegal Groundwater Abstraction
For effective management of Ground Water, action is being initiated against illegally operating companies as Per Honorable Madras High Court order passed under WP No.16299 / 2018. Totally 683 packaged drinking water firms who were illegally operating have been sealed and closed.
A Comprehensive Groundwater (Management and Development) Act., to regulate and Manage the extraction of Groundwater is under active consideration of the Government.NIL
XV. Good irrigation practices being adopted by the State:
Awareness meeting are conducted under TNIAMP, ADB & State Funds. In
some parts of the reach, DRIP irrigation is practiced.

XVI. Rain Water Harvesting:
Existing structure
Ongoing works
Proposed works
13
3
17
XVII. Demarcation of Floodplain and removal of illegal encroachments:
Drone Survey to be conducted by WAPCOS during December 2020. A
DPR is under preparationunder NadanthaiVaazhi Cauvery for conducting
the above survey for identification of flood plain zonesand area for
Afforastation to maintain Bio Diversity. The tentative cost of the DPR is
around 2 crores. The DPR will be completed in December 2020.
55 nos of encroachments are to be removed which belong to fishing
community. Recommendations for alternate land has been sent to
Secretary to Government Revenue department by Commissioner for
Revenue administration vide letter no F.2/41632/2005/Dt.15.2.2006.
XVIII. Maintaining minimum e-flow of river:
An E flow of 92718 cusecs (including Irrigation purpose) was maintained
in the river Bhavani during the Month of December 2020.
XIX. Plantation activities along the rivers:
It is proposed to plant around 86,500 samplings under NadanthaiVaazhi
Cauvery for which DPR is under preparation. DPR preparation is likely to
the completed by December 2020. Plantation work will be completed in
March 2021.
XX. Development of biodiversity park:
This is proposed to be taken up under NadanthaiVaazhi Cauvery for which
DPR is under preparation. Drone Survey is proposed to be conducted by
WAPCOS during December 2020. DPR preparation is likely to the
completed by December 2020. This work will be completed in March 2022.

Format for Submission of Monthly Progress Report by States/ UTs
(Hon’ble NGT in the matter of OA No. 673/2018 dated 06.12.2019)
for the Month of October 2020 for TNPWD WRD
Reach: Mettur to Mayiladuthuraistretch in Cauvery River
XIII. Latest water quality of polluted river, its tributaries, drains with flow
details and ground water quality in the catchment of polluted river;
This river stretch comprises districts of Dharmapuri, Erode, Salem, Namakkal,
Karur, Trichy, Cuddalore and Thanjavur. The State Ground water Department is
having ground water quality data for the areasof Dharmapuri, Mettur, Bhavani,
Salem, Paramathivelur, Namakkal, Kumarapalayam, Karur, Erode, Musiri, Trichy,
Kulithalai, Thanjavur, Kumbakonam and Mayiladuthurai. While considering the
TDS value of Dharmapuritaluk it is found to vary between 523 to 2096 mg/L and
the quality of ground water lies between Moderate to poor. In case of
Bhavaniriver the TDS values ranging between Good to moderate. While
reviewing WQ data of Salem, the TDS values found to vary between 412 to
2845mg/L, the available ground water in Salem is having good, moderate and
poor quality with major proportion moderate ground water. The water quality data
of Namkkal shows the TDS values exceed even 6000mg/L in some places with
wide distribution of moderate water quality. While reviewing the water quality data
of Trichy and Musiri the water quality is found to vary between good and
moderate in most of the places with very few places having poor quality. Most of
the locations in Cuddalore and Thanjavur are having good quality water. Few
places of Cuddalore having TDS of the order of 5000 to 6000mg/L.
The State Ground and Surface Water Resources Data centre is having water
quality data for lesser number of locations. Moreover this department is mainly
concerned with the analysis of inorganic parameters and hence TDS is being
used as a vital tool in determining the quality of water as Good, Moderate or poor
quality. But to identify pollution in an area, the pollution parameters such as
Dissolved Oxygen(DO), Biochemical Oxygen Demand (BOD), Chemical Oxygen
Demand (COD), Total Coliform, Faecal Coliform has to be measured. With the
water quality data available in this Department, it can be inferred whether ground
water of a particular area is suitable for drinking or not.
Hence it is suggested that water samples may be collected along this river stretch
and analysis may be performed for pollution parameters to identify the extent of
pollution.

XIV. Ground water regulation:
1.
Control of illegal Groundwater Abstraction
For effective management of Ground Water, action is being initiated against illegally operating companies as Per Honorable Madras High Court order passed under WP No.16299 / 2018. Totally 683 packaged drinking water firms who were illegally operating have been sealed and closed.
A Comprehensive Groundwater (Management and Development) Act., to regulate and Manage the extraction of Groundwater is under active consideration of the Government.
XV. Good irrigation practices being adopted by the State:
Awareness meeting are conducted under TNIAMP, ADB & State Funds. In
some parts of the reach DRIP irrigation is practiced.
XVI. Rain Water Harvesting:
Existing structure
Ongoing works
Proposed works
44
10
29
XVII. Demarcation of Floodplain and removal of illegal encroachments:
Drone Survey is proposed to be conducted by WAPCOS during December 2020. A DPR is under preparationunder NadanthaiVaazhi Cauvery for conducting the above survey for identification of flood plain zonesand area for afforestation to maintain Bio Diversity. The tentative cost of the DPR is around 20 crores. The DPR will be completed in December 2020. Encroachment if any identified during the survey will be evicted and other management works will be completed by March 2022 after rehabilitation and resettlement.
XVIII. Maintaining minimum e-flow of river:
Mettur dam is opened for irrigation from June 12th to January 28th based on availability of water every year. It is opened for drinking purpose in the remaining days, During the monsoon period at flood time the maximum flood discharge in the river has been 284606 cusecs 0n 08.07.1961. Usually a monthly minimum average E flow of 0.10 TMC is maintained.

The E flow is maintained for more than 8 months. During the month of October an E Flow of 1059 mcm was maintained.
XIX. Plantation activities along the rivers:
It is proposed to plant around 1,44,500 samplings under NadanthaiVaazhi
Cauvery for which DPR is under preparation. DPR preparation is likely to
the completed by December 2020. Plantation work will be completed in
March 2021.
XX. Development of biodiversity park:
This is proposed to be taken up under NadanthaiVaazhi Cauvery for which
DPR is under preparation. Drone Survey is proposed to be conducted by
WAPCOS during December 2020. DPR preparation is likely to the
completed by December 2020. This work will be completed in March 2022
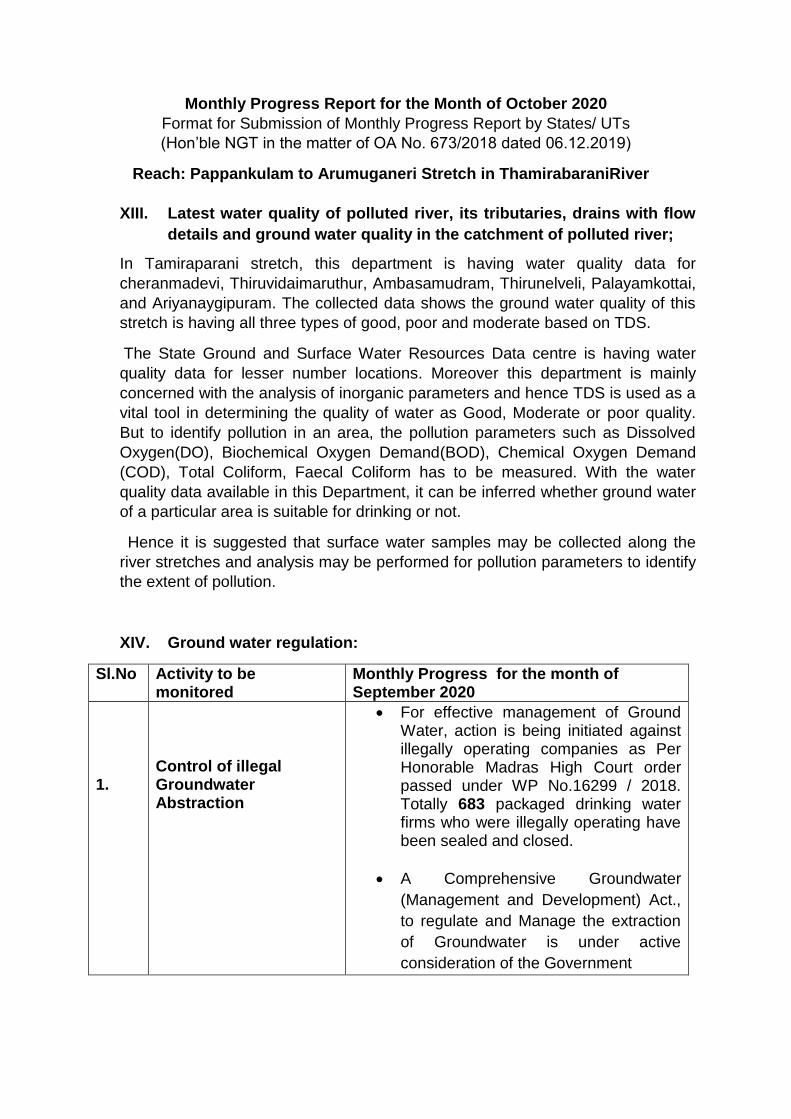
Monthly Progress Report for the Month of October 2020
Format for Submission of Monthly Progress Report by States/ UTs
(Hon’ble NGT in the matter of OA No. 673/2018 dated 06.12.2019)
Reach: Pappankulam to Arumuganeri Stretch in ThamirabaraniRiver
XIII. Latest water quality of polluted river, its tributaries, drains with flow
details and ground water quality in the catchment of polluted river;
In Tamiraparani stretch, this department is having water quality data for
cheranmadevi, Thiruvidaimaruthur, Ambasamudram, Thirunelveli, Palayamkottai,
and Ariyanaygipuram. The collected data shows the ground water quality of this
stretch is having all three types of good, poor and moderate based on TDS.
The State Ground and Surface Water Resources Data centre is having water
quality data for lesser number locations. Moreover this department is mainly
concerned with the analysis of inorganic parameters and hence TDS is used as a
vital tool in determining the quality of water as Good, Moderate or poor quality.
But to identify pollution in an area, the pollution parameters such as Dissolved
Oxygen(DO), Biochemical Oxygen Demand(BOD), Chemical Oxygen Demand
(COD), Total Coliform, Faecal Coliform has to be measured. With the water
quality data available in this Department, it can be inferred whether ground water
of a particular area is suitable for drinking or not.
Hence it is suggested that surface water samples may be collected along the
river stretches and analysis may be performed for pollution parameters to identify
the extent of pollution.
XIV. Ground water regulation:
Sl.No Activity to be monitored
Monthly Progress for the month of September 2020
1.
Control of illegal Groundwater Abstraction
For effective management of Ground Water, action is being initiated against illegally operating companies as Per Honorable Madras High Court order passed under WP No.16299 / 2018. Totally 683 packaged drinking water firms who were illegally operating have been sealed and closed.
A Comprehensive Groundwater
(Management and Development) Act.,
to regulate and Manage the extraction
of Groundwater is under active
consideration of the Government

XV. Good irrigation practices being adopted by the State:
Village level awareness campaign were conducted periodically by PWD
officials to adopt the crop rotation to have a good irrigation practices.
Rehabilitation and modernization of Tanks, Anicuts and Supply channels
are being carried out in TNIAMP project vide GO Ms No: 140 PW(WR 1)
DeptDt: 21.06.2017 for an amount of Rs.107.09 crores.
XVI. Rain Water Harvesting:
Existing structure
Ongoing works
Proposed works
7
2
230 (Barrages 3 nos at cost of Rs. 230 Crores. Check dam 2 nos at cost of Rs. 76 Crores, Artificial Recharge well 221 nos and Recharge shaft 4 nos at a cost of Rs. 88.496 Crores.)
XVII. Demarcation of Floodplain and removal of illegal encroachments:
To prepare comprehensive flood protection plan for Thamirabarani River
Rs. 4.00 Lakhs has been alloted vide GO Ms. No. 37 Revenue (DMII)
Department 9.02.2017. Estimate has been prepared for Rs. 4.00 Lakhs for
the demarcation of Flood plain zone and steps are being taken for the
Protection and management of Flood plain Zones of Thamirabarani River.
Moreover in Tirunelveli Corporation, ProsopisJuliflora on the river
stretches for a length of 10km from Vilagam to Naranammalpuram river
bridge were removed at a cost of 140.00 lakhs vide GO(2D) No. 14 PW
(P2) Dept Dated 8.03.2019 to restore the River course for a free flow flood
water.
XVIII. Maintaining minimum e-flow of river:
Environmental flow (outflow) of papanasam Reservoir in 718 for the month
of October 2020.
XIX. Plantation activities along the rivers:
At present there is no proposal on plantation on the River Banks and
investigation works are being taken to implement it by Forest Department.
XX. Development of biodiversity park:
At present there is no proposal on biodiversity parks on the encroached
River stretches and investigation works are being taken to implement it.

Format for Submission of Monthly Progress Report by States/ UTs
(Hon’ble NGT in the matter of OA No. 673/2018 dated 06.12.2019)
for the Month of October 2020 for TNPWD WRD
Reach: Salem to Papparapattiin Thirumanimutharu River
XIII. Latest water quality of polluted river, its tributaries, drains with flow
details and ground water quality in the catchment of polluted river;
For this stretch the SG& SWRDC having monitoring wells for observation
ground water quality inSalem, Attayampatti, and palapattiareas.
From the observed data it is inferred that the quality of water is in
moderate level i.e in these places TDS value ranges between 500 to
2000mg/L
The State Ground and Surface Water Resources Data centre is having
water quality data for lesser number of locations. Moreover this
department is mainly concerned with the analysis of inorganic parameters
and hence TDS is being used as a vital tool in determining the quality of
water as Good, Moderate or poor quality. But to identify pollution in an
area, the pollution parameters such as Dissolved Oxygen(DO),
Biochemical Oxygen Demand(BOD), Chemical Oxygen Demand(COD),
Total Coliform, Faecal Coliform has to be measured. With the water quality
data available in this Department, it can be whether ground water of a
particular area is suitable for drinking or not.
Hence it is suggested that water samples may be collected along this
river stretch and analysis may be performed for pollution parameters to
identify the extent of pollution.
XIV. Ground water regulation:
1.
Control of illegal
Groundwater
Abstraction
For effective management of Ground Water, action is being initiated against illegally operating companies as Per Honorable Madras High Court order passed under WP No.16299 / 2018. Totally 683 packaged drinking water firms who were illegally operating have been sealed and closed.
A Comprehensive Groundwater
(Management and Development) Act.,
to regulate and Manage the extraction
of Groundwater is under active
consideration of the Government.

XV. Good irrigation practices being adopted by the State:
Awareness meeting are conducted under TNIAMP, ADB & State Funds. In
some parts of the reach DRIP irrigation is practiced.
XVI. Rain Water Harvesting:
Existing structure
Ongoing works
Proposed works
6
----
14 (Recharge well structures)
XVII. Demarcation of Floodplain and removal of illegal encroachments:
Drone Survey to be conducted by WAPCOS during December 2020. A DPR is under preparationunder NadanthaiVaazhi Cauvery for conducting the above survey for identification of flood plain zonesand area for Afforastation to maintain Bio Diversity. The tentative cost of the DPR is around 2 crores. The DPR will be completed in December 2020. Encroachment if any identified during the survey will be evicted and other management works will be completed by March 2022 after rehabilitation and resettlement.
XVIII. Maintaining minimum e-flow of river:
This river is only a flood carrier. The sewage water enters in to the river in Salem Corporation. Treatment plants have been proposed under NadanthaiVaazhi Cauvery. DPR preparation is likely to the completed by December 2020. E flow will be maintained in this river after completion sewage treatment plants by March 2021,as the treated water will flow as environmental flow.
XIX. Plantation activities along the rivers:
It is proposed to plant around 42,000 samplings under NadanthaiVaazhi
Cauvery for which DPR is under preparation. DPR preparation is likely to
the completed by December2020. Plantation work will be completed in
March 2021.
XX. Development of biodiversity park:
This is proposed to be taken up under NadanthaiVaazhi Cauvery for which
DPR is under preparation. Drone Survey is proposed to be conducted by
WAPCOS during December 2020. DPR preparation is likely to the
completed by December 2020. This work will be completed in March 2022.

ANNEXURE
BIOMEDICAL WASTE MANAGEMENT
S.No. Bio-Medical
Waste Management
State Polluted River Stretch
1 Total Bio-medical generation (TPD)
Authorised BMW generation qty:
70 T/day
Salem 1.968
Namakkal 0.717
Dharmapuri 0.433
Erode 0.753
Avg. Actual BMW Generation:
22 T/day
Karur 0.917
Trichy 0.850
Thanjavur 1.571
Nagapattinam 1.079
2 No. of Hospitals and Health Care Facilities
24833 Salem 1022
Namakkal 538
Dharmapuri 482
Erode 485
Karur 435
Trichy 996
Thanjavur 975
Nagapattinam 638
3 Status of Treatment Facility / CBMWTFs
In Tamil Nadu, there are 12 CBMWTFs, out of which 8 facilities are in operation, one facility is ready for operation and three facilities at Coimbatore, Ooty and Ramanathapuram have been issued with closure direction by TNPCB for non compliance of consent order conditions and Bio Medical Waste Management Rules, 2016. The biomedical wastes generated from the Health Care Facilities attached to these three facilities which are under closure are sent to other CBMWTFs for further treatment and disposal. On an average, 70 Tons/day of bio-medical wastes are handled by these facilities. In
1. One Facility M/s. Medicare Enviro Systems, Thanjavur is in operation which covers the following districts Thanjavur, Thiruvarur, Trichy, Nagapattinam, Pudukottai, Perambalur, Ariyalur & Sivagangai.
2. Another Facility in M/s. Ramky Energy And Environment Ltd, Salem is in operation which covers the following districts Salem, Namakkal, Erode, Dharmapuri, Krishnagiri & Karur.

addition, three common facilities are under establishment in Gummidipoondi, Hosur and Tiruppur Districts. Total installed capacity of 9 CBMWTFs in Tamil Nadu which is in operation is 106.49 TPD (Incinerator & Autoclave)
List of common bio-medical waste treatment facilities (CBMWTFs) in
Tamil Nadu
S.No. Name & Address of the
CBMWTFs Regions covered
1. M/s. G. J. Multiclave (India) Pvt Ltd, Thenmelpakkam, Chengalpattu Taluk, Chengalpattu District.
Part of Chennai & Kancheepuram Districts
2. M/s. Tamilnadu Waste Management Ltd., Maduranthakam Taluk, Chengalpattu District.
Chennai (North), Part of Kancheepuram, Tiruvallur, Cuddalore and Villupuram Districts
3. M/s. Medicare Enviro Systems, Sengipatti, Thanjavur Taluk, Thanjavur District.
Thanjavur, Thiruvarur, Trichy, Nagapattinam, Pudukottai, Perambalur, Ariyalur & Sivagangai Districts
4. M/s. Ken Bio Links Private Ltd., Kandipedu,Katpadi Taluk, Vellore District.
Vellore & Tiruvannamalai Districts
5. M/s. Society for Bio Medical Waste Management, Udhagamandalam, The Nilgiris District.
Nilgiris District
6. M/s. Neat and Clean Service Squad, Muthuvayal, Ramanathapuram District.
Ramanathapuram District
7. M/s. Ramky Energy and Environment Ltd, Thangayur, Salem District.
Salem, Namakkal, Erode, Dharmapuri, Krishnagiri & Karur Districts
8. M/s.Teknotherm Industries, Orattukuppai, Coimbatore District.
Coimbatore, Nilgris & Tiruppur Districts
9. M/s. Aseptic System Bio Medical Waste Management Co., Pappankulam,Tirunelveli District.
Tirunelveli, Thoothukudi & Kanyakumari Districts

10. M/s. Ramky Energy and Environment Ltd., Undurmikidakulam, Virudhunagar District.
Madurai, Virudhunagar, Dindigul, Theni & Ramanathapuram Districts
11. M/s. Kovai Bio Waste Management Pvt Ltd., Orattukuppai, Coimbatore District.
Coimbatore, Tiruppur & Nilgiris Districts
12. M/s. Pondicherry Solid Waste Management Company Private Limited, S.F.NO.275/2, T. Pudaiyur village, Virudhachalam Taluk, Cuddalore District
Ready for operation


D.O
m
g/L
BO
D a
t 27
0 C
mg
/L
Fe
cal colif
orm
MP
N/1
00 m
l
D.O
m
g/L
BO
D a
t 27
0 C
mg
/L
Fe
cal colif
orm
MP
N/1
00 m
l
D.O
m
g/L
BO
D a
t 27
0 C
mg
/L
Fe
cal colif
orm
MP
N/1
00 m
l
D.O
m
g/L
BO
D a
t 27
0 C
mg
/L
Fe
cal colif
orm
MP
N/1
00 m
l
D.O
m
g/L
BO
D a
t 27
0 C
mg
/L
Fe
cal colif
orm
MP
N/1
00 m
l
D.O
m
g/L
BO
D a
t 27
0 C
mg
/L
Fe
cal colif
orm
MP
N/1
00 m
l
D.O
m
g/L
BO
D a
t 27
0 C
mg
/L
Fe
cal colif
orm
MP
N/1
00 m
l
D.O
m
g/L
BO
D a
t 27
0 C
mg
/L
Fe
cal colif
orm
MP
N/1
00 m
l
D.O
m
g/L
BO
D a
t 27
0 C
mg
/L
Fe
cal colif
orm
MP
N/1
00 m
l
D.O
m
g/L
BO
D a
t 27
0 C
mg
/L
Fe
cal colif
orm
MP
N/1
00 m
l
1Edappadi
(River)3024
2Edappadi
(Borewell)3024 6.5 <2 11 6.2 <2 14 6.3 <2 4 6.1 <2 11 6.4 <2 4 6.0 <2 1.8 6.0 <2 1.8 6.6 <2 1.8 6.3 <2 1.8
Standard limit for BOD <3 mg/L
Standard limit for Fecal coliform <500 MPN/100ml
Standard limit for DO 5.0 mg/l
No Sampling
Sl.
No.
Jan-20
No FlowNo Flow No Flow No FlowNo Flow
Aug-20
No FlowNo Flow
TAMIL NADU POLLUTION CONTROL BOARD
76, Mount Salai, Guindy, Chennai - 600 032.
Water Quality Status of Polluted River Stretches
River Sarabanga - Polluted river stretches from Thathayampatti to T.Konagapadi - 15 KM - Priority-I
No Flow No FlowNo Flow
Mar-20 Oct-20Feb-20
Name of
station
Station
Code
No.
Jun-20May-20 Sep-20Apr-20 Jul-20

D.O
m
g/L
BO
D a
t 27
0 C
mg/L
Fecal colif
orm
MP
N/1
00
ml
D.O
m
g/L
BO
D a
t 27
0 C
mg/L
Fecal colif
orm
MP
N/1
00
ml
D.O
m
g/L
BO
D a
t 27
0 C
mg/L
Fecal colif
orm
MP
N/1
00
ml
D.O
m
g/L
BO
D a
t 27
0 C
mg/L
Fecal colif
orm
MP
N/1
00
ml
D.O
m
g/L
BO
D a
t 27
0 C
mg/L
Fecal colif
orm
MP
N/1
00
ml
D.O
m
g/L
BO
D a
t 27
0 C
mg/L
Fecal colif
orm
MP
N/1
00
ml
D.O
m
g/L
BO
D a
t 27
0 C
mg/L
Fecal colif
orm
MP
N/1
00
ml
D.O
m
g/L
BO
D a
t 27
0 C
mg/L
Fecal colif
orm
MP
N/1
00
ml
D.O
m
g/L
BO
D a
t 27
0 C
mg/L
Fecal colif
orm
MP
N/1
00
ml
D.O
m
g/L
BO
D a
t 27
0 C
mg/L
Fecal colif
orm
MP
N/1
00
ml
1 3022 2.1 8.5 11000 Nil 15 6100 3.9 6.1 1300 Nil 14 3500 5.8 3.6 9 5.1 3.2 1400 5.9 <2 310 0.8 12 310 1.1 9.6 320
2 3022 6.6 <2 11 6.2 <2 11 5.1 <2 17 6.7 <2 8 4.8 2.7 8 6.0 2.1 8 6.9 <2 3.7 6.0 2 1.8 5.2 5 <1.8 6.3 <2 <1.8
Standard limit for BOD <3 mg/L
Standard limit for Fecal coliform <500 MPN/100ml
Standard limit for DO 5.0 mg/l
Feb-20
Name of station
Uthamasolapuram
(River)
Oct-20
Uthamasolapuram
(Borewell)
No Flow
May-20 Jun-20 Jul-20 Sep-20Aug-20Apr-20
Station
Code
No.
Jan-20
TAMIL NADU POLLUTION CONTROL BOARD
76, Mount Salai, Guindy, Chennai - 600 032.
Water Quality Status of Polluted River Stretches
River Thirumanimutharu - Polluted river stretches from Salem to Papparapatti - 15 KM - Priority-I
Sl.
No.
Mar-20

D.O
m
g/L
BO
D a
t 2
70 C
mg
/L
Fe
ca
l co
lifo
rm M
PN
/10
0 m
l
D.O
m
g/L
BO
D a
t 2
70 C
mg
/L
Fe
ca
l co
lifo
rm M
PN
/10
0 m
l
D.O
m
g/L
BO
D a
t 2
70 C
mg
/L
Fe
ca
l co
lifo
rm M
PN
/10
0 m
l
D.O
m
g/L
BO
D a
t 2
70 C
mg
/L
Fe
ca
l co
lifo
rm M
PN
/10
0 m
l
D.O
m
g/L
BO
D a
t 2
70 C
mg
/L
Fe
ca
l co
lifo
rm M
PN
/10
0 m
l
D.O
m
g/L
BO
D a
t 2
70 C
mg
/L
Fe
ca
l co
lifo
rm M
PN
/10
0 m
l
D.O
m
g/L
BO
D a
t 2
70 C
mg
/L
Fe
ca
l co
lifo
rm M
PN
/10
0 m
l
D.O
m
g/L
BO
D a
t 2
70 C
mg
/L
Fe
ca
l co
lifo
rm M
PN
/10
0 m
l
D.O
m
g/L
BO
D a
t 2
70 C
mg
/L
Fe
ca
l co
lifo
rm M
PN
/10
0 m
l
D.O
m
g/L
BO
D a
t 2
70 C
mg
/L
Fe
ca
l co
lifo
rm M
PN
/10
0 m
l
1Thulukkanur
(River)3023 Nil 24 14000 Nil 15 17000 Nil 16 2100 Nil 20 33000 Nil 500* 17000 0.4 15 14000 Nil 30 11000 2.1 7.5 2200
2Thulukkanur
(Subsurface)3023 6.8 <2 2 6.4 <2 6 4.8 <2 11 6.6 <2 2 6.5 <2 4 6.0 2.1 8 4.4 2.6 4 5.6 <2 4 5.8 <2 3.6 6.5 <2 1.8
Standard limit for BOD <3 mg/L
Standard limit for Fecal coliform <500 MPN/100ml
Standard limit for DO 5.0 mg/l
Name of
station
* Sago effluent disposed in the river
No FlowNo Flow
Jul-20Feb-20 Jun-20
Station
Code
No.
Mar-20Jan-20 Aug-20
TAMIL NADU POLLUTION CONTROL BOARD
76, Mount Salai, Guindy, Chennai - 600 032.
Water Quality Status of Polluted River Stretches
River Vasista - Polluted river stretches from Manivilundhan to Thiyaganur - 10 KM - Priority-I
Apr-20 Sep-20
Sl.
No.
May-20 Oct-20

D.O
m
g/L
BO
D a
t 27
0 C
mg/L
Fecal colif
orm
MP
N/1
00 m
l
D.O
m
g/L
BO
D a
t 27
0 C
mg/L
Fecal colif
orm
MP
N/1
00 m
l
D.O
m
g/L
BO
D a
t 27
0 C
mg/L
Fecal colif
orm
MP
N/1
00 m
l
D.O
m
g/L
BO
D a
t 27
0 C
mg/L
Fecal colif
orm
MP
N/1
00 m
l
D.O
m
g/L
BO
D a
t 27
0 C
mg/L
Fecal colif
orm
MP
N/1
00 m
l
D.O
m
g/L
BO
D a
t 27
0 C
mg/L
Fecal colif
orm
MP
N/1
00 m
l
D.O
m
g/L
BO
D a
t 27
0 C
mg/L
Fecal colif
orm
MP
N/1
00 m
l
D.O
m
g/L
BO
D a
t 27
0 C
mg/L
Fecal colif
orm
MP
N/1
00 m
l
D.O
m
g/L
BO
D a
t 27
0 C
mg/L
Fecal colif
orm
MP
N/1
00 m
l
D.O
m
g/L
BO
D a
t 27
0 C
mg/L
Fecal colif
orm
MP
N/1
00 m
l
1 Mettur 50 6.6 <2 21 5.1 2.0 43 5.8 2.5 46 6.7 <2 21 6.0 <2 21 6.0 <2 43 4.8 <2 32 6.0 <2 31 6.8 <2 26 6.0 3.5 31
2 Pallipalayam 51 6.7 <2 58 1.6 12.0 170 6.1 2.2 170 6.6 <2 26 5.0 2.2 84 5.9 3.8 310 5.9 <2 260 5.9 <2 170 6.3 <2 84 6.9 <2 79
3 Musiri Borewell 32 7.2 2 NA 6.5 <2 31
4 Musiri Ferry Gate 31 6.0 <2 140 6.1 <2 63 6.4 <2 33 6.3 2.4 32
5 Komarapalayam 3012 6.7 <2 110 6.0 2.0 170 5.8 <2 210 6.9 <2 49 5.6 <2 210 4.6 6.9 250 6.5 2.2 170 5.4 <2 140 5.4 2.2 210 6.5 <2 170
6 Urachikottai 3013 6.5 <2 32 6.0 <2 70 5.8 <2 84 6.7 <2 32 6.0 <2 58 6.1 <2 58 6.9 <2 63 6.4 <2 46 6.4 <2 70 6.2 <2 31
7 Seerampalayam 3014 6.5 <2 94 5.4 3.0 210 6.1 <2 490 6.9 <2 31 5.7 <2 220 5.9 3.6 220 7.3 <2 120 5.8 <2 43 6.0 <2 32 6.7 <2 31
8 Pugalur 3045 6.1 <2 140 6.6 <2 170 6.1 <2 210 6.6 <2 58 6.2 <2 140 6.0 <2 110 6.9 <2 140 6.1 <2 110 7.0 <2 140 6.6 <2 170
9 Pettavaithalai 3016 6.1 <2 220 6 <2 140 7.2 2 NA 6.5 <2 110 6.4 <2 230 6.4 2.9 63
10 Kumbakonam 3017 6.0 <2 170 7.0 3 NA 5.2 <2 23 6.5 <2 26 6.8 <2 23
11 Mayiladuthurai 3018 6.1 2 84 5.1 3 63 6.0 <2 110 5.3 2.0 NA 5.2 2 NA 5.2 2 NA 6.0 <2 32 6.7 <2 27
12 R.N. Pudur 1322 6.6 <2 45 0.4 23.3 430 5.7 2.5 310 6.7 <2 38 6.1 <2 140 6.0 <2 94 7.0 <2 84 6.5 <2 32 6.4 <2 110 6.3 <2 43
13 Vairapalayam 1320 6.2 <2 31 6.5 <2 170 6.2 <2 220 6.8 <2 110 5.6 <2 210 6.0 <2 23 6.1 <2 26 6.5 <2 22 6.4 <2 17 6.4 <2 12
14 P. Velur 1323 6.6 <2 38 6.1 <2 220 5.6 <2 260 6.1 <2 170 6.0 <2 250 6.1 <2 230 6.3 <2 79 6.0 <2 70 6.3 2.0 33 6.7 <2 27
15 Mohanur 1324 6.3 <2 31 5.7 2.4 210 5.8 <2 580 6.0 <2 200 6.2 <2 260 6.0 <2 260 5.8 <2 84 6.0 <2 63 6.7 <2 38 6.8 <2 33
16 Thirumukkudalur 1451 6.0 <2 150 6.5 <2 210 6.0 <2 170 6.3 <2 46 6.1 <2 170 6.2 <2 130 7.0 <2 170 6.0 <2 120 6.9 <2 150 6.3 <2 170
17 Trichy Upstream 1202 6.0 <2 310 6.1 <2 310 7.4 4 NA 6.4 <2 130 6.5 <2 120 6.5 <2 63
18 Trichy Downstream 1325 5.5 <2 460 5.8 3.3 430 7.6 3 NA 5.6 <2 210 6.5 <2 14 6.7 <2 210
19 Grand Anaicut 1203 5.4 <2 110 6 <2 110 7.5 3 NA 5.5 <2 38 6.5 <2 26 6.3 2.3 31
Standard limit for BOD <3 mg/L
Standard limit for Fecal coliform <500 MPN/100ml
Standard limit for DO 5.0 mg/l
No Flow
Jul-20
No Flow
No Flow
No Flow
No Flow
No Flow
No Flow
No Flow
No Flow
No Flow
No Flow
TAMIL NADU POLLUTION CONTROL BOARD
76, Mount Salai, Guindy, Chennai - 600 032.
Water Quality Status of Polluted River Stretches
Sl.No. Name of station
Station
Code
No.
River Cauvery - Polluted river stretches from Mettur to Mayiladuthurai - 200 KM - Priority - I
Jan-20
No Flow
Aug-20
No Flow
No Flow
No Flow
Jun-20
No Flow
Feb-20 May-20 Oct-20
No Flow
No Flow
Sep-20
No Flow
No Flow
No Flow
No Flow
No Flow
No Flow
No Flow
Mar-20
No Flow
No Flow
No Flow
No Flow
No Flow
No Flow
No Flow
Apr-20
No Flow
No Flow
No Flow
No Flow
No Flow

D.O
m
g/L
BO
D a
t 2
70 C
mg
/L
Fe
ca
l co
lifo
rm M
PN
/10
0 m
l
D.O
m
g/L
BO
D a
t 2
70 C
mg
/L
Fe
ca
l co
lifo
rm M
PN
/10
0 m
l
D.O
m
g/L
BO
D a
t 2
70 C
mg
/L
Fe
ca
l co
lifo
rm M
PN
/10
0 m
l
D.O
m
g/L
BO
D a
t 2
70 C
mg
/L
Fe
ca
l co
lifo
rm M
PN
/10
0 m
l
D.O
m
g/L
BO
D a
t 2
70 C
mg
/L
Fe
ca
l co
lifo
rm M
PN
/10
0 m
l
D.O
m
g/L
BO
D a
t 2
70 C
mg
/L
Fe
ca
l co
lifo
rm M
PN
/10
0 m
l
D.O
m
g/L
BO
D a
t 2
70 C
mg
/L
Fe
ca
l co
lifo
rm M
PN
/10
0 m
l
D.O
m
g/L
BO
D a
t 2
70 C
mg
/L
Fe
ca
l co
lifo
rm M
PN
/10
0 m
l
D.O
m
g/L
BO
D a
t 2
70 C
mg
/L
Fe
ca
l co
lifo
rm M
PN
/10
0 m
l
D.O
m
g/L
BO
D a
t 2
70 C
mg
/L
Fe
ca
l co
lifo
rm M
PN
/10
0 m
l
1 Badrakaliamman koil 1201 6.7 <2 26 6.6 <2 26 6.3 2.1 31 7.2 <2 14 7.1 <2 NA 5.9 <2 26 6.0 <2 21 6.0 <2 13 6.8 <2 17 6.8 <2 17
2 Sirumugai 1204 6.8 <2 22 6.2 2 130 6.0 2.4 140 7.1 <2 9 7.4 <2 NA 6.3 <2 21 6.5 <2 14 6.5 <2 11 6.3 <2 170 6.2 <2 21
3 Bhavanisagar 1321 6.8 <2 26 6.6 <2 32 6.2 <2 31 6.8 <2 26 6.2 <2 31 6.3 <2 22 7 <2 17 6.4 <2 21 6.2 <2 26 6.1 <2 21
4 Bhavani 1205 6.5 <2 63 7.0 <2 110 6.3 <2 94 6.2 <2 49 6.3 <2 34 6.0 <2 110 6.7 <2 170 6.2 <2 70 6.8 <2 17 6.5 <2 93
5 Sathyamangalam 3019 6.6 <2 13 6.0 <2 63 5.7 <2 38 7.1 <2 26 6.3 <2 43 6.2 <2 26 6.7 <2 22 6.2 <2 21 6.6 <2 38 6.1 <2 14
6 Kalingarayan Canal (B5) 3020 6.5 <2 33 6.7 <2 61 6.0 <2 79 6.4 <2 31 6.1 <2 43 5.6 2.5 63 6.8 <2 46 6.4 <2 21 6.6 <2 22 6.2 <2 33
7 Kalingarayan Canal (B10) 3021 6.5 <2 49 6.6 <2 61 6.1 <2 70 6.3 <2 47 6.3 <2 49 5.7 <2 70 6.9 <2 63 6.3 <2 22 6.4 <2 46 6.3 <2 46
Standard limit for BOD <3 mg/L
Standard limit for Fecal coliform <500 MPN/100ml
Standard limit for DO 5.0 mg/l
TAMIL NADU POLLUTION CONTROL BOARD
Feb-20 Jun-20
76, Mount Salai, Guindy, Chennai - 600 032.
Water Quality Status of Polluted River Stretches
River Bhavani Polluted river stretches from Sirumugai to Kalingarayan - 60 KM - Priority-IV
Sl.
No.
Jul-20Mar-20
Name of station
Station
Code
No.
Jan-20 Oct-20May-20Apr-20 Aug-20 Sep-20

D.O
m
g/L
BO
D a
t 27
0 C
mg/L
Fe
ca
l co
lifo
rm
MP
N/1
00 m
l
D.O
m
g/L
BO
D a
t 27
0 C
mg/L
Fe
ca
l co
lifo
rm
MP
N/1
00 m
l
D.O
m
g/L
BO
D a
t 27
0 C
mg/L
Fe
ca
l co
lifo
rm
MP
N/1
00 m
l
D.O
m
g/L
BO
D a
t 27
0 C
mg/L
Fe
ca
l co
lifo
rm
MP
N/1
00 m
l
D.O
m
g/L
BO
D a
t 27
0 C
mg/L
Fe
ca
l co
lifo
rm
MP
N/1
00 m
l
D.O
m
g/L
BO
D a
t 27
0 C
mg/L
Fe
ca
l co
lifo
rm
MP
N/1
00 m
l
D.O
m
g/L
BO
D a
t 27
0 C
mg/L
Fe
ca
l co
lifo
rm
MP
N/1
00 m
l
D.O
m
g/L
BO
D a
t 27
0 C
mg/L
Fe
ca
l co
lifo
rm
MP
N/1
00 m
l
D.O
m
g/L
BO
D a
t 27
0 C
mg/L
Fe
ca
l co
lifo
rm
MP
N/1
00 m
l
D.O
m
g/L
BO
D a
t 27
0 C
mg/L
Fe
ca
l co
lifo
rm
MP
N/1
00 m
l
1 Papanasam 1159 7.0 2.2 2 7.2 2.0 8 7.2 <2 2 6.8 <2 2 6.1 <2 2 7.3 2 4 6.8 2.3 <1.8 7.6 <2 <1.8 7.5 <2 4 7.4 <2 <1.8
2 Cheranmadevi 1160 6.5 2.4 14 7.0 2.4 22 7.0 2.8 8 6.6 2.3 10 6.8 <2 9 7.0 2.2 21 6.5 2.5 21 7.0 2.2 4 6.1 2.5 13 7.1 2.4 4
3 Kokirakulam 1161 6.6 2.5 25 6.5 2.8 110 6.8 2.3 26 6.6 2.1 13 6.4 2 22 7.1 2.9 70 6.2 2.4 42 6.8 2.5 9 6.6 3 33 6.5 2.4 22
4 Murapanadu 1162 6.0 2.5 63 7.5 2.4 70 7.6 2.3 70 7.5 2.7 33 7.3 2.8 70 6.4 3.3 120 7.4 2.5 26 7.4 2.4 9 7.1 2.3 48 7.1 2.8 39
5 Thiruvidaimarudur 1328 6.2 2.2 9 7.2 2.4 17 7.1 2.2 7 6.8 <2 8 7.0 <2 8 7.2 <2 12 7.2 2.5 17 7.2 2 2 6.3 2.7 21 6.0 2.2 2
6 Ambasamudram 1329 7.0 2.3 4 7.0 2.2 17 7.3 2.5 4 7.0 <2 2 7.3 <2 4 7.2 <2 7 7.0 2.5 2 7.4 <2 <1.8 6.6 2.2 47 7.3 <2 <1.8
7 Authoor 1330 6.6 2.8 41 7.6 2.6 94 7.2 2.5 58 6.8 3 110 7.1 3.2 220 7.5 2.6 53 7.1 5.1 84 7.3 3.4 21 7.0 3.3 120 6.8 3.1 94
8 Eral 3025 6.5 2.9 110 6.0 2.8 120 5.3 2.3 70 6.5 2.7 110 6.7 3 140 6.2 2.8 58 5.8 4.5 34 6.7 3.2 17 7.2 3.2 58 6.0 2.4 60
9 Kallidaikurichi 3026 7.2 2.1 7 7.1 2.2 22 7.3 2.4 6 7.1 <2 6 6.9 <2 6 7.0 <2 8 7.1 2.6 6 7.4 2 2 6.9 2.9 8 7.5 2 <1.8
10 Srivaikuntam 3027 7.1 2.8 43 7.9 2.2 63 7.0 2.3 47 7.2 2.6 43 7.3 2.8 110 5.9 3 70 5.3 3.9 31 6.0 3 13 6.6 2.2 40 7.6 2.8 47
11 Vellakovil 3028 6.4 2.6 17 6.0 2.5 70 6.2 2.9 22 6.5 3 17 6.0 2.2 26 6.3 2.9 94 5.9 2.5 23 6.5 2.4 7 6.5 2.9 4 5.6 2.4 17
12 Seevalaperi 3029 6.4 2.5 33 6.8 2.7 79 5.8 2.7 31 6.4 3 23 6.2 2.6 26 6.4 3 120 6.1 2.5 31 6.5 2.6 9 6.5 2.5 7 6.0 2.5 25
Standard limit for BOD <3 mg/L
Standard limit for Fecal coliform <500 MPN/100ml
Standard limit for DO 5.0 mg/l
Name of station
Mar-20
Station
Code
No.
Jun-20 Oct-20Jul-20 Aug-20 Sep-20
TAMIL NADU POLLUTION CONTROL BOARD
76, Mount Salai, Guindy, Chennai - 600 032.
Water Quality Status of Polluted River Stretches
River Thamirabarani Polluted river stretches from Pappankulam to Arumuganeri - 80 KM - Priority-V
Sl.
No.
Apr-20 May-20Jan-20 Feb-20