formation and evolution mechanism of regional haze: a case study
TRANSCRIPT

Atmos. Chem. Phys., 13, 4501–4514, 2013www.atmos-chem-phys.net/13/4501/2013/doi:10.5194/acp-13-4501-2013© Author(s) 2013. CC Attribution 3.0 License.
EGU Journal Logos (RGB)
Advances in Geosciences
Open A
ccess
Natural Hazards and Earth System
Sciences
Open A
ccess
Annales Geophysicae
Open A
ccessNonlinear Processes
in Geophysics
Open A
ccess
Atmospheric Chemistry
and PhysicsO
pen Access
Atmospheric Chemistry
and Physics
Open A
ccess
Discussions
Atmospheric Measurement
Techniques
Open A
ccess
Atmospheric Measurement
Techniques
Open A
ccess
Discussions
Biogeosciences
Open A
ccess
Open A
ccess
BiogeosciencesDiscussions
Climate of the Past
Open A
ccess
Open A
ccess
Climate of the Past
Discussions
Earth System Dynamics
Open A
ccess
Open A
ccess
Earth System Dynamics
Discussions
GeoscientificInstrumentation
Methods andData Systems
Open A
ccess
GeoscientificInstrumentation
Methods andData Systems
Open A
ccess
Discussions
GeoscientificModel Development
Open A
ccess
Open A
ccess
GeoscientificModel Development
Discussions
Hydrology and Earth System
Sciences
Open A
ccess
Hydrology and Earth System
Sciences
Open A
ccess
Discussions
Ocean Science
Open A
ccess
Open A
ccess
Ocean ScienceDiscussions
Solid Earth
Open A
ccess
Open A
ccess
Solid EarthDiscussions
The Cryosphere
Open A
ccess
Open A
ccess
The CryosphereDiscussions
Natural Hazards and Earth System
Sciences
Open A
ccess
Discussions
Formation and evolution mechanism of regional haze:a case study in the megacity Beijing, China
X. G. Liu 1,2, J. Li3, Y. Qu4, T. Han1, L. Hou1, J. Gu2, C. Chen2, Y. Yang1, X. Liu 5, T. Yang4, Y. Zhang2, H. Tian1, andM. Hu 2
1State Key Laboratory of Water Environment Simulation, School of Environment, Beijing Normal University,Beijing, 100875, China2State Key Joint Laboratory of Environment Simulation and Pollution Control, College of Environmental Sciences andEngineering, Peking University, Beijing, 100871, China3College of Civil Aviation, Nanjing University of Aeronautics and Astronautics, Nanjing, 210016, China4State Key Laboratory of Atmospheric Boundary Layer Physics and Atmospheric Chemistry, Institute of AtmosphericPhysics, Chinese Academy of Sciences, Beijing, 100029, China5School of Physics, Peking University, Beijing, 100871, China
Correspondence to:X. G. Liu ([email protected]) and M. Hu ([email protected])
Received: 18 April 2012 – Published in Atmos. Chem. Phys. Discuss.: 3 July 2012Revised: 4 April 2013 – Accepted: 13 April 2013 – Published: 2 May 2013
Abstract. The main objective of this study is to investigatethe formation and evolution mechanism of the regional hazein megacity Beijing by analyzing the process of a severehaze that occurred 20–27 September 2011. Mass concen-tration and size distribution of aerosol particles as well asaerosol optical properties were concurrently measured at theBeijing urban atmospheric environment monitoring station.Gaseous pollutants (SO2, NO-NO2-NOx, O3, CO) and mete-orological parameters (wind speed, wind direction, and rel-ative humidity) were simultaneously monitored. Meanwhile,aerosol spatial distribution and the height of planetary bound-ary layer (PBL) were retrieved from the signal of satellite andLIDAR (light detection and ranging). Concentrations of NO,NO2, SO2, O3, and CO observed during 23–27 Septemberhad exceeded the national ambient air quality standards forresidents. The mass concentration of PM2.5 gradually accu-mulated during the measurement and reached at 220 µg m−3
on 26 September, and the corresponding atmospheric visi-bility was only 1.1 km. The daily averaged AOD in Beijingincreased from∼ 0.16 atλ = 500 nm on 22 September andreached∼ 3.5 on 26 September. The key factors that affectedthe formation and evolution of this haze episode were stableanti-cyclone synoptic conditions at the surface, decreasingof the height of PBL, heavy pollution emissions from urbanarea, number and size evolution of aerosols, and hygroscopic
growth for aerosol scattering. This case study may providevaluable information for the public to recognize the forma-tion mechanism of the regional haze event over the megacity,which is also useful for the government to adopt scientificapproach to forecast and eliminate the occurrence of regionalhaze in China.
1 Introduction
Airborne aerosols, such as sulfate, nitrate, ammonium, par-ticulate organic matter, black carbon, and other chemicalspecies, can scatter and absorb the incident light and there-fore lead to atmosphere opacity and horizontal visibility de-grade. When the horizontal visibility is equal to or less thanl0 km and atmospheric relative humidity (RH) is equal to orless than 90 %, this phenomenon is called atmospheric haze(Wu et al., 2006). Haze is pollution of fine particles in nature,fine particles are mainly from industrial emissions, vehicleexhaust pollutants, and secondary aerosols formed through aseries of photochemical reactions. Haze has adverse effectson human health (Yadav et al., 2003; Xiao et al., 2006; Bell etal., 2011). Haze, rich in toxic and hazardous substances, candirectly enter the human body through the respiratory systemand adhere to the upper and lower respiratory tract and lungs,
Published by Copernicus Publications on behalf of the European Geosciences Union.

4502 X. G. Liu et al.: Formation and evolution mechanism of regional haze: a case study in Beijing, China
which ultimately causes respiratory and cardiovascular dis-eases (Tie et al., 2009). In addition, haze that reduces visibil-ity and could directly affect the land, sea and air traffic safety(Wu et al., 2005; Mukherjee and Viswanathan, 2001). Hazehas also been found to have impact on natural and agricul-tural ecosystems. For example, haze, a higher concentrationof atmospheric particles absorbing and scattering the incidentsunlight, results in the decreasing intensity of solar radiationand sunshine hours, thus, leading to the reduction of agricul-tural production and disruption of ecosystems (Chameides etal., 1999).
Historically, the haze occurred in some areas of theUnited Kingdom and the United States due to their devel-oped economies (McNulty, 1968; Lee, 1983; Schichtel et al.,2001). Recently, haze frequently has occurred in the regionsof North Africa, Indian Ocean, and Asia (Quinn and Bates,2003; Huebert et al., 2003). Scientists throughout the worldhave carried out many experiments to understand the for-mation mechanism of haze and governments have taken ef-fective measures to reduce the occurrence of haze (Huebertet al., 2003; Wu et al., 2005; Malm and Day, 2001; Wanget al., 2006). The United States carried out observations ofatmospheric visibility and launched a large-scale visibilityobservation program IMPROVE (Interagency Monitoring ofProtected Visual Environment Program), which established avisibility monitoring network in 1988 (Malm and Day, 2001).Furthermore, the United States developed and adopted Re-gional Haze Rule in 1999 (http://www.epa.gov/) calling forstate and federal agencies to work together to improve visi-bility. Also in 1999, scientists found that the northern IndianOcean, South and Southeast Asia were shrouded by the at-mospheric brown haze during the INDOEX (Indian OceanExperiment) (Quinn et al., 2002).
In the past 30 yr, with the rapid economic and social de-velopment, many cities in China have suffered from air pol-lution and extreme haze because of heavy dispersion of airpollutants (Wu et al., 2006). When haze happens, the skyseems cloudy, blurry and poorly visibility to the people. Re-cent haze episodes are characterized by increasing frequen-cies, longer duration and expanding sphere (Wu et al., 2005;Zhang et al., 2008; Kang et al., 2013). Haze, as well as its ad-verse effect, is one of the most concerned problems in China,and it has become the major air quality issue at the moment.There are four major haze polluted areas in China: Jing-Jin-Tang Region, the Yangtze River delta, Sichuan Basin and thePearl River delta (PRD), among which, the PRD is the areacoupled with the most frequently occurring haze episodes.Taking Guangzhou, the central city in PRD as an example,the number of haze days was 70 in 2001; 83 days in 2002;93 days in 2003; 144 days in 2004 (Wu et al., 2006; Deng etal., 2008). An extreme haze event happened on 2 Novem-ber 2003 in Guangzhou with the instantaneous visibilityvalue less than 200 m, reported by Wu et al. (2005). Lowvisibilities due to aerosol pollution and high RH have beenalso observed in Xinken and Guangzhou during two PRD
campaigns (Cheng et al., 2006, 2008a,b; Liu et al., 2008).The number of hazy day in Beijing urban area was 17 daysin 1971, sharply grew to 223 days in 1982, and kept this level(∼ 200 days) until 1998 (Yang, 2008). Since 1998, Beijinghad vigorously implemented a number of measures focusingon management of coal, motor vehicles, industrial and dustpollution to improve air quality (Sun et al., 2004). As a result,the hazy days quickly decreased to 73 days in 2005. But, in2011, the haze in megacity Beijing had increased in intensity,and this extreme heavy haze could have significantly adverseeffects on human health.
Haze has been studied by scientists home and abroad dur-ing the past two decades (Chen et al., 2003; Du et al., 2011;Kang et al., 2013; Sun et al., 2006; Wu et al., 2005, 2006).Chen et al. (2003) studied the formation and evolution mech-anism of summertime haze in the mid-Atlantic region andsignified the role of stationary weather conditions, RH in thehaze formation and also clarified that secondary aerosol am-moniated sulfate ((NH4)2SO4 and NH4HSO4) was most re-sponsible for summertime haze at this locale. IMPROVE re-sults suggested that haze is often regional in nature (Malmand Day, 2001). However, the formation and evolution of ahaze is complicated, involving the formation, growth, trans-port, and dispersion of aerosols (Chen et al., 2003). Mostof haze has occurred in the developed region in China andresulted from excess particulate matter emitted by anthro-pogenic sources and gas to particle conversion (Sun et al.,2006; Wu et al., 2005; Wang et al., 2006; Du et al., 2011). Re-gional haze has happened frequently especially during coldwinter and spring seasons because of the enhanced heat-ing/traffic/industrial emissions with the stable synoptic con-ditions (Wang et al., 2006; Sun et al., 2006). Du et al. (2011)classified the haze happening in Shanghai in summertime asbiomass burning induced, complicated, and from secondarypollution according to its formation mechanism. But, dust-storms, which mostly happen in northern China in springseason, is a special haze due to the transported dust withhigh wind speed. However, available studies on the hazemostly focused on the chemical compositions of aerosols andscarcely on the formation and evolution mechanism of thehaze (Sun et al., 2006; Wu et al., 2005; Wang et al., 2006; Duet al., 2011; Cheng et al., 2006, 2008a,b; Liu et al., 2008).Therefore, studies on the formation and evolution mecha-nism of regional haze would be useful for air quality forecastand would provide scientific support for the government totake effective measures to reduce the incidence of regionalhaze.
2 Experiment
2.1 Experiment site
The measurements were carried out in Beijing, the capital ofthe People’s Republic of China, and the national center for
Atmos. Chem. Phys., 13, 4501–4514, 2013 www.atmos-chem-phys.net/13/4501/2013/
X. G. Liu et al.: Formation and evolution mechanism of regional haze: a case study in Beijing, China 4503
politics, culture, and international business. The city’s popu-lation is 36 million and its population density is 7837 peopleper km2 as of 2010, more than the densely populated GreaterLondon (5437 people per km2) and Tokyo (5984 peo-ple per km2) (http://cn.chinagate.cn/population/2011-07/18/content23015074.htm). Furthermore, the total energy con-sumption is 69.5 million tons of standard coal, and there aremore than 4.8 million cars in Beijing as of 2010 (http://www.bjstats.gov.cn/nj/main/2011-tjnj/index.htm). High degrees ofpopulation density and economic level had unavoidably re-sulted in heavy emission of air pollutants in Beijing.
Field measurements from 20–27 September were carriedout at the Peking University (PKU) urban atmospheric en-vironment monitoring station (39.98◦ N, 116.35◦ E), whichlies in the northwestern part of Beijing and is∼ 600 m to thenorth of the 4th ring road that acts as one of the main trafficlines of Beijing. The observation site is located on the roof ofa six-floor building (∼ 20 m a.g.l. – above ground level), allof the instruments were installed in an air-conditioned roomexcept the visibility sensor, which was installed outdoors.Possible air pollutants sources arriving at measurement sitewere local vehicular traffic, combustion of fuels for cooking,and some of the transported pollutants.
2.2 Measurements
The instruments involved in this study are listed in Table 1.Mass concentration of PM2.5 (particulate matter with aerody-namic diameter less than 2.5 µm) was monitored by TEOM(tapered element oscillating microbalance). Gaseous pollu-tants (SO2, NO-NO2-NOx, O3, CO) were detected by i-seriesautomatic monitoring system manufactured by Thermo Elec-tron Corporation (USA). Meteorological parameters includ-ing wind speed, temperature and RH were measured by theautomatic meteorological station. Particle size distributionwas measured by SMPS (Scanning Mobility Particle Siz-ers) and APS (Aerodynamic particle sizer) (Liu et al., 2008).The SMPS spectrometer is a system that measures the par-ticle number size distribution in the size range from 2.5 to1000 nm. Particles of different sizes were classified with dif-ferential mobility analyzer (DMA, Hauke-type), and theirconcentrations were measured with a condensation particlecounter (CPC, TSI Model 3010). The APS measured parti-cle size distributions with aerodynamic diameters from 0.5 to20 µm.
The nephelometer continuously measured the light scat-tering coefficient by dry particlesbsp (dry) at a wavelengthof 532 nm. A silicone tube drier maintained the RH of thepumped air less than 30 % during the field study. The neph-elometer was routinely calibrated by zero and span check.The nephelometer correction factor for truncation error hadbeen done by Liu et al. (2008). The MAAP (Petzold andSchonlinner, 2004) operated at the incident light wavelengthof 670 nm on the principle of light attenuation due to absorp-tion by aerosols deposited on the quartz fiber filter. Aerosol
absorption coefficientbap was then calculated by the productof mass concentration of BC by specific absorption coeffi-cient (6.6 m2 g−1), which was from the manufacture guide.Spectral aerosol optical depth (AOD) was measured by a 5-channel (380, 500, 675, 870, and 1020 nm) handheld sun-photometer (Microtops II, USA). The instrument is equippedwith five accurately aligned optical collimators. Each chan-nel is fitted with a narrow-band interference filter and a pho-todiode suitable for the particular wavelength range. Radia-tion captured by the collimator and filters onto the photodi-odes produces an electrical current that is proportional to theradiant power. AOD is determined by the Bouguer–Lambert–Beer law. Additionally, in order to investigate the sourcesof the regional haze from a large scale, spatial distributionof AOD with 10 km× 10 km resolution was retrieved fromthe remote sensing data of the Moderate Resolution Imag-ing Spectroradiometer (MODIS) on Terra and Aqua satellites(http://modis-atmos.gsfc.nasa.gov/).
Visibility sensor system consisted of a transmitter, a re-ceiver, and a controller. It measured the light extinctionof infrared light (λ = 875 nm) in air, and the measurementrange was from 10 m to 50 km. It should be noted that thewavelengths that the optical instruments used were differ-ent; therefore, all parameters were scaled to values at thewavelength of 550 nm by using a power-law wavelength de-pendence (i.e., with the help ofAngstrom exponents thatwere retrieved from the spectral distribution of AOD). Themeasured value of visibility (Vis) was directly transformedto atmospheric extinction coefficientbext (RH) at 550 nm inunit of inverse megameter (M m−1) by Eq. (1) (Koschmieder,1924; Seinfeld and Pandis, 2006):
bext(RH) =3.912× 103
Vis×
(550
λ
). (1)
The LIDAR (light detection and ranging), being similar tothat reported by Sugimoto et al. (2009), was installed in theinstitute of atmospheric physics (IAP), Chinese academy ofsciences (39.98◦ N, 116.37◦ E), about 5.7 km east of PekingUniversity. The same conditions of PBL were assumed atthese two nearby measurement sites. The LIDAR was de-signed for automated continuous operation and was directedvertically. The LIDAR was operated for 5 min every 15 min,and the averaged profile data were stored. Therefore, 96 pro-files were recorded per day. The LIDAR had a 25 MHzanalog-to-digital conversion rate, which means a 6 m heightresolution. LIDAR signals were processed with range cor-rected and overlap corrected, and then the calibrated sig-nals could be used to retrieve the height of planetary bound-ary layer (PBL). Several methods, including threshold tech-niques (Melfi et al., 1985) and gradient techniques (Haydenet al., 1997), have been investigated to extract the PBL heightfrom LIDAR data. The fundamental premise took advantageof the large variance in aerosol echo profile where the aerosolconcentration changed abruptly between the free troposphereand mixing layer. In this study, we used the coefficient of
www.atmos-chem-phys.net/13/4501/2013/ Atmos. Chem. Phys., 13, 4501–4514, 2013

4504 X. G. Liu et al.: Formation and evolution mechanism of regional haze: a case study in Beijing, China
Table 1.Overview of instruments involved in this study.
Instrument Parameter Manufacturer Calibration Wavelengthmodel (nm)
TEOM PM2.5 Thermo. Electron. – –1400a
Pulsed fluorescence SO2 Thermo. Electron. Zero, span check –SO2 43iTL every dayanalyzer
Chemiluminescence NO-NO2-NOx Thermo. Electron. Zero, span check –NO-NO2-NOx 42iTL every dayanalyzer
UV photometric O3 O3 Thermo. Electron. Zero, span check –analyzer 49i every day
Gas filter correlation CO Thermo. Electron. Zero, span check –CO analyzer 48iTL every day
Wind speed Wind speed, Vaisala – –temperature/RH sensor Temperature, RH GMT220
HMP45
SMPS Particle size TSI Com. – –distribution 3936(2.5∼ 1000 nm)
APS Particle size TSI Com. – –distribution 3321(0.5∼ 20 µm)
Integrating Aerosol Ecotech Zero, span check (CO2) 525nephelometer scattering M9003 every day
coefficient
MAAP Aerosol Thermo. Electron. Zero, flow-rate check 670absorption Caruso 5012 at the start/endcoefficient
Sun-photometer Aerosol optical Solar light Inc. – 380, 500, 675,depth Microtops II 870, 1020
Visibility meter Atmospheric Vaisala Before and after 875extinction FD12 the campaigncoefficient
LIDAR PBL height NIES∗ – 525
∗ NIES: National Institute for Environmental Studies, Japan.
variance of LIDAR signals calculated by Eq. (2) to detect theheight of the PBL (Strawbridge and Snyder, 2004):
v =S
x× 100%=
√n∑
i=1(xi −x)2
n
1n
n∑i=1
xi
× 100%, (2)
whereS is standard deviation andx is the average of adja-cent five LIDAR signals, which were from the normalizedbackscattering data on 532 nm wavelength channel. The sitewhere its coefficient of variance is the maximum is the heightof the PBL.
3 Results and discussion
3.1 Process of regional haze
3.1.1 Temporal variations of atmospheric pollutants
Temporal variations of measured NO, NO2, SO2, O3, CO,and PM2.5 in Beijing from 20–27 September 2011 are de-picted in Fig. 1. Generally, the concentrations of air pollu-tants NO2, SO2, CO, and PM2.5 had an increasing trend, withthe exception of NO, probably due to the scavenging pro-cess by O3. O3, which is formed by photochemical reactionsbetween volatile organic compounds (VOCs) and nitrogenoxides (NOx) in the presence of heat and sunlight (Seinfeld
Atmos. Chem. Phys., 13, 4501–4514, 2013 www.atmos-chem-phys.net/13/4501/2013/

X. G. Liu et al.: Formation and evolution mechanism of regional haze: a case study in Beijing, China 4505
29
Fig. 1. Time series of observed NO, NO2, SO2, O3, CO, and PM2.5 in Beijing from 20~27
September 2011.
9-20 9-21 9-22 9-23 9-24 9-25 9-26 9-270
100
200
3000
1
2
30
10
20
30
400
50
100
1500
40
80
1200
100
200
300
PM
2.5 (
μg/m
3 )
Date (m-d)
CO
(ppm
V)
SO
2 (pp
bV)
O3 (p
pbV)
NO
2 (ppb
V)N
O (p
pbV
)
Fig. 1.Time series of observed NO, NO2, SO2, O3, CO, and PM2.5 in Beijing from 20–27 September 2011.
and Pandis, 2006), also showed an increasing trend until24 September with a slight decrease on 25 and 26 Septem-ber. O3 concentration in this pollution episode exceeded100 ppbV and reached 120 ppbV on 24 September, whichwas higher than the national ambient air quality standards forO3 (93 ppbV) (i.e., China air quality standard 200 µg m−3).Pollutants SO2, NO2 and CO, being the emissions frombiomass, fuel and coal burning, had the same increasing trendfrom 20–27 September. The mass loading of PM2.5 grad-ually accumulated, and its instantaneous value reached at220 µg m−3 at midnight of 26 September and daily averagewas 143 µg m−3 on 26 September, which was nearly 4 timesas high as the daily limit (35 µg m−3) of the USA AmbientAir Quality Standard. Sun et al. (2004) monitored an extremePM2.5 concentration with 349 µg m−3 in winter from 2002to 2003, and He et al. (2001) monitored an extreme PM2.5concentration with 357 µg m−3 in Beijing from July 1999 toSeptember 2000. Concentrations of NO, NO2, SO2, O3, CO,and PM2.5 observed during 23–27 September had exceededthe national ambient air quality standards for residents, in-dicating that air pollution had been very serious, and such ahigh value of PM2.5 was regularly considered unsuitable forresidents.
3.1.2 Temporal variations of atmospheric opticalproperties
Figure 2 shows the temporal series of observed aerosol scat-tering coefficientbsp, aerosol absorption coefficientbap, ab-sorption coefficient by NO2 bag, atmospheric extinction coef-ficient bext (RH), and atmospheric visibility in Beijing from20–27 September 2011. Absorption coefficient by NO2 bagwas calculated by experiential equationbag= 0.33· [NO2]from Hodkinson (1966).bsp, bap, andbext (RH) had the sametendency to increase in the formation process of haze. Fur-thermore, the value ofbext (RH) was nearly 5600 M m−1 inthe morning of 26 September and the corresponding visibilitywas only 1.1 km.bag also had an increasing trend with appar-ent diurnal variation. The visibility decreased sharply from23 September and met the definition of haze (Vis≤ 10 kmand RH≤ 90 %). Furthermore, as illustrated in Fig. 3, thevalue of daily averaged AOD at Beijing urban area increasedfrom ∼ 0.16 atλ = 500 nm on 22 September and reached∼ 3.5 on 26 September; the value of AOD increased nearly22 times from clear day to haze day, and about 17 times largerthan that (0.195) of the global mean value of AOD over landstudied by Bevan et al. (2012).
www.atmos-chem-phys.net/13/4501/2013/ Atmos. Chem. Phys., 13, 4501–4514, 2013

4506 X. G. Liu et al.: Formation and evolution mechanism of regional haze: a case study in Beijing, China
30
Fig. 2. Time series of measured aerosol scattering coefficient bsp, aerosol absorption
coefficient bap, absorption coefficient by NO2 bag, atmospheric extinction coefficient bext(RH),
and atmospheric visibility (Vis) in Beijing from 20-27 September 2011.
0
2000
4000
60000
12
24
360
50
100
1500
600
1200
1800
9-20 9-21 9-22 9-23 9-24 9-25 9-26 9-270
15
30
45
b sp
(1/M
m)
b ext(R
H)
(1/M
m)
b ap
(1/M
m)
b ag
(1/M
m)
V
is(K
m)
Date (m-d)
Fig. 2. Time series of measured aerosol scattering coefficientbsp, aerosol absorption coefficientbap, absorption coefficient by NO2 bag,atmospheric extinction coefficientbext (RH), and atmospheric visibility (Vis) in Beijing from 20–27 September 2011.
31
Fig. 3. Temporal series of daily averaged aerosol optical depth measured by sunphotometer in
Beijing.
9-20 9-21 9-22 9-23 9-24 9-25 9-260
1
2
3
4
5
AO
D
Date (m-d)
380nm 500nm 675nm 870nm 1020nm
Fig. 3.Temporal series of daily averaged aerosol optical depth mea-sured by sunphotometer in Beijing.
3.2 Formation and evolution mechanism ofregional haze
3.2.1 Stable synoptic condition
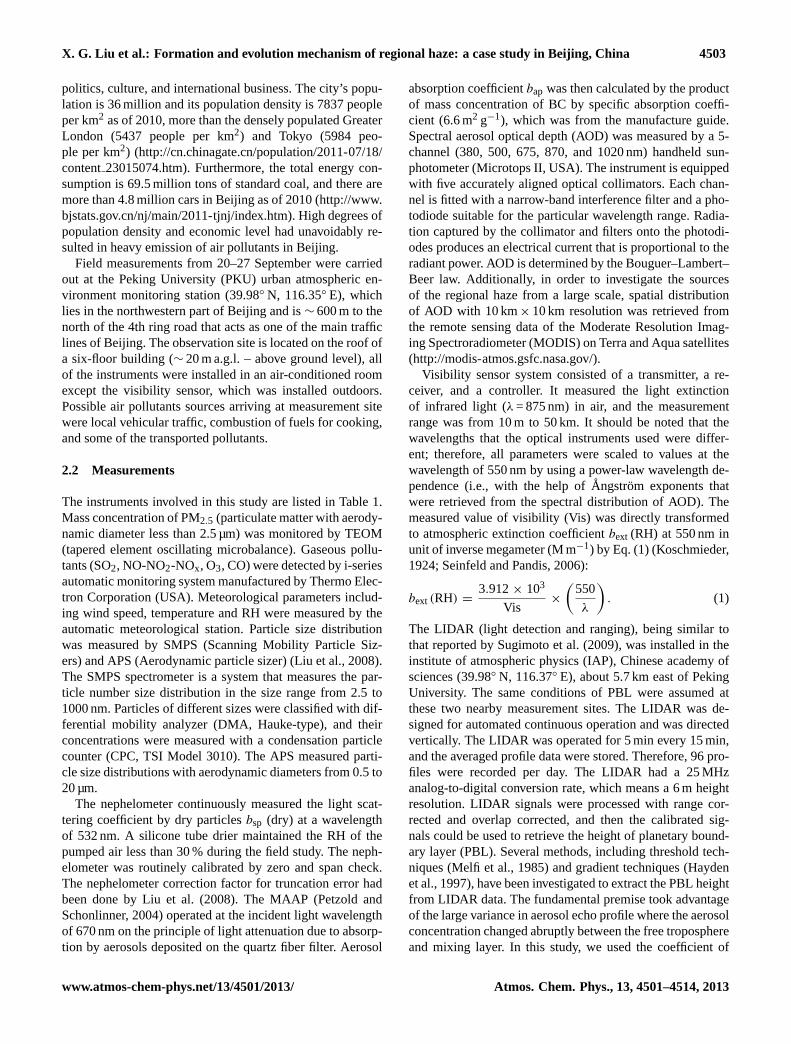
The surface weather maps at 05:00 LT from 22–25 Septem-ber are shown in Fig. 4. A slowly migrating anti-cyclone(high-pressure system) which resulted in clear sky, subsi-dence airflow, and relatively stagnant conditions (Chen etal., 2003) overlaid Beijing-Tianjin-Tangshan Region before23 September. The edge of a slowly migrating cyclone(which originated in northeastern China) affected Beijingarea from 24 September and possibly caused a build-up ofpollutants in this region. Beijing area was again controlledby the edge of the high-pressure system from 25 Septem-ber. Beijing-Tianjin-Tangshan Region was dominated byweak high pressure, indicating fine weather. From China’sFengyun-2 satellite image (http://www.nmc.gov.cn/publish/satellite/fy2.htm) (showed by example in Fig. 5), therewas no cloud over Beijing-Tianjin-Tangshan Region and itprovided favorable conditions for photochemical reactions.
Atmos. Chem. Phys., 13, 4501–4514, 2013 www.atmos-chem-phys.net/13/4501/2013/

X. G. Liu et al.: Formation and evolution mechanism of regional haze: a case study in Beijing, China 4507
Fig. 4.Weather maps on the surface at(a) 05:00 LT 22 September,(b) 05:00 LT 23 September,(c) 05:00 LT 24 September, and(d) 05:00 LT25 September. Black star denotes measurement site.
Dominance of high pressure in the Beijing-Tianjin-TangshanRegion also indicated aloft airflow convergence and surfacedivergence. Due to the divergence of the air around the anti-cyclone, the airflow would subside and restrict the develop-ment of the height of the PBL, which limited the vertical dif-fusion of pollutants (discussed in Sect. 3.2.2).
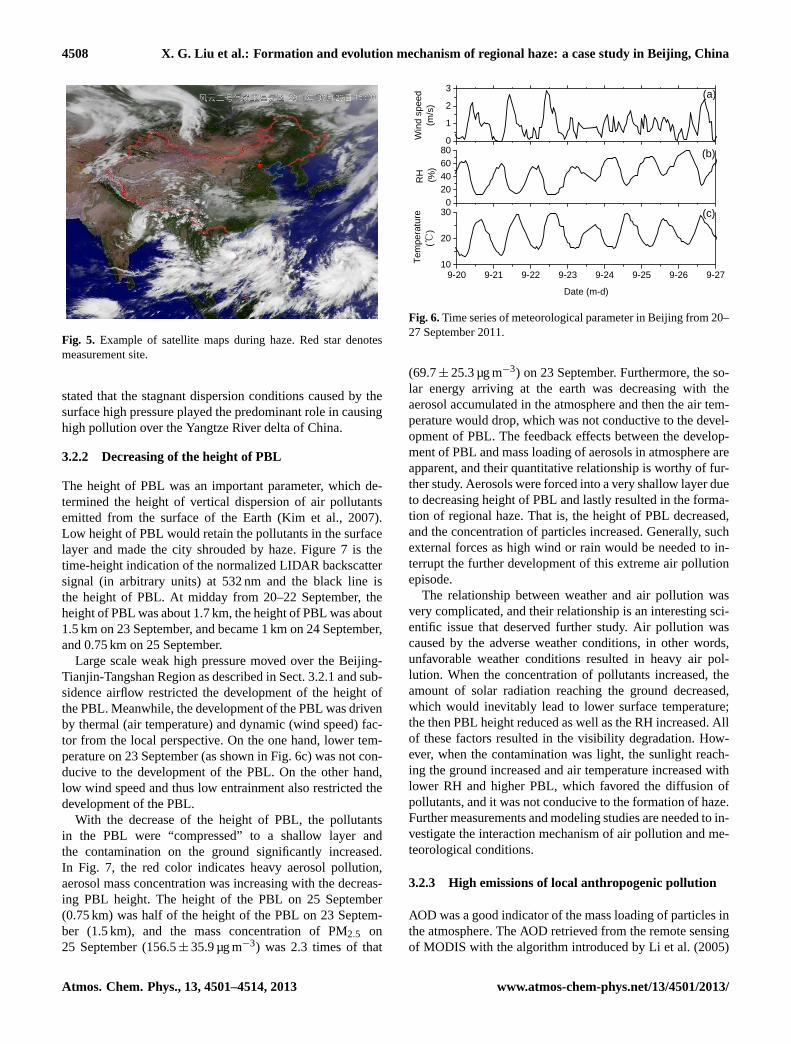
Furthermore, because there were no strong pressure gradi-ents over Beijing-Tianjin-Tangshan Region in Fig. 4, largescale air circulation was relatively weak due to low windspeed. This stable synoptic condition and calm wind fa-vored the accumulation of the atmospheric pollutants andhorizontal dilution was difficult, ultimately led to high con-centrations of urban pollutants. As depicted in Fig. 6a,the wind speed was relatively low with the mean value of0.9 m s−1 from 23–26 September, which was consistent withthe occurrence of haze episode. In addition, the air tem-perature decreased from 22 September (maximum 29.7◦) to23 September (maximum 25.3◦), which would cause the lack
of the thermal dynamics for the development of the PBL(discussed in Sect. 3.2.2). Meanwhile, the RH during 21–23 September was below 60 % with minimum of 10 %, but,its value increased with a maximum of 75–80 % and a min-imum of 30∼ 40 % during 24–27 September. The ambientaerosols would uptake water vapor and grow in diameter,which also resulted in higher light scattering (discussed inSect. 3.2.5) and the formation of this haze event.
During this haze episode, Beijing-Tianjin-Tangshan Re-gion was dominated by a weak high pressure system withlow wind speed, subsidence airflow, and shallow PBL, whichrestricted the diffusion of pollutants in the vertical andhorizontal directions. So, stable synoptic condition was oneof the important factors resulting in the formation and evolu-tion of haze event. Wu et al. (2005) studied an extreme hazeepisode over the Guangzhou region of China and also clar-ified that descending air motion and weak horizontal windproduced very high aerosol concentrations. Fu et al. (2008)
www.atmos-chem-phys.net/13/4501/2013/ Atmos. Chem. Phys., 13, 4501–4514, 2013
4508 X. G. Liu et al.: Formation and evolution mechanism of regional haze: a case study in Beijing, China
33
Fig. 5. Example of satellite maps during haze. Red star denotes measurement site. Fig. 5. Example of satellite maps during haze. Red star denotesmeasurement site.
stated that the stagnant dispersion conditions caused by thesurface high pressure played the predominant role in causinghigh pollution over the Yangtze River delta of China.
3.2.2 Decreasing of the height of PBL
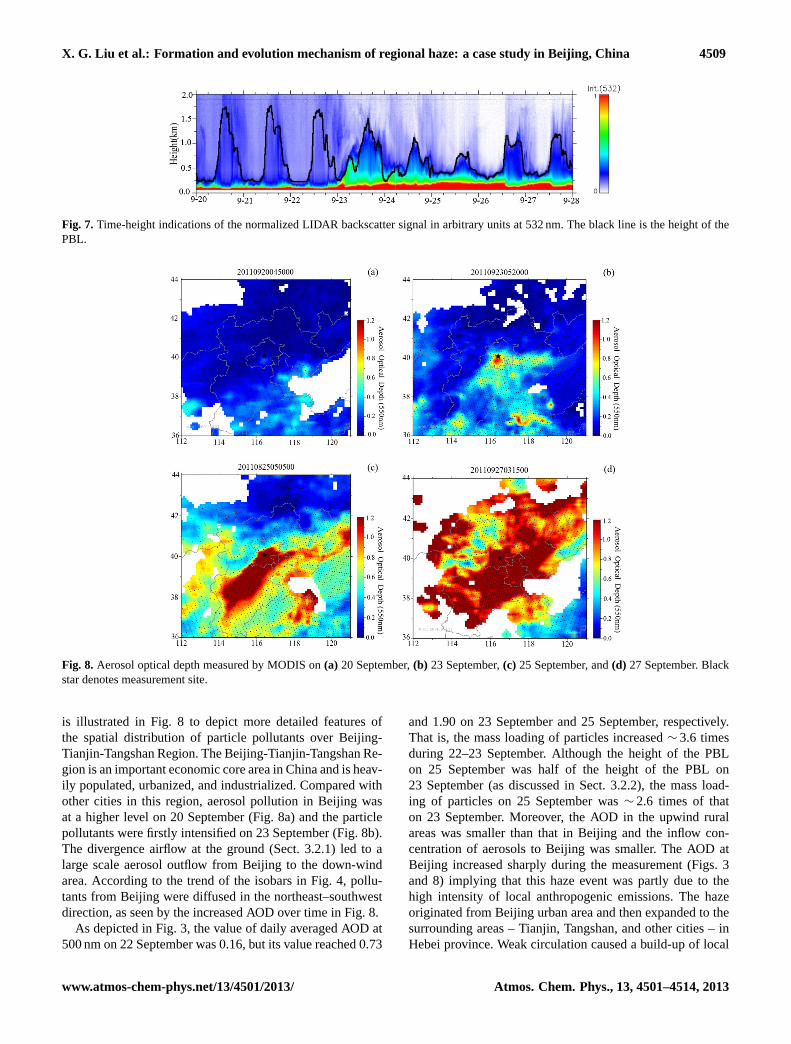
The height of PBL was an important parameter, which de-termined the height of vertical dispersion of air pollutantsemitted from the surface of the Earth (Kim et al., 2007).Low height of PBL would retain the pollutants in the surfacelayer and made the city shrouded by haze. Figure 7 is thetime-height indication of the normalized LIDAR backscattersignal (in arbitrary units) at 532 nm and the black line isthe height of PBL. At midday from 20–22 September, theheight of PBL was about 1.7 km, the height of PBL was about1.5 km on 23 September, and became 1 km on 24 September,and 0.75 km on 25 September.
Large scale weak high pressure moved over the Beijing-Tianjin-Tangshan Region as described in Sect. 3.2.1 and sub-sidence airflow restricted the development of the height ofthe PBL. Meanwhile, the development of the PBL was drivenby thermal (air temperature) and dynamic (wind speed) fac-tor from the local perspective. On the one hand, lower tem-perature on 23 September (as shown in Fig. 6c) was not con-ducive to the development of the PBL. On the other hand,low wind speed and thus low entrainment also restricted thedevelopment of the PBL.
With the decrease of the height of PBL, the pollutantsin the PBL were “compressed” to a shallow layer andthe contamination on the ground significantly increased.In Fig. 7, the red color indicates heavy aerosol pollution,aerosol mass concentration was increasing with the decreas-ing PBL height. The height of the PBL on 25 September(0.75 km) was half of the height of the PBL on 23 Septem-ber (1.5 km), and the mass concentration of PM2.5 on25 September (156.5± 35.9 µg m−3) was 2.3 times of that
34
Fig. 6. Time series of meteorological parameter in Beijing from 20~27 September 2011.
9-20 9-21 9-22 9-23 9-24 9-25 9-26 9-2710
20
300
204060800
1
2
3
(c)
Tem
pera
ture
( ℃)
Date (m-d)
(b)
RH
(%)
Win
d sp
eed
(m/s
)
(a)
Fig. 6.Time series of meteorological parameter in Beijing from 20–27 September 2011.
(69.7± 25.3 µg m−3) on 23 September. Furthermore, the so-lar energy arriving at the earth was decreasing with theaerosol accumulated in the atmosphere and then the air tem-perature would drop, which was not conductive to the devel-opment of PBL. The feedback effects between the develop-ment of PBL and mass loading of aerosols in atmosphere areapparent, and their quantitative relationship is worthy of fur-ther study. Aerosols were forced into a very shallow layer dueto decreasing height of PBL and lastly resulted in the forma-tion of regional haze. That is, the height of PBL decreased,and the concentration of particles increased. Generally, suchexternal forces as high wind or rain would be needed to in-terrupt the further development of this extreme air pollutionepisode.
The relationship between weather and air pollution wasvery complicated, and their relationship is an interesting sci-entific issue that deserved further study. Air pollution wascaused by the adverse weather conditions, in other words,unfavorable weather conditions resulted in heavy air pol-lution. When the concentration of pollutants increased, theamount of solar radiation reaching the ground decreased,which would inevitably lead to lower surface temperature;the then PBL height reduced as well as the RH increased. Allof these factors resulted in the visibility degradation. How-ever, when the contamination was light, the sunlight reach-ing the ground increased and air temperature increased withlower RH and higher PBL, which favored the diffusion ofpollutants, and it was not conducive to the formation of haze.Further measurements and modeling studies are needed to in-vestigate the interaction mechanism of air pollution and me-teorological conditions.
3.2.3 High emissions of local anthropogenic pollution
AOD was a good indicator of the mass loading of particles inthe atmosphere. The AOD retrieved from the remote sensingof MODIS with the algorithm introduced by Li et al. (2005)
Atmos. Chem. Phys., 13, 4501–4514, 2013 www.atmos-chem-phys.net/13/4501/2013/
X. G. Liu et al.: Formation and evolution mechanism of regional haze: a case study in Beijing, China 4509
35
Fig. 7. Time-height indications of the normalized LIDAR backscatter signal in arbitrary units at
532nm. The black line is the height of the PBL.
Fig. 7. Time-height indications of the normalized LIDAR backscatter signal in arbitrary units at 532 nm. The black line is the height of thePBL.
36
Fig. 8. Aerosol optical depth measured by MODIS on (a) 20 September, (b) 23 September, (c) 25
September, and (d) 27 September. Black star denotes measurement site.
Fig. 8. Aerosol optical depth measured by MODIS on(a) 20 September,(b) 23 September,(c) 25 September, and(d) 27 September. Blackstar denotes measurement site.
is illustrated in Fig. 8 to depict more detailed features ofthe spatial distribution of particle pollutants over Beijing-Tianjin-Tangshan Region. The Beijing-Tianjin-Tangshan Re-gion is an important economic core area in China and is heav-ily populated, urbanized, and industrialized. Compared withother cities in this region, aerosol pollution in Beijing wasat a higher level on 20 September (Fig. 8a) and the particlepollutants were firstly intensified on 23 September (Fig. 8b).The divergence airflow at the ground (Sect. 3.2.1) led to alarge scale aerosol outflow from Beijing to the down-windarea. According to the trend of the isobars in Fig. 4, pollu-tants from Beijing were diffused in the northeast–southwestdirection, as seen by the increased AOD over time in Fig. 8.
As depicted in Fig. 3, the value of daily averaged AOD at500 nm on 22 September was 0.16, but its value reached 0.73
and 1.90 on 23 September and 25 September, respectively.That is, the mass loading of particles increased∼ 3.6 timesduring 22–23 September. Although the height of the PBLon 25 September was half of the height of the PBL on23 September (as discussed in Sect. 3.2.2), the mass load-ing of particles on 25 September was∼ 2.6 times of thaton 23 September. Moreover, the AOD in the upwind ruralareas was smaller than that in Beijing and the inflow con-centration of aerosols to Beijing was smaller. The AOD atBeijing increased sharply during the measurement (Figs. 3and 8) implying that this haze event was partly due to thehigh intensity of local anthropogenic emissions. The hazeoriginated from Beijing urban area and then expanded to thesurrounding areas – Tianjin, Tangshan, and other cities – inHebei province. Weak circulation caused a build-up of local
www.atmos-chem-phys.net/13/4501/2013/ Atmos. Chem. Phys., 13, 4501–4514, 2013

4510 X. G. Liu et al.: Formation and evolution mechanism of regional haze: a case study in Beijing, China
pollutants in this region. In addition, the wind speed showednegative correlations with the mass concentration of PM2.5in Beijing as discussed in Sect. 3.2.1, which indicated thatthis haze event was partly attributed to the high emissions oflocal anthropogenic pollution through direct emissions andsubsequent secondary transformations.
3.2.4 Number and size evolution of aerosols
According to its size distribution, aerosol could be di-vided into nucleation mode (particles with diameters3∼ 25 nm), Aitken mode (25∼ 100 nm), accumulation mode(0.1∼ 1 µm), and coarse mode (> 1 µm). Particle size distri-bution is an important factor determining the amount of vis-ible light scattered by atmospheric aerosols. In theory, thecontribution of extinction by nucleation mode and coarsemode could be ignored regarding visibility impairment, andaerosols in accumulation mode contributed most of the lightextinction (Cheng et al., 2008b).
Primary gaseous species such as NO2, SO2 and VOCscould form secondary nitrate, sulfate and organic particles innucleation or Aitken mode through photochemical reaction.Temporal variance of particle size distribution, SO2 mixingratio, and PM2.5 mass concentration from 20–27 Septemberin Beijing is illustrated in Fig. 9. Nanoparticle event (Russellet al., 2007), which is characterized by banana-shaped con-tour, happened on 20, 21, and 22 September (Fig. 9a). Theseevents occurred before or during noon time when higher lev-els of SO2 were simultaneously observed (Fig. 9b) and PM2.5mass concentrations were at significantly lower values thantheir averages (Fig. 9c). Subsequently, nanoparticles quicklygrew to bigger size due to heterogeneous reactions or coag-ulation, and particles were mainly in the Aitken mode in theafternoon. The growth rate of nanoparticles were calculatedusing the method introduced by Kulmala et al. (2001), andthe growth rate were 1.8, 2.3, and 3.8 nm h−1 for 20, 21, and22 September, respectively.
Temporal variations of aerosol number concentration fornucleation mode, Atiken mode, and accumulation mode areillustrated in Fig. 10. The bursts of the nucleation modeaerosols on each day of 20–22 September were immedi-ately followed by an increase of aerosols in Atiken mode.Aerosols growth in diameter was apparent. In the process ofhaze evolution during 23–26 September, the number concen-tration of aerosols in nucleation mode decreased and that inaccumulation mode sharply increased (Fig. 10). Especially,the number concentrations of aerosols in accumulation mode(8000 cm−3) were larger than those in Aitken mode or nu-cleation mode from noon time on 25 September. Low windspeed favored accumulation of aerosols and hence aerosolsurface area increased, which could favor the heterogeneousreactions at the surface of the existing aerosols. The scat-tering ability of these aerosols in accumulation mode wasstrong and resulted in the deterioration of visibility, as shownin Fig. 10 where the temporal distribution of the directly
37
Fig. 9. Temporal variations of (a) particle size distribution, (b) SO2 mixing ratio, and (c) PM2.5
mass concentration from 20~27 September 2011. Empty space denotes lack of measurements.
0
10
20
30
9-20 9-21 9-22 9-23 9-24 9-25 9-26 9-270
100
200
300
10
100
700
Dp
(nm
)
1E1 1E2 1E3 1E4 1E5dN/dlogDp (/cm3)
(a)
(b)
SO2 (p
pbV)
(c)
PM2.
5 (μg/
m3 )
Date (m-d)
Fig. 9. Temporal variations of(a) particle size distribution,(b) SO2 mixing ratio, and(c) PM2.5 mass concentration from 20–27 September 2011. Empty space denotes lack of measurements.
measured aerosol scattering coefficients was consistent withthat of aerosol number concentrations in accumulation mode.
Nanoparticle events occurred on 20–22 September, andthese nanoparticles grew larger in diameter to the accumu-lation mode through heterogeneous reactions or coagulationduring 23–26 September. With the number concentration in-crease of aerosols in accumulation mode as well as the in-crease of their sizes, light scattered by aerosols gradually in-creased, which led to the occurrence of haze.
3.2.5 Impact of hygroscopic growth for aerosolscatteringf (RH)
Sulfur and nitrogen oxides could form sulfate, nitrateaerosols by gas to particle conversion in the atmosphere. Fur-thermore, water-soluble ions (e.g., SO2−
4 , NO−
3 , NH+
4 , andNa+) accounted for∼ 60 % of the mass of PM10 in Beijing(Liu et al., 2009). When RH in the atmosphere was high,these strong hydrophilic aerosols grew in diameter due to up-take of water vapor and their ability to scatter light increased(Tang, 1996), which resulted in decreasing the atmosphericvisibility. Hygroscopic factor for aerosol scatteringf (RH),being the ratio of the aerosol scattering coefficient in wetconditions to that in dry conditions, was calculated by Eq. (3)(Hegg et al., 1993; Liu et al., 2008, 2010):
f (RH) =bsp(RH)
bsp(dry)=
bext(RH) − bsg − bag − bap
bsp(dry), (3)
where, “s” and “a” denote scattering and absorption, and “p”and “g” denote particle and gas, respectively.
Figure 11 shows the ratio of wet to dry light scatteringacting as a function of RH. Thef (RH) had the tendencyto increase with increasing RH. Usually, the relationship be-tweenf (RH) and RH could be fitted by empirical functions:
Atmos. Chem. Phys., 13, 4501–4514, 2013 www.atmos-chem-phys.net/13/4501/2013/

X. G. Liu et al.: Formation and evolution mechanism of regional haze: a case study in Beijing, China 4511
38
Fig. 10. Temporal variations of the measured aerosol scattering coefficient bsp and aerosol
number concentrations for nucleation mode, Atiken mode, and accumulation mode.
0
300
600
900
1200
1500
9-20 9-21 9-22 9-23 9-24 9-25 9-26 9-270
5000
10000
15000
20000
Nucleation mode Aitken mode Accumulation mode Aerosol scattering coefficient bsp
Date (m-d)
Nuc
leat
ion/
Aitk
en m
ode
(cm
-3)
0
4000
8000
12000
16000
b sp
(1/M
m)
Acc
umul
atio
n m
ode
(cm
-3)
Fig. 10. Temporal variations of the measured aerosol scattering coefficientbsp and aerosol number concentrations for nucleation mode,Atiken mode, and accumulation mode.
39
Fig. 11. Hygroscopic growth for aerosol scattering f(RH) as a function of RH with curve
fitting. Scattered dots are the measured f(RH) and the line is the empirical fitting curve.
20 30 40 50 60 70 80 900.0
0.5
1.0
1.5
2.0
2.5
3.0
f(RH
)=b sp
(RH
)/bsp
(Dry
)
RH (%)
f(RH)=1+a(RH/100)ba: 4.34±0.43b: 6.72±0.40R2= 0.93
Fig. 11. Hygroscopic growth for aerosol scatteringf (RH) as afunction of RH with curve fitting. Scattered dots are the measuredf (RH) and the line is the empirical fitting curve.
f (RH) = 1+ a (RH× 100−1)b. The curve fitting parametersa andb were 4.34 and 6.72, respectively, during the measure-ment period. Thef (RH) at 80 % RH was 1.97± 0.21 withmean and standard deviation, i.e., under 80 % RH condition,aerosol scattered nearly two times (more) of light relative tothat at dry condition. Moreover, the aerosol scattering gen-erally attributed to nearly 80 % of total atmospheric extinc-tion. So, in case of high RH, its extinction effects would bealso amplified with the particles hygroscopic growth. Atmo-spheric extinction coefficientbext (dry) under dry conditioncould be calculated by Eq. (4):
bext(dry) = bsp(dry) + bap + bsg + bag. (4)
The visibility under dry condition was then calculated byEq. (1). The average visibility during 20–27 September inBeijing was 22.3 km (±26.3 km) under the dry condition, butits value was 10.5 km (±9.2 km) because of the hygroscopicgrowth of aerosol scattering under ambient RH. Aerosol hy-groscopic properties played an important role on visibilitydegradation, and the haze was an extreme example of thisproperty.
Mass concentrations of PM2.5 could not properly explainthe reasons for reduced visibility because of the fact that hazealso associated with the aerosol chemical hygroscopic com-ponents and its hygroscopic growth factorf (RH) (Malm andDay, 2001; Cheng et al., 2008a,b; Liu et al., 2008). Atmo-spheric extinction coefficientbext (RH) under ambient condi-tion could be expressed by an approximate Eq. (5) (Hand andMalm, 2007; Malm and Hand, 2007):
bext(RH) = bsp(RH) + bap + bsg + bag
= Qsp × PM2.5 ×
(1 + a ×
(RH
100
)b)
+Qap × PM2.5 + 24, (5)
where Qsp and Qap are the mass scattering and absorp-tion efficiency, and the value forQsp, Qap were 5.3 m2 g−1,and 0.6 m2 g−1 according to the statistics value from the ra-tio of bsp andbap to PM2.5, respectively, which were omit-ted in this study. The empirical fitting coefficientsa andb were 4.34 and 6.72, respectively. Additionally, the meanvalue of 14 M m−1 for bag during the measurement periodwas used as the model value for light absorption by gaseouspollutants. Extinction by gasbsg is assumed to be constantwith the value of 10 M m−1; therefore, the sum of the valueof bag andbsg was 24 as demonstrated in Eq. (5). The at-mospheric visibility in a unit of km was ultimately con-verted from this atmospheric extinction coefficientbext (RH)by Eq. (1).
The equivalent curve for visibility depending on the massconcentration of PM2.5 and RH is illustrated in Fig. 12.In general, the atmospheric visibility decreased with theincreasing mass concentration of PM2.5 and the visibilitywould decrease sharply with higher RH. The visibility wouldbe less than 3.0 km when the mass concentration of PM2.5was larger than 200 µg m−3. For example, the visibility wasonly 1.7 km when the mass loading of PM2.5 was 220 µg m−3
under 70 % RH at midnight of 26 September. Under dry con-dition, the mass concentration of PM2.5 should not exceed60 µg m−3 in order to make visibility no less than 10 km (see
www.atmos-chem-phys.net/13/4501/2013/ Atmos. Chem. Phys., 13, 4501–4514, 2013

4512 X. G. Liu et al.: Formation and evolution mechanism of regional haze: a case study in Beijing, China
40
Fig. 12. The equivalent curve for visibility depending on the mass concentration of PM2.5 and
relative humidity. Line (b) is the standard for visibility equal to 10 km, and line (a) is the
limit for mass concentration of PM2.5 under dry condition (RH=10%).
0 50 100 150 2000
10
20
30
40
50 60
b
visi
bilit
y (K
m)
PM2.5 (μgm-3)
10 60 70 80 90
RH (%)
60
a
Fig. 12.The equivalent curve for visibility depending on the massconcentration of PM2.5 and relative humidity. Line(b) is the stan-dard for visibility equal to 10 km, and line(a) is the limit for massconcentration of PM2.5 under dry condition (RH = 10 %).
cross line a and b in Fig. 12). Taking the RH into consider-ation, the mass concentration of PM2.5 should be less thanthis value (60 µg m−3). For example, the mass concentrationof PM2.5 should be less than 30 µg m−3 when the RH arrivingat 80 %.
4 Conclusions
In this study, the evolution of haze in Beijing from 20–27 September 2011 was investigated in order to clarify theformation mechanism of this regional haze event. Compre-hensive measurements of aerosol characteristics and relevantgas pollutants as well as meteorological conditions were con-ducted at the PKU urban atmospheric environment monitor-ing station. Meanwhile, aerosol spatial distribution and theheight of PBL were retrieved from the signal of MODIS andLIDAR.
Concentrations of NO, NO2, SO2, O3, CO, and PM2.5observed during 23–27 September had exceeded the na-tional ambient air quality standards for residents. The massloading of PM2.5 gradually accumulated and its instan-taneous value reached at 220 µg m−3 on the midnight of26 September and daily average was 143 µg m−3. The valueof daily averaged AOD at Beijing urban area increased from∼ 0.16 atλ = 500 nm on 22 September and reached∼ 3.5 on26 September. The value of AOD increased nearly 22 timesfrom clear day to haze day.
The formation of severe haze episodes was a combinationof many factors. Firstly, haze formation and evolution dependon both meteorological conditions and emission intensity.Beijing-Tianjin-Tangshan Region was dominated by weakhigh pressure during the measurement. The high-pressuresystem resulted in clear sky, subsiding airflow, and rela-tively stagnant conditions. Ample sunlight and higher tem-perature provided favorable conditions for photochemical re-actions at the beginning. Furthermore, calm wind caused a
build-up of pollutants in the Beijing area and air pollutantswandered inside the source region. Meanwhile, the airflowwould subside due to the divergence of the air on the surface,which restricted the development of the height of the PBLand limited the vertical mixing of air pollutants. The heightof the PBL on 25 September was half of the height of thePBL on 23 September, the mass concentration of PM2.5 on25 September (156.5± 35.9 µg m−3) was 2.3 times of that(69.7± 25.3 µg m−3) on 23 September, and the mass loadingof particles in the atmosphere on 25 September was∼ 2.6times of that on 23 September. The inflow of aerosols to Bei-jing was smaller and the large scale circulation was relativelyweak, therefore, the sharp increase of AOD at Beijing duringthe measurement indicated that this haze episode was alsodue to the high intensity of local anthropogenic emissions.Secondly, nanoparticle events occurred on 20–22 Septem-ber, and nanoparticles subsequently grew larger in diameterto the accumulation mode through heterogeneous reactionsor coagulation. The increase of the number concentration ofaerosols in accumulation mode as well as the increase of theirsize, resulted in the increase in light scattering, which ul-timately induced the occurrence of haze. Lastly, the RH inthe beginning of the measurement was< 60 % and increasedwith maximum of 75∼ 80 % at the latter phase of haze event.The ambient hydrophilic aerosols absorbed water vapor andscattered more light with the ambient RH increasing, aerosolunder 80 % RH scattered nearly two times of light relative tothat at dry condition.
In summary, the key factors that affected the formation andevolution of haze were (1) stable anti-cyclone synoptic con-ditions at the surface, (2) reduction of the height of PBL,(3) heavy pollution emissions from urban area, (4) numberand size evolution of aerosols and (5) hygroscopic growthfor aerosol scattering.
Acknowledgements.This work was supported by the NationalNatural Science Foundation of China (Grant No. 41175018,41005063, and 20977001) and the Ministry of Science and Tech-nology of China (2013CB955804). The authors thank Chengcai Liand Yafang Cheng for helpful discussions, and we also thankanonymous reviewers for their constructive comments.
Edited by: L. M. Russell
References
Bell, M. L., Cifuentes, L. A., Davis, D. L., Cushing, E., and Telles,A. G.: Gouveia, N. Environmental health indicators and a casestudy of air pollution in Latin American cities, Environ. Res.,111, 57–66, 2011.
Bevan, S. L., North, P. R. J., Los, S. O., and Grey, W. M. F.: Aglobal dataset of atmospheric aerosol optical depth and surfacereflectance from AATSR, Remote Sens. Environ., 116, 199–210,2012.
Atmos. Chem. Phys., 13, 4501–4514, 2013 www.atmos-chem-phys.net/13/4501/2013/

X. G. Liu et al.: Formation and evolution mechanism of regional haze: a case study in Beijing, China 4513
Chameides, W. L., Yu, H., Liu, S. C., Bergin, M., Zhou, X., Mearns,L., Wang, G., Kiang, C. S., Saylor, R. D., Luo, C., Huang, Y.,Steiner, A., and Giorgi, F.: Case study of the effects of atmo-spheric aerosols and regional haze on agriculture: an opportunityto enhance crop yields in China through emission controls?, P.Natl. Acad. Sci. USA, 96, 13626–13633, 1999.
Chen, L. W. A., Chow, J. C., Doddridge, B. G., Dickerson, R. R.,Ryan, W. F., and Mueller, P. K.: Analysis of a summertime PM2.5and haze episode in the mid-Atlantic region, J. Air Waste Mange.Assoc., 53, 946–956, 2003.
Cheng, Y. F., Eichler, H., Wiedensohler, A., Heintzenberg, J.,Zhang, Y. H., Hu, M., Herrmann, H., Zeng, L. M., Liu, S.,Gnauk, T., Bruggenmann, E., and He, L. Y.: Mixing state ofelemental carbon and non-light-absorbing aerosol componentsderived from in situ particle optical properties at Xinken inPearl River Delta of China, J. Geophys. Res., 111, D20204,doi:10.1029/2005JD006929, 2006.
Cheng, Y. F., Wiedensohler, A., Eichler, H., Heintzenberg, J.,Tesche, M., Ansmann, A., Wendisch, M., Su, H., Althausen, D.,Herrmann, H., Gnauk, T., Bruggemann, E., Hu, M., and Zhang,Y. H.: Relative humidity dependence of aerosol optical proper-ties and direct radiative forcing in the surface boundary layer atXinken in Pearl River Delta of China: An observation based nu-merical study, Atmos. Environ., 42, 6373–6397, 2008a.
Cheng, Y. F., Wiedensohler, A., Eichler, H., Su, H., Gnauk, T.,Bruggemann, E., Herrmann, H., Heintzenberg, J., Slanina, J.,Tuch, T., Hu, M., and Zhang, Y. H.: Aerosol optical propertiesand related chemical apportionment at Xinken in Pearl RiverDelta of China, Atmos. Environ., 42, 6351–6372, 2008b.
Deng, X., Tie, X., Wu, D., Zhou, X., Bi, X., Tan, H., Li, F., andJiang, C.: Long-term trend of visibility and its characterizationin the Pearl River Delta (PRD) region, China, Atmos. Environ.,42, 1424–1435, 2008.
Du, H. H, Kong, L. D., Cheng, T. T., Chen, J. M., Du, J. F., Li, L.,Xia, X. A., Leng, C. P., and Huang, G. H.: Insights into sum-mertime haze pollution events over Shanghai based on onlinewater-soluble ionic composition of aerosols, Atmos. Environ.,45, 5131–5137, 2011.
Fu, Q. Y., Zhuang, G. S., Wang, J., Xu, C., Huang, K., Li, J., Hou,B., Lu, T., and Streets, D. G.: Mechanism of formation of theheaviest pollution episode ever recorded in the Yangtze RiverDelta, China, Atmos. Environ., 42, 2023–2036, 2008.
Hand, J. L. and Malm, W. C.: Review of aerosol mass scattering ef-ficiencies from ground-based measurements since 1990, J. Geo-phys. Res., 112, D16203,doi:10.1029/2007JD008484, 2007.
Hayden, K. L., Anlauf, K. G., Hoff, R. M., Strapp, J. W., Botten-heim, J. W., Wiebe, H. A., Froude, F. A., and Martin, J. B.: Thevertical chemical and meteorological structure of the boundarylayer in the Lower Fraser Valley during Pacific 93, Atmos. Envi-ron., 31, 2089–2105, 1997.
He, K., Yang, F., Ma, Y., Zhang, Q., Yao, X., Chan, C. K., Cadle,S., Chan, T., and Mulawa, P.: The characteristics of PM2.5 inBeijing, China, Atmos. Environ., 35, 4959–4970, 2001.
Hegg, D., Larson, T., and Yuen, P.-F.: A theoretical study of theeffect of relative humidity on light scattering by troposphericaerosols, J. Geophys. Res., 98, 18435–18439, 1993.
Hodkinson, R. J.: Calculations of colour and visibility in urban at-mospheres polluted by gaseous NO2, Int. J. Air Water Pollut.,10, 137–144, 1966.
Huebert, B. J., Bates, T., Russell, P. B., Shi, G. Y., Kim, Y. J., Kawa-mura, K., Carmichael, G., and Nakajima, T.: An overview ofACE-Asia: Strategies for quantifying the relationships betweenAsian aerosols and their climatic impacts, J. Geophys. Res., 108,1–20, 2003.
Kang, H., Zhu, B., Su, J., Wang, H., Zhang, Q., and Wang, F.: Anal-ysis of a long-lasting haze episode in Nanjing, China, Atmos.Res., 120–121, 78–87,doi:10.1016/j.atmosres.2012.08.004,2013.
Kim, S. W., Yoon, S. C., Won, J. G., and Choi, S. C.: Ground-basedremote sensing measurements of aerosol and ozone in an urbanarea: A case study of mixing height evolution and its effect onground-level ozone concentrations, Atmos. Environ., 41, 7069–7081, 2007.
Koschmieder, H.: Theorie der horizontalen Sichtweite, Beitr. Phys.frei. Atmos., 12, 33–53, 1924.
Kulmala, M., Maso, D., Makela, J. M., Pirjola, L., Vakeva, M.,Aalto, P., Miikkulainen, P., Hameri, K., and O’Dowd, C. D.: Onthe formation, growth and composition of nucleation mode par-ticles, Tellus B, 53, 479–490, 2001.
Lee, D. O.: Trends in summer visibility in London and SouthernEngland 1962–1979, Atmos. Environ., 17, 151–159, 1983.
Li, C., Lau, K. H., Mao, J., and Chu, D. A.: Retrieval, validationand application of the 1-km aerosol optical depth from MODISmeasurements over Hong Kong, IEEE T. Geosci. Remote, 43,2650–2658, 2005.
Liu, X. G., Cheng, Y. F., Zhang, Y. H., Jung, J. S., Sugimoto, N.,Chang, S.-Y., Kim, Y. J., Fan, S. J., and Zeng, L. M.: Influences ofrelative humidity and particle chemical composition on aerosolscattering properties during the 2006 PRD campaign, Atmos. En-viron., 42, 1525–1536, 2008.
Liu, X. G., Zhang, Y. H., Jung, J. S., Gu, J. W., Li, Y. P.,Guo, S., Chang, S.-Y., Yue, D., Lin, P., Kim, Y. J., Hu,M., Zeng, L. M., and Zhu, T.: Research on Aerosol Hy-groscopic Properties by Measurement and Model during the2006 CARE Beijing Campaign, J. Geophys. Res., 114, D00G16,doi:10.1029/2008JD010805, 2009.
Liu, X. G., Zhang, Y. H., Wen, M. T., Wang, J. L., Jung, J. S., Chang,S.-Y., Hu, M., Zeng, L. M., and Kim, Y. J.: A Closure Study ofAerosol Hygroscopic Growth Factor during the 2006 PRD Cam-paign, Adv. Atmos. Sci., 27, 947–956,doi:10.1007/s00376-009-9150-z, 2010.
Malm, W. C. and Day, D. E.: Estimates of aerosol species scatteringcharacteristics as a function of relative humidity, Atmos. Envi-ron., 35, 2845-02860, 2001.
Malm, W. C. and Hand, J. L.: An examination of the physical andoptical properties of aerosols collected in the IMPROVE pro-gram, Atmos. Environ., 41, 3407–3427, 2007.
McNulty, R. P.: The effect of air pollutants on visibility in fog andhaze at New York city, Atmos. Environ., 2, 625–628, 1968.
Melfi, S. H., Spinhirne, J. D., Chou, S. H., and Palm, S. P.: Li-dar observation of vertically organized convection in the plan-etary boundary layer over the ocean, J. Appl. Meteorol. Clim.,24, 806–821, 1985.
Mukherjee, P. and Viswanathan S.: Contributions to CO concentra-tions from biomass burning and traffic during haze episodes inSingapore, Atmos. Environ., 35, 715–725, 2001.
Petzold, A. and Schonlinner, M.:, Multi-angle absorption photome-try – a new method for the measurement of aerosol light absorp-
www.atmos-chem-phys.net/13/4501/2013/ Atmos. Chem. Phys., 13, 4501–4514, 2013

4514 X. G. Liu et al.: Formation and evolution mechanism of regional haze: a case study in Beijing, China
tion and atmospheric black carbon, J. Aerosol Sci., 35, 421–441,2004.
Quinn, P. K. and Bates, T.: North American, Asian, and Indian haze:Similar regional impacts on climate?, Geophys. Res. Lett., 30,1555,doi:10.1029/2003GL016934, 2003.
Quinn, P. K., Coffman, D. J., Bates, T. S., Miller, T. L., John-son, J. E., Welton, E. J., Neususs, C., Miller, M., and Sheridan,P. J.: Aerosol optical properties during INDOEX 1999: Means,variability, and controlling factors. J. Geophys. Res., 107, 8020,doi:10.1029/2000JD000037, 2002.
Russell, L. M., Mensah, A. A., Fischer, E. V., Sive, B. C., Varner,R. K., Keene, W. C., Stutz, J., and Pszenny, A. A. P.: Nanopar-ticle growth following photochemicalα- and β-pinene oxida-tion at Appledore Island during International Consortium forResearch on Transport and Transformation/Chemistry of Halo-gens at the Isles of Shoals 2004, J. Geophys. Res., 112, D10S21,doi:10.1029/2006JD007736, 2007.
Schichtel, B. A., Husar, R. B., Falke, S. R., and Wilson, W. E.: Hazetrends over the United States, 1980–1995, Atmos. Environ., 35,5205–5210, 2001.
Seinfeld, J. H. and Pandis, S. N.: Atmospheric Chemistry andPhysics: from Air Pollution to Climate Change, 2nd Edn., JohnWiley & Sons, Inc., New York, USA, 2006.
Strawbridge, K. B. and Snyder, B. J.: Planetary boundary layerheight determination during Pacific 2001 using the advantageof a scanning lidar instrument, Atmos. Environ., 38, 5861–5871,2004.
Sugimoto, N., Nishizawa, T., Liu, X. G., Matsui, I., Shimizu, A.,Zhang, Y. H., Kim, Y. J., Li, R. H., and Liu, J.: Continuous obser-vations of aerosol profiles with a two-wavelength Mie-scatteringlidar in Guangzhou in PRD2006, J. Appl. Meteorol. Clim., 48,1822–1830, 2009.
Sun, Y. L., Zhuang, G. S., Wang, Y., Han, L. H., Guo, J. H., Dan,M., Zhang, W. J., Wang, Z. F., and Hao, Z. P.: The air-borneparticulate pollution in Beijing-Concentration, composition, dis-tribution and sources, Atmos. Environ., 38, 5991–6004, 2004.
Sun, Y. L., Zhuang, G. S., Tang, A. H., Wang, Y., and An, Z.S.: Chemical characteristics of PM2.5 and PM10 in haze-fogEpisodes in Beijing, Environ. Sci. Technol., 40, 3148–3155,2006.
Tang, I. N.: Chemical and size effects of hygroscopic aerosolson light scattering coefficients, J. Geophys. Res., 101, 19245–19250, 1996.
Tie, X. X., Wu, D., and Brasseur, G.: Lung cancer mortality andexposure to atmospheric aerosol particles in Guangzhou, China,Atmos. Environ., 43, 2375–2377, 2009.
Wang, Y., Zhuang, G. S., Sun, Y. L., and An, Z. S.: The variationof characteristics and formation mechanisms of aerosols in dust,haze, and clear days in Beijing, Atmos. Environ., 40, 6579–6591,2006.
Wu, D., Tie, X., Li, C., Ying, Z., Lau, A. K.-H., Huang, J., Deng, X.,and Bi, X.: An extremely low visibility event over the Guangzhouregion: a case study, Atmos. Environ., 39, 6568–6577, 2005.
Wu, D., Bi, X., Deng, X., Li, F., Tan, H., Liao, G., and Huang, J.:Effects of atmospheric haze on the deterioration of visibility overthe Pearl River Delta, Acta Meteorol. Sin., 64, 510–517, 2006.
Xiao, F., Brajer, V., and Mead, R. W.: Blowing in the wind: theimpact of China’s Pearl River Delta on Hong Kong’s air quality,Sci. Total Environ., 367, 96–111, 2006.
Yadav, A. K., Kumar, K., Kasim, A., Singh, M. P., Parida, S. K.,and Sharan, M.: Visibility and incidence of respiratory diseasesduring the 1998 haze episode in Brunei Darussalam, Pure Appl.Geophys., 160, 265–277, 2003.
Yang, D. P.: Crisis and turning of China’s environment, Social Sci-ences Academic Press, 156–160, 2008.
Zhang, Y. H., Hu, M., Zhong, L. J., Wiedensohler, A., Liu, S. C.,Andreae, M. O., Wang, W., and Fan, S. J.: Regional integratedexperiments on air quality over Pearl River Delta 2004 (PRIDE-PRD2004): Overview, Atmos. Environ., 42, 6157–6173, 2008.
Atmos. Chem. Phys., 13, 4501–4514, 2013 www.atmos-chem-phys.net/13/4501/2013/