formation of supported graphene oxide: evidence for ... of... · formation of supported graphene...
TRANSCRIPT

Formation of Supported Graphene Oxide: Evidence for EnolateSpeciesZbynek Novotny,†,⊥ Manh-Thuong Nguyen,† Falko P. Netzer,‡ Vassiliki-Alexandra Glezakou,†
Roger Rousseau,*,† and Zdenek Dohnalek*,†,§
†Fundamental and Computational Sciences Directorate and Institute for Integrated Catalysis, Pacific Northwest National Laboratory,P.O. Box 999, Richland, Washington 99352, United States‡Surface and Interface Physics, Institute of Physics, Karl-Franzens University, A-8010 Graz, Austria§Voiland School of Chemical Engineering and Bioengineering, Washington State University, Pullman, Washington 99163, UnitedStates
*S Supporting Information
ABSTRACT: Graphene oxides are promising materials fornovel electronic devices or anchoring of the active sites forcatalytic applications. Here we focus on understanding theatomic oxygen (AO) binding and mobility on different regions ofgraphene (Gr) on Ru(0001). Differences in the Gr/Ru latticesresult in the superstructure, which offers an array of distinctadsorption sites. We employ scanning tunneling microscopy anddensity functional theory to map out the chemical identity andstability of prepared AO functionalities in different Gr regions.The AO diffusion is utilized to establish that in the regions thatare close to the metal substrate the terminally bonded enolate groups are strongly preferred over bridge-bonded epoxy groups.No oxygen species are observed on the graphene regions that are far from the underlying Ru, indicating their low relativestability. This study provides a clear fundamental basis for understanding the local structural, electronic factors and C−Ru bondstrengthening/weakening processes that affect the stability of enolate and epoxy species.
■ INTRODUCTION
The engineering of the electronic band structure via dopingwith atomic or molecular adsorbates,1−4 essential for the use ofgraphene in novel electronic devices, and the tuning of thechemical reactivity by the incorporation of active chemicalgroups for catalytic applications5−8 are examples of the versatileways modified graphene can be employed in novel applications.The functionalization of graphene with oxygen, previouslydescribed as graphene oxide (GO),9 has been of particularinterest. GO was first synthesized from graphite by exfoliatingthe individual graphene sheets by Brodie10 in 1859, and theprocedure was later modified by Hummers11 and is still usedtoday.12 With modified Hummer’s method, it is possible tosynthesize large-scale GO membranes with a very high degreeof oxidation and a broad range of oxygen-containing functionalgroups.13 Membranes of GO produced in such a way showunique properties: while they are impermeable to liquids,vapors, and gases, including helium, they can be readilypenetrated by water,14 and very recently GO has been used topurify seawater into drinking water.15 To control covalentfunctionalization of such GO membranes, selective oxidation ofboth graphene edges and basal planes and selective etching ofGO to create edges and nanopores with unique physical andchemical properties are actively pursued.16 It is generally agreedthat the chemical oxidation of graphite forms epoxide and
hydroxyl groups located on the basal plane, while carbonyl andcarboxyl groups are present at the edges.5,6,17−19 While theabove-mentioned functional groups are most common, otherfunctionalities such as ether, lactone, or ketone groups nearcarbon vacancies were reported in studies concerning grapheneetching using oxygen plasma or ozone.20 The chemistry ofgraphene is also strongly influenced by defects in the graphenefilms, as demonstrated for example for graphene zigzag edgesand Stone−Wales defects, where nitrogen dopants wereidentified as active sites for oxygen reduction reaction.21,22 Inheterogeneous catalysis, such oxygen-containing functionalgroups on graphitic carbon, graphene, and carbon nanotubeshave been used as anchoring sites for catalytically activeparticles.23−27 Since the functionalities of GO all contain thecarbon−oxygen bonds as a major structural element, under-standing their character is of fundamental importance for theproperties of GO-related materials.To date, the interaction of atomic oxygen with graphene has
been studied mainly by theoretical means with the focus on thefree-standing layer, and it is generally accepted that atomicoxygen forms a bridge-bonded (epoxy) configuration on defect-free basal sites of graphene.18,28−30 For graphene supported on
Received: December 6, 2017Published: February 5, 2018
Article
pubs.acs.org/JACSCite This: J. Am. Chem. Soc. 2018, 140, 5102−5109
© 2018 American Chemical Society 5102 DOI: 10.1021/jacs.7b12791J. Am. Chem. Soc. 2018, 140, 5102−5109
Dow
nloa
ded
via
PAC
IFIC
NO
RT
HW
EST
NA
TL
LA
BO
RA
TO
RY
on
Dec
embe
r 24
, 201
8 at
18:
57:5
5 (U
TC
).
See
http
s://p
ubs.
acs.
org/
shar
ingg
uide
lines
for
opt
ions
on
how
to le
gitim
atel
y sh
are
publ
ishe
d ar
ticle
s.

solid substrates, the situation is less clear and controversial. Onone hand, density functional theory (DFT) calculationspredicted that oxygen in a terminal, on-top carbon bondedconfiguration (enolate functional group) is more stable than abridge-bonded (epoxy group) for single layer graphene (Gr) onthe (111) surfaces of Cu and Ni, but no experimental studiesexist to verify this prediction.31 On the other hand, theexperimental studies on Gr on 6H-SiC(0001),32,33 Gr/Ir(111),34 and Gr/Pt(111)34 reported the formation ofbridge-bonded epoxy functional groups, but the possibility ofthe on-top bonded enolate configuration was not considered.Here, we employ scanning tunneling microscopy (STM) and
provide a direct real-space mapping of atomic oxygen (AO)species binding and stability in different regions of single-layerGr (simply Gr from here on) supported on Ru(0001). Onlydefect-free regions are selected in the analysis to allow for adirect comparison with the accompanying theoretical studies. Acomplex behavior caused by an interplay of the registry anddistance between the Gr lattice and the underlying Ru(0001)surface atoms is observed. The experimental and theoreticalevidence clearly demonstrates that in the Gr regions that areclose to the metal substrate the terminally bonded enolategroups are strongly preferred over bridge-bonded configuration.No AO species are observed on the Gr regions that are far fromthe underlying Ru, indicating their low relative stability. TheDFT calculations further conclude that in these regions theterminal-bonded enolate AO species are also preferred but areclose in energy to the epoxy configuration. This study providesa clear fundamental basis for understanding the structural and
electronic factors that affect the stability of both configurationsin different Gr regions.
■ METHODSExperimental Details. The Ru(0001) single crystal was cleaned
using cycles of Ne+ sputtering and annealing in O2 at 850 K, followedby flash-annealing in ultrahigh vacuum (UHV) to 1600 K in the sameexperimental setup as described previously.35 Partial Gr layers (∼50%of surface covered with Gr flakes) were grown by chemical vapordeposition at 1100 K using toluene (C7H8) and decane (C10H22) ascarbon precursors. The partial Gr layers were chosen because it wasfound that the apex of the STM tip was easier to modify to give goodperformance on the metal-covered areas than on Gr-covered areas.Moreover, the edges of Gr were used as reference points for thermaldrift compensation during the acquisition of time-lapsed STM moviesat elevated temperatures. Atomic oxygen was produced with acommercial thermal gas cracker (Mantis Ltd.) directly attached to avariable-temperature STM (Omicron). The cracker was operated at acracking power of 75 W with 1 × 10⁻⁸ Torr O2 background pressure.The STM tip was retracted several nanometers from the surface duringthe dose. Both STM heating stage and thermal gas cracker wereoutgassed for 100+ h prior to the experiments to minimizecontamination during the operation and was left running overnightprior the oxygen deposition. The atomic oxygen source was furthertested on a bare Ru(0001) surface, where a well-defined (1 × 1)-O/Ru(0001) overlayer was prepared. As shown previously, only a (2 ×1)-O/Ru(0001) overlayer can be prepared by dosing molecular O2,and atomic oxygen is required to reach the (1 × 1)-O/Ru(0001)overlayer.36 Oxygen coverage in monolayers (ML) on Gr is definedrelative to the surface density of carbon atoms (1 ML ≡ 3.71 × 10¹⁵
atoms/cm2). Processing of the STM images, acquired with resolutionof 512 pixels per line, included background subtraction, noise removal
Figure 1. (a) STM image of the Gr flake on Ru(0001) obtained at 450 K before dosing atomic oxygen. The hexagonal overlay illustrates thegraphene lattice that was superimposed using the current model for this surface using the Mound regions as a reference.47 (b) High-magnificationatomically resolved STM image of bare Gr, indicating a large 25 over 23 coincidence unit cell46,47 highlighted by thick white lines. The unit cell isfurther divided into four regions that can be described by a simplified 12 over 11 model,48 (thin white lines). (b, c) Three distinct areas can bedistinguished within each region: Mound, FCC, and HCP. (d) Image of the same area as in (a) after dosing 0.002 monolayers of atomic oxygen at450 K. Dark AO-related features are observed primarily in FCC regions (dark-blue circles), with a minority of features also found in HCP regions(brown circles). (e) Zoom-in STM image of an area with four AO features, without and with the Gr lattice overlay highlighting the AO features inthe FCC regions and their size with respect to the density of C atoms in the Gr lattice. In the latter case, the Gr lattice was aligned to be consistentwith the interpretation put forward in this study. Images a, d, and e were acquired at 450 K (Vs = +200 mV, It = 100 pA) and image b at 300 K (Vs =+4.6 mV, It = 1 nA). The color coding of the atoms in (c): C, dark gray; surface Ru, light gray; second layer Ru, blue; third layer Ru, white.
Journal of the American Chemical Society Article
DOI: 10.1021/jacs.7b12791J. Am. Chem. Soc. 2018, 140, 5102−5109
5103

from frequency domain images, and linear and nonlinear distortionremoval using algorithms described in ref 37.Theoretical Calculations. All computations were conducted with
the CP2K package.38 First-principles calculations were carried outusing the PBE-D3 density functional,39,40 the GTH pseudopoten-tials,41 and the GPW hybrid basis set scheme42 in which the MOLOPTdouble-ζ Gaussian basis sets43 were employed to expand the valenceelectron states and 400 Ry cutoff for computing the electrostatic terms.The electrostatic potential along the surface normal direction wastreated by the Martyna−Tuckerman approach.44 We adopted thesystem of (12 × 11) graphene/Ru(0001) periodicity with the Rusurface consisting of four atomic layers, of which the bottom two werefixed in all geometry optimizations. Because of the large surface unitcell vector sizes (∼30.2 Å), which is 11 times the primitive cell vectorof the Ru(0001) surface, only the Γ-point in the Brillouin zone wassampled in the self-consistent calculations.
■ RESULTS AND DISCUSSION
The appearance of the bare Gr monolayer on Ru(0001) beforethe oxidation is illustrated in the STM images shown in Figure1a,b. The typical Moire superstructure characteristic of thesingle Gr layer supported on Ru(0001) substrate can be readilyrecognized. Small bare Ru regions covered with carbon can bealso seen in the top- and bottom-left corners of the image inFigure 1a. These regions are a result of the intentionallyincomplete Gr overlayer45 that help us locate the same areabefore and after the oxidation and reliably prepare the STM tip.The high magnification, atomically resolved image in Figure 1bshows the (25 × 25) Gr Moire supercell. This (25 × 25)supercell is commensurate with (23 × 23) unit cells of theunderlying Ru(0001).46,47 This large Gr supercell can befurther divided into four similar (12.5 × 11.5) regions that canbe approximated by a slightly simplified (12 × 11) model that isschematically depicted in Figure 1c.48 This model issubsequently used in our DFT calculations.36 Within each ofthe regions, three distinct areas with different height above theRu(0001) surface can be identified: The Mound region(brightest, largest separation) at 3.0 Å and the FCC (mediumbright) and the HCP (darkest) regions both at approximately2.2 Å (see Supporting Information Figure S1 for additionalcomputational details).
Figure 1d shows the same area as in Figure 1a, after dosingAO at 450 K. Following the dose, a number (0.002monolayers) of new dark round features with ∼3 Å full widthat half-maximum diameter are observed. These dark featuresare preferentially found within the FCC region (77%) of the GrMoire cell (highlighted with dark-blue circles in Figure 1d),although a smaller number (23%) is also observed within theHCP regions (brown circles, Figure 1d) after dosing AO at 450K. This difference in stability suggests an energy difference onthe order of ∼0.05 eV between the two sites. No AO-relatedfeatures are observed in the Mound regions. It is important tonote that the dark depressions of variable size on some of theMound regions are unrelated to AO and have also beenobserved previously on bare Gr.48 In that study, the authorsattributed the donut-like appearance of the mound regions toelectronic effects. The complete Gr layer exhibited identicalbehavior, and the AO dose-dependent experiments showedonly a linear increase in the AO coverage (see Figure S2).Depending on the tip termination, the AO features appearbright in ∼50% of the acquired images relative to thesurrounding Gr substrate. To avoid confusion, we presentonly the subset where these features appear dark. The samearea images with the dark and bright appearances of the AOspecies are shown in Figure S3.We further focus on determining the chemical identity of the
AO species in both FCC and HCP regions. Two possibilitieshave been previously considered theoretically in the literature:the bridge-bonded, epoxy-like species bound to two neighbor-ing carbons and the terminal; enolate-like species bound on topto a single carbon.31 It should be noted (Figure 1c) that theneighboring carbon atoms in the FCC and HCP regions arenot equivalent due to their different coordination by theunderlying metal atoms at the interface. As illustrated in thehigh magnification image in Figure 1e, the AO features arerelatively large (∼4 Å), and they do not change withtemperature (114−500 K). This large size prevents us fromreliably making an accurate assignment of their position, i.e.,on-top vs in-between carbon atoms, and consequently of theirchemical identity.To determine the AO binding, we take advantage of their
motion at elevated temperatures. The AO species became
Figure 2. (a) The image shows the first frame from the time-lapsed STM movie (Supporting Information) obtained after dosing a small amount ofAO at 500 K. A set of AO trajectories highlighted with blue (FCC region) and orange (HCP region) traces obtained from the STM movie over theperiod of 3 h (68 frames). Imaging conditions: Vs = +200 mV, It = 100 pA. (b) Possible directions and lengths of single (top) and double (bottom)hops of AO in bridge-bonded epoxy (red arrows) and terminal enolate (green arrows) configurations on Gr monolayer.
Journal of the American Chemical Society Article
DOI: 10.1021/jacs.7b12791J. Am. Chem. Soc. 2018, 140, 5102−5109
5104

mobile above 400 K, and an example of the AO diffusiontrajectories at 500 K is shown in Figure 2a. (The completeSTM movie can be found in the Supporting Information.) Themajority AO species in the FCC regions (blue trajectories)exhibit a tightly confined motion, indicating that these regionsrepresent local minima for the AOs. In contrast, the minorityAO species observed in the HCP regions (orange) diffuse overlonger distances and ultimately end up in the more stable FCCregions. The orange trajectory in the middle of the Gr flakeshows one example where the AO species crossed from oneFFC region over the HCP region to another FCC region. Thedetails of the AO diffusion analysis are presented in section S4of the Supporting Information.To resolve the AO binding configuration, we utilize the
directionality of the AO motion. The conceptual nature of thisanalysis is summarized in Figure 2b. Two binding scenarios arepossible: the AO adsorbed in a bridge-bonded (epoxy)configuration and the terminal, on-top carbon-bonded(enolate) configuration. Assuming that one of the twoconfigurations is preferred, as shown by DFT below, diffusivehopping between the same adsorption sites is expected.For single hops, (Figure 2b, upper part), there are three
symmetrically inequivalent positions for the bridge-bonded AO(red arrows). On the other hand, for terminal AO configuration(green arrows in Figure 2b), only two neighboring carbonatoms offer symmetrically inequivalent directions for singlehops. Consequently, on average bridge-bonded and terminalAO species should diffuse in directions with azimuths ofmultiples of 60°, but offset by 30° as shown in the upper panelof Figure 2b. The lengths of the hops are 1.23 and 1.42 Å forbridge and terminally bonded AO, respectively. The azimuthangles of AO jumps between consecutive STM images can beeasily related to the position of two neighboring moundregions, with 0° azimuth being parallel with a line connectingtwo nearest-neighbor mound regions along a selected direction(see section S4 for details).The same analysis can be extended to double hops (Figure
2b, lower panel). For bridge-bonded AO diffusion, there arethree symmetrically inequivalent directions (red arrows),
resulting in hops with azimuths of multiples of 30°. For theterminal AO, all carbon atoms are equivalent in terms ofpossible azimuths of double hops, and multiples of 60° areexpected (green arrows). The lengths of the double hops are2.13 and 2.46 Å for bridge-bonded AO and 2.46 Å forterminally bonded AO. The large difference in distancesbetween single and double hops allows us to easily distinguishthem apart as illustrated in section S4. The evaluation of longer(triple and quadruple) hops is more complex as the range ofpossible distances is larger. Nonetheless, by selecting relativelylow temperatures (<500 K) for the analysis, their contributionis fairly small.As demonstrated above, both single and double AO hops
should allow us to determine the nature of the AO binding inboth FCC and HCP regions. To this end, we have performed anumber of experiments between 425 and 500 K and analyzedthe diffusion distances and azimuths of the AO species asshown in Figure 3. To our initial surprise, the analysispresented in Figure 3a revealed that at all temperatures thesingle hops are highly unfavorable compared to double hops.Similarly, the fraction of quadruple hops is larger than thefraction of triple hops. As shown in DFT calculations presentedbelow, the absence of the single hops is only consistent withterminal binding of the enolate species (but not the epoxy).Further independent experimental evidence for the terminal
binding of the AO species comes from the analysis of theazimuths of the double hops in Figure 3b. The results from 266events obtained at a single temperature of 500 K are plotted asa fraction within the FCC and HCP regions of the Gr Moire.The analysis shows that the vast majority of double hops (94%)follows the azimuths separated by 60° (green) both within theFCC and HCP regions. As outlined in the discussion of Figure2b, this scenario is only consistent with terminal binding(enolate) of the AO species in both regions. The fact that theprobabilities along all 60° spaced azimuths (green) are identical(within the error of the experiment) also demonstrates thatdiffusion is not affected by the tip scanning direction. A smallfraction, 6%, of the double hop events (shown in red) areobserved in the directions that are offset from the green
Figure 3. Hoping rate analysis of the AO species obtained from the time-lapsed STM images acquired in the 425−500 K range. (a) Fraction of hops(∼6800 events) observed between consecutive images (acquired 160 s apart) at different temperatures. (b) Distribution of the double hop directionswithin the FCC region (upper part) and HCP region (lower part) of the Gr Moire at 500 K. In the double hop analysis (266 events) we includedevents where the AO moved a distance within the 2.0−2.6 Å range. The analyzed distance range includes both epoxy and enolate diffusion scenarios(see Figure 2b, bottom), but the diffusion directions are convincing: green bars correspond to 60° spaced azimuths expected for enolate species; redbars include additional directions that would have to be equally present if AOs binds as epoxy species.
Journal of the American Chemical Society Article
DOI: 10.1021/jacs.7b12791J. Am. Chem. Soc. 2018, 140, 5102−5109
5105
azimuths by 30°. While these azimuths could, in principle, beassigned to a small fraction of epoxy double hops, the collectiveevidence presented in this study strongly suggests that these aresimply errors in the analysis, i.e., inaccurate distance measure-ments due to small thermal drift in the images. The details ofthe hopping distance and direction analysis are presented insection S4.While Figure 3 clearly demonstrates the dominant
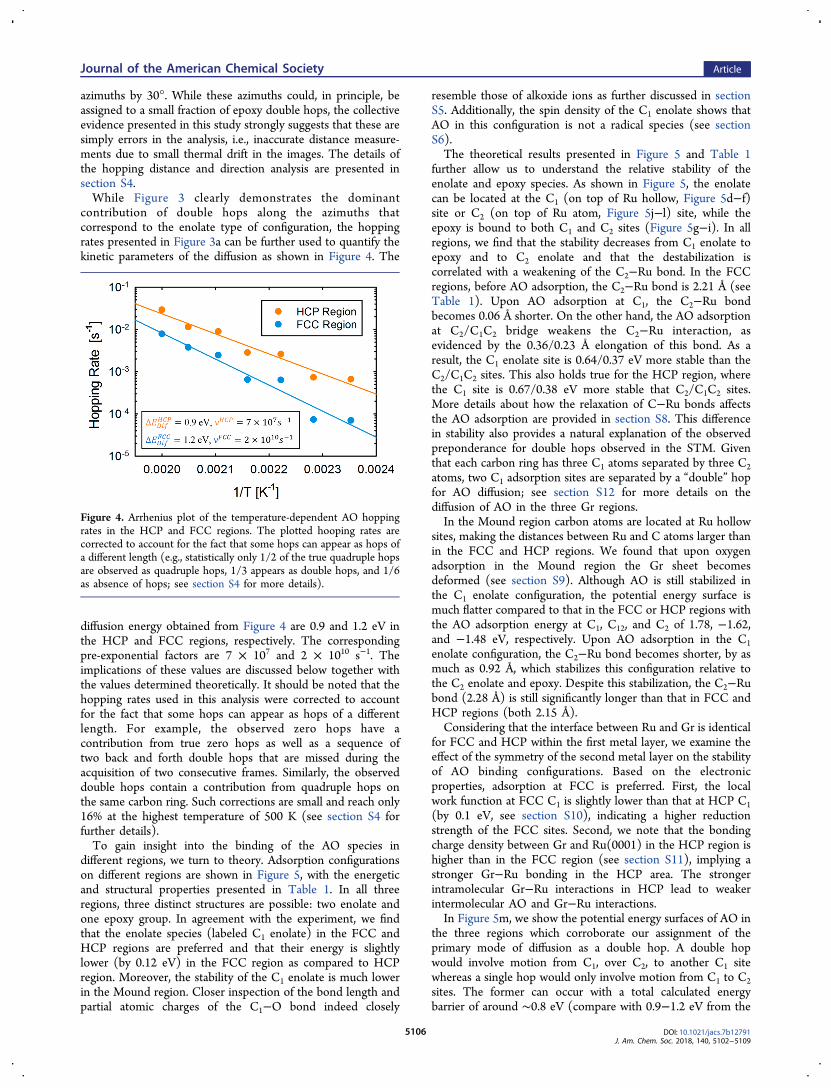
contribution of double hops along the azimuths thatcorrespond to the enolate type of configuration, the hoppingrates presented in Figure 3a can be further used to quantify thekinetic parameters of the diffusion as shown in Figure 4. The
diffusion energy obtained from Figure 4 are 0.9 and 1.2 eV inthe HCP and FCC regions, respectively. The correspondingpre-exponential factors are 7 × 10⁷ and 2 × 10¹⁰ s−1. Theimplications of these values are discussed below together withthe values determined theoretically. It should be noted that thehopping rates used in this analysis were corrected to accountfor the fact that some hops can appear as hops of a differentlength. For example, the observed zero hops have acontribution from true zero hops as well as a sequence oftwo back and forth double hops that are missed during theacquisition of two consecutive frames. Similarly, the observeddouble hops contain a contribution from quadruple hops onthe same carbon ring. Such corrections are small and reach only16% at the highest temperature of 500 K (see section S4 forfurther details).To gain insight into the binding of the AO species in
different regions, we turn to theory. Adsorption configurationson different regions are shown in Figure 5, with the energeticand structural properties presented in Table 1. In all threeregions, three distinct structures are possible: two enolate andone epoxy group. In agreement with the experiment, we findthat the enolate species (labeled C1 enolate) in the FCC andHCP regions are preferred and that their energy is slightlylower (by 0.12 eV) in the FCC region as compared to HCPregion. Moreover, the stability of the C1 enolate is much lowerin the Mound region. Closer inspection of the bond length andpartial atomic charges of the C1−O bond indeed closely
resemble those of alkoxide ions as further discussed in sectionS5. Additionally, the spin density of the C1 enolate shows thatAO in this configuration is not a radical species (see sectionS6).The theoretical results presented in Figure 5 and Table 1
further allow us to understand the relative stability of theenolate and epoxy species. As shown in Figure 5, the enolatecan be located at the C1 (on top of Ru hollow, Figure 5d−f)site or C2 (on top of Ru atom, Figure 5j−l) site, while theepoxy is bound to both C1 and C2 sites (Figure 5g−i). In allregions, we find that the stability decreases from C1 enolate toepoxy and to C2 enolate and that the destabilization iscorrelated with a weakening of the C2−Ru bond. In the FCCregions, before AO adsorption, the C2−Ru bond is 2.21 Å (seeTable 1). Upon AO adsorption at C1, the C2−Ru bondbecomes 0.06 Å shorter. On the other hand, the AO adsorptionat C2/C1C2 bridge weakens the C2−Ru interaction, asevidenced by the 0.36/0.23 Å elongation of this bond. As aresult, the C1 enolate site is 0.64/0.37 eV more stable than theC2/C1C2 sites. This also holds true for the HCP region, wherethe C1 site is 0.67/0.38 eV more stable that C2/C1C2 sites.More details about how the relaxation of C−Ru bonds affectsthe AO adsorption are provided in section S8. This differencein stability also provides a natural explanation of the observedpreponderance for double hops observed in the STM. Giventhat each carbon ring has three C1 atoms separated by three C2atoms, two C1 adsorption sites are separated by a “double” hopfor AO diffusion; see section S12 for more details on thediffusion of AO in the three Gr regions.In the Mound region carbon atoms are located at Ru hollow
sites, making the distances between Ru and C atoms larger thanin the FCC and HCP regions. We found that upon oxygenadsorption in the Mound region the Gr sheet becomesdeformed (see section S9). Although AO is still stabilized inthe C1 enolate configuration, the potential energy surface ismuch flatter compared to that in the FCC or HCP regions withthe AO adsorption energy at C1, C12, and C2 of 1.78, −1.62,and −1.48 eV, respectively. Upon AO adsorption in the C1enolate configuration, the C2−Ru bond becomes shorter, by asmuch as 0.92 Å, which stabilizes this configuration relative tothe C2 enolate and epoxy. Despite this stabilization, the C2−Rubond (2.28 Å) is still significantly longer than that in FCC andHCP regions (both 2.15 Å).Considering that the interface between Ru and Gr is identical
for FCC and HCP within the first metal layer, we examine theeffect of the symmetry of the second metal layer on the stabilityof AO binding configurations. Based on the electronicproperties, adsorption at FCC is preferred. First, the localwork function at FCC C1 is slightly lower than that at HCP C1(by 0.1 eV, see section S10), indicating a higher reductionstrength of the FCC sites. Second, we note that the bondingcharge density between Gr and Ru(0001) in the HCP region ishigher than in the FCC region (see section S11), implying astronger Gr−Ru bonding in the HCP area. The strongerintramolecular Gr−Ru interactions in HCP lead to weakerintermolecular AO and Gr−Ru interactions.In Figure 5m, we show the potential energy surfaces of AO in
the three regions which corroborate our assignment of theprimary mode of diffusion as a double hop. A double hopwould involve motion from C1, over C2, to another C1 sitewhereas a single hop would only involve motion from C1 to C2sites. The former can occur with a total calculated energybarrier of around ∼0.8 eV (compare with 0.9−1.2 eV from the
Figure 4. Arrhenius plot of the temperature-dependent AO hoppingrates in the HCP and FCC regions. The plotted hooping rates arecorrected to account for the fact that some hops can appear as hops ofa different length (e.g., statistically only 1/2 of the true quadruple hopsare observed as quadruple hops, 1/3 appears as double hops, and 1/6as absence of hops; see section S4 for more details).
Journal of the American Chemical Society Article
DOI: 10.1021/jacs.7b12791J. Am. Chem. Soc. 2018, 140, 5102−5109
5106

experimental data in Figure 4) and is hence facile. Conversely, asingle hop would have a similar energy, but for those sitesadjacent to the HCP/FCC region it would be uphill in energyby ca. 0.64 eV and thus be improbable by a Boltzmann factor ofexp[−0.64/kBT] ∼ 10−10.Finally, we discuss the lack of AO in the Mound regions.
Upon dosing, AO will hit all three regions of the Moire structure. However, no AO is observed in the Mound region,implying that after landing on this region AO has to diffuse tothe FCC or HCP regions. This supposition is supported by thesmall energy difference between different binding configu-rations in the Mound region and a low diffusion barrier of 0.3eV, as shown in Table 1 and Figure 5.
■ CONCLUSIONS
In this work, we mapped out the stability of atomic oxygen(AO) species within different regions of metal−supportedgraphene (Gr). We provide experimental and theoretical proofof the existence of terminally bonded enolate functional groupsfor Gr supported on Ru(0001). The bridge-bonded epoxyspecies that represent the preferred binding motif on free-standing Gr and on graphite are found to be significantly lessstable. DFT calculations highlight the importance of metal−graphene interactions and their critical role in stabilizing atomicoxygen. This implies that the local chemistry of anchor groups,such as oxygen, can be controlled by a templating effect of theunderlying graphene substrate. We have demonstrated that thepreferred enolate binding sites are periodic in nature with ∼3nm separation. Such preferential binding can be possibly
Figure 5. Side views of the DFT structures of graphene on Ru(0001) along the [1,1] direction before and after AO adsorption. In each region,oxygen was adsorbed at the C1 site (d−f), C1C2 bridge site (g−i), and C2 site (j−l). The adsorption energies (eV) are referenced to the bare Gr and3O atom in the gas phase. (m) The potential energy surfaces in the corresponding regions; see section S11 for details of energy barrier calculations.
Table 1. Adsorption Energy, ΔEa (eV), and Bond Lengths (Å) for Gr on Ru(0001) before and after AO Adsorptiona
FCC HCP Mound
C1−C2 C2−Ru C1/2−O ΔEa C1−C2 C2−Ru C1/2−O ΔEa C1−C2 C2−Ru C1/2−O ΔEabare Gr 1.47 2.21 1.47 2.21 1.43 3.20C1 enolate O−C1 1.54 2.15 1.29 −2.28 1.55 2.15 1.30 −2.16 1.54 2.28 1.30 −1.78epoxy C1−O−C2 1.48 2.44 1.44/1.48 −1.91 1.50 2.43 1.44/1.49 −1.78 1.47 2.71 1.43/1.48 −1.62C2 enolate O−C2 1.53 2.57 1.30 −1.64 1.54 2.56 1.30 −1.49 1.52 2.74 1.30 −1.48
aThe adsorption energies are referenced to the bare supported Gr and atomic 3O in the gas phase. For comparison, the adsorption energy of theepoxy oxygen on unsupported Gr is −1.83 eV (see section S7). See Supporting Information for the discussion of the accuracy of the calculations.
Journal of the American Chemical Society Article
DOI: 10.1021/jacs.7b12791J. Am. Chem. Soc. 2018, 140, 5102−5109
5107

utilized in the future for engineering of periodic arrays of well-defined electronic and catalytic materials. These principles openup the possibility of controlled synthesis of spatially uniformnanoparticle arrays on such redox-active surfaces.
■ ASSOCIATED CONTENT*S Supporting InformationThe Supporting Information is available free of charge on theACS Publications website at DOI: 10.1021/jacs.7b12791.
Section S1: details for DFT calculations for graphene onRu(0001); section S2: STM images of a single Gr flake asa function of increasing AO dose; section S3: STMimages of AO species with dark and bright appearance;section S4: hopping rate analysis; section S5: comparisonof the enolate species with CO bonds in alkoxidemolecules and ions; section S6: spin density of enolates;section S7: oxygen on unsupported graphene; section S8:adsorption of AO with fixed and relaxed Gr/Ru; sectionS9: atomic O adsorption in the Mound region; sectionS10: computation of the local electrostatic potential;section S11: bonding charge pattern induced by the Gr/Ru contact; section 12: diffusion of oxygen in FCC,HCP, and Mound regions; section 13: description of themovie showing AO diffusion at 500 K; section 14: DFTerrors (PDF)Movie showing AO diffusion at 500 K (AVI)
■ AUTHOR INFORMATIONCorresponding Authors*E-mail [email protected].*E-mail [email protected] P. Netzer: 0000-0001-5617-7225Vassiliki-Alexandra Glezakou: 0000-0001-6028-7021Roger Rousseau: 0000-0003-1947-0478Zdenek Dohnalek: 0000-0002-5999-7867Present Address⊥Z.N.: Department of Physics, University of Zurich, Winter-thurerstrasse 190, 8057 Zurich, Switzerland.Author ContributionsZ.N. performed experimental work and analysis of the data.Z.D. designed the experiments. Z.D. and F.N. guided the dataanalysis. M.T.N., V.A.G., and R.R. performed DFT simulations.The manuscript was written by all the authors.NotesThe authors declare no competing financial interest.
■ ACKNOWLEDGMENTSWe thank Michael Schmid for development of a custom ImageJmacros, Ryan T. Frederick for assistance during the acquisitionof small portion of the experimental data, Rentao Mu fornumerous discussions in the early stages of this project, andMarcella Iannuzzi for sharing DFT graphene/Ru(0001)structures. This work was supported by the US Departmentof Energy, Office of Basic Energy Sciences, Division ofChemical Sciences, Geosciences and Biosciences and per-formed in EMSL, a national scientific user facility sponsored bythe Department of Energy’s Office of Biological and Environ-mental Research and located at Pacific Northwest NationalLaboratory (PNNL). PNNL is a multiprogram nationallaboratory operated for DOE by Battelle. Computational
Resources were provided by a user proposal at the NERSCuser facility located at Lawrence Berkley National Laboratory,FPN acknowledges the award of an Alternate SponsoredFellowship at PNNL and financial support of the University ofGraz. The cover image was created by Cortland Johnson andVassiliki-Alexandra Glezakou, PNNL.
■ REFERENCES(1) Georgakilas, V.; Otyepka, M.; Bourlinos, A. B.; Chandra, V.; Kim,N.; Kemp, K. C.; Hobza, P.; Zboril, R.; Kim, K. S. Chem. Rev. 2012,112 (11), 6156−6214.(2) Singh, V.; Joung, D.; Zhai, L.; Das, S.; Khondaker, S. I.; Seal, S.Prog. Mater. Sci. 2011, 56 (8), 1178−1271.(3) Sreeprasad, T. S.; Berry, V. Small 2013, 9 (3), 341−350.(4) Wei, Z.; Wang, D.; Kim, S.; Kim, S.-Y.; Hu, Y.; Yakes, M. K.;Laracuente, A. R.; Dai, Z.; Marder, S. R.; Berger, C.; King, W. P.; deHeer, W. A.; Sheehan, P. E.; Riedo, E. Science 2010, 328 (5984),1373−1376.(5) Dreyer, D. R.; Park, S.; Bielawski, C. W.; Ruoff, R. S. Chem. Soc.Rev. 2010, 39 (1), 228−240.(6) Dreyer, D. R.; Todd, A. D.; Bielawski, C. W. Chem. Soc. Rev.2014, 43 (15), 5288−5301.(7) Deng, D. H.; Novoselov, K. S.; Fu, Q.; Zheng, N. F.; Tian, Z. Q.;Bao, X. H. Nat. Nanotechnol. 2016, 11 (3), 218−230.(8) Batzill, M. Surf. Sci. Rep. 2012, 67 (3−4), 83−115.(9) Zhu, Y.; Murali, S.; Cai, W.; Li, X.; Suk, J. W.; Potts, J. R.; Ruoff,R. S. Adv. Mater. 2010, 22 (35), 3906−3924.(10) Brodie, B. Philos. Trans. 1859, 149, 249.(11) Hummers, W. S.; Offeman, R. E. J. Am. Chem. Soc. 1958, 80 (6),1339−1339.(12) Marcano, D. C.; Kosynkin, D. V.; Berlin, J. M.; Sinitskii, A.; Sun,Z.; Slesarev, A.; Alemany, L. B.; Lu, W.; Tour, J. M. ACS Nano 2010, 4(8), 4806−4814.(13) Chen, C.-H.; Hu, S.; Shih, J.-F.; Yang, C.-Y.; Luo, Y.-W.; Jhang,R.-H.; Chiang, C.-M.; Hung, Y., Jr. Sci. Rep. 2017, 7 (1), 3908.(14) Nair, R. R.; Wu, H. A.; Jayaram, P. N.; Grigorieva, I. V.; Geim,A. K. Science 2012, 335 (6067), 442−444.(15) Abraham, J.; Vasu, K. S.; Williams, C. D.; Gopinadhan, K.; Su,Y.; Cherian, C. T.; Dix, J.; Prestat, E.; Haigh, S. J.; Grigorieva, I. V.;Carbone, P.; Geim, A. K.; Nair, R. R. Nat. Nanotechnol. 2017, 12 (6),546−550.(16) Kaplan, A.; Yuan, Z.; Benck, J. D.; Govind Rajan, A.; Chu, X. S.;Wang, Q. H.; Strano, M. S. Chem. Soc. Rev. 2017, 46 (15), 4530−4571.(17) Gao, W.; Alemany, L. B.; Ci, L.; Ajayan, P. M. Nat. Chem. 2009,1 (5), 403−408.(18) Gomez-Navarro, C.; Meyer, J. C.; Sundaram, R. S.; Chuvilin, A.;Kurasch, S.; Burghard, M.; Kern, K.; Kaiser, U. Nano Lett. 2010, 10(4), 1144−1148.(19) Lerf, A.; He, H.; Forster, M.; Klinowski, J. J. Phys. Chem. B 1998,102 (23), 4477−4482.(20) Koizumi, K.; Boero, M.; Shigeta, Y.; Oshiyama, A. J. Phys. Chem.Lett. 2013, 4 (10), 1592−1596.(21) Ikeda, T.; Boero, M.; Huang, S.-F.; Terakura, K.; Oshima, M.;Ozaki, J.-i. J. Phys. Chem. C 2008, 112 (38), 14706−14709.(22) Chai, G.-L.; Boero, M.; Hou, Z.; Terakura, K.; Cheng, W. ACSCatal. 2017, 7 (11), 7908−7916.(23) Kwak, J. H.; Kovarik, L.; Szanyi, J. ACS Catal. 2013, 3 (9),2094−2100.(24) Tasis, D.; Tagmatarchis, N.; Bianco, A.; Prato, M. Chem. Rev.2006, 106 (3), 1105−1136.(25) Sun, Y.-P.; Fu, K.; Lin, Y.; Huang, W. Acc. Chem. Res. 2002, 35(12), 1096−1104.(26) Kamat, P. V. J. Phys. Chem. Lett. 2010, 1 (2), 520−527.(27) Johns, J. E.; Alaboson, J. M. P.; Patwardhan, S.; Ryder, C. R.;Schatz, G. C.; Hersam, M. C. J. Am. Chem. Soc. 2013, 135 (48),18121−18125.(28) Zhou, S.; Bongiorno, A. Sci. Rep. 2013, 3 (1), 7.
Journal of the American Chemical Society Article
DOI: 10.1021/jacs.7b12791J. Am. Chem. Soc. 2018, 140, 5102−5109
5108
(29) Loh, K. P.; Bao, Q.; Eda, G.; Chhowalla, M. Nat. Chem. 2010, 2(12), 1015−1024.(30) Pandey, D.; Reifenberger, R.; Piner, R. Surf. Sci. 2008, 602 (9),1607−1613.(31) Jung, J.; Lim, H.; Oh, J.; Kim, Y. J. Am. Chem. Soc. 2014, 136(24), 8528−8531.(32) Hernandez, S. C.; Wheeler, V. D.; Osofsky, M. S.; Jernigan, G.G.; Nagareddy, V. K.; Nath, A.; Lock, E. H.; Nyakiti, L. O.; Myers-Ward, R. L.; Sridhara, K.; Horsfall, A. B.; Eddy, C. R., Jr.; Gaskill, D.K.; Walton, S. G. Surf. Coat. Technol. 2014, 241, 8−12.(33) Hossain, M. Z.; Johns, J. E.; Bevan, K. H.; Karmel, H. J.; Liang,Y. T.; Yoshimoto, S.; Mukai, K.; Koitaya, T.; Yoshinobu, J.; Kawai, M.;Lear, A. M.; Kesmodel, L. L.; Tait, S. L.; Hersam, M. C. Nat. Chem.2012, 4 (4), 305−309.(34) Vinogradov, N. A.; Schulte, K.; Ng, M. L.; Mikkelsen, A.;Lundgren, E.; Martensson, N.; Preobrajenski, A. B. J. Phys. Chem. C2011, 115 (19), 9568−9577.(35) Novotny, Z.; Netzer, F. P.; Dohnalek, Z. ACS Nano 2015, 9 (8),8617−8626.(36) Over, H. Chem. Rev. 2012, 112 (6), 3356−3426.(37) Choi, J. I. J.; Mayr-Schmolzer, W.; Mittendorfer, F.; Redinger, J.;Diebold, U.; Schmid, M. J. Phys.: Condens. Matter 2014, 26 (22),225003.(38) VandeVondele, J.; Krack, M.; Mohamed, F.; Parrinello, M.;Chassaing, T.; Hutter, J. Comput. Phys. Commun. 2005, 167 (2), 103−128.(39) Grimme, S.; Antony, J.; Ehrlich, S.; Krieg, H. J. Chem. Phys.2010, 132 (15), 154104.(40) Perdew, J.; Burke, K.; Ernzerhof, M. Phys. Rev. Lett. 1996, 77(18), 3865−3868.(41) Goedecker, S.; Teter, M.; Hutter, J. Phys. Rev. B: Condens. MatterMater. Phys. 1996, 54 (3), 1703−1710.(42) Lippert, G.; Hutter, J.; Parrinello, M. Mol. Phys. 1997, 92 (3),477−487.(43) VandeVondele, J.; Hutter, J. J. Chem. Phys. 2007, 127 (11),114105.(44) Martyna, G. J.; Tuckerman, M. E. J. Chem. Phys. 1999, 110 (6),2810−2821.(45) Loginova, E.; Bartelt, N. C.; Feibelman, P. J.; McCarty, K. F.New J. Phys. 2008, 10 (9), 093026.(46) Martoccia, D.; Willmott, P. R.; Brugger, T.; Bjorck, M.; Gunther,S.; Schleputz, C. M.; Cervellino, A.; Pauli, S. A.; Patterson, B. D.;Marchini, S.; Wintterlin, J.; Moritz, W.; Greber, T. Phys. Rev. Lett.2008, 101 (12), 126102.(47) Iannuzzi, M.; Kalichava, I.; Ma, H.; Leake, S. J.; Zhou, H.; Li, G.;Zhang, Y.; Bunk, O.; Gao, H.; Hutter, J.; Willmott, P. R.; Greber, T.Phys. Rev. B: Condens. Matter Mater. Phys. 2013, 88 (12), 125433.(48) Marchini, S.; Gunther, S.; Wintterlin, J. Phys. Rev. B: Condens.Matter Mater. Phys. 2007, 76 (7), 075429.
Journal of the American Chemical Society Article
DOI: 10.1021/jacs.7b12791J. Am. Chem. Soc. 2018, 140, 5102−5109
5109