forming a dynamic hypothesis: causal loop...
TRANSCRIPT
Forming a Dynamic Hypothesis: Causal Loop Diagrams
Todd BenDor Associate Professor Department of City and Regional Planning [email protected] 919-962-4760 Course Website: http://todd.bendor.org/datamatters
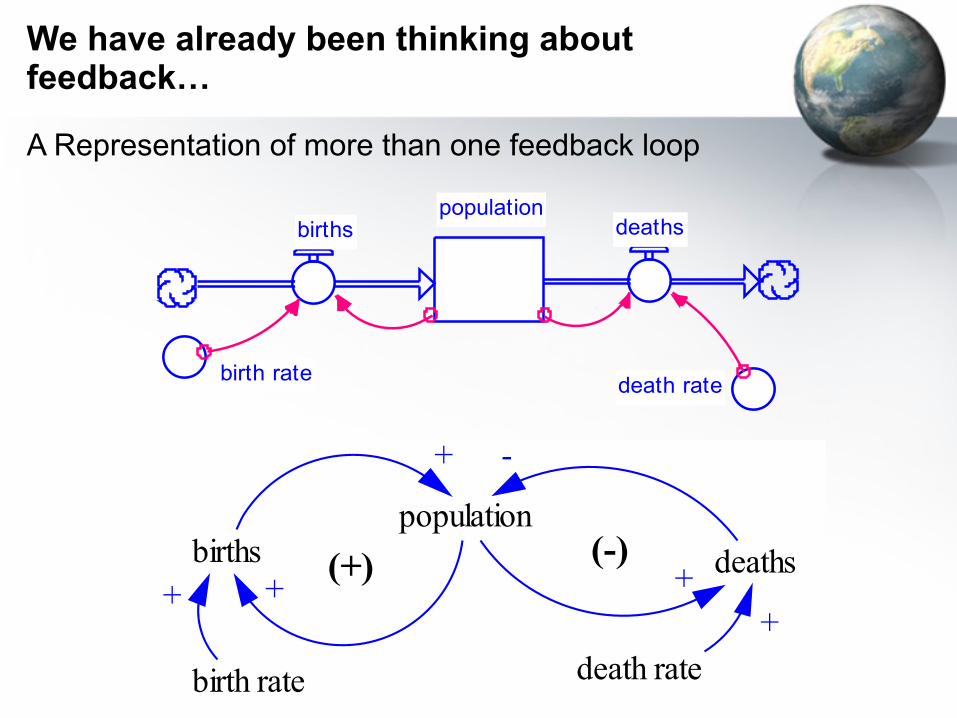
We have already been thinking about feedback…
populationbirths deaths
birth rate death rate
populationbirths
birth rate
deaths
death rate
+
++
-
++
(+) (-)
A Representation of more than one feedback loop

Guidelines for labeling an arrow as positive (+) or negative (-)
AB+
XY-
XC
BA
?- +

Why Draw These Diagrams?
• To see the feedback loops
• Causal Loop Diagrams (CLD) are for thinking and discussion (not for simulation) – “soft” system dynamics – systems thinking

Drawing the diagrams
• Pencil and paper • Drawing the loops in Vensim • PowerPoint


The classic case of a “bad HVAC” system
energy contentin BTU
airtemperaturethermostat's target
temperature
furnace heatproduction inBTU per hour
heat loss in BTUper hour
outdoortemperature
+
+-
-
+ -+
(-)
(-)
Also two feedback loops – this time both negative loops

Positive Feedback Loops
• Can often lead to exponential growth • Or they can lead to rapid decline • If change is “good”, sometimes called “virtuous
circles” • If not so good, sometimes called “vicious circles” • The loop acts to magnify the effect of outside
disturbances • 0, 2, 4,6 (any even number) of – arrows in the loop
R

Negative Feedback Loops
• Can often lead to exponential decline • Or they may serve as control loops
– with an explicit goal (i.e., engineered like a thermostat) – or with an implicit goal (a natural system)
• The loop acts to negate the effect of outside disturbances
• 1, 3, 5, 7 (any odd number) of (–) negative arrows in the loop
• Tend to be much more common than positive feedback loops
C
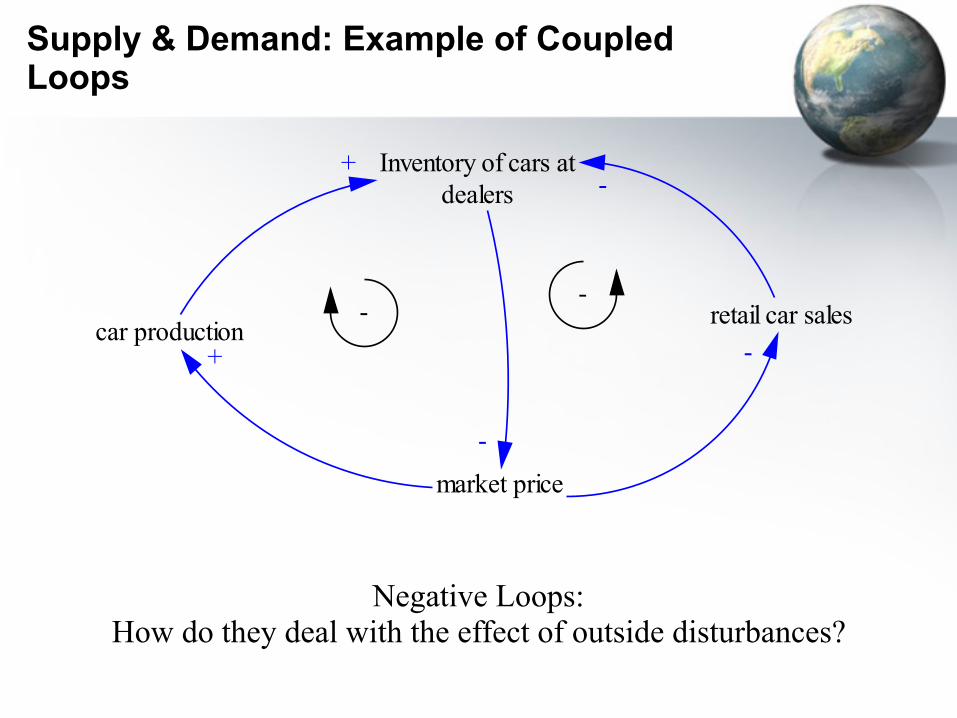
Supply & Demand: Example of Coupled Loops
Negative Loops: How do they deal with the effect of outside disturbances?
Inventory of cars atdealers
retail car sales
market price
car production
-
-
-+
+
--

Portion of a typical model of a “Boom Town”
constructionworkers atproject site
total workersother
workershousing demand
housingconstructionstock of houses
++
+
+
+
-(-)
cost ofconstruction
cumulative costof project
++
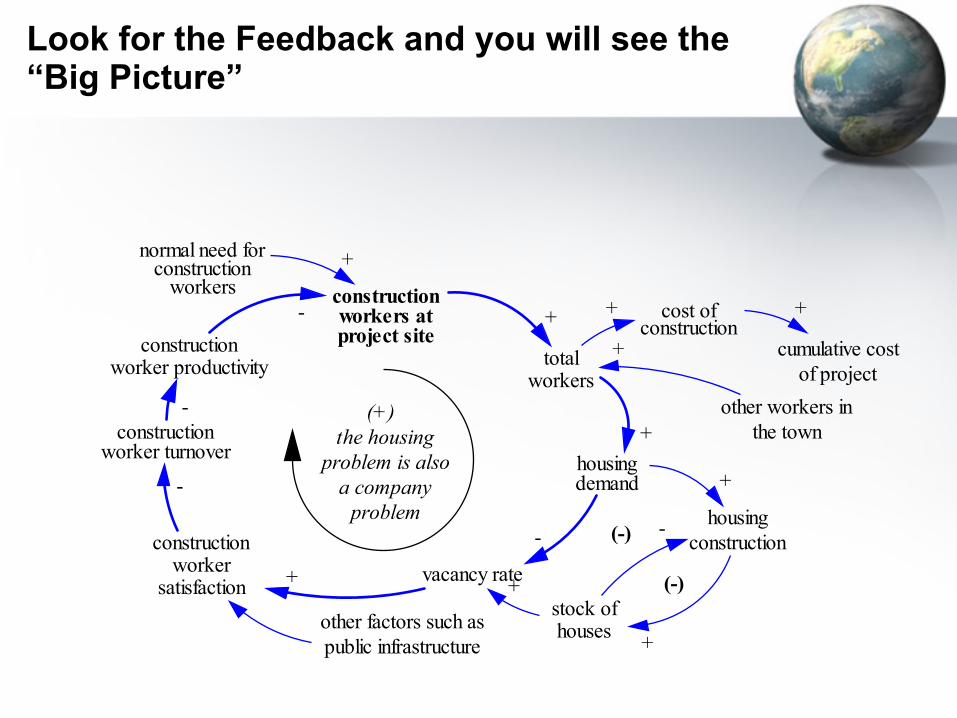
Look for the Feedback and you will see the “Big Picture”
constructionworkers atproject site
totalworkers
other workers inthe town
housingdemand
housingconstruction
stock ofhouses
++
+
+
+
-
(-)
cost ofconstruction
cumulative costof project
+ +
vacancy rate
-
+
constructionworker
satisfaction +
other factors such aspublic infrastructure
constructionworker productivity
normal need forconstruction
workers-
+
(-)
(+) the housing
problem is alsoa company
problem
constructionworker turnover
-
-
Drawing Diagrams
• Previous examples start from scratch – the goal is to get started thinking about the key feedbacks in the system
• Next example: We have a model and we are wondering about its feedback loops

A Familiar Population Model
young population mature population elderly populationbirths maturation aging deaths
maturation rate aging rate death rate
+
total population
mature femalesfraction female
births per mature female per yr
young population
births
maturation
mature population
aging
elderly population
deaths
+
- + - +-
Start with the stocks and flows
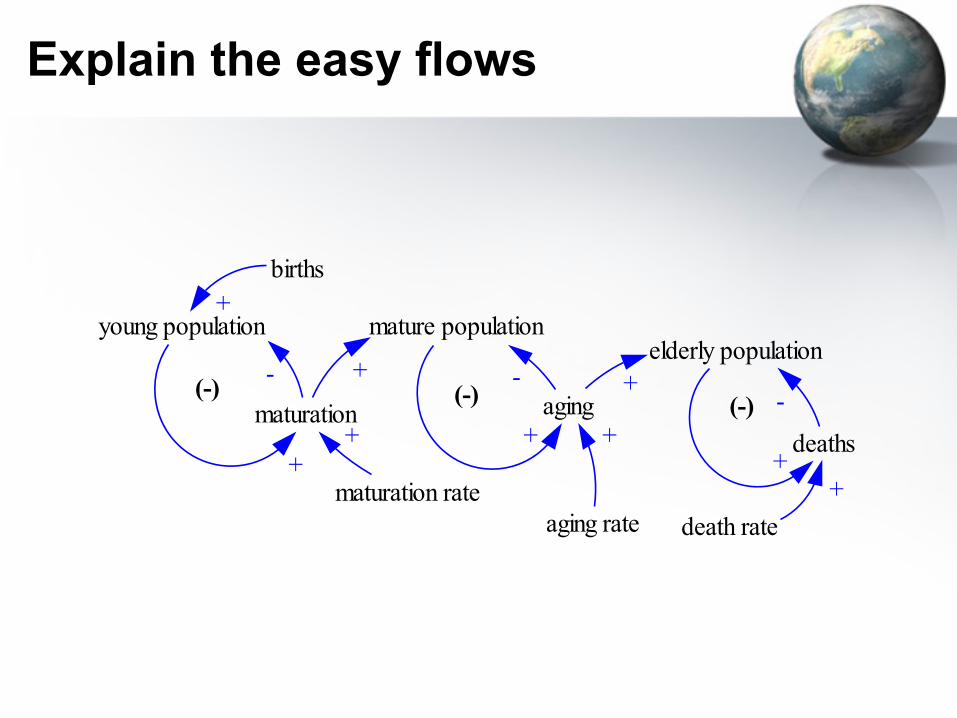
Explain the easy flows
young population
births
maturation
mature population
aging
elderly population
deaths
+
- + - +-
++
+maturation rate
aging rate death rate
+ +
+
(-) (-)(-)

Explain the births
young population
births
maturation
mature population
aging
elderly population
deaths
+
- + - +-
++
+maturation rate
aging rate death rate
+ +
+
(-) (-)(-)
mature females
fraction female
births per mature female per year
++
+
+(+)

S-Shaped Growth
• Flowers Model
• Sales Company Model
• Epidemic Model

Loops in the Flowers Model
suitable area
(-)
(-)
(+)
fraction occupiedgrowth rate decay rate
decaygrowth
area of flowers
--
++
+
-
+
+
+

Loops in the Sales Model
number ofsales
persons
departures
exit rate
new hires
budgetednumber of
sales persons
average salary
sales deptbudget
fraction tosales annual
revenues
widget sales
widget price
effectiveness
+--
+
+
-
++
+
++
+
+
+
-
SalesGrowth(+)
saturation(-)
(-)hiringcontrol
(-)
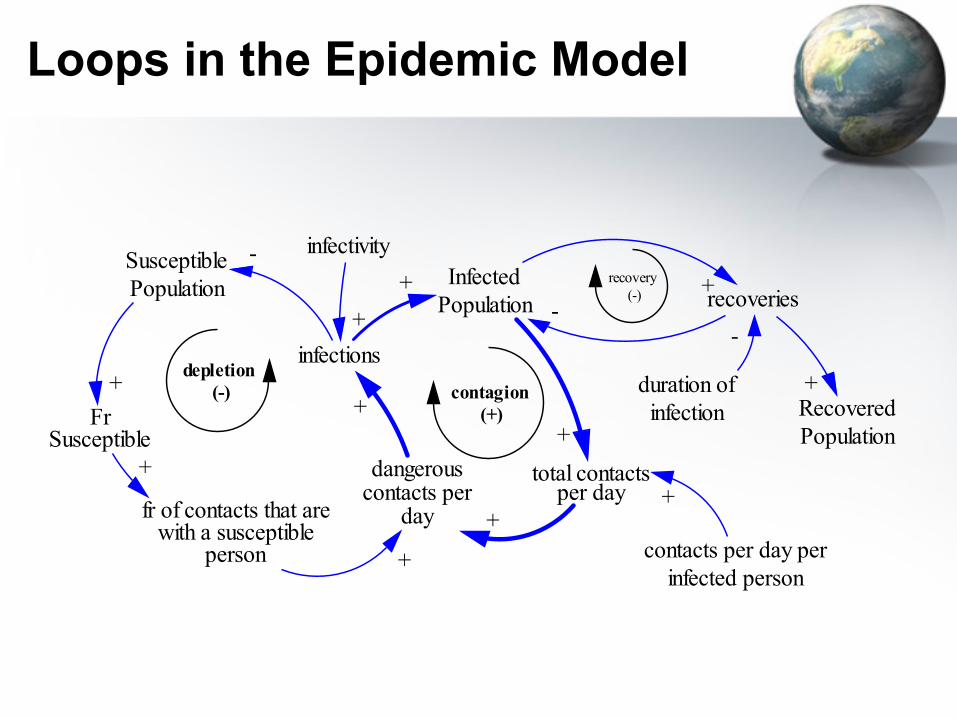
Loops in the Epidemic Model
InfectedPopulation
SusceptiblePopulation
infections
recoveries
RecoveredPopulation
FrSusceptible
fr of contacts that arewith a susceptible
person
dangerouscontacts per
day
total contactsper day
contacts per day perinfected person
duration ofinfection
-+
-
++
+
+
+
infectivity
+
+
++
-
contagion (+)
depletion (-)
recovery (-) +

Beginners Difficulties
• Avoid “too many arrows” – Your goal is to show the loops, not the clutter
• Avoid “action words” – The action is in the arrows, not in the words

car sales go down becauseof higher prices
market price isgoing up
inventories go up becauseof higher production andbecause of lower sales
car production goes upbecause of higher prices
-
-+?
+
Good
Bad
Inventory of cars atdealers
retail car sales
market price
car production
-
-
-+
+
--

Find the Errors
AB
CD
+-
+
+
(+)
AB
CD
++
+(+)
+
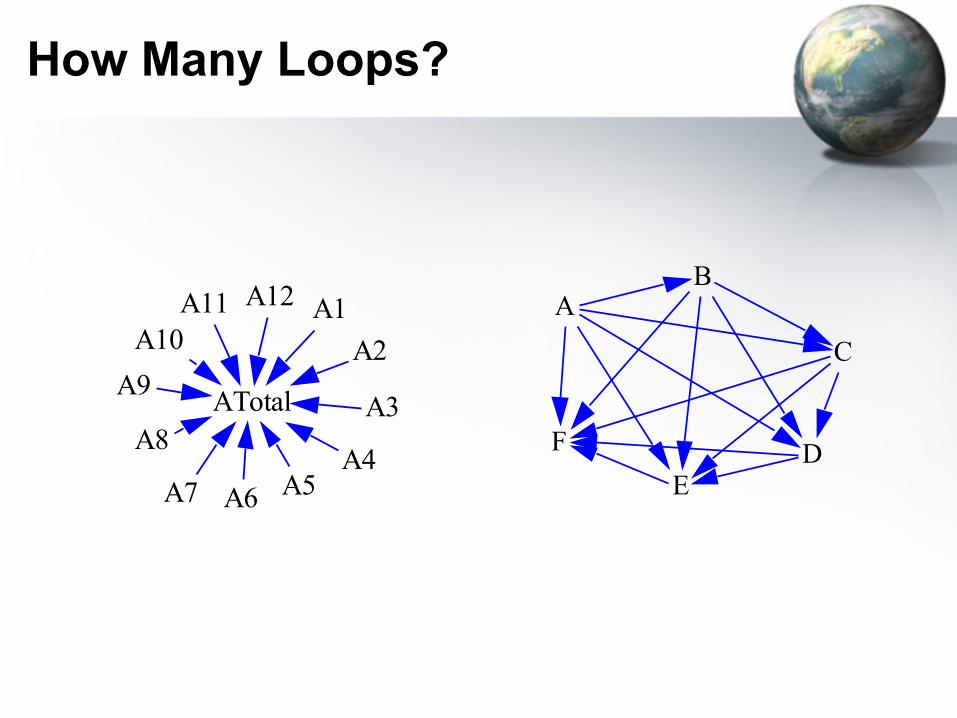
How Many Loops?
A1A2
A3
A4A5A6A7
A8
A9
A10A11 A12
ATotal
AB
C
DE
F

Homeostasis
• Refers to our remarkable capability to maintain a relatively stable physiological state even when the outside environment is varying dramatically.

Homeostasis
• Walter Cannon, Professor of Physiology, Harvard Medical School
• The Wisdom of the Body (1932)
• Higher organisms had “learned” this ability over eons of time through gradual evolution

The Wisdom of the Body
• Control of Blood Pressure • Control of Blood Sugar • Control of Food Intake • Control of Water Intake • Control of Salinity
These systems are fundamentally the same when we think of their homeostatic properties.

External Disturbance to the Body
size of initial cut orrupture
size of thewoundopening
trauma tolocal vessels
+ vascularspasm+ - blood
loss
++

Feedback loops controlling clot formation
size of initial cut orrupture
size of thewound opening
trauma tolocal vessels
size ofthe clot
+vascularspasm
+
--
+
amount ofthrombin
formation ofprothrombin
activator
+
+
formation offibrin fibers
+
+
+
bloodloss
++
-
+

A dangerous (+) loop forms
• Once a critical amount of thrombin [coagulant] is formed, a vicious circle develops that causes still more blood clotting and more thrombin to be formed; thus, the blood clot continues to grow until something stops its growth. -- Guyton & Hall (1996)
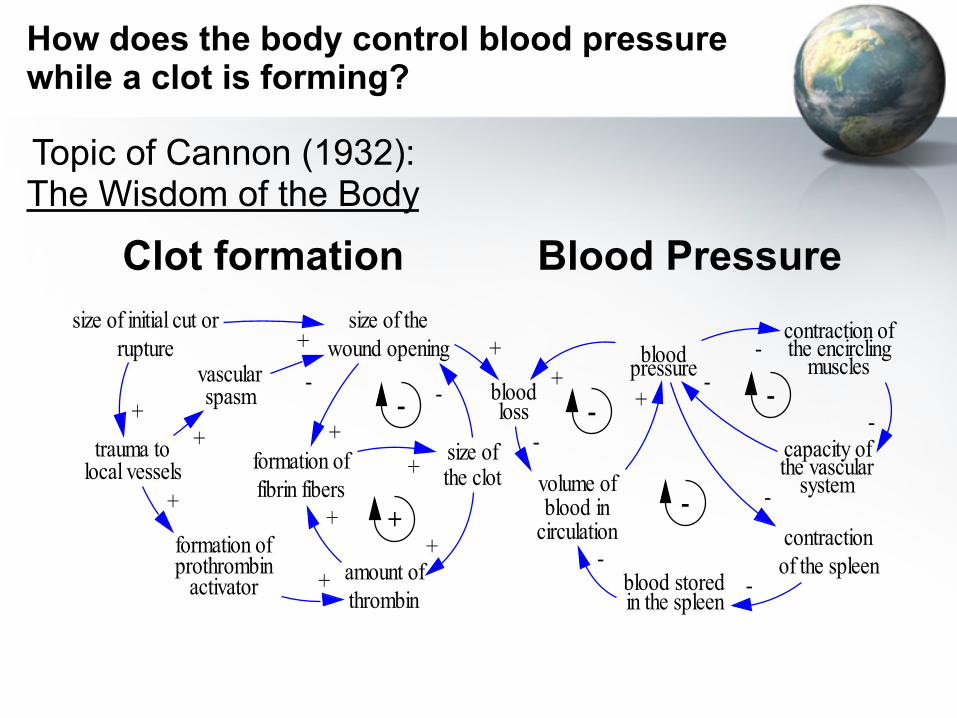
How does the body control blood pressure while a clot is forming?
size of initial cut orrupture
size of thewound opening
trauma tolocal vessels
size ofthe clot
+vascularspasm
+
--
+
amount ofthrombin
formation ofprothrombin
activator
+
+
formation offibrin fibers
+
+
+
bloodloss
++
-
+
volume ofblood in
circulation
bloodpressure
-
++-
contraction ofthe encircling
muscles
contractionof the spleen
capacity ofthe vascular
system
-
-
-
-
blood storedin the spleen
--
-
-
Clot formation Blood Pressure
Topic of Cannon (1932): The Wisdom of the Body

Should We Try to Extend Homeostasis Beyond Physiology?
• Cannon: Yes – his concluding section
• Cannon’s Advice: homeostasis is “not a special gift” bestowed upon the highest organisms but is the consequence of gradual evolution

Webster’s Defines Homeostasis:
Tendency toward maintenance of a relatively stable internal environment in the bodies of higher animals through a series
of interacting physiological processes
Tendency toward maintenance of relatively stable social conditions among groups with respect to various factors
(such as food supply and population among animals) and to competing tendencies and powers within the body politic, to
society, to culture among men.
OK
Say What?

Extending Cannon’s Ideas
• Homeostatic responses may be extremely difficult to detect (as in 98 degrees body temperature)
• Look for both Positive as well as Negative Feedback
• Can think of a “Span of Control”

Stability Concepts discussed so far
• Stability around equilibrium

The Span of Control

Body Temperature Control
Runaway behavior? When the body is too hot, runaway behavior takes over. This runaway feedback (if not stopped) leads to death.

Home Heating System
Could you envision runaway behavior?

Loss of Blood
What is the run-away behavior here?

Application to my field - urban systems
• Urban resilience • How can we think about homeostasis with regards
to local or regional economies? • Transport
• What about environmental systems? • Applications to your fields?