formula-based approach in the allocation of specific
TRANSCRIPT

Jurnal Perencanaan Pembangunan
The Indonesian Journal of Development Planning
Volume IV No. 3 September 2020/page: 253-269 Doi: 10.36574/jpp.v4i3.130 Article
Page | 253 Copyright © 2020 Kementerian PPN/Bappenas RI
Formula-Based Approach in the Allocation of Specific Allocation
Grants for Infrastructure (DAK Fisik): Case of Education Provision
Tengku Munawar Chalil1* and Mohammad Roudo2
1School of Architecture, Planning and Policy Development Institut Teknologi Bandung
and 2Ministry of National Development Planning (Bappenas)
*Corresponding author. Email: [email protected]
Submitted: July 26th 2020 | Accepted: September 21st 2020 | Published: September 28th 2020
Abstract
The paper presents the top-down (formula-based) approach in the allocation of specific purpose grants
for infrastructure (DAK Fisik) in education by considering the specific needs related to the
infrastructure in education. First, we estimate the needs of education infrastructure by calculating the
gap between the current condition of infrastructures and the minimum required infrastructures in
education. Then, we translate the needs into necessary costs for education per region. After that, we
simulate financial scenarios for the necessary costs using specific allocation grants in hierarchical,
temporal, and regional dimensions. We also consider the local fiscal capacity and indicators for the
achievement of local governments in education for the distribution of DAK Fisik for FY2021 and
onward. Finally, we provide the potential implications of using the formula-based approach as a top-
down planning and budgeting tool for DAK Fisik.
Keywords: Infrastructure Costing, Specific Allocation Grants, Education
Tengku Munawar Chalil and Mohammad Roudo
Page | 254 Copyright © 2020 Kementerian PPN/Bappenas RI
Formula Based Approach in the Allocation of Specific Allocation
Grants for Infrastructure (DAK Fisik): Case of Education Provision
Tengku Munawar Chalil and Mohammad Roudo
I. Introduction
The increase of the allocation and scope of Specific Allocation Funds for
infrastructure (DAK Fisik) in fact still procures many flaws and problems, both at the central
level and the local level. Some problems, for instance, are the mismatching between the
expenditure menu and the needs of the local government, a late announcement of technical
guidance, postponed implementation by a third party, which can cause fewer outputs and
outcomes regarding DAK Fisik. Therefore, the ministry of national development planning
(BAPPENAS) has accomplished various efforts to further enhance the quality and
governance of DAK Fisik, including process, cycle, and management mechanisms through a
proposal-based approach.
Since 2016, the allocation of DAK Fisik is not determined by the central government
by general, specific and technical criteria.1 The allocation of DAK Fisik has to conform with
the national priority and fiscal capacity, and the most important consideration is the
proposals submitted by the local government. The President’s direction addresses the
allocation of DAK Fisik with a preference to use the bottom-up approach instead of the top-
down approach. This means that the central government must take into high consideration
the proposals from local governments to accommodate their specific needs. In 2016, the local
governments still forwarded each individual proposal manually to the central government,
however, since 2017, BAPPENAS has initiated the utilization of e-planning so DAK Fisik
proposals are submitted through the utilization of the e-planning application process instead
of them being manually submitted. Then this application transforms towards the utilization
KRISNA application, which is one gate portal to submit DAK Fisik proposals from local
government. This system is later connected with other systems such as OM-SPAN, a
financial system to disburse money to the successful applicants. All related stakeholders can
access this application, from the submission of proposals, verification of proposals and data,
as well as synchronization, between planning and budgeting.
Even though current planning of specific allocation funds are based on each proposal,
the Ministry of National Development Planning initiates the partial use of a fixed formula-
based approach on the allocation of DAK Fisik for FY2021. Learning from past experience,
previous planning of DAK Fisik is dominantly driven by each specific proposal from the local
government. Therefore, it is important to use a formula that can accommodate big data, fiscal
capacity, statistics, and other technical data which are related to sectoral data, construction
index and spending disbursement in the previous fiscal year. We expect that the use of this
formula could represent the needs of local government in an equal and impartial manner. In
1 Technical criteria are naturally a top-down process. A ministry/agency decides the technical criteria for a specific allocation of funds. Law 33/2004, Article 40 mentions this matter specifically.
Tengku Munawar Chalil and Mohammad Roudo
Page | 255 Copyright © 2020 Kementerian PPN/Bappenas RI
the future, the evolution on the concept of DAK Fisik will be set as a combination between
proposal-based and formula-based approaches.
Thus, this paper introduces the formula-based approach for the allocation of DAK
Fisik, particularly in the case of the fulfillment of the education infrastructure. Some steps
need to be taken when following this formula-based approach. First, developing a formula
to estimate the needs of the education infrastructure per region using the current
infrastructure data. Second, setting the goal for the education infrastructure to calculate the
gap between the current condition and the needs sought after. Third, measuring the cost of
the infrastructure gaps. The funding scenario is also introduced that reflect the gaps in cost.
Finally, the funding scenario per region is developed by considering local achievement and
fiscal capacity.
Our paper contributes both to the academic field and policy recommendation. First,
this paper enriches the literature on public finance particularly on the corpus of fiscal needs
and allocation. This is in line with the idea presented by Procelli and Vidoli (2019) who
constructed expenditures’ needs from a supply and demand curve and also from citizens’
income. Shah, Qibtidayah, and Dita (2012) argued that fiscal needs come from an index of
area, population, construction price index, human development index, and regional GDP.
Mochida (2007) presented the calculation of expenditure needs in Japan, which utilizes the
infrastructure gap and unit cost. Our paper estimates the fiscal needs of infrastructure based
on the gap of infrastructure which is later transformed into the necessary cost.
Secondly, the paper contributes to giving a breakthrough about the planning and
budgeting of DAK Fisik. This paper comes with the idea of balancing a bottom-up approach
and a top-down approach regarding the planning process of DAK Fisik. The current process
highly explores the bottom-up approach, but less exploration is given to the top-down
approach. Our aim is to fill the gap between these different approaches by developing a
formula and simulation using a combination of the top-down and bottom-up approaches that
can be utilized by the central government as a guideline when discussing grant proposals
with local government.
The rest of this paper is constructed by the following: Section 2 reviews the cogent
related literature. Section 3 presents the calculation of the infrastructure needs. Section 4
discusses the allocation scenario of specific allocation funds. Finally, Section 5 concludes the
paper.
II. Literature review
In the literature, the needs of expenditure require financial sources to provide a
standard set of public service (Duncan & Smith, 1996). The standard set of public service is
not similar to that with a minimum level service. A standard set of public service can be
different across regions, but a minimum level service is fixed by law (Porcelli & Vidoli, 2019).
Expenditure needs can be estimated by a normative approach. Mochida (2007) showed that
in the case of Japan, expenditure needs are calculated as the number of measurement units
by multiplying the unit cost, adjusted by the modification coefficient. For instance,
expenditure needs for road improvement is 380,000-yen x road length (km) x modification
coefficients. The financing of the expenditure is using Local Allocation Tax (LAT) transfers

Tengku Munawar Chalil and Mohammad Roudo
Page | 256 Copyright © 2020 Kementerian PPN/Bappenas RI
and other legal revenue within local government. The costing practice is similar with the
system developed in Australia for calculating special expenditure needs (see, Ma, 1999 for
the specific details). Before the calculation of standard expenditure needs, public service for
each subnational government is divided into particular service items by function. After that,
expenditure needs are calculated using the measurement of necessary unit(s) multiplied by
unit cost(s) and adjustment coefficients.
Focusing on infrastructure needs, Bhattacharyay (2010) noted two approaches for
estimating infrastructure demand. The first is the top-down approach. The top-down
approach relies on an econometric model, where the demand of infrastructure as the function
of per capita income, population density, share of agriculture and manufacture to value
added, and the degree of urbanization are taken into account. The top-down approach uses
historic trends to forecast the demand. In contrast, the bottom-up approach requires an
individual infrastructure project(s) manager to estimate the costs of their implementation.
The total of infrastructure costs from all infrastructure projects become the total needs of
infrastructure. The issue may arise as a result of the bottom-up process, the planning of
infrastructure is less coordinated and inefficient. Moreover, Shick (1998) noted the idea about
operational efficiency, which is the best selection of approach based on the efficiency of
utilizing money or resources to achieve the desired goals.
The strands of literature also discuss the education needs and government
expenditures. West et al. (2001) used the Standard Spending Assessment (SSA) in the United
Kingdom to examine the needs of education and its impact. The SSA is the minimum funds
for education which the allocation of funds is determined by several of the authorities in
different parts of the country and its population characteristics. Stiglitz (1974) noted that
the provision of education is an interesting case on the one hand but it also has complex
issues attached to it on the other hand, since education in some parts are public goods and
other parts are publicly provided private goods. Hirsch (1960) argued that in an ideal setting,
the needs of education expenditures are determined by population density, sociology,
cultural, and the willingness-to-pay for education. Ladd (1965) found that the property tax
has an effect on local government spending on education. Later he argued that this education
expenditure relies on local fiscal capacity. Kurban, Gallagher, and Persky (2015) showed that
the dynamic of population-cohort affects the needs and priorities of education. Denzau (1975)
has surveyed the large volume of literature and suggested that fiscal grants often have a
significant positive contribution to education expenditure albeit it does not directly address
the needs of education. Apparently, fiscal grants appear as an important source to finance
education in developing countries. Other factors such as population density, number of
pupils, and family income also magnify the public expenditures for education (Patrinos &
Ariasingnam, 1997).
However, the literature about costing and estimation on the needs of the education
sector in Indonesia is limited, as far as the author’s knowledge. Therefore, this paper offers
the costing of the demand of the education sector in Indonesia and how transfer grants from
the central to subnational government, particularly, DAK Fisik, could finance the cost for
the needs of the education sector based on its demand.

Tengku Munawar Chalil and Mohammad Roudo
Page | 257 Copyright © 2020 Kementerian PPN/Bappenas RI
III. Costing the needs of the education infrastructure
The costing of the needs to fulfil the education infrastructure that is financed by DAK
Fisik departs from identifying the current condition of education’s infrastructure. In this
paper, this education’s infrastructure is only limited in scope to the physical infrastructure
of education, for example, the amount and condition of the classroom, school library,
laboratory, teacher room, closet/toilet, medical room, science and computer laboratory, and
other physical infrastructure for education. The capacity of each teacher, teacher and school
staff salary, and curriculum are categorized as non-physical infrastructure. Patrinos and
Ariasingnam (1977) noted that the local government should finance the expenditures to
enhance the capacity of local education using the local budget instead of relying on central
government grants. It is important to note that DAK Fisik is addressed to fund the physical
infrastructure, while the non-physical infrastructure is financed by DAK Non Fisik.
We utilized the database for principal education (Data Pokok Pendidikan/DAPODIK)
year 2020 to illustrate the current condition of the infrastructure within the education sector.
We identify the number of the current infrastructure in each tier of the government in each
region (district, city, and province). For instance, we calculate the number of science
laboratories in elementary school in municipal X. We also probe the number of potential
damages of infrastructures in each tier of government and in each region. After the current
condition is clearly identified and calculated, then we determine the ideal condition as the
goals. The ideal condition of the infrastructure in education follows the target that is
stipulated in the Government Regulation (GR) 19/2005 juncto GR 32/2013 on the National
Education Standard. We also follow the target of the Ministry of Education and Culture
about the target of infrastructure in education which must be financed by DAK Fisik.
The comparison of ideal and current conditions yields the needs of infrastructures
within the education sector. The needs of infrastructures consist of two categories: new
infrastructure and repairing damaged infrastructures. The total of both infrastructures is
then multiplied with the unit cost and construction index, which yield the total cost of the
need of infrastructure in education.
Cost of Education Inf. (𝑗𝑘) = (∑ 𝑁𝑒𝑤 𝐼𝑛𝑓.𝑖𝑗𝑘𝑛𝑖=1 + ∑ 𝑅𝑒ℎ. 𝐼𝑛𝑓.𝑖𝑗𝑘 ) 𝑥𝑈𝐶 𝑥
𝐶𝐼𝑘
100
𝑛𝑖=1
Where cost of education infrastructure in j-level (kindergarten, elementary, junior
high, senior high, etc.) and k-municipal equal to the total need of new i-infrastructure
(classroom, library, laboratory, etc.) and repairing of damaged i-infrastructure, which is
multiplied by Unit Cost (UC) and Construction Index (CI).
The calculation on the needs of infrastructure in education assumes that the ideal
condition is all damaged in infrastructures that are repaired and the newly built
infrastructures are addressed to all in terms of less quality of infrastructure as stated by the
Minister of Education and Cultural, all students must receive a convenient and educational
environment that is conducive to study in.
The calculation of infrastructure has three steps. First, we list the infrastructure that
must be provided in each tier of government. These needs are different. For instance, a
science laboratory is only addressed for elementary and junior high school, while senior high
schools require physics, chemistry, biology, and language laboratories. In this paper, the list
Tengku Munawar Chalil and Mohammad Roudo
Page | 258 Copyright © 2020 Kementerian PPN/Bappenas RI
and calculation is made for six levels of education: kindergarten (PAUD), elementary (SD),
junior high (SMP), senior high (SMA), vocational school (SMK) and special education school
(SLB). We exclude the calculation in senior vocation and university level (undergraduate
and graduate levels) since they belong to the central government’s authority and out of the
scope of this paper. We also accommodate the characteristics of the region as a priority that
gains full intervention while other regions only gain partial intervention. Meaning there is
an imbalance of interventions across the regions.
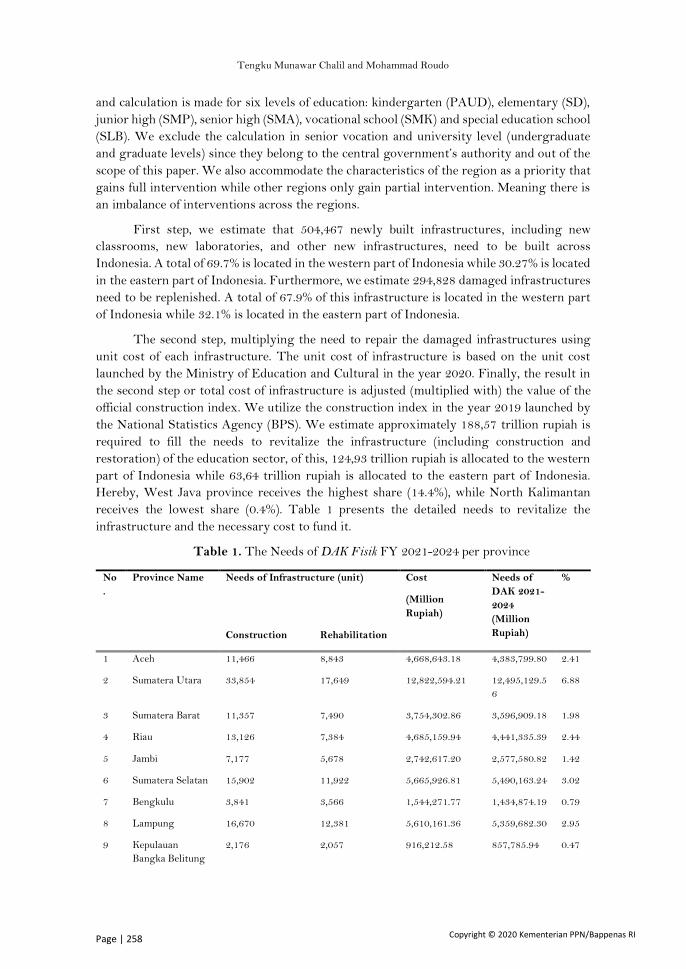
First step, we estimate that 504,467 newly built infrastructures, including new
classrooms, new laboratories, and other new infrastructures, need to be built across
Indonesia. A total of 69.7% is located in the western part of Indonesia while 30.27% is located
in the eastern part of Indonesia. Furthermore, we estimate 294,828 damaged infrastructures
need to be replenished. A total of 67.9% of this infrastructure is located in the western part
of Indonesia while 32.1% is located in the eastern part of Indonesia.
The second step, multiplying the need to repair the damaged infrastructures using
unit cost of each infrastructure. The unit cost of infrastructure is based on the unit cost
launched by the Ministry of Education and Cultural in the year 2020. Finally, the result in
the second step or total cost of infrastructure is adjusted (multiplied with) the value of the
official construction index. We utilize the construction index in the year 2019 launched by
the National Statistics Agency (BPS). We estimate approximately 188,57 trillion rupiah is
required to fill the needs to revitalize the infrastructure (including construction and
restoration) of the education sector, of this, 124,93 trillion rupiah is allocated to the western
part of Indonesia while 63,64 trillion rupiah is allocated to the eastern part of Indonesia.
Hereby, West Java province receives the highest share (14.4%), while North Kalimantan
receives the lowest share (0.4%). Table 1 presents the detailed needs to revitalize the
infrastructure and the necessary cost to fund it.
Table 1. The Needs of DAK Fisik FY 2021-2024 per province
No
.
Province Name Needs of Infrastructure (unit) Cost
(Million
Rupiah)
Needs of
DAK 2021-
2024
(Million
Rupiah)
%
Construction Rehabilitation
1 Aceh 11,466 8,843 4,668,643.18 4,383,799.80 2.41
2 Sumatera Utara 33,854 17,649 12,822,594.21 12,495,129.5
6
6.88
3 Sumatera Barat 11,357 7,490 3,754,302.86 3,596,909.18 1.98
4 Riau 13,126 7,384 4,685,159.94 4,441,335.39 2.44
5 Jambi 7,177 5,678 2,742,617.20 2,577,580.82 1.42
6 Sumatera Selatan 15,902 11,922 5,665,926.81 5,490,163.24 3.02
7 Bengkulu 3,841 3,566 1,544,271.77 1,434,874.19 0.79
8 Lampung 16,670 12,381 5,610,161.36 5,359,682.30 2.95
9 Kepulauan
Bangka Belitung
2,176 2,057 916,212.58 857,785.94 0.47

Tengku Munawar Chalil and Mohammad Roudo
Page | 259 Copyright © 2020 Kementerian PPN/Bappenas RI
No
.
Province Name Needs of Infrastructure (unit) Cost
(Million
Rupiah)
Needs of
DAK 2021-
2024
(Million
Rupiah)
%
Construction Rehabilitation
10 Kepulauan Riau 3,829 1,678 1,802,643.06 1,664,972.39 0.92
11 DKI Jakarta 7,517 4,636 3,393,285.26 3,393,285.26 1.87
12 Jawa Barat 89,427 35,889 27,158,688.91 26,368,834.5
9
14.5
2
13 Jawa Tengah 45,466 31,489 16,903,548.60 16,646,268.6
8
9.16
14 DI Yogyakarta 3,615 3,331 1,539,613.08 1,430,253.81 0.79
15 Jawa Timur 58,069 35,308 22,632,203.54 22,162,064.6
3
12.2
0
16 Banten 21,745 8,292 6,486,206.09 6,400,903.21 3.52
17 Bali 7,314 2,741 2,607,972.81 2,550,942.24 1.40
18 Nusa Tenggara
Barat
12,978 6,811 4,902,657.87 4,761,645.80 2.62
19 Nusa Tenggara
Timur
17,751 14,228 7,590,729.86 7,244,960.08 3.99
20 Kalimantan Barat 13,820 11,098 6,472,555.22 6,264,783.04 3.45
21 Kalimantan
Tengah
8,791 4,504 3,310,273.00 3,065,692.74 1.69
22 Kalimantan
Selatan
7,665 4,509 2,809,251.52 2,717,584.71 1.50
23 Kalimantan
Timur
7,226 3,088 2,695,689.94 2,490,542.50 1.37
24 Kalimantan Utara 1,710 1,019 747,850.00 656,245.28 0.36
25 Sulawesi Utara 7,089 4,208 2,866,675.70 2,653,489.98 1.46
26 Sulawesi Tengah 10,039 6,203 3,491,581.70 3,241,690.88 1.78
27 Sulawesi Selatan 20,537 15,362 7,285,649.38 7,077,710.25 3.90
28 Sulawesi
Tenggara
8,568 6,138 3,364,862.50 3,134,505.49 1.73
29 Gorontalo 2,583 1,671 991,590.57 931,815.92 0.51
30 Sulawesi Barat 5,180 4,013 1,904,850.68 1,697,997.02 0.93
31 Maluku 7,042 4,097 3,271,285.77 3,050,595.66 1.68
32 Maluku Utara 6,483 2,722 2,766,495.68 2,569,853.17 1.41
33 Papua Barat 4,155 1,549 1,782,697.23 1,616,535.50 0.89
34 Papua 11,462 3,294 7,384,655.15 7,225,940.84 3.98
Total 505,647 294,848 188,573,403 181,656,374 100

Tengku Munawar Chalil and Mohammad Roudo
Page | 260 Copyright © 2020 Kementerian PPN/Bappenas RI
No
.
Province Name Needs of Infrastructure (unit) Cost
(Million
Rupiah)
Needs of
DAK 2021-
2024
(Million
Rupiah)
%
Construction Rehabilitation
West Indonesia 352,559.69 200,334.00 124,934,051 121,254,785 66.7
5
East Indonesia 153,087.59 94,514.00 63,639,351 60,401,588 33.2
5
IV. Costing the needs of DAK Fisik Pendidikan
During serial consultations with BAPPENAS and the Ministry of Education and
Culture,2 it was agreed that DAK Fisik will be funded 100% for the need of the infrastructure
in the education sector. Therefore, towards FY2021 to FY2024 (end of midterm national
development plan 2020-2024), it has set the target that 100% of the education infrastructure
will be revitalized in FY2024. In other words, since FY2020, it is stated in the midterm plan
document (RPJMN), the need of DAK Fisik in education FY2021-FY2024 is obtained by
subtracting the need of the education infrastructure with DAK Fisik in education for FY2020.
Need of DAK 2021 − 2024 (𝑗𝑘) = Cost of Education Inf. (𝑗𝑘) − DAK 2020(𝑗𝑘)
Based on that formula, it is estimated and calculated that the need of DAK Fisik in
education FY2021-2024 is approximately 181,66 trillion rupiah which is allocated to the
western part of Indonesia to the proportion of about 67% and about 33% in the eastern part
of Indonesia. The biggest portion of DAK Fisik in education is for elementary schools (54%),
then is followed by junior high schools (17%), vocational schools (13%), senior high schools
(10%), kindergartens (6%) and special education schools (1%). Madrasa is not included in the
calculation and analysis since it does not belong to the authority of the Ministry of Education
and Culture. The exercise does not also include the need of the cultural academy (SKB) due
to lack of data. Table 1 presents per province allocation of DAK Fisik in education FY2021-
2024. Then, we split the funds of DAK Fisik in each fiscal year in the following scenario. In
FY2021, the funding is only set for 15% of completion, amid the economic contraction in
FY2020. In FY2022, it is set more optimistically with 35% of completion. As the economic
recovery is projected to get incrementally better, the target accelerates in FY2023, when it
is set for 70% of completion. Finally, the 100% completion will be achieved in FY2024.
Referring to that percentage, we estimate that the need of DAK Fisik in education in
FY2021 is approximately 27,25 trillion rupiah. The total amount that is addressed to the
western part of Indonesia is about 18,18 trillion rupiah while the eastern part of Indonesia
will receive 9,06 trillion rupiah. We call this scenario a baseline scenario. This scenario
assumes all cities and districts receive 100% of DAK Fisik to finance its needs. Table 2 below
presents the details of the per province allocation according to the baseline scenario.
2 The serial consultations for estimating the needs of specific allocation funds for infrastructure FY2021
and forward were initiated by the Directorate of Regional Autonomy, BAPPENAS with support from KOMPAK. The serial consultations started since March 2020 onwards.

Tengku Munawar Chalil and Mohammad Roudo
Page | 261 Copyright © 2020 Kementerian PPN/Bappenas RI
Table 2. Specific Allocation Funds for Education Infrastructure FY2021 by education
level per province (Baseline Scenario) (In Million Rupiah)
No Province
Name PAUD SD SMP SMA SMK SLB TOTAL
1 Aceh 28,393.7 336,652.5 150,683.
6
103,906.
2
34,900.7 3,033.3 657,570.0
2 Sumatera
Utara
60,268.3 1,019,964.
1
310,026.
4
230,220.
3
249,320.
1
4,470.3 1,874,269.
4
3 Sumatera
Barat
10,581.0 367,617.5 64,530.8 55,596.6 35,003.0 6,207.4 539,536.4
4 Riau 20,641.5 361,030.9 143,746.
2
82,024.0 57,378.2 1,379.6 666,200.3
5 Jambi 9,422.9 233,215.1 74,823.5 41,150.0 28,025.7 - 386,637.1
6 Sumatera
Selatan
41,150.5 429,473.3 180,802.
6
112,918.
1
57,396.9 1,783.0 823,524.5
7 Bengkulu 1,838.6 130,084.0 44,512.9 20,682.2 17,903.2 210.2 215,231.1
8 Lampung 61,706.4 420,552.3 137,308.
8
86,159.2 96,482.1 1,743.6 803,952.3
9 Kepulauan
Bangka
Belitung
15,354.3 73,327.0 18,623.4 10,777.8 10,585.3 - 128,667.9
10 Kepulauan
Riau
7,047.2 128,387.2 54,638.3 32,045.8 26,655.6 971.9 249,745.9
11 DKI
Jakarta
55,854.7 151,659.9 36,624.2 87,249.4 174,256.
3
3,348.2 508,992.8
12 Jawa Barat 244,445.
9
1,950,245.
4
650,661.
2
298,184.
7
795,524.
8
16,263.1 3,955,325.
2
13 Jawa
Tengah
225,077.
4
1,555,240.
1
169,855.
9
139,101.
5
400,939.
8
6,725.6 2,496,940.
3
14 DI
Yogyakart
a
16,375.6 113,755.0 10,225.2 22,824.7 49,222.5 2,135.0 214,538.1
15 Jawa
Timur
276,571.
9
1,683,744.
9
455,366.
8
309,058.
7
578,792.
4
20,774 3,324,309.
7
16 Banten 63,715.6 414,121.0 166,081.
0
120,443.
6
191,146.
0
4,628.4 960,135.5
17 Bali 37,104.0 231,384.2 30,547.7 35,681.5 47,852.5 71.4 382,641.3
18 Nusa
Tenggara
Barat
92,451.7 330,546.7 135,470.
6
73,640.0 78,984.3 3,153.6 714,246.9
19 Nusa
Tenggara
Timur
11,245.9 617,581.7 282,365.
3
122,392.
1
52,044.1 1,114.8 1,086,744.
0

Tengku Munawar Chalil and Mohammad Roudo
Page | 262 Copyright © 2020 Kementerian PPN/Bappenas RI
No Province
Name PAUD SD SMP SMA SMK SLB TOTAL
20 Kalimanta
n Barat
11,767.3 557,467.8 216,699.
2
106,569.
5
46,382.2 831.4 939,717.5
21 Kalimanta
n Tengah
15,662.9 266,313.1 116,317.
8
45,006.0 15,460.9 1,093.2 459,853.9
22 Kalimanta
n Selatan
29,661.8 264,564.1 52,743.6 36,147.2 24,521.0 - 407,637.7
23 Kalimanta
n Timur
29,210.6 177,631.6 73,430.6 45,521.7 47,025.7 761.2 373,581.4
24 Kalimanta
n Utara
3,707.5 54,809.1 26,821.5 13,098.7 - - 98,436.8
25 Sulawesi
Utara
497.8 235,940.5 81,035.3 43,889.9 34,101.3 2,558.6 398,023.5
26 Sulawesi
Tengah
18,340.7 294,867.3 108,115.
5
38,306.3 25,628.7 995.0 486,253.6
27 Sulawesi
Selatan
47,248.5 619,988.8 176,019.
2
114,553.
3
100,077.
5
3,769.3 1,061,656.
5
28 Sulawesi
Tenggara
31,862.7 255,722.4 86,973.0 65,143.6 24,461.4 6,012.7 470,175.8
29 Gorontalo 6,652.3 79,545.1 36,217.0 7,429.8 9,928.1 - 139,772.4
30 Sulawesi
Barat
9,804.6 161,077.8 54,548.3 10,101.0 18,569.2 598.6 254,699.6
31 Maluku 9,886.2 224,426.0 123,342.
0
76,478.9 21,900.1 1,556.3 457,589.3
32 Maluku
Utara
19,491.0 179,545.9 94,312.3 58,535.1 32,411.6 1,182.1 385,478.0
33 Papua
Barat
4,541.0 152,471.5 42,141.2 32,381.7 6,530.0 4,414.9 242,480.3
34 Papua 27,746.0 636,076.1 222,209.
3
132,324.
6
46,270.1 19,265.1 1,083,891.
1
Total 1,545,32
7
14,709,03
0
4,627,82
0
2,809,54
3
3,435,68
1
121,052 27,248,45
6
West
Indonesia
1,175,54
9
9,600,454 2,699,05
8
1,788,02
4
2,851,38
5
73,745 18,188,21
7
East
Indonesia
369,778 5,108,575 1,928,76
1
1,021,51
9
584,296 47,307 9,060,238
V. Scenario in Allocation of DAK Fisik in Education
We exercise the allocation of DAK Fisik in the quadrant-based scenario. Each district
or city is plotted in each quadrant which refers to particular treatment, possible incentives
and disincentives which could be gained. There are two scenarios being exercised here. Both
scenarios consider the fiscal capacity of each local government and the performance of local
government to ensure the equity of allocation of DAK Fisik in the education sector.

Tengku Munawar Chalil and Mohammad Roudo
Page | 263 Copyright © 2020 Kementerian PPN/Bappenas RI
The first scenario as is illustrated in Figure 1 below, represents, index of education
(X-axis) and index of fiscal capacity (Y-axis) The calculation of the Education Index follows
the formula from the Directorate of Education – BAPPENAS as is shown below.
Education Index(𝑗𝑘) =∑ 𝑁𝑒𝑤𝑖𝑗𝑘
𝑛𝑖=1
𝑛+
∑ 𝑅𝑒ℎ𝑖𝑗𝑘𝑛𝑖=1
𝑛+ 𝑃𝑎𝑟𝑡𝑗𝑘 + 𝐶𝑜𝑚𝑚𝑗𝑘
It can be seen that the Education Index on j-level and k-municipal, equals to the sum
of the average ratio to the needs of new infrastructures compared towards the existing
infrastructure (Newijk), the average ratio of damaged infrastructures towards the existing
infrastructure (Rehijk), school participation index on j-level (Partjk), as well as the commitment
index (commjk). This commitment index is the combination of indices which shows the quality
of education, national exam scores, and implementation of DAK Fisik in education in the
previous year. Furthermore, the data of fiscal capacity index is gained from the Ministry of
Finance. The 2020 fiscal capacity data is utilized.
Figure 1. First Scenario
We estimate that allocation of DAK Fisik in education using the first scenario is
smaller in amount than the allocation in the baseline scenario. The DAK Fisik in education
for FY2021 using this first scenario is only about 17,65 trillion rupiah. It is also estimated
from this total amount that an allocation to the western part of Indonesia will be
approximately 7,45 trillion rupiah (42.2%) while the allocation for the eastern part of
Indonesia will be around 10,2 trillion rupiah (57.7%). Table 3 shows the detail of allocation
per province using this first scenario.
Table 3. DAK Fisik in Education FY2021 by education level per province (Scenario
1) (In Million Rupiah)
No Province Name PAUD SD SMP SMA SMK SLB TOTAL
1 Aceh 7,840.9 270,424.6 34,594.7 11,874.
8
- 497.7 325,232.7
2 Sumatera Utara 22,911.8 283,301.6 161,270.
3
87,052.
4
86,790.
4
1,459.
7
642,786.4
3 Sumatera Barat 3,680.2 312,634.5 33,534.3 20,609.
8
4,342.4 1,277.
7
376,078.9
4 Riau 6,479.0 321,974.6 70,501.8 24,297.
0
9,143.2 28.5 432,424.2
Q II: INCENTIVE
Receive 75% funding from DAK
Q I: STIMULAN
Receive 10% funding from DAK
Q III: FOCUS DAK
Receive 100% funding from DAK
Q IV: DISINCENTIVE
Receive no funding from DAK
(y: FCI, x: EI)

Tengku Munawar Chalil and Mohammad Roudo
Page | 264 Copyright © 2020 Kementerian PPN/Bappenas RI
5 Jambi 4,545.0 346,552.2 30,105.9 10,824.
2
- - 392,027.2
6 Sumatera Selatan 6,631.5 362,858.8 34,954.7 12,226.
6
- 282.4 416,954.0
7 Bengkulu 147.7 360,942.9 1,345.0 - - - 362,435.6
8 Lampung 7,055.7 373,747.2 19,097.9 - - 495.3 400,396.0
9 Kepulauan Bangka
Belitung
- 393,052.9 - - - - 393,052.9
10 Kepulauan Riau 1,886.0 376,694.2 23,285.4 8,991.1 - 500.7 411,357.4
11 DKI Jakarta - 384,723.6 - - - - 384,723.6
12 Jawa Barat 24,200.8 387,084.7 63,665.7 - 37,663.
9
129.6 512,744.8
13 Jawa Tengah 17,648.4 388,189.9 13,456.3 7,087.1 1,528.1 270.9 428,180.8
14 DI Yogyakarta 1,637.6 380,565.8 1,022.5 - - - 383,225.9
15 Jawa Timur 39,184.1 434,159.9 71,424.2 21,188.
3
47,287.
2
928.6 614,172.3
16 Banten 8,642.0 432,883.0 34,922.4 16,434.
2
15,275.
6
440.0 508,597.2
17 Bali 7,094.8 430,276.8 11,960.3 11,149.
5
9,868.8 - 470,350.2
18 Nusa Tenggara
Barat
14,941.5 434,600.6 29,764.5 6,755.5 1,406.7 - 487,468.9
19 Nusa Tenggara
Timur
8,330.1 484,488.3 200,435.
9
77,172.
8
25,672.
6
410.4 796,510.1
20 Kalimantan Barat 4,007.8 498,080.6 118,753.
1
45,254.
0
4,817.7 218.6 671,131.8
21 Kalimantan
Tengah
7,173.4 520,084.2 85,915.9 25,115.
5
- 831.3 639,120.3
22 Kalimantan
Selatan
12,186.3 541,038.4 26,505.9 11,500.
9
5,767.0 - 596,998.5
23 Kalimantan Timur 12,973.8 552,884.9 21,426.9 4,178.4 - - 591,464.0
24 Kalimantan Utara 476.6 569,061.3 17,573.3 6,000.9 - - 593,112.1
25 Sulawesi Utara - 562,675.9 52,943.4 17,338.
8
7,073.8 1,283.
0
641,315.0
26 Sulawesi Tengah 15,120.0 533,884.9 88,961.6 27,270.
4
15,776.
3
809.3 681,822.6
27 Sulawesi Selatan 17,193.1 512,682.9 57,398.8 23,909.
4
21,595.
6
996.2 633,776.0
28 Sulawesi
Tenggara
15,229.5 481,955.8 41,520.2 23,214.
8
1,239.6 2,871.
6
566,031.4
29 Gorontalo 2,237.0 449,629.3 26,876.7 2,025.7 3,718.0 - 484,486.6
30 Sulawesi Barat 4,376.7 439,624.3 39,369.2 3,969.3 8,458.9 330.1 496,128.5

Tengku Munawar Chalil and Mohammad Roudo
Page | 265 Copyright © 2020 Kementerian PPN/Bappenas RI
31 Maluku 7,606.8 417,125.4 101,153.
2
56,923.
3
12,148.
5
924.0 595,881.2
32 Maluku Utara 13,896.6 393,589.8 65,594.8 40,507.
5
12,238.
5
603.3 526,430.5
33 Papua Barat 3,809.2 398,056.5 37,871.6 25,604.
3
2,537.3 4,211.
5
472,090.5
34 Papua 17,751.9 380,297.0 179,742.
2
96,539.
1
28,287.
8
16,02
4.7
718,642.6
Total 316,895.
7
14,409,82
7.4
1,796,94
8.7
725,01
5.8
362,63
8.1
35,82
5.0
17,647,15
0.6
West Indonesia 159,585.
4
6,240,067
.1
605,141.
5
231,73
5.0
211,89
9.7
6,311.
2
7,454,740
.0
East Indonesia 157,310.
3
8,169,760
.3
1,191,80
7.2
493,28
0.7
150,73
8.4
29,51
3.8
10,192,41
0.6
The second scenario as is shown in Figure 2, uses the Education PrAda Index instead
of the Education Index on the X-axis. However, it still used the Fiscal Capacity Index on the
Y-axis. The PrAda Index shows the performance of local government in several sectors
using the specific village data (PoDes). This data is initiated by the Directorate of Regional
Development– BAPPENAS.
Figure 2. Second Scenario
We calculated and estimated the amount of DAK Fisik in education for FY2021 with
the second scenario totalling about 19,26 trillion rupiah. By this total amount, the western
part of Indonesia will receive 8,27 trillion rupiah (43%) while the eastern part of Indonesia
will receive 11 trillion rupiah (57%). Table 4 shows the detail of allocation per province by
using this second scenario.
Table 4. DAK Fisik in Education FY2021 by education level per province (Scenario
2) (In Million Rupiah)
No Province Name PAUD SD SMP SMA SMK SLB TOTAL
1 Aceh 21,833.8 270,424.6 117,174.
9
75,199.9
8
23,050.
08
2,127.3
1
509,810.7
5
2 Sumatera Utara 30,212.7 283,301.6 197,879.
22
115,898.
23
112,212
.53
2,954.5
6
742,458.8
4
Q II: INCENTIVE
receives 10% DAK
Q I: .....receives noDAK
Q III: receives100% DAK
Q IV: receives 75% DAK
(y: FCI, x: PrAda)

Tengku Munawar Chalil and Mohammad Roudo
Page | 266 Copyright © 2020 Kementerian PPN/Bappenas RI
No Province Name PAUD SD SMP SMA SMK SLB TOTAL
3 Sumatera Barat 6,273.7 312,634.4 47,217.1
7
33,879.0
9
15,222.
54
3,463.4
7
418,690.4
7
4 Riau 2,287.5 321,974.6 13,474.7
5
- - - 337,200.5
3
5 Jambi 4,489.0 346,552.1 50,082.6
2
22,656.3
5
9,869.9
6
- 433,650.1
1
6 Sumatera
Selatan
6,226 362,858.7 42,457.1
0
20,970.6
3
- 506.98 433,020.1
0
7 Bengkulu 1,378.9 360,942.8 33,856.0
4
14,753.4
9
11,546.
78
72.89 422,551.0
3
8 Lampung 25,707.3 373,747.1 77,721.8
4
36,221.9 36,019.
01
780.27 550,197.5
3
9 Kepulauan
Bangka Belitung
11,515 393,052.9 13,967.5
6
7,405.13 6,726.1
6
- 432,667.4
6
10 Kepulauan Riau 1,709.4 376,694.2 22,597.6
1
11,189.1
5
4,588.5
9
746.39 417,525.4
0
11 DKI Jakarta 41,891 384,723.6 27,468.1
6
65,478.9
1
130,760
.2
2,602.7
1
652,924.7
0
12 Jawa Barat 2,512.8 387,084.6 15,096.4
6
- - - 404,694.0
2
13 Jawa Tengah 36,445 388,189.9 26,469.5
6
16,969.6
7
40,521.
9
1,270.0
1
509,866.2
2
14 DI Yogyakarta - 380,565.7 - - - - 380,565.7
9
15 Jawa Timur 26,004.1 434,159.9 121,347.
40
34,036.5
1
73,542.
3
797.90 689,888.1
8
16 Banten 4,645.4 432,883 22,069.0
7
12,015.7
3
18,128.
3
612.01 490,353.5
7
17 Bali 1,808.4 430,276.7 4,120.77 3,604.85 1,303.2 - 441,114.1
1
18 Nusa Tenggara
Barat
38,117 434,600.6 60,726.9
0
32,548.3
6
25,703.
45
2,136.6
2
593,832.9
3
19 Nusa Tenggara
Timur
10,579.7 484,488.2 274,457.
20
116,433.
27
47,922.
33
994.95 934,875.7
5
20 Kalimantan
Barat
4,533.8 498,080.6 180,239.
55
82,946.5
4
29,127.
81
430.88 795,359.2
2
21 Kalimantan
Tengah
12,031.7 520,084.1 86,787.4
2
34,997.0
9
5,280.4
5
522.11 659,703.0
3
22 Kalimantan
Selatan
9,886.2 541,038.4 22,100.2
1
12,434.5
4
4,756.5
1
- 590,215.9
8
23 Kalimantan
Timur
1,877.5 552,884.8 6,091.71 - - - 560,854.1
4

Tengku Munawar Chalil and Mohammad Roudo
Page | 267 Copyright © 2020 Kementerian PPN/Bappenas RI
No Province Name PAUD SD SMP SMA SMK SLB TOTAL
24 Kalimantan
Utara
2,997 569,061.3 23,937.8
7
12,337.6
9
- - 608,333.9
9
25 Sulawesi Utara 373.3 562,675.8 61,794.1
5
24,611.5
2
13,916.
26
1,698.9
8
665,070.1
5
26 Sulawesi
Tengah
13,563.8 533,884.9 79,085.8
4
24,111.9
1
14,991.
33
646.00 666,283.8
4
27 Sulawesi Selatan 26,904.7 512,682.8 129,431.
20
66,614.0
8
62,837.
55
1,826.8
4
800,297.2
7
28 Sulawesi
Tenggara
19,883.1 481,955.8 61,910.9
0
41,571.4
2
12,637.
07
4,893.3
7
622,851.7
8
29 Gorontalo 4,989.2 449,629.2 27,162.7
6
4,934.87 6,887.6
6
- 493,603.8
0
30 Sulawesi Barat 7,515.6 439,624.3 49,013.3
2
9,299.27 15,778.
25
406.14 521,636.9
3
31 Maluku 9,683 417,125.4 122,031.
63
74,528.1 20,444.
78
1,534.0
9
645,347.0
7
32 Maluku Utara 18,573.9 393,589.8 91,329.6
8
53,801.3 31,170.
35
1,010.2
7
589,475.4
3
33 Papua Barat 4,254.7 398,056.5 37,460.6
4
25,156 5,134.9
0
3,943.9
2
474,006.7
6
34 Papua 18,124.4 380,297 203,733.
91
119,100.
5
31,226.
32
18,597.
55
771,079.8
Total 428,831.
3
14,409,82
7.3
2,350,29
5.1
1,205,16
9.8
811,306
.8
54,576.
2
19,260,00
6.7
West Indonesia 224,941.
9
6,240,067
.1
833,000.
2
469,743.
2
483,491
.7
15,934.
5
8,267,178
.8
East Indonesia 203,889.
3
8,169,760
.2
1,517,29
4.9
735,426.
5
327,815
.0
38,641.
7
10,992,82
7.9
VI. Conclusion
This paper offers the top-down approach in the calculation of DAK Fisik in the
education sector. The calculation departs from previous methods by estimating the need of
the infrastructures in education by seeking to fill the gap between the current and the ideal
condition of the infrastructure. The gap is then calculated and estimated into the exercise of
costing. After that, the estimated cost could be financed by DAK Fisik and is calculated and
projected within a particular time frame and scenario.
Without ignoring the importance and the successful implementation of the current
bottom-up approach, the idea of the top-down approach is also essential to factor into the
process. This top-down approach through the formula presented is necessary as a baseline
and guidance for policymakers to accurately predict the overall needs of DAK Fisik based on
valid and reliable data and pertinent information being taken into account. Furthermore, this
formula-based (top-down) approach is also useful to give the idea for the central government

Tengku Munawar Chalil and Mohammad Roudo
Page | 268 Copyright © 2020 Kementerian PPN/Bappenas RI
to help them ascertain whether the proposals from the local government are either under-
budget or over-budget.
The idea of this top-down approach is not aimed to replace the bottom-up approach
through the proposal based in KRISNA DAK. The bottom-up approach could still be
endorsed since the central government may not have sufficient good judgment and may
encourage active participation for local government to provide valid and reliable data and
essential information through their proposals during the application process. We
recommend the best alternative as being the combination of both the top-down and bottom-
up approaches.
However, we still consider some weaknesses in this formula-based approach. For
instance, it could not adapt to any major negative factors during the development process.
For example, this approach is not flexible for any disaster or emergency condition, i.e., the
COVID-19 pandemic. This approach also relies too much on the supply and accuracy of data.
In the case regarding the education sector, the data came from self-reporting from the school
headmasters. School headmasters may report small damage in a classroom as “damaged,”
with fewer appraisals from officials in public works departments (Dinas Pekerjaan Umum).
Finally, there are some elements that should be fulfilled to ensure the successful
implementation of the proposed approach. For instance, the ministry/agency should set a
clear target in each planning document. In the case of the education sector, the Ministry of
Education and Culture should mention a clear target about how many newly built or
restoration of damaged infrastructures should be done over a particular time frame in each
ministry/agency planning document. This target should be later translated into a “road
map,” which is then transformed to the needs of the budget available.
Acknowledgement: The authors wish to thank the Directorate of Regional Autonomy, the
Directorate of Regional Development and the Directorate of Education and Religion, the Ministry of
Development Planning (BAPPENAS), the Ministry of Education and Culture and the KOMPAK
Project for assisting with data and information, facilitating the discussion and giving helpful inputs,
comments and feedback.
References
Denzau, A. T. (1975). An empirical survey of studies on public school spending. National
Tax Journal, 241-249.
Hirsch, W. Z. (1960). Determinants of public education expenditures. National Tax
Journal, 13(1), 29-40.
Kurban, H., Gallagher, R. M., & Persky, J. J. (2015). Demographic changes and education
expenditures: A reinterpretation. Economics of Education Review, 45, 103-108.
Ladd, H. F. (1975). Local education expenditures, fiscal capacity, and the composition of the
property tax base. National Tax Journal, 145-158.
Ma, J. (1999). Intergovernmental Fiscal Transfer: A Comparison of Nine Countries (Cases
of the United States, Canada, the United Kingdom, Australia, Germany, Japan, Korea,
India, and Indonesia). The World Bank. DOI: 10.1596/1813-9450-1822

Tengku Munawar Chalil and Mohammad Roudo
Page | 269 Copyright © 2020 Kementerian PPN/Bappenas RI
Mochida, N. (2007). Measuring Fiscal Needs: Japan’s Experience. CIRJE Working Paper.
Center for International Research on the Japanese Economy, Faculty of Economics, University
of Tokyo.
Patrinos, H. A., & Ariasingam, D. L. (1997). Decentralization of education: demand-side
financing. The World Bank.
Porcelli, F., & Vidoli, F. (2019). A comprehensive model for the evaluation of standard
expenditure needs and standard level of local services. Local Government Studies, 1-29.
Rosnes, O., & Vennemo, H. (2009). Powering up: costing power infrastructure spending
needs in Sub-Saharan Africa. World Bank Working Paper. DOI: 10.1596/28073
Schick (1998). A Contemporary Approach to Public Expenditure Management. The World
Bank Institute: 35116
Shah, A., Qibthiyyah, R., & Dita, A. (2012). General purpose central-provincial-local transfers
(dau) in Indonesia: From gap filling to ensuring fair access to essential public services for all.
The World Bank. DOI: 10.1596/1813-9450-6075
Stiglitz, J. E. (1974). The demand for education in public and private school systems. Journal
of Public Economics, 3(4), 349-385.
West, A., Pennell, H., Travers, T., & West, R. (2001). Financing school-based education in
England: poverty, examination results, and expenditure. Environment and Planning C:
Government and Policy, 19(3), 461-471.