formulation, development and evaluations of immediate ... · pdf fileformulation, development...
TRANSCRIPT

International journal of Applied Pharmaceutical a
FORMULATION, DEVELOPMENT AND EVALUATIONS OF IMMEDIATE
RELEASE TABLET OF CLOPIDOGREL BISULPHATE
Khushboo Ranka*1, Narendra Singh Solanki
1Department of Pharmaceutics, Bhopal Nobles’ Institute of Pharmaceutical
2College of Medicine and Health sciences, Department of Pharmacy, Ambo University,
ABSTRACT
This investigation is undertaken with an aim to develop pharmaceutically equivalent, stable, cost effective and quality improved formulation of clopidogrel immediate release tablet is accomplishedisintegration of the tablet administrated orally minimizes absorption time and improves its bioavailability in less time. Immediate Release tablet of Anti plate drug is formulated using direct disintegrant Crosspovidone. Clopidogrel is an inhibitor of platelet activation and decreases subsequent platelet aggregation. The current study involves preparation and evaluation of clopidogrel of dissolution rate of final formula with innovator’s product and estimation of similarity and difference factors. The kinetics study shows that the fast dissolving tablet formulation followed First order kinetic model explaining the diffusion controlled releaseclopidogrel bisulphate was found to be within the standards. The formulation Fprofile to that of innovators product at each time point. Hence, F Key words: Clopidogrel bisulphate, Immediate Release Tablets, Direct Compression
It is designed to disintegrate and release their medicaments with no special rate controlling features. These are the dosage forms in which min. immediate release may be provided for by way of an appropriate pharmaceutically acceptable diluents or carrier, which extent, the rate of drug release bioavailability of any drug from immediate release tablets, disintegration is one of the important process. Few Super disintegrants are available commercially as Croscarmellose sodium, Crosspovidone and Simmediate release tablets. The most common preparation methods are moulding, lyophilisation or freeze drying, direct compression, spray drying and sublimation. Direct compression, is one of the techniquinto the formulation. Direct compression does not require the use of water or heat during the formulation procedure and is very sensitive to changes in the type and proportion of excipients and the compression forces,
www.ijapbr.com
International journal of Applied Pharmaceutical and Biological Research, 2016,1(1
Research ArticleResearch ArticleResearch ArticleResearch Article ISSN : 2456
1
FORMULATION, DEVELOPMENT AND EVALUATIONS OF IMMEDIATE
RELEASE TABLET OF CLOPIDOGREL BISULPHATE
, Narendra Singh Solanki1, Anamika Chouhan1, Kamal Singh Rathore
Department of Pharmaceutics, Bhopal Nobles’ Institute of Pharmaceutical Udaipur (Rajasthan) India
College of Medicine and Health sciences, Department of Pharmacy, Ambo University, Ambo, Ethiopia
This investigation is undertaken with an aim to develop pharmaceutically equivalent, stable, cost effective and quality improved formulation of clopidogrel bisulphate immediate release tablets. The task of developing immediate release tablet is accomplished by using a suitable diluents and supedisintegration of the tablet administrated orally minimizes absorption time and improves its bioavailability in less time. Immediate Release tablet of Anti plate drug is formulated using direct compression using super
Clopidogrel is an inhibitor of platelet activation and decreases subsequent platelet The current study involves preparation and evaluation of clopidogrel bisulphate
solution rate of final formula with innovator’s product and estimation of similarity and difference factors. The kinetics study shows that the fast dissolving tablet formulation followed First order kinetic model explaining the diffusion controlled release mechanism The similarity and dissimilarity factor obtained for
was found to be within the standards. The formulation F-8 exhibited similar release profile to that of innovators product at each time point. Hence, F-8 was considered as the best formulation.
, Immediate Release Tablets, Direct Compression
INTRODUCTION
It is designed to disintegrate and release their medicaments with no special rate controlling features. These are the dosage forms in which ≥ 75% of labelled amount dissolves with in 30
release may be provided for by way of an appropriate pharmaceutically or carrier, which diluents or carrier does not prolong, to an appreciable
extent, the rate of drug release and/or absorption. To enhance dissolution and hence bioavailability of any drug from immediate release tablets, disintegration is one of the important process. Few Super disintegrants are available commercially as Croscarmellose sodium, Crosspovidone and SSG. Several Technologies are available to manufacture immediate release tablets. The most common preparation methods are moulding, lyophilisation or freeze drying, direct compression, spray drying and sublimation. Direct compression, is one of the techniques that requires the incorporation of a superdisintegrant
the formulation. Direct compression does not require the use of water or heat during the formulation procedure and is very sensitive to changes in the type and proportion of
compression forces, when used to achieve tablets of suitable hardness
2016,1(1):1-21
ISSN : 2456-0189
FORMULATION, DEVELOPMENT AND EVALUATIONS OF IMMEDIATE
RELEASE TABLET OF CLOPIDOGREL BISULPHATE
, Kamal Singh Rathore2
Department of Pharmaceutics, Bhopal Nobles’ Institute of Pharmaceutical Sciences
College of Medicine and Health sciences, Department of Pharmacy, Ambo University,
This investigation is undertaken with an aim to develop pharmaceutically equivalent, stable, cost effective and immediate release tablets. The task of developing
d by using a suitable diluents and super disintegrant. Faster disintegration of the tablet administrated orally minimizes absorption time and improves its bioavailability in
compression using super Clopidogrel is an inhibitor of platelet activation and decreases subsequent platelet
bisulphate tablets, comparison solution rate of final formula with innovator’s product and estimation of similarity and difference factors.
The kinetics study shows that the fast dissolving tablet formulation followed First order kinetic model mechanism The similarity and dissimilarity factor obtained for
8 exhibited similar release s the best formulation.
It is designed to disintegrate and release their medicaments with no special rate controlling 75% of labelled amount dissolves with in 30
release may be provided for by way of an appropriate pharmaceutically or carrier does not prolong, to an appreciable
To enhance dissolution and hence bioavailability of any drug from immediate release tablets, disintegration is one of the important process. Few Super disintegrants are available commercially as Croscarmellose
Several Technologies are available to manufacture immediate release tablets. The most common preparation methods are moulding, lyophilisation or freeze drying, direct compression, spray drying and sublimation. Direct
es that requires the incorporation of a superdisintegrant the formulation. Direct compression does not require the use of water or heat during the
formulation procedure and is very sensitive to changes in the type and proportion of when used to achieve tablets of suitable hardness

Available online www.ijapbr.com
Khushboo Ranka et al IJAPBR 2016; 1(1): 1-21
2
without compromising the rapid disintegration characteristics. Recently, immediate release tablets have gained prominence of being new drug delivery systems. Most immediate release tablets are intended to disintegrate in the stomach, where the pH is acidic. The objective of this article was to investigate the superdisintegrants in 0.01N HCl and their efficiency in promoting disintegration and dissolution of active ingredients from directly compressed tablets of clopidogrel bisulphate. Clopidogrel has been approved and marketed globally with the primary indication being to reduce atherosclerotic events in patients with several co-morbid conditions due to stroke, myocardial infarction and cardiovascular disease. Clopidogrel is an inhibitor of platelet activation and aggregation through the irreversible binding of its active metabolite to the P2Y12 class of ADP receptors on platelets. The blockade of this receptor inhibits platelet aggregation by blocking activation of the glycoprotein IIb/IIIa pathway. The active metabolite has an elimination half-life of about six hours and acts by forming a disulfide bridge with the platelet ADP receptor.
MATERIALS AND METHODS Materials Clopidogrel bisulphate powder drug was given by the Aarti Drug Ltd., low- substitute hydroxyl propyl cellulose (L-HPC) given by Shin Etsu, Japan, microcrystalline cellulose was given by the Accent Microcell Industry, Cross Povidone was given by Wockhardt Research Centre Aurangabad (India), Starch 1500 (Pregelatinized starch) given by Colorcon Asia Pvt. Ltd., colloidal silicon dioxide was given by Signet Chemical, Magnesium stearate was given by SD Fine Chem Ltd., Mumbai, Cotab RFC was given by Colorcon Asia Pvt .Ltd. Methods Preformulation Studies Preformulation testing is the first step in the rationale development of dosage forms of a drug substance. It can be defined as an investigation of physical and chemical properties of a drug substance alone and when combined with excipients. The overall objective of preformulation testing is to generate information useful to the formulator in developing stable and bioavailable dosage forms, which can be mass-produced. Identification of pure drug: Identification of clopidogrel bisulfate was carried out by Infra Red Absorption Spectrophotometry.
Drug-Excipients Compatibility studies by FTIR Study: Fourier transform infrared (FTIR) spectra of clopidogrel bisulfate and physical mixture of drug and excipients were recorded using potassium bromide KBr mixing method on FTIR instrument as depicted in Figure 1 to 8
Procedure:
(a) Drug: Excipients Ratio
(b) Drug and excipients were taken in the ratios as mentioned in table no.6.9
Pack details
USP type I Clear transparent glass vials with bromobutyl rubber stopper and aluminium seal. (c) Storage condition
1. 40ºC±2°C / 75%RH± 5 % RH
API and excipients were been thoroughly mixed in predetermined ratio given in above table and passed through the 40# sieve. The blend was to be filled in transparent glass vials and were closed with gray coloured rubber stoppers and further sealed with aluminium seal and charged in to stress condition at above condition. Similarly API should also be kept at all

Available online www.ijapbr.com
Khushboo Ranka et al IJAPBR 2016; 1(1): 1-21
3
condition as for the samples. Samples were withdrawn for analysis within two day of sampling date as per the compatibility study plan. Physical observation should be done at every week up to 1 month and FTIR studies were carried out to determine the compatibility of excipients with the drug.
Solubility studies: The solubility of drug in various solvent was determined by using shake flask method. Excess amount of drug that can be dissolved was added to 250 ml conical flask containing 100 ml of dissolution media. The shaking process was carried for 24 hours by keeping the conical flask on rotary shaker at 200 rpm. A portion of drug dissolved in distilled water, methanol, ethyl ether and 0.1N HCl was filtered through membrane filter (0.45μm) and concentration of drug in the filtrate was determined at 270 nm by UV Spectrophotometer.
Melting point determination :
Melting point of clopidogrel bisulphate was determined by melting point apparatus.
Loss on Drying: Loss on drying was carried out by using halogen moisture analyser at 105oC.
UV spectroscopy: The first step in preformulation is to establish a simple analytical method so that all future measurements can be quantitative. Most drugs absorb light in the ultraviolet wavelengths (190-390 nm) region, since they are generally aromatic or contain double bonds.
Standard calibration curve for Clopidogrel bisulphate in 0.1N HCl Buffer 100 mg of Clopidogrel bisulfate was dissolved in small amount of 0.1N HCl (pH 2) buffer and volume was made up to 100 ml (= 1000µg/mL) using the same, which is called as stock-I solution, further dilution were carried out in 0.1N HCl (pH 2). From this stock-I solution serial dilutions were made to obtain solutions of the drug in the concentration ranging from 50,100,150,200,250,300, 350,400,450,500 and 550µg/ml. The absorbance of the solutions was measured at 270nm using UV-visible spectrophotometer. A graph of concentration vs. absorbance was plotted. Preparation of (pH 2) 0.1N HCL buffer: - Take 7.35 gm of KCl and dissolve in 100ml of water and 7.35 ml HCl in 100 ml of water. Pipette out 50ml of KCl solution and 85mL of HCl solution and make up to 1000ml.
Micromeritic Properties of Drug and Blend:- Determination of Bulk Density
The bulk density of the ingredients was evaluated using a graduated cylinder. It is the ratio of total mass of powder to the bulk volume of powder. It was measured by pouring the weighed powder into a graduated measuring cylinder and the volume was noted. It is expressed in gm/mL and is given by
Bulk Density (ρb) = ���� �� �� ��� (�)
����� �� �� ���� ��� (��) I. Tapped Density :It is the ratio of total mass of powder to the tapped volume of
powder. The tapped volume was measured by tapping the powder to constant volume. It is expressed in gram/ml and is given by
Tapped Density (ρt) = ���� �� �� ��� (�)
��� ����� �� �� ��� (��)

Available online www.ijapbr.com
Khushboo Ranka et al IJAPBR 2016; 1(1): 1-21
4
II. Hausner’s Ratio:
It indicates the flow properties of the granules and is measured by the ratio of tapped density to the bulk density.
Hausner’s Ratio = Tapped density/Bulk density
III. Compressibility index (Carr’s index): Compressibility index is an important measure that can be obtained from the bulk and tapped densities. In theory, the less compressible a material the more flowable it is. A material having values of less than 20% is defined as the free flowing material.
CI = (��� ������ – ���� ������) ��� ������ × 100
IV. Determination of Angle of Repose
Angle of Repose is an indication of the frictional forces existing between granule particles. It is the maximum angle possible between the surface of the pile of granules and the horizontal plane:
tan θ = h / r
Where θ is the angle of repose; h is the height of the heap of powder and r is the radius of the heap of the powder.
Therefore θ = tan-1 (h/r).
Formulation of Compressed Tablets of Clopidogrel Bisulfate
The methodology adopted included:
1) Preparation of core tablets of clopidogrel bisulphate
2) Coating of the core tablets
Tablets of clopidogrel bisulphate were formulated by incorporating diluents such as Microcrystalline cellulose pH 102 and other excipients like Starch 1500 (direct compressible), Crosspovidone (Superdisintegrant), L-HPC (disintegrant), Magnesium Stearate (Lubricant), Aerosil® (glidant) etc. The core tablets were further coated with red oxide of iron, isopropyl alcohol and methylene dichloride.
Evaluations of Tablet
i. Shape of Tablets Compressed tablets were examined under the magnifying lens for the shape of the tablets.
ii. Tablet Dimensions Thickness and diameter of tablets were measured using a Vernier Callipers. It was determined by checking ten tablets from each formulation. It is expressed in mm.
iii. Hardness
Hardness indicates the ability of a tablet to withstand mechanical shocks while handling. The hardness of the tablets was determined using Digital Hardness Tester. It was expressed in kg/cm2.Ten tablets were selected and hardness of the tablets was measured.

Available online www.ijapbr.com
Khushboo Ranka et al IJAPBR 2016; 1(1): 1-21
5
iv. Friability
For tablets with an average weight of 650mg or less take a sample of whole tablets corresponding to about 6.5 gm and for tablets with an average weight of more than 650 mg take a sample of 10 whole tablets. Dedust the tablets carefully and weigh accurately the required number of tablets. Place the tablets in the Roché friabilator. The friabilator was operated at 25 rpm for four minutes (100 revolutions) then remove any loose dust from them and weigh them accurately. A maximum loss of weight not greater than 1.0 per cent is acceptable for most tablets (Table 32). The percent friability was calculated using equation
% F = 1- "#" × 100
Where, % F = friability in percentage
W = Initial weight of tablet
W0 = weight of tablets after revolution
Table 1:- Different Formulations of Clopidogrel Bisulfate
v. variation Test
Weigh individually 20 units selected at randomly and calculate the average weight. Not more than two of the individual weights deviate from the average weight by more than the percentage shown in the Table 13 and none deviates by more than twice that percentage as shown in Table 5.8.
S. No.
Name of the chemical used Quantity used in mg F1 F2 F3 F4 F5 F6 F7 F8
Dry Mix 61. Clopidogrel bisulfate 98 98 98 98 98 98 98 98 2. Microcrystalline Cellulose 115.6 - - - - - - - 3. Microcrystalline Cellulose
PH 102 - 115.6 105.6 125.6 110.60 105.60 110.60 105.60
4. Starch 50 50 60 - - - - - 5. Starch 1500 - - - 40 5o 55 55 60 6. L- HPC 5.6 5.6 5.6 5.6 10.60 10.60 5.60 5.60 7. Cross Povidone 5.4 5.4 5.4 5.4 5.4 5.4 5.4 5.40 8. Aerosil 2.7 2.7 2.7 2.7 2.7 2.7 2.7 2.70 Lubrication 9. Magnesium Stearate 2.7 2.7 2.7 2.7 2.7 2.7 2.7 2.70 Total-280.00mg
Coating
10. Cotab RFC(Red oxide of iron)
10 10 10 10 10 10 10 10
11. Isopropyl Alcohol(mL) q.s q.s q.s q.s q.s q.s q.s q.s 12. Dichloromethane(mL) q.s q.s q.s q.s q.s q.s q.s q.s

Available online www.ijapbr.com
Khushboo Ranka et al IJAPBR 2016; 1(1): 1-21
6
vi. Disintegration Time Weight In the present study disintegration test was carried out on six tablets using the apparatus specified in USP (Electro quip, disintegration apparatus USP). The distilled water at 37°C ± 2°C was used as a disintegration media.
vii. Assay: Twenty tablets were weighed and powdered. A quantity of powder containing about 0.1gm of clopidogrel bisulfate was weighed. The weighed quantity was shaken with 70mL of water for 15min. This was diluted to 100mL with water and filtered. 10mL of the solution was diluted to 100mL.The absorbance of the resulting solution was observed at 270nm.
viii. Dissolution study
In vitro dissolution study was carried out for optimized formulation of clopidogrel bisulfate and Plavix tablet (Marketed) in 0.1N HCl buffer and analyzed at 270 nm by UV spectrophotometer and plotted graph as shown in Figure. Dissolution Test parameters Medium: pH 1.0 HCl buffer Apparatus: Apparatus 2 (Paddle) Speed: 50 rpm Temperature: 37±0.5°C Run time: 60 min ix. Dissolution Profile Comparison Comparative dissolution profiles are used as 1. The basis for formulation development of bioequivalent drug products and proceeding to the pivotal in-vivo bioequivalence study; 2. Comparative dissolution profiles are used for demonstrating the equivalence of a change in the formulation of a drug product after the drug product has been approved for marketing; and 3. The basis of a bio-waiver of a lower-strength drug product that is dose proportional in active and inactive ingredients to the higher-strength drug product.
Dissimilarity factor (f 1) Dissimilarity factor (f1) describes the relative error between two dissolution profiles. It approximately gives the percent error between curves. The percent error is zero when the test and reference profiles are identical and increases proportionally with the dissimilarity between the two profiles.
Dissimilarity factor (f1) was calculated from the following equation.
$% = '(( − *)( ∗ %,,
Dissimilarity factor (f1) should be between 0 to15 Similarity factor (f 2) The resulting dissolution profile was compared to the targeted profile by means of the Food and Drug Administration (FDA) recommended model-independent approach utilizing the similarity factor (f2). This similarity factor is algorithmic reciprocal square root transformation of the sum of squared errors, and it serves as a measure of the similarity of two respective dissolution profiles.
$- = ., ∗ /01 {3 % + '(( − *)56 7
8½
∗ %,,} Where,

Available online www.ijapbr.com
Khushboo Ranka et al IJAPBR 2016; 1(1): 1-21
7
n = number of observations R = mean percent drug dissolved of reference product T = mean percent drug dissolved of test product
The FDA guidance states that two profiles are considered equivalent if the f2 score is greater than 50.11
RESULTS
6.1 Identification of drug:
6.1.1 Identification of drug by IR spectroscopy:
The IR spectrum of pure drug was found to be similar to the standard spectrum of clopidogrel bisulfate. The spectrum of clopidogrel bisulfate shows the following functional groups at their frequencies.
Figure 6.1: FTIR of drug
Table 6.1: IR- spectra of pure drug (Clopidogrel bisulphate)
S.No. Region in
Cm-1
Type of Vibration Function
Group
present
1. 1753.03 C=O Stretching Ketone
2. 1651.18 C=C Stretching Ethers
3. 1174.39 C-O Stretching Carbonyl
4. 2924.96 C-H Stretching Alkyne
Available online www.ijapbr.com
Khushboo Ranka et al IJAPBR 2016; 1(1): 1-21
8
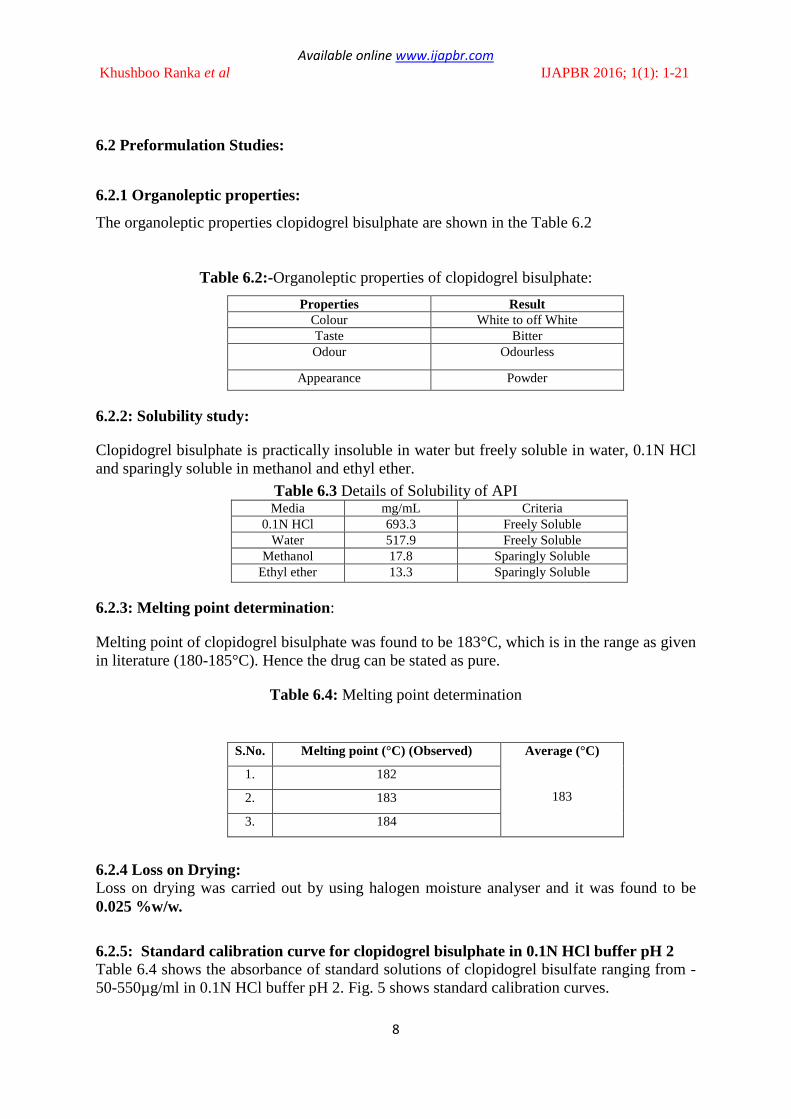
6.2 Preformulation Studies:
6.2.1 Organoleptic properties:
The organoleptic properties clopidogrel bisulphate are shown in the Table 6.2
Table 6.2:-Organoleptic properties of clopidogrel bisulphate:
Properties Result Colour White to off White Taste Bitter Odour Odourless
Appearance Powder
6.2.2: Solubility study:
Clopidogrel bisulphate is practically insoluble in water but freely soluble in water, 0.1N HCl and sparingly soluble in methanol and ethyl ether.
Table 6.3 Details of Solubility of API Media mg/mL Criteria
0.1N HCl 693.3 Freely Soluble Water 517.9 Freely Soluble
Methanol 17.8 Sparingly Soluble Ethyl ether 13.3 Sparingly Soluble
6.2.3: Melting point determination:
Melting point of clopidogrel bisulphate was found to be 183°C, which is in the range as given in literature (180-185°C). Hence the drug can be stated as pure.
Table 6.4: Melting point determination
S.No. Melting point (°C) (Observed) Average (°C)
183
1. 182
2. 183
3. 184
6.2.4 Loss on Drying: Loss on drying was carried out by using halogen moisture analyser and it was found to be 0.025 %w/w.
6.2.5: Standard calibration curve for clopidogrel bisulphate in 0.1N HCl buffer pH 2 Table 6.4 shows the absorbance of standard solutions of clopidogrel bisulfate ranging from -50-550µg/ml in 0.1N HCl buffer pH 2. Fig. 5 shows standard calibration curves.

Khushboo Ranka et al
Table-6.5: Standard calibration curve for
S.No.
1.
2. 3. 4. 5. 6. 7. 8. 9. 10. 11.
Figure 6.2: Calibration curve of drug in 0.1N HCl buffer pH 2 solution
Available online www.ijapbr.com
IJAPBR 2016; 1(1): 1
9
Standard calibration curve for clopidogrel bisulfate in 0.1HCl buffer pH2
Concentration ( µg/mL)
Absorbance ƛmax 270 in 0.1N HCL buffer pH 2
50 0.045
100 0.151 150 0.220 200 0.320 250 0.420 300 0.556 350 0.663 400 0.752 450 0.838 500 0.952 550 1.077
Table 6.6 Regression Analysis
Figure 6.2: Calibration curve of drug in 0.1N HCl buffer pH 2 solution
Observation
R²
0.9978
Slop(m)
0.0021
0.0728
IJAPBR 2016; 1(1): 1-21
in 0.1HCl buffer pH2
270 in 0.1N
Figure 6.2: Calibration curve of drug in 0.1N HCl buffer pH 2 solution

Available online www.ijapbr.com
Khushboo Ranka et al IJAPBR 2016; 1(1): 1-21
10
6.2.6Micromeritic properties evaluation:
Table 6.7: Micromeritic properties of API: S.No. Parameters Results Flow Properties
1. Bulk density(gm/mL) 0.680 - 2. Tapped density (gm/mL) 0.850 - 3. Carr's Index (%) 20 Fair 4. Hausners' Ratio(HR) 1.25 Free Flowing 5. Angle of Repose(°) 39° Passable
The results of angle of repose (<40) indicate passable properties of the powder. This was further supported by lower compressibility index values. Generally, compressibility index values upto15% results in good to excellent flow properties
Table 6.8: Micromeritic Properties of Excipients:- Parameters MCC Starch 1500 Cross
povidone L- HPC Aerosil Magnesium
Stearate
Bulk density(gm/mL) 0.437 0.642 0.234 0.346 0.099 0.388
Tapped density(gm/mL) 0.546 0.917 0.286 0.494 0.125 0.4818
Carr's index (%) 19.96 29.98 22.22 29.95 20.8 19.29
Hausners' Ratio 1.24 1.42 1.22 1.42 1.26 1.23
Angle of Repose (°) 27.1 28.2 28.5 26.1 19.8 22
6.2.7: Drug excipients compatibility study:
a) Physical compatibility:
Table 6.9: Result of physical compatibility of drug
Drug + Excipients Ratio Observations on appearance
Initial (Colour)
At 40°C±2°C 75%RH±5% for 1 Month
Drug 1 White No Change
Microcrystalline cellulose 1:1 White No Change
L-HPC 1:1 White No Change
Available online www.ijapbr.com
Khushboo Ranka et al IJAPBR 2016; 1(1): 1-21
11
Starch 1500 1:1 White No Change
CSD 1:1 White No Change
Magnesium Stearate 1:1 White No Change
Cross Povidone 1:1 White No Change
Drug+MCC+L-
HPC+Aerosil+Magnesium Stearate
+Cross Povidone
Proportional
Mixture
White No Change
Drug+MCC+L-
HPC+Aerosil+Magnesium Stearate
+Cross Povidone+ Coating Material
Proportional
Mixture
White No Change
b) Compatibility with FTIR + graphs
1. Compatibility with Drug + L-HPC
Fig 6.3: FT-IR Spectra of Drug+ L-HPC
2. Compatibility with Drug+ Starch 1500
Fig 6.4: FT-IR Spectra of Drug+ Starch 1500
Available online www.ijapbr.com
Khushboo Ranka et al IJAPBR 2016; 1(1): 1-21
12
3. Compatibility with Drug + Cross Povidone
Fig: 6.5 FT-IR Spectra of Drug+ Cross povidone 6.3 Introduction of Reference product
Table 6.10: Reference product description
Innovator Parameter Observation
Brand Name Plavix
Strength 75 mg
Description Brown colored, Round shaped, biconvex coated
tablets.
Weight 290±5% mg
Hardness 5.0±0.4 kg/cm2
Thickness 4.0±0.30 mm
Disintegration Time 5 min 20 sec
Assay (%) 98.8
Available online www.ijapbr.com
Khushboo Ranka et al IJAPBR 2016; 1(1): 1-21
13
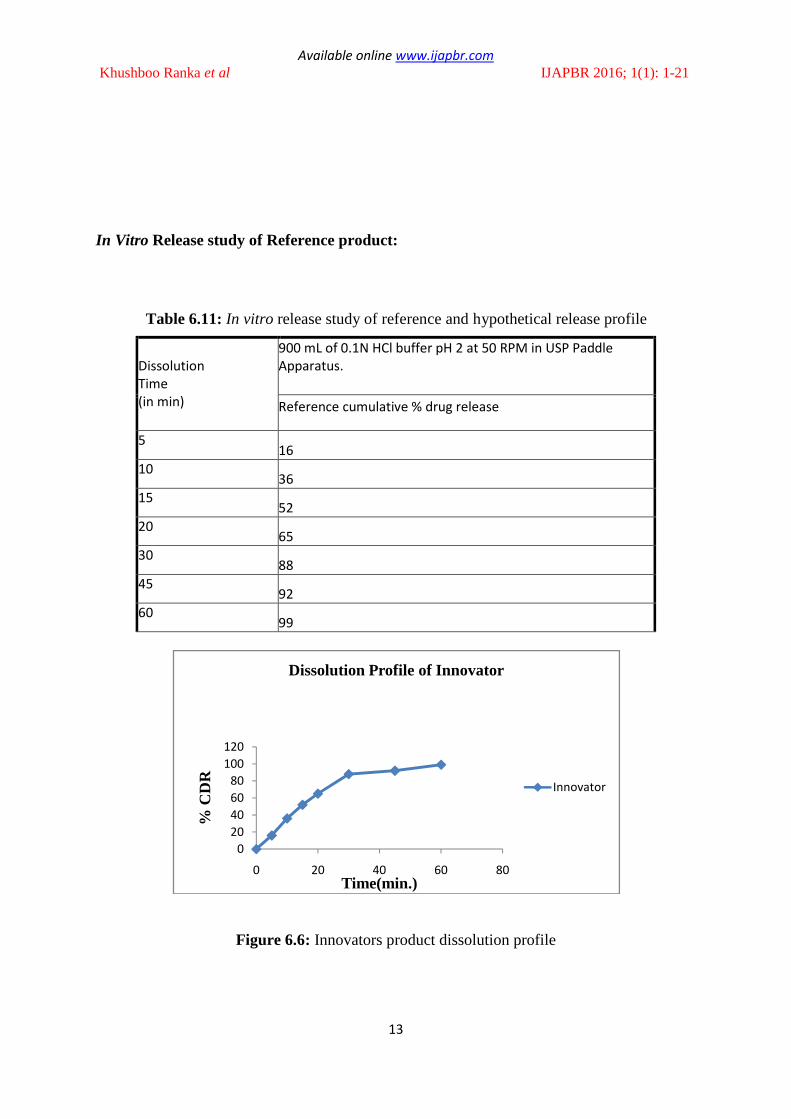
In Vitro Release study of Reference product:
Table 6.11: In vitro release study of reference and hypothetical release profile
Dissolution
Time
(in min)
900 mL of 0.1N HCl buffer pH 2 at 50 RPM in USP Paddle
Apparatus.
Reference cumulative % drug release
5 16
10 36
15 52
20 65
30 88
45 92
60 99
Figure 6.6: Innovators product dissolution profile
0
20
40
60
80
100
120
0 20 40 60 80
% C
DR
Time(min.)
Dissolution Profile of Innovator
Innovator

Available online www.ijapbr.com
Khushboo Ranka et al IJAPBR 2016; 1(1): 1-21
14
6.4: Evaluations of Tablets 6.4.1: Evaluations of Powder blend
Table 6.12: Evaluations of Powder of Blend:- S.No. Formulatio
n Code
Bulk density(gm/mL)
Tapped density(gm/mL)
Carr's index (%)
Hausner's Ratio (HR)
Angle of Repose(°
) 1. F1 0.596 0.785 24.07 1.31 38.23 2. F2 0.581 0.714 18.60 1.22 25.51 3. F3 0.654 0.802 18.60 1.22 37.12 4. F4 0.694 0.834 16.67 1.20 36.34 5. F5 0.480 0.625 23.07 1.30 42.13 6. F6 0.519 0.732 23.09 1.44 29.48 7. F7 0.583 0.745 21.74 1.27 26.48 8. F8 0.583 0.714 18.60 1.22 28.81
In the above table characteristics of the powder blend from F-1 to F-8 is given. From the values of angle of repose, Hausners’ ratio and Carr’s Index we can conclude that blend of the above formulations have good flow properties.
6.4.2 Physical parameters of Tablets: Various evaluation post compression parameters for factorial Batch F1 to F8 like weight variation, thickness, and hardness, friability and disintegration time were measured. Weigh variation test by taking the average weight and the formula. Hardness test was performed by Digital Hardness Tester. Friability test was performed by Roché Friabilator (25 rpm for four min). In vitro disintegration time was measured by disintegration apparatus in the suitable media. The results of all the tests were tabulated in the following table.
Table 6.13 Physical parameters of Tablets batch F1 to F8
Batch No
Avg. Tab wt. (mg)
Thickness (mm)
Hardness (Kg/cm2)
Friability (%)
DT (Min) Assay (%)
F1 290 ± 5% 3.93-4.0 ±0.3 3-4 ±0.05 0.12 3-4 97.4
F2 290 ± 5% 3.93-4.0 ±0.3 3-4 ±0.05 0.15 3-4 97
F3 290 ± 5% 3.93-4.0 ±0.3 3-4 ±0.05 0.07 3-4 99.2 F4 290 ± 5% 3.93-4.0 ±0.3 3.5-4 ±0.05 0.02 4-5 98.3 F5 290 ± 5% 3.93-4.0 ±0.3 4-5 ±0.05 0.12 4.5-5 97.4 F6 290 ± 5% 3.93-4.0 ±0.3 4-5 ±0.05 0.04 4.5-5 98.5 F7 290 ± 5% 3.93-4.0 ±0.3 4-5 ±0.05 0.11 5-6 97.6
F8 290 ± 5% 3.93-4.0 ±0.3 4-5 ±0.05 0.15 5-6 98
Discussion
The thickness of the tablets was found to be in the range of 3.93±0.03 to 4.0±0.03mm. The results showed that the thickness of all formulated tablets is found to be uniform. The hardness of all tablet formulations was found to be in the range of 3±0.05 to 5±0.05 kg/cm2. It indicates all the tablets have adequate mechanical strength. The accepted percentage
Available online www.ijapbr.com
Khushboo Ranka et al IJAPBR 2016; 1(1): 1-21
15
deviation was ±5% for more than 324 mg weight tablets. In friability test the maximum weight loss should be not more than 1%. The results revealed that the tablets passed the friability test.
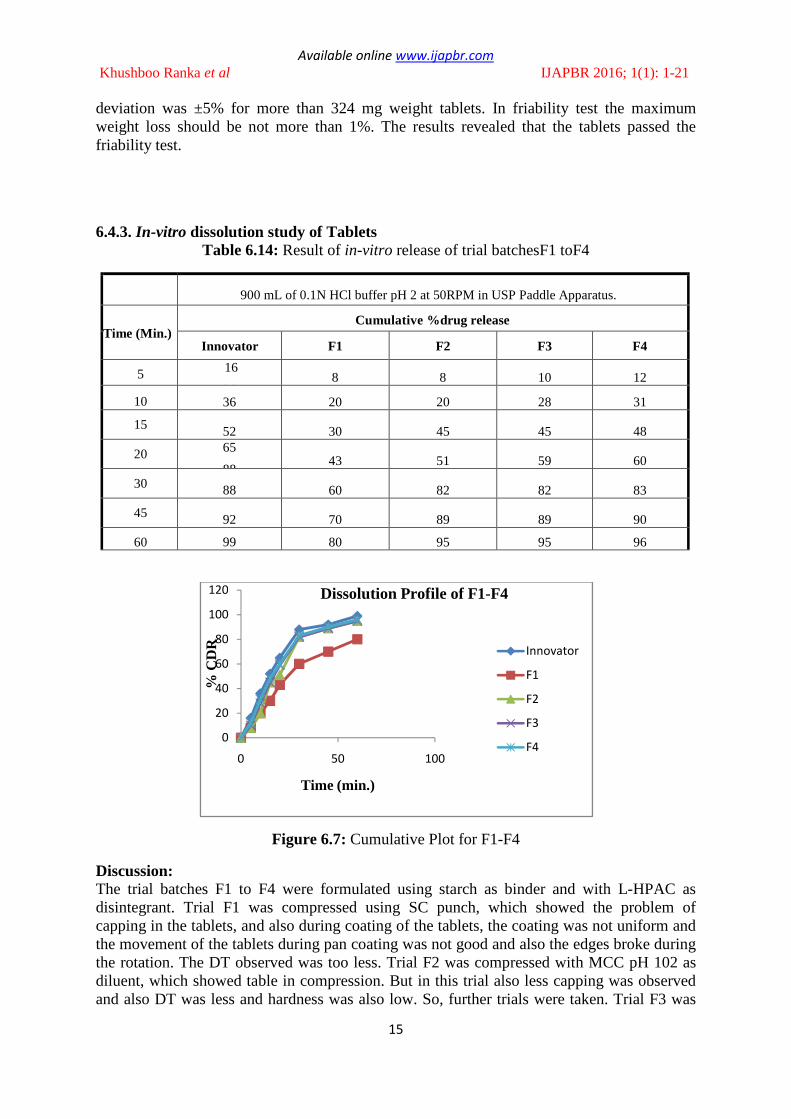
6.4.3. In-vitro dissolution study of Tablets
Table 6.14: Result of in-vitro release of trial batchesF1 toF4
900 mL of 0.1N HCl buffer pH 2 at 50RPM in USP Paddle Apparatus.
Time (Min.) Cumulative %drug release
Innovator F1 F2 F3 F4
5 16
36 8 8 10 12
10 36 20 20 28 31
15 52 30 45 45 48
20 65
88 43 51 59 60
30 88 60 82 82 83
45 92 70 89 89 90
60 99 80 95 95 96
Figure 6.7: Cumulative Plot for F1-F4
Discussion: The trial batches F1 to F4 were formulated using starch as binder and with L-HPAC as disintegrant. Trial F1 was compressed using SC punch, which showed the problem of capping in the tablets, and also during coating of the tablets, the coating was not uniform and the movement of the tablets during pan coating was not good and also the edges broke during the rotation. The DT observed was too less. Trial F2 was compressed with MCC pH 102 as diluent, which showed table in compression. But in this trial also less capping was observed and also DT was less and hardness was also low. So, further trials were taken. Trial F3 was
0
20
40
60
80
100
120
0 50 100
% C
DR
Time (min.)
Dissolution Profile of F1-F4
Innovator
F1
F2
F3
F4

Available online www.ijapbr.com
Khushboo Ranka et al IJAPBR 2016; 1(1): 1-21
16
compressed with an increase in the binder concentration. In this trial also table in compression was observed with less DT. Broken edges were also observed during coating. So, further trials were taken. Trial F4 was compressed with using starch 1500 in place of starch as binder, which is pregelatine starch and also direct compressible property. In this trial capping was not observed with an increase in DT but very less as compared to the reference product. So, further trials were taken.
Table 6.15: Result of in vitro release of trial batchesF5 toF8
Figure 6.8: Cumulative Plot for F5-F8
Discussion: The trials F5-F8 were formulated using starch1500 as binder and L-HPC as a disintegrant. None of the trials showed capping defect as was in the previous trials. Trial F5 was
0
20
40
60
80
100
120
0 20 40 60 80
% C
DR
Time (min.)
Dissolution Profile of F5-F8
Innovator
F5
F6
F7
F8
900 mL of 0.1N HCl buffer pH 2 at 50RPM in USP Paddle Apparatus.
Time (Min.) Cumulative %drug release
Innovator F5 F6 F7 F8
5 16
3633
14 16 17 17
10 36 33 35 36 38
15 52 50 51 54 55
20 65 61 63 64 66
30 88 85 88 88 90
45 92 92 93 94 94
60 99 98 97 97 97

Khushboo Ranka et al
formulated after slight increase in the binder and disintegrant concentration. Friability was found to be in the specified range. The DT was also found to beprevious trials but was not matched with the reference. But it showed slight appearance problem and also broken edge were observed during coating of the tablet. So, further trials were taken. Trial F6 was formulated after more incdisintegrant concentration.it showed improves appearance. Butmatch the reference specifications.. So, further trials were taken.after slight decrease in the disintegrant concentration using DC punches. This trial showed almost similar parameters as compared to the reference product accept the dissolution data. So, further trial was taken. Trial F8 was formulated after increasing the concentration of binder. This trial showed almost similar parameters as compared to the reference product and drug release from the formulation occurred similar to the reference product.formulation F8 was considered to be the final batch and was compared with the reference
In- vitro release Kineti
3.3 In vitro release kinetic data graph of trial batches F1 to F4
Figure 9: First Order plot for formulation F5
Available online www.ijapbr.com
IJAPBR 2016; 1(1): 1
17
formulated after slight increase in the binder and disintegrant concentration. Friability was found to be in the specified range. The DT was also found to be increased as compared to previous trials but was not matched with the reference. But it showed slight appearance problem and also broken edge were observed during coating of the tablet. So, further trials
Trial F6 was formulated after more increase in the binder concentrationand also disintegrant concentration.it showed improves appearance. But the DT of the trial but did not match the reference specifications.. So, further trials were taken. Trial F7 was formulated
disintegrant concentration using DC punches. This trial showed almost similar parameters as compared to the reference product accept the dissolution data.
Trial F8 was formulated after increasing the concentration of his trial showed almost similar parameters as compared to the reference product and
drug release from the formulation occurred similar to the reference product.formulation F8 was considered to be the final batch and was compared with the reference
release kinetic data graph of trial batches F1 to F4
Fig: 10 KorsemeyerPeppas plot for formulation F1Figure 9: First Order plot for formulation F5-F8
IJAPBR 2016; 1(1): 1-21
formulated after slight increase in the binder and disintegrant concentration. Friability was increased as compared to
previous trials but was not matched with the reference. But it showed slight appearance problem and also broken edge were observed during coating of the tablet. So, further trials
rease in the binder concentrationand also T of the trial but did not
Trial F7 was formulated disintegrant concentration using DC punches. This trial showed
almost similar parameters as compared to the reference product accept the dissolution data. Trial F8 was formulated after increasing the concentration of
his trial showed almost similar parameters as compared to the reference product and drug release from the formulation occurred similar to the reference product. So, the formulation F8 was considered to be the final batch and was compared with the reference.
Fig: 10 KorsemeyerPeppas plot for formulation F1-F4

Available online www.ijapbr.com
Khushboo Ranka et al IJAPBR 2016; 1(1): 1-21
18
6.4.5 Calculation of f1 and f2 Value
Table 6.17: Calculation of f1 and f2 value of final Product (F8)
N Innovator(R) T(F8) R-T (R-T)² f1Value f2Value
5 16 17 1 1
3.36
95
10 32 38 6 36
15 52 55 3 9
20 65 66 1 1
30 88 90 2 4
45 94 94 0 0
60 99 97 2 4
DISCUSSION
The data for calculation of f1 and f2 were shown in Table 6.24. The dissimilarity similarity and factor obtained for clopidogrel bisulfate was found to be within the standards. The standards for similarity factor and dissimilarity factor are 0-15 and 50-100 6.5 Result of stability study Batch F8 was put on stability as below mentioned condition. Batch No. : F8
Formulation
Zero-Order Kinetic data Higuchi Matrix kinetic data First-Order kinetic data Korsemeyer-Peppas data
R² C K(mg.hr-1)
R² C K(mg hr-1/2)
R² C K(hr-1) R² C n
F1 0.935 7.1752 1.3708 0.9813 20.699 13.538 0.9923 2.0088 0.012 0.9594 1.4473 0.9234
F2 0.8839 9.5412 1.6955 0.9374 25.722 16.928 0.9807 2.0695 0.023 0.9223 1.3374 1.0127
F3 0.8662 14.863 1,6275 0.9392 18.749 16.013 0.9883 2.0451 0.0227 0.9173 1.5357 0.8937
F4 0.8662 14.863 1.6275 0.9399 15.414 15.676 0.9908 2.0476 0.024 0.9214 1.646 0.8242
F5 0.8651 16.107 1.644 0.9415 13.628 15.69 0.9862 2.0856 0.028 0.9304 1.7203 0.7763
F6 0.844 17.907 1.6202 0.925 10.296 15.295 0.9803 2.0424 0.0267 0.9305 1.8048 0.728
F7 0.8355 19.067 1.6079 0.9218 8.1504 15.057 0.9843 2.0355 0.0271 0.9274 1.8471 0.7037
F8 0.8345 20.149 1.599 0.9083 6.4019 14.902 0.9743 2.0212 0.0271 0.915 1.8643 0.6964
Table 6.16: In vitro release kinetic data for the Batch F1-F8

Available online www.ijapbr.com
Khushboo Ranka et al IJAPBR 2016; 1(1): 1-21
19
Conditions: 40°C/ 75±5% RH
Table 6.18: Result of stability study Data
Pack Alu – Alu Blister
Condition 40˚C/75%RH
Batch No. F08 In vitro drug release
Time (min) Initial 1 month 2 month 3month
0 0
0 0 0
5 17
16.80 16.70 16.55
10 38
37.90 37.85 37.71
15 55
54.76 54.75 54.21
20 66
65.87 65.84 65.21
30 90
89.45 89.35 89.03
45 94
93.67 93.60 93.01
60 97
96.78 96.72 96.11
Assay (%) 98 97.7 97.2 97
Figure 6.18: Cumulative Plot for formulationF8 After Stability test
0
20
40
60
80
100
120
0 20 40 60 80
% C
DR
Time (min.)
Dissolution Profile after Stability Study of F8 Batch
Initial
1month
2month
3month

Available online www.ijapbr.com
Khushboo Ranka et al IJAPBR 2016; 1(1): 1-21
20
The result of stability study showed that there was no change in the formulation after 1, 2, 3 month. In vitro drug release study show that after one month, the drug release throughout the time period obtained was within the range of targeted release profile and the assay result was also stable.
CONCLUSION
The present study was undertaken to develop clopidogrel bisulfate immediate tablets of 75mg, comparable to the innovators product (Plavix-Sanofi-Aventis). Based on the results, suitable excipients were selected for formulation development. Various formulas of clopidogrel bisulphate were prepared by using direct compression method. The tablets were formulated using Cross povidone as super disintegrant, micro crystalline cellulose pH 102 as filler, Starch 1500 which is direct compressible and aerosil, magnesium stearate. The advantage of such formulation is that it is cheaper and do not require expensive equipments for manufacture. In post compression parameter, all the tablets of F8 formulation were found to be of round shape with no cracks. The thickness of tablet indicates that, die fill was uniform. Drug content was found to be uniform and the formulations possessed sufficient hardness and friability indicating a good mechanical strength of the developed formulations. The weights of all the formulations were found to be within pharmacopeia limit. All good formulation from eight batches were evaluated for in vitro drug release in 0.1N HCL pH 2 buffers using USP type II dissolution apparatus at 50 rpm. The dissolution profiles of the batches were compared with that of innovator product. Among all eight formulations F8 batch showed good results compare to all other batches. Compare to F8 batch there were no among all eight formulations F8 batch showed matching in vitro drug release to that of innovator. The optimized batch tablets were packed in HDPE containers and performed stability studies at 40°C/75%RH. Stability samples were evaluated initially and after one months, two month and three month.
All the results were found to be satisfactory. Hence the designed and developed formula of clopidogrel was stable. Clopidogrel bisulphate immediate release tablets developed in the present work was found to be pharmaceutically equivalent to innovators product.
REFERENCES
1. Herbert A.liberman., Leon lachman. Joseph B. Schwartz “Pharmaceutical dosage forms Marcel Dekker Inc. 2. Tablets: A novel approach to drug delivery: International Journal of Current Pharmaceutical Research 2011; 3(1): 1-7. 3. Annke Frick, Helga Moller, Ehrenfried Wirbitzki. Biopharmaceutical characterization of oral immediate release drug products- In vitro / in vivo comparison of phenoxymethylpenicillin potassium, glimepiride and levofloxacin. European Journal of Pharmaceutics and Biopharmaceutics, 1998; 46:305–311. 4. Susijit Sahoo, B. Mishra, PIK. Biswal, OP Panda, SK Mahapatra and GK Jana: Fast Dissolving Tablet: As A Potential Drug Delivery System, Drug Invention Today 2010; (2): 130-133. 5. A Gupta, AK Mishra, V Gupta, P Bansal, R Singh and AK Singh. Recent Trends of Fast Dissolving Tablet- An Overview of Formulation Technology, International Journal of Pharmaceutical & Biological Archives. 2010; 1(1): 1 – 10 6. Rakesh Patel and Ajay Suthar: Formulation and Process Optimization of Cinnarizine Fast-Release Tablets, Pharmaceutical Technology. 33(8): 53- 59.

Available online www.ijapbr.com
Khushboo Ranka et al IJAPBR 2016; 1(1): 1-21
21
7. R Margret, B Jayakar, A Pasupathi, BL Maurya. J. of Pharm. Res., 2009, 2(6), 1039-1041. 8. Sree Giri Prasad. B, Gupta VRM, Devanna N, Rama Devi. M, Tamilselvan A1, Siva Subramanian, JGTPS, 2014; 5(4): 2154 – 2166
9. Remington The Science and Practice of Pharmacy 22nd
Edition, Lippincott Williams & Wilkins International Student Edition. 10. Handbook of Pharmaceutical Excipients, 2nd Edition. 11. United States Pharmacopoeia 30 NF 25 The Official Compendia of Standards. Published by United States Pharmacopoeial Convention, Inc. Rockville, 2007; 32, 74-78.