forrester report: the total economic impact of netscaler · the total economic impact™ of ......
TRANSCRIPT

A Forrester Total Economic
Impact™ Study
Commissioned By
Citrix
Project Director:
Sean Owens
October 2015
The Total Economic
Impact™ Of Citrix
NetScaler Cost Savings And Business Benefits Enabled By NetScaler

Table Of Contents
Executive Summary .................................................................................... 3
Disclosures .................................................................................................. 4
TEI Framework And Methodology ............................................................ 5
Analysis ........................................................................................................ 6
Financial Summary ................................................................................... 19
Citrix NetScaler: Overview ....................................................................... 20
Appendix A: Composite Organization Description .............................. 21
Appendix B: Total Economic Impact™ Overview ................................. 22
Appendix C: Forrester And The Age Of The Customer ....................... 23
Appendix D: Glossary ............................................................................... 24
Appendix E: Endnotes .............................................................................. 24
ABOUT FORRESTER CONSULTING
Forrester Consulting provides independent and objective research-based
consulting to help leaders succeed in their organizations. Ranging in scope from a
short strategy session to custom projects, Forrester’s Consulting services connect
you directly with research analysts who apply expert insight to your specific
business challenges. For more information, visit forrester.com/consulting.
© 2015, Forrester Research, Inc. All rights reserved. Unauthorized reproduction is strictly prohibited.
Information is based on best available resources. Opinions reflect judgment at the time and are subject to
change. Forrester®, Technographics
®, Forrester Wave, RoleView, TechRadar, and Total Economic Impact
are trademarks of Forrester Research, Inc. All other trademarks are the property of their respective
companies. For additional information, go to www.forrester.com.

3
Executive Summary
Citrix commissioned Forrester Consulting to conduct a Total Economic Impact™ (TEI) study and examine the potential
return on investment (ROI) enterprises may realize by deploying NetScaler. The purpose of this study is to provide readers
with a framework to evaluate the potential financial impact of the NetScaler on their organizations, based on the results from
existing customers. Readers should be able to develop their own business case to measure possible improvements in
application reliability and deliver improved services, all to win, serve, and retain customers.
To better understand the benefits, costs, and risks associated with a NetScaler implementation, Forrester interviewed
several customers with multiple years of experience using NetScaler. They primarily or exclusively have purchased
NetScaler SDX devices, which provide multitenancy options for organizations to consolidate application delivery controller
(ADC) instances while still delivering a high-availability solution.
Prior to NetScaler, the customers had all implemented other ADC devices. However, these devices were harder to manage,
did not offer the same consolidation potential (so were overall more expensive), and did not catch all application server
issues, leading to some application downtime. These led to:
› High device and licensing costs.
› Extra resource costs associated with managing ADC devices,
troubleshooting, and reviewing support materials.
› Lost revenue and profit from missed sales opportunities due to
disruptions related to ADC or load-balancing issues.
With NetScaler, they were able to automate more application
management tasks and found management tools easier to use.
Downtime related to load-balancing issues was also eliminated.
One network engineer said, “I’ve never had a NetScaler crash, and we’ve got a lot of them running.”
NETSCALER HELPS REDUCE COSTS, AUTOMATE TASKS, AND IMPROVE APPLICATION RELIABILITY
A composite organization, based on interviews with four existing customers and subsequent financial analysis, experienced
the risk-adjusted ROI benefits and costs shown in Figure 1.1 See Appendix A for a description of the composite organization.
The composite organization analysis points to annual benefits of $419,407 to $1,049,407 versus implementation costs of
($698,016) plus annual costs of ($120,000), adding up to a net present value (NPV) of $879,623.
With NetScaler SDX, the organization consolidated its ADC devices from 12 to six and reduced ADC-related full-time
equivalent (FTE) headcount from four to 2.5. Improved application reliability led to an estimated, risk-adjusted total of
$121,500 per year in profit from avoided customer losses.
FIGURE 1
Financial Summary Showing Three-Year Risk-Adjusted Results
ROI: 88%
NPV: $879,623
IRR: 91%
Payback: nine months
15 avoided ADC device purchases
Source: Forrester Research, Inc.
“I’ve never had a NetScaler
crash, and we’ve got a lot of
them running.”
~ Network engineer, US healthcare organization

4
› Benefits. The composite organization experienced the following risk-adjusted benefits that represent those experienced by
the interviewed companies:
• Cost savings from replaced, retired, and avoided devices, plus avoided previous-ADC-solution planned
purchases, adding up to $792,000 in Year 1, $477,000 in Year 2, and $162,000 in Year 3. With Citrix NetScaler
SDX licensing and scalable instances, the organization was able to reduce physical device deployment and
management costs for replaced and retired devices as well as avoid expensive purchases in the future. In addition,
the reduction in physical ADCs reduced the costs associated with accommodating them within the network
infrastructure.
• Reduced resource costs related to application management and support of $99,840 per year. Citrix NetScaler
SDX devices support fully isolated virtual load-balancing instances, have easier management interfaces, and have
more helpful support documentation. The organization was able to save time managing and supporting NetScaler
devices because there were fewer physical boxes with less cabling and hardware configuration, so each device
(even with multiple virtual instances) is easier to manage.
• IT improvements related to specific application setup and management totaling $36,067 per year. Interviewed
organizations highlighted improvements in one or two specific tasks related to application support, reliability, and
load-balancing, such as configuring a new application server cluster for testing, or setting up a virtual IP.
• $121,500 per year in business improvements and opportunities from improved application reliability. With
improved application reliability, issues related to customer- or partner-facing applications are greatly reduced or
eliminated. One interviewed organization highlighted that previous ADCs for a key web application wouldn’t
recognize an issue with a partially down server, so users were directed to a server that would return a 404 or other
error, leading to dissatisfaction, transaction abandonment, and lost revenue.
› Costs. The composite organization experienced the following risk-adjusted costs:
• Citrix NetScaler purchase costs of $660,000 for SDX devices, as well as $120,000 per year in maintenance
and support costs. These are the upfront costs to purchase the devices, as well as ongoing costs for Citrix support,
updates, and service.
• Deployment resource costs of $38,016. The organization assigned three FTEs for four weeks to set up and
deploy Citrix NetScaler, including migrating application settings and rules from old systems to NetScaler.
Disclosures
The reader should be aware of the following:
› The study is commissioned by Citrix and delivered by Forrester Consulting. It is not meant to be used as a competitive
analysis.
› Forrester makes no assumptions as to the potential ROI that other organizations will receive. Forrester strongly advises
that readers use their own estimates within the framework provided in the report to determine the appropriateness of an
investment in Citrix NetScaler.
› Citrix reviewed and provided feedback to Forrester, but Forrester maintains editorial control over the study and its findings
and does not accept changes to the study that contradict Forrester's findings or obscure the meaning of the study.
› Citrix provided the customer names for the interviews but did not participate in the interviews.
5
TEI Framework And Methodology
INTRODUCTION
From the information provided in the interviews, Forrester has constructed a Total Economic Impact™ (TEI) framework for
those organizations considering implementing Citrix NetScaler. The objective of the framework is to identify the cost, benefit,
flexibility, and risk factors that affect the investment decision, to help organizations understand how to take advantage of
specific benefits, reduce costs, and improve the overall business goals of winning, serving, and retaining customers.
APPROACH AND METHODOLOGY
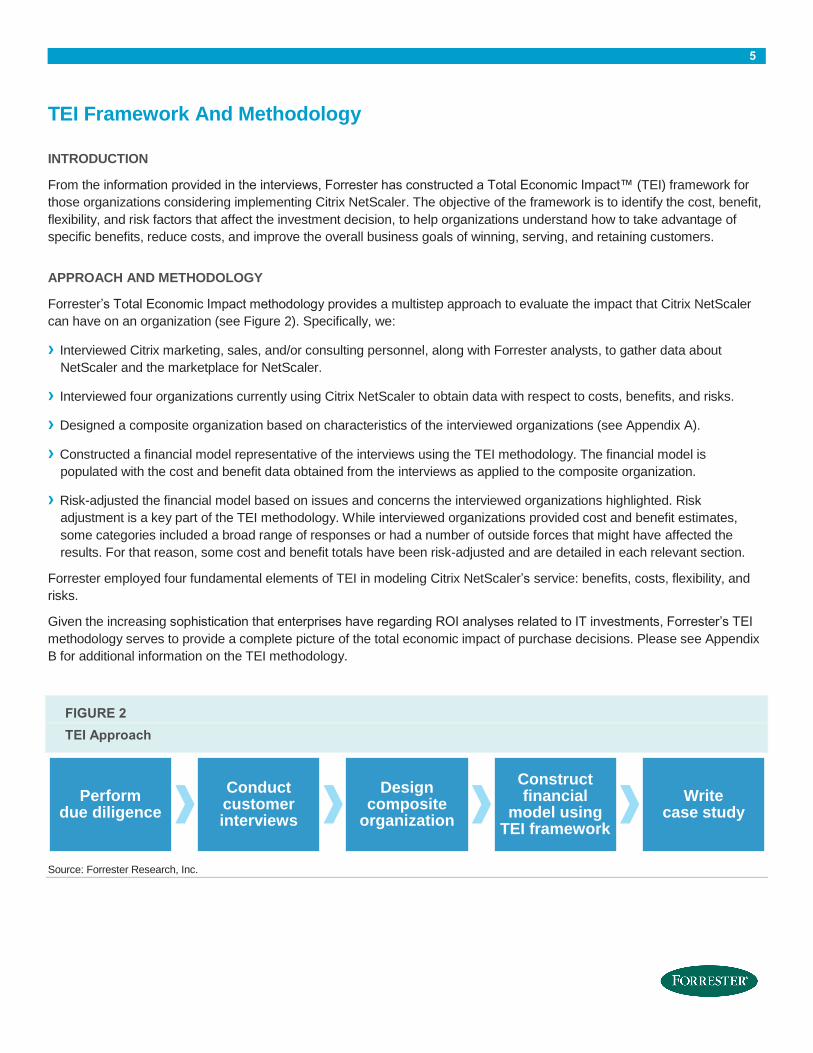
Forrester’s Total Economic Impact methodology provides a multistep approach to evaluate the impact that Citrix NetScaler
can have on an organization (see Figure 2). Specifically, we:
› Interviewed Citrix marketing, sales, and/or consulting personnel, along with Forrester analysts, to gather data about
NetScaler and the marketplace for NetScaler.
› Interviewed four organizations currently using Citrix NetScaler to obtain data with respect to costs, benefits, and risks.
› Designed a composite organization based on characteristics of the interviewed organizations (see Appendix A).
› Constructed a financial model representative of the interviews using the TEI methodology. The financial model is
populated with the cost and benefit data obtained from the interviews as applied to the composite organization.
› Risk-adjusted the financial model based on issues and concerns the interviewed organizations highlighted. Risk
adjustment is a key part of the TEI methodology. While interviewed organizations provided cost and benefit estimates,
some categories included a broad range of responses or had a number of outside forces that might have affected the
results. For that reason, some cost and benefit totals have been risk-adjusted and are detailed in each relevant section.
Forrester employed four fundamental elements of TEI in modeling Citrix NetScaler’s service: benefits, costs, flexibility, and
risks.
Given the increasing sophistication that enterprises have regarding ROI analyses related to IT investments, Forrester’s TEI
methodology serves to provide a complete picture of the total economic impact of purchase decisions. Please see Appendix
B for additional information on the TEI methodology.
FIGURE 2
TEI Approach
Source: Forrester Research, Inc.
Perform due diligence
Conduct customer interviews
Design composite
organization
Construct financial
model using TEI framework
Write case study

6
Analysis
COMPOSITE ORGANIZATION
For this study, Forrester conducted a total of four interviews with representatives from the following companies, all of which
have significant Citrix NetScaler implementations:
› A Canadian personal and commercial insurance provider.
› A regional healthcare organization in the southeast United States, with nearly 100 locations and 18,000 employees
(including 3,000 providers).
› A North American transportation and logistics organization with 25,000 employees.
› A financial services firm located in the UK. with about 1,000 employees but a very large portfolio of applications.
Based on the interviews, Forrester constructed a TEI framework, a composite company, and an associated ROI analysis that
illustrates the areas financially affected. The composite organization that Forrester synthesized from these results represents
an organization with the following characteristics:
› A North American insurance firm (the kind of firm that manages access and security across multiple applications for
external customers and partners, as well as internal resources).
› 15,000 employees.
› Eight Citrix NetScaler SDX 11500 series devices purchased for this implementation, across four locations, and that support
30 total virtual instances.
› 100 applications managed by NetScaler devices.
› Four FTEs that support NetScaler.
› The NetScaler devices replaced 15 non-Citrix ADC devices (but were somewhat comparable to single instance MPX or
smaller SDX 8000-series devices).
After an extensive RFP and business case process evaluating multiple vendors, the composite organization chose Citrix
NetScaler and began deployment:
› Implementation started in 2013, with the first full year in
production from mid-2014 to mid-2015.
› The first phase focused on a limited set of applications (the 100
applications listed above is a subset of the organization’s full
portfolio of applications).
› The first phase also focused significantly on reducing the number
of ADC devices.
INTERVIEW HIGHLIGHTS
With Citrix NetScaler, the organization was able to meet a number
of its goals to resolve issues and better take advantage of
opportunities.
“We needed a system like SDX
to exist because I couldn’t have
bought 50 physical appliances
to load-balance everywhere.”
~ Network engineer, Canadian insurance
provider

7
Situation
Before NetScaler, the organization relied on an application infrastructure of non-Citrix devices that it knew needed to be
upgraded or replaced, due to the age of the ADC devices and new business requirements, such as:
› An organizational focus to get the most from IT (not necessarily just cost reduction, though that is a part).
› A second (sometimes conflicting) organizational focus to ensure that IT helps drive and improve business opportunities.
› And, as a way to save IT time and ensure application consistency, simplify and automate common application
management tasks.
Solution
The organization was able to meet all these goals by purchasing and deploying six NetScaler SDX 11500 series devices in
three company data center locations.
Results
With NetScaler, the organization was able to deliver better
application reliability and scalability to help simplify IT and ensure
fast and exceptional application performance for customers,
partners, and internal users.
› Fewer NetScaler physical devices were required with
NetScaler SDX. The organization reduced the number of ADC
devices while increasing capacity using virtualized NetScaler
instances in the SDX appliance that provide better flexibility while
reducing physical complexity. The organization also estimates it
would have had to purchase many more non-NetScaler ADCs to
meet the same level of reliability and scale, meaning significant
avoided hardware and licensing costs.
› Applications are more reliable. The organization has seen a marked improvement in application performance over
previous load-balancers, which is particularly important for applications to external customers or partners. One interviewed
organization remembered dealing with “zombie” servers — they weren’t down but they wouldn’t run the application either.
The previous ADC was not able to reliably identify the server as down, so business partners and customers accessing an
application (a high-availability web application, such as an insurance policy configuration and purchase page) would see
an error page. With NetScaler, any customers and partners that would have seen this issue and might have chosen to take
their business elsewhere no longer see any issues related to improper load-balancing, and the organization is able to
retain these customers and partners.
› IT tasks are streamlined and simplified. Due to the simple and easy-to-use management interfaces and built-in wizards,
the organization saw a decrease in IT time and resource requirements for ongoing management tasks. With fewer physical
devices, less time was required to deal with hardware configuration and issues. Further, the NetScaler management
interface and help materials were both praised for their ease-of-use and ability to find information and complete tasks.
“Before, we only had one
production and lab unit. Now,
we have dev, pre-prod, and
prod environments.”
~ Telecom architect at a North American
transportation and logistics organization

8
BENEFITS
The composite organization experienced a number of quantified
benefits in this case study:
› Reduced device hardware and management costs from retired
devices and avoided future planned purchases, and reduced
network complexity associated with fewer physical devices to
ensure redundancy and resiliency.
› Reduced day-to-day IT management resource costs with fewer
devices and easier-to-use NetScaler management tools.
› Faster IT task completion with NetScaler automated tasks and
support resources, including moving applications to production servers.
› Improved business performance with more-reliable application delivery.
Reduced Device Hardware And Management Costs
The organization was able to reduce the number of application ADC devices required to manage its applications
with NetScaler SDX devices running multiple virtual instances. The organization can take advantage of NetScaler
multitenancy to virtualize multiple NetScaler instances on one device, and avoid the added costs of having to
buy, configure, and manage ADC devices dedicated to relatively small or minor applications. “We needed a
system like SDX to exist because I couldn’t have bought 50 physical appliances to load-balance everywhere,”
said the network engineer of the Canadian insurance provider.
TABLE 1
Device Cost Savings From Retired And Avoided Devices
Ref. Metric Calculation Initial Year 1 Year 2 Year 3
A1 Number of ADC devices retired since NetScaler
12 12 12
A2 Annual management licensing cost per ADC device
$15,000 $15,000 $15,000
A3 Number of ADC devices purchases avoided with NetScaler
10 5 0
A4 Cost per pre-NetScaler ADC device
$70,000
At Device cost savings from retired and avoided devices
(A3*A4)+(A1*A2) $0 $880,000 $530,000 $180,000
Risk adjustment ↓10%
Atr Device cost savings from retired and avoided devices (risk-adjusted)
$0 $792,000 $477,000 $162,000
Source: Forrester Research, Inc.
“To date, nothing that we had
to do was impossible with the
Citrix NetScaler.”
~ Network engineer, Canadian insurance
provider
9
This consolidation and multitenancy helps reduce costs
but also can help provide a more-consistent network
environment. Between development, testing, and
production, even small changes (such as different load-
balancing settings) can lead to significant issues.
While the organization’s previous ADC devices may
have been cheaper or cost less for annual management
and support (when comparing just one device from
before and after), the organization was able to save
total costs due to the ability to consolidate applications
and manage them with fewer NetScaler devices.
The organization purchased and deployed six
NetScaler SDX 11500 series devices across three data centers (paired for high availability). These six devices
replaced 12 existing non-Citrix ADC devices, as well as 15 more devices planned over the next two years to
meet the same scale and reliability requirements as the NetScaler SDX implementation.
The organization replaced 12 old devices with NetScaler, meaning they could end that a maintenance contract
and planned ADC purchases in the next two years could also be avoided. As shown in Table 1, this adds up to
$880,000 in Year 1, $530,000 in Year 2, and $180,000 in Year 3. Given that planned purchase assumptions may
have been lower than predicted, or that higher-priced ADC devices could be purchased in the future, a 10% risk-
adjustment has been applied (see the section on Risks for more detail). The risk-adjusted totals are $792,000 in
Year 1, $477,000 in Year 2, and $162,000 in Year 3.
Reduced Resource Management Requirements
As a direct result of reducing the number of ADC devices required to manage its applications, the organization
was also able to reduce the number of FTEs required to manage NetScaler devices, which includes avoiding the
addition of new hires in the future. This is attributed to greater automation and the ability to make changes to
virtual ADCs with the click of a button instead of having to physically touch servers and networking equipment.
As shown in Table 2, the organization reduced its current ADC-dedicated FTE resources from four to 2.5
(reallocated to other IT tasks or reduced through natural attrition) and avoided the hiring of one additional FTE.
Note that this table focused on the basic everyday tasks of managing and supporting ADC devices, which are
expected to take up about two-thirds of resource time (some specific tasks that take up the remaining one-third of
time are detailed in the next section). Also, recovered
work time is not fully available for work tasks — there
are breaks, HR matters, side projects, and the like that
take up a significant portion of a person’s time. These
resource savings add up to a total of $124,800 per
year; however, a 20% risk adjustment has been applied
in the event that the planned FTE hire was not required
(see the section on Risks for more detail). The risk-
adjusted total is $99,840 per year.
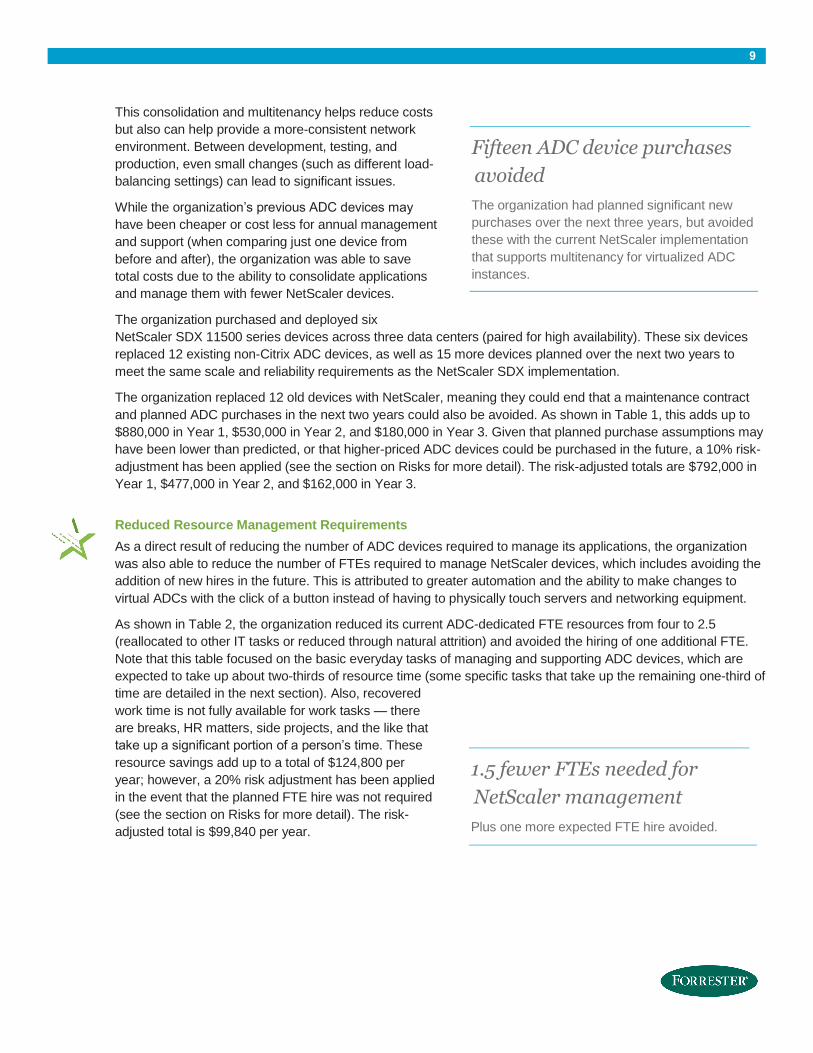
Fifteen ADC device purchases
avoided
The organization had planned significant new
purchases over the next three years, but avoided
these with the current NetScaler implementation
that supports multitenancy for virtualized ADC
instances.
1.5 fewer FTEs needed for
NetScaler management
Plus one more expected FTE hire avoided.

10
TABLE 2
Accelerated New Business Initiation: Processing Time Improvements Led To Time Savings
Ref. Metric Calculation Initial Year 1 Year 2 Year 3
B1
FTEs dedicated to day-to-day
ADC support and management
before NetScaler
4.0
B2
Added FTE avoided by
implementing NetScaler (that
would have been hired to support
extra ADC devices)
1.0 1.0 1.0
B3
FTEs dedicated to day-to-day
NetScaler support and
management
2.5 2.5 2.5
B4 IT resource FTE hourly rate
$72 $72 $72
B5 Percent of time spent on ADC
management and support
67% 67% 67%
B6 Percent of recovered time
allocated to work tasks
50% 50% 50%
Bt Resource management savings (B1+B2-B3)*
B4*B5*B6*2080 $0 $124,800 $124,800 $124,800
Risk adjustment ↓20%
Btr Resource management savings
(risk-adjusted) $0 $99,840 $99,840 $99,840
Source: Forrester Research, Inc.
Specific IT Task Savings
In addition to day-to-day ADC management, the organization identified several tasks that, while not especially
frequent, were specific examples of improvements
enabled by NetScaler:
› The organization would set up virtual IP addresses at
a rate of about one per week, and they would take
around 40 minutes for simple web apps or as much
as a day or two for very complex applications. On
average, a virtual IP setup took 5.3 hours. With
NetScaler, the interface is more streamlined, and if
more research is needed to properly set up virtual IPs
(for those complex applications), Citrix provides more-
thorough resources and support. “I must say it was
going to take me twice as long because there’s just
“NetScaler is easier. I can work
faster. I do not have enough
time through the day so why
not do it faster.”
~ Lead network engineer, US healthcare
organization

11
more to research and think about and worry about, because there’s so much more opportunity for
complications,” said the network engineer for a regional healthcare provider.
TABLE 3
Accelerated New Business Initiation: Processing Time Improvements Lead To Time Savings
Ref. Metric Calculation Initial Year 1 Year 2 Year 3
C1 Virtual IP setups per week (on average)
1 1 1
C2 Time per VIP setup before NetScaler (average, in hours)
5.3
C3 Time per VIP setup with NetScaler (average, in hours)
2.7 2.7 2.7
C4 Hours per year saved on virtual IP setups
138.7 138.7 138.7
C5 ADC configuration scripting tasks, per week (on average)
2.0 2.0 2.0
C6 Time per config. scripting before NetScaler (average, in hours)
1.5
C7 Time per config. scripting with NetScaler (average, in hours)
0.2 0.2 0.2
C8 Hours per year saved on change requests and server configurations
135 135 135
C9
Application deployment tasks per week (assume one app deployment or update per year)
2 2 2
C10 Time per app before NetScaler (average, in hours)
10
C11 Time per app with NetScaler (average, in hours)
3 3 3
C12 Hours per year saved on app deployment
728 728 728
C13 IT resource hourly rate $72 $72 $72
C14 Percent of recovered time allocated to work tasks
50% 50% 50%
Ctr IT task savings (C4+C8+C12)*
C13*C14 $0 $36,067 $36,067 $36,067
Source: Forrester Research, Inc.
› ADC configuration scripting changes would be required around two times a week and would take 1.5 hours
before NetScaler. With NetScaler, it’s about 10 minutes. The network engineer for a UK financial services firm
said, “To do anything more advanced [with the previous ADC solution], you would have to write a script, and

12
unfortunately, the scripts aren’t very intuitive. Whereas, on Citrix NetScaler, it is intuitive; there is no need to
understand scripting, no need to investigate, no need to look online.”
› The organization deploys an application or application update to its production environment about twice a
week. Before NetScaler this task would take 10 hours, on average to configure load balancing in pre-
production and production, and test any network differences between the two environments. With NetScaler,
configuration scripts can be imported, and ADC virtualization ensures that environments from test to pre-
production to production are very similar if not identical. “Before, we only had production and one lab unit. Now,
we have dev, pre-prod, and prod environments,” said the telecom architect at a North American transportation
and logistics organization. The network engineer at a UK financial services firm concurred, “You would do
something in staging but something would be different. You’re not really getting a true picture.” Since NetScaler
this task has been reduced to about 3 hours.
This adds up to more than 1,000 hours saved each year. Since not all time recovered is used for new work tasks
(they might work on side projects, get a cup of coffee, socialize with their team – all important parts of working at
a successful company but not included in this analysis) that factor, along with an average IT hourly rate, are
applied.
As shown in Table 3, this adds up to $36,067 per year
in recovered IT task time.
Business Improvement Due To Avoided Customer
And Partner Issues
The organization’s application portfolio managed by
ADC devices includes several customer- and partner-
facing web applications that need to always be up and
running. These applications provide insurance brokers
with policy information, configuration, and purchasing,
that brokers can use to provide a client a quote and
then sell the policy. Insurance brokers work with a
variety of insurance companies, so if one provider’s
web application is down, the company stands to lose a
significant amount of business — both for the one lost
transaction as well as long term as those brokers start to avoid one company in favor of others.
The organization wanted to avoid this possibility. Over the past several years, their previous ADC devices had
incorrectly recognized some problem application servers as running properly. These servers were in a “zombie”
state where the operating system and application were running, but something happened where the application
was not responding to transaction queries, was frozen,
or some other error had occurred that meant the server
could appear normal to ADC devices but would not
actually be responsive. This meant that one server in a
load-balanced infrastructure would be unresponsive,
but traffic would still be sent to that server; in a four-
server configuration that would mean that when this
error occurred, about one in four brokers would see an
error page. Refreshing would usually work but not
always, and by that time with a client waiting in their
office for an answer, the broker would try another
provider’s site. The network engineer at a Canadian
Two downtime events avoided
per year
The organization found that NetScaler’s
improved reliability meant they no longer
experienced issues related to some application
server issues going unnoticed by their ADC
solution.
“Our main driver is selling
insurance. It’s not providing
Internet services.”
~ Network engineer at a Canadian insurance
provider

13
insurance company provided a specific example: “A broker that logged into our system was being load balanced
with very little probing. So sometimes, if a server would enter into a state where the socket is still listening but the
server is not doing the job it’s supposed to, brokers would get an error page, not the site.”
The organization estimates that this used to happen about two times each year, and would sometimes take as
much as a day (on average, it was more like 6 hours of business time that was lost) before the error was
identified, diagnosed, and corrected. While downtime can affect individual businesses in different ways, this
particular organization estimates that it can close about 25 transactions through brokers (or direct to customers)
each hour through their web applications. Some of these brokers would continue to sell policies from the
organization to other clients, but others would avoid the organization altogether in the future. An estimated profit
margin for revenue generated through these brokers via the web applications is also applied.
TABLE 4
Profit From Avoided Business Downtime
Ref. Metric Calculation Initial Year 1 Year 2 Year 3
D1 Server outages per year before NetScaler
2
D2 Hours per outage (on average)
6.0
D3 Revenue lost per missed transaction during outage
$1,000
D4 Estimated revenue lost from future transactions from brokers who left
$5,000
D5 Brokers impacted by web outage per hour (on average)
25
D6 Percentage of brokers lost due to outage
50%
D7 Outages since NetScaler 0 0 0
D8 Revenue regained from avoided business downtime
$900,000 $900,000 $900,000
D9 Profit margin for web application transactions
15%
Dt Profit from avoided business downtime
D8*D9 $0 $135,000 $135,000 $135,000
Risk adjustment ↓10%
Dtr Profit from avoided business downtime (risk-adjusted)
$0 $121,500 $121,500 $121,500
Source: Forrester Research, Inc.
With NetScaler, the organization saw improved error recognition and notifications, so that zombie servers were
identified correctly and taken out of production automatically. The network engineer continued: “Now, at the first
sign of failures, NetScaler readjusts traffic load to other nodes and also notifies our team immediately to quickly

14
deal with the matter and either repair or replace the problem server and put it back into production.” Overall, the
organization has seen zero outages due to improper load-balancing since NetScaler was deployed.
As shown in Table 4, this added availability adds up to $900,000 in total recovered revenue per year, or
$135,000 per year in recovered profit to the organization. A 10% risk adjustment is applied, as it is hard to
correctly measure the average number of brokers using the site in an hour that might be affected, as well as how
many might decide to take their business elsewhere and how much they would have purchased in the future. The
risk-adjusted total is $121,500 per year (see the section on Risks for more detail).
Additionally, while not able to provide quantitative details, the UK financial services firm identified another benefit
that many other organizations might expect to see improvement with NetScaler. “Now, ultimately, our
development life cycle is a lot quicker,” said the network engineer for that UK firm. “We can now say with
certainty that testing is exactly what you would expect in production.” With improved, standardized, load-
balancing and configuration across dev, test, and production, not only are application deployment and
configuration tasks quicker (as described in the previous benefit section), but applications can be completed and
launched in production faster. This can greatly impact revenue and reduce costs, whether that application is a
retail eCommerce app to sell insurance policies directly, a secure client application to help brokers, an internal
application to optimize transaction processing, or any other application that can directly or indirectly help sell
products, optimize processes, or save IT resources.
Total Benefits
Table 5 shows the total of all benefits across the areas listed above, as well as present values (PVs) discounted at 10%.
Over three years, the composite organization expects risk-adjusted total benefits to be a PV of more than $1.8 million.
TABLE 5
Total Benefits (Risk-Adjusted)
Ref. Benefit Category Initial Year 1 Year 2 Year 3 Total Present Value
Atr
Device cost savings
from retired and
avoided devices
$0 $792,000 $477,000 $162,000 $1,431,000 $1,235,928
Btr
Resource
management
savings
$0 $99,840 $99,840 $99,840 $299,520 $248,287
Ctr IT task savings $0 $36,067 $36,067 $36,067 $108,202 $89,694
Dtr Profit from avoided
business downtime $0 $121,500 $121,500 $121,500 $364,500 $302,153
Total benefits
(risk-adjusted) $0 $1,049,407 $734,407 $419,407 $2,203,222 $1,876,061
Source: Forrester Research, Inc.

15
COSTS
The composite organization experienced the following costs associated with implementing NetScaler:
› Purchase costs and annual licensing fees.
› Deployment resource costs
New Citrix Purchase And Licensing Costs
The organization purchased six NetScaler SDX 11500 series devices, which come with upfront purchase costs
and recommended service and maintenance licensing. Table 6 shows the total costs during the initial purchase
period as well as the annual maintenance costs.
TABLE 6
New Citrix NetScaler Purchase And Licensing Costs
Ref. Metric Calculation Initial Year 1 Year 2 Year 3
E1 Citrix NetScaler devices (cumulative)
6 6 6 6
E2 NetScaler purchase price, per device
$110,000
E3 Annual NetScaler maintenance and support
$20,000 $20,000 $20,000
E4 Other Citrix products and services
$0 $0 $0 $0
Et Citrix licensing costs E1*E2+E1*E3+E4 $660,000 $120,000 $120,000 $120,000
Source: Forrester Research, Inc.

16
Deployment Resource Costs
The organization assigned several resources (averaging about three FTEs each week) over the course of about
a month to plan, test, and deploy the NetScaler SDX devices. A 10% risk adjustment has been applied, as the
organization had included some planning and mitigation steps to avoid or handle a number of issues that might
have arisen. The risk-adjusted total deployment resource costs added up to $38,016, as shown in Table 7.
TABLE 7
Deployment Resource Costs
Ref. Metric Calculation Initial Year 1 Year 2 Year 3
F1 Deployment resource FTEs 3
F2 Deployment weeks
4
F3 IT resource hourly rate $72
F4 Other support or training costs
$0 $0 $0
Ft Resource costs F1*F2*F3+F4 $34,560 $0 $0 $0
Risk adjustment ↑10%
Ftr Resource costs (risk-adjusted)
$38,016 $0 $0 $0
Source: Forrester Research, Inc.
Total Costs
Table 8 shows the total of all costs as well as associated present values, discounted at 10%. Over three years, the
composite organization expects total costs to total a net present value of less than $1 million.
TABLE 8
Total Costs (Risk-Adjusted)
Ref. Cost Category Initial Year 1 Year 2 Year 3 Total Present Value
Etr Citrix licensing costs
$660,000 $120,000 $120,000 $120,000 $1,020,000 $958,422
Ftr Resource costs $38,016 $0 $0 $0 $38,016 $38,016
Total costs (risk-adjusted)
$698,016 $120,000 $120,000 $120,000 $1,058,016 $996,438
Source: Forrester Research, Inc.

17
FLEXIBILITY
Flexibility, as defined by TEI, represents an investment in additional capacity or capability that could be turned into business
benefit for some future additional investment. This provides an organization with the “right” or the ability to engage in future
initiatives but not the obligation to do so. There are multiple scenarios in which a customer might choose to implement
NetScaler and later realize additional uses and business opportunities. Flexibility would also be quantified when evaluated as
part of a specific project (described in more detail in Appendix B). The organization identified two flexibility benefits:
› The organization has invested in Citrix NetScaler SDX devices, and sees the ease of management, scalability, and
multitenancy as a significant opportunity to manage more applications in its portfolio. Only around 100 applications were
included in the initial NetScaler implementation, of a total portfolio of 1,000 total applications. Many of those applications,
once reviewed, will likely not require ADC management, will not be suitable (such as a legacy application on old systems),
or will be retired. But remaining applications — as well as any developed or purchased in the future — would likely benefit
from NetScaler.
• If the organization doubled the number of applications managed by NetScaler, it would likely require fewer new
NetScaler SDX devices (because some existing capacity from remaining devices might be available, and it’s
assumed that the largest and most important applications were part of the first 100). And it may not retire or avoid as
many non-Citrix devices, but some device cost savings, plus IT resource and task savings, and business benefits
from any customer- or partner-facing applications would all be expected.
› The organization had limited the features and capabilities of its previous ADC devices because added features often
required additional devices or required special licensing modules. With NetScaler, “What you see is what you get,” said the
network engineer for a financial services firm, since the cost of NetScaler includes these and other features.
• The organization has not implemented most of these features yet, but looks forward to testing and implementing
capabilities such as caching and content switching, which are expected to deliver new benefits at a relatively low
cost since the devices and licenses are already included in the SDX platform.
RISKS
Forrester defines two types of risk associated with this analysis: “implementation risk” and “impact risk.” Implementation risk
is the risk that a proposed investment in NetScaler may deviate from the original or expected requirements, resulting in
higher costs than anticipated. Impact risk refers to the risk that the business or technology needs of the organization may not
be met by the investment in NetScaler, resulting in lower overall total benefits. The greater the uncertainty, the wider the
potential range of outcomes for cost and benefit estimates.
Quantitatively capturing implementation risk and impact risk by directly adjusting the financial estimates results provides
more meaningful and accurate estimates and a more accurate projection of the ROI. In general, risks affect costs by raising
the original estimates, and they affect benefits by reducing the original estimates. The risk-adjusted numbers should be taken
as “realistic” expectations since they represent the expected values considering risk.

18
TABLE 9
Benefit And Cost Risk Adjustments
Benefits Adjustment
Device cost savings from retired and avoided devices 10%
Resource management savings 20%
Profit from avoided business downtime 10%
Costs Adjustment
Deployment resource costs 10%
Source: Forrester Research, Inc.
The following impact risks that affect benefits are identified as part of the analysis:
› Device cost savings from retired and avoided devices may be less than expected, as future purchases may be less than
expected, or those future purchases may be for higher-end equipment that might achieve some of the same device
consolidation benefits.
› Resource management savings is adjusted in case the planned FTE would not have been required. Not hiring a full FTE
would significantly impact this benefit, so a higher risk-adjustment is applied.
› Avoided business downtime benefits are adjusted, as it is hard to correctly measure the number of brokers that might be
affected and decide to take their business elsewhere and how much they would have purchased in the future.
The following implementation risk that affects costs is identified as part of this analysis:
› Deployment resource costs have been adjusted, as many deployment tasks may raise issues or take longer than
expected.
Table 9 shows the values used to adjust for risk and uncertainty in the cost and benefit estimates for the composite
organization. Readers are urged to apply their own risk ranges based on their own degree of confidence in the cost and
benefit estimates.

19
Financial Summary
The financial results calculated in the Benefits and Costs sections can be used to determine the ROI, NPV, IRR and payback
period for the composite organization’s investment in NetScaler.
Table 10 shows the risk-adjusted ROI, NPV, IRR, and payback period values. These values are determined by applying the
risk-adjustment values from Table 9 in the Risk section to the unadjusted results in each relevant cost and benefit section.
FIGURE 3
Cash Flow Chart (Risk-Adjusted)
Source: Forrester Research, Inc.
TABLE 10
Cash Flow (Risk-Adjusted)
Initial Year 1 Year 2 Year 3 Total Present Value
Costs ($698,016) ($120,000) ($120,000) ($120,000) ($1,058,016) ($996,438)
Benefits $0 $1,049,407 $734,407 $419,407 $2,203,222 $1,876,061
Net benefits ($698,016) $929,407 $614,407 $299,407 $1,145,206 $879,623
ROI
88%
IRR 91%
Payback period (months) 9.0
Source: Forrester Research, Inc.
($1,000,000)
($500,000)
$0
$500,000
$1,000,000
$1,500,000
Initial Year 1 Year 2 Year 3
Cas
h f
low
s
Total costs Total benefits Cumulative total

20
Citrix NetScaler: Overview
The following information is provided by Citrix. Forrester has not validated any claims and does not endorse Citrix or its
offerings.
About Citrix NetScaler
Citrix NetScaler is a purpose-built appliance that improves how applications are delivered to users. Netscaler provides
performance benefits and increases the security and resiliency of supported applications.
NetScaler is deployed in front of high-traffic server environments and provides load-balancing across localized clusters or
geographically dispersed data centers. While load-balancing remains a core service delivered by NetScaler, additional
functionalities such as resource monitoring and analytics increase its ability to deliver more highly available applications.
NetScaler can also serve as a secure reverse proxy for internal servers, allowing it to handle exceedingly high volumes of
inbound traffic, while at the same time safeguarding internal server IP addresses from external exposure. Consequently,
NetScaler often becomes the single access point for external users needing to access network resources.
NetScaler is widely deployed as an authentication gateway for secure remote access and can be deployed as the single
secure access point for all web, mobile, and published applications and desktops. Its ability to process encrypted SSL/TLS
traffic allows it to securely validate users’ identities and offload these compute-intensive tasks from back-end servers.
Unlike traditional network switches and routers, NetScaler processes traffic higher in the network stack at layers 4-7. This
enables it to protect servers from more-sophisticated types of web-based attacks that can often evade standard network
firewall defenses.
NetScaler is available in three licensed editions; Standard, Enterprise, and Platinum, and can be deployed in either a
physical (MPX) or virtual (VPX) form factor. Physical appliances support a range of capacities based on throughput,
SSL/TLS, and HTTP transaction performance. Virtual appliances offer exactly the same full range of features offered in the
physical form factor, but lack the comparable SSL/TLS offload capacity since this is largely dependent on the underlying
hardware specifications. Additionally, virtual instances of NetScaler can be either purchased or hosted on AWS, IBM
Softlayer, and Azure. It is possible to purchase NetScaler VPX as a service from leading cloud providers.
NetScaler offers unique options for scaling a deployment to meet an organization’s needs. Throughput can be licensed on a
pay-as-you-go basis, where only the initial throughput needed is purchased with the option to increase the appliance
capacity via a license key upgrade as demands rise over time. Burst pack licenses are a unique offering where a temporary
reserve license can be purchased and applied only when the appliance is in need of short-term increased capacity.
NetScaler appliances can be clustered to provide aggregated throughput and capacity; up to 32 appliances can be
supported in a cluster.
NetScaler SDX is a physical appliance that supports fully isolated multitenant virtual instances of NetScaler in addition to
supported third-party workloads. NetScaler SDX leverages the power of Intel Xeon processors to provide superior
performance. Unlike commodity server-borne VPX instances, the instances on an SDX appliance are able to leverage the
SSL capacity of a physical NetScaler appliance, which can be easily allocated to an instance without affecting the
performance of neighboring instances. NetScaler SDX combines the flexibility and versatility of a virtual appliance with the
performance and capacity of a physical appliance.
Organizations have become increasingly agile in the new cloud era. As app developers work more closely with operational
and infrastructure teams, the need to integrate NetScaler into an application’s delivery fabric becomes more pressing.
NetScaler as a “service” hosted on an SDX appliance works in tandem with this effort, and removes many of the obstacles
associated with physically connecting and configuring a physical device across a highly complex network.
More information and free evaluation versions of NetScaler are available at
http://www.citrix.com/content/dam/citrix/en_us/documents/products-solutions/netscaler-data-sheet.pdf
http://www.citrix.com/products/netscaler-application-delivery-controller/try.html

21
Appendix A: Composite Organization Description
For this TEI study, Forrester has created a composite organization to illustrate the quantifiable benefits and costs of
implementing NetScaler. The composite company is intended to represent an insurance firm with about 15,000 employees
and is based on characteristics of the interviewed customers.
The composite company is described as:
› A North American insurance firm (that manages access and security across multiple applications for external
customers and partners, as well as internal resources).
› 15,000 employees.
› Eight Citrix NetScaler SDX 11500 series devices purchased for this implementation supporting 30 total VPX instances.
› 100 applications managed by NetScaler devices.
› Four FTEs that support NetScaler (plus one more hire planned in the next one to two years).
› The NetScaler devices replaced 15 non-Citrix ADC devices (but were comparable to MPX or SDX 8000-series
devices).
After an extensive RFP and business case process
evaluating multiple vendors, the composite organization
chose Citrix NetScaler and began deployment:
› Implementation started in 2013, with the first full year in
production from mid-2014 to mid-2015.
› The first phase focused on a limited set of applications
(the 100 applications listed above is a subset of the
organization’s full portfolio of applications).
› The first phase also focused significantly on reducing
the number of ADC devices.
In purchasing NetScaler, the composite company has the
following objectives:
› Get the most from IT (not necessarily just cost reduction, though that is a part).
› Ensure that IT helps drive and improve business opportunities.
› Simplify and automate common application management tasks.
For the purpose of the analysis, Forrester assumes the organization’s full IT team is about 550 employees, with four focused
on application management for high-availability implementations.
FRAMEWORK ASSUMPTIONS
Table 11 provides the model assumptions Forrester used in this analysis.
The discount rate used in the PV and NPV calculations is 10% and time horizon used for the financial modeling is three
years. Organizations typically use discount rates between 8% and 16% based on their current environment. Readers are
urged to consult with their respective company’s finance department to determine the most appropriate discount rate to use
within their own organizations.
TABLE 11
Model Assumptions
Ref. Metric Value
G1 Hours per year (M-F, 9-5) 2,080
G2 Annual IT/network manager
salary (fully burdened) $150,000
G3 Hourly IT/network manager
rate (fully burdened) $72
Source: Forrester Research, Inc.

22
Appendix B: Total Economic Impact™ Overview
Total Economic Impact is a methodology developed by Forrester Research that enhances a company’s technology decision-
making processes and assists vendors in communicating the value proposition of their products and services to clients. The
TEI methodology helps companies demonstrate, justify, and realize the tangible value of IT initiatives to both senior
management and other key business stakeholders. TEI assists technology vendors in winning, serving, and retaining
customers.
The TEI methodology consists of four components to evaluate investment value: benefits, costs, flexibility, and risks.
BENEFITS
Benefits represent the value delivered to the user organization — IT and/or business units — by the proposed product or
project. Often, product or project justification exercises focus just on IT cost and cost reduction, leaving little room to analyze
the effect of the technology on the entire organization. The TEI methodology and the resulting financial model place equal
weight on the measure of benefits and the measure of costs, allowing for a full examination of the effect of the technology on
the entire organization. Calculation of benefit estimates involves a clear dialogue with the user organization to understand
the specific value that is created. In addition, Forrester also requires that there be a clear line of accountability established
between the measurement and justification of benefit estimates after the project has been completed. This ensures that
benefit estimates tie back directly to the bottom line.
COSTS
Costs represent the investment necessary to capture the value, or benefits, of the proposed project. IT or the business units
may incur costs in the form of fully burdened labor, subcontractors, or materials. Costs consider all the investments and
expenses necessary to deliver the proposed value. In addition, the cost category within TEI captures any incremental costs
over the existing environment for ongoing costs associated with the solution. All costs must be tied to the benefits that are
created.
FLEXIBILITY
Within the TEI methodology, direct benefits represent one part of the investment value. While direct benefits can typically be
the primary way to justify a project, Forrester believes that organizations should be able to measure the strategic value of an
investment. Flexibility represents the value that can be obtained for some future additional investment building on top of the
initial investment already made. For instance, an investment in an enterprisewide upgrade of an office productivity suite can
potentially increase standardization (to increase efficiency) and reduce licensing costs. However, an embedded collaboration
feature may translate to greater worker productivity if activated. The collaboration can only be used with additional
investment in training at some future point. However, having the ability to capture that benefit has a PV that can be
estimated. The flexibility component of TEI captures that value.
RISKS
Risks measure the uncertainty of benefit and cost estimates contained within the investment. Uncertainty is measured in two
ways: 1) the likelihood that the cost and benefit estimates will meet the original projections, and 2) the likelihood that the
estimates will be measured and tracked over time. TEI risk factors are based on a probability density function known as
“triangular distribution” to the values entered. At a minimum, three values are calculated to estimate the risk factor around
each cost and benefit.

23
Appendix C: Forrester And The Age Of The Customer
Your technology-empowered customers now know more than you do about your products and services, pricing, and
reputation. Your competitors can copy or undermine the moves you take to compete. The only way to win, serve, and retain
customers is to become customer-obsessed.
A customer-obsessed enterprise focuses its strategy, energy, and budget on processes that enhance knowledge of and
engagement with customers and prioritizes these over maintaining traditional competitive barriers.
CMOs and CIOs must work together to create this companywide transformation.
Forrester has a four-part blueprint for strategy in the age of the customer, including the following imperatives to help
establish new competitive advantages:
Transform the customer experience to gain sustainable competitive advantage.
Accelerate your digital business with new technology strategies that fuel business growth.
Embrace the mobile mind shift by giving customers what they want, when they want it.
Turn (big) data into business insights through innovative analytics.
24
Appendix D: Glossary
Discount rate: The interest rate used in cash flow analysis to take into account the time value of money. Companies set
their own discount rate based on their business and investment environment. Forrester assumes a yearly discount rate of
10% for this analysis. Organizations typically use discount rates between 8% and 16% based on their current environment.
Readers are urged to consult their respective organizations to determine the most appropriate discount rate to use in their
own environment.
Net present value (NPV): The present or current value of (discounted) future net cash flows given an interest rate (the
discount rate). A positive project NPV normally indicates that the investment should be made, unless other projects have
higher NPVs.
Present value (PV): The present or current value of (discounted) cost and benefit estimates given at an interest rate (the
discount rate). The PV of costs and benefits feed into the total NPV of cash flows.
Payback period: The breakeven point for an investment. This is the point in time at which net benefits (benefits minus costs)
equal initial investment or cost.
Return on investment (ROI): A measure of a project’s expected return in percentage terms. ROI is calculated by dividing
net benefits (benefits minus costs) by costs.
Internal rate of return (IRR) is the interest rate at which the net present value of all the cash flows (both positive and
negative) from a project or investment equal zero. IRR is used to evaluate the attractiveness of a project or investment.
A NOTE ON CASH FLOW TABLES
The following is a note on the cash flow tables used in this study (see the example table below). The initial investment
column contains costs incurred at “time 0” or at the beginning of Year 1. Those costs are not discounted. All other cash flows
in years 1 through 3 are discounted using the discount rate (shown in the Framework Assumptions section) at the end of the
year. PV calculations are calculated for each total cost and benefit estimate. NPV calculations are not calculated until the
summary tables are the sum of the initial investment and the discounted cash flows in each year.
Sums and present value calculations of the Total Benefits, Total Costs, and Cash Flow tables may not exactly add up, as
some rounding may occur.
TABLE [EXAMPLE]
Example Table
Ref. Metric Calculation Year 1 Year 2 Year 3
Source: Forrester Research, Inc.
Appendix E: Endnotes
1 Forrester risk-adjusts the summary financial metrics to take into account the potential uncertainty of the cost and benefit
estimates. For more information, see the section on Risks.