forty years' research on atmospheric ozone at oxford: a … · forty years' research on...
TRANSCRIPT

Forty Years' Research on Atmospheric Ozoneat Oxford: a History
G. M. B. Dobson
The development of research on atmospheric ozone at Oxford is traced from the year 1922, when one singleinstrument was used there to make measurements of the total ozone, to 1966, when some hundred instru-ments were distributed all over the world. In recent years an important advance has been made by themeasurement of the vertical distribution of the ozone in the atmosphere. A digression, covering the waryears, describes the measurement of the amount of water vapor in the stratosphere which, however, provedto have a bearing on the effect of the ozone on the temperature of the upper atmosphere.
1. IntroductionIt is now just over forty years since the first daily
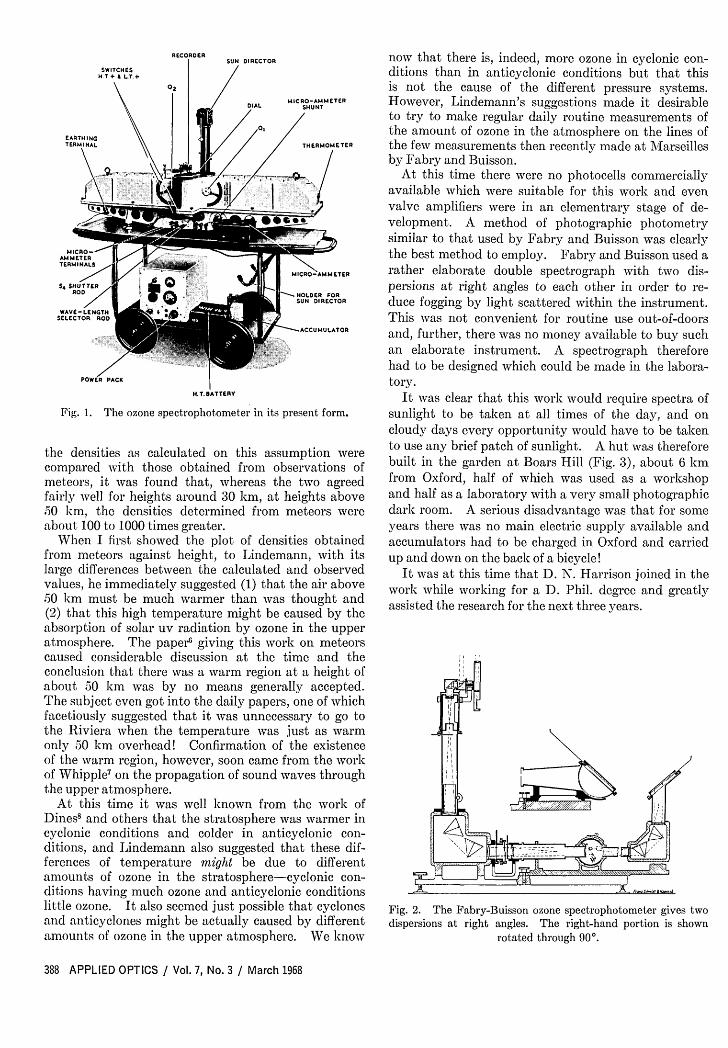
routine measurements of the ozone in the atmospherewere begun at Oxford, and Beck has just completedozone instrument No. 100 (Fig. 1). The present,therefore, seems a suitable time to review the progressof this work at Oxford, and it is thought that some ofthose who are now carrying on the major active researchin this subject may be interested in an account of howit all began. This account has been confined to thework connected with Oxford in order to keep it withinreasonable limit.
In 1879 Cornul had suggested that the rather sharplimitation of the uv end of the solar spectrum asreceived at the ground was due to absorption in theatmosphere, and in 1880, Hartley,2 having roughlymeasured the absorption of ozone in the uv region(the Hartley band), suggested that it was ozone whichwas responsible for the absorption. While Meyer'in 1903, had measured the absorption coefficients ofozone more accurately, Fabry and Buisson,4 in 1912,made careful measurements of the absorption coef-ficients of ozone and compared these with the absorptionof sunlight by the atmosphere. From their measure-ments they concluded that there was about 0.5 cm ofozone in one vertical thickness of the atmosphere.It was suggested that the ozone was formed fromoxygen in the upper atmosphere by the action of solaruv radiation.
In 1919 and 1920 Fabry and Buisson5 returned to thissubject and designed a special spectrograph with twodispersions at right angles to each other, thus reducing
The author has retired from the Clarendon Laboratory, Oxford,U.K.
Received 25 March 1967.
the fogging of the photographic plate by light scatteredwithin the instrument (Fig. 2). During May and June1920 they made measurements of the amount of ozoneat Marseilles by taking spectrograms on fourteen daysat several times during each day when the sun wasat different heights. They found that the amount ofozone was about 0.3 cm (STP) and, owing to rathersteady weather conditions at the time, there was littlevariation in the amount between one day and another.They suggested that it would be of great interest if asufficiently large institution [sic] could arrange tomake daily measurements over a long time. Theythought correctly that the ozone was formed by solaruv radiation and suggested that if this were so it wouldbe mainly situated at a height of about 40 km. Ray-leigh and Gdtz had both shown that there was littleozone in the lower atmosphere by taking uv spectra of amercury lamp through long distances of air near theground.
In 1921, F. A. Lindemann (later Lord Cherwell)had shown that it should be possible to obtain someknowledge of the variation of the density of the airwith height in the upper atmosphere from observationsof the velocity, brightness, and height of meteors.At this time no suitable photographic measurements ofmeteors were available and, although two automaticcameras were set up, one in Oxford and one on BoarsHill about four miles away, owing to their limitedfield of view, very few meteors were photographed.However, using the eye observations of Denning andhis co-observers (which proved surprisingly accurate),the density of the air was calculated at the height ofappearance and of disappearance of a number ofmeteors. It was generally supposed that the airabove the tropopause was cold at all levels and when
March 1968 / Vol. 7, No. 3 / APPLIED OPTICS 387
RECORDERSUN DIRECTOR
MICRO-AMMETERSHUNT
/ THERMOMETER
I MMETERHOLDER FOR
i SUN DIRECTOR
-AACCUMULATOR
/POWER PACK
H. T. BATTERY
Fig. 1. Te ozone spectrophotometer in its present form.
the densities as calculated on this assumption werecompared with those obtained from observations ofmeteors, it was found that, whereas the two agreedfairly well for heights around 30 km, at heights above:50 km, the densities determined from meteors wereabout 100 to 1000 times greater.
When I first showed the plot of densities obtainedfrom meteors against height, to Lindemann, with itslarge differences between the calculated and observedvalues, he immediately suggested (1) that the air above50 km must be much warmer than was thought and(2) that this high temperature might be caused by theabsorption of solar uv radiation by ozone in the upperatmosphere. The paper' giving this work on meteorscaused considerable discussion at the time and theconclusion that there was a warm region at a height ofabout 50 km was by no means generally accepted.The subject even got into the daily papers, one of whichfacetiously suggested that it was unnecessary to go tothe Riviera when the temperature was just as warmonly 50 km overhead! Confirmation of the existenceof the warm region, however, soon came from the workof Whipple7 on the propagation of sound waves throughthe upper atmosphere.
At this time it was well known from the work ofDines8 and others that the stratosphere was warmer incyclonic conditions and colder in anticyclonic con-ditions, and Lindemann also suggested that these dif-ferences of temperature might be due to differentamounts of ozone in the stratosphere-cyclonic con-ditions having much ozone and anticyclonic conditionslittle ozone. It also seemed just possible that cyclonesand anticyclones might be actually caused by differentamounts of ozone in the upper atmosphere. We know
now that there is, indeed, more ozone in cyclonic con-ditions than in anticyclonic conditions but that thisis not the cause of the different pressure systems.However, Lindemann's suggestions made it desirableto try to make regular daily routine measurements ofthe amount of ozone in the atmosphere on the lines ofthe few measurements then recently made at 1\Iarseillesby Fabry and Buisson.
At this time there were no photocells commerciallyavailable which were suitable for this work and evenvalve amplifiers were in an elementrary stage of de-velopment. A method of photographic photometrysimilar to that used by Fabry and Buisson was clearlythe best method to employ. Fabry and Buisson used arather elaborate double spectrograph with two dis-persions at right angles to each other in order to re-duce fogging by light scattered within the instrument.This was not convenient for routine use out-of-doorsand, further, there was no money available to buy suchan elaborate instrument. A spectrograph thereforehad to be designed which could be made in the labora-tory.
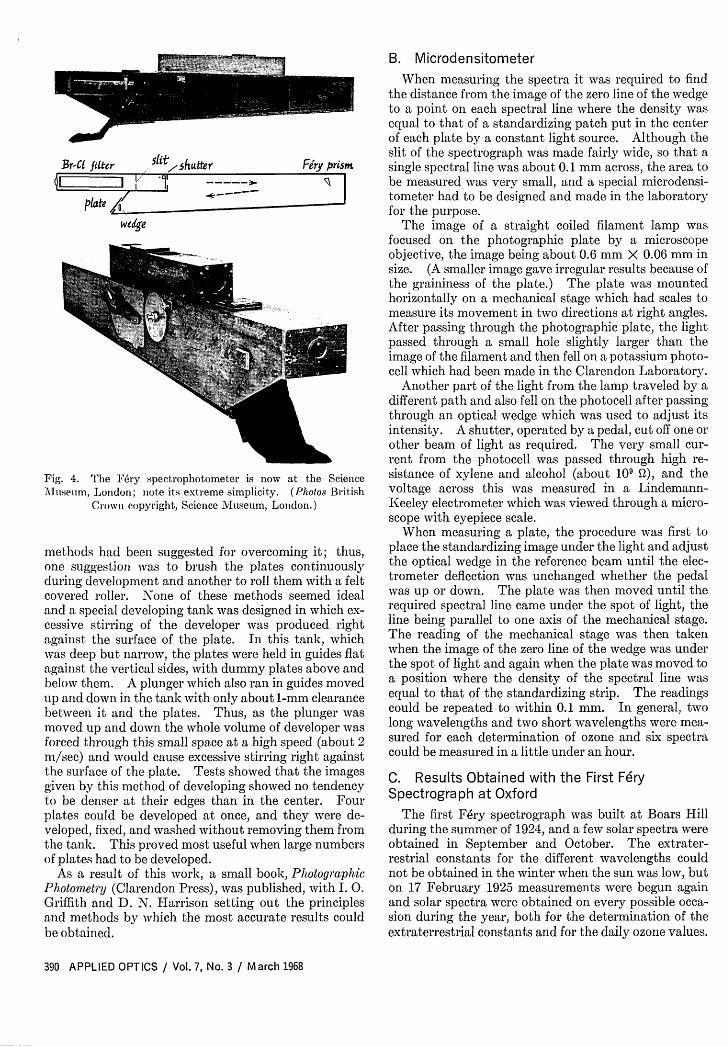
It was clear that this work would require spectra ofsunlight to be taken at all times of the day, and oncloudy days every opportunity would have to be takento use any brief patch of sunlight. A hut was thereforebuilt in the garden at Boars Hill (Fig. 3), about 6 kmfrom Oxford, half of which was used as a workshopand half as a laboratory with a very small photographicdark room. A serious disadvantage was that for someyears there was no main electric supply available andaccumulators had to be charged in Oxford and carriedup and down on the back of a bicycle!
It was at this time that D. N. Harrison joined in thework while working for a D. Phil. degree and greatlyassisted the research for the next three years.
Fig. 2. The Fabry-Buisson ozone spectrophotometer gives twodispersions at right angles. The right-hand portion is shown
rotated through 900.
388 APPLIED OPTICS / Vol. 7, No. 3 / March 1968
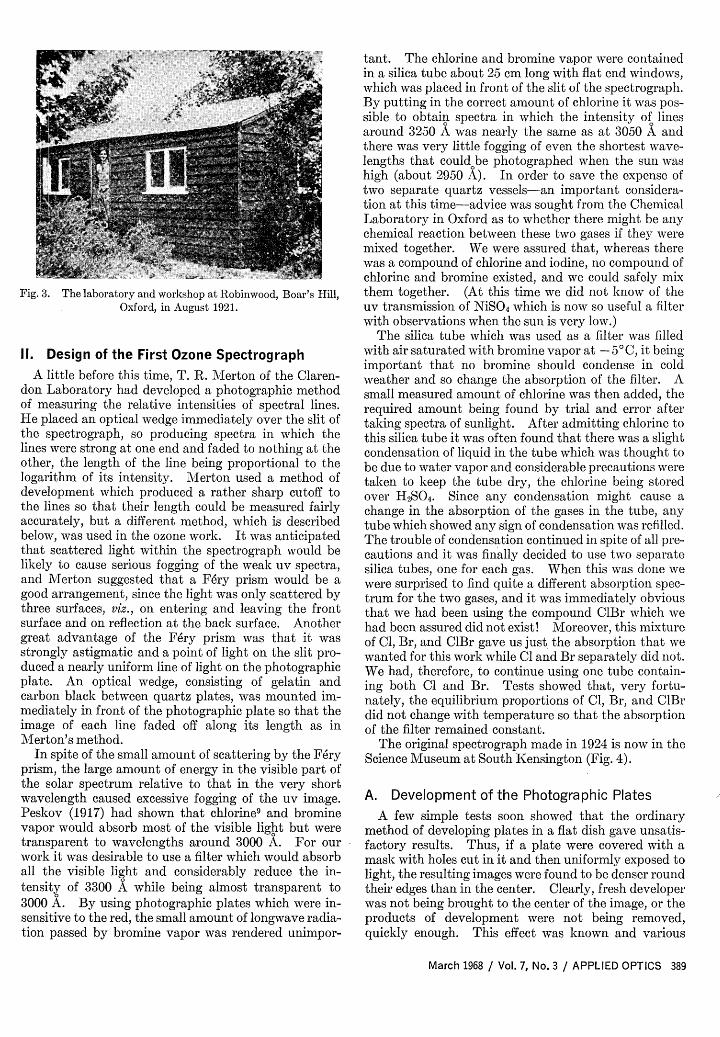
Fig. 3. The laboratory and workshop at Robinwood, Boar's Hill,Oxford, in August 1921.
11. Design of the First Ozone SpectrographA little before this time, T. R. Merton of the Claren-
don Laboratory had developed a photographic methodof measuring the relative intensities of spectral lines.He placed an optical wedge immediately over the slit ofthe spectrograph, so producing spectra in which thelines were strong at one end and faded to nothing at theother, the length of the line being proportional to thelogarithm of its intensity. Merton used a method ofdevelopment which produced a rather sharp cutoff tothe lines so that their length could be measured fairlyaccurately, but a different method, which is describedbelow, was used in the ozone work. It was anticipatedthat scattered light within the spectrograph would belikely to cause serious fogging of the weak uv spectra,and Merton suggested that a Fery prism would be agood arrangement, since the light was only scattered bythree surfaces, viz., on entering and leaving the frontsurface and on reflection at the back surface. Anothergreat advantage of the Fry prism was that it wasstrongly astigmatic and a point of light on the slit pro-duced a nearly uniform line of light on the photographicplate. An optical wedge, consisting of gelatin andcarbon black between quartz plates, was mounted im-mediately in front of the photographic plate so that theimage of each line faded off along its length as inMerton's method.
In spite of the small amount of scattering by the Feryprism, the large amount of energy in the visible part ofthe solar spectrum relative to that in the very shortwavelength caused excessive fogging of the uv image.Peskov (1917) had shown that chlorine' and brominevapor would absorb most of the visible light but weretransparent to wavelengths around 3000 A. For ourwork it was desirable to use a filter which would absorball the visible light and considerably reduce the in-tensity of 3300 A while being almost transparent to3000 A. By using photographic plates which were in-sensitive to the red, the small amount of longwave radia-tion passed by bromine vapor was rendered unimpor-
tant. The chlorine and bromine vapor were containedin a silica tube about 25 cm long with flat end windows,which was placed in front of the slit of the spectrograph.By putting in the correct amount of chlorine it was pos-sible to obtain spectra in which the intensity of linesaround 3250 A was nearly the same as at 3050 A andthere was very little fogging of even the shortest wave-lengths that could be photographed when the sun washigh (about 2950 A). In order to save the expense oftwo separate quartz vessels-an important considera-tion at this time-advice was sought from the ChemicalLaboratory in Oxford as to whether there might be anychemical reaction between these two gases if they weremixed together. We were assured that, whereas therewas a compound of chlorine and iodine, no compound ofchlorine and bromine existed, and we could safely mixthem together. (At this time we did not know of theuv transmission of NiSO4 which is now so useful a filterwith observations when the sun is very low.)
The silica tube which was used as a filter was filledwith air saturated with bromine vapor at - 50 C, it beingimportant that no bromine should condense in coldweather and so change the absorption of the filter. Asmall measured amount of chlorine was then added, therequired amount being found by trial and error aftertaking spectra of sunlight. After admitting chlorine tothis silica tube it was often found that there was a slightcondensation of liquid in the tube which was thought tobe due to water vapor and considerable precautions weretaken to keep the tube dry, the chlorine being storedover H2SO4. Since any condensation might cause achange in the absorption of the gases in the tube, anytube which showed any sign of condensation was refilled.The trouble of condensation continued in spite of all pre-cautions and it was finally decided to use two separatesilica tubes, one for each gas. When this was done wewere surprised to find quite a different absorption spec-trum for the two gases, and it was immediately obviousthat we had been using the compound ClBr which wehad been assured did not exist! Moreover, this mixtureof Cl, Br, and ClBr gave us just the absorption that wewanted for this work while Cl and Br separately did not.We had, therefore, to continue using one tube contain-ing both Cl and Br. Tests showed that, very fortu-nately, the equilibrium proportions of Cl, Br, and ClBrdid not change with temperature so that the absorptionof the filter remained constant.
The original spectrograph made in 1924 is now in theScience Museum at South Kensington (Fig. 4).
A. Development of the Photographic PlatesA few simple tests soon showed that the ordinary
method of developing plates in a flat dish gave unsatis-factory results. Thus, if a plate were covered with amask with holes cut in it and then uniformly exposed tolight, the resulting images were found to be denser roundtheir edges than in the center. Clearly, fresh developerwas not being brought to the center of the image, or theproducts of development were not being removed,quickly enough. This effect was known and various
March 1968 / Vol. 7, No. 3 / APPLIED OPTICS 389
Br-C fer Slt"Ashutter Firy pr!smIE1 |-IV .11 "A__ s
plate,/wedge
Fig. 4. The Fry spectrophotometer is now at the ScienceM\huseum, London; note its extreme simplicity. (Photos British
Crown copyright, Science Museum, London.)
methods had been suggested for overcoming it; thus,one suggestion was to brush the plates continuouslyduring development and another to roll them with a feltcovered roller. None of these methods seemed idealand a special developing tank was designed in which ex-cessive stirring of the developer was produced rightagainst the surface of the plate. In this tank, whichwas deep but narrow, the plates were held in guides flatagainst the vertical sides, with dummy plates above andbelow them. A plunger which also ran in guides movedup and down in the tank with only about 1-mm clearancebetween it and the plates. Thus, as the plunger wasmoved up and down the whole volume of developer wasforced through this small space at a high speed (about 2m/sec) and would cause excessive stirring right againstthe surface of the plate. Tests showed that the imagesgiven by this method of developing showed no tendencyto be denser at their edges than in the center. Fourplates could be developed at once, and they were de-veloped, fixed, and washed without removing them fromthe tank. This proved most useful when large numbersof plates had to be developed.
As a result of this work, a small book, PhotographicPhotometry (Clarendon Press), was published, with I. 0.Griffith and D. N. Harrison setting out the principlesand methods by which the most accurate results couldbe obtained.
B. MicrodensitometerWhen measuring the spectra it was required to find
the distance from the image of the zero line of the wedgeto a point on each spectral line where the density wasequal to that of a standardizing patch put in the centerof each plate by a constant light source. Although theslit of the spectrograph was made fairly wide, so that asingle spectral line was about 0.1 mm across, the area tobe measured was very small, and a special microdensi-tometer had to be designed and made in the laboratoryfor the purpose.
The image of a straight coiled filament lamp wasfocused on the photographic plate by a microscopeobjective, the image being about 0.6 mm X 0.06 mm insize. (A smaller image gave irregular results because ofthe graininess of the plate.) The plate was mountedhorizontally on a mechanical stage which had scales tomeasure its movement in two directions at right angles.After passing through the photographic plate, the lightpassed through a small hole slightly larger than theimage of the filament and then fell on a potassium photo-cell which had been made in the Clarendon Laboratory.
Another part of the light from the lamp traveled by adifferent path and also fell on the photocell after passingthrough an optical wedge which was used to adjust itsintensity. A shutter, operated by a pedal, cut off one orother beam of light as required. The very small cur-rent from the photocell was passed through high re-sistance of xylene and alcohol (about 109 ), and thevoltage across this was measured in a Lindemann-Keeley electrometer which was viewed through a micro-scope with eyepiece scale.
When measuring a plate, the procedure was first toplace the standardizing image under the light and adjustthe optical wedge in the reference beam until the elec-trometer deflection was unchanged whether the pedalwas up or down. The plate was then moved until therequired spectral line came under the spot of light, theline being parallel to one axis of the mechanical stage.The reading of the mechanical stage was then takenwhen the image of the zero line of the wedge was underthe spot of light and again when the plate was moved toa position where the density of the spectral line wasequal to that of the standardizing strip. The readingscould be repeated to within 0.1 mm. In general, twolong wavelengths and two short wavelengths were mea-sured for each determination of ozone and six spectracould be measured in a little under an hour.
C. Results Obtained with the First FdrySpectrograph at Oxford
The first Fery spectrograph was built at Boars Hillduring the summer of 1924, and a few solar spectra wereobtained in September and October. The extrater-restrial constants for the different wavelengths couldnot be obtained in the winter when the sun was low, buton 17 February 1925 measurements were begun againand solar spectra were obtained on every possible occa-sion during the year, both for the determination of theextraterrestrial constants and for the daily ozone values.
390 APPLIED OPTICS / Vol. 7, No. 3 / March 1968
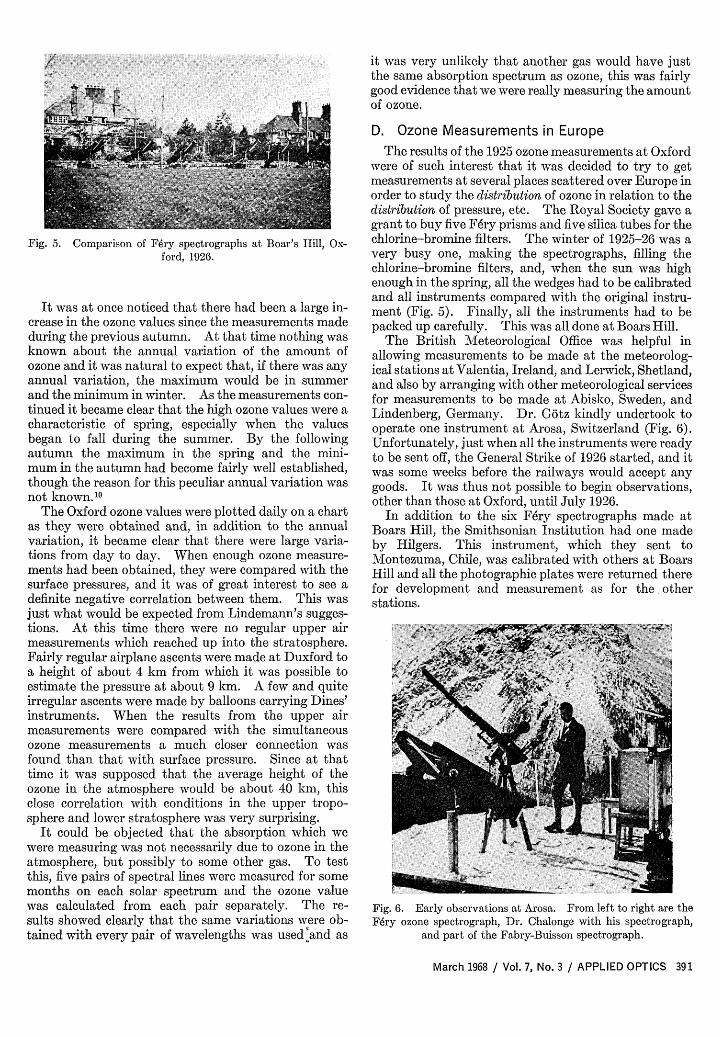
Fig. 5. Comparison of F6ry spectrographs at Boar's Hill, Ox-ford, 1926.
It was at once noticed that there had been a large in-crease in the ozone values since the measurements madeduring the previous autumn. At that time nothing wasknown about the annual variation of the amount ofozone and it was natural to expect that, if there was anyannual variation, the maximum would be in summerand the minimum in winter. As the measurements con-tinued it became clear that the high ozone values were acharacteristic of spring, especially when the valuesbegan to fall during the summer. By the followingautumn the maximum in the spring and the mini-mum in the autumn had become fairly well established,though the reason for this peculiar annual variation wasnot known.' 0
The Oxford ozone values were plotted daily on a chartas they were obtained and, in addition to the annualvariation, it became clear that there were large varia-tions from day to day. When enough ozone measure-ments had been obtained, they were compared with thesurface pressures, and it was of great interest to see adefinite negative correlation between them. This wasjust what would be expected from Lindemann's sugges-tions. At this time there were no regular upper airmeasurements which reached up into the stratosphere.Fairly regular airplane ascents were made at Duxford toa height of about 4 km from which it was possible toestimate the pressure at about 9 km. A few and quiteirregular ascents were made by balloons carrying Dines'instruments. When the results from the upper airmeasurements were compared with the simultaneousozone measurements a much closer connection wasfound than that with surface pressure. Since at thattime it was supposed that the average height of theozone in the atmosphere would be about 40 km, thisclose correlation with conditions in the upper tropo-sphere and lower stratosphere was very surprising.
It could be objected that the absorption which wewere measuring was not necessarily due to ozone in theatmosphere, but possibly to some other gas. To testthis, five pairs of spectral lines were measured for somemonths on each solar spectrum and the ozone valuewas calculated from each pair separately. The re-sults showed clearly that the same variations were ob-tained with every pair of wavelengths was used land as
it was very unlikely that another gas would have justthe same absorption spectrum as ozone, this was fairlygood evidence that we were really measuring the amountof ozone.
D. Ozone Measurements in EuropeThe results of the 1925 ozone measurements at Oxford
were of such interest that it was decided to try to getmeasurements at several places scattered over Europe inorder to study the distribution of ozone in relation to thedistribution of pressure, etc. The Royal Society gave agrant to buy five Fdry prisms and five silica tubes for thechlorine-bromine filters. The winter of 1925-26 was avery busy one, making the spectrographs, filling thechlorine-bromine filters, and, when the sun was highenough in the spring, all the wedges had to be calibratedand all instruments compared with the original instru-ment (Fig. 5). Finally, all the instruments had to bepacked up carefully. This was all done at Boars Hill.
The British Meteorological Office was helpful inallowing measurements to be made at the meteorolog-ical stations at Valentia, Ireland, and Lerwick, Shetland,and also by arranging with other meteorological servicesfor measurements to be made at Abisko, Sweden, andLindenberg, Germany. Dr. Gotz kindly undertook tooperate one instrument at Arosa, Switzerland (Fig. 6).Unfortunately, just when all the instruments were readyto be sent off, the General Strike of 1926 started, and itwas some weeks before the railways would accept anygoods. It was thus not possible to begin observations,other than those at Oxford, until July 1926.
In addition to the six Fry spectrographs made atBoars Hill, the Smithsonian Institution had one madeby Hilgers. This instrument, which they sent toMontezuma, Chile, was calibrated with others at BoarsHill and all the photographic plates were returned therefor development and measurement as for the otherstations.
Fig. 6. Early observations at Arosa. From left to right are theF6ry ozone spectrograph, Dr. Chalonge with his spectrograph,
and part of the Fabry-Buisson spectrograph.
March 1968 / Vol. 7, No. 3 / APPLIED OPTICS 391
During 1927 Buisson made measurements of theozone at Marseilles using the Fabry-Buisson spectro-graph described earlier. These were a very useful addi-tion to the values obtained with the Fdry spectrographsand showed a very interesting relation between thechanges of ozone at Marseilles and that at Arosa-some500 km northeastwards-as small depressions movedeastwards and affected the two stations in turn.
In the work with the photographic spectrophotom-eters, the observers at all stations were supplied withphotographic plates. They were only asked to load theplates into the plateholders, make the exposures, writethe date and place on the edge of the plate, and repackthe plates in their original packing and return them toOxford. Special red labels were supplied asking thecustoms not to open the packages. At Lindenberg theydid not consider that it was safe to send the platesthrough the ordinary post and made special arrange-ments for them to be sent to the German Embassy inLondon through the diplomatic bag. The GermanEmbassy agreed to forward them, provided that I wouldrepay the postage of the plates from London to Oxford.In any event we never had any trouble with the platesbeing opened in the post except some of those sentthrough the German Foreign Office.
There was much activity when the plates began toarrive from the different stations, as these all had to bedeveloped, measured, and the ozone calculated.Fortunately, the DSIR became interested and gave agrant for a half-time assistant who measured the platesand calculated the ozone values. It was naturally withgreat interest that the European values were plotted onthe weather maps, and the first idea of the distributionof ozone in relation to pressure systems was obtained.Since the 1926 observations began late, it was decided tocarry on with the same routine during 1927. The re-sults obtained were reported in two papers to the RoyalSociety." By the end of the European work, over 5000spectra had been measured and the ozone values calcu-lated. In order to keep the interest of those taking thephotographs at the different stations, the daily ozonevalues were duplicated each month and sent to all thecooperating stations and any other people interested.On occasions of special interest, the daily weather mapswere duplicated with the ozone values entered at eachstation and these were also circulated.
E. Measurements of Ozone Over the WorldThe European measurements in 1926 and 1927 had
allowed us to obtain a rough picture of the distributionof ozone relative to the pressure systems, and gave alimited indication of the variation of mean ozone valueswith latitude. However, we knew nothing about thevariations of ozone in the southern hemisphere since thestation at Montezuma was only 220 S and the resultswere not very reliable. It was therefore decided to re-distribute most of the instruments to places widelyscattered over the world. Only the instruments at Ox-ford and Arosa remained at their old stations, the othersbeing sent to Table Mountain, California; Helwan,Egypt; Kodai Kanal, India; and Christchurch, New
Zealand. One instrument was lent to the Italian PolarAirship Expedition. Unfortunately, disaster overtookthat expedition, but the spectrograph was not on boardand was eventually recovered. i\'Ieasurements weremade on all possible days throughout 1928 and 1929, thephotographic plates being returned to Oxford as before,for development and measurement.
J. Lawrence joined us about this time, and whileworking for a B.Sc. degree studied the relation of ozoneto geomagnetic conditions. Chree,' 2 using the firstyear's results at Oxford had shown that there appearedto be a connection between magnetic activity and theamount of ozone, the amount of ozone being greater onmagnetically disturbed days. Lawrence used the Ox-ford ozone values for 1926 and 1927 and in each yearfound the same relation as Chree had done. However,when he used the average ozone values for NorthwestEurope-which should be less affected by local meteoro-logical conditions-he found no relation at all, so it wasconcluded that both Chree's results and his earlier oneshad been accidental. This investigation has never beenrepeated.
The results of this work" gave us a fair idea of thedistribution mean of ozone with latitude (except highlatitude) and its seasonal variations, though, of course,there were large gaps and little information could be ob-tained about any possible variations with longitude.The six months difference in phase of the annual varia-tion in the two hemispheres was clearly established,while at Kodai Kanal (100N) there was very little varia-tion throughout the year. The type of variation ofozone with pressure systems which had been found inEurope was also found at other extratropical stations.Since the ozone is mainly situated within the strato-sphere and the Indian monsoon is a relatively low levelphenomenon, it was not expected that the change in themonsoon would affect the ozone values; this was foundto be the case.
F. Design and Construction of thePhotoelectric Spectrophotometer
The Fry spectrographs had proved very successfuland had provided data which allowed the general rela-tionship between the ozone and the pressure distributionto be found, as well as the general distribution of ozoneand its seasonal variation over much of the world.However, experience had shown two serious disadvan-tages: (1) the time taken in posting the photographicplates back to Oxford, together with their developmentand measurement, meant that all ozone values weremany weeks out of date when first calculated; (2) thelight gathering power of the Fery spectrograph is smalland measurements could only be taken with sunlightand when the sun was not too low; so it was not possibleto work at the higher latitude stations in midwinter.Further, no measurements could be obtained on cloudydays.
By about 1927-28, photoelectric cells were beingdeveloped and valve amplifiers were in general use, somuch thought was given to the design of a possible
392 APP LIED OPTICS / Vol. 7, No. 3 / March 1968
544 P11 SLIT 14 P1011 1.. A1 -400 4
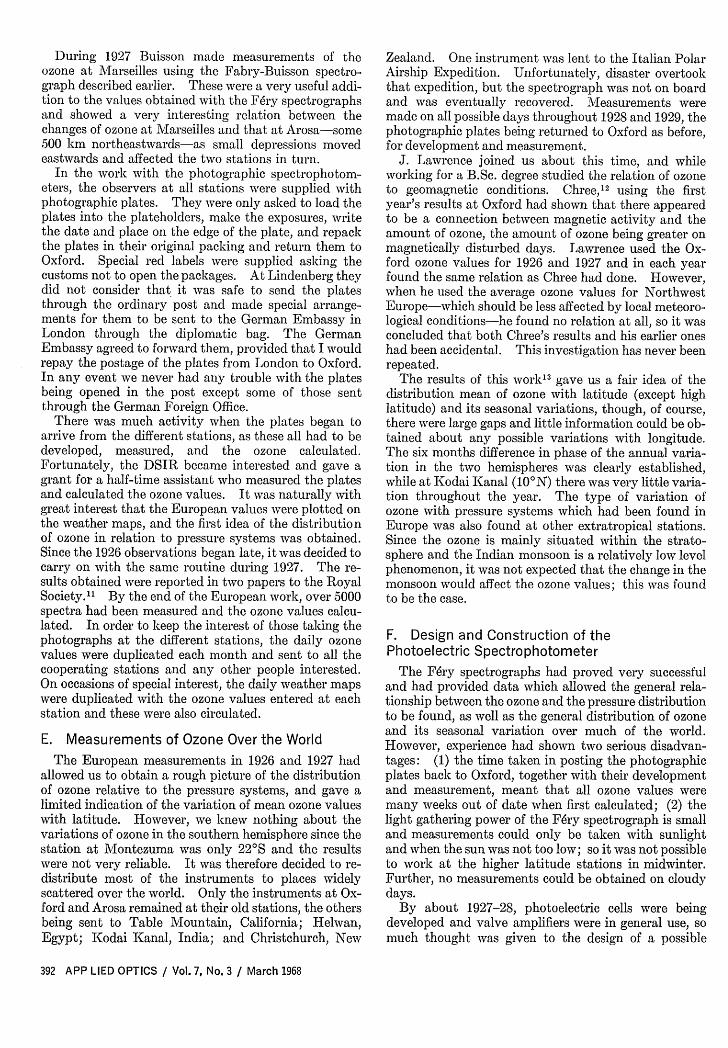
Fig. 7. The optical system of the photoelectric spectrophotometer.
photoelectric instrument in which the ozone valueswould be obtained without any delay. It was alsohoped that a method might be developed by whichozone values could be obtained-even if only approxi-mately-on lightly cloudy days.
Since the design of the instrument will be well knownto all readers,' 4 it is not proposed to describe it in detailhere, but the following notes recall the reasons why theparticular design was chosen. It was desired to producean instrument which should measure the amount ofozone in the atmosphere with an error of less than about1%. It also had to be an instrument which could beused for routine observations by an assistant, as distinctfrom one which was used by professional scientific staffonly. It was further necessary that the instrumentshould remain as constant as possible over long periodsof time and only require periodic checks in order to seethat no important changes had taken place. Thus, forexample, changes in the voltage on the amplifier orphotocell should make no difference to the values givenby the instrument. It was therefore decided to allowthe two wavelengths which had to be compared to fallon the same part of the cathode of one photocell, a sectorwheel allowing each wavelength to pass in turn, thus ingeneral producing a variable output from the photocellwhich was easy to amplify by an ac amplifier. Thelonger (stronger) wavelength was reduced in intensityby passing through an adjustable optical wedge until itproduced exactly the same output current as the shorter(weaker) wavelength. When this was the case the out-put from the photocell was constant, and therefore theac amplifier gave no output. The output from theamplifier was passed through a commutator and read ona dc galvanometer. The position of the optical wedge,when the galvanometer gave a zero reading, was a mea-sure of the relative intensities of the two wavelengthsbeing measured. The measurement was thus indepen-dent of the intensity of the light, the voltage on thephotocell, and the amplification of the amplifier, and theonly things that were required to remain constant were(1) the wavelength used, (2) the wedge transmission,
and (3) the relative sensitivity of the photocell to twowavelengths 200 A apart (see Fig. 7).
When the original instrument was made, photo-multipliers were not available, but we were fortunate inbeing able to use a photocell with sodium hydridecathode made in the Clarendon Laboratory. This was aglass cell with waxed-on silica window, and in spite ofthe waxed-on window it continued to function excellentlyfor many years until finally replaced by a photomulti-plier. The cell contained a small amount of inert gasand considerable gas amplification was used, the normalvoltage on the cell being only a few volts below the arc-ing point. Looking back at the amplifier today, the de-sign seems exceedingly crude but it was passed at thetime by the radio experts. The very high grid leak wasa small potassium-in-glass photocell illuminated by asmall lamp whose brightness could be controlled to giveany desired effective resistance (usually about 109 Q).
In order to reduce the amount of scattered light, itwas necessary to use a double monochromator. Insteadof dispersing the light a second time it appeared betterto arrange for the second dispersing system to recom-bine the two wanted wavelengths onto the slit in frontof the photocell. This is just as effective in eliminatingstray light and makes it easy to arrange for the twowavelengths to fall on exactly the same part of thecathode of the photocell. The exact wavelengths to beused could not be decided until the instrument was com-pleted and the sensitivity measured, but a separation ofabout 200 A, which had been found satisfactory in theFery spectrograph, was thought to be about right.This gave sufficient difference in the absorption coeffi-cients of ozone, while the scattering coefficients for airwere not very different. The dimensions of the instru-ment were fixed by the minimum separation of the twowavelengths at the central slits (7.45 mm) which wasnecessary in order to allow the shorter wavelength topass clear above the wedges while the longer wavelengthpassed through the wedges without any possible inter-ference by its edges.
March 1968 / Vol. 7, No. 3 / APPLIED OPTICS 393
The width of the short wavelength slit (2) was fixedat the maximum which was thought advisable in view ofthe change of ozone absorption with wavelength. Thewidth of the other slit (S3) had to be such that, with thehighest sun and the lowest ozone, the zenith sky mea-surements came just on the thin end of the wedges.Hence, this slit width could not be fixed until the instru-ment had been completed and many measurements hadbeen made. No measurements for the determination ofthe extraterrestrial constant could be begun until thisslit width was fixed.
It happened that the separation chosen between theslits S2 and S3 was very nearly the same as the separationbetween the Hg lines 3126-3131 A and 3342 A. Whenthis was noticed, it was decided that it would simplifythe adjustment of the instruments if the separation weremade exactly equal to that between the Hg lines so thatwhen 3126-3131 X was central on S2, the line 3342 Ashould also be central on S3.
The only optical wedges of evaporated metal whichwere hen available were extremely crude and so farfrom linear as to be useless for this purpose. It wastherefore necessary to use wedges of gelatin containingcarbon black between quartz plates. These wedges,made by Ilford, had excellent optical properties but un-fortunately, while gelatin will adhere well to glass, ittends to peel off quartz; this gave a good deal of trouble.Moreover, in warm climates mold tended to grow onthe gelatin and the wedges became useless. At a muchlater date Beck developed a method of producing themetalized wedges which are now used.
A great deal of thought was given to the best methodof mounting and moving the wedges. It was necessaryto be able to move the wedges quickly over a large partof their total travel (e.g., between measurements on theA and D wavelengths) and yet to measure their positionto within a few hundredths of a millimeter without anybacklash. A movement worked by a screw would havebeen much too slow. The method adopted, using a tautmetal band, proved most satisfactory, giving negligiblebacklash, and, with the magnification produced by theratio of the radius of the dial to that of the drum aroundwhich the metal band was wrapped, ample accuracy ofreading was obtained.
In the first instruments, two fixed wavelengths wereused, and, to allow for the effect of temperature on the re-fractive index of quartz, a single thin quartz plate wasmounted in front of the central slits and rotated as re-qu'ired to correct for temperature changes. There wasno lens at slit 5. This was not a very good arrange-ment since, although the correct wavelengths were kepton the central slits, the patch of light on the photocellmoved with change of temperature and in some photo-cells this caused small differences of dial reading.
The best wavelengths to use could not be decideduntil the first instrument was made and working so thatthe sensitivity could be found. If the sensitivity hadproved to be very low, it would have been necessary touse relatively long wavelengths where there was morelight, while if the sensitivity were very good, shorterwavelengths with larger ozone absorption coefficients,
could have been used. Photographs of the solar spec-trum taken at the position of the central slits showed afairly strong band at about 3115 A with a rather rapidfall in intensity at shorter wavelengths, so this seemedto be suitable for the shorter wavelength. It was alsofound that the sensitivity of the instrument was suchthat good dial readings could be obtained when usingthis wavelength. (This is, of course, the present Cwavelength.)
In the early days a good deal of exploratory photo-graphing of the solar spectrum was done, and to facili-tate this the laboratory was darkened and daylight wasled from the hole in the roof down to the window of theinstrument through a tube of black cloth. In this waythe whole laboratory was dark but the spectrograph re-ceived daylight and one could work with the cover offthe instrument and place pieces of photographic plate init as required. When the photographs showed that theshort wavelength slit (S2) was fairly close to the strongband in the solar spectrum at 3115 A, the exact settingand the exact value of the wavelength were determinedby the use of the wavelength (temperature) adjustingplate. The central slits, other than slit S2 were blockedso that the galvanometer deflection was a measure of theintensity of the light passing slit S2. Then, using eithersunlight or skylight, it was possible to plot out a curve ofgalvanometer deflections against settings of the wave-length adjusting plate. The setting of the plate whichgave the maximum galvanometer deflection was thatwhich was used. (This has been slightly changed in themodern instrument.) Finally, it was necessary to knowthe wavelength of the light passing slit 2 as closely aspossible, and for this purpose the setting of the wave-length adjusting plate was found at which the Hg lines inthe 3126-3131 A region came centrally on the slit. Thedifference in the settings of thewavelengthadjustingplatenaturally allowed the exact wavelength to be calculated.
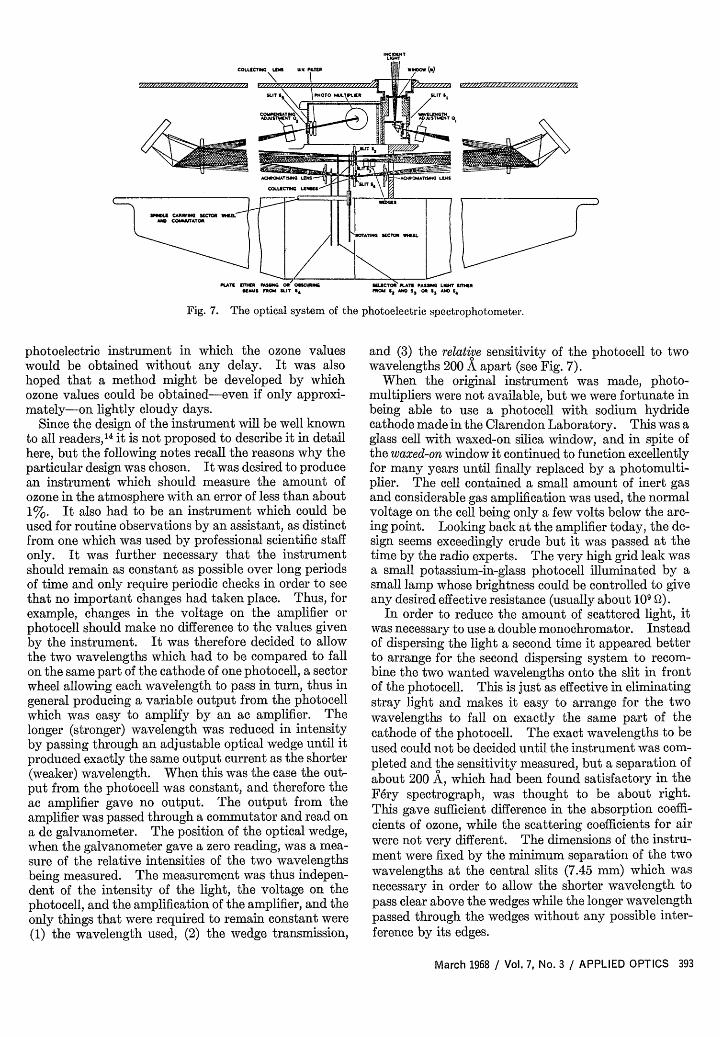
The working drawings of the photoelectric instrumenttook about two months to prepare, while the actual con-struction of the first instrument occupied all availabletime for nearly a year. While observations with thezenith skylight could be taken through the hole in theroof of the laboratory, it was necessary to wheel the in-struments to different parts of the garden at differenttimes of the day to get sunlight. After the instrument(Fig. 8) was completed and before useful ozone measure-ments could be made, it was necessary to calibrate thewedges and to determine the value of the extraterrestrialconstant. The method initially used for calibrating thewedges was to block both slits 2 and S4 SO that the de-flection of the galvanometer was a measure of the lightpassing that slit 3 and the wedges. Measurementswere taken both with and without a gauze in the solarbeam which cut down the sunlight in a known ratio.Owing to variations in the sunlight and variations in theamplifier, the calibration was very poor by present daystandards. We did not even have a tungsten filamentlamp with quartz window at that time.
On all suitable days, measurements were started earlyin the morning in the hope of getting a good series of ob-servations with the sun at different heights, from which
394 APPLIED OPTICS / Vol. 7, No. 3 / March 1968
Fig. 8. Photoelectric spectrophotometer No. 1, with front panelremoved (about 1927). The clockwork motor driving the sector
wheel has now been replaced by an electric motor.
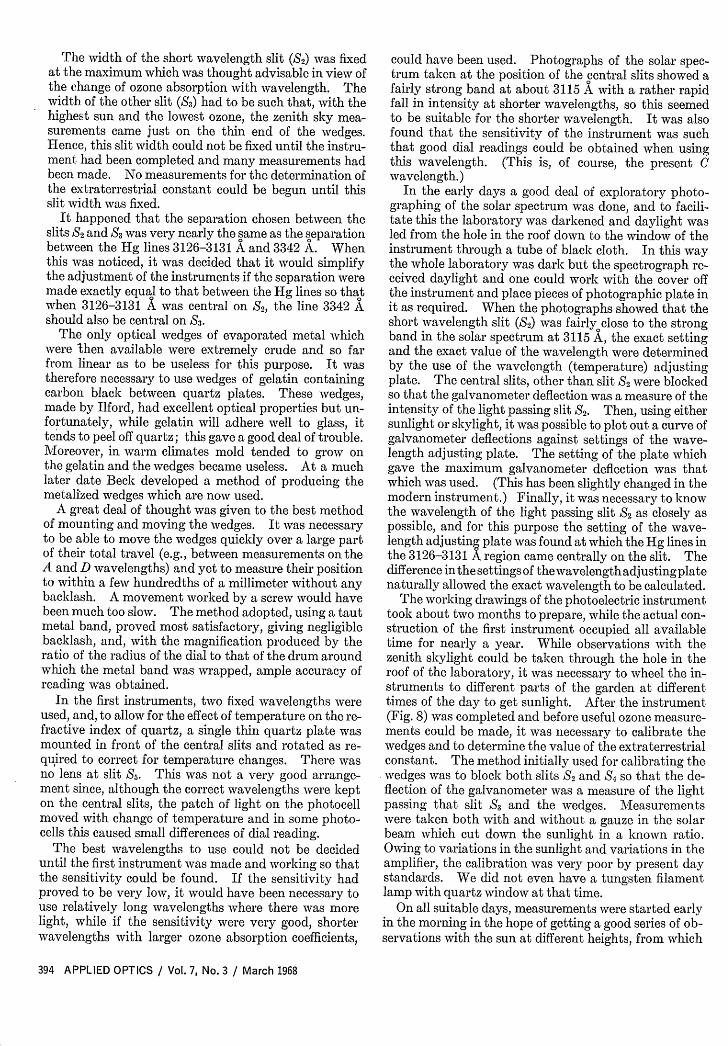
Fig. 9. Comparison of photoelectric spectrophotometers atShotover, Oxford (about 1948).
it would be possible to find the extraterrestrial constant,but many were the days which were wasted owing to thesky clouding over! After the instrument had been cali-brated in a preliminary way, there followed manymonths during which small improvements were made tothe instrument itself or to the methods of calibration.As usual, looking back, one can see that much timewould have been saved if more thought had been givento the program of work.
1. Measurements on the Clear Blue Zenith Sky
Cabannes and Dufay had calculated the total ozonefrom measurements on the light from the zenith sky byassuming that all the skylight was scattered below theozone region, then thought to be at about 40-50 km.This assumption was not justifiable and a long series ofmeasurements were begun in order to find an empiricalrelation between the results of measurements on theclear zenith sky and the total ozone as given by measure-ments on direct sunlight. Little help could be obtainedfrom theoretical considerations, since at that time wehad no idea of the vertical distribution of the ozone inthe atmosphere. Owing to the infrequency of very highor very low ozone values, it was a long time before suffi-cient measurements were obtained to give a relationshipwhich could be used to convert measurements made onthe clear zenith sky to equivalent ozone values as mea-sured by direct sunlight. It might be thought that itwas not very important to be able to obtain values of
total ozone from measurements on the zenith sky since,if the zenith sky were clear, it would generally be possi-ble to get observations on direct sunlight. However,the relationship is very important when we try to obtainozone values from measurements on the cloudy zenithsky as discussed below.
2. Observations on Cloudy Days
When the instrument was made it was arranged that athird wavelength could be used if required. This wave-length (C') was in the blue region and was comparedwith that passing through the wedges in the same way asfor the short wavelength, (C). Since the C' wavelengthswere little affected by ozone it was hoped to work out amethod whereby measurements made on a cloudy skyon the C wavelengths could be corrected by observa-tions on the C' wavelengths on the same cloud to givevalues equal those which would have been obtained ifthe sky had been clear. A great deal of time was spentin trying to get pairs of observations on the C and C'wavelengths as the zenith sky changed from clear blueto uniformly cloudy.
After some years of experience with the first photo-electric instrument, it was clear that reasonably accu-rate measurements of the total ozone could be obtainedwith the instrument when using sunlight, the light fromthe clear blue zenith sky, or that from the cloudy zenithsky. It was, therefore, very desirable that it should bepossible to obtain a number of these instruments inorder to make a more thorough survey of the distribu-tion of ozone than had been possible with the Fdry spec-trographs (Fig. 9). There was no question of building anumber of instruments in the laboratory in the sameway as the Fdry spectrographs had been built since thetime and labor would have been too great. Beck* wastherefore approached to see if they would be interestedin making the instrument, and they agreed that, if themoney could be found, they would produce one proto-type instrument for £500. Fortunately, the RoyalSociety agreed to provide this sum and in due courseinstrument No. 2 was delivered to Boars Hill, where allthe adjustments of the instrument and its calibrationhad to be done. The instrument made by Beck wasoptically exactly similar to instrument No. 1, but themechanical construction was entirely different in orderto suit their methods of machining, etc.
After Beck's instrument had been shown to be satis-factory, a few other instruments were ordered, the firstbeing for Egypt and China. A letter arriving one dayat Boars Hill from China said "I enclose cheque £100,please arrange to send me one ozone spectrograph. Ifyou want more money I will send it." In accordancewith the principle of having nothing to do with thefinancial side of the question, this letter was sent on toBeck who agreed to make the instrument. These twoinstruments and some half a dozen other instrumentsmade before the war were all adjusted and calibrated atBoars Hill.
* R. and J. Beck Ltd.
March 1968 / Vol. 7, No. 3 / APPLIED OPTICS 395
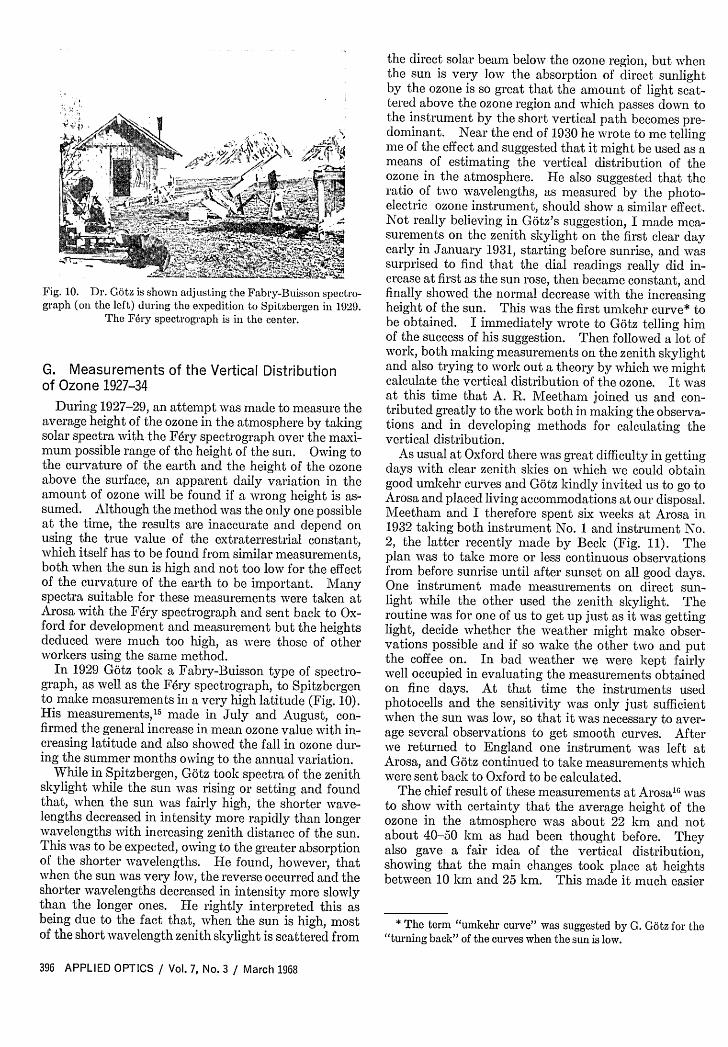
. :y~~~~~~~:Fig. 10. Dr. Gotz is shown adjusting the Fabry-Buisson spectro-graph (on the left) during the expedition to Spitzbergen in 1929.
The F6ry spectrograph is i the center.
G. Measurements of the Vertical Distributionof Ozone 1927-34
During 1927-29, an attempt was made to measure theaverage height of the ozone in the atmosphere by takingsolar spectra with the Fdry spectrograph over the maxi-mum possible range of the height of the sun. Owing tothe curvature of the earth and the height of the ozoneabove the surface, an apparent daily variation in theamount of ozone will be found if a wrong height is as-sumed. Although the method was the only one possibleat the time, the results are inaccurate and depend onusing the true value of the extraterrestrial constant,which itself has to be found from similar measurements,both when the sun is high and not too low for the effectof the curvature of the earth to be important. Manyspectra suitable for these measurements were taken atArosa with the Fry spectrograph and sent back to Ox-ford for development and measurement but the heightsdeduced were much too high, as were those of otherworkers using the same method.
In 1929 Gtz took a Fabry-Buisson type of spectro-graph, as well as the Fry spectrograph, to Spitzbergento make measurements in a very high latitude (Fig. 10).His measurements,"i made in July and August, con-firmed the general increase in mean ozone value with in-creasing latitude and also showed the fall in ozone dur-ing the summer months owing to the annual variation.
While in Spitzbergen, Gtz took spectra of the zenithskylight while the sun was rising or setting and foundthat, when the sun was fairly high, the shorter wave-lengths decreased in intensity more rapidly than longerwavelengths with increasing zenith distance of the sun.This was to be expected, owing to the greater absorptionof the shorter wavelengths. He found, however, thatwhen the sun was very low, the reverse occurred and theshorter wavelengths decreased in intensity more slowlythan the longer ones. He rightly interpreted this asbeing due to the fact that, when the sun is high, mostof the short wavelength zenith skylight is scattered from
the direct solar beam below the ozone region, but whenthe sun is very low the absorption of direct sunlightby the ozone is so great that the amount of light scat-tered above the ozone region and which passes down tothe instrument by the short vertical path becomes pre-dominant. Near the end of 1930 he wrote to me tellingme of the effect and suggested that it might be used as ameans of estimating the vertical distribution of theozone in the atmosphere. He also suggested that theratio of two wavelengths, as measured by the photo-electric ozone instrument, should show a similar effect.Not really believing in Gbtz's suggestion, I made mea-surements on the zenith skylight on the first clear dayearly in January 1931, starting before sunrise, and wassurprised to find that the dial readings really did in-crease at first as the sun rose, then became constant, andfinally showed the normal decrease with the increasingheight of the sun. This was the first umkehr curve* tobe obtained. I immediately wrote to Gdtz telling himof the success of his suggestion. Then followed a lot ofwork, both making measurements on the zenith skylightand also trying to work out a theory by which we mightcalculate the vertical distribution of the ozone. It wasat this time that A. R. Meetham joined us and con-tributed greatly to the work both in making the observa-tions and in developing methods for calculating thevertical distribution.
As usual at Oxford there was great difficulty in gettingdays with clear zenith skies on which we could obtaingood umkehr curves and G6tz kindly invited us to go toArosa and placed living accommodations at our disposal.M/eetham and I therefore spent six weeks at Arosa in1932 taking both instrument No. 1 and instrument No.2, the latter recently made by Beck (Fig. 11). Theplan was to take more or less continuous observationsfrom before sunrise until after sunset on all good days.One instrument made measurements on direct sun-light while the other used the zenith skylight. Theroutine was for one of us to get up just as it was gettinglight, decide whether the weather might make obser-vations possible and if so wake the other two and putthe coffee on. In bad weather we were kept fairlywell occupied in evaluating the measurements obtainedon fine days. At that time the instruments usedphotocells and the sensitivity was only just sufficientwhen the sun was low, so that it was necessary to aver-age several observations to get smooth curves. Afterwe returned to England one instrument was left atArosa, and Gtz continued to take measurements whichwere sent back to Oxford to be calculated.
The chief result of these measurements at Arosal wasto show with certainty that the average height of theozone in the atmosphere was about 22 km and notabout 40-50 km as had been thought before. Theyalso gave a fair idea of the vertical distribution,showing that the main changes took place at heightsbetween 10 km and 25 km. This made it much easier
* The term "umkehr curve" was suggested by G. Gotz for the"turning back" of the curves when the sun is low.
396 APPLIED OPTICS / Vol. 7, No. 3 / March 1968
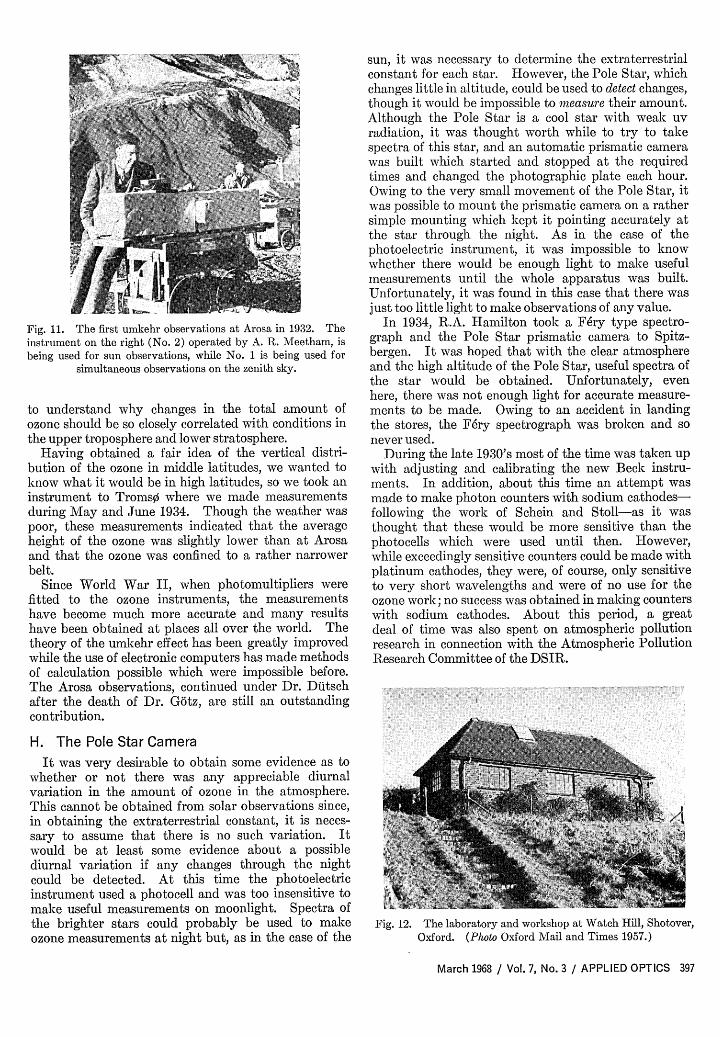
Fig. 11. The first umkehr observations at Arosa in 1932. Theinstrument on the right (No. 2) operated by A. R. Meetham, isbeing used for sun observations, while No. 1 is being used for
simultaneous observations on the zenith sky.
to understand why changes in the total amount ofozone should be so closely correlated with conditions inthe upper troposphere and lower stratosphere.
Having obtained a fair idea of the vertical distri-bution of the ozone in middle latitudes, we wanted toknow what it would be in high latitudes, so we took aninstrument to Tromso where we made measurementsduring May and June 1934. Though the weather waspoor, these measurements indicated that the averageheight of the ozone was slightly lower than at Arosaand that the ozone was confined to a rather narrowerbelt.
Since World War II, when photomultipliers werefitted to the ozone instruments, the measurementshave become much more accurate and many resultshave been obtained at places all over the world. Thetheory of the umkehr effect has been greatly improvedwhile the use of electronic computers has made methodsof calculation possible which were impossible before.The Arosa observations, continued under Dr. Dfitschafter the death of Dr. Gbtz, are still an outstandingcontribution.
H. The Pole Star CameraIt was very desirable to obtain some evidence as to
whether or not there was any appreciable diurnalvariation in the amount of ozone in the atmosphere.This cannot be obtained from solar observations since,in obtaining the extraterrestrial constant, it is neces-sary to assume that there is no such variation. Itwould be at least some evidence about a possiblediurnal variation if any changes through the nightcould be detected. At this time the photoelectricinstrument used a photocell and was too insensitive tomake useful measurements on moonlight. Spectra ofthe brighter stars could probably be used to makeozone measurements at night but, as in the case of the
sun, it was necessary to determine the extraterrestrialconstant for each star. However, the Pole Star, whichchanges little in altitude, could be used to detect changes,though it would be impossible to measure their amount.Although the Pole Star is a cool star with weak uvradiation, it was thought worth while to try to takespectra of this star, and an automatic prismatic camerawas built which started and stopped at the requiredtimes and changed the photographic plate each hour.Owing to the very small movement of the Pole Star, itwas possible to mount the prismatic camera on a rathersimple mounting which kept it pointing accurately atthe star through the night. As in the case of thephotoelectric instrument, it was impossible to knowwhether there would be enough light to make usefulmeasurements until the whole apparatus was built.Unfortunately, it was found in this case that there wasjust too little light to make observations of any value.
In 1934, R.A. Hamilton took a F6ry type spectro-graph and the Pole Star prismatic camera to Spitz-bergen. It was hoped that with the clear atmosphereand the high altitude of the Pole Star, useful spectra ofthe star would be obtained. Unfortunately, evenhere, there was not enough light for accurate measure-ments to be made. Owing to an accident in landingthe stores, the F6ry spectrograph was broken and sonever used.
During the late 1930's most of the time was taken upwith adjusting and calibrating the new Beck instru-ments. In addition, about this time an attempt wasmade to make photon counters with sodium cathodes-following the work of Schein and Stoll-as it wasthought that these would be more sensitive than thephotocells which were used until then. However,while exceedingly sensitive counters could be made withplatinum cathodes, they were, of course, only sensitiveto very short wavelengths and were of no use for theozone work; no success was obtained in making counterswith sodium cathodes. About this period, a greatdeal of time was also spent on atmospheric pollutionresearch in connection with the Atmospheric PollutionResearch Committee of the DSIR.
Fig. 12. The laboratory and workshop at Watch Hill, Shotover,Oxford. (Photo Oxford Mail and Times 1957.)
March 1968 / Vol. 7, No. 3 / APPLIED OPTICS 397
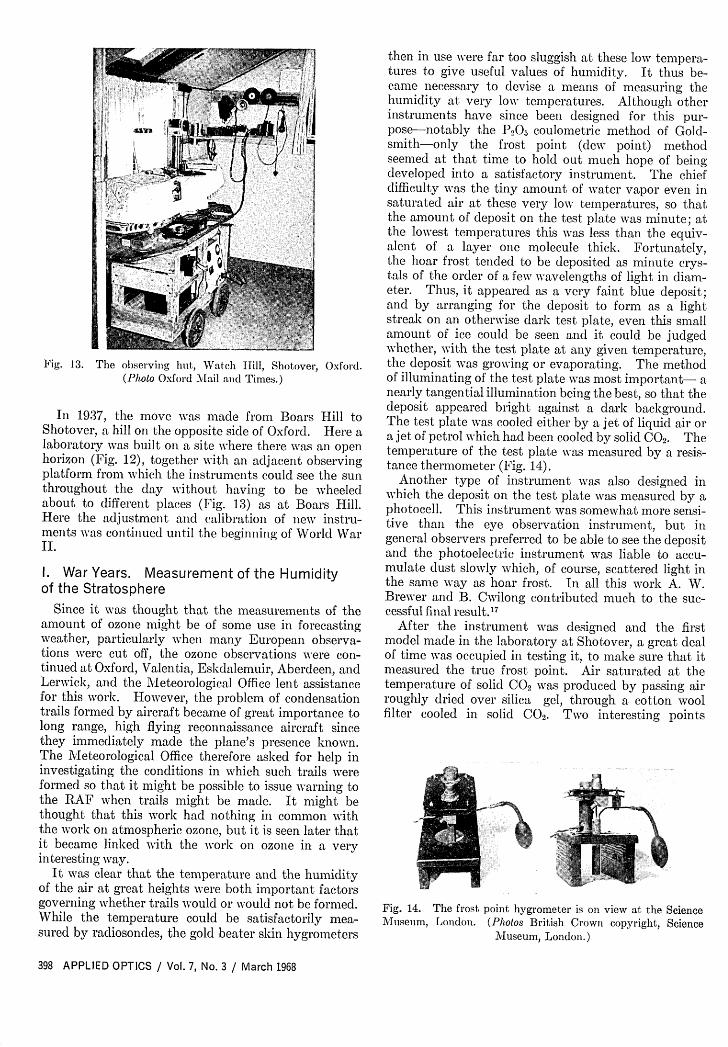
Fig. 13. The obseiving hlt, Watch ill, Shotover,(Photo Oxfold Mail and Times.)
Oxford.
In 1937, the move was made from Boars Hill toShotover, a hill on the opposite side of Oxford. Here alaboratory was built oil a site where there was an openhorizon (Fig. 12), together with all adjacent observingplatform from which the instruments could see the sunthroughout the day without having to be wheeledabout to different places (Fig. 13) as at Boars Hill.Here the adjustment and calibration of new instru-ments was continued until the beginning of World WarII.
I. War Years. Measurement of the Humidityof the Stratosphere
Since it was thought that the measurements of theamount of ozone might be of some use in forecastingweather, particularly when many European observa-tions were cut off, the ozone observations were con-tinued at Oxford, Valentia, Eskdalemuir, Aberdeen, andLerwick, ad the Meteorological Office lent assistancefor this work. However, the problem of condensationtrails formed by aircraft became of great importance tolong range, high flying reconnaissance aircraft sincethey immediately made the plane's presence known.The Meteorological Office therefore asked for help ininvestigating the conditions in which such trails wereformed so that it might be possible to issue warning tothe RAF when trails might be made. It might bethought that this work had nothing in common withthe work on atmospheric ozone, but it is seen later thatit became linked with the work on ozone in a veryinteresting way.
It was clear that the temperature and the humidityof the air at great heights were both important factorsgoverning whether trails would or would not be formed.While the temperature could be satisfactorily mea-sured by radiosondes, the gold beater skin hygrometers
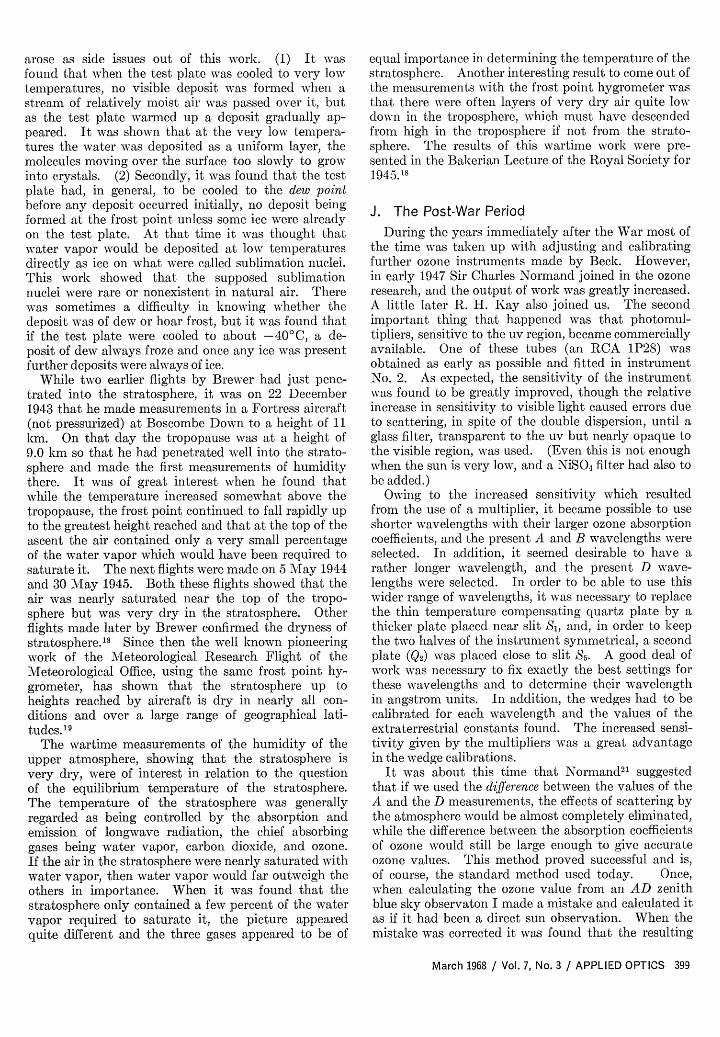
then in use were far too sluggish at these low tempera-tures to give useful values of humidity. It thus be-came necessary to devise a means of measuring thehumidity at very low temperatures. Although otherinstruments have since been designed for this pur-pose-notably the P205 coulometric method of Gold-smith-only the frost point (dew point) methodseemed at that time to hold out much hope of beingdeveloped into a satisfactory instrument. The chiefdifficulty was the tiny amount of water vapor even insaturated air at these very low temperatures, so thatthe amount of deposit on the test plate was minute; atthe lowest temperatures this was less than the equiv-alent of a layer one molecule thick. Fortunately,the hoar frost tended to be deposited as minute crys-tals of the order of a few wavelengths of light in diam-eter. Thus, it appeared as a very faint blue deposit;and by arranging for the deposit to form as a lightstreak on an otherwise dark test plate, even this smallamount of ice could be seen and it could be judgedwhether, with the test plate at any given temperature,the deposit was growing or evaporating. The methodof illuminating of the test plate was most important- anearly tangential illumination being the best, so that thedeposit appeared bright against a dark background.The test plate was cooled either by a jet of liquid air ora jet of petrol which had been cooled by solid CO2. Thetemperature of the test plate was measured by a resis-tance thermometer (Fig. 14).
Another type of instrument was also designed inwhich the deposit on the test plate was measured by aphotocell. This instrument was somewhat more sensi-tive than the eye observation instrument, but ingeneral observers preferred to be able to see the depositand the photoelectric instrument was liable to accu-mulate dust slowly which, of course, scattered light inthe same way as hoar frost. In all this work A. W.Brewer and B. Cwilong contributed much to the suc-cessful final result. 7
After the instrument was designed and the firstmodel made in the laboratory at Shotover, a great dealof time was occupied in testing it, to make sure that itmeasured the true frost point. Air saturated at thetemperature of solid CO2 was produced by passing airroughly dried over silica gel, through a cotton woolfilter cooled in solid CO2 Two interesting points
Fig. 14. The frost point hygrometer is on view at the ScienceMuseum, London. (Photos British Crown copyright, Science
Museum, London.)
398 APPLIED OPTICS / Vol. 7, No. 3 / March 1968
arose as side issues out of this work. (1) It wasfound that when the test plate was cooled to very lowtemperatures, no visible deposit was formed when astream of relatively moist air was passed over it, butas the test plate warmed up a deposit gradually ap-peared. It was shown that at the very low tempera-tures the water was deposited as a uniform layer, themolecules moving over the surface too slowly to growinto crystals. (2) Secondly, it was found that the testplate had, in general, to be cooled to the dew pointbefore any deposit occurred initially, no deposit beingformed at the frost point unless some ice were alreadyon the test plate. At that time it was thought thatwater vapor would be deposited at low temperaturesdirectly as ice on what were called sublimation nuclei.This work showed that the supposed sublimationnuclei were rare or nonexistent in natural air. Therewas sometimes a difficulty in knowing whether thedeposit was of dew or hoar frost, but it was found thatif the test plate were cooled to about -40'C, a de-posit of dew always froze and once any ice was presentfurther deposits were always of ice.
While two earlier flights by Brewer had just pene-trated into the stratosphere, it was on 22 December1943 that he made measurements in a Fortress aircraft(not pressurized) at Boscombe Down to a height of 11km. On that day the tropopause was at a height of9.0 km so that he had penetrated well into the strato-sphere and made the first measurements of humiditythere. It was of great interest when he found thatwhile the temperature increased somewhat above thetropopause, the frost point continued to fall rapidly upto the greatest height reached and that at the top of theascent the air contained only a very small percentageof the water vapor which would have been required tosaturate it. The next flights were made on 5 May 1944and 30 May 1945. Both these flights showed that theair was nearly saturated near the top of the tropo-sphere but was very dry in the stratosphere. Otherflights made later by Brewer confirmed the dryness ofstratosphere."s Since then the well known pioneeringwork of the Meteorological Research Flight of theMeteorological Office, using the same frost point hy-grometer, has shown that the stratosphere up toheights reached by aircraft is dry in nearly all con-ditions and over a large range of geographical lati-tudes. I 9
The wartime measurements of the humidity of theupper atmosphere, showing that the stratosphere isvery dry, were of interest in relation to the questionof the equilibrium temperature of the stratosphere.The temperature of the stratosphere was generallyregarded as being controlled by the absorption andemission of longwave radiation, the chief absorbinggases being water vapor, carbon dioxide, and ozone.If the air in the stratosphere were nearly saturated withwater vapor, then water vapor would far outweigh theothers in importance. When it was found that thestratosphere only contained a few percent of the watervapor required to saturate it, the picture appearedquite different and the three gases appeared to be of
equal importance in determining the temperature of thestratosphere. Another interesting result to come out ofthe measurements with the frost point hygrometer wasthat there were often layers of very dry air quite lowdown in the troposphere, which must have descendedfrom high in the troposphere if not from the strato-sphere. The results of this wartime work were pre-sented in the Bakerian Lecture of the Royal Society for1945. 18
J. The Post-War PeriodDuring the years immediately after the War most of
the time was taken up with adjusting and calibratingfurther ozone instruments made by Beck. However,in early 1947 Sir Charles Normand joined in the ozoneresearch, and the output of work was greatly increased.A little later R. H. Kay also joined us. The secondimportant thing that happened was that photomul-tipliers, sensitive to the uv region, became commerciallyavailable. One of these tubes (an RCA P28) wasobtained as early as possible and fitted in instrumentNo. 2. As expected, the sensitivity of the instrumentwas found to be greatly improved, though the relativeincrease in sensitivity to visible light caused errors dueto scattering, in spite of the double dispersion, until aglass filter, transparent to the uv but nearly opaque tothe visible region, was used. (Even this is not enoughwhen the sun is very low, and a NiSO4 filter had also tobe added.)
Owing to the increased sensitivity which resultedfrom the use of a multiplier, it became possible to useshorter wavelengths with their larger ozone absorptioncoefficients, and the present A and B wavelengths wereselected. In addition, it seemed desirable to have arather longer wavelength, and the present D wave-lengths were selected. In order to be able to use thiswider range of wavelengths, it was necessary to replacethe thin temperature compensating quartz plate by athicker plate placed near slit Si, and, in order to keepthe two halves of the instrument symmetrical, a secondplate (Q2) was placed close to slit S5. A good deal ofwork was necessary to fix exactly the best settings forthese wavelengths and to determine their wavelengthin angstrom units. In addition, the wedges had to becalibrated for each wavelength and the values of theextraterrestrial constants found. The increased sensi-tivity given by the multipliers was a great advantagein the wedge calibrations.
It was about this time that Normand"i suggestedthat if we used the difference between the values of theA and the D measurements, the effects of scattering bythe atmosphere would be almost completely eliminated,while the difference between the absorption coefficientsof ozone would still be large enough to give accurateozone values. This method proved successful and is,of course, the standard method used today. Once,when calculating the ozone value from an AD zenithblue sky observaton I made a mistake and calculated itas if it had been a direct sun observation. When themistake was corrected it was found that the resulting
March 1968 / Vol. 7, No. 3 / APPLIED OPTICS 399
TIEE SCALE FOR ~ I1'A101 ____ I! 20__ _21 _ 2 __ --°3 00 01 02
0o-
21' 22 23 00 01 .02
N
-110-
050-
i,- d S - IS OE
I0-
150~~~~~~~~~~~~~~~~~2
I n- i- O P -1 .22 25 00 -- l TIME SCALE TOM 14'' I0l'
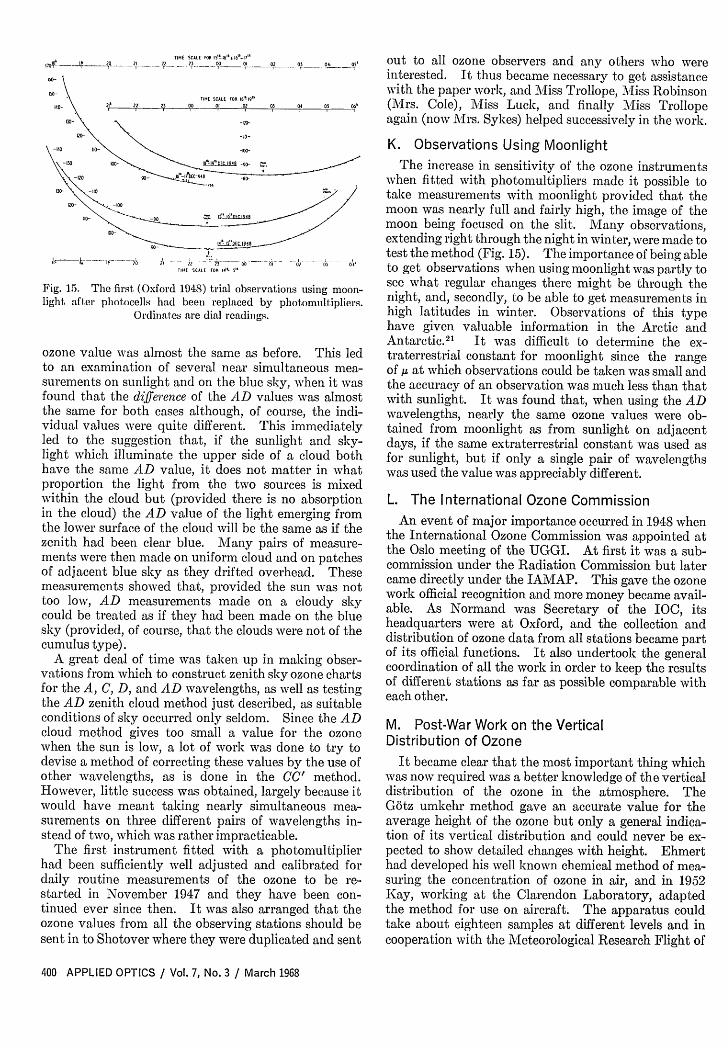
Fig. 15. The first (Oxford 1948) trial observationslight; after photocells had been replaced by ph(
Ordinates are dial readings.
ozone value was almost the same as beforeto an examination of several near simultasurements on sunlight and on the blue sky,found that the difference of the AD valuesthe same for both cases although, of coursvidual values were quite different. This iled to the suggestion that, if the sunligllight which illuminate the upper side of ahave the same AD value, it does not matproportion the light from the two sourcwithin the cloud but (provided there is noin the cloud) the AD value of the light emthe lower surface of the cloud will be the sa]zenith had been clear blue. Many pairs (ments were then made on uniform cloud andof adjacent blue sky as they drifted overhcmeasurements showed that, provided the stoo low, AD measurements made on acould be treated as if they had been madesky (provided, of course, that the clouds weicumulus type).
A great deal of time was taken up in mavations from which to construct zenith sky cfor the A, C, D, and AD wavelengths, as wethe AD zenith cloud method just described,conditions of sky occurred only seldom. Sicloud method gives too small a value foiwhen the sun is low, a lot of work was dordevise a method of correcting these values bother wavelengths, as is done in the C(However, little success was obtained, largel.would have meant taking nearly simultasurements on three different pairs of wavestead of two, which was rather impracticable
The first instrument fitted with a pholhad been sufficiently well adjusted and cadaily routine measurements of the ozonestarted in November 1947 and they havetinued ever since then. It was also arrangozone values from all the observing stationsent in to Shotover where they were duplicat
0 405. out to all ozone observers and any others who wereinterested. It thus became necessary to get assistancewith the paper work, and Miss Trollope, Miss Robinson
04 05 0X"t (TVIrs. Cole), \/iss Luck, and finally Miss Trollopeagain (now M'Irs. Sykes) helped successively in the work.
K. Observations Using MoonlightThe increase in sensitivity of the ozone instruments
when fitted with photomultipliers made it possible totake measurements with moonlight provided that themoon was nearly full and fairly high, the image of themoon being focused on the slit. Many observations,extending right through the night in winter, were made totest the method (Fig. 15). The importance of being able
~02~ 005-- 04 to get observations when using moonlight was partly touig moon- see what regular changes there might be through the
tomultipliers. night, and, secondly, to be able to get measurements inhigh latitudes in winter. Observations of this typehave given valuable information in the Arctic andAntarctic.2i It was difficult to determine the ex-
This led traterrestrial constant for moonlight since the range,neous mea- of ,u at which observations could be taken was small andwhen it was the accuracy of an observation was much less than thatwas almost with sunlight. It was found that, when using the ADe, the indi- wavelengths, nearly the same ozone values were ob-mmediately tained from moonlight as from sunlight on adjacenttt and sky- days, if the same extraterrestrial constant was used ascloud both for sunlight, but if only a single pair of wavelengthster in what was used the value was appreciably different.es is mixedabsorption L. The International Ozone Commissionerging from An event of major importance occurred in 1948 when
me as if the the International Ozone Commission was appointed atmeasure- the Oslo meeting of the UGGI. At first it was a sub-
on patches commission under the Radiation Commission but later,ad. Thse came directly under the IAMAP. This gave the ozone
lun was no work official recognition and more money became avail-cloudy sky able. As Normand was Secretary of the IOC, itson the blue headquarters were at Oxford, and the collection and-e not of the distribution of ozone data from all stations became part
Aing bse. of its official functions. It also undertook the general)king hsert coordination of all the work in order to keep the results
zoane tars of different stations as far as possible comparable with11 a tesing each other.
as suitablence the AD M. Post-War Work on the Verticalthe ozone Distribution of Ozone
ie to try toy the use of It became clear that the most important thing which
' method. was now required was a better knowledge of the verticaly because it distribution of the ozone in the atmosphere. Theieous mea- Gbtz umkehr method gave an accurate value for theeIengths in- average height of the ozone but only a general indica-
tion of its vertical distribution and could never be ex-omultiplier pected to show detailed changes with height. Ehmert
librated for had developed his well known chemical method of mea-to be re- suring the concentration of ozone in air, and in 1952been con- Kay, working at the Clarendon Laboratory, adapted
ed that the the method for use on aircraft. The apparatus coulds should be take about eighteen samples at different levels and ined and sent cooperation with the Meteorological Research Flight of
400 APPLIED OPTICS / Vol. 7, No. 3 / March 1968
loo-
the Meteorological Office, a number of flights weremade with the apparatus to a height of about 12 kmand three to about 15 km. These showed that theozone content of the troposphere, though everywheresmall, increased slightly with height up to the tropo-pause and there seemed to be a larger increase as soonas the stratosphere was entered. In 1956, Brewer tookthe same apparatus to northern Norway, and, in co-operation with the Norwegian Air Force made a numberof flights there. While there was some trouble due todestruction of ozone in the pipes leading the air intothe apparatus, a large increase of ozone content of theair in the stratosphere was found.
In 1956, S. Larsen, who had previously taken ozonemeasurements at Spitzbergen and Tromso, came toOxford to work on the scattering properties of theatmosphere, since lack of knowledge had been causingdifficulties in calculating the vertical distribution ofozone from umkehr measurements.
Chemical methods of estimating the amount ofozone in the air, which require titration and only takespot samples, are not at all suitable for a balloon-borneapparatus such as is necessary if measurements atgreat heights are to be obtained. In 1957, Brewer,working with Milford22 and later with Griggs,2 3 showedthat if ozone is passed into KI solution, the amount ofiodine released can be measured coulometrically, pro-vided that the iodine formed at the anode is not allowedto recirculate to the cathode. In the first type ofinstrument the iodine was washed away as it wasformed by a current of KI solution while in the secondtype of apparatus a silver or mercury anode was used sothat the insoluble AgI or HgI was formed. The currentpassed by the solution under average conditions wasonly about 5 iA but this was enough to control theaudiofrequency of a small radio transmitter and sotelemeter the concentration of ozone to a ground station.Many very valuable ascents were made in the BritishIsles in conjuncton with the Meteorological Office,while other flights were made at Tromso, Malta, Nai-robi, and Halley Bay.2 4 Just after Brewer's work atOxford, Regener produced his well known chemilu-minescent method. 25 Both these chemical types ofozone sondes require measurements with the spectro-photometer to check the absolute values.
N. Preparations for the IGYIt was clear that the IGY would bring a large in-
crease in the number of ozone instruments required,and several new Beck instruments were ordered bydifferent countries. It was too much work to do allthe adjustment and preliminary testing at Shotover anda member of Beck's staff came to Shotover for severalweeks to learn the technique. New instruments still,however, had to come for final calibration and compari-son with instrument No 1 (Fig. 9). In order to keep themethods as uniform as possible at the different stationsand to help observers to keep their instruments in goodorder, the Observers Handbook, which was firstwritten when the instruments used photocells, wasrewritten and a new section added on adjustment and
calibration of the instruments. These booklets, to-gether with that written later, Determination of Con-stants, were published in the Annals of the IGY.20
An important step was taken at this tme when it be-came possible for the IOC to appoint a TravellingPhysicist (C. D. Walshaw) who, having become famil-iar with the adjustments and calibration of the instru-ments, toured all the stations measuring ozone inEurope to ensure that they were all in good order beforethe start of the IGY, so that the measurements fromdifferent stations should as far as possible be compa-rable with one another.
In addition to testing new instruments and checkingexisting ones, many observers came to Shotover tolearn the best methods of using the instruments andmaintaining them in good order. This alone took up alot of time.
In March 1957, an intensive series of observationswas begun with the object of checking the extrater-restrial constants and the accuracy of the zenith ozonecharts for the different wavelengths. Whenever con-ditions were suitable, measurements on all four wave-lengths, on both the sun and the zenith sky, were madesix times a day from early morning to late evening-avery exhausting program in fine weather. Althoughthe weather for the first few months was better thanusual, the results for the extraterrestrial constant werevery disappointing, giving large differences from day today. This was shown to be due to changes in theamount of ozone during a set of observations, and nofurther attempt has been made at Oxford to measurethe extraterrestrial constant since it can be done somuch better at other stations in better climates.
Q -- . ...... -.
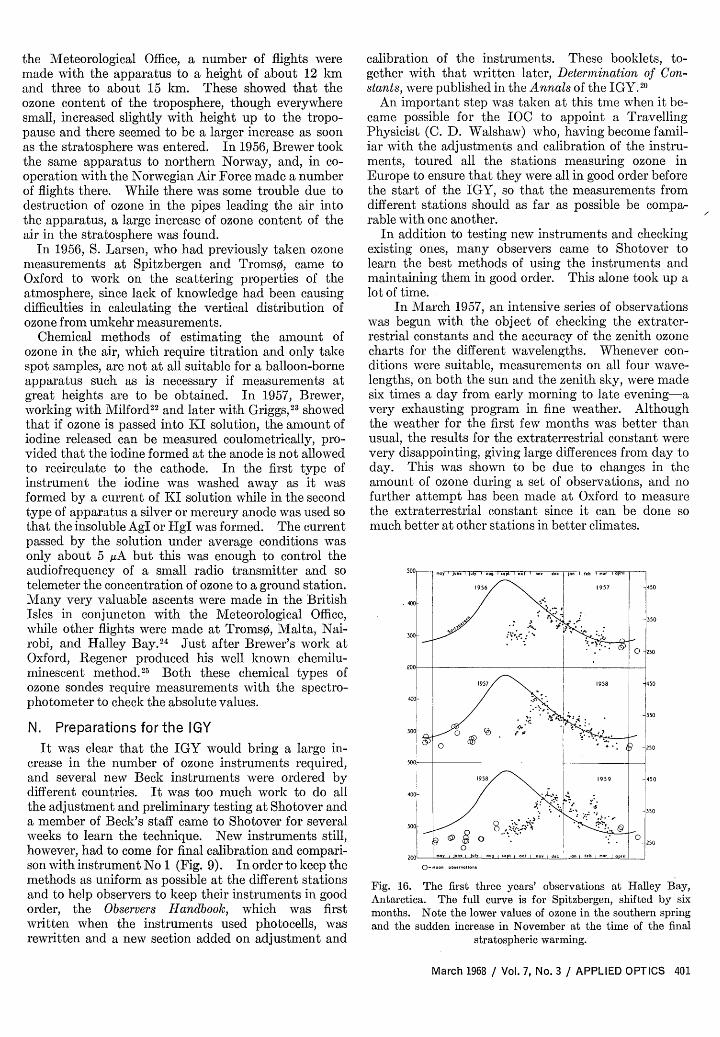
Fig. 16. The first three years' observations at Halley Bay,Antarctica. The full curve is for Spitzbergen, shifted by sixmonths. Note the lower values of ozone in the southern springand the sudden increase in November at the time of the final
stratospheric warming.
March 1968 / Vol. 7, No. 3 / APPLIED OPTICS 401
4
-1c
020
I
11
l
I
In
-I
I3
4
Vf,
p I 'i IrI '�, 's � 4i'IC II ,
I->: 'N\j 4
402 APPLIED OPTICS / Vol. 7, No. 3 / March 1968
--,,V '�.I
ip
r\..�s 1� , I
t,
4 �� i�,�, �,4 ')
:0
. * *
De > m 0
VD 0X n o
Cd e e
(N~
CD
One of the more interesting results on atmosphericozone which came out of the IGY was the discovery ofthe peculiar annual variation of ozone at Halley Bay(Fig. 16). This particular ozone instrument had been toShotover to be checked up immediately before leavingEngland. Moreover, Evans, who took the originalobservations at Halley Bay, had also been to Shotoverto become familiar with the working of the instrumentand its maintainence. The annual variation of ozoneat Spitzbergen was fairly well known at that time, so,assuming a six months difference, we knew what toexpect. However, when the monthly telegrams fromHalley Bay began to arrive and were plotted alongsidethe Spitzbergen curve, the values for September andOctober 1956 were about 150 units lower than was ex-pected. We naturally thought that Evans had madesome large mistake or that, in spite of checking just be-fore leaving England, the instrument had developedsome fault. In November the ozone values suddenlyjumped up to those expected from the Spitzbergenresults. It was not until a year later, when the sametype of annual variation was repeated, that we realizedthat the early results were indeed correct and thatHalley Bay showed most interesting difference fromother parts of the world. It was clear that the wintervortex over the South Pole was maintained late into thespring and that this kept the ozone values low. Whenit suddenly broke up in November both the ozonevalues and the stratosphere temperatures suddenlyrose.
0. Transfer of the IOC Work from Shotover
In 1959 Normand resigned as Secretary of the IOCand the work at Shotover was much reduced but newBeck instruments still continued to go there for theirfinal comparison and checking.
The appointment of the IOC in 1948, together withan annual grant of money, had been a great help to theresearch on atmospheric ozone, and four internationalconferences on the subject had been held under theaegis of the IOC with great success. With the begin-ning of the IGY, the WMO became interested in thework and undertook the publication of all the IGYozone results. Later, after WM/O had appointed aWorking Group to consider the whole matter, theCanadian Meteorological Department undertook-onbehalf of WMO-to collect and publish the daily ozonevalues from all stations after the end of the IGY.This was clearly a much more satisfactory arrange-ment, since the work at Shotover, being on a privatebasis, could not be permanent, nor did it lend itself tothe expansion which could be envisaged in future years.At the beginning of the work, an informal organizationwas necessary, but as more and more people becameinterested in atmospheric ozone a much more permanentorganization became necessary. The arrangements forthe general control of the work now seem very satis-factory.
March 1968 / Vol. 7, No. 3 / APPLIED OPTICS 403
1:6 'DQZ i��(Z) ';�)eq) 4N)
Q (DQ)
Qi)�D (31%
(Z) <�)'
<9) O(R)0
Q�) 1;��)T5
f--"\ /--'&\W \S)
<A�o
(7:�N <�)1�:�
Q �)�6�
0
0
00
0
0
0
S
0
0S
0
0010S
r12
0
00
-S
S
00
S
04
-SH
404 APPLIED OPTICS / Vol. 7, No. 3 / March 1968
method and by the ozone sondes developed by Brewerand by Regener, particularly the magnificent series ofascents extending from Panama to Thule and Alaska inNorth America.
I am much indebted to Sir Charles Normand, to Dr.Houghton, and to Dr. Walshaw for their help in pro-ducing this article.
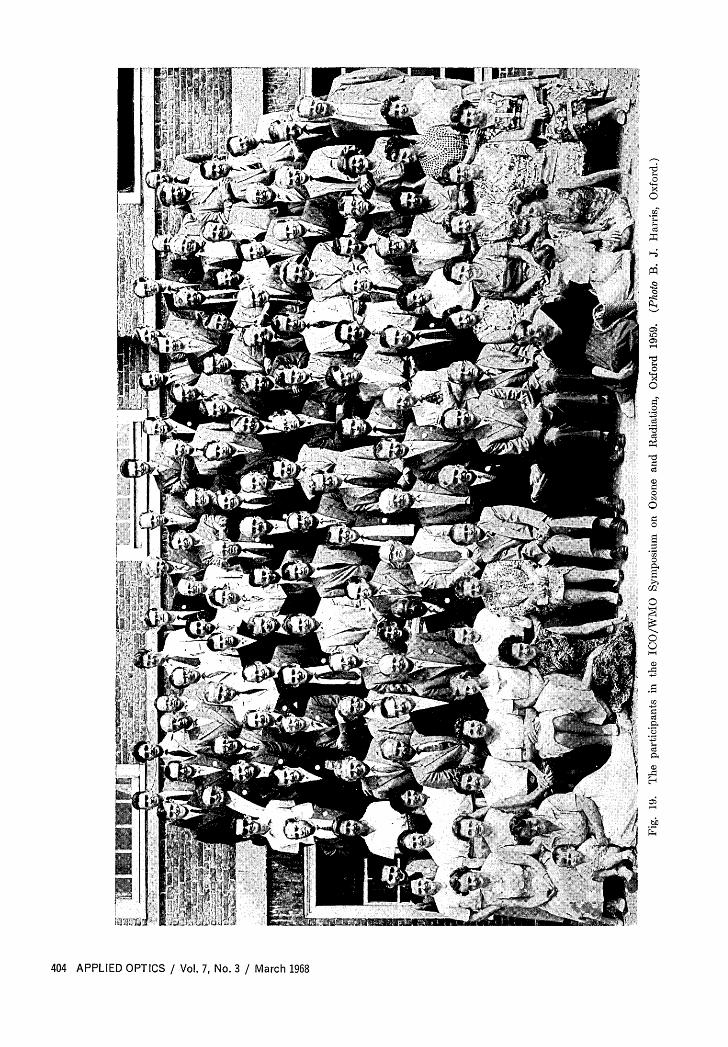
The following international conferences on atmo-spheric ozone have been held:
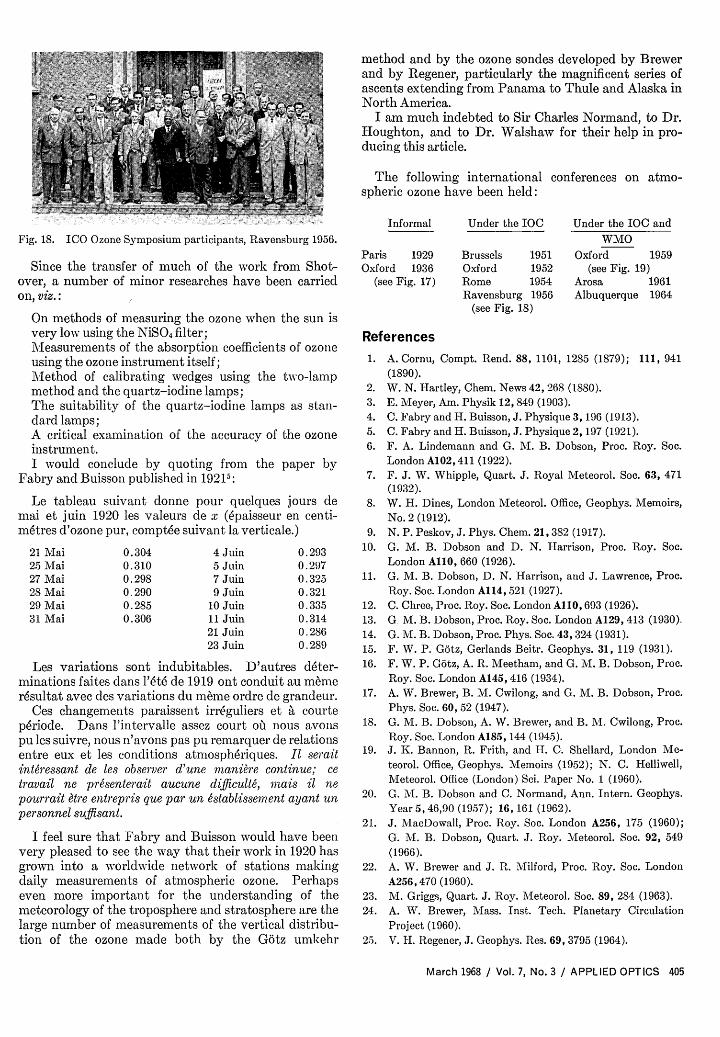
Informal Under the IOCFig. 18. ICO Oo ne .Sypo siu. m V t, , pt ipants, Ravensburg 95..
Fig. 18. ICO Ozone Symposium participants, Ravensburg 1956.
Since the transfer of much of the work from Shot-over, a number of minor researches have been carriedon, viz.:
On methods of measuring the ozone when the sun isvery low using the NiSO4 filter;Measurements of the absorption coefficients of ozoneusing the ozone instrument itself;Method of calibrating wedges using the two-lampmethod and the quartz-iodine lamps;The suitability of the quartz-iodine lamps as stan-dard lamps;A critical examination of the accuracy of the ozoneinstrument.I would conclude by quoting from the paper by
Fabry and Buisson published in 19215:
Le tableau suivant donne pour quelques jours demai et juin 1920 les valeurs de x (paisseur en centi-metres d'ozone pur, comptee suivant la verticale.)
0.2930.2970.3250.3210.3350.3140.2860.289
Les variations sont indubitables. D'autres d6ter-minations faites dans 1'6t6 de 1919 ont conduit au mbmeresultat avec des variations du meme ordre de grandeur.
Ces changements paraissent irr6guliers et courtep6riode. Dans l'intervalle assez court o nous avonispu les suivre, nous n'avons pas pu remarquer de relationsentre eux et les conditions atmosphdriques. I seraitintgressant de les observer d'une maniere continue; cetravail ne presenterait aucune difficultt, mais i nepourrait Utre entrepris que par un stablissem ent ayant unpersonnel suffisant.
I feel sure that Fabry and Buisson would have beenvery pleased to see the way that their work in 1920 hasgrown into a worldwide network of stations makingdaily measurements of atmospheric ozone. Perhapseven more important for the understanding of themeteorology of the troposphere and stratosphere are thelarge number of measurements of the vertical distribu-tion of the ozone made both by the Gbtz umkehr
Paris 1929Oxford 1936
(see Fig. 17)
References
Brussels 1951Oxford 1952Rome 1954Ravensburg 1956
(see Fig. 18)
Under the IOC andWMO
Oxford 1959(see Fig. 19)
Arosa 1961Albuquerque 1964
1. A. Cornu, Compt. Rend. 88, 1101, 1285 (1879); 111, 941(1890).
2. W. N. Hartley, Chem. News 42, 268 (1880).3. E. Meyer, Am. Physik 12, 849 (1903).4. C. Fabry and H. Buisson, J. Physique 3, 196 (1913).5. C. Fabry and H. Buisson, J. Physique 2, 197 (1921).6. F. A. Lindemann and G. M. B. Dobson, Proc. Roy. Soc.
London A102, 411 (1922).7. F. J. W. Whipple, Quart. J. Royal Meteorol. Soc. 63, 471
(1932).8. W. H. Dines, London Meteorol. Office, Geophys. Memoirs,
No. 2 (1912).9. N. P. Peskov, J. Phys. Chem. 21, 382 (1917).
10. G. M. B. Dobson and D. N. Harrison, Proc. Roy. Soc.
London A110, 660 (1926).11. G. M. B. Dobson, D. N. Harrison, and J. Lawrence, Proc.
Roy. Soc. London A114, 521 (1927).12. C. Chree, Proc. Roy. Soc. London A 10, 693 (1926).13. G. M. B. Dobson, Proc. Roy. Soc. London A129, 413 (1930).14. G. M. B. Dobson, Proc. Phys. Soc. 43,324 (1931).15. F. W. P. Gotz, Gerlands Beitr. Geophys. 31, 119 (1931).16. F. W. P. G6tz, A. R. Meetham, and G. M. B. Dobson, Proc.
Roy. Soc. London A145, 416 (1934).17. A. W. Brewer, B. M. Cwilong, and G. M. B. Dobson, Proc.
Phys. Soc. 60, 52 (1947).18. G. M. B. Dobson, A. W. Brewer, and B. M. Cwilong, Proc.
Roy. Soc. London A185, 144 (1945).19. J. K. Bannon, R. Frith, and H. C. Shellard, London Me-
teorol. Office, Geophys. Memoirs (1952); N. C. Helliwell,Meteorol. Office (London) Sci. Paper No. 1 (1960).
20. G. M. B. Dobson and C. Normand, Ann. Intern. Geophys.Year 5, 46,90 (1957); 16, 161 (1962).
21. J. MacDowall, Proc. Roy. Soc. London A256, 175 (1960);G. M. B. Dobson, Quart. J. Roy. Meteorol. Soc. 92, 549
(1966).22. A. W. Brewer and J. R. Milford, Proc. Roy. Soc. London
A256,470 (1960).23. M. Griggs, Quart. J. Roy. M\eteorol. Soc. 89, 284 (1963).24. A. W. Brewer, Mass. Inst. Tech. Planetary Circulation
Project (1960).25. V. H. Regener, J. Geophys. Res. 69, 3795 (1964).
March 1968 / Vol. 7, No. 3 / APPLIED OPTICS 405
21 Mai25 Mai27 Mai28 Mai29 Mai31 Mai
0.3040.3100.2980.2900.2850.306
4 Juin5 Juin7 Juin9 Juin
10 Juin11 Juin21 Juin23 Juin