forward guidance as a monetary policy rule - bank of japan · forward guidance as a monetary policy...
TRANSCRIPT

Forward Guidance as a Monetary Policy Rule Mitsuru Katagiri*[email protected]
No.16-E-6June 2016
Bank of Japan 2-1-1 Nihonbashi-Hongokucho, Chuo-ku, Tokyo 103-0021, Japan
* Research and Statistics Department
Papers in the Bank of Japan Working Paper Series are circulated in order to stimulate discussion and comments. Views expressed are those of authors and do not necessarily reflect those of the Bank. If you have any comment or question on the working paper series, please contact each author. When making a copy or reproduction of the content for commercial purposes, please contact the Public Relations Department ([email protected]) at the Bank in advance to request permission. When making a copy or reproduction, the source, Bank of Japan Working Paper Series, should explicitly be credited.
Bank of Japan Working Paper Series

Forward Guidance as a Monetary Policy Rule�
Mitsuru Katagiriy
June 2016
Abstract
Many central banks implement forward guidance according to an implicit or
explicit policy rule in practice, and thus it is expected to in�uence the economy by
changing expectations formation of private agents. In this paper, I investigate the
e¤ects of forward guidance particularly via expectations formation by formulating
forward guidance as a monetary policy rule in a non-linear new Keynesian model.
A quantitative analysis using the U.S. and Japanese data implies that a rule-based
forward guidance signi�cantly mitigates a decline in in�ation and output growth
in a crisis period via changing expectations formation.
Keywords: Forward Guidance; Expectations Formation; E¤ective Lower Bound;
Particle Filter
JEL Classi�cation: E31; E32; E42; E52
�The author is grateful for comments from Kosuke Aoki, Richard Harrison, Yasuo Hirose, colleagues
at the Bank of Japan, and participants of Royal Economic Society Conference 2016 and of a seminar
at the Bank of England and the Bank of Japan. Any remaining errors are the sole responsibility of the
author. The views expressed in this paper are those of the author and do not necessarily re�ect the
o¢ cial views of the Bank of Japan.
yBank of Japan. E-mail: [email protected].
1

1 Introduction
Recently, a number of central banks have implemented monetary easing by keeping in-
terest rates at zero longer than expected to mitigate the adverse e¤ects of the e¤ective
lower bound (ELB) of nominal interest rates. For example, the Federal Reserve kept
the interest rates at zero after the Great Recession even though the estimated contem-
poraneous Taylor rule �a popular policy rule for nominal interest rates �has already
suggested positive values (Figure 1).1 Such a commitment to keep interest rates low
and longer than expected is referred to as a type of forward guidance (FG). The basic
mechanism behind its e¤ect after reaching the ELB has been theoretically established by,
for example, Reifschneider and Williams (2000) and Eggertsson and Woodford (2003)
among others.2
A quantitative evaluation of FG in a rational expectations model is, however, not
so simple task because FG is usually implemented by an implicit or explicit policy rule
and consequently it potentially in�uences the economy via changing expectations of
private agents. That is, since the private agents recognize that FG is endogenously
introduced and removed (more generally, strengthened and weakened) in response to
economic situations, FG must change the way of forming expectations among private
agents not only at the ELB but also before reaching the ELB. Therefore, to correctly
and precisely evaluate the e¤ects of FG in a rational expectations model, FG needs to
be formulated as a monetary policy rule rather than exogenous policy actions.
In this paper, I quantitatively investigate the e¤ects of FG by modeling FG as a
monetary policy rule in a non-linear new Keynesian model. The approach to model
1For computing the interest rates suggested by the Taylor rule, I �rst assume a contemporaneous
Taylor rule without interest rate inertia responding in�ation and output growth, and set the reaction
parameter to in�ation rates and output growth to 2.45 and 0.39, respectively, based on the estimated
rule in the later section.
2While FG is recently de�ned as broader policy measures, especially a clari�cation of policy rules,
than a commitment policy, this paper de�nes FG as the traditional commitment policy. Campbell,
Evans, Fisher, and Justiniano (2012) categorize FG depending on whether or not it entails a commitment
to future actions. They call these two types of FG Odyssean and Delphic, respectively.
2
FG as a monetary policy rule is in contrast to the previous literature in the sense that
the previous literature usually models FG as an exogenous extension of zero interest
rate periods in a perfect foresight model or as an exogenous news shock to nominal
interest rates. Therefore, the previous literature just investigates the e¤ects of FG after
it is actually implemented at the ELB, and tells nothing about the e¤ects of FG via
expectations formation at the ELB as well as before reaching the ELB. To describe FG
as a policy rule, the central bank in the model is assumed to conduct the monetary
policy not only by setting nominal interest rates according to the Taylor rule with ELB,
but also by committing to zero interest rates à la Reifschneider and Williams (2000). A
rule-based FG following the Reifschneider-Williams rule suggests that when the nominal
interest rate by the Taylor rule is constrained by the ELB, the central bank commits to
an extended period of zero interest rate policy or a lower interest rate policy according to
the cumulative deviation of nominal interest rates from the ELB. Therefore, the event of
reaching ELB induces the expectation for future monetary easing and consequently leads
to an increase in in�ation expectations. The Reifschneider-Williams rule is of course a
reduced form of a FG rule, but since it appropriately captures the endogenous and
historically dependent implementation of the central bank�s FG in response to in�ation
and output growth as observed in real economy, the quantitative analysis based on the
Reifschneider-Williams rule should provide a useful implication for the e¤ects of a rule-
based FG in general.
The quantitative analysis using policy functions and impulse responses indicates that
while the economy faces a signi�cant negative pressure on in�ation and output growth
at the ELB as emphasized by the previous literature, a rule-based FG can signi�cantly
mitigate those adverse e¤ects at the ELB. Furthermore, the quantitative analysis shows
that a rule-based FG has e¤ects on in�ation and output growth even at non-ELB (but
close to ELB) states via changing expectation for the central bank�s policy at the ELB,
and as a result reduces the probability for reaching ELB. That is, it implies that the
central bank can positively in�uence in�ation and output growth even at non-ELB states
by clarifying in advance that they would commit to low interest rates according to the FG
rule if they are constrained by the ELB. This policy implication sounds relatively new
3
in the literature of FG, but Davig and Leeper (2006) call such policy e¤ects �expecta-
tions formation e¤ects�and show that those e¤ects are quantitatively important when
investigating the e¤ects of a non-linear policy rule.
To apply the model to the U.S. economy and quantify the e¤ects of FG, I estimate
the model parameters and identify the structural shocks by a Bayesian method. The
model is non-linear with respect to: (i) the nominal interest rates are constrained by
the ELB, and (ii) the economy is faced with a potential large decline in output growth
(i.e., the crisis shock). The second non-linearity, which is supposed to capture the large
decline in output growth during the Great Recession, is incorporated as in Barro (2006).
Since the non-linear structure of the model makes it practically di¢ cult to estimate all
parameters by computing exact solutions, I adopt the following two-step approach. First,
most parameters are estimated by a linearized model without ELB and the crisis shock
using the data up to 2007/4Q. The implicit assumption in the �rst-step estimation is
that the economy had not been faced with the crisis shocks as well as the ELB up to the
Great Recession. The parameters of the fully non-linear model are set to the estimated
values, and, as the second-step estimation, the degree of commitment to FG as well as
the structural shock sequences are estimated by a non-linear model with ELB and the
crisis shock using the particle �lter and the data up to 2015/4Q.
The estimated FG rule strongly implies that they respond to economic changes even
at the ELB by strengthening and weakening its commitment to FG. To understand the
role taken by the rule-based FG in more detail, the counterfactual simulations for the U.S.
economy are conducted. The counterfactual experiments indicate that the U.S. economy
would possibly experience de�ation and a sharper decline in output growth during and
after the Great Recession if the Federal Reserve adopted a weaker commitment to FG.
Furthermore, they imply that the exogenous extensions of zero interest rate periods,
which are identi�ed as negative monetary policy shocks at the ELB, contributed to
support in�ation and output growth during the Great Recession. Put together, the
results of the policy experiments suggest that the monetary policy both as a rule and
as an exogenous extension of the zero interest rate periods at the ELB played a key role
accounting for the �missing de�ation�during the Great Recession.
4

Finally, a quantitative analysis on the Japanese economy is carried out. Since the
Japanese economy experienced long-lasting low in�ation periods in contrast to the U.S.
economy, it is expected that the quantitative e¤ects of FG are less evident than in the
case of the U.S. economy. The counterfactual simulation examining the case of (i) a
stronger commitment to FG, and (ii) a higher target in�ation rate, implies that the
Japanese economy would mitigate the sharp drop in in�ation and output growth during
the Great Recession under those alternative policy choices. Interestingly, however, it
also shows that, even under a stronger commitment to FG, the Japanese economy would
still experience the long-lasting de�ation that occurred in the late 1990s and early 2000s.
This result implies that the e¢ cacy of FG crucially depends on the assumption that
recession or de�ation lasts only for a few periods, and that the commitment to FG works
for mitigating a sharp drop in in�ation, particularly during crisis periods, but its e¤ects
for supporting in�ation could be reduced if the economy faces long-lasting de�ationary
pressures. This is because the FG, by design, commits to a future lower interest rate
policy after recovering from the ELB. If the de�ationary pressures are expected to con-
tinue for many periods and the recovery from the ELB is not expected in a short period
of time, the expectations formation e¤ects of FG on current in�ation rates would not be
very powerful.
Literature Review
In terms of literature, this paper is related to the literature on the quantitative investi-
gation of non-linear policy rules. Davig and Leeper (2006) incorporate the endogenous
monetary policy shift into a forward-looking model. While they do not mention FG at
all, FG in my paper is in e¤ect by the same mechanism via expectations formation as
in their model. Adam and Billi (2006) and Hara, Kimura, and Okina (2008) analyze
the e¤ect of a non-linear monetary policy rule by the model with ELB, and emphasize
the expectations formation e¤ects near ELB. Nakov (2008) is a good summary of this
literature.
This paper is also related to the recent studies that solve a non-linear rational ex-
pectations model with the ELB (e.g., Aruoba, Cuba-Borda, and Schorfheide (2013),
5

Fernandez-Villaverde, Gordon, Guerron-Quintana, and Rubio-Ramirez (2015), Nakata
(2013), Hirose and Sunakawa (2015) and Hills, Nakata, and Schmidt (2016)). These
studies, however, may overestimate the adverse e¤ects caused by the ELB because they
do not consider the e¤ects of FG at the ELB.
Another strand of studies related to this paper is the quantitative evaluation to FG.
In a spirit of Eggertsson andWoodford (2003), a number of studies quantitatively investi-
gate the e¤ect of FG by DSGE models. These studies, however, do not examine the e¤ect
of FG as a policy rule but as an exogenous news shock to nominal interest rates (e.g., Hi-
rose and Kurozumi (2011), Campbell, Evans, Fisher, and Justiniano (2012), Del Negro,
Giannoni, and Patterson (2012), and Gavin, Keen, Richter, and Throckmorton (2013))
or an exogenous extension of zero interest rate periods in a perfect foresight model (e.g.,
McKay, Nakamura, and Steinsson (2015)). Reifschneider and Williams (2000), on the
other hand, consider FG as a policy rule. While they use a backward-looking model
and consequently do not mention the e¤ects via expectations formation, their idea of a
rule-based FG is used in my paper to investigate the e¤ects of FG including those via
expectations formation. In a similar vein, Harrison (2015) points out the importance of
systematic components of FG, and Harrison, Korber, and Waldron (2015) consider FG
as an endogenous threshold-based policy and investigate on the optimal policy rule.
The paper proceeds as follows. In Section 2, I construct a non-linear new Keynesian
model to analyze policy e¤ects and transmission mechanism of FG. Section 3 estimates
the model parameters using the U.S. data and quantitatively investigates the e¤ects
of FG by policy functions and impulse responses, and conducts counterfactual policy
simulations with respect to the degree of commitment to FG and the monetary policy
shocks. Section 4 applies the model to the Japanese economy and quantitatively analyzes
the role of FG there. Concluding remarks are given in Section 5.
2 Model
The model follows a standard small-scale new Keynesian model with the ELB of nominal
interest rates as Aruoba, Cuba-Borda, and Schorfheide (2013) and Nakata (2013). The
6
private sector of the economy consists of a representative household, consumption-good
�rms, and intermediate-good �rms. The central bank conducts a monetary policy by
using nominal interest rates as a policy tool and follows the Taylor rule with ELB. In
contrast to the conventional literature, however, the central bank can commit to future
monetary easing through FG in a spirit of Reifschneider and Williams (2000). Each
agent�s behavior is described in turn.
2.1 Household
The representative household supplies labor force to obtain wage income, WtLt, where
Wt denotes real wages and Lt denotes hours worked. In addition, because the household
owns all �rms in the economy as a stockholder, it also obtains dividend, Dt, as another
source of income. The household allocates its income to consumption, Ct, and savings
as a form of nominal one-period bonds, Bt. The household faces the budget constraint,
PtCt +Bt = Rt�1Bt�1 + PtWtLt + PtDt (1)
where Pt is the price level and Rt is the nominal interest rate.
The household maximizes its lifetime utility by choosing consumption and labor sup-
plies,
maxCt;Lt
1Xt=0
�t
"(Ct=At)
1��
1� ��
L1+�t
1 + �
#subject to the budget constraint (1). � 2 (0; 1) is a constant discount factor and At is a
non-stationary part of aggregate productivity. The �rst order conditions for Ct; Bt and
Lt give the Euler equation,
c��t = �RtEt
�c��t+1
at+1�t+1
�(2)
as well as the labor supply function,
wtc��t = L�t ; (3)
where the detrended consumption and real wages are denoted by lower-case letters as
ct = Ct=At and wt = Wt=At. Also, the growth rate of non-stationary part of aggregate
productivity is denoted by at = At=At�1, which follows an exogenous stochastic process
speci�ed below.
7

2.2 Firm
The representative consumption-good �rm produces the �nal good, Yt, by aggregating
the intermediate goods, Yit, using the following CES aggregator, Yt =�R 1
0Yi;t
��1� di
� ���1
;
where � > 1 is the elasticity of substitution. Let pi;t be the price of each intermediate
good. The price index, Pt, is then de�ned as Pt =�R 1
0pi;t
1��di� 11��
; and the demand for
each intermediate good is derived as a result of pro�t maximization of the representative
consumption good �rm,
Yi;t =
�pi;tPt
���Yt: (4)
The detrended consumption goods and intermediate goods production are de�ned by
dividing them by At; and are denoted by lower-case letters as yt = Yt=At and yi;t =
Yi;t=At.
A continuum of intermediate-good �rms produces di¤erentiated intermediate goods
using labor, Li;t, according to the following linear technology,
Yi;t = AtztLi;t; (5)
where At and zt is a non-stationary and stationary part of the aggregate productivity at
period t, respectively.
Under monopolistic competition, intermediate-good �rm i maximizes its discounted
pro�ts by setting the price of its di¤erentiated products under the cost for price changes,
. Hence, the intermediate-good �rm i chooses its prices so as to maximize,
maxfpi;t+kg1k=0
Et
1Xk=0
�k�ct+kct
���
"pi;t+kPt
yi;t+k � wt+kLi;t+k �
2
�pi;t+kpi;t+k�1
� ���2
yt+k
#
subject to (4) and (5). Here, �� represents the steady-state in�ation rate. As a result of
the intermediate-good �rms�optimization, in�ation dynamics can be described by the
following new Keynesian Phillips curve,
1� � + �wtzt= (�t � ��)�t � � Et (�t+1 � ��)�t+1
�yt+1yt
�1��: (6)
where wt=zt represents the real marginal cost.
8

2.3 Central Bank
The central bank sets the nominal interest rate according to the Taylor rule with the
ELB and the forward guidance term (FG term),
Rt = max�Rtlrt �mt�1; 1
�: (7)
where Rtlrt is the nominal interest rate suggested by the Taylor rule, and mt is the FG
term, which is speci�ed below. The max function indicates that the central bank would
set the nominal interest rate to one if the nominal interest rate based on the Taylor
rule subtracted by the FG term, Rtlrt � mt�1; is lower than one. The nominal interest
rate based on the policy rule, Rtlrt ; is speci�ed by the following a type of Taylor rule
responding to in�ation rates and output growth rates,
Rtlrt = Rss
� �t��
��� � ytyt�1
ata�
��yit (8)
where Rss = ��a�=� is the nominal interest rate at the steady-state. it is the monetary
policy shock which is determined by the following stochastic process,
it = i�it�1 exp("i;t) (9)
where "i;t follows N(0; �i).
The FG term, mt; is determined by the following law of motion à la Reifschneider
and Williams (2000),
mt =
8<: mt�1 + ��1�Rtlrt
�if Rtlrt < 1
mt�1 ��Rtlrt �Rt
�otherwise
(10)
where � � 0. This FG rule indicates that when the nominal interest rate based on (7)
is lower than one (i.e., Rtlrt < 1), the central bank commits to future monetary eas-
ing by accumulating mt, which is proportional to the negative deviation from the rule,
��1�Rtlrt
�. That is, the increase in mt induces the expectation for future monetary
easing and consequently leads to an increase in in�ation expectations, because the ac-
cumulated mt will be subtracted from nominal interest rates as speci�ed in (7) after
the economy leaves the ELB. Since the parameter � determines how much the negative
9
deviation is accumulated as mt, it is interpreted as the strength of commitment to the
FG.3 After the economy leaves the ELB, the above law of motion (10) indicates that the
accumulated mt is reduced by Rtlrt � Rt, which is the same amount of mt�1 subtracted
from the nominal interest rate in period t.
Figure 2 shows a simple example for describing how the Reifschneider-Williams rule
works for committing to future monetary easing in response to de�ation. In this example,
the nominal interest rate indicated by the Taylor rule Rtlrt is assumed to decline to a
negative value in period 2, and gradually return to the previous level (the green line in
the top �gure). Given the path of Rtlrt , the interest rate Rt and the FG term mt are
determined according to (7) and (10), respectively (the middle and bottom �gures). The
dashed red lines represent the interest rate Rt and the FG term mt for the case of � = 0.
This case corresponds to the policy rule without FG because the FG term mt is always
equal to zero. As a result, the interest rate for � = 0 (the red dashed line in the middle
�gure) is the same as the Taylor rule with ELB, i.e., Rt = max�Rtlrt ; 1
�. The blue solid
lines, on the other hand, represent the interest rate Rt and the FG term mt for the case
of � = 1:5. In this case, the negative deviation from the rule ��1�Rtlrt
�is accumulated
as the FG term mt (the blue solid line in the bottom �gure). Therefore, as indicated by
(7), the gross interest rate Rt continues to be one (i.e., the net interest rate Rt � 1 is
zero) as long as mt > 0, and it lifts o¤ from the ELB after using up the accumulated FG
term. Since such a commitment to future monetary easing is expected by private agents
right after the economy is hit by a de�ationary shock in period 2, the commitment to
FG as a policy rule (i.e., a positive �) works as supporting current in�ation rates via
the expectations formation.4 There are some presumptions for the policy e¤ects via
expectations formation. First, it is assumed that the value of � is common knowledge
among private agents. Therefore, if private agents have only imperfect information for
3Note that if � = 0; the FG term mt is always equal to zero, and as a result the monetary policy rule
(7) just becomes the Taylor rule with ELB as is used in the previous literature.
4The path of nominal interest rate looks similar to the Taylor rule with interest rate smoothing. The
Reifschneider-Williams rule, however, does not require a smoothed decline of interest rate in the face of
negative shocks, and such an asymmetric response is a key di¤erence to the interest rate smoothing.
10

the value of �, the e¤ects of FG via expectations formation would be limited, and would
depend on how precisely the private agents know about the true value of �. Second, it
is assumed that the central bank can commit to FG perfectly. While some papers cast
doubt on the feasibility of FG in terms of the time consistency problem, Nakata (2014)
provides a positive result about the ability of commitment to FG by taking into account
the central bank�s reputation, thus supporting the assumption here.
The Reifschneider-Williams rule is of course a reduced form of FG rule, and it looks
di¤erent from the actual policies, including, for example, the date-dependent FG or the
FG that is directly contingent on in�ation rates and unemployment rates. Neverthe-
less, the FG based on the Reifschneider-Williams rule responds to in�ation and output
growth through changes in Rtlrt , as observed in the real economy. Therefore, this rule ap-
propriately captures the endogenous and historically dependent responses of the central
bank�s FG to in�ation and output growth in principle. Consequently, the quantitative
analysis based on the rule provides useful implications for the e¤ects of a rule-based FG
in general.
2.4 Productivity Process
The economic dynamics are driven by the non-stationary and stationary part of pro-
ductivity, At and zt. The growth rate of the non-stationary part of productivity, at �
At=At�1, as well as the stationary part of productivity, zt, follow a standard AR(1)
process,
at = a�at�1a�1��a exp("a;t) (11)
and
zt = z�zt�1 exp("z;t); (12)
where "a;t and "z;t are stochastic shocks to productivity growth and level, respectively.
a� is the growth rate of productivity at the steady-state. While both the growth rate of
productivity, at; and the productivity level, zt; entail exogenous changes in productiv-
ity of intermediate-good �rms as shown in (5), they have di¤erent e¤ects on aggregate
output and in�ation: The positive shock to productivity growth "a;t > 0 increases both
11

output and in�ation on impact while the positive shock to productivity level "z;t > 0
increases output but decreases in�ation on impact. The positive shock to at increases
in�ation because it generates the expectation for the increase in future income in addi-
tion to current income. Consequently, it raises the current consumption more than its
supply through the wealth e¤ect, thus leading to higher in�ation rates. The di¤erence in
responses of output and in�ation means that the shock to productivity growth "a;t acts
as a �demand shock�while the shock to productivity level "z;t acts as a �supply shock�
according to the classi�cation in, for example, Brave, Campbell, Fisher, and Justiniano
(2012). In the estimation of the model, given the fact that all economic variables are
driven only by those two shocks in the model, the shock to productivity growth "a;t is
supposed to capture all demand shocks, including the discount rate shock, while the
shock to productivity level "z;t is supposed to capture all supply shocks, including the
mark-up shock, in a very parsimonious way.
As for the probability distribution of the structural shocks, "a;t and "z;t, I assume
that there are two regimes: the non-crisis regime and crisis regime. In the non-crisis
regime, "a;t and "z;t follow N(0; �a) and N(0; �z) as in a standard DSGE model. In the
crisis regime, however, "a;t and "z;t follow the uniform distribution U [�6%;�3%] and
U [�10%;�3%], respectively.5 That is, the economy in the crisis regime is faced with
the risk for very large negative shocks to both non-stationary and stationary decline in
aggregate productivity. The economy is assumed to be hit by the �crisis shock�and go
into the crisis regime with probability 1% in an i.i.d manner. This speci�cation follows
the setting in the disaster shock literature such as Barro (2006). Also, from a practical
perspective, the crisis shock is necessary for likelihood evaluation of a non-linear model,
particularly for the period of large �uctuations such as the Great Recession, because
the probability for a large �uctuation in the normal distribution is so small that it is
5The lower bound of distribution is set to -16% based on Barro (2006). Then, since Nakamura,
Steinsson, Barro, and Ursua (2013) argues that a temporary shock is more dominant than a permanent
shock in a crisis, I set -6% and -10% for the lower bound of distribution for the permanent and temporary
productivity shock, respectively. The upper bound of distribution, on the other hand, is set to a value
high enough to capture only the Great Recession as a disaster in the estimation.
12

impossible to describe such an event by a simulation-based method like the particle �lter.
This point is discussed in more detail in the estimation part.
3 Quantitative Analysis
This section quantitatively investigates the e¤ects of a rule-based FG, particularly fo-
cusing on those in the U.S. economy around the Great Recession. Given the highly
non-linear structure of the model, I adopt the following two-step approach for estima-
tion of parameters as similarly in Aruoba, Cuba-Borda, and Schorfheide (2013): First,
most parameters are estimated by a linearized model without ELB and the crisis shock
using the data up to 2007/4Q. Next, as the second step estimation, the strength of com-
mitment to FG, �; is estimated by a non-linear model with ELB and the crisis shock
using the particle �lter and the data up to 2015/4Q.
With the estimated values of parameters, the e¤ects of a rule-based FG are investi-
gated by examining policy functions and impulse responses. As a part of the investigation
on the e¤ect of FG, I try to give an interpretation of �forward guidance puzzle�in this
model brie�y. Finally, to measure the in�uence of the strength of commitment, the coun-
terfactual simulations for the U.S. economy are conducted, with a special focus on the
following two counterfactual cases during the Great Recession: (i) a weak commitment
to FG, and (ii) no exogenous extensions of zero interest rate periods.
3.1 Estimation up to 2007/4Q
Since the model described in the previous section is highly non-linear due to the ELB
and the crisis shock, the computational burden is too heavy to estimate all parameters
by computing the exact solutions. Therefore, the parameters except for the strength
of commitment to FG, �, are estimated by a linearized model without ELB and the
crisis shock using the data only from 1983/1Q to 2007/4Q as in Aruoba, Cuba-Borda,
and Schorfheide (2013). The implicit assumption for this estimation strategy is that
the economy had not been faced with the crisis shocks as well as the ELB of nominal
13

interest rates up to the Great Recession, and that the estimated parameters are structural
and not changed during and after the Great Recession. The linearized model consists
of eight state variables (yt; wt; �t; Rt; Rtlrt ; at; zt; it), and its dynamics can be described
by a linearized version of eight equations: (2), (3), (6), (8), (9), (11), (12), and Rt =
Rtlrt . The parameters are estimated by a Bayesian method using the following four
data sequences: the annualized quarter-to-quarter real GDP growth rate (GDPR), the
annualized quarter-to-quarter core PCE de�ator (INF), the annualized FF rate (SR),
and the annualized 5-year government bond yield (5R). Speci�cally, the measurement
equations are formulated as,
GDPRt =
�ytyt�1
at � 1�� 400
INFt = (�t � 1)� 400
SRt = (Rt � 1)� 400
5Rt =��tR
20t � 1
�� 400;
where Rjt is the long-term interest rate with maturity j quarter and �t is a measurement
error associated with the long-term interest rate.
The long-term interest rate with maturity j is computed by the following recursive
structure,
Rjt = Et�Rj�1t+1
�j�1Rt (13)
where R1t = Rt and R0t = 1. In the estimation, the long-term interest rate is supposed
to identify the e¤ect through the accumulation of mt at the ELB because it re�ects the
decline in expected short-term interest rates by FG.6 A measurement error associated
with the long-term interest rate �t follows the AR(1) process,
�t = ���t�1�
�1��� exp("�;t)
where "�;t is generated from N(0; ��) and �� is the measurement error at the steady
6Long-term interest rates have been used for identifying the e¤ects of FG in the previous literature.
For example, Hirose and Kurozumi (2011) model FG as a news shock and argue that the long-term
interest rate provides important information to identify its e¤ects.
14

state. Since �t is interpreted as including term-premia, its steady state value �� is not
necessarily equal to zero but usually takes a positive value.
Before running the estimation, some parameters are calibrated. The discount factor
� is chosen so that the annual discount rate is 0.5%. The elasticity of labor supply �
and the elasticity of substitution � are set to 2.0 and 6.0, both of which are conventional
values. The disutility of labor supply is set to 4.0 just as normalization. Finally,
the steady-state in�ation rate �� is set to 1.005, which means that the Federal Reserve
set the target in�ation rate at 2%. The rest of the parameters are estimated by a
Bayesian technique using the U.S. quarterly data from 1983/1Q to 2007/4Q. Table 1
summarizes the estimation results with the prior distribution used for estimation. The
table indicates that the estimated parameters are close to the previous studies such
as Del Negro, Eusepi, Giannoni, Sbordone, Tambalotti, Cocci, Hasegawa, and Linder
(2013). For the monetary policy rule, the response to in�ation, �� (output growth,
�y), is a little bit larger (smaller) than the conventional value probably because the
growth-rate rule rather than the output-gap rule is adopted and because the interest
rate inertia is not incorporated. The steady-state value of measurement error for the
long-term interest rate �� is 1.0032, which means that the 5-year interest rate contains
about 1.4% term-premium on average. For the productivity processes, the growth of
non-stationary productivity at follows a persistent process with a small shock variance
while the stationary productivity zt and the monetary policy shock it follow a relatively
less persistent process.7
3.2 E¤ects of a Rule-Based Forward Guidance
This subsection quantitatively investigates the e¤ects of a rule-based FG by examining
policy functions as well as impulse responses with respect to the productivity growth at.
To compute policy functions and impulse responses, the parameters of the non-linear
7A slightly tight prior distribution is assumed for at because the shock to at is supposed to capture
the persistent potential growth and consequently work as a demand shock in the model, as is discussed
in Section 2.4.
15

model with ELB and the crisis shock are set to the estimated values by the linearized
model summarized in Table 1, and it is solved by the Coleman�s policy function iteration
method. A more detailed description for the non-linear model and its solution method
is provided in Appendix A.
3.2.1 Policy Functions and Impulse Responses
Figure 3 shows the policy functions of the in�ation rate (�t), output growth rate (atyt=yt�1),
the short-term interest rate (Rt), and the interest rate indicated by the Taylor rule (Rtlrt ).
The horizontal axis represents the log-deviation of productivity growth from its steady
state, log(at=a�). The solid blue lines show the policy functions with no accumulated FG
term (i.e., mt�1 = 0) while the dashed red lines show those with positive accumulated
FG term (i.e., mt�1 > 0). For both cases, the strength of commitment to FG � is set to
0.5, which is the lower bound value for solving the model.8 First of all, the �gure shows
that both in�ation and output growth positively respond to at. That is, the shock to
productivity growth "at works as a demand shock, as explained in Section 2.4. The �gure
also points out that there is strong non-linearity in the policy functions for in�ation and
output growth. Speci�cally, as the policy function of interest rates suggested by the
Taylor-rule Rtlrt (the right bottom �gure) implies, the non-linear responses of in�ation
and output growth to productivity growth are observed around the point where the ELB
binds. For instance, the policy function of output growth becomes clearly steeper than
a 45 degree line (the dotted black line) only at the ELB. Such non-linearities at the
ELB, which are not observed in a standard linearized model but commonly observed in
a non-linear model with the ELB, point out the possibility that in�ation and output
growth face signi�cant negative pressure at the ELB because the central bank cannot
lower the nominal interest rate in response to the negative productivity growth. Finally,
the �gure shows that the dashed red lines are always higher than the bold blue lines in
the �gures for in�ation and output growth, implying that the accumulation of FG term,
8If � is lower than 0.5, the policy functions in this model would be di¢ cult to compute because the
policy function iteration would not converge.
16

mt, works for increasing both in�ation and output growth. Behind the e¤ects of FG on
in�ation and output growth, note that the central bank keeps zero interest rates even at
the states where the Taylor rule suggests a positive level of interest rates, as indicated
by the policy function of nominal interest rates Rt for mt�1 > 0 (the dashed red line in
left bottom �gure).
Figure 4 shows the policy functions under di¤erent values of �. Since � represents
the degree of commitment to FG as a monetary policy rule in (10), the di¤erences in
policy functions under the di¤erent values of � can be interpreted as the policy e¤ects of
a rule-based FG. The �gures show the policy functions of in�ation (�t), output growth
(atyt=yt�1), the short-term interest rate (Rt), and the 5-year interest rate (R20t ) with
respect to the log-deviation of productivity growth from its steady state, log(at=a�). The
solid blue lines show the policy functions with a weak commitment to FG (� = 0:5) while
the dashed red lines show those with a tight commitment to FG (� = 4). The �gures
indicate that, with a tight commitment to FG as a rule, the adverse e¤ects on in�ation
and output growth at the ELB are signi�cantly mitigated, and consequently their non-
linear responses to negative productivity growth are merely observed. Furthermore, the
policy functions point out that commitment to FG has e¤ects on in�ation and output
growth even at non-ELB (but close to ELB) states, which implies that a rule-based FG
in�uences the economy not only through the actual accumulation of the FG termmt > 0
but also through the expectation for such commitment at the ELB. As the policy function
for interest rates Rt (the left bottom �gure in Figure 4) shows, such policy e¤ects of FG
at non-ELB states signi�cantly shrink the region of at in which the ELB binds, and
consequently mitigates the adverse e¤ects due to the ELB by reducing the probability
for reaching the ELB.
Those policy functions therefore imply that central banks can positively in�uence
in�ation and output growth even at non-ELB (but close to ELB) states and reduce
the probability for reaching ELB by clarifying in advance that they would commit to low
interest rates following the FG rule if they face the ELB. This policy implication at a non-
ELB state is new in the literature of FG, but such e¤ects of a rule-based policy through
the expectations for future policy responses have already been discussed in the literature
17

of monetary policy analyses. For example, Davig and Leeper (2006) emphasize that a
non-linear Taylor rule for nominal interest rates has e¤ects on in�ation not only through
the actual non-linear responses by central banks but also through the expectation for the
non-linear responses. They call such policy e¤ects �expectations formation e¤ects�and
show that those e¤ects are quantitatively important.
To quantify the expectations formation e¤ects of FG, I compute (1) the impulse
responses to the same size of productivity growth shock under the di¤erent values of �,
and (2) the forecast paths of in�ation. Figure 5 shows the impulse responses of in�ation,
output growth and interest rates to the productivity growth shock "a;t of -3%. The
sequence of productivity growth rates at after the shock realization is shown in the top
left �gure. The solid blue lines represent the impulse responses with a weak commitment
to FG (� = 0:5) while the dashed red lines represent those with a tight commitment to FG
(� = 4). The �gures imply that, even with the same size of negative productivity growth
shock "a;t, the responses of in�ation and output growth can be signi�cantly di¤erent
depending on the degree of commitment to FG. Speci�cally, the �gure implies that the
economy would be faced with de�ation, large �uctuations in output growth and a long-
lasting ELB experience if the central bank does not �rmly commit to FG as a policy
rule, but those negative consequences including a long lasting ELB experience could
be avoided by clarifying the commitment to FG as a policy rule in advance. Figure
6 shows unconditional forecast paths of in�ation rates with the 99%, 95%, 90% and
80% con�dence intervals under di¤erent values of �. The �gure indicates that while
the forecasting path of in�ation is negatively skewed under a weak commitment to FG
(� = 0:5) due to the adverse e¤ects of ELB, the negative skew almost disappears under a
tight commitment to FG (� = 4). For example, while the 90% con�dence interval includes
negative in�ation rates under � = 0:5, the 95% con�dence interval slightly touches on
negative in�ation rates under � = 4. Those impulse responses and forecasting paths
imply that if FG is announced as a monetary policy rule, it would have quantitatively
relevant e¤ects on in�ation via expectations formation. Therefore, FG is more powerful
if it is implemented as a systematic component of monetary policy, and, in such cases,
FG should be modeled as a policy rule rather than neither an exogenous news shock to
18

nominal interest rates nor an exogenous extension of zero interest rate periods.9 In other
words, if FG is not implemented as a policy rule, the e¤ects of FG via the expectations
formation e¤ects would completely disappear, and consequently FG would have e¤ects
on in�ation and output growth only after it is actually implemented at the ELB.
3.2.2 Target In�ation Rate and Forward Guidance
The e¤ectiveness of FG as a policy rule heavily depends on the possibility of being
constrained by the ELB. As is often argued, with a low target in�ation rate, the central
bank would be easily constrained by the ELB and consequently lose a room for lowering
nominal interest rates in the face of de�ation and/or recessions. In such cases, FG might
be a useful tool to avoid being trapped by the ELB. Actually, the quantitative results in
the previous subsection imply that the adverse e¤ects due to the ELB could be mitigated
by implementing a rule-based FG appropriately. On the other hand, with a high target
in�ation rate and a low probability of being trapped by the ELB, the e¤ectiveness of FG
might not be as evident as an economy with a lower target in�ation rate.
To examine such arguments in this model, Figure 7 computes the policy functions
of in�ation and output growth with respect to the log-deviation of productivity growth
from its steady state, log(at=a�), under di¤erent levels of target in�ation ��. The solid
blue lines represent the policy functions with a 2% in�ation target (�� = 1:005) while
the dashed red lines represent those with a 1% in�ation target (�� = 1:0025). In both
cases, the degree of commitment to FG � is set to 0.5. Those policy functions point
out the advantage for setting a higher in�ation target, as argued above. As productivity
growth rates decline, in�ation and output growth decline much more non-linearly for the
1% target case than for the 2% target case, because there is smaller room for lowering
nominal interest rates in the former case. In particular, note that the steady-state
in�ation rate (i.e., in�ation at at = 0) is around 2% for the 2% target case while it is
9Recently, Guerrieri and Iacoviello (2015) build a non-linear model in which the ZLB constraint binds
endogenously and occasionally, and propose an easier way of solving it. As emphasized by themselves,
however, their approach also cannot take into account the expectations formation e¤ects at non-ZLB
states by construction.
19

clearly less than 1% and close to 0% for the 1% target case. While steady-state in�ation
is usually lower than target in�ation in a model with ELB, the �gures indicate that such
an adverse e¤ect of ELB on steady-state in�ation is not quantitatively negligible and
more severe in the economy with a lower in�ation targets.10
Figure 8 shows the policy functions under a tight commitment to FG (i.e., � = 4)
and di¤erent levels of in�ation target. They show that, with a tight commitment to FG,
the adverse e¤ects due to a lower in�ation target are signi�cantly mitigated: the policy
functions of in�ation in the 1% target case and the 2% target case are almost parallel
with each other and those of output growth are almost on the same line. Also, the
steady-state in�ation for the 1% target case is now at around 1%. Given the fact that
the ELB constraint does not bind at the steady-state, the e¤ect of FG on the steady-
state in�ation is induced by the expectations formation e¤ects. That is, the expectation
that the central bank would commit to FG at the ELB mitigate the adverse e¤ects on
in�ation at the steady state, thus making it easier for the central bank to realize the
target in�ation at the steady state than under a weak commitment.
Figures 7 and 8 imply that a strong commitment to FG (i.e., a high �) and a high
target in�ation rate (i.e., a high ��) are partly substitutable as a policy tool for mitigating
the adverse e¤ects due to ELB. In particular, a strong commitment might be more
preferable than the higher in�ation target if the central bank can have private agents
trust the FG rule, because a high steady-state in�ation may entail non-negligible welfare
losses, as pointed out by Ascari and Sbordone (2014).
3.2.3 Relation to the �Forward Guidance Puzzle�
As some previous studies argue, FG modeled as an exogenous extension of zero interest
rate periods has (unrealistically) large e¤ects on in�ation and output, which is called the
�forward guidance puzzle�(e.g., Del Negro, Giannoni, and Patterson (2012) and McKay,
Nakamura, and Steinsson (2015)). In this model, such an exogenous extension of zero
10Hills, Nakata, and Schmidt (2016) argues that steady-state in�ation can be somewhat lower than
target in�ation in a non-linear model with ELB because steady-state in�ation is determined by taking
into account the risk for reaching the ELB.
20

interest rate periods can be described as negative monetary policy shocks "i;t < 0 at the
ELB. That is, the negative monetary policy shocks at the ELB increase the FG term mt
by about ��Rss as indicated by (10), and lead to the expectation for longer zero interest
rate periods. Therefore, the model in this paper is a good laboratory to examine how
the �forward guidance puzzle�can be interpreted in the model with a rule-based FG.
Figure 9 shows the impulse responses of in�ation and interest rates to a negative
productivity growth shock "a;t < 0 and a negative monetary policy shock "i;t < 0. That
is, the �gure describes the situation that the central bank exogenously extends the period
of zero interest rates at the same time as the economy is hit by a negative productivity
growth shock in t = 2. The thick blue lines represent the case for no monetary policy
shock (i.e., "a;t < 0 and "i;t = 0) for comparison, and indicate that the economy would
be faced with de�ation and as a result constrained by the ELB for �ve periods. The thin
red lines in the same �gure represent the case that the central bank tries to extend the
period of zero interest rates by adding "i;t = �4% in t = 2. The -4% shock of "i;t in t = 2
seems large enough to extend the periods of zero interest rates by one period, because the
interest rate level right after leaving the ELB for the case without any monetary policy
shocks (i.e., the thick blue line in the period 6 in the right �gure) is less than 1%. The
thin red lines indicate, however, that the interest rate in t = 6 would be slightly lower
than that for the case of "i;t = 0 (the blue line), but the periods of zero interest rates
would not be extended at all; there would still be �ve . The reason why the interest rate
path would not signi�cantly change even with the large negative monetary policy shock
in t = 2 is that the negative monetary policy shock works for increasing in�ation, as
shown in the left �gure, and consequently making the lifto¤ from the ELB earlier. That
is, the increases in in�ation due to the negative monetary policy shock in t = 2 would
raise the interest rate indicated by the Taylor rule Rtlrt and reduce the FG term mt as
indicated by (10), thus o¤setting the increase in mt induced by the negative productivity
shock. The dotted green lines represent the case for "a;t < 0 and "i;t = �8%, which imply
that the periods of zero interest rates would be extended by one period only if the central
bank adds such an unrealistically large monetary policy shock in t = 2.
In summary, the quantitative exercise in this subsection provides the following inter-
21

pretation of the forward guidance puzzle. When the central bank announces to exoge-
nously extend the periods of zero interest rates as a form of FG, in�ation rates would
increase in response to the announcement. Such an increase in in�ation, however, makes
the lifto¤ from the ELB earlier because the rule-based FG endogenously responds to the
increased in�ation rates, thus partially o¤setting the central bank�s initial intention for
extending the zero interest rates. Therefore, considering the central bank�s endogenous
response to the increased in�ation, an unrealistically large monetary policy shock needs
to be added for extending the zero interest rate periods even just by one period. Since
such an unrealistically large monetary policy shock has signi�cant positive e¤ects on
in�ation and output, a tiny exogenous extension of the zero interest rate periods and
puzzlingly large policy e¤ects on in�ation and output growth are simultaneously observed
in the model. In other words, the exercise implies that since such an unrealistically large
monetary policy shock needs to be added, it is merely puzzling to observe the large policy
e¤ects on in�ation and output growth.
3.3 Estimation with Full Sample
This subsection estimates the degree of commitment to FG, �, and identi�es the struc-
tural shock sequences by a fully non-linear model using the U.S. data up to 2015/4Q.
Since model parameters except for � have been already estimated by a linearized model
using the U.S. data up to the Great Recession (i.e., up to 2007/4Q) in Section 3.1, the
parameters of the non-linear model are set to the estimated posterior mean in Table 1.
The model is then solved by the Coleman policy function iteration method under various
values of �. Given the non-linear structure of the model due to the ELB and the crisis
shock, the likelihood under each � cannot be calculated by the Kalman �lter; it must
be computed by simulation based methods like the particle �lter. This subsection uses
the particle �lter with 1,000,000 particles and assumes measurement errors for output
growth and in�ation in data.11 When applying the particle �lter to the data with large
11This paper uses an algorithm for the particle �lter as described in An and Schorfheide (2007). See
Herbst and Schorfheide (2015) for other algorithms. Also, note that the number of particles needs to
22

economic �uctuations such as the U.S. data around the Great Recession, the crisis shock
takes an important role for computing the likelihood in practice. That is, since the
normal distribution has very small probability for a tail event, the particle �lter only
with normally distributed shocks cannot cover large economic �uctuations like the Great
Recession even with a huge number of particles. Such a problem is not materialized
when using the Kalman �lter because the Kalman �lter can cover any event, as long as
it occurs with a positive probability. This problem, however, casts doubt on the use of a
linearized model only with normally distributed shocks and the estimation of the model
using the Kalman �lter for describing crisis periods such as the Great Recession.
The degree of commitment to FG, �, is estimated as follows. First, the likelihood
under a particular value of �, which is denoted by p(Y j�) where Y represents the data
sequences, is computed by the particle �lter. Then, the posterior mode based on the
posterior density, p(�jY ), can be found using the joint density, p(�; Y ), which is com-
puted by multiplying the likelihood with the prior density, p(�), because the joint density
is proportional to the posterior density, i.e., p(�jY ) / p(�)p(Y j�). Since � is the only
parameter to be estimated, it is not needed to search the posterior mode by sampling
posterior draws. Instead, the posterior mode is searched by calculating the joint prob-
ability p(�; Y ) for each � according to p(�) � p(Y j�) one by one. Figure 10 shows the
likelihood (dotted green line), prior density (gray line), and posterior density (blue line)
with respect to �. The �gure shows that the likelihood function for � is clearly increasing
up to around � = 4, thus strongly implying that the Federal Reserve has adopted FG
as a policy rule. The �gure also shows, however, that the likelihood function becomes
almost �at for � > 4, thus implying that the degree of commitment to FG � is weakly
identi�ed. This �at likelihood indicates that the only one ELB episode after the Great
Recession in the U.S. is not enough to identify between the expected FG by a large � and
the unexpected FG by the monetary policy shock it. Therefore, to identify a particular
baseline value of �; a slightly downward sloping function Beta[1,2500] is used for the prior
density, which implies that a higher � has slightly small probability than a lower �. The
be much more than usual cases in order to accurately describe the crisis event.
23

�gure indicates that, given this downward sloping prior density, the posterior density is
hump-shaped and maximized around � = 4 (dashed black line) while the likelihood is
almost �at for � > 4. Hereafter, the value of � = 4 is used as the baseline value.
Given the degree of commitment to FG in the baseline case, � = 4, the sequences
of structural shocks as well as the FG term mt can be identi�ed by the particle �lter
based on the model. The set of exogenous variables which drive the economy in this
model consists of (i) the productivity growth, at, (ii) the productivity level, zt; and (iii)
the monetary policy shock, it. Figure 11 shows the identi�ed sequences of exogenous
variables as well as the FG term in the U.S. economy from 1983/1Q to 2015/4Q. The
dotted red lines show 95% con�dence intervals. The sequence of productivity growth (the
left top �gure) indicates that the U.S. productivity growth dropped dramatically in the
Great Recession, but it has recovered and has now returned to around the steady state
level. The productivity level (the right top �gure), on the other hand, dropped somewhat
during the Great Recession but it too has recovered strongly and remained at a higher
level than the steady state. Because the productivity shocks are supposed to represent all
supply shocks in the economy, the current high level of productivity in the �gure implies
that the weak in�ation rates after the Great Recession are not driven by negative demand
shocks but mainly by positive supply shocks, including lower commodity prices.12 The
sequences of monetary policy shock and the FG term (the bottom two �gures) imply
that the Federal Reserve aggressively carries out monetary easing or tightening as a form
of monetary policy shocks and FG.13 In particular, both positive FG term and negative
monetary policy shocks are observed during and after the Great Recession, implying that
the Federal Reserve kept zero interest rates longer than suggested by the Taylor rule both
via expected rule-based FG and via exogenous extensions of zero interest rate periods.
The FG term signi�cantly increased right after the Great Recession, but it has gradually
decreased and reached zero in 2015/4Q re�ecting the fact that the Federal Reserve left
12This result is consistent with an argument by policy makers. See, for example, Yellen (2015).
13In addition to FG, the U.S. central bank adopted the Quantitative Easing (QE) as a monetary
policy measure at the ELB. Since the model in this paper does not take into account the QE at all, the
e¤ects of QE, if any, are mostly identi�ed as a demand shock in the estimation.
24

the ELB then. In the following subsections, counterfactual policy experiments are carried
out through comparative statics under the identi�ed sequences of exogenous variables.
3.4 Policy Experiment
This subsection conducts counterfactual policy experiments to investigate how much a
rule-based FG a¤ects in�ation and output growth, particularly during and after the Great
Recession. In particular, the policy experiments intend to answer the following �missing
de�ation�puzzle: Why did the U.S. economy not experience de�ation, even with the
huge decline in output growth during the Great Recession? While several studies, in-
cluding Del Negro, Giannoni, and Schorfheide (2015), investigate the missing de�ation
problem using a linearized DSGE model, the policy experiments in this subsection try to
add another but possibly compatible interpretation for this problem using a non-linear
model. Also, the policy experiments that examine the in�ation and output dynamics
under various monetary policy choices should be helpful to consider the policy prescrip-
tion for de�ationary pressure observed in developed countries other than the U.S. For
instance, since many European countries continue to su¤er from de�ationary pressure
after the �nancial crisis, the results of the policy experiments may give some suggestive
implications for their future policy decisions.
The counterfactual policy experiments via comparative statics are conducted by ex-
amining what would happen in the U.S. economy if the Federal Reserve adopted di¤erent
monetary policies, given the structural shocks identi�ed in the previous subsection re-
main unchanged. As for the counterfactual policy choices, I examine di¤erent monetary
policy measures at the ELB in the following two aspects: (i) A weaker commitment
to FG (i.e., a lower �), (ii) No exogenous extension of the zero interest rate periods
(i.e., zero monetary policy shocks, it). Since the identi�ed monetary policy shocks it in
Figure 11 indicate that the Federal Reserve extended the zero interest rate periods via
exogenous extensions in addition to via expected rule-based FG, these two counterfac-
tual policy choices intend to describe the situation where the Federal Reserve did not
expectedly and/or unexpectedly extend zero interest rate periods longer than suggested
25

by the estimated Taylor rule.
Figure 12 shows the counterfactual paths of in�ation and output growth under a
weaker commitment to FG (� : 4! 0:5). The �gure indicates that in�ation and output
growth would not been changed for most periods even under the weaker commitment
to FG, a re�ection of the fact that the U.S. economy had not been faced with the ELB
of nominal interest rates up to the late 2000s. During and after the Great Recession,
however, the �gure suggests that the U.S. economy would possibly experience de�ation
and a sharper drop in output growth if the Federal Reserve adopted the weaker com-
mitment to FG. Furthermore, the e¤ect of FG on in�ation is also observed around the
periods after the dot-com bubble in the early 2000s, even though the economy was not
constrained by the ELB at that time. This result therefore implies the possibility that
the commitment to FG has e¤ects on in�ation through not only the accumulation of FG
term mt at ELB but also through the expectations formation e¤ects of a rule-based FG
at non-ELB states.14
Next, Figure 13 shows the counterfactual paths of in�ation and output growth with
zero monetary policy shocks (it = 1 for all t) under a weaker commitment to FG (� :
4 ! 0:5). This counterfactual scenario intends to describe the situation where the
Federal Reserve did not deviate from the Taylor rule both expectedly via the FG rule
and unexpectedly via the monetary policy shock, and as a result did not carry out any
monetary easing via FG. The �gure shows that, in this case, the U.S. economy not
only would su¤er from de�ation during the Great Recession but also would experience
relatively long-lasting low in�ation rates in the early 2000s and after the Great Recession.
Therefore, while the monetary easing that deviated from the Taylor rule during and after
the recession periods is criticized for potentially having caused the economic bubble, the
policy experiment indicates that these negative deviations from the Taylor rule played a
key role to avoiding de�ation.
14A caveat to this result is that the analysis here assumes that the value of � is constant throughout
the sample period, and thus does not take into account the possibility that a commitment to a rule-based
FG in the early 2000s might not be as strong as that in the late 2000s.
26

4 Application to the Japanese Economy
Finally, a quantitative analysis on the Japanese economy is carried out. Compared to
the U.S. economy, there are some notable features in the Japanese economy. First, the
Japanese economy was constrained by the ELB for most of the time since the late 1990s,
and the Bank of Japan introduced FG to deal with the ine¤ectiveness of monetary
policy at the ELB.15 Although it is di¢ cult to estimate the central bank�s monetary
policy behavior at the ELB, the estimation results are expected to give a more clear-
cut conclusion than the U.S. case because the Japanese experience of the ELB should
provide enough information for the estimation. Second, the Japanese economy had faced
prolonged de�ationary pressure. As I mentioned earlier, the e¢ cacy of FG could crucially
depend on the assumption that recession or de�ation lasts only for a few periods, and
thus an application of the model to the Japanese experiences is an interesting policy
analysis to examine such an argument.
For the estimation of parameters, the same two-step approach is adopted as in the
analysis on the U.S. economy. After estimating the parameters and identifying the shock
sequences, the counterfactual policy simulations are conducted, with a special focus on
the following two counterfactual cases: (i) a stronger commitment to FG, and (ii) a
higher in�ation target.
4.1 Estimation Result
As in the analysis on the U.S. economy, the parameters except for the strength of com-
mitment to FG, �, are estimated by a linearized model without ELB and the crisis
shock using the data only from 1983/1Q to 1997/4Q. The measurement equations for
the Bayesian estimation are exactly the same as those for the analysis on the U.S. econ-
omy. As for calibrated parameters, only the steady-state in�ation rate �� is di¤erent
from the U.S. case and set to 1.0025, which means that the Bank of Japan had set the
15In the 1990s, the Bank of Japan committed to a zero interest rate policy to deal with de�ationary
pressure at the ELB, even though it was not called FG at that time. See Ueda (2000) for more detail
about the commitment policy in the 1990s in Japan.
27

target in�ation rate at 1% up to 2013/1Q. The estimation results summarized in Table
1 indicate that the estimated parameters are close to the U.S. case.
Next, the degree of commitment to FG, �; as well as the structural shock sequences
are estimated by a non-linear model with ELB and the crisis shock using the particle
�lter and the data up to 2013/1Q. The parameters of the fully non-linear model are
set to the estimated values by the linearized model in Table 1. Figure 14 shows the
likelihood with respect to �. In contrast to the U.S. case, the value of � is identi�ed by
the likelihood that it has a peak around � = 0:9. Such a di¤erence between the U.S.
case and the Japanese case probably stems from the fact that the Japanese economy has
reached the ELB three times in the sample periods and thus provides enough information
to identify the value of �. The estimated � = 0:9 implies that the Bank of Japan has
adopted FG as a policy rule but its degree of commitment is much weaker than the U.S.
case, re�ecting the fact that, for example, the Bank of Japan raised interest rates in the
early 2000s even in the low in�ation environment.
Given the degree of commitment to FG in the baseline case, � = 0:9, the sequences of
structural shocks as well as the FG term mt can be identi�ed by the particle �lter based
on the model as in the U.S. case. Figure 15 shows the identi�ed sequences of exogenous
variables as well as the FG term in the Japanese economy from 1983/1Q to 2013/1Q.
As in the U.S. economy, it indicates that the productivity growth declined around the
Great Recession but has already returned to the steady state level, and that the high
productivity level causes de�ationary pressure. In contrast to the U.S. case, however, the
FG term is still at a high level, even in 2013/1Q, thus implying that the Bank of Japan
is expected to continue the zero interest rate for a while in the face of low in�ation.
Furthermore, the monetary policy shocks are identi�ed as almost zero during all the
zero interest rate periods. This result is also in contrast to the U.S. economy, where
signi�cant negative monetary policy shocks are identi�ed after the Great Recession, and
implies that the Bank of Japan committed to FG as expected by a rule but did not
exogenously extend the zero interest rate periods more than (or less than) expected in
the all ELB episodes.
When interpreting the quantitative result for a rule-based FG, however, we should
28
be careful about the following caveats. First, the value of � is assumed to be constant
throughout the sample period. This assumption may be a little bit strong, particularly
for the Japanese economy, because the Bank of Japan has introduced several di¤erent
versions of commitment on the future monetary policy in the course of its struggle with
long-lasting de�ation. Furthermore, considering the fact that FG has been treated as
a rule-based policy only recently, the value of � for recent periods might be estimated
with a downward bias. Second, the zero interest rate policy in Japan implemented in the
late 2000s was quite di¤erent from what the U.S. had introduced in 2008. In particular,
while the former intended to deal with the long-lasting de�ationary pressure, the latter
was introduced mainly as a crisis management tool. Third, the estimation presumes that
the value of � is precisely perceived among private agents. In practice, however, even
in the case that the central bank tried to strongly commit to a rule-based FG, private
agents might not perceive such a commitment of the central bank perfectly. If this is the
case, the estimated � would not necessarily correspond to a degree of commitment by
the central bank, but would correspond to pervasiveness of FG as a policy rule. Since
only the Japanese economy experienced the ELB in the early 2000s, the small value of
� for the Japanese economy may re�ect the fact that FG was not as pervasive as it was
in the late 2000s or as it is in the U.S.
4.2 Counterfactual Policy Experiment
This subsection conducts counterfactual policy experiments to investigate how much a
rule-based FG a¤ects in�ation and output growth in the Japanese economy. As for the
counterfactual policy choices, I examine di¤erent monetary policy measures at the ELB
in the following two aspects: (i) A stronger commitment to FG (i.e., a higher �), and
(ii) a higher target in�ation (i.e., a higher ��). Since the Bank of Japan raised the
target in�ation in 2013/1Q, the second counterfactual case is supposed to provide some
suggestions for the e¤ect of the recent policy change.16
16On January 22, 2013, the Bank of Japan was recognized as increasing the target in�ation from 1%
to 2% when it announced that �...the Bank sets the �price stability target�at 2 percent in terms of the
29

Figure 16 shows the counterfactual paths of in�ation and output growth when the
Bank of Japan adopts as strong commitment to FG as in the U.S. case (� : 0:9 ! 4).
The �gure indicates that in�ation and output growth would not been changed even
under the stronger commitment to FG when the Japanese economy was not constrained
by the ELB (i.e., periods up to the late 1990s and 2007-2008). During and after the
Great Recession, however, the �gure suggests that the Japanese economy would avoid
the sharp drop in in�ation and output growth if the Bank of Japan was believed to adopt
a stronger commitment to FG. Interestingly, however, the �gure implies that, even under
a stronger commitment to FG, the Japanese economy would have experienced the long-
lasting de�ation in the late 1990s and the early 2000s, thus implying that the commitment
to FG works for mitigating a sharp drop in in�ation, particularly during a crisis period,
but does not work for supporting in�ation in the face of long-lasting de�ationary pressure.
Next, Figure 17 shows the counterfactual paths of in�ation and output growth with a
higher target in�ation (�� : 1:0025! 1:005) with the baseline value of �. As pointed out
by Figure 7 and 8, with a higher target in�ation rate, the central bank has more room for
lowering nominal interest rates, thus dealing with a decline in in�ation or output growth
by lowering nominal interest rates. Figure 17 indicates that the counterfactual path of
in�ation is higher than the actual data by more than 1%, particularly during the Great
Recession, thus implying that a high target in�ation rate works as a bu¤er for lowering
interest rates and supports in�ation rates.
A caveat to the counterfactual policy experiments for the Japanese economy is that
the trend in�ation is assumed to be anchored at the target in�ation rate �� throughout
the sample periods. This assumption is controversial in the sense that some studies,
including Aruoba, Cuba-Borda, and Schorfheide (2013) and Hirose (2014), consider the
possibility that the trend in�ation in Japan was not anchored at the target in�ation in
the 1990s, and argue that Japanese economy remained around the de�ationary steady
state, which is proposed by Benhabib, Schmitt-Grohe, and Uribe (2002). If the trend
year-on-year rate of change in the consumer price index (CPI) �a main price index. Previously, the
�price stability goal in the medium to long term�was in a positive range of 2 percent or lower in terms
of the year-on-year rate of change in the CPI and the Bank set a goal at 1 percent for the time being.�
30

in�ation was not anchored at the target in�ation rate but remained at the lower level,
the e¤ects of FG via the expectations formation e¤ect would be much smaller because its
e¢ cacy signi�cantly relies on the assumption that in�ation rates will eventually return
to around the target in�ation rate. In that sense, it may still be an open question that
the FG can work for getting the economy out of de�ation even after the economy runs
into chronic de�ation, as observed in Japan.
5 Concluding Remarks
In this paper, I quantitatively investigate the e¤ects of FG by modeling it as a monetary
policy rule rather than an exogenous policy shock in a non-linear new Keynesian model.
By doing so, I investigate the e¤ects of FG via changing expectations formation of private
agents at the ELB as well as before reaching the ELB. A quantitative analysis points out
signi�cant policy e¤ects of a rule-based FG via expectations formation, and provides a
new interpretation of �forward guidance puzzle.�The counterfactual policy experiments
using the U.S. and Japanese data imply that a rule-based FG signi�cantly mitigates a
decline in in�ation and output growth in a crisis period like the Great Recession via
expectations formation. However, FG has, by design, smaller e¤ects on in�ation if the
economy faces a long-lasting de�ationary pressure, as observed in the 1990s in Japan.
There are some directions for future works. First, while this paper just focuses on
the U.S. and Japanese economy, the same method can be applied to other developed
countries, including European countries. Since de�ation is a main concern for central
banks in most developed countries, the methodologies developed in this paper would be
helpful to consider the policy prescriptions for those economies. Second, the e¤ect of FG
in a model with the de�ationary steady state in the sense of Benhabib, Schmitt-Grohe,
and Uribe (2002) is an open question. While the possibility of the de�ationary steady
state is excluded by assumption even in face of long-lasting de�ation, this assumption
should be taken away when analyzing how to escape from the equilibrium dynamics
around the de�ationary steady state, particularly when investigating the Japanese econ-
omy. Third, the investigation on the optimal level of � is another important step. While
31

those topics are important from theoretical and practical perspectives, I leave them for
future research.
References
Adam, K., and R. M. Billi (2006): �Optimal Monetary Policy under Commitment
with a Zero Bound on Nominal Interest Rates,�Journal of Money, Credit and Banking,
38(7), 1877�1905.
An, S., and F. Schorfheide (2007): �Bayesian Analysis of DSGE models,�Econo-
metric Reviews, 26, 113�172.
Aruoba, S. B., P. Cuba-Borda, and F. Schorfheide (2013): �Macroeconomic
Dynamics Near the ZLB: A Tale of Two Countries,�NBER Working Papers 19248.
Ascari, G., and A. Sbordone (2014): �The Macroeconomics of Trend In�ation,�
Journal of Economic Literature, 52(3), 679�739.
Barro, R. (2006): �Rare Disasters and Asset Markets in the Twentieth Century,�
Quarterly Journal of Economics, 99(4), 817�39.
Benhabib, J., S. Schmitt-Grohe, and M. Uribe (2002): �Avoiding Liquidity
Traps,�Journal of Political Economy, 110(3), 535�563.
Brave, S. A., J. R. Campbell, J. D. Fisher, and A. Justiniano (2012): �The
Chicago Fed DSGE Model,�Discussion paper.
Campbell, J. R., C. L. Evans, J. D. Fisher, and A. Justiniano (2012): �Macro-
economic E¤ects of Federal Reserve Forward Guidance,�Brookings Papers on Eco-
nomic Activity, 44(1), 1�80.
Davig, T., and E. M. Leeper (2006): �Endogenous Monetary Policy Regime Change,�
in NBER International Seminar on Macroeconomics 2006, pp. 345�391.
32
Del Negro, M., S. Eusepi, M. Giannoni, A. Sbordone, A. Tambalotti,
M. Cocci, R. Hasegawa, andM. H. Linder (2013): �The FRBNY DSGEModel,�
Discussion paper.
Del Negro, M., M. Giannoni, and C. Patterson (2012): �The Forward Guidance
Puzzle,�Discussion paper.
Del Negro, M., M. P. Giannoni, and F. Schorfheide (2015): �In�ation in the
Great Recession and New Keynesian Models,�American Economic Journal: Macro-
economics, 7(1), 168�96.
Eggertsson, G. B., and M. Woodford (2003): �The Zero Bound on Interest Rates
and Optimal Monetary Policy,�Brookings Papers on Economic Activity, 34(1), 139�
235.
Fernandez-Villaverde, J., G. Gordon, P. Guerron-Quintana, and J. F.
Rubio-Ramirez (2015): �Nonlinear Adventures at the Zero Lower Bound,� Jour-
nal of Economic Dynamics and Control, 57, 182�204.
Gavin, W. T., B. D. Keen, A. Richter, and N. Throckmorton (2013): �The
Stimulative E¤ect of Forward Guidance,�Discussion paper.
Guerrieri, L., and M. Iacoviello (2015): �OccBin: A toolkit for solving dynamic
models with occasionally binding constraints easily,�Journal of Monetary Economics,
70(C), 22�38.
Hara, N., T. Kimura, and K. Okina (2008): �Monetary Policy Framework and
�Insurance Against De�ation�,�Bank of Japan Working Paper Series 08-E-6, Bank of
Japan.
Harrison, R. (2015): �Estimating the e¤ects of forward guidance in rational expecta-
tions models,�European Economic Review, 79(C), 196�213.
Harrison, R., L. Korber, and M. Waldron (2015): �Threshold-based Forward
Guidance: Hedging the Zero Bound,�Discussion paper.
33

Herbst, E. P., and F. Schorfheide (2015): Bayesian Estimation of DSGE Models,
vol. 1 of Economics Books. Princeton University Press.
Hills, T., T. Nakata, and S. Schmidt (2016): �The Risk of Returning to the E¤ec-
tive Lower Bound: An Implication for In�ation Dynamics after Lift-O¤,�Feds notes,
Board of Governors of the Federal Reserve System (U.S.).
Hirose, Y. (2014): �An Estimated DSGE Model with a De�ation Steady State,�
CAMA Working Papers 2014-52, Centre for Applied Macroeconomic Analysis, Craw-
ford School of Public Policy, The Australian National University.
Hirose, Y., and T. Kurozumi (2011): �Changes in the Federal Reserve Communi-
cation Strategy: A Structural Investigation,� Bank of Japan Working Paper Series
11-E-2, Bank of Japan.
Hirose, Y., and T. Sunakawa (2015): �Parameter bias in an estimated DSGE model:
does nonlinearity matter?,� CAMA Working Papers 2015-46, Centre for Applied
Macroeconomic Analysis, Crawford School of Public Policy, The Australian National
University.
McKay, A., E. Nakamura, and J. Steinsson (2015): �The Power of Forward Guid-
ance Revisited,�NBER Working Papers 20882.
Nakamura, E., J. Steinsson, R. Barro, and J. Ursua (2013): �Crises and Recov-
eries in an Empirical Model of Consumption Disasters,�American Economic Journal:
Macroeconomics, 5(3), 35�74.
Nakata, T. (2013): �Uncertainty at the Zero Lower Bound,�Discussion paper.
(2014): �Reputation and Liquidity Trap,�Discussion paper.
Nakov, A. (2008): �Optimal and Simple Monetary Policy Rules with Zero Floor on the
Nominal Interest Rate,�International Journal of Central Banking, 4(2), 73�127.
Reifschneider, D., and J. C. Williams (2000): �Three Lessons for Monetary Policy
in a Low-In�ation Era,�Conference Series; Proceedings, pp. 936�978.
34

Ueda, K. (2000): �The Transmission Mechanism of Monetary Policy Near Zero Interest
Rates: The Japanese Experience 1998-2000,�Speech at a conference sponsored by the
national bureau of economic research, european institute of japanese studies, tokyo
university center for international research on the japanese economy, and the center
for economic policy research, swedish embassy in tokyo.
Yellen, J. L. (2015): �In�ation Dynamics and Monetary Policy,� Speech at the
philip gamble memorial lecture, university of massachusetts amherst, amhearst, massa-
chusetts.
Appendix A
In Appendix A, I describe how to solve a non-linear new Keynesian model in 2 by the
Coleman�s policy function iteration with a discretized state space. The procedure is
basically the same as in Nakata (2013), which solves the New Keynesian model with the
ELB by the same method.
First, the system to be solved is formulated. By plugging (3) and (5) into (6), the
labor supply Lt and the real wage rate wt are deleted from the equations and the following
output-based new Keynesian Phillips curve (NKPC) is obtained,
1� � + � y�+�t
z�+1t
= (�t � ��)�t � � Et (�t+1 � ��)�t+1
�yt+1yt
�1��: (14)
There are �ve state variables in this system: (yt�1;mt�1; at; zt; it). The next step is
making a discretized state space for shocks (at; zt and it), and approximating the AR(1)
processes (11), (12), and (9) as a �rst-order Markov chains by the Tauchen�s method.
Also, the discretized state spaces for yt�1 and mt�1 are made in the space [0:9y�; 1:1y�]
and [0:0; 0:4].
Then, the policy function iteration starts with the guess for the policy function
y0(y�1;m�1; a; z; i) and �0(y�1;m�1; a; z; i), which are de�ned on the discretized state
space for (yt�1;mt�1; at; zt; it). With this guess, the k-th interation (k = 1; :::) proceeds
as follows.
35

1. For k = 1; :::, the function for the interest rate based on the Taylor rule Rtlr and
the observed interest rate R are de�ned as:
Rtlr(~y; ~�; y�1; a; i) = Rss
�~�
��
��� � ~y
y�1
a
a�
��yi
and
R(~y; ~�; y�1;m�1; a; i) = max�Rtlr(~y; ~�; y�1; a; i)�m�1; 1
�:
where the variables with tilde (~y and ~�) represent variables other than the state
variable. Given the function for Rtlr and R, de�ne the law of motion for the forward
guidance term m as:
m(~y; ~�; y�1;m�1; a; i)
=
8<: m�1 + ��1�Rtlr(~y; ~�; y�1;m�1; a; i)
�if Rtlr < 1
m�1 ��Rtlr(~y; ~�; y�1;m�1; a; i)�R(~y; ~�; y�1;m�1; a; i)
�otherwise
2. De�ne and compute functions � and � for (~y; ~�) on the discretized state space as
follows:
�(~y; ~�; y�1;m�1; a; z; i) = 0:99� ENa+1jaENz+1jzE
Ni+1ji
�[yk�1(~y; ~m; a+1; z+1; i+1)]
��
a+1�k�1(~y; ~m; a+1; z+1; i+1)
�+ 0:01� ECa+1jaE
Cz+1jzE
Ci+1ji
�[yk�1(~y; ~m; a+1; z+1; i+1)]
��
a+1�k�1(~y; ~m; a+1; z+1; i+1)
�and
�(~y; ~�; y�1;m�1; a; z; i)
= 0:99� ENa+1jaENz+1jzE
Ni+1ji
24 ��k�1(~y; ~m; a+1; z+1; i+1)� ���
��k�1(~y; ~m; a+1; z+1; i+1)�yk�1(~y; ~m;a+1;z+1;i+1)
~y
�1��35
+ 0:01� ECa+1jaECz+1jzE
Ci+1ji
24 ��k�1(~y; ~m; a+1; z+1; i+1)� ���
��k�1(~y; ~m; a+1; z+1; i+1)�yk�1(~y; ~m;a+1;z+1;i+1)
~y
�1��35
where ~m = m(~y; ~�; y�1;m�1; a; i). Also, ENx+1jx and ECx+1jx represent the one-period
forward expectation operator of the variable x = a; z; i in the non-crisis and crisis
regime, respectively. In the computation, those expectations are computed by the
transition matrix of Markov chain for at; zt and it.
36

3. Given the functions � and �, the two residual functions V1 and V2 based on the
Euler equation (2) and the NKPC (14) are de�ned as follows:
V1(~y; ~�; y�1;m�1; a; z; i) = ~y�� � �R(~y; ~�; y�1;m�1; a; i)�(~y; ~�; y�1;m�1; a; z; i)
and
V2(~y; ~�; y�1;m�1; a; z; i) = (~� � ��) ~��� �(~y; ~�; y�1;m�1; a; z; i)��1� � + �
~y�+�
z�+1
�:
Since there are two unknowns, ~y and ~�, and two residual functions, V1 and V2, the
values of ~y and ~� can be pinned down by solving24 V1
V2
35 =24 00
35using a non-linear equation solver. Let the solution for ~y and ~� be yk(y�1;m�1; a; z; i)
and �k(y�1;m�1; a; z; i), respectively, for the state vector (yt�1;mt�1; at; zt; it). Re-
peat Step 1 - 3 for every state vector (yt�1;mt�1; at; zt; it):
4. If yk � yk�1
+ �k � �k�1 < �", then stop and use yk(y�1;m�1; a; z; i) and
�k(y�1;m�1; a; z; i) as the policy functions in the non-linear new Keynesian model.
Otherwise, k ! k + 1 and go back to Step 1.
5. Once the policy functions y(y�1;m�1; a; z; i) and �(y�1;m�1; a; z; i) are obtained,
the policy function for the interest rate based on the Taylor rule, the observed in-
terest rate and the forward guidance term, Rtlr(y�1;m�1; a; z; i); R(y�1;m�1; a; z; i)
and m(y�1;m�1; a; z; i), are computed by
Rtlr(y�1;m�1; a; z; i) = Rss
��(y�1;m�1; a; z; i)
��
��� �y(y�1;m�1; a; z; i)
y�1
a
a�
��yi;
R(y�1;m�1; a; z; i) = max�Rtlr(y�1;m�1; a; z; i)�m�1; 1
�;
and
m(y�1;m�1; a; z; i) =
8<: m�1 + ��1�Rtlr(y�1;m�1; a; z; i)
�if Rtlr < 1
m�1 ��Rtlr(y�1;m�1; a; z; i)�R(y�1;m�1; a; z; i)
�otherwise
:
37
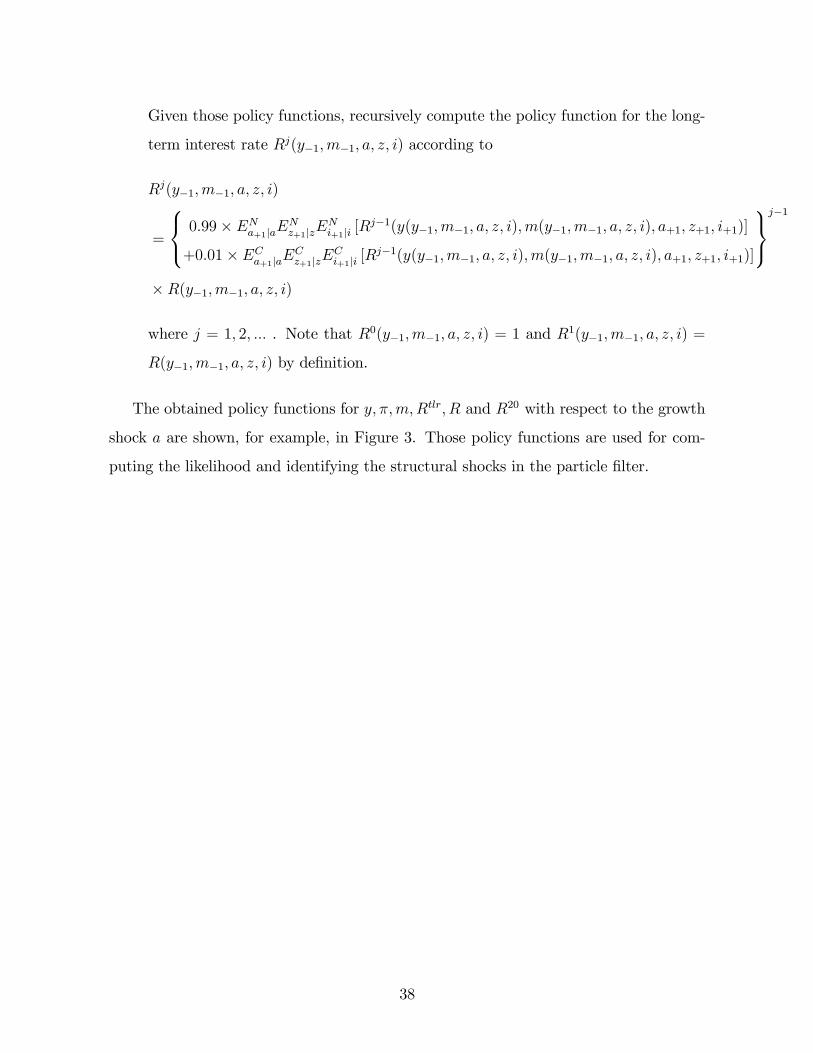
Given those policy functions, recursively compute the policy function for the long-
term interest rate Rj(y�1;m�1; a; z; i) according to
Rj(y�1;m�1; a; z; i)
=
8<: 0:99� ENa+1jaENz+1jzE
Ni+1ji [R
j�1(y(y�1;m�1; a; z; i);m(y�1;m�1; a; z; i); a+1; z+1; i+1)]
+0:01� ECa+1jaECz+1jzE
Ci+1ji [R
j�1(y(y�1;m�1; a; z; i);m(y�1;m�1; a; z; i); a+1; z+1; i+1)]
9=;j�1
�R(y�1;m�1; a; z; i)
where j = 1; 2; ::: . Note that R0(y�1;m�1; a; z; i) = 1 and R1(y�1;m�1; a; z; i) =
R(y�1;m�1; a; z; i) by de�nition.
The obtained policy functions for y; �;m;Rtlr; R and R20 with respect to the growth
shock a are shown, for example, in Figure 3. Those policy functions are used for com-
puting the likelihood and identifying the structural shocks in the particle �lter.
38
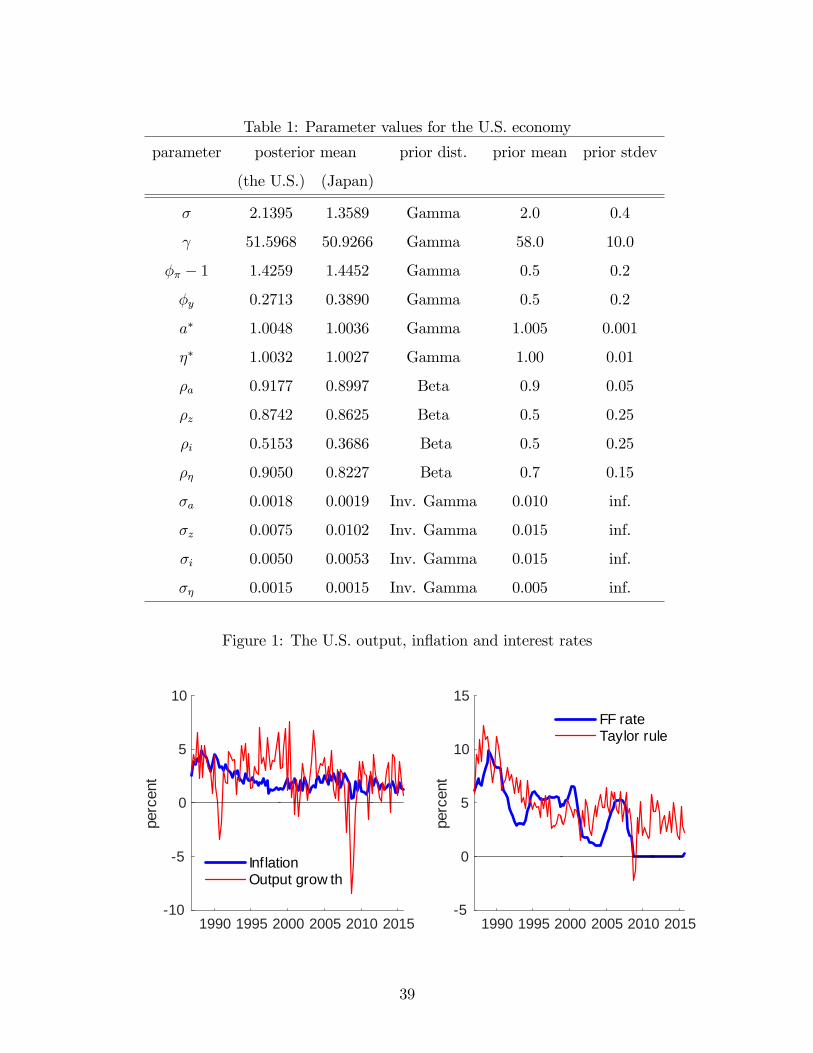
Table 1: Parameter values for the U.S. economy
parameter posterior mean prior dist. prior mean prior stdev
(the U.S.) (Japan)
� 2.1395 1.3589 Gamma 2.0 0.4
51.5968 50.9266 Gamma 58.0 10.0
�� � 1 1.4259 1.4452 Gamma 0.5 0.2
�y 0.2713 0.3890 Gamma 0.5 0.2
a� 1.0048 1.0036 Gamma 1.005 0.001
�� 1.0032 1.0027 Gamma 1.00 0.01
�a 0.9177 0.8997 Beta 0.9 0.05
�z 0.8742 0.8625 Beta 0.5 0.25
�i 0.5153 0.3686 Beta 0.5 0.25
�� 0.9050 0.8227 Beta 0.7 0.15
�a 0.0018 0.0019 Inv. Gamma 0.010 inf.
�z 0.0075 0.0102 Inv. Gamma 0.015 inf.
�i 0.0050 0.0053 Inv. Gamma 0.015 inf.
�� 0.0015 0.0015 Inv. Gamma 0.005 inf.
Figure 1: The U.S. output, in�ation and interest rates
1990 1995 2000 2005 2010 201510
5
0
5
10
perc
ent
Inf lationOutput grow th
1990 1995 2000 2005 2010 20155
0
5
10
15
perc
ent
FF rateTaylor rule
39

Figure 2: Forward guidance: a simple example
1 2 3 4 5 6 7 82
0
2
perc
ent
Taylor rule
1 2 3 4 5 6 7 82
0
2
perc
ent
Interest rate
1 2 3 4 5 6 7 8Time
0
5Forward guidance term
= 1.5 = 0.0
Figure 3: Policy functions by FG term, mt�1
6 4 2 0 2 410
5
0
5
perc
ent
Inflation
mt1 =0mt1 >0
6 4 2 0 2 420
10
0
10GDP growth
6 4 2 0 2 4log(a
t/a *)
10
0
10
perc
ent
Shortterm rate
6 4 2 0 2 4log(a
t/a *)
10
0
10
Taylor rule
40

Figure 4: Policy functions by FG rule, �
6 4 2 010
5
0
5
perc
ent
Inflation
= 0.5 = 4
6 4 2 020
10
0
10GDP growth
6 4 2 0log(a
t/a *)
0
2
4
perc
ent
Shortterm rate
6 4 2 0log(a
t/a *)
0
2
4
Longterm rate (5year)
Figure 5: Impulse responses to a growth shock
2 4 6 8 102
0
2
perc
ent
growth shock
2 4 6 8 104
2
0
2output growth
= 0.5 = 4
2 4 6 8 10quarter
2
0
2
perc
ent
inflation
2 4 6 8 10quarter
0
2
4
6interest rate
41

Figure 6: Forecasting Path of In�ation Rates
2 4 6 8 10quarter
5
0
5
perc
ent
= 0.5
2 4 6 8 10quarter
5
0
5
perc
ent
= 4
99% interval95% interval90% interval80% interval
Figure 7: Policy function by target in�ation, �� (a weak commitment to FG case, � = 0:5)
2 0 2log(a
t/a *)
10
5
0
5
perc
ent
Inflation
2% target1% target
2 0 2log(a
t/a *)
10
5
0
5
10GDP growth
Figure 8: Policy function by target in�ation, �� (a strong commitment case, � = 4)
2 0 2log(a
t/a *)
8642024
perc
ent
Inflation
2% target1% target
2 0 2log(a
t/a *)
10
5
0
5
10GDP growth
42

Figure 9: Responses to a growth shock with a negative monetary policy shock
2 4 6 8 10quarter
0.5
0
0.5
1
1.5
2
perc
ent
inflation
2 4 6 8 10quarter
0
1
2
3
4
5interest rate
ti = 0
ti
ti
Figure 10: Likelihood and posterior distribution for � (the U.S.)
0 5 10 15
0.055
0.0552
0.0554
0.0556
0.0558
prior dist.posterior dist.likelihood
43
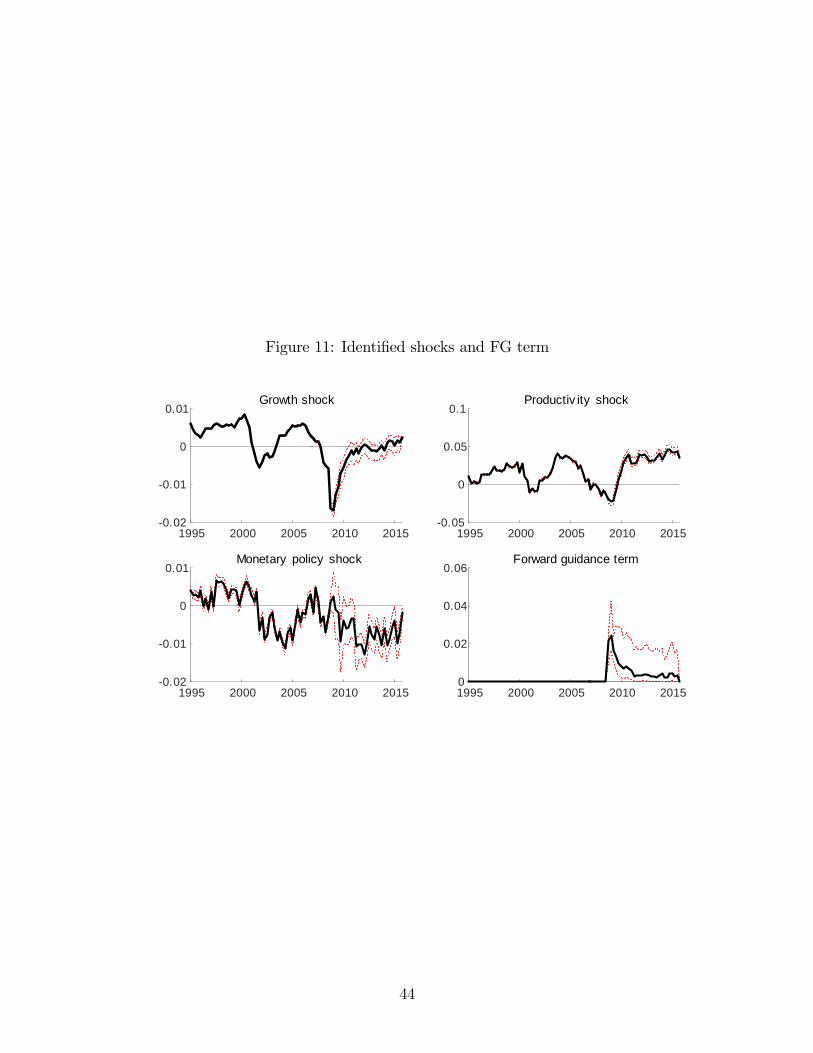
Figure 11: Identi�ed shocks and FG term
1995 2000 2005 2010 20150.02
0.01
0
0.01Growth shock
1995 2000 2005 2010 20150.05
0
0.05
0.1Productiv ity shock
1995 2000 2005 2010 20150.02
0.01
0
0.01Monetary policy shock
1995 2000 2005 2010 20150
0.02
0.04
0.06Forward guidance term
44

Figure 12: Counterfactual simulation (� : 4! 0:5)
1995 2000 2005 2010 20154
2
0
2
4
perc
ent
Inflation
1995 2000 2005 2010 201515
10
5
0
5
10
perc
ent
Output growth
1995 2000 2005 2010 20155
0
5
10
perc
ent
Interest rate
Data (A)Counterf actual simulation (B)(B)(A)
45
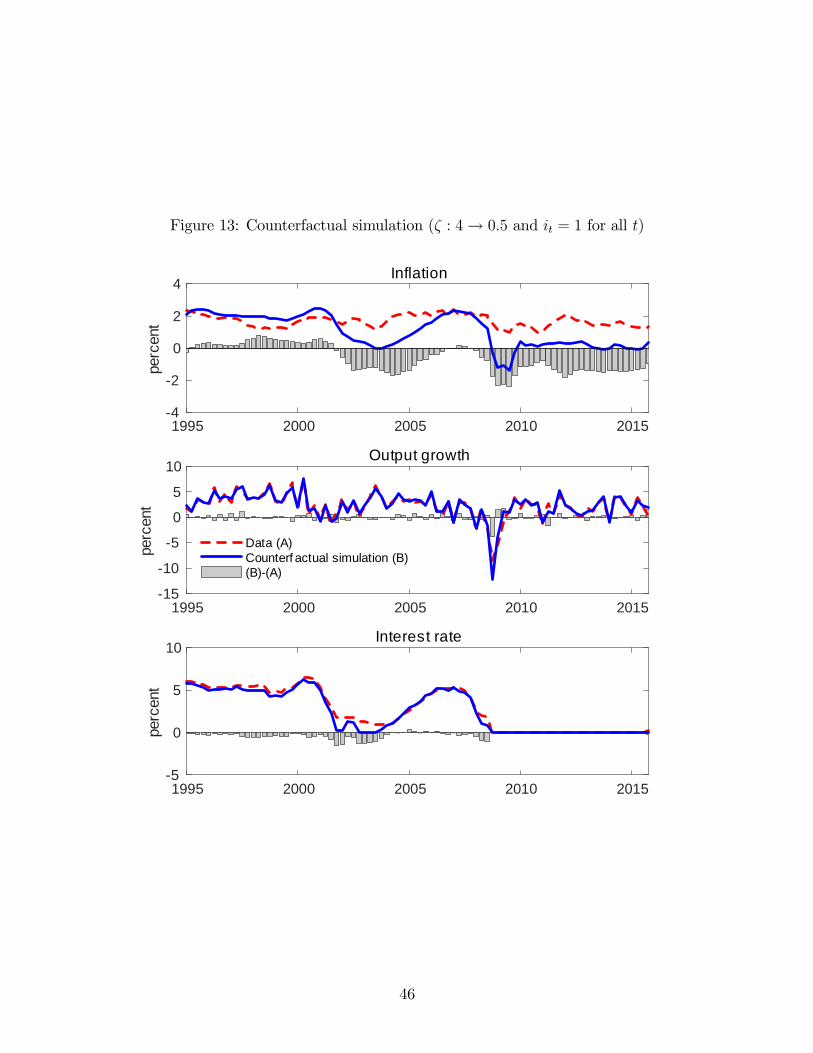
Figure 13: Counterfactual simulation (� : 4! 0:5 and it = 1 for all t)
1995 2000 2005 2010 20154
2
0
2
4
perc
ent
Inflation
1995 2000 2005 2010 201515
10
5
0
5
10
perc
ent
Output growth
1995 2000 2005 2010 20155
0
5
10
perc
ent
Interest rate
Data (A)Counterf actual simulation (B)(B)(A)
46

Figure 14: Likelihood for � (Japan)
0.6 0.8 1 1.2 1.4 1.60.0768
0.077
0.0772
0.0774
0.0776
0.0778
0.078
0.0782
Figure 15: Identi�ed shocks and FG term (Japan)
1995 2000 2005 20100.03
0.02
0.01
0
0.01Growth shock
1995 2000 2005 20100.05
0
0.05
0.1Productiv ity shock
1995 2000 2005 20100.02
0.01
0
0.01
0.02Monetary policy shock
1995 2000 2005 20100
0.05
0.1Forward guidance term
47

Figure 16: Counterfactual simulation (� : 0:9! 4)
1996 1998 2000 2002 2004 2006 2008 2010 20124
2
0
2
4
perc
ent
Inflation
1996 1998 2000 2002 2004 2006 2008 2010 201220
10
0
10
20
perc
ent
Output growth
1996 1998 2000 2002 2004 2006 2008 2010 20126
4
2
0
24
perc
ent
Interest rate
Data (A)Counterf actual simulation (B)(B)(A)
48

Figure 17: Counterfactual simulation (�� : 1:0025! 1:005)
1996 1998 2000 2002 2004 2006 2008 2010 20124
2
0
2
4
perc
ent
Inflation
1996 1998 2000 2002 2004 2006 2008 2010 201220
10
0
10
20
perc
ent
Output growth
1996 1998 2000 2002 2004 2006 2008 2010 20126
4
2
0
2
4
perc
ent
Interest rate
Data (A)Counterf actual simulation (B)(B)(A)
49