forward osmosis using organic cationic draw solutions for
TRANSCRIPT

Forward Osmosis Using Organic Cationic Draw Solutions for Water Recovery
by
MOHAMMED J A HAMAD
A dissertation submitted in partial fulfilment of requirements for the degree of
MASTER OF ENGINEERING (WATER UTILISATION ENGINEERING)
in the
FACULTY OF ENGINEERING, BUILT ENVIRONMENT AND INFORMATION TECHNOLOGY
UNIVERSITY OF PRETORIA
2017

i
ABSTRACT
Title: Forward Osmosis Using Organic Cationic Draw Solutions for Water
Recovery
Author: Mohammed J A Hamad
Supervisor: Professor Evans M N Chirwa
Co-supervisor: Joseph Mwakio
Department: Chemical Engineering
University: University of Pretoria
Degree: Master of Engineering (Water Utilisation Engineering)
Forward Osmosis (FO) is an emerging technology which has potential to operate with
minimum energy input. High performance of FO systems depend on the availability of a
suitable Draw Solution. Different types of Draw Solutions have been proposed, however;
choosing a suitable one is still a developing area within the FO field. There is an urgent need
to explore new materials in order to develop an efficient FO system. The current study aims at
investigating the performance of three Draw Solutions namely, L-Alanine, DADMAC and
PolyDADMAC as osmotic agents for FO. These organic cationic solutions can be used as
extraction agents of water from poorer quality organic solutes such as fumaric acid solution
produced in a continuous flow microbial fermentation process. The performance of the three
Draw Solutions was evaluated by measuring the water flux and reverse solute diffusion at
different concentrations. The viability of reconcentration of the diluted Draw Solutions was
also investigated using Nanofiltration system. The performance and the efficiency of the Draw
Solutions were studied via two separated bench scale systems of FO and Nanofiltration. Both
Cellulose Triacetate (CTA) and Thin Film Composite (TFC) aquaporin protein FO membranes
were employed under different orientations in FO set up operated for 24 hours or longer. In
this study, NF90 membrane was used for reconcentration the Draw Solutions. A series of
experiments were conducted to obtain the best water flux and reverse solute diffusion under
various influencing operating conditions.
The experiments were designed to achieve three objectives, i.e. (i) optimum operating
conditions for FO system, (ii) optimum operating conditions for the reconcentration system,

ii
and (iii) implementation of the optimum operating conditions of the FO system for water
recovery from a fumaric acid solution produced by a simulated industrial fermentation process.
In the initial stage, L-Alanine Draw Solution demonstrated that it was the most viable agent for
FO. It was established that L-Alanine Solution at 0.085 g/mL concentration achieved the
highest initial water flux and the lowest reverse solute diffusion through both CTA and TFC
aquaporin protein FO membranes. In the second stage, a Nanofiltration system was proven to
be effective in the reconcentration of the diluted L-Alanine Draw Solution. The average
rejection of L-Alanine ions achieved by NF90 membrane was 96.00%. Drawing on the
previous results, the third stage was used to investigate the viability of the FO system in water
recovery from fumaric acid solution produced by continuous microbial fermentation process
using L-Alanine as a Draw Solution. The reduction of water content of the fumaric acid solution
made it to concentrate by 26.00% and 19.80% in 32℃ and 17℃, respectively. Consequently,
FO technology is an effective way to concentrate a fumaric acid solution produced by
continuous microbial fermentation process. Based on the results, it is recommended that L-
Alanine should be proposed in the FO process according to its reliability and effectiveness as
a viable draw agent. TFC aquaporin protein membrane is also recommended to be used in
recover the water from fumaric acid solution produced by fermentation processes. Further
studies should be done to investigate the viability of FO in water recovery from advanced
application such as downstream bioprocessing.
Keywords: Forward osmosis, water recovery, draw solution, organic cationic, PolyDADMAC,
DADMAC, L-Alanine, aquaporin, Fumaric acid, downstream processing, fermentation.

iii
DECLARATION
I Mohammed J A Hamad, hereby declare that this dissertation which I submit to University
of Pretoria for examination in consideration of the award of a Master of Engineering (Water
Utilisation Engineering) is my own original work. This work has not been submitted by me for
any degree at this or other institutions.
Signature of candidate ……………………………. Date …………………………….

iv
DEDICATION
I dedicate this dissertation to my parents, sisters and brothers for their love, motivation and support. May Allah bless all of you.
I also dedicate this dissertation to my late brother soul, Khaled. I miss you so much. Rest in peace till we meet again in heaven insha’a
Allah. I love you forever.

v
ACKNOWLEDGEMENTS
First and foremost, my thanks to Allah, The Generous, for granting me strength, patience and
ability to achieve this dissertation.
I am sincerely grateful to my supervisor Professor Evans M. N. Chirwa for his guidance,
wisdom, and invaluable advices which motivated and inspired me. My appreciation also goes
to Mister Joseph Mwakio for his kind assistance during the dissertation. Deepest appreciation
goes to Doctor Deon Brink and Andre Naude for their priceless assistance during the
experimental work.
My father and mother are greatly thanked for their unlimited constant support and continued
prayers.
My deep appreciation is also to Mrs. Elmarie Otto and Mrs. Alette Duvega for their assist,
hospitality and support.
Thanks are also extended to my friends here in South Africa and Home, who created a positive
environment around me and motivated me to achieve this dissertation. My friends, including
but not limited to, Khaled Qasaymeh, Ashraf Sheri, Hani El-Messiri, Ahmed Ebaid, Dina Fagir,
Doaa Althalathini, Mahboubeh Fathi Kenari thank you all for putting colours in my life.
Last but not least, a great appreciation to National Research Foundation NRF for the award of
the bursary during the second year of my studies.

vi
TABLE OF CONTENTS
ABSTRACT ................................................................................................................................................. i
DECLARATION ...................................................................................................................................... iii
DEDICATION ........................................................................................................................................... iv
ACKNOWLEDGEMENTS .................................................................................................................... v
TABLE OF CONTENTS ........................................................................................................................ vi
LIST OF FIGURES ................................................................................................................................... x
LIST OF TABLES ................................................................................................................................. xiii
LIST OF ABBREVIATIONS AND ACRONYMS ....................................................................... xiv
CHAPTER 1 Introduction ....................................................................................................................... 1
1.1 Research Rationale and Motivation ................................................................................. 1
1.2 Problem Statement ........................................................................................................... 2
1.3 Project Aim and Objectives .............................................................................................. 3
1.4 Scope ................................................................................................................................ 3
1.5 Main Findings .................................................................................................................. 4
1.6 Research Outline .............................................................................................................. 5
CHAPTER 2 Literature Review ............................................................................................................. 6
2.1 Background ...................................................................................................................... 6
2.2 Forward Osmosis Theory ................................................................................................. 9
2.3 FO Membranes- Structure/Morphology ......................................................................... 12
2.3.1 Isotropic Membranes ............................................................................................... 12
2.3.1.1 Microporous Membrane.................................................................................... 12
2.3.1.2 Nonporous Membranes ..................................................................................... 13
2.3.2 Anisotropic Membranes .......................................................................................... 13
2.4 FO Membranes - Materials, Preparation ........................................................................ 14

vii
2.4.1 Phase Inversion Membranes .................................................................................... 14
2.4.2 Thin Film Composite Membranes ........................................................................... 17
2.4.3 Chemically Modified Membranes ........................................................................... 24
2.5 Draw Solution ................................................................................................................ 25
2.5.1 Non-Responsive Draw Solutes ................................................................................ 26
2.5.1.1 Inorganic Solutes .............................................................................................. 26
2.5.1.2 Polymers ........................................................................................................... 28
2.5.1.3 Organic Solutes and Organic-Based Compounds ............................................. 30
2.5.2 Responsive Draw Solutes ........................................................................................ 32
2.5.2.1 Nanoparticles .................................................................................................... 32
2.5.2.2 Hydrogels .......................................................................................................... 33
2.5.2.3 Volatile Compounds or Soluble-Gases ............................................................. 34
2.6 Limitations of Forward Osmosis .................................................................................... 35
2.6.1 Concentration Polarisation ...................................................................................... 36
2.6.1.1 External Polarisation Concentration ................................................................. 37
2.6.1.2 Internal Concentration Polarisation .................................................................. 37
2.6.2 Reverse Draw Solute Diffusion ............................................................................... 39
2.6.3 Membrane Fouling .................................................................................................. 40
2.7 Summary ........................................................................................................................ 42
CHAPTER 3 Materials and Methods .................................................................................................. 43
3.1 Experimental Plan .......................................................................................................... 43
3.2 Experimental Setup ........................................................................................................ 44
3.2.1 Forward Osmosis System ........................................................................................ 44
3.2.2 Nanofiltration System .............................................................................................. 46
3.3 Experimental Protocols .................................................................................................. 47
3.3.1 Experimental Protocols for FO Experiments Represented by the Following Steps 47

viii
3.3.2 Experimental Protocols for Reconcentration Experiments Using Nanofiltration
System Represented by the Following Steps .................................................................... 48
3.4 Characterisation of Membranes ..................................................................................... 49
3.4.1 FO Membranes ........................................................................................................ 49
3.4.2 Nanofiltration Membrane ........................................................................................ 50
3.5 Characterisation of Draw and Feed Solutions ................................................................ 50
3.5.1 Draw Solution .......................................................................................................... 50
3.5.2 Feed Solution ........................................................................................................... 51
3.6 Measurements and Analytical Methods ......................................................................... 52
3.6.1 Preparation the Draw Solution ................................................................................ 52
3.6.2 Determination of Osmotic Pressure ......................................................................... 53
3.6.3 Determination of Draw Solution Viscosity ............................................................. 54
3.6.4 Determination of Water Flux ................................................................................... 55
3.6.5 Determination of Ion Rejection by Nanofiltration Membrane ................................ 55
3.6.6 Determination of Reverse Solute Diffusion ............................................................ 56
3.6.7 HPLC Analysis ........................................................................................................ 57
CHAPTER 4 Forward Osmosis Performance Evaluation ............................................................. 58
4.1 The FO System ............................................................................................................... 58
4.1.1 Preliminary Study on Draw Solutions Characteristics ............................................ 58
4.1.2 Water Flux and Reverse Solute Diffusion Studies .................................................. 60
4.1.2.1 Variation of Water Flux and Reverse Solute Diffusion over Operation Time . 60
4.1.2.2 The Effect of the Draw Solutions Osmotic Pressure on Water Flux ................ 68
4.1.2.3 The Effect of Membrane Orientation on Water Flux and Reverse Solute
Diffusion ....................................................................................................................... 72
4.1.2.4 The Effect of Changing the Pumping Scheme of the Draw Solution and Feed
Solution on Water Flux and Reverse Solute Diffusion ................................................. 76
4.2 The Reconcentration System .......................................................................................... 79

ix
4.3 The Potential Application ............................................................................................... 85
4.3.1 Findings and Discussions of Using Synthesis Fumaric Acid Solution as Feed
Solution ............................................................................................................................. 85
4.3.2 Findings and Discussions of Using Fumaric Acid Produced by Fermentation Process
as Feed Solution................................................................................................................ 87
CHAPTER 5 Conclusions and Recommendations ........................................................................... 92
5.1 The FO System ............................................................................................................... 92
5.2 The Reconcentration System .......................................................................................... 94
5.3 The Potential Application ............................................................................................... 95
5.4 Recommendations .......................................................................................................... 96
References ................................................................................................................................................... 98
Appendix .................................................................................................................................................. 102

x
LIST OF FIGURES
Figure 2.1: Water flux through semi preamble membrane under various condition: (a) osmotic
equilibrium, (b) osmotically driven process, (c) and (d) pressure driven process Schematic
diagrams of the principal types of membranes ------------------------------------------------------ 11
Figure 2.2: Mechanism of water flux through the membrane in Forward Osmosis ----------- 11
Figure 2.3: Schematic diagrams of the principal types of membranes ------------------------- 12
Figure 2.4: Cross sectional SEM images of (a) cellulose acetate FO membrane, (b) cellulose
acetate RO membrane where 1 is active layer, 2 is support layer. -------------------------------- 16
Figure 2.5: Step of thin film composite membrane formation via Interfacial polymerization
------------------------------------------------------------------------------------------------------------- 18
Figure 2.6: Chemical structure of (a) Polyethersulfone, (b) Polysulfone ----------------------- 18
Figure 2.7: Modified Interfacial Polymerization process, where membrane layers are linked
via covalent bond --------------------------------------------------------------------------------------- 18
Figure 2.8: Preparation of TFC aquaporin protein membrane by Interfacial Polymerization 23
Figure 2.9: Layer-by-layer assembly method of PAH and PSS ---------------------------------- 25
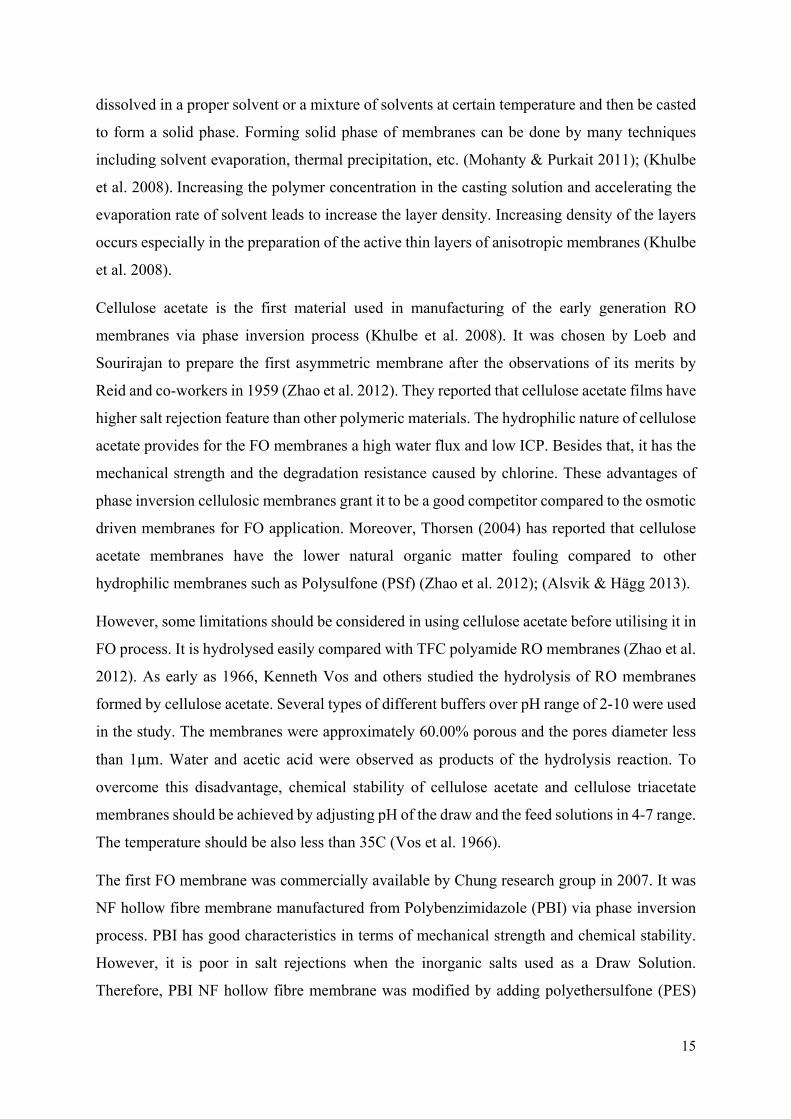
Figure 2.10: Schematic demonstrates the utilisation of magnetic nanoparticles as draw solutes
in FO desalination --------------------------------------------------------------------------------------- 33
Figure 2.11: Schematic demonstrates the utilisation of ammonium salts as draw solutes in FO
desalination ---------------------------------------------------------------------------------------------- 35
Figure 2.12: Concentration polarisation types in both pressure driven and osmotically driven
membrane processes ------------------------------------------------------------------------------------ 36
Figure 2.13: Driving force and internal concentration polarisation of FO mode ( left) and PRO
Mode (right) --------------------------------------------------------------------------------------------- 38
Figure 2.14: Fouling membrane mechanisms in osmotically driven and pressure driven
processes ------------------------------------------------------------------------------------------------- 41
Figure 3.1: Channels of FO cell in details ---------------------------------------------------------- 45
Figure 3.2: FO cell ------------------------------------------------------------------------------------- 45
Figure 3.3: Schematic diagram of the bench-scale FO system ----------------------------------- 45
Figure 3.4: The bench-scale FO system ------------------------------------------------------------- 46
Figure 3.5: Schematic diagram of reconcentration system --------------------------------------- 46
Figure 3.6: Stirred stainless steel dead-end cell ---------------------------------------------------- 47
Figure 3.7: Osmomat 030, cryoscopic osmometer ------------------------------------------------- 53
Figure 3.8: Pipette and tubes -------------------------------------------------------------------------- 53

xi
Figure 3.9: Anton Paar MCR301 rheometer -------------------------------------------------------- 54
Figure 4.1: Osmotic pressure of L-Alanine, DADMAC, and PolyDADMAC solutions ----- 59
Figure 4.2: Dynamic viscosity of L-Alanine, DADMAC, and PolyDADMAC solutions ---- 60
Figure 4.3: Variation of water flux by L-Alanine, DADMAC and PolyDADMAC using CTA
flat sheet membrane over the operation time -------------------------------------------------------- 62
Figure 4.4: Variation of water flux by L-Alanine, DADMAC and PolyDADMAC using TFC
aquaporin protein flat sheet membrane over the operation time ---------------------------------- 63
Figure 4.5: Reverse solute diffusion of L-Alanine, DADMAC and PolyDADMAC using CTA
flat sheet membrane over the operation time -------------------------------------------------------- 66
Figure 4.6: Reverse solute diffusion of L-Alanine, DADMAC and PolyDADMAC using TFC
aquaporin protein flat sheet membrane over the operation time ---------------------------------- 67
Figure 4.7: Water flux by L-Alanine, DADMAC and PolyDADMAC using CTA flat sheet
membrane under osmotic pressure variable. -------------------------------------------------------- 70
Figure 4.8: Water flux by L-Alanine, DADMAC and PolyDADMAC using TFC aquaporin
protein flat sheet membrane under the osmotic pressure variable -------------------------------- 71
Figure 4.9: Comparison between water flux and reverse solute diffusion of L-Alanine at 0.120
g/mL and DADMAC at 0.120 g/mL using CTA flat sheet membrane under FO mode and PRO
mode ------------------------------------------------------------------------------------------------------ 74
Figure 4.10: Comparison between water flux and reverse solute diffusions of L-Alanine at
0.120 g/mL and DADMAC at 0.120 g/mL using TFC aquaporin protein flat sheet membrane
under FO mode and PRO mode ----------------------------------------------------------------------- 75
Figure 4.11: Comparison between water flux and reverse solute diffusion of L-Alanine at
0.085 g/mL and DADMAC at 0.085 g/mL using CTA flat sheet membrane under two ways of
pumping scheme ---------------------------------------------------------------------------------------- 77
Figure 4.12: Comparison between water flux and reverse solute diffusion of L-Alanine at
0.085 g/mL and DADMAC at 0.085 g/mL using TFC aquaporin protein membrane flat sheet
membrane under two ways of pumping scheme ---------------------------------------------------- 78
Figure 4.13: Change in the external applied pressure and the osmotic pressure of L-Alanine,
DADMAC, and PolyDADMAC during reconcentration experiments --------------------------- 82
Figure 4.14: Cumulative water flux across Nanofiltration flat sheet membrane and
concentration L-Alanine, DADMAC, and PolyDADMAC during reconcentration experiments
------------------------------------------------------------------------------------------------------------- 84
Figure 4.15: Changing of fumaric acid concentration in both the Feed Solution and the Draw
Solution tanks using CTA flat sheet membrane ----------------------------------------------------- 86

xii
Figure 4.16: Changing of fumaric acid concentration in both the Feed Solution and the Draw
Solution tanks using TFC aquaporin protein flat sheet membrane ------------------------------- 87
Figure 4.17: Changing of fumaric acid and glucose concentrations in both Feed Solution and
Draw Solution tanks at 32 using TFC aquaporin protein flat sheet membrane -------------- 88
Figure 4.18: Changing of fumaric acid and glucose concentrations in both Feed Solution and
Draw Solution tanks at 17 using TFC aquaporin protein flat sheet membrane -------------- 89
Figure 4.19: Comparison between the water flux and the reverse solute diffusion of L-Alanine
at 0.085 g/mL using TFC aquaporin protein flat sheet membrane and two types of Feed
Solution with different temperatures ----------------------------------------------------------------- 90
Figure 4.20: Osmotic pressure gradient between the Draw Solution and the Feed Solution
during FO process at different temperatures a) 32 , b) 17 ------------------------------------- 91

xiii
LIST OF TABLES
Table 2.1: Classification of the membrane processes by driving force --------------------------- 8
Table 2.2: Amine-acid chloride combinations used in FO membrane preparation via Interfacial
Polymerisation ------------------------------------------------------------------------------------------- 20
Table 2.3: Draw inorganic solutions - properties, water flux and reverse solute diffusion --- 27
Table 2.4: PAA-NA solutions - properties, water fluxes and reverse solute diffusions ------- 29
Table 2.5: Draw organic solutions - properties, water flux and reverse solute diffusion ----- 30
Table 2.6: Non-electrolytes organic draw solutions - properties, water flux and application 31
Table 3.1: Initial and increasing rate of applied pressure per two hours ------------------------ 47
Table 3.2: Characteristics of NF90 Nanofiltration membrane ------------------------------------ 50
Table 3.3: Characteristics of the three Draw Solutions used in the research ------------------- 51
Table 3.4: Required volumes to prepare 2000 mL of the Draw Solutions with various
concentrations ------------------------------------------------------------------------------------------- 53
Table 4.1: Results of reconcentration L-Alanine solution under varying concentration of
permeate and concentrate, and rejection percentage ----------------------------------------------- 80
Table 4.2: Results of reconcentration DADMAC solution under varying concentration of
permeate and concentrate, and rejection percentage ----------------------------------------------- 80
Table 4.3: Results of reconcentration PolyDADMAC solution under varying concentration of
permeate and concentrate, and rejection percentage ----------------------------------------------- 81

xiv
LIST OF ABBREVIATIONS AND ACRONYMS
BDSA 2,2’-Benzidinedisulfonic acid
CECP Cake enhanced concentration polarisation
CP Concentration polarisation
CTA Cellulose triacetate
DADMAC Diallyldimethylammonium chloride
ECP External concentration polarisation
DI Deionized
FO Forward osmosis
GHM Grams per square meter per hour
HPLC High performance liquid chromatography
HTI Hydration technology innovation
ICP Internal concentration polarisation
LHM Litres per square meter per hour
MF Microfiltration
MPD m-Phenylene diamine
MW Molecular weight
MWCO Molecular weight cut-off
NF Nanofiltration
OMBR Osmotic membrane bioreactor
OP Osmotic pressure
PAA-NA Polyelectrolyte polyacrylic acid sodium salts
PAI Polyamide-imide
PAH Poly(allylamine hydrochloride)
PAN Polyacrylonitrile
PBI Polybenzimidazole
PES Polyethersulfone
PolyDADMAC Poly(diallyldimethylammonium chloride)
PPD p-Phenylene diamine
PRO Pressure related osmosis
PSf Polysulfone
PSS Poly(sodium 4-styrene sulfonate)
PVP Polyvinylpyrrolidone

xv
RO Reverse osmosis
RSD Reverse solute diffusion
TDS Total dissolved solids
TFC Thin film composite
TMA-CO Thermolytic trimethylamine carbon dioxide
TMC Trimesoyle chloride

1
CHAPTER 1
Introduction
1.1 Research Rationale and Motivation
Separation and extraction processes of purified water from industrial products and polluted
streams have been a subject of wide range in science and research. The debate among
researchers continues posing the question as to whether the proposed processes are optimal in
solving the water treatment and recovery from otherwise highly polluted water. Water recovery
processes use to minimise the water content, consequently concentrate the final product. The
water recovered from aqueous solutions can be used directly or after post treatment.
Furthermore, water extraction processes are widely employed for conventional applications
such as seawater desalination, industrial water treatment, wastewater streams, dewatering the
sludge, etc. Water extraction processes are also used in other variable solutions such as food
streams, protein concentration, peptides and bioprocessing (Nguyen et al. 2013; Mentzel et al.
2016).
The available technologies in water extraction include mechanical and pressure driven
membrane processes. The mechanical processes involve centrifugation and filter press and the
pressure driven processes include Microfiltration (MF), Ultrafiltration (UF), Nanofiltration
(NF), and Reverse Osmosis (RO). These extraction technologies have been used in various
applications for water extraction purpose for decades (Baker 2012; Nguyen et al. 2013).
However, these technologies are limited due to high energy requirement during the operation
and irreversible membrane fouling (Nguyen et al. 2013; Nicoll 2013). In order to overcome the
current limitations, a new proposal has been made which offers low energy consumption and
longer operation time for the membrane system. Forward Osmosis (FO) is the new osmotically
driven membrane system which allows movement of water molecules up-gradient to an
extractable Draw Solution using a non-degradable, natural, or artificial draw solutes. FO is a
natural process which occurs due to the variance of osmotic pressure between the two solutions
separated by semi-permeable membrane. The process can be utilised in water recovery and
concentration stream applications (Zhao et al. 2012; Nicoll 2013; Alsvik & Hägg 2013).

2
The advantage of FO lies in the low operation cost where a minimal energy consumption is
required compared to pressure driven membrane processes. The intensive energy consumption
of operation in pressure driven membrane processes comes from the high quantity of hydraulic
pressure which is needed to overcome the osmotic pressure of solution to create the flux.
However, during the FO process the osmotic pressure of the solution itself works as a driving
force to create the flux across the membrane (Yong 2012). In contrast, the absence of applied
hydraulic pressure during FO system minimizes the foulants accumulation which results in
easy removed reversible fouling. (Cai & Hu 2016).
Although FO system is a promising technology, concentration polarisation (CP), reverse solute
diffusion, and membrane fouling still pose challenges relating to the efficiency of FO.
Mitigating these challenges can be achieved through the improvement of FO membrane and
the development of more effective Draw Solution. (Yong 2012). Besides that, reconcentration
the diluted Draw Solutions by energy efficient and commercial ways forms another challenge
to the FO system. Proper processes such as low pressure driven processes are utilised in the
Draw Solutions reconcentration stage, which is where the energy loses occur in the FO system,
to minimize the energy consumption. This dissertation investigates the appropriate Draw
Solutions, which may partially address the challenges facing FO.
1.2 Problem Statement
The fundamental requirement for effective FO lies in selecting a suitable Draw Solution. The
competent Draw Solution is a key factor of high performance and viability of FO technology,
consequently mitigating environmental externalities. In terms of the environment, Draw
Solution is required to be environmental friendly, non-toxic and stable. In terms of
performance, the characterisation of the Draw Solution is based on the size and function of the
molecular size. On the one hand, the Draw Solution is characterised by a large molecular size
enough to minimise the reverse solute diffusion through the active layer of the membrane. On
the other hand, it is required to be of a small molecular size, which is enough to alleviate the
effect of Internal Concentration Polarisation (ICP) inside the support layer of the membrane.
Furthermore, the ability of the Draw Solution to produce high osmotic pressure for high water
flux and be easily reconcentrated by techniques at hand is also required (Shaffer et al. 2015).
Among these several and sometimes conflicting properties, a wide range of materials have been
proposed as novel Draw Solutions such as inorganic and organic solutes, magnetic
nanoparticles, polymers and others (Cai & Hu 2016). However, choosing the optimal draw

3
osmotic agent is still debatable issue. The question arises as to whether the appropriateness of
organic cationic draw solutions may propose viable solution for FO.
1.3 Project Aim and Objectives
This dissertation aims at investigating the performance of three organic cationic solutions
namely, L-Alanine, DADMAC and PolyDADMAC as osmotic agents for FO. Thereafter,
utilises the competent Draw Solution to recover the water from fumaric acid solution produced
by continuous microbial fermentation process via FO. This has been realised by the following
specific objectives:
i. Exploring the FO performance under the influence of various operation conditions,
(including Draw Solution type, Draw Solution concentrations, membrane type,
membrane orientations, and the pattern of pumping the solutions)
ii. Identifying the optimum operating conditions for FO system among the previous
operating conditions, where the highest water flux and lowest reverse solute diffusion
were achieved.
iii. Evaluating FO system for recovering water from fumaric acid solution produced by
continuous microbial fermentation process.
iv. Identifying the impact of membrane fouling and changing the temperature on
concentrating fumaric acid solution produced by continuous microbial fermentation
process.
v. Investigating the availability of reconcentration of the diluted Draw Solution using
stirred dead end NF membrane cell.
1.4 Scope
The scope of this dissertation focuses on three organic cationic solutions, namely DADMAC,
PolyDADMAC, and L-Alanine, within two focal points. The first investigates the most suitable
solution to be used as a draw osmotic agent in FO. The second investigates whether the water
recovery from fumaric acid solution produced by continuous microbial fermentation process
can be achieved via FO.
The first focal point has been dealt with by testing the three organic cationic solutions with
different concentrations in order to determine the most efficient Draw Solution for water
extraction application. Several bench scale experiments were performed using CTA and TFC

4
aquaporin protein flat sheet FO membranes. The diluted Draw Solutions were tested for their
reconcentration potential by using NF membrane process.
The second focal point was addressed by using L-Alanine at a concentration of 0.085 g/mL as
a Draw Solution and the TFC aquaporin protein flat sheet membrane in FO set up. L-Alanine
at a concentration of 0.085 g/mL achieved the highest distilled water flux with the lowest
reverse solute diffusion through the TFC aquaporin protein flat sheet membrane. Besides that,
diluted Draw Solutions of L-Alanine was effectually reconcentrated by NF system. The
average ion rejection of L-Alanine by NF90 membrane was 96.00%. The distilled water Feed
Solution was replaced with fumaric acid solution produced by continuous microbial
fermentation process to examine the viability of L-Alanine Draw Solution in extracting the
water from it via FO process.
1.5 Main Findings
The main findings of this dissertation are categorised according to three phases of experiments
which in the first phase intended to identify the best water flux and the lowest reverse solute
diffusion various operating condition. Fundamentally, this phase identifies L-Alanine solution
with 0.085 g/mL concentration as the best Draw Solution. L-Alanine with 0.085 g/mL
concentration achieved the highest initial water flux through both CTA and TFC aquaporin
protein flat sheets membranes with 22 L/m . hr (cited to as LMH) and 17 LMH, respectively.
The same concentration of L Alanine had the lowest reverse solute diffusion across both
membranes. It changed from 0.05 g/m . hr (cited to as GMH) at the beginning of experiment
to 0.01 GMH at the end of experiment.
The second phase investigates the ability of concentration the diluted Draw Solution produced
in FO system. In this phase it was demonstrated that Nanofiltration system was effective
method to reconcentrate the diluted L-Alanine solution. The average rejection of L-Alanine
ions achieved by NF90 membrane was 96.00%.
The third phase explores the viability of the FO system in water recovery from fumaric acid
solution produced by continuous microbial fermentation process experiments. This phase was
intended to establish that FO is an effective way to recover the water from the feed solution by
using L-Alanine as a Draw Solution. As a result, Fumaric acid solution produced by continuous
microbial fermentation process concentrated by 26.00% and 19.80% at 32℃ and 17℃,
respectively. In the same vein, high residual concentration of glucose in the biological process

5
limited the high water recovery from the fumaric acid feed solution. The limitations were due
to the reduction of the net driving osmotic force through the membrane.
1.6 Research Outline
Chapter 2 investigates previous studies pertaining to FO technology and membrane
processes and their structure, recent developments in materials and preparation of
methods of FO membranes, various types of responsive and non-responsive Draw
Solution, and the limitations of FO performance.
Chapter 3 presents the experimental plan, experimental protocol and set up of both FO
and NF systems, all materials and analytical methods used to conduct the research.
Chapter 4 summarises the experimental findings and discussions of each FO system,
reconcentration system, and the potential application which is concentrate fumaric acid
solution produced by continuous microbial fermentation process via FO system.
Chapter 5 presents the conclusions of research and important recommendations for
future works

6
CHAPTER 2
Literature Review This chapter presents a brief background of membrane technologies in separation and
extraction processes. It also provides for the principles of FO technology, FO membrane
structure and the materials, which are used to prepare the membrane. Furthermore, the chapter
details information on a wide range of materials used as draw agents. The limitations of FO
process including concentration polarisation, reverse solute diffusion (RSD), and membrane
fouling are discussed.
2.1 Background
Membrane Technology has been used as a separation and purification tool since the dawn of
human civilisation (Mohanty & Purkait 2011). However, utilising the membranes in large scale
industrial applications was considered seriously about 1970 for desalination and purification
purpose to produce high quality water (Strathmann et al. 2006). Membrane processes are
applied to control the permeation of the mixture components movement by allowing specific
components to go through the membrane structure freely, whilst trapping the other components
behind the membrane (Baker 2012).
Efficient membrane processes are necessary to supply the residential and industrial sectors with
high quality water, to remove toxic contaminants and to recover valuable components from the
industrial downstream. Membrane processes are utilised mainly in three areas ranging from
traditional to advanced applications. The first area covers wastewater treatment, desalination
applications and production ultrapure water. The second area focuses on separation and
purification the valuable components in food and medication industry. The third area includes
the usage of membrane in medical devices and artificial organs such as artificial kidney
(Strathmann et al. 2006; Ansari et al. 2017). Nowadays the use of membrane technology in
petrochemicals and production green energy is rabidly increasing. However, more
contributions are still needed in this area to enhance the performance of membranes in
advanced applications (Mohanty & Purkait 2011).

7
The characters of membrane processes make it favourable compared to other separation
processes such as distillation, crystallization and ion exchange. Membrane processes are more
energy efficient and easy to operate than the others. It works at ambient temperature and
without adding chemicals. Therefore, membrane processes are attractive tools compared to
conventional separation processes because it can be used to separate and purify the
temperature-sensitive components in medication industry and downstream processing.
Membranes can be natural membranes, which are part of living objects such as cells membrane,
or man-made synthetic membranes. The early studies of membranes were done using natural
materials such as gum elastics and animals bladders. Natural membranes are characterised with
high efficiency of transport molecules and minimal energy consumptions. The first study on
membrane permeation was recorded on the middle of the eighteenth century by Nollet. He
noticed that ethanol passes pig’s bladder while it was used as a barrier between water-ethanol
mixture on one side and pure water on the other side. This early observation demonstrated the
relations between mass transport through semi permeable barriers and osmotic pressure. More
studies on osmotic phenomena and mass transport through semipermeable membranes were
carried out by Fick and van’t Hoff. Fick (1855) explained that the liquids diffusion was a result
of concentration gradients. Later, van’t Hoff (1887) introduced the osmotic pressure equation
of dilute solutions based on thermodynamic explanation (Strathmann et al. 2006).
In the first decade of the twentieth century membrane preparation entered a new phase. A new
technique of preparing synthetic membranes was developed by Bechhold (1908). He prepared
the first synthetic membrane by digging a filter paper in a solution of nitrocellulose dissolved
in glacial acetic acid. Subsequent research utilised Bechhold’s membranes, however with
different pore sizes to study the diffusion phenomena and separate molecules from aqueous
solutions. Rapid developments of synthetic membranes manufacturing occurred in conjunction
with the progress of polymer chemistry. Various structures of synthetic polymeric membranes
have become available in the industry with efficient mass transport properties and excellent
stability. Polymers such as polyamide, polyethersulfone, polysulfone, polyethylene, etc. were
used in synthetic membranes manufacture. These synthetic polymeric membranes demonstrate
high mechanical, thermal and chemical stability compared to the membranes based on cellulose
asters. However, the milestone of membrane development was the preparation of the first
reverse osmosis membrane using cellulose acetate. In 1964 Loeb and Sourirajan prepared an

8
anisotropic cellulose acetate membrane for reverse osmosis desalination application with high
permeability and high solute rejection under moderate hydrostatic pressures.
The permeability of membrane for certain component is defined as the transport rate of that
component through membrane structure under particular conditions of pressure, concentration,
temperature and/or electric effect. The transport mass rate of different components depends on
many parameters such as membrane structure, size and concentration of permeating
components, type of electrical charge of both membrane and components and the driving force
(Strathmann et al. 2006). The diversity of membrane processes results from the use of different
membrane structures and driving forces such as pressure, concentration, thermal, and electrical
gradients across the membrane. The electrical potential driving force targets only the charged
elements in the queues solutions. However, other driving forces inducing pressure,
concentration, and thermal gradients affect equally on all the solutions components. Membrane
processes classification based on driving forces demonstrates in table 2.1 (American Water
Works Association & James Edzwald 2011).
Table 2.1: Classification of the membrane processes by driving force
Driving force Examples of membrane processes
Pressure gradient MF, UF, NF, RO.
Concentration gradient Dialysis, pervaporation, FO.
Temperature gradient Thermo-osmosis, distillation (thermal).
Electrical potential Electrodialysis, electro-osmosis.
Choosing an appropriate membrane process depends strongly on the composition feed solution.
For example, in seawater desalination applications the pressure driven membrane processes
especially RO and NF compete with distillation and electrodialysis processes. This is due to
the significant heat energy required for distillation process as well as high electrical energy for
electrodialysis. Moreover, the electrodialysis process can not eliminate viruses, bacteria and
other fine particles from the feed solution which can be removed effectively by RO and NF. In
contrast, RO and NF are more commercial, energy efficient and easy to handle. Pressure driven
membrane processes are run easily and achieve high quality final products at ambient
temperature without any change or degradation of the sensitive components. In this regards, in
some stages of wastewater treatment and surface water purification, the MF and UF processes
are recommended to be used instead of conventional processes such as flocculation and sand

9
bed filtration in order to achieve higher quality of the final product; similarly for separation
and concertation of food products, industry downstream and medical applications.
Nonetheless, membrane processes still face challenges which limit its performance. The high
hydraulic pressure applied during pressure driven membrane processes overstrains the
membrane and reduces the long term reliability. The formation of irreversible fouling on the
membrane surface declines the function of membranes. Pre-treatment processes are required
to eliminate the effects of the fouling which increases the energy and the cost. Concentration
polarisation is also considered as a major contributing factor forming serious constraints on the
membranes function (Strathmann et al. 2006).
Recently, significant progress has been made in developing the membrane processes to
improve the performance, the stability, and the minimal need of energy. The desirable
development contributes to the required increasing water flux at low energy and achieve long
life of membranes (Li et al. 2008). The development in membrane processes enticed
engineering and membrane technology research for the potential separation efficiency such as
FO. FO has invigorated membrane industry strongly for its merits including low or no energy
consumption, high water flux, solute rejection, and less prone to membrane fouling (American
Water Works Association & James Edzwald 2011; Nicoll 2013). The purpose of this work is
focused on FO process and more detailed information is provided in the following sections.
2.2 Forward Osmosis Theory
The principle of osmosis phenomenon is transmission of water molecules through semi
permeable barrier from region of low solute potential to region of higher solute potential. It is
the movement of liquid water from a low osmotic pressure region to higher osmotic pressure
region. This is illustrated by placing two compartments with different osmotic pressures
separated by a semi permeable membrane, the water molecules move spontaneously to the
compartment with higher osmotic pressure till the balance is achieved. The osmosis
phenomenon takes place widely in nature in trees and plants to get the water up from the soil
through its roots. This natural process has recently attracted more attention for its potential use
in industrial processes (Nicoll 2013).
Osmosis phenomenon was first explained in 1897 by the physicist Gibbs according to the water
potential of the system. It has been demonstrated that the water potential of solution decreases

10
gradually by adding more solutes. The water potential (Ψ ) then becomes the main parameter
that controls the water flux across the membrane and can be expressed as
Ψ Ψ Ψ Ψ Ψ Eq. 2.1
where is Ψ is the pressure potential (hydrostatic pressure P);
Ψ is the solute potential;
Ψ Ψ are the gravitational and matric potentials, respectively. These parameters are
neglected due to their small magnitude.
It is apparent from this equation that the water potential of the system is directly proportional
to the concentration of solute and external hydrostatic pressure. The dissolution occurs by
binging solute molecules to water molecules via hydrogen bonds. Some of the potential energy
of the system is consumed to create these hydrogen bonds which lead to decrease in the total
water potential. Increasing the solute concentration in the solution leads to more energy
consumption and consequently a significant decrease in the water potential. Difference of water
potentials between two solutions produces unbalanced force which grants water molecules the
tendency to move forward to the side with low water potential (high solute concentration)
seeking the balance (Boundless Biology Boundless 2016).
Fig 2.1 illustrates the movement of water molecules through semi permeable membrane in
many cases. When the solute is added (Fig 2.1, b) or external positive pressure is applied on
the left side of the U-tube (Fig 2.1, c), the water shifts to the right side. Shifting of water
molecules occurs due to the osmotic pressure of solutes or the external applied pressure,
respectively. Conversely, if the external applied pressure becomes negative (Fig 2.1, d), the
water will move to the left side of the U-tube. The mechanism of water flux through the
membrane structure in FO process (as an example of osmotically driven processes) is
demonstrated clearly in Fig 2.2.

11
Figure 2.1: Water flux through semi preamble membrane under various condition: (a)
osmotic equilibrium, (b) osmotically driven process, (c) and (d) pressure driven process
Figure 2.2: Mechanism of water flux through the membrane in Forward Osmosis
The viability of FO technology either in bench scale or pilot scale has been explored by many
of academic institutes and commercial organisations. FO process has been involved in wide
applications including water extraction applications, desalination, wastewater and sludge
treatment, food concentration, pharmaceutical products dehydration, power generation,
resource recovery and others (Nicoll 2013; Chung et al. 2012; Zhang et al. 2017).

12
2.3 FO Membranes- Structure/Morphology
Morphological characteristics of membrane affect strongly the performance of membranes.
Membranes generally can be categorised into isotropic membranes and anisotropic
membranes. The classification occurs based on the similarity of layers composition and
structure, besides of size and distribution of the pores. Isotropic and anisotropic membranes
are illustrated in Fig 2.2
Figure 2.3: Schematic diagrams of the principal types of membranes (Baker 2012)
2.3.1 Isotropic Membranes
Isotropic membrane is a completely homogeneous thin membrane which is composed of one
layer of similar molecules in the structure. It can be either microporous membrane or nonporous
membrane.
2.3.1.1 Microporous Membrane
A microporous membrane is composed of a symmetric membrane which contains high
percentage of pores as illustrated above in figure 2.2. These pores are randomly placed in a
manner forming interconnected voids. The size of these pores ranges from 0.01 to 10 μm in
diameter. The separation process using microporous membrane is a function of solute particles

13
size and pore size distribution. Solute particles with diameter larger than 10 μm are completely
hindered to cross the membrane, meanwhile the particles with diameter much smaller than
0.01μm will pass unrestrictedly through the membrane. Particles with diameter larger than the
smallest pores and smaller than the largest pores would be partially rejected as a result of the
randomly distribution of the pore size (Baker 2012). Microporous membranes are also used
effectively, besides FO process, in liquid separation applications by means of a sieving
technique as in case of MF and UF processes (Jaffrin 2015).
2.3.1.2 Nonporous Membranes
A nonporous membrane is a symmetric dense film with relatively low permeant flux compared
to the permeant flux in microporous membrane. The diffusion of the components of the mixture
across the dense membrane require an external driving force. The driving force can be applied
pressure, concentration gradient, thermal gradient, or electrical potential.
The mass transport through the membrane is a function of both the diffusivity ratio of the liquid
and the solubility ratio in the membrane materials. In other words, the dense membrane can
separate molecules of mixture which have the same size if their solubility ratio in the membrane
material is significantly different. Usually this type of membrane is used as an active layer of
the anisotropic composite membranes to enhance the permeate flux (Baker 2012). Nonporous
Membranes are also used effectively for RO, NF, and gas separation processes (Jaffrin 2015).
2.3.2 Anisotropic Membranes
Serious steps have been taken for the development of the structure of membranes to produce a
stable membrane with high mass transport. One of these steps was the manufacturing of
anisotropic membrane which became later the widest type of membranes used in water
separation industries.
An anisotropic membrane is composed of a multilayer barrier, usually two layers. The top one
is called active layer or top skin layer, and the bottom one is called the support layer. The
Active layer must be extremely thin dense layer to provide high flux. Meanwhile, the support
layer must be porous sublayer and thicker to provide the mechanical strength to membrane
thickness. The anisotropic membranes are divided to two types based on the homogeneity of
the layers, namely integrally skinned asymmetric membranes and composite membranes. In
the integrally skinned asymmetric membranes, the material of the active and the support layers
are the same. In the composite membranes, the material of the active layer and support layer

14
are different. Choosing the materials separately to prepare the layers of composite membrane
can enhance the overall performance of the membrane. Enhancing the performance occurs by
gaining the merits of various materials in one membrane (Baker 2012; Khulbe et al. 2008).
2.4 FO Membranes - Materials, Preparation
Both chemical and physical characteristics of membranes materials play an integral role in the
performance of membrane processes. High performance of membranes can be obtained by
considering significant characteristics during the materials manufacturing stage. These
characteristics including membrane selectivity, chemical resistance, permeability, mechanical
stability, and thermal stability. Membrane with high selectivity causes low permeability and
low water flux; therefore, membrane surface area is needed to be increased to overcome this
issue. In contrast, membrane with low selectivity causes high permeability. This option leads
to combine multi units to achieve products with high quality results, which require more energy
and cost. The manufacturing of the layers of FO membranes requires the use of either or both
type of raw materials including modified natural products and synthetic products. The diversity
of membrane materials with various characteristics assists in selecting the compatible materials
for each layer based on the transport mechanism across it (American Water Works Association
& James Edzwald 2011; Li et al. 2008).
Two generation of synthetic membrane types are used in FO applications. The early generation
had started since 1960s with preparation the first asymmetric membrane by Loeb and
Sourirajan. In this period the majority of studies have been used the pressure driven
membranes, especially RO membranes, for FO application. In 2000s serious attempts were
recorded in the development of a new generation of membranes especially for osmotically
driven process. The structure of new generation of FO membranes is quietly different than
pressure driven membrane for better performance and high efficiency. Zhao et al. (2012)
categorised the membranes based on the preparation technique to three types, namely phase
inversion membranes, thin film composite (TFC) membranes, and chemically modified
membranes (Zhao et al. 2012).
2.4.1 Phase Inversion Membranes
Phase inversion process is the most commonly method used in manufacturing the cellulosic
and polymeric membranes. It is utilised in the preparation of both isotropic and integrally
skinned anisotropic membranes. Phase inversion process is feasible for polymers which can be
15
dissolved in a proper solvent or a mixture of solvents at certain temperature and then be casted
to form a solid phase. Forming solid phase of membranes can be done by many techniques
including solvent evaporation, thermal precipitation, etc. (Mohanty & Purkait 2011); (Khulbe
et al. 2008). Increasing the polymer concentration in the casting solution and accelerating the
evaporation rate of solvent leads to increase the layer density. Increasing density of the layers
occurs especially in the preparation of the active thin layers of anisotropic membranes (Khulbe
et al. 2008).
Cellulose acetate is the first material used in manufacturing of the early generation RO
membranes via phase inversion process (Khulbe et al. 2008). It was chosen by Loeb and
Sourirajan to prepare the first asymmetric membrane after the observations of its merits by
Reid and co-workers in 1959 (Zhao et al. 2012). They reported that cellulose acetate films have
higher salt rejection feature than other polymeric materials. The hydrophilic nature of cellulose
acetate provides for the FO membranes a high water flux and low ICP. Besides that, it has the
mechanical strength and the degradation resistance caused by chlorine. These advantages of
phase inversion cellulosic membranes grant it to be a good competitor compared to the osmotic
driven membranes for FO application. Moreover, Thorsen (2004) has reported that cellulose
acetate membranes have the lower natural organic matter fouling compared to other
hydrophilic membranes such as Polysulfone (PSf) (Zhao et al. 2012); (Alsvik & Hägg 2013).
However, some limitations should be considered in using cellulose acetate before utilising it in
FO process. It is hydrolysed easily compared with TFC polyamide RO membranes (Zhao et al.
2012). As early as 1966, Kenneth Vos and others studied the hydrolysis of RO membranes
formed by cellulose acetate. Several types of different buffers over pH range of 2-10 were used
in the study. The membranes were approximately 60.00% porous and the pores diameter less
than 1μm. Water and acetic acid were observed as products of the hydrolysis reaction. To
overcome this disadvantage, chemical stability of cellulose acetate and cellulose triacetate
membranes should be achieved by adjusting pH of the draw and the feed solutions in 4-7 range.
The temperature should be also less than 35C (Vos et al. 1966).
The first FO membrane was commercially available by Chung research group in 2007. It was
NF hollow fibre membrane manufactured from Polybenzimidazole (PBI) via phase inversion
process. PBI has good characteristics in terms of mechanical strength and chemical stability.
However, it is poor in salt rejections when the inorganic salts used as a Draw Solution.
Therefore, PBI NF hollow fibre membrane was modified by adding polyethersulfone (PES)

16
and polyvinylpyrrolidone (PVP) into the casting solution during the phase inversion process to
improve the salt rejection of FO membrane. The modified membrane is commercially used
under the tradename of dual layer PBI-PES/PVP membrane.
Recently, Chung research group (2010) has introduced cellulose acetate material in
manufacturing FO membranes via phase inversion. Formation double dense active layers has
incorporated to reduce ICP in the support layer of cellulose acetate membrane. The
modification of membrane structure was done by using a hot water annealing as separation
technique during the phase inversion process (Zhao et al. 2012). Fig 2.3 shows the structural
comparison between FO membrane and RO membrane both prepared from cellulose acetate.
FO membrane is thinner with porous open structure.
Figure 2.4: Cross sectional SEM images of (a) cellulose acetate FO membrane, (b) cellulose acetate RO membrane where 1 is active layer, 2 is support layer. adopted from (Nicoll 2013).
Currently, Hydration Technology Innovation HTI (Albany, Oregon, USA) provides for two
commercial types of anisotropic CTA based membranes. Firstly, the integrally skinned
asymmetric membrane with approximately 50μm as overall thickness, and secondly the
conventional TFC membrane with much thicker than 100μm. These types are widely utilised
nowadays in FO research especially the thin integrally skinned asymmetric one because it has
high water flux compared with the thick conventional TFC membrane. Phase inversion process
is utilised to prepare the support layer in both of these membranes using CTA material.
Other processes are used for preparation the active thin layer and manufacture a new FO
composite membrane. Dip Coating and Interfacial Polymerization processes are used to
achieve the purpose (Zhao et al. 2012; Khulbe et al. 2008).

17
2.4.2 Thin Film Composite Membranes
Same methods of manufacturing pressure driven composite membranes such as RO are
followed in preparing the FO composite membranes. The porous support layers are prepared
by phase inversion process and the selective thin layers by Dip Coating or Interfacial
Polymerization (Zhao et al. 2012; Khulbe et al. 2008).
In Dip coating process; a dried porous support layer manufactured from appropriate polymer
via phase inversion is dipped in bath of dilute solution of a different polymer. A thin layer of
the latter polymer is deposited on the top of the support layer. After that the membrane is
removed from the bath and the solvent is evaporated. Final product of the TFC membrane
consists of porous support layer coated by thin dense polymeric layer is prepared (Khulbe et
al. 2008). This method was used by Wang et al. (2005) in coating asymmetric membrane
capsule utilised the FO technology to deliver poorly water-soluble drugs. The path consisted
of a mixture of cellulose acetate, ethyl cellulose, and plasticizer dissolved in a mixture of
acetone, alcohol, and glycerine solution (Wang et al. 2005). Same method was reported by
Kumar et al. (2012) to coat the wall asymmetric membrane capsule and used it osmotic drug
delivery mechanism (Kumar et al. 2012).
In Interfacial Polymerization; a porous support layer is coated on the top by a thin active
layer of a polyamide via interfacial in situ polycondensation. It occurs when the porous support
layer is dipped in an aqueous amine monomer solution (amine solution mixed with water).
Then the pores on the surface are sealed with the same aqueous monomer solution. The extra
solution should be removed from the top to adjust the level of polymerization. After that, the
membrane is soaked in acid chloride monomer solution dissolved in hexane as an organic
solvent. The amine monomer is easily dissolved in the organic solvent. However, the acid
chloride is not soluble in the aqueous solution. Therefore, the polycondensation reaction of
amine solution and acid chloride occurs at the boundary of the two phases to form a thin dense
layer of polyamide. Preparation of TFC membranes by Interfacial Polymerization is illustrated
in Fig 2.4 (Khulbe et al. 2008; Alsvik & Hägg 2013).

18
Figure 2.5: Step of thin film composite membrane formation via Interfacial polymerization. Adopted from (Khulbe et al. 2008)
Alsvik & Hägg (2013) have mentioned some of synthetic chemical materials which are
involved widely in manufacturing the FO membranes such as CTA, PSf, PES, PBI, polyamide-
imide (PAI), and polyamide. The PSf and PES have a quite same characteristics, yet the PSf
has longer chain of aryl- -aryl units than the PES, as illustrated in Fig 2.5. Both of these
polymers are used to prepare the porous support layer in the TFC membranes because of its
suitable properties. It has high resistance of hydrolysis and thermal oxidative besides the good
mechanical strengthen to reinforce the thin active layers.
(a) (b)
Figure 2.6: Chemical structure of (a) Polyethersulfone, (b) Polysulfone
Moreover, polyamides are the final products of the reaction between an amine monomer and
an acid chloride monomer. It widely used to coat the porous support layer in the TFC
membranes to display good performance. Deposit a thin active layer of polyamides based on
the concept of Interfacial Polymerization was reported firstly by Cadotte. The process of
Interfacial Polymerization described later. Another polymer PAI is commercially used under
the trade name ofTorlon®4000T. It is preferred to add it with other polymers during the

19
manufacturing process of the membranes to enhance the membrane resistance against strong
chemicals. Table 2.2 illustrates the amine-acid chloride combinations used in FO membrane
preparation via Interfacial Polymerization process (Alsvik & Hägg 2013).

20
Table 2.2: Amine-acid chloride combinations used in FO membrane preparation via Interfacial Polymerization process.
Literature Active layer
Amine Acid Chloride
Tiraferri et al. (2011) has prepared thin active TMC-MPD layer via Interfacial
Polymerization. This polyamide is commonly used in FO and Pressure
Retarded Osmosis (PRO) applications. It provides high solute rejection and
excellent water flux (Alsvik & Hägg 2013; Tiraferri et al. 2011). The porous
support layer was prepared from the PSf casted on polyester nonwoven. It has
been observed that changing the concentrations of the components affects the
characteristics of the active layer. Water permeability through the layer
increases by increasing the concentration of the acid chloride (TMC) or
reducing the concentration of the Amine (MPD). However, negative impacts
on the solute rejection have been observed in this case (Zhao et al. 2012).
m-Phenylene diamine (MPD)
Juhn Roh (2003) studied the effluence of physicochemical properties of the
TFC membranes on the permeation performance. He used Interfacial
Polymerization process but replaced MPD with PPD which has similar
chemical composition but different structure. The final polyamide TMC-PPD
product has lower molecular chain compared to TMC-MPD. It has been
demonstrated that TMC-PPD provides lower water flux and higher solute
rejection. This behaviour attributed to the high hydrophilicity of TMC-MPD
membrane and low solubility of TMC-PPD, respectively (Roh 2003).
p-Phenylene diamine (PPD)

21
Literature Active layer
Amine Acid Chloride
Garry Baroña et al. (2012) enhanced the water flux and solute rejection of RO
membrane by adding 2,2’-Benzidinedisulfonic acid (BDSA) monomer to
TMC-MPD to prepare the thin active polyamide layer on the top of a PSf
porous support layer. The rejection ofNaCl and MgCl solutes were studied.
The results showed the morphology of the active layer surface becomes more
smooth and hydrophilic by increasing the concentration of BDSA which
increases the water flux. The rejection of solutes also increases by increasing
the content of BDSA until 5.00%, then the rejection decreases because of
reduced the reactive activity of BDSA with TMC (Baroña et al. 2012).
2,2’-Benzidinedisulfonic acid
(BDSA)
Trimesoyl chloride (TMC)

22
In previous studies, a conventional Interfacial Polymerization process was applied to prepare
the TFC membranes. The conventional Interfacial Polymerization process was based on the
adhesive forces to combine the polymers of both active and support layers. However, the
conventional process is not suitable for manufacturing the TFC membranes which consisted of
a thin active layer bonded to a hydrophilic cellulose acetate /CTA support layer. The challenge
in this method is that, the thin active layer easily peeled off from the support base in case of
using the conventional Interfacial Polymerization process. Alsvik and Hägg (2013) succeeded
in coating the hydrophilic cellulose acetate /CTA support layer by thin polyamide layer by
modification Interfacial Polymerization method. The modified Interfacial Polymerization
method works by linking the hydrolysed CTA support layer with the molecules of TMC in the
thin active polyamide layer. The molecules of both active and support layers bonded by
covalent bonds instead of adhesion force, as illustrated in Fig 2.6. This combination between
hydrophilic cellulose acetate/CTA support layer and thin active polyamide layer has provided
for promising TFC membranes for osmotically driven applications. It has integrated the
hydrophilic feature of the CTA layer with the high water permeability of thin polyamide layer
resulted in reducing the ICP in the support layer and increasing the water flux cross the active
layer (Alsvik & Hägg, 2013).
Figure 2.7: Modified Interfacial Polymerization process, where membrane layers are linked via covalent bond, (Alsvik & Hägg 2013)

23
Sterlitech Corporation has developed one brand of FO membranes based on incorporating the
aquaporin protein water channels in the commercial TFC membranes. The TFC active layer is
prepared through Interfacial Polymerization in which an additional aquaporin water channels
component has been integrated. This new component has been added to the aqueous amine
solution before the Interfacial Polymerization reaction occurred. The thin active layer is formed
by dipping the porous support layer of the PES in MPD aqueous solution contains the aquaporin
water channels. Then the membrane is soaked in TMC solution dissolved in organic solvent.
A highly crosslinked polyamide TMC-MPD active thin layer comprising embedded aquaporin
water channels is formed on the top of the PES porous support layer. The thickness of active
layer becomes approximately 100-700 nm. The integration of aquaporin water channels creates
narrow passages with a diameter of only 2.4 nm in the nonporous active layer. These narrow
passages improve performance of the TFC membranes. They stimulate water transport which
results in high water flux. Nonetheless, high rejection of solutes and organic molecules joined
with low fouling tendency have been observed (Petrinić & Hélix-Nielsen, 2014; Mentzel,
Perry, Vogel, Braekevelt, Geschke, Larsen, 2016).
Figure 2.8: Preparation of TFC aquaporin protein membrane by Interfacial Polymerization, adopted from (Shenvi et al. 2015)

24
2.4.3 Chemically Modified Membranes
Operating FO process for a long time can cause water flux decline due to the contaminants
deposition on the active layer of membranes. Membrane surface modification has been done
to prevent the contaminants deposition and enhance the water flux. The polyamide active layer
surface of composite membrane can be chemically modified by exposure it to strong solution
of hydrofluoric acid. A chemical reaction occurs and results in a slight decrease in the
polyamide active layer thickness. Consequently, water flux increases; meanwhile the NaCl
solute rejection remains without change or slightly improved (Khulbe et al. 2008).
Setiawan et al. (2011) reported that the chemical modification of the PAI porous layer can be
used to add a positive charged active layer. The chemical modification resulted from the
reaction between the porous layer and a cationic polyethylene mine. At a later stage, the group
of Setiawan et al. developed a FO flat sheet membrane consisted of this positive charged layer
embedded with woven fabric, which result in reduction of the membrane thickness to 55μm
(Setiawan et al. 2011; Zhao et al. 2012).
Tang and co-workers have produced a novel FO membrane via layer-by-layer assembly
technique (Qiu et al. 2011). The support layer of polyacrylonitrile (PAN) was prepared by
phase inversion process and exported to sodium hydroxide to modify the surface in order to
increase both the hydrophilicity and the negative charge density. The requirement to add double
charged layers which are chemically crosslinked with negative PAN support layer prevails.
This was done by a chemical reaction between three layers, namely the negative PAN support
layer, polyanion layer and polycation layer. As Fig 2.8 illustrates, the support layer is coated
first by positive layer via soaking it in positive Poly (allylamine hydrochloride) (PAH) solution.
Then, the negative Poly (sodium 4-styrene sulfonate) (PSS) is also coated by the same method
to add a negative layer. Between the coating steps, the membrane was rinsed by deionised water
to remove the extra polyelectrolytes. The desired number of polyelectrolytes layers on the top
of negative PAN support layer can be acquired by repeating the coating steps (Zhao et al. 2012).

25
Figure 2.9: Layer-by-layer assembly method of PAH and PSS, adopted from (Zhao et al. 2012).
2.5 Draw Solutions
The viability of using FO processes in principle does not only depends on the membrane
materials, but also depends critically on the type of the Draw Solution. However, the lack of
the optimal Draw Solution still poses challenges to operate efficient large scale applications of
FO. The selection of appropriate Draw Solution will improve the performance of FO process
and save money regarding the regeneration process. Cai and Hu (2016) stated four main criteria
of the appropriate Draw Solution i.e. (i) Draw Solution which has relatively good solubility in
water, (ii) Draw Solution which has a high osmotic pressure leading to a positive water flux
across the membrane, (iii) Draw Solution which is easily reconcentrated by effective and
commercial processes to reuse it again, and (ix) Draw Solution which has a proper
physicochemical characteristics such as small molecular weight and low viscosity to minimize
ICP. Ge et al (2013) added another criterion to the selection process of the Draw Solution
relating to the reverse solute diffusion, which must be minimal. The Draw Solution should also
have other noble properties such as zero toxicity, the absence of any damage effects on the
membranes structure, and has chemical stability.
Various materials and components are proposed as an ideal Draw Solution for FO process.
However, researches are ongoing to investigate new materials for this purpose. Scientists and
researchers have differed in the classification of the Draw Solution. On the one hand, Ge et al.

26
(2013) categorised the draw solutes, the components which dissolved or used to prepare the
Draw Solutions, into two groups including commercially available components and synthetic
components. The commercially available components are divided based on their
physicochemical into four categories; inorganic solutes, organic solutes, nutrients components
and volatile components. Synthetic draw solutes such as hydrophilic magnetic nanoparticles
are presented as promising draw agents which have a high amount of interest recently (Ge et
al. 2013).
On the other hands, Cai and Hu (2016) classified the draw solutes based on their response to
the external environmental factors into two categories; responsive draw solutes and non-
responsive draw solutes. Both draw solutes are exposed to external factors such as temperature,
light, pH and electromagnetic. In the non-responsive draw solutions, the solute-solvent
intermolecular forces are not affected significantly by the external factors. However, in the
responsive draw solutions, these intermolecular forces are affected by the exposure to the
previous external environmental factors. This response causes a significant changes in the state
and characteristics of solutions. Investigating the influence of the external environmental
factors on the Draw Solutions gives an indicator of the ability of reconcentrate and reuse them.
Therefore, this classification provides an intrinsic assessment for the selection of the proposed
draw agents of FO proses in the future (Cai & Hu 2016).
2.5.1 Non-Responsive Draw Solutes
2.5.1.1 Inorganic Solutes
The usage of sugar as a Draw Solution to desalinate the seawater was only tested in 1970s,
however; the intention of using inorganic solutes for industrial applications started in the late
1990s (Cai & Hu 2016; Ge et al. 2013). Mainly, NaCl solute has been utilised in the majority
of FO applications because of its benign characteristics. It is nontoxic, inexpensive, high
soluble, generate high osmotic pressure as well as easy to reconcentrate by available processes
like RO. However,NaCl has a relatively high reverse solute diffusion which is considered a
weakness (Achilli et al. 2010).
Various inorganic draw solutes have been tasted in FO applications. In 2010, Andrea Achilli
et al. established a protocol for selection an ideal inorganic Draw Solution. The composition
of the protocol includes three steps, namely initial screen process, laboratory evaluation and
finally explore the viability of reconcentration the Draw Solutions. Among 500 inorganic

27
solutes were initially considered, 14 compounds were passed the screaming process to the
second stage of the protocol. The selected compounds were then tested in the laboratory to
determine their water flux, reverse solute diffusion, as well as the efficacy of the
reconcentration using Reverse Osmosis System Analysis (ROSA) software. Ultrapure water as
a Feed Solution and a negatively charged flat sheet membrane of CTA were used in all the
experiments.
The study of Andrea Achilli has demonstrated that various Draw Solutions with the same
osmotic pressure achieve different values of water flux and reverse solute diffusion due to the
influence of ICP. Moreover, it has been observed that the highest water flux of 10.9 LMH was
achieved by KCl solution with osmotic pressure 28atm. The reverse solute diffusion of
solutions containing large hydrated anions such asMgSO ,KHCO ,NaHCO ,Na SO ,
NH SO , K SO was the lowest comparing with other compounds.
Table 2.3 lists the properties, water flux and reverse solute diffusion of the 14 draw inorganic
solutions finally selected by Andrea Achilli et al.
Table 2.3: Draw inorganic solutions - properties, water flux and reverse solute diffusion.
Draw
solutes
Solubility at
25 , g/L
Concentration
g/L
Osmotic
pressure atm
Water flux
LMH
Reverse solute
diffusion, GMH
KCl 313 47.0 28 10.9 12.3
NH Cl 305 32.6 28 10.4 7.6
KBr 536 71.3 28 10.2 22
NaCl 315 35.2 28 9.6 7.2
CaCl 821 43.8 28 9.5 7.9
K SO 105 101.4 28 9.1 3.7
NaHCO 101 63.9 28 8.9 1.7
Ca NO 1209 87.2 28 8.9 6.0
MgCl 466 33.8 28 8.4 4.8
NH SO 542 74.3 28 8.2 3.3
KHCO 200 65.5 28 8.1 1.4
Na SO 256 84.7 28 7.7 2.7
NH HCO 232 52.8 28 7.3 18.2
MgSO 342 141.3 28 5.5 1.2
28
Chekli et al. (2017) investigated nine inorganic fertilisers including NH NO , NH SO ,
NH Cl, Ca NO , KCl, NH H PO , NH HPO , KNO , andKH PO . These fertilisers were
used to prepare Draw Solutions with high osmotic pressure and utilise it to extract the water
from wastewater. The diluted Draw Solutions with nutrients compounds were used directly for
irrigation purpose. Therefore, reconcentration of diluted Draw Solution step was unnecessary.
The efficiency of fertiliser Draw Solution was determined based on their water flux, reverse
solute diffusion, and water recovery percentage values. Chekli et al. (2017) used a commercial
FO membrane prepared from TFC-polyamide to overcome the hydrolysis issue which is a real
problem for cellulose acetate /CTA FO membranes as it is explained before.
2.5.1.2 Polymers
Recently, few studies have been conducted on utilising polymers compounds as draw agents
compared to inorganic solutes. Often, soluble polymeric organic compounds meet the
requirements to be appropriate draw agents. They have high molecular weight which make
them easy to reconcentrate using low pressure driven processes. Large molecular weights grant
the Draw Solution to reduce the reverse solute diffusion back to the Feed Solution side (Cai &
Hu 2016).
These properties encouraged Ge et al. (2012) to explore the performance of an anionic
polyelectrolyte polyacrylic acid sodium salts (PAA-NA) with various molecular weights as a
Draw Solution in FO process. Investigating the performance of PAA-NA with molecular
weights of 1200, 1800, and 5000 was based on water flux, reverse solute diffusion and the
ability of reconcentration the diluted Draw Solutions (Ge et al. 2012).
Ge et al (2012) reasoned the choice of PAA-NA (1800) instead of PAA (1800) as a Draw
Solution as follows: Firstly, NaCl solute was added to adjust the acidity degree of polyacrylic
acid to reach the neutral range of 6.9-7.3. Neutral solution would skip the hydrolysis issue
therefore be safe on the cellulose acetate/CTA membranes structure which was used in the
study. Secondly, PAA-NA (1800) has higher dissociation degree than PAA (1800) which
causes the increase in ionization of solution by 89.00% compared to 0.6.00% in PAA solution.
Increasing ionization degree comes accompanied with increasing electrical conductivity and
osmotic pressure of the Draw Solution which is required to achieve high water flux. However,
water fluxes are limited by the sharp increasing of the viscosity due to increasing the molecular
wright of the polyelectrolyte.
29
Table 2.4 represents the properties and the comparison of PAA-NA with various concentrations
in osmotic pressure, water flux, and reverse solutes diffusion via cellulose acetate hollow fibre
membrane, PRO mode (Ge et al. 2012).
Table 2.4: PAA-NA solutions - properties, water fluxes and reverse solute diffusions.
Draw solute
Concentration
g/mL
Relative
viscosity
Osmotic
pressure
atm
Feed
solution
Water
Flux
LMH
Reverse solute
diffusion
GMH
PAA-Na, 1200 Da 0.48 ~ 13 36.6 DI water 16.7 1.2
0.48 ~ 13 36.6 Seawater 3.6 Unmeasured
0.72 ~ 80 44.0 DI water 21.6 1.7
0.72 ~ 80 44.0 Seawater 6.5 Unmeasured
PAA-Na, 1800 Da 0.48 ~ 14 33.5 DI water 15 1.4
0.72 ~ 120 39.5 DI water 18.7 1.7
PAA-Na, 5000 Da 0.48 ~ 30 21.8 DI water 11.3 1.2
0.72 ~ 320 25.8 DI water 13.7 1.5
Besides that, PSS was studied as another anionic polyelectrolyte draw solute by Enling Tian et
al. (2015). Various concentrations of different molecular weight solute were investigated. It
was highlighted that the diluted Draw Solution of strong polyelectrolyte PSS needs less
hydraulic pressure via ultrafiltration membrane process to reconcentrate than PAA-NA. The
PSS achieved water flux better than that of PAA-Na at the same concentration. The best water
flux produces by 0.24 g/mL PSS (70.000 Da) is 18.2 LMH and higher than that of 0.24 g/mL
PAA-Na (1800 Da) which is approximately 12LMH. In contrast, the reverse diffusion of 0.24
g/mL PSS (70.000 Da) solute is higher than that of 0.24 g/mL PAA-Na (1800 Da) by 7 times
due to the strong and intensive charged ions presented in the solution. The intensive charged
ions lead to high osmotic pressure, high water flux, and high reverse solute diffusion. The effect
of increasing the viscosity of PSS solutions was also studied. Increasing the viscosity causes a
severe concentration polarization near the surface of the membrane, which causes a high
reverse solute diffusion and low water flux (Tian et al. 2015).

30
2.5.1.3 Organic Solutes and Organic-Based Compounds
Organic solute is an electrolyte compound results from reaction between organic acid (anion)
and organic or inorganic base (cation) (Ge et al. 2013). Organic electrolytes have molecular
weights approximately from 100 to 1000g/mol, higher than the molecular weights of
inorganic solutes and lower than that of polyelectrolyte. They have lower viscosities than their
polymers counterparts, while they generate higher water flux (Cai & Hu 2016). Bowden et al.
(2012) investigated the viability of using various organic solutes as draw agents in osmotic
membrane bioreactors to treat wastewater. Ten organic solutes result of the reaction between
inorganic cations of Na and Mg and organic anions of acetate, formate, propionate, and
fumarate/maleate were initially proposed. Only four organic salts were finally selected and
evaluated based on a modified protocol build on the Achillie’s protocol (Bowden et al. 2012).
The selection of the Draw Solution for osmotic membrane bioreactors was according to two
criteria. Firstly, the organic anion part of draw solute must be biodegradable to prevent the
solutes accumulation inside the bioreactors. It must also act as a carbon resource which is
required for removing the nutrients by denitrification of the ammonium compound. Secondly,
it should be commercially available and has benign properties. Organic Draw Solution should
have a reasonable relationship between the concentration and its osmotic pressure. Water flux,
reverse solute diffusion, reconcentration the diluted draw solutions, and the biodegradation
potential of each organic solutes were measured. Table 2.5 shows the properties,
concentrations, water flux, and reverse solute diffusion of each draw solution using the CTA
flat sheet membrane, FO mode.
Table 2.5: Draw organic solutions - properties, water flux and reverse solute diffusion.
Draw solutes Concentration
g/L
Osmotic pressure
atm.
Water flux
LMH
Reverse solute
diffusion GMH
Sodium formate
HCOONa
46 28 9.36 6.04
Sodium acetate
CH COONa
91 28 9.00 2.73
Sodium propionate
CH CH COONa
66 28 8.68 1.47
Magnesium acetate
CH COO Mg
166 28 8.10 1.07

31
The aforementioned table illustrates, on the one hands, the water flux generated at 28 atm range
from 8.10LMH for magnesium acetate to 9.36LMH for sodium formate. The change in water
flux occurs due to the effect of ICP inside the support layer of the membrane. Solutes with high
diffusion coefficient have high ability to diffuse inside the support layer than that of have low
diffusion coefficient. It causes increasing the concentration of the Draw Solution within support
layer and less ICP effluence. Sodium formate with high diffusion coefficient 1.59
10 m S⁄ at 28atm was less influenced by ICP than magnesium acetate with low diffusion
coefficient 1.14 10 m S⁄ . Therefore, sodium formate generated water flux higher than
magnesium acetate (Bowden et al. 2012). More explanation of ICP is demonstrated in section
2.6.1.2.
On the other hands, by comparing the reverse solute diffusion of two organic solutes have the
same anions; sodium acetate and magnesium acetate, it is observed that the reverse diffusion
of sodium acetate is double of magnesium acetate. In explaining this phenomenon, Achillie et
al. (2010) stated that the charge of the membrane surface plays a role of changing the reverse
solute diffusion. The increase of the cations concentration in the Draw Solution leads to
decrease the reverse solute diffusion through the negative charged CTA membrane.
Akther et al. (2015) reported another group of non-electrolytes organic draw solutions were
used for various FO applications. These draw solutions are shown in table 2.6
Table 2.6: Non-electrolytes organic draw solutions - properties, water flux and application.
Draw
solutions
Concentration
g/L
Osmotic pressure
atm
pH at given
concentration
Water flux
LMH Application
Fructose 360 55.02 7.01 7.50 Desalination
Glucose 360 55.03 7.01 0.24 Desalination
Sucrose 684 56.81 6.18 0.35 Food industry
Ethanol 92 43.93 7 N/A Desalination

32
2.5.2 Responsive Draw Solutes
The osmotic pressure of Draw Solutions prepared by smart responsive draw solutes can change
significantly due to the exposure to external environmental factors. Temperature, magnetic
field, electric field, light, and pH changing are environmental factors which able to affect the
osmotic pressure of the Draw Solutions. Therefore, choosing appropriate responsive draw
solutes for FO can mitigate prevailing challenges, difficulties pertaining to reconcentration of
the non-responsive Draw Solutions. Cai and Hu (2016) reported different types of responsive
draw solutes suitable for FO applications such as nanoparticles, hydrogels, and volatile
components. Some of these are practically used and others are in the development stage (Cai
& Hu 2016).
2.5.2.1 Nanoparticles
Nanoparticles are defined as ultrafine particles with size ranges from 1nm to 100nm.
Nanoparticles such as carbon quantum dots and magnetic Fe O have been used as Draw
Solutions for FO applications. In this case, Draw solutions are prepared by dispersing these
nanoparticles in water. The osmotic pressure of the Draw Solution can be increased by adding
ionic compounds to the solution such as Na which pairs the carbon quantum dots and then
increase the surface charge of particles.
Number of advantages can be derived from the use of nanoparticles in FO applications. For
example, low reverse solute diffusion can be obtained since the size of nanoparticles is much
larger than the pore size of the FO membranes. Paramagnetic nanoparticles can be regenerated
readily from Draw Solutions by using external magnetic field (Cai & Hu 2016), and pressure
membrane processes such as UF process. As it is illustrated in Fig 2.9, a responsive Fe O
nanoparticle Draw Solution was utilised to generate osmotic pressure to extract water from
saline and meanwhile it can easily be separated via magnetic field.
However, water flux produced by the nanoparticles Draw Solution is still very low compared
to the non-responsive Draw Solutions. Water flux of approximately 2 LMH was achieved
against seawater feed solution. Other drawbacks were also stated of using nanoparticles by
Kim et al (2011). They investigated that the separation of nanoparticles with less than 11 nm
is difficult even by using strong magnetic fields. In the same time, it is not easy to separate
those which have a size bigger than 20 nm from the magnetic column. To overcome this
problem, nanoparticles with uniform dimensions can be effectively recovered by membrane
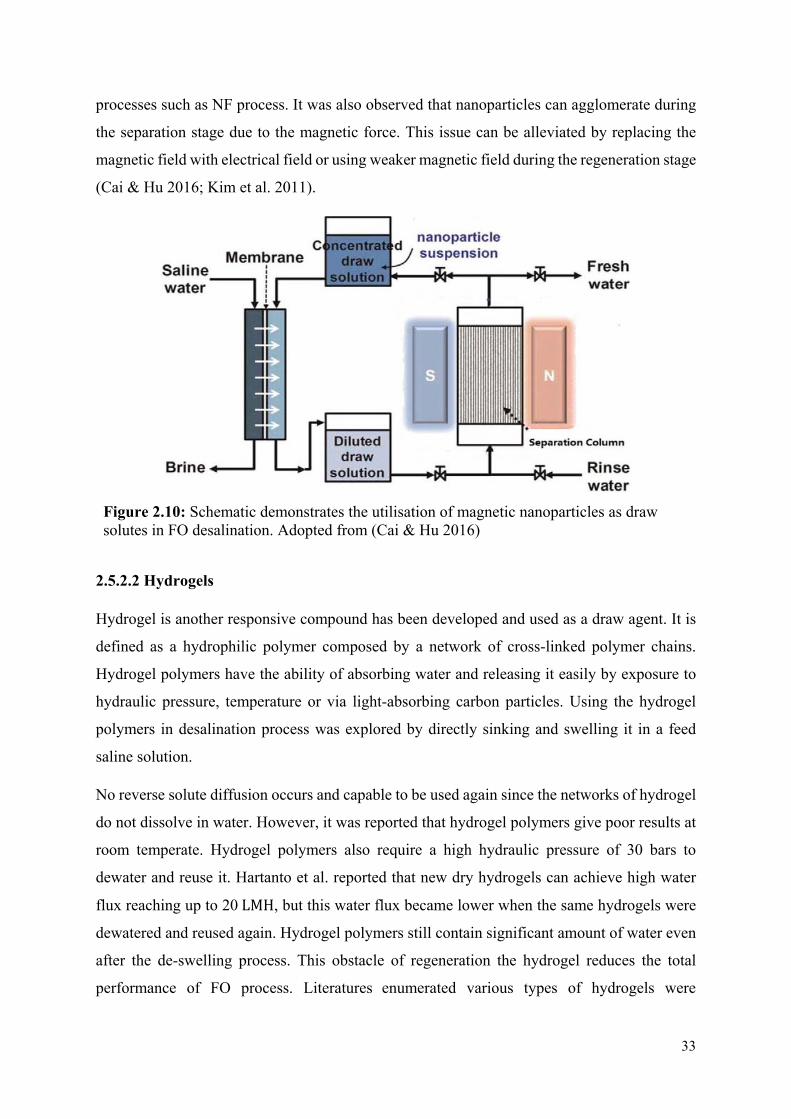
33
processes such as NF process. It was also observed that nanoparticles can agglomerate during
the separation stage due to the magnetic force. This issue can be alleviated by replacing the
magnetic field with electrical field or using weaker magnetic field during the regeneration stage
(Cai & Hu 2016; Kim et al. 2011).
Figure 2.10: Schematic demonstrates the utilisation of magnetic nanoparticles as draw solutes in FO desalination. Adopted from (Cai & Hu 2016)
2.5.2.2 Hydrogels
Hydrogel is another responsive compound has been developed and used as a draw agent. It is
defined as a hydrophilic polymer composed by a network of cross-linked polymer chains.
Hydrogel polymers have the ability of absorbing water and releasing it easily by exposure to
hydraulic pressure, temperature or via light-absorbing carbon particles. Using the hydrogel
polymers in desalination process was explored by directly sinking and swelling it in a feed
saline solution.
No reverse solute diffusion occurs and capable to be used again since the networks of hydrogel
do not dissolve in water. However, it was reported that hydrogel polymers give poor results at
room temperate. Hydrogel polymers also require a high hydraulic pressure of 30 bars to
dewater and reuse it. Hartanto et al. reported that new dry hydrogels can achieve high water
flux reaching up to 20LMH, but this water flux became lower when the same hydrogels were
dewatered and reused again. Hydrogel polymers still contain significant amount of water even
after the de-swelling process. This obstacle of regeneration the hydrogel reduces the total
performance of FO process. Literatures enumerated various types of hydrogels were

34
investigated as draw agents such as thermally responsive PNIPAm hydrogels, cross-linked
PSA polyelectrolyte, thermally responsive polyionic liquids, and semi-interpenetrating
network hydrogels (Cai & Hu 2016; Ge et al. 2013).
2.5.2.3 Volatile Compounds or Soluble-Gases
Draw Solutions with a proper osmotic pressure can be prepared by dissolving soluble-gases in
water. Since 1960s, group of soluble gases have been proposed by early studies to be used as
a Draw Solution for FO desalination process. A mixture of two highly soluble gases carbon
dioxide CO and ammonia NH were involved by Neff (1964) in preparing a promising Draw
Solution for FO desalination. The concentrated Draw Solution was prepared by dissolving
ammonium bicarbonate NH HCO salt in freshwater. However, poor solubility of NH HCO
salt in water limited the osmotic pressure of the Draw Solution. Therefore; McCutchoen et al.
(2007) were able to improve the solubility by adding ammonium hydroxide NH OH to
NH HCO salt. The new Draw Solution with much high osmotic pressure due to improvement
of the solubility became a very good agent for FO desalination process, see Fig 2.10. The
laboratory results of water flux, reverse solute diffusion and salt rejection were given to
evaluate the efficiency of NH OH+NH HCO as a Draw Solution. These results demonstrate a
high reverse solute diffusion and membrane scale formation can be attributed to the alkalinity
of the Draw Solution where the carbonate ions are existed. Controlling the stability of the
soluble-gas NH HCO Draw Solution concentration after the regeneration was an obstacle
because of the undesirable water evaporation. Moreover, removing the residue of high soluble
ammonia from the final water product is still a drawback of using NH CO draw agent
system to produce a drinking water via FO application (Cai & Hu 2016; Ge et al. 2013).
Recently in 2015, Boo et al. (2015) proposed thermolytic trimethylamine carbon
dioxide TMA CO as a Draw Solution and compared the experimental results with the
NH CO Draw Solution system. The reverse solute diffusion of TMA CO was lower
thanNH CO . However, water flux produced by TMA CO was not improved because
TMA CO was affected by CP more than NH CO due to its lower diffusivity (Boo et al.
2015).
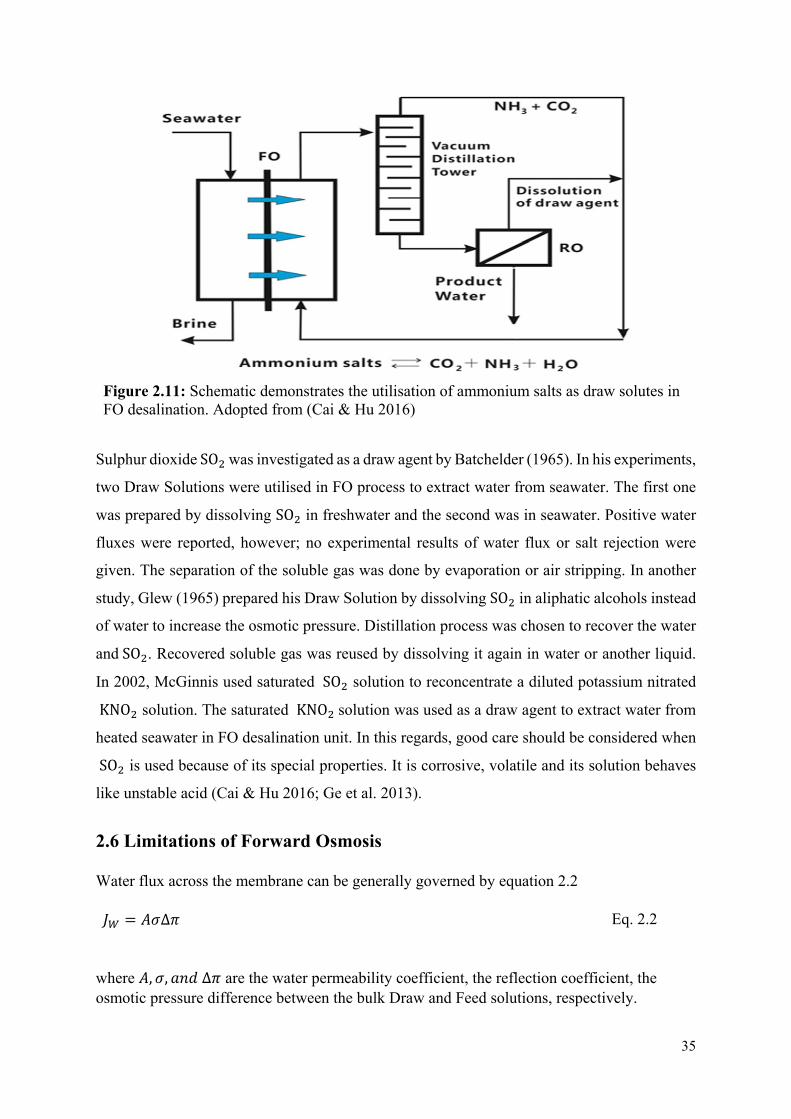
35
Figure 2.11: Schematic demonstrates the utilisation of ammonium salts as draw solutes in FO desalination. Adopted from (Cai & Hu 2016)
Sulphur dioxide SO was investigated as a draw agent by Batchelder (1965). In his experiments,
two Draw Solutions were utilised in FO process to extract water from seawater. The first one
was prepared by dissolving SO in freshwater and the second was in seawater. Positive water
fluxes were reported, however; no experimental results of water flux or salt rejection were
given. The separation of the soluble gas was done by evaporation or air stripping. In another
study, Glew (1965) prepared his Draw Solution by dissolving SO in aliphatic alcohols instead
of water to increase the osmotic pressure. Distillation process was chosen to recover the water
andSO . Recovered soluble gas was reused by dissolving it again in water or another liquid.
In 2002, McGinnis used saturated SO solution to reconcentrate a diluted potassium nitrated
KNO solution. The saturated KNO solution was used as a draw agent to extract water from
heated seawater in FO desalination unit. In this regards, good care should be considered when
SO is used because of its special properties. It is corrosive, volatile and its solution behaves
like unstable acid (Cai & Hu 2016; Ge et al. 2013).
2.6 Limitations of Forward Osmosis
Water flux across the membrane can be generally governed by equation 2.2
∆ Eq. 2.2
where , , ∆ are the water permeability coefficient, the reflection coefficient, the osmotic pressure difference between the bulk Draw and Feed solutions, respectively.

36
The results of effective water flux which come from the laboratory show lower values than the
theoretical value comes from equation 2.2 (Mattia Stefani 2014). This declination of water flux
can be attributed to various phenomena occurred during the FO process such as CP, reverse
solute diffusion, and membrane fouling. These phenomena consequently limit the efficacy of
the utilisation of FO technology at a large scale. The effect of these phenomena varies
according to several factors including changing temperature of solutions, concentration and
type of the Draw Solution, membrane structure, and membrane orientation (Akther et al. 2015).
Fig 2.11 illustrates the concentration polarisation types in both pressure driven and osmotically
driven membrane processes. Each phenomenon is described more below.
Figure 2.12: Concentration polarisation types in both pressure driven and osmotically driven membrane processes.
2.6.1 Concentration Polarisation CP
Concentration polarisation (CP) is a phenomenon which can hit both types of membrane
separation processes whether governed by hydraulic pressure or osmotic pressure. It is
classified as an External Concentration Polarisation (ECP) and Internal Concentration
Polarisation (ICP). ECP occurs on the membrane surface meanwhile ICP occurs inside the
porous layer. ECP affects both FO osmotic pressure driven and hydraulic pressure driven
membrane processes. However, ICP only affects FO process significantly causing the main
reason of reducing the water flux (Zhao et al. 2012; Mattia Stefani 2014).
CP
ECP
Concentrative ECP
Pressure driven processes e.g.
RO , NF
FO process, FO mode
Dilutive ECP
FO process, PRO mode
ICP
Concentrative ICP
FO process, PRO mode
Dilutive ICP
FO process, FO mode
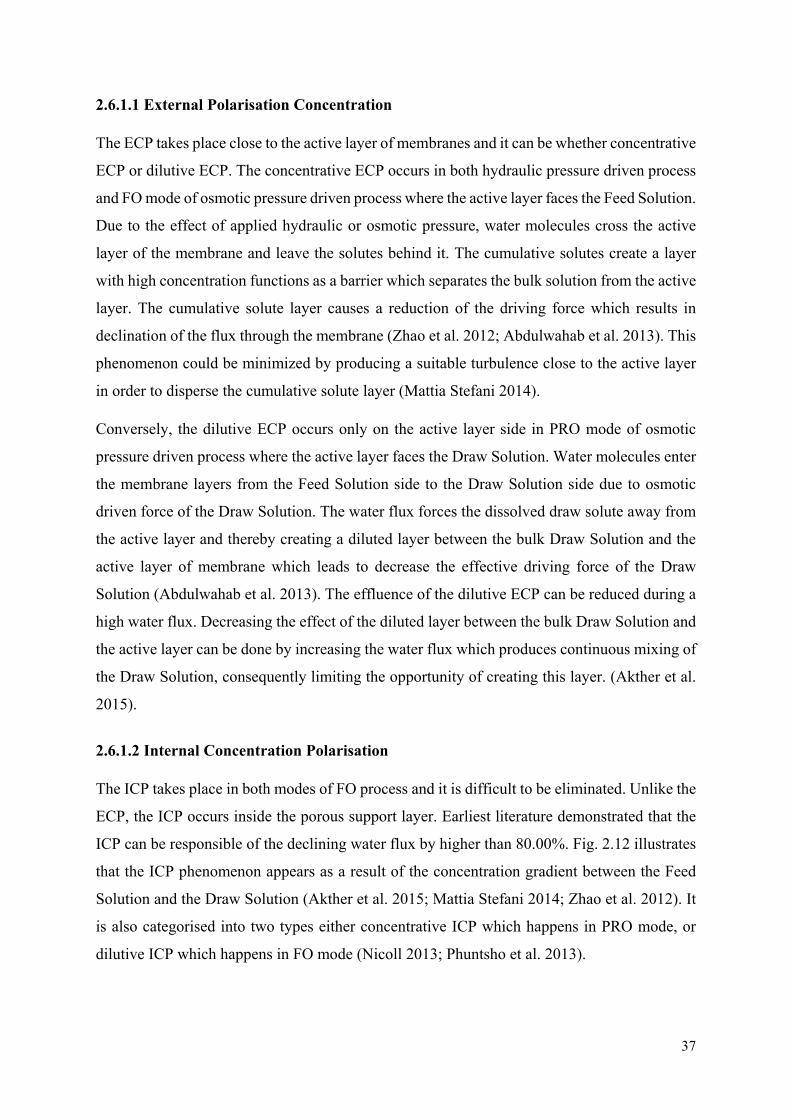
37
2.6.1.1 External Polarisation Concentration
The ECP takes place close to the active layer of membranes and it can be whether concentrative
ECP or dilutive ECP. The concentrative ECP occurs in both hydraulic pressure driven process
and FO mode of osmotic pressure driven process where the active layer faces the Feed Solution.
Due to the effect of applied hydraulic or osmotic pressure, water molecules cross the active
layer of the membrane and leave the solutes behind it. The cumulative solutes create a layer
with high concentration functions as a barrier which separates the bulk solution from the active
layer. The cumulative solute layer causes a reduction of the driving force which results in
declination of the flux through the membrane (Zhao et al. 2012; Abdulwahab et al. 2013). This
phenomenon could be minimized by producing a suitable turbulence close to the active layer
in order to disperse the cumulative solute layer (Mattia Stefani 2014).
Conversely, the dilutive ECP occurs only on the active layer side in PRO mode of osmotic
pressure driven process where the active layer faces the Draw Solution. Water molecules enter
the membrane layers from the Feed Solution side to the Draw Solution side due to osmotic
driven force of the Draw Solution. The water flux forces the dissolved draw solute away from
the active layer and thereby creating a diluted layer between the bulk Draw Solution and the
active layer of membrane which leads to decrease the effective driving force of the Draw
Solution (Abdulwahab et al. 2013). The effluence of the dilutive ECP can be reduced during a
high water flux. Decreasing the effect of the diluted layer between the bulk Draw Solution and
the active layer can be done by increasing the water flux which produces continuous mixing of
the Draw Solution, consequently limiting the opportunity of creating this layer. (Akther et al.
2015).
2.6.1.2 Internal Concentration Polarisation
The ICP takes place in both modes of FO process and it is difficult to be eliminated. Unlike the
ECP, the ICP occurs inside the porous support layer. Earliest literature demonstrated that the
ICP can be responsible of the declining water flux by higher than 80.00%. Fig. 2.12 illustrates
that the ICP phenomenon appears as a result of the concentration gradient between the Feed
Solution and the Draw Solution (Akther et al. 2015; Mattia Stefani 2014; Zhao et al. 2012). It
is also categorised into two types either concentrative ICP which happens in PRO mode, or
dilutive ICP which happens in FO mode (Nicoll 2013; Phuntsho et al. 2013).

38
In the concentrative ICP case, water passes the porous support layer and diffuses easily through
the active layer to the Draw Solution side by means of the osmotic pressure gradient. The solute
molecules in the saline Feed Solution can also pass through the open structure of the porous
layer but cannot diffuse through the active layer. The solute molecules accumulate and then
increase the solute concentration inside the porous support layer.
In the dilutive ICP case, which occurs in FO mode where the porous support layer faces the
Draw Solution, water molecules diffuse through the active layer and reach to support layer due
to the driving force of the Draw Solution. The permeate will dilute the Draw Solution which
occupies the open structure of the porous layer and decrease the diving force. A severe dilutive
ICP occurs when solutes with large molecular weight is used. Literatures state that the ICP in
FO mode is more severe than PRO mode, consequently reduces the effective driving force
(Abdulwahab et al. 2013; Alsvik & Hägg 2013; Nicoll 2013; Phuntsho et al. 2013). This is
clearly illustrated in Fig 2.12 where the effective osmotic pressure in case of FO mode is less
than that of PRO mode.
Figure 2.13: Driving force and internal concentration polarisation of FO mode ( left) and PRO Mode (right), adopted from (P. Nicoll, 2013)
39
2.6.2 Reverse Draw Solute Diffusion
Reducing the concentration difference between the Draw and the Feed Solutions occurs due to
the dilution of the Draw Solution and also due to increasing the Feed Solution concentration.
The increase in the Feed Solution concentration occurs by the reverse diffusion of draw solutes.
In FO process, solutes diffuse reversely through the membrane from the Draw Solution side
with high solute concentration to the Feed Solution side with low solute concentration. The
reverse solute diffusion is governed by Fick’s Law:
∆ Eq. 2.6
where, and ∆ are the solute permeability coefficient and the solute concentration difference,
respectively (Nicoll 2013; Mattia Stefani 2014)
The reverse draw solute diffusion is considered an inevitable challenge which causes a
limitation in the efficiency of FO process. A new term named specific reverse solute flux
has provided by Hancock and Cath (2009). This term expresses the ratio between the
forward water flux to the reverse draw solute flux across the semi permeable membrane. It is
used to evaluate the selectivity of FO membrane which is needed to understand the solute
transport between the membrane layers. Philip et al. (2010) illustrated that specific reverse
solute flux is not affected by the porous support layer structure and the concentration of the
Draw Solution. It is only affected by the selectivity feature of the thin active layer. Therefore,
manufacturing a promising FO membrane with high selectivity active layer is needed to
minimize the reverse solute diffusion. The hydration radius and the ions charge can also play
a role in reducing the reverse solute diffusion. It has been observed that cations with divalent
such asCa , Mg and Ba have less reverse diffusion rate than the monovalent ions.
However, multivalent ions could cause high ICP (Akther et al. 2015; Phillip et al. 2010; Zhang
et al. 2017).
Many studies have been conducted to investigate the effect of membrane orientation on reverse
solute diffusion. It shows that the reverse solute diffusion in FO mode is lower than of PRO
mode. The studies also illustrate that the reverse solute diffusion increases proportionally by
the increasing of the Draw Solution concentration in both modes (Mattia Stefani 2014; Akther
et al. 2015; Zhao et al. 2012).

40
The reverse solute diffusion phenomenon has negative impacts on environment. For example,
the reverse diffusion of Draw Solutions containing nitrogen such as NH CO could cause
contamination of the Feed Solution and consequently forming eutrophication. In this case, post
treatment processes and high energy are needed to treat the Feed Solution. The reverse solute
diffusion phenomenon can be reduced by taking three approaches into consideration; seeking
a competent draw solution, improving the selectivity of FO membranes, and choosing optimal
operation parameters (Cai & Hu 2016).
2.6.3 Membrane Fouling
Membrane fouling is another limitation which occurs in both type of membrane separation
processes including pressure driven processes and FO process. Membrane fouling causes a
performance declination of aforementioned processes. In pressure driven membrane process,
the fouling is formed on the surface facing the applied hydraulic pressure. In FO process it
happens on or inside the open structure of the porous support layer when PRO mode is used,
and on the active layer surface when the FO mode is used. Fouling can be categorised into
organic fouling, inorganic fouling (scaling), biofouling, and colloidal fouling (Mattia Stefani
2014; Alsvik & Hägg 2013; Zhang et al. 2017). Number of studies have been conducted by
Cornelissen et al., Lee et al., Holloway et al., Thompson and Nicoll to compare between the
fouling under the FO process and pressure driven process (Nicoll 2013). It was concluded that
the fouling in case of FO process has smaller impacts than pressure driven which grants it the
merit of low maintenance and consequently longer membrane life. In driven pressure
membrane process the fouling layer on membrane surface is irreversible and compacted due to
the high applied hydraulic pressure. While, in FO process which operated without external
hydraulic pressure, the fouling layer is loose and reversible (Zhao et al. 2012; Nicoll 2013), see
Fig 2.13.

41
Figure 2.14: Fouling membrane mechanisms in osmotically driven and pressure driven processes, adopted from (Alsvik & Hägg 2013).
The loose fouling deposition on the active layer of FO membranes can impede the reverse
diffused draw solute ions and held it. Impeding the draw solutes leads to increase the local
osmotic pressure of the strip which is close to the membrane surface consequently increase the
negative effects of the ECP. This phenomenon is known as a Cake Enhanced Concentration
Polarisation (CECP) and reduces the net driving force which adversely affects the performance
of FO process. Solutes with high reverse solute diffusion can easily cause the CECP which is
more than the solutes with low reverse solute diffusion. This investigation stated by Lee et al.
(2010) during their study using NaCl as a small hydrated radius solute with high reverse solute
diffusion, and dextrose as a larger hydrated radius solute with low reverse solute diffusion. The
conclusion of Lee et al. study besides of many studies also show that the type of a Draw
Solution has strong effect on forming the fouling during FO process (Zhao et al. 2012; Mattia
Stefani 2014; Lee et al. 2010).
The majority of FO membrane can be cleaned readily from inorganic and organic fouling by
low pressure backwash flush and no need to use chemicals (Akther et al. 2015). Achilli et al.
(2009) reported in their study of treating domestic wastewater using submerged OMBR, that
approximately 90.00% of the initial water flux value was recovered by backwashing flush
process (Zhao et al. 2012; Achilli et al. 2009). On the contrary, this physical cleaning does not
work efficiently in case of biofouling formation. The chemical cleaning process becomes
necessary to remove foulants and sticky substance produced by the bacteria which is strongly
agglutinated on the membrane surface (Akther et al. 2015). Main factors including the nature
42
of the draw solute, appropriate material choices, and membrane surface modification should be
taken into considerations to avoid the fouling (Mattia Stefani 2014).
2.7 Summary
FO is an emerging technology with good potential in water and wastewater treatment as well
as separation and purification of the valuable components from the industrial downstream. The
advantages of FO membrane process make it favourable compared to other separation
processes such as driven pressure membrane processes, crystallization and ion exchange. It is
more energy efficient, and easy to operate, less prone to membrane fouling, and works at
ambient temperature. The concept of FO process is placing a semi-permeable membrane
between Feed Solution and Draw Solution with high osmotic pressure. Water is driven to the
Draw Solution side due to the osmotic pressure gradient between both solutions. The efficiency
of FO performance depends on both Draw Solution and composition of the membrane.
Developing the composition of FO membranes and finding an efficient Draw Solution are
essentials to overcome the inherent limitations occur during the FO process such as
concentration polarisation, reverse solute diffusion and membrane fouling. On the one hand,
the important criteria to be considered in development of the FO membrane composition are
the ability of achieving high water flux by reducing the membrane thickness, meanwhile;
improvement the selectivity of the active layer to reduce the reverse solute diffusion. Interfacial
Polymerization as an advanced technique has been used to manufacture the thin selective layer
of the FO polymeric membranes. Furthermore, recent studies have been conducted to
incorporate the aquaporin protein water channels in the manufacturing of FO membranes to
enhance the water flux. On the other hand, the viability of utilising FO technology does also
depends on the type of the Draw Solution. A competent Draw Solution with high osmotic
pressure and proper characteristics can improve the performance of FO, meanwhile; save
money regarding its regeneration process. The lack of the competent Draw Solution limits the
utilisation of FO technology in large scale applications. Several types of responsive draw
solutes and non-responsive draw solutes have been investigated either in laboratory scale or
industry. However, finding the optimal Draw Solution is still searchable issue. This valorises
the current study at hand which is intended to contribute to the knowledge pertaining to the
appropriateness of organic cationic solutions to be draw agents and use them to recover water
from industrial fermentation Feed Solution.

43
CHAPTER 3
Materials and Methods 3.1 Experimental Plan
The experiments were planned so as to obtain the optimum operating conditions of both FO
and reconcentration systems and utilise them for concentrating fumaric acid produced by a
fermentation process as a Feed Solution. Three main phases were conducted in sequence to
achieve the previous objective. Firstly, determination of the optimum operating conditions for
FO system. Secondly, determination of the optimum operating conditions for the
reconcentration system. Thirdly, implementation of those optimum operating conditions for
water recovery from both solutions of a synthesis fumaric acid and fumaric acid solution
produced by an industrial fermentation process.
I. Determination of the optimum operating conditions for FO system: In this section
a set of series of experiments were conducted using distilled water as a Feed Solution
to investigate the influence of various operating conditions on water flux rate and
reverse solute diffusion through FO membranes. Draw Solution type, Draw Solution
concentration, membrane type, and membrane orientation are the targeted conditions
which were tested in this phase. The following matrix clarifies that.
Operating conditions
Draw Solution type
Membrane sheet type
Membrane orientation
Draw Solution concentration
Variables L AlanineDADMAC
PolyDADMAC
CTAAquaporin protein
FO modePRO mode
0.035g/mL0.085g/mL0.120g/mL0.155g/mL
II. Determination of the optimum operating conditions for the regeneration system:
A NF system was chosen to regenerate the diluted Draw Solution produced in the FO
system. A NF90- Nanofiltration membrane with a stirred dead end filtration cell was
chosen to achieve the reconcentration.
III. Implementation of the optimum operating conditions of the FO system for water
recovery from a fumaric acid solution produced by industrial fermentation
44
process: The results obtained from the experiments conducted in phase I were used in
the extraction of water from fumaric acid produced by fermentation process and from
synthesis fumaric acid. The results of the experiments in both phase II and phase III
produced also product streams such as clean water and concentrated fumaric acid
solution as a useful industrial product.
The experimental plan establishes that the efficiency of FO system can be determined by
comparing water flux rate, and reverse solute diffusion in each experiments under the various
operating conditions. The efficiency of NF system was also explored through comparing the
rejection ions percentage of each Draw Solution with NF90- Nanofiltration membrane.
3.2 Experimental Setup
Two separated bench-scale of FO and NF systems were set up and operated at a temperature
of (22 1 . The FO system was utilised to extract the water molecules from the Feed
Solution, which resulted in the dilution of the Draw Solution. This occurs with decreasing the
weight of Feed Solution and concurrently increasing its concentration. The NF system was
used to reconcentrate the diluted Draw Solutions via a stirred dead end filtration cell to reuse
it again in FO experiments.
3.2.1 Forward Osmosis System
The core element of the FO set up is the cross-flow membrane cell with two different sized
cavities for the Draw Solution and the Feed Solution flows. The channels were separated by
flat sheet FO membranes. Both Cavities have the same surface area with the following
dimensions of 200 mm in length and 40 mm in width. However, the depth of the Feed Solution
cavity (10 mm) is more than the depth of the Draw Solution cavity (3 mm) as it illustrated in
figure 3.1 and 3.2.
The schematic diagram of the FO setup is illustrated in figures 3.3 and 3.4. The diagram also
includes auxiliary components, namely two pre-calibrated peristaltic pumps (Masterflex L/S,
Model 77201-60, Korai) were used to pump the Draw Solution in counter clockwise loop and
the Feed Solution in clockwise loop across the two channels of the membrane cell. The flow
of both Draw Solution and Feed Solution was pumped by the same flow rate 1 L/min (60 L/hr)
and the Feed Solution was mixed continuously using magnetic stirrer. The increase in the
weight of the Draw Solution was recorded by an electronic balance (Radwag Model PS

45
4500/C/2, Poland), and these measurements were used to calculate the water flux. A
conductivity meter was linked to the Feed Solution tank to determine the electrical conductivity
to calculate the reverse diffusion of the solute.
Figure 3.1: Channels of FO cell in details Figure 3.2: FO cell
Figure 3.3: Schematic diagram of the bench-scale FO system

46
Figure 3.4: The bench-scale FO system
3.2.2 Nanofiltration System
A Stirred stainless steel dead-end cell was supplied by Memcom Pty. Ltd (Newlands,
Johannesburg, South Africa) and was utilised for reconcentration of the diluted Draw
Solutions. As shown in figures 3.5 and 3.6, the stirred dead-end cell consists of three main
parts; bottom plate with sintered stainless steel plate, cylindrical container with magnetic stirrer
bar, and top plate with pressure gauge. The Stirred dead-end cell was connected to a pressurized
nitrogen gas cylinder acted as an applied pressure source.
Figure 3.5: Schematic diagram of reconcentration system

47
Figure 3.6: Stirred stainless steel dead-end cell
During the experiments, the pressure was adjusted every two hours to keep the pressure
difference between external applied pressure and osmotic pressure of the Draw Solution
constant as illustrated is table 3.1
Table 3.1: Initial and increasing rate of applied pressure per two hours.
Draw Solution Initial concentration, Initial
osmotic pressure
Initial applied
pressure
Constant increase
per 2 hr
L-Alanine 0.035 g/mL, 11.0 atm 14.80 atm 3.80 atm
DADMAC 0.035 g/mL, 11.0 atm 14.80 atm 3.80 atm
PolyDADMAC 0.035 g/mL, 3.58 atm 06.91 atm 3.33 atm
3.3 Experimental Protocols
3.3.1 Experimental Protocols for FO Experiments Represented by the Following Steps
1- Preparation and Assembly of the Cell
I. Feed spacer was inserted into the cavity of cell bottom. The feed spacer as required
to be flat and fitted the area of cavity. Note: the cell bottom is the part of cell body
which has four holes.

48
II. Wetted O-rings were inserted into the grooves on the cell bottom and cell top to
avoid the leakage.
III. Pre-cut membrane sheet was placed over the cavity using the four holes to put the
sheet in right position.
IV. Two parts of the cell body were combined by fitting the alignment pins in the cell
top snugly into the alignment holes in the cell bottom.
V. Solid plate was placed onto the cell top and the assembly of the membrane cell
was completed by combining the bolts and nuts tightly.
2- Operation of the System
I. Feed and draw tanks were filled with 2 L solutions.
II. Two pumps and pipes were connected with the membrane cell as shown in
schematic Fig 3.3. Cross flow rates of the Draw Solution and the Feed Solution
were 1 L/min (60 L/hr).
III. Firstly, the Feed Solution was pumped into the Feed Solution channel for 5 min
without pumping the Draw Solution to remove the air babbles.
IV. After 5 min, the Draw Solution was pumped into the Draw Solution channel and
be directly in touch with the surface of the membrane.
The system was run for 24 hours and the changes of the weight of the Draw Solution was
recorded by the electronic balance every 2 hours except the first two hours was taken every 30
minutes. The process was stopped after 24 hours and the new volume of both Draw Solution
and Feed Solution were collected and measured. Changing of the osmotic pressure of the both
solutions occurred as a result of transmission water molecules across the membrane sheet.
The aforementioned procedures were repeated using new variables according to the matrix in
section 3.1 of this chapter till obtaining the optimum operating conditions.
3.3.2 Experimental Protocols for Reconcentration Experiments Using Nanofiltration System Represented by the Following Steps
1- Preparation and Assembly of the Stirred Dead-End Cell
I. Pre-cut membrane sheet was rinsed by distilled water to remove the preservative
materials.
II. Membrane sheet was fitted on the top of the sintered stainless plate which occupies
the cavity of bottom plate.

49
III. Wetted O-rings were inserted into the groove in bottom and top plates to avoid the
solution leakage and releasing of pressurized gas.
IV. Cylindrical container with magnetic stirrer bar and top plate were combined the
bottom plate by locking bolts and nuts tightly.
V. Pressurized nitrogen gas cylinder was connected to pressure gauge at the top plate.
2- Operation of the System
I. The cylindrical container was filled with 1 L of the Draw Solution at 0.035 g/mL and
then the blind plug was closed tightly.
II. The stirred dead- end cell was placed on a magnetic stirrer and speed increased slowly
from zero to 450 rpm.
III. Nitrogen gas was pressurized gently through the pressure gauge to reach the required
pressure and then it was adjusted every two hrs according to table 3.1.
IV. Permeate volume was measured by electronic scale, whereas its osmotic pressure was
measured by Osmomat 030 device.
V. Osmotic pressure of the concentrate Draw Solution inside the cylindrical container was
calculated by the mass equation.
VI. The experiments were stopped when the concentration of the Draw Solution inside the
cylindrical container raised to 0.085 g/mL.
VII. After the experiments was run completely, pressurized nitrogen gas gauge was closed
and the cell was depressurized by opening the blind plug till the pressure gauge
indicates 0.
VIII. The reconcentrated Draw Solution was collected and then the cell was prepared for a
new experiment.
3.4 Characterisation of Membranes
3.4.1 FO Membranes
FO membranes used in the experiments are of two types, namely CTA-FO flat sheet membrane
and TFC aquaporin flat sheet membrane:
CTA-FO, supplied by Hydration Technology Innovation (Albany, Oregon, USA), is an
anisotropic membrane with thickness less than 50μm. The structure of the membrane
consists of CTA active layer casted over embedded polyester mesh layer forming a two-

50
layer membrane. Unlike the RO membranes structure which have thick porous support
layer, the usage of the mesh layer is intended to reduce the thickness of the support
layer
TFC aquaporin insideTM membrane, supplied by Sterlitech Corporation (Kent,
Washington, USA), is a thin film composite membrane with thickness
equals110μm 15μm . It consists of thin dense polyamide active layer comprising
aquaporin water channels deposited on porous PES support layer.
3.4.2 Nanofiltration Membrane
NF90 flat sheet Nanofiltration membrane, supplied by Dow FilmTec, USA, was chosen to
reconcentrate the diluted Draw Solutions. NF90 membrane is a commercial and industrial TFC
polyamide membrane with high chemical stability and durability. It is described by the
manufacturer as a low net driving pressure membrane which allows it to operate effectively
under low pressure and low energy. The maximum operating pressure and the maximum
operating temperature are 41bar 45 , respectively.
Table 3.2: Characteristics of NF90 Nanofiltration membrane.
Membrane Flux
LMH/bar
Rejection
%
MWCO
Daltons
pH
range
Pore size
nm
Surface
charge
NF90 78.2-102/8.96 99.00% MgSO ~200-400 2-11 0.73/0.68 Negative
3.5 Characterisation of Draw and Feed Solutions
3.5.1 Draw Solution
L-Alanine, DADMAC, and PolyDADMAC were purchased from Sigma-Aldrich Pty. Ltd,
(Kempton Park, Johannesburg, South Africa). They were used to prepare the Draw Solutions
of FO process. DADMAC and PolyDADMAC stock solutions were diluted by using distilled
water to prepare 4 diluted Draw Solutions from each one at concentrations 0.035, 0.085, 0.120
and 0.155 g/mL. In the case of the L-Alanine, the solubility limit of L-Alanine is approximately
0.120 g/mL at the operation temperature. Therefore, only three Draw Solutions at 0.035, 0.085,
and 0.120 g/mL concentrations were prepared. This will be detailed in section 3.6.1 of this
chapter.

51
Table 3.3: Characteristics of the three Draw Solutions used in the research.
Common
Name
Appearance Formula MW
(g/mol)
Stock solution
Concentration
Chemical
Structure
A-Alanine
Powder
C H NO
89.09
98 %
Purity (TLC)
DADMAC Liquid C H Cl N 161.67 65 wt. % in
H O
Poly-
DADMAC
Liquid
C H Cl N
100,000
35 wt. % in
H O
3.5.2 Feed Solution
Three Feed Solutions were investigated for the purpose of this dissertation: distilled water,
synthesis fumaric acid, and fumaric acid produced by fermentation process. Firstly, distilled
water was used in entire of the experiments during phase I, where the optical operation
conditions for FO system were determined. Secondly, synthesis fumaric acid C H O was
purchased from Merck Pty. Ltd, (Merck Schuchardt OHG, Germany) and was used to prepare
solution with concentration of 5 g/L. Synthesis fumaric acid solution was explored as a Feed
Solution to investigate the efficiency of both CTA and TFC aquaporin protein membranes in
rejection the molecules of fumaric acid. Thirdly, fumaric acid produced by fermentation
process.
Fumaric acid was produced by microbial fermentation process using Rhizopus oryzae
microorganism. It was collected as a final downstream of the current project of Bioreaction
Engineering group at University of Pretoria. Rhizopus oryzae bioconverts glucose used as a
source of carbon for producing fumaric acid. The downstream was processed through filter
paper with 2.5μmpore size (Whatman, 1442-110 Ashless, Grade 42) to produce filtrated
downstream. This downstream consists of fumaric acid as a major product besides of other

52
organic acids (succinic acid, lactic acid, citric acid, and acetic acid). Glucose, ethanol and
mineral salts were also found in the downstream as by-products.
3.6 Measurements and Analytical Methods
3.6.1 Preparation the Draw Solution
Dilution process was used to prepare the desired Draw Solution from concentrated stock
solution. The concentration of stock solutions were reduced by mixing it with distilled water
that functions as a solvent. This entailed the application of the mass equation, to calculate the
ratio between the required stock solution volume and the required amount of distilled water.
The mass equation is expressed as follows
Eq 3.1
where is the stock solution concentration (g/mL). is the required stock solution volume
(mL). is the final solution concentration (g/mL). And is the final solution volume after
the dilution (mL).
DADMAD stock solution with 65 wt.% in H O, and PolyDADMAC stock solution with 35
wt.% in H O were used to prepare 4 diluted solutions from each stock solution at concentrations
of 0.035 g/mL, 0.085 g/mL, 0.120 g/mL, and 0.155 g/mL. L-Alanine powder with ≥ 98% purity
was used to prepare 3 diluted solutions with concentrations of 0.035 g/mL, 0.085 g/mL, and
0.120 g/mL. Each diluted solution was 2000 mL.
For instance, preparation a diluted DADMAC solution with final concentration equal 0.035
g/mL from stock DADMAC solution 65 wt.% in H O was calculated according to the following
equation
65 g 100gH O X1.04g mL XV 0.035 g mL X2000mL
V mL 0.035X250.0
0.676
Then, V = 103.55 mL.

53
This means, to prepare 2000 mL of diluted DADMAC solution with concentration of 0.035
g/mL, a 103.55 mL was taken from stock solution and then a distilled water was added to the
level of 2000 mL. The same procedure was applied to calculate the required volumes of the
other concentrations. The following table summarises the required volumes to prepare 2000
mL of the Draw Solutions with various concentrations.
Table 3.4: Required volumes to prepare 2000 mL of the Draw Solutions with various concentrations Final required
concentration
g/mL
Required mass of
L-Alanine
g
Required volume of
stock DADMAC
mL
Required volume of
stock PolyDADMAC
mL
0.035 70 103.55 183.49
0.085 170 251.48 445.61
0.120 240 355.03 629.10
0.155 ---- 458.58 812.58
3.6.2 Determination of Osmotic Pressure
Freezing point depression osmometer (Osmomat 030, cryoscopic osmometer, Gonotec, Berlin,
Germany) was used to measure the osmolality of the solutions Osmol. kg .
Figure 3.7: Osmomat 030, cryoscopic osmometer
Figure 3.8: Pipette and tubes

54
A 50 μL of the Draw Solution was pipetted into 0.5 mL centrifuge tube (Eppendorf AG,
Hamburg, Germany) and ran it on the Osmometer. The readings of three samples were taken
at zero time of experiments and then every two hours successively for 24 hours. However, the
first two hours are marked by high drop in the readings. Therefore readings were taken every
30 minutes. The average of these three readings was taken to represent the osmolality. Then,
osmotic pressure was calculated by converting the osmolality measurements to osmotic
pressure in atm using the following equation
Eq 3.2
where OP is the osmotic pressure inatm. = 24.22kg. atm.mol at22 . And
is the osmolality in moles. kg
The instrument was calibrated with distilled water and NaCl calibration solution of 1000
mosmol.Kg .
3.6.3 Determination of Draw Solution Viscosity
Dynamic viscosity of the Draw Solutions was measured by Anton Paar MCR301 rheometer
attached with Rheoplus 3.0X software, as illustrated in figure 3.9.
Figure 3.9: Anton Paar MCR301 rheometer

55
An enough amount of the Draw Solution was settled on the instrument base and then 50 mm
parallel plate spindle descended toward the sample to push excess amount away. The sample
would occupy the gab setting between parallel plate and the base. The gap was set up at 1 mm.
Shear rate was applied on the sample and increased from 0.1 S to 100 S on logarithmic
scale. The dynamic viscosity results were measured by Rheoplus 3.0X software. The rotational
shear movement of the spindle depends on air bearing instead of mechanical bearing. This
mechanism functions as an agent in the reduction of friction and therefore enhancing the
instrument sensitivity during viscoelastic measurements (Ramjee 2015).
3.6.4 Determination of Water Flux
Water flux through the effective membrane area of 0.008 m was calculated from the
observation of the Draw Solution weight change. The balance reading was taken at zero time
of experiments and then every two hours successively for 24 hours; except the first two hours
the readings were taken every 30 minutes. Water flux was calculated by the following formula
every two hours. (This formula assumes only the water flux)
Eq 3.3
where is the water flux on the top of every two hours, L/m . hr
is the change of the Draw Solution weight between every two hours, g
is the water density, g/L
is the effective membrane area, m . And is the change of time, hour.
3.6.5 Determination of Ion Rejection by Nanofiltration Membrane
A certain percentage of solute molecules passed easily the membrane during the Draw Solution
reconcentration due to the effect of external applied pressure, meanwhile other molecules were
rejected. The dead-end stirred cell, which was used to reconcentrate the diluted Draw Solutions,
works as a batch system. The ion rejection percentage by the dead-end stirred cell is defined as
the reduction percentage of solute concentration in permeate at any time related to the initial
solute concentration of the diluted Draw Solution and it is expressed as follows

56
1 100 Eq 3.4
where is the solute concentration in cumulative permeate, g/mL. And is the initial solute
concentration of the diluted Draw Solution, g/mL
The samples of the cumulative permeate were collected every 2 hours to measure the
osmolality of permeate by OSMOMAT unit. Thus, the solute concentration in concentrate at
any time was calculated by mass balance equation as follows
Eq 3.5
where & are the initial volume of the diluted Draw Solution (was 1 L), and the volume of cumulative permeate at any time, respectively.
& are the initial solute concentration of the diluted Draw Solution (was 0.035g/mL), and
the solute concentration in cumulative permeate at any time,mg/L, respectively.
The experiment was run till the concentration of concentrate inside the cell reached the desirable concentration, which was 0.085g/mL.
3.6.6 Determination of Reverse Solute Diffusion
Reverse Solute Diffusion of the Draw Solutions across the membrane into the Feed Solution
side was calculated by measuring the Total Dissolved Solids (TDS) inside the Feed Solution.
TDS was taken at zero time of experiments and then every two hours successively for 24 hours;
except the first two hours the readings were taken every 30 minutes. The following formula
was used to calculate the RSD
1000
Eq 3.6
where; is the reverse Solute Diffusion, g/m . hr
& are the initial TDS,mg/L, and the volume of Feed Solution, L, respectively
& are the TDS,mg/L, and the volume of Feed Solution at time t, respectively
is the effective membrane area, m . And is the time, hours.
57
The TDS was measured by using handheld conductivity meter (FG3-FIVEGO, METTLER
TOLEDO) connected with LE703 robust conductivity probe. The TSD measuring range of this
probe is 0.1 mg/L to 199.9 g/L.
3.6.7 HPLC Analysis
Samples from the Draw Solution and the Feed Solution tanks were collected after each
experiment of phase III and analysed by the Agilent 1260 Infinity HPLC with refractive index
RI detector (Agilent Technologies, USA). The amount of fumaric acid, glucose, succinic acid,
lactic acid, ethanol and others, see the appendix, were separated and determined in a single
injection by Aminex HPX-87H column (Bio-Rad Laboratories, USA). A 0.3 mL LH SO⁄
aqueous solution was utilised as mobile phase with flow rate started at 0.2 mL min⁄ increased
in gradual increments to 0.6mL min⁄ at a column temperature of60 .

58
CHAPTER 4
Forward Osmosis Performance Evaluation
The chapter summarizes the findings of the experiments conducted to evaluate the performance
of the FO system. The chapter is presented under three main themes i.e., findings and
discussions of FO system, findings and discussions of reconcentration system, and findings
and discussions of the potential application.
Under the first theme results from the preliminary studies on the Draw Solution characteristics
are reported. The change over time, the effect of osmotic pressure, membrane orientation, and
flow direction parameters on water flux and reverse solute diffusion were evaluated. Secondly,
findings on NF reconcentration system are also discussed. The third theme, a specific
investigation of the viability of utilisation the FO process to recover water from both solutions
of synthesis fumaric acid and fumaric acid produced by fermentation process was conducted.
4.1 The FO System
4.1.1 Preliminary Study on Draw Solutions Characteristics
Preliminary studies on the Draw Solutions characteristics were conducted before the bench-
scale FO system was setup and FO experiments was started. Two characteristics including
osmotic pressure and viscosity for each concentration were investigated. Knowing these
characteristics assists in the performance exploration of the Draw Solutions and their influence
on water flux and reverse solute diffusion studies.
Preparation of the Draw Solutions and determination of osmotic pressure were carried out
according to methods described in chapter three, section 3.6.1 and 3.6.2. The osmotic pressure
gradient versus concentrations of the three Draw Solutions L-Alanine, DADMAC, and
PolyDADMAC are illustrated in Figure 4.1. It shows that the osmotic pressure of the three
Draw Solutions increased linearly with increasing the Draw Solution concentration. Osmotic
pressure values of L-Alanine and DADMAC were almost the same and higher than the osmotic
pressure of PolyDADMAC.

59
Figure 4.1: Osmotic pressure of L-Alanine, DADMAC, and PolyDADMAC solutions.
The dynamic viscosity results were measured by the Rheoplus 3.0X software as explained in
chapter three, section 3.6.3. Figure 4.2 shows the dynamic viscosity versus the concentrations
of the three Draw Solutions. The y-axis starts with 9.8 10 Pa. s which indicates at the
dynamic viscosity of distilled water.
Figure 4.2 demonstrates that the dynamic viscosity of both L-Alanine and DADMAC with
different concentrations are quite similar and close to the dynamic viscosity of distilled water.
For example, the dynamic viscosity values of L-Alanine and DADMAC at 0.035 g/mL are
10.04 10 Pa. s and9.19 10 Pa. s, respectively. The dynamic viscosity increased
slightly by increasing the concentration of the Draw Solution. However, the dynamic viscosity
of PolyDADMAC increased significantly from 20.74 10 Pa. s to 72.15 10 Pa. s
with increasing the concentration of the Draw Solution from 0.035 g/mL to 0.155 g/mL. L-
Alanine and DADMAC Draw Solutions with Low dynamic viscosity gave better performance
than the high dynamic viscosity PolyDADMAC Draw Solution.
y = 315.31xR² = 0.9927
y = 319.85xR² = 0.9935
y = 102.65xR² = 0.9908
0
10
20
30
40
50
60
0 0.035 0.07 0.105 0.14 0.175
Osm
otic
pre
ssur
e, a
tm
Concentration, g/mL
L-Alanine DADMAC PolyDADMAC

60
Figure 4.2: Dynamic viscosity of L-Alanine, DADMAC, and PolyDADMAC solutions
4.1.2 Water Flux and Reverse Solute Diffusion Studies
This section reports on the effect of varying osmotic pressure, flow direction, and membrane
orientation on the flux output and reverse solute diffusion through CTA and TFC aquaporin
protein membranes. The time of operation for each experiment was kept constant at 24 hr for
each experiment. Distilled water was used as the Feed Solution for these experiments.
4.1.2.1 Variation of Water Flux and Reverse Solute Diffusion over Operation Time
In order to identify the values of water flux and reverse solute diffusion a series of experiments
were conducted. On the one hand, CTA and TFC aquaporin protein membranes were used
under FO mode during the set up experiments of water flux identification. Distilled water as a
Feed Solution was pumped first into the membrane cell with flow rate 1 L/min (60 L/hr) and
then the Draw Solution was pumped with same rate. The following figures were plotted by
using water flux calculations based on the change in the Draw Solution weight as it is explained
in chapter three, section 3.6.4.
Figure 4.3 represents the water flux produced by L-Alanine, DADAMAC, and PolyDADMAC
with different concentrations of each one using the CTA flat sheet membrane. While figure 4.4
represents the water flux of same components and under similar conditions using the TFC
aquaporin protein flat sheet membrane. Figures 4.3 and 4.4 show similar water flux behaviour
of the three Draw Solutions with different concentrations through both CTA and TFC
8.9
18.9
28.9
38.9
48.9
58.9
68.9
78.9
0 0.035 0.07 0.105 0.14 0.175
Dyn
amic
vis
cosi
ty, P
a.s
[10-4
]
Concentration, g/mL
L-Alanine DADMAC PolyDADMAC

61
aquaporin protein membrane. The water flux decreased dramatically during the first four hours
of the experiments. Afterward, the water flux decreased relatively slowly over the remaining
time of the experiment. However, in the case of using PolyDADMAC as a Draw Solution with
the TFC aquaporin protein membrane (Fig 4.4-c), the water flux decreased slightly from the
beginning of experiments to the end. Figure 4.3 also illustrates that the highest water flux was
achieved by using 0.085 g/mL L-Alanine (Fig 4.3-a) and 0.155 g/mL DADMAC (Fig 4.3-b)
through the CTA flat sheet membrane with initial water Flux 22 LMH and 20 LMH,
respectively. Water flux of 0.085 g/mL L-Alanine dropped to 9.63 LMH after four hours then
decreased slowly with time to 4.75 LMH after 24 hours.
The water flux of 0.155 g/mL DADMAC dropped to 12.69 LMH after four hours then
decreased to 4.31 LMH after 24 hours. Whereas, the lowest initial water flux occurred through
the CTA flat membrane when 0.035 g/mL PolyDADMAC was used as a Draw Solution. It fell
from 4 LMH to 0.075 LMH at the end of experiment (Fig 4.3-c). Water flux demonstrated
similar behaviour through the TFC aquaporin protein flat sheet membrane as it is illustrated in
figure 4.4. However, it was observed in the figures 4.3 and 4.4 that water flux through the CTA
flat sheet membrane were higher than water flux through the TFC aquaporin protein flat sheet
membrane. L-Alanine at concentration 0.085 g/mL (Fig 4.4-a) and DADMAC at concentration
0.155 g/mL (Fig 4.4-b) maintained the highest water flux. Water flux of L-Alanine at
concentration 0.085 g/mL started at 17 LMH as an initial value and reached to 4.50 LMH at
the end of experiment. While, water flux of DADMAC at concentration 0.155 g/mL declined
from 11.50 LMH as an initial to 3.50 LMH at the end of experiment.

62
(a)
(b)
(c)
Figure 4.3: Variation of water flux by L-Alanine, DADMAC and PolyDADMAC using CTA flat sheet membrane over the operation time
0.00
4.00
8.00
12.00
16.00
20.00
24.00
0 2 4 6 8 10 12 14 16 18 20 22 24
Wat
er F
lux,
LM
H
Time, hr
L-Alanine, 0.035 g/mL L-Alanine, 0.085 g/mL
L-Alanine, 0.120 g/mL
0.00
3.00
6.00
9.00
12.00
15.00
18.00
21.00
0 2 4 6 8 10 12 14 16 18 20 22 24
Wat
er F
lux,
LM
H
Time, hr
DADMAC, 0.035 g/mL DADMAC, 0.085 g/mL
DADMAC, 0.120 g/mL DADMAC, 0.155 g/mL
0.00
3.00
6.00
9.00
12.00
15.00
18.00
0 2 4 6 8 10 12 14 16 18 20 22 24
Wat
er F
lux,
LM
H
Time, hr
PolyDADMAC, 0.035 g/mL PolyDADMAC, 0.085 g/mL
PolyDADMAC, 0.120 g/mL PolyDADMAC, 0.155 g/mL

63
(a)
(b)
(c)
Figure 4.4: Variation of water flux by L-Alanine, DADMAC and PolyDADMAC using TFC aquaporin protein flat sheet membrane over the operation time
0.00
4.00
8.00
12.00
16.00
20.00
24.00
0 2 4 6 8 10 12 14 16 18 20 22 24
Wat
er F
lux,
LM
H
Time, hr
L-Alanine, 0.035 g/mL L-Alanine, 0.085 g/mL
L-Alanine, 0.120 g/mL
0.00
3.00
6.00
9.00
12.00
15.00
18.00
21.00
0 2 4 6 8 10 12 14 16 18 20 22 24
Wat
er F
lux,
LM
H
Time, hr
DADMAC, 0.035 g/mL DADMAC, 0.085 g/mL
DADMAC. 0.120 g/mL DADMAC, 0.155 g/mL
0.00
3.00
6.00
9.00
12.00
15.00
18.00
0 2 4 6 8 10 12 14 16 18 20 22 24
Wat
er F
lux,
LM
H
Time, hr
PolyDADMAC, 0.035 g/mL PolyDADMAC, 0.085 g/mL
PolyDADMAC, 0.120 g/mL PolyDADMAC, 0.155 g/mL

64
The features of both membranes including structure, thickness and hydrophilic nature
influenced the water flux. Both of CTA and TFC aquaporin protein are anisotropic membranes.
The support layer of the CTA is polyester mesh meanwhile the one of the TFC aquaporin
protein membrane is porous PES layer combined with water channels. The porous support layer
of CTA and TFC aquaporin protein membrane enhances water flux by allowing water
molecules to diffuse easily through it. However, the high water flux through the CTA
membrane compared with the TFC aquaporin protein membrane can be explained regarding to
the thickness and the material of the membranes. The open structure of mesh layer in the CTA
is more loose than that of the PES support layer. The thinner CTA flat sheet membrane with
thickness of about 50 μm achieved high water flux than the thicker TFC aquaporin protein flat
sheet membrane with thickness of about 110μm. The hydrophilic property of CTA material
also resulted in a high water flux.
On the other hand, figures 4.5 and 4.6 were plotted based on the measurements of the reverse
solute diffusion. The measurements were taken intensively every 30 minutes during the first
two hours, after that every two hours till the end of the experiments. The method of measuring
reverse solute diffusion is explained in chapter 3, section 3.6.6. Figure 4.5 displays the
magnitude of reverse solute diffusion of L-Alanine, DADMAC, and PolyDADMAC with
different concentrations of each one through the CTA flat sheet membrane versus operation
time. Figure 4.6 shows the magnitude of reverse solute diffusion of the same components and
the same period of time through the TFC aquaporin protein flat sheet membrane.
By studying both figures 4.5 and 4.6, it was demonstrated generally that the reverse diffusion
of all Draw Solutions through the TFC aquaporin protein membrane was less than that through
the CTA membrane. Figure 4.6 shows that the reverse solute diffusion through the TFC
aquaporin protein membrane was nearly constant from the beginning to the end of experiments
regardless of the variety in the Draw Solution concentration. Nevertheless, figure 4.5 shows
the reverse solute diffusion through the CTA membrane changed gradually with time especially
reverse diffusion of DADMAC at high concentration 0.155 g/mL (Fig 4.5-b). It was observed
that the lowest reverse solute diffusion was the reverse diffusion of 0.085 g/mL of L-Alanine
through both used membranes. It fell from 0.05 GMH to 0.00 GMH through the CTA
membrane (Fig 4.5-a) and from 0.05 GMH to 0.01 GMH through the TFC aquaporin protein
membrane (Fig 4.6-a). On the contrary, the highest reverse solute diffusion was the reverse
diffusion of DADMAC at 0.155 g/mL of through the CTA membrane (Fig 4.5-b). The
magnitude started from 16.77 GMH and reached gradually after 24 hours to 8.83 GMH.
65
The reverse diffusion of 0.155 g/mL of DADMAC through TFC aquaporin protein membrane
was nearly constant (Fig 4.6-b). It started from 7.98 GMH to 7.40 GMH at the end of
experiment. In case of using PolyDADMAC as a Draw Solution (Fig. 4.5-c), it was observed
that the reverse diffusion of PolyDADMAC increased by increasing the viscosity of the Draw
Solution. Increasing the viscosity of the Draw Solution due to concentration incline caused a
severe concentration polarization near membrane surface and then increasing in reverse solute
diffusion.

66
(a)
(b)
(c)
Figure 4.5: Reverse solute diffusion of L-Alanine, DADMAC and PolyDADMAC using CTA flat sheet membrane over the operation time
0.00
0.10
0.20
0.30
0.40
0.50
0 2 4 6 8 10 12 14 16 18 20 22 24
Rev
erse
Sol
ute
Dif
fusi
on, G
MH
Time, hr
L-Alanine, 0.035 g/mL L-Alanine, 0.085 g/mL
L-Alanine, 0.120 g/mL
0.00
4.00
8.00
12.00
16.00
20.00
24.00
0 2 4 6 8 10 12 14 16 18 20 22 24
Rev
erse
Soo
lute
Dif
fusi
on, G
MH
Time, hr
DADMAC, 0.035 g/mL DADMAC, 0.085 g/mL
DADMAC, 0.120 g/mL DADMAC, 0.155 g/mL
0.00
4.00
8.00
12.00
16.00
20.00
24.00
0 2 4 6 8 10 12 14 16 18 20 22 24
Rev
erse
Sol
ute
Dif
fusi
on, G
MH
Time, hr
PolyDADMAC, 0.035 g/mL PolyDADMAC, 0.085 g/mL
PolyDADMAC, 0.120 g/mL PolyDADMAC, 0.155 g/mL

67
(a)
(b)
(c)
Figure 4.6: Reverse solute diffusion of L-Alanine, DADMAC and PolyDADMAC using TFC aquaporin protein flat sheet membrane over the operation time
0.00
0.10
0.20
0.30
0.40
0.50
0 2 4 6 8 10 12 14 16 18 20 22 24
Rev
erse
Sol
ute
Dif
fusi
on, G
MH
Time, hr
L-Alanine , 0.035 g/mL L-Alanine , 0.085 g/mL
L-Alanine , 0.120 g/mL
0.00
4.00
8.00
12.00
16.00
20.00
24.00
0 2 4 6 8 10 12 14 16 18 20 22 24
Rev
erse
Sol
ute
Dif
fusi
on, G
MH
Time, hr
DADMAC, 0.035 g/mL DADMAD, 0.085 g/mL
DADMAC, 0.120 g/mL DADMAC, 0.155 g/mL
0.00
4.00
8.00
12.00
16.00
20.00
24.00
0 2 4 6 8 10 12 14 16 18 20 22 24
Rev
erse
Sol
ute
Dif
fusi
on, G
MH
Time, hr
PolyDADMAC, 0.035 g/mL PolyDADMAC, 0.085 g/mL
PolyDADMAC, 0.120 g/mL PolyDADMAC. 0.155 g/mL
68
4.1.2.2 The Effect of the Draw Solutions Osmotic Pressure on Water Flux
The decline of osmotic pressure of the Draw Solutions over the experiment time affected the
water flux significantly. This declination was attributed to the dilution effects in the Draw
Solutions. Water molecules cross the membranes from the Feed Solution side to the Draw
Solution side due to the driving force of the Draw Solution. Figure 4.7 shows that water flux
trends of L-Alanine, DADAMAC, and PolyDADMAC at various concentrations through the
CTA flat sheet membrane versus the changing of osmotic pressure during the experiments.
Figure 4.8 represents the water flux trends of same components versus the changing of osmotic
pressure using the TFC aquaporin protein flat sheet membrane.
These trends showed similar behaviour to the previous observation which was the change in
water flux over operation time. In case of using the CTA membrane, water flux produced by
the Draw Solutions with osmotic pressure less than 15 atm dropped dramatically within 2 hrs
after commencing the experiments while the osmotic pressure decreased faintly. However, after
the first 2 hrs the water flux declined slightly while the decrease of osmotic pressure was more
apparent. Similar behaviour of the water flux drop was observed when the TFC aquaporin
protein membrane was used as shown in figure 4.8. Besides that, Figure 4.7 illustrates that the
majority of water flux cross CTA membrane reached approximately the same level at the end
of experiments irrespective of the initial values of the water flux. For example, (Fig 4.7-a) and
(Fig 4.7-b) show that water flux was much closer to 4 LMH when L-Alanine and DADMAC
with different concentrations and different initial water flux values were used. The same was
observed when the TFC aquaporin protein membranes were used as shown in figure 4.8.
As a general rule, the magnitude of water flux depends on the osmotic pressure of the Draw
Solution. Solutions with high solute concentration should have high osmotic pressure resulting
in high water flux. However, in the course of the experiments conducted, I noticed that some
of the Draw Solutions at low concentration produced a higher water flux than the same Draw
Solutions at higher concentration. For instance, L-Alanine and DADMAC with 0.120 g/mL
achieved the lowest water flux through the CTA membrane compared to other concentrations
as shown in (Fig 4.7-a) and (Fig 4.7-b). The same was also observed through the TFC aquaporin
protein membrane when L-Alanine at the same concentration was used as a Draw Solution.
Water flux produced by L-Alanine at 0.120 g/mL concentration was lower than water flux
when 0.085 g/mL of L-Alanine was used as displayed in (Fig 4.8-a).

69
At this point I submit that the unexpected behaviour of the L-Alanine and DADMAC at 0.120
g/mL has no reference in the literatures pertaining to FO. I forward a simple explanation which
is based on the interaction between the ions of the Draw Solution and the charged FO
membrane surface. The number of ions presented in the Draw Solution at certain concentration
could have serious impacts on the FO membrane surface consequently affects the performance
of the membrane. It was observed in this research that the low water flux behaviour occurred
when L-Alanine and DADMAC with exactly concentration of 0.120 g/ml among other
concentrations were used as draw agents. In this regards, an intensive studies are recommended
to take a place in the future focusing the interaction between Draw Solutions with different
concentrations and the charged FO membrane surface.
In case of using PolyDADMAC as a Draw Solution (Fig 4.7-c), water flux produced by 0.155
g/mL concentration through the CTA membrane was lower than 0.120 g/mL. This declination
of water flux occurred due to the sharp increasing in PolyDADMAC viscosity with increasing
the concentration. High viscosity of PolyDADMAC causes severe concentration polarization
near membrane surface and causes decrease in water flux. Similar results were observed in the
literatures of Ge et al. (2013) and Tian et al. (2015) when anionic polyelectrolytes of PAA-NA
and PSS were used as a Draw Solution with high viscosity (Ge et al. 2013; Tian et al. 2015).
The performance of high viscosity polymer solutions was less than that of lower viscosity.
However, the effect of viscosity did not appear when L-Alanine and DADMAC were used with
various concentrations because of their viscosity is quite similar to water viscosity.

70
(a)
(b)
(c)
Figure 4.7: Water flux by L-Alanine, DADMAC and PolyDADMAC using CTA flat sheet membrane under osmotic pressure variable.
0.00
4.00
8.00
12.00
16.00
20.00
24.00
0.00 5.00 10.00 15.00 20.00 25.00 30.00 35.00 40.00 45.00 50.00
Wat
er F
lux,
LM
H
Osmotic Pressure of DS, atm
L-Alanine, 0.035 g/mL L-Alanine, 0.085 g/mL
L-Alanine, 0.120 g/mL
0.00
4.00
8.00
12.00
16.00
20.00
24.00
0.00 5.00 10.00 15.00 20.00 25.00 30.00 35.00 40.00 45.00 50.00
Wat
er F
lux,
LM
H
Osmotic Pressure of DS, atm
DADMAC, 0.035 g/mL DADMAC, 0.085 g/mL
DADMAC, 0.120 g/mL DADMAC, 0.155 g/mL
0.00
3.00
6.00
9.00
12.00
15.00
0.00 5.00 10.00 15.00 20.00 25.00 30.00 35.00 40.00 45.00 50.00
Wat
er F
lux,
LM
H
Osmotic Pressure of DS, atm
PolyDADMAC, 0.035 g/mL PolyDADMAC, 0.085 g/mL
PolyDADMAC, 0.120 g/mL PolyDADMAC, 0.155 g/mL

71
(a)
(b)
(c)
Figure 4.8: Water flux by L-Alanine, DADMAC and PolyDADMAC using TFC aquaporin protein flat sheet membrane under the osmotic pressure variable.
0.00
4.00
8.00
12.00
16.00
20.00
24.00
0.00 5.00 10.00 15.00 20.00 25.00 30.00 35.00 40.00 45.00 50.00
Wat
er F
lux,
LM
H
Osmotic Pressure, atm
L-Alanine , 0.035 g/mL L-Alanine , 0.085 g/mL
L-Alanine, 0.120 g/mL
0.00
4.00
8.00
12.00
16.00
20.00
24.00
5.00 10.00 15.00 20.00 25.00 30.00 35.00 40.00 45.00 50.00
Wat
er F
lux,
LM
H
Osmotic Pressure, atm
DADMAC, 0.035g/mL DADMAC, 0.085 g/mL
DADMAC, 0.120 g/mL DADMAC. 0.155 g/mL
0.00
3.00
6.00
9.00
12.00
15.00
0.00 5.00 10.00 15.00 20.00 25.00 30.00 35.00 40.00 45.00 50.00
Wat
er F
lux,
LM
H
Osmotic Pressure, atm
PolyDADMAC, 0.035 g/mL PolyDADMAC, 0.085 g/mL
PolyDADMAC, 0.120 g/mL PolyDADMAC, 0.155 g/mL

72
4.1.2.3 The Effect of Membrane Orientation on Water Flux and Reverse Solute Diffusion
The effect of changing the orientation of the CTA and TFC aquaporin protein flat sheet
membranes on water flux and reverse solute diffusion were tested. L-Alanine and DADMAC
at concentration 0.120 g/mL were used. Meanwhile distilled water was used as the Feed
Solution.
Figure 4.9 shows the comparison between water flux and reverse solute diffusion L-Alanine at
0.120 g/mL and DADMAC at 0.120 g/mL using the CTA flat sheet membrane under FO and
PRO modes. Figure 4.10 demonstrates the comparison between water flux and reverse solute
diffusion of both Draw Solutions using the TFC aquaporin protein flat sheet membrane under
both modes. As observed in figures 4.9 and 4.10, water flux through both CTA and TFC
aquaporin protein membranes under PRO mode was higher than water flux under FO mode.
The observed behaviour was expected in line with the previous results of the literatures (Ge et
al. 2012; Chen 2013; Mattia Stefani 2014; Cai & Hu 2016). The explanation of achieving
higher water flux under PRO mode is due to the asymmetric structure of membranes which
leads to increase the effect of the ICP inside the support layer under FO mode compared to
PRO mode and then decline the water flux.
In case of using the CTA membrane under PRO mode, the declination of water flux produced
by L-Alanine over the experiment time was 10.25 LMH (Fig 4.9-a). Similar magnitude of water
flux declination from the initial time to the end of the experiment was also observed when
DADMAC was used as a Draw Solution (Fig 4.9-b). In Contrast, the magnitude of the water
flux declination became less in case of using the TFC aquaporin protein membrane under PRO
mode. The declination of water flux trend through the CTA membrane under PRO mode was
sharper than that of through the TFC aquaporin protein membrane. This declination is
attributed to the membrane structure that affects the ICP of membranes. The concentration of
reverse solute diffusion inside the loose open structure of the CTA membrane support layer
would be higher than that in PES layer of the TFC aquaporin protein membrane. High
magnitude of the ICP inside the CTA membrane occurred with time which caused fast drop in
water flux. (Fig 4.10-a) illustrates that water flux of L-Alanine dropped by 6.5 LMH from the
initial time to the end of the experiment. In the same way (Fig 4.10-b) demonstrates water flux
of DADMAC dropped by 5.94 LMH.

73
The reverse solute diffusion of L-Alanine through both CTA (Fig. 4.9-a) and TFC aquaporin
protein (Fig. 4.10-a) membranes was higher in PRO mode than that in FO mode in the first 12
hours of the experiment. Thereafter, the two trends started matching each other and
demonstrating same values. In case of using DADMAC as a Draw Solution, the reverse solute
diffusion through the TFC aquaporin protein membrane in PRO mode was also higher than that
in FO mode in first 12 hours of the experiment (Fig. 4.10-b). However, reverse solute diffusion
of DADMAC through the CTA membrane manifested exact opposite behaviour (Fig. 4.9-b).
The reverse solute diffusion of DADMAC through the CTA membrane was in FO mode higher
than that in PRO mode in the first half time of the experiment. The observed results were in
line with previous results of the literatures (Ge et al. 2012; Chen 2013; Mattia Stefani 2014;
Cai & Hu 2016). The literatures demonstrate that the reverse solute diffusion in FO mode is
lower than in PRO mode. These behaviours are also attributed to the asymmetric structure of
membranes where the combination of CP and orientation impacts affect the reverse solute
diffusion.

74
(a)
(b)
Figure 4.9: Comparison between water flux and reverse solute diffusion of L-Alanine at 0.120 g/mL and DADMAC at 0.120 g/mL using CTA flat sheet membrane under FO mode and PRO mode.
0.00
0.05
0.10
0.15
0.20
0.25
0.30
0.35
0.40
0.45
0.50
0.00
4.00
8.00
12.00
16.00
20.00
24.00
0 2 4 6 8 10 12 14 16 18 20 22 24
Rev
erse
Sol
ute
Dif
fusi
on, G
MH
Wat
er F
lux,
LM
H
Time, hr
Water flux, FO ModeWater flux, PRO ModeReverse solute diffusion, FO modeReverse solute diffusion, PRO mode
0.00
2.00
4.00
6.00
8.00
10.00
12.00
14.00
0.00
4.00
8.00
12.00
16.00
20.00
24.00
0 2 4 6 8 10 12 14 16 18 20 22 24
Rev
erse
Sol
ute
Dif
fusi
on, G
MH
Wat
er F
lux,
LM
H
Time, hr
Water flux, FO ModeWater flux, PRO ModeReverse solute diffusion, FO modeReverse solute diffusion, PRO mode

75
(a)
(b)
Figure 4.10: Comparison between water flux and reverse solute diffusions of L-Alanine at 0.120 g/mL and DADMAC at 0.120 g/mL using TFC aquaporin protein flat sheet membrane under FO mode and PRO mode.
0.00
0.05
0.10
0.15
0.20
0.25
0.30
0.35
0.40
0.45
0.50
0.00
4.00
8.00
12.00
16.00
20.00
24.00
0 2 4 6 8 10 12 14 16 18 20 22 24
Rev
erse
Sol
ute
Dif
fusi
on, G
MH
Wat
er F
lux,
LM
H
Time, hr
Water Flux, FO ModeWater Flux, PRO ModeRevese solute diffusion, FO ModeReverse solute diffusion, PRO Mode
0.00
1.00
2.00
3.00
4.00
5.00
6.00
7.00
0.00
4.00
8.00
12.00
16.00
20.00
24.00
0 2 4 6 8 10 12 14 16 18 20 22 24
Rev
erse
Sol
ute
Dif
fusi
on, G
MH
Wat
er F
lux,
LM
H
Time, hr
Water Flux, FO ModeWater Flux, PRO ModeRevese solute diffusion, FO ModeReverse solute diffusion, PRO Mode

76
4.1.2.4 The Effect of Changing the Pumping Scheme of the Draw Solution and Feed Solution on Water Flux and Reverse Solute Diffusion
In the previous experiments, the Feed Solution was pumped firstly for 5 minutes into the Feed
Solution channel then the Draw Solution was pumped into the Draw Solution channel.
However, a series of experiments were intended to examine the effect of reversing the pattern
of pumping the solutions. The reversing of pumping pattern was applied to study the effect of
that on water flux and reverse solute diffusion through membranes. Hence, the Draw Solution
was pumped into its channel then by 5 minutes later the Feed Solution was pumped into its
channel. Membranes were also operated in this section under FO mode. L-Alanine at 0.085
g/mL and DADMAC at 0.085 g/mL were used as Draw Solutions. The flow rate of the Draw
Solutions and the distilled water, which the latter was used as a Feed Solution, was 1 L/min
(60 L/hr). Figure 4.11 displays water flux and reverse solute diffusion through the CTA flat
sheet membrane of 0.085 g/mL L-Alanine and 0.085 g/mL DADMAC under two patterns of
pumping the solutions. While, figure 4.12 shows water flux and the reverse solute diffusion of
same Draw Solutions but using the TFC aquaporin protein flat sheet membrane.
Pumping the Draw Solution first into the membrane has affected the integrity of the membrane
structure especially the support layer during the operation under FO mode. The support layer
was fully saturated by the Draw Solution for sometimes before the Feed Solution was ready to
be pumped. Consequently, a severe ICP inside the support layer occurred when the Feed
Solution was pumped. Low water flux and high reverse solute diffusion through membranes
were manifested. Figure 4.11 illustrates that water flux through the CTA membrane in case of
pumping both L-Alanine and DADMAC first was clearly lower than the case of pumping the
Feed Solution first. In case of pumping 0.085 g/mL DADMAC solution first, the water flux
through the CTA membrane collapsed dramatically from 15.75 LMH to 0.25 LMH within the
first 10 hours of the experiment time. A massive amount of DADMAC solute was reversely
diffused to the Feed Solution side through the structure of the CTA membrane when the Draw
Solution was pumped first (Fig. 4.11-b).The declination of water flux can be attributed to a
severe ICP occurred inside the support layer. However, this dramatic collapse of the water flux
can be attributed to the possibility DADMAC with 0.085 g/mL concentration empoisoned the
membrane structure and affected seriously the integrity of the membrane.
Figure 4.12 shows a slight difference in water flux through the TFC aquaporin protein
membrane between the two pumping cases. However, a low water flux was observed in case
of pumping both L-Alanine and DADMAC before the Feed Solution. Additionally, the reverse

77
diffusion of each Draw Solutions was quite similar in both cases. This indicates that the TFC
aquaporin protein membrane was more stable than the CTA membrane. The TFC aquaporin
protein membrane was not significantly affected by the changes in the pumping scheme of the
solutions compared to the CTA membrane.
(a)
(b)
Figure 4.11: Comparison between water flux and reverse solute diffusion of L-Alanine at 0.085 g/mL and DADMAC at 0.085 g/mL using CTA flat sheet membrane under two ways of pumping scheme.
0.00
0.05
0.10
0.15
0.20
0.25
0.30
0.00
4.00
8.00
12.00
16.00
20.00
24.00
0 2 4 6 8 10 12 14 16 18 20 22 24
Rev
erse
Sol
ute
Dif
fusi
on, G
MH
Wat
er F
lux,
LM
H
Time, hr
Water flux, Pumping FS first
Water flux, Pumping DS first
Reverse solute diffusion, Pumping FS first
Reverse solute diffusion, Pumping DS first
0
20
40
60
80
100
120
140
160
180
0.00
4.00
8.00
12.00
16.00
20.00
24.00
0 2 4 6 8 10 12 14 16 18 20 22 24
Rev
erse
Sol
ute
Dif
fusi
on, G
MH
Wat
er F
lux,
LM
H
Time, hr
Water flux, Pumping FS firstWater flux, Pumping DS firstReverse solute diffusion, Pumping FS firstReverse solute diffusion, Pumping DS first

78
(a)
(b)
Figure 4.12: Comparison between water flux and reverse solute diffusion of L-Alanine at 0.085 g/mL and DADMAC at 0.085 g/mL using TFC aquaporin protein membrane flat sheet membrane under two ways of pumping scheme.
0.00
0.05
0.10
0.15
0.20
0.25
0.30
0.00
4.00
8.00
12.00
16.00
20.00
24.00
0 2 4 6 8 10 12 14 16 18 20 22 24
Rev
erse
Sol
ute
Dif
fusi
on, G
MH
Wat
er F
lux,
LM
H
Time, hr
Water flux, Pumping FS first
Water flux, Pumping DS first
Reverse solute diffusion, Pumping FS first
Reverse solute diffusion, Pumping DS first
0.00
1.00
2.00
3.00
4.00
5.00
6.00
0.00
4.00
8.00
12.00
16.00
20.00
24.00
0 2 4 6 8 10 12 14 16 18 20 22 24
Rev
erse
Sol
ute
Dif
fusi
on, G
MH
Wat
er F
lux,
LM
H
Time, hr
Water flux, Pumping FS firstWater flux, Pumping DS firstReverse solute diffision, Pumping FS firstReverse solute diffusion, Pumping DS first

79
4.2 The Reconcentration System
The findings and discussions of the phase II of the experimental plan, which determines the
optimum operating conditions for the regeneration system, are provided in this section. Diluted
Draw Solutions of L-Alanine, DADMAC, and PolyDADMAC were produced at the end of the
FO experiments. NF system was chosen to accomplish the mission of reconcentration them.
The findings provided in this section demonstrates that the NF system is an effectual technique
to reconcentrate the diluted Draw Solutions. The experimental procedures were conducted
based on the experimental protocol of reconcentration the Draw Solutions using NF system as
explained in chapter 3, section 3.3.2.
Tables 4.2, 4.3, and 4.4 show the results from the reconcentration experiments of L-Alanine,
DADMAC, and PolyDADMAC, respectively. The tables indicate at the results of (i) the
volume of cumulative permeate every 2 hrs, (ii) the osmolality and concentration of cumulative
permeate, (iii) the concentration of cumulative concentrate, (iv) the ion rejection results. The
concentration of cumulative concentrate and ion rejection results were calculated according to
the mass balance and ion rejection equations illustrated in chapter 3, section 3.6.5 above.
The results demonstrated that the ion rejection percentage of the three Draw Solutions
decreased by increasing the concentration of cumulative concentrate inside the dead end stirred
cell. It was observed that the average ion rejection percentage of both L-Alanine and
DADMAC was 96.00% and higher that the average ion rejection percentage of PolyDADMAC
which was 85.00%. The big ions of PolyDADMAC were supposed to be trapped behind the
membrane more than the small ions of L-Alanine and DADMAC. However, the observation
of low ion rejection of PolyDADMAC can be attributed to the effect of high density of positive
charged ions in PolyDADMAC solution. The poor rejection of high cationic PolyDADMAC
ions was attributed to the interaction with the negative charge surface of the NF90 membrane.
Several studies have been conducted on the efficiency of Nanofiltration membrane in rejection
the ions of high charge density solutions (Nguyen et al. 2015; Agboola et al. 2014; Cathie Lee
et al. 2014; Mullett et al. 2014). The high charge density solution affects the pore size of the
Nanofiltration membrane deforming the mechanism of the size exclusion ion rejection (Mullett
et al. 2014). In this dissertation, the results demonstrated that PolyDADMAC, which is high
charge cationic polymer, negatively affected the efficiency of the NF membrane surface in
preventing the solute flux. The deformation of membrane pore size causing in high water flux
and poor ionic rejection.

80
Table 4.1: Results of L-Alanine solution reconcentration under varying concentration of permeate and concentrate, and rejection percentage.
Time Volume of
cumulative
permeate
Osmolality of
cumulative
permeate
Concentration of
cumulative
permeate,
Concentration of
cumulative
concentrate
Rejection
1
100
Hr. L Osmol/Kg g/mL g/mL %
0 0.035,
2 0.083 0.0130 0.00099 0.038 97
4 0.159 0.0130 0.00099 0.041 97
6 0.232 0.0120 0.00092 0.045 97
8 0.303 0.0150 0.00115 0.050 97
10 0.37 0.0153 0.00115 0.055 97
12 0.432 0.0260 0.00200 0.060 94
14 0.485 0.0270 0.00207 0.066 94
16 0.532 0.0270 0.00207 0.072 94
18 0.579 0.0270 0.00207 0.080 94
20 0.625 0.0270 0.00207 0.090 94
Table 4.2: Results of DADMAC solution reconcentration under varying concentration of permeate and concentrate, and rejection percentage.
Time Volume of
cumulative
permeate
Osmolality of
cumulative
permeate
Concentration of
cumulative
permeate
Concentration of
cumulative
concentrate
Rejection
1
100
Hr. L Osmol/Kg g/mL g/mL %
0 0.035,
2 0.117 0.0120 0.00091 0.040 97
4 0.207 0.0140 0.00106 0.044 97
6 0.304 0.0150 0.00135 0.050 96
8 0.392 0.0157 0.00119 0.057 97
10 0.461 0.0160 0.00121 0.064 97
12 0.528 0.0180 0.00136 0.073 96
14 0.582 0.0190 0.00144 0.082 96
16 0.630 0.0190 0.00144 0.092 96
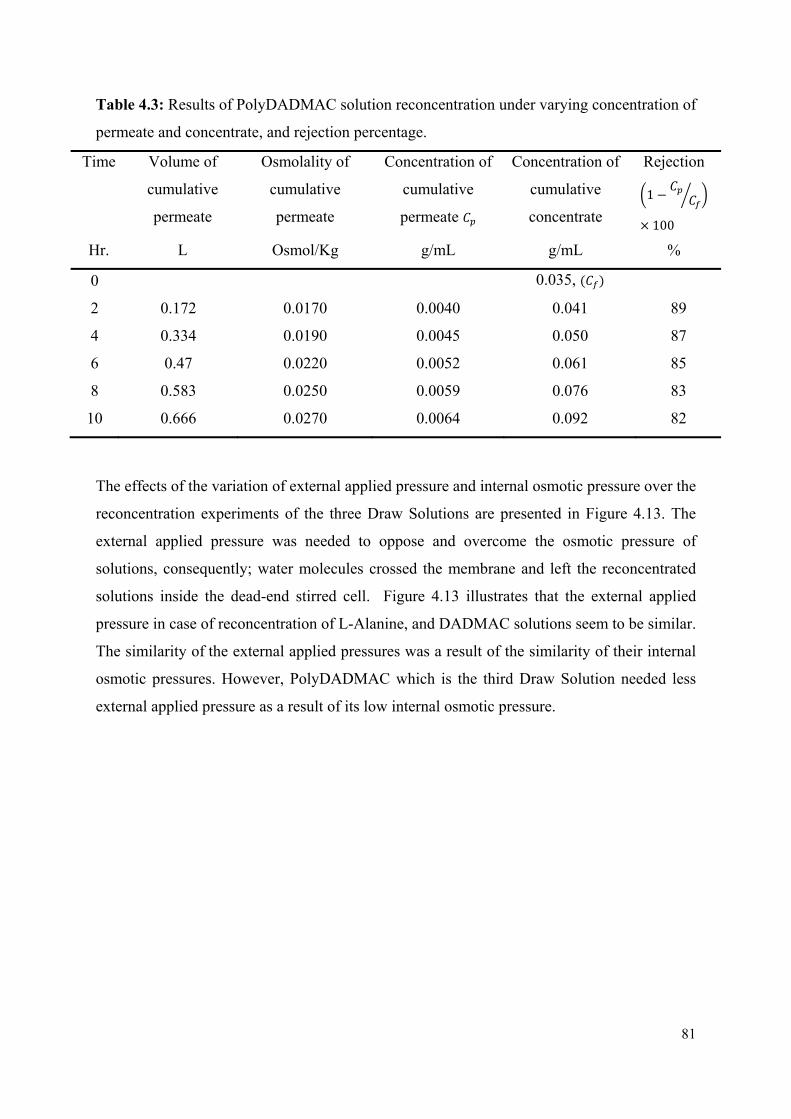
81
Table 4.3: Results of PolyDADMAC solution reconcentration under varying concentration of
permeate and concentrate, and rejection percentage.
Time Volume of
cumulative
permeate
Osmolality of
cumulative
permeate
Concentration of
cumulative
permeate
Concentration of
cumulative
concentrate
Rejection
1
100
Hr. L Osmol/Kg g/mL g/mL %
0 0.035,
2 0.172 0.0170 0.0040 0.041 89
4 0.334 0.0190 0.0045 0.050 87
6 0.47 0.0220 0.0052 0.061 85
8 0.583 0.0250 0.0059 0.076 83
10 0.666 0.0270 0.0064 0.092 82
The effects of the variation of external applied pressure and internal osmotic pressure over the
reconcentration experiments of the three Draw Solutions are presented in Figure 4.13. The
external applied pressure was needed to oppose and overcome the osmotic pressure of
solutions, consequently; water molecules crossed the membrane and left the reconcentrated
solutions inside the dead-end stirred cell. Figure 4.13 illustrates that the external applied
pressure in case of reconcentration of L-Alanine, and DADMAC solutions seem to be similar.
The similarity of the external applied pressures was a result of the similarity of their internal
osmotic pressures. However, PolyDADMAC which is the third Draw Solution needed less
external applied pressure as a result of its low internal osmotic pressure.
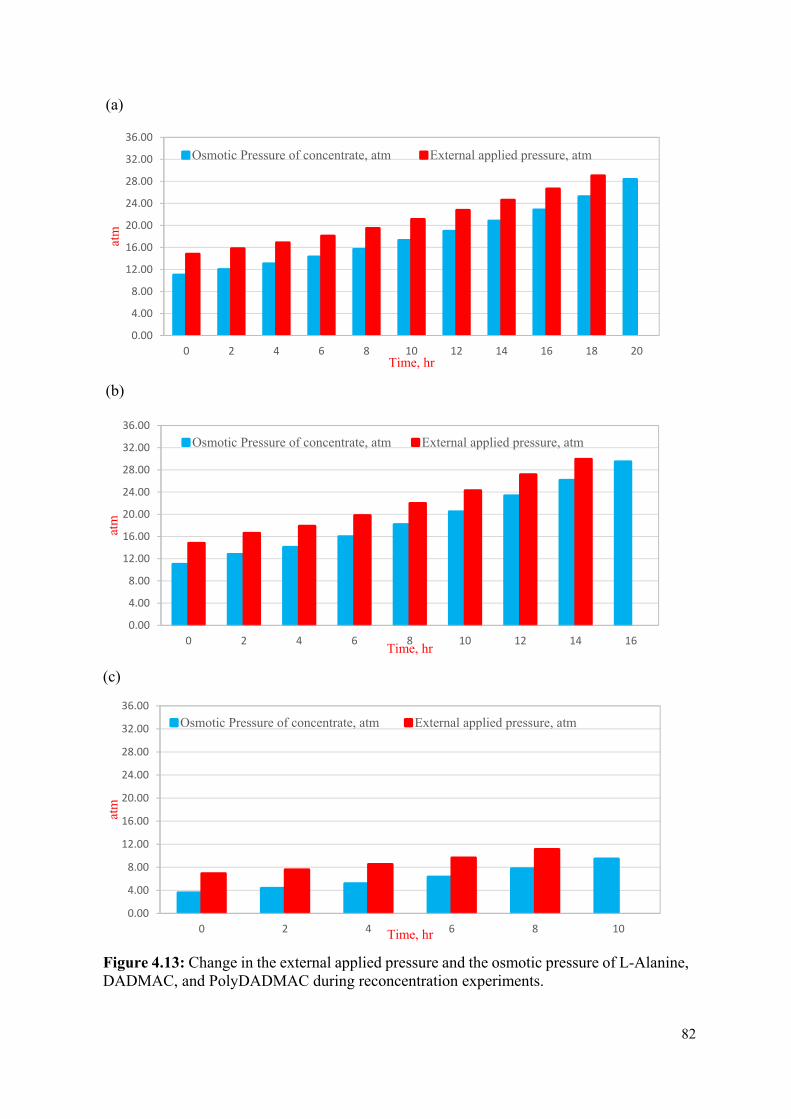
82
(a)
(b)
(c)
Figure 4.13: Change in the external applied pressure and the osmotic pressure of L-Alanine, DADMAC, and PolyDADMAC during reconcentration experiments.
0.00
4.00
8.00
12.00
16.00
20.00
24.00
28.00
32.00
36.00
0 2 4 6 8 10 12 14 16 18 20
atm
Time, hr
Osmotic Pressure of concentrate, atm External applied pressure, atm
0.00
4.00
8.00
12.00
16.00
20.00
24.00
28.00
32.00
36.00
0 2 4 6 8 10 12 14 16
atm
Time, hr
Osmotic Pressure of concentrate, atm External applied pressure, atm
0.00
4.00
8.00
12.00
16.00
20.00
24.00
28.00
32.00
36.00
0 2 4 6 8 10
atm
Time, hr
Osmotic Pressure of concentrate, atm External applied pressure, atm
83
The cumulative water flux across Nanofiltration membrane and the changing in the three
solutions concentration during reconcentration experiments are displayed in Figure 4.14. Initial
water flux with 4.79, 6.76 and 9.93 LMH were achieved after 2 hrs of reconcentration
experiments of L-Alanine, DADMAC, and PolyDADMAC, respectively. A Quick
reconcentration of the diluted Draw Solutions can be achieved by increasing the water flux
where a high amount of water can be drawn from the diluted solution. Therefore, the diluted
solution of PolyDADMAC with high initial water flux was reconcentrated faster than L-
Alanine and DADMAC. Figure 4.14 demonstrates that the desired concentration, which was
0.085 g/mL, of L-Alanine, DADMAC, and PolyDADMAC was obtained after 19, 15, and 9
hours, respectively.
The difference between the external applied pressure and the osmotic pressure of diluted
solution was monitored to be constant over the experiment time. However, a declination of
water flux was observed. The drop of water flux is attributed to the ECP, membrane
compaction, and scale formation:
Firstly, the ECP occurred due to the increase in the concentration of dissolved or colloidal
solute near or atop of Nanofiltration membrane surface. The solutes accumulated behind the
membrane and then created concentrated layer with high osmotic pressure. This layer with high
osmotic pressure worked against the external applied pressure and contributed to the decrease
in the water flux. Therefore, the stirred cell membrane was used to minimize the effect of the
ECP.
Secondly, membrane compaction can also contribute the decreasing of water flux with time. It
happened when the external pressure was applied on the polymeric driving force membrane.
Under this compression force, the membrane structure deformed and became denser. The pore
size decreased and hydraulic resistance increased.
Thirdly, the scale formation contributed to the declination of the water flux. In driven pressure
membrane processes such as NF, some of solute molecules became non-dissolved due to
solubility limits and the continuous drawing of the solvent through the membrane. Non-
dissolved solute molecules then precipitated on the membrane surface. In the related
experiments, the components which have relatively low solubility level leaded to reduction of
water flux. Therefore, it was observed that L-Alanine took more time than DADMAC and
PolyDADMAC to reach the same concentration due to its limited solubility.

84
(a)
(b)
(c)
Figure 4.14: Cumulative water flux across Nanofiltration flat sheet membrane and concentration L-Alanine, DADMAC, and PolyDADMAC during reconcentration experiments.
0.00
0.02
0.03
0.05
0.06
0.08
0.09
0.11
0.12
0.00
2.00
4.00
6.00
8.00
10.00
12.00
14.00
16.00
0 2 4 6 8 10 12 14 16 18 20
L-A
lani
ne c
once
ntra
tion
, g/m
L
Wat
er F
lux,
LM
H
Time, hr
L-Alanine concentration, g/mL Cumulative Water Flux, LMH
0.00
0.02
0.03
0.05
0.06
0.08
0.09
0.11
0.12
0.00
2.00
4.00
6.00
8.00
10.00
12.00
14.00
16.00
0 2 4 6 8 10 12 14 16
DA
DM
AC
con
cent
rati
on, g
/mL
Wat
er F
lux,
LM
H
Time, hr
DADMAC concentration, g/mL Cumulative Water Flux, LMH
0.00
0.02
0.03
0.05
0.06
0.08
0.09
0.11
0.12
0.00
2.00
4.00
6.00
8.00
10.00
12.00
14.00
16.00
0 2 4 6 8 10
Pol
yDA
DM
AC
con
cent
rati
on,
g/m
L
Wat
er F
lux,
LM
Hr
Time, hr
PolyDADMAC concentration, g/mL Cumulative Water Flux, LMH

85
4.3 The Potential Application
One of the main objectives of this dissertation is to investigate the viability of the utilisation of
the FO for water recovery from fumaric acid produced by fermentation process in laboratory
scale experiments. FO process was involved to minimize the water content and thus concentrate
fumaric acid produced by fermentation process. The osmotic pressure of the Draw Solution
was implemented to draw only the water molecules through membrane meanwhile the
membrane prevented the fumaric acid solution components to shift to the Draw Solution tank.
The results obtained from the experiments conducted in phase I of the experimental plan were
used in the recovery water experiments from both synthesis fumaric acid and fumaric acid
produced by Fermentation process. A combination among the best Draw Solution, the efficient
concentration and the best membrane type, which provided the highest water flux and lowest
reverse solute diffusion were chosen. The viability of the regeneration of the Draw Solution
was also considered. Membranes were operated under FO mode to minimize the effect of
fouling.
As a result, the selected operating conditions were L-Alanine as a Draw Solution at 0.085 g/mL
and CTA flat sheet membrane, which operated under FO mode, as shown in the following
matrix.
Factors Draw Solution type
Membrane sheet type
Membrane orientation
Draw Solution concentration.
Variables LDADMAC
PolyDADMAC Aquaporin protein PRO mode
0.035g/mL . /0.120g/mL0.155g/mL
4.3.1 Findings and Discussions of Using Synthesis Fumaric Acid Solution as Feed Solution
The purpose of this experiment was to investigate the efficiency of the CTA flat sheet
membrane in seizing fumaric acid and permeates water. The samples were taken from the Feed
Solution and the Draw Solution tanks at the beginning of the experiment and after 32 hours
and were analysed by HPLC to measure the amount of fumaric acid in both tanks.
Figure 4.15 illustrates the initial and the final fumaric acid concentration in both the Feed
Solution and the Draw Solution tanks. The initial fumaric acid concentration was 5 g/L and 0
g/L in the Feed Solution tank and the Draw Solution tank, respectively. After 32 hours of the
experiment, the final concentration of fumaric acid in the Feed Solution tank decreased to 2.783

86
g/L meanwhile fumaric acid was found in the Draw Solution tank at 1.822 g/L. In other words,
the concentration of fumaric acid increased inside the Draw Solution tank from 0 g/L to 1.822
g/L, which means that both water and fumaric acid passed through CTA flat sheet membrane
to the Draw Solution tank. That means, the CTA membrane did not reject fumaric acid and
allowed it to cross easily to the Draw Solution tank. Taking in considerations that the main
function of the membrane is to trap fumaric acid and allow only the water molecules, the
membrane failed due to its chemical incompatibility with fumaric acid. The incompatibility is
attributed to the reaction between the surface of the CTA membrane and fumaric acid
molecules which hydrolysed and deformed the membrane.
Figure 4.15: Changing of fumaric acid concentration in both the Feed Solution and the Draw Solution tanks using CTA flat sheet membrane
For the previous reason, the incompatible CTA membrane was replaced by the TFC aquaporin
protein membrane and the experiment under the same conditions was repeated. That was
intended to study the efficiency of TFC aquaporin protein membrane in seizing fumaric acid
and permeates water.
The concentration of fumaric acid in both the Feed Solution and the Draw Solution tanks were
determined by same procedures via HPLC analysis. The results were plotted in Figure 4.16.
5.000
2.783
0.000
1.822
0.00
1.00
2.00
3.00
4.00
5.00
6.00
7.00
8.00
Initial Fumaric acid Con. Final Fumaric acid Con. Initial Fumaric acid Con. Final Fumaric acid Con.
FS tank DS tank
Con
cent
ratio
n, g
/L
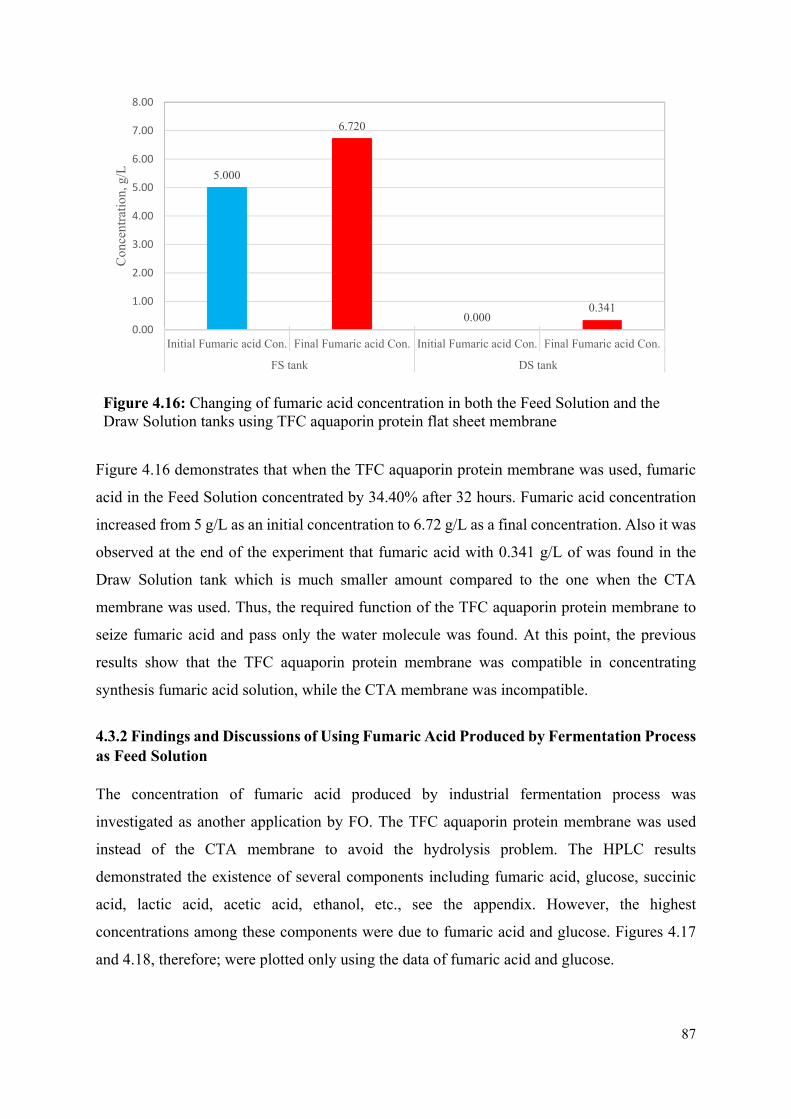
87
Figure 4.16: Changing of fumaric acid concentration in both the Feed Solution and the Draw Solution tanks using TFC aquaporin protein flat sheet membrane
Figure 4.16 demonstrates that when the TFC aquaporin protein membrane was used, fumaric
acid in the Feed Solution concentrated by 34.40% after 32 hours. Fumaric acid concentration
increased from 5 g/L as an initial concentration to 6.72 g/L as a final concentration. Also it was
observed at the end of the experiment that fumaric acid with 0.341 g/L of was found in the
Draw Solution tank which is much smaller amount compared to the one when the CTA
membrane was used. Thus, the required function of the TFC aquaporin protein membrane to
seize fumaric acid and pass only the water molecule was found. At this point, the previous
results show that the TFC aquaporin protein membrane was compatible in concentrating
synthesis fumaric acid solution, while the CTA membrane was incompatible.
4.3.2 Findings and Discussions of Using Fumaric Acid Produced by Fermentation Process as Feed Solution
The concentration of fumaric acid produced by industrial fermentation process was
investigated as another application by FO. The TFC aquaporin protein membrane was used
instead of the CTA membrane to avoid the hydrolysis problem. The HPLC results
demonstrated the existence of several components including fumaric acid, glucose, succinic
acid, lactic acid, acetic acid, ethanol, etc., see the appendix. However, the highest
concentrations among these components were due to fumaric acid and glucose. Figures 4.17
and 4.18, therefore; were plotted only using the data of fumaric acid and glucose.
5.000
6.720
0.0000.341
0.00
1.00
2.00
3.00
4.00
5.00
6.00
7.00
8.00
Initial Fumaric acid Con. Final Fumaric acid Con. Initial Fumaric acid Con. Final Fumaric acid Con.
FS tank DS tank
Con
cent
ratio
n, g
/L

88
The effluence of the temperature on the concentration of fumaric acid efficiency was
investigated. Two experiments were taken place in two labs with different temperature. The
first temperature was 17 while the second temperature was 32 . Figure 4.17 shows the
changing of fumaric acid and glucose concentrations in both the Feed Solution and the Draw
Solution tanks at 32 . The reduction of water content of the fumaric acid solution made it to
concentrate by 26.00% after 32 hours. The concentration raised from 6.020 g/L as an initial
concentration to 7.584g/L as a final concentration. Similarly, the concentration of glucose in
the Feed Solution tank increased by 29.45%. Inconsiderable amounts of both fumaric acid and
glucose were crossed the TFC aquaporin protein membrane into the Draw Solution tank as
observed in the figure.
Figure 4.17: Changing of fumaric acid and glucose concentrations in both Feed Solution and Draw Solution tanks at 32 using TFC aquaporin protein flat sheet membrane
Figure 4.18 demonstrates the changing of fumaric acid and glucose concentrations in both the
Feed Solution and the Draw Solution tanks at 17 . The results demonstrated that at the end
of the experiment fumaric acid and glucose in the Feed Solution tank concentrated by 19.80%
and 19.90%, respectively. As a result, it was observed that by increasing the lab temperature
from 17 to 32 , the final concentrations of fumaric acid and glucose grew by 31.26% and
47.99%, respectively. This observation indicated a positive effect of increasing the temperature
in FO process. By increasing the temperature, better water recovery was obtained and
consequently more concentration percentage of fumaric acid was achieved.
6.020 7.584
38.534
49.880
0.025 0.060 0.026 0.4140.00
6.00
12.00
18.00
24.00
30.00
36.00
42.00
48.00
54.00
60.00
InitialFumaric
Con.
FinalFumaric
Con.
IntialGlucose
Con.
FinalGlucose
Con.
InitialFumaric
Con.
FinalFumaric
Con.
IntialGlucose
Con.
FinalGlucose
Con.
FS tank DS tank
Con
cent
ratio
n, g
/L
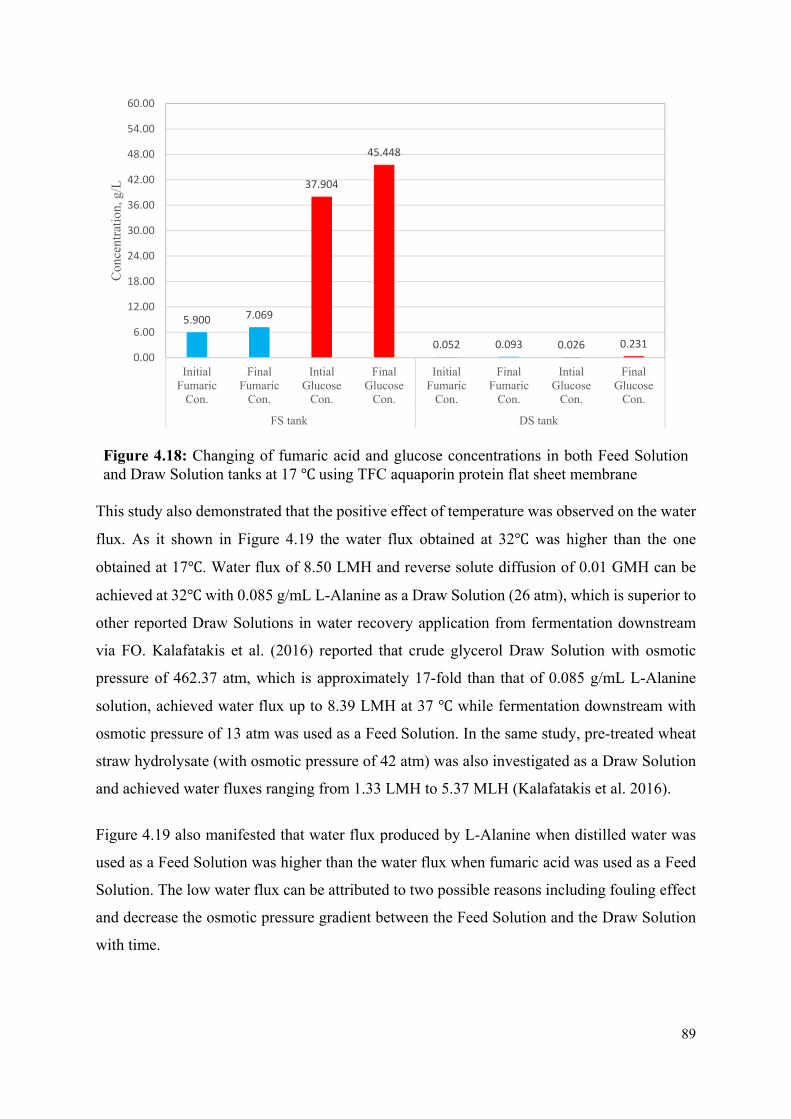
89
Figure 4.18: Changing of fumaric acid and glucose concentrations in both Feed Solution and Draw Solution tanks at 17 using TFC aquaporin protein flat sheet membrane
This study also demonstrated that the positive effect of temperature was observed on the water
flux. As it shown in Figure 4.19 the water flux obtained at 32 was higher than the one
obtained at 17 . Water flux of 8.50 LMH and reverse solute diffusion of 0.01 GMH can be
achieved at 32 with 0.085 g/mL L-Alanine as a Draw Solution (26 atm), which is superior to
other reported Draw Solutions in water recovery application from fermentation downstream
via FO. Kalafatakis et al. (2016) reported that crude glycerol Draw Solution with osmotic
pressure of 462.37 atm, which is approximately 17-fold than that of 0.085 g/mL L-Alanine
solution, achieved water flux up to 8.39 LMH at 37 while fermentation downstream with
osmotic pressure of 13 atm was used as a Feed Solution. In the same study, pre-treated wheat
straw hydrolysate (with osmotic pressure of 42 atm) was also investigated as a Draw Solution
and achieved water fluxes ranging from 1.33 LMH to 5.37 MLH (Kalafatakis et al. 2016).
Figure 4.19 also manifested that water flux produced by L-Alanine when distilled water was
used as a Feed Solution was higher than the water flux when fumaric acid was used as a Feed
Solution. The low water flux can be attributed to two possible reasons including fouling effect
and decrease the osmotic pressure gradient between the Feed Solution and the Draw Solution
with time.
5.900 7.069
37.904
45.448
0.052 0.093 0.026 0.2310.00
6.00
12.00
18.00
24.00
30.00
36.00
42.00
48.00
54.00
60.00
InitialFumaric
Con.
FinalFumaric
Con.
IntialGlucose
Con.
FinalGlucose
Con.
InitialFumaric
Con.
FinalFumaric
Con.
IntialGlucose
Con.
FinalGlucose
Con.
FS tank DS tank
Con
cent
ratio
n, g
/L

90
Figure 4.19: Comparison between the water flux and the reverse solute diffusion of L-Alanine at 0.085 g/mL using TFC aquaporin protein flat sheet membrane and two types of Feed Solution with different temperatures
In regards to the first cause which is the fouling, increasing the temperature to 32 enhanced
the growth of Rhizopus oryzae microorganism and with time the microorganisms flocculated
and produced considerable foulants. It was observed that the colour of fumaric acid became
less clear with time as a result of the microorganism growing. The foulants depressed on the
surface of TFC aquaporin protein membrane therefore forming a fouling layer. As a result, the
hydraulic resistance of the membrane increased and water flux decreased. The water flux
achieved at 32 decreased sharply than at 17 .
The second cause of decreasing the water flux rate sharply was the decrease in osmotic pressure
gradient between the Feed Solution and the Draw Solution with time. Reducing the gap
between osmotic pressure of the Draw Solution and the Feed Solution happened as a result of
transmission the water molecules from the Feed Solution side to the Draw Solution side.
Osmotic pressure of the Draw Solution decreased gradually with time due to its dilution
meanwhile osmotic pressure of the Feed Solution increased gradually due to its concentration.
Consequently, the effective driven force through the membrane was decreased by the gradual
reduction of osmotic pressure gradient which led to drop in the water flux. Figure 4.20
illustrates that the osmotic pressure gradient decreased at 32 more than at 17 . Both
experiments conducted in two separate labs. The first experiment was under 32 , where the
gap of the osmotic pressure reduced from 16.88 atm to 6.21 atm after 32 hours. However,
under 17 , the gab reduced from 16.48 atm to 9.47atm. Furthermore, the high residual
0.00
0.10
0.20
0.30
0.40
0.50
0.60
0.70
0.80
0.90
1.00
0.00
3.00
6.00
9.00
12.00
15.00
18.00
0 2 4 6 8 10 12 14 16 18 20 22 24
Rev
erse
Sol
ute
Dif
fusi
on, G
MH
Wat
er F
lux,
LM
H
Time, hr
Water Flux, LMH (FS: distilled water)
Water Flux, LMH (FS: Fumaric acid, Temp: 32℃)
Water Flux, LMH (FS: Fumaric acid, Temp: 17℃)
Reverse Solute Diffusion, GMH (FS: distilled water)
Reverse Solute Diffusion, GMH (FS: Fumaric acid, Temp: 32℃)
Reverse Solute Diffusion, GMH (FS: Fumaric acid, Temp: 17℃)

91
concentration of glucose in the Feed Solution limited the high concentration of the fumaric acid
process. The limitations are due to the reduction of the osmotic pressure (OP) gradient through
the membrane.
(a)
(b)
Figure 4.20: Osmotic pressure gradient between the Draw Solution and the Feed Solution during FO process at different temperatures a) 32 , b) 17
27.14
10.26
20.86
14.65
0.00
5.00
10.00
15.00
20.00
25.00
30.00
Initial OP of DS Intial OP of FS Final OP of DS Final OP of FS
Osm
otic
pre
ssur
e, a
tm
Temp: 32℃
26.87
10.39
22.32
12.85
0.00
5.00
10.00
15.00
20.00
25.00
30.00
Initial OP of DS Intial OP of FS Final OP of DS Final OP of FS
Osm
otic
pre
ssur
e, a
tm
Temp: 17℃

92
CHAPTER 5
Conclusions and Recommendations 5.1 The FO System
High growth of osmotic pressure and low viscosity were observed by increasing the
concentration of L-Alanine and DADMAC Draw Solutions. In contrast, a progressive increase
of osmotic pressure and high increase of viscosity was observed by increasing the concentration
of PolyDADMAC. Water flux and reverse solute diffusion were affected by various conditions
such as; the characteristics of the Draw Solution, osmotic pressure gradient, membrane
orientation, and change in the pumping pattern of the solutions inside the FO membrane cell.
The majority of water flux trends decreased dramatically during the first four hours, then the
decrease became progressively slow with time.
Both CTA and TFC aquaporin protein flat sheet membranes were operated under FO and PRO
modes. In FO mode, water flux through the CTA flat sheet membrane was higher than the one
through the TFC aquaporin protein flat sheet membrane. This observation is attributed to the
low thickness, loose fibre support layer and hydrophilic nature of the CTA membrane.
The highest two initial water flux through the CTA flat sheet membrane were achieved by L-
Alanine at 0.085 g/mL and DADMAC at 0.155 g/mL were used as a Draw Solution with 22
LMH and 20 LMH, respectively. These concentrations of L-Alanine and DADMAC also
produced the highest initial water flux through the TFC aquaporin protein flat sheet with 17
LMH and 11.50 LMH, respectively. In contrast, PolyDADMAC at 0.035 g/mL produced the
lowest initial water flux through both CTA and TFC Aquaporin protein flat sheet membranes
with 4 LMH and 2.75 LMH, respectively. Low osmotic pressure and relatively high viscosity
played intrinsic role of that behaviour.
The TFC aquaporin protein flat sheet membrane provided better results of reverse solute
diffusion than the CTA flat sheet membrane. The three Draw Solutions had low and nearly
constant reverse diffusion across the TFC aquaporin protein flat sheet membrane. However,
reverse solutes diffusion across the CTA flat sheet membrane was high and decreasing
gradually with time. L-Alanine at 0.085 g/mL achieved the lowest reverse solute diffusion
across both TFC aquaporin protein and CTA membranes. The initial value of the reverse solute

93
of L-Alanine was 0.05 GMH and reached to 0.01 GMH at the end of the experiment.
Nevertheless, DADMAC at 0.155 g/mL had the highest reverse solute diffusion across the
CTA flat sheet membrane with initial value 16.77 GMH.
The variation of the osmotic pressure values of the Draw Solutions affected the water flux.
Water flux achieved by the Draw Solutions with osmotic pressure less than 15 atm dropped
dramatically within 2 hrs after commencing the experiments while the osmotic pressure
decreased faintly. However, the water flux declined slightly after the first 2 hrs while the
decrease of osmotic pressure was more apparent. Similar behaviour of the water flux drop was
observed when the TFC aquaporin protein membrane was operated under FO mode. It was also
observed that when L-Alanine, DADMAC, and PolyDADMAC with various concentrations
were used as Draw Solutions, the water flux across the CTA membrane reached approximately
the same level at the end of experiments irrespective of the initial values of the water flux. For
example, the water flux produced by L-Alanine and DADMAC were much closer to 4 LMH at
the end of the experiments. The same was observed when the TFC aquaporin protein
membranes were used.
The effect of viscosity appeared when PolyDADMAC was used. The high viscosity of
PolyDADMAC contributed the declination of water flux. For example, water flux obtained by
PolyDADMAC at 0.155 g/mL was lower than the one at 0.120 g/mL concentration.
The effect of changing the membranes’ orientation on water flux and reverse solute diffusion
were observed. The Solutions of L-Alanine and DADMAC at 0.120 g/mL concentration were
used as Draw Solutions, meanwhile distilled water was used as a Feed Solution. It was observed
that the initial water flux through both CTA and TFC aquaporin protein membranes under PRO
mode was higher than water flux under FO mode. However in PRO mode, water flux through
the CTA flat sheet membrane dropped sharper than that of the TFC aquaporin protein flat sheet
membrane. This high declination in water flux is attributed to increasing the ICP inside the
CTA flat sheet membrane with time more than the ICP inside the TFC aquaporin protein flat
sheet membrane. The results demonstrated that the reverse solute diffusion across both CTA
and TFC aquaporin protein flat sheet membranes in PRO mode was higher than the one in FO
mode.
Moreover, it was observed that the water flux and the reverse solute diffusion were also affected
by the pattern of pumping the solutions inside the FO membrane cell. Pumping the Draw
Solution first and thereafter pumping the Feed Solution affected the efficiency of membrane.

94
Low water flux and high amount of reverse solute diffusion though the CTA membrane was
observed as a result of the severe ICP inside the support layer of membrane. The CTA flat sheet
membrane was affected badly more than the TFC aquaporin protein flat sheet membrane in the
case of pumping the Draw Solution first. For instance, when DADMAC at 0.085 g/mL was
used as a Draw Solution, it was observed a dramatic collapse of water flux through the CTA
flat sheet membrane from 15.75 LMH to 0.25 LMH after 10 hours of the experiment. A massive
of reverse diffusion of DADMAC was discovered in the Feed Solution tank. In contrast, the
results for the TFC aquaporin protein flat sheet membrane illustrated more stability and low
effect of pumping the Draw Solution before the Feed Solution.
5.2 The Reconcentration System
Diluted Draw Solutions of L-Alanine, DADMAC, and PolyDADMAC were effectively
reconcentrated by NF system. Reconcentration system of NF90 Nanofiltration membrane with
dead end stirred cell was used.
The average ion rejection of L-Alanine, DADMAC, and PolyDADMAC by NF90 membrane
were 96.00%, 96.00%, and 85.00%, respectively. Poor rejection of PolyDADMAC ions is
imputed to high density of cationic charge of PolyDADMAC solution which affected badly the
negative charged surface of NF90 membrane. Pores size of negative charged membrane was
deformed due to exposing to high amount of positive charges of PolyDADMAC solution. Thus,
the percentage of ions rejection would be reduced and high water flux would be found.
Decreasing the ions rejection percentage was directly proportional to increasing the
concentration of cumulative concentrate inside the dead end stirred cell with time.
Initial water fluxes in reconcentration experiments were measured after 2 hrs from the start
time. Initial water fluxes were 4.79, 6.76, and 9.93 LMH for L-Alanine, DADMAC, and
PolyDADMAC, respectively. Moreover, the concentration of L-Alanine, DADMAC, and
PolyDADMAC rose from 0.035 g/mL to 0.085 g/mL after 19, 15, and 9 hours, respectively.
Therefore, higher water flux was achieved, quicker reconcentration was obtained.
The external applied pressure was adjusted every two hours to keep the difference between the
external applied pressure and the internal osmotic pressure of the diluted solution. However,
declination of water flux with time was observed. Three parameters contribute the decreasing
of the water flux with time including concentration polarization, membrane compaction, and
scale formation. The stirred cell membrane was used to minimize the effect of concentration
95
polarization which happens due to increase the concentration of dissolved or colloidal solute
molecules close or atop of the membrane surface. The limited solubility of L-Alanine increases
the opportunity of scale formation on atop of the membrane surface. Therefore, lowering of
water flux in case of reconcentration L-Alanine was observed comparing with DADMAC and
PolyDADMAC.
5.3 The potential Application
Both CTA and TFC aquaporin protein flat sheet membranes were tested in FO set up for water
recovery from a synthesis fumaric acid. Then only the TFC aquaporin protein flat sheet was
chosen and utilised in water recovery from fumaric acid solution produced by a fermentation
process.
The CTA membrane was chemically incompatible with fumaric acid. The membrane was
hydrolysed and fumaric acid molecules were passing through the membrane layers free from
the Feed Solution side to the Draw Solution side. To overcome the hydrolysis phenomenon,
the CTA membrane was replaced by the TFC aquaporin protein membrane in the
reconcentration experiments. The TFC aquaporin protein membrane showed positive results in
terms of preventing the fumaric acid molecules to pass through. Synthesis fumaric acid solution
was reconcentrated by 34.40% after 32 hours via the TFC aquaporin protein membrane.
Due to the compatibility of the TFC aquaporin protein membrane with fumaric acid, it was
employed in water recovery from fumaric acid solution produced by a fermentation process
experiments. Two experiments were run separately under two different degree; 32 and 17
to investigate the influence of temperature on the reconcentration. HPLC samples analysis of
fumaric acid solution produced by a fermentation process showed that the dominant
components were fumaric acid and glucose. The concentrations of fumaric acid and glucose
approximately 6 g/L and 38 g/L, respectively. Besides that, small amounts of other organic
acids such as succinic, lactic, and acetic acids and ethanol were also measured.
The reduction of water content of the fumaric acid solution due to the FO process made it to
concentrate by 26.00% and 19.80% at 32℃ and 17℃, respectively. Likewise, glucose in the
Feed Solution tank also concentrated by 29.45% and 19.90% at 32 and 17 , respecetivly.
Therefore, it was observed that increasing the temperature has positive impact on increasing
the water recovery and thus the concentration of fumaric acid in FO process.
96
Water flux through the TFC aquaporin protein membrane dropped with time from 8.5 LMH to
1.5 LMH in 32℃. It also dropped from 6.25 LMH to 1.13 LMH in 17 . Concentration
polarization, decreased the osmotic pressure gradient between the Feed Solution and the Draw
Solutions with time, and fouling formation were the main factors to cause the declination of
water flux rate in hot laboratory than in cold one. Lab with temperature 32℃ was suitable to
grow Rhizopus oryzae microorganism which flocculated and started to form fouling on the
membrane surface.
Achieving high percentage of water recovery from fumaric acid solution has been limited due
to the high initial concentration of glucose in the Feed Solution. With the time the glucose also
concentrated and created high osmotic pressure. It reduced the effective net driving force
through the membrane results in low water flux and limited concentration of fumaric acid.
5.4 Recommendations
Choosing a suitable Draw Solution for FO process is still one of the most debatable and
effective keys of improvement the FO technology performance. Accelerated studies have been
conducted for that purpose. Thus, wide range of materials have been proposed as novel Draw
Solutions to generate a considerably high osmotic driving force. However, other intrinsic
characters besides the osmotic pressure of the Draw Solution should be taken into account to
investigate the mass transport through the membrane. The interaction between the Draw
Solution and the charged surface of membranes affects the mass transport. Therefore,
Further effort should be devoted to investigate this interaction based on the
characteristics of both Draw Solutions and membranes surface.
Besides that, many studies had investigated the use of FO technology in wastewater,
desalination, and other common applications and how much it holds great promise. However,
Further studies should be done to explore the efficacy of utilisation FO technology in
other promising applications such as downstream bioprocessing of organic acids
(fumaric acid, succinic acid, malic acid, etc). These organic acids should have more
attention to utilise a proper process like FO process for its concentration and extraction.
This study demonstrates that the existence of glucose component with high concentration
limited the water recovery from fumaric acid by FO process. Glucose component with high

97
concentration can generate high osmotic pressure and then reduce the net driving osmotic force
through the membrane. Therefore,
Proper solutions should be given first to minimize glucose concentration in the
fermentation downstream and in the same time to maintain the fumaric acid without
consuming.

98
References Abdulwahab, M.I., Sabermajeed, N. & Yousifissa, S., 2013. Water Recovery from Brine
Solution by Forward Osmosis Process. Journal of Engineering, 19(8), pp.1–12.
Achilli, A. et al., 2009. The forward osmosis membrane bioreactor: A low fouling alternative
to MBR processes. Desalination, 238(1–3), pp.10–21.
Achilli, A., Cath, T.Y. & Childress, A.E., 2010. Selection of inorganic-based draw solutions
for forward osmosis applications. Journal of Membrane Science, 364(1–2), pp.233–241.
Agboola, O. et al., 2014. Deposition of toxic metal particles on rough nanofiltration
membranes. Korean Journal of Chemical Engineering, 31(8), pp.1413–1424.
Akther, N. et al., 2015. Recent advancements in forward osmosis desalination: A review.
Chemical Engineering Journal, 281, pp.502–522.
Alsvik, I. & Hägg, M.-B., 2013. Pressure Retarded Osmosis and Forward Osmosis
Membranes: Materials and Methods. Polymers, 5(1), pp.303–327.
American Water Works Association & James Edzwald, 2011. Water Quality & Treatment: A
Handbook on Drinking Water., McGraw-Hill Professional.
Ansari, A.J. et al., 2017. Forward osmosis as a platform for resource recovery from municipal
wastewater - A critical assessment of the literature. Journal of Membrane Science,
529(July 2016), pp.195–206.
Baker, R.W., 2012. Membrane Technology and Applications.
Baroña, G.N.B., Lim, J. & Jung, B., 2012. High performance thin film composite polyamide
reverse osmosis membrane prepared via m-phenylenediamine and 2,2’-
benzidinedisulfonic acid. Desalination, 291, pp.69–77.
Boo, C., Khalil, Y.F. & Elimelech, M., 2015. Performance evaluation of trimethylamine-
carbon dioxide thermolytic draw solution for engineered osmosis. Journal of Membrane
Science, 473(October 2014), pp.302–309.
Boundless Biology Boundless, 2016. Water and Solute Potential. Source: Boundless. “Water
and Solute Potential.” Boundless Biology [Accessed February 9, 2017].
99
Bowden, K.S., Achilli, A. & Childress, A.E., 2012. Organic ionic salt draw solutions for
osmotic membrane bioreactors. Bioresource Technology, 122, pp.207–216.
Cai, Y. & Hu, X.M., 2016. A critical review on draw solutes development for forward
osmosis. Desalination, 391(August), pp.16–29.
Cathie Lee, W.P. et al., 2014. Phosphorus removal by NF90 membrane: Optimisation using
central composite design. Journal of the Taiwan Institute of Chemical Engineers, 45(4),
pp.1260–1269.
Chen, S.S., 2013. Exploration of Ethylenediaminetetraacetic Acid Disodium ( EDTA- 2Na )
Salt as Novel Draw Solution for Forward Osmosis Process on Dewatering of High
Nutrient Sludge Experimental Set-Up. , (2012), pp.1–7.
Chung, T.-S. et al., 2012. Forward osmosis processes: Yesterday, today and tomorrow.
Desalination, 287, pp.78–81.
Ge, Q. et al., 2012. Exploration of polyelectrolytes as draw solutes in forward osmosis
processes. Water Research, 46(4), pp.1318–1326.
Ge, Q., Ling, M. & Chung, T.S., 2013. Draw solutions for forward osmosis processes:
Developments, challenges, and prospects for the future. Journal of Membrane Science,
442(October 2016), pp.225–237.
Jaffrin, M., 2015. Membrane filtration processes 1st Edition.
Kalafatakis, S. et al., 2016. On a novel strategy for water recovery and recirculation in
biorefineries through application of forward osmosis membranes. Chemical Engineering
Journal, 311, pp.209–21
Khulbe, K.C., Feng, C. & Matsuura, T., 2008. Synthetic Polymeric Membranes.
Kim, Y.C., Han, S. & Hong, S., 2011. A feasibility study of magnetic separation of magnetic
nanoparticle for forward osmosis. Water Science & Technology, 64(2), pp.469–476.
Kumar, L. et al., 2012. Asymmetric membrane capsule (AMC): An useful osmotic drug
delivery system. International Journal of Pharmacy and Pharmaceutical Sciences, 4(2),
pp.54–59.
Lee, S. et al., 2010. Comparison of fouling behavior in forward osmosis (FO) and reverse
osmosis (RO). Journal of Membrane Science, 365(1–2), pp.34–39.

100
Li, N.N. et al., 2008. Advanced Membrane Technology and Applications. John Wiley &
Sons, Inc.
Mattia Stefani, 2014. Forward Osmosis : Influence of Sucrose and Sodium Chloride As Draw
Solutions, PhD thesis, University of Padua, Italy.
Mentzel, S. et al., 2016. Systems for water extraction, US patent.
Mohanty, K. & Purkait, M., 2011. Membrane Technologies and Applications, New York:
CRC Press.
Mullett, M., Fornarelli, R. & Ralph, D., 2014. Nanofiltration of mine water: Impact of feed
pH and membrane charge on resource recovery and water discharge. Membranes, 4(2),
pp.163–180.
Nguyen, N. et al., 2015. Assessing nanofiltration and reverse osmosis for the detoxification of
lignocellulosic hydrolysates. Journal of Membrane Science, 487, pp.40–50.
Nguyen, N.C. et al., 2013. Application of forward osmosis on dewatering of high nutrient
sludge. Bioresource technology, 132, pp.224–9.
Nicoll, P.G., 2013. Forward Osmosis - A Brief Introduction. The International Desalination
Association World Congress on Desalination and Water Reuse.
Petrinić, I. & Hélix-Nielsen, C., 2014. Towards new membrane based technologies for water
treatment and reuse in the textile industry . Tekstil, 63(7–8), pp.243–250.
Phillip, W. a., Yong, J.S. & Elimelech, M., 2010. Reverse draw solute permeation in forward
osmosis: Modeling and experiments. Environmental Science and Technology, 44(13),
pp.5170–5176.
Phuntsho, S. et al., 2013. Assessing the major factors affecting the performances of forward
osmosis and its implications on the desalination process. Chemical Engineering Journal,
231, pp.484–496.
Qiu, C., Qi, S. & Tang, C.Y., 2011. Synthesis of high flux forward osmosis membranes by
chemically crosslinked layer-by-layer polyelectrolytes. Journal of Membrane Science,
381(1–2), pp.74–80.
Ramjee, S., 2015. Rheological Behaviour and Characterisation of Pitch-Based Carbon
Precursors, PhD thesis. University of Pretoria, South Africa.

101
Roh, I.J., 2003. Effect of the physicochemical properties on the permeation performance in
fully aromatic crosslinked polyamide thin films. Journal of Applied Polymer Science,
87(3), pp.569–576.
Setiawan, L. et al., 2011. Fabrication of novel poly(amide-imide) forward osmosis hollow
fiber membranes with a positively charged nanofiltration-like selective layer. Journal of
Membrane Science, 369(1–2), pp.196–205.
Shaffer, D.L. et al., 2015. Forward osmosis: Where are we now? Desalination, 356, pp.271–
284.
Shenvi, S.S., Isloor, A.M. & Ismail, A.F., 2015. A review on RO membrane technology:
Developments and challenges. Desalination, 368(February).
Strathmann, H., Giorno, L. & Drioli, E., 2006. An introduction to membrane science and
technology. Journal of proteome research, 10(January 2011).
Tian, E. et al., 2015. A study of poly (sodium 4-styrenesulfonate) as draw solute in forward
osmosis. Desalination, 360, pp.130–137.
Tiraferri, A. et al., 2011. Relating performance of thin-film composite forward osmosis
membranes to support layer formation and structure. Journal of Membrane Science,
367(1–2), pp.340–352.
Vos, K.D., Burris, F.O. & Riley, R.L., 1966. Kinetic study of the hydrolysis of cellulose
acetate in the pH range of 2–10. Journal of Applied Polymer Science, 10(5), pp.825–
832.
Wang, C.Y. et al., 2005. Asymmetric membrane capsules for delivery of poorly water-soluble
drugs by osmotic effects. International Journal of Pharmaceutics, 297(1–2), pp.89–97.
Yong, J.S., 2012. Reverse Draw Solute Transport in Forward Osmosis Systems.
Zhang, M. et al., 2017. Effect of reverse solute diffusion on scaling in forward osmosis: A
new control strategy by tailoring draw solution chemistry. Desalination, 401, pp.230–
237.
Zhao, S. et al., 2012. Recent developments in forward osmosis: Opportunities and challenges.
Journal of Membrane Science, 396, pp.1–21.
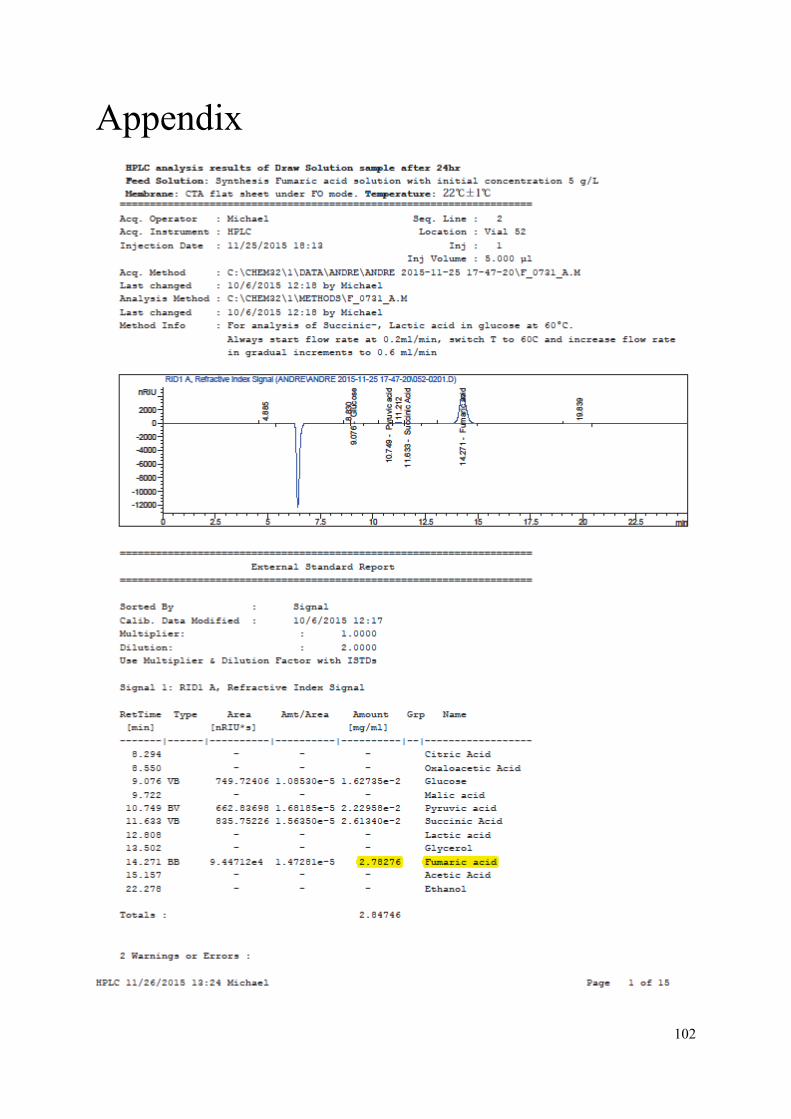
102
Appendix

103

104

105

106
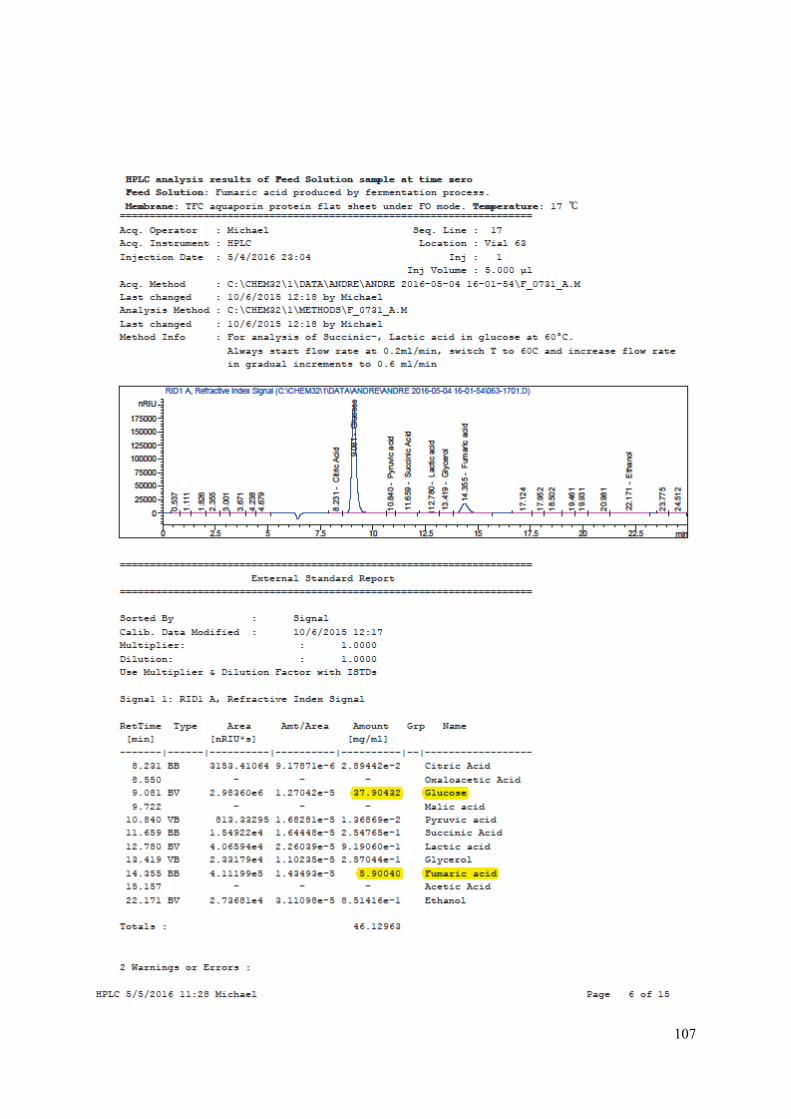
107
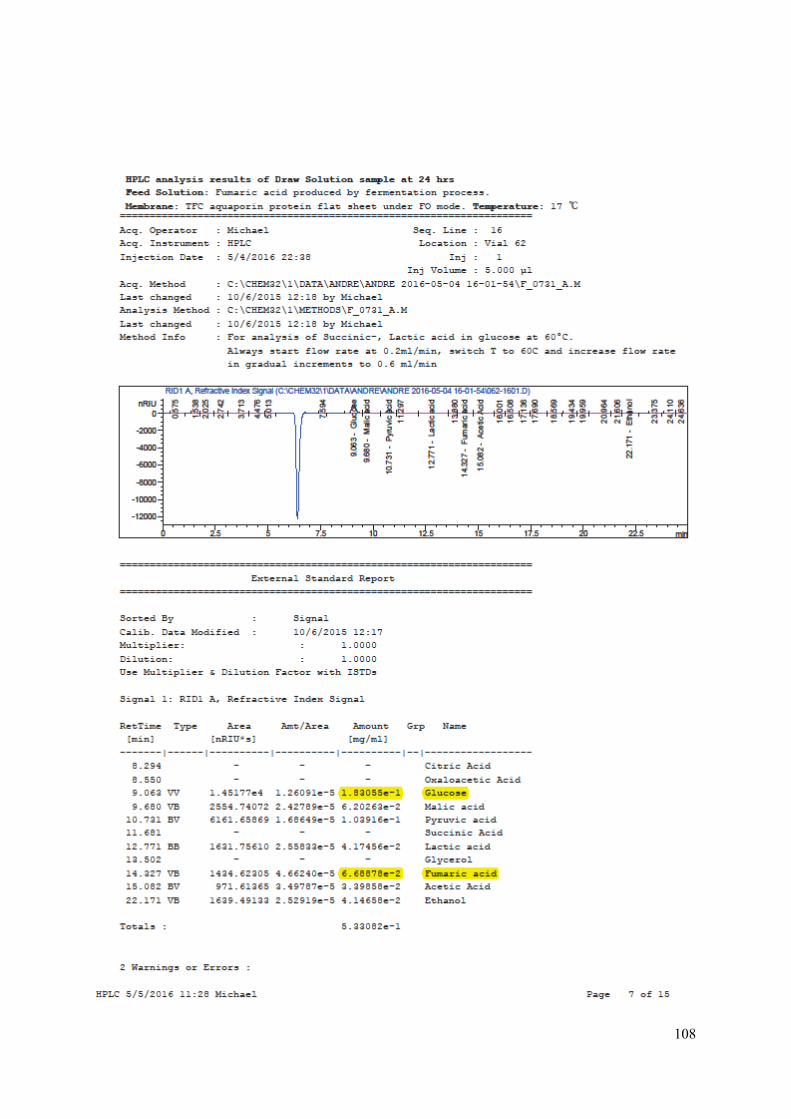
108

109

110
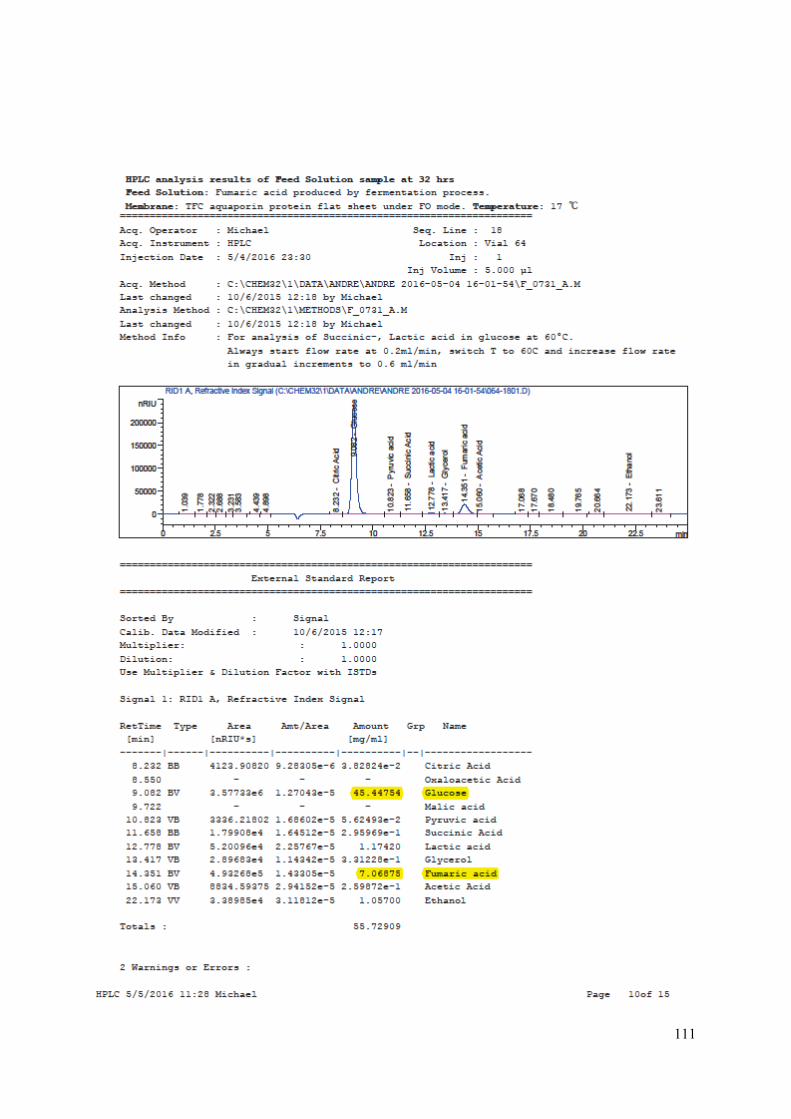
111

112

113

114

115
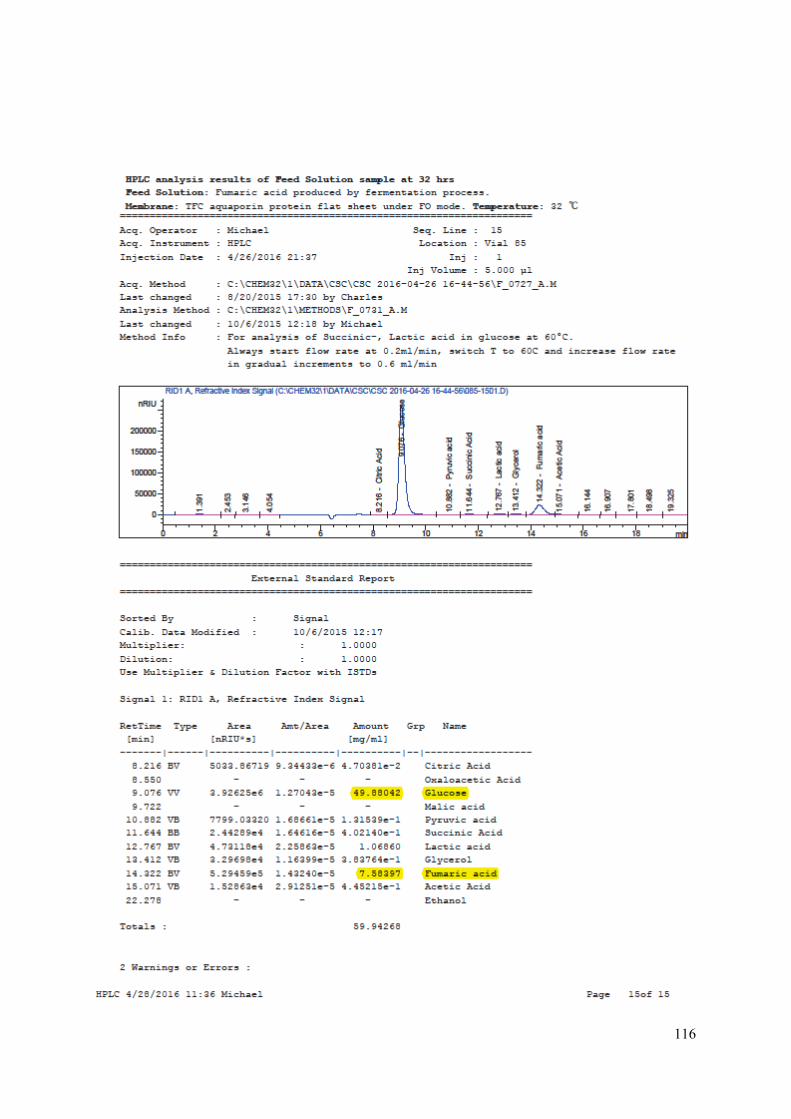
116