forward plan performance metrics definition 2018/19 · 12. whole system optionality 26 13. whole...
TRANSCRIPT

Forward Plan Performance Metrics Definition 2018/19

2Forward Plan Performance Metrics Definition National Grid
1. Commercial assessment transparency 3
2. BSUoS forecast provision 5
3. Trades data transparency 6
4. Forecasting accuracy 7
5. Balancing cost management 10
6. Reform of Balancing Services markets 15
7. New provider on-boarding 17
8. Market diversity 18
9. BSUoS billing 20
10. Code administrator – stakeholder satisfaction 22
11. Charging Futures 23
12. Whole system optionality 26
13. Whole system – unlocking cross-boundary solutions 27
14. Connections agreement management 28
15. System access management 29
16. Future GB electricity system security 30
17. NOA consumer benefit 32
18. NOA engagement 34
Appendix 1 – Forecasting points definition 35
Appendix 2 – Triad avoidance methodology 36
Appendix 3 – Summary of our 2018/19 potential value to unlock 38
The Delivery Schedule for each principle contains a number of deliverables and metrics which contribute to consumer value. The aim of this document is to provide detailed information on each performance metric and the elements used in estimating potential consumer value to unlock.
This document is structured in the following sections:
The Performance Metrics 1-18: For each metric this document provides a very brief consumer benefit statement, allows explanation of the context, a description of the framework and details of operation of the metric.
Summary of 2018/19 Potential Consumer Value to Unlock: A table which provides for each principle an overview of how we have estimated the potential consumer value benefit which can be released through actions set out in the Forward Plan as published in March 2018.
3Forward Plan Performance Metrics Definition National Grid
1. Commercial assessment transparency
Consumer benefitReduction in costs due to efficient market facilitation and data transparency leading to increased ancillary services market participation. Better informed market participants are able to use more efficient bidding strategies and to reduce their risk premia caused by information uncertainty. The ESO is focusing on the tendering process, to avoid as much as is possible, procuring services in real-time / Control Room timescales so that costs can be optimised.
Delivering the results of tender assessments punctually gives providers time to absorb what is happening in the market, reflect on this, and incorporate learning into their bidding strategies for the next rounds. This should lead to greater confidence in the market and a clearer understanding of pricing, which will in turn lead to increased participation in these markets.
ContextAncillary service providers have told us that they value clarity and transparency on how we procure ancillary services. A number of factors determine the value of these services. Providers have highlighted that the better they understand how we assess value and make procurement decisions, the better they can tailor their offers to meet our requirements. This should lead to greater confidence in the market and a clearer understanding of pricing.
This metric incentivises the ESO to publish on-time, clear, useful market information and results and to make sure providers understand our procurement decisions. It also incentivises the ESO to establish a continuous feedback loop from our providers. We will run webinars to explain how we make our decisions and to receive feedback from our providers on what they need to enable them to make more effective offers into the market.
FrameworkThe tender process is as follows:
1. Structuring and Optimisation (S&O) receives tenders from Contracts and Settlements (C&S).
2. S&O runs an assessment. 3. S&O determines the contracts to award, and gets sanction for that.4. S&O provides the results to C&S (whether a tender is accepted/rejected), and where
possible a reason for rejection.5. C&S uses the information to publish the results to our website.
Firm Frequency Response (FFR) and Fast Reserve have schedules detailing when we will publish the results. Currently FFR and Fast Reserve results are published on a specific business day of the month (12th business day for FFR and 14th business day for Fast Reserve). Publication of Short Term Operating Reserve (STOR) results is flexible based on operational requirements; however we will publish a schedule of publication dates. The schedule is published by the tender lead within the C&S team before April 2018.
MetricWe are striving to meet customer needs which they have expressed as wanting the information as soon as possible.
The core measure is the publication of Ancillary Services/Balancing Services (AS/BS) tender assessment decisions to a published schedule. This is for Firm Frequency Response1(FFR), Short Term Operating Reserve2 (STOR), and Fast Reserve3 which we run monthly for FFR and Fast Reserve, and three times a year for STOR. These three tendered services are the ones that we run regularly. Others are run on a more ad-hoc basis. We will continue to explore how to measure our performance in these areas.
Ancillary Service providers are submitting more complex bids. This has increased the workload. At the same time, we endeavor to make a step change in how we interact with parties and provide more timely and transparent market information. We need to accommodate increased numbers of providers, as well as an increase in the numbers of units that are tendered in.
1 https://www.nationalgrid.com/uk/electricity/market-operations-and-data/system-balancing-reports
2 https://www.nationalgrid.com/uk/electricity/balancing-services/reserve-services/short-term-operating-reserve-stor?market-information
3 https://www.nationalgrid.com/uk/electricity/balancing-services/reserve-services/fast-reserve?market-information
ESO role Principle
Managing system balancing and operability 1. Support market participants to make informed decisions by providing user-friendly, comprehensive and accurate information.

4Forward Plan Performance Metrics Definition National Grid
We have seen an increase in the number of tenders received across all three regularly tendered ancillary services. This has been most noticeable in the FFR dynamic market. In the first quarter of 2017, on average we received eight dynamic tenders per month. In comparison, in the first quarter of 2018, this number rose to an average of 141 tenders per month. It should also be noted that for one of these months (February 2018) the tender was for month ahead only, which attracts a lower number of tenders.
There has been a similar trend in Fast Reserve. In the first quarter of 2018, we received 37 tenders in total. This is more than we received in the whole of 2016 (34 tenders). Finally, the last STOR tender round saw the highest number of tenders received in the last three years with 588 tenders received, an increase of almost 40% on the same tender period in 2017.
Throughout the year, we will report on other work we are doing to drive more value from Tender Assessments, such as:
• Simplifying Balancing Services products and the assessment of how we procure services.
• Standardising current FFR tender design: contract terms and daily windows. Reduc-ing the variability in these areas will increase transparency of our volume requirement, thereby allowing parties to have a better understanding of the value of individual tenders to the SO, which in turn will aid competition. For example, currently providers can tender for any number of months, from one through 24, which makes comparison of different competing tenders challenging. We will therefore be changing our procurement to tender for standard periods, as is the case for the wholesale market. We are also intro-ducing daily windows to align with Electricity Forward Agreement (EFA) blocks, again aligning with the wholesale market.
• Limiting the number of tenders per unit that providers can submit, to reduce complexity of assessments and promote clarity to the market.
• Trialing webinars to explain the assessment process. We will continue to roll these out to cover more products throughout the year. These are aimed at both potential and existing providers. They are in addition to the webinars which we will conduct to explain the results of assessments.
• Where we run an ad-hoc tender, and we feel it would be useful to provide feedback to the market, we will arrange a webinar to cover that ad-hoc tender.
Exceeds baseline expectations: • Meeting baseline expectations performance plus conducting webinars for FFR, Fast
Reserve and STOR to provide the results of the assessments and to engage with stakeholders. The ESO commits to trial results webinars for FFR and Fast Reserve for six months (one per tender) and will collect formal feedback periodically (twice during the six-month period). The ESO commits to trialing a results webinar for STOR for TR35 and TR36 and will collect formal feedback after each one. The webinars will be available to those companies with a signed framework agreement.
• Stakeholder feedback will be reviewed and, where possible, changes will be made to the content of the webinars or we will consult further with industry to implement suggested value-add activity, where feasible, to enhance the customer/stakeholder experience.
Meets baseline expectations: • Results published on time, right first time, 91% of the time for FFR and Fast Reserve
and on time, right first time 100% of the time for STOR. On time is defined as published on the day stated in the schedule. Right first time is defined as no errors in the data (i.e. all tenders acceptances/rejections clearly stated).
• We will be deemed to have failed to publish right first time if we have to re-publish any results due to errors identified by any party. The ESO will put in place backup arrangements to normal publication methods to act as contingency in the event of systems failures.
Below baseline expectations: • Results published on time, right first time, less than 91% of the time for FFR and Fast
Reserve and on time, right first time less than 100% of the time for STOR.
• Late is defined as published later than the day listed in the schedule.

5Forward Plan Performance Metrics Definition National Grid
2. BSUoS forecast provision
Consumer benefitReduced costs to consumers through better functioning markets due to market participants not having to include as much risk premia in their submitted Balancing Mechanism (BM) bid/offer prices to compensate for the uncertainty and volatility of daily and per settlement-period Balancing Services Use of System (BSUoS) costs. Better visibility of costs for market participants should lead to more efficient market behaviour, and help ‘level the playing field’. Participants will be able to make more informed balancing decisions.
ContextStakeholders have told us that a granular forecast of BSUoS would help them make better informed balancing decisions. BSUoS forecast is currently broken down to monthly resolution.
This forecast will provide a best view of expected BSUoS costs to the market at a single point in time. This will ensure that all participants have the opportunity to benchmark and optimise their commercial positions against a consistent basis, and one that reflects the expected operational context of the next 24 hours.
This is challenging as many external factors impact half-hourly BSUoS, e.g. weather conditions/network and plant availability, as well as complex interplay between this forecast and market behaviour.
This metric will focus the ESO to deliver BSUoS half-hourly cost forecasts as requested by customers. Changing system background conditions make straightforward historical comparisons difficult. The ESO will use its understanding of these changing conditions to help customers understand likely future costs close to real time.
FrameworkThe ESO will develop a new methodology for a half-hourly total BSUoS cost forecast. The forecast will be published on the National Grid website. The measure will count the number of forecasts published during the agreed reporting period.
In addition, we will publish a document describing at high level the main methodology that the forecasting process uses. The measure is the daily delivery, Monday to Friday, of a day ahead half-hourly BSUoS cost forecast by 08:00, and on Friday by 17:00 a half-hourly forecast for the coming Sunday and Monday.
MetricThe following performance targets will be enacted from Q3 2018/19, following deployment and testing of the new BSUoS forecasting system in Q1/Q2 2018/19. As this is a new methodology and forecasting system that will be developed, we believe that publishing these on time 85-95% is an appropriate target to reflect the development of a new methodology and processes.
The publication of the forecast itself has potential to alter market participants’ behaviour, as they respond to and act on the information. Therefore, the act of publishing a forecast has the potential to change the initial conditions and assumptions used to create the forecast, and as such a measure of forecast accuracy is not proposed at this point. However, once the forecast model is established and in production, we will collate data and identify the drivers of the change in BSUoS outturn from published forecast.
Exceeds baseline expectations: Greater than 95% forecasts published on the National Grid website by agreed schedule.
Meets baseline expectations: 85-95% forecasts published on the National Grid website before 08:00 each publication day for Tuesday to Saturday forecasts, and by 17:00 on Fridays for Sunday to Monday forecasts (the agreed schedule).
Below baseline expectations: Fewer than 85% forecasts published on the National Grid by agreed schedule. The target will exclude all planned outage/downtime of the IT systems.
ESO role Principle
Managing system balancing and operability 1. Support market participants to make informed decisions by providing user-friendly, comprehensive and accurate information.

6Forward Plan Performance Metrics Definition National Grid
3. Trades data transparency
Consumer benefitLower costs for consumers due to improved transparency for market participants, resulting in more informed decision-making by participants, and those participants holding lower risk premia associated with this activity.
ContextAt Operational Forums, industry has explicitly asked for greater frequency of trades data publication, highlighting that delay introduces increased risk in their decision-making.
This metric will drive the SO to be transparent and punctual in providing data.
This metric supports a newly developed process using new software to greatly increase the frequency of publication of trades data.
Framework To meet forecast energy requirements at minimum cost, National Grid trades energy-related products forward in time, when appropriate.
Stakeholders have told us that they want the information about trades enacted by the ESO to be available more quickly than they can currently obtain it, which is at daily frequency.
The ESO has invested in a new platform which will allow trades information to be published within one hour of its being available. The aim is to carry out seven-day-a-week publication of trades information within the targeted frequency of one hour.
The information on trades with all parties will be published at https://trades.nationalgrid.co.uk
This website will display all upcoming electricity trades due to be delivered no sooner than 90 minutes from the current time. The website will pull new trade data every 10 minutes.
Users can also subscribe to receive email notifications. The system will check for trade data every 10 minutes. If the data contains new upcoming trades, an email notification is sent out to all subscribers with the latest trade data attached as a CSV file.
The ESO will continue to engage with stakeholders throughout the year through the Operational Forums to elicit their feedback on the system, and act on any suggested modifications where possible.
Metric The target is to publish 80-90% of all trades data within one hour of capture in the first year of deploying this new system. In the development of this new platform, the ESO has struck a balance between the cost of system availability and how critical the uptime of this platform is. 99% system availability with rapid response service level agreements comes with a high price tag. The ESO has made an efficient choice which balances stakeholder need and cost. Therefore on-target performance is set at 80-90% of all trades data published within one hour of capture.
We will be trialing the system in Q1 2018/19 and then will measure publication performance as detailed here from Q2 2018/19 onwards.
We will trial the implementation of a weekly report detailing the timestamping of the data through April and May 2018, which will then become the mechanism of reporting the performance.
Exceeds baseline expectations: Publish > 90% of all trades data within one hour of capture.
Meets baseline expectations: Publish 80-90% of all trades data within one hour of capture.
Below baseline expectations: Publish < 80% of all trades data within one hour of capture.
ESO role Principle
Managing system balancing and operability 1. Support market participants to make informed decisions by providing user-friendly, comprehensive and accurate information.
7Forward Plan Performance Metrics Definition National Grid
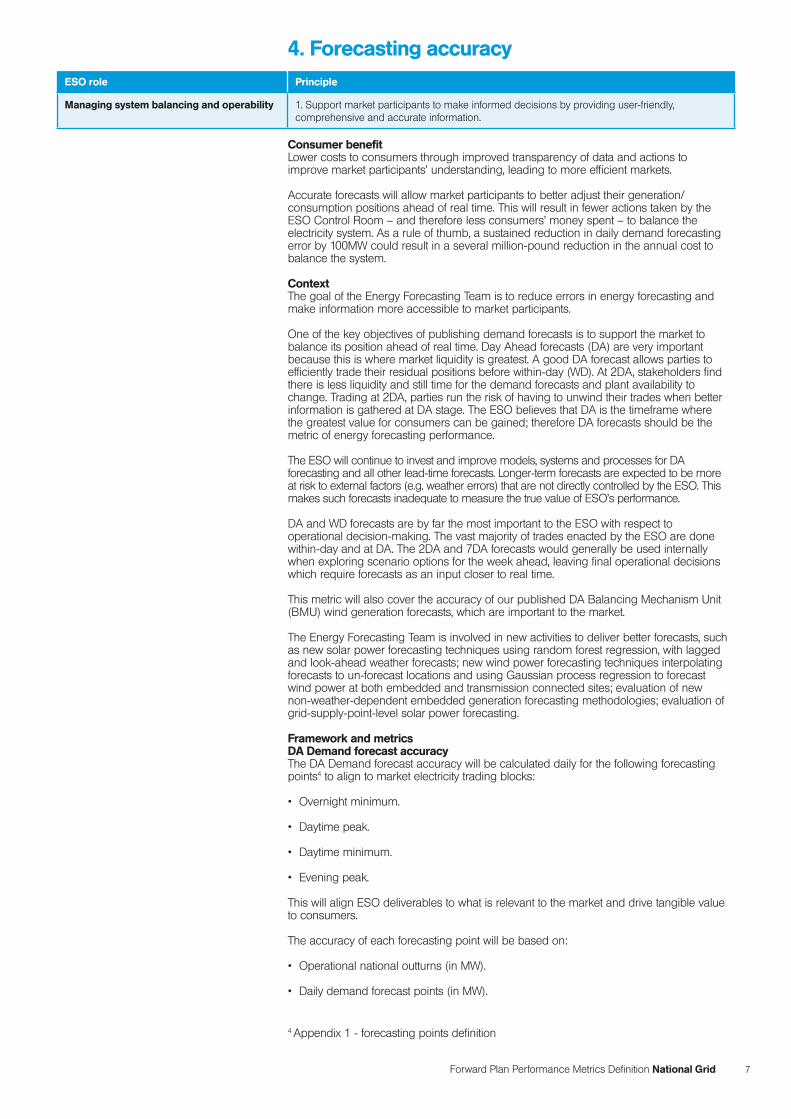
4. Forecasting accuracyESO role Principle
Managing system balancing and operability 1. Support market participants to make informed decisions by providing user-friendly, comprehensive and accurate information.
Consumer benefit Lower costs to consumers through improved transparency of data and actions to improve market participants’ understanding, leading to more efficient markets.
Accurate forecasts will allow market participants to better adjust their generation/consumption positions ahead of real time. This will result in fewer actions taken by the ESO Control Room – and therefore less consumers’ money spent – to balance the electricity system. As a rule of thumb, a sustained reduction in daily demand forecasting error by 100MW could result in a several million-pound reduction in the annual cost to balance the system.
Context The goal of the Energy Forecasting Team is to reduce errors in energy forecasting and make information more accessible to market participants.
One of the key objectives of publishing demand forecasts is to support the market to balance its position ahead of real time. Day Ahead forecasts (DA) are very important because this is where market liquidity is greatest. A good DA forecast allows parties to efficiently trade their residual positions before within-day (WD). At 2DA, stakeholders find there is less liquidity and still time for the demand forecasts and plant availability to change. Trading at 2DA, parties run the risk of having to unwind their trades when better information is gathered at DA stage. The ESO believes that DA is the timeframe where the greatest value for consumers can be gained; therefore DA forecasts should be the metric of energy forecasting performance.
The ESO will continue to invest and improve models, systems and processes for DA forecasting and all other lead-time forecasts. Longer-term forecasts are expected to be more at risk to external factors (e.g. weather errors) that are not directly controlled by the ESO. This makes such forecasts inadequate to measure the true value of ESO’s performance.
DA and WD forecasts are by far the most important to the ESO with respect to operational decision-making. The vast majority of trades enacted by the ESO are done within-day and at DA. The 2DA and 7DA forecasts would generally be used internally when exploring scenario options for the week ahead, leaving final operational decisions which require forecasts as an input closer to real time.
This metric will also cover the accuracy of our published DA Balancing Mechanism Unit (BMU) wind generation forecasts, which are important to the market.
The Energy Forecasting Team is involved in new activities to deliver better forecasts, such as new solar power forecasting techniques using random forest regression, with lagged and look-ahead weather forecasts; new wind power forecasting techniques interpolating forecasts to un-forecast locations and using Gaussian process regression to forecast wind power at both embedded and transmission connected sites; evaluation of new non-weather-dependent embedded generation forecasting methodologies; evaluation of grid-supply-point-level solar power forecasting.
Framework and metrics DA Demand forecast accuracy The DA Demand forecast accuracy will be calculated daily for the following forecasting points4 to align to market electricity trading blocks:
• Overnight minimum. • Daytime peak. • Daytime minimum. • Evening peak.
This will align ESO deliverables to what is relevant to the market and drive tangible value to consumers.
The accuracy of each forecasting point will be based on:
• Operational national outturns (in MW). • Daily demand forecast points (in MW).
4 Appendix 1 - forecasting points definition
8Forward Plan Performance Metrics Definition National Grid
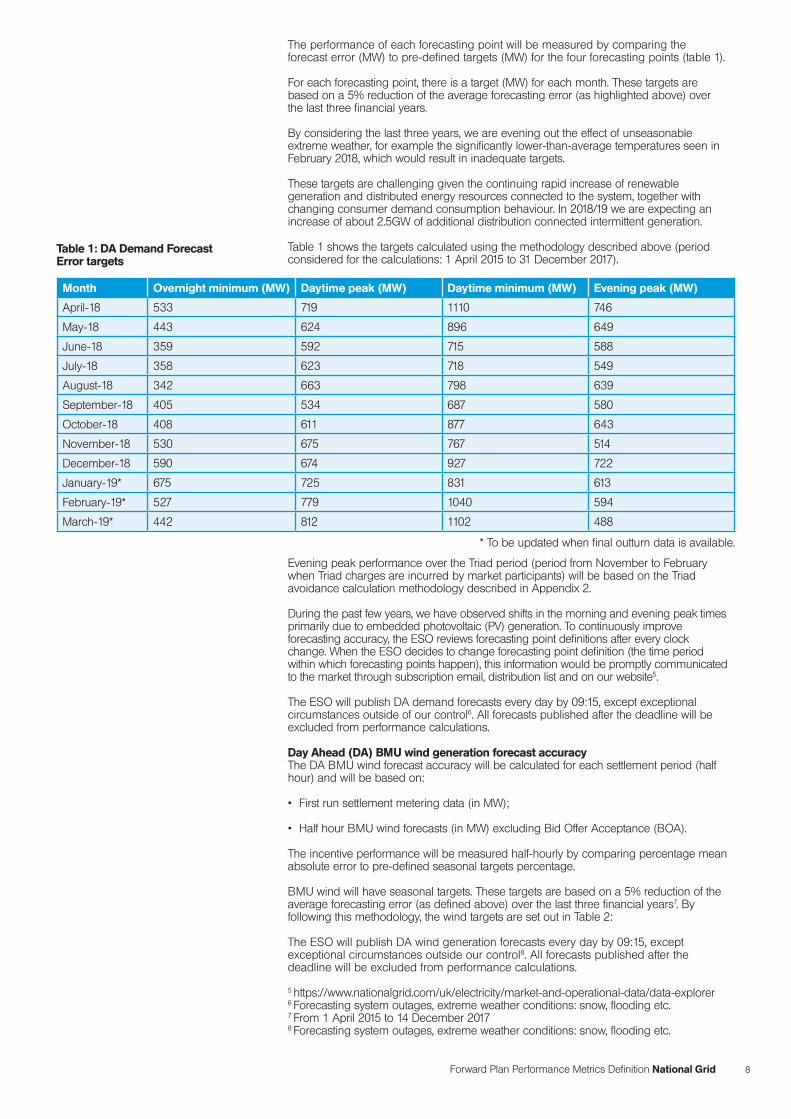
The performance of each forecasting point will be measured by comparing the forecast error (MW) to pre-defined targets (MW) for the four forecasting points (table 1).
For each forecasting point, there is a target (MW) for each month. These targets are based on a 5% reduction of the average forecasting error (as highlighted above) over the last three financial years.
By considering the last three years, we are evening out the effect of unseasonable extreme weather, for example the significantly lower-than-average temperatures seen in February 2018, which would result in inadequate targets.
These targets are challenging given the continuing rapid increase of renewable generation and distributed energy resources connected to the system, together with changing consumer demand consumption behaviour. In 2018/19 we are expecting an increase of about 2.5GW of additional distribution connected intermittent generation.
Table 1 shows the targets calculated using the methodology described above (period considered for the calculations: 1 April 2015 to 31 December 2017).
Month Overnight minimum (MW) Daytime peak (MW) Daytime minimum (MW) Evening peak (MW)
April-18 533 719 1110 746
May-18 443 624 896 649
June-18 359 592 715 588
July-18 358 623 718 549
August-18 342 663 798 639
September-18 405 534 687 580
October-18 408 611 877 643
November-18 530 675 767 514
December-18 590 674 927 722
January-19* 675 725 831 613
February-19* 527 779 1040 594
March-19* 442 812 1102 488
* To be updated when final outturn data is available.
Evening peak performance over the Triad period (period from November to February when Triad charges are incurred by market participants) will be based on the Triad avoidance calculation methodology described in Appendix 2.
During the past few years, we have observed shifts in the morning and evening peak times primarily due to embedded photovoltaic (PV) generation. To continuously improve forecasting accuracy, the ESO reviews forecasting point definitions after every clock change. When the ESO decides to change forecasting point definition (the time period within which forecasting points happen), this information would be promptly communicated to the market through subscription email, distribution list and on our website5.
The ESO will publish DA demand forecasts every day by 09:15, except exceptional circumstances outside of our control6. All forecasts published after the deadline will be excluded from performance calculations.
Day Ahead (DA) BMU wind generation forecast accuracy The DA BMU wind forecast accuracy will be calculated for each settlement period (half hour) and will be based on: • First run settlement metering data (in MW);
• Half hour BMU wind forecasts (in MW) excluding Bid Offer Acceptance (BOA).
The incentive performance will be measured half-hourly by comparing percentage mean absolute error to pre-defined seasonal targets percentage.
BMU wind will have seasonal targets. These targets are based on a 5% reduction of the average forecasting error (as defined above) over the last three financial years7. By following this methodology, the wind targets are set out in Table 2:
The ESO will publish DA wind generation forecasts every day by 09:15, except exceptional circumstances outside our control8. All forecasts published after the deadline will be excluded from performance calculations.
5 https://www.nationalgrid.com/uk/electricity/market-and-operational-data/data-explorer
6 Forecasting system outages, extreme weather conditions: snow, flooding etc. 7 From 1 April 2015 to 14 December 2017 8 Forecasting system outages, extreme weather conditions: snow, flooding etc.
Table 1: DA Demand Forecast Error targets
9Forward Plan Performance Metrics Definition National Grid
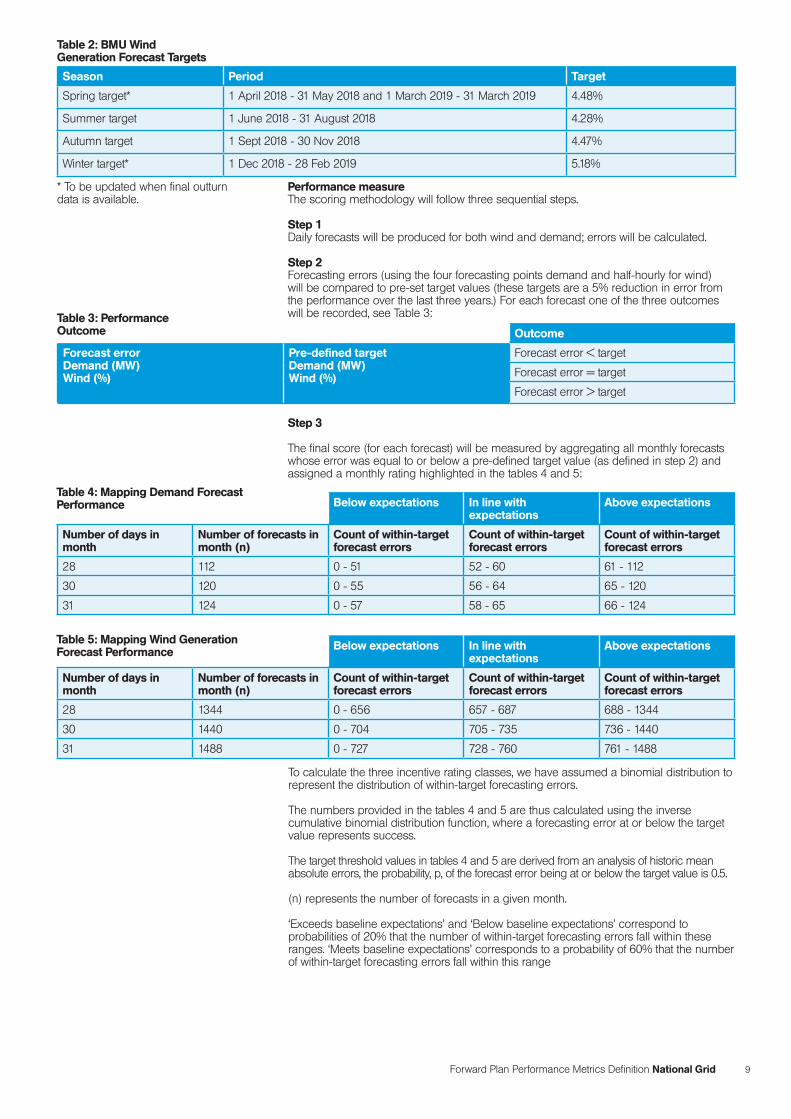
Outcome
Forecast errorDemand (MW)Wind (%)
Pre-defined target Demand (MW)Wind (%)
Forecast error < target
Forecast error = target
Forecast error > target
Below expectations In line with expectations
Above expectations
Number of days in month
Number of forecasts in month (n)
Count of within-target forecast errors
Count of within-target forecast errors
Count of within-target forecast errors
28 112 0 - 51 52 - 60 61 - 112
30 120 0 - 55 56 - 64 65 - 120
31 124 0 - 57 58 - 65 66 - 124
Below expectations In line with expectations
Above expectations
Number of days in month
Number of forecasts in month (n)
Count of within-target forecast errors
Count of within-target forecast errors
Count of within-target forecast errors
28 1344 0 - 656 657 - 687 688 - 1344
30 1440 0 - 704 705 - 735 736 - 1440
31 1488 0 - 727 728 - 760 761 - 1488
Performance measure The scoring methodology will follow three sequential steps.
Step 1 Daily forecasts will be produced for both wind and demand; errors will be calculated.
Step 2 Forecasting errors (using the four forecasting points demand and half-hourly for wind) will be compared to pre-set target values (these targets are a 5% reduction in error from the performance over the last three years.) For each forecast one of the three outcomes will be recorded, see Table 3:
Step 3
The final score (for each forecast) will be measured by aggregating all monthly forecasts whose error was equal to or below a pre-defined target value (as defined in step 2) and assigned a monthly rating highlighted in the tables 4 and 5:
To calculate the three incentive rating classes, we have assumed a binomial distribution to represent the distribution of within-target forecasting errors.
The numbers provided in the tables 4 and 5 are thus calculated using the inverse cumulative binomial distribution function, where a forecasting error at or below the target value represents success.
The target threshold values in tables 4 and 5 are derived from an analysis of historic mean absolute errors, the probability, p, of the forecast error being at or below the target value is 0.5.
(n) represents the number of forecasts in a given month.
‘Exceeds baseline expectations’ and ‘Below baseline expectations’ correspond to probabilities of 20% that the number of within-target forecasting errors fall within these ranges. ‘Meets baseline expectations’ corresponds to a probability of 60% that the number of within-target forecasting errors fall within this range
Season Period Target
Spring target* 1 April 2018 - 31 May 2018 and 1 March 2019 - 31 March 2019 4.48%
Summer target 1 June 2018 - 31 August 2018 4.28%
Autumn target 1 Sept 2018 - 30 Nov 2018 4.47%
Winter target* 1 Dec 2018 - 28 Feb 2019 5.18%
* To be updated when final outturn data is available.
Table 2: BMU Wind Generation Forecast Targets
Table 3: Performance Outcome
Table 4: Mapping Demand Forecast Performance
Table 5: Mapping Wind Generation Forecast Performance

10Forward Plan Performance Metrics Definition National Grid
5. Balancing cost management
Consumer benefitReducing balancing spend by embracing opportunities to reduce requirements or find lower-cost options/better ways to meet system needs. A new, simple, transparent balancing cost metric: a cost benchmark for balancing spend (excluding black start) will drive the ESO to focus on delivering consumer benefit. The ESO will look to save consumers money by finding new ways to reduce balancing requirements and also employ increasingly efficient procurement strategies which take account of long-term and short-term outcomes.
Context The role of the ESO is changing rapidly as the electricity industry transitions to a low-carbon energy system. As the energy resources on the system change, so do the needs of the system to ensure safe delivery of electricity across the network. These requirements can be different from one day to the next. We must match that flexibility with the right systems and Balancing Services to ensure that we meet the expectations of the consumer and continue to provide secure delivery of electricity across our network. It ensures we use the most economic options for relevant timeframes and find innovative ways of doing business with providers to lower costs.
We continue to improve the transparency of our decision-making strategies, balancing requirements and operability challenges. We also look ahead, working with market participants and industry, to make sure that we have tools to deliver an economic, efficient and operable system today and in the future.
This metric drives us to look across the spectrum of system operation to optimise the costs of running the system, in terms of both ‘energy’ and ‘system’ spending. It will also focus the ESO on reducing BSUoS cost for users of the transmission system which should feed through to lower costs for consumers. The narrative provided by the ESO on how value has been achieved will bring a new level of transparency on balancing costs to stakeholders.
Framework The performance of the ESO, in managing balancing costs, can be monitored against a simple benchmark which is created using historical outturns and incorporates a forward view of significant cost drivers. To cover historic volatility, it includes a range in which costs could be expected to outturn. This ensures that the performance measure reflects changes in system conditions and operational requirements as we transition to a transmission system increasingly led by renewable energy sources (RES). This benchmark with a range can better help our customers manage their commercial positions.
The benchmark for expected balancing costs is derived from the application of a linear trend through five-year moving averages of historic balancing cost (excluding black start and Supplemental Balancing Reserve), beginning with the rolling mean for 2010/11-2014/15. We use historical data to develop our baseline costs for two reasons. Firstly, some cost elements are comparatively stable over time and therefore history is a good indicator as to how they will evolve. For those costs that are less stable year on year, by applying a historical dataset that intrinsically reflects a broad range of operational situations, we capture a sufficient number of observations that the ESO has encountered to establish a good baseline for costs. Using only one year as a data point, or indeed a shorter time horizon in the historical dataset, would not provide a robust benchmark, e.g. if the operational context for the chosen year had an unusual component which then affected cost.
The purpose of using a moving average is to smooth out the volatility of year-to-year balancing costs and establish a baseline for future costs. By using a five-year moving average, we are able to calculate a sufficient number of data points to produce a more stable trend that will be less affected by the inclusion of any particular year. This trend is adjusted to account for the offset necessarily induced by the use of the backward-looking rolling mean. This correction provides a fitted moving average to match average historic outturns across the period. Therefore, there may still be underspend/overspend between outturn and benchmark in any single year. The forecast baseline balancing cost using this methodology for 2017/18 is £960.2m. The baseline benchmark for 2018/19 is £979.92m and is set out in Table 1.
ESO role Principle
Managing system balancing and operability 2. Drive overall efficiency and transparency in balance, taking into account impacts of the actions across time horizons.

11Forward Plan Performance Metrics Definition National Grid
Explanation of the trend It is apparent that the metric reflects an increasing trend in costs over the period of calculation. The principal driver behind the increasing cost trend is the transition towards a system with a significantly higher RES penetration. This has required more SO interventions to manage transmission-related issues such as constraints, or more fundamental changes to balancing the system, including the level of system inertia and frequency control. It is important to note that the higher RES contribution can materialise as direct-cost impacts such as thermal export constraints, or second-order impacts such as lower system inertia or higher operating margin costs. We have observed increasing costs in the following areas:
Rate of Change on Frequency (RoCoF) – the ESO has to ensure frequency control is maintained across a number of potential operational events (described in GB SQSS). System inertia is a measure by which the ESO can determine how system frequency would behave should a prescribed operational event occur. In simple terms, the level of system inertia is a function of the amount of synchronous generation (demand) on the system. The higher contribution from non-synchronous RES (wind and PV) generation in recent years has made it necessary for the ESO to implement mitigating strategies, such as carrying more frequency response or managing down the potential largest loss. To do this, the ESO often has to trade (sell) on interconnectors at a discount to market price or desynchronise BMUs in GB. Often this energy then has to be replaced, often at a premium to market. Actions to manage RoCoF during overnight periods throughout the year and during daytime hours on non-business summer days have increased significantly.
Voltage management – the ESO is required to ensure voltage is maintained in a stable range across a number of potential operational events (described in GB SQSS). The voltage profiles on the National Electricity Transmission System (NETS) are not solely under the control of the ESO and can be affected by operations on the distribution networks. Historically, voltage was managed through a combination of generation assets providing or absorbing reactive power and static compensation equipment on the NETS. As RES penetration has increased and conventional generation load factors have fallen, it is increasingly necessary to synchronise conventional assets in the balancing mechanism to provide the necessary reactive range. The costs of these actions tend to be at a premium to wholesale market prices. Furthermore, payments for mandatory reactive provision have also increased.
Intermittency – while increased dispersion of RES has mitigated some of the effects of intermittency, it is still necessary to carry additional reserves to mitigate the energy shortfall risk. This has led to an increase in positive margin costs including operating margin and STOR costs. Furthermore, we have observed an increase in volatility and the absolute level of offer prices in the Balancing Mechanism during periods of tightened system margin.
Negative margin – it is important that the ESO is able to reduce generation rapidly in the event of a high frequency event (where generation exceeds demand). This contingency is typically delivered by ensuring generation can reduce output to a Stable Export Limit (SEL). During periods of high system output from RES, there is often too much inflexible plant on the system, often already operating at SEL. This is often as a result of the revenue drivers on RES, e.g. output necessitated by Renewable Obligation Certificates (ROCs) in combination with inflexible thermal generation not desynchronising as a result of technical inflexibility or risk avoidance. Therefore, the ESO has to intervene to desynchronise inflexible generation and synchronise flexible generation to deliver the negative margin requirements.
Energy imbalance – in recent years, we have observed the net imbalance volume (NIV) becoming less ‘long’. Typically, the market has delivered a ‘long’ position (generation exceeds demand). However, on average it more typically operates closer to balance. A long system would traditionally have delivered revenue from bids acceptances. However, the more balanced system and an increased likelihood for the need to accept negative bids for energy balancing has reduced the revenue impact from these balancing actions.
We recognise that there are a number of foreseeable fundamental or structural drivers that might impact the balancing cost metric. This may be because some costs reflected in the history are not expected to continue, or costs expected to arise may not be reflected in the historical trend. We therefore consider additional adjustments to the adjusted rolling average to reflect the impact from the addition or removal of these potential costs drivers. We have limited these adjustments to three, recognising that the intent of them would be to reflect only structural changes to the benchmark that could lead to higher or lower costs in the forecast year. We have considered the following cost drivers:
1. Managing summer minimum demand periods and the associated costs in frequency response and management of system inertia during high RES penetration periods. This is likely to increase costs.
2. Impact on balancing costs due to higher RES penetration and the impact on revenues

12Forward Plan Performance Metrics Definition National Grid
of thermal or contestable plant. We would expect to see an increase in some elements of service pricing if revenues become increasingly constrained, in the main presenting through higher operating margin and constraint costs.
3. The full commissioning of the Western Link HVDC (WLHVDC9) which should lower costs.
The outcomes of these assessments are:
Managing summer minimum demand periods – we have noted that one of the underlying drivers in the trend is the impact of RES on balancing costs. However, we expect that in the coming years a threshold will be crossed when inertia on the system is not sufficient to allow secure frequency control. When this threshold is reached, we will have to actively manage inertia by decreasing non-inertial renewable output and increasing inertial conventional output, beyond the levels already reflected in the trend. We undertook some additional modelling to determine whether this is likely to happen in 2018-/19.
To estimate the impact: • We modelled summer conditions at overnight and within-day demand minimums
through a large number of simulations (Monte Carlo modelling)
• The conditions encompass • Underlying demand • Wind and PV generation renewable • BMU generation by generation type (nuclear, hydro, must-run generation, other
generation)
• We then calculated residual demand to be met by inertial generation • Calculate inertia on system • Calculate response on system
• We then used response model to see if there is enough potential response to meet inertial conditions • If there is a deficit, reduce non-inertial generation and increase inertial generation to
meet SQSS standards. Estimate the cost of these actions
Our model runs strongly suggest there will be no impact this coming summer, and so our initial view is that the impact, and hence the adjustor for this factor, will be zero.
Impact on balancing costs due to higher RES penetration – while we have observed significant price spikes during periods of tight system margins, particularly during winter 2016/17, we believe further modelling work is needed in addition to more historical observations within a stable market context. We believe that there will be more incidents of high price periods in future driven by underlying pricing strategies of contestable generation that will be seeking revenue streams from shorter-term markets and the balancing mechanism. Indeed we observed comparatively high offer prices on 1 March 2018. However, we believe more observations supported by further market modelling is required to determine the definitive drivers that may lead to this. We therefore believe that the trend derived from the rolling average better reflects the likely increase in costs for 2018/19.
The full commissioning of the WLHVDC – the rolling average from historical years will reflect the constraint costs that have been incurred under the connect and manage regime across the Anglo-Scottish boundary (Cheviot). The WLHVDC is one of the investments that increases the boundary capability and so will reduce the level of constraints, particularly on wind generation. It is difficult to isolate the impact of one asset on constraint costs, particularly because the operational context continuously changes, as do the operational decisions, including co-optimisation across actions to minimise total costs. Furthermore, the meshed nature of the NETS means that the interactions across assets and underlying generation patterns cannot be isolated. It is therefore extremely difficult to define a comparable basis to make a cost-impact estimate. Our estimate of the impact was based on an analysis of costs in 2017/18 and then applying a counterfactual determination of which of these costs would have been avoided had WLHVDC been operational through 2017/18.
This analysis used the volumes and costs that were ‘tagged’ as costs incurred in managing the transfers over the Cheviot boundary. For the bid volumes that would have been avoided (using the counterfactual boundary calculations), if WLHVDC had been operational, we valued against the ‘lost opportunity’ cost, i.e. the price that could have been realised in an unconstrained system. Our analysis produced an estimate for a range of costs, from which we have chosen the upper bound to adjust the balancing cost KPI, as detailed in table 1.
9 http://www.westernhvdclink.co.uk/

13Forward Plan Performance Metrics Definition National Grid
Benchmark range We have established a benchmark range that will reflect the uncertainty that is intrinsic to a system with a high proportion of RES. The range is based on an analysis of historic balancing cost elements that can be significantly affected by factors beyond the direct control of the ESO.
We have assessed the range of uncertainty around the Balancing Service cost model using historical data from April 2011 onwards. Historically, one of the drivers of Balancing Services costs has been wind generation behind the Cheviot constraint. With the advent of the WLHVDC, we no longer expect this to be such a significant driver.
First, we assess how much the Cheviot wind generation explains the variability in costs.
A simple linear model shows that historically the Scottish wind explains 20% of the monthly variability in costs. Again using historical data, we assess that the cost of variability in wind generation alone is +/- £2.5 million. Hence we expect the non-wind variability to account for 80% of the historic variability: that is +/- £10 million.
Using the simple linear model for the effect of Scottish wind, we can examine the month-by-month residual variability around the mean value once the Scottish wind costs have been accounted for. We use a local regression to identify monthly inter-annual patterns around which the variation occurs. This should provide an estimate for expected variability in costs, once the WLHVDC is fully operational. The residual cost model is shown below.

14Forward Plan Performance Metrics Definition National Grid
The 95% confidence interval for the local regression has a reasonably constant width of +/- £10m, consistent with the estimate we obtained earlier.
Hence we propose that the uncertainty range for the balancing service cost model should be +/- £10m.
To assist the in-scheme monitoring role that the Authority undertakes, a monthly shape will be applied to the annual projected cost. The principal aim of this will be to provide an understanding of how costs might typically be distributed across the year, so providing a supporting indicator on whether costs are emerging in line with expectations. Where there is deviation, the ESO can provide contextual explanation. To avoid doubt, this monthly shape will only be used for information and context. The performance of the ESO will be assessed against the annual cost benchmark.
The benchmark (BCt) will therefore be: BCt=Sum(Xn(5years)±Xa± Xb± Xc) ± Yt
Where Xn = Linear trend through 5-year rolling means since 2010/11 – 2014/15, adjusted for the offset associated with use of the rolling mean: Xa = Cost Driver 1 Xb = Cost Driver 2 Xc = Cost Driver 3 Yt = range derived from historical analysis
The outturn cost value used in this metric comprises terms defined in National Grid Special Licence Condition 4C.10
Outturn cost = CSOBMt + BSCCt – OMt
Defined as: CSOBMt which represents the cost to the licensee of bids and offers in the Balancing Mechanism accepted by the licensee in Relevant Year t less the total non-delivery charge for that Relevant Year, is the sum across Relevant Year t of the values of CSOBMj (being the daily System Operator BM cashflow for each settlement period j as defined in Table X-2 of Section X of the BSC in force immediately prior to 1 April 2001);
BSCCt means the costs to the licensee of contracts for the availability or use of Balancing Services during the Relevant Year t, excluding costs within CSOBMt and BSCt but including charges made by the licensee for the provision of Balancing Services to itself in the Relevant Year t;
OMt means an amount representing the revenue from the provision of Balancing Services to others during the Relevant Year t, calculated in accordance with paragraph 4C.10.
Benchmark balancing cost 2018/19
Range on benchmark2018/19
Five year moving average with uplift adjustment
WLHVDC impact assessed reduced constraint impact 2018/19
BCt Yt Xn (5years) Xa
£843.52m +/- £10m £979.92m £136.40m
Note for 2018/19, Xb and Xc both equal zero.
Metric Explanation of outturn vs benchmark range Performance will be provided to Ofgem and stakeholders through monthly reporting. Evidence of non-BAU and innovative activities providing cost savings will be presented, along with explanation of the drivers of outturn costs. The information provided will be similar to the monthly reporting that was in place under the previous Balancing Services Incentives Scheme.
Exceeds baseline expectations: Outturn spend < lower bound of benchmark range.
Meets baseline expectations: Outturn spend within benchmark range.
Below baseline expectations: Outturn spend > upper bound of benchmark range.
Table 1

15Forward Plan Performance Metrics Definition National Grid
6. Reform of Balancing Services markets
Consumer benefitReducing costs to consumers by increasing competition through access to markets and revenue streams for potential and existing market participants.
Security of supply should also be improved through greater access to markets.
This metric will drive the ESO to design solutions to meet future system operation challenges and facilitate markets to provide for those needs at the least cost to the end consumer.
Context A flexible network will make the most economic and efficient use of all available resources to meet the continuing needs of the electricity system, thus lowering costs for consumers whilst facilitating the transition to a low-carbon future.
The ESO has highlighted the need to reform the Balancing Services markets to remove barriers to entry to enable new providers to participate. This will increase both the volume and technical range of counterparties which will enable the ESO to increase the flexibility of the electricity system.
The activities required to achieve this objective are:
• Developing and implementing a plan to reform Balancing Services.
• Moving away from bilateral procurement activities to competitive market-based procurement methods wherever possible.
• Facilitate the entry of non-traditional providers into balancing service markets.
To measure the success of the ESO’s actions in these areas, a suite of three metrics is being composed, which together hold the ESO accountable for delivering the reform of the electricity balancing service markets. These work together in the following manner:
ESO role Principle
Facilitating competitive markets 3. Ensure the rules and processes for procuring Balancing Services maximise competition where possible and are simple, fair and transparent.
Reform of Balancing Services markets Tracking our progress in moving away from bilateral procurement towards market based mechanisms.
New provider on-boarding Tracking our progress in facilitating new providers offering Balancing Services.
Market diversity A measure of success of our activities demonstrated through increased liquidity in relevant markets.
This metric will track the progress of the SO in achieving commitments made in the Future Balancing Services Roadmap10.
Framework Part of the ESO’s role is market facilitator and it will work with parties to develop markets so that they, ultimately, better serve consumers. The activity that is under way to develop balancing markets is on a scale far beyond that normally undertaken. It involves working with entirely new groups of stakeholders – private investors, equity investors, small scale developers etc – to understand their business and open up value propositions for them. We are working hand in hand with these stakeholders in an incredibly fast-developing market, breaking down barriers to entry and tackling new issues daily. The issues we are tackling are complex and we need to find the right pace to keep up with this market but also continue to make sure the system operates safely. We have more than 300 participants registered with us who we are actively managing, and 1,500 stakeholders on our Power Responsive distribution list.
Through the Future Balancing Services Roadmap, we commit to reforms to the Balancing Services markets. This will increase the provision of flexible Balancing Services, which is essential in enabling the SO to facilitate the transition to a low carbon network. The Future of Balancing Services Roadmap is published in two parts: the December 2017 roadmap contains our actions for Reserve and Response; in Q1 2018/19, we will be publishing our proposals for black start, Reactive Power and Constraint Management.
These commitments have been publicly made and endorsed by industry, so achieving them is a priority for the SO.
10 https://www.nationalgrid.com/uk/electricity/balancing-services/future-balancing-services

16Forward Plan Performance Metrics Definition National Grid
Metric Part 1: progress against plan We will publish quarterly our progress on reforming balancing service markets. Progress against the plan will be reported, supported by an explanation of the current state of the programme, and, where changes have been made, the rationale for the changes. Where deadlines have been missed or key milestones delivered early we will report the reasons for this.
Part 2: Stakeholder satisfaction As outlined in the Stakeholder Engagement Report published alongside this document we will be using a range of channels, including the electricity Operations and Power Responsive Forums, formal Customer and Stakeholder surveys and newsletters to capture stakeholder views on our progress in this area and how we are engaging.
Topics on which we will be seeking feedback include level of satisfaction with progress of milestones for Balancing Services markets reform and engagement around this activity.
In the coming months we will be reviewing our channels and approaches to develop a robust and integrated process for collecting and reporting on stakeholder feedback. This process will include defining the right questions to ask and establishing appropriate target metrics based on our understanding of current expectations. Progress updates on this activity will be provided via the quarterly performance reporting on our website.
Planning and Execution Performance Exceeds baseline expectations: We carry out all rationalisation and simplification actions to the timeline laid out in the product roadmap and we trial an auction for response in 2018/19.
Meets baseline expectations: We carry out all rationalisation and simplification actions for response and reserve identified in the product roadmap in 2018/19.
Below baseline expectations: We fail to carry out all rationalisation and simplification actions for response and reserve identified in the product roadmap in 2018/19.

17Forward Plan Performance Metrics Definition National Grid
7. New provider on-boarding
Consumer benefitLowering costs for consumers by driving the ESO to focus on providers and potential providers to reduce barriers to market entry, increasing liquidity in Balancing Services markets. This will also benefit consumers through the ESO facilitating the transition to a lower carbon network.
Context We have made commitments to reforming the Balancing Services markets to open the markets to new providers. New providers must go through an ‘on-boarding’ process before they can participate in balancing service markets. Around 100 parties are being actively managed through the on-boarding process currently; around 40 of these have signed framework agreements. We propose two metrics to reflect the maturity of our action in this area.
FrameworkNew providers must go through an on-boarding process before they can participate in balancing service markets. The process starts with introducing the provider to the range of Balancing Services and helping them understand potential opportunities, through to the point where the provider signs a framework agreement and is thereafter able to participate in procurement activities. This metric is intended to measure the ESO’s success in helping new providers (generally those who do not participate in the balancing mechanism – commonly referred to as non-traditional providers) getting to the stage where they are able to offer services. We propose two metrics to reflect the maturity of our action in this area.
Metric Metric 1 (2018/19 and onwards): Stakeholder satisfaction As outlined in the Stakeholder Engagement Report published alongside this document we will be using formal Stakeholder Satisfaction Surveys (SSAT) alongside a range of other tools to capture stakeholder feedback on our activities.
Currently only counterparties that have a signed framework agreement (and are therefore already ‘on-boarded’) are included in the SSAT survey. We propose widening the parties we survey to include the rest of the new providers who we work with (where the ESO Business Development team spends a large proportion of its time) to understand whether those parties are satisfied with the support they are getting from the SO.
Each month we survey a random selection of our existing providers, drawn from a password-protected document containing details of key contacts. An independent third party carries out the survey. The metric is updated every month to reflect the responses received. We propose to retain this process and widen the master list to include all the parties we are currently actively engaged with.
In the coming months we will be reviewing our channels and approaches to develop a robust and integrated process for collecting and reporting on stakeholder feedback. This process will include defining the right questions to ask and establishing appropriate target metrics based on our understanding of current expectations. Progress updates on this activity will be provided via the quarterly performance reporting on our website.
Metric 2 (October 2018 onwards): Progress through on-boarding process
The ESO is working with Unipart Expert Practice (UEP), a consultancy helping us implement ‘Lean’ working practices, and the Customer Strategy team to map out the journey that potential counterparties go through from first showing an interest in the Balancing Services market, through to signing a framework agreement. We are working with UEP to understand this journey and then build a measurement framework that will track the success of the ESO in helping potential service providers progress through this journey. For example, the metric could be the percentage of potential service providers/market participants that successfully pass through each stage gate and the percentage of potential service providers/market participants that pass through each stage gate within defined timescales. We propose to develop this metric during 2018/19 and implement it from October 2018.
As yet, we do not have sufficient understanding of the journey that counterparties go through from first contacting us (often through Power Responsive) to the point where they are able to sign a framework agreement which would enable them to tender in to provide ancillary services.
ESO role Principle
Facilitating competitive markets 3. Ensure the rules and processes for procuring Balancing Services maximise competition where possible and are simple, fair and transparent.

18Forward Plan Performance Metrics Definition National Grid
8. Market diversity
Consumer benefitLowering costs for consumers by increasing competition through access to markets and revenue streams for participants. This metric will drive the ESO to encourage diversity in markets and develop market-based solutions to its needs.
Context We have committed to making changes to the Balancing Services markets to open the markets to new providers. This will facilitate the transition to a low-carbon network as well as increasing market liquidity, reducing cost to consumers. The purpose of this metric is to measure the effectiveness of the work being undertaken to remove barriers to entry to the balancing service markets.
FrameworkThe purpose of this metric is to measure the success of the ESO in removing barriers to entry to a number of balancing service markets. This metric has been restricted to those Balancing Services where markets already exist and therefore focusses the ESO activity on increasing participation in those markets. It works hand in hand with the Reform of Balancing Services metric, which is focused on opening up bilateral procurement activities to market-based methods. Once these markets have been opened to competitive procurement activities, they should be included in this removal of barriers to entry metric, to test the effectiveness of the work.
We have considered using an established liquidity measure, such as the Herfindahl Hirschman Index (HHI) for this metric but consider that this would not drive the correct behaviour. HHI makes an assessment of the market share of each participant in a market. This would not be appropriate in a market such as FFR, where there is a limited requirement and few large (MW volume) participants competing against many small (MW volume) participants. We therefore propose a simple measure of increase in the number of tenders/bids received from individual units (by number rather than MW volume) as a measure of the success in removing barriers to entry. So for each market-based procurement method for Frequency Response and Reserve we would measure the number of tenders/bids, with the objective of increasing the number received.
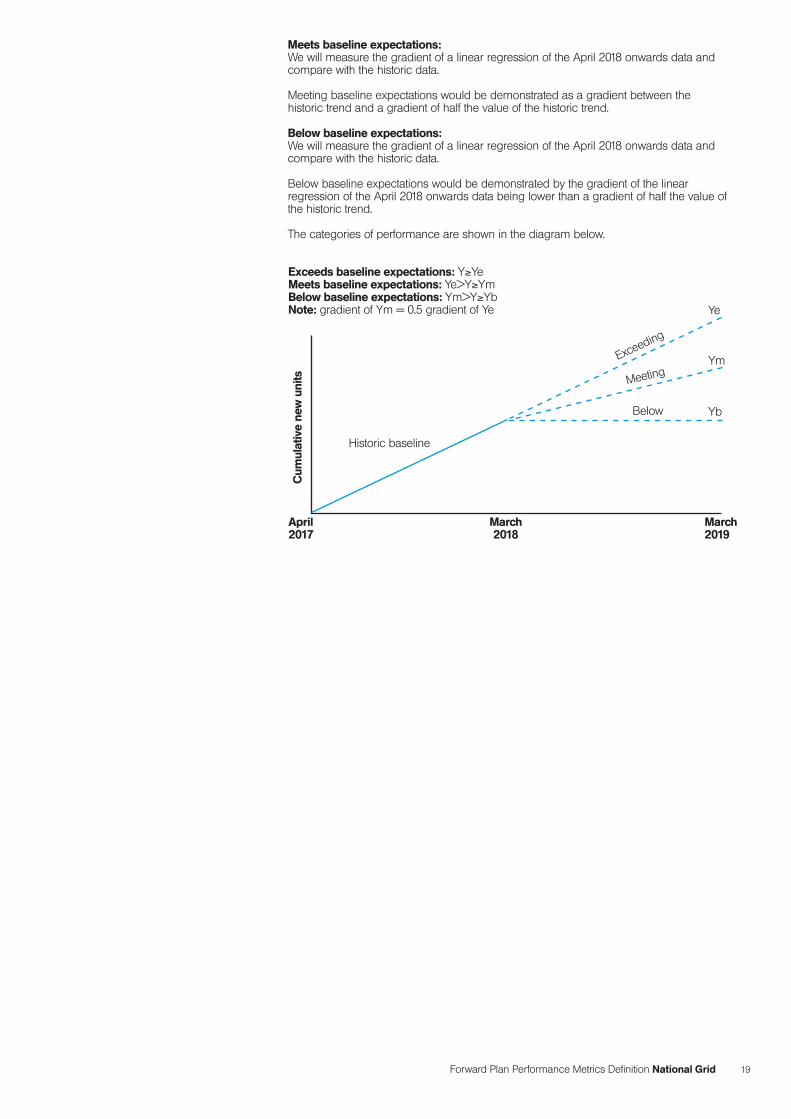
MetricExceeds baseline expectations: Continuation of existing trend in increase in participation. The reason for continuing the existing trend, rather than a higher trend is that there are a number of established aggregators operating in this market – who have caused the historical increase. Going forward, new entrants are more likely to be smaller independent parties who will find the barriers to entry much more difficult to navigate.
We will measure the existing trend as a linear regression of the historical data over the period April 2017 – March 2018.
We will measure the gradient of a linear regression of the April 2018 onwards data and compare with the historic data. A gradient greater than or equal to historic gradient demonstrates exceeding baseline expectations.
ESO role Principle
Facilitating competitive markets 3. Ensure the rules and processes for procuring Balancing Services maximise competition where possible and are simple, fair and transparent.
19Forward Plan Performance Metrics Definition National Grid
Meets baseline expectations: We will measure the gradient of a linear regression of the April 2018 onwards data and compare with the historic data.
Meeting baseline expectations would be demonstrated as a gradient between the historic trend and a gradient of half the value of the historic trend.
Below baseline expectations: We will measure the gradient of a linear regression of the April 2018 onwards data and compare with the historic data.
Below baseline expectations would be demonstrated by the gradient of the linear regression of the April 2018 onwards data being lower than a gradient of half the value of the historic trend.
The categories of performance are shown in the diagram below.
Cum
ulat
ive
new
uni
ts
April 2017
March 2018
March 2019
Historic baseline
Exceeding
Meeting
Below
Ye
Ym
Yb
Exceeds baseline expectations: Y≥YeMeets baseline expectations: Ye>Y≥YmBelow baseline expectations: Ym>Y≥YbNote: gradient of Ym = 0.5 gradient of Ye

20Forward Plan Performance Metrics Definition National Grid
9. BSUoS billing
Consumer benefitReducing the risk premia added to bills caused by uncertainty around bills.
Context The ESO is responsible for billing BSUoS parties for the cost of balancing the system. These customers have told us that BSUoS bills are important in managing their profitability. There are two aspects of BSUoS billing that are important to customers: good quality and timeliness. The prime focus of the Billing team in the coming year is to improve the quality of the BSUoS bills.
These metrics will give the opportunity for the ESO to progress a step change in the ability to acknowledge and close customer queries in a timely way. In recent years, there has been a substantial increase in the number of BSUoS payers and bills so there is a requirement for the ESO to make sure that the quality of service is maintained despite the increasing workload. For example, the number of customers we invoice daily has increased by 65% between April 2014 and January 2018, and the number of BMUs registered has increased from just over 2,000 in April 2014 to over 3,250 in January 2018. In addition, the new providers are often new to the industry and require more support to understand their bill. Maintaining the element of billing on schedule while improving the quality makes this a useful metric.
FrameworkThe measure of the quality of the billing process is response and resolution time of BSUoS billing queries. The aim is to improve on quality while holding steady on timeliness. The ESO has already invested effort in improving the timeliness of bills, measured by the percentage of on-time billing runs.
These metrics will drive the ESO to maintain a high level of reliability and predictability of BSUoS billing process for customers, minimising any deviation from the published billing calendar. It will drive us to steadily improve the quality of customer experience of the BSUoS billing process, with the measure of query closure rate giving a clear view of customers’ experience with the team. As a result, existing and new providers can rely on improved BSUoS billing. This provides more certainty to all on their settled financial position. In turn, this frees bill payers to compete more freely in all market sectors. To continually improve performance against this metric, we will be driven to prioritise the experience of customers alongside maintaining a timely billing process.
Metric The quality measure uses two indicators for quality of BSUoS billing process: Query response time: time taken to respond with a tailored acknowledgment and query reference number to customer BSUoS queries, measured as a percentage of queries acknowledged <1 business day following receipt. Exceeds baseline expectations: >95% initial response within one business day of receipt. Meets baseline expectations: 90-95% initial response within one business day of receipt. Below baseline expectations: <90% initial response within one business day of receipt.
Query resolution time: time taken to resolve/close BSUoS queries, measured as a percentage queries resolved in less than two weeks following receipt. Exceeds baseline expectations: >70% of queries resolved in less than two weeks following receipt. Meets baseline expectations: 60-70% of queries resolved in less than two weeks following receipt. Below baseline expectations: <60% of queries resolved in less than two weeks following receipt.
Historic performance: FY 2017/18 (to date at January 2018): • Baseline performance across April to September 2017 – 53% closed in two weeks. • Performance across YTD (to January 2018) – 63% closed in two weeks.
ESO role Principle
Managing system balancing and operability 4. Promote competition in wholesale and capacity markets.

21Forward Plan Performance Metrics Definition National Grid
The timeliness measure will take the total number of billing runs due each day according to the BSUoS payment calendar and compare the actual number completed against this to give a percentage figure. The billing runs are defined as follows:
• II (interim initial)
• SF (settlement final)
• RF (final reconciliation)
On each billing day, at least one of each of these runs is due to be billed. The BSUoS payment calendar is published online by National Grid11. The dates are set by the requirement for bills to be produced on the next working day following Elexon’s publication of the necessary data for billing. This is the baseline for what is defined as on-time delivery, i.e. according to the dates in the BSUoS payment calendar. The measure will exclude impacts of any movement by Elexon from its own calendar for sending data, though a report of any such instances will be included for information.
The metric will be based on a target percentage of runs completed on time as an annual figure; a monthly percentage figure will be collected and reported by National Grid throughout the year to indicate performance.
Exceeds baseline expectations: >98% billing runs on time.
Meets baseline expectations: 95-98% billing runs on time. Below baseline expectations: <95% billing runs on time.
Historic performance: • FY 2016-17 89% billing runs on time. • FY YTD 2017-18 98% billing runs on time.
11 https://www.nationalgrid.com/sites/default/files/documents/45780-BSUoS%20Payment%20Calender%202015-2017%20Web.xlsx
22Forward Plan Performance Metrics Definition National Grid
ESO role Principle
Managing system balancing and operability 4. Promote competition in wholesale and capacity markets.
10. Code administrator – stakeholder satisfaction
Consumer benefitImproved performance in our code administration function will support all stakeholders to effectively navigate and engage with code change, increasing the efficiency and pace of the process. In turn, this will maximise the direct consumer benefits that can be captured through individual code change modifications.
ContextThe ESO is code administrator for three codes: Connection and Use of System Code (CUSC), System Operator Transmission Owner Code (STC) and Grid Code. In this role, the ESO will focus on a variety of key areas, such as access and quality of information as well as tailored support for new participants, to improve its performance. We believe this will help speed up the code change process, reducing the resource pull on industry and helping break down barriers to engagement with new market entrants and smaller companies. The most recent comprehensive customer satisfaction survey in this area was the Ofgem-run Code Administration Code of Practice (CACoP)12 survey which was reported to industry in early 2017 (for 2016/17) and which shows underperformance for the ESO. Customers have told us that we need to enhance the service that we offer in administering codes.
The most recent CACoP survey highlighted the gap in performance between the ESO and other code administrators. After listening to the feedback from our customers, we want to improve our performance and have set ourselves an ambitious step-change strategy over the next three years. We will transform the service that we provide to the industry so that we are judged as a leading industry code administrator.
For the year ahead, we have committed to significantly increase our resources to meet the expectations of our customers. While the CACoP survey will inform the detail of the improvement plan, feedback to date will likely result in a number of key themes being evident within the plan. Feedback highlights the need to focus on improving the level of support and guidance that we provide in administering modifications to our customers; provide simplified information to our customers; and improve how we support the code administration process to be more inclusive to wider stakeholders within the energy industry.
Improving the efficiency of the code change processes and increasing engagement with the codes, especially for smaller customers, and removing barriers to effective code change could also improve the timeliness and quality of industry change in the interests of consumers.
Framework The ESO will use the results from Ofgem’s 2017/18 CACoP survey for its three codes – CUSC, STC and Grid Code – as the baseline for its performance. Following the results, which are expected in May 2018, we will develop a code administrator improvement plan to act on the feedback that we receive from this survey. To make sure we are targeting the most important areas for improvement, we will publish and consult on our improvement plan during Q2 2018.
The remainder of the year will focus on achieving the commitments that we have made to our customers in the improvement plan. In Q4 2018/19, the CACoP survey will be rerun, which will act as the mechanism to demonstrate the effectiveness of our overall service performance and how well we have managed to carry out the actions contained within the improvement plan.
Metric We acknowledge that there is considerable effort required to successfully achieve this, so for the incentive year 2018/19, we are targeting top-half performance for each of our codes when benchmarked against other code administrators. As an example, benchmarking top-half performance against the 2016/17 CACoP would provide a target of 71%, whereas we scored 45% for STC, 47% for CUSC and 59% for Grid Code.
Exceeds baseline expectations: Top-half overall performance (net satisfied responses) across all of our three codes (STC/CUSC/Grid Code) when benchmarked with other code administrators in the 2019/20 CACoP survey due to be carried out in spring 2019.
Meets baseline expectations: Top-half overall performance (net satisfied responses) based on the average score across our three codes (STC/CUSC/Grid Code) when benchmarked with other code administrators in the 2019/20 CACoP survey.
Below baseline expectations: Bottom-half overall performance (net satisfied responses) based on an average score across our three codes (STC/CUSC/Grid Code) when benchmarked with other administrators in the 2019/20 CACoP survey.
12 https://www.ofgem.gov.uk/licences-codes-and-standards/codes/industry-codes-work/code-administration-code-practice-cacop

23Forward Plan Performance Metrics Definition National Grid
ESO role Principle
Managing system balancing and operability 4. Promote competition in wholesale and capacity markets.
11. Charging Futures
Consumer benefitBy supporting current and future network customers through change, Charging Futures will help realise benefits to the end-consumer by: • Stimulating competition and facilitating an expanding market – reducing barriers to entry for new customers, leading to greater choice and enhanced service for consumers.
• Managing a complete and collaborative cross-system change process – allowing the industry to fully understand how a new charging and access regime can drive the most efficient use of the network, while recovering costs fairly for consumers.
ContextCharging Futures has been set up to respond to industry’s call for better coordination of charging and access reform, where network users and consumers can contribute to change no matter their size or how they use the network. We know there is a range of knowledge and resources across the industry to manage reform, which is why our role is to create one place where every network user can easily learn, collaborate and contribute to change. Charging Futures will help promote competition by enabling industry to shape reforms at pace, and in a way that levels the playing field in network charging.
Charging Futures will support customers across the whole system. Through focused engagement activities we will upskill the industry; remove barriers to accessing market reform; and feed a range of perspectives into the change process. We will do this through: • A simple and plain English approach to communicating change.
• Clear and various routes to engage at all stages of the change process.
• Identifying market access barriers, and reducing these in a timely manner. • Reducing the time and cost for stakeholders to effectively engage in change process. • Greater transparency of the decision-making process in the development of new
charging policy.
Our role as lead secretariat for Charging Futures is a new area of accountability for us and allows us to exhibit our proactive stance in helping the industry to best engage with charging reform. Our performance should be judged on how well we can enable the industry change process. This will be measured by outcome-focused performance indicators.
We have committed to three engagement objectives to best support industry through Charging Futures. Every network user, no matter their size or where they are connected to the electricity network, has the opportunity to:
1. Learn – about electricity network charging across the whole system today, and how it could change in the future.
2. Ask – regularly ask charging and regulatory experts questions related to reforms, and wider charging code change.
3. Contribute – be able to contribute to reform at all stages and through a number of ways.
24Forward Plan Performance Metrics Definition National Grid
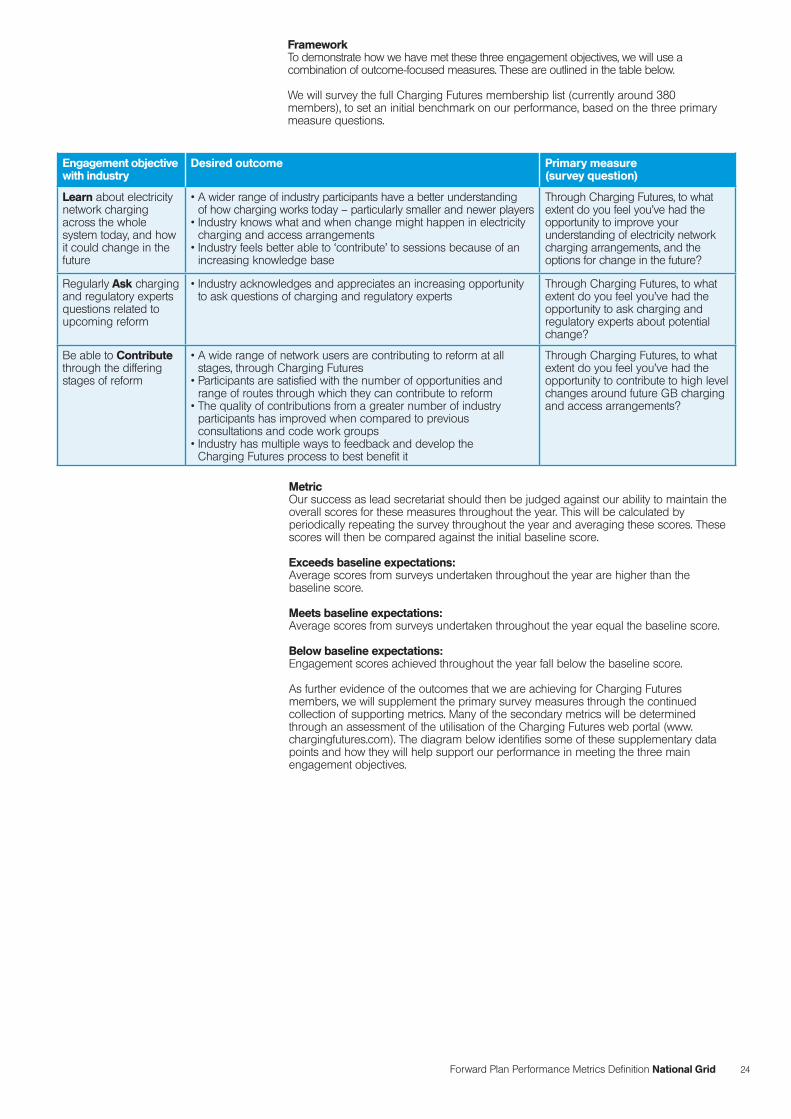
Framework To demonstrate how we have met these three engagement objectives, we will use a combination of outcome-focused measures. These are outlined in the table below.
We will survey the full Charging Futures membership list (currently around 380 members), to set an initial benchmark on our performance, based on the three primary measure questions.
Engagement objective with industry
Desired outcome Primary measure (survey question)
Learn about electricity network charging across the whole system today, and how it could change in the future
• A wider range of industry participants have a better understanding of how charging works today – particularly smaller and newer players
• Industry knows what and when change might happen in electricity charging and access arrangements
• Industry feels better able to ‘contribute’ to sessions because of an increasing knowledge base
Through Charging Futures, to what extent do you feel you’ve had the opportunity to improve your understanding of electricity network charging arrangements, and the options for change in the future?
Regularly Ask charging and regulatory experts questions related to upcoming reform
• Industry acknowledges and appreciates an increasing opportunity to ask questions of charging and regulatory experts
Through Charging Futures, to what extent do you feel you’ve had the opportunity to ask charging and regulatory experts about potential change?
Be able to Contribute through the differing stages of reform
• A wide range of network users are contributing to reform at all stages, through Charging Futures
• Participants are satisfied with the number of opportunities and range of routes through which they can contribute to reform
• The quality of contributions from a greater number of industry participants has improved when compared to previous consultations and code work groups
• Industry has multiple ways to feedback and develop the Charging Futures process to best benefit it
Through Charging Futures, to what extent do you feel you’ve had the opportunity to contribute to high level changes around future GB charging and access arrangements?
Metric Our success as lead secretariat should then be judged against our ability to maintain the overall scores for these measures throughout the year. This will be calculated by periodically repeating the survey throughout the year and averaging these scores. These scores will then be compared against the initial baseline score.
Exceeds baseline expectations: Average scores from surveys undertaken throughout the year are higher than the baseline score.
Meets baseline expectations: Average scores from surveys undertaken throughout the year equal the baseline score.
Below baseline expectations: Engagement scores achieved throughout the year fall below the baseline score.
As further evidence of the outcomes that we are achieving for Charging Futures members, we will supplement the primary survey measures through the continued collection of supporting metrics. Many of the secondary metrics will be determined through an assessment of the utilisation of the Charging Futures web portal (www.chargingfutures.com). The diagram below identifies some of these supplementary data points and how they will help support our performance in meeting the three main engagement objectives.
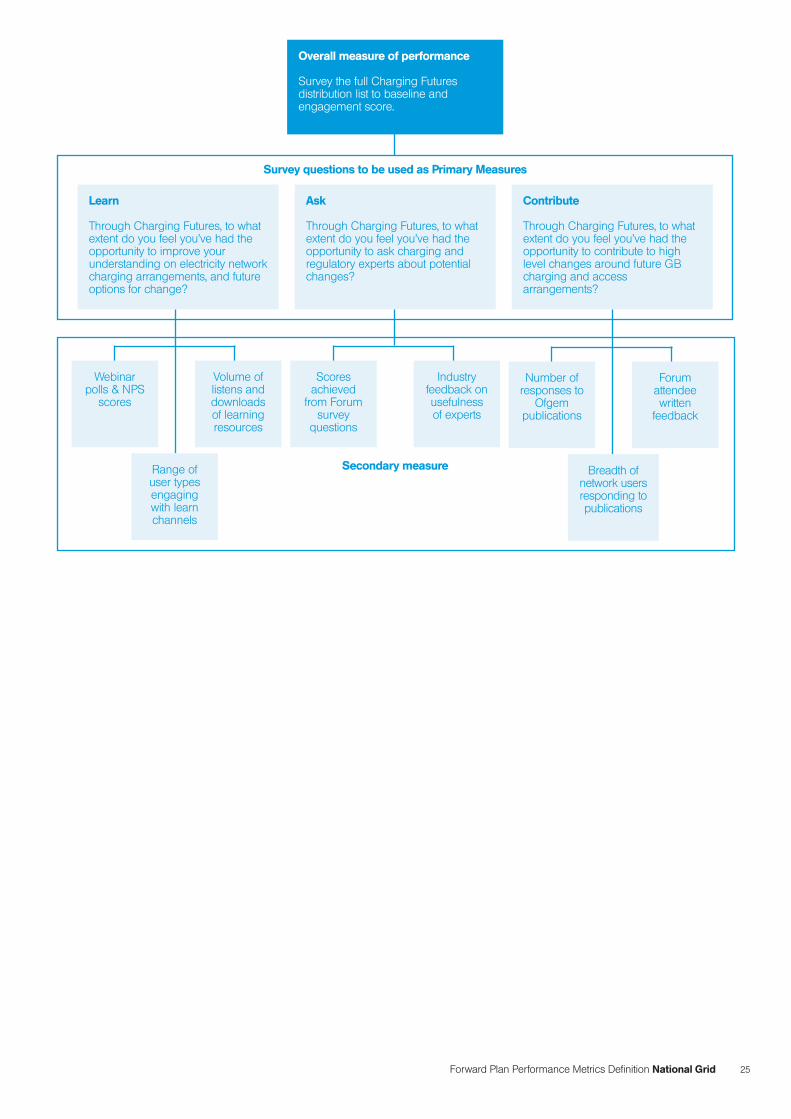
25Forward Plan Performance Metrics Definition National Grid
Learn
Through Charging Futures, to what extent do you feel you’ve had the opportunity to improve your understanding on electricity network charging arrangements, and future options for change?
Ask
Through Charging Futures, to what extent do you feel you’ve had the opportunity to ask charging and regulatory experts about potential changes?
Overall measure of performance
Survey the full Charging Futures distribution list to baseline and engagement score.
Contribute
Through Charging Futures, to what extent do you feel you’ve had the opportunity to contribute to high level changes around future GB charging and access arrangements?
Survey questions to be used as Primary Measures
Secondary measure
Webinar polls & NPS
scores
Volume of listens and downloads of learning resources
Range of user types engaging with learn channels
Number of responses to
Ofgem publications
Forum attendee written
feedback
Breadth of network users responding to publications
Scores achieved
from Forum survey
questions
Industry feedback on usefulness of experts

26Forward Plan Performance Metrics Definition National Grid
ESO role Principle
Facilitating whole system outcomes 5. Coordinate across system boundaries to deliver efficient network planning and development.
12. Whole system – optionality
Consumer benefitLowering network and balancing costs by accessing a wider pool of solutions to transmis-sion system challenges. ContextThe Network Options Assessment (NOA) currently assesses Transmission Owner (TO) solutions to increasing capability across large transmission network boundaries. It does not yet look at more regional system challenges, such as the efficient management of voltage. In some areas, these regional transmission system challenges can incur large operational costs, for example through the use of Balancing Services from generation and demand. For some of the regional system challenges, the ESO will be running a regional, extended NOA process. The aim of this is to clearly articulate the transmission system challenge to support as many solutions to be brought forward as possible. The process for working with TOs to produce options to be included is well-defined, but there is currently no equivalent process for non-TO parties.
Framework This process will seek credible options from non-TO parties to tackle regional transmission system issues. The behaviour we are trying to drive in the ESO includes a clear articulation of those issues, derived through credible and robust network modelling, so that parties can respond with potential solutions to those problems. These can then be assessed in a transparent way in accordance with an agreed methodology.
The aim of this metric is to act as a measure of how effective the ESO is in encouraging non-TO parties to suggest solutions to transmission system needs. These can be assessed against what might be thought of as more traditional transmission network solutions.
Assessing a wider pool of solutions to transmission problems through a detailed cost/benefit assessment, with a recommendation regarding which of the assessed options should be pursued, should drive lower network costs, balancing costs, or both.
MetricThis is a simple count of the number of non-TO solutions to transmission system challenges submitted by non-TO parties as part of an extended NOA process. This is transformational work that has not previously been undertaken by the ESO:
Exceeds baseline expectations: More than three new solutions.
Meets baseline expectations: Three new solutions.

27Forward Plan Performance Metrics Definition National Grid
ESO role Principle
Facilitating whole system outcomes 5. Coordinate across system boundaries to deliver efficient network planning and development.
13. Whole system – unlocking cross-boundary solutions
Consumer benefit Reducing balancing costs by developing our suite of tools to manage transmission system constraints and system security using a whole system approach.
ContextBefore June 2017, connections to the South-East Coast distribution network were inaccessible to Distributed Energy Resource (DER) developers due to transmission system constraints in the area. Following the work carried out during 2017/18 between UK Power Networks (UKPN) and the ESO, DER developers are now able to apply to connect in the South-East Coast distribution network area. In addition, the ESO gains access to a wider range of constraint management tools, which support the ongoing efficient management of transmission network issues, supporting system security and potentially driving down balancing costs.
Framework This metric is an assessment of the effectiveness of the ESO’s whole system actions, measured in terms of their consequences. The specific measurable for the project to release capacity in UKPN South-East Coast is:
• MW capacity of DER connections as a result of the 2017 UKPN/ESO collaboration on the South-East Coast (i.e. from 1 June 2017) – this would be a measure of the contracted MW.
Metric Assessment of the performance will be on an ex-post basis based on what level of MW are contracted and the narrative of what we have achieved if connections in this area are requested and contracts signed.
The baseline position is that no further DER connections were possible before June 2017 when the arrangements developed between the ESO and UKPN were formally publicised to the developer community. Following the work carried out during 2017/18, DER developers are now able to apply to connect in the South-East Coast distribution network area. New processes and types of contracts still need to be developed by the ESO to enable connections due to the need to efficiently manage transmission constraints and distribution interactions in this area.
The metric is designed as a measure of the effectiveness of contracts and processes we implement, as measured by new capacity contracted at distribution level.

28Forward Plan Performance Metrics Definition National Grid
ESO role Principle
Facilitating whole system outcomes 6. Coordinate effectively to ensure efficient whole system operation and optimal use of resources.
14. Connections Agreement Management
Consumer benefitReducing balancing costs by ensuring that the ESO has access to appropriate commer-cial options following changes to the transmission network, to maintain its operation of the transmission system. ContextThe GB transmission system is constantly under change as the three TOs build new assets. All generation that needs to be connected to the transmission system requires a contract with the ESO. After the TOs make changes to the transmission system, they inform the ESO of these changes. The ESO needs to ensure that the relevant contracts for the affected generators are then updated to reflect this change. Some agreements permit the ESO to curtail generation under certain circumstances at no cost but if an agreement is not up to date and the generation requires curtailment, the ESO may need to instruct this through a Bid Offer Acceptance (BOA).
Ensuring that connections agreements are up to date to reflect changes to the transmission network gives the ESO more options to ensure the system can be run safely and securely and potentially saves BSUoS cost when the ESO would need to pay to curtail generation.
Framework This metric drives the ESO to improve its own internal processes as well as working strongly with the relevant TOs to ensure that it can enact the contracts that it has in place to benefit the consumer.
Updating connection agreements requires collaboration between the ESO and the relevant TO and then a three-month period to get the updated agreement signed off by the customer. The ESO cannot control all aspects of the performance as it requires interaction between the ESO, TO and the customer, so targets reflect this.
MetricThis metric will measure how long it takes from the point of notification for these agreements to be updated. This metric drives efficient and effective management of existing connections contracts by measuring the percentage of contracts up to date within nine months.
Exceeds baseline expectations: >70% of agreements to be updated within nine months of notification.
Meets baseline expectations: 60-70% of agreements to be updated within nine months of notification.
Below baseline expectations: <60% of agreements to be updated within nine months of notification.
Current performance: = 22%
29Forward Plan Performance Metrics Definition National Grid
ESO role Principle
Facilitating whole system outcomes 6. Coordinate effectively to ensure efficient whole system operation and optimal use of resources.
15. System access management
Consumer benefitReducing unnecessary network and balancing costs by improving the system access request planning process. ContextThe ESO directs the flow of electricity over the transmission system in real time and the three TOs own the assets through which the electricity is transferred. To ensure that these assets are maintained, the TOs need to ask the ESO for access to their assets. When the system access requests are formally submitted, the ESO performs due diligence on these requests and, if secure and economic, they are accepted into the master outage plan in the Transmission Outage Generation Availability (TOGA) database before 15:30 at DA. These outages are then reassessed in the control phase (within day) before the asset is switched out to make sure it adheres to policy (GBSQSS-GB Security and Quality of Supply Standard). When a system access request has been accepted into the plan, customers will have acted on the assumption that it will go ahead. This includes TOs, DNOs and generators who could have, for example, incurred costs hiring specialist contractors or equipment. Sometimes these requests are delayed or even cancelled within day for a variety of reasons from unforeseeable weather conditions to faults on the system to planning process failures. These cancellations can lead to higher network costs. (The estimated delay costs to the TOs are between £5,000 and £15,000 a day).
Framework This metric looks to drive down the number of planned outages that are delayed by more than an hour or cancelled by ESO in the control phase due to process failure, investigating the reason for cancellations and putting in place changes into the process where appropriate to prevent a repeat. The ESO is required by its licence to coordinate the flow of electricity over the network in an efficient, economic and coordinated manner. For this reason, sometimes the ESO should cancel system access requests that have been accepted into the plan because these are no longer securable or the costs are too high. The ESO will continue to cancel system access requests where needed; however this number should be as low as practical to avoid costs for external stakeholders and costs for the ESO in re-planning these requests. The tension between these two aspects is dynamic and so the ESO will work to reduce the number of control phase cancellations out of every 1,000 system access requests. The improvement in the planning process should reduce avoidable costs through re-planning outages at short notice, which will in turn save money for the consumer.
MetricThis measure is a count of the number of outages out of every 1,000 delayed by more than an hour or cancelled within day.
ESO current performance: 11.5 delays more than an hour or cancellations within day per 1,000 outages accepted into the master outage plan.
Exceeds baseline expectations: Less than 10.4 per 1,000 outages (more than 10% reduction).
Meets baseline expectations: 10.9 -10.4 per 1,000 outages (5-10% reduction).
Below baseline expectations: More than 10.9 per 1,000 outages (less than 5% reduction).

30Forward Plan Performance Metrics Definition National Grid
ESO role Principle
Facilitating whole system outcomes 6. Coordinate effectively to ensure efficient whole system operation and optimal use of resources.
16. Future GB electricity system security
Consumer benefitIncreased system security and reduced system operability risk. More efficient delivery of system operability through longer-term planning and enhanced op-erability modelling capability. Our goal is to identify future challenges to the operation of the system early so we can develop economic options and solutions to manage those issues. Developing appropriate strategies to optimise the balance between cost and risk.
ContextThe GB electricity system is changing rapidly. The ESO needs to focus on identifying emergent and interacting system operability challenges in all timescales, putting a plan in place to address the issues, and executing the plan to time and quality.
This metric will drive the ESO to determine and implement a coordinated, optimised programme for system operability from 2019 to 2030.
This will be developed through building on current horizon scanning and industry engagement activity such as the Future Energy Scenarios13, System Operability Framework14 and System Needs and Product Strategy15 work. Using this information, an ongoing Operability Gap Analysis will be produced. Where operability gaps are highlighted, we will develop plans to make sure they are closed in appropriate time.
We will deliver a technically secure system with quantified and agreed risk achieved through market-acceptable cost and procurement methods from 2019 to 2030 against a background of fundamental change in the energy industry.
Framework The ESO will identify emergent and interacting system operability challenges in all timescales, putting a plan in place to address the issues, and executing the plan to time and quality.
We will publish a Six-Monthly Operability Report detailing: • Current view on operability gap analysis for each security area.
• Review of performance for the previous six months.
• Work already under way to reduce operability gaps.
• Plan for future work to eliminate remaining operability gaps and which seeks feedback from stakeholders.
This will give industry a more transparent and coordinated view of the operability challenges facing the system. It will engage industry with the solution development phase and seek feedback on proposed actions.
System operability has been split into five key areas that we need to focus on to achieve secure and economic balancing now and into the future:
• Voltage management • Frequency management • Restoration capability
• Stability of the system • Thermal capacity
We will use existing and new modelling, coupled with power system analysis, to identify our current capability in these areas, and in the period up to 2030.
13 http://fes.nationalgrid.com/ 14 https://www.nationalgrid.com/uk/publications/system-operability-framework-sof 15 https://www.nationalgrid.com/uk/electricity/balancing-services/future-balancing-services

31Forward Plan Performance Metrics Definition National Grid
We will also use these models and engineering approaches to identify what the system needs are expected to be in these areas, as demand, generation and system design change, for the system to remain secure. This will include emergent operability challenges and a focus on the interaction between the five operability areas. We will make sure that the impacts of solutions in one operability area on the remaining areas are understood and taken into consideration in our technical analysis and cost-benefit analysis.
We will then identify the differences between our current capability and future system needs to understand the operability gaps which will need to be addressed. We will look at all options for solutions to problems, e.g. new market-based approaches, system asset changes (distribution and transmission) and updates to industry codes, and develop a plan for future work to eliminate these gaps.
MetricWe will measure our delivery of the Six-Monthly Operability Reports, stakeholders’ engagement with them, and our delivery against plan.
Through the operability reports, the operability delivery plan will be supported by a narrative explaining the current state of the programme, and where changes have been made, the rationale for the changes. Where deadlines have been missed or key milestones delivered early we will report our reasoning for this.
Six-monthly operability reporting performance: Exceeds baseline expectations: Delivery of Six-Monthly Operability Reports on time – this is transformational work that has not previously been undertaken by the ESO.
Meets baseline expectations: Manage emerging system operability issues and challenges through processes and publications involving the Future Energy Scenarios feeding the System Operability Framework to inform the market of what is likely to be needed in the future.
Below baseline expectations: Failure to provide information and publications to detail future system scenarios and needs, e.g. failure to provide System Operability Framework information.
Stakeholder feedback on Six-Monthly Operability Reports We will survey our stakeholders at each report, asking them to review the quality of progress updates provided to industry through the Six-Monthly Operability Reports.
As outlined in the Stakeholder Engagement Report published alongside this document we will be using a range of channels, including the Electricity Operations and Power Responsive Forums, formal Customer and Stakeholder surveys and newsletters to capture stakeholder views on our progress in this area and how we are engaging.
In the coming months we will be reviewing our channels and approaches to develop a robust and integrated process for collecting and reporting on stakeholder feedback. This process will include defining the right questions to ask and establishing appropriate target metrics based on our understanding of current expectations. Progress updates on this activity will be provided via the performance reporting on our website.
Delivery against plan: The plan will include activities which are fully within the control of the ESO, partially within our control, and outside our control.
Exceeds baseline expectations: Delivery of plan milestones within our control on time, and evidence that we are influencing and driving the completion of milestone not fully within our control to completion.
Meets baseline expectations: Delivery of plan milestones within our control on time.
Below baseline expectations: Failure to deliver plan milestones within our control on time, unless valid reason for failure is shown.

32Forward Plan Performance Metrics Definition National Grid
ESO role Principle
Supporting competition in networks 7. Facilitate timely, efficient and competitive network investments.
17. NOA consumer benefit
Consumer benefitReducing network and balancing costs by pursing good quality, reduced-build options to be included into the NOA process.
ContextThe ESO carries out the NOA annually to recommend to the three TOs in GB which reinforcement projects should proceed to meet the future needs for the bulk transfer of electricity over the electricity system, and which to delay. The NOA methodology, approved annually by Ofgem, uses ‘single year least worst regret’ analysis to quantify the risk each course of action poses. Selecting the strategy with the lowest maximum regret leaves the consumer exposed to the lowest risk. Currently four parties can submit options to the NOA process: the three TOs and the ESO. The TOs submit their asset build-based options and the ESO and TOs submit reduced-build options. These reduced-build options maximise the use of the existing assets in innovative ways. Pursing these reduced-build options minimises consumer spend on network reinforcement through the use of alternatives and results in lower cost for increased capability. This metric will drive the ESO to work with the TOs to devise good quality, reduced-build options where these are appropriate. These may be a cost-effective solution for the long term or a method to save constraint cost in the short term while larger network assets are built.
Framework This metric will count how many of the reduced-build options that have been submitted to the NOA process appear in the optimal path and, where this is the case, what their consumer value is. In any given year, there are not always non-transmission build options that can be included within the NOA and the consumer value of these options is not in the control of the ESO. For clarity, the ESO will only include reduced-build options that have been initiated by ESO as this will drive the ESO to continue to be proactive in looking for these options. The options that are ESO initiated will be highlighted as part of the main NOA report when this is published in January 2019. This is different from metric Whole System Optionality where those options do not need to be on the optimal path, and may be assessed as part of our Pathfinding Projects16, which we are carrying out alongside the NOA methodology to develop our capability.
MetricThis metric will include two aspects: the number of value-add options appearing in optimal paths, and consumer value of these options. The number of options is expressed as a count and the consumer value will be based on £/kW saving for alternative options against traditional build options as a percentage of actual/target.
Exceeds baseline expectations: Larger number of value-add options than target and consumer benefit >=10% in excess of target.
Meets baseline expectations: Number of value-add alternative options meets target and consumer benefit within 10% of target.
Below baseline expectations: Number of value-add alternative options below target and consumer benefit below 10% of target.
These targets are based on the average number of options and consumer benefit in 2015/16, 2016/17 and 2017/18 options.
NOA Number of options Consumer value
2015/16 0 £0.00
2016/17 2 £54.00m
2017/18 1 £55.56m
Average 1 £36.52m
16 Detail of this will be published in the Network Development Roadmap, which will be published during April 2018 https://www.nationalgrid.com/uk/publications/network-options-assessment-noa

33Forward Plan Performance Metrics Definition National Grid
This is as follows: • Target number of value-add options: 1. • Target consumer value: £50m. Consumer benefit is calculated as the difference in £/kW
of alternative options compared to.
• For NGET – UCA (Unit Cost Allowance) for named boundaries as defined in RIIO-T1. For boundaries not listed, an average of the UCA.
• For SP Transmission plc and Scottish Hydro Electric Transmission plc – an average of the UCA for NGET.

34Forward Plan Performance Metrics Definition National Grid
ESO role Principle
Supporting competition in networks 7. Facilitate timely, efficient and competitive network investments.
18. NOA engagement
Consumer benefitDriving down network costs by facilitating the broadening of competition in the NOA.
ContextCurrently only four parties can take part in the NOA process: the three TOs and the ESO. The ESO is committed to developing this process and making it accessible to non-transmission-network parties. To this end, the ESO will be delivering and publishing a Network Development Roadmap to show direction of travel to allow more parties to engage in the NOA process. Increasing the level of participation in the NOA will increase competition and improve value to the consumer through meeting transmission system needs at lower cost. The aim of this is to allow more alternatives to transmission build to be submitted and to drive competition between the different ways of meeting the need. If our development of the processes and awareness raising is successful, the ESO will expect increased engagement in the future participation in the NOA.
Framework This metric is to measure how effective we are in engaging stakeholders in the progress of our network development processes, as set out in the Network Development Roadmap mentioned in the Delivery Schedule.
MetricWe will survey stakeholders regularly to collect feedback on our progress in the development of the NOA and views on our engagement. This will include asking them to review our progress in understanding their requirements while developing the new processes.
As outlined in the Stakeholder Engagement Report published alongside this document we will be using a range of channels, including the Electricity Operations and Power Responsive Forums, formal Customer and Stakeholder surveys and newsletters to capture stakeholder views on our progress in this area and how we are engaging.
In the coming months we will be reviewing our channels and approaches to develop a robust and integrated process for collecting and reporting on stakeholder feedback. This process will include defining the right questions to ask and establishing appropriate target metrics based on our understanding of current expectations. Progress updates on this activity will be provided via the quarterly performance reporting on our website.

35ESO Forward Plan National Grid
Appendix 1 – Forecasting points definition
Electricity demand changes during the day depending on how much energy people, businesses and industries are using at that moment. As the electricity demand goes up and down, we see characteristic peaks and troughs appearing daily at similar times.
These peaks and troughs occur within four forecasting points as described below:
1. Overnight minimum (1B): Early morning minimum usually between 04:30 and 07:30.
The time of day when the greatest number of people are in bed using no electricity, just before the surge in demand caused by people getting up.
The measure of this forecasting point for incentive purposes will be the minimum demand between the period defined above. Period time can change based on operational requirements.
2. Daytime peak (2F or 2A or 2B): • 2F – Early morning demand peak after the ramp-up from overnight minimum usually
happens 08:00-09:00.
This point can be the morning peak depending on solar generation output/time of year.
• 2A – Usually between 09:30-10:30, as by this time the majority of people have arrived at offices/school/places of work, after which demand starts to level off.
• 2B – Morning/midday peak usually between 11:00-13:00, caused by a lunchtime surge in demand as energy is used for food preparation.
The measure of this forecasting point for incentive purposes will be the maximum of the above cardinal points. Period time can change based on operational requirements.
3. Daytime minimum (3B): The afternoon trough usually happens between 13:30-16:30, with people still at work but using no extra electricity; demand is primarily computers and lights which are already on.
All daytime peaks and troughs are largely affected by embedded solar generation.
The measure of this forecasting point for incentive purposes will be the minimum demand between period defined above. Period time can change based on operational requirements.
4. Evening peak:• BST Only – 3C Afternoon peak as people get home and make dinner and turn on
other appliances.
• BST Only – 4B Peak as the sun sets and people turn on lights.
• GMT Only – DP (Darkness peak) Peak of the day as people get home, make dinner, turn appliances on and turn lights on (as the sun has already set).
The measure of this forecasting point for incentive purposes will be the maximum of the above cardinal points. Period time can change based on operational requirements.

36ESO Forward Plan National Grid
Appendix 2 – Triad avoidance methodology
Demand customers try to avoid high charges that are determined by their usage over the three Triad settlement periods (SPs) by suppressing their transmission supplied demands on days which have a reasonable chance of being one of the Triad days. This is referred to as Triad avoidance. Because the peak of the day has a reduced value, the values of the demand in SPs on either side of the peak are also affected; otherwise they might become a new, higher, peak for that day. Typically, SP 33-37 are affected. We call this the Triad Interval.
No data is available to measure this Triad avoidance accurately, and so it must be estimated by assessing what the outturn would have been had there been no Triad avoidance. This note explains the methodology for performing this estimation.
Triad avoidance days have a distinctive demand shape. On normal days, Monday to Friday, during the Triad period November to February, half-hourly demands increase steadily from settlement SP 31 to a daily maximum value during SP 35, then decreasing for the rest of the day. Typically, on a Triad day, the rise stops at SP 33, and demands remain (roughly) level, or can even slightly decrease, until SP 37, when the normal pattern re-emerges. This behaviour is only observed on days with a reasonable chance of becoming one of the Triad days.
Estimating Triad avoidanceTo estimate what would have happened had there been no Triad avoidance, we consider a historical day from recent history on which there was no Triad avoidance (i.e. the distinctive Triad shape is not present).
We take this historical day as a proxy for the counterfactual situation that no Triad avoidance occurred.
It is important that this day is from as recent history as can be found, as changing use of technologies and energy saving technologies has slowly changed the shape of the demand curve, including over the daily peak, over a period of years.
Other factors affecting the timing of the peak and the demand shape around it are overall weather conditions and time of year.
Because of changing economic conditions, different years have different underlying customer demand levels. Even within a year, these underlying demand levels shift as the week progresses. Therefore when we have identified a candidate historic day, it is aligned as closely as possible to the observed day on either side of the Triad interval.
In assessing Triad avoidance, we identify customer behaviour in the demand trace. The national demand trace is affected both by customer behaviour and by fluctuations in the weather-driven embedded generation (PV and wind). Therefore to assess the impact of Triad avoidance, we use national demand with non-metered PV and wind generation added on; this is referred to as virtual demand.
The proxy virtual demand curve chosen is the historic day that best fits the observed climb up towards the peak before Triad avoidance begins, and also fits the observed virtual demand fall after Triad avoidance ends, subject to the conditions that the day falls within two weeks of the date of the observed day, occurs most recently, and fits the temperature profile over the peak most accurately.
Once we have chosen the historic day, it is aligned to fit the rise and fall before and after the Triad avoidance interval as well as possible.
We measure the difference between the (adjusted) historic day peak half-hourly virtual demand and the corresponding half-hourly virtual demand on the observed day. This is rounded to the nearest 100MW, as the methodology cannot be presumed to give any greater degree of accuracy.
The key to the procedure is choosing the historic day to represent what would have happened without Triad avoidance. The precise methodology for this is set out on the following page.
The three Triad demands are the three highest settlement period demands occurring between start of November and end of February, subject to the condition that the demands must be separated by at least 10 days.

37ESO Forward Plan National Grid
Historic day methodology1 Determine the national average effective temperature (TE) over the Triad interval on the
observed day. 2 Search the demand database for days with closely matching temperature profiles,
according to a defined temperature tolerance, that occur within two weeks of the calendar day of year, that represent the observed day of the week appropriately, and that occur within the past four years. These are the candidate days.
3 Group these results by most recent year, then within each group arrange by goodness of fit of the temperature profile.
4 Starting with the current year group, test the candidate historic days for (adjusted) demand shape fit around the Triad interval, using a maximum metric.
5 Select the best candidate according to the metric. If the best candidate has maximum deviation from the observed day < 100 MW, accept it as the proxy day. If not, move to the next most recent year group.
6 If no suitable proxy is found after all candidates have been tested, re-query the historic demand database relaxing the temperature profile tolerance.
7 Repeat the testing procedure. 8 If no suitable candidate is found after this second run, choose the historic day from the
most recent two years with the minimum deviation from the observed demand.
Triad avoidance methodology 1 Align the proxy historic virtual demand curve with the observed virtual demand curve to
obtain the minimum deviation. 2 Identify the peak in the Triad Interval settlement periods in the proxy historic day virtual
demand. 3 Measure the virtual demand in the corresponding SP in the observed day. 4 Calculate the difference, and round to nearest 100MW.

38Forward Plan Performance Metrics Definition National Grid
Appendix 3 – Summary of our 2018/19 potential value to unlock
Overarching consumer valueThe complex, rapidly changing energy landscape can be enhanced by an optimally flexible electricity market and joined to a ‘Smart Power’17 future including interconnection, storage and flexible demand to realise benefits of up to £8 billion per year by 2030. Our Delivery Schedule sets out the work we will undertake to start to unlock this consumer benefit. It is important to understand much of the groundwork we will undertake in the next few years will come with an element of cost but that the major benefit payback on much of this activity is not expected until 2030. The work must be done to lay foundations for this optimised electricity supply future now as timescales on investment, design and construction decisions can take decades to come to fruition.
The seven principles stretch across all elements of electricity system operation. This estimation of value is set out by principle. We acknowledge that there will be some overlap. Transparency is best served by ensuring that there is a clear line of sight between a deliverable and where the anticipated outcome is expected. In evaluation of delivered benefit where a deliverable contributes to more than one principle, unlocked consumer value will be assessed but counted only once; either all in one principle or split in a clear way across principles. Rather than place an exact value on estimated consumer benefit we have set out to identify the level of consumer value in bands:
It is worth acknowledging that benefits delivered in one principle could interact across the range. Thus, the level of consumer benefit estimated in the table below may be at the upper bound given that a proportion of this benefit could be incorporated within other principles.
During the course of this year, the ESO will develop a methodology and set of assumptions which we will use for the estimation of delivered consumer value in relation to its performance in each principle area.
Less than £15 million Small consumer value
£15-£30 million Medium consumer value
£30-£50 million Large consumer value
Greater than £50 million Very large consumer value
17 https://www.gov.uk/government/uploads/system/uploads/attachment_data/file/505218/IC_Energy_Report_web.pdf

39Forward Plan Performance Metrics Definition National Grid
Mechanisms for benefit Benefit type Approach to quantification Magnitude of benefit
Principle 1 Support market participants to make informed decisions by providing user-friendly, comprehensive and accurate information.
Consumer benefit Benefits of enhanced competition for services.
Efficiency savings from improved market actions and reduced risk premiums.
Some decarbonisation benefits from technology integration.
Industry benefit Greater transparency of SO decision-making.
Better information on which to compete effectively and on which to base operational decision-making.
Improved integration of renewable and flexible sources.
Financial Decarbonisation
Competition for STOR services Consumer benefit = estimated £7m
BSUoS risk premium (as a result of BSUoS forecasting and trades transparency): 10-20% of total risk premium = £2-9m Consumer benefit = estimated £4.5m
Industry decision-making as a result of providing better wind forecasting and trades information and transparency Consumer benefit = estimated £4.5m
Additional efficiency of reserve procurement: from improved forecasting Consumer benefit = estimated £7m
Contribution to carbon savings (priced at price of carbon in UK): Consumer benefit = estimated £5.4m
Total consumer benefit = 7+4.5+4.5+7+5.4=£28.4m
Medium (£15m-£30m)
Principle 2 Drive overall efficiency and transparency in balancing, taking into account impacts of its actions across time horizons.
Consumer benefit Direct benefit from reduced balancing costs.
Industry benefit Reduction in BSUoS charges.
Financial Savings of balancing costs from taking optimal and innovative actions and contracting decisions
Consumer benefit = estimated £65m
Very large (>£50m)
Principle 3 Ensure the rules and processes for procuring Balancing Services maximise competition where possible and are simple, fair and transparent.
Consumer benefit Enhanced competition for Balancing Services.
Improved diversity of participants.
Facilitate shift from conventional, fossil fuel generation.
Industry benefit Support to allow better capability to engage and compete in balancing service markets.
Financial Security of supply
Decarbonisation
Competition for STOR services Consumer benefit = estimated £7m
Introduction of market mechanisms for non-market services Consumer benefit = estimated £25.6m
Enhanced diversity in markets Consumer benefit = estimated £25m
Total estimated benefit = 7 + 25.6 + 25 = £57.6m
Very large (>£50m)
Principle 4 Promote competition in wholesale and capacity markets.
Consumer benefit Efficiency savings from improved market arrangements.
Efficiency savings from reduced risk premiums.
Industry benefit Faster codes and charging changes.
Enhanced ability for smaller market participants to drive beneficial market change.
Financial Facilitate expedient delivery of effective code modifications.
Project TERRE – estimated economic benefits Consumer benefit = estimated £31m
Large (£30m-£50m)

40Forward Plan Performance Metrics Definition National Grid
Mechanisms for benefit Benefit type Approach to quantification Magnitude of benefit
Principle 5 Coordinate across system boundaries to deliver efficient network planning and development.
Consumer benefit Benefits of enhanced competition for services
Efficiency savings from improved market actions and reduced risk premiums
Industry benefit Better coordination with network companies and other solution providers
Enhanced ability to provide new solutions to networks challenges
Financial Accessing non-transmission build solutions Consumer benefit = estimated £26m-£52m
Large (£30m-£50m)
Principle 6 Coordinate effectively to ensure efficient whole system operation and optimal use of resources.
Consumer benefit Efficiency savings from more optimal industry operation programmes
Enhanced security of supply given future system security planning
Industry benefit More accurate information and improved capability for optimal operation programme
Financial
Security of supply
Identifying operability challenges at an early stage Consumer benefit = estimated £25m
Rate of Change of Frequency changes to codes Consumer benefit = estimated £10m-£20m
Medium (£15m-£30m)
Principle 7 Facilitate timely, efficient and competitive network investments.
Consumer benefit Enhanced competition for provision of network solutions
Efficiency savings from lower cost solutions
Industry benefit Better coordination with network companies and other solution providers
Enhanced ability to provide new solutions to networks challenges
Information provision to allow better decision making and more informed challenge
Financial Additional reduced build options included into NOA Consumer benefit = estimated £26-£52m
Large (£30m-£50m)

National Grid System OperatorNational Grid HouseWarwick Technology ParkGallows HillWarwickCV34 6DAwww.nationalgrid.com