fossil fuel divestment: an analysis of and argument for
TRANSCRIPT

Project: JS6
Fossil Fuel Divestment: An Analysis of and Argument for Fossil Fuel Divestment
A Major Qualifying Project Submitted to the Faculty
of
WORCESTER POLYTECHNIC INSTITUTE
in partial fulfillment of the requirements for the Degree of Bachelor of Science
in Interdisciplinary Studies: Ethical Policy Studies
by
________________________
Thomas E. Cyr
28 January 2016
__________________________________________
Professor John Sanbonmatsu, Project Advisor
This report represents work of WPI undergraduate students submitted to the faculty as evidence of a degree requirement. WPI routinely publishes these reports on its web site without editorial or peer review. For more information about the projects program at WPI, see http://www.wpi.e-
du/Academics/Projects.
�1

ABSTRACT
I argue that WPI should divest its endowment fund from fossil fuels. I examine the harmful
effects of global climate change, emphasizing WPI’s moral obligation to divest and explore the
financial efficacy of divestment. Several academic institutions have divested without suffering
financial losses, showing that divestment is a feasible investment strategy and an effective way
for WPI to combat global climate change.
�2

EXECUTIVE SUMMARY
Global climate change caused by carbon emissions trapped within the atmosphere is one of
the biggest environmental problems facing the world today. It is an issue with disastrous con-
sequences for all life on Earth and has been ignored for too long. The planet is already feeling
the harmful effects of global climate change and time is running out for something to be done to
mitigate them. Action is being taken around the world to raise climate awareness and combat
the harmful effects of global climate change. Scientists have been developing technology to
minimize the harmful effects of carbon emissions on the planet’s atmosphere and produce
cleaner energy, politicians have worked to pass environmental legislation to reduce carbon
emissions and activists worldwide are protesting environmental degradation and calling for in-
vestors and institutions to divest their endowments from fossil fuels. Climate change activists
on WPI’s campus have repeatedly petitioned the Board of Trustees to divest its endowment to
no avail. They argue that divestment is against the financial self-interest of the institution and
not aligned with their fiduciary responsibility.
The goal of this project is to disprove the Board of Trustees’ argument against divestment
and advocate for it as an effective strategy and WPI’s moral obligation. By analyzing the per-
formance and volatility of each asset within WPI’s endowment portfolio and the portfolio’s per-
formance over time I will show how other investments could replace fossil fuels and improve the
overall performance of the portfolio. I also compare the performance of divested school’s en-
dowments against those of non-divested schools to assess the performance of divested en-
dowments over time. This analysis serves to support my claim that divestment is a financially
�3

valid course of action for WPI and address the Board of Trustees’ strongest objection to divest-
ment.
This project addresses divestment as the best option for WPI to actively combat global cli-
mate change by approaching the problem from different angles. The first section addresses the
negative effects of climate change, emphasizes the need for a global solution and outlines
WPI’s moral obligation to divest. This leads into a section discussing the environmental move-
ment and the validity of divestment as a tactic. After these topics have been addressed, I dis-
cuss financial concepts, endowment regulations and the state of WPI’s endowment to give
background necessary for my methodology and results sections. These sections address the
financial aspect of divestment and demonstrate how other assets are more effective invest-
ments than fossil fuels. These points work together to support my argument for divestment and
refute the counterpoint that it is not a financially feasible option.
The results of this project show that divestment does not equate to financial loss and divest-
ed portfolios have out performed their non divested counterparts. The divested portfolios utilize
more productive and less volatile assets and as a result generate a higher rate of return with
less risk. Since this project only discusses divestment of academic endowments from fossil fu-
els which only started in 2009, the lack of available data naturally presents limitations. As more
schools divest and more data becomes available for those that already have, the strength of this
analysis can be improved. If the new data still supports the argument for divestment, the next
step in a practical approach to convince the Board of Trustees to divest would be to develop a
divested portfolio and compare its returns and volatility with the non divested portfolio. If the
divested portfolio performs better than the current portfolio, the Board of Trustees would be fidu-
cially obligated to divest as it would be shown to be the best financial course of action.
�4

ABSTRACT 2
EXECUTIVE SUMMARY 3
TABLE OF FIGURES 7
TABLE OF TABLES 8
CHAPTER 1: INTRODUCTION 9
1.1 WPI’s RESPONSIBILITY TO DIVEST 9
1.2 THE SCOPE OF THE PROJECT 13
CHAPTER 2: BACKGROUND 14
2.1 CLIMATE CHANGE 14
2.1.1 Overview 14
2.1.2 Possible Solutions 20
2.2 THE CLIMATE CHANGE MOVEMENT 27
2.2.1 History of the Climate Change Movement 28
2.2.2 Divestment as a Historically Successful Tactic 34
2.3.3 Counterarguments and Summary 38
2.3 FINANCIAL TERMS AND CONCEPTS 41
2.3.1 RISK 41
2.3.2 INVESTMENT VEHICLES 44
2.3.3 DIVERSIFICATION 46
2.3.4 PORTFOLIO DESIGN 49
2.4 INVESTMENT PRACTICES FOR WPI’S ENDOWMENT 52
2.4.1 ENDOWMENT REGULATIONS 52
2.4.2 WPI’S ENDOWMENT 52
CHAPTER 3: METHODOLOGY 55
�5
CHAPTER 4: RESULTS 59
CHAPTER 5: CONCLUSIONS AND FUTURE WORK 67
5.1 SUMMARY 67
5.2 DISCUSSION 68
APPENDIX B: SELECTED DIVESTED SCHOOLS AND THEIR ANNUAL RETURNS FROM 2006 TO 2014 73
APPENDIX C: AVERAGE ASSET ALLOCATION AND RETURNS FOR ACADEMIC INSTITUTIONS WITH ENDOWMENTS VALUED BETWEEN $101 MILLION and $500 MILLION FROM 2009 TO 2013 81
APPENDIX D: ASSET CLASS HISTORICAL RETURNS FROM 1995 TO 2014 85
REFERENCES 93
�6

TABLE OF FIGURES
FIGURE 1: Average Asset Allocation for WPI’s Endowment from 2009 to 2013 59FIGURE 2: Alternative Strategies Asset Allocation for WPI from 2009 to 2013 60FIGURE 3: Asset Class Returns from 2009 to 201363FIGURE 4: Returns for Alternative Investment Asset Classes from 2009 to 2013 64FIGURE 5: Average Annual Percentage Change for Divested v.s. Non-Di-vested Schools from 2006-2014 66
�7

TABLE OF TABLES
TABLE 1: Average Annual Returns and Standard Deviations for Asset Classes from 1995 to 2014 61
�8

CHAPTER 1: INTRODUCTION
1.1 WPI’s RESPONSIBILITY TO DIVEST
Over the past decade, WPI has implemented many green initiatives on campus including
eco-friendly buildings, solar panels, high efficiency lighting and low flow toilets. Though these
efforts are not to be discounted, there is a concern among many students, faculty and alumni
about WPI’s endowment portfolio specifically, its investment in fossil fuels. WPI’s environmental
sustainability and its investment practices are key issues for student environmental groups, like
The Green Team and Students for a Just and Stable Future. With a petition containing over 250
signatures and the support of some faculty members and alumni, Students for a Just and Stable
Future has repeatedly requested that the Board of Trustees divests the endowment fund from
fossil fuels in an effort to mitigate the effects of climate change and encourage other academic
institutions to implement similar strategies. These petitions have been repeatedly rejected in
favor of more traditional investment practices for WPI’s endowment. While WPI showcases new
eco-friendly facilities, the endowment portfolio is still heavily invested in fossil fuels. This is a
conflict of interest where WPI prominently displays how eco-friendly its campus is but beneath
the surface, their investments are funding the companies responsible for the damaging effects
of global climate change.
The harmful effects of carbon emissions on the environment, non human life and human
condition are well known. The majority of scientists believe that greenhouse gas (GHG) emis-
sions caused by human kind burning fossil fuels since the Industrial Revolution have contributed
to the excessive carbon content of the atmosphere which has been attributed to global warming.
Climate change experts agree that an increase in temperature of 2 degrees Celsius will cause
�9

irreversible damage to the planet (Hansen et. al, 82). Shifting weather patterns resulting in
floods and droughts, melting ice caps, and natural disasters of increasingly severe magnitude
have all been attributed to global climate change (Randall and Schwartz, 320-321). These dis-
asters have occurred with a global temperature increase of less than 1 degree Celsius since the
Industrial Revolution.
WPI’s founding directive, according to its Mission Statement, is “to create, to discover,
and to convey knowledge at the frontiers of academic inquiry for the betterment of society”
therefore, it cannot, in good faith invest money in the institutions responsible for greatest causes
of global climate change. Doing so is morally objectionable and goes against the founding di-
rectives of the institution.
The Board of Trustees holds the ultimate authority over the decision making process and
investment practices for WPI’s endowment. This is a group of thirty entrepreneurs and business
people charged with upholding WPI’s Mission Statement, managing its operations and ensuring
the institution’s longevity. This includes ensuring WPI’s endowment provides future students
with the same level of benefits it provides its current students. This financial responsibility for
the longevity of the institution has been used as an excuse by the Board of Trustees to reject
divestment as a viable strategy in favor of their current investment strategy despite growing dis-
sent. Members of the Board of Trustees claim that the primary investment goal of the endow-
ment fund is to maintain a stable portfolio that will generate the best possible returns and the
lowest volatility and believe that divesting from fossil fuels is contrary to this objective. By priori-
tizing their fiduciary responsibilities, they are neglecting their moral duty to the institution. The
Board of Trustees actions represent the WPI community, our views, and what we hold impor-
tant. If their actions are not representative of the community, they are not fulfilling their duty and
must amend their actions.
�10
Where investors choose to invest their money impacts their financial future and also re-
flects the values of the investor. If two investment options are similar in every way except that
one is a company that produces clean energy and the other is a petroleum company, the choice
of where one invests is a reflection of the investor’s opinions on the moral value of fossil fuel
investments. Investors with eco-friendly inclinations are more likely to support the clean energy
company, where as those with ties to the fossil fuel industry are more likely to associate with the
petroleum company. By continuing to invest in fossil fuels, the Board of Trustees is saying that
the WPI community supports these companies, what they do and what they represent.
Large institutions like the Rockefeller Brothers Fund, the University of California endow-
ment and the city of Seattle have divested their portfolios from fossil fuels. Additionally, many
comparatively smaller institutions like College of the Atlantic, The Ben and Jerry’s Foundation
and the city of Amherst, MA have also successfully divested their portfolios from fossil fuels (go-
fossilfree.org). The variety in size and growing number of divested institutions (499 and count-
ing totaling worth $3.4 trillion 29 schools worth over $140 billion) is beginning to show that so-
cially responsible investing is a viable strategy and will not result in a loss of profitability. Social-
ly Responsible Investing has become mainstream to the point where many large financial insti-
tutions offer sustainable investment options including WPI’s primary advisor, Prime and Buch-
holz. Divestment strategies have been successfully implemented and the tools to implement
such a strategy are readily available to investors. Therefore, no reasonable argument can be
made for the continuing lack of serious inquiry into investment options that meet WPI’s invest-
ment goals and are a proper reflection of the values of the institution.
WPI has the opportunity to be at the frontier of the academic divestment movement as
one of the first polytechnic institutes to divest from fossil fuels. The green improvements on
campus have left a positive impression on WPI’s image but these have a small impact on the
global environment. Being part of the growing movement to choose not to fund companies that
�11
pollute the environment and facilitate climate change is more helpful to the environment than
lightbulbs and toilets. By taking a stance against fossil fuel companies, WPI would be demon-
strating to its community and to the world that they will no longer be part of the problem and are
actively working towards the solution. Using analysis of various studies tracking the perfor-
mance of assets and endowment portfolios over time, I will make a case for divestment as a vi-
able investment strategy for WPI to combat global climate change. WPI’s divestment from fossil
fuels would be a strong step in the right direction for the climate change divestment movement.
As more institutions divest, other schools that had never previously considered divestment are
encouraged to begin the inquiry process. Presently, the problem is that WPI is acting against its
founding principles by continuing to invest in companies associated with the fossil fuel industry
despite overwhelming evidence testifying to their harm and growing opposition to this practice.
Discussion regarding the institution’s investment options must be promoted and feedback must
be taken seriously. This is a problem that is too important to ignore and there are solutions that
are effective. The only reason not to pursue a new, socially responsible financial course of ac-
tion is lack of desire. The investments of the institution speak to its values and there are many
financial options that are available. If those responsible for an institution’s investments choose
to invest in assets that are not reflective of the institution’s values, those values are merely word
on paper. It is time for WPI’s investment actions to align with Their Mission Statement.
�12

1.2 THE SCOPE OF THE PROJECT
This project explores the likely ramifications of a WPI divestment plan by investigating
the problems of global climate change and what can be done to mitigate them. I will begin by
briefly explaining the science of climate change, expand upon the harmful effects it is already
having on the planet and describe what the world might look like if action is not taken. I will go
on to discuss the Environmental Movement and how it has influenced the modern Climate
Change Divestment Campaign. Next, I will discuss divestment as a tactic and demonstrate its
past success with an analysis of the divestment from apartheid South Africa. Then I will discuss
relevant financial terms and discuss endowments regulations and the current state of WPI’s En-
dowment portfolio. This leads into the description of the methods used in my analysis of WPI’s
endowment portfolio. Finally, I will present my results, give my conclusions and offer ideas for
the continuation of this work in the future.
�13

CHAPTER 2: BACKGROUND
2.1 CLIMATE CHANGE
2.1.1 Overview
Ninety-seven percent of climate change scientists agree that the global temperature in-
crease over the past 300 years is the result of humankind emitting carbon into the atmosphere
through aggressive animal agriculture, deforestation and burning fossil fuels (Oreskes, 76). The
gases produced from industrial agriculture, transportation and manufacturing are becoming
trapped in the atmosphere at a rate faster than they dissipate. The chemistry of the atmosphere
is very delicate and disruptions of its chemical composition effect the planet’s temperature, cli-
mate stability, weather patterns and ocean levels. According to a study referenced by Kahn,
carbon dioxide (77%), nitrous oxide (8%) and methane (14%) are the gases that were found to
be the main contributors to climate change (Kahn, 337). These GHGs prevent infrared radiation
from leaving the atmosphere which causes the surface temperature of the Earth to rise. Meth-
ane is the most potent greenhouse gas but it and nitrous oxide combined only account for “one-
fifth of the annual increase in radiative forcing of climate change” (Kahn, 338). In the fight
against climate change, triage must be done. Though the other gases are harmful and their
production has ethical implications of their own, the focus of this project is the reduction of the
most abundant GHG, carbon dioxide. If climate change is to be effectively managed the largest
sources of pollution must be addressed before other sources can be considered.
According to Paul Crutzen, a Nobel prize winning atmospheric chemist, and researcher,
Eugene Stoermer, for the past 10,000 years, the Earth has maintained a relatively constant
temperature with minor variations of plus or minus 1 degree Celsius (Crutzen and Stoermer, 70-
�14

71). Until the Industrial Revolution, the atmosphere’s carbon content had been relatively stable,
hovering around 275 parts per million but that would change in the late 1700’s (IPCC Working
Group I, 57). British inventor, James Watt’s, invention of the steam engine in 1781 is consid-
ered to mark the dawn of the Industrial Revolution in England which eventually spread to the
rest of Europe then the rest of the world (Mumford, 3). This is about the time humankind shifted
from an agriculture based economy to an industrial economy. Fossil fuels like coal and eventu-
ally oil were extracted from the earth and burned to power the machines of the new industrial
economy. With this shift in economic production came a new view of nature. Previously, the
natural world was seen a sacred entity and its destruction was considered a violation of Nature
but once capitalists began exploiting the natural world for economic gain, this point of view
changed. The value of Nature had been reduced to the value of the revenue it could generate
for a capitalist. Over the 150 year span of the Industrial Revolution, the British economy’s in-
dustrial production increased by 160%, the British population more than tripled, and industrial
production per capita quadrupled due to the mainstream use of fossil fuels (Jackson, 3).
The ability to extract these resources and emit them into the atmosphere is held by a
small group of capitalists who have little incentive to reform their ways. They have made their
money by exploiting the environment and as long as these practices continue to be profitable,
they will not change their ways. Without consequences for their actions, they had no incentive
to stop their practices and continue to exploit the environment for profit to this day. Today, the
harmful effects of carbon emissions are well known and cannot be ignored. In a 2009 interview,
Lord David Puttnam, an author, environmental activist and member of the British House of
Lords, accuses this generation of capitalists of making decisions that were, “not inhuman but not
particularly human under the guise of shareholder value” (Johnson and Mitleton-Kelly,72). De-
spite their knowledge of the negative impact of global climate change capitalists continue to ex-
tract carbon from the earth, emit it into the atmosphere and are knowingly contributing to the
�15
destruction of the planet. Capitalism has created a systemic problem by commodifying nature.
This attitude has dangerous consequences for humanity and places the value of capital ahead
of the value of nature, nonhuman life and the human condition.
The planet has already begun to feel the effects of global climate change from the car-
bon that has already been emitted into the atmosphere. Since the Industrial Revolution, the av-
erage global temperature has risen 0.8 degrees Celsius and has already had disastrous conse-
quences (Cornell et. al, 42-43). In 2012, 40,000 heat records were set across the United States
and across the globe, including 111 degrees in Russia, 118 degrees in Niger, and over 130 de-
grees in Pakistan (Mckibben, 251) (Easterbrook, 112-114) (Masters, 90-91). According to the
global analysis conducted annually by the National Oceanic and Atmospheric Administration
(NOAA), July 2014 saw Earth’s 355th consecutive month (29 years) where the average global
temperature is higher than predicted (NOAA, 2014). As the planet’s temperature increases, the
polar ice caps melt at an increasingly faster rate. According to some estimates, there is a
chance that this past September could have been the first ice free Arctic in history (Kerr, 1591).
Ice caps are frozen fresh water and when they melt, more water is added to the oceans causing
the sea-level to rise. When fresh water from the ice caps melts, it changes the pH of the ocean.
As a result of global climate change, the oceans are 30% more acidic than they were prior to the
Industrial Revolution (Kolbert, 380). Since their environment no longer maintains the pH level to
which they have adapted, ocean acidification has been a contributing factor to the massive
losses of aquatic biodiversity. To compound the problem, the ice caps are white, a color that
does not absorb much sunlight while the oceans are much darker and thus absorb more energy
from the Sun (Kolbert, 384). As the white ice melts, the dark ocean takes its place meaning that
as the ice caps melt, the Earth’s surface absorbs more energy from the Sun because there is
more dark area due to the melting ice. This causes the planet to heat up at an accelerated rate
and starts a negative feedback loop. As the planet warms, so too does the air in the at-
�16

mosphere. Warm air absorbs more water than cooler air, the atmosphere is 5% more moist than
it was 40 years ago (Groisman, 1857). This gives rise to shifting weather patterns, higher ocean
temperatures and larger more severe oceanic storms. As a result of shifting weather patterns,
people are being displaced or dying and nonhuman species like the Costa Rican Golden Toad,
the Ring-tailed Opossum and countless others are being driven to extinction at an alarming rate.
Traditionally arid regions like Pakistan are experiencing record breaking floods and traditionally
fertile places like Russia are experiencing horrific wildfires caused by horrible droughts (Mas-
ters, 91). Before the 2010 drought, Russia was the third largest exporter of grain in the world
but as the drought progressed, the Russian government decided that they would no longer ex-
port grain and the price of food skyrocketed across the globe.
To support life as we know it, there is a limited amount of carbon that can exist within the
atmosphere before the global temperature change would make the planet inhospitable to hu-
mans and non humans alike. The general consensus among climate change researchers is
that the this will occur if the global temperature increases 2 degrees Celsius above the tempera-
ture before the Industrial Revolution (Hansen et. al, 82). If left unchecked, this global tempera-
ture increase of 2 degree Celsius would lead to continuing and more severe desertification,
species loss, fresh water shortages, famine, natural disasters and war (Cornell et. al, 184-185).
Hansen and his team estimated the maximum amount of carbon that can be contained in the
atmosphere before, “the planet to which life has adapted will cease to exist” to be 350 parts per
million. Meaning if the atmosphere were to contain over 350 carbon parts per million, the global
temperature change of over 2 degrees Celsius would be imminent.
As of 2008, it estimated that the atmosphere contains approximately 385 parts of carbon
per million (ppm) and more recent estimates guess that it is closer to 400 ppm, implying that the
atmosphere’s carbon threshold has already been exceeded (IPCC Working Group I, 58-59)
(Hansen et. al, 83). Globally, humankind is emitting carbon into the atmosphere at an annual
�17

rate of 2 parts per million which is increasing at an average annual rate of 4.3% (Kellogg, 315).
The most conservative estimates state that globally, humankind can emit only 595 more giga-
tons of carbon into the atmosphere before there is nothing that can be done to slow or reverse
the effects of climate change. At the current rate, humankind will have exceeded the 595 giga-
ton limit by 2028. More disturbingly, the amount of carbon that exists in current fossil fuel re-
serves is about 5 times (2795 gigatons) this limit and the capitalists who control these reserves
have no incentive not to extract and sell these fossil fuels (McKibben, 746).
If carbon emissions do not peak and then dramatically decline by 2028, scientists predict
that by 2100 the average global temperature could increase by up to 6 degrees Celsius from pre
Industrial Revolution levels which would be the hottest the planet has been in 30 million years
(Zachos, 688) (Easterbrook, 45-46). Humankind has never existed at a temperature greater
than +3.3 degrees Celsius above the Industrial Revolution baseline and many members of the
scientific community believe that a 4 degree Celsius increase would be an extinction level event
for humankind and most of the species on Earth (Zachos, 688) (DeMenocal, 541) (Randall and
Schwartz, 333 and 339) (Kellogg, 316). If global temperatures were to increase by 4 degrees
Celsius, “sea levels would rise 3-6 feet, there would be a drought over 40% of the inhabitable
land leading to food shortage, global hunger and war (Cornell, 148-149). Half of the known
species on Earth would go extinct” and the world would be left in a state that is, “incompatible
with an organized global society” (Hansen, 81). Mass exodus from the worst afflicted regions,
particularly sub Saharan Africa and South America, would lead to an unprecedented refugee
crisis and an overpopulation problem for the countries that open their borders to them. Food
and water will become more scarce due to the lack of farmable land and fresh water melting
from the glaciers and ice caps and disappearing from newly formed deserts. By 2025, an esti-
mated 1.8 billion people in the most impoverished parts of the world would be living in regions of
“absolute water scarcity” (Sivakumar, 585). These people and the nonhuman life around them
�18

would suffer the worst consequences of climate change. If the world continues to accept the
consequences of current practices as the price of “progress”, this will be the cost of their poor
investment.
In a 2014 article published in The Guardian, Desmond Tutu calls it “our duty to persuade
our leaders…to help us abandon our collective addiction to fossil fuels” (Tutu, 2014). Climate
change has caused billions of dollars in property damage, loss of income, species destruction,
loss of habitat, desertification and loss of human life with a temperature increase of under 1 de-
gree Celsius (Randall and Schwartz, 333 and 339) (Cornell, 184). Renowned British economist,
Nicholas Stern, estimates costs related to climate change could eventually exceed the com-
bined cost of both World Wars and the Great Depression and calls climate change a, “… market
failure on the greatest scale the world has ever seen” (Haq and Paul, 67) (McKibben, 36-37).
International policies have not yet been strong enough to impact the profitability of these com-
panies and lack adequate enforcement mechanisms. Therefore, it is up to the citizens of the
world to apply their own pressure to these institutions. This is the first generation that will feel
the effects of climate change and is the last generation that can do anything about it. Effective
action against climate change will require a global effort and no small expense but the cost of
inaction could very well be the end of life as we know it.
�19

2.1.2 Possible Solutions
As I just described, the effects of climate change will be inevitable and disastrous if ac-
tion is not taken soon to reduce, mitigate and eliminate carbon emissions. Though some corpo-
rations are fined and ordered to clean their pollution, they largely face very few consequences
for the pollution they cause so they have no incentive to stop generating profit at the expense of
the Earth and its inhabitants. Since the capitalists are unwilling to stop their profitable yet de-
structive practices, many climate change scientists and activists have developed solutions to
mitigate the negative effects of climate change. Four of the most common solutions to combat
climate change are carbon sequestration, carbon commodification and taxation, in-
ternational action and divestment. Scientists are continuing to develop technology to capture
and store carbon, lawmakers have proposed and enacted policies to commodify and tax carbon
emissions on national and international levels and activists are calling for institutions to divest
their investment portfolios from the fossil fuel industry. In this section, I will address each of
these solutions in detail and analyze their strengths and weaknesses. Each strategy addresses
the problem differently but I will show how, of the available options, divestment is the most effec-
tive way WPI can combat global climate change.
I will be discussing the strategies mentioned above in greater depth later in this section
but before doing so, I must again address the fact that carbon emissions are not the sole cause
of global climate change. Greenhouse gas pollution from sources other than carbon dioxide
pose a similar threat to the chemical composition of the atmosphere. Prolific use of fertilizers
containing nitrous oxide for agriculture and methane from large scale animal agriculture also
produce harmful GHGs and have ethical implications of their own that should not be ignored
(Kahn, 337) (Rosas, 354) (Andrade, 124). These fertilizers are used on industrial farms to pro-
mote crop growth but they also pollute the atmosphere and water supply and contribute to the
breakdown of ecosystems and climate change. Fertilizer runoff contaminates the water supply
�20
exposing non human and human life to harmful chemicals, causing loss of biodiversity, disease
and death. Animal agriculture completely disregards the value of non human life and raises an-
imals for the sole purpose of killing them for their meat. Worldwide, these facilities pack billions
of animals together in inhumane conditions that facilitate disease, pump them with growth hor-
mones and antibiotics to promote unnatural growth and subject them to abuse in the name of
profit (Andrade, 105). Collectively, these animals produce enough methane (22%, 32 billion
tons of all GHGs that trap infrared radiation) to have an impact on the chemistry of the at-
mosphere (Kahn, 337) (Lohmann, 100). These practices are morally objectionable and must
also be stopped but as mentioned before, the fight against climate change is in triage mode so
the largest problems with greater potential to cause harm must be addressed before the other
comparatively smaller problems. Since carbon dioxide accounts for 77% of GHGs and methane
and nitrous oxide only account for 14% and 8% of GHGs respectively, the issue of carbon diox-
ide emissions must be resolved before the other sources of GHGs can be considered (Kahn,
337). However, these major pollutants have a common theme. They are all the product of capi-
talism’s exploitation of the environment. Disregard for non human life, the planets ecosystems
and its climate have all contributed to the climate crisis we face today. These are all important
issues that must be addressed in their time but the scope of this project is centered around the
reduction and elimination of carbon emissions.
Policies to commodify and tax carbon were considered by members of the United Na-
tions during the discussion around the Kyoto Protocol in 1997 but were ultimately left out of the
final agreement. The concept of commodifying and taxing carbon was first proposed in the
1960’s to serve as another commodity in the emerging futures market pioneered by Richard
Sandor and others (Lohmann, 86). When these policies were enacted, they were seen as a
means of reducing carbon emissions by financially incentivizing the worst polluters by making
them pay for the right to pollute. The hope was that the worst polluters would have to pay so
�21

much for emissions permits that it would affect their profit margins creating a gap in the market
for competitors and forcing the offending institutions to either reform their practices or go out of
business. Commodifying carbon emissions, meant ownership of carbon emissions could be
established giving the owners the ability to buy and sell these permits at any time and to any
entity (Lohmann, 91). This allows countries and institutions with emissions permits in excess of
their actual emissions to sell their remaining permits to buyers who produce more emissions
than their permits allow (Yamin, 27). Since owners can now freely trade the rights to their car-
bon emissions, a carbon trading market is created that undermines the spirit of the original poli-
cy. The institutions responsible for the greatest amount of pollution are often given permits at
little or no cost and have sufficient cash reserves to purchase any additional permits they might
need (Lohmann, 92-93). They have purchased the legal right to pollute the atmosphere which
eliminates any incentive they would have had to change and encourages business as usual.
Though carbon commodification was introduced with the intentions of reducing carbon emis-
sions, it has only truly succeeded in producing licenses to pollute (Lohmann, 101-102). Sub-
stantial overhauls of the policies and enforcement mechanisms are needed for carbon commod-
ification to be an effective means of reducing carbon emission. As it stands now, it has simply
made carbon another commodity that can be bought and sold and no tangible effort has been
made by the worst polluters to amend their ways.
The shortcomings of carbon cap and trade legislation were acknowledged during the
climate talks in Paris in December 2015. These talks resulted in an international agreement to
prevent global temperatures from rising past 1.5 degrees Celsius past preindustrial levels.
Though the talks were hailed as a success by politicians and diplomats, climate change scien-
tists and activists saw the resolutions reached as too little too late. According to McKibben and
Hansen, the resolutions reached would cause the global temperature to rise past 1.5 degrees
Celsius to 3.5 degrees Celsius which would have disastrous consequences (McKibben, A23).
�22
In an article in CounterPunch, Brian Tokar emphasizes the effects felt from a 1 degree Celsius
increase (Tokar, 2015). He further critiques the resolution’s lack of a binding enforcement
mechanism and the voluntary commitments made by countries. McKibben argues that these
commitments are just enough to prevent undeveloped countries from walking away from the
talks but not enough for developed countries to make the necessary impact on global climate
change (McKibben, A23). These talks did not save the planet from the effects of climate change
but it did buy humanity a little more time in the fight against global climate change. McKibben
and Tokar both call for activists to continue to raise climate change awareness and encourage
divestment to target the sources of global climate change, the fossil fuel companies. Like most
international discussions, it is difficult to get the countries of the world to reach a consensus
about anything and when they do, it is rarely substantial. Though the resolution has many flaws
it is a crucial step towards international agreement and action to combat climate change.
Technological optimists view climate change as a classic neo-Malthusian problem. In his
1798 essay titled, “An Essay on the Principles of Population”, Malthus discusses the problem of
food shortage due to lack of farmable land and a growing population. He believed that there
was a point at which the population of England would exceed its ability to produce food, leading
to starvation. However, he failed to account for advances in technology which increased food
production. Techno-utopians believe climate change is a similar problem and the solution lies in
the development of new technology. New forms of energy that do not involve the burning of
fossil fuels have already been developed and implemented. There are “transition towns” across
the globe that have replaced fossil fuels with these greener alternative fuel sources (Haq and
Paul, 23). However, until these become more commonplace their impact on global climate
change is comparatively negligible. In addition to green alternative energy sources technology
has been developed to capture carbon from the atmosphere, neutralize it and safely store it
(Gibbins, 4318-4319). The process the carbon dioxide molecules go through, called carbon se-
�23

questration, minimizes their harmful effects and decreases the damage they can do to the plan-
et and the atmosphere. Captured carbon can be injected into depleted aquifers and oil wells,
called carbon sinks, to prevent it from entering the atmosphere but this has potentially danger-
ous consequences to local ecosystems and marine life if the carbon were to leak (Gibbins,
4319, 4320). This technology has the potential to reduce the carbon content of the atmosphere
in the future but as it currently stands, will not be widely implemented until 2050 and even then,
there is no scientific consensus about its likely efficacy in dealing with global climate change.
(Gibbins, 4320). This is too long of a time table and by the time this technology is ubiquitous, it
could be too late. Some climate change prediction models state that if this technology is not
implemented by 2020, it will not have the desired effect (Haszeldine, 1651). Also, there are still
questions about how effective it can be and if it creates more problems than it solves. Storing
carbon dioxide beneath the Earth’s surface or in Its oceans could have dangerous conse-
quences on non human life and could create more GHG problems for future generations when
storage limits are reached. Though still in its infancy, carbon capture and storage technology
shows some promise in the fight against climate change but it is far from the cure all solution
technological utopians hope it to be.
Divestment is a tactic that activists have successfully used in the past to apply social,
political and financial pressure to offending institutions by encouraging investors to remove their
investments from these entities in an effort to combat a social injustice. Institutions who as-
sociate with or commit social injustices receive negative attention and the public begins to view
them unfavorably. The negative attention is magnified by international political pressure which
creates a climate of instability within the offending institution. Investors see their investments as
volatile and view divestment as an opportunity to escape a declining investment, gain favorable
attention and in their best self interest. The goal of the activists is to facilitate this climate of in-
stability around an offending institution by raising social awareness and promoting action. The
�24

theory is that the mounting social and political pressure coupled with financial destabilization will
coerce the offending institution to end its socially destructive practices. The consequences of
climate change are the ultimate social injustice because those responsible are left unaccount-
able and the most disadvantaged people and non human life bear the bulk of the burden. Di-
vestment is the result of social pressure from activists calling for the end of an injustice, increas-
ing awareness of the injustice and international action against it. Its effects increase dramatical-
ly as more investors and institutions commit to divest. For example, in 2015, the year following
Stanford’s commitment to divest from coal, academic divestment commitments more than dou-
bled (gofossilfree.org). It was highly publicized and received national media attention which
showed other academic institutions that even schools with endowments as large as Stanford’s
could divest effectively.
Today, climate change activists are involved in a campaign to encourage institutions to
divest from fossil fuel companies as a way to protest the harmful effects they have on the envi-
ronment. To date, 499 total institutions of all sizes including educational endowment funds, mu-
nicipalities religious organizations and governments have divested their portfolios of approxi-
mately 3.4 trillion dollars worth of fossil fuel investments . Other instances where divestment 1
has proven to be an effective strategy will be discussed in a later section.
These are four of the most common strategies proposed to combat global climate
change but there are many others each with their own strengths and weaknesses. Carbon
commodification has become an ineffective strategy and has moved away from its initial pur-
pose (Lohmann, 101). Instead of reducing carbon emissions, they have become like any other
commodity and are readily bought and sold by the largest offenders giving them the license to
pollute. There are still many questions surrounding carbon capture and storage technology. It
A full accounting of all divested institutions can be found at gofossilfree.org/commitments, a 1
website that promotes divestment and tracks divested institutions. A list of all divested schools and available endowment information can be found in Appendices A and B
�25

may not be safe for the environment, is still decades of development away from being an effec-
tive strategy and if its development is not accelerated, it will cease to be an effective way to re-
duce atmospheric pollution (Gibbins, 4321). The Paris climate talks have shown how in-
ternational action has proven to be slow and unaligned with the most recent science. It is diffi-
cult for international bodies to reach agreement and these agreements are flimsy at best.
Though international action is important, the process to accomplish a resolution takes more time
than the planet has to spare. Divestment is the only strategy that can be implemented indepen-
dently of other entities and in a timely manner and though it has its flaws, is the most effective
tactic available to WPI to combat global climate change. Individual and institutional investors do
not need to wait for legislators to enact policies to combat climate change or for new technology
to be invented to counteract climate change. Divestment is also a strategy activists have suc-
cessfully used in the past to combat social injustice by refusing to fund and support destructive
practices. For these reasons, divestment is the most effective strategy an academic institution
can implement to leverage its influence within the academic community to fight global climate
change.
�26

2.2 THE CLIMATE CHANGE MOVEMENT
As I argued in the previous sections, climate change is a global problem that will contin-
ue to get worse with time. The window to mitigate the effects of climate change is closing and
the consequences for human and non human life alike will be disastrous. The world can no
longer stand idly by and wait for a solution to manifest itself. Worldwide, millions of people are
in agreement and have taken action. On September 21, 2014 over 400,000 people in 162
countries engaged in a worldwide march against the harmful effects climate change and 2015
saw a substantial increase in academic institutions committing to divest their endowments from
fossil fuels (350.org) (gofossilfree.org). These modern activists are continuing the legacy of
many generations of activists that came before them and have learned from their successes
and shortcomings. They are utilizing tactics and following strategies that were effective in the
past and have learned from those that were not. This section will discuss the origins, effective-
ness and shortcomings of the Climate Change Movement and of divestment as an effective tac-
tic. I will analyze the successes and failures of social movements that have successfully imple-
mented divestment tactics in the past, discuss counterarguments for divestment and address
them accordingly, and will argue for the implementation of a divestment strategy as the best
strategy for a university to combat global climate change.
�27
2.2.1 History of the Climate Change Movement
The Climate Change Movement and divestment campaign have their roots in the Envi-
ronmental Movement that emerged in the 1960’s amidst a growing counterculture but the origins
of these movements can be traced back to the Romantic Period of the late 1700’s and 1800’s
(Haq and Paul, 3 and 7). Romanticism emphasized the value of the natural world in a time when
the mentality of the Industrial Revolution devalued it to the revenue it can generate. Modern
activists are following in the footsteps of the Romantics by showing the value of Nature beyond
its value as a commodity. Both Romantics and modern activists believe that Nature has inher-
ent value and seek to demonstrate this to the world. Modern activists see the consequences of
the destruction of Nature and engage in collective action to promote awareness and change
while the Romantics did the same by creating beautiful works of art and literature depicting and
describing Nature’s beauty and condemning the destruction of the natural world. They both un-
derstand that the planet is shared by all creatures and all damage it sustains impacts us all to
varying degrees. These ideas are radically different from the industrial mentality promoted by
capitalism and are the founding beliefs of the Environmental Movement which lead into the Cli-
mate Change Movement.
Though the Environmental Movement as it exists today has been around since the
1960’s, it has only recently focused on the issue of global climate change and adopted divest-
ment as a tactic. Feelings of environmentalism, as we know it today, have been around since
the late 1800’s. Most mark the beginnings of modern environmentalism with John Muir’s forma-
tion of the Sierra Club in 1892 or the founding of the National Trust in the United Kingdom in
1895 (Haq and Paul, 6). During the early 1900’s and throughout the World Wars, the main fo-
cus of environmental activists was preservation of natural beauty. The decades between the
turn of the century and the end of World War II saw the formation of groups like The National
Audubon Society (1905), the Izaak Walton League (1922), the Wilderness Society (1935) and
�28
the National Wildlife Federation with the mission of protecting and preserving Nature. In the
decades following World War II, environmental activism began to take on a new form. After
World War II, there was a revitalized sense of the value of Nature. The mid 1940’s through the
late 1950’s and into the 1960’s saw an increase in protests against environmental and social
injustices. Activists rallied against causes like the use of chemical pesticides like DDT, the her-
bicide Agent Orange, nuclear weapons testing, air pollution and the Vietnam War (Haq and
Paul, 7). Isolated groups of grassroots activists protested local environmental injustices like the
construction of incinerators and offshore drilling . The decade following World War II also saw
the first wave of environmental legislation with the passing of the Federal Water Pollution Con-
trol Act (1948) and the Air Pollution Control Act (1955) with the Clean Air Act (1963), the Wilder-
ness Act (1964) and the Land and Water Conservation Act (1965) following shortly thereafter.
In addition to new environmental legislation and grassroots activism, thinkers like Rachel Car-
son (Silent Spring, 1962), Kenneth Boulding (The Economics of the Coming Spaceship Earth,
1966), Garrett Hardin (The Tragedy of the Commons, 1968) and Paul Elrich (The Population
Bomb, 1968) published books and papers about the harmful implications of environmental
degradation and addressed these issues from an intellectual standpoint and brought environ-
mental issues to the public’s attention (Haq and Paul, xii). Particularly, Carson’s Silent Spring
raised public awareness of the harmful effects of pesticides and eventually lead to the banning
of DDT.
These activists used the contacts they made in previous movements to recruit new
members to their causes and to promote environmental activism (Tokar, 43). As a result, long
standing organizations like the Sierra Club (founded in 1892) saw their membership swell from
its original 1000 to 7000 by 1950 as activists felt the need to affiliate with organizations in an
effort to establish an environmentally friendly collective identity. The Sierra Club’s mission is to
protect the wild places of the earth, practice and promote responsible use of the earths ecosys-
�29

tems and resources, protect and restore the quality of the natural and human environment.
However, since so many causes fell under the umbrella of environmentalism and there was dis-
agreement regarding issue priority and tactics resulting in the formation of many more organiza-
tions. Organizations like the World Wildlife Fund (1961), the Environmental Defense Fund
(1967), Friends of Earth (1969) and Greenpeace (1971) were established to accommodate the
diverse interests of environmental activists. Greenpeace in particular was founded in response
to mainstream environmental organizations aversion to direct action and preference for political
lobbying. By the late 1980’s, over 300 different environmental groups from diverse backgrounds
had been established each of which with their own priorities and repertoire of preferred tactics.
The interests of these organizations include wildlife protection, the efficacy of environmentally
harmful projects, greenhouse gas emissions, climate change, corporate responsibility and many
more. These large centralized entities lent credibility to the Environmental Movement but also
made it difficult for the movement as a whole to establish its priorities (Haq and Paul, 11).
Sources of funding and choice of tactic have been points of contention within the Environmental
Movement since its inception (Tokar, 46).
The over saturation of environmental organizations, causes and tactics lead to stiff com-
petition for scarce resources forcing activists to seek funding through other avenues. Diverse
causes, scarce funding and growing membership stretched the available resources thinly and
made outside funding critical to the success of an environmental organization (Summerfeldt,
429-430). One way environmental organizations acquired outside funding was through partner-
ships with corporations who might sympathize with their cause (Haq and Paul, 18-19) (Kohl-
Arenas 482-483 and 495-496). Though it had some financial benefits, corporate sponsorship
was not always welcomed by environmental activists. This was part of the reason for the forma-
tion of the organization, Earth First! (1980). To achieve these alliances, organizations had to
weaken their stance in some key issues particularly with the use of disruptive and public tactics
�30

which corporations saw as a potential liability in a partner (Haq and Paul, 20-21). These tactics
were most commonly deployed by grassroots activists who believed that environmental prob-
lems could not be legislated away and that the best course of action was to combat the prob-
lems directly. Mainstream lobbying organizations believed the exact opposite, believing that the
most pragmatic way to influence mainstream institutions was through politics (Tokar, 44). This
lead to the formation of Green Party in 1985 and became a way for the Environmental Move-
ment to express its ideas in politics by attempting to produce electable political candidates in all
levels of government.
These varying approaches to environmental issues caused a schism within the Envi-
ronmental Movement which was magnified by the political climate of the 1980’s. Where the
previous decades saw the passing of environmental legislation and an increase in environmen-
tal awareness the 1980’s saw a new level of environmental destruction. The pro capitalist anti
regulatory position of the Reagan Administration stressed the importance of economic progress
even at the expense of the environment (Reagan, 115-116). The Administration enacted poli-
cies that undermined environmental legislation and advocated for unregulated economic growth
which lead to environmental atrocities throughout Reagan’s time in office. Hazardous waste
dumps like the one proposed in Afton, North Carolina (1981), a predominately black community
were being built around the country and caused to health problems in the surrounding neigh-
borhoods (Haq and Paul, xiii). The country was suffering from an acid rain problem and Mon-
santo was given the green light to begin field trials on their genetically modified crops in 1987
(Haq and Paul, 51). The end of his second term saw one of the worst environmental disasters
of its time when the Exxon Valdez spilled oil off the Alaska coast in 1989, killing millions of non-
human beings (Haq and Paul, xiii,xiv and 80). The culture of greed, militarism and consumption
disregarded these disasters and allowed them to continue in the name of economic progress
and prosperity (Reagan, 114-118). Capitalists exploited the environment at unprecedented
�31

rates and with impunity while efforts to regulate the unfettered growth of capitalism to preserve
the natural world were continually ignored leaving the Environmental Movement with little to
show for during this decade (Rootes, 843).
Towards the end of the Reagan Administration and after Reagan left office, there was a
change in environmental awareness. During this time, the Green Party began to rise to a new
level of political prominence. Their mission was to combat environmental issues through politi-
cal influence and in 1986, David Conley and Frank Koehn were elected to the County Board of
Supervisors and became the first Green Party candidates to be elected in the United States.
Their political platform opposed the of commodification of air and water, denounced sexism and
racism and advocated for Native American sovereignty, a 75% reduction in military spending
and decentralized control of healthcare, banking, insurance, energy and transportation (Tokar,
45). This and other elections paved the way for Ralph Nader’s 1996 and 2000 failed presidential
campaigns. Though unsuccessful in the United States, the European green parties upon which
the US party was modeled, were much more successful. The mid 1990’s and into the 2000’s
saw an increase in international discussion regarding environmental issues, strong environmen-
tal legislation being passed in Europe and annual conferences on the topic of climate change.
These talks have lead to implementation of international legislation like the Kyoto Protocol.
Adopted in 1997 and implemented in 2005, it called for countries to reduce their carbon emis-
sions by 20% of the baseline established in 2005 by 2020 but was not ratified by the United
States (van der Heijden, 3).
By 2005, most people in the US and the UK believed climate change was the origin of all
other problems facing the environment and therefore, the most important environmental issue
(Haq and Paul, 21 and 88). In an effort to combat climate change, activist and climate change
writer, Bill McKibben and his supporters founded the organization 350 in 2007 with the goal of
determining the maximum amount of carbon that can be emitted into the atmosphere and ensur-
�32

ing this limit is not exceeded by calling institutions and municipalities to divest their holdings
from fossil fuels (Haq and Paul, 23). In 2009, the organization coordinated 5200 rallies across
181 countries and promotes the use of divestment as a tactic to combat climate change (McK-
ibben, 256). To date, of the 499 institutions that have divested approximately $3.4 trillion, 29 are
academic institutions in the United States and have divested over $140 billion from fossil fuel
assets since 2009 (gofossilfree.org). In 2009, Hampshire College continued its tradition of di-
vesting from social injustices like South African apartheid and nuclear proliferation when it be-
came the first school to commit to divestment. In 2014, Stanford University committed to divest
its $21 billion endowment from coal and the following year, large state universities like University
of Washington, University of Hawaii and Syracuse University all committed to divestment . Al2 -
most every year since 2009, more schools have committed to divesting their endowments than
the previous year, suggesting that divestment is a viable strategy and a growing trend. Though
Climate Change Divestment is a relatively new movement, it is progressing similarly to divest-
ment movements of the past like the movement to divest from South Africa’s apartheid regime.
Social and financial pressures are being applied to the institutions responsible for the worst pol-
lution and they are beginning to be seen as an investment that is a poor reflection of personal
and institutional values. The financial impact of divestment on the offending institutions is up for
debate but as social pressure builds and more people begin to see the investment as a social
pariah, the institution is encouraged to amend its offensive practices or continue to be a social
liability to investors. Thus far, the Climate Change Divestment Movement has shown itself to be
effective with annual increases in divestment commitments and many more institutions and mu-
nicipalities recognizing fossil fuel divestment as an effective and necessary strategy to combat
climate change.
Details regarding all divested schools can be found in Appendices A and B and will be dis2 -cussed in more detail in the Results section.
�33

2.2.2 Divestment as a Historically Successful Tactic
Though the Environmental Movement has only recently adopted divestment as a tactic,
social movements of the past have used divestment to combat social injustices on several oc-
casions. As mentioned before, divestment is a tactic activists use to encourage investors to
avoid specific assets or securities for moral reasons in an effort to restrict the funding to the
causes of social injustice. This limits the offending institutions ability to generate profit and
causes their securities to become socially and financially unattractive investments. The hope is
that the lack of capital and social stigma attached to the institution due to its association with a
social injustice will encourage the offending institution to mend its ways or force it to revise its
operations. Movements like the South African Anti-Apartheid Movement successfully employed
divestment tactics as part of their efforts to end the apartheid regime in South Africa. In this
section, I will discuss the South African Anti-Apartheid Movement and the role divestment
played in meeting the movement’s goals.
Widespread social injustice, discriminatory regulations and open racism were common-
place in South Africa from the earliest interactions between Dutch colonists and the natives in
1658 well before the official rise of apartheid (Worden, 75). Indigenous people were subjected
to different laws than whites and enslaved until 1834. The Caledon Code of 1809 forced slaves
to carry passes to prove they identity, subjected to arrest if caught without them and was en-
forced well after the end of slavery. These and other discriminatory laws were passed and by
the 1900’s, segregation was a common part of life. Black and white South Africans did not mix
socially, in the workplace or in schools and a clear divide between white haves and the black
have nots was deeply ingrained in society (Adam and Moodley, 14). The circumstances bred
mistrust between black and white South Africans which resulted in varying degrees of conflict
throughout the nation’s history (Ross, 88). This came to a head in 1948 when the National Par-
�34
ty came to power under the apartheid platform subjecting black South Africans to more discrimi-
natory laws, harsh punishment and rigid enforcement.
The laws established prior to the National Party’s rise to power oppressed black South
Africans by paying them lower wages than their white counterparts, restricting their access to
education and segregating all parts of society. The National Party took this a step further by
passing the Population Registration Act (1950), the Group Areas Act (1950) and the Reservation
of Separate Amenities Act (1953) (Worden, 104-105). In addition to the institutional racism and
oppression of the past, the government issued new laws legally classifying South African citi-
zens as white, colored, Indian or Native, and no longer permitted interracial marriage. The
Caledon Code was strictly enforced, black South Africans were not allowed to travel outside
their region without the proper paperwork, and the police had the authority to forcibly detain and
relocate any citizen for any reason (Ross, 146). The 1950’s and the decades to follow saw a
rise in civil disobedience and political protests for fair wages, better working conditions and
freedom from white oppression by black South Africans (Worden, 109). The African National
Congress (ANC) urged participants to utilize nonviolent tactics in their protests. Despite the
nonviolent nature of protests, political organizers were routinely arrested, detained and tortured
and relocated while the protests were met with lethal force. On March 21, 1960 during a peace-
ful march protesting the Caledon Code, a police force of white South Africans fired upon the ac-
tivists killing 69 and wounding 180 in what became known as the Sharpeville Massacre (Wor-
den, 116). After this incident, the ANC reluctantly abandoned their peaceful tactics in favor of a
more violent approach in 1961 (Sparks, 73). The apartheid government met resistance with
brutality and conflict between the government and its citizens continued to escalate.
The conflict gained international attention in 1976 after a group of 20,000 black South
African students were fired upon in Soweto, killing at least 176 and possibly as many as 700
(Ross, 153). People around the world began to speak out against the atrocities committed by
�35

the South African government and the events in South Africa began to receive more media at-
tention. The situation in South Africa was incredibly volatile with centuries of racism, tyranny,
forced poverty and oppression leading to violent revolutionary action by black South Africans.
Increased media coverage of the violence in South Africa, international outcry and the threat of
economic sanctions magnified the already volatile situation in South Africa. In 1982, loans
made to South Africa by international banks came due and the banks, including Barclay’s Bank,
chose not to allow them the option to renew them which temporarily shut down the Johannes-
burg Stock Exchange (Worden, 145). Countries ceased trade engagements with South Africa
and large corporations like I.B.M., Kodak and Revlon divested their pension funds. In the Unit-
ed States, students built shanties on college campuses, engaged in sit ins and called for their
schools to divest their endowments from South Africa and companies that do business there
(Broadhurst, 11). Between 1977 and 1989, 167 academic institutions over 200 US companies
and 20 countries severed business ties with South Africa (Soule, 4). These institutions included
high profile schools like Harvard and Colombia and collectively divested over $1 billion of direct
investment from South Africa (Welch and Wazzan, 79-83). After nearly fifty years of apartheid
and over 300 years of oppression, international economic sanctions, mounting social pressure,
and divestment contributed to the collapse of South African apartheid in 1994.
Though divestment was a contributing factor it alone did not cause the end of apartheid
in South Africa. Without the non violent demonstrations, violent responses to brutality, in-
creased media coverage and international political and social pressure that preceded it, divest-
ment could not have occurred. The ANC’s initial strategy of nonviolent campaigns against
apartheid was not effective and resulted in violent tactics from both sides and an increase in
media coverage. Activists speaking out against apartheid were making their voices heard and
as more became known about the situation in South Africa, the more clear it became that it must
stop. Working with the volatile situation in South Africa, activists encouraged divestment as a
�36

way to deal a crippling blow to the apartheid government. The decision to divest from South
Africa would not even have been considered by investors if there was not substantial media
coverage outlining the atrocities committed on behalf of the South African government. All of
these events had to occur before the world could take take a stand against South African
apartheid. Divestment was the straw that broke the camel’s back but the contributions made by
groups like the ANC to organize and mobilize black South Africans must not be minimized
(Ross, 196-197). Without proper organization, visible tactics and proper media coverage, the
international pressure for divestment might not have had the same effect on the South African
government.
�37
2.3.3 Counterarguments and Summary
Though the South African case shows that divestment can be an effective tactic to com-
bat social injustice, it has also received some valid criticism. The three main points made by
critics of divestment are: that divestment does not make a substantial financial impact on the
offending institution, other tactics are more effective and that divestment is against the institu-
tion’s financial self interest. In this section, I will address these counterarguments against di-
vestment and advocate for its implementation as the most effective strategy an academic insti-
tution can employ to combat global climate change.
A 1999 study analyzed the financial impact divestment from South Africa made on the
targeted companies and South African markets. The researchers found that when socially re-
sponsible investors divested from the South Africa and those who did business there, more in-
different investors stepped in to take advantage of the new investment opportunity (Welch and
Wazzan, 79-83). The indifferent investors replace the investments of those who divested and
Welch and Wazzen determined that this made divestment an ineffective tactic because it did not
make a substantial financial impact on the offending institutions. However, this study neglects
to account for the increased media attention and global sympathy for black South Africans that
shed an unfavorable light on the South Africa government. Large amounts of negative publicity
discouraged further investment in South Africa and encouraged those with existing investments
to consider other alternatives. Divestment is just one tool to fight social injustice which hap-
pened to occur towards the end of a movement during the height of its publicity. Though it was
not entirely responsible for the end of apartheid in South Africa, the fact that it was a contributing
factor cannot be denied. There will always be indifferent investors ready to capitalize on the
misfortunes of others but this does not reduce the impact of the tactic. The effectiveness of di-
vestment is not judged solely on the financial impact it has on the offending institutions. The
united social and political pressure from the international community was more important than
�38

destabilizing the financial situation in South Africa. Together, the countries and people of the
world took a stand against the social injustice of apartheid and decided it could no longer be al-
lowed to continue. Though the financial impacts of divestment were mitigated, as a tactic, it cer-
tainly contributed bringing an end to the apartheid regime in South Africa.
Another criticism of divestment involves the voice of shareholders in the operations of
publicly traded companies. When an investor purchases common stock in a company they are
entitled to voice their opinions about the company’s direction. Some critics of divestment argue
that it would be more effective to purchase more shares of common stock in these companies to
increase the opposition among the shareholders. These companies are obligated to generate a
profit for their shareholders and usually only listen to them or the government when dictating the
direction of the company. The idea is that increased shareholder opposition will create pressure
from within the organization to move the institution away from its objectionable course. Though
shareholders are entitled to voice their opinion, this does not guarantee that the institution will
listen to it. If the opposition does not hold the majority of the common stock of the company,
they cannot force it to do anything. Additionally, common stock does not generate as much rev-
enue as preferred stock because you pay for the voting rights. To reallocate assets to common
stock in fossil fuel companies means that these assets are either taking on unnecessary addi-
tional risk or underperforming. Neither outcome is ideal for an endowment portfolio and there-
fore makes this a legitimately poor investment option. Furthermore, purchasing common stock
in fossil fuel companies is still funding the institutions that are destroying the planet and allowing
them to continue their practices. The dissenting shareholder voices will be ignored and busi-
ness as usual will continue.
The most common objection to divestment, is also WPI’s position on divestment. While
the institution and the Board of Trustees recognize the contributions fossil fuel emissions have
made to global climate change, they are unwilling to take a financial loss to stand against these
�39

practices. In later sections I will show how divestment does not imply assuming more risk or
financial loss and can actually be a strategy to mitigate risk and increase returns. The point of
divestment is to send the message that this institution will not tolerate the offending Institution’s
actions. Regardless if it may cost the institution in the short term, if the message is important
enough to the it, the financial cost would not matter. To invest in an asset is to tacitly condone
the practices that generate capital for it. By holding assets in fossil fuels, WPI is condoning the
destructive practices of fossil fuel companies and contributing to the causes of global climate
change. If WPI were to divest, in addition to the potential for higher returns and lower risk that I
will demonstrate later, it would also show the world that it will no longer stand idly by as the
planet is destroyed. Rather than being a part of the problem, they would be part of the solution.
There are several ways to address the environmental issues plaguing the planet today
but I believe that divestment carries the least risk and is the most effective way for WPI to com-
bat climate change. It has shown itself to be an effective tactic in the past and contrary to the
belief of the members of the Board of Trustees does not carry a large risk of financial risk as I
will prove later. Divestment would send a powerful message to the rest of the academic com-
munity by becoming the first polytechnic to divest from fossil fuels and would open the door for
similar schools to inquire into divestment as a viable financial strategy. Finally, if WPI knowingly
continues its current investment practices, it is actively condoning the destruction of Nature de-
spite knowledge of better alternatives. This would be in blatant disregard of the values of the
institution and its community and must not be allowed to happen. The Board of Trustees must
answer the community’s call to divest and align its endowment portfolio with its founding values.
�40

2.3 FINANCIAL TERMS AND CONCEPTS
To address the fiduciary concerns of WPI’s Board of Trustees and reassure them of the
validity of divestment as a financially reasonable course of action, the sections to follow will dis-
cuss relevant financial terms and concepts which will lead into a financial argument for divest-
ment. These sections will discuss Risk, Investment Vehicles, Diversification and Portfolio
Design. This will lead into a section regarding the specifics of endowment portfolios and WPI’s
finances. These concepts must be introduced before the methodology and results to give rele-
vant background information about the financial reality of divestment. If divestment is seen to
be a financially risky proposition, the Board of Trustees will take no action and continue busi-
ness as usual. The following sections and the rest of this project will demonstrate how invest-
ments in fossil fuels can be replaced with other assets and achieve better results.
2.3.1 RISK
It is important for investors to understand the different investments available to them,
how they work, and the benefits of each. Some assets involve more risk than others and un-
derstanding how these assets vary is crucial when determining the asset allocation that meets
the investors goals. A portfolio that properly allocates its funds in diverse assets guards itself
against unnecessary risk while meeting the goals of the investor.
A portfolio consists of different investments and is constructed with the intent to in-
crease the investor’s wealth. The different assets each have advantages and disadvantages,
including receiving different rates of return. The expected rate of return is what analysts predict
for the performance of the investment. It is an educated assumption based on the risk taken
and will usually not be equal to the actual rate of return which is how the investment actually
performs. The return is calculated by subtracting the initial price of the investment from the
�41

price of the investment at its sale, adding all the dividends that have accumulated while holding
the investment and dividing that number by the initial price of the investment (Bodie et.al, 111).
The capital generated by a portfolio are the portfolio returns which are based on the
performance of the portfolio based on its asset allocation. The advantages and disadvantages
of the different investments reflect the desired level of risk to the investor and the return they will
receive given the risk. A portfolio that carries more risk has the potential to earn higher returns
but also the potential for more loss. More stable investments do not generate as high of a re-
turn due to their lower level of risk but there is less likelihood of loss. The combination of high
risk and low risk investments in a portfolio generate the portfolio’s overall return.
Risk is the likelihood that an asset will decrease in value. It is based on the price volatil-
ity of the asset. The more volatile an asset is,the higher the risk of loss but this is typically ac-
companied by the potential for higher gains. Understanding the risk return tradeoff is essential
when determining one’s investment goals. Investors must know the level of risk they are willing
to accept (Black, 95). The rate of return for every asset is different and is based on the level of
risk associated with each asset, on average, the more risk taken the larger the reward. To earn
high returns, risk is unavoidable but some can be mitigated through proper diversification (Bodie
et.al, 149).
Risk premium is a statistic that is calculated by comparing the rate of return for an in-
vestment to the rate of return of a low risk asset. This determines the “upside” of taking on the
additional risk as opposed to investing in a low risk option. For example, if an investor had a
higher tolerance for risk, he or she would invest in the stock of a company and if the same in-
vestor had a lower tolerance for risk, they would invest in the same company’s bonds. A diversi-
fied portfolio consists of a mixture of stable and risky assets. The combination of these assets
allows the investor to maximize returns while limiting risk. Typically with endowment funds, the
objective is to produce the maximum income possible while limiting exposure to only moderate
�42

risk (Bodie et.al, 721). This investing style ensures the endowment fund generates sufficient
capital to maintain the institution and still be solvent for generations to come.
�43

2.3.2 INVESTMENT VEHICLES
A properly allocated portfolio will contain of a variety of investments. These include
stocks, bonds, United States Treasury Bills, and commodities. Each asset has advantages and
disadvantages. When properly allocated, the advantages and disadvantages of the different
assets produce returns without taking on more than the desired amount of risk. Below, I explain
three different securities and their advantages and disadvantages.
United States Treasury Bills (T-Bills) are considered to be nearly risk free assets.
They are short term government securities sold at less than face value and returning the face
amount upon maturity (Bodie et.al, 27). The only risk they carry is the unlikely event that the
United States Treasury defaults. The pricing of T Bills is based on how long it will take for them
to reach maturity. Since they are a very low risk asset, their return is not very high but investors
do not buy them for the return on investment. They use them as a safety net that will allow
them to take on risks on other assets that would otherwise be considered too volatile for their
investment goals.
Stocks are shares of a company that are sold at market and purchased by investors
with the hope of high returns on their investment. Investors can purchase either preferred or
common shares of stock in a company. Purchasing shares of a company makes you a partial
owner of the company thus not obligating the company to pay the investor. The benefit to own-
ing stock is the income stream generated by the dividends, shares of the profit of the company
distributed among the shareholders, and the potential for capital gains on the sale of the stock in
the future. Preferred shares pay out a stream of dividends and do not give their owners the
right to vote on matters concerning company affairs. Common shares may pay a dividend, but
likely will not, but they do allow the owner the right to vote on company affairs. Stocks are more
risky than assets like bonds so they typically offer a higher average rate of return (Bodie et.al,
37-40). According to a study conducted by New York University, between 2005 and 2014, the
�44
average return on investment in shares of companies on the S&P 500 was between 9.37% and
9.7%. The average risk premium as compared to T-Bills was between 6.18% and 7.94% and
between 2.73% and 4.06% as compared to United States Treasury bonds (Damodaran). Mean-
ing, that stocks in the S&P 500 performed about 6% to 8% better than T-Bills and about 3%-4%
better than US Treasury bonds.
Bonds are shares of debt that can be bought and sold in a marketplace. Companies,
municipalities, institutions, and governments issue bonds as a way to increase capital for a new
venture. When investors purchase the bond, part of the contract is when the bond reaches ma-
turity it will compensate the investor with a payout. Purchasing a bond, the investor becomes a
creditor to the institution that sold the bond thus obligating them to pay the investor back. They
can also be set up to produce an income stream similar to preferred stock (Bodie et.al, 31-37).
According to the same New York University study, the average return on investment for United
States Treasury bonds was between 4.88% and 5.31% between the years 2005 and 2014. The
risk premium was between 3.45 and 3.88 as compared to T-Bills and between -2.73% and
-4.06% as compared to stocks in S&P 500 companies (Damodaran). Meaning, that US Trea-
sury bonds performed about 5% better than T-Bills but performed about 3%-4% worse than
stocks in the S&P 500.
�45
2.3.3 DIVERSIFICATION
Diversification is the process by which assets in a portfolio are balanced according to the
level of risk they carry. More risky assets are held in addition to less risky assets and stable as-
sets. For an endowment, much like for personal investors, the trustees want the portfolio to
have high expected rates of return and low volatility. By properly diversifying their portfolio, in-
vestors can earn a higher rate of return with less risk than they could in a portfolio that was not
properly diversified. Adding different assets to your portfolio actually lowers the volatility of the
portfolio even if the assets added are more risky (Bodie et.al, 157).
Diversifying a portfolio spreads the risk of each asset throughout the entire portfolio in-
stead of relying on the success or failure of one particular asset. If an investor invests all of
their capital in one asset and that asset performs worse than expected, the investor will take a
loss. The investor has put all their eggs into one basket with the hope of reward but also an el-
evated risk of loss. There are no other assets in the portfolio with the potential to over perform
that could have mitigated the investor’s losses. If the investor invested in multiple assets, the
risk of this happening is greatly reduced. When one asset is performing poorly, another might
be performing well and having investments in multiple assets allows for one investment to bal-
ance the other. Some investments will perform well and others will not but having multiple in-
vestments helps protect against major losses that become a greater possibility with fewer in-
vestments.
Every portfolio has an ideal level of risky assets that relates to the investor’s goals.
Some investors, particularly young professionals, want to earn as high of a return as they can
while they are young and still have time to rebound from a large loss. Investors like the trustees
of an endowment want a more stable portfolio that generates the optimal return for the low level
of risk (Bodie et.al, 162-163). Both portfolios have an ideal level of risk that will align with the
investor’s goals and generate the highest rate of return. The reward to volatility ratio (Sharpe
�46
ratio) is used to rank portfolios in terms of the risk return tradeoff (Bodie et.al, 125). This ratio
takes the portfolio’s expected return in excess of that on risk free securities and divides it by the
standard deviation of the rate of return in excess of the risk free rate (Bodie et.al, 122-125). A
higher Sharpe ratio means that the portfolio will produce a higher reward per unit of volatility and
is a good way to compare the efficiency of different portfolios.
The capital allocation line (CAL) is used in conjunction with the Sharpe ratio to determine
the proper asset allocation for the risk tolerance of the investor. The CAL is the result of adding
low risk assets (United States Treasury Bills) to the portfolio. Adding these assets to a portfolio
will give it a higher expected rate of return than a portfolio that consists of high and low risk as-
sets (stocks and bonds) (Bodie et.al, 162). The CAL with the highest Sharpe ratio will produce a
portfolio with the best combination of risky assets mixed with safe assets otherwise known as
the optimal risky portfolio because it generates the highest rate of return per unit of risk (Bodie
et.al, 161-165).
Once the CAL with the highest Sharpe ratio is established, one can then find the optimal
composition of the rest of the portfolio. The ideal percentages of the portfolio invested in stocks
and bonds have the highest Sharpe ratio (Bodie et.al, 162). Since there are only two types of
assets that carry risk, one can solve for the weights each asset holds once they know what per-
centage of the total investment will be allocated to risk free assets. Once they know the weights
and the percentage they choose to allocate to risk carrying assets, all that is left to be done is to
multiply each weight by the percentage allocated to each risk carrying asset. This will yield the
the optimal composition of the portfolio.
For example, if an investor decided to build a portfolio with an initial investment of
$50,000 and the goal to have stable growth over the long term, they would need to determine
the ideal composition of risky and non risky assets to meet their investment goals. The investor
has the option to invest in income or growth stocks, bonds, and T Bills. The income stocks earn
�47

an average rate of return of 5%, the growth stocks earn a rate of return of 9%, the bonds earn
4%, and the T Bills earn 0.5%. For the portfolio to align with the investor’s goals for stable long
term growth, it would likely consist of more bonds than stocks. Bonds are less volatile asset
compared to stocks thus making them a better option for investors who seek to mitigate risk.
The money that is invested in stocks would likely be more heavily invested in income stocks
than growth stocks. Growth stocks have a higher rate of return due to their volatility. They typi-
cally perform exceptionally well or incredibly poorly but they help increase the possibility for a
higher rate of return from the entire portfolio. A fair portion of the portfolio would likely also be
allocated to T Bills. They are a very low risk investment and thus will not generate a very high
return but they are also incredibly stable investments which allows the investor to accept more
risk in other areas. For an investor who is focused on long term investment and mitigating risk,
T Bills will generate a steady but small return on investment. Their real value is the stability they
offer to the portfolio as a whole. The incredibly low risk associated with T Bills allows for more
risk to be taken in other investments in the pursuit of optimal returns. They are a risk manage-
ment tool that allows for more risk in the portfolio and a higher possible rate of return. Investing
the incorrect amount in any asset class causes the portfolio to fall short of the investor’s goals
and not perform at the optimal efficiency that is the product of proper diversification.
�48
2.3.4 PORTFOLIO DESIGN
When designing a portfolio for an endowment, there are many factors that must be con-
sidered. The typical investment goal for endowment funds is “to provide at least the same level
of support from the endowment to future generations that the current beneficiaries
enjoy.” (Fogler, 1994). The responsibility of those who manage the endowment funds is to en-
sure that the portfolio performs just as well if not better than its current performance. This re-
sponsibility falls to the institution’s Board of Trustees. To accomplish this, they must consider
the asset allocation that will best meet their investment goal, how they plan to spend the capital
generated from the fund and plan a strategy for periodically rebalancing the portfolio (Fogler,
1994).
To determine the appropriate asset allocation for a portfolio, it is important to know the
risk tolerance of the investor. The composition of assets is reflective of the investor’s appetite
for risk. How much risk they are willing to accept gives parameters for the allocation of invest-
ment capital. After determining the asset allocation, the spending policy for the endowment
must be addressed (Fogler, 1994). How much of the earnings of the endowment fund should be
spent to ensure that it is meeting its investment goals but also providing the maximum possible
benefit to its institution is an important question when assessing asset allocation. The invest-
ment goals for endowments are to produce capital for institutional operation, increase capital to
replace what is taken out each year, and keep pace with inflation. How much a portfolio needs
to grow to meet its goals depends on how much of the portfolio is needed for operational ex-
penses. A large portfolio generating a smaller rate of return can produce sufficient funding for
their budget so anything extra is seen as unnecessary risk. Smaller portfolios do not have this
luxury. They will need to assume more risk to have the same capital return as the larger portfo-
lio because they have less capital to invest. Historically, endowment funds typically spend 5.5%
of the five year moving average of the annual gains each year (Fogler, 1994). This helps re-
�49
duce volatility in capital available for spending due to market fluctuations and usually equates to
about 5% of the return on investment (Green, 2009). For example, an institution with an en-
dowment fund of $389,310,000 that is averaging a 7.4% return on investment over the past 5
years, should be spending 5.5% of their five year moving average annual return of 7.4%. This
is about 0.04% of the total investment (about $1.6 million) that needs to be made back to meet
the endowment’s investment goals.
Without any other diversified assets, a 60/40 split between stocks and bonds would pro-
duce a sufficient return to meet the investment objectives. According to Fogler’s data, the aver-
age real return on investment between the years 1924 and 1991 for US stock was 7% and 2%
for US Treasury bonds (Fogler, 1994). This is a simple example to show that an endowment
can easily maintain its value with a very low risk portfolio. The 60/40 split is enough to average
a 5% return, covering the operational expenses for the institution. However, this example is not
a diverse portfolio and is vulnerable to market volatility. If Treasury bonds or US stocks have a
bad year, so will the endowment fund.
More diversity within the portfolio helps protect the entire investment from volatility risk.
The risk is spread among many different asset classes and allows for more risk to be taken
within the portfolio. The success of the portfolio independent on the average success of many
asset classes rather than the likelihood of success or failure of a few assets. Fogle diversified
his sample further by examining the average asset allocation for equities, fixed income and real
estate. He found that on average, endowment funds were invested 52% in equities, 2% in real
estate and 46% in fixed income. These categories were broken down to show their composi-
tion. Equities consisted of S&P 500 stock, US Small-Cap Stock, Venture Capital, and In-
ternational Equity and Fixed Income assets were divided between 1 year, 5 year and 20 year
US Treasury bonds (T-Bonds), HiGrade and HiYield Corporate bonds and International bonds
(Fogler, 1994). According to NACUBO, it was found that on average, an endowment fund held
�50

49% in S&P 500 stock, 1% in Venture Capital and 2% in International Equity, 2% in Real Estate,
13% in 1 year T-Bonds, 22% in 5 year T-Bonds and 11% in 20 year T-Bonds. This average port-
folio produced a 10.13% average return with a Standard Deviation of 8.38% (Fogler, 1994). Us-
ing these average numbers, Fogler developed 3 options for a better diversified endowment with
a comparable level of risk. Of the three options he produced, the best was allocated as follows:
36% in S&P 500 stock, 7% in US Small-Cap stock, 12% in Venture Capital and 11% in In-
ternational Equity, 9% in Real Estate, 5% in 5 year T-Bonds, 15% in 20 year T-Bonds and 5% in
International Equity. In total, there is 66% of the portfolio in Equity, 25% in Fixed Income and
9% in Real Estate. This portfolio is more diversified produces a 12.33% average return with a
Standard Deviation of 10 .01%. This more diversified portfolio is heavier on equities than the
average portfolio and can afford to accept more risk because the fixed income portion is better
diversified. This added risk produces a higher return while only slightly increasing the risk.
The goal of the endowment fund is to replace what is withdrawn from it and to keep pace
with inflation. By properly diversifying assets, this goal can easily be exceeded while assuming
minimal risk (Bhatti, 89-90). Diversifying and properly allocating assets is crucial for any portfo-
lio and must be seriously considered before investing. Investment goals must be defined and
the allocation strategy must be aligned with these goals. If the strategy and goals are not in
alignment, the portfolio is not accomplishing its objective and must be adjusted accordingly.
�51

2.4 INVESTMENT PRACTICES FOR WPI’S ENDOWMENT
2.4.1 ENDOWMENT REGULATIONS
Endowment funds are also subject to certain laws to which they must adhere. In his ar-
ticle in the Pennsylvania CPA journal, Lee Sullivan discusses various laws that affect the in-
vestment of money for an endowment. One such law is the 1983 Uniform Management of Insti-
tutional Fund Act (UMIFA) which regulates institutional funds and how they are to be managed.
This in conjunction with the 2006 Uniform Prudent Management of Institutional Funds Act (UP-
MIFA) establish measurable investment standards for funds invested in an endowment but still
allows for the institution to have some flexibility around how much can be invested in a certain
asset class and what the expected return on investment will be (Sullivan, 22). Sullivan goes
on to state that these laws place the fiduciary responsibility of the endowment in the hands of
the institution’s governing board. They alone have the ability to adjust the underlying invest-
ments of the endowment but are subject to investing laws that manage gift intent and spending
ability (Sullivan, 22).
2.4.2 WPI’S ENDOWMENT
Between the years of 2009 and 2013 WPI’s endowment fund was valued between $290
million and $380 million with an average annual value of $351 million during this time period
(Bass et.al). The money is invested with over 60 money managers in mutual funds and hedge
funds. One of their biggest managers is Prime Buchholz, a money management firm that spe-
cializes in academic endowment investing (Solomon). The money is spread between several
investment firms and is allocated to several different funds, each with different investment goals
as a way to diversify its holdings and mitigate risk. Some are mutual funds, where their invest-
ment and the investments of all other investors are pooled and allocated within a portfolio with a
�52

set investment goal. The asset allocation for a particular fund is usually available to the investor
so they have a general idea where their capital is being invested but WPI is unwilling to share
that information. A sizable portion of the endowment fund is invested in hedge funds but the
specific percentage was not allowed to be disclosed (Solomon). These are individual funds
managed by aggressive professional investors with their own strategies they developed to pro-
duce the investor’s desired outcome. These funds do not disclose their investment practices
because they are “trade secrets” so even if WPI was willing to allow public access to their in-
vestments, they would not have that information (Solomon).
WPI’s investments are overseen by the Board of Trustees. Their purpose is to ensure
that the institution’s finances are achieving their investment goals to ensure the longevity of the
school. They are also charged with maintaining the school’s Mission Statement, “to create, to
discover, and to convey knowledge at the frontiers of academic inquiry for the betterment of so-
ciety”. This is not a legal or fiduciary charge but if they fail to uphold the school’s Mission
Statement, they are not properly representing the WPI community. Their investment goals must
fall within the boundaries of very specific laws and the Board of Trustees is responsible for en-
suring the investment goals of the institution are met but the choice of investment goals and pri-
orities is still ultimately their decision. If they are truly investing the endowment fund according
to the mission statement, the Board of Trustees must realize that they are approving of a de-
structive practice that is causing irreparable damage to the planet and make changes accord-
ingly. Since it is their decision, their investment practices are a reflection of the values of the
institution and the WPI community. By approving of business as usual, the Board of Trustees is
saying that the WPI community approves of the environmental destruction in which they invest
the endowment. They have their reasons for prioritizing one investment practice over another
just as any other investor or set of investors would and are concerned with setting and meeting
�53
the financial goals of the institution. However, their investment choices must be evaluated on
both a financial level and a moral level to ensure WPI is truly practicing what it preaches.
Many people associated with the institution including faculty, students and alumni are in agree-
ment that WPI’s investments in fossil fuels are not reflective of their mission statement. By in-
vesting in companies that are actively polluting the environment by pumping carbon into the at-
mosphere, WPI is giving its seal of approval for this practice to continue. With the destructive
effects of climate change widely accepted to be the result of humankind burning fossil fuels for
300 years, WPI has an obligation to consider if investments that encourage the continuation of
these practices are truly something they and the institution support. Assets that are harmful to
the betterment of society should be reallocated promptly but as is financially prudent towards
assets that are actually reflective of the strong moral principles to which the institution espous-
es.
�54

CHAPTER 3: METHODOLOGY
Calling for an institution to divest requires a plan to reallocate the capital in an effective
manner to meet the institution’s fiduciary responsibilities. This section sets out how I went about
investigating the specific composition of an educational endowment portfolio that is as similar to
WPI’s as possible and how these investments performed in order to determine the best reallo-
cation strategy for the divested fossil fuel assets. To find the best reinvestment strategy, I found
the typical asset classes in which educational institutions invest their endowment funds to find
the average return and standard deviation for each asset class. This information allowed me to
match the average returns and standard deviation of fossil fuels to a combination of other asset
classes to mimic their performance . This strategy removes one asset class from the portfolio 3
and redistributes those assets to other asset classes to match the returns and volatility.
The nature of WPI’s finances is such that even if the administration wanted to, they
could not give me the necessary information to conduct a thorough analysis of the institution’s
endowment portfolio. WPI’s endowment portfolio is managed by sixty different teams of finan-
cial advisors and fund managers, many of whom claim their investment practices as “trade se-
crets” (Solomon, 2013). Thus, the institution knows with whom their money is invested but not
where these managers invest the money. This makes it difficult to tailor my analysis specifically
to WPI. This being the case, I examined the portfolio performance and asset allocation of en-
dowment portfolios that were similar in size to WPI’s endowment portfolio . Working with the 4
Information regarding returns and standard deviation for each asset class can be found in Ap3 -pendix D
Information regarding the performance and asset allocation of endowments similar in size to 4
WPI can be found in Appendix C
�55

averages for a portfolio of WPI’s size allowed me to establish a baseline upon which I could
base a hypothetical portfolio that approximated WPI’s as closely as possible.
A series of longitudinal studies, conducted by NACUBO (National Association of College
and University Business Officers) provided the average returns and asset allocation data for
over 800 endowment portfolios from 2008 to 2013 (the most recent study available) (Bass et.
al) . These schools were a mix of public and private institutions varying in size from small col5 -
leges with very few students to large state universities. Their endowments ranged from $50 mil-
lion and under to over $1 billion. To accommodate for the variation in investing power, the port-
folios were further categorized based on size. These categories were portfolios with assets to-
taling over $1billion, $501 million-$999 million, $251 million-$500 million, $100 million-$250 mil-
lion and under $99 million. Another study by NACUBO provided the total annual assets of
WPI’s endowment portfolio and the annual market value change. This allowed me to determine
which category in the first study was best representative of WPI’s portfolio. The first study doc-
umented the annual, 3 year, 5 year and 10 year returns of portfolios within this range and in-
cluded the annual asset allocation for an average portfolio within that range . The NACUBO 6
study on asset allocation tracked what percentage the average portfolio for each endowment
category held in domestic equity, fixed income, international equity, “alternative strategies” and
short term securities/cash/other . 7
The alternative strategies asset class is further broken down into sub classes which
showed where these assets are invested. These categories are: private equity, marketable al-
ternative strategies, venture capital, private equity real estate, distressed debt, and energy and
natural resources. The NACUBO study provided the data for the value of WPI’s portfolio each
See Figure 1 in the Results section and Appendix C for more information. 5
Findings in Appendix C.6
See Figures 1 and 2 in Results section and Appendix C for more information.7
�56

year. It also provided the average asset allocation for institutions with endowments of similar
size. This data showed the annual percentage of the endowment portfolio and dollar value WPI
allocates to each asset class . These numbers are approximations of how much capital WPI 8
invests in each asset class based on the investment behavior of the average institution with a
comparable endowment portfolio. With this baseline, the percentage of the endowment portfolio
that is allocated to fossil fuels can be estimated providing an approximation of the dollar value
that must be reallocated to different asset classes. For the sake of this project, the Energy and
Natural Resources asset class is taken to represent investments in fossil fuels. Taking the per-
centage of the endowment allocated to this asset and multiplying it by the total value of the en-
dowment estimates the dollar value of WPI’s investment in fossil fuels . 9
Colleges have only been divesting their endowments from fossil fuels since 2009 with
most of them divesting within the past three years. To compensate for the lack of data, I con-
ducted additional research on the historical returns of each asset class . INVESCO, an in10 -
vestment institution, provided the returns for each asset class for the past twenty years. This
data was used to calculate the average percentage return and the standard deviation for each
asset class. The standard deviation represents the volatility of each asset class. The data was
tracked for US Large Cap Growth Stocks, US Large Cap Value Stocks, US Mid Cap Stocks, US
Small Cap Stocks, Fixed Income, International Equity, Real Estate and Commodities. These
were tracked based on the Russell 1000 Growth Index, Russell 1000 Value Index, Russell Mid-
Cap Index, Russell 2000, Barclay’s US Aggregate Index, MSCI EAFE Index, FTSE NAREIT All
Equity Index and S&P GSCI Index respectively. The S&P GSCI Index was further analyzed by
See Figures 2 and 3 in the Results Section and Appendix C for more information. 8
See Figure 2 in the Results Section and Appendix C for more information. 9
See Table 1 in the Results section. Detailed information can be found in Appendix D10
�57

reviewing the Annual Report to determine the percentage allocated to fossil fuels. This number
was used to determine the performance of fossil fuel commodities over the past twenty years.
To understand the effects of divestment on institution’s endowment portfolios, I re-
searched divested schools in the United States. By referring to the NACUBO studies and inves-
tigating the annual financial statements for each institution, I collected data on the annual value
of each portfolio from 2006 to 2014. Some of the data were unavailable and incomplete so the
linear average was taken for the years before and after the missing year to make an assumption
about the portfolio’s value for the missing years. This provided data prior to the first school di-
vesting to help show how the endowments performed post divestment . Also, it allowed for the 11
returns of divested schools to be compared to those of non divested schools to determine if a
divested endowment can perform as well or better than the endowments of the non divested
schools. I calculated the annual percentage change for each portfolio by subtracting the returns
from the past year from the current year, dividing that number by the previous year’s returns and
multiplying by 100. All the schools that are now divested did not divest at the same time. Over
time, more schools divested but some of the schools that are currently divested were not di-
vested for most of the time period. The average annual percentage change was calculated for
divested and non divested institutions. From 2006 to 2009, all the schools were non divested,
from 2009 to 2011 only one school was divested, from 2011 to 2013 only two schools had di-
vested and from 2013 to the end of my dataset in 2014, only four schools had divested. Most of
the schools that are currently divested did so in 2014 and 2015, meaning that more complete
data will be available upon the publishing of the 2014-2015 endowment figures. As institutions
divested, i calculated the average of their returns separately from the returns of the non divested
schools.
See Figures 4 and 5 in the Results section. Complete data can be found in Appendix D11
�58

CHAPTER 4: RESULTS
The value of WPI’s endowment portfolio has ranged from $290 million to $380 million
between the years of 2009 and 2013 and fluctuates from year to year based on the performance
of the investments. The average holdings for the portfolio between these years was $351 mil-
lion. The estimated asset allocation for WPI during this time period is included in FIGURE 1.
FIGURE 1: Average Asset Allocation for WPI’s Endowment from 2009 to 2013
FIGURE 1 shows that over this five year span, it is estimated that on average, WPI in-
vested about 25% ($87 million) of the endowment in domestic equity, about 16% ($56 million) in
�59
34%
6%
18%
16%
25%
Domestic Equity Fixed IncomeInternational Equity Short Term Securities/Cash/OtherAlternative Strategies*
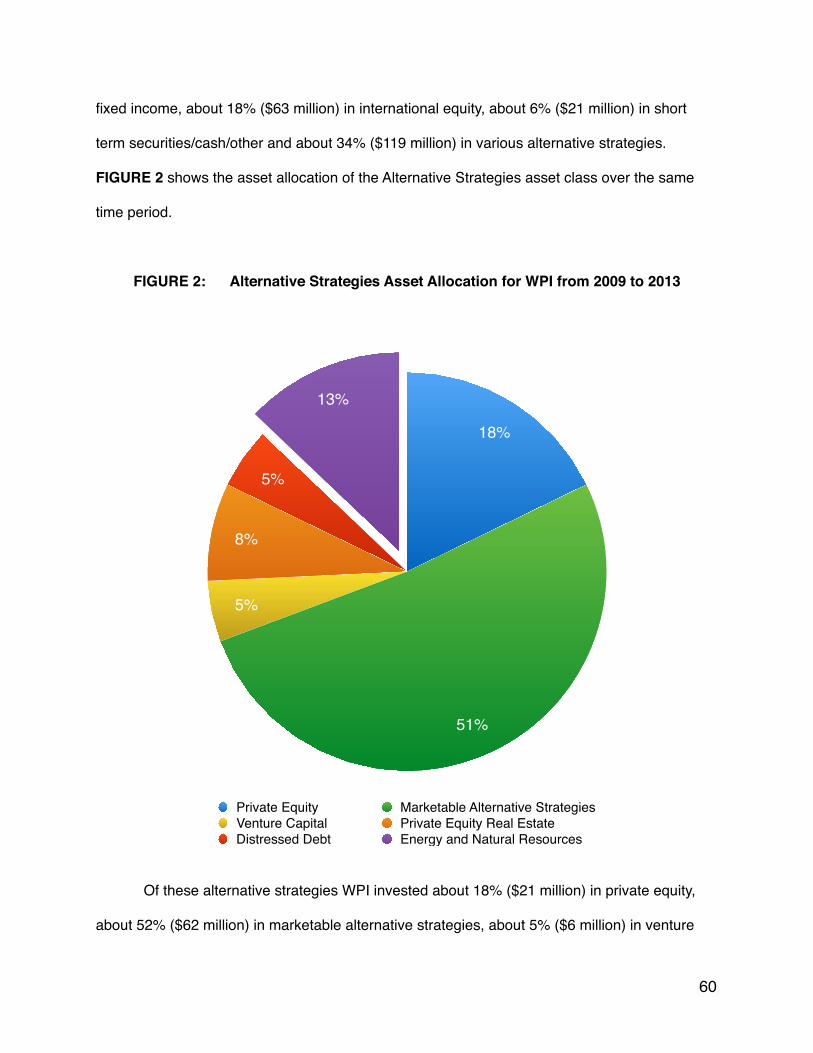
fixed income, about 18% ($63 million) in international equity, about 6% ($21 million) in short
term securities/cash/other and about 34% ($119 million) in various alternative strategies.
FIGURE 2 shows the asset allocation of the Alternative Strategies asset class over the same
time period.
FIGURE 2: Alternative Strategies Asset Allocation for WPI from 2009 to 2013
Of these alternative strategies WPI invested about 18% ($21 million) in private equity,
about 52% ($62 million) in marketable alternative strategies, about 5% ($6 million) in venture
�60
13%
5%
8%
5%
51%
18%
Private Equity Marketable Alternative StrategiesVenture Capital Private Equity Real EstateDistressed Debt Energy and Natural Resources

capital, about 8% ($9.5 million) in private equity real estate, about 5% ($6 million) in distressed
debt, and about 13% ($15.5 million) in energy and natural resources. This equates to about 6%
of the total portfolio invested in private equity, about 17% in marketable alternative strategies,
about 2% in venture capital, about 3% in private equity real estate, about 2% in distressed debt
and about 4% in energy and natural resources. The average returns and standard deviation for
each asset class over a 20 year period is available in TABLE 1.
TABLE 1: AVERAGE ANNUAL RETURNS AND STANDARD DEVIATIONS FOR ASSET
CLASSES FROM 1995 TO 2014
Over the last twenty years, Domestic Large Cap Growth investments earned an average
of 12.19% with a standard deviation of 23.33. Domestic Large Cap Value investments earned
Asset Class Average Annual Return
Standard Deviation n
Large Cap Growth 12.19% 23.33 20
Large Cap Value 12.60% 17.92 20
Mid Cap 10.99% 18.53 20
Small Cap 10.91% 18.12 20
International Equity 8.69% 20.15 20
Real Estate 13.51% 19.63 20
Commodities 7.30% 27.67 20
Fixed Income 5.80% 4.77 20
�61
an average of 12.60% with a standard deviation of 17.92. Over the past twenty years, Large
Cap Value investments have outperformed Large Cap Growth investments with less volatility
making them strong investments over time. Domestic Mid Cap and Small Cap earned an aver-
age annual return of 10.99% and 10.91% with standard deviations of 18.53 and 18.12 respec-
tively. Investments in Domestic Mid Cap equity earn a slightly higher return with a slightly high-
er volatility over the past twenty years and they do not perform as well as Domestic Large Cap
Value so they are not likely to be good candidates for reallocating fossil fuel assets. In-
ternational Equity has a comparatively low return of 8.69% and a relatively high standard devia-
tion of 20.15. This is a fairly unstable investment but might help add volatility in an otherwise
conservatively constructed portfolio to maximize returns. Real Estate offers an interesting op-
tion. It earned a 13.51% return with a 19.63 standard deviation over the past twenty years.
Fixed Income is a strong option to reduce the volatility of the portfolio with the lowest standard
deviation of 4.77 and earning an average annual return of 5.80%. Finally, Commodities earned
a 7.30% average annual return with a volatility of 27.67, making them volatile investments simi-
lar to International Equity. Further research into the actual fund being tracked showed the fossil
fuel assets held by the S&P GSCI Index, which tracked Commodities, are as follows: Brent
Crude Oil, 21.67%, Crude Oil 18.38%, Gas Oil, 7.07%, Unleaded Gas, 6.08%, Heating Oil,
5.84%, and Natural Gas, 3.03% totaling 62.07% of the Index .12
The past decade has seen substantial volatility for investments. Institutional divestment
coincided with the recession and the recovery, which skewed the data on the performance of
endowment portfolios during this time. FIGURE 3 shows the annual returns for the asset class-
es over the past five years to demonstrate how the dataset was too small to make an accurate
http://quote.morningstar.com/etf-filing/Prospectus/2015/5/26/12
t.aspxt=GSG&ft=424B3&d=e9b9bd0591eeccfc94698246091cfb30
�62

assumption which is why it was necessary to investigate the twenty year returns for each asset
class.
FIGURE 3: Asset Class Returns from 2009 to 2013
Investments in Domestic Equity have been particularly volatile since the 2008 recession
and the recovery that followed. Like most asset classes, it performed very poorly in 2008-2009,
rebounded the following year, peaked the year after, performed poorly again and rebounded.
This volatility is due to the state of the US economy during the recession and recovery. Howev-
er, this was a global recession and International Equity was similarly volatile and nearly mirrored
the performance of Domestic Equity. Fixed Income remained relatively stable during this time,
as expected but it did see a slight increase in 2009-2010 during the early recovery effort. Like-
�63
-30
-20
-10
0
10
20
30
40
2008-2009 2009-2010 2010-2011 2011-2012 2012-2013
Domestic Equity Fixed Income International EquityShort Term Securities/Cash/Other Alternative Strategies*

wise, Short Term Securities/Cash/Other was similarly stable throughout this time. These are low
risk investments with typically low volatilities so this is to be expected. Alternative Strategies
were volatile but less so compared to Domestic and International Equity, though it followed the
same general trend. FIGURE 4 shows the returns for the same years for each asset class in
the Alternative Strategies class.
FIGURE 4: Returns for Alternative Investment Asset Classes from 2009 to 2013
The assets that make up the Alternative Strategies asset classes performed relatively
similarly. Like the other asset classes, they performed poorly during the 2008-2009 recession
�64
-40
-30
-20
-10
0
10
20
30
2008-2009 2009-2010 2010-2011 2011-2012 2012-2013
Private Equity Marketable Alternative Strategies Venture CapitalPrivate Equity Real Estate Distressed Debt Energy and Natural Resources

and rebounded strongly in 2009-2010. Distressed Debt had the largest rebound that year while
Private Equity Real Estate had the smallest. Private Equity, Venture Capital, Marketable Alter-
native Strategies and Energy and Natural Resources followed a generally similar trend. They
each peaked in 2010-2011, declined slightly and rebounded the next year. After its meteoric
rise in 2009-2010, it peaked and declined until 2011-2012 when it eventually began a gradual
rebound. Private Equity Real Estate plateaued in 2010-2011 and has remained unchanged
since then.
The average annual percentage change for divested and non divested schools for 2006
to 2014 can be found in FIGURE 5. It depicts the average annual returns for divested and non
divested institutions from 2006-2007 to 2013-2014. As mentioned in Section 3, prior to the
2009-2010 year, there were no divested schools. From 2009-2010 on, the returns of the
schools that had divested were averaged and compared to the average returns of the schools
that have currently divested but were not divested at the time.
�65

FIGURE 5: Average Annual Percentage Change for Divested v.s. Non-Divested Schools
from 2006-2014
Prior to the 2009-2010 fiscal year, there were no divested institutions and therefore no
data. This also coincides with the beginning of the recovery from the Recession of 2008. Un-
derstandably, the first divested school, Hampshire College, did not perform well in the year of
their divestment but this year was very volatile. In the following years, the divested portfolio re-
bounded and ultimately surpassed the performance of the non divested portfolios. Since the
2011-2012 year, divested portfolios have continued to outperform the non divested portfolios
though the two were close in 2013-2014. As more data becomes available for the divested
schools and more schools divest, the average annual percentage change will be more repre-
sentative of the performance of the divested portfolios. Though more complete data could
change these results, excluding the year following the recession, divested portfolios produce a
comparable and in many cases better returns than non divested portfolios.
�66
-22.5
-15
-7.5
0
7.5
15
22.5
30
2006-2007 2007-2008 2008-2009 2009-2010 2010-2011 2011-2012 2012-2013 2013-2014
Divested Non-Divested

CHAPTER 5: CONCLUSIONS AND FUTURE WORK
5.1 SUMMARY
The goal of this project was to develop a strong fact based argument surrounding the
moral value of WPI’s fossil fuel investments, the harmful effects of carbon emissions on the
planet’s atmosphere, divestment as an effective tactic and the financial feasibility of divesting an
endowment portfolio from fossil fuels. The studies and data referenced throughout this project
support my argument for divestment as a financially feasible and historically effective tactic.
From the results of this project, it is clear that fossil fuels are under performing and volatile and
have been this way over the past twenty years. Other assets are more productive and less
volatile, making them suitable replacements for fossil fuel investments. Additionally, the en-
dowment portfolios of divested schools have performed better than those of non divested
schools on average though there is limited data due to the small timeframe and number of di-
vested academic institutions. These financial figures reinforce the moral argument for divest-
ment and must be brought to the attention of the Board of Trustees during the next petition for
divestment. Since climate change is a global problem, a collective effort towards a global solu-
tion must be made. Though WPI is putting forth the effort to make its campus more environ-
mentally friendly, divestment would have a further reaching effect. As part of a growing move-
ment and as the first polytechnic institute to divest, WPI is in a unique position to demonstrate to
other schools that divestment is possible without financial loss. WPI has the option to actively
be part of the solution to global climate change or continue to contribute to the problem. The
argument against the financial feasibility of divestment has been invalidated and divestment has
been proven to be financially effective. Therefore, with the primary concern about the effective-
ness of divestment addressed, the only excuse not to divest is now apathy.
�67
5.2 DISCUSSION
Though the data I have shown supports my argument for divestment, there are some
areas where it can be improved. If the divestment trend continues, 2016 will se more schools
divest than any year prior (hopefully WPI) and more data will become available to continue this
analysis. Data for schools that divested in 2014 and 2015 were not yet released during the
completion of this project and that data would also be helpful in continuing this research. Di-
vestment as a tactic also has limitations as discussed above. Divestment cannot have the de-
sired impact without the movement that accompanies it. If more institutions do not continue to
divest, the social injustice will fall from the attention of the public and the efforts of the move-
ment will go unnoticed. Carbon emissions from fossil fuels are doing irreparable damage to our
planet and the situation will only grow worse if no action is taken. As a responsible member of
the academic and scientific community, it is WPI’s duty to continue the movement and divest its
endowment from fossil fuels.
Due to the limitations presented by the lack and large amount of data soon to be re-
leased, improvements can be made on this research. Future projects could use the data pre-
sented in this project and the new data to continue the analysis and determine if it is still valid.
Additionally, to aid in the divestment process, it would be prudent to present the Board of
Trustees with a reallocation strategy to redistribute the assets held in fossil fuels. This would
give the Board of Trustees a guideline for divestment to consider and adjust accordingly. This
information and the results of my project should address the biggest fiduciary concerns of the
Board of Trustees and convince them to consider divestment as a legitimate option.
New climate data for 2015 has shown that it has been the hottest year on record. Time
is running out and action must be taken to combat global climate change. The fate of the planet
lies in the hands of this generation and the consequences of inaction are too great to continue
�68

to ignore. Global action must be taken to combat climate change and WPI is not excluded from
this. It is time to take a stance against climate change and become part of the solution instead
of continuing to be part of the problem.
�69

APPENDICES
�70

APPENDIX A: LIST OF DIVESTED SCHOOLS
Divested School State Type of Divestment
Year Divested
Brevard College NJ Full 2015
California Institute of the Arts CA Full 2014
Chico State University CA Full 2014
College of the Atlantic ME Full 2011
ESF College Foundation Inc. NY Full 2015
Foothill-De Anza Community College Foundation
CA Full 2013
Georgetown University DC Partial 2015
Goddard College VT Fossil Free 2015
Green Mountain College VT Full 2013
Hampshire College MA Full 2009
Humboldt State University CA Partial 2014
Naropa University CO Full 2013
Peralta Community College CA Full 2014
Pitzer College CA Full 2014
Prescott College AZ Partial 2014
Rhode Island School of Design RI Full 2015
San Francisco State University Foundation
CA Coal and Tar Sands Only
2013
Stanford University CA Coal Only 2014
Sterling College VT Full 2013
Syracuse University NY Full 2015
The New School NY Full 2015
Unity College ME Full 2012
University of California CA Full 2015
University of Dayton OH Full 2014
�71
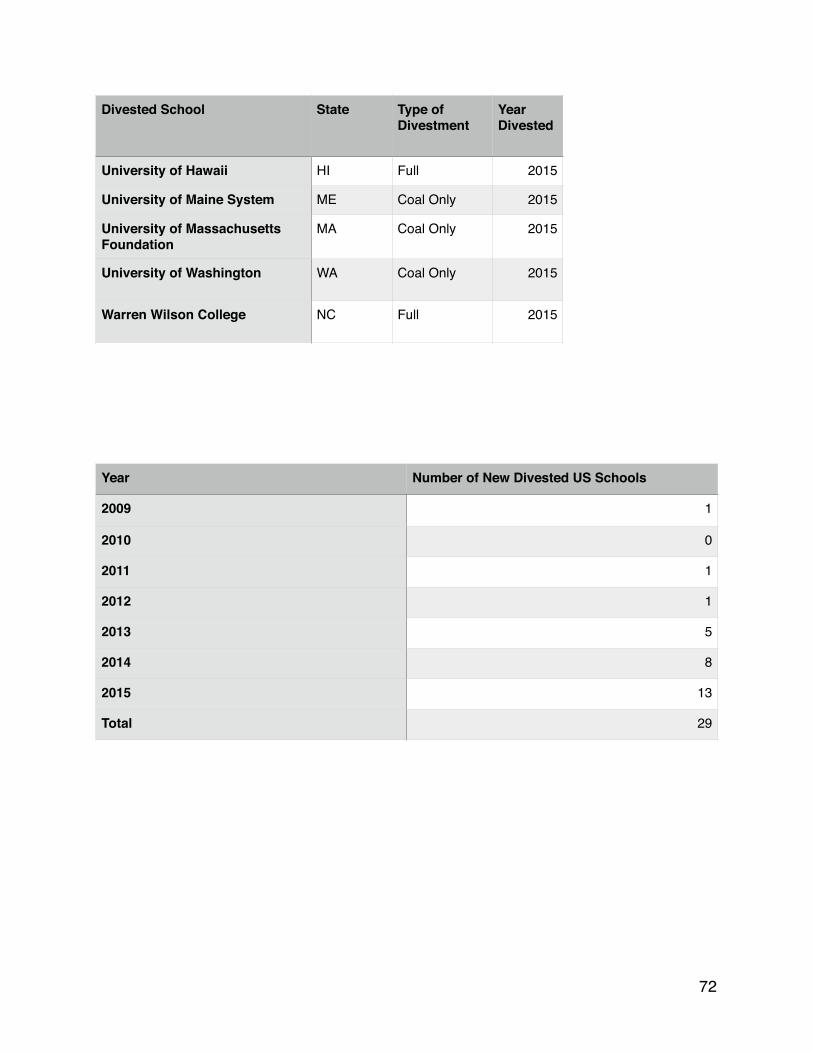
University of Hawaii HI Full 2015
University of Maine System ME Coal Only 2015
University of Massachusetts Foundation
MA Coal Only 2015
University of Washington WA Coal Only 2015
Warren Wilson College NC Full 2015
Divested School State Type of Divestment
Year Divested
Year Number of New Divested US Schools
2009 1
2010 0
2011 1
2012 1
2013 5
2014 8
2015 13
Total 29
�72

APPENDIX B: SELECTED DIVESTED SCHOOLS AND THEIR ANNUAL RE-TURNS FROM 2006 TO 2014
2006 to 2007
Divested School Endowment Size 2006 Endowment Size 2007 Percentage Change
California Institute of the Arts
$91,752,000 $108,932,000 18.7%
Chico State University*
30,840,000 $35,741,000 15.9%
College of the Atlantic*
N/A $19,999,000 N/A
Foothill-De Anza Community College Foundation
$457,093,000 $737,470,000 61.3%*
Georgetown University
$834,497,000 $1,059,343,000 26.9%
Hampshire College* $31,404,000 $33,018,000 5.1%
Humboldt State University
$16,083,000 $18,797,000 16.9%
Pitzer College $86,336,000 $106,364,000 23.2%
Rhode Island School of Design
$304,729,000 $380,033,000 24.7%
San Francisco State University Foundation
$29,761,000 $41,202,000 38.4%
Stanford University $14,084,676,000 $17,164,836,000 21.9%
Syracuse University $908,371,000 $1,086,143,000 19.6%
The New School $199,087,000 $232,239,000 16.7%
University of California
$5,733,621,000 $6,439,436,000 12.3%
University of Dayton $353,424,000 $410,355,000 16.1%
University of Hawaii $43,886,000 $40,361,000 -8.0%
�73
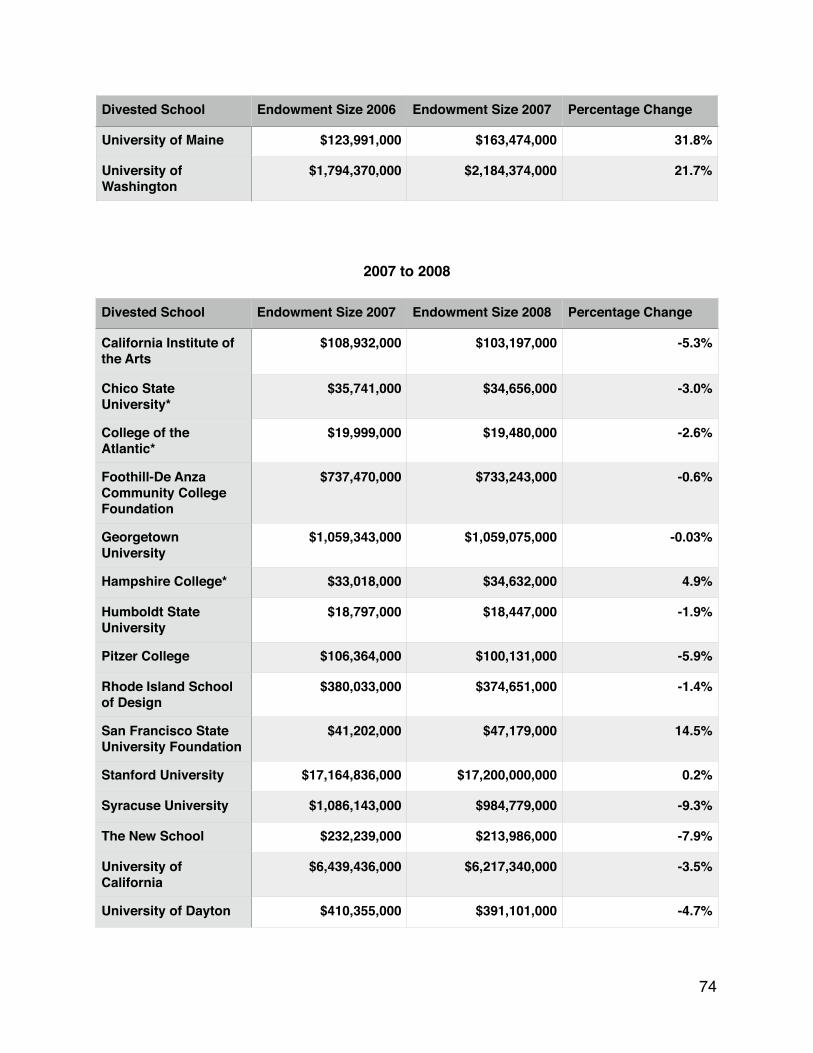
2007 to 2008
University of Maine $123,991,000 $163,474,000 31.8%
University of Washington
$1,794,370,000 $2,184,374,000 21.7%
Divested School Endowment Size 2006 Endowment Size 2007 Percentage Change
Divested School Endowment Size 2007 Endowment Size 2008 Percentage Change
California Institute of the Arts
$108,932,000 $103,197,000 -5.3%
Chico State University*
$35,741,000 $34,656,000 -3.0%
College of the Atlantic*
$19,999,000 $19,480,000 -2.6%
Foothill-De Anza Community College Foundation
$737,470,000 $733,243,000 -0.6%
Georgetown University
$1,059,343,000 $1,059,075,000 -0.03%
Hampshire College* $33,018,000 $34,632,000 4.9%
Humboldt State University
$18,797,000 $18,447,000 -1.9%
Pitzer College $106,364,000 $100,131,000 -5.9%
Rhode Island School of Design
$380,033,000 $374,651,000 -1.4%
San Francisco State University Foundation
$41,202,000 $47,179,000 14.5%
Stanford University $17,164,836,000 $17,200,000,000 0.2%
Syracuse University $1,086,143,000 $984,779,000 -9.3%
The New School $232,239,000 $213,986,000 -7.9%
University of California
$6,439,436,000 $6,217,340,000 -3.5%
University of Dayton $410,355,000 $391,101,000 -4.7%
�74

2008 to 2009
University of Hawaii $40,361,000 $42,421,000 5%
University of Maine $163,474,000 $159,033,000 -2.7%
University of Washington
$2,184,374,000 $2,262,149,000 3.6%
Divested School Endowment Size 2007 Endowment Size 2008 Percentage Change
Divested School Endowment Size 2008 Endowment Size 2009 Percentage Change
California Institute of the Arts
$103,197,000 $89,592,000 -13.2%
Chico State University*
$34,656,000 $36,807,000 6.2%
College of the Atlantic*
$19,480,000 $14,292,000 -26.6%
Foothill-De Anza Community College Foundation
$733,243,000 $716,013,000 -2.4%
Georgetown University
$1,059,075,000 $883,182,000 -16.6%
Hampshire College* $34,632,000 $29,838,000 -13.8%
Humboldt State University
$18,447,000 $15,700,000 -14.9%
Pitzer College $100,131,000 $77,414,000 -22.7%
Rhode Island School of Design
$374,651,000 $273,806,000 -26.9%
San Francisco State University Foundation
$47,179,000 $43,731,000 -7.3%
Stanford University $17,200,000,000 $12,619,094,000 -26.6%
Syracuse University $984,779,000 $658,248,000 -33.2%
The New School $213,986,000 $176,078,000 -17.7%
�75
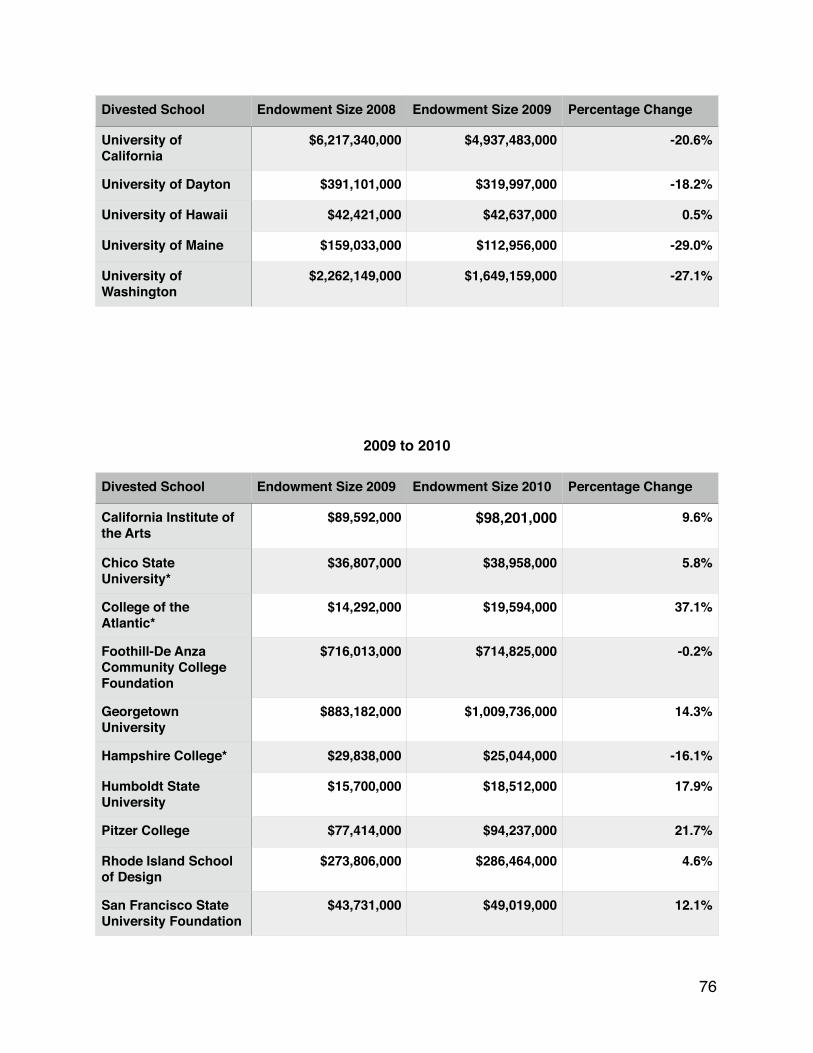
2009 to 2010
University of California
$6,217,340,000 $4,937,483,000 -20.6%
University of Dayton $391,101,000 $319,997,000 -18.2%
University of Hawaii $42,421,000 $42,637,000 0.5%
University of Maine $159,033,000 $112,956,000 -29.0%
University of Washington
$2,262,149,000 $1,649,159,000 -27.1%
Divested School Endowment Size 2008 Endowment Size 2009 Percentage Change
Divested School Endowment Size 2009 Endowment Size 2010 Percentage Change
California Institute of the Arts
$89,592,000 $98,201,000 9.6%
Chico State University*
$36,807,000 $38,958,000 5.8%
College of the Atlantic*
$14,292,000 $19,594,000 37.1%
Foothill-De Anza Community College Foundation
$716,013,000 $714,825,000 -0.2%
Georgetown University
$883,182,000 $1,009,736,000 14.3%
Hampshire College* $29,838,000 $25,044,000 -16.1%
Humboldt State University
$15,700,000 $18,512,000 17.9%
Pitzer College $77,414,000 $94,237,000 21.7%
Rhode Island School of Design
$273,806,000 $286,464,000 4.6%
San Francisco State University Foundation
$43,731,000 $49,019,000 12.1%
�76
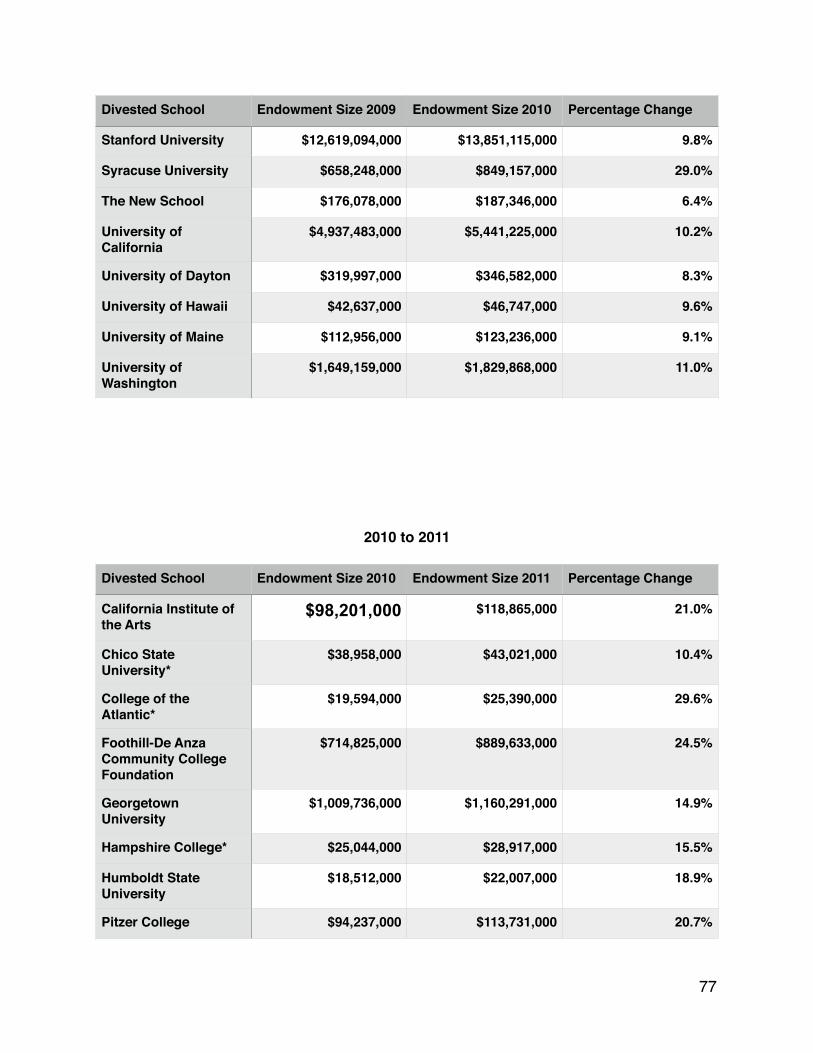
2010 to 2011
Stanford University $12,619,094,000 $13,851,115,000 9.8%
Syracuse University $658,248,000 $849,157,000 29.0%
The New School $176,078,000 $187,346,000 6.4%
University of California
$4,937,483,000 $5,441,225,000 10.2%
University of Dayton $319,997,000 $346,582,000 8.3%
University of Hawaii $42,637,000 $46,747,000 9.6%
University of Maine $112,956,000 $123,236,000 9.1%
University of Washington
$1,649,159,000 $1,829,868,000 11.0%
Divested School Endowment Size 2009 Endowment Size 2010 Percentage Change
Divested School Endowment Size 2010 Endowment Size 2011 Percentage Change
California Institute of the Arts
$98,201,000 $118,865,000 21.0%
Chico State University*
$38,958,000 $43,021,000 10.4%
College of the Atlantic*
$19,594,000 $25,390,000 29.6%
Foothill-De Anza Community College Foundation
$714,825,000 $889,633,000 24.5%
Georgetown University
$1,009,736,000 $1,160,291,000 14.9%
Hampshire College* $25,044,000 $28,917,000 15.5%
Humboldt State University
$18,512,000 $22,007,000 18.9%
Pitzer College $94,237,000 $113,731,000 20.7%
�77

2011 to 2012
Rhode Island School of Design
$286,464,000 $318,678,000 11.2%
San Francisco State University Foundation
$49,019,000 $48,954,000 -0.1%
Stanford University $13,851,115,000 $16,502,606,000 19.1%
Syracuse University $849,157,000 $913,662,000 7.6%
The New School $187,346,000 $216,082,000 15.3%
University of California
$5,441,225,000 $6,342,217,000 16.6%
University of Dayton $346,582,000 $414,504,000 19.6%
University of Hawaii $46,747,000 $67,189,000 43.7%
University of Maine $123,236,000 $149,060,000 21.0%
University of Washington
$1,829,868,000 $2,154,494,000 17.7%
Divested School Endowment Size 2010 Endowment Size 2011 Percentage Change
Divested School Endowment Size 2011 Endowment Size 2012 Percentage Change
California Institute of the Arts
$118,865,000 $113,190,000 -4.8%
Chico State University*
$43,021,000 $42,174,000 -2.0%
College of the Atlantic*
$25,390,000 $29,288,000 15.4%
Foothill-De Anza Community College Foundation
$889,633,000 $854,043,000 -4.0%
Georgetown University
$1,160,291,000 $1,141,752,000 -1.6%
Hampshire College* $28,917,000 $31,103,000 7.6%
�78

2012 to 2013
Humboldt State University
$22,007,000 $22,270,000 1.2%
Pitzer College $113,731,000 $110,203,000 -3.1%
Rhode Island School of Design
$318,678,000 $297,207,000 -6.7%
San Francisco State University Foundation
$48,954,000 $49,003,000 0.1%
Stanford University $16,502,606,000 $17,035,804,000 3.2%
Syracuse University $913,662,000 $940,056,000 2.9%
The New School $216,082,000 $204,783,000 -5.2%
University of California
$6,342,217,000 $5,962,906,000 -6.0%
University of Dayton $414,504,000 $397,794,000 -4.0%
University of Hawaii $67,189,000 $84,669,000 26.0%
University of Maine $149,060,000 $148,298,000 -0.5%
University of Washington
$2,154,494,000 $2,111,332,000 -2.0%
Divested School Endowment Size 2011 Endowment Size 2012 Percentage Change
Divested School Endowment Size 2012 Endowment Size 2013 Percentage Change
California Institute of the Arts
$113,190,000 $115,310,000 1.9%
Chico State University*
$42,174,000 $48,498,000 15.0%
College of the Atlantic*
$29,288,000 $35,751,000 22.1%
Foothill-De Anza Community College Foundation
$854,043,000 $919,455,000 7.7%
�79
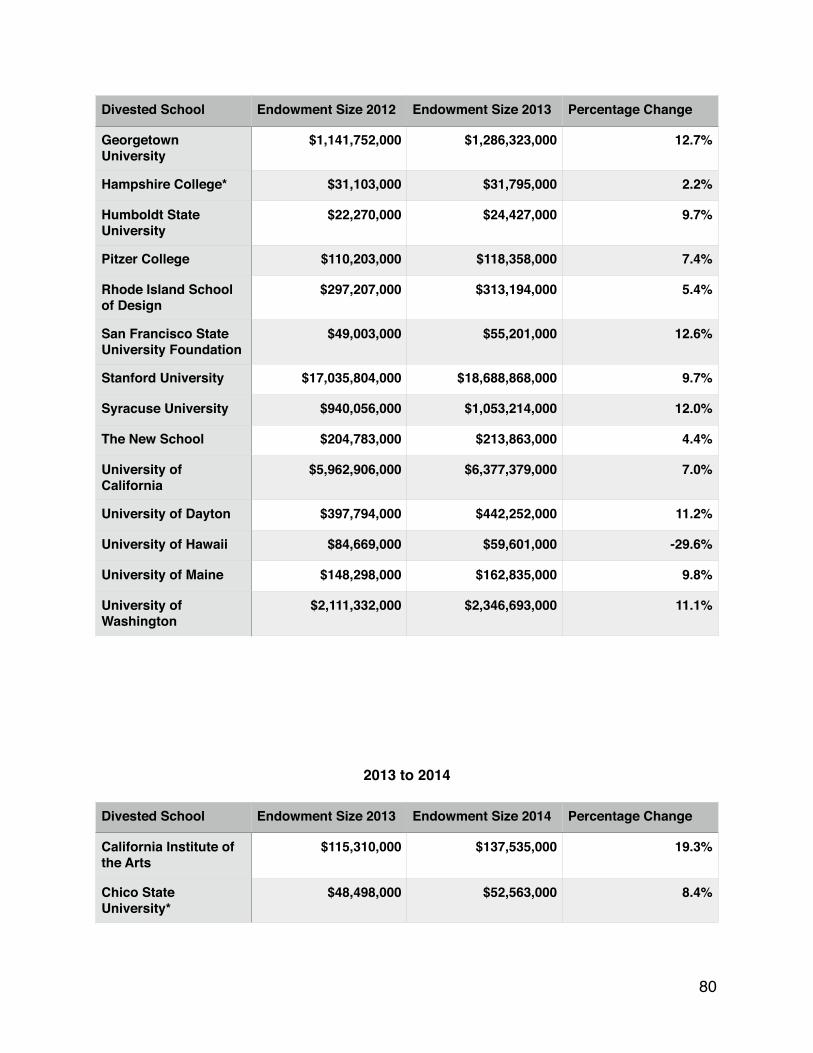
2013 to 2014
Georgetown University
$1,141,752,000 $1,286,323,000 12.7%
Hampshire College* $31,103,000 $31,795,000 2.2%
Humboldt State University
$22,270,000 $24,427,000 9.7%
Pitzer College $110,203,000 $118,358,000 7.4%
Rhode Island School of Design
$297,207,000 $313,194,000 5.4%
San Francisco State University Foundation
$49,003,000 $55,201,000 12.6%
Stanford University $17,035,804,000 $18,688,868,000 9.7%
Syracuse University $940,056,000 $1,053,214,000 12.0%
The New School $204,783,000 $213,863,000 4.4%
University of California
$5,962,906,000 $6,377,379,000 7.0%
University of Dayton $397,794,000 $442,252,000 11.2%
University of Hawaii $84,669,000 $59,601,000 -29.6%
University of Maine $148,298,000 $162,835,000 9.8%
University of Washington
$2,111,332,000 $2,346,693,000 11.1%
Divested School Endowment Size 2012 Endowment Size 2013 Percentage Change
Divested School Endowment Size 2013 Endowment Size 2014 Percentage Change
California Institute of the Arts
$115,310,000 $137,535,000 19.3%
Chico State University*
$48,498,000 $52,563,000 8.4%
�80

APPENDIX C: AVERAGE ASSET ALLOCATION AND RETURNS FOR ACADEMIC INSTITUTIONS WITH ENDOWMENTS VALUED BETWEEN $101 MILLION and $500 MILLION FROM 2009 TO 2013
College of the Atlantic*
$35,751,000 $45,295,000 26.7%
Foothill-De Anza Community College Foundation
$919,455,000 $915,680,000 -0.4%
Georgetown University
$1,286,323,000 $1,461,276,000 13.6%
Hampshire College* $31,795,000 $37,567,000 18.2%
Humboldt State University
$24,427,000 $27,724,000 13.5%
Pitzer College $118,358,000 $134,289,000 13.5%
Rhode Island School of Design
$313,194,000 $337,954,000 7.9%
San Francisco State University Foundation
$55,201,000 $65,385,000 18.4%
Stanford University $18,688,868,000 $21,446,006,000 14.8%
Syracuse University $1,053,214,000 $1,183,244,000 12.3%
The New School $213,863,000 $299,890,000 40.2%
University of California
$6,377,379,000 $7,384,410,000 15.8%
University of Dayton $442,252,000 $510,107,000 15.3%
University of Hawaii $59,601,000 $52,742,000 -11.5%
University of Maine $162,835,000 $189,151,000 16.1%
University of Washington
$2,346,693,000 $2,832,753,000 20.7%
Divested School Endowment Size 2013 Endowment Size 2014 Percentage Change
�81

Returns for Endowments Valued Between $101 Million and $500 Million From 2008-2009
to 2012-2013
Average Asset Allocation for Endowments Valued Between $101 Million and $500 Million
From 2008-2009 to 2012-2013
Average Allocation of Alternative Strategies Assets for Endowments Valued Between
$101 Million and $500 Million From 2008-2009 to 2012-2013
2008-2009 2009-2010 2010-2011 2011-2012 2012-2013
Total Annual Net Return
-20% 12% 20% -1% 12%
3-Year Net Return
-3% -4% 3% 10% 10%
5-Year Net Return
3% 3.0% 4% 1% 4%
10-Year Net Return
4% 3% 5% 6.0% 7.0%
2008-2009 2009-2010 2010-2011 2011-2012 2012-2013
Domestic Equity
26% 25% 27% 25% 27%
Fixed Income 17% 17% 15% 16% 15%
International Equity
17% 17% 18% 18% 19%
Short-Term Securities/Cash/Other
7% 6% 5% 5% 5%
Alternative Strategies*
33% 35% 35% 36% 34%
�82

Average Returns by Asset for Endowments Valued Between $101 Million and $500 Million
From 2008-2009 to 2012-2013
Average Returns For Alternative Strategies Investments for Endowments Valued Between
2008-2009 2009-2010 2010-2011 2011-2012 2012-2013
Total Percentage of the Endowment
33% 35% 35% 36% 34%
Private Equity 17% 17% 18% 19% 17%
Marketable Alternative Strategies
54% 55% 53% 50% 50%
Venture Capital 5% 4% 4% 5% 6%
Private Equity Real-Estate
7% 6% 7% 8% 9%
Distressed Debt 5% 5% 4% 4% 6%
Energy and Natural Resources
12% 13% 14% 14% 12%
2008-2009 2009-2010 2010-2011 2011-2012 2012-2013
Domestic Equity
-26% 16% 31% 2% 21%
Fixed Income 3% 12% 7% 6% 2%
International Equity
-28% 12% 27.0% -11% 14%
Short-Term Securities/Cash/Other
-2% 3% 5% 0% 2%
Alternative Strategies*
-18% 8% 15% 1% 9%
�83
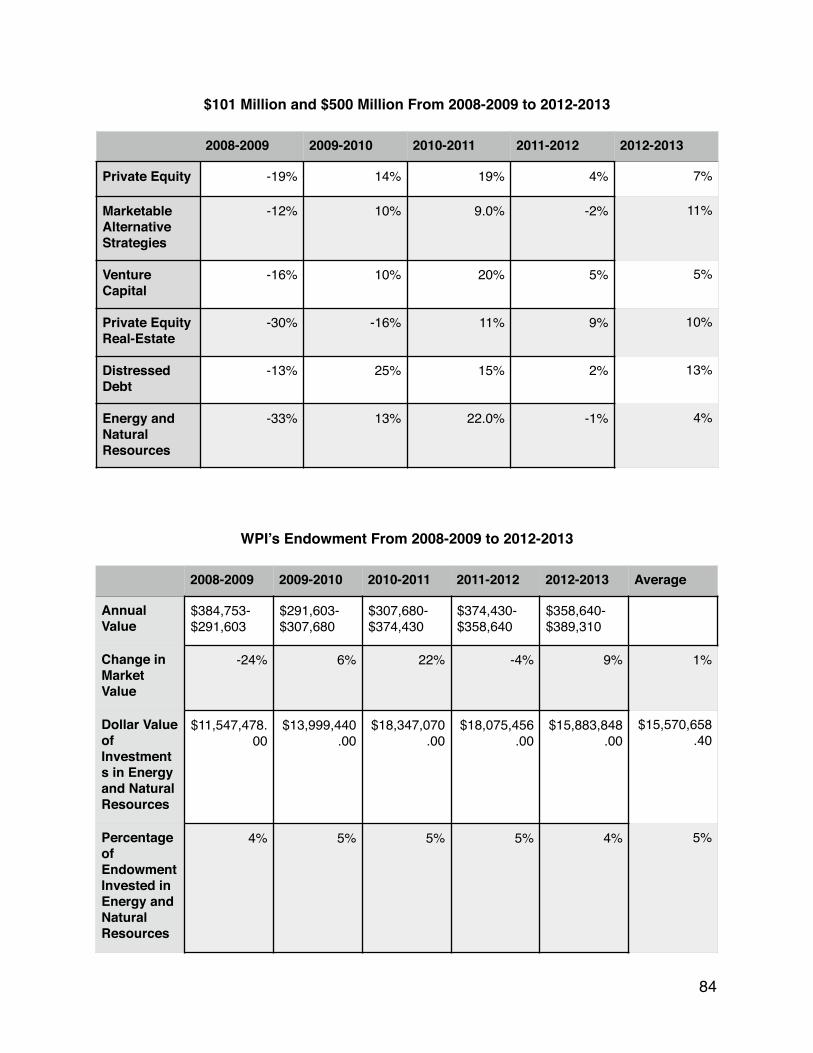
$101 Million and $500 Million From 2008-2009 to 2012-2013
WPI’s Endowment From 2008-2009 to 2012-2013
2008-2009 2009-2010 2010-2011 2011-2012 2012-2013
Private Equity -19% 14% 19% 4% 7%
Marketable Alternative Strategies
-12% 10% 9.0% -2% 11%
Venture Capital
-16% 10% 20% 5% 5%
Private Equity Real-Estate
-30% -16% 11% 9% 10%
Distressed Debt
-13% 25% 15% 2% 13%
Energy and Natural Resources
-33% 13% 22.0% -1% 4%
2008-2009 2009-2010 2010-2011 2011-2012 2012-2013 Average
Annual Value
$384,753-$291,603
$291,603-$307,680
$307,680-$374,430
$374,430-$358,640
$358,640-$389,310
Change in Market Value
-24% 6% 22% -4% 9% 1%
Dollar Value of Investments in Energy and Natural Resources
$11,547,478.00
$13,999,440.00
$18,347,070.00
$18,075,456.00
$15,883,848.00
$15,570,658.40
Percentage of Endowment Invested in Energy and Natural Resources
4% 5% 5% 5% 4% 5%
�84

APPENDIX D: ASSET CLASS HISTORICAL RETURNS FROM 1995
TO 2014
Historic Asset Performance From 1995 to 1999
1995 1996 1997 1998 1999
Large Cap Value 38.36%
Real Estate 35.27%
Large Cap Value 35.18%
Large Cap Growth 38.71%
Commodities 40.92%
Large Cap Growth 37.18%
Commodities 33.92%
Large Cap Growth 30.49%
International Equity 20.00%
Large Cap Growth 33.16%
Mid Caps 34.45% Large Cap Growth 23.12%
Mid Cap 29.01% Large Cap Value 15.63%
International Equity 26.96%
Small Cap 28.45% Large Cap Value 21.64%
Small Cap 22.36% Mid Cap 10.09% Small Cap 21.26%
Commodities 20.33%
Mid Cap 19.00% Real Estate 20.26%
Fixed Income 8.69%
Mid Cap 18.23%
Fixed Income 18.47%
Small Cap 16.49% Fixed Income 9.65%
Small Cap -2.55% Large Cap Value 7.35
Real Estate 15.27%
International Equity 6.05%
International Equity 1.78%
Real Estate -17.50%
Fixed Income -0.82%
International Equity 11.21%
Fixed Income 3.63%
Commodities -14.07%
Commodities -35.75%
Real Estate -4.62%
�85

Historic Asset Performance From 2000 to 2004
2000 2001 2002 2003 2004
Commodities 49.74%
Real Estate 13.93%
Commodities 32.07%
Small Cap 47.25% Real Estate 31.58%
Real Estate 26.37%
Fixed Income 8.44%
Fixed Income 10.25%
Mid Cap 40.06% International Equity 20.25%
Fixed Income 11.63%
Small Cap 2.49% Real Estate 3.82% International Equity 38.59%
Mid Cap 20.22%
Mid Cap 8.25% Large Cap Value -5.59%
Large Cap Value -15.52%
Real Estate 37.13%
Small Cap 18.33%
Large Cap Value 7.01%
Mid Cap -5.62% International Equity -15.94%
Large Cap Value 30.03%
Commodities 17.28%
Small Cap -3.02% Large Cap Growth -20.42%
Mid Cap -16.19% Large Cap Growth 29.75%
Large Cap Value 16.49%
International Equity -14.17%
International Equity -21.44%
Small Cap -20.48%
Commodities 20.72%
Large Cap Growth 6.30%
Large Cap Growth -22.42%
Commodities -31.93%
Large Cap Growth -27.88%
Fixed Income 4.10 %
Fixed Income 4.34%
�86

Historic Asset Performance From 2005 to 2009
2005 2006 2007 2008 2009
Commodities 25.55%
Real Estate 35.06%
Commodities 32.67%
Fixed Income 5.24%
Mid Cap 40.48%
International Equity 13.54%
International Equity 26.34%
Large Cap Growth 11.81%
Small Cap -33.79%
Large Cap Growth 37.21%
Mid Cap 12.65% Large Cap Value 22.25%
International Equity 11.17%
Large Cap Value -36.85%
International Equity 31.78%
Real Estate 12.16%
Small Cap 18.37% Fixed Income 6.97%
Real Estate -37.73%
Real Estate 27.99%
Large Cap Value 7.05%
Mid Cap 15.26% Mid Cap 5.60% Large Cap Growth -38.44%
Small Cap 27.17%
Large Cap Growth 5.26%
Large Cap Growth 9.07%
Large Cap Value -0.17%
Mid Cap -41.46 Large Cap Value 19.69%
Small Cap 4.55% Fixed Income 4.33%
Small Cap -1.57% International Equity -43.38%
Commodities 13.48%
Fixed Income 2.43%
Commodities -15.09%
Real Estate -15.69%
Commodities -46.49%
Fixed Income 5.93%
�87

Historic Asset Performance From 2010 to 2014 and Average
2010 2011 2012 2013 2014 Average
Real Estate 27.95%
Real Estate 8.28%
Real Estate 19.70%
Large Cap Growth 38.82%
Real Estate 28.03%
Mid Cap 13.96%
Large Cap Growth 26.85%
Mid Cap 7.84% International Equity 17.51%
Large Cap Value 34.76%
Large Cap Value 13.45%
Real Estate 13.51%
Large Cap Value 25.48%
Small Cap 2.84%
Commodities 17.32%
Small Cap 33.48%
Mid Cap 13.22%
Large Cap Value 12.10%
Small Cap 16.71%
International Equity 0.39%
Large Cap Value 17.28%
International Equity 32.53%
Large Cap Growth 13.05%
Large Cap Growth 11.70%
International Equity 15.51%
Fixed Income -1.18%
Large Cap Growth 16.35%
Commodities 22.78%
Fixed Income 5.97%
Small Cap 11.40%
Fixed Income 9.03%
Large Cap Value -1.55%
Small Cap 15.26%
Real Estate 2.86%
Small Cap 4.89%
International Equity 7.19%
Commodities 7.75%
Large Cap Growth -4.18%
Mid Cap 4.22% Fixed Income -1.22%
International Equity -4.90%
Fixed Income 6.29%
Mid Cap 6.54% Commodities -12.14%
Fixed Income 0.08%
Mid Cap -2.02%
Commodities -33.06%
Commodities 5.85%
�88

Annual Returns and Standard Deviations for Large Cap Growth and Large Cap Value As-
sets From 1995 to 2014
Large Cap Growth Returns
Large Cap Growth Variance
Large Cap Value Returns
Large Cap Value Variance
1995 37.18 624.5001 38.36 663.5776
1996 23.12 119.4649 21.64 81.7216
1997 30.49 334.89 35.18 509.8564
1998 38.71 703.3104 15.63 9.18090000000001
1999 33.16 439.7409 7.35 27.5625
2000 -22.42 1197.8521 7.01 31.2481
2001 -20.42 1063.4121 -5.59 330.8761
2002 -27.88 1605.6049 -15.52 790.7344
2003 29.75 308.3536 30.03 303.8049
2004 6.30 34.69 16.49 15.1321
2005 5.26 48.0249 7.05 30.8025
2006 9.07 9.7344 22.25 93.1225
2007 11.81 0.144399999999999
-0.17 163.0729
2008 -38.44 2563.3969 -36.85 2445.3025
2009 37.21 626.0004 19.69 50.2681
2010 26.85 214.9156 25.48 165.8944
2011 -4.18 267.9769 -1.55 200.2225
2012 16.35 17.3056 17.28 21.9024
�89

Annual Returns and Standard Deviations for Mid Cap and Small Cap Assets From 1995 to
2014
2013 38.82 709.1569 34.76 491.0656
2014 13.05 0.739600000000002
13.45 0.722499999999999
Average 12.1895 544.460835 12.5985 321.303525
Standard Deviation
23.3336845568804
17.9249414224984
Large Cap Growth Returns
Large Cap Growth Variance
Large Cap Value Returns
Large Cap Value Variance
Mid Cap Returns Mid Cap Variance Small Cap Returns
Small Cap Variance
1995 34.45 550.3716 28.45 307.6516
1996 19.00 64.16 16.49 31.1364
1997 29.01 324.7204 22.36 131.1025
1998 10.09 0.810000000000001
-2.55 181.1716
1999 18.23 52.4176 21.26 107.1225
2000 8.25 7.5076 -3.02 194.0449
2001 -5.62 275.8921 2.49 70.8964
2002 -16.19 738.7524 -20.48 985.3321
2003 40.06 845.0649 47.25 1320.5956
2004 20.22 85.1929 18.33 55.0564
2005 12.65 2.7556 4.55 40.4496
2006 15.26 18.2329 18.37 55.6516
2007 5.60 29.05 -1.57 155.7504
2008 -41.46 2751.0025 -33.79 1998.09
2009 40.48 869.6601 27.17 264.3876
�90

Annual Returns and Standard Deviations for International Equity and Real- Estate From
1995 to 2014
2010 6.54 19.8025 16.71 33.64
2011 7.84 9.9225 2.64 68.3929
2012 4.22 45.8329 15.26 18.9225
2013 -2.02 169.2601 33.48 509.4049
2014 13.22 4.9729 4.89 36.2404
Average 10.9915 343.269185 10.9145 328.251995
Standard Deviation
18.527525064077 18.1177259886554
Mid Cap Returns Mid Cap Variance Small Cap Returns
Small Cap Variance
International Equity Returns
International Equity Variance
Real-Estate Returns
Real-Estate Variance
1995 11.21 6.35040000000001
15.27 3.0976
1996 6.05 6.9696 35.27 473.4976
1997 1.78 47.7481 20.26 45.5625
1998 20.00 127.92 -17.50 961.62
1999 26.96 333.7929 -4.62 328.6969
2000 -14.17 522.5796 26.37 165.3796
2001 -21.44 907.8169 13.93 0.1764
2002 -15.94 606.6369 3.82 93.8961
2003 38.59 894.01 37.13 557.9044
2004 20.25 133.6336 31.58 326.5249
2005 13.54 23.5225 12.16 1.8225
2006 26.34 311.5225 35.06 464.4025
2007 11.17 6.1504 -15.69 852.64
�91
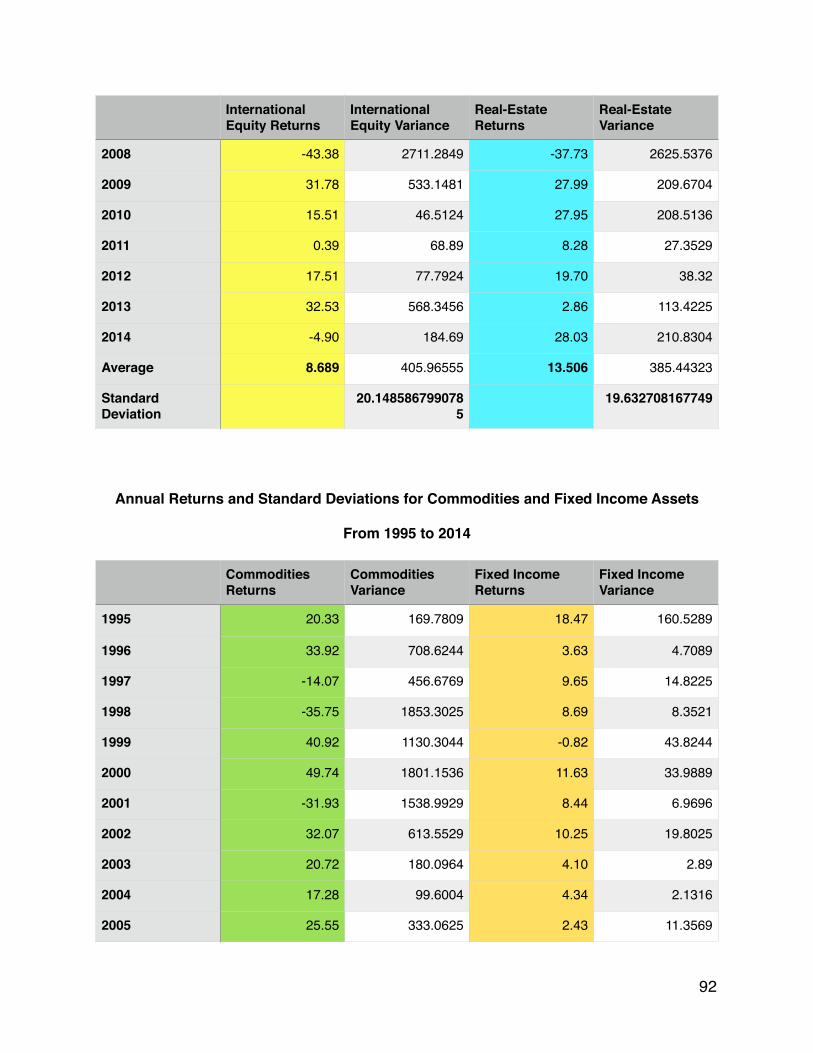
Annual Returns and Standard Deviations for Commodities and Fixed Income Assets
From 1995 to 2014
2008 -43.38 2711.2849 -37.73 2625.5376
2009 31.78 533.1481 27.99 209.6704
2010 15.51 46.5124 27.95 208.5136
2011 0.39 68.89 8.28 27.3529
2012 17.51 77.7924 19.70 38.32
2013 32.53 568.3456 2.86 113.4225
2014 -4.90 184.69 28.03 210.8304
Average 8.689 405.96555 13.506 385.44323
Standard Deviation
20.1485867990785
19.632708167749
International Equity Returns
International Equity Variance
Real-Estate Returns
Real-Estate Variance
Commodities Returns
Commodities Variance
Fixed Income Returns
Fixed Income Variance
1995 20.33 169.7809 18.47 160.5289
1996 33.92 708.6244 3.63 4.7089
1997 -14.07 456.6769 9.65 14.8225
1998 -35.75 1853.3025 8.69 8.3521
1999 40.92 1130.3044 -0.82 43.8244
2000 49.74 1801.1536 11.63 33.9889
2001 -31.93 1538.9929 8.44 6.9696
2002 32.07 613.5529 10.25 19.8025
2003 20.72 180.0964 4.10 2.89
2004 17.28 99.6004 4.34 2.1316
2005 25.55 333.0625 2.43 11.3569
�92

REFERENCES
Andrade, Stefan. "Farmers Under Pressure. Analysis of the Social Conditions of Cases of Ani-mal Neglect." Journal of Agricultural and Environmental Ethics 27.1 (2014): 103-26. JSTOR. Web. Jan. 2016.
Bass, David, and Et. Al. Commonfund Study of Responsible Investing. Commonfund.org. Com-monfund Institute, Apr. 2015. Web. Sept. 2015.
Black, Keith. "Risk Management for Endowment and Foundation Portfolios." The Journal of Al-ternate Investments (2013): 87-96. JSTOR. Web. Nov. 2014.
Bhatti, Ayesha, Junaid Ashraf, and M. Farhan Akhtar. "Understanding Endowment Funds." Asian Journal of Management Cases 11.2 (2014): n. pag. JSTOR. Web. 23 Mar. 2015.
Bodie, Zvi, and Et. Al. Essentials of Investing. New York: McGraw-Hill, 2013. Print.
Broadhurst, Christopher. "Campus Activism in the 21st Century: AHistorical Framing." New Di-rections for Higher Education 2014.167 (2014): 3-15. JSTOR. Web. Nov. 2015.
2006 -15.09 501.3121 4.33 2.1609
2007 32.67 643.6369 6.97 1.3689
2008 -46.49 2893.3641 5.24 0.3136
2009 13.48 38.1924 5.93 0.0169
2010 7.75 0.2025 9.03 10.4329
2011 -12.14 377.9136 -1.18 48.7204
2012 17.32 100.4004 0.08 32.7184
2013 22.78 239.6304 -1.22 49.2804
2014 -33.06 1628.9296 5.97 0.0289
Average 7.3 765.43649 5.798 22.72088
Standard Deviation
27.6665229112731
4.76664242418078
Commodities Returns
Commodities Variance
Fixed Income Returns
Fixed Income Variance
�93

"Causes of the Upswing in Atlantic Basin Major Hurricane Activity since 1995.” Evidence-Based Climate Science. Ed. Don Easterbrook. Oxford: Elsevier, 2011. 225-227. Print.
Cornell, Sarah, and Et. Al. "Difficulties Assessing 'Dangerous' Levels of Global Warming." Un-derstanding the Earth System. New York, NY: Cambridge UP, 2012. 184-185. Print.
Cornell, Sarah, and Et. Al. "Energy Balance and Radiative Forcing." Understanding the Earth System. New York, NY: Cambridge UP, 2012. 19-25. Print.
Crutzen, Paul and Eugene Stoemer . “The ‘Anthropocene’." The Global Warming Reader: A Century of Writing about Climate Change. Ed. Bill McKibben. New York, NY: Penguin, 2012. 69-72. Print.
Damodaran, Aswath. Annual Returns on Stock, T.Bonds and T.Bills: 1928 - Current. 5 Jan. 2015. Raw data. New York University, New York.
DeMenocal, Peter. "Climate and Human Evolution." Science 331 (2011): 540-542. JSTOR. Web. Nov. 2015.
Fogler, H. Russell, et al. "Endowment planning: a real-life example." Journal of Portfolio Man-agement Spring 1994: 30+. Business Insights: Essentials. Web. 3 Sept. 2015.
Foss, Michelle. The Outlook for U.S. Gas Prices in 2020: Henry Hub at $3 or $10? Oxford Ener-gy. Oxford Institutefor Energy Studies, Dec. 2011. Web. July 2015.
Gibbins, Jon. "Carbon Capture and Storage." EnergyPolicy 36.12 (2008): 4317-4322. JSTOR. Web. Dec. 2015.
Green, Steven. "Why 5 Percent? An Analysis of Optimal Endowment Spending Rates." Studies in Economics and Finance 26.4 (2009): 216-231. JSTOR. Web. 3 Sept. 2015.
Groisman, Pavel. "Prolonged Dry Episodes over the Conterminous United States: New Tenden-cies Emerging during the Last 40 Years." Journal of Climate 21.9 (2008): 1850-1862. JSTOR. Web. Nov. 2015.
Hansen, James and Et. Al. “Target Atmospheric Co2: Where Should Humanity Aim?” The Glob-al Warming Reader: A Century of Writing about Climate Change. Ed. Bill McKibben. New York, NY: Penguin, 2012. 81-86. Print.
Haszeldine, R.Stuart. "Carbon Capture and Storage: How Green Can Black Be?" Science 325 (2009): 1647-1652. JSTOR. Web. Dec. 2015.
Haq, Gary, and Alistair Paul. Environmentalism since 1945. Abingdon, Oxon: Routledge, 2012. Print.
Heijden, Hein-Anton Van Der. Social Movements, Public Spheres and the European Politics of the Environment: Green Power Europe? Houndmills, Basingstoke, Hampshire: Palgrave Macmillan, 2010. Print.
�94

Intergovernmental Panel on Climate Change. "IPCC Working Group I." The Global Warming Reader: A Century of Writing about Climate Change. Ed. Bill McKibben. New York, NY: Pen-guin, 2012. 55-67. Print.
Jackson, R. V. "Rates of Industrial Growth during the Industrial Revolution." The Economic His-tory Review 45.1 (1992): 1-23. JSTOR. Web. July 2015.
Kahn, Muhammad. "Global Estimates of Energy Consumption and Greenhouse Gas Emissions." Renewable and Sustainable Energy Reviews 29 (2014): 336-344. JSTOR. Web. Nov. 2015.
Kellogg, W. W. “Potential Consequences of a Global Warming.” Man’s Impact on Climate. By Wilfrid Bach and Et. Al. Oxford, UK: Elsevier, 1979. 313-319. Print.
Kerr, Richard. "Ice-Free Arctic Sea May Be Years, Not Decades, Away." Science 337.6102 (2012): 1591. Web. Nov. 2015.
Kohl-Arenas, Erica. "Will the Revolution Be Funded? Resource Mobilization and the California Farm Worker Movement." Journal of Social, Cultural and Political Protest 13.4 (2014): 482-498. JSTOR. Web. Aug. 2015.
Kolbert, Elizabeth. “The Darkening Sea: What Carbon Emissions are doing to the Ocean.” The Global Warming Reader: A Century of Writing about Climate Change. Ed. Bill McKibben. New York, NY: Penguin, 2012. 377-398. Print.
“Lessons From Past Global Climate Change." Evidence-Based Climate Science. Ed. Don East-erbrook. Oxford: Elsevier, 2011. 19-25. Print.
Lohmann, Larry. "Financialization, Commodification and Carbon: The Contradictions of Neolib-eral Climate Policy." Socialist Register 48 (2012): 85-107. JSTOR. Web. Oct. 2015.
Masters, Jeff. “Causes of the Russian Heat Wave and Pakistani Floods." The Global Warming Reader: A Century of Writing about Climate Change. Ed. Bill McKibben. New York, NY: Pen-guin, 2012. 89-93. Print.
McKibben, Bill. "Don’t Imagine the Future—it’s Already Here." Organization 20.5 (2013): 745-747. JSTOR. Web. July 2015
McKibben, Bill. "Falling Short on Climate in Paris." The New York Times [New York] 14 Dec. 2015: A23. Print.
McKibben, Bill. “This Is Fucked Up-- It's Time to Get Mad and Then Busy.” The Global Warming Reader: A Century of Writing about Climate Change. Ed. Bill McKibben. New York, NY: Pen-guin, 2012. 251-257. Print.
Mitleton-Kelly, Eve, and Jeff Johnson. "Energy and Climate Change: The Contribution of Com-plexity Science an Interview with Lord David Puttnam 24 March 2009." E-CO 12.2 (2010): 70-76. JSTOR. Web. July 2015.
�95

Mumford, Lewis. Technics & Civilization. Chicago: U of Chicago, 1934. Print.
National Oceanic and Atmospheric Association. Global Analysis 2014. NOAA: National Centers for Environmental Information. NOAA, July 2014. Web. Aug. 2015.
Oreskes, Naomi. “Scientific Consensus on Climate Change." The Global Warming Reader: A Century of Writing about Climate Change. Ed. Bill McKibben. New York, NY: Penguin, 2012. 75-78. Print.
Randall, Douglas and Peter Schwartz. “An Abrupt Climate Change Scenario and Its Implications for United States National Security." The Global Warming Reader: A Century of Writing about Climate Change. Ed. Bill McKibben. New York, NY: Penguin, 2012. 319-349. Print.
Reagan, Ronald. "Remarks Before the American Petroleum Institute." The Environmental Movement 1968-1972. Seattle: U O Washington, 2012. 114-118. Print.
Rootes, Christopher. "Environmental Movements and Campaigns against Waste Infrastructure in the United States." Environmental Politics 18.6 (2009): 835-50. JSTOR. Web. Jan. 2016.
Rosas, Francisco. "Nitrous Oxide Emission Reductions from Cutting Excessive Nitrogen Fertil-izer Applications." Climate Change 132.2 (2015): 353-67. JSTOR. Web. Dec. 2015.
Ross, Robert. A Concise History of South Africa. 2nd ed. Cape Town: Cambridge UP, 2008. Print.
Sivakumar, Bellie. "Global Climate Change and Its Impacts on Water Resources Planning and Management: Assessment and Challenges." Stochastic Environmental Research and Risk Assessment 25.4 (2011): 583-600. JSTOR. Web. Jan. 2016.
Solomon, Jeffrey and Thomas Cyr. Interview Exploring WPI's Endowment. Feb. 2014. Inter-viewed Jeffrey Solomon on how WPI invests its Endowment. Worcester Polytechnic Institute, Worcester, MA.
Soule, Sarah. The Effect of Student Protest on the Diffusion of University Divestment Decisions in the United States. Cornell University, 11 Mar. 2008. Web. Dec. 2015.
Sparks, Allister. The Mind of South Africa. New York: Alfred A. Knopf, 1990. Print.
Sullivan, Lee. "Getting on Board with Endowment Management Rules." Pennsylvania CPA Journal (2014): 22. JSTOR. Web. Dec. 2014.
Tokar, Brian. "Inside the Paris Climate Agreement: Hope or Hype." CounterPunch. 30 Dec. 2015. Web. Jan. 2016.
Tokar, Brian. "The Greens as a social movement: the early years." Synthesis/Regeneration Win-ter 2011: 43-47. Web. 8 Aug. 2015.
Tutu, Desmond. "We Fought Apartheid. Now Climate Change Is Our Global Enemy." The Guardian.” Sept. 2014. Web. July 2015.
�96
Welch, Ivo, and Paul Wazzen. "The Effect of Socially Activist Investment Policies on the Finan-cial Markets: Evidence from the South African Boycott." Chicago Journals 72.1 (1999): 35-89. JSTOR. Web. Nov. 2015.
Worden, Nigel. The Making of Modern South Africa. West Sussex, UK: Wiley-Blackwell, 2012. Print.
Yamin, Farhana, ed. Climate Change and Carbon Markets. London: Earthscan, 2005. Print.
Zachos, James, and Et. Al. "Trends, Rhythms, and Aberrations in Global Climate 65 Ma to Present." Science 292 (2001): 686-693. JSTOR. Web. Dec. 2015.
�97