fossil fuels – at what cost? - iisd · 2011-10-28 · the global subsidies initiative fossil...
TRANSCRIPT
www.globalsubsidies.org
Fossil Fuels – At What Cost? Government support for upstream oil activities in
three Canadian provinces: Alberta, Saskatchewan, and Newfoundland and Labrador
NOVEMBER 2010
Prepared by:
EnviroEconomics Inc. Dave SawyerSeton Stiebert
For the Global Subsidies Initiative (GSI) of the International Institute for Sustainable Development (IISD)Geneva, Switzerland


www.globalsubsidies.org
THE GLOBAL SUBSIDIES INITIATIVE FOSSIL FUELS – AT WHAT COST? GOVERNMENT SUPPORT FOR UPSTREAM OIL ACTIVITIES IN THREE CANADIAN PROVINCES: ALBERTA, SASKATCHEWAN, AND NEWFOUNDLAND AND LABRADOR Page III
Fossil Fuels – At What Cost? Government support for upstream oil activities in three Canadian provinces: Alberta,Saskatchewan, and Newfoundland and Labrador
NOVEMBER 2010
Prepared by:
EnviroEconomics Inc. Dave SawyerSeton Stiebert
For the Global Subsidies Initiative (GSI) of the International Institute for Sustainable Development (IISD)Geneva, Switzerland

www.globalsubsidies.org
THE GLOBAL SUBSIDIES INITIATIVE FOSSIL FUELS – AT WHAT COST? GOVERNMENT SUPPORT FOR UPSTREAM OIL ACTIVITIES IN THREE CANADIAN PROVINCES: ALBERTA, SASKATCHEWAN, AND NEWFOUNDLAND AND LABRADOR Page IV
© 2010, International Institute for Sustainable Development
IISD contributes to sustainable development by advancing policy recommendations on international tradeand investment, economic policy, climate change and energy, measurement and assessment, and naturalresources management, and the enabling role of communication technologies in these areas. We report oninternational negotiations and disseminate knowledge gained through collaborative projects, resulting in morerigorous research, capacity building in developing countries, better networks spanning the North and theSouth, and better global connections among researchers, practitioners, citizens and policy-makers.
IISD’s vision is better living for all—sustainably; its mission is to champion innovation, enabling societies tolive sustainably. IISD is registered as a charitable organization in Canada and has 501(c)(3) status in the UnitedStates. IISD receives core operating support from the Government of Canada, provided through the CanadianInternational Development Agency (CIDA), the International Development Research Centre (IDRC) andEnvironment Canada, and from the Province of Manitoba. The Institute receives project funding from numerousgovernments inside and outside Canada, United Nations agencies, foundations and the private sector.
International Institute for Sustainable Development
Head Office161 Portage Avenue East, 6th FloorWinnipeg, ManitobaCanada R3B 0Y4Tel: +1 (204) 958-7700Fax: +1 (204) 958-7710Web site: www.iisd.org
International Institute for Sustainable DevelopmentGlobal Subsidies Initiative
International Environment House 29 chemin de Balexert1219 ChâtelaineGeneva, SwitzerlandTel: +41 22 917-8373Fax: +41 22 917-8054Web site: www.globalsubsidies.org
Fossil Fuels – At What Cost? Government support for upstream oil activities in three Canadian provinces:Alberta, Saskatchewan, and Newfoundland and Labrador
Novermber 2010
Prepared by
EnviroEconomics Inc.
Dave Sawyer
Seton Stiebert
www.globalsubsidies.org
THE GLOBAL SUBSIDIES INITIATIVE FOSSIL FUELS – AT WHAT COST? GOVERNMENT SUPPORT FOR UPSTREAM OIL ACTIVITIES IN THREE CANADIAN PROVINCES: ALBERTA, SASKATCHEWAN, AND NEWFOUNDLAND AND LABRADOR Page V
ACKNOWLEDGEMENTS
Special thanks to Jotham Peters of M.K. Jaccard and Associates Inc. for modelling support, as well as ChrisBataille. Methodological support was also provided by Dr. Andrew Leach. The authors would also like to thankKerryn Lang of the Global Subsidies Initiative (GSI) for some excellent support and methodology development.
Peer review comments were provided by John Drexhage and Peter Wooders (International Institute for SustainableDevelopment), Masami Kojima (World Bank), Amy Taylor (Pembina Institute), Rick Hyndman (CanadianAssociation of Petroleum Producers), and Cees van Beers (Delft University of Technology, The Netherlands).
The work of the GSI could not have been undertaken without the generous support of the governments ofDenmark, Norway and the United Kingdom, as well as the William and Flora Hewlett Foundation.
The views expressed in this study do not necessarily reflect those of the GSI’s funders, nor should they beattributed to them.
www.globalsubsidies.org
THE GLOBAL SUBSIDIES INITIATIVE FOSSIL FUELS – AT WHAT COST? GOVERNMENT SUPPORT FOR UPSTREAM OIL ACTIVITIES IN THREE CANADIAN PROVINCES: ALBERTA, SASKATCHEWAN, AND NEWFOUNDLAND AND LABRADOR Page VI
TABLE OF CONTENTS1. Executive Summary . . . . . . . . . . . . . . . . . . . . . . . . . . . . . . . . . . . . . . . . . . . . . . . . . . . . . . . . . . . . 11
1.1 Scope of the Study . . . . . . . . . . . . . . . . . . . . . . . . . . . . . . . . . . . . . . . . . . . . . . . . . . . . . . . . . . . . . . . . . . . . . . . 18
2. Overview of the Oil Supply Sector . . . . . . . . . . . . . . . . . . . . . . . . . . . . . . . . . . . . . . . . . . . . . . . . . . 19
2.1 Physical Characteristics in Canada . . . . . . . . . . . . . . . . . . . . . . . . . . . . . . . . . . . . . . . . . . . . . . . . . . . . . . . . . . . . 19
2.2 Industry Structure by Jurisdiction. . . . . . . . . . . . . . . . . . . . . . . . . . . . . . . . . . . . . . . . . . . . . . . . . . . . . . . . . . . . . 20
2.2.1 Alberta . . . . . . . . . . . . . . . . . . . . . . . . . . . . . . . . . . . . . . . . . . . . . . . . . . . . . . . . . . . . . . . . . . . . . . 21
2.3 Saskatchewan. . . . . . . . . . . . . . . . . . . . . . . . . . . . . . . . . . . . . . . . . . . . . . . . . . . . . . . . . . . . . . . . . . . . . . . . . . . 23
2.3.1 Newfoundland and Labrador . . . . . . . . . . . . . . . . . . . . . . . . . . . . . . . . . . . . . . . . . . . . . . . . . . . . . . . 23
3. Subsidy Definition and Approach . . . . . . . . . . . . . . . . . . . . . . . . . . . . . . . . . . . . . . . . . . . . . . . . . . 25
3.1 Definition of Subsidy. . . . . . . . . . . . . . . . . . . . . . . . . . . . . . . . . . . . . . . . . . . . . . . . . . . . . . . . . . . . . . . . . . . . . . 25
3.2 Approach . . . . . . . . . . . . . . . . . . . . . . . . . . . . . . . . . . . . . . . . . . . . . . . . . . . . . . . . . . . . . . . . . . . . . . . . . . . . . . 26
4. Summary of the Value of the Subsidies . . . . . . . . . . . . . . . . . . . . . . . . . . . . . . . . . . . . . . . . . . . . . . 295. Oil Subsidies Provided by the Federal Government. . . . . . . . . . . . . . . . . . . . . . . . . . . . . . . . . . . . . . 36
5.1 Historical Context of Subsidy Programs. . . . . . . . . . . . . . . . . . . . . . . . . . . . . . . . . . . . . . . . . . . . . . . . . . . . . . . . . 36
5.2 Number of Subsidy Programs. . . . . . . . . . . . . . . . . . . . . . . . . . . . . . . . . . . . . . . . . . . . . . . . . . . . . . . . . . . . . . . . 37
5.3 Value of Subsidy Programs. . . . . . . . . . . . . . . . . . . . . . . . . . . . . . . . . . . . . . . . . . . . . . . . . . . . . . . . . . . . . . . . . . 39
6. Oil Subsidies in Alberta. . . . . . . . . . . . . . . . . . . . . . . . . . . . . . . . . . . . . . . . . . . . . . . . . . . . . . . . . 41
6.1 Historical Context of Subsidy Programs. . . . . . . . . . . . . . . . . . . . . . . . . . . . . . . . . . . . . . . . . . . . . . . . . . . . . . . . . 41
6.2 Number of Subsidy Programs. . . . . . . . . . . . . . . . . . . . . . . . . . . . . . . . . . . . . . . . . . . . . . . . . . . . . . . . . . . . . . . . 42
6.3 Value of Subsidy Programs. . . . . . . . . . . . . . . . . . . . . . . . . . . . . . . . . . . . . . . . . . . . . . . . . . . . . . . . . . . . . . . . . . 44
7. Oil Subsidies in Saskatchewan . . . . . . . . . . . . . . . . . . . . . . . . . . . . . . . . . . . . . . . . . . . . . . . . . . . . 46
7.1 Historical Context of Subsidy Programs. . . . . . . . . . . . . . . . . . . . . . . . . . . . . . . . . . . . . . . . . . . . . . . . . . . . . . . . . 46
7.2 Number of Subsidy Programs. . . . . . . . . . . . . . . . . . . . . . . . . . . . . . . . . . . . . . . . . . . . . . . . . . . . . . . . . . . . . . . . 47
7.3 Value of Subsidy Programs. . . . . . . . . . . . . . . . . . . . . . . . . . . . . . . . . . . . . . . . . . . . . . . . . . . . . . . . . . . . . . . . . . 49
8. Oil Subsidies in Newfoundland and Labrador . . . . . . . . . . . . . . . . . . . . . . . . . . . . . . . . . . . . . . . . . 51
8.1 Historical Context of Subsidy Programs. . . . . . . . . . . . . . . . . . . . . . . . . . . . . . . . . . . . . . . . . . . . . . . . . . . . . . . . . 51
8.2 Number of Subsidy Programs. . . . . . . . . . . . . . . . . . . . . . . . . . . . . . . . . . . . . . . . . . . . . . . . . . . . . . . . . . . . . . . . 52
8.3 Value of Subsidy Programs. . . . . . . . . . . . . . . . . . . . . . . . . . . . . . . . . . . . . . . . . . . . . . . . . . . . . . . . . . . . . . . . . . 54
9. Economic and Environmental Impacts of Subsidies . . . . . . . . . . . . . . . . . . . . . . . . . . . . . . . . . . . . . 55
9.1 Financial Implications of Subsidy at the Well Level in Saskatchewan . . . . . . . . . . . . . . . . . . . . . . . . . . . . . . . . . . . 55
9.1.1 Incentives Relative to Royalties Due . . . . . . . . . . . . . . . . . . . . . . . . . . . . . . . . . . . . . . . . . . . . . . . . . 58
9.2 The Macroeconomic and Emissions Impact of Reducing Existing Subsidies . . . . . . . . . . . . . . . . . . . . . . . . . . . . . . 59
10. Conclusion . . . . . . . . . . . . . . . . . . . . . . . . . . . . . . . . . . . . . . . . . . . . . . . . . . . . . . . . . . . . . . . . . 6411. References . . . . . . . . . . . . . . . . . . . . . . . . . . . . . . . . . . . . . . . . . . . . . . . . . . . . . . . . . . . . . . . . . 67Annex 1: Detailed Subsidies. . . . . . . . . . . . . . . . . . . . . . . . . . . . . . . . . . . . . . . . . . . . . . . . . . . . . . . . 7212. Government-Owned Energy Minerals. . . . . . . . . . . . . . . . . . . . . . . . . . . . . . . . . . . . . . . . . . . . . . . 72
12.1 Federal. . . . . . . . . . . . . . . . . . . . . . . . . . . . . . . . . . . . . . . . . . . . . . . . . . . . . . . . . . . . . . . . . . . . . . . . . . . . . . . 72
12.1.1 Deductible Portion of Royalties Due . . . . . . . . . . . . . . . . . . . . . . . . . . . . . . . . . . . . . . . . . . . . . . . . 72
12.2 Provincial-Alberta . . . . . . . . . . . . . . . . . . . . . . . . . . . . . . . . . . . . . . . . . . . . . . . . . . . . . . . . . . . . . . . . . . . . . . . 73
12.2.1 Drilling Royalty Credit. . . . . . . . . . . . . . . . . . . . . . . . . . . . . . . . . . . . . . . . . . . . . . . . . . . . . . . . . . . 73
www.globalsubsidies.org
THE GLOBAL SUBSIDIES INITIATIVE FOSSIL FUELS – AT WHAT COST? GOVERNMENT SUPPORT FOR UPSTREAM OIL ACTIVITIES IN THREE CANADIAN PROVINCES: ALBERTA, SASKATCHEWAN, AND NEWFOUNDLAND AND LABRADOR Page VII
12.2.2 New Royalty Framework Transitional Offer(TO) (Natural Gas). . . . . . . . . . . . . . . . . . . . . . . . . . . . . . . 74
12.2.3 Alberta Royalty Tax Credit (Historic). . . . . . . . . . . . . . . . . . . . . . . . . . . . . . . . . . . . . . . . . . . . . . . . . 75
12.2.4 New Well Royalty Reduction . . . . . . . . . . . . . . . . . . . . . . . . . . . . . . . . . . . . . . . . . . . . . . . . . . . . . . 76
12.2.5 Bitumen Royalty in Kind (BRIK) . . . . . . . . . . . . . . . . . . . . . . . . . . . . . . . . . . . . . . . . . . . . . . . . . . . 77
12.2.6 Enhanced Recovery of Oil Royalty Reduction (EOR) . . . . . . . . . . . . . . . . . . . . . . . . . . . . . . . . . . . . . 78
12.2.7 CO2 Enhanced Oil Recovery . . . . . . . . . . . . . . . . . . . . . . . . . . . . . . . . . . . . . . . . . . . . . . . . . . . . . . 79
12.2.8 CO2 Projects Royalty Credit . . . . . . . . . . . . . . . . . . . . . . . . . . . . . . . . . . . . . . . . . . . . . . . . . . . . . . . 80
12.2.9 Experimental Project Petroleum Royalty Reduction. . . . . . . . . . . . . . . . . . . . . . . . . . . . . . . . . . . . . . 82
12.2.10 Reactivated Well Royalty Exemption . . . . . . . . . . . . . . . . . . . . . . . . . . . . . . . . . . . . . . . . . . . . . . . 83
12.2.11 Low Productivity Well Royalty Reduction . . . . . . . . . . . . . . . . . . . . . . . . . . . . . . . . . . . . . . . . . . . . 85
12.2.12 Innovative Energy Technologies Program (IETP) . . . . . . . . . . . . . . . . . . . . . . . . . . . . . . . . . . . . . . . 87
12.2.13 Royalty Tax Deduction (Response to Resource Allowance). . . . . . . . . . . . . . . . . . . . . . . . . . . . . . . . 88
12.2.14 Royalty Payments. . . . . . . . . . . . . . . . . . . . . . . . . . . . . . . . . . . . . . . . . . . . . . . . . . . . . . . . . . . . . 89
12.2.15 Leasing of Mineral Rights . . . . . . . . . . . . . . . . . . . . . . . . . . . . . . . . . . . . . . . . . . . . . . . . . . . . . . . 91
12.3 Provincial-Saskatchewan . . . . . . . . . . . . . . . . . . . . . . . . . . . . . . . . . . . . . . . . . . . . . . . . . . . . . . . . . . . . . . . . . . 93
12.3.1 Enhanced Oil Recovery (EOR) Royalty Regime . . . . . . . . . . . . . . . . . . . . . . . . . . . . . . . . . . . . . . . . . 93
12.3.2 Royalty Tax Rebate . . . . . . . . . . . . . . . . . . . . . . . . . . . . . . . . . . . . . . . . . . . . . . . . . . . . . . . . . . . . . 95
12.3.3 Corporation Capital Tax Exemption . . . . . . . . . . . . . . . . . . . . . . . . . . . . . . . . . . . . . . . . . . . . . . . . . 96
12.3.4 Allowable Transportation Expenses . . . . . . . . . . . . . . . . . . . . . . . . . . . . . . . . . . . . . . . . . . . . . . . . . 97
12.3.5 Vertical Well Drilling Incentive. . . . . . . . . . . . . . . . . . . . . . . . . . . . . . . . . . . . . . . . . . . . . . . . . . . . . 98
12.3.6 Horizontal Well Drilling Incentive. . . . . . . . . . . . . . . . . . . . . . . . . . . . . . . . . . . . . . . . . . . . . . . . . . . 99
12.3.7 Exploratory Well Drilling Incentive . . . . . . . . . . . . . . . . . . . . . . . . . . . . . . . . . . . . . . . . . . . . . . . . . 100
12.3.8 New or Expanded Water Flood Projects . . . . . . . . . . . . . . . . . . . . . . . . . . . . . . . . . . . . . . . . . . . . . 102
12.3.9 High Water-Cut Program . . . . . . . . . . . . . . . . . . . . . . . . . . . . . . . . . . . . . . . . . . . . . . . . . . . . . . . . 103
12.3.10 Oil Well Reactivation Program. . . . . . . . . . . . . . . . . . . . . . . . . . . . . . . . . . . . . . . . . . . . . . . . . . . 104
12.3.11 Workover Reclassification Program . . . . . . . . . . . . . . . . . . . . . . . . . . . . . . . . . . . . . . . . . . . . . . . 105
12.4 Provincial-Newfoundland and Labrador . . . . . . . . . . . . . . . . . . . . . . . . . . . . . . . . . . . . . . . . . . . . . . . . . . . . . . 106
12.4.1 Fiscal Equalization Offset Payments . . . . . . . . . . . . . . . . . . . . . . . . . . . . . . . . . . . . . . . . . . . . . . . 106
13. Government Ownership of Energy Related Enterprises . . . . . . . . . . . . . . . . . . . . . . . . . . . . . . . . . 107
13.1 Federal. . . . . . . . . . . . . . . . . . . . . . . . . . . . . . . . . . . . . . . . . . . . . . . . . . . . . . . . . . . . . . . . . . . . . . . . . . . . . . 107
13.1.1 Equity Investment . . . . . . . . . . . . . . . . . . . . . . . . . . . . . . . . . . . . . . . . . . . . . . . . . . . . . . . . . . . . 107
13.2 Provincial-Newfoundland and Labrador . . . . . . . . . . . . . . . . . . . . . . . . . . . . . . . . . . . . . . . . . . . . . . . . . . . . . . 108
13.2.1 Equity Investment . . . . . . . . . . . . . . . . . . . . . . . . . . . . . . . . . . . . . . . . . . . . . . . . . . . . . . . . . . . . 108
13.3 Saskatchewan. . . . . . . . . . . . . . . . . . . . . . . . . . . . . . . . . . . . . . . . . . . . . . . . . . . . . . . . . . . . . . . . . . . . . . . . . 109
13.3.1 Saskatchewan Carbon Dioxide EOR and Storage Initiative. . . . . . . . . . . . . . . . . . . . . . . . . . . . . . . . 109
13.3.2 Upstream Emission Reduction Initiative . . . . . . . . . . . . . . . . . . . . . . . . . . . . . . . . . . . . . . . . . . . . 110
13.4 Provincial – Newfoundland and Labrador . . . . . . . . . . . . . . . . . . . . . . . . . . . . . . . . . . . . . . . . . . . . . . . . . . . . . 111
13.4.1 Offshore Technology Transfer Fund . . . . . . . . . . . . . . . . . . . . . . . . . . . . . . . . . . . . . . . . . . . . . . . . 111
13.4.2 Oil and Gas Manufacturing and Services Export Development Fund. . . . . . . . . . . . . . . . . . . . . . . . . 111
13.4.3 Canada-Newfoundland Offshore Petroleum Board . . . . . . . . . . . . . . . . . . . . . . . . . . . . . . . . . . . . . 112
13.4.4 Scientific Research and Experimental Development (SR&ED) tax credit program . . . . . . . . . . . . . . . 112
www.globalsubsidies.org
THE GLOBAL SUBSIDIES INITIATIVE FOSSIL FUELS – AT WHAT COST? GOVERNMENT SUPPORT FOR UPSTREAM OIL ACTIVITIES IN THREE CANADIAN PROVINCES: ALBERTA, SASKATCHEWAN, AND NEWFOUNDLAND AND LABRADOR Page VIII
13.4.5 Petroleum Exploration Enhancement Program (PEEP) . . . . . . . . . . . . . . . . . . . . . . . . . . . . . . . . . . 113
13.4.6 Offshore Seismic Funding Assistance . . . . . . . . . . . . . . . . . . . . . . . . . . . . . . . . . . . . . . . . . . . . . . 113
14. Tax Breaks and Special Taxes-Tax Expenditures . . . . . . . . . . . . . . . . . . . . . . . . . . . . . . . . . . . . . . 114
14.1 Federal-Canada. . . . . . . . . . . . . . . . . . . . . . . . . . . . . . . . . . . . . . . . . . . . . . . . . . . . . . . . . . . . . . . . . . . . . . . . 114
14.1.1 ACCA-Efficient and Renewable Energy Generation Equipment (43.1, 43.2). . . . . . . . . . . . . . . . . . . 114
14.1.2 ACCA-Oil Sands . . . . . . . . . . . . . . . . . . . . . . . . . . . . . . . . . . . . . . . . . . . . . . . . . . . . . . . . . . . . . . 116
14.1.3 CEE, CDE, COGPE . . . . . . . . . . . . . . . . . . . . . . . . . . . . . . . . . . . . . . . . . . . . . . . . . . . . . . . . . . . . 117
14.1.4 Atlantic Canada Investment Tax Credit (AITC) . . . . . . . . . . . . . . . . . . . . . . . . . . . . . . . . . . . . . . . . 118
14.2 Provincial-Alberta . . . . . . . . . . . . . . . . . . . . . . . . . . . . . . . . . . . . . . . . . . . . . . . . . . . . . . . . . . . . . . . . . . . . . . 119
14.2.1 Township 53 . . . . . . . . . . . . . . . . . . . . . . . . . . . . . . . . . . . . . . . . . . . . . . . . . . . . . . . . . . . . . . . . 119
14.2.2 Flow-Through Shares . . . . . . . . . . . . . . . . . . . . . . . . . . . . . . . . . . . . . . . . . . . . . . . . . . . . . . . . . . 120
14.2.3 ACCA . . . . . . . . . . . . . . . . . . . . . . . . . . . . . . . . . . . . . . . . . . . . . . . . . . . . . . . . . . . . . . . . . . . . . 121
14.3 Provincial-Saskatchewan . . . . . . . . . . . . . . . . . . . . . . . . . . . . . . . . . . . . . . . . . . . . . . . . . . . . . . . . . . . . . . . . . 123
14.3.1 Freehold Drilling Incentive . . . . . . . . . . . . . . . . . . . . . . . . . . . . . . . . . . . . . . . . . . . . . . . . . . . . . . 123
14.3.2 Provincial Sales Tax Exemption . . . . . . . . . . . . . . . . . . . . . . . . . . . . . . . . . . . . . . . . . . . . . . . . . . . 124
14.3.3 EOR Tax Exemption . . . . . . . . . . . . . . . . . . . . . . . . . . . . . . . . . . . . . . . . . . . . . . . . . . . . . . . . . . . 125
14.3.4 Flow-Through Shares . . . . . . . . . . . . . . . . . . . . . . . . . . . . . . . . . . . . . . . . . . . . . . . . . . . . . . . . . . 126
14.3.5 Deferred Exploration and Development Expenses . . . . . . . . . . . . . . . . . . . . . . . . . . . . . . . . . . . . . . 127
14.3.6 Fuel Tax Rebate for Mineral Exploration. . . . . . . . . . . . . . . . . . . . . . . . . . . . . . . . . . . . . . . . . . . . . 128
14.3.7 Saskatchewan Petroleum Research Incentive Program . . . . . . . . . . . . . . . . . . . . . . . . . . . . . . . . . . 129
14.4 Provincial–Newfoundland and Labrador . . . . . . . . . . . . . . . . . . . . . . . . . . . . . . . . . . . . . . . . . . . . . . . . . . . . . . 130
14.4.1 PST Exemption on start-up capital and operating expenditures . . . . . . . . . . . . . . . . . . . . . . . . . . . . 130
14.4.2 Fuel Tax Exemption for Offshore Projects . . . . . . . . . . . . . . . . . . . . . . . . . . . . . . . . . . . . . . . . . . . . 130
14.4.3 Fuel Tax Exemption for Onshore Oil Exploration . . . . . . . . . . . . . . . . . . . . . . . . . . . . . . . . . . . . . . . 131
15. Credit Support. . . . . . . . . . . . . . . . . . . . . . . . . . . . . . . . . . . . . . . . . . . . . . . . . . . . . . . . . . . . . . 131
15.1 Provincial-Newfoundland and Labrador . . . . . . . . . . . . . . . . . . . . . . . . . . . . . . . . . . . . . . . . . . . . . . . . . . . . . . 131
15.1.1 Canada-Newfoundland Offshore Development Fund . . . . . . . . . . . . . . . . . . . . . . . . . . . . . . . . . . . . 131
15.1.2 Canada-Newfoundland Offshore Development Fund . . . . . . . . . . . . . . . . . . . . . . . . . . . . . . . . . . . . 132
16. Environmental Issues. . . . . . . . . . . . . . . . . . . . . . . . . . . . . . . . . . . . . . . . . . . . . . . . . . . . . . . . . 132
16.1 Provincial–Alberta . . . . . . . . . . . . . . . . . . . . . . . . . . . . . . . . . . . . . . . . . . . . . . . . . . . . . . . . . . . . . . . . . . . . . . 132
16.1.1 Orphan Well Fund . . . . . . . . . . . . . . . . . . . . . . . . . . . . . . . . . . . . . . . . . . . . . . . . . . . . . . . . . . . . 132
17. Annex 2: Calculation of Tax Deferral from Canadian Development and Exploration Expenses . . . . . 13318. Annex 3: The GEEM computable general equilibrium model . . . . . . . . . . . . . . . . . . . . . . . . . . . . 136About the Authors . . . . . . . . . . . . . . . . . . . . . . . . . . . . . . . . . . . . . . . . . . . . . . . . . . . . . . . . . . . . . . 141
www.globalsubsidies.org
THE GLOBAL SUBSIDIES INITIATIVE FOSSIL FUELS – AT WHAT COST? GOVERNMENT SUPPORT FOR UPSTREAM OIL ACTIVITIES IN THREE CANADIAN PROVINCES: ALBERTA, SASKATCHEWAN, AND NEWFOUNDLAND AND LABRADOR Page 9
ACRONYMS AND ABBREVIATIONSAB AlbertaACCA Accelerated Capital Cost AllowanceAITC Atlantic Canada Investment Tax CreditARTC Alberta Royalty Tax CreditASCM Agreement on Subsidies and Countervailing MeasuresBC British ColumbiaBRIK Bitumen Royalty In KindBTD balance of trade deficitCAPP Canadian Association of Petroleum ProducersCCA capital cost allowanceCCDE Cumulative Canadian Development ExpenseCCEE Cumulative Canadian Exploration ExpenseCCPC Canadian-controlled private corporationsCCS carbon capture and storageCCT Corporation Capital TaxCDE Canadian Development ExpenseCEE Canadian Exploration ExpenseCGE computable general equilibriumCHOPS Cold Heavy Oil Production with SandC-NLOPB Canada-Newfoundland and Labrador Offshore Petroleum BoardCO2 carbon dioxideCOGPE Canadian Oil and Gas Property ExpenseCPI Consumer Price IndexCRA Canada Revenue AgencyCRCE Canadian Renewable and Conservation ExpenseEOR enhanced oil recoveryEUB Energy Utility BoardFTS flow-through sharesGAMS General Algebraic Modeling SystemGDP gross domestic productGEEM General Equilibrium and Emissions ModelGHG greenhouse gasGSI Global Subsidies Initiative IETP Innovative Energy Technologies ProgramIOSTAC Industry Oil Sands Tenure Advisory CommitteeISEEE Institute for Sustainable Energy, Environment and Economy (University of Calgary)ITC income tax creditm3 cubic metresMOP monthly oil productionMT million tonnesNFL Newfoundland and LabradorNRCan Natural Resources Canada
www.globalsubsidies.org
THE GLOBAL SUBSIDIES INITIATIVE FOSSIL FUELS – AT WHAT COST? GOVERNMENT SUPPORT FOR UPSTREAM OIL ACTIVITIES IN THREE CANADIAN PROVINCES: ALBERTA, SASKATCHEWAN, AND NEWFOUNDLAND AND LABRADOR Page 10
NRF New Royalty FrameworkOAG Office of the Auditor General of CanadaOECD Organisation for Economic Co-Operation and DevelopmentOERD Office of Energy Research and DevelopmentOPEC Organization of Petroleum Exporting CountriesPEEP Petroleum Exploration Enhancement ProgramPERD Program of Energy Research and DevelopmentPIP Petroleum Incentive PaymentsPRTC Petroleum Technology Research CentrePST Provincial Sales TaxPTF Production Tax FactorR&D research and developmentRCIT Royalty Credit for Individuals and TrustsRTR Royalty Tax RebateSCO synthetic crude oilSK SaskatchewanSPRI Saskatchewan Petroleum Research IncentiveSRC Saskatchewan Resource CreditSR&ED Scientific Research and Experimental DevelopmentStatCan Statistics CanadaTRA Tax and Revenue AdministrationTO Transitional OfferUS United StatesWTI West Texas IntermediateWTO World Trade Organization
www.globalsubsidies.org
THE GLOBAL SUBSIDIES INITIATIVE FOSSIL FUELS – AT WHAT COST? GOVERNMENT SUPPORT FOR UPSTREAM OIL ACTIVITIES IN THREE CANADIAN PROVINCES: ALBERTA, SASKATCHEWAN, AND NEWFOUNDLAND AND LABRADOR Page 11
1. EXECUTIVE SUMMARY
EnviroEconomics, under contract to the International Institute for Sustainable Development, presents in thisreport up-to-date estimates of Canada’s subsidies to the oil sector in three Canadian provinces, namely Alberta,Saskatchewan and Newfoundland and Labrador, and the federal government. The focus of the study is onproduction, and more specifically on oil exploration, development and extraction, including upgraders. Thereport is organized around three core questions:
1. What are the subsidy policies for oil production in Alberta, Saskatchewan and Newfoundland,including federal subsidies? This first question required an in-depth review of the subsidy regimes inplace in the four jurisdictions.
2. Who is benefiting from these subsidies, including the value transfer between producers andgovernment? To address this second question, we value the subsidies and aggregate the variouspolicies into an estimate of subsidy.
3. What are the environmental and economic outcomes of these subsidies? To answer this question, weadopt two approaches: (1) facility-level modelling to determine the impact on financial performance;and (2) macroeconomic modelling to estimate economic, environmental and social outcomes.
This report does not provide recommendations for subsidy reform, nor does it seek to judge whether somesubsidies are “good” or if other subsidies are “bad.” Instead, through exploring the three questions above,we reveal the extent of oil subsidies to production in the majority of production in Canada (97 per cent) andthen explore what these subsidies imply for a range of economic and emission outcomes.
Of course many will not be happy with our results. And indeed we expect some push-back from industry,governments and the environmental community. This will likely stem from differences in the definition ofsubsidy. Generally, existence and extent of subsidies varies according to viewpoint, with two competingextremes defining the spectrum:
• An environmental view treats any benefit to the oil sector as a subsidy, regardless of whether or notthey are available to other economic sectors. Under this view, taxes are low or not collected, royalty andland lease payments are set well below the value of the oil in the ground, and environmental servicesare provided for free. Oil prices therefore misrepresent the societal cost of a barrel of oil extracted,leading to higher activity levels and more environmental degradation. Here, any subsidy is unacceptable,and through subsidy reform, the costs of oil extraction need to rise to reflect the social cost.
• A development view by contrast, favoured by industry and to some extent governments, is one wherecompetitiveness is maintained through keeping taxes and royalty payments low to keep investmentactivity levels high. Under this view there are no subsidies. Instead, incentives and programs aredesigned to make the sector more competitive relative to other jurisdictions thereby attractinginvestment and keeping activity levels high.
Much of the debate and conjecture on the existence of oil subsidies to producers in Canada can be traced tothese two views. It is no wonder the debate continues when bounded by two such extremes.
In this review, we adopt a definition of subsidy that to some extent balances the two extremes outlined above.This study uses a definition of “subsidy” based on the World Trade Organization’s (WTO) Agreement onSubsidies and Countervailing Measures (ASCM), which is agreed by 153 countries, including Canada. UnderArticle 1: Definition of a Subsidy, the ASCM determines that four types of subsidies exist, where government:
www.globalsubsidies.org
THE GLOBAL SUBSIDIES INITIATIVE FOSSIL FUELS – AT WHAT COST? GOVERNMENT SUPPORT FOR UPSTREAM OIL ACTIVITIES IN THREE CANADIAN PROVINCES: ALBERTA, SASKATCHEWAN, AND NEWFOUNDLAND AND LABRADOR Page 12
1. Provides direct transfer of funds or potential direct transfer of funds or liabilities,
2. Revenue is foregone or not collected,
3. Provides goods or services or purchases goods,
4. Provides income or price support.
The ASCM definition excludes environmental externalities such as air or water pollution.
The ASCM also requires that a subsidy be specific to an enterprise, industry, or group of enterprises or industriesunder Article 2. So although in some cases government support is offered to more than one sector, it can stillbe considered a subsidy for the purposes of this study if, for example, it is offered only to the oil and gassectors, or if the oil sector disproportionately benefits from the support. The Atlantic Investment Tax Credit isan example of a disproportionate benefit, as it is available to resource sectors, but is overwhelmingly utilizedby the oil and gas sector. The scope of the study also includes subsidies for carbon capture and storage.
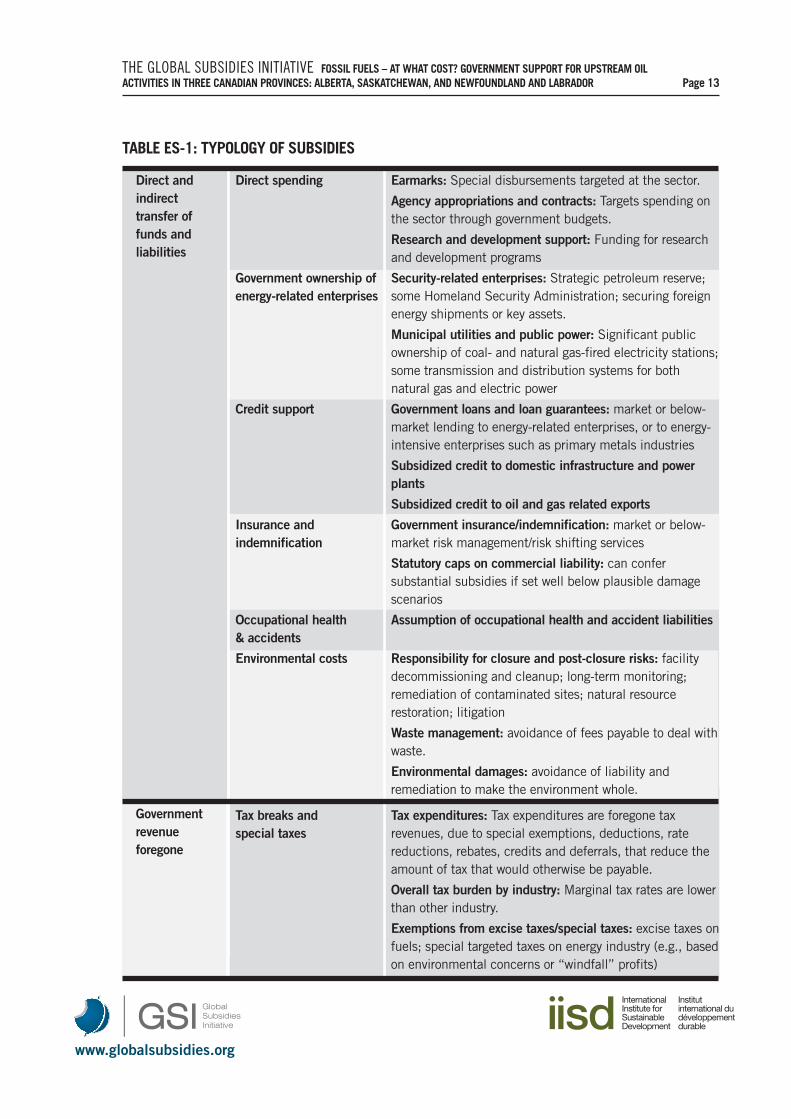
Based on the ACSM list above, GSI developed sub-categories of subsidies that form the framework foridentifying subsidies in the oil sector in Canada (Table ES-1). These are not all necessarily relevant to the oilsector in Canada, as this study will reveal, but rather forms a comprehensive framework for identifying andanalyzing subsidies in any country. This framework provides the basis for the GSI’s series of country casestudies to identify and quantify subsidies to upstream oil and gas activities.
Royalties and lease payments are an interesting case within this definition. These are important mechanismsto share the value (economic rent) of the Crown oil resource value with industry. In theory, royalties and landleases should reflect the value of the oil in the ground, less returns to investment capital and risk, but inpractice there is no benchmark value for which to set the appropriate level of royalty and there remain manyuncertainties to this value (for example, what volume will be produced and what the oil price will be). To theextent that the royalty and land-lease mechanisms do not capture for government the full “economic rent” ofthe resource, then a subsidy is most likely conferred. The challenge with this approach, that of defining asubsidy based on a benchmark resource rent value, is establishing just what that benchmark should be, andthen determining how the royalty payment differs from that benchmark. We have not, in this report, gonedown this road due to issues of project scope and methodological challenge. Future work could look at thisissue as the value of resource rent is large compared to the current incentive programs offered.
What we have done, however, is identify royalty relief programs that reduce the quantity of royalties paid.These incentives are differentiated at sub-segments of the oil production sector to either incentivize newdrilling or make high-cost oil recovery more economic. As such, they are not generally available and thereforemeet our subsidy definition. One could also argue that the royalty levels have been set by governments tomeet their objectives on sharing resource rents, and to the extent royalty relief exists, it represents an implicitsubsidy to the sector. Of course, the development view would argue that royalty relief is a reaction to economiccircumstances and a necessary adjustment to maintain the competitiveness of the sector.
www.globalsubsidies.org
THE GLOBAL SUBSIDIES INITIATIVE FOSSIL FUELS – AT WHAT COST? GOVERNMENT SUPPORT FOR UPSTREAM OIL ACTIVITIES IN THREE CANADIAN PROVINCES: ALBERTA, SASKATCHEWAN, AND NEWFOUNDLAND AND LABRADOR Page 13
TABLE ES-1: TYPOLOGY OF SUBSIDIES
Direct andindirecttransfer offunds andliabilities
Governmentrevenueforegone
Direct spending Earmarks: Special disbursements targeted at the sector.
Agency appropriations and contracts: Targets spending onthe sector through government budgets.
Research and development support: Funding for researchand development programs
Government ownership of Security-related enterprises: Strategic petroleum reserve; energy-related enterprises some Homeland Security Administration; securing foreign
energy shipments or key assets.
Municipal utilities and public power: Significant publicownership of coal- and natural gas-fired electricity stations;some transmission and distribution systems for bothnatural gas and electric power
Credit support Government loans and loan guarantees: market or below-market lending to energy-related enterprises, or to energy-intensive enterprises such as primary metals industries
Subsidized credit to domestic infrastructure and powerplants
Subsidized credit to oil and gas related exports
Insurance and Government insurance/indemnification: market or below-indemnification market risk management/risk shifting services
Statutory caps on commercial liability: can confersubstantial subsidies if set well below plausible damagescenarios
Occupational health Assumption of occupational health and accident liabilities& accidents
Environmental costs Responsibility for closure and post-closure risks: facilitydecommissioning and cleanup; long-term monitoring;remediation of contaminated sites; natural resourcerestoration; litigation
Waste management: avoidance of fees payable to deal withwaste.
Environmental damages: avoidance of liability andremediation to make the environment whole.
Tax breaks and Tax expenditures: Tax expenditures are foregone tax special taxes revenues, due to special exemptions, deductions, rate
reductions, rebates, credits and deferrals, that reduce theamount of tax that would otherwise be payable.
Overall tax burden by industry: Marginal tax rates are lowerthan other industry.
Exemptions from excise taxes/special taxes: excise taxes onfuels; special targeted taxes on energy industry (e.g., basedon environmental concerns or “windfall” profits)

www.globalsubsidies.org
THE GLOBAL SUBSIDIES INITIATIVE FOSSIL FUELS – AT WHAT COST? GOVERNMENT SUPPORT FOR UPSTREAM OIL ACTIVITIES IN THREE CANADIAN PROVINCES: ALBERTA, SASKATCHEWAN, AND NEWFOUNDLAND AND LABRADOR Page 14
TABLE ES-1: TYPOLOGY OF SUBSIDIES (CONTINUED)
Provision ofgoods orservices belowmarket value
Income or pricesupport
Government-owned Process for mineral leasing: auctions for larger sites; sole-energy minerals source for many smaller sites
Royalty relief or reductions in other taxes due onextraction: reduced, delayed or eliminated royalties arecommon at both national and sub-national levels. Royaltiestargeted based on type of energy, type of formation,geography or location of reserve (e.g., deep water).
Process of paying royalties due: allowable methods toestimate and pay public owners for energy mineralsextracted from public lands
Government-owned Access to government-owned natural resources land: at no natural resources or land charge or for below fair-market rate
Government-owned Use of government-provided infrastructure: at no charge or infrastructure below fair-market rate
Government procurement Government purchase of goods or services for above-market rates
Government-provided Government-provided goods or services at below-market goods or services rates
Market price support Consumption mandates: fixed consumption shares for total and regulation energy use.
Border protection or restrictions: controls on imports orexports leading to unfair advantages.
Regulatory loopholes: any legal loopholes, either in thewording of the statute or in its enforcement, that transferssignificant market advantage and financial return toparticular energy market participants
Regulated prices set at below-market rates: for consumers(including where there is no financial contribution bygovernment)
Regulated prices set at above-market rates: includinggovernment regulations or import barriers
www.globalsubsidies.org
THE GLOBAL SUBSIDIES INITIATIVE FOSSIL FUELS – AT WHAT COST? GOVERNMENT SUPPORT FOR UPSTREAM OIL ACTIVITIES IN THREE CANADIAN PROVINCES: ALBERTA, SASKATCHEWAN, AND NEWFOUNDLAND AND LABRADOR Page 15
Results Both federal and provincial governments have made some progress in phasing out subsidies such asaccelerated capital costs allowances; however, new subsidies have also emerged in an attempt to provideincentive to access more oil from high-cost resources. In total, this study estimates that provincial and federalgovernments are providing over $2.8 billion in subsidies to the oil sector in Alberta, Saskatchewan and offshoreNewfoundland and Labrador. These three jurisdictions account for more than 97 per cent of oil productionwithin Canada and so this study provides a comprehensive subsidy estimate.
This study identified a total of 63 subsidy programs targeted at the oil industry in the jurisdictions; 18 inAlberta, 19 in Saskatchewan, nine in Newfoundland and Labrador and 17 at the federal level. Most of thesesubsidies seek to increase exploration and development activity, with a focus on reducing the costs ofexploration, drilling and development through a mix of tax breaks and royalty reductions. Developmentsubsidies primarily directed at encouraging companies to bring new oil resources into production comprised59 per cent of total subsidies ($1.68 billion). These subsidies typically reduce capital expenditures throughaccelerated write-offs, tax credits, royalty reductions or allowances. Subsidies to support exploration, drilling,operations and research and technology comprised the remaining share of subsidies in about equal proportion.
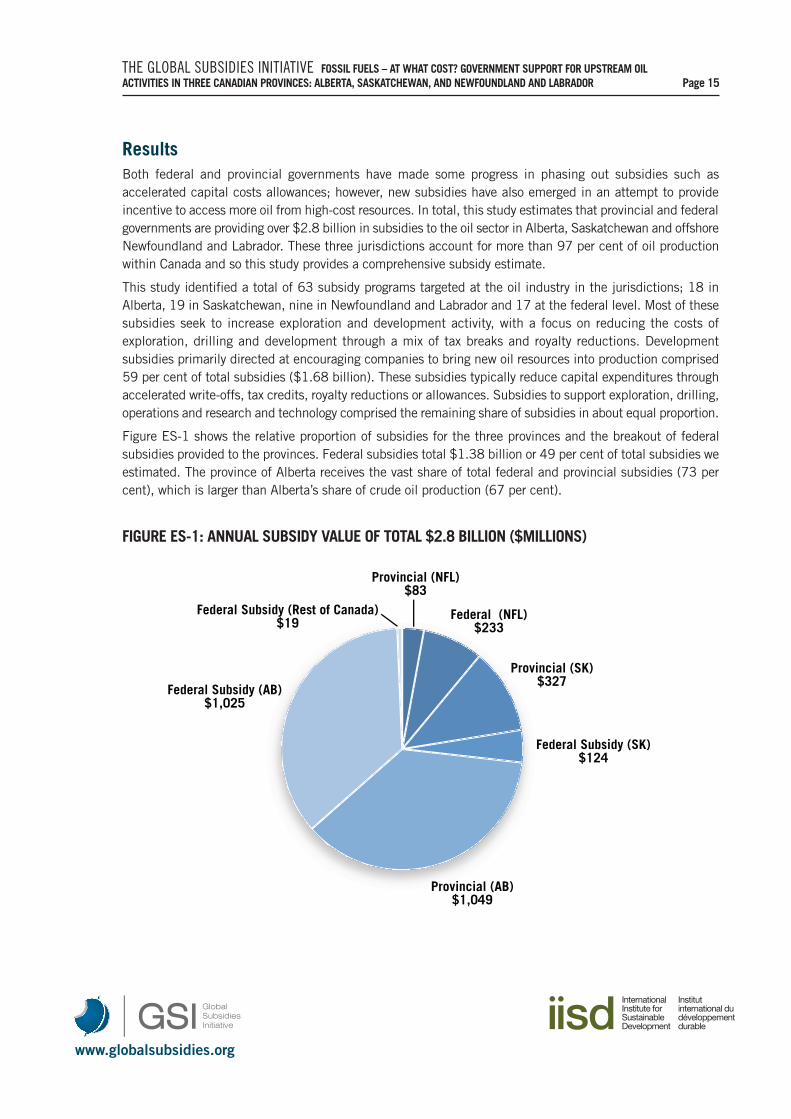
Figure ES-1 shows the relative proportion of subsidies for the three provinces and the breakout of federalsubsidies provided to the provinces. Federal subsidies total $1.38 billion or 49 per cent of total subsidies weestimated. The province of Alberta receives the vast share of total federal and provincial subsidies (73 percent), which is larger than Alberta’s share of crude oil production (67 per cent).
FIGURE ES-1: ANNUAL SUBSIDY VALUE OF TOTAL $2.8 BILLION ($MILLIONS)
Federal Subsidy (Rest of Canada)$19
Federal Subsidy (AB)$1,025
Provincial (AB)$1,049
Federal Subsidy (SK)$124
Provincial (SK)$327
Federal (NFL)$233
Provincial (NFL)$83
www.globalsubsidies.org
THE GLOBAL SUBSIDIES INITIATIVE FOSSIL FUELS – AT WHAT COST? GOVERNMENT SUPPORT FOR UPSTREAM OIL ACTIVITIES IN THREE CANADIAN PROVINCES: ALBERTA, SASKATCHEWAN, AND NEWFOUNDLAND AND LABRADOR Page 16
In terms of the types of subsidies that are prevalent, the federal government and Government of Newfoundlandand Labrador favour tax expenditures (83 per cent of federal subsidies, 63 per cent of Newfoundland andLabrador), while Saskatchewan favours royalty relief or reductions in other taxes (78 per cent of Saskatchewansubsidies). Alberta has a larger mix of different types of subsidies with royalty relief (46 per cent) and taxbreaks (25 per cent) comprising the largest proportion of total subsidies.
On average, across Canada, the subsidy as a share of average production value is estimated to be about 5.2per cent. The subsidy as a share of production is highest in Alberta (5.7 per cent) and lowest in Newfoundlandand Labrador (3.7 per cent). This is consistent with the cost of production, which is also highest in Albertaand lowest in Newfoundland and Labrador. Subsidies as a percentage of the total transfers to government,including taxes, royalties and Crown land sales, were 5.3 per cent on average across Canada, with a high of7 per cent in Alberta and a low of 5.2 per cent in Saskatchewan.
An analysis of the financial implications of subsidies to well drilling in Saskatchewan found that subsidies toencourage the development of new oil wells were significant. The average subsidy level to produce new wellswas found to be $139,000 per well or $143 per m3 produced. This subsidy level represents approximately27 per cent of the estimated future value of production from these wells, although the full tax implicationsof these subsidies were not estimated. Subsidies provided for production in Saskatchewan were found to bemuch smaller and estimated to be only $0.22 per m3 produced.
Unique relative to past subsidy work in Canada is the exploration of the impacts of oil sector subsidies onemission and economic outcomes. We use an economy-wide macroeconomic model with royalty andcorporate tax interactions to determine the impact of the subsidies on production and emissions. We forecasteconomic activity and emissions nationally and by region as well as oil production to 2020, and then estimatehow the $2.8 billion of subsidies identified in this report alter oil production, the associated linked economicactivity and emissions. This future-looking analysis allows us to capture the longer-term impacts of thesubsidies on new capital deployment and production. Note, that our modelling is stylized and providesindicative results. Nevertheless the analysis helps one think about the policy trade-offs of the current practiceof subsidizing the sector.
With the equivalent of $2.8 billion in current dollars incentivizing future oil production, we identify thefollowing implications attributable to the subsidy:
• The current subsidies have a slight positive impact on economic activity. The largest impacts are foundin Alberta where the size of the total economy (i.e., GDP) is about 0.16 per cent larger in 2020 becauseof the subsidies identified in this report. This in effect increases the annual GDP growth rate in 2020from about 1.64 per cent to 1.8 per cent. This has a marginal effect on the size of the total Albertaeconomy, which is projected to be 27 per cent bigger in 2020 than it is today.
• Subsidies to the oil sector are increasing the level of production. The impact of the subsidies on themarginal producer of oil is important. With subsidies in place, oil production nationally is projected tobe in the order of 5 per cent larger in 2020, with a range of 0.3 per cent increase in Newfoundlandand Labrador and a high of 6 per cent in Alberta. In 2020 the sector will be about twice as large as itwas in 2005 with or without subsidies, which implies the subsidies influence growth in the sector butare not a major determinant.
www.globalsubsidies.org
THE GLOBAL SUBSIDIES INITIATIVE FOSSIL FUELS – AT WHAT COST? GOVERNMENT SUPPORT FOR UPSTREAM OIL ACTIVITIES IN THREE CANADIAN PROVINCES: ALBERTA, SASKATCHEWAN, AND NEWFOUNDLAND AND LABRADOR Page 17
• Net exports are fuelled by subsidies. Subsidies are contributing to oil exports, which in turn generateforeign exchange. Our results indicate that net exports in oil (or the oil trade surplus) increases about14 per cent nationally with the subsidies in place.
• The employment benefit of the subsidies is questionable.While the economy does expand with the oilsubsidies in place, most of this happens in the capital-intensive oil sector. The impacts on totalemployment are therefore negligible.
• Government balances are lower even with higher corporate taxes and royalty payments. While theincreased economic activity due to the subsidies does increase corporate taxes and royalties paid,labour taxes are likely lower due to the spending in the capital intensive oil sector. More significantly,major subsidy outlays are relatively large. Government balances therefore are worse off with thesubsidies: the federal government is lower by 1 per cent, Alberta by 5 per cent, and Saskatchewan by4 per cent. A small increase is observed in Newfoundland and Labrador budget, where the federalsubsidy infusion creates more activity and revenue while not being offset by provincial subsidies paid.
• Subsidies drive production and hence more emissions.Nationally, emissions are about 2 per cent higherin 2020 with the subsidies. In Alberta, the likely increase in emissions attributable to the subsidies islarge, with about 5 per cent more provincial emissions than if the subsidies were removed.
• Non-conventional production is experiencing the greatest benefit from the subsidies, followed by newdrilling. With targeted programs for the oil sands, as well as a large share of total production, the oilsands are disproportionally benefiting. Our assessment indicates that the subsidies are adding 6 percent to 7 per cent more production to the sector and about 12 per cent more emissions. Most of thetargeted programs are for more exploration activity and drilling in the provinces.
Perhaps most interesting is the risk of a growing subsidy obligation on governments. With oil productionpredicted to more than double between now and 2020, with or without the subsidies in place, the share ofsubsidy relative to overall government expenditures could grow. In our simple modelling, scaling up currentsubsidies to future production more than doubles the subsidy as a share of government expenditures. Asmentioned above, government balances are then worse off as the tax and royalty increases are more thanoffset by the subsidies paid. This points to a government balances risk through providing incentive programsto a rapidly expanding sector.
Finally, an important area for future work is to examine how the subsidy revenue could be recycled. Given thesize of current government spending on subsidies to the oil sector, redirecting subsidy revenue to reducecorporate and income taxes, pay off debt, or increase the size of government spending, would all have verydifferent efficiency implications.

www.globalsubsidies.org
THE GLOBAL SUBSIDIES INITIATIVE FOSSIL FUELS – AT WHAT COST? GOVERNMENT SUPPORT FOR UPSTREAM OIL ACTIVITIES IN THREE CANADIAN PROVINCES: ALBERTA, SASKATCHEWAN, AND NEWFOUNDLAND AND LABRADOR Page 18
1.1 SCOPE OF THE STUDY
This report has a fairly narrow scope:
• We focus on upstream oil production, and do not look at natural gas or coal, or other forms of energysuch as biomass or renewables;
• Upstream activities are defined as exploration, development, production, upgrading, thereby excludingrefining, storage, transportation, distribution and retail;
• This means we do not focus on subsidies to consumption; and
• The study is focused on four jurisdictions in Canada: the federal government, Alberta, Saskatchewan,and Newfoundland and Labrador, thereby excluding the rest of Canada.
International comparisons are not made, and benchmarking of subsidy levels is not conducted. Instead, thisreport identifies, monetizes and then discusses the implications of the subsidies on a number of importantoutcomes, such as economic activity and emissions.
Finally, the report is focused on current subsidies provided by the four jurisdictions, and does not look to thepast to quantify the level of subsidy. All values are in 2009 dollars, and where possible, attributed to thesubsidy in 2008 on an annualized basis.
www.globalsubsidies.org
THE GLOBAL SUBSIDIES INITIATIVE FOSSIL FUELS – AT WHAT COST? GOVERNMENT SUPPORT FOR UPSTREAM OIL ACTIVITIES IN THREE CANADIAN PROVINCES: ALBERTA, SASKATCHEWAN, AND NEWFOUNDLAND AND LABRADOR Page 19
2. OVERVIEW OF THE OIL SUPPLY SECTOR
2.1 PHYSICAL CHARACTERISTICS IN CANADA
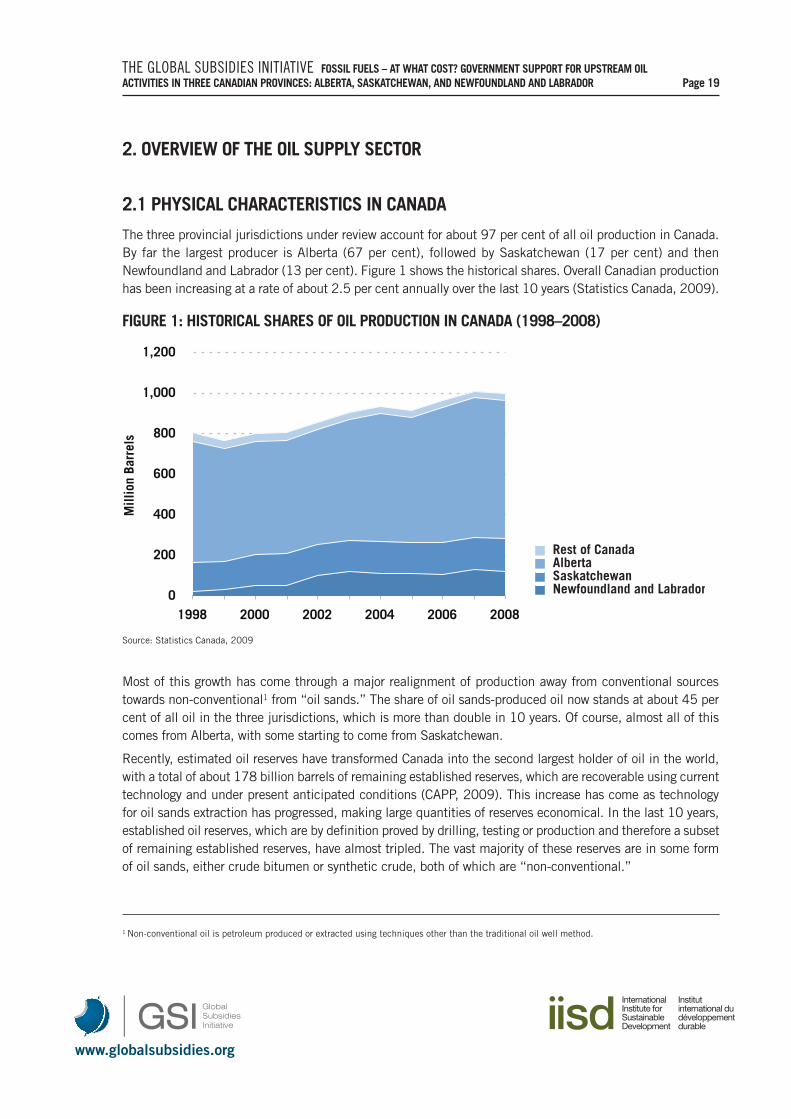
The three provincial jurisdictions under review account for about 97 per cent of all oil production in Canada.By far the largest producer is Alberta (67 per cent), followed by Saskatchewan (17 per cent) and thenNewfoundland and Labrador (13 per cent). Figure 1 shows the historical shares. Overall Canadian productionhas been increasing at a rate of about 2.5 per cent annually over the last 10 years (Statistics Canada, 2009).
Most of this growth has come through a major realignment of production away from conventional sourcestowards non-conventional1 from “oil sands.” The share of oil sands-produced oil now stands at about 45 percent of all oil in the three jurisdictions, which is more than double in 10 years. Of course, almost all of thiscomes from Alberta, with some starting to come from Saskatchewan.
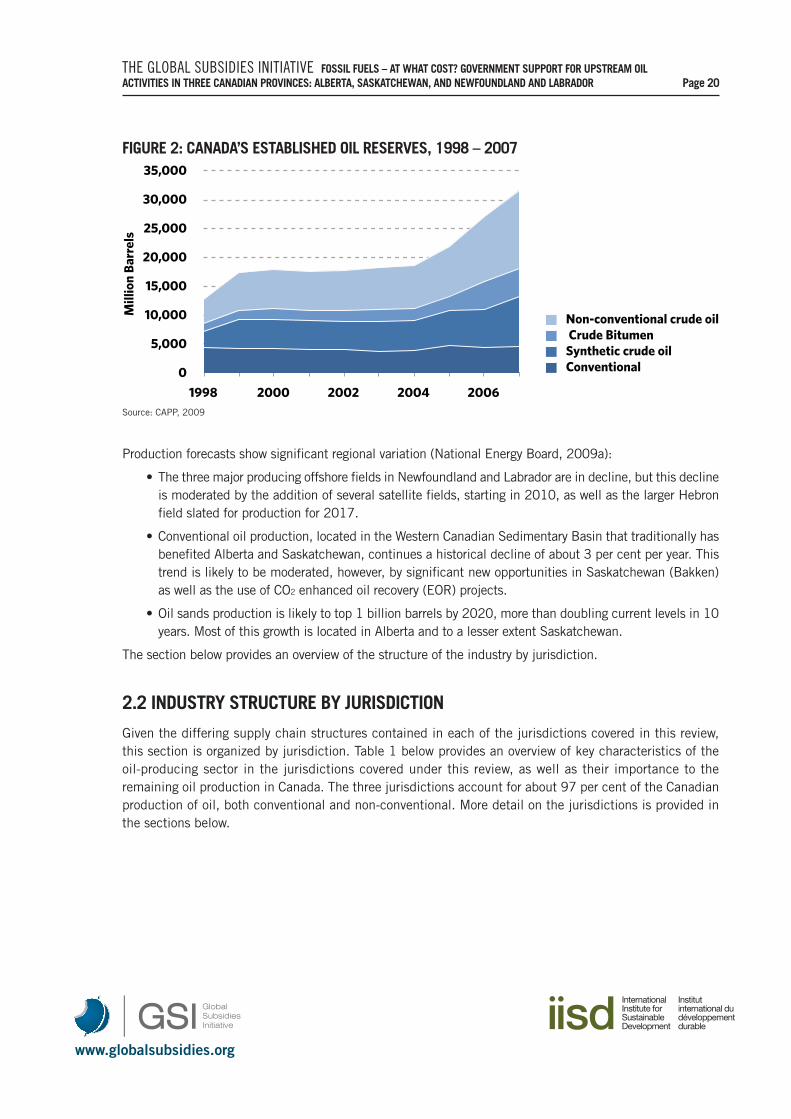
Recently, estimated oil reserves have transformed Canada into the second largest holder of oil in the world,with a total of about 178 billion barrels of remaining established reserves, which are recoverable using currenttechnology and under present anticipated conditions (CAPP, 2009). This increase has come as technologyfor oil sands extraction has progressed, making large quantities of reserves economical. In the last 10 years,established oil reserves, which are by definition proved by drilling, testing or production and therefore a subsetof remaining established reserves, have almost tripled. The vast majority of these reserves are in some formof oil sands, either crude bitumen or synthetic crude, both of which are “non-conventional.”
1 Non-conventional oil is petroleum produced or extracted using techniques other than the traditional oil well method.
0
200
400
600
800
1,000
1,200
1998 2000 2002 2004 2006 2008
Mill
ion
Barr
els
Newfoundland and LabradorSaskatchewanAlberta Rest of Canada
FIGURE 1: HISTORICAL SHARES OF OIL PRODUCTION IN CANADA (1998–2008)
Source: Statistics Canada, 2009
www.globalsubsidies.org
THE GLOBAL SUBSIDIES INITIATIVE FOSSIL FUELS – AT WHAT COST? GOVERNMENT SUPPORT FOR UPSTREAM OIL ACTIVITIES IN THREE CANADIAN PROVINCES: ALBERTA, SASKATCHEWAN, AND NEWFOUNDLAND AND LABRADOR Page 20
0
5,000
10,000
15,000
20,000
25,000
30,000
35,000
1998 2000 2002 2004 2006
M
illio
n Ba
rrel
s
Conventional Synthetic crude oil Crude Bitumen Non-conventional crude oil
FIGURE 2: CANADA’S ESTABLISHED OIL RESERVES, 1998 – 2007
Source: CAPP, 2009
Production forecasts show significant regional variation (National Energy Board, 2009a):
• The three major producing offshore fields in Newfoundland and Labrador are in decline, but this declineis moderated by the addition of several satellite fields, starting in 2010, as well as the larger Hebronfield slated for production for 2017.
• Conventional oil production, located in the Western Canadian Sedimentary Basin that traditionally hasbenefited Alberta and Saskatchewan, continues a historical decline of about 3 per cent per year. Thistrend is likely to be moderated, however, by significant new opportunities in Saskatchewan (Bakken)as well as the use of CO2 enhanced oil recovery (EOR) projects.
• Oil sands production is likely to top 1 billion barrels by 2020, more than doubling current levels in 10years. Most of this growth is located in Alberta and to a lesser extent Saskatchewan.
The section below provides an overview of the structure of the industry by jurisdiction.
2.2 INDUSTRY STRUCTURE BY JURISDICTION
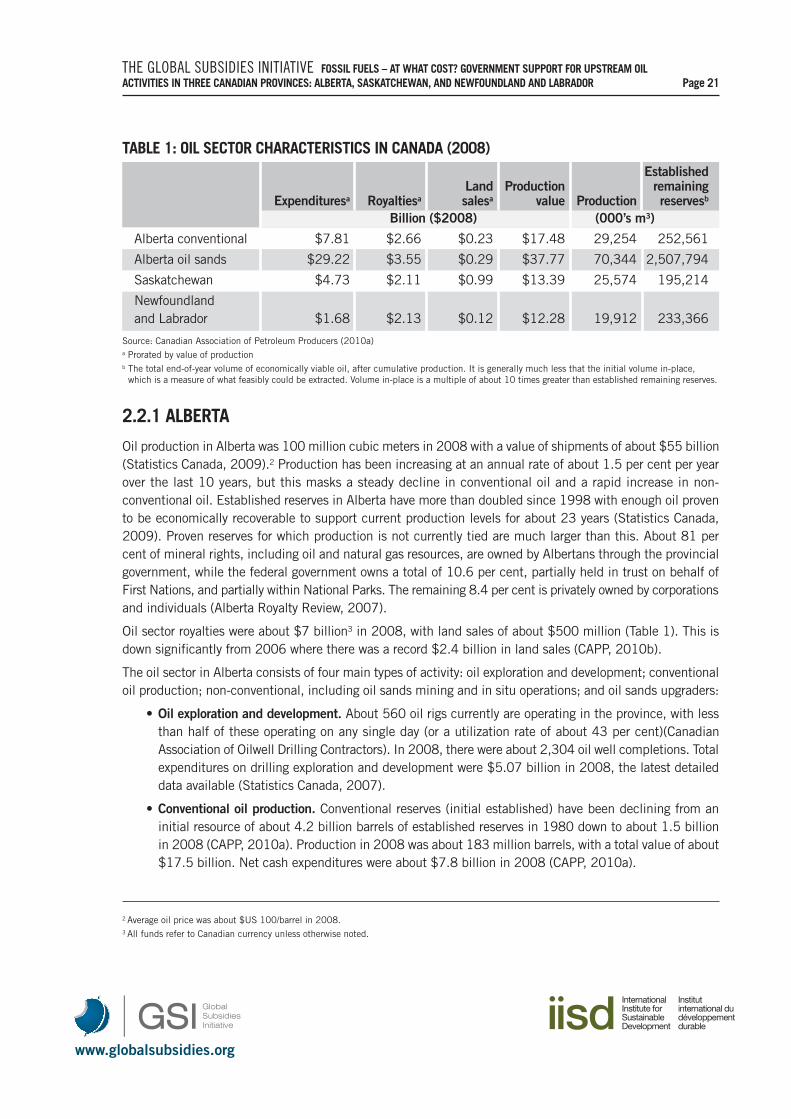
Given the differing supply chain structures contained in each of the jurisdictions covered in this review,this section is organized by jurisdiction. Table 1 below provides an overview of key characteristics of theoil-producing sector in the jurisdictions covered under this review, as well as their importance to theremaining oil production in Canada. The three jurisdictions account for about 97 per cent of the Canadianproduction of oil, both conventional and non-conventional. More detail on the jurisdictions is provided inthe sections below.
www.globalsubsidies.org
THE GLOBAL SUBSIDIES INITIATIVE FOSSIL FUELS – AT WHAT COST? GOVERNMENT SUPPORT FOR UPSTREAM OIL ACTIVITIES IN THREE CANADIAN PROVINCES: ALBERTA, SASKATCHEWAN, AND NEWFOUNDLAND AND LABRADOR Page 21
TABLE 1: OIL SECTOR CHARACTERISTICS IN CANADA (2008)Established
Land Production remainingExpendituresa Royaltiesa salesa value Production reservesb
Billion ($2008) (000’s m3)
Alberta conventional $7.81 $2.66 $0.23 $17.48 29,254 252,561
Alberta oil sands $29.22 $3.55 $0.29 $37.77 70,344 2,507,794
Saskatchewan $4.73 $2.11 $0.99 $13.39 25,574 195,214
Newfoundland and Labrador $1.68 $2.13 $0.12 $12.28 19,912 233,366
Source: Canadian Association of Petroleum Producers (2010a)a Prorated by value of productionb The total end-of-year volume of economically viable oil, after cumulative production. It is generally much less that the initial volume in-place,which is a measure of what feasibly could be extracted. Volume in-place is a multiple of about 10 times greater than established remaining reserves.
2.2.1 ALBERTA
Oil production in Alberta was 100 million cubic meters in 2008 with a value of shipments of about $55 billion(Statistics Canada, 2009).2 Production has been increasing at an annual rate of about 1.5 per cent per yearover the last 10 years, but this masks a steady decline in conventional oil and a rapid increase in non-conventional oil. Established reserves in Alberta have more than doubled since 1998 with enough oil provento be economically recoverable to support current production levels for about 23 years (Statistics Canada,2009). Proven reserves for which production is not currently tied are much larger than this. About 81 percent of mineral rights, including oil and natural gas resources, are owned by Albertans through the provincialgovernment, while the federal government owns a total of 10.6 per cent, partially held in trust on behalf ofFirst Nations, and partially within National Parks. The remaining 8.4 per cent is privately owned by corporationsand individuals (Alberta Royalty Review, 2007).
Oil sector royalties were about $7 billion3 in 2008, with land sales of about $500 million (Table 1). This isdown significantly from 2006 where there was a record $2.4 billion in land sales (CAPP, 2010b).
The oil sector in Alberta consists of four main types of activity: oil exploration and development; conventionaloil production; non-conventional, including oil sands mining and in situ operations; and oil sands upgraders:
• Oil exploration and development. About 560 oil rigs currently are operating in the province, with lessthan half of these operating on any single day (or a utilization rate of about 43 per cent)(CanadianAssociation of Oilwell Drilling Contractors). In 2008, there were about 2,304 oil well completions. Totalexpenditures on drilling exploration and development were $5.07 billion in 2008, the latest detaileddata available (Statistics Canada, 2007).
• Conventional oil production. Conventional reserves (initial established) have been declining from aninitial resource of about 4.2 billion barrels of established reserves in 1980 down to about 1.5 billionin 2008 (CAPP, 2010a). Production in 2008 was about 183 million barrels, with a total value of about$17.5 billion. Net cash expenditures were about $7.8 billion in 2008 (CAPP, 2010a).
2 Average oil price was about $US 100/barrel in 2008. 3 All funds refer to Canadian currency unless otherwise noted.
www.globalsubsidies.org
THE GLOBAL SUBSIDIES INITIATIVE FOSSIL FUELS – AT WHAT COST? GOVERNMENT SUPPORT FOR UPSTREAM OIL ACTIVITIES IN THREE CANADIAN PROVINCES: ALBERTA, SASKATCHEWAN, AND NEWFOUNDLAND AND LABRADOR Page 22
0
100
200
300
400
500
600
700
1989 1992 1995 1998 2001 2004 2007
M
illio
n Ba
rrel
s
Heavy crude oil Light and medium crude oil Synthetic crude oil Crude bitumen Pentanes plus
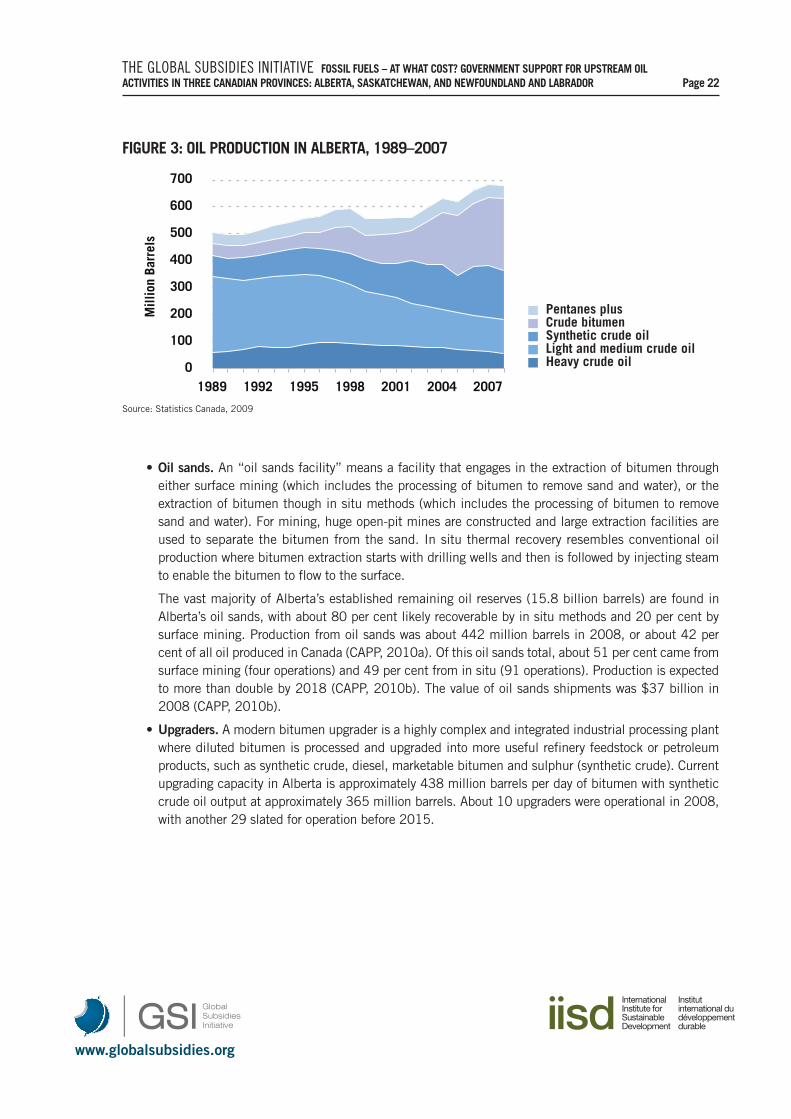
• Oil sands. An “oil sands facility” means a facility that engages in the extraction of bitumen througheither surface mining (which includes the processing of bitumen to remove sand and water), or theextraction of bitumen though in situ methods (which includes the processing of bitumen to removesand and water). For mining, huge open-pit mines are constructed and large extraction facilities areused to separate the bitumen from the sand. In situ thermal recovery resembles conventional oilproduction where bitumen extraction starts with drilling wells and then is followed by injecting steamto enable the bitumen to flow to the surface.
The vast majority of Alberta’s established remaining oil reserves (15.8 billion barrels) are found inAlberta’s oil sands, with about 80 per cent likely recoverable by in situ methods and 20 per cent bysurface mining. Production from oil sands was about 442 million barrels in 2008, or about 42 percent of all oil produced in Canada (CAPP, 2010a).�Of this oil sands total, about 51 per cent came fromsurface mining (four operations) and 49 per cent from in situ (91 operations). Production is expectedto more than double by 2018 (CAPP, 2010b). The value of oil sands shipments was $37 billion in2008 (CAPP, 2010b).
• Upgraders. A modern bitumen upgrader is a highly complex and integrated industrial processing plantwhere diluted bitumen is processed and upgraded into more useful refinery feedstock or petroleumproducts, such as synthetic crude, diesel, marketable bitumen and sulphur (synthetic crude). Currentupgrading capacity in Alberta is approximately 438 million barrels per day of bitumen with syntheticcrude oil output at approximately 365 million barrels. About 10 upgraders were operational in 2008,with another 29 slated for operation before 2015.
FIGURE 3: OIL PRODUCTION IN ALBERTA, 1989–2007
Source: Statistics Canada, 2009
www.globalsubsidies.org
THE GLOBAL SUBSIDIES INITIATIVE FOSSIL FUELS – AT WHAT COST? GOVERNMENT SUPPORT FOR UPSTREAM OIL ACTIVITIES IN THREE CANADIAN PROVINCES: ALBERTA, SASKATCHEWAN, AND NEWFOUNDLAND AND LABRADOR Page 23
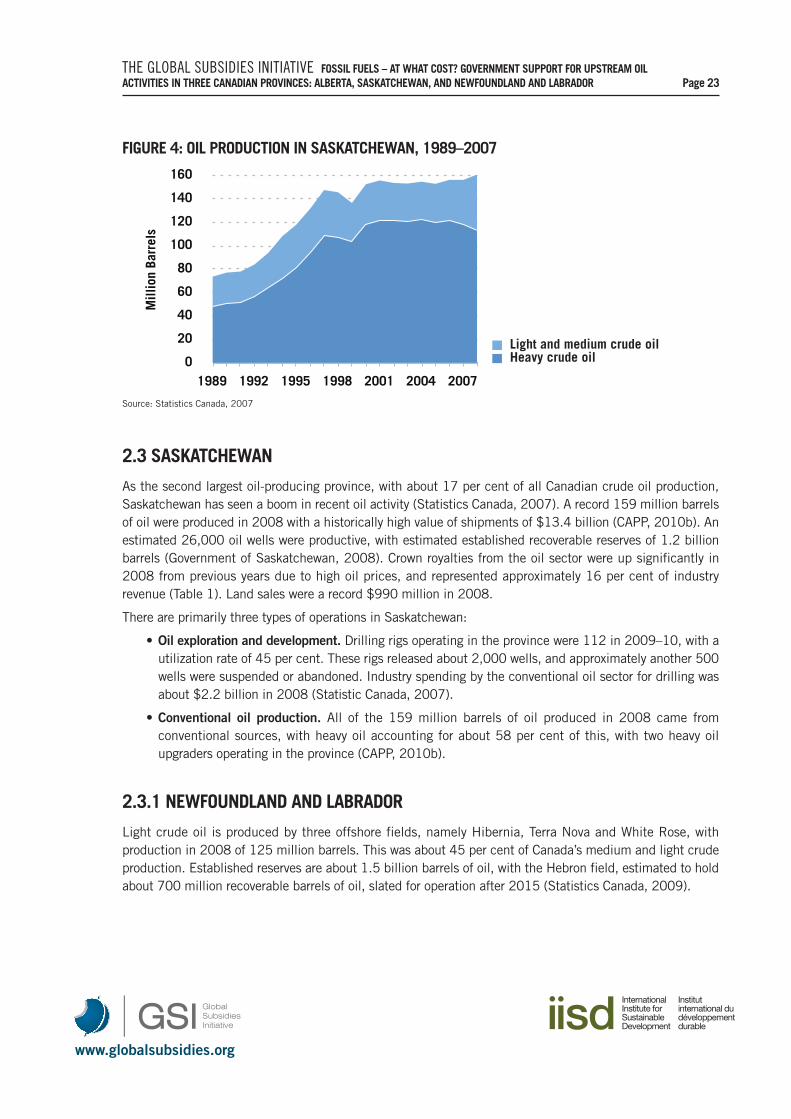
2.3 SASKATCHEWAN
As the second largest oil-producing province, with about 17 per cent of all Canadian crude oil production,Saskatchewan has seen a boom in recent oil activity (Statistics Canada, 2007). A record 159 million barrelsof oil were produced in 2008 with a historically high value of shipments of $13.4 billion (CAPP, 2010b). Anestimated 26,000 oil wells were productive, with estimated established recoverable reserves of 1.2 billionbarrels (Government of Saskatchewan, 2008). Crown royalties from the oil sector were up significantly in2008 from previous years due to high oil prices, and represented approximately 16 per cent of industryrevenue (Table 1). Land sales were a record $990 million in 2008.
There are primarily three types of operations in Saskatchewan:
• Oil exploration and development. Drilling rigs operating in the province were 112 in 2009–10, with autilization rate of 45 per cent. These rigs released about 2,000 wells, and approximately another 500wells were suspended or abandoned. Industry spending by the conventional oil sector for drilling wasabout $2.2 billion in 2008 (Statistic Canada, 2007).
• Conventional oil production. All of the 159 million barrels of oil produced in 2008 came fromconventional sources, with heavy oil accounting for about 58 per cent of this, with two heavy oilupgraders operating in the province (CAPP, 2010b).
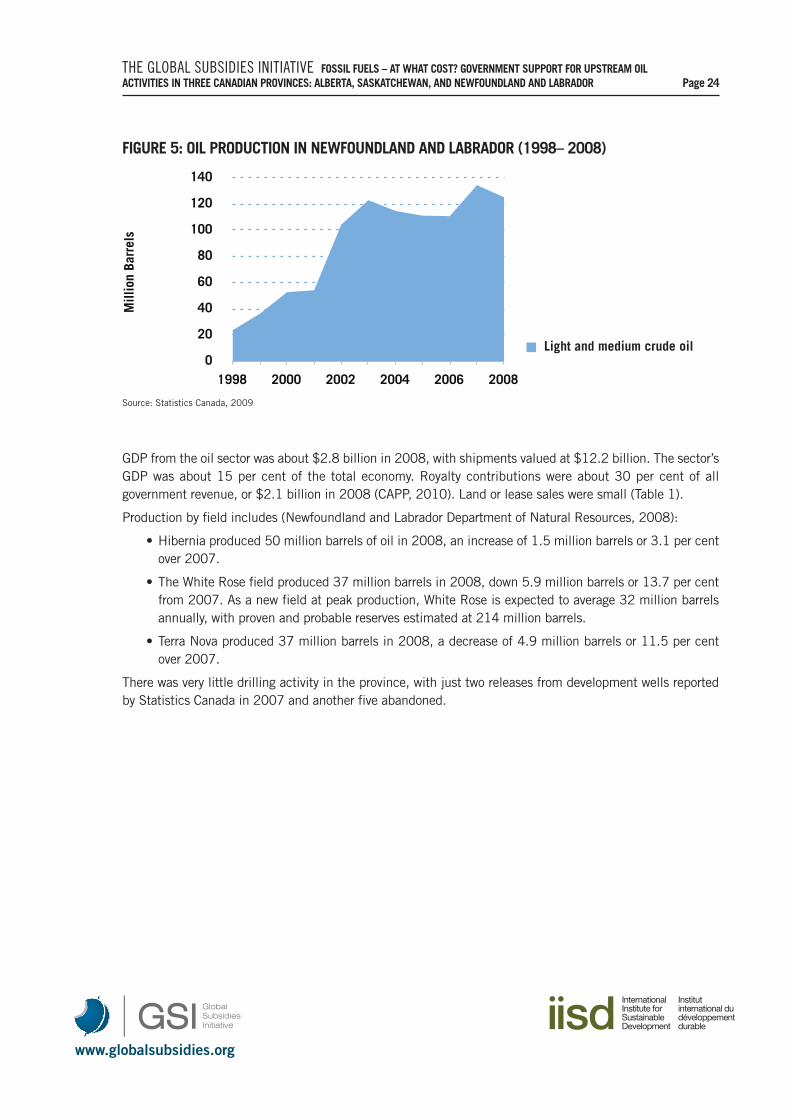
2.3.1 NEWFOUNDLAND AND LABRADOR
Light crude oil is produced by three offshore fields, namely Hibernia, Terra Nova and White Rose, withproduction in 2008 of 125 million barrels. This was about 45 per cent of Canada’s medium and light crudeproduction. Established reserves are about 1.5 billion barrels of oil, with the Hebron field, estimated to holdabout 700 million recoverable barrels of oil, slated for operation after 2015 (Statistics Canada, 2009).
0
20
40
60
80
100
120
140
160
1989 1992 1995 1998 2001 2004 2007
M
illio
n Ba
rrel
s
Heavy crude oil Light and medium crude oil
FIGURE 4: OIL PRODUCTION IN SASKATCHEWAN, 1989–2007
Source: Statistics Canada, 2007
www.globalsubsidies.org
THE GLOBAL SUBSIDIES INITIATIVE FOSSIL FUELS – AT WHAT COST? GOVERNMENT SUPPORT FOR UPSTREAM OIL ACTIVITIES IN THREE CANADIAN PROVINCES: ALBERTA, SASKATCHEWAN, AND NEWFOUNDLAND AND LABRADOR Page 24
GDP from the oil sector was about $2.8 billion in 2008, with shipments valued at $12.2 billion. The sector’sGDP was about 15 per cent of the total economy. Royalty contributions were about 30 per cent of allgovernment revenue, or $2.1 billion in 2008 (CAPP, 2010). Land or lease sales were small (Table 1).
Production by field includes (Newfoundland and Labrador Department of Natural Resources, 2008):
• Hibernia produced 50 million barrels of oil in 2008, an increase of 1.5 million barrels or 3.1 per centover 2007.
• The White Rose field produced 37 million barrels in 2008, down 5.9 million barrels or 13.7 per centfrom 2007. As a new field at peak production, White Rose is expected to average 32 million barrelsannually, with proven and probable reserves estimated at 214 million barrels.
• Terra Nova produced 37 million barrels in 2008, a decrease of 4.9 million barrels or 11.5 per centover 2007.
There was very little drilling activity in the province, with just two releases from development wells reportedby Statistics Canada in 2007 and another five abandoned.
0
20
40
60
80
100
120
140
1998 2000 2002 2004 2006 2008
M
illio
n Ba
rrel
s
Light and medium crude oil
FIGURE 5: OIL PRODUCTION IN NEWFOUNDLAND AND LABRADOR (1998– 2008)
Source: Statistics Canada, 2009
www.globalsubsidies.org
THE GLOBAL SUBSIDIES INITIATIVE FOSSIL FUELS – AT WHAT COST? GOVERNMENT SUPPORT FOR UPSTREAM OIL ACTIVITIES IN THREE CANADIAN PROVINCES: ALBERTA, SASKATCHEWAN, AND NEWFOUNDLAND AND LABRADOR Page 25
3. SUBSIDY DEFINITION AND APPROACH
This section presents the results of an in-depth review of the subsidy regimes in place in the four jurisdictions.This section will first present a standardized subsidy definition and approach to valuation. A standardizedinformation collection template is then used to collect and present the information. Methods of data collectioninclude investigating public accounts, literature review of both peer-reviewed and grey, and conducting interviews.
3.1 DEFINITION OF SUBSIDY
The Global Subsidies Initiative adopts a three-step approach to: define, measure and evaluate subsidies(GSI, 2010). This approach starts with a broad definition of “subsidy” with the purpose of identifying allexisting subsidies in a sector, whether those subsidies are considered “good” or “bad.” This provides acomprehensive starting point for the analysis to follow. Then, as the study proceeds through the steps, thefocus will narrow to those subsidies that are measurable and able to be fully assessed. Therefore, it shouldnot be assumed, that because a subsidy is identified at the beginning of the study that it is necessarily inneed of reform.
The GSI’s approach is based on the view that a subsidy exists where preferential treatment—financial andotherwise—is provided to producers (in this case study, oil producers). Preferential treatment can be providedin three forms:
• To selected companies;
• To one sector or product when compared with other sectors;
• To sectors or products in one country when compared internationally (GSI, 2010).
It is useful to keep these three broad types of preferential treatment in mind when determining whether aspecific subsidy is granted. The GSI uses a definition of “subsidy” based on the World Trade Organization’s(WTO) Agreement on Subsidies and Countervailing Measures (ASCM), which is agreed by 153 countries,including Canada. Under Article 1: Definition of a Subsidy, the ASCM determines that four types of subsidiesexist, where:
1. Government provides direct transfer of funds or potential direct transfer of funds or liabilities,
2. Revenue is foregone or not collected,
3. Government provides goods or services or purchases goods,
4. Government provides income or price support.
The ASCM also requires that a subsidy be specific to an enterprise, industry, or group of enterprises orindustries under Article 2. So although in some cases government support is offered to more than one sector,it can still be considered a subsidy for the purposes of this study if, for example, it is offered only to the oil,gas and mining sectors, or if the oil sector disproportionately benefits from the support. The Atlantic InvestmentTax Credit is an example of a disproportionate benefit, as it is available to resource sectors, but isoverwhelmingly utilized by the oil and gas sector.
Based on the ACSM list above, GSI has developed sub-categories of subsidies that form the frameworkidentifying subsidies in the oil sector in Canada (Table 2). These are not all necessarily relevant to the oilsector in Canada, as this study will reveal, but rather forms a comprehensive framework for identifying andanalyzing subsidies in any country. This framework provides the basis for the GSI’s series of country casestudies to identify and quantify subsidies to upstream oil and gas activities.
www.globalsubsidies.org
THE GLOBAL SUBSIDIES INITIATIVE FOSSIL FUELS – AT WHAT COST? GOVERNMENT SUPPORT FOR UPSTREAM OIL ACTIVITIES IN THREE CANADIAN PROVINCES: ALBERTA, SASKATCHEWAN, AND NEWFOUNDLAND AND LABRADOR Page 26
Although the GSI adopts a broad definition of “subsidy,” the definition excludes environmental externalities(such as carbon emissions and pollution), which are better considered in the environmental impactassessments in the third step of the GSI process (i.e., evaluating subsidies).
In the next sections, we report on what we found with respect to each of these categories. Appendix A providesthe detailed programs organized by jurisdiction and the typology presented in the table below.
3.2 APPROACH
The approach we adopt for this review consists of four steps:
1. We identify programs in the oil sector that are otherwise not available to other sectors.
2. We sort the programs by jurisdiction into the four high-level subsidy categories identified above.
3. We quantify the number of subsidies and their value. We use a variety of quantification methodshere, from adopting outright published subsidy levels by the target jurisdictions, to estimating thesubsidy based on sector information.
4. Finally, we estimate the environmental and economic outcomes of these subsidies. A variety of methodsare used here, including original modelling at the macroeconomic level and at the facility level.
All values are annualized in 2009 Canadian dollars. All conversions to Canadian dollars are first adjustedbased on the closing exchange rate for the year in which the currency is reported, and then converted topresent dollars using the Canadian consumer price index.
www.globalsubsidies.org
THE GLOBAL SUBSIDIES INITIATIVE FOSSIL FUELS – AT WHAT COST? GOVERNMENT SUPPORT FOR UPSTREAM OIL ACTIVITIES IN THREE CANADIAN PROVINCES: ALBERTA, SASKATCHEWAN, AND NEWFOUNDLAND AND LABRADOR Page 27
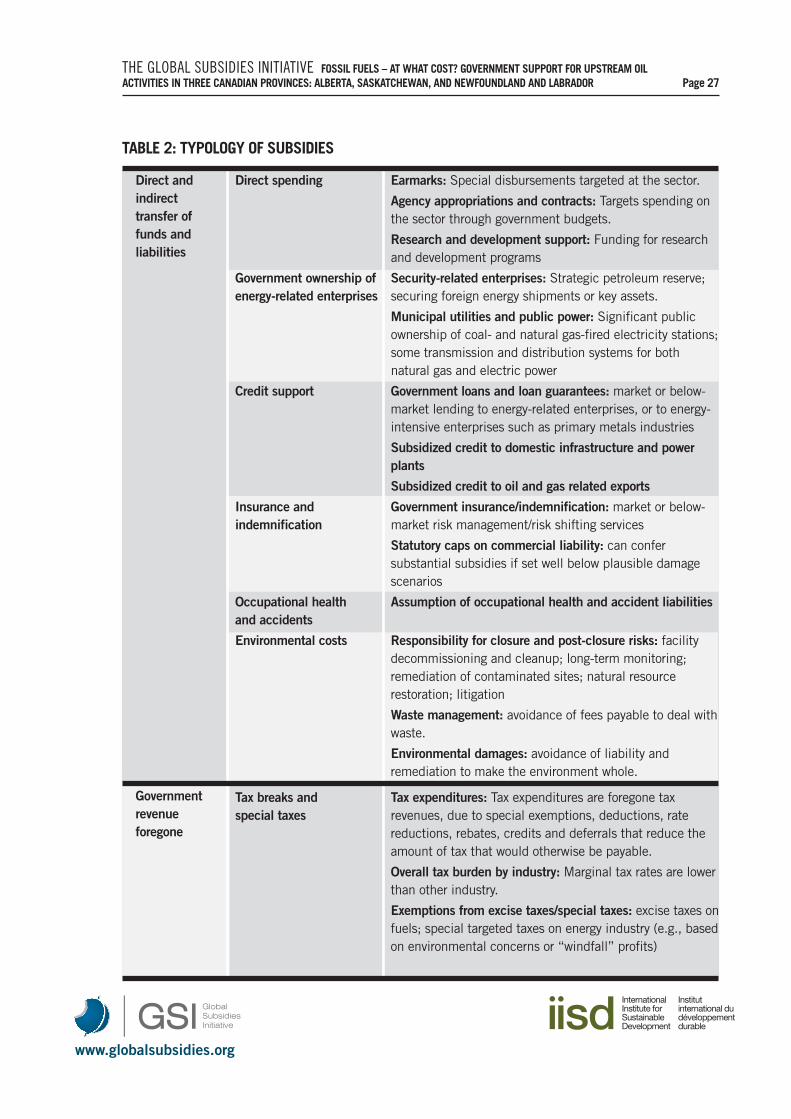
TABLE 2: TYPOLOGY OF SUBSIDIES
Direct andindirecttransfer offunds andliabilities
Governmentrevenueforegone
Direct spending Earmarks: Special disbursements targeted at the sector.
Agency appropriations and contracts: Targets spending on the sector through government budgets.
Research and development support: Funding for research and development programs
Government ownership of Security-related enterprises: Strategic petroleum reserve; energy-related enterprises securing foreign energy shipments or key assets.
Municipal utilities and public power: Significant publicownership of coal- and natural gas-fired electricity stations;some transmission and distribution systems for bothnatural gas and electric power
Credit support Government loans and loan guarantees: market or below-market lending to energy-related enterprises, or to energy-intensive enterprises such as primary metals industries
Subsidized credit to domestic infrastructure and powerplants
Subsidized credit to oil and gas related exports
Insurance and Government insurance/indemnification: market or below-indemnification market risk management/risk shifting services
Statutory caps on commercial liability: can confersubstantial subsidies if set well below plausible damagescenarios
Occupational health Assumption of occupational health and accident liabilitiesand accidents
Environmental costs Responsibility for closure and post-closure risks: facilitydecommissioning and cleanup; long-term monitoring;remediation of contaminated sites; natural resourcerestoration; litigation
Waste management: avoidance of fees payable to deal withwaste.
Environmental damages: avoidance of liability andremediation to make the environment whole.
Tax breaks and Tax expenditures: Tax expenditures are foregone tax special taxes revenues, due to special exemptions, deductions, rate
reductions, rebates, credits and deferrals that reduce theamount of tax that would otherwise be payable.
Overall tax burden by industry: Marginal tax rates are lowerthan other industry.
Exemptions from excise taxes/special taxes: excise taxes onfuels; special targeted taxes on energy industry (e.g., basedon environmental concerns or “windfall” profits)
www.globalsubsidies.org
THE GLOBAL SUBSIDIES INITIATIVE FOSSIL FUELS – AT WHAT COST? GOVERNMENT SUPPORT FOR UPSTREAM OIL ACTIVITIES IN THREE CANADIAN PROVINCES: ALBERTA, SASKATCHEWAN, AND NEWFOUNDLAND AND LABRADOR Page 28
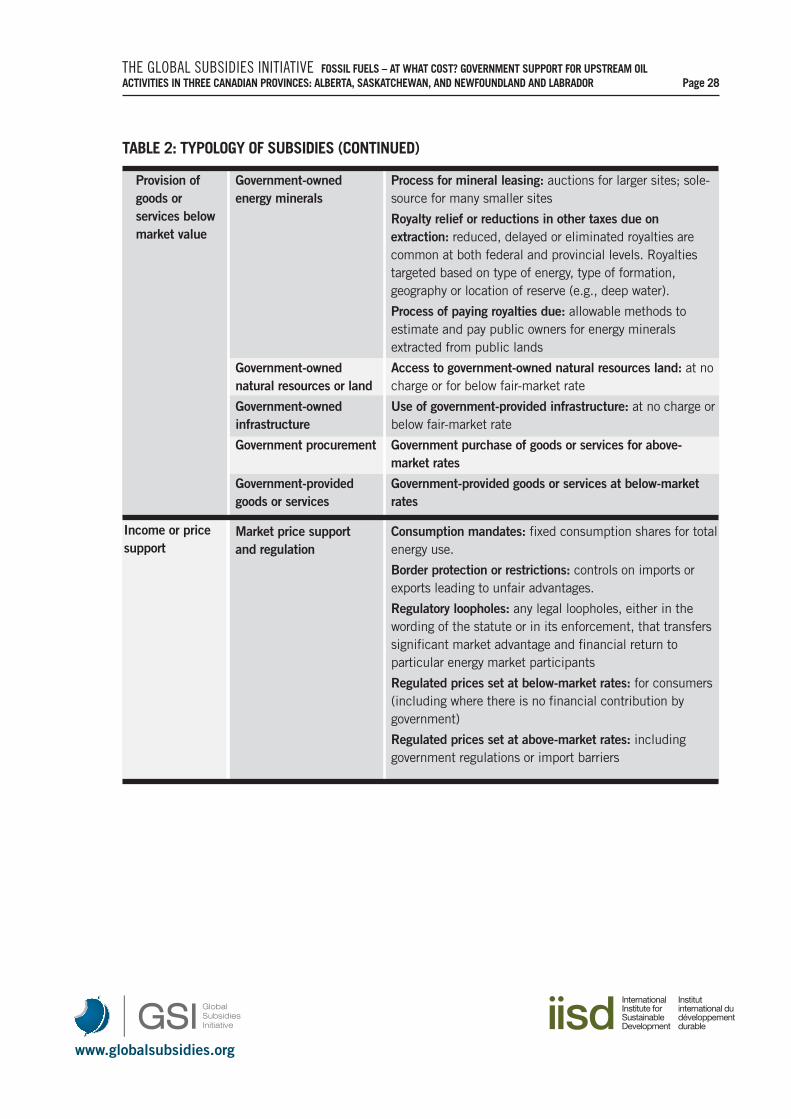
TABLE 2: TYPOLOGY OF SUBSIDIES (CONTINUED)
Provision ofgoods orservices belowmarket value
Income or pricesupport
Government-owned Process for mineral leasing: auctions for larger sites; sole-energy minerals source for many smaller sites
Royalty relief or reductions in other taxes due onextraction: reduced, delayed or eliminated royalties arecommon at both federal and provincial levels. Royaltiestargeted based on type of energy, type of formation,geography or location of reserve (e.g., deep water).
Process of paying royalties due: allowable methods toestimate and pay public owners for energy mineralsextracted from public lands
Government-owned Access to government-owned natural resources land: at no natural resources or land charge or for below fair-market rate
Government-owned Use of government-provided infrastructure: at no charge or infrastructure below fair-market rate
Government procurement Government purchase of goods or services for above-market rates
Government-provided Government-provided goods or services at below-market goods or services rates
Market price support Consumption mandates: fixed consumption shares for total and regulation energy use.
Border protection or restrictions: controls on imports orexports leading to unfair advantages.
Regulatory loopholes: any legal loopholes, either in thewording of the statute or in its enforcement, that transferssignificant market advantage and financial return toparticular energy market participants
Regulated prices set at below-market rates: for consumers(including where there is no financial contribution bygovernment)
Regulated prices set at above-market rates: includinggovernment regulations or import barriers
www.globalsubsidies.org
THE GLOBAL SUBSIDIES INITIATIVE FOSSIL FUELS – AT WHAT COST? GOVERNMENT SUPPORT FOR UPSTREAM OIL ACTIVITIES IN THREE CANADIAN PROVINCES: ALBERTA, SASKATCHEWAN, AND NEWFOUNDLAND AND LABRADOR Page 29
4. SUMMARY OF THE VALUE OF THE SUBSIDIES
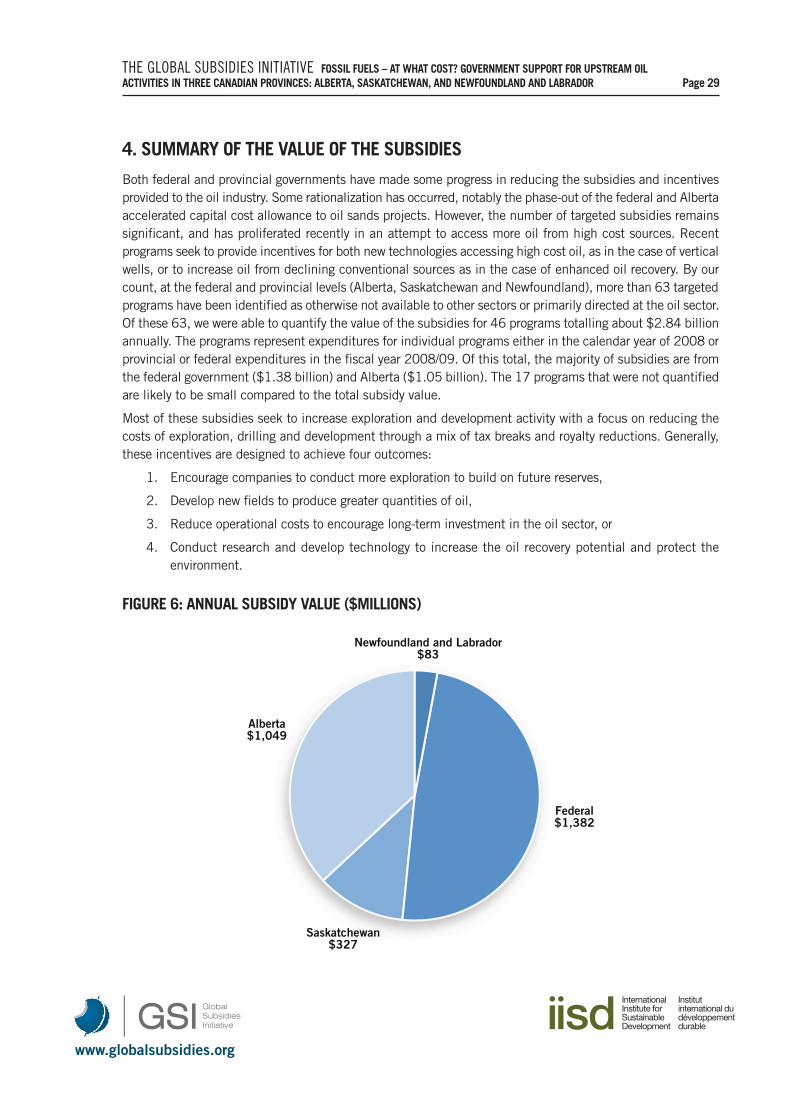
Both federal and provincial governments have made some progress in reducing the subsidies and incentivesprovided to the oil industry. Some rationalization has occurred, notably the phase-out of the federal and Albertaaccelerated capital cost allowance to oil sands projects. However, the number of targeted subsidies remainssignificant, and has proliferated recently in an attempt to access more oil from high cost sources. Recentprograms seek to provide incentives for both new technologies accessing high cost oil, as in the case of verticalwells, or to increase oil from declining conventional sources as in the case of enhanced oil recovery. By ourcount, at the federal and provincial levels (Alberta, Saskatchewan and Newfoundland), more than 63 targetedprograms have been identified as otherwise not available to other sectors or primarily directed at the oil sector.Of these 63, we were able to quantify the value of the subsidies for 46 programs totalling about $2.84 billionannually. The programs represent expenditures for individual programs either in the calendar year of 2008 orprovincial or federal expenditures in the fiscal year 2008/09. Of this total, the majority of subsidies are fromthe federal government ($1.38 billion) and Alberta ($1.05 billion). The 17 programs that were not quantifiedare likely to be small compared to the total subsidy value.
Most of these subsidies seek to increase exploration and development activity with a focus on reducing thecosts of exploration, drilling and development through a mix of tax breaks and royalty reductions. Generally,these incentives are designed to achieve four outcomes:
1. Encourage companies to conduct more exploration to build on future reserves,
2. Develop new fields to produce greater quantities of oil,
3. Reduce operational costs to encourage long-term investment in the oil sector, or
4. Conduct research and develop technology to increase the oil recovery potential and protect theenvironment.
FIGURE 6: ANNUAL SUBSIDY VALUE ($MILLIONS)
Alberta$1,049
Saskatchewan$327
Federal$1,382
Newfoundland and Labrador$83
www.globalsubsidies.org
THE GLOBAL SUBSIDIES INITIATIVE FOSSIL FUELS – AT WHAT COST? GOVERNMENT SUPPORT FOR UPSTREAM OIL ACTIVITIES IN THREE CANADIAN PROVINCES: ALBERTA, SASKATCHEWAN, AND NEWFOUNDLAND AND LABRADOR Page 30
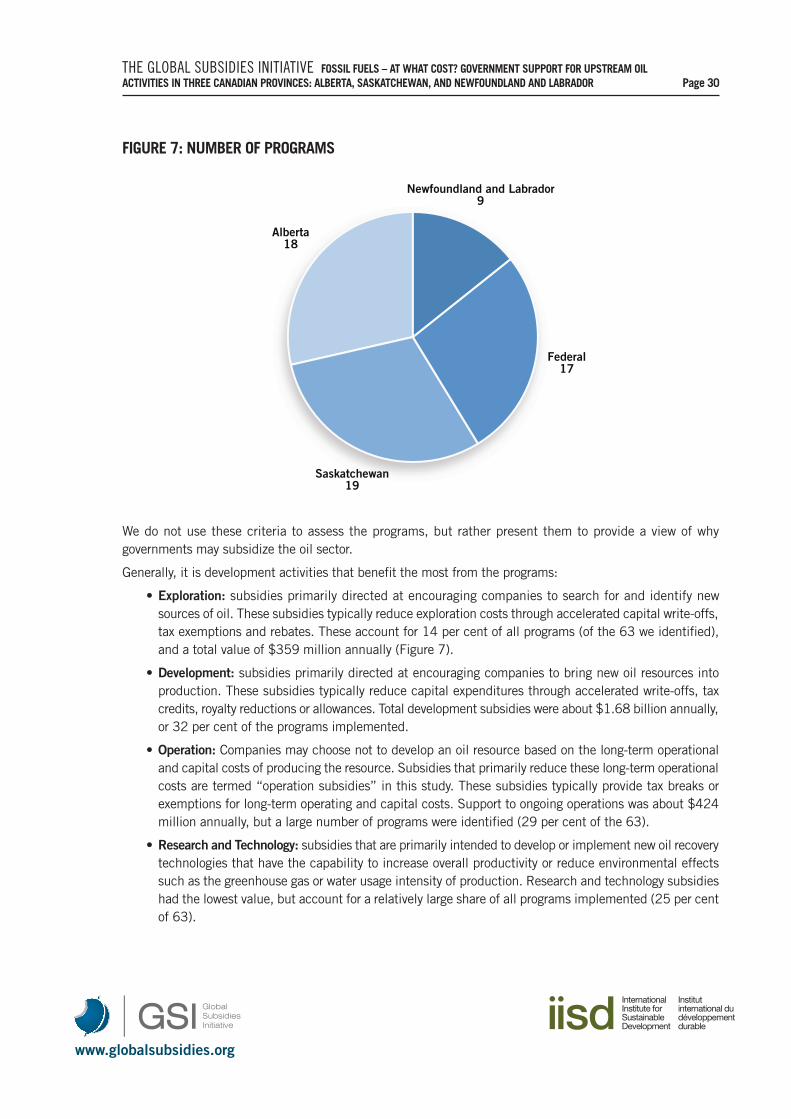
FIGURE 7: NUMBER OF PROGRAMS
Alberta18
Saskatchewan19
Federal17
Newfoundland and Labrador9
We do not use these criteria to assess the programs, but rather present them to provide a view of whygovernments may subsidize the oil sector.
Generally, it is development activities that benefit the most from the programs:
• Exploration: subsidies primarily directed at encouraging companies to search for and identify newsources of oil. These subsidies typically reduce exploration costs through accelerated capital write-offs,tax exemptions and rebates. These account for 14 per cent of all programs (of the 63 we identified),and a total value of $359 million annually (Figure 7).
• Development: subsidies primarily directed at encouraging companies to bring new oil resources intoproduction. These subsidies typically reduce capital expenditures through accelerated write-offs, taxcredits, royalty reductions or allowances. Total development subsidies were about $1.68 billion annually,or 32 per cent of the programs implemented.
• Operation: Companies may choose not to develop an oil resource based on the long-term operationaland capital costs of producing the resource. Subsidies that primarily reduce these long-term operationalcosts are termed “operation subsidies” in this study. These subsidies typically provide tax breaks orexemptions for long-term operating and capital costs. Support to ongoing operations was about $424million annually, but a large number of programs were identified (29 per cent of the 63).
• Research and Technology: subsidies that are primarily intended to develop or implement new oil recoverytechnologies that have the capability to increase overall productivity or reduce environmental effectssuch as the greenhouse gas or water usage intensity of production. Research and technology subsidieshad the lowest value, but account for a relatively large share of all programs implemented (25 per centof 63).
www.globalsubsidies.org
THE GLOBAL SUBSIDIES INITIATIVE FOSSIL FUELS – AT WHAT COST? GOVERNMENT SUPPORT FOR UPSTREAM OIL ACTIVITIES IN THREE CANADIAN PROVINCES: ALBERTA, SASKATCHEWAN, AND NEWFOUNDLAND AND LABRADOR Page 31
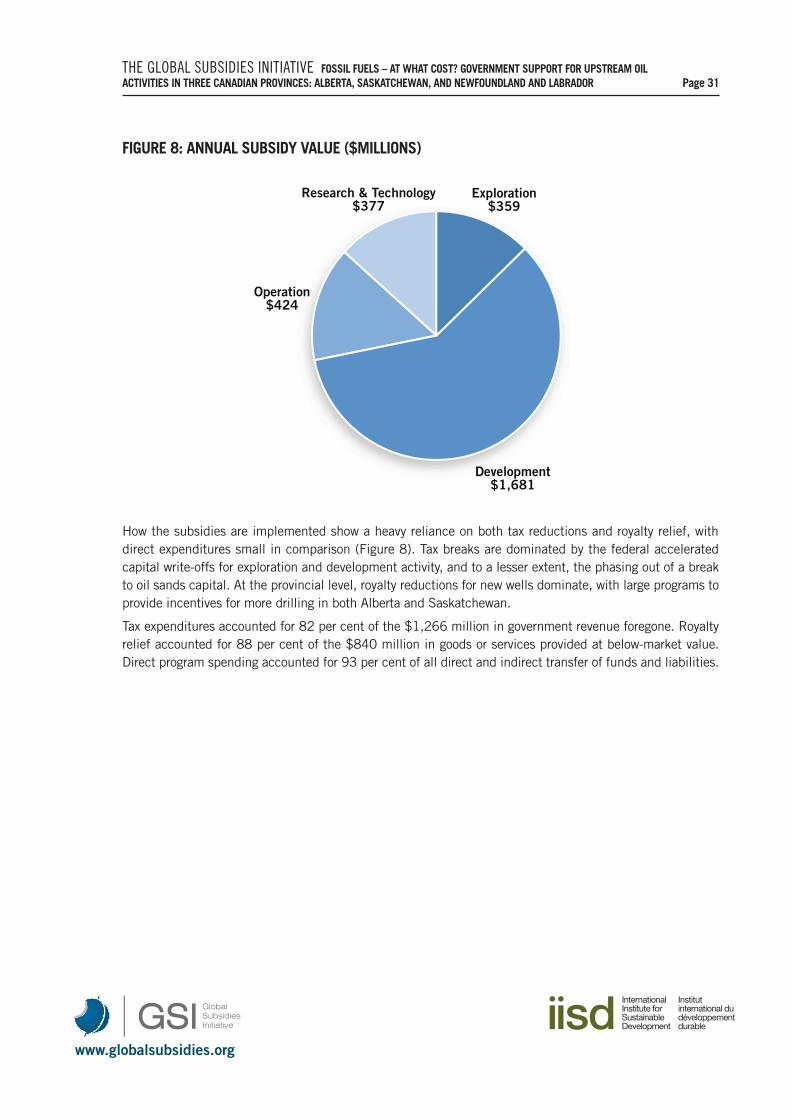
FIGURE 8: ANNUAL SUBSIDY VALUE ($MILLIONS)
Research & Technology$377
Operation$424
Development$1,681
Exploration$359
How the subsidies are implemented show a heavy reliance on both tax reductions and royalty relief, withdirect expenditures small in comparison (Figure 8). Tax breaks are dominated by the federal acceleratedcapital write-offs for exploration and development activity, and to a lesser extent, the phasing out of a breakto oil sands capital. At the provincial level, royalty reductions for new wells dominate, with large programs toprovide incentives for more drilling in both Alberta and Saskatchewan.
Tax expenditures accounted for 82 per cent of the $1,266 million in government revenue foregone. Royaltyrelief accounted for 88 per cent of the $840 million in goods or services provided at below-market value.Direct program spending accounted for 93 per cent of all direct and indirect transfer of funds and liabilities.
www.globalsubsidies.org
THE GLOBAL SUBSIDIES INITIATIVE FOSSIL FUELS – AT WHAT COST? GOVERNMENT SUPPORT FOR UPSTREAM OIL ACTIVITIES IN THREE CANADIAN PROVINCES: ALBERTA, SASKATCHEWAN, AND NEWFOUNDLAND AND LABRADOR Page 32
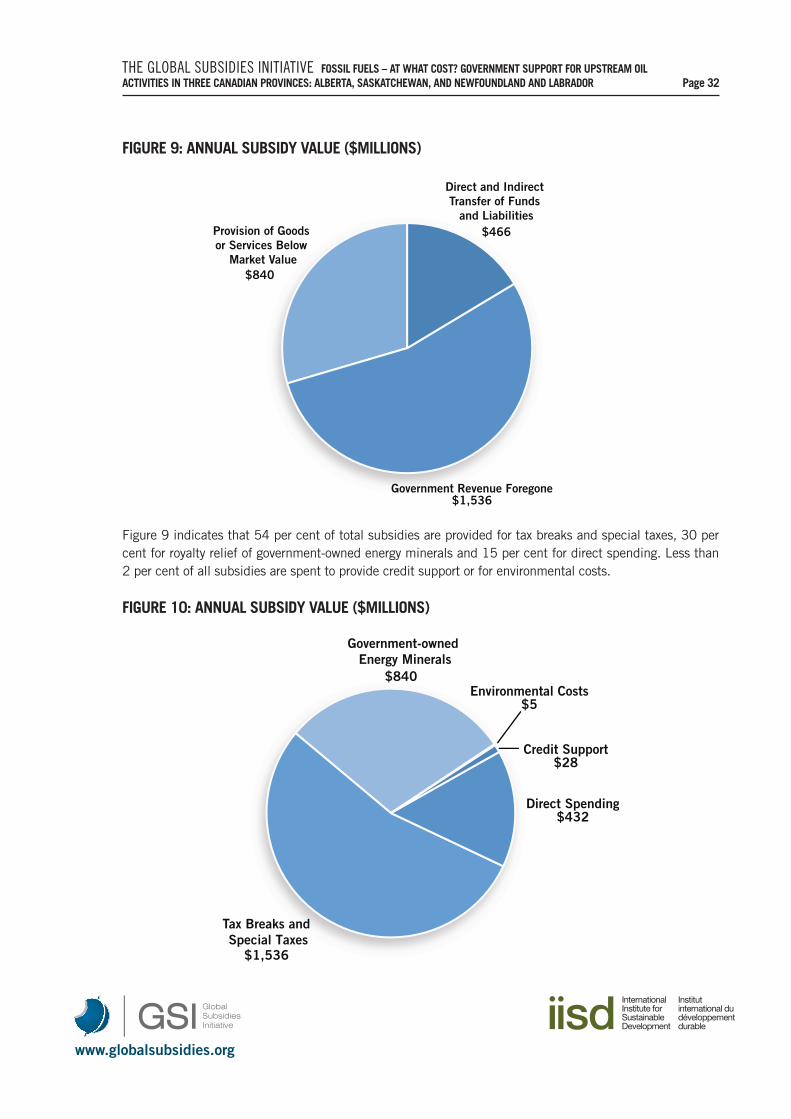
Figure 9 indicates that 54 per cent of total subsidies are provided for tax breaks and special taxes, 30 percent for royalty relief of government-owned energy minerals and 15 per cent for direct spending. Less than2 per cent of all subsidies are spent to provide credit support or for environmental costs.
FIGURE 9: ANNUAL SUBSIDY VALUE ($MILLIONS)
Provision of Goods or Services Below
Market Value$840
Government Revenue Foregone$1,536
Direct and Indirect Transfer of Funds
and Liabilities$466
FIGURE 10: ANNUAL SUBSIDY VALUE ($MILLIONS)
Environmental Costs$5
Government-owned Energy Minerals
$840
Tax Breaks and Special Taxes
$1,536
Direct Spending$432
Credit Support$28
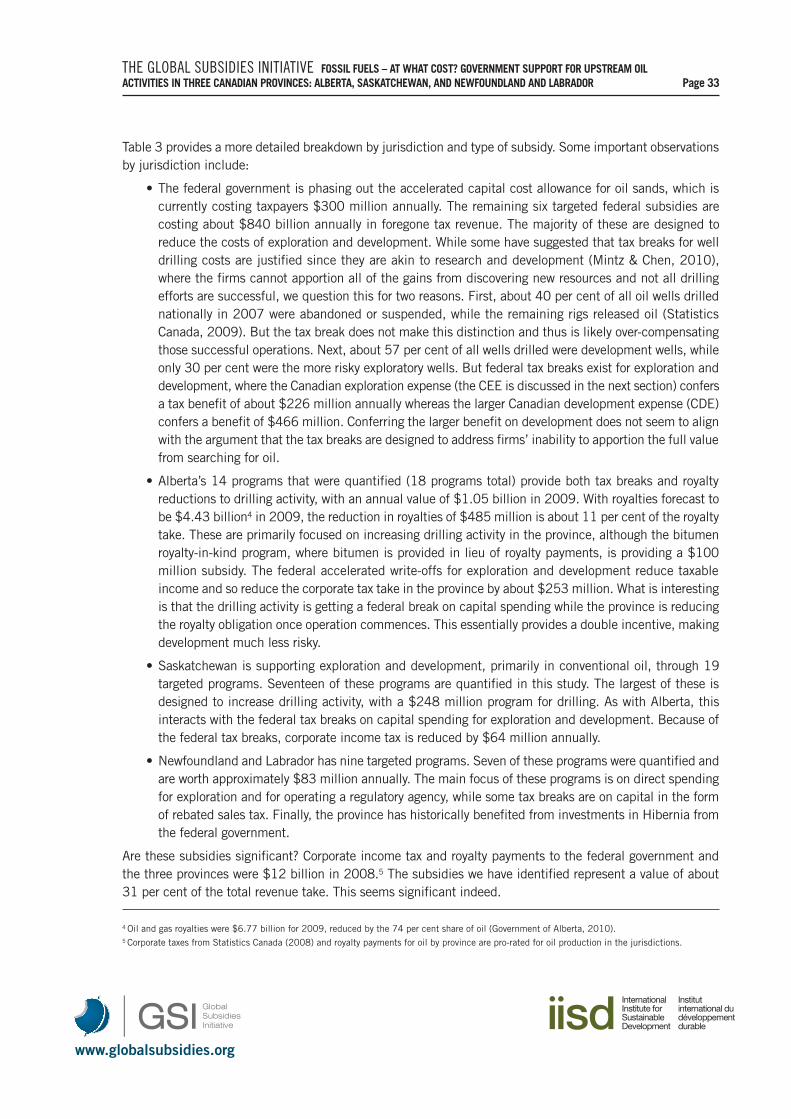
www.globalsubsidies.org
THE GLOBAL SUBSIDIES INITIATIVE FOSSIL FUELS – AT WHAT COST? GOVERNMENT SUPPORT FOR UPSTREAM OIL ACTIVITIES IN THREE CANADIAN PROVINCES: ALBERTA, SASKATCHEWAN, AND NEWFOUNDLAND AND LABRADOR Page 33
Table 3 provides a more detailed breakdown by jurisdiction and type of subsidy. Some important observationsby jurisdiction include:
• The federal government is phasing out the accelerated capital cost allowance for oil sands, which iscurrently costing taxpayers $300 million annually. The remaining six targeted federal subsidies arecosting about $840 billion annually in foregone tax revenue. The majority of these are designed toreduce the costs of exploration and development. While some have suggested that tax breaks for welldrilling costs are justified since they are akin to research and development (Mintz & Chen, 2010),where the firms cannot apportion all of the gains from discovering new resources and not all drillingefforts are successful, we question this for two reasons. First, about 40 per cent of all oil wells drillednationally in 2007 were abandoned or suspended, while the remaining rigs released oil (StatisticsCanada, 2009). But the tax break does not make this distinction and thus is likely over-compensatingthose successful operations. Next, about 57 per cent of all wells drilled were development wells, whileonly 30 per cent were the more risky exploratory wells. But federal tax breaks exist for exploration anddevelopment, where the Canadian exploration expense (the CEE is discussed in the next section) confersa tax benefit of about $226 million annually whereas the larger Canadian development expense (CDE)confers a benefit of $466 million. Conferring the larger benefit on development does not seem to alignwith the argument that the tax breaks are designed to address firms’ inability to apportion the full valuefrom searching for oil.
• Alberta’s 14 programs that were quantified (18 programs total) provide both tax breaks and royaltyreductions to drilling activity, with an annual value of $1.05 billion in 2009. With royalties forecast tobe $4.43 billion4 in 2009, the reduction in royalties of $485 million is about 11 per cent of the royaltytake. These are primarily focused on increasing drilling activity in the province, although the bitumenroyalty-in-kind program, where bitumen is provided in lieu of royalty payments, is providing a $100million subsidy. The federal accelerated write-offs for exploration and development reduce taxableincome and so reduce the corporate tax take in the province by about $253 million. What is interestingis that the drilling activity is getting a federal break on capital spending while the province is reducingthe royalty obligation once operation commences. This essentially provides a double incentive, makingdevelopment much less risky.
• Saskatchewan is supporting exploration and development, primarily in conventional oil, through 19targeted programs. Seventeen of these programs are quantified in this study. The largest of these isdesigned to increase drilling activity, with a $248 million program for drilling. As with Alberta, thisinteracts with the federal tax breaks on capital spending for exploration and development. Because ofthe federal tax breaks, corporate income tax is reduced by $64 million annually.
• Newfoundland and Labrador has nine targeted programs. Seven of these programs were quantified andare worth approximately $83 million annually. The main focus of these programs is on direct spendingfor exploration and for operating a regulatory agency, while some tax breaks are on capital in the formof rebated sales tax. Finally, the province has historically benefited from investments in Hibernia fromthe federal government.
Are these subsidies significant? Corporate income tax and royalty payments to the federal government andthe three provinces were $12 billion in 2008.5 The subsidies we have identified represent a value of about31 per cent of the total revenue take. This seems significant indeed.
4 Oil and gas royalties were $6.77 billion for 2009, reduced by the 74 per cent share of oil (Government of Alberta, 2010).5 Corporate taxes from Statistics Canada (2008) and royalty payments for oil by province are pro-rated for oil production in the jurisdictions.
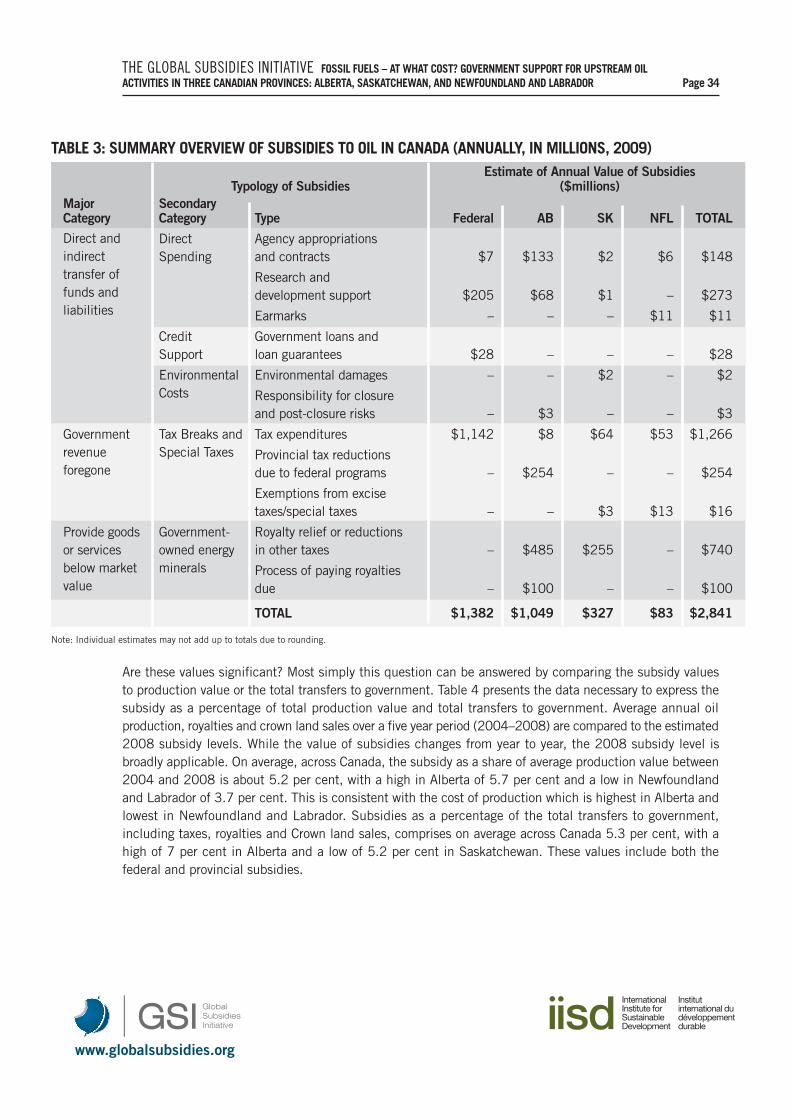
www.globalsubsidies.org
THE GLOBAL SUBSIDIES INITIATIVE FOSSIL FUELS – AT WHAT COST? GOVERNMENT SUPPORT FOR UPSTREAM OIL ACTIVITIES IN THREE CANADIAN PROVINCES: ALBERTA, SASKATCHEWAN, AND NEWFOUNDLAND AND LABRADOR Page 34
TABLE 3: SUMMARY OVERVIEW OF SUBSIDIES TO OIL IN CANADA (ANNUALLY, IN MILLIONS, 2009)Estimate of Annual Value of Subsidies
Typology of Subsidies ($millions)Major SecondaryCategory Category Type Federal AB SK NFL TOTAL
Direct Agency appropriations Spending and contracts $7 $133 $2 $6 $148
Research and development support $205 $68 $1 – $273
Earmarks – – – $11 $11
Credit Government loans and Support loan guarantees $28 – – – $28
Environmental Environmental damages – – $2 – $2Costs Responsibility for closure
and post-closure risks – $3 – – $3
Government Tax Breaks and Tax expenditures $1,142 $8 $64 $53 $1,266revenue Special Taxes Provincial tax reductionsforegone due to federal programs – $254 – – $254
Exemptions from excise taxes/special taxes – – $3 $13 $16
Provide goods Government- Royalty relief or reductionsor services owned energy in other taxes – $485 $255 – $740below market minerals Process of paying royaltiesvalue due – $100 – – $100
TOTAL $1,382 $1,049 $327 $83 $2,841
Note: Individual estimates may not add up to totals due to rounding.
Direct andindirecttransfer offunds andliabilities
Are these values significant? Most simply this question can be answered by comparing the subsidy valuesto production value or the total transfers to government. Table 4 presents the data necessary to express thesubsidy as a percentage of total production value and total transfers to government. Average annual oilproduction, royalties and crown land sales over a five year period (2004–2008) are compared to the estimated2008 subsidy levels. While the value of subsidies changes from year to year, the 2008 subsidy level isbroadly applicable. On average, across Canada, the subsidy as a share of average production value between2004 and 2008 is about 5.2 per cent, with a high in Alberta of 5.7 per cent and a low in Newfoundlandand Labrador of 3.7 per cent. This is consistent with the cost of production which is highest in Alberta andlowest in Newfoundland and Labrador. Subsidies as a percentage of the total transfers to government,including taxes, royalties and Crown land sales, comprises on average across Canada 5.3 per cent, with ahigh of 7 per cent in Alberta and a low of 5.2 per cent in Saskatchewan. These values include both thefederal and provincial subsidies.
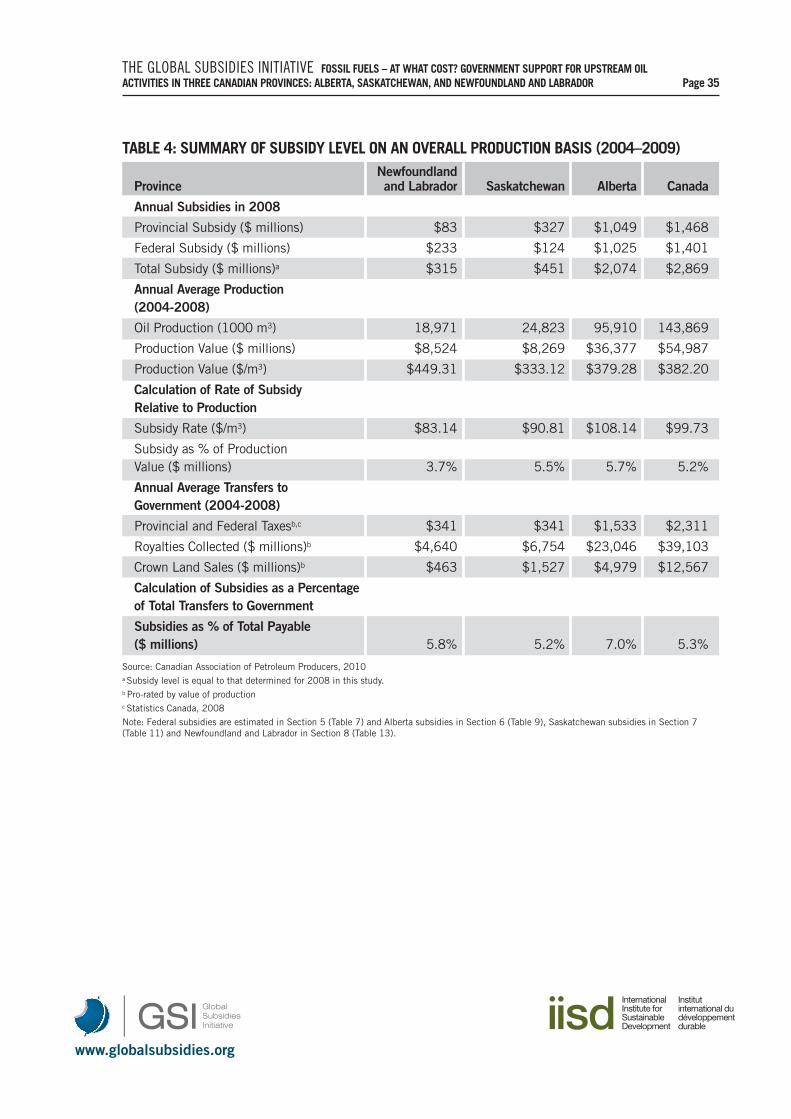
www.globalsubsidies.org
THE GLOBAL SUBSIDIES INITIATIVE FOSSIL FUELS – AT WHAT COST? GOVERNMENT SUPPORT FOR UPSTREAM OIL ACTIVITIES IN THREE CANADIAN PROVINCES: ALBERTA, SASKATCHEWAN, AND NEWFOUNDLAND AND LABRADOR Page 35
TABLE 4: SUMMARY OF SUBSIDY LEVEL ON AN OVERALL PRODUCTION BASIS (2004–2009)Newfoundland
Province and Labrador Saskatchewan Alberta Canada
Annual Subsidies in 2008
Provincial Subsidy ($ millions) $83 $327 $1,049 $1,468
Federal Subsidy ($ millions) $233 $124 $1,025 $1,401
Total Subsidy ($ millions)a $315 $451 $2,074 $2,869
Annual Average Production (2004-2008)
Oil Production (1000 m3) 18,971 24,823 95,910 143,869
Production Value ($ millions) $8,524 $8,269 $36,377 $54,987
Production Value ($/m3) $449.31 $333.12 $379.28 $382.20
Calculation of Rate of Subsidy Relative to Production
Subsidy Rate ($/m3) $83.14 $90.81 $108.14 $99.73
Subsidy as % of Production Value ($ millions) 3.7% 5.5% 5.7% 5.2%
Annual Average Transfers to Government (2004-2008)
Provincial and Federal Taxesb,c $341 $341 $1,533 $2,311
Royalties Collected ($ millions)b $4,640 $6,754 $23,046 $39,103
Crown Land Sales ($ millions)b $463 $1,527 $4,979 $12,567
Calculation of Subsidies as a Percentage of Total Transfers to Government
Subsidies as % of Total Payable($ millions) 5.8% 5.2% 7.0% 5.3%
Source: Canadian Association of Petroleum Producers, 2010a Subsidy level is equal to that determined for 2008 in this study.b Pro-rated by value of productionc Statistics Canada, 2008
Note: Federal subsidies are estimated in Section 5 (Table 7) and Alberta subsidies in Section 6 (Table 9), Saskatchewan subsidies in Section 7(Table 11) and Newfoundland and Labrador in Section 8 (Table 13).

www.globalsubsidies.org
THE GLOBAL SUBSIDIES INITIATIVE FOSSIL FUELS – AT WHAT COST? GOVERNMENT SUPPORT FOR UPSTREAM OIL ACTIVITIES IN THREE CANADIAN PROVINCES: ALBERTA, SASKATCHEWAN, AND NEWFOUNDLAND AND LABRADOR Page 36
5. OIL SUBSIDIES PROVIDED BY THE FEDERAL GOVERNMENT
The federal government does not collect royalties in Canada, and instead levies corporate income tax on theoil sector. Historically, the taxation of income earned in the oil sector has been subject to preferentialtreatment in the pursuit of three policy objectives: mobilize key economic assets through increasing economicactivity; address risks in resource exploration and extraction; and address international competitive pressures(Department of Finance, 2008). Regardless of the motive, these special provisions are tax expenditures,which are foregone tax revenue due to special exemptions, deductions, rate reductions, rebates and creditsand deferrals that reduce the amount of tax otherwise payable (Office of the Auditor General of Canada,2008). A summary of key tax developments related to the current tax treatment of the oil sector can betraced back decades.6
5.1 HISTORICAL CONTEXT OF SUBSIDY PROGRAMS
During the early development phase before 1970 or so, tax holidays were used, but were phased out due toefficiency concerns in the early 1970s. These were replaced with accelerated capital cost allowances underthe Income Tax Act. Royalties to the provinces were also fully deductible. During this period, the percentagedepletion was one of the most important deductions allowed, where oil and gas well operators could fullydeduct 33.5 per cent of well profits, and other companies with an interest in the well could deduct 25 percent. This was designed to encourage more exploration, and was in addition to the actual expenses incurredthat were fully deductible. This meant that taxes were paid at a much reduced rate (Office of the AuditorGeneral of Canada, 2000).
Starting in the mid-1970s, the federal government made important changes to the tax system for oil andother non-renewable resource sectors. Development expenses, or money spent to bring wells into production,were allowed to be written off at an accelerated rate of 30 per cent, which is now the Canadian developmentexpense (CDE). Exploration expenses could still be written down at 100 per cent in the year they were incurred,which is now referred to as the Canadian exploration expense (CEE).
The deductibility of royalty payments gave way to a deductible resource allowance, set at 25 per cent. To theextent the deducible amount exceeded actual royalty payments paid there was a reduction in the federal taxpayable. This provision was phased out between 2003 and 2006 in favour of actual royalties paid (Office ofthe Auditor General of Canada, 2008). Finally, the percentage depletion was replaced with earned depletion,meaning that actual expenses needed to be incurred to “earn” the deduction (Office of the Auditor Generalof Canada, 2008). This provision was phased-out in 1987, but accumulated amounts are still reducing taxrates for some (Ketchum, Lavigne & Plummer, 2001).
In 1996, in situ oil sands projects (using wells) were granted an accelerated capital cost allowance similar tothat available to oil sands mines. Prior to this, capital was written off at the same rate as conventional oil.Budget 2007 announced a phase-out schedule to 2015 for this preferential treatment, but significant taxexpenditures remain.
Flow-through shares were first introduced by the federal government in the 1950s to allow transfer or “flow-through” of tax credits between corporations. Since 1972, the Tax Act has allowed exploration companies totransfer or flow-through specific type of exploration expenses on Canadian properties to individual investors.An important change in 1996 added a one year “look back” rule, where a company can issue flow-through
6 Note: We do not benchmark subsidy levels with other jurisdictions internationally.
www.globalsubsidies.org
THE GLOBAL SUBSIDIES INITIATIVE FOSSIL FUELS – AT WHAT COST? GOVERNMENT SUPPORT FOR UPSTREAM OIL ACTIVITIES IN THREE CANADIAN PROVINCES: ALBERTA, SASKATCHEWAN, AND NEWFOUNDLAND AND LABRADOR Page 37
shares and transfer CEE to an investor in the same year of purchase (MineralFields.com). This tax expenditureis a financing mechanism to assist oil companies, mostly small scale or “juniors” to raise capital for explorationand development. Essentially, unused exploration and development tax deductions are sold as shares toinvestors. Historically, there have been direct transfers of funds with the objective of funding research andmaking appropriations to support the sector. Currently, there are a number of targeted programs for just theoil sector, including the CanmetENERGY at the Devon (Alberta) research centre; the Clean Energy Funddesigned to co-fund 3–5 large-scale carbon capture and storage projects; and the University of Calgary Institutefor Sustainable Energy, Environment and Economy (ISEEE).
But generally, the federal government programs that transfer funds directly are provided to oil as well as otherindustry sectors, and are thus not subsidies under our “otherwise not available” test. Four major programsfund oil activities as well as other sectors:
• Agency appropriations to the Office of Energy Research and Development (OERD); and,
• Research and development support initiatives include the Green Mining Initiative (NRCan); the Programof Energy Research and Development (PERD); and the ecoENERGY Technology Initiative.
Finally, significant federal support was provided for the development of the Newfoundland and Labradoroffshore. With the development of the Hibernia offshore field, the Government of Canada entered into a seriesof direct equity investments and credit support. An overview of the Hibernia project is provided in the sectionon Newfoundland (Section 8).
5.2 NUMBER OF SUBSIDY PROGRAMS
As the historical review above indicates, two main types of oil and gas subsidies are provided by theGovernment of Canada: foregone tax revenue and direct and indirect transfer of funds and liabilities. In all,we identified ten programs that result in direct and indirect transfer of funds and liabilities and another sevenprograms that result in foregone tax revenue.
There are numerous other incentive programs available to the oil sector, but these are also available to othersectors. This would include, for example, export insurance provided by Export Development Canada. Whilethe oil and gas sector is the single largest user of this government program, and there is clearly a benefit tobe gained through lower insurance costs, the insurance is generally available to all economic sectors. Thebenefit enjoyed by the oil sector is therefore not classified as a subsidy under our definition. Subsidies thatare otherwise not available to other sectors are discussed in detail below.
Direct and indirect transfer of funds and liabilities through government loans and loan guarantees andcredit support.
• Credit Support The Canada-Newfoundland Offshore Development Fund (Annex 1, Section 15.1.2)provided well over a billion dollars in loan guarantees to the first offshore project (the Hibernia project).The Hibernia Interest Assistance Loan Agreement was an original provision of the November 1990Agreements between several oil companies and the Government of Canada. Payments commenced inMarch 2001 and were expected to continue until 2008. Repayment was expected to begin in 2009and total repayment is anticipated by 2010. As of February 2002, $22.7 million had been paid to theowners. Also outstanding are loans made under the Hibernia Development Project (loan) for the BullArm facility. In addition, the Canada-Newfoundland Offshore Development Fund provided grants for
www.globalsubsidies.org
THE GLOBAL SUBSIDIES INITIATIVE FOSSIL FUELS – AT WHAT COST? GOVERNMENT SUPPORT FOR UPSTREAM OIL ACTIVITIES IN THREE CANADIAN PROVINCES: ALBERTA, SASKATCHEWAN, AND NEWFOUNDLAND AND LABRADOR Page 38
the construction of facilities to build offshore drilling equipment. As part of the Canada-NewfoundlandOffshore Development Fund, the federal government also spent $290 million on an 8.5 per cent stakein the Hibernia project and the provincial government has spent approximately $200 million for equitystake in Hebron, White Rose and Hibernia South Field Expansion projects. While the investments arelarge, historical returns for Hibernia have proven to be significant. For example, the federal governmenthas earned over a $1 billion from its 8.5 per cent stake over the last 5 years. This study does notconsider these investments to be subsidies.
There are two main types of government foregone revenue provided to the oil sector through the federal IncomeTax Act: deductions for intangible capital expenses and deductions for tangible capital expenses:
1. Intangible capital expenses are those that cannot be recovered by selling assets or products (e.g.,drilling muds, drilled wells, etc.) and are often related to exploration and development. A subsidyarises in the form of foregone tax revenue where there is a difference in the way the industry writesoff the capital for book purposes, reflecting the life span of the capital, and the way it is treated fortax purposes (Office of the Auditor General of Canada, 2000). The value of the subsidy is then thedifference over the life of the capital between what is booked and what the tax system allows.Subsidies identified in our review include (see Annex 1, Section 14.1.3):
• Canadian Exploration Expense (CEE) includes geological, geophysical, geochemical, drilling andcompletion expenses, cost of building a temporary access road or preparing a site for the well. Itis deductible at a rate of 100 per cent. The CEE balance of exploration expenditures must be fullydeducted against income with any unclaimed portion carried forward indefinitely.
• Canadian Development Expense (CDE) includes expenses incurred in drilling or converting a wellfor the disposal of waste liquids, injection of water, gas or other substances, monitoring fluid levelsor pressure changes, drilling for water or gas for injection, drilling and completing a well after thecommencement of production or drilling and completing a well, building a temporary access roador preparing a site for the well to the extent that the expense is not a Canadian exploration expense.These expenses can be deducted at a rate of 30 per cent annually.
• Canadian Oil and Gas Property Expenses includes the cost of any right, license or privilege toexplore or drill for petroleum, natural gas or related hydrocarbons, the cost of any oil or gas well,and any rental or royalty. This capital intangible expense is deductible at a rate of 10 per cent andincludes the costs of acquiring an oil or gas well in Canada, an interest or right to explore, drill, orextract petroleum or natural gas, or a qualifying interest or right in oil or gas production.
• Flow-Through Shares (FTS). The FTS program provides tax incentives to investors who acquireFTS by allowing deductions for resource expenses renounced by eligible corporations, andinvestment tax credits for individuals on resource expenses. The type of expenses a firm canrenounce are Canadian exploration expenses (CEEs), which are added to the cumulative CEE(CCEE) pool and can be deducted up to the maximum of 100 per cent; or Canadian developmentexpenses (CDEs), which are added to the cumulative CDE (CCDE) pool and can be deducted upto the maximum of 30 per cent (Canada Revenue Agency).
• CCA oil sands leases and building mines. Depreciation rates for oil sands intangible assets suchas leases and building oil sands mines enjoy more generous capital cost allowances than the restof the oil sector (Canadian Department of Finance, 2010).

www.globalsubsidies.org
THE GLOBAL SUBSIDIES INITIATIVE FOSSIL FUELS – AT WHAT COST? GOVERNMENT SUPPORT FOR UPSTREAM OIL ACTIVITIES IN THREE CANADIAN PROVINCES: ALBERTA, SASKATCHEWAN, AND NEWFOUNDLAND AND LABRADOR Page 39
2. Tangible capital expenses are the costs of physical assets such as buildings and equipment. Thesecosts are typically written off by companies at the rate of depletion of the capital. For tax purposesthere are a series of classes in which capital is pooled in which the capital depreciation rates are set.To the extent the book and tax values differ, a subsidy may be present. Federal tax expendituresfocused on tangible capital expenses include:
• Accelerated Capital Cost Allowance (ACCA) for oil sands (See Annex 1, Section 14.1.2). This allowsindividual oil sands projects, though not the parent company itself, to write off all of their capitalcosts before they start to pay income tax. If the project’s revenue is $1 billion and the capitalexpenditures are the same amount, the ACCA deduction can be $1 billion. With 100 per cent ACCAon all project costs, the company only pays income tax on the income from the project once it haswritten off all capital costs. Eleven oil sands projects currently under construction will receive thefull 100 per cent ACCA under grandfathering clauses. A further 45 planned projects will receivesubstantial ACCA because they will be completed before 2015. As a result, over 90 per cent of oilsands projects currently announced will receive substantial subsidies. Budget 2007 announced thephase-out of the existing ACCA for general investment in oil sands projects, leaving in place theregular 25 per cent ACCA rate for these assets (Office of the Auditor General of Canada, 2008).
• The Atlantic Canada Investment Tax Credit is estimated to be more than $100 million annuallyfor the oil and gas sector in Newfoundland. The Atlantic Investment Tax Credit aims to developthe economy of the Atlantic provinces by granting a 10 per cent tax credit on investments inmanufacturing and energy production. Offshore oil and gas companies currently receive a largeshare of the total amount claimed for this credit (Office of the Auditor General of Canada, 2000;2008). While not strictly falling under the category of “otherwise not available,”7 this tax credit isdisproportionately accessed by the oil sector in Newfoundland and Labrador. We have thereforeincluded the program.
As discussed above, there are at least three programs that provide direct funds to support oil sector activity:the CanmetENERGY at the Devon research centre; the Clean Energy Fund designed to co-fund 3–5 large-scalecarbon capture and storage projects; and the University of Calgary Institute for Sustainable Energy, Environmentand Economy (ISEEE). Finally, the Canada-Newfoundland and Labrador Offshore Petroleum Board regulatesindustry, and is partly funded by the federal government (this contribution is included as a subsidy).
5.3 VALUE OF SUBSIDY PROGRAMS
The federal government has made adjustments in recent years to reduce direct oil subsidies through taxexpenditures. The federal ACCA for oil sands projects is being phased out and should reduce costs after 2015.But, this will still cost $300 million per year, with about 90 per cent of facilities gaining benefit (Office of theAuditor General of Canada, 2008). Still in place are accelerated write-offs for some oils sands intangiblecosts, resulting in about a $50 million annual benefit. However, exploration and development subsidies remainin place (CDE and CEE), totalling over $692 million in annual tax savings through generous tax provisions ondevelopment and exploration expenses. Finally, much smaller allocations are available to two research groupstotalling about $7 million annually.
Newer subsidies through the direct transfer of funds are aimed at reducing climate change impacts in the oilsands sector have also been announced and, in total, federal and provincial governments have committed
7 The incentive is somewhat limited in scope, with availability to resource extraction industries and manufacturing.

www.globalsubsidies.org
THE GLOBAL SUBSIDIES INITIATIVE FOSSIL FUELS – AT WHAT COST? GOVERNMENT SUPPORT FOR UPSTREAM OIL ACTIVITIES IN THREE CANADIAN PROVINCES: ALBERTA, SASKATCHEWAN, AND NEWFOUNDLAND AND LABRADOR Page 40
approximately $200 million annually in funding for carbon capture and storage, most of which will benefitthe oil sector.
Our conservative estimate of the subsidy to the oil sector in the three provinces by the federal government is$1.38 billion annually (Table 5).
TABLE 5: OVERVIEW AND VALUE OF FEDERAL SUBSIDIES TO OIL IN ALBERTA, SASKATCHEWAN ANDNEWFOUNDLAND AND LABRADOR (ANNUALLY, IN MILLIONS, 2009)
Estimate of Typology of Subsidies Subsidy Annual Value
Credit Support Government loans and loan guarantees• Hibernia Start-up grant $22.5 milliona
• Canada-Newfoundland Offshore Development Fund $2.0 millionb
• Hibernia Interest Assistance Loan $3.2 millionc
• Hibernia Development Project (loan) $0.7 milliond
Direct spending Agency appropriations and contracts• The University of Calgary Institute for Sustainable Energy, Environment and Economy (ISEEE) $0.5 millione
• Petroleum Technology Research Centre Contribution for Enhanced Oil Recovery (EOR) Research Activities $0.5 millionf
• The Canada-Newfoundland Offshore Petroleum Board 6.0 milliong
Research and Development support• CanmetENERGY (Devon research centre) Likely small• The Clean Energy Fund $200 millionh
• Petroleum Technology Research Centre (Saskatchewan) $4.7 millioni
Tax breaks and Tax expendituresspecial taxes Intangible capital expenses
• Canadian Exploration Expense $233 millionj
• Canadian Development Expense $478 millionk
• Canadian Oil and Gas Property Expenses (COGPE) Likely included above• Flow-Through Shares Likely Small• CCA Oil sands leases and building mines $50 millionTangible capital expenses• Accelerated capital cost allowance for oil sand $300 millionl
• Atlantic Canada Investment Tax Credit $100 million
TOTAL 1,382 million
Direct andIndirectTransfer ofFunds andLiabilities
GovernmentRevenueForegone
a $1.04 billion grant in 1998 divided by 50 years of production life (assuming a straight line depreciation), plus financing costs at 8 per cent thatotherwise would have to be in place to substitute for the grant.
b $95 million grant for Bull Arm facility, divided by useful life, multiplied by the interest rate (0.8 per cent). c Interest payments would be about $3.2 million in 2009 on an outstanding balance of $40 million (at 8 per cent), ignoring any compounding of interest(Treasury Board of Canada, 2008).
d Ibid. Interest free loans with current outstanding values of outstanding $9.2 million, or $736,000 in annual foregone interest.e Treasury Board of Canada, 2009.f NRCan, 2010g C-NLOPB, 2009. h Department of Finance, 2009i PRTC, 2009.j See Annex 2 for details. k Ibid. l Office of the Auditor General of Canada, 2008
www.globalsubsidies.org
THE GLOBAL SUBSIDIES INITIATIVE FOSSIL FUELS – AT WHAT COST? GOVERNMENT SUPPORT FOR UPSTREAM OIL ACTIVITIES IN THREE CANADIAN PROVINCES: ALBERTA, SASKATCHEWAN, AND NEWFOUNDLAND AND LABRADOR Page 41
6. OIL SUBSIDIES IN ALBERTA
Significantly declining conventional oil production in the last decade, combined with decreasing capitalinvestment in conventional oil drilling, has led the provincial government to introduce a host of new subsidiesto encourage new conventional exploration, drilling and re-activating old wells. A related development is thepull back from the 2007 oil royalty review recommendations that have been accompanied by new drillingincentives of a significant value.
The preferred mechanism to provide subsidies in Alberta is through royalty relief. The number of directspending programs and tax expenditure programs is limited and are generally used to help develop improvedoil recovery technologies that will increase the total recovery of oil resources and to reduce harm to theenvironment such as carbon capture and storage projects.
6.1 HISTORICAL CONTEXT OF SUBSIDY PROGRAMS
For most of the history of oil development in Alberta between 1935 and 1971, the provincial governmentpursued a hands-off management approach and provided little in terms of subsidies other than competitiveroyalty rates. Oil and gas companies paid the full costs of exploration and development and paid royalties tothe province for oil produced. In response to the OPEC crisis in 1973, the Alberta government moved tocapture additional profits associated with rising oil prices. The government raised royalties on oil and gas andestablished technical public ownership of resources. The federal government also moved to secure energysupplies and control of oil resources. The National Energy Program introduced by the federal government in1980 established policies to develop non-conventional oil extraction methods and shifted the share of incomeat the wellhead to the federal government. The net effect of the program was to increase the federalgovernment’s share to 36 per cent from 10 per cent, and decrease the provincial share and the industry sharefrom 45 per cent each to 36 per cent and 28 per cent respectively. Royalties are now the exclusive purviewof the provinces, which set their own royalty rates.
Between 1980 and 1985 the federal government spent billions of dollars on Petroleum Incentive Payments(PIPs), under which Ottawa paid up to 35 per cent of wildcats (wells) drilled in the West, the amountdepending on the degree of Canadian ownership of the exploring company. However, dropping oil prices meantthat the federal government did not recover the subsidies that it paid out, and the National Energy Programwhich was unpopular in Alberta for shifting resource control to the federal government, was fully eliminatedby 1986. The Western Accord signed in 1984 eliminated some federal taxes and also removed the PIPs. Taxincentives, to some extent, replaced the PIP grants and ended discrimination against foreign investment andexploration expenditures in Alberta.
In 1995 a generic royalty regime for new oil sands projects was structured to provide a smaller royalty shareat the beginning of a development and a larger share for the government after the developers have recoveredtheir costs. In 1999, the Oil Sands Generic Royalty Regime set rates and established the provincial acceleratedcapital cost allowance for oil sands projects to encourage development. This mirrored the federal acceleratedcapital cost allowance.
In recent years, the Alberta government has adjusted subsidies and royalty rates in response to oil prices andtrends. In February, 2007 the government appointed an Alberta Royalty Review Panel to provide advice onhow to restructure Alberta’s royalty system. The panel delivered a report that informed the creation of a newAlberta Royalty regime that was implemented as of January 1, 2009 (Alberta Royalty Review Panel, 2007).This royalty regime raised the maximum royalty rates to 50 per cent up from 35 per cent. The Albertagovernment also announced the elimination of the Alberta Royalty Tax Credit Program (ARTC).
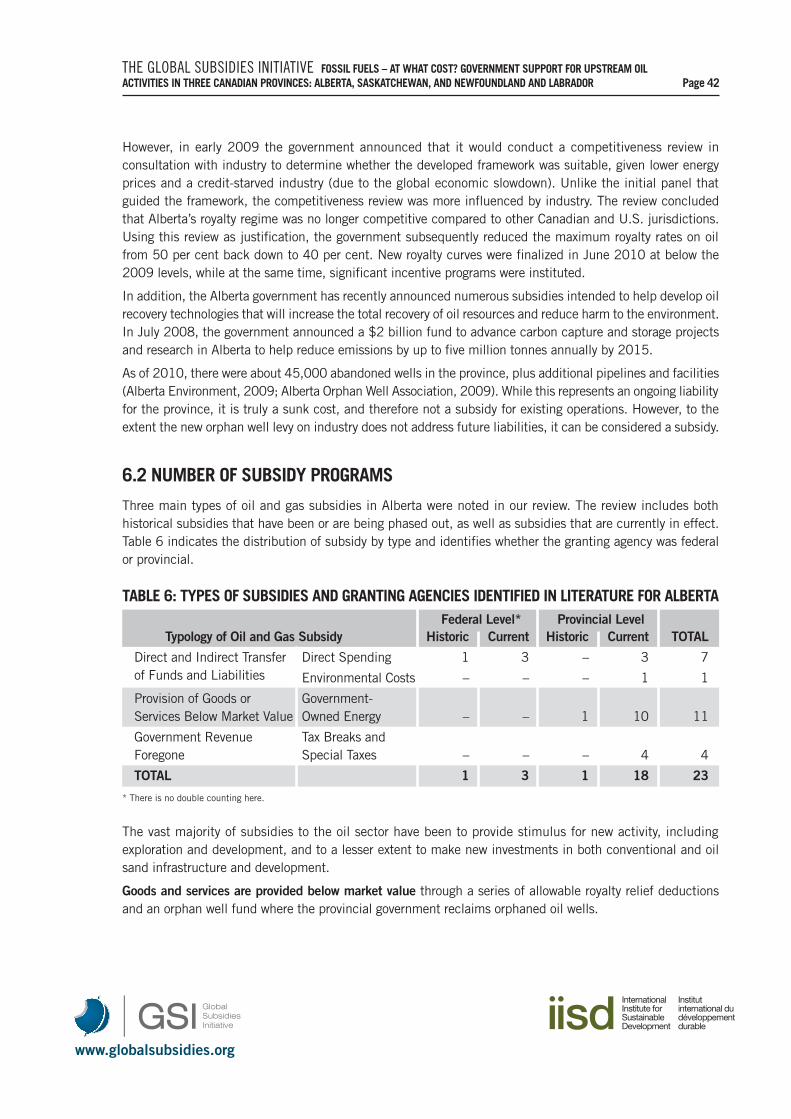
www.globalsubsidies.org
THE GLOBAL SUBSIDIES INITIATIVE FOSSIL FUELS – AT WHAT COST? GOVERNMENT SUPPORT FOR UPSTREAM OIL ACTIVITIES IN THREE CANADIAN PROVINCES: ALBERTA, SASKATCHEWAN, AND NEWFOUNDLAND AND LABRADOR Page 42
However, in early 2009 the government announced that it would conduct a competitiveness review inconsultation with industry to determine whether the developed framework was suitable, given lower energyprices and a credit-starved industry (due to the global economic slowdown). Unlike the initial panel thatguided the framework, the competitiveness review was more influenced by industry. The review concludedthat Alberta’s royalty regime was no longer competitive compared to other Canadian and U.S. jurisdictions.Using this review as justification, the government subsequently reduced the maximum royalty rates on oilfrom 50 per cent back down to 40 per cent. New royalty curves were finalized in June 2010 at below the2009 levels, while at the same time, significant incentive programs were instituted.
In addition, the Alberta government has recently announced numerous subsidies intended to help develop oilrecovery technologies that will increase the total recovery of oil resources and reduce harm to the environment.In July 2008, the government announced a $2 billion fund to advance carbon capture and storage projectsand research in Alberta to help reduce emissions by up to five million tonnes annually by 2015.
As of 2010, there were about 45,000 abandoned wells in the province, plus additional pipelines and facilities(Alberta Environment, 2009; Alberta Orphan Well Association, 2009). While this represents an ongoing liabilityfor the province, it is truly a sunk cost, and therefore not a subsidy for existing operations. However, to theextent the new orphan well levy on industry does not address future liabilities, it can be considered a subsidy.
6.2 NUMBER OF SUBSIDY PROGRAMS
Three main types of oil and gas subsidies in Alberta were noted in our review. The review includes bothhistorical subsidies that have been or are being phased out, as well as subsidies that are currently in effect.Table 6 indicates the distribution of subsidy by type and identifies whether the granting agency was federalor provincial.
TABLE 6: TYPES OF SUBSIDIES AND GRANTING AGENCIES IDENTIFIED IN LITERATURE FOR ALBERTAFederal Level* Provincial Level
Typology of Oil and Gas Subsidy Historic Current Historic Current TOTAL
Direct and Indirect Transfer Direct Spending 1 3 – 3 7of Funds and Liabilities Environmental Costs – – – 1 1
Provision of Goods or Government-Services Below Market Value Owned Energy – – 1 10 11
Government Revenue Tax Breaks and Foregone Special Taxes – – – 4 4
TOTAL 1 3 1 18 23
* There is no double counting here.
The vast majority of subsidies to the oil sector have been to provide stimulus for new activity, includingexploration and development, and to a lesser extent to make new investments in both conventional and oilsand infrastructure and development.
Goods and services are provided below market value through a series of allowable royalty relief deductionsand an orphan well fund where the provincial government reclaims orphaned oil wells.
www.globalsubsidies.org
THE GLOBAL SUBSIDIES INITIATIVE FOSSIL FUELS – AT WHAT COST? GOVERNMENT SUPPORT FOR UPSTREAM OIL ACTIVITIES IN THREE CANADIAN PROVINCES: ALBERTA, SASKATCHEWAN, AND NEWFOUNDLAND AND LABRADOR Page 43
• Drilling royalty relief deductions are provided to companies to encourage new drilling in the form ofdrilling incentives or to re-activate old wells. The royalty tax rate is reduced for an initial volume ofproduction. The value of the subsidy is the difference in the royalty tax rate that would have otherwisebeen paid. Subsidies identified in our review include the Drilling Royalty Credit (Annex 1, Section12.2.1), New Well Royalty Reduction (Annex 1, Section 12.2.4), the Enhanced Recovery of OilRoyalty Reduction (Annex 1, Section 12.2.4) and the Reactivated Well Royalty Exemption (Annex1, Section 12.2.10).
• Technology Royalty Relief Deductions are provided for projects that advance environmentally soundtechnologies. The CO2 Projects Royalty Credit (Annex 1, Section 12.2.8) provides royalty relief forprojects that implement carbon capture and storage technology and the Experimental ProjectPetroleum Royalty Reduction (Annex 1, Section 12.2.9) provides royalty relief for projects that useinnovative technologies to increase energy or resource efficiency in the recovery of oil.
• Low Productivity Well Royalty Reduction (Annex 1, Section 12.2.11) encourages additionalproduction from low-producing wells by reducing royalty rates based on historical production.
• Alberta Royalty Tax Credit (Annex 1, Section 12.2.3) was a royalty program administered throughthe income tax system and allowed a credit as a percentage of the amount of crown royalties paid inthe year on qualifying wells. While the program was discontinued in 2006, the program will still allowsome oil and gas companies to receive a credit on their income tax over the next few years.
• The CO2 Enhanced Oil Recovery (Annex 1, Section 12.2.7) is a royalty credit that seeks to encouragethe development of commercial carbon dioxide (CO2) enhanced oil recovery projects. Royalty relief isapplied only to that portion of the oil production that would not have been realized from base recoveryoperations.
• The Innovative Energy Technologies Program (Annex 1, Section 12.2.12) promotes the use ofinnovative technologies to increase environmentally sound recovery of oil and includes a $200 millioncommitment over 5 years to provide royalty adjustments to pilot and demonstration projects. Successfulapplicants in the program are provided with royalty adjustments up to a maximum of 30 per cent ofapproved project costs.
There are direct and indirect transfers of funds and liabilities through direct spending on technology andinnovation funds and an orphan well fund where the provincial government reclaims orphaned oil wells.
• Orphan Well Fund. The province has set aside a $30 million fund to invest in the Orphan WellAssociation to focus on the reclamation of approximately 600 high-priority abandoned sites. There aremany more abandoned wells where the province may assume ultimate responsibility.
There are two main types of government foregone tax revenue provided to the oil sector in Alberta: deductionsfor intangible and tangible capital expenses.
1. Intangible capital expenses are related to exploration and development. A subsidy arises in the formof foregone tax revenue where there is a difference in the way the industry writes off the capital forbook purposes, reflecting the life span of the capital, and the way it is treated for tax purposes (Officeof the Auditor General of Canada, 2000). The value of the subsidy is then the difference over the lifeof the capital between what is booked and what the tax system allows. Subsidies identified in ourreview include:
• Flow-Through Shares (Annex 1, Section 14.2.2). The FTS program provides tax incentives toinvestors who acquire FTS by allowing deductions for resource expenses renounced by eligible
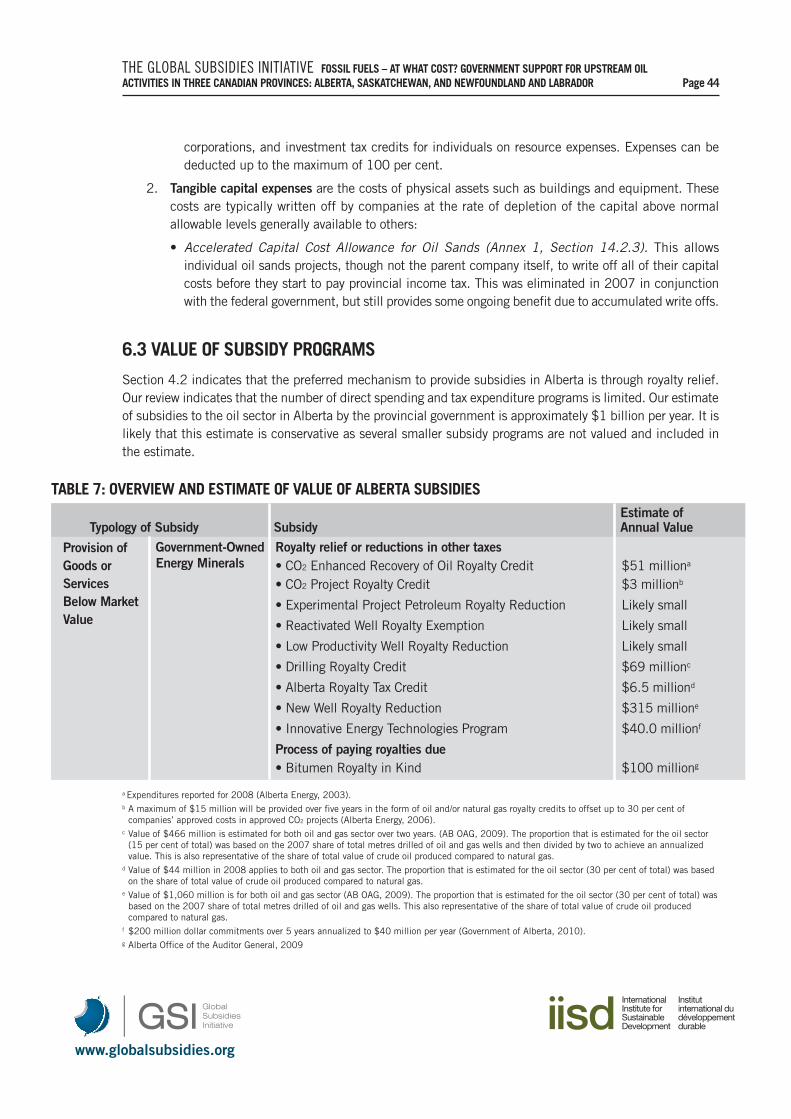
www.globalsubsidies.org
THE GLOBAL SUBSIDIES INITIATIVE FOSSIL FUELS – AT WHAT COST? GOVERNMENT SUPPORT FOR UPSTREAM OIL ACTIVITIES IN THREE CANADIAN PROVINCES: ALBERTA, SASKATCHEWAN, AND NEWFOUNDLAND AND LABRADOR Page 44
corporations, and investment tax credits for individuals on resource expenses. Expenses can bededucted up to the maximum of 100 per cent.
2. Tangible capital expenses are the costs of physical assets such as buildings and equipment. Thesecosts are typically written off by companies at the rate of depletion of the capital above normalallowable levels generally available to others:
• Accelerated Capital Cost Allowance for Oil Sands (Annex 1, Section 14.2.3). This allowsindividual oil sands projects, though not the parent company itself, to write off all of their capitalcosts before they start to pay provincial income tax. This was eliminated in 2007 in conjunctionwith the federal government, but still provides some ongoing benefit due to accumulated write offs.
6.3 VALUE OF SUBSIDY PROGRAMS
Section 4.2 indicates that the preferred mechanism to provide subsidies in Alberta is through royalty relief.Our review indicates that the number of direct spending and tax expenditure programs is limited. Our estimateof subsidies to the oil sector in Alberta by the provincial government is approximately $1 billion per year. It islikely that this estimate is conservative as several smaller subsidy programs are not valued and included inthe estimate.
TABLE 7: OVERVIEW AND ESTIMATE OF VALUE OF ALBERTA SUBSIDIES Estimate of
Typology of Subsidy Subsidy Annual ValueGovernment-Owned Royalty relief or reductions in other taxes Energy Minerals • CO2 Enhanced Recovery of Oil Royalty Credit $51 milliona
• CO2 Project Royalty Credit $3 millionb
• Experimental Project Petroleum Royalty Reduction Likely small
• Reactivated Well Royalty Exemption Likely small
• Low Productivity Well Royalty Reduction Likely small
• Drilling Royalty Credit $69 millionc
• Alberta Royalty Tax Credit $6.5 milliond
• New Well Royalty Reduction $315 millione
• Innovative Energy Technologies Program $40.0 millionf
Process of paying royalties due• Bitumen Royalty in Kind $100 milliong
Provision ofGoods orServicesBelow MarketValue
a Expenditures reported for 2008 (Alberta Energy, 2003).b A maximum of $15 million will be provided over five years in the form of oil and/or natural gas royalty credits to offset up to 30 per cent ofcompanies’ approved costs in approved CO2 projects (Alberta Energy, 2006).
c Value of $466 million is estimated for both oil and gas sector over two years. (AB OAG, 2009). The proportion that is estimated for the oil sector(15 per cent of total) was based on the 2007 share of total metres drilled of oil and gas wells and then divided by two to achieve an annualizedvalue. This is also representative of the share of total value of crude oil produced compared to natural gas.
d Value of $44 million in 2008 applies to both oil and gas sector. The proportion that is estimated for the oil sector (30 per cent of total) was basedon the share of total value of crude oil produced compared to natural gas.
e Value of $1,060 million is for both oil and gas sector (AB OAG, 2009). The proportion that is estimated for the oil sector (30 per cent of total) wasbased on the 2007 share of total metres drilled of oil and gas wells. This also representative of the share of total value of crude oil producedcompared to natural gas.
f $200 million dollar commitments over 5 years annualized to $40 million per year (Government of Alberta, 2010). g Alberta Office of the Auditor General, 2009
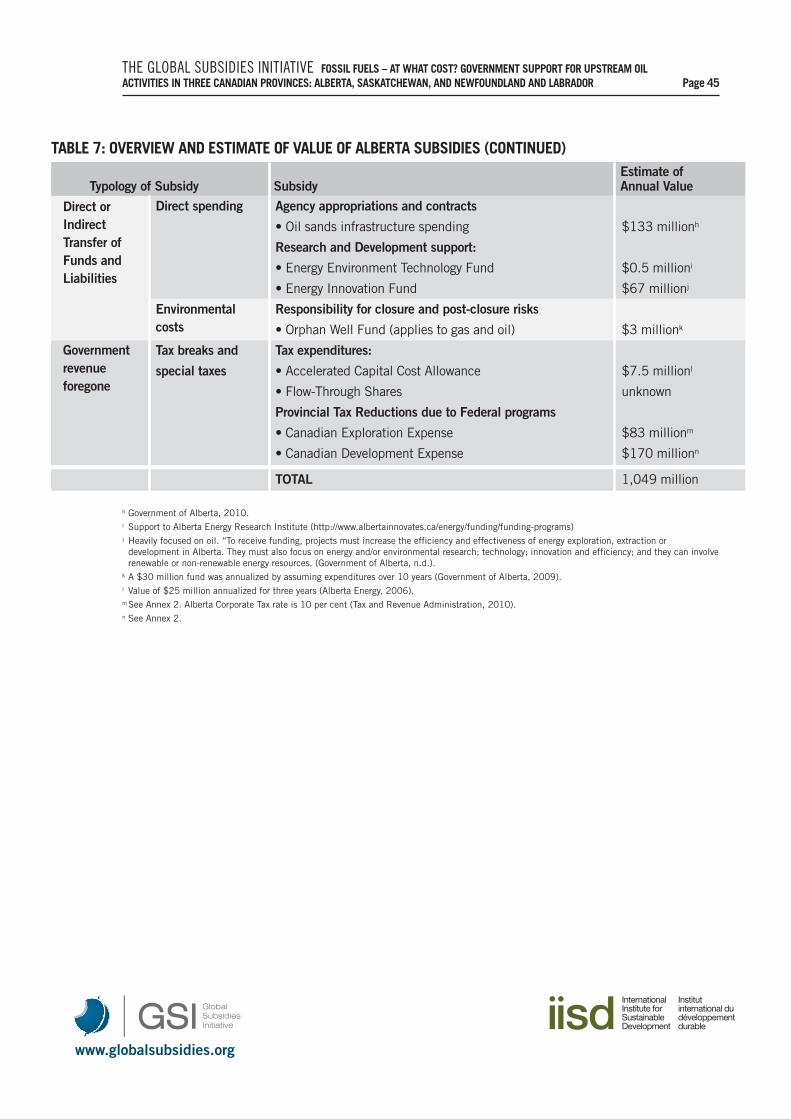
www.globalsubsidies.org
THE GLOBAL SUBSIDIES INITIATIVE FOSSIL FUELS – AT WHAT COST? GOVERNMENT SUPPORT FOR UPSTREAM OIL ACTIVITIES IN THREE CANADIAN PROVINCES: ALBERTA, SASKATCHEWAN, AND NEWFOUNDLAND AND LABRADOR Page 45
TABLE 7: OVERVIEW AND ESTIMATE OF VALUE OF ALBERTA SUBSIDIES (CONTINUED)Estimate of
Typology of Subsidy Subsidy Annual ValueDirect spending Agency appropriations and contracts
• Oil sands infrastructure spending $133 millionh
Research and Development support:
• Energy Environment Technology Fund $0.5 millioni
• Energy Innovation Fund $67 millionj
Environmental Responsibility for closure and post-closure risks costs • Orphan Well Fund (applies to gas and oil) $3 millionk
Tax breaks and Tax expenditures:
special taxes • Accelerated Capital Cost Allowance $7.5 millionl
• Flow-Through Shares unknown
Provincial Tax Reductions due to Federal programs
• Canadian Exploration Expense $83 millionm
• Canadian Development Expense $170 millionn
TOTAL 1,049 million
Direct orIndirectTransfer ofFunds andLiabilities
Governmentrevenueforegone
h Government of Alberta, 2010.i Support to Alberta Energy Research Institute (http://www.albertainnovates.ca/energy/funding/funding-programs) j Heavily focused on oil. “To receive funding, projects must increase the efficiency and effectiveness of energy exploration, extraction ordevelopment in Alberta. They must also focus on energy and/or environmental research; technology; innovation and efficiency; and they can involverenewable or non-renewable energy resources. (Government of Alberta, n.d.).
k A $30 million fund was annualized by assuming expenditures over 10 years (Government of Alberta, 2009).l Value of $25 million annualized for three years (Alberta Energy, 2006).mSee Annex 2. Alberta Corporate Tax rate is 10 per cent (Tax and Revenue Administration, 2010).n See Annex 2.

www.globalsubsidies.org
THE GLOBAL SUBSIDIES INITIATIVE FOSSIL FUELS – AT WHAT COST? GOVERNMENT SUPPORT FOR UPSTREAM OIL ACTIVITIES IN THREE CANADIAN PROVINCES: ALBERTA, SASKATCHEWAN, AND NEWFOUNDLAND AND LABRADOR Page 46
7. OIL SUBSIDIES IN SASKATCHEWAN
An increase in oil production in Saskatchewan over the last few decades can be attributed to advances indrilling technology, particularly the adoption of horizontal drilling techniques, continued strong developmentand exploration activity, and the production of greater amounts of heavy oil. To encourage these developments,the provincial government has introduced subsidies aimed at increasing investment and activity. The preferredmechanism to provide subsidies in Saskatchewan is through royalty relief and tax expenditures.
7.1 HISTORICAL CONTEXT OF SUBSIDY PROGRAMS
Saskatchewan’s first commercial crude oil discovery was made in 1944, although large-scale production didnot begin for several decades. Major oil fields were discovered in the province after intensive exploration inthe 1950s and 1960s. Heavy crude oil is generally produced in the southwest part of the province(Lloydminister and Kindersely areas) and light crude oil is produced mainly in the southeast part of theprovince. In the 1980s and 1990s oil production increased dramatically as new drilling technologies such ashorizontal drilling were developed. In recent years, overall oil production has remained relatively stable andconventional oil production is not expected to increase significantly in the future. Saskatchewan does haveoil sand deposits that are being explored but no projects have been announced.
In 2002 the province adjusted its royalty regime. The most significant change was that they lowered royaltyrates on oil and gas wells drilled on or after October 1, 2002 and introduced a new system of volumeincentives. The royalty paid on these volumes was fixed at 2.5 per cent for all wells, a change from priorregimes where horizontal wells had maintained 8 per cent or 4 per cent royalty rates depending on the typeof horizontal well drilled. Royalty rates in Saskatchewan are price-sensitive. Below a threshold price, a baseroyalty rate applies. Above that threshold, royalty rates increase with oil prices.
In recent years, the Saskatchewan government has introduced several subsidies to encourage new exploration,new production, as well as technologies that can enhance oil recovery. Lower royalty rates are offered for initialvolumes of oil produced from horizontal, exploratory and deep oil wells. Since 2005, incremental productionfrom an enhanced oil recovery (EOR) project are subject to a separate cost-sensitive royalty/tax structure thatincorporates lower royalty and freehold production tax rates. Prior to payout of investment and operatingexpenditures, EOR projects are subject to a Crown royalty rate of 1 per cent of gross revenue and a freeholdproduction tax rate of zero. After payout, the Crown royalty rate is 20 per cent of operating revenues and thefreehold production tax rate is 8 per cent of operating revenues.
The newly introduced Saskatchewan Petroleum Research Incentive (SPRI) provides a royalty credit equal to30 per cent of expenditures, to a maximum of $3 million in credits, towards qualifying EOR pilots andresearch, and development and demonstration projects involving the application of new technologies in theoil and natural gas sector.
Finally, there are about 650 orphan wells (i.e., abandoned without clear ownership for liability purposes) and180 orphan facilities in Saskatchewan. This represents a significant unfunded liability for the province(Saskatchewan Ministry of Energy and Resources, 2009b). These are essentially subsidies to past productionsince the avoided decommissioning costs do no benefit current production. As with Alberta, to the extentcurrent operations are not responsible for future decommissioning, a subsidy is likely conferred.
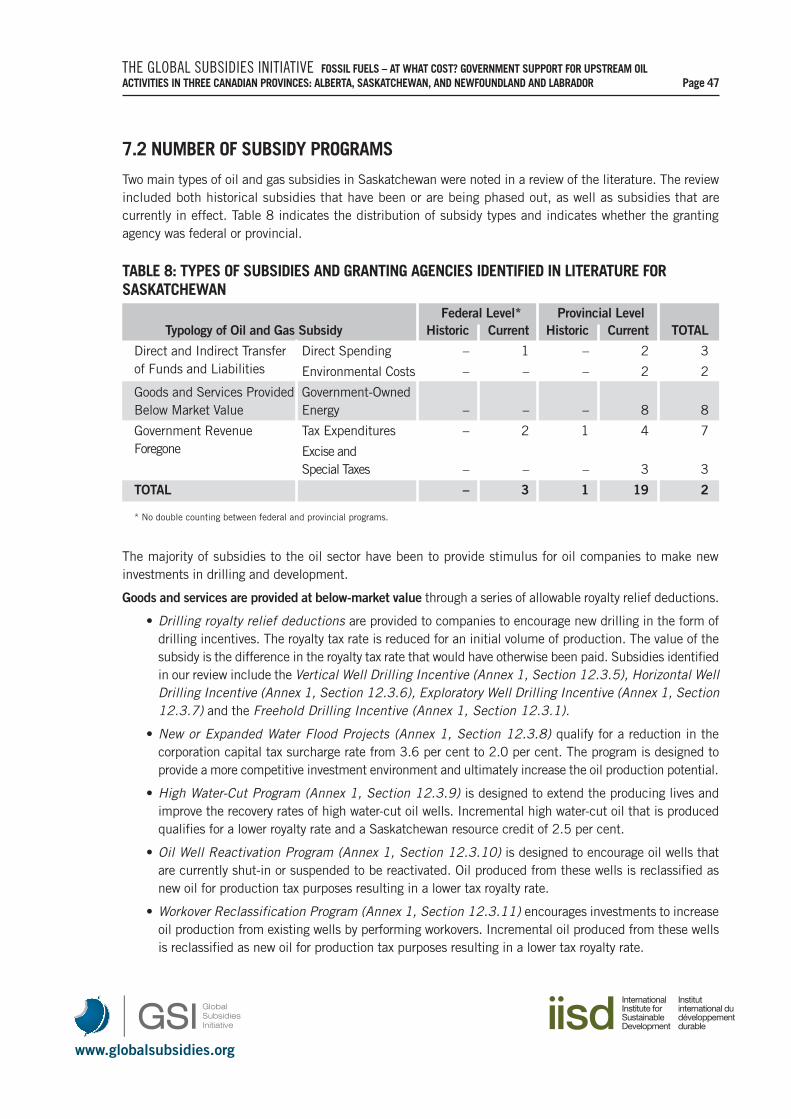
www.globalsubsidies.org
THE GLOBAL SUBSIDIES INITIATIVE FOSSIL FUELS – AT WHAT COST? GOVERNMENT SUPPORT FOR UPSTREAM OIL ACTIVITIES IN THREE CANADIAN PROVINCES: ALBERTA, SASKATCHEWAN, AND NEWFOUNDLAND AND LABRADOR Page 47
7.2 NUMBER OF SUBSIDY PROGRAMS
Two main types of oil and gas subsidies in Saskatchewan were noted in a review of the literature. The reviewincluded both historical subsidies that have been or are being phased out, as well as subsidies that arecurrently in effect. Table 8 indicates the distribution of subsidy types and indicates whether the grantingagency was federal or provincial.
TABLE 8: TYPES OF SUBSIDIES AND GRANTING AGENCIES IDENTIFIED IN LITERATURE FORSASKATCHEWAN
Federal Level* Provincial LevelTypology of Oil and Gas Subsidy Historic Current Historic Current TOTAL
Direct and Indirect Transfer Direct Spending – 1 – 2 3of Funds and Liabilities Environmental Costs – – – 2 2
Goods and Services Provided Government-OwnedBelow Market Value Energy – – – 8 8
Government Revenue Tax Expenditures – 2 1 4 7Foregone Excise and
Special Taxes – – – 3 3
TOTAL – 3 1 19 2
* No double counting between federal and provincial programs.
The majority of subsidies to the oil sector have been to provide stimulus for oil companies to make newinvestments in drilling and development.
Goods and services are provided at below-market value through a series of allowable royalty relief deductions.
• Drilling royalty relief deductions are provided to companies to encourage new drilling in the form ofdrilling incentives. The royalty tax rate is reduced for an initial volume of production. The value of thesubsidy is the difference in the royalty tax rate that would have otherwise been paid. Subsidies identifiedin our review include the Vertical Well Drilling Incentive (Annex 1, Section 12.3.5), Horizontal WellDrilling Incentive (Annex 1, Section 12.3.6), Exploratory Well Drilling Incentive (Annex 1, Section12.3.7) and the Freehold Drilling Incentive (Annex 1, Section 12.3.1).
• New or Expanded Water Flood Projects (Annex 1, Section 12.3.8) qualify for a reduction in thecorporation capital tax surcharge rate from 3.6 per cent to 2.0 per cent. The program is designed toprovide a more competitive investment environment and ultimately increase the oil production potential.
• High Water-Cut Program (Annex 1, Section 12.3.9) is designed to extend the producing lives andimprove the recovery rates of high water-cut oil wells. Incremental high water-cut oil that is producedqualifies for a lower royalty rate and a Saskatchewan resource credit of 2.5 per cent.
• Oil Well Reactivation Program (Annex 1, Section 12.3.10) is designed to encourage oil wells thatare currently shut-in or suspended to be reactivated. Oil produced from these wells is reclassified asnew oil for production tax purposes resulting in a lower tax royalty rate.
• Workover Reclassification Program (Annex 1, Section 12.3.11) encourages investments to increaseoil production from existing wells by performing workovers. Incremental oil produced from these wellsis reclassified as new oil for production tax purposes resulting in a lower tax royalty rate.
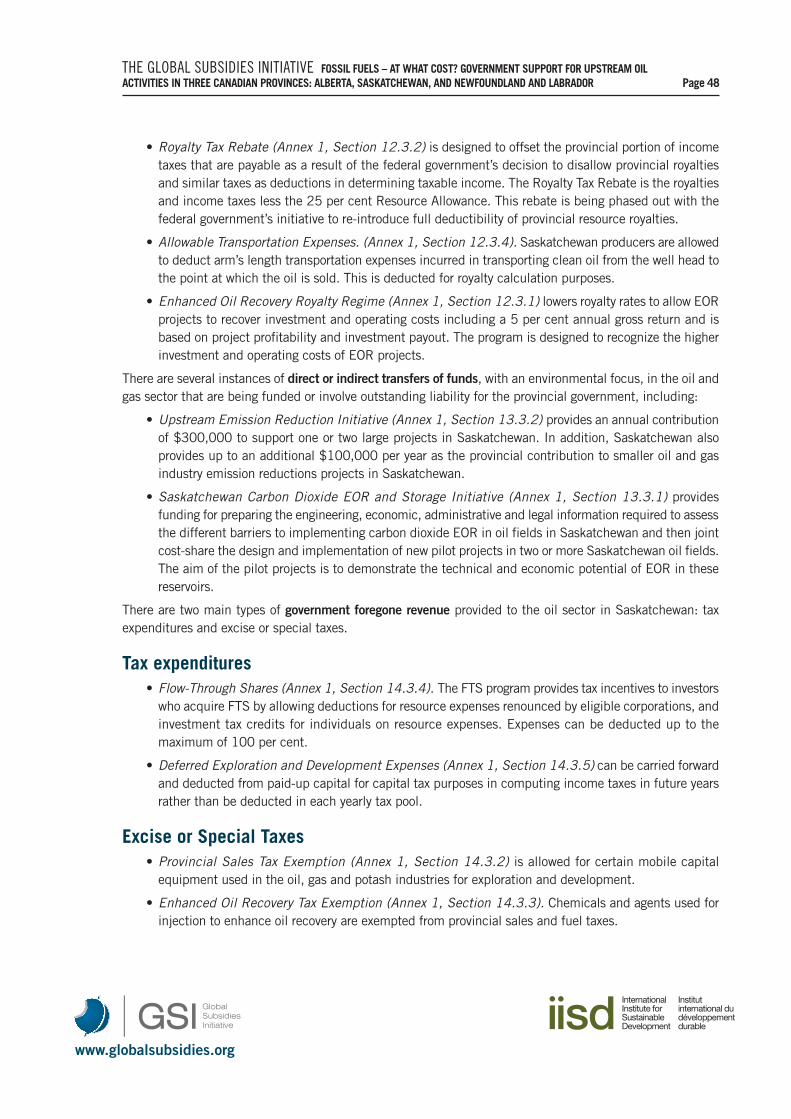
www.globalsubsidies.org
THE GLOBAL SUBSIDIES INITIATIVE FOSSIL FUELS – AT WHAT COST? GOVERNMENT SUPPORT FOR UPSTREAM OIL ACTIVITIES IN THREE CANADIAN PROVINCES: ALBERTA, SASKATCHEWAN, AND NEWFOUNDLAND AND LABRADOR Page 48
• Royalty Tax Rebate (Annex 1, Section 12.3.2) is designed to offset the provincial portion of incometaxes that are payable as a result of the federal government’s decision to disallow provincial royaltiesand similar taxes as deductions in determining taxable income. The Royalty Tax Rebate is the royaltiesand income taxes less the 25 per cent Resource Allowance. This rebate is being phased out with thefederal government’s initiative to re-introduce full deductibility of provincial resource royalties.
• Allowable Transportation Expenses. (Annex 1, Section 12.3.4). Saskatchewan producers are allowedto deduct arm’s length transportation expenses incurred in transporting clean oil from the well head tothe point at which the oil is sold. This is deducted for royalty calculation purposes.
• Enhanced Oil Recovery Royalty Regime (Annex 1, Section 12.3.1) lowers royalty rates to allow EORprojects to recover investment and operating costs including a 5 per cent annual gross return and isbased on project profitability and investment payout. The program is designed to recognize the higherinvestment and operating costs of EOR projects.
There are several instances of direct or indirect transfers of funds, with an environmental focus, in the oil andgas sector that are being funded or involve outstanding liability for the provincial government, including:
• Upstream Emission Reduction Initiative (Annex 1, Section 13.3.2) provides an annual contributionof $300,000 to support one or two large projects in Saskatchewan. In addition, Saskatchewan alsoprovides up to an additional $100,000 per year as the provincial contribution to smaller oil and gasindustry emission reductions projects in Saskatchewan.
• Saskatchewan Carbon Dioxide EOR and Storage Initiative (Annex 1, Section 13.3.1) providesfunding for preparing the engineering, economic, administrative and legal information required to assessthe different barriers to implementing carbon dioxide EOR in oil fields in Saskatchewan and then jointcost-share the design and implementation of new pilot projects in two or more Saskatchewan oil fields.The aim of the pilot projects is to demonstrate the technical and economic potential of EOR in thesereservoirs.
There are two main types of government foregone revenue provided to the oil sector in Saskatchewan: taxexpenditures and excise or special taxes.
Tax expenditures • Flow-Through Shares (Annex 1, Section 14.3.4). The FTS program provides tax incentives to investorswho acquire FTS by allowing deductions for resource expenses renounced by eligible corporations, andinvestment tax credits for individuals on resource expenses. Expenses can be deducted up to themaximum of 100 per cent.
• Deferred Exploration and Development Expenses (Annex 1, Section 14.3.5) can be carried forwardand deducted from paid-up capital for capital tax purposes in computing income taxes in future yearsrather than be deducted in each yearly tax pool.
Excise or Special Taxes• Provincial Sales Tax Exemption (Annex 1, Section 14.3.2) is allowed for certain mobile capitalequipment used in the oil, gas and potash industries for exploration and development.
• Enhanced Oil Recovery Tax Exemption (Annex 1, Section 14.3.3). Chemicals and agents used forinjection to enhance oil recovery are exempted from provincial sales and fuel taxes.
www.globalsubsidies.org
THE GLOBAL SUBSIDIES INITIATIVE FOSSIL FUELS – AT WHAT COST? GOVERNMENT SUPPORT FOR UPSTREAM OIL ACTIVITIES IN THREE CANADIAN PROVINCES: ALBERTA, SASKATCHEWAN, AND NEWFOUNDLAND AND LABRADOR Page 49
• Fuel Tax Rebate for Mineral Exploration (Annex 1, Section 14.3.6) is available as a tax credit againstincome taxes payable for unlicensed machinery and equipment used in mineral exploration, including oil.
7.3 VALUE OF SUBSIDY PROGRAMS
The preferred mechanism to provide subsidies in Saskatchewan is through royalty relief. Our review indicatesthat the number of direct spending and tax expenditure programs is limited. Our estimate of the subsidy tothe oil sector in Saskatchewan by the provincial government is $327 million per year. It is likely that thisestimate is conservative as several smaller subsidy programs are not valued and included in the estimate.
TABLE 9: OVERVIEW AND ESTIMATE OF VALUE OF SASKATCHEWAN SUBSIDIES Estimate of
Typology of Subsidy Subsidy Annual ValueGovernment-Owned Royalty relief or reductionsEnergy Minerals • Drilling Incentives (vertical, horizontal, exploratory $248 milliona
and freehold) Range ($96-$310)
• Enhanced Oil Recovery Royalty Regime $6.0 millionb
• Allowable Transportation Expenses Likely small
• New or Expanded Water Flood Projects Likely small
• High Water-Cut Program Likely small
• Oil Well Reactivation Program Likely small
• Workover Reclassification Program Likely small
• Saskatchewan Petroleum Research Incentive Program $1.0 millionc
Direct Spending Agency appropriations and contracts
• Resource and Energy Policy Grants $2.1 milliond
Research and development support
• Petroleum Technology Research Centre (PTRC) 1.1 millione
Environmental Environmental damagesCosts • Upstream Emission Reduction Initiative, Saskatchewan $0.3 millionf
Energy and Resources
• Saskatchewan Carbon Dioxide EOR and Storage Initiative $1.6 milliong
Goods orServicesBelow-MarketValue
Direct andIndirectTransfer ofFunds andLiabilities
a Value of drilling incentives estimated using 2008 heavy oil, non-heavy oil and southwest designated oil well production values and forecasted WTIprices for oil between $51 and $120. Average well production values were estimated based on balancing total net royalty tax revenues for 2008.Well data was analyzed from oil and gas reports from Energy and Resources Saskatchewan website: http://www.er.gov.sk.ca/oilgasstatreports.
b Government of Saskatchewan, 2005.c Government of Saskatchewan, 2007.d Government of Saskatchewan, 2009.e Saskatchewan Ministry of Energy and Resources, 2009c.f Government of Saskatchewan, n.d.g Saskatchewan Ministry of Energy and Resources, 2009a.
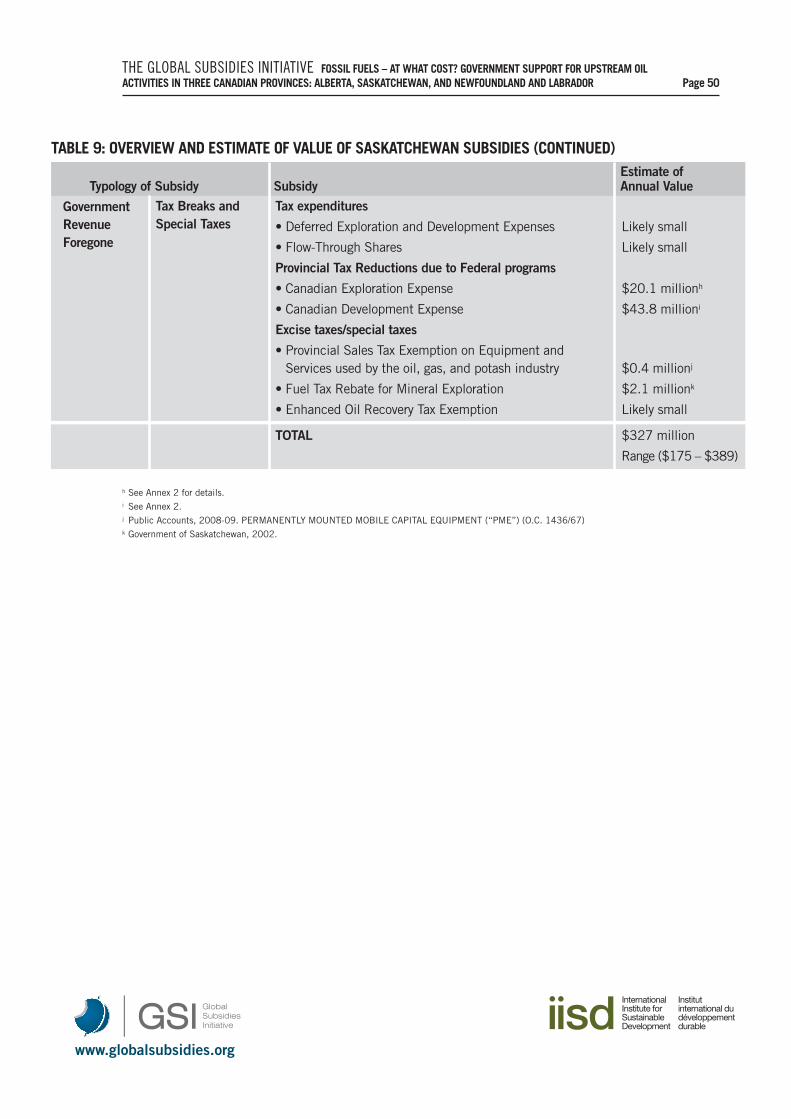
www.globalsubsidies.org
THE GLOBAL SUBSIDIES INITIATIVE FOSSIL FUELS – AT WHAT COST? GOVERNMENT SUPPORT FOR UPSTREAM OIL ACTIVITIES IN THREE CANADIAN PROVINCES: ALBERTA, SASKATCHEWAN, AND NEWFOUNDLAND AND LABRADOR Page 50
TABLE 9: OVERVIEW AND ESTIMATE OF VALUE OF SASKATCHEWAN SUBSIDIES (CONTINUED)Estimate of
Typology of Subsidy Subsidy Annual ValueTax Breaks and Tax expendituresSpecial Taxes • Deferred Exploration and Development Expenses Likely small
• Flow-Through Shares Likely small
Provincial Tax Reductions due to Federal programs
• Canadian Exploration Expense $20.1 millionh
• Canadian Development Expense $43.8 millioni
Excise taxes/special taxes
• Provincial Sales Tax Exemption on Equipment and Services used by the oil, gas, and potash industry $0.4 millionj
• Fuel Tax Rebate for Mineral Exploration $2.1 millionk
• Enhanced Oil Recovery Tax Exemption Likely small
TOTAL $327 million
Range ($175 – $389)
GovernmentRevenueForegone
h See Annex 2 for details. i See Annex 2.j Public Accounts, 2008-09. PERMANENTLY MOUNTED MOBILE CAPITAL EQUIPMENT (“PME”) (O.C. 1436/67)k Government of Saskatchewan, 2002.
www.globalsubsidies.org
THE GLOBAL SUBSIDIES INITIATIVE FOSSIL FUELS – AT WHAT COST? GOVERNMENT SUPPORT FOR UPSTREAM OIL ACTIVITIES IN THREE CANADIAN PROVINCES: ALBERTA, SASKATCHEWAN, AND NEWFOUNDLAND AND LABRADOR Page 51
8. OIL SUBSIDIES IN NEWFOUNDLAND AND LABRADOR
Today there are three producing offshore oil projects in Newfoundland and Labrador: Hibernia, Terra Novaand White Rose. Oil production exceeds 300,000 barrels of crude per day representing about 12 per cent ofCanada’s total crude oil production. Another offshore oil field, the Hebron project, is under development andthere are other significant discoveries that could be developed in the future. This makes the offshore oil andgas industry in Newfoundland and Labrador the most important industry sector in the province and it wasestimated in 2007 that 36 per cent of the nominal gross domestic product (GDP) was attributed to the oiland gas industry.
8.1 HISTORICAL CONTEXT OF SUBSIDY PROGRAMS
While the first exploration wells were drilled off the coast of Newfoundland and Labrador in the early 1960sdevelopment, exploration was not undertaken seriously until 1973 when oil prices increased dramatically.Oil and gas production in Newfoundland and Labrador began in earnest in 1997 with the development andfirst production from the Hibernia offshore oil field. However, an equally dramatic decline in prices from apeak in 1979 delayed any potential projects until the late 1990s as the economics provided little incentivefor development.
Offshore development is considerably more technically challenging and capital intensive than onshoreconventional oil development. As a result, the government needed to take a more hands-on approach andestablish predictable and competitive regulatory and royalty policies before oil companies were willing toinvest significant capital and explore and develop potential resources. Newfoundland and Labrador took on adifferent view of development than other provinces in Canada. The province established regulations thatsought to develop any oil resources that it found and not allow oil fields to remain fallow and oil companiesto determine the development schedule. These regulations are based on the development model that wasused for the North Sea and are intended to maximize local benefits without delaying development. The AtlanticAccord signed in 1985 allowed joint management of Newfoundland and Labrador’s offshore resources, givingthe province benefits as if the oil were located on land.
By the time the Atlantic Accord was signed and the province and oil companies were ready to negotiate thefirst offshore development agreement, prices were significantly depressed (i.e., between $20 and $30 perbarrel adjusted in time for inflation) and offshore development was only marginally profitable. However, theGovernment of Newfoundland and Labrador was determined to not delay the development of offshore resourcesand were willing to provide financial incentives in return for commitments to generate jobs in the province.As a result, the subsidies received in these early years were very generous by any standard. The provincialgovernment agreed to give the developers over $1 billion in grants and $1.7 billion in loan guarantees for the$5.2 billion Hibernia project. As a result, oil and gas subsidies were much higher in Newfoundland andLabrador than for conventional oil deposits in other provinces in Canada in order to be able to attract theinvestment for offshore development. The combination of low oil prices at the time, high technology risks andcommitment to bring jobs to Newfoundland and Labrador also allowed oil companies to negotiate a relativelylow royalty rate. The original royalty agreement was that the province would increase its take by 1 per cent ofgross revenue (sales less transport costs) every 18 months until it received 5 per cent of gross revenue. Whilethis arrangement may not have been unreasonable when world oil prices were low, when oil prices eventuallyincreased, companies successfully lobbied to increase production. Since royalties had not been tiered tovarious potential production levels (as with oil wells in Alberta and Saskatchewan), and instead fixed to
www.globalsubsidies.org
THE GLOBAL SUBSIDIES INITIATIVE FOSSIL FUELS – AT WHAT COST? GOVERNMENT SUPPORT FOR UPSTREAM OIL ACTIVITIES IN THREE CANADIAN PROVINCES: ALBERTA, SASKATCHEWAN, AND NEWFOUNDLAND AND LABRADOR Page 52
production and gross revenue for periods of time, the province did not gain by allowing an increase inproduction and actually lost money because existing oil was produced more quickly.
The second and third offshore projects, Terra Nova and White Rose, did not receive the same level of assistanceas the Hibernia project, but one consequence was that only a fraction of the project construction jobs andwork remained in Newfoundland. Royalty arrangements negotiated were more lucrative to the province. ForTerra Nova, it was estimated that the project would generate twice as much in royalties as Hibernia. In thecourse of negotiating the White Rose project, the province developed a generic royalty regime that was toapply to all future projects and was tied to production levels. This development was intended to be both fairto the province and provided more certainty to investors and financial security and create an investmentclimate that would help to encourage oil companies to invest in future projects.
In the development of the offshore oil field (Hebron) in 2006, the provincial government sought to alter thegeneric royalty regime to include an additional royalty that would kick in during times of very high oil pricesand also establish an equity stake in the project. Negotiations stalled on these demands. However, rising oilprices eventually increased the bargaining position of the province. In 2008, oil companies and the provinceexecuted an agreement to proceed with the Hebron project. The province did receive an equity stake (althoughless than what it had originally sought) and an improved royalty regime with an additional 6.5 per cent royaltypaid on net revenues whenever monthly average oil prices exceed $50 U.S. WTI per barrel, calculated afterthe net royalty payout was made.
The Hibernia, White Rose and Hebron offshore projects are the only projects in Canada where either federalor provincial governments have equity stake in oil and gas projects. While there is inherent risk in establishingequity stake in offshore oil development, the stake in Newfoundland and Labrador has turned out to be quitelucrative. An 8.5 per cent stake in the Hibernia project for which the government paid $290 million in theearly 1990s earned the federal government $288 million in revenue in 2008–2009 alone and over $1 billionwithin the past seven years. This equity stake is roughly equivalent to the $332 million in federal subsidiesestimated for 2008.
In 2008–2009 the Province of Newfoundland and Labrador earned an estimated $2.5 billion annually fromoil royalties representing over 30 per cent of the total provincial revenues. Forecasts for 2009–2010 aresignificantly lower due to lower world oil prices and lower production. As in other Canadian jurisdictions andmost developments around the world, royalties are now tiered based on production levels and net revenues.
8.2 NUMBER OF SUBSIDY PROGRAMS
Four main types of oil and gas subsidies in Newfoundland and Labrador were noted in a review of the literature.The review included both historical subsidies that were offered for the first offshore exploration projects to beestablished, as well as subsidies that are currently in effect. Table 10 indicates the distribution of subsidy typesand indicates whether the granting agency was federal, provincial or from both federal and provincial sources.
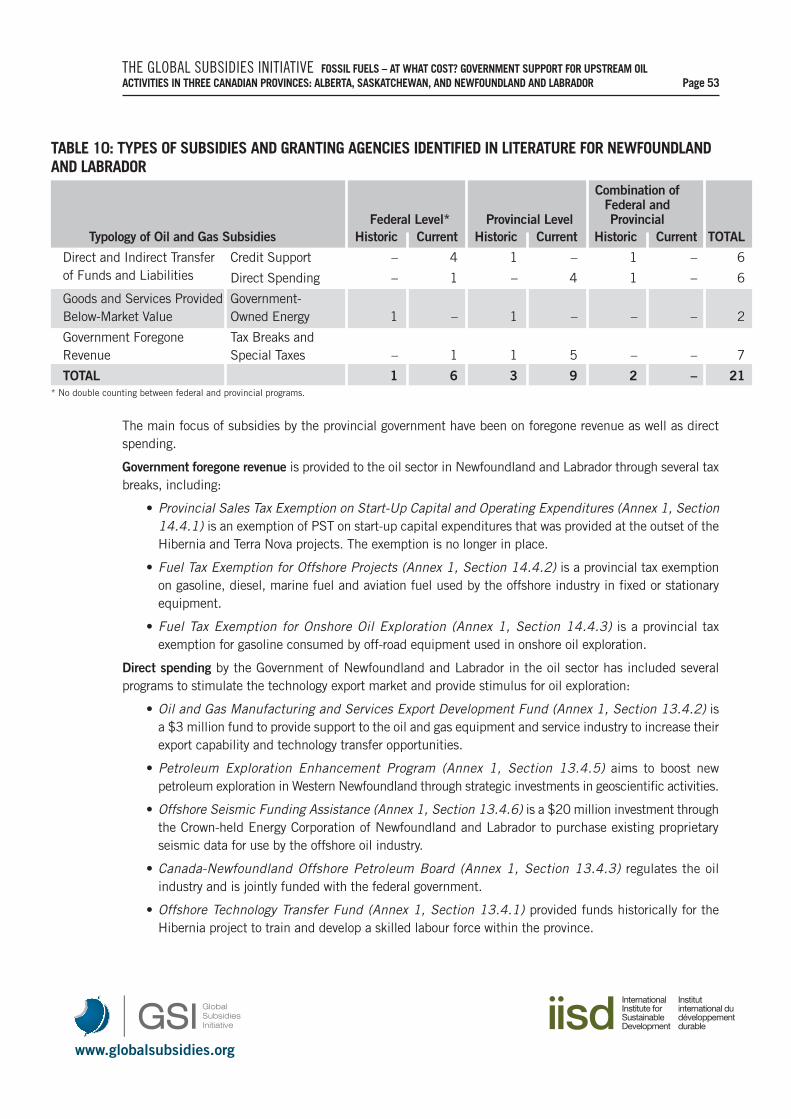
www.globalsubsidies.org
THE GLOBAL SUBSIDIES INITIATIVE FOSSIL FUELS – AT WHAT COST? GOVERNMENT SUPPORT FOR UPSTREAM OIL ACTIVITIES IN THREE CANADIAN PROVINCES: ALBERTA, SASKATCHEWAN, AND NEWFOUNDLAND AND LABRADOR Page 53
TABLE 10: TYPES OF SUBSIDIES AND GRANTING AGENCIES IDENTIFIED IN LITERATURE FOR NEWFOUNDLAND AND LABRADOR
Combination ofFederal and
Federal Level* Provincial Level ProvincialTypology of Oil and Gas Subsidies Historic Current Historic Current Historic Current TOTAL
Direct and Indirect Transfer Credit Support – 4 1 – 1 – 6of Funds and Liabilities Direct Spending – 1 – 4 1 – 6
Goods and Services Provided Government-Below-Market Value Owned Energy 1 – 1 – – – 2
Government Foregone Tax Breaks and Revenue Special Taxes – 1 1 5 – – 7
TOTAL 1 6 3 9 2 – 21* No double counting between federal and provincial programs.
The main focus of subsidies by the provincial government have been on foregone revenue as well as directspending.
Government foregone revenue is provided to the oil sector in Newfoundland and Labrador through several taxbreaks, including:
• Provincial Sales Tax Exemption on Start-Up Capital and Operating Expenditures (Annex 1, Section14.4.1) is an exemption of PST on start-up capital expenditures that was provided at the outset of theHibernia and Terra Nova projects. The exemption is no longer in place.
• Fuel Tax Exemption for Offshore Projects (Annex 1, Section 14.4.2) is a provincial tax exemptionon gasoline, diesel, marine fuel and aviation fuel used by the offshore industry in fixed or stationaryequipment.
• Fuel Tax Exemption for Onshore Oil Exploration (Annex 1, Section 14.4.3) is a provincial taxexemption for gasoline consumed by off-road equipment used in onshore oil exploration.
Direct spending by the Government of Newfoundland and Labrador in the oil sector has included severalprograms to stimulate the technology export market and provide stimulus for oil exploration:
• Oil and Gas Manufacturing and Services Export Development Fund (Annex 1, Section 13.4.2) isa $3 million fund to provide support to the oil and gas equipment and service industry to increase theirexport capability and technology transfer opportunities.
• Petroleum Exploration Enhancement Program (Annex 1, Section 13.4.5) aims to boost newpetroleum exploration in Western Newfoundland through strategic investments in geoscientific activities.
• Offshore Seismic Funding Assistance (Annex 1, Section 13.4.6) is a $20 million investment throughthe Crown-held Energy Corporation of Newfoundland and Labrador to purchase existing proprietaryseismic data for use by the offshore oil industry.
• Canada-Newfoundland Offshore Petroleum Board (Annex 1, Section 13.4.3) regulates the oilindustry and is jointly funded with the federal government.
• Offshore Technology Transfer Fund (Annex 1, Section 13.4.1) provided funds historically for theHibernia project to train and develop a skilled labour force within the province.
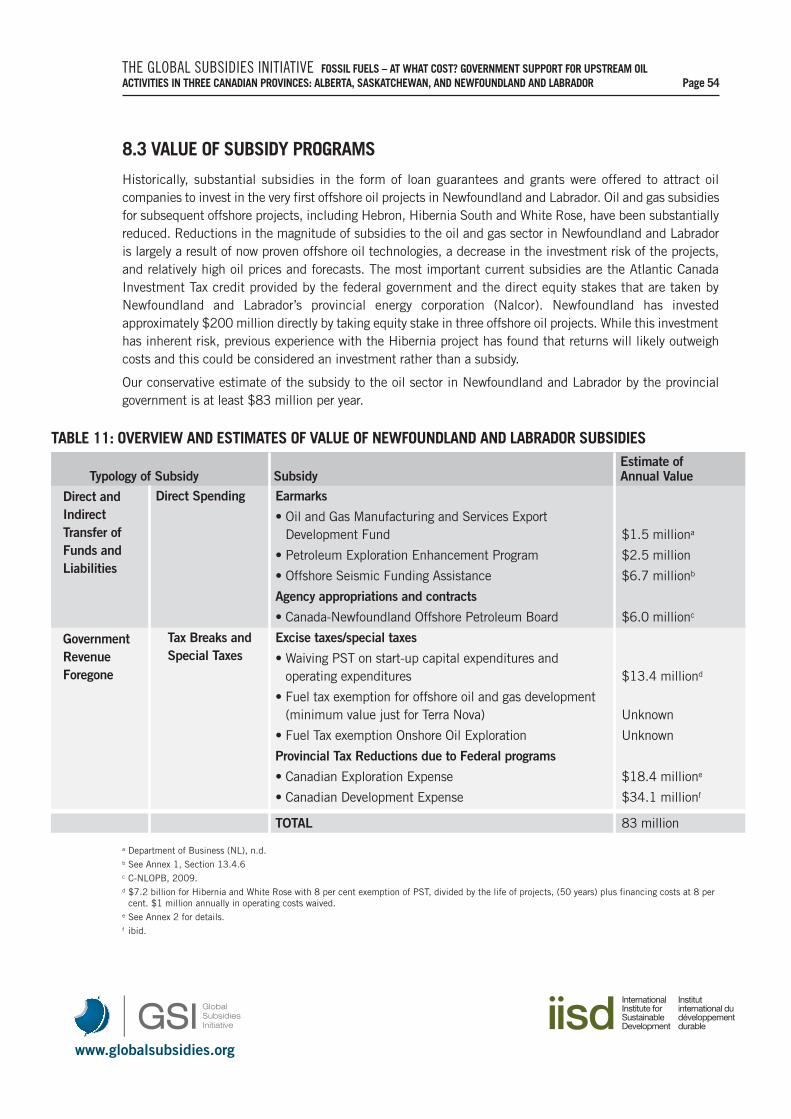
www.globalsubsidies.org
THE GLOBAL SUBSIDIES INITIATIVE FOSSIL FUELS – AT WHAT COST? GOVERNMENT SUPPORT FOR UPSTREAM OIL ACTIVITIES IN THREE CANADIAN PROVINCES: ALBERTA, SASKATCHEWAN, AND NEWFOUNDLAND AND LABRADOR Page 54
8.3 VALUE OF SUBSIDY PROGRAMS
Historically, substantial subsidies in the form of loan guarantees and grants were offered to attract oilcompanies to invest in the very first offshore oil projects in Newfoundland and Labrador. Oil and gas subsidiesfor subsequent offshore projects, including Hebron, Hibernia South and White Rose, have been substantiallyreduced. Reductions in the magnitude of subsidies to the oil and gas sector in Newfoundland and Labradoris largely a result of now proven offshore oil technologies, a decrease in the investment risk of the projects,and relatively high oil prices and forecasts. The most important current subsidies are the Atlantic CanadaInvestment Tax credit provided by the federal government and the direct equity stakes that are taken byNewfoundland and Labrador’s provincial energy corporation (Nalcor). Newfoundland has investedapproximately $200 million directly by taking equity stake in three offshore oil projects. While this investmenthas inherent risk, previous experience with the Hibernia project has found that returns will likely outweighcosts and this could be considered an investment rather than a subsidy.
Our conservative estimate of the subsidy to the oil sector in Newfoundland and Labrador by the provincialgovernment is at least $83 million per year.
TABLE 11: OVERVIEW AND ESTIMATES OF VALUE OF NEWFOUNDLAND AND LABRADOR SUBSIDIESEstimate of
Typology of Subsidy Subsidy Annual ValueDirect Spending Earmarks
• Oil and Gas Manufacturing and Services Export Development Fund $1.5 milliona
• Petroleum Exploration Enhancement Program $2.5 million
• Offshore Seismic Funding Assistance $6.7 millionb
Agency appropriations and contracts
• Canada-Newfoundland Offshore Petroleum Board $6.0 millionc
Tax Breaks and Excise taxes/special taxesSpecial Taxes • Waiving PST on start-up capital expenditures and
operating expenditures $13.4 milliond
• Fuel tax exemption for offshore oil and gas development (minimum value just for Terra Nova) Unknown
• Fuel Tax exemption Onshore Oil Exploration Unknown
Provincial Tax Reductions due to Federal programs
• Canadian Exploration Expense $18.4 millione
• Canadian Development Expense $34.1 millionf
TOTAL 83 million
Direct andIndirectTransfer ofFunds andLiabilities
GovernmentRevenueForegone
a Department of Business (NL), n.d. b See Annex 1, Section 13.4.6c C-NLOPB, 2009.d $7.2 billion for Hibernia and White Rose with 8 per cent exemption of PST, divided by the life of projects, (50 years) plus financing costs at 8 percent. $1 million annually in operating costs waived.
e See Annex 2 for details. f ibid.
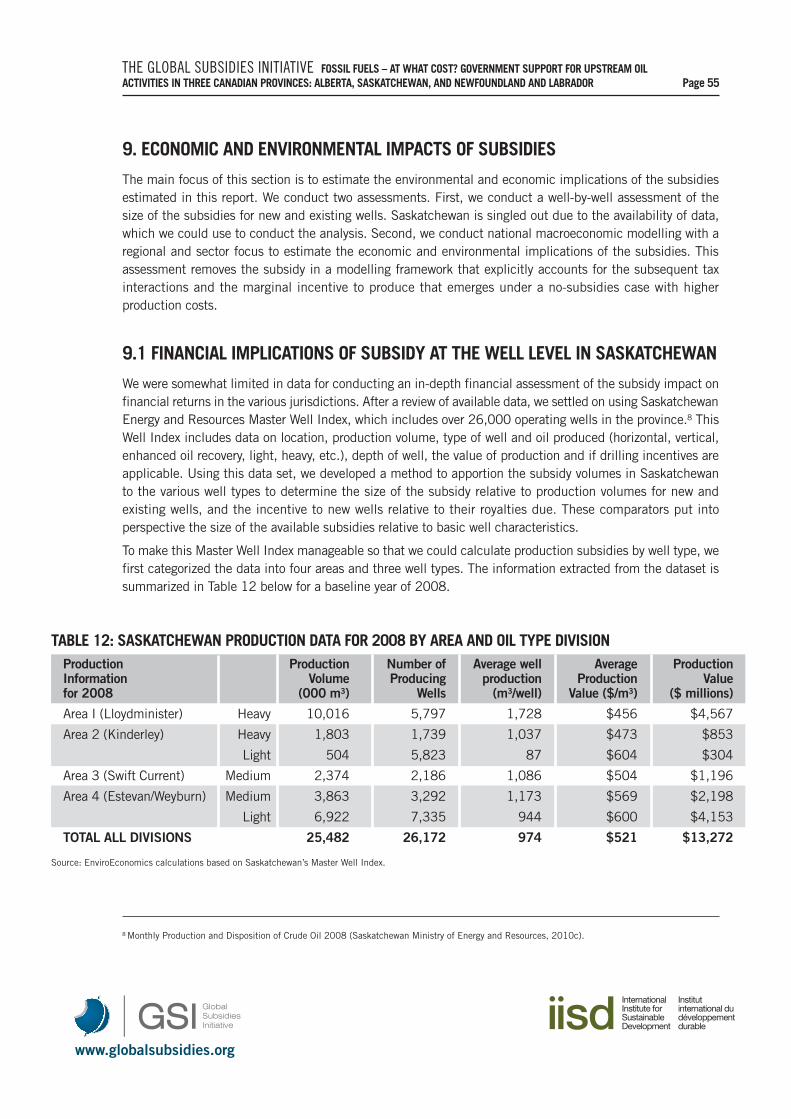
www.globalsubsidies.org
THE GLOBAL SUBSIDIES INITIATIVE FOSSIL FUELS – AT WHAT COST? GOVERNMENT SUPPORT FOR UPSTREAM OIL ACTIVITIES IN THREE CANADIAN PROVINCES: ALBERTA, SASKATCHEWAN, AND NEWFOUNDLAND AND LABRADOR Page 55
9. ECONOMIC AND ENVIRONMENTAL IMPACTS OF SUBSIDIES
The main focus of this section is to estimate the environmental and economic implications of the subsidiesestimated in this report. We conduct two assessments. First, we conduct a well-by-well assessment of thesize of the subsidies for new and existing wells. Saskatchewan is singled out due to the availability of data,which we could use to conduct the analysis. Second, we conduct national macroeconomic modelling with aregional and sector focus to estimate the economic and environmental implications of the subsidies. Thisassessment removes the subsidy in a modelling framework that explicitly accounts for the subsequent taxinteractions and the marginal incentive to produce that emerges under a no-subsidies case with higherproduction costs.
9.1 FINANCIAL IMPLICATIONS OF SUBSIDY AT THE WELL LEVEL IN SASKATCHEWAN
We were somewhat limited in data for conducting an in-depth financial assessment of the subsidy impact onfinancial returns in the various jurisdictions. After a review of available data, we settled on using SaskatchewanEnergy and Resources Master Well Index, which includes over 26,000 operating wells in the province.8 ThisWell Index includes data on location, production volume, type of well and oil produced (horizontal, vertical,enhanced oil recovery, light, heavy, etc.), depth of well, the value of production and if drilling incentives areapplicable. Using this data set, we developed a method to apportion the subsidy volumes in Saskatchewanto the various well types to determine the size of the subsidy relative to production volumes for new andexisting wells, and the incentive to new wells relative to their royalties due. These comparators put intoperspective the size of the available subsidies relative to basic well characteristics.
To make this Master Well Index manageable so that we could calculate production subsidies by well type, wefirst categorized the data into four areas and three well types. The information extracted from the dataset issummarized in Table 12 below for a baseline year of 2008.
8 Monthly Production and Disposition of Crude Oil 2008 (Saskatchewan Ministry of Energy and Resources, 2010c).
TABLE 12: SASKATCHEWAN PRODUCTION DATA FOR 2008 BY AREA AND OIL TYPE DIVISIONProduction Production Number of Average well Average ProductionInformation Volume Producing production Production Valuefor 2008 (000 m3) Wells (m3/well) Value ($/m3) ($ millions)
Area I (Lloydminister) Heavy 10,016 5,797 1,728 $456 $4,567
Area 2 (Kinderley) Heavy 1,803 1,739 1,037 $473 $853
Light 504 5,823 87 $604 $304
Area 3 (Swift Current) Medium 2,374 2,186 1,086 $504 $1,196
Area 4 (Estevan/Weyburn) Medium 3,863 3,292 1,173 $569 $2,198
Light 6,922 7,335 944 $600 $4,153
TOTAL ALL DIVISIONS 25,482 26,172 974 $521 $13,272
Source: EnviroEconomics calculations based on Saskatchewan’s Master Well Index.
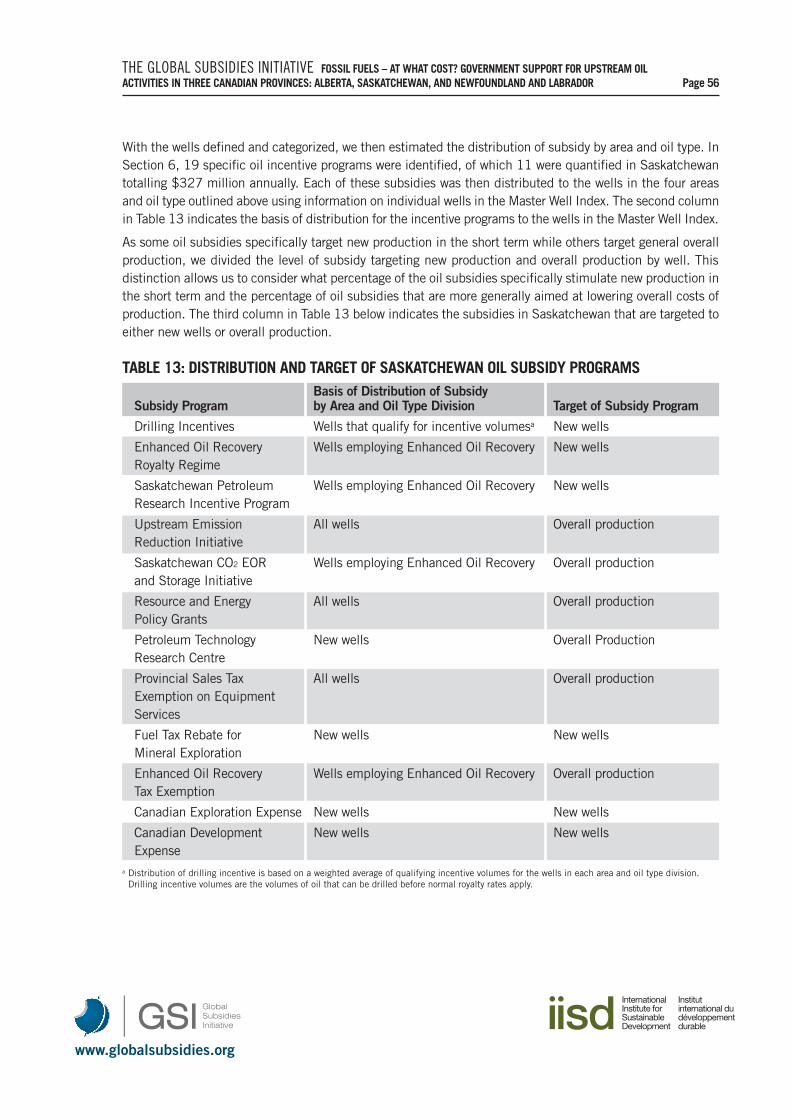
www.globalsubsidies.org
THE GLOBAL SUBSIDIES INITIATIVE FOSSIL FUELS – AT WHAT COST? GOVERNMENT SUPPORT FOR UPSTREAM OIL ACTIVITIES IN THREE CANADIAN PROVINCES: ALBERTA, SASKATCHEWAN, AND NEWFOUNDLAND AND LABRADOR Page 56
With the wells defined and categorized, we then estimated the distribution of subsidy by area and oil type. InSection 6, 19 specific oil incentive programs were identified, of which 11 were quantified in Saskatchewantotalling $327 million annually. Each of these subsidies was then distributed to the wells in the four areasand oil type outlined above using information on individual wells in the Master Well Index. The second columnin Table 13 indicates the basis of distribution for the incentive programs to the wells in the Master Well Index.
As some oil subsidies specifically target new production in the short term while others target general overallproduction, we divided the level of subsidy targeting new production and overall production by well. Thisdistinction allows us to consider what percentage of the oil subsidies specifically stimulate new production inthe short term and the percentage of oil subsidies that are more generally aimed at lowering overall costs ofproduction. The third column in Table 13 below indicates the subsidies in Saskatchewan that are targeted toeither new wells or overall production.
TABLE 13: DISTRIBUTION AND TARGET OF SASKATCHEWAN OIL SUBSIDY PROGRAMSBasis of Distribution of Subsidy
Subsidy Program by Area and Oil Type Division Target of Subsidy Program
Drilling Incentives Wells that qualify for incentive volumesa New wells
Enhanced Oil Recovery Wells employing Enhanced Oil Recovery New wellsRoyalty Regime
Saskatchewan Petroleum Wells employing Enhanced Oil Recovery New wellsResearch Incentive Program
Upstream Emission All wells Overall productionReduction Initiative
Saskatchewan CO2 EOR Wells employing Enhanced Oil Recovery Overall productionand Storage Initiative
Resource and Energy All wells Overall productionPolicy Grants
Petroleum Technology New wells Overall ProductionResearch Centre
Provincial Sales Tax All wells Overall productionExemption on Equipment Services
Fuel Tax Rebate for New wells New wellsMineral Exploration
Enhanced Oil Recovery Wells employing Enhanced Oil Recovery Overall productionTax Exemption
Canadian Exploration Expense New wells New wells
Canadian Development New wells New wellsExpense
a Distribution of drilling incentive is based on a weighted average of qualifying incentive volumes for the wells in each area and oil type division.Drilling incentive volumes are the volumes of oil that can be drilled before normal royalty rates apply.
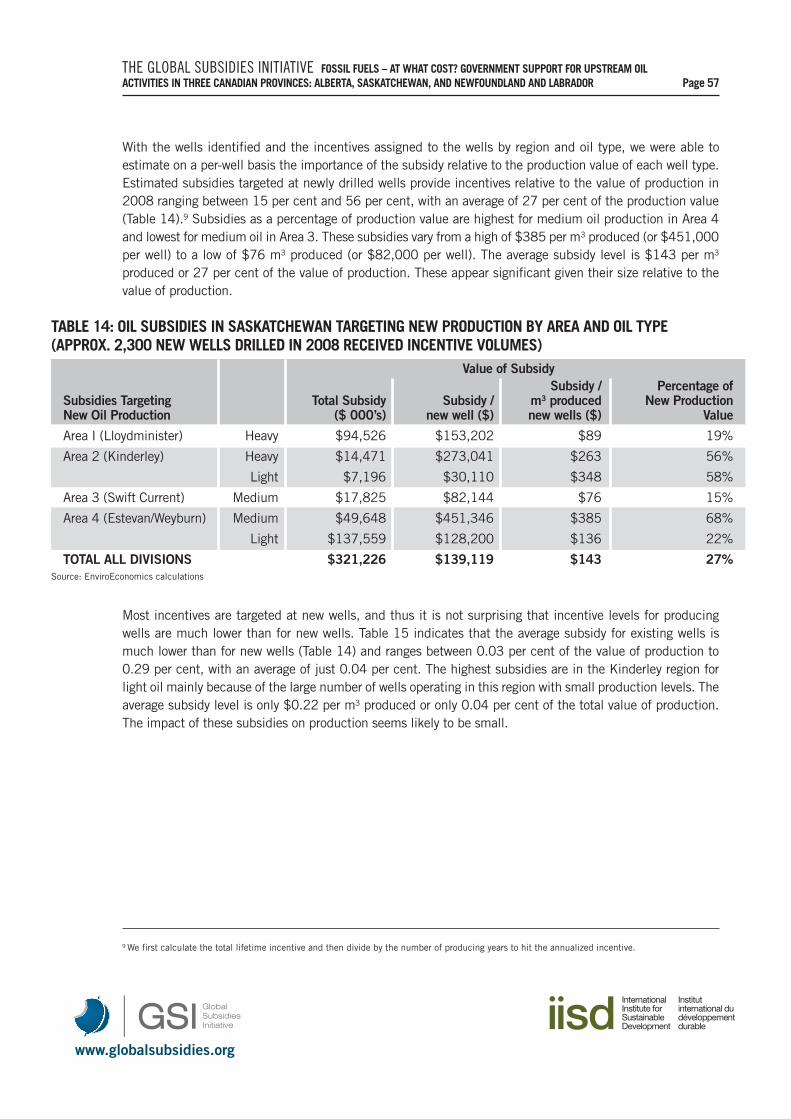
www.globalsubsidies.org
THE GLOBAL SUBSIDIES INITIATIVE FOSSIL FUELS – AT WHAT COST? GOVERNMENT SUPPORT FOR UPSTREAM OIL ACTIVITIES IN THREE CANADIAN PROVINCES: ALBERTA, SASKATCHEWAN, AND NEWFOUNDLAND AND LABRADOR Page 57
With the wells identified and the incentives assigned to the wells by region and oil type, we were able toestimate on a per-well basis the importance of the subsidy relative to the production value of each well type.Estimated subsidies targeted at newly drilled wells provide incentives relative to the value of production in2008 ranging between 15 per cent and 56 per cent, with an average of 27 per cent of the production value(Table 14).9 Subsidies as a percentage of production value are highest for medium oil production in Area 4and lowest for medium oil in Area 3. These subsidies vary from a high of $385 per m3 produced (or $451,000per well) to a low of $76 m3 produced (or $82,000 per well). The average subsidy level is $143 per m3
produced or 27 per cent of the value of production. These appear significant given their size relative to thevalue of production.
9 We first calculate the total lifetime incentive and then divide by the number of producing years to hit the annualized incentive.
TABLE 14: OIL SUBSIDIES IN SASKATCHEWAN TARGETING NEW PRODUCTION BY AREA AND OIL TYPE (APPROX. 2,300 NEW WELLS DRILLED IN 2008 RECEIVED INCENTIVE VOLUMES)
Value of SubsidySubsidy / Percentage of
Subsidies Targeting Total Subsidy Subsidy / m3 produced New Production New Oil Production ($ 000’s) new well ($) new wells ($) Value
Area I (Lloydminister) Heavy $94,526 $153,202 $89 19%
Area 2 (Kinderley) Heavy $14,471 $273,041 $263 56%
Light $7,196 $30,110 $348 58%
Area 3 (Swift Current) Medium $17,825 $82,144 $76 15%
Area 4 (Estevan/Weyburn) Medium $49,648 $451,346 $385 68%
Light $137,559 $128,200 $136 22%
TOTAL ALL DIVISIONS $321,226 $139,119 $143 27%Source: EnviroEconomics calculations
Most incentives are targeted at new wells, and thus it is not surprising that incentive levels for producingwells are much lower than for new wells. Table 15 indicates that the average subsidy for existing wells ismuch lower than for new wells (Table 14) and ranges between 0.03 per cent of the value of production to0.29 per cent, with an average of just 0.04 per cent. The highest subsidies are in the Kinderley region forlight oil mainly because of the large number of wells operating in this region with small production levels. Theaverage subsidy level is only $0.22 per m3 produced or only 0.04 per cent of the total value of production.The impact of these subsidies on production seems likely to be small.
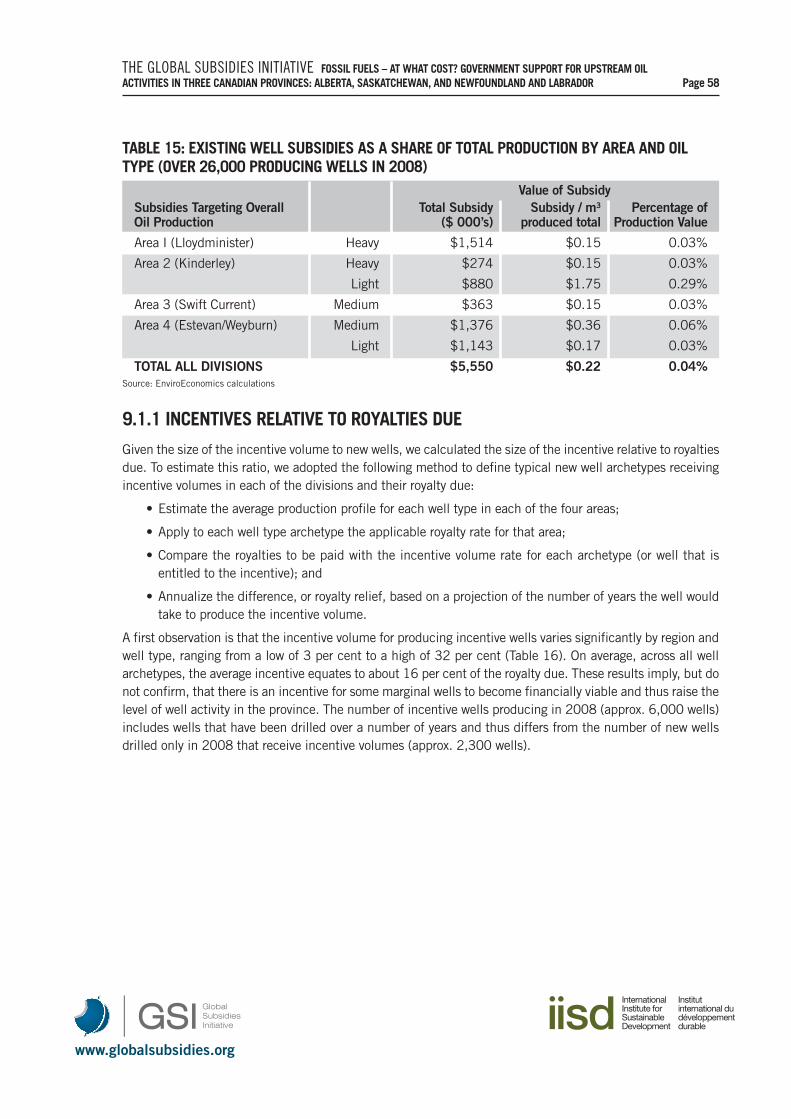
www.globalsubsidies.org
THE GLOBAL SUBSIDIES INITIATIVE FOSSIL FUELS – AT WHAT COST? GOVERNMENT SUPPORT FOR UPSTREAM OIL ACTIVITIES IN THREE CANADIAN PROVINCES: ALBERTA, SASKATCHEWAN, AND NEWFOUNDLAND AND LABRADOR Page 58
TABLE 15: EXISTING WELL SUBSIDIES AS A SHARE OF TOTAL PRODUCTION BY AREA AND OILTYPE (OVER 26,000 PRODUCING WELLS IN 2008)
Value of SubsidySubsidies Targeting Overall Total Subsidy Subsidy / m3 Percentage of Oil Production ($ 000’s) produced total Production Value
Area I (Lloydminister) Heavy $1,514 $0.15 0.03%
Area 2 (Kinderley) Heavy $274 $0.15 0.03%
Light $880 $1.75 0.29%
Area 3 (Swift Current) Medium $363 $0.15 0.03%
Area 4 (Estevan/Weyburn) Medium $1,376 $0.36 0.06%
Light $1,143 $0.17 0.03%
TOTAL ALL DIVISIONS $5,550 $0.22 0.04%Source: EnviroEconomics calculations
9.1.1 INCENTIVES RELATIVE TO ROYALTIES DUE
Given the size of the incentive volume to new wells, we calculated the size of the incentive relative to royaltiesdue. To estimate this ratio, we adopted the following method to define typical new well archetypes receivingincentive volumes in each of the divisions and their royalty due:
• Estimate the average production profile for each well type in each of the four areas;
• Apply to each well type archetype the applicable royalty rate for that area;
• Compare the royalties to be paid with the incentive volume rate for each archetype (or well that isentitled to the incentive); and
• Annualize the difference, or royalty relief, based on a projection of the number of years the well wouldtake to produce the incentive volume.
A first observation is that the incentive volume for producing incentive wells varies significantly by region andwell type, ranging from a low of 3 per cent to a high of 32 per cent (Table 16). On average, across all wellarchetypes, the average incentive equates to about 16 per cent of the royalty due. These results imply, but donot confirm, that there is an incentive for some marginal wells to become financially viable and thus raise thelevel of well activity in the province. The number of incentive wells producing in 2008 (approx. 6,000 wells)includes wells that have been drilled over a number of years and thus differs from the number of new wellsdrilled only in 2008 that receive incentive volumes (approx. 2,300 wells).
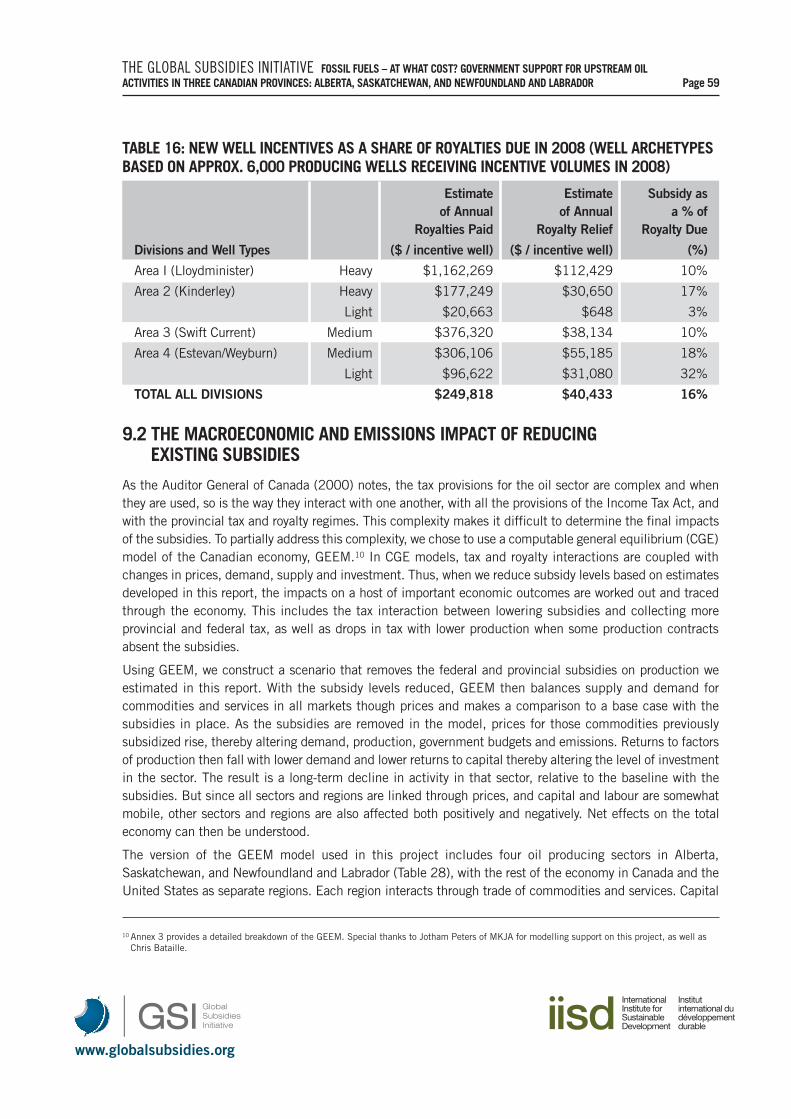
www.globalsubsidies.org
THE GLOBAL SUBSIDIES INITIATIVE FOSSIL FUELS – AT WHAT COST? GOVERNMENT SUPPORT FOR UPSTREAM OIL ACTIVITIES IN THREE CANADIAN PROVINCES: ALBERTA, SASKATCHEWAN, AND NEWFOUNDLAND AND LABRADOR Page 59
TABLE 16: NEW WELL INCENTIVES AS A SHARE OF ROYALTIES DUE IN 2008 (WELL ARCHETYPESBASED ON APPROX. 6,000 PRODUCING WELLS RECEIVING INCENTIVE VOLUMES IN 2008)
Estimate Estimate Subsidy asof Annual of Annual a % of
Royalties Paid Royalty Relief Royalty Due
Divisions and Well Types ($ / incentive well) ($ / incentive well) (%)
Area I (Lloydminister) Heavy $1,162,269 $112,429 10%
Area 2 (Kinderley) Heavy $177,249 $30,650 17%
Light $20,663 $648 3%
Area 3 (Swift Current) Medium $376,320 $38,134 10%
Area 4 (Estevan/Weyburn) Medium $306,106 $55,185 18%
Light $96,622 $31,080 32%
TOTAL ALL DIVISIONS $249,818 $40,433 16%
9.2 THE MACROECONOMIC AND EMISSIONS IMPACT OF REDUCINGEXISTING SUBSIDIES
As the Auditor General of Canada (2000) notes, the tax provisions for the oil sector are complex and whenthey are used, so is the way they interact with one another, with all the provisions of the Income Tax Act, andwith the provincial tax and royalty regimes. This complexity makes it difficult to determine the final impactsof the subsidies. To partially address this complexity, we chose to use a computable general equilibrium (CGE)model of the Canadian economy, GEEM.10 In CGE models, tax and royalty interactions are coupled withchanges in prices, demand, supply and investment. Thus, when we reduce subsidy levels based on estimatesdeveloped in this report, the impacts on a host of important economic outcomes are worked out and tracedthrough the economy. This includes the tax interaction between lowering subsidies and collecting moreprovincial and federal tax, as well as drops in tax with lower production when some production contractsabsent the subsidies.
Using GEEM, we construct a scenario that removes the federal and provincial subsidies on production weestimated in this report. With the subsidy levels reduced, GEEM then balances supply and demand forcommodities and services in all markets though prices and makes a comparison to a base case with thesubsidies in place. As the subsidies are removed in the model, prices for those commodities previouslysubsidized rise, thereby altering demand, production, government budgets and emissions. Returns to factorsof production then fall with lower demand and lower returns to capital thereby altering the level of investmentin the sector. The result is a long-term decline in activity in that sector, relative to the baseline with thesubsidies. But since all sectors and regions are linked through prices, and capital and labour are somewhatmobile, other sectors and regions are also affected both positively and negatively. Net effects on the totaleconomy can then be understood.
The version of the GEEM model used in this project includes four oil producing sectors in Alberta,Saskatchewan, and Newfoundland and Labrador (Table 28), with the rest of the economy in Canada and theUnited States as separate regions. Each region interacts through trade of commodities and services. Capital
10 Annex 3 provides a detailed breakdown of the GEEM. Special thanks to Jotham Peters of MKJA for modelling support on this project, as well asChris Bataille.
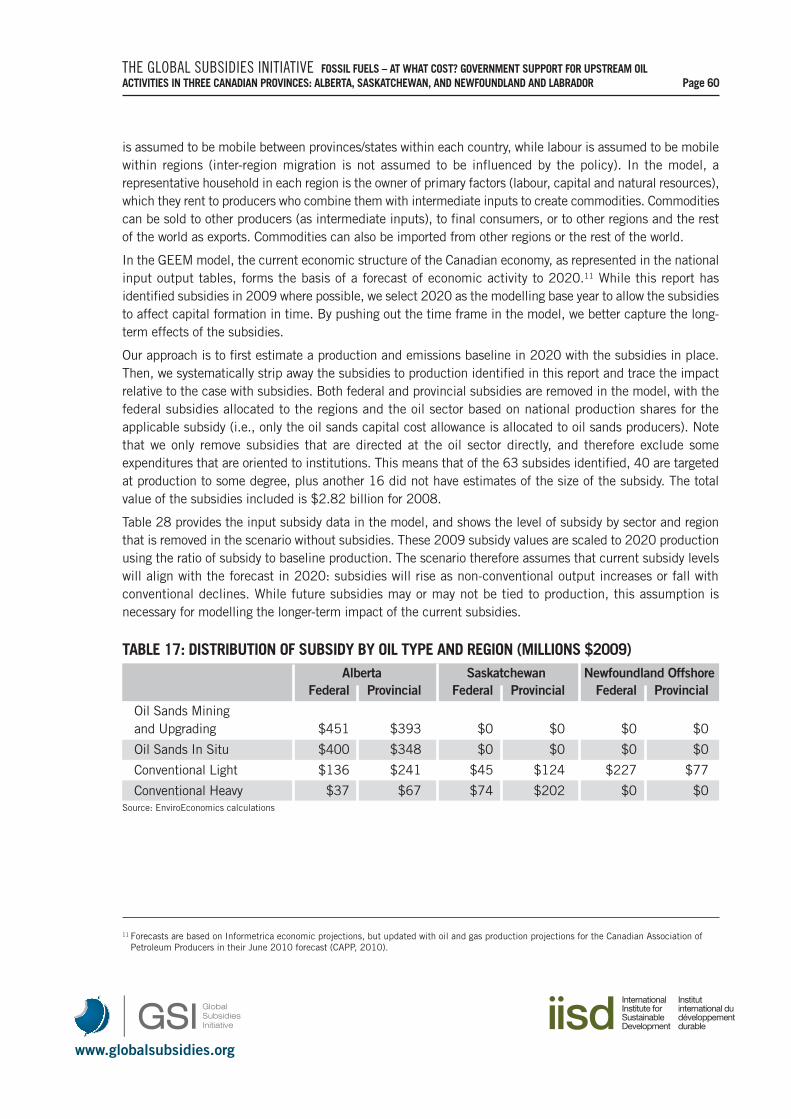
www.globalsubsidies.org
THE GLOBAL SUBSIDIES INITIATIVE FOSSIL FUELS – AT WHAT COST? GOVERNMENT SUPPORT FOR UPSTREAM OIL ACTIVITIES IN THREE CANADIAN PROVINCES: ALBERTA, SASKATCHEWAN, AND NEWFOUNDLAND AND LABRADOR Page 60
is assumed to be mobile between provinces/states within each country, while labour is assumed to be mobilewithin regions (inter-region migration is not assumed to be influenced by the policy). In the model, arepresentative household in each region is the owner of primary factors (labour, capital and natural resources),which they rent to producers who combine them with intermediate inputs to create commodities. Commoditiescan be sold to other producers (as intermediate inputs), to final consumers, or to other regions and the restof the world as exports. Commodities can also be imported from other regions or the rest of the world.
In the GEEM model, the current economic structure of the Canadian economy, as represented in the nationalinput output tables, forms the basis of a forecast of economic activity to 2020.11 While this report hasidentified subsidies in 2009 where possible, we select 2020 as the modelling base year to allow the subsidiesto affect capital formation in time. By pushing out the time frame in the model, we better capture the long-term effects of the subsidies.
Our approach is to first estimate a production and emissions baseline in 2020 with the subsidies in place.Then, we systematically strip away the subsidies to production identified in this report and trace the impactrelative to the case with subsidies. Both federal and provincial subsidies are removed in the model, with thefederal subsidies allocated to the regions and the oil sector based on national production shares for theapplicable subsidy (i.e., only the oil sands capital cost allowance is allocated to oil sands producers). Notethat we only remove subsidies that are directed at the oil sector directly, and therefore exclude someexpenditures that are oriented to institutions. This means that of the 63 subsides identified, 40 are targetedat production to some degree, plus another 16 did not have estimates of the size of the subsidy. The totalvalue of the subsidies included is $2.82 billion for 2008.
Table 28 provides the input subsidy data in the model, and shows the level of subsidy by sector and regionthat is removed in the scenario without subsidies. These 2009 subsidy values are scaled to 2020 productionusing the ratio of subsidy to baseline production. The scenario therefore assumes that current subsidy levelswill align with the forecast in 2020: subsidies will rise as non-conventional output increases or fall withconventional declines. While future subsidies may or may not be tied to production, this assumption isnecessary for modelling the longer-term impact of the current subsidies.
11 Forecasts are based on Informetrica economic projections, but updated with oil and gas production projections for the Canadian Association ofPetroleum Producers in their June 2010 forecast (CAPP, 2010).
TABLE 17: DISTRIBUTION OF SUBSIDY BY OIL TYPE AND REGION (MILLIONS $2009)Alberta Saskatchewan Newfoundland Offshore
Federal Provincial Federal Provincial Federal Provincial
Oil Sands Mining and Upgrading $451 $393 $0 $0 $0 $0
Oil Sands In Situ $400 $348 $0 $0 $0 $0
Conventional Light $136 $241 $45 $124 $227 $77
Conventional Heavy $37 $67 $74 $202 $0 $0Source: EnviroEconomics calculations
www.globalsubsidies.org
THE GLOBAL SUBSIDIES INITIATIVE FOSSIL FUELS – AT WHAT COST? GOVERNMENT SUPPORT FOR UPSTREAM OIL ACTIVITIES IN THREE CANADIAN PROVINCES: ALBERTA, SASKATCHEWAN, AND NEWFOUNDLAND AND LABRADOR Page 61
With the quantities of subsidies to be removed by type of oil production and jurisdiction, the no-subsidiesscenario was run to determine impacts on government budgets, GDP and emissions in 2020. Table 18presents the results of the scenario when the subsidy equivalent to about 2.5 per cent of the sector’s valueof production is removed:
• Gross Domestic Product (GDP) falls significantly in the oil sector but is mostly unaffected economy-wide. Overall, the economy-wide impacts of the no-subsidies case is small, ranging between a low ofzero nationally to a high of 0.16 per cent in Alberta. But, this small change masks some rather largeimpacts in the oil-producing sectors, as the removal of the subsidy increases production costs, therebymaking some production uneconomic. Output is scaled back significantly, with lower rates of newcapital formation driving much of this decline. Alberta is hardest hit with a drop in GDP in the oil sectorof 6 per cent, while the impact in Newfoundland and Labrador is small (0.3 per cent). This disparityhas much to do with the characteristics of the two regions: Alberta is expanding capacity rapidly andhence the subsidies impact the formation of new capital more than in Newfoundland where new offshorecapital is growing at a much slower pace. But still, at basic prices (GDP), the economy-wide impactsare small, with the reduction in the oil sector partially offset as the subsidy is redirected by governmentspending elsewhere in the economy.
• Net exports fall with the decline oil produced. Not surprisingly, the trade surplus for oil falls in all cases,and significantly in Alberta. This is less a price effect, since world oil prices are unchanged by movementin Canadian production and more about output declines. Natural gas imports to Alberta also fall offsignificantly as there is less demand in the non-conventional sector, thereby improving the trade surplus.Indeed one indirect beneficiary of the oil subsidies is the gas sector, which sees its output fall with thebenefit of the subsidies removed and less gas demand from the non-conventional oil sector.
• Employment increases, although not significantly. Although we do not recycle the subsidy revenue inthe model to any partial purpose, the increase in government budgets and subsequent spending doesdrive up employment. This has much to do with a drop in the capital-intensive oil sector relative togovernment spending that tends to be more labour intensive. Similarly, labour income tax rises in allprovinces as a result of redirecting the subsidy expenditures.
• Government budgets improve. In all jurisdictions, there is a net improvement in government balances,primarily due to the savings from subsidies that are not paid, even accounting for losses in royaltypayments and corporate income taxes from the oil sector. In the simulation, current subsidy levels arescaled to future production, and with a large increase in forecast production, the value of the subsidiesnot paid are large relative to government spending in Alberta and Saskatchewan.12 Corporate incometax and royalty revenues in the provinces are all lower relative to the case with subsidies, which isexpected with less oil sector output. Labour income tax is higher as more labour is employed—lessactivity in the capital-intensive oil sector is offset by more activity in the relatively labour-intensive restof the economy. Alberta has the highest budget savings given its large relative subsidy due to a rapidlyexpanding oil sector, with the subsidy not paid more than compensating for the reduced royalties andcorporate income tax.
12 In 2008, Alberta subsidies, as estimated in this report, are about 2.7 per cent of Budget 2008 expenses ($1.05 billion on $37 billion), and inSaskatchewan they are 2.8 per cent ($0.26 billion on $9.4 billion) (Government of Saskatchewan, 2008).
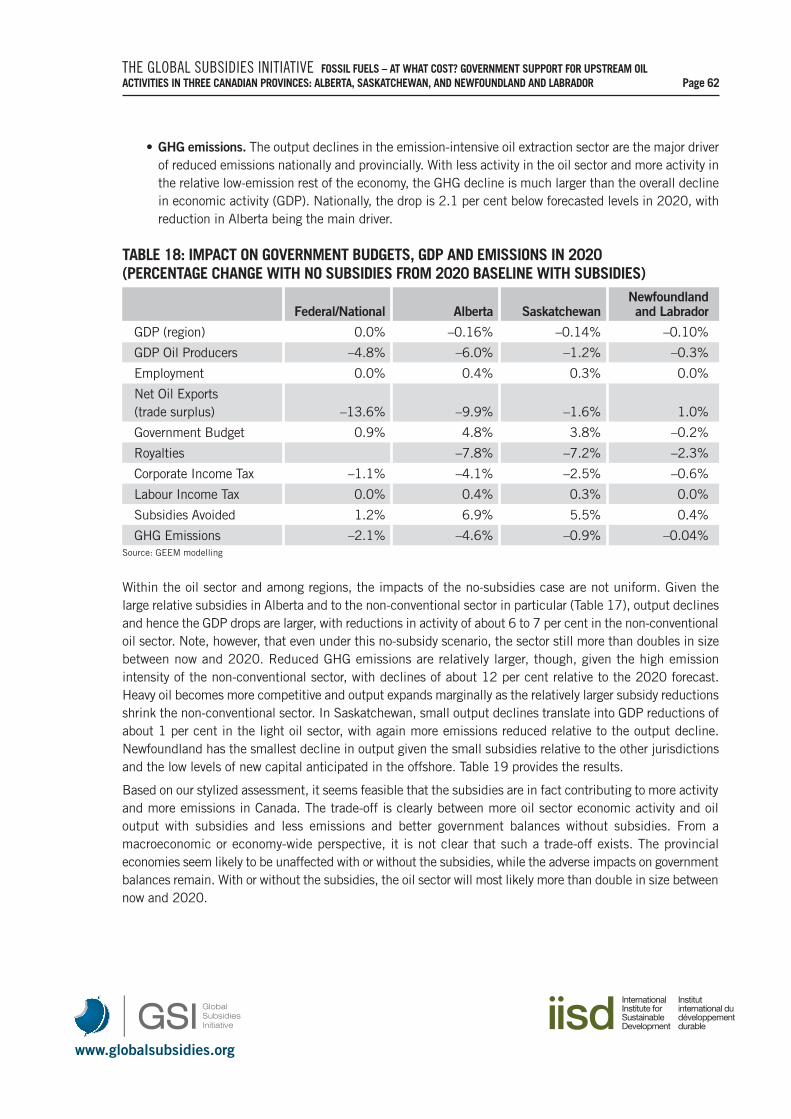
www.globalsubsidies.org
THE GLOBAL SUBSIDIES INITIATIVE FOSSIL FUELS – AT WHAT COST? GOVERNMENT SUPPORT FOR UPSTREAM OIL ACTIVITIES IN THREE CANADIAN PROVINCES: ALBERTA, SASKATCHEWAN, AND NEWFOUNDLAND AND LABRADOR Page 62
TABLE 18: IMPACT ON GOVERNMENT BUDGETS, GDP AND EMISSIONS IN 2020 (PERCENTAGE CHANGE WITH NO SUBSIDIES FROM 2020 BASELINE WITH SUBSIDIES)
Newfoundland Federal/National Alberta Saskatchewan and Labrador
GDP (region) 0.0% –0.16% –0.14% –0.10%
GDP Oil Producers –4.8% –6.0% –1.2% –0.3%
Employment 0.0% 0.4% 0.3% 0.0%
Net Oil Exports(trade surplus) –13.6% –9.9% –1.6% 1.0%
Government Budget 0.9% 4.8% 3.8% –0.2%
Royalties –7.8% –7.2% –2.3%
Corporate Income Tax –1.1% –4.1% –2.5% –0.6%
Labour Income Tax 0.0% 0.4% 0.3% 0.0%
Subsidies Avoided 1.2% 6.9% 5.5% 0.4%
GHG Emissions –2.1% –4.6% –0.9% –0.04%Source: GEEM modelling
• GHG emissions. The output declines in the emission-intensive oil extraction sector are the major driverof reduced emissions nationally and provincially. With less activity in the oil sector and more activity inthe relative low-emission rest of the economy, the GHG decline is much larger than the overall declinein economic activity (GDP). Nationally, the drop is 2.1 per cent below forecasted levels in 2020, withreduction in Alberta being the main driver.
Within the oil sector and among regions, the impacts of the no-subsidies case are not uniform. Given thelarge relative subsidies in Alberta and to the non-conventional sector in particular (Table 17), output declinesand hence the GDP drops are larger, with reductions in activity of about 6 to 7 per cent in the non-conventionaloil sector. Note, however, that even under this no-subsidy scenario, the sector still more than doubles in sizebetween now and 2020. Reduced GHG emissions are relatively larger, though, given the high emissionintensity of the non-conventional sector, with declines of about 12 per cent relative to the 2020 forecast.Heavy oil becomes more competitive and output expands marginally as the relatively larger subsidy reductionsshrink the non-conventional sector. In Saskatchewan, small output declines translate into GDP reductions ofabout 1 per cent in the light oil sector, with again more emissions reduced relative to the output decline.Newfoundland has the smallest decline in output given the small subsidies relative to the other jurisdictionsand the low levels of new capital anticipated in the offshore. Table 19 provides the results.
Based on our stylized assessment, it seems feasible that the subsidies are in fact contributing to more activityand more emissions in Canada. The trade-off is clearly between more oil sector economic activity and oiloutput with subsidies and less emissions and better government balances without subsidies. From amacroeconomic or economy-wide perspective, it is not clear that such a trade-off exists. The provincialeconomies seem likely to be unaffected with or without the subsidies, while the adverse impacts on governmentbalances remain. With or without the subsidies, the oil sector will most likely more than double in size betweennow and 2020.
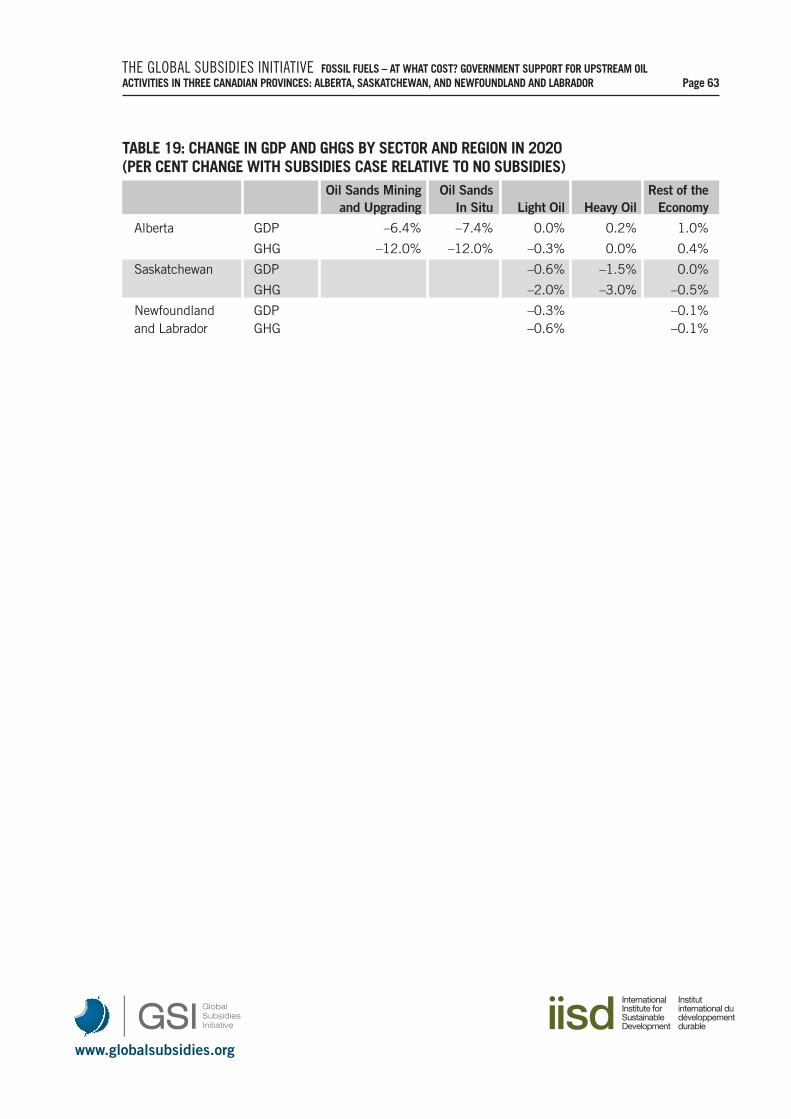
www.globalsubsidies.org
THE GLOBAL SUBSIDIES INITIATIVE FOSSIL FUELS – AT WHAT COST? GOVERNMENT SUPPORT FOR UPSTREAM OIL ACTIVITIES IN THREE CANADIAN PROVINCES: ALBERTA, SASKATCHEWAN, AND NEWFOUNDLAND AND LABRADOR Page 63
TABLE 19: CHANGE IN GDP AND GHGS BY SECTOR AND REGION IN 2020 (PER CENT CHANGE WITH SUBSIDIES CASE RELATIVE TO NO SUBSIDIES)
Oil Sands Mining Oil Sands Rest of theand Upgrading In Situ Light Oil Heavy Oil Economy
Alberta GDP –6.4% –7.4% 0.0% 0.2% 1.0%
GHG –12.0% –12.0% –0.3% 0.0% 0.4%
Saskatchewan GDP –0.6% –1.5% 0.0%
GHG –2.0% –3.0% –0.5%
Newfoundland GDP –0.3% –0.1%and Labrador GHG –0.6% –0.1%
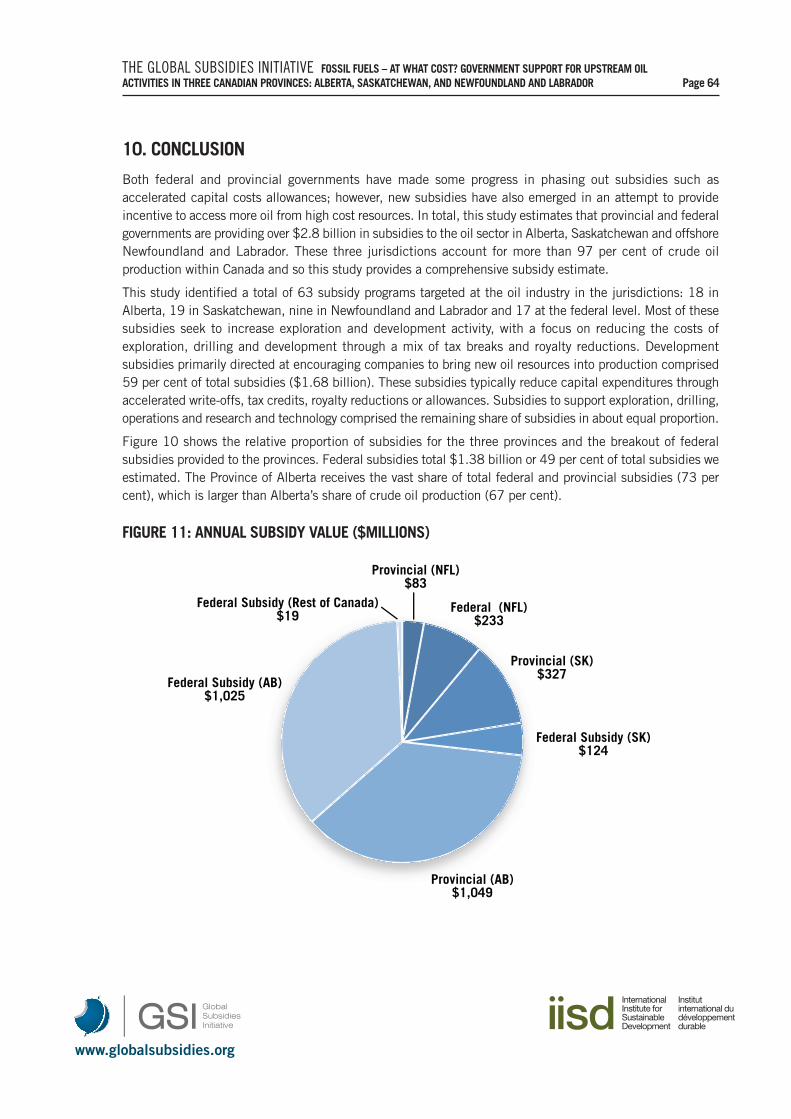
www.globalsubsidies.org
THE GLOBAL SUBSIDIES INITIATIVE FOSSIL FUELS – AT WHAT COST? GOVERNMENT SUPPORT FOR UPSTREAM OIL ACTIVITIES IN THREE CANADIAN PROVINCES: ALBERTA, SASKATCHEWAN, AND NEWFOUNDLAND AND LABRADOR Page 64
10. CONCLUSION
Both federal and provincial governments have made some progress in phasing out subsidies such asaccelerated capital costs allowances; however, new subsidies have also emerged in an attempt to provideincentive to access more oil from high cost resources. In total, this study estimates that provincial and federalgovernments are providing over $2.8 billion in subsidies to the oil sector in Alberta, Saskatchewan and offshoreNewfoundland and Labrador. These three jurisdictions account for more than 97 per cent of crude oilproduction within Canada and so this study provides a comprehensive subsidy estimate.
This study identified a total of 63 subsidy programs targeted at the oil industry in the jurisdictions: 18 inAlberta, 19 in Saskatchewan, nine in Newfoundland and Labrador and 17 at the federal level. Most of thesesubsidies seek to increase exploration and development activity, with a focus on reducing the costs ofexploration, drilling and development through a mix of tax breaks and royalty reductions. Developmentsubsidies primarily directed at encouraging companies to bring new oil resources into production comprised59 per cent of total subsidies ($1.68 billion). These subsidies typically reduce capital expenditures throughaccelerated write-offs, tax credits, royalty reductions or allowances. Subsidies to support exploration, drilling,operations and research and technology comprised the remaining share of subsidies in about equal proportion.
Figure 10 shows the relative proportion of subsidies for the three provinces and the breakout of federalsubsidies provided to the provinces. Federal subsidies total $1.38 billion or 49 per cent of total subsidies weestimated. The Province of Alberta receives the vast share of total federal and provincial subsidies (73 percent), which is larger than Alberta’s share of crude oil production (67 per cent).
FIGURE 11: ANNUAL SUBSIDY VALUE ($MILLIONS)
Federal Subsidy (Rest of Canada)$19
Federal Subsidy (AB)$1,025
Provincial (AB)$1,049
Federal Subsidy (SK)$124
Provincial (SK)$327
Federal (NFL)$233
Provincial (NFL)$83
www.globalsubsidies.org
THE GLOBAL SUBSIDIES INITIATIVE FOSSIL FUELS – AT WHAT COST? GOVERNMENT SUPPORT FOR UPSTREAM OIL ACTIVITIES IN THREE CANADIAN PROVINCES: ALBERTA, SASKATCHEWAN, AND NEWFOUNDLAND AND LABRADOR Page 65
In terms of the types of subsidies that are prevalent, the federal government and Government of Newfoundlandand Labrador favour tax expenditures (83 per cent of federal subsidies, 63 per cent of Newfoundland andLabrador), while Saskatchewan favours royalty relief or reductions in other taxes (78 per cent of Saskatchewansubsidies). Alberta has a larger mix of different types of subsidies with royalty relief (46 per cent) and taxbreaks (25 per cent) comprising the largest proportion of total subsidies.
On average, across Canada, the subsidy as a share of average production value is estimated to be about 5.2per cent. The subsidy as a share of production is highest in Alberta (5.7 per cent) and a lowest inNewfoundland and Labrador (3.7 per cent). This is consistent with the cost of production, which is alsohighest in Alberta and lowest in Newfoundland and Labrador. Subsidies as a percentage of the total transfersto government, including taxes, royalties and crown land sales, were 5.3 per cent on average across Canada,with a high of 7 per cent in Alberta and a low of 5.2 per cent in Saskatchewan.
An analysis of the financial implications of subsidies to well drilling in Saskatchewan found that subsidies toencourage the development of new oil wells were significant. The average subsidy level to produce new wellswas found to be $139,000 per well or $143 per m3 produced. This subsidy level represents approximately27 per cent of the estimated future value of production from these wells, although the full tax implicationsof these subsidies were not estimated. Subsidies provided for production in Saskatchewan were found to bemuch smaller and estimated to be only $0.22 per m3 produced.
Unique relative to past subsidy work in Canada is the exploration of the impacts of oil sector subsidies onemission and economic outcomes. We used an economy-wide macroeconomic model with royalty andcorporate tax interactions to determine the impact of subsidies on production and emissions. We forecastedeconomic activity and emissions nationally and by region as well as oil production to 2020, and then estimatedhow the $2.8 billion of subsidies identified in this report alter oil production, the associated linked economicactivity and emissions. This future-looking analysis allows us to capture the longer-term impacts of thesubsidies on new capital deployment production. Note that our modelling is stylized and provides indicativeresults. Nevertheless, the analysis helps one think about the policy trade-offs of the current practice ofsubsidizing the sector.
With the equivalent of $2.8 billion in current dollars incentivizing future oil production, we identify thefollowing implications attributable to the subsidy:
• The current subsidies have a slight positive impact on economic activity. The largest impacts are foundin Alberta, where the size of the total economy (i.e., GDP) is about 0.16 per cent larger in 2020 becauseof the subsidies. This, in effect, increases the annual GDP growth rate in 2020 from about 1.64 percent to 1.8 per cent. This has a marginal effect on the overall size of the Alberta economy, which isprojected to be about 27 per cent bigger in 2020 than it is today.
• Subsidies to the oil sector are increasing the level of production. The impact of the subsidies on themarginal producer of oil is important. With subsidies in place, oil production nationally is projected tobe in the order of 5 per cent larger in 2020, with a range of 0.3 per cent increase in Newfoundlandand Labrador to a high of 6 per cent in Alberta. In 2020, the sector is projected to be about twice aslarge as it was in 2005, with or without subsidies, which implies that subsidies influence growth in thesector but are not a major determinant.
• Net exports are fuelled by subsidies. Subsidies are contributing to oil exports, which in turn generateforeign exchange. Our results indicate that net exports in oil (or the trade surplus) increase about 14per cent nationally with subsidies in place.
www.globalsubsidies.org
THE GLOBAL SUBSIDIES INITIATIVE FOSSIL FUELS – AT WHAT COST? GOVERNMENT SUPPORT FOR UPSTREAM OIL ACTIVITIES IN THREE CANADIAN PROVINCES: ALBERTA, SASKATCHEWAN, AND NEWFOUNDLAND AND LABRADOR Page 66
• The employment benefit of the subsidies is questionable.While the economy does expand with the oilsubsidies in place, most of this happens in the capital-intensive oil sector. The impacts on totalemployment are therefore negligible.
• Government balances are lower even with higher corporate taxes and royalty payments. While theincreased economic activity due to the subsidies does increase corporate taxes and royalties paid,labour taxes are likely lower due to the spending in the capital intensive oil sector. More significantly,major subsidy outlays are relatively large. Government balances are therefore worse off with thesubsidies: the federal government is lower by 1 per cent, Alberta by 5 per cent, and Saskatchewan by4 per cent. A small increase is observed in the Newfoundland and Labrador budget, where the federalsubsidy infusion creates more activity and revenue while not being offset by provincial subsidies paid.
• Subsidies drive production and hence more emissions. Nationally, emissions are about 2 per cent higherin 2020 with the subsidies. In Alberta, the likely increase in emissions attributable to the subsidies islarge, with about 5 per cent more provincial emissions than if the subsidies were removed.
• Non-conventional production is experiencing the greatest benefit from the subsidies, followed by newdrilling. With targeted programs for the oil sands, as well as a large share of total production, the oilsands are disproportionally benefiting. Our assessment indicates that the subsidies are adding 6 to 7per cent more production to the sector and about 12 per cent more emissions. Most of the targetedprograms are for more exploration activity and drilling in the provinces.
Perhaps most interesting is the risk of a growing subsidy obligation on governments. With oil productionpredicted to more than double between now and 2020, with or without the subsidies in place, the share ofsubsidy relative to overall government expenditures could grow. In our simple modelling, scaling up currentsubsidies to future production more than doubles the subsidy as a share of government expenditures. Asmentioned above, government balances are then worse off as the tax and royalty increases are more thanoffset by the subsidies paid. This points to a risk in government balances through providing incentive programsto a rapidly expanding sector.
Finally, an important area for future work is to examine how the subsidy revenue could be recycled. Given thesize of the current government spending on subsidies to the oil sector, redirecting subsidy revenue to reducecorporate and income taxes, pay off debt, or increase the size of government spending, would all have verydifferent efficiency implications.
www.globalsubsidies.org
THE GLOBAL SUBSIDIES INITIATIVE FOSSIL FUELS – AT WHAT COST? GOVERNMENT SUPPORT FOR UPSTREAM OIL ACTIVITIES IN THREE CANADIAN PROVINCES: ALBERTA, SASKATCHEWAN, AND NEWFOUNDLAND AND LABRADOR Page 67
11. REFERENCE LIST
Alberta Energy. “Enhanced Oil Recovery Royalty Relief Program.” Information Letter 2003-16. Edmonton:Alberta Energy, 17 June 2003. 20 October 2010. <http://inform.energy.gov.ab.ca/Documents/Published/IL-2003-16.PDF>
Alberta Energy. Oil and gas fiscal regimes: Western Canadian provinces and territories. Edmonton: AlbertaEnergy, December 2006. 20 October 2010. <http://www.energy.alberta.ca/Tenure/pdfs/FISREG.pdf>
Alberta Energy Resources Conservation Board. “Crude oil disposition overview.” 2010. 20 October 2010:<http://www.ercb.ca/docs/products/STs/st98-2010-ds-overview.xls>
Alberta Energy Resources Conservation Board. Liability management rating report – June 2010. June 2010.20 October 2010: <http://www.ercb.ca/docs/data/facilities/llr_report_Jun2010.pdf>
Alberta Environment. “State of the environment – Land: Oil and gas well reclamation.” 2009. 20 October2010. <http://environment.alberta.ca/02855.html>
Alberta Office of the Auditor General. “Bitumen valuation methodology implementation.” Report of the AlbertaAuditor General. No. 20. Edmonton, AB: ABOAG, October 2009.
Alberta Orphan Well Association. “2008/09 Annual Report.” June 2009. 20 October 2010.<http://www.orphanwell.ca/OWA%202008-09%20Ann%20Rpt%20Final.pdf>
Alberta Royalty Review. (2007). Our fair share. Report of the Alberta Ryalty Review Panel. 20 October 2010.<http://www.albertaroyaltyreview.ca/panel/final_report.pdf>
Babiker, M. H., Metcalf, G. E. & Reilly, J. “Tax distortions and global climate policy.” Journal of EnvironmentalEconomics and Management 46, no. 2 (2003): 269–287.
Bataille, C., Jaccard, M., Nyboer, J., & Rivers, N. “Towards general equilibrium in a technology-rich model withempirically estimated behavioural parameters.” Energy Journal 27 (2006): 93–112.
Canadian Association of Oilwell Drilling Contractors. “Average monthly drilling rig count.” 20 October 2010.<http://www.caodc.ca/>
Canada-Newfoundland and Labrador Offshore Petroleum Board (C-NLOPB). Annual Report, 2008–2009. St John’s, NL: C_NLOBP, 2009. http://www.cnlopb.nl.ca/pdfs/ar2009e.pdf
Canada Revenue Agency. “Flow-Through Shares.” 20 October 2010. http://www.cra-arc.gc.ca/tx/bsnss/tpcs/fts-paa/menu-eng.html
Canadian Department of Finance. “Subsidies and countervailing measures information paper.” Ottawa: CDE,2010. 20 October 2010. http://www.fin.gc.ca/activty/pubs/sub_-eng.asp
Canadian Association of Petroleum Producers (CAPP). “CAPP fact sheet.” 20 October 2010.<http://www.capp.ca/getdoc.aspx?DocID=111534>
www.globalsubsidies.org
THE GLOBAL SUBSIDIES INITIATIVE FOSSIL FUELS – AT WHAT COST? GOVERNMENT SUPPORT FOR UPSTREAM OIL ACTIVITIES IN THREE CANADIAN PROVINCES: ALBERTA, SASKATCHEWAN, AND NEWFOUNDLAND AND LABRADOR Page 68
Canadian Association of Petroleum Producers (CAPP). Cananda’s oil, natural gas and oil sands: Overview andoutlook. Calgary, AB: CAPP, February 2009. 20 October 2010.<http://www.capp.ca/getdoc.aspx?DocID=147850&DT=PDF>
Canadian Association of Petroleum Producers (CAPP). Statistical handbook for Canada’s upstream petroleumindustry. Technical Report. Calgary, AB: CAPP, 2010a.
Canadian Association of Petroleum Producers (CAPP). “2010–2025 Canadian crude oil forecast and marketoutlook.” 2010b. 20 October 2010. <http://www.capp.ca/aboutUs/mediaCentre/NewsReleases/Pages/2010-Oil-Forecast.aspx#ufVSBF8FoJpL>
Chen, Duanjie & Mintz, Jack M. “Federal corporate tax cuts would lift Canada’s standard of living.” C.D. Howee-Brief, 2005. 20 October 2010. <http://www.cdhowe.org/pdf/ebrief_14.pdf>
Department of Business (NL). “Guidelines and eligibility criteria (amended): Oil and Gas Manufacturing andServices Export Development Fund (OGEDF).” St John’s: Government of Newfoundland and Labrador. 20October 2010. <http://www.business.gov.nl.ca/business/GuidelinesEligibilityCriteria.pdf>
Department of Finance. Tax expenditures and evaluation 2007. Ottawa: Government of Canada, 2007.
Department of Finance. Improving the income taxation of the resource sector in Canada. Ottawa:Government of Canada, 2008. 20 October 2010. <http://www.fin.gc.ca/activty/pubs/rsc_1-eng.asp>
Department of Finance. “G-20 commitment – Fossil fuel subsidies.” Memorandum. Ottawa: Government ofCanada, 18 March 2010.
Department of Finance. Federal budget, 2009. Ottawa: Government of Canada, 2009. 20 October 2010.<http://www.budget.gc.ca/2009/plan/bpc3e-eng.html#s38>
Dissou, Y. “Cost-effectiveness of the performance standard system to reduce CO2 emissions in Canada: A general equilibrium analysis.” Resource and Energy Economics 27 (2005) 187–207.
European Commission (EC). “Methods of assessing the aid element.” State Aid Scoreboard, DG Competition,2007. 20 October 2010. <http://ec.europa.eu/comm/competition/state_aid/studies_reports/conceptual_remarks.html#calc_aid_element>
Global Subsidies Initiative (GSI). “Defining fossil-fuel subsidies for the G-20: Which approach is best?” Policy Brief. Geneva: GSI, June 2010.
Government of Alberta. “Energy Innovation Fund.” 20 October 2010.<http://www.environment.alberta.ca/02014.html>
Government of Alberta. “Province announces three-point incentive program for energy sector.” Edmonton:Government of Alberta, 3 March, 2009. 20 October 2010.<http://www.alberta.ca/ACN/200903/25402CDEFE818-F1BC-5D66-DF309066E457F2A4.html>
Government of Alberta. Backgrounder: Fiscal Tables. Budget 2010. Edmonton: Government of Alberta, 2010.20 October 2010. http://alberta.ca/acn/201006/286652010_annrep_backgrounder_final.pdf
www.globalsubsidies.org
THE GLOBAL SUBSIDIES INITIATIVE FOSSIL FUELS – AT WHAT COST? GOVERNMENT SUPPORT FOR UPSTREAM OIL ACTIVITIES IN THREE CANADIAN PROVINCES: ALBERTA, SASKATCHEWAN, AND NEWFOUNDLAND AND LABRADOR Page 69
Government of Saskatchewan. “The Saskatchewan oil and gas industry upstream emission reductioninitiative.” 20 October 2010. <http://www.er.gov.sk.ca/Default.aspx?DN=56b82248-d453-4f75-90f2-0a12ec55707c>
Government of Saskatchewan. “Incentives to boost mineral exploration.” 19 September 2002. 20 October2010. <http://www.gov.sk.ca/news?newsId=70754f48-aff1-4022-9318-d032db340417>
Government of Saskatchewan. “Canadian enhanced oil recovery incentives.” Press release 225. Regina:Industry and Resources, 18 March 2005. 20 October 2010.
Government of Saskatchewan. “Premier commits to exploring oil sands potential.” News release. Regina:Government of Saskatchewan, 12 December 2007. 20 October 2010.<http://www.gov.sk.ca/news?newsId=0feaac0b-1ee6-4aab-a20e-0ebf9724be9f>
Government of Saskatchewan. “Oil industry fact sheet.” 2008. 20 October 2010.ttp://www.er.gov.sk.ca/adx/aspx/adxGetMedia.aspx?DocID=6552,3384,5460,2936,Documents&MediaID=20542&Filename=Fact+Sheet+-+Oil+in+Sask+(Sept+8+2008).pdf
Government of Saskatchewan. “Permanently mounted mobile capital equipment.” Public accounts. O.C.1436/67. Regina: Government of Saskatchewan, 2009.
International Energy Agency (IEA). Carrots and sticks: Taxing and subsidising energy. Economic AnalysisDivision, Note on Energy Subsidies and Taxes. Paris: IEA, 17 January 2006. 20 October 2010.<http://www.iea.org/textbase/papers/2006/oil_subsidies.pdf>
International Monetary Fund (IMF). Government finance statistics manual 2001 (GFSM 2001), StatisticsDivision, 19 December 2001. 20 October 2010. <http://www.imf.org/external/pubs/ft/gfs/manual/>
Iowerth, A., Bagnoli, P., Dissou, Y., Peluso, T. & Rudin, J. A computable General Equilibrium Analysis ofgreenhouse gas reduction paths and scenarios. Ottawa: Economic Studies and Policy Analysis Division,Finance Canada, 2000.
Kallbekken, Steffen. A description of the dynamic analysis of economics of environmental policy (DEEP)model. CICERO Report 2004:01. Norway: CICERO, 2004. 20 October 2010.<http://www.cicero.uio.no/media/2719.pdf>
Ketchum, Ken, Lavigne, Robert & Plummer, Reg. Oil sands tax expenditures. Department of Finance WorkingPaper. 2001-17. Ottawa: Government of Canada, 2001.
McKibbin, W. & Wilcoxen, P. “The theoretical and empirical structure of the G-Cubed Model.” EconomicModelling 16 (1999): 123–48.
McKitrick, R. (1997). “Double dividend environmental taxation and Canadian carbon emissions control.”Canadian Public Policy – Analyse de Politiques 23, no. 4 (1997): 417–434.
MineralFields.com. “What is a Super Flow-Through Limited Partnership?” 20 October 2010.http://www.mineralfields.com/fr/index.cfm?Section=&PageId=76D561C9-423B-A2BC-40931D7E23EBFCD1&refresh=FBDF1586-423B-A2BC-4825C7020F468454
www.globalsubsidies.org
THE GLOBAL SUBSIDIES INITIATIVE FOSSIL FUELS – AT WHAT COST? GOVERNMENT SUPPORT FOR UPSTREAM OIL ACTIVITIES IN THREE CANADIAN PROVINCES: ALBERTA, SASKATCHEWAN, AND NEWFOUNDLAND AND LABRADOR Page 70
Mintz, Jack. Measuring effective tax rates for oil and gas in Canada. Working Paper. Calgary, AB: School ofPublic Policy, University of Calgary, 2010.
Mintz, Jack & Chen, Duanjie. “Taxing Canada’s cash cow: Tax and royalty burdens on oil and gas invstments.”School of Public Policy Briefing Paper 3, no. 3, Calgary, AB: School of Public Policy, University of Calgary,February 2010. 20 October 2010. <http://www.policyschool.ucalgary.ca/files/publicpolicy/mintz3.pdf>
National Energy Board. Reference case scenario: Canadian energy demand and supply to 2020 – An energy market assessment. Ottawa: Government of Canada, 2009a.
National Energy Board. Forecasts for oil and gas production at different prices for oil and natural gas. Ottawa:Government of Canada, 2009b.
Natural Resources Canada (NRCAN). “NRCAN’s Three Year Plan for Transfer Payment Programs, 2008–2009.”Ottawa: NRCAN, 14 September 2010. 20 October 2010. <http://www.nrcan-rncan.gc.ca/com/resoress/transfer-eng.php>
Natural Resources Canada (NRCAN). “Backgrounder: Clean Energy Fund Renewable Energy and Clean EnergySystems Demonstration Projects.” News release, 2010/01 (a). Ottawa: Government of Canada, 2010. 20October 2010. <http://www.nrcan-rncan.gc.ca/media/newcom/2010/201001a-eng.php>
Newfoundland and Labrador Department of Finance. Public Accounts, Volume I: Consolidated summaryfinancial statements. St John’s, NL: Government of Newfoundland and Labrador, 2009. 20 October 2010.<http://www.fin.gov.nl.ca/fin/publications/index.html>
Newfoundland and Labrador Mines and Energy. Hibernia Project Royalty Regime. St John’s, NL: Departmentof Natural Resources, Government of Newfoundland and Labrador. 20 October 2010.http://www.nr.gov.nl.ca/mines&en/exploration/hibernia.pdf
Newfoundland and Labrador Department of Natural Resources. Oil and gas report. St John’s, NL: Departmentof Natural Resources, Government of Newfoundland and Labrador, 2008. 20 October 2010.<http://www.nr.gov.nl.ca/mines&en/oil/>
Office of the Auditor General of Canada. Government support for energy investments. Report of the Commissionerof the Environment and Sustainable Development. Chapter 3. Ottawa: Government of Canada, 2000.
Office of the Auditor General of Canada. Subsidies to the oil and gas industry and federal initiatives forgreenhouse gas emission reductions. Commissioner of the Environment and Sustainable Development.Petition: No. 222. Ottawa: Government of Canada, 2008.
Petroleum Technology Research Centre (PTRC). Annual Report, 2008–2009. Regina, SK: PTRC, 2009. 20 October 2010. <http://www.ptrc.ca/siteimages/2008-9%20Annual%20Report.pdf>
Saskatchewan Ministry of Energy and Resources. Monthly production and disposition of crude 2008.Saskatoon, SK: Government of Saskatchewan, 2008. 20 October 2010.<http://www.er.gov.sk.ca/Default.aspx?DN=3732,3620,3384,2936,Documents>
Saskatchewan Ministry of Energy and Resources. Oil reserves data with production by region. Saskatoon, SK:Government of Saskatchewan, 2008. 20 October 2010. <http://www.er.gov.sk.ca/oilgassummaryreport>

www.globalsubsidies.org
THE GLOBAL SUBSIDIES INITIATIVE FOSSIL FUELS – AT WHAT COST? GOVERNMENT SUPPORT FOR UPSTREAM OIL ACTIVITIES IN THREE CANADIAN PROVINCES: ALBERTA, SASKATCHEWAN, AND NEWFOUNDLAND AND LABRADOR Page 71
Saskatchewan Ministry of Energy and Resources. Saskatchewan’s strategic approach to carbon dioxidecapture and storage. Saskatoon, SK: Government of Saskatchewan, 6 March 2009a. 20 October 2010.<http://www.er.gov.sk.ca/adx/aspx/adxGetMedia.aspx?DocID=10291,10289,3384,5460,2936,Documents&MediaID=25534&Filename=SER+CO2+Info+Opening+Remarks+(Mar+6+09).pdf>
Saskatchewan Ministry of Energy and Resources. Ministry of Saskatchewan Energy and Resources OrphanFund Program. Saskatoon, SK: Government of Saskatchewan, 6 March 2009b. 20 October 2010.<http://www.er.gov.sk.ca/adx/aspx/adxGetMedia.aspx?DocID=10419,10418,3680,3384,5460,2936,Documents&MediaID=25616&Filename=LLR+Presentation+Feb+2009.pdf>
Saskatchewan Ministry of Energy and Resources. Annual Report 2008-2009. Saskatoon, SK: Government ofSaskatchewan, 2009c. 20 October 2010. <http://www.publications.gov.sk.ca/deplist.cfm?d=22&c=870>
Saskatchewan Ministry of Energy and Resources. Saskatchewan crude oil Crown royalty and freeholdproduction tax. Saskatoon, SK: Government of Saskatchewan, 2010b. 20 October 2010.<http://www.er.gov.sk.ca/royaltytaxfactors>
Saskatchewan Ministry of Energy and Resources. Master well index file. (Master Well Index All.zip). Saskatoon,SK: Government of Saskatchewan, 2010c. 20 October 2010.http://www.er.gov.sk.ca/Default.aspx?DN=3732,3620,3384,2936,Documents
Statistics Canada. Oil and gas extraction. Catalogue no. 26-213-X. Ottawa: Government of Canada, 2007.
Statistics Canada. “Financial and Taxation Statistics for Enterprises. 61-219-x. Reconciliation of Profit.”Ottawa: Government of Canada, 2008.
Statistics Canada. “Reconciliation of Profit Oil and gas extraction and support activities: Reconciliation of profit(Table 7.2).” In Financial and Taxation Statistics for Enterprises. 61-219-X. Ottawa: Government of Canada, 2008.
Statistics Canada. Oil and gas extraction. Catalogue no. 26-213-X. Ottawa: Government of Canada, 2009.
Statistics Canada. Energy statistics handbook. Ottawa: Government of Canada, 2009.
Tax and Revenue Administration. “Current and historic Alberta tax rates.” Edmonton: Alberta Finance andEnterprise, Tax and Revenue Administration, Government of Alberta. 20 January 2010. 20 October 2010.<http://www.finance.alberta.ca/publications/tax_rebates/rates/hist1.html>
Treasury Board of Canada. “Section 3: Supplementary Information” In Departmental performance report forNatural Resources Canada, 2007–2008. Ottawa: Treasury Board of Canada, 2008, 20 October 2010.<http://www.tbs-sct.gc.ca/dpr-rmr/2007-2008/inst/rsn/rsn03-eng.asp>
Treasury Board of Canada. “Section 3: Supplementary Information” In Departmental performance report forNatural Resources Canada, 2008–2009. Ottawa: Treasury Board of Canada, 2009, 20 October 2010.<http://www.tbs-sct.gc.ca/dpr-rmr/2008-2009/inst/rsn/rsn00-eng.asp>
Varangu, Kristi. IEA work on defining and measuring environmentally harmful subsidies in the energysector. OECD Workshop on Environmentally Harmful Subsidies, 7–8 November 2002. Paris: OECD, 2002. 20October 2010. <http://www.oecd.org/dataoecd/41/27/35217143.pdf>
Wigle, Randy. BMRT V 1.0 Model Documentation. Working Paper. Waterloo, ON: Department of EconomicsWilfred Laurier University, 2007.
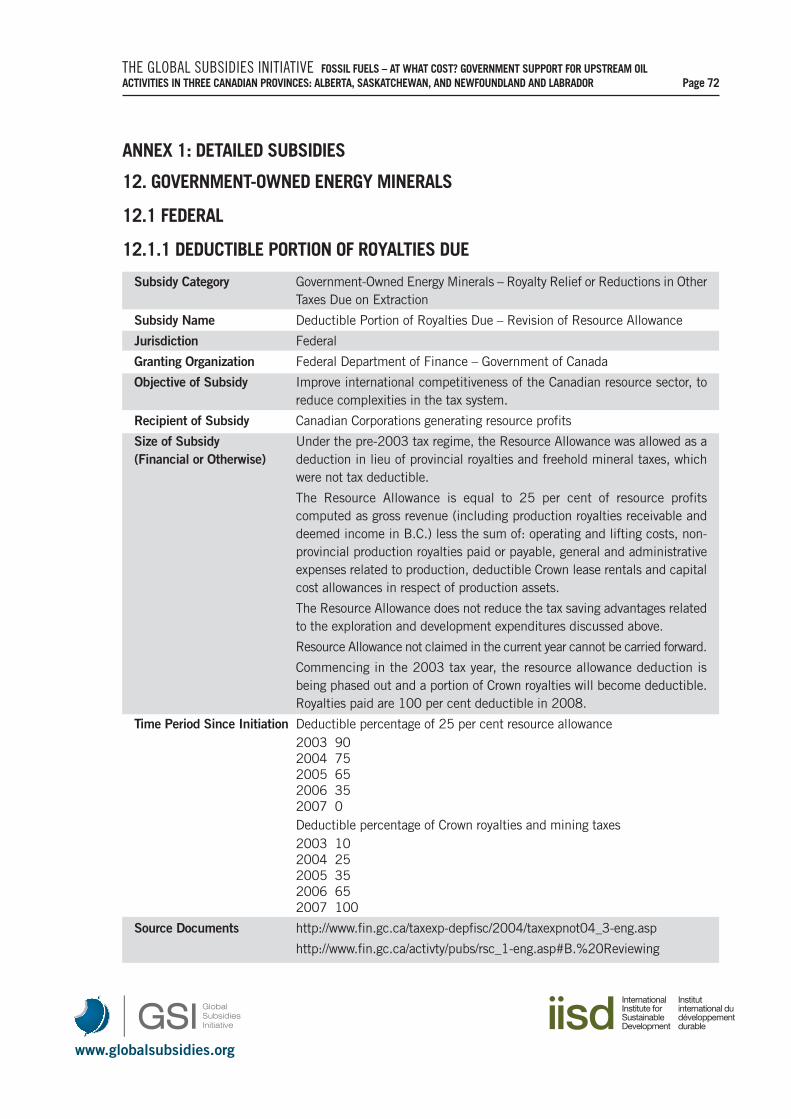
www.globalsubsidies.org
THE GLOBAL SUBSIDIES INITIATIVE FOSSIL FUELS – AT WHAT COST? GOVERNMENT SUPPORT FOR UPSTREAM OIL ACTIVITIES IN THREE CANADIAN PROVINCES: ALBERTA, SASKATCHEWAN, AND NEWFOUNDLAND AND LABRADOR Page 72
ANNEX 1: DETAILED SUBSIDIES
12. GOVERNMENT-OWNED ENERGY MINERALS
12.1 FEDERAL
12.1.1 DEDUCTIBLE PORTION OF ROYALTIES DUE
Subsidy Category Government-Owned Energy Minerals – Royalty Relief or Reductions in OtherTaxes Due on Extraction
Subsidy Name Deductible Portion of Royalties Due – Revision of Resource Allowance
Jurisdiction Federal
Granting Organization Federal Department of Finance – Government of Canada
Objective of Subsidy Improve international competitiveness of the Canadian resource sector, toreduce complexities in the tax system.
Recipient of Subsidy Canadian Corporations generating resource profits
Size of Subsidy Under the pre-2003 tax regime, the Resource Allowance was allowed as a (Financial or Otherwise) deduction in lieu of provincial royalties and freehold mineral taxes, which
were not tax deductible.
The Resource Allowance is equal to 25 per cent of resource profitscomputed as gross revenue (including production royalties receivable anddeemed income in B.C.) less the sum of: operating and lifting costs, non-provincial production royalties paid or payable, general and administrativeexpenses related to production, deductible Crown lease rentals and capitalcost allowances in respect of production assets.
The Resource Allowance does not reduce the tax saving advantages relatedto the exploration and development expenditures discussed above.
Resource Allowance not claimed in the current year cannot be carried forward.
Commencing in the 2003 tax year, the resource allowance deduction isbeing phased out and a portion of Crown royalties will become deductible.Royalties paid are 100 per cent deductible in 2008.
Time Period Since Initiation Deductible percentage of 25 per cent resource allowance2003 902004 752005 652006 352007 0Deductible percentage of Crown royalties and mining taxes2003 102004 252005 352006 652007 100
Source Documents http://www.fin.gc.ca/taxexp-depfisc/2004/taxexpnot04_3-eng.asp
http://www.fin.gc.ca/activty/pubs/rsc_1-eng.asp#B.%20Reviewing
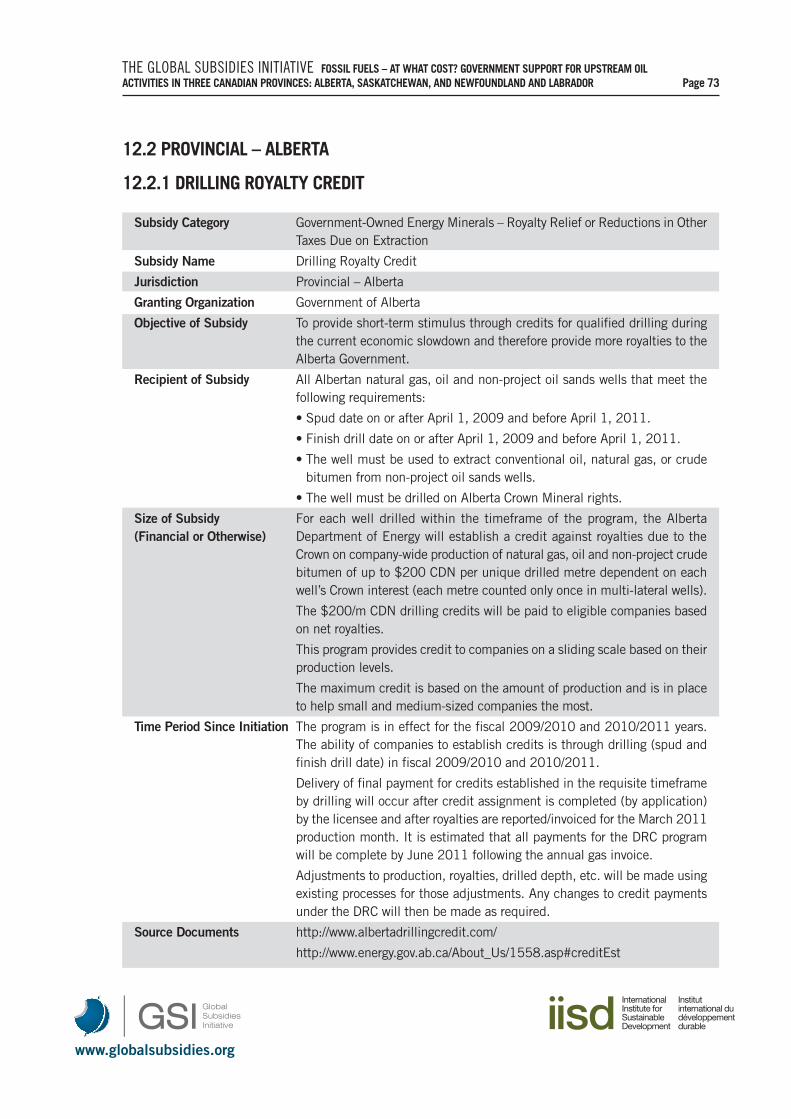
www.globalsubsidies.org
THE GLOBAL SUBSIDIES INITIATIVE FOSSIL FUELS – AT WHAT COST? GOVERNMENT SUPPORT FOR UPSTREAM OIL ACTIVITIES IN THREE CANADIAN PROVINCES: ALBERTA, SASKATCHEWAN, AND NEWFOUNDLAND AND LABRADOR Page 73
12.2 PROVINCIAL – ALBERTA
12.2.1 DRILLING ROYALTY CREDIT
Subsidy Category Government-Owned Energy Minerals – Royalty Relief or Reductions in OtherTaxes Due on Extraction
Subsidy Name Drilling Royalty Credit
Jurisdiction Provincial – Alberta
Granting Organization Government of Alberta
Objective of Subsidy To provide short-term stimulus through credits for qualified drilling duringthe current economic slowdown and therefore provide more royalties to theAlberta Government.
Recipient of Subsidy All Albertan natural gas, oil and non-project oil sands wells that meet thefollowing requirements:
• Spud date on or after April 1, 2009 and before April 1, 2011.
• Finish drill date on or after April 1, 2009 and before April 1, 2011.
• The well must be used to extract conventional oil, natural gas, or crudebitumen from non-project oil sands wells.
• The well must be drilled on Alberta Crown Mineral rights.
Size of Subsidy For each well drilled within the timeframe of the program, the Alberta(Financial or Otherwise) Department of Energy will establish a credit against royalties due to the
Crown on company-wide production of natural gas, oil and non-project crudebitumen of up to $200 CDN per unique drilled metre dependent on eachwell’s Crown interest (each metre counted only once in multi-lateral wells).
The $200/m CDN drilling credits will be paid to eligible companies basedon net royalties.
This program provides credit to companies on a sliding scale based on theirproduction levels.
The maximum credit is based on the amount of production and is in placeto help small and medium-sized companies the most.
Time Period Since Initiation The program is in effect for the fiscal 2009/2010 and 2010/2011 years.The ability of companies to establish credits is through drilling (spud andfinish drill date) in fiscal 2009/2010 and 2010/2011.
Delivery of final payment for credits established in the requisite timeframeby drilling will occur after credit assignment is completed (by application)by the licensee and after royalties are reported/invoiced for the March 2011production month. It is estimated that all payments for the DRC programwill be complete by June 2011 following the annual gas invoice.
Adjustments to production, royalties, drilled depth, etc. will be made usingexisting processes for those adjustments. Any changes to credit paymentsunder the DRC will then be made as required.
Source Documents http://www.albertadrillingcredit.com/
http://www.energy.gov.ab.ca/About_Us/1558.asp#creditEst
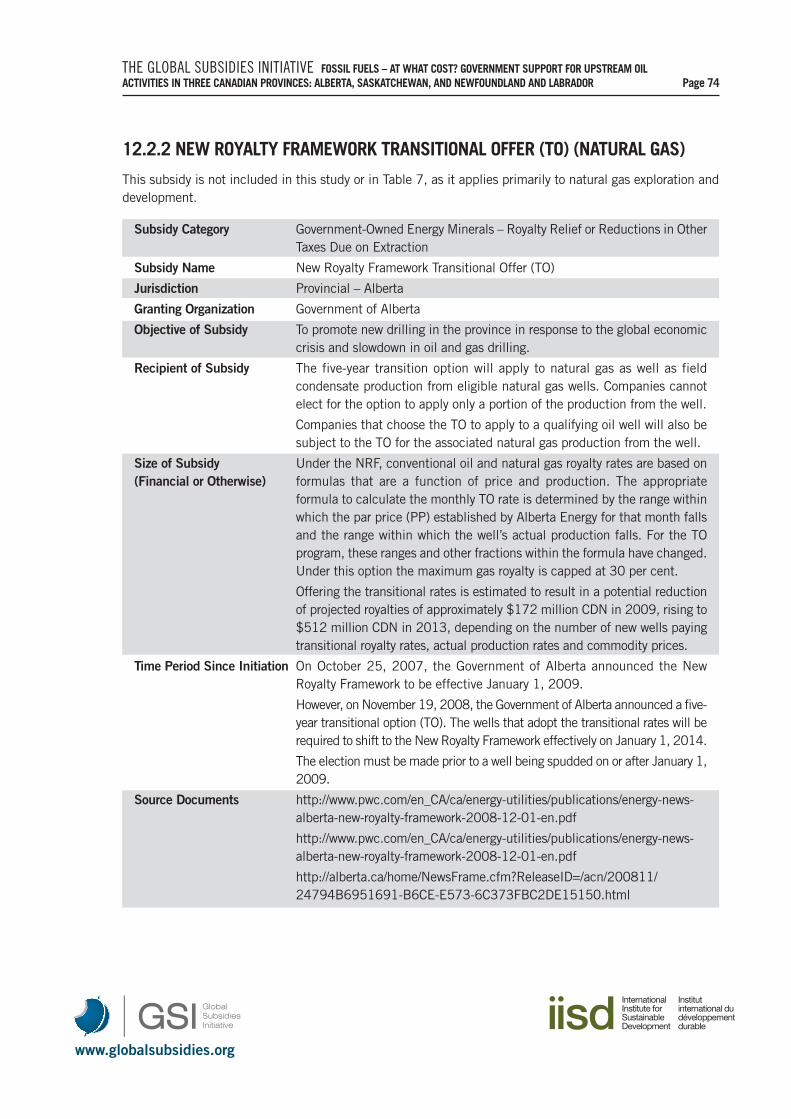
www.globalsubsidies.org
THE GLOBAL SUBSIDIES INITIATIVE FOSSIL FUELS – AT WHAT COST? GOVERNMENT SUPPORT FOR UPSTREAM OIL ACTIVITIES IN THREE CANADIAN PROVINCES: ALBERTA, SASKATCHEWAN, AND NEWFOUNDLAND AND LABRADOR Page 74
12.2.2 NEW ROYALTY FRAMEWORK TRANSITIONAL OFFER (TO) (NATURAL GAS)
This subsidy is not included in this study or in Table 7, as it applies primarily to natural gas exploration anddevelopment.
Subsidy Category Government-Owned Energy Minerals – Royalty Relief or Reductions in OtherTaxes Due on Extraction
Subsidy Name New Royalty Framework Transitional Offer (TO)
Jurisdiction Provincial – Alberta
Granting Organization Government of Alberta
Objective of Subsidy To promote new drilling in the province in response to the global economiccrisis and slowdown in oil and gas drilling.
Recipient of Subsidy The five-year transition option will apply to natural gas as well as fieldcondensate production from eligible natural gas wells. Companies cannotelect for the option to apply only a portion of the production from the well.
Companies that choose the TO to apply to a qualifying oil well will also besubject to the TO for the associated natural gas production from the well.
Size of Subsidy Under the NRF, conventional oil and natural gas royalty rates are based on (Financial or Otherwise) formulas that are a function of price and production. The appropriate
formula to calculate the monthly TO rate is determined by the range withinwhich the par price (PP) established by Alberta Energy for that month fallsand the range within which the well’s actual production falls. For the TOprogram, these ranges and other fractions within the formula have changed.Under this option the maximum gas royalty is capped at 30 per cent.
Offering the transitional rates is estimated to result in a potential reductionof projected royalties of approximately $172 million CDN in 2009, rising to$512 million CDN in 2013, depending on the number of new wells payingtransitional royalty rates, actual production rates and commodity prices.
Time Period Since Initiation On October 25, 2007, the Government of Alberta announced the NewRoyalty Framework to be effective January 1, 2009.
However, on November 19, 2008, the Government of Alberta announced a five-year transitional option (TO). The wells that adopt the transitional rates will berequired to shift to the New Royalty Framework effectively on January 1, 2014.
The election must be made prior to a well being spudded on or after January 1,2009.
Source Documents http://www.pwc.com/en_CA/ca/energy-utilities/publications/energy-news-alberta-new-royalty-framework-2008-12-01-en.pdf
http://www.pwc.com/en_CA/ca/energy-utilities/publications/energy-news-alberta-new-royalty-framework-2008-12-01-en.pdf
http://alberta.ca/home/NewsFrame.cfm?ReleaseID=/acn/200811/24794B6951691-B6CE-E573-6C373FBC2DE15150.html
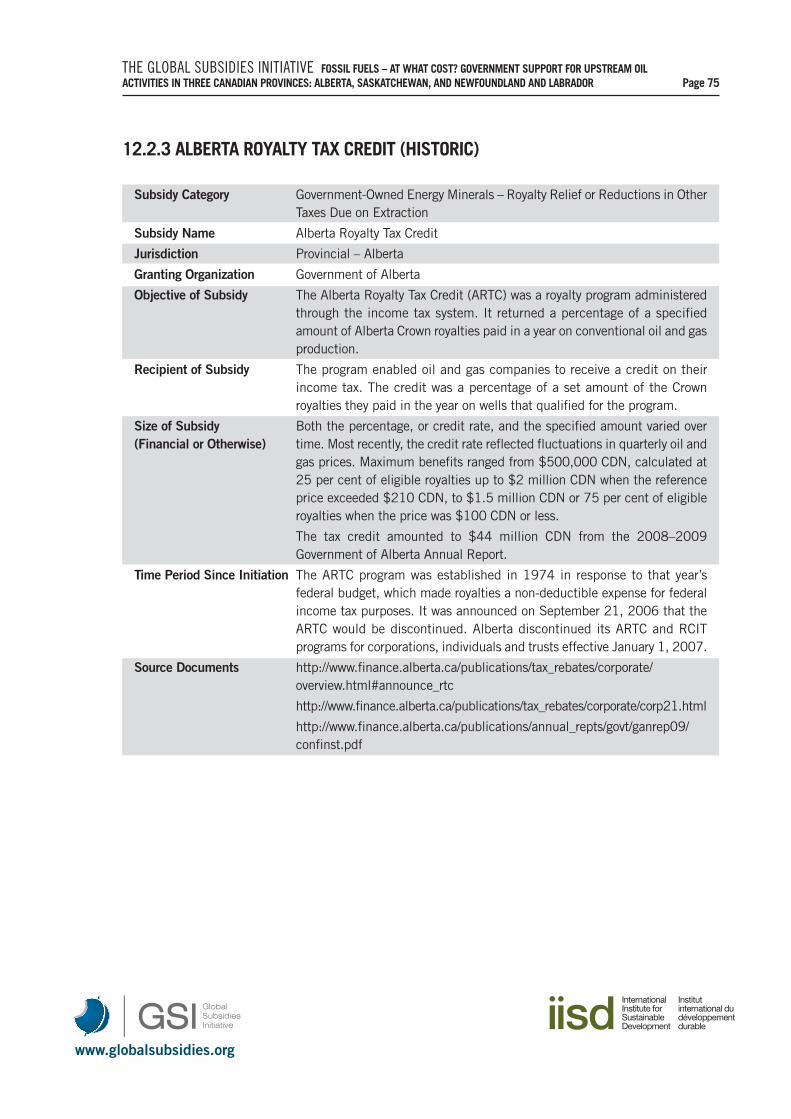
www.globalsubsidies.org
THE GLOBAL SUBSIDIES INITIATIVE FOSSIL FUELS – AT WHAT COST? GOVERNMENT SUPPORT FOR UPSTREAM OIL ACTIVITIES IN THREE CANADIAN PROVINCES: ALBERTA, SASKATCHEWAN, AND NEWFOUNDLAND AND LABRADOR Page 75
12.2.3 ALBERTA ROYALTY TAX CREDIT (HISTORIC)
Subsidy Category Government-Owned Energy Minerals – Royalty Relief or Reductions in OtherTaxes Due on Extraction
Subsidy Name Alberta Royalty Tax Credit
Jurisdiction Provincial – Alberta
Granting Organization Government of Alberta
Objective of Subsidy The Alberta Royalty Tax Credit (ARTC) was a royalty program administeredthrough the income tax system. It returned a percentage of a specifiedamount of Alberta Crown royalties paid in a year on conventional oil and gasproduction.
Recipient of Subsidy The program enabled oil and gas companies to receive a credit on theirincome tax. The credit was a percentage of a set amount of the Crownroyalties they paid in the year on wells that qualified for the program.
Size of Subsidy Both the percentage, or credit rate, and the specified amount varied over (Financial or Otherwise) time. Most recently, the credit rate reflected fluctuations in quarterly oil and
gas prices. Maximum benefits ranged from $500,000 CDN, calculated at25 per cent of eligible royalties up to $2 million CDN when the referenceprice exceeded $210 CDN, to $1.5 million CDN or 75 per cent of eligibleroyalties when the price was $100 CDN or less.
The tax credit amounted to $44 million CDN from the 2008–2009Government of Alberta Annual Report.
Time Period Since Initiation The ARTC program was established in 1974 in response to that year’sfederal budget, which made royalties a non-deductible expense for federalincome tax purposes. It was announced on September 21, 2006 that theARTC would be discontinued. Alberta discontinued its ARTC and RCITprograms for corporations, individuals and trusts effective January 1, 2007.
Source Documents http://www.finance.alberta.ca/publications/tax_rebates/corporate/overview.html#announce_rtc
http://www.finance.alberta.ca/publications/tax_rebates/corporate/corp21.html
http://www.finance.alberta.ca/publications/annual_repts/govt/ganrep09/confinst.pdf
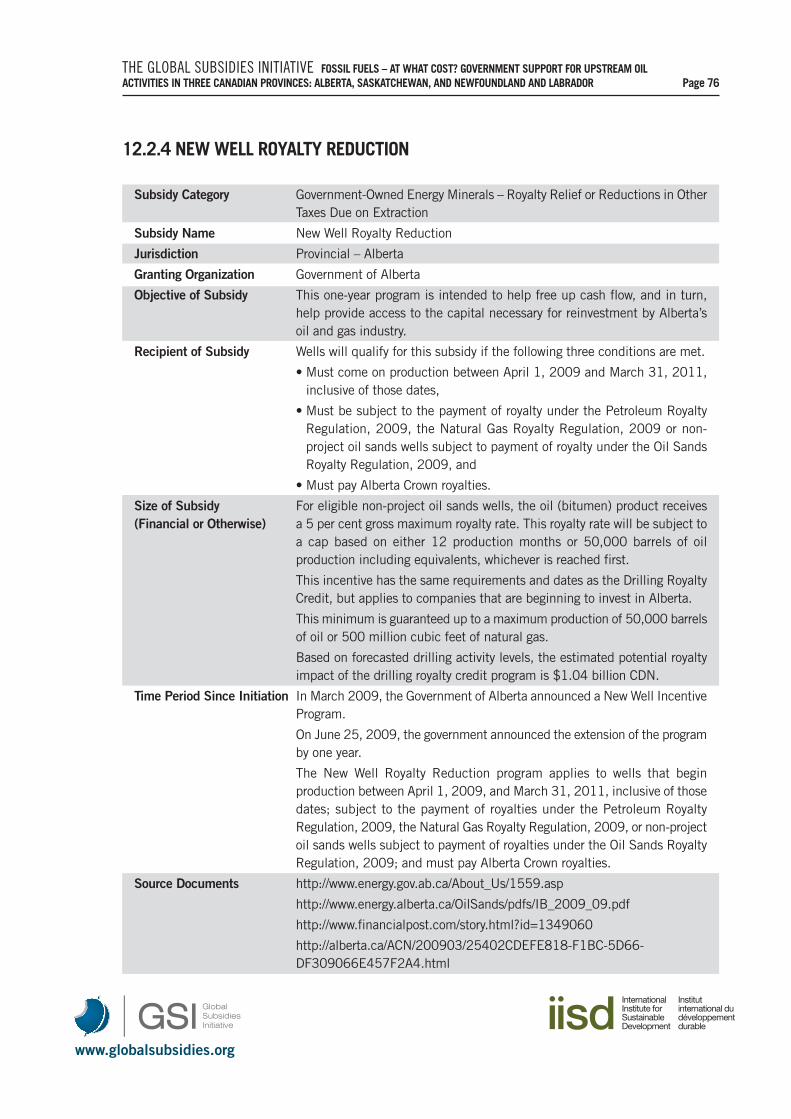
www.globalsubsidies.org
THE GLOBAL SUBSIDIES INITIATIVE FOSSIL FUELS – AT WHAT COST? GOVERNMENT SUPPORT FOR UPSTREAM OIL ACTIVITIES IN THREE CANADIAN PROVINCES: ALBERTA, SASKATCHEWAN, AND NEWFOUNDLAND AND LABRADOR Page 76
12.2.4 NEW WELL ROYALTY REDUCTION
Subsidy Category Government-Owned Energy Minerals – Royalty Relief or Reductions in OtherTaxes Due on Extraction
Subsidy Name New Well Royalty Reduction
Jurisdiction Provincial – Alberta
Granting Organization Government of Alberta
Objective of Subsidy This one-year program is intended to help free up cash flow, and in turn,help provide access to the capital necessary for reinvestment by Alberta’soil and gas industry.
Recipient of Subsidy Wells will qualify for this subsidy if the following three conditions are met.
• Must come on production between April 1, 2009 and March 31, 2011,inclusive of those dates,
• Must be subject to the payment of royalty under the Petroleum RoyaltyRegulation, 2009, the Natural Gas Royalty Regulation, 2009 or non-project oil sands wells subject to payment of royalty under the Oil SandsRoyalty Regulation, 2009, and
• Must pay Alberta Crown royalties.
Size of Subsidy For eligible non-project oil sands wells, the oil (bitumen) product receives (Financial or Otherwise) a 5 per cent gross maximum royalty rate. This royalty rate will be subject to
a cap based on either 12 production months or 50,000 barrels of oilproduction including equivalents, whichever is reached first.
This incentive has the same requirements and dates as the Drilling RoyaltyCredit, but applies to companies that are beginning to invest in Alberta.
This minimum is guaranteed up to a maximum production of 50,000 barrelsof oil or 500 million cubic feet of natural gas.
Based on forecasted drilling activity levels, the estimated potential royaltyimpact of the drilling royalty credit program is $1.04 billion CDN.
Time Period Since Initiation In March 2009, the Government of Alberta announced a New Well IncentiveProgram.
On June 25, 2009, the government announced the extension of the programby one year.
The New Well Royalty Reduction program applies to wells that beginproduction between April 1, 2009, and March 31, 2011, inclusive of thosedates; subject to the payment of royalties under the Petroleum RoyaltyRegulation, 2009, the Natural Gas Royalty Regulation, 2009, or non-projectoil sands wells subject to payment of royalties under the Oil Sands RoyaltyRegulation, 2009; and must pay Alberta Crown royalties.
Source Documents http://www.energy.gov.ab.ca/About_Us/1559.asp
http://www.energy.alberta.ca/OilSands/pdfs/IB_2009_09.pdf
http://www.financialpost.com/story.html?id=1349060
http://alberta.ca/ACN/200903/25402CDEFE818-F1BC-5D66-DF309066E457F2A4.html
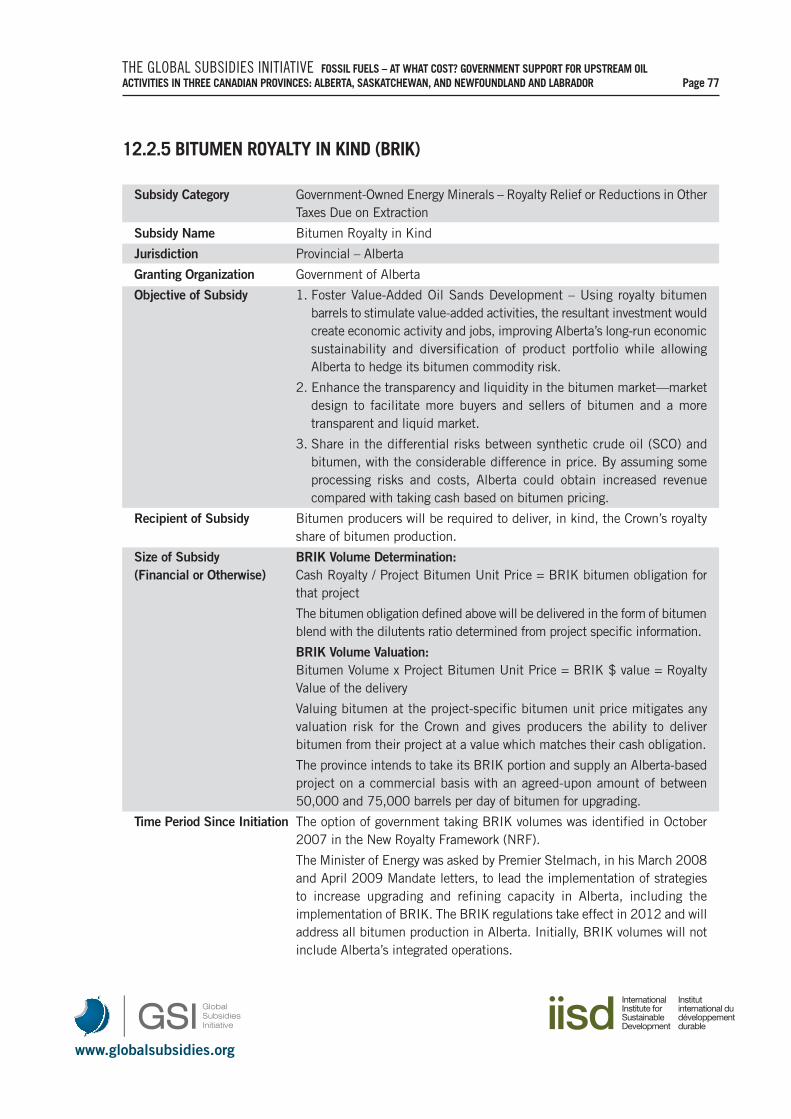
www.globalsubsidies.org
THE GLOBAL SUBSIDIES INITIATIVE FOSSIL FUELS – AT WHAT COST? GOVERNMENT SUPPORT FOR UPSTREAM OIL ACTIVITIES IN THREE CANADIAN PROVINCES: ALBERTA, SASKATCHEWAN, AND NEWFOUNDLAND AND LABRADOR Page 77
12.2.5 BITUMEN ROYALTY IN KIND (BRIK)
Subsidy Category Government-Owned Energy Minerals – Royalty Relief or Reductions in OtherTaxes Due on Extraction
Subsidy Name Bitumen Royalty in Kind
Jurisdiction Provincial – Alberta
Granting Organization Government of Alberta
Objective of Subsidy 1. Foster Value-Added Oil Sands Development – Using royalty bitumenbarrels to stimulate value-added activities, the resultant investment wouldcreate economic activity and jobs, improving Alberta’s long-run economicsustainability and diversification of product portfolio while allowingAlberta to hedge its bitumen commodity risk.
2. Enhance the transparency and liquidity in the bitumen market—marketdesign to facilitate more buyers and sellers of bitumen and a moretransparent and liquid market.
3. Share in the differential risks between synthetic crude oil (SCO) andbitumen, with the considerable difference in price. By assuming someprocessing risks and costs, Alberta could obtain increased revenuecompared with taking cash based on bitumen pricing.
Recipient of Subsidy Bitumen producers will be required to deliver, in kind, the Crown’s royaltyshare of bitumen production.
Size of Subsidy BRIK Volume Determination:(Financial or Otherwise) Cash Royalty / Project Bitumen Unit Price = BRIK bitumen obligation for
that project
The bitumen obligation defined above will be delivered in the form of bitumenblend with the dilutents ratio determined from project specific information.
BRIK Volume Valuation:Bitumen Volume x Project Bitumen Unit Price = BRIK $ value = RoyaltyValue of the delivery
Valuing bitumen at the project-specific bitumen unit price mitigates anyvaluation risk for the Crown and gives producers the ability to deliverbitumen from their project at a value which matches their cash obligation.
The province intends to take its BRIK portion and supply an Alberta-basedproject on a commercial basis with an agreed-upon amount of between50,000 and 75,000 barrels per day of bitumen for upgrading.
Time Period Since Initiation The option of government taking BRIK volumes was identified in October2007 in the New Royalty Framework (NRF).
The Minister of Energy was asked by Premier Stelmach, in his March 2008and April 2009 Mandate letters, to lead the implementation of strategiesto increase upgrading and refining capacity in Alberta, including theimplementation of BRIK. The BRIK regulations take effect in 2012 and willaddress all bitumen production in Alberta. Initially, BRIK volumes will notinclude Alberta’s integrated operations.
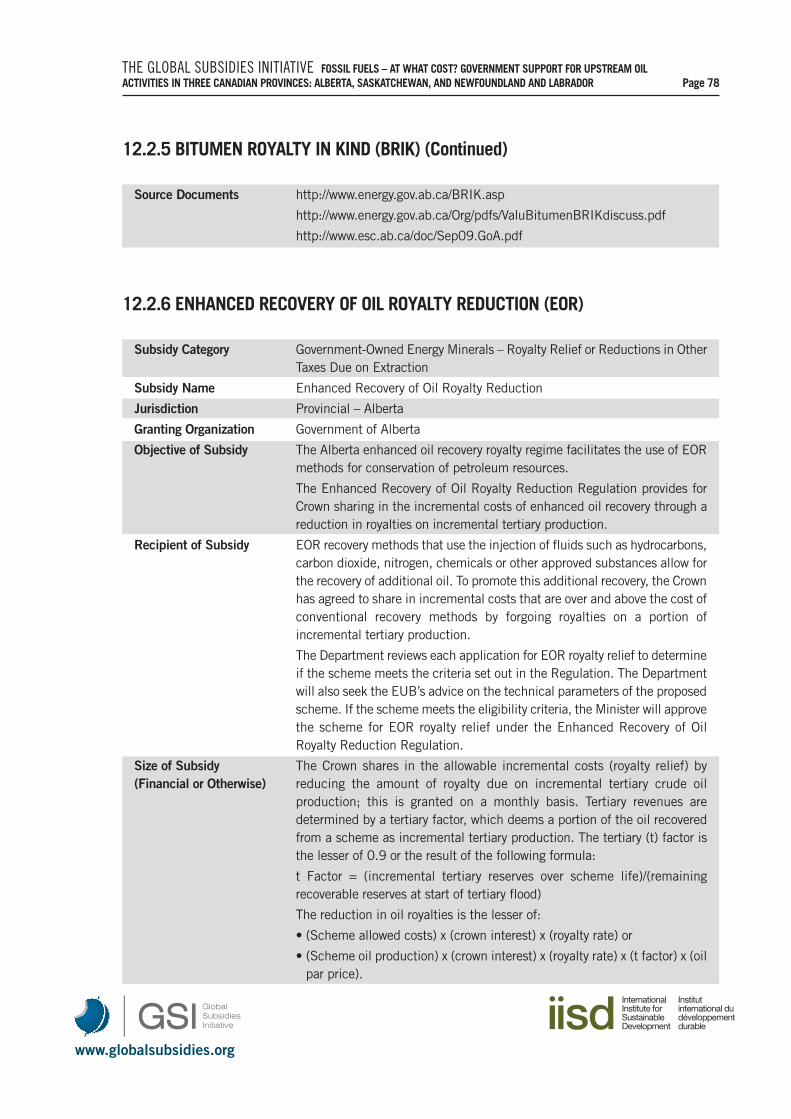
www.globalsubsidies.org
THE GLOBAL SUBSIDIES INITIATIVE FOSSIL FUELS – AT WHAT COST? GOVERNMENT SUPPORT FOR UPSTREAM OIL ACTIVITIES IN THREE CANADIAN PROVINCES: ALBERTA, SASKATCHEWAN, AND NEWFOUNDLAND AND LABRADOR Page 78
12.2.5 BITUMEN ROYALTY IN KIND (BRIK) (Continued)
Source Documents http://www.energy.gov.ab.ca/BRIK.asp
http://www.energy.gov.ab.ca/Org/pdfs/ValuBitumenBRIKdiscuss.pdf
http://www.esc.ab.ca/doc/Sep09.GoA.pdf
12.2.6 ENHANCED RECOVERY OF OIL ROYALTY REDUCTION (EOR)
Subsidy Category Government-Owned Energy Minerals – Royalty Relief or Reductions in OtherTaxes Due on Extraction
Subsidy Name Enhanced Recovery of Oil Royalty Reduction
Jurisdiction Provincial – Alberta
Granting Organization Government of Alberta
Objective of Subsidy The Alberta enhanced oil recovery royalty regime facilitates the use of EORmethods for conservation of petroleum resources.
The Enhanced Recovery of Oil Royalty Reduction Regulation provides forCrown sharing in the incremental costs of enhanced oil recovery through areduction in royalties on incremental tertiary production.
Recipient of Subsidy EOR recovery methods that use the injection of fluids such as hydrocarbons,carbon dioxide, nitrogen, chemicals or other approved substances allow forthe recovery of additional oil. To promote this additional recovery, the Crownhas agreed to share in incremental costs that are over and above the cost ofconventional recovery methods by forgoing royalties on a portion ofincremental tertiary production.
The Department reviews each application for EOR royalty relief to determineif the scheme meets the criteria set out in the Regulation. The Departmentwill also seek the EUB’s advice on the technical parameters of the proposedscheme. If the scheme meets the eligibility criteria, the Minister will approvethe scheme for EOR royalty relief under the Enhanced Recovery of OilRoyalty Reduction Regulation.
Size of Subsidy The Crown shares in the allowable incremental costs (royalty relief) by (Financial or Otherwise) reducing the amount of royalty due on incremental tertiary crude oil
production; this is granted on a monthly basis. Tertiary revenues aredetermined by a tertiary factor, which deems a portion of the oil recoveredfrom a scheme as incremental tertiary production. The tertiary (t) factor isthe lesser of 0.9 or the result of the following formula:
t Factor = (incremental tertiary reserves over scheme life)/(remainingrecoverable reserves at start of tertiary flood)
The reduction in oil royalties is the lesser of:
• (Scheme allowed costs) x (crown interest) x (royalty rate) or
• (Scheme oil production) x (crown interest) x (royalty rate) x (t factor) x (oilpar price).

www.globalsubsidies.org
THE GLOBAL SUBSIDIES INITIATIVE FOSSIL FUELS – AT WHAT COST? GOVERNMENT SUPPORT FOR UPSTREAM OIL ACTIVITIES IN THREE CANADIAN PROVINCES: ALBERTA, SASKATCHEWAN, AND NEWFOUNDLAND AND LABRADOR Page 79
12.2.6 ENHANCED RECOVERY OF OIL ROYALTY REDUCTION (EOR) (Continued)
Time Period Since Initiation The tertiary Enhanced Oil Recovery (EOR) Royalty Relief Program wasintroduced in 1977 through Section 4.2 of the Petroleum RoyaltyRegulations.
Since 1977 there have been numerous amendments to the EOR program,including the most recent in 2003 to encourage the development ofcommercial CO2 EOR projects. See CO2 Enhanced Oil Recovery
Source Documents http://www.energy.gov.ab.ca/Oil/pdfs/EOR_GuidelinesAugust2005.pdf
http://www.qp.alberta.ca/574.cfm?page=1993_348.cfm&leg_type=Regs&isbncln=9780779732272
http://www.energy.alberta.ca/Tenure/pdfs/FISREG.pdf
12.2.7 CO2 ENHANCED OIL RECOVERY
Subsidy Category Government-Owned Energy Minerals – Royalty Relief or Reductions in OtherTaxes Due on Extraction
Subsidy Name CO2 Enhanced Oil Recovery
Jurisdiction Provincial – Alberta
Granting Organization Government of Alberta
Objective of Subsidy Alberta’s Enhanced Oil Recovery (EOR) Royalty Relief Program encouragesthe development of commercial carbon dioxide (CO2) EOR projects. Thedevelopment of a CO2 EOR industry has the potential to provide significantlong-term benefits to Alberta in the form of increased oil production andeconomic activity, and an increased ability to manage the province’sgreenhouse gas emissions via geological storage of CO2. CO2 EOR hasattractive advantages, including:
• improving the flow rate of the oil to be recovered;
• increasing recoveries of the total existing resource (e.g., 8–15 per cent);and
• storing a portion of the injected CO2 underground permanently.
Recipient of Subsidy EOR recovery methods that use the injection of fluids such as hydrocarbons,carbon dioxide, nitrogen, chemicals or other approved substances allow forthe recovery of additional oil.
To promote this additional recovery, the Crown has agreed to share inincremental costs that are over and above the cost of conventional recoverymethods by forgoing royalties on a portion of incremental tertiary production.The Department reviews each application for EOR royalty relief to determineif the scheme meets the criteria set out in the Regulation. The Departmentwill also seek the EUB’s advice on the technical parameters of the proposedscheme. If the scheme meets the eligibility criteria, the Minister will approvethe scheme for EOR royalty relief under the Enhanced Recovery of OilRoyalty Reduction Regulation.
www.globalsubsidies.org
THE GLOBAL SUBSIDIES INITIATIVE FOSSIL FUELS – AT WHAT COST? GOVERNMENT SUPPORT FOR UPSTREAM OIL ACTIVITIES IN THREE CANADIAN PROVINCES: ALBERTA, SASKATCHEWAN, AND NEWFOUNDLAND AND LABRADOR Page 80
12.2.7 CO2 ENHANCED OIL RECOVERY (Continued)
Size of Subsidy A temporary t-factor will be provided for new and expanded CO2 EOR(Financial or Otherwise) projects.
As royalty relief is applied only to that portion of the oil production thatwould not have been realized from base recovery operations, a tertiary (t)factor is used to specify the incremental production from approved EORprojects. The current practice is to establish a t-factor only after the EUBrecognizes reserves for EOR projects. This process may take up to threeyears and royalty relief cannot be provided during the interim period.
ARC energy trust estimates that 2010 capital expenditure for EOR projectsto be $40 million CDN compared to 2008’s actual expenditure of$51 million CDN.
Time Period Since Initiation In June 2003, the Alberta Department of Energy (ADOE) announcedchanges to the Enhanced Oil Recovery (EOR) Royalty Relief Program toencourage the development of commercial carbon dioxide (CO2) schemes.The following changes have been implemented to the EOR Royalty Reliefprogram effective May, 2003:
• A temporary t-factor will be provided for new and expanded CO2 EORprojects.
• Increased allowance for recognition of the value of net CO2 injection forEOR projects.
• Recognition of capital costs for replacement of oil field facilities associatedwith CO2 injection operations.
• Increased overhead allowance to provide recognition of incrementaloperating costs resulting from CO2 injection operations.
Source Documents http://inform.energy.gov.ab.ca/Documents/Published/IL-2003-16.PDF
http://www.energy.alberta.ca/Tenure/pdfs/FISREG.pdf
http://www.arc.ab.ca/areas-of-focus/carbon-conversion-capture-and-storage/carbon-storage/co2-enhanced-oil-recovery/
http://www.arcresources.com/NR/rdonlyres/0DEBCB96-F02F-4DE8-87ED-2591ED887183/0/2010budgetFINAL.pdf

www.globalsubsidies.org
THE GLOBAL SUBSIDIES INITIATIVE FOSSIL FUELS – AT WHAT COST? GOVERNMENT SUPPORT FOR UPSTREAM OIL ACTIVITIES IN THREE CANADIAN PROVINCES: ALBERTA, SASKATCHEWAN, AND NEWFOUNDLAND AND LABRADOR Page 81
12.2.8 CO2 PROJECTS ROYALTY CREDIT
Subsidy Category Government-Owned Energy Minerals – Royalty Relief or Reductions in OtherTaxes Due on Extraction
Subsidy Name CO2 Projects Royalty Credit
Jurisdiction Provincial – Alberta
Granting Organization Government of Alberta
Objective of Subsidy The objective of the CO2 Projects Royalty Credit program (the “program”) isto encourage projects and application of technology that will lead to theexpanded production of Alberta’s oil and gas resources through use of CO2injection into geological formations.
Alberta believes that a producer’s ability to undertake certain projects isoften limited by the related technical and financial risk. This programprovides a reduction in royalties to offset some financial risk to encourageproducers to undertake demonstration projects.
The development of a CO2-enhanced oil and gas recovery industry has thepotential to provide significant long-term benefits to Alberta in the form ofincreased petroleum production and economic activity, and also anincreased ability to manage the province’s greenhouse gas emissions viageological storage of CO2.
Recipient of Subsidy Demonstration projects based in Alberta that inject a mixture consistingmainly of CO2 for enhanced recovery of oil, natural gas or coal bed methanewere eligible for approval under the program.
Size of Subsidy The programs (CO2 enhanced oil recovery and CO2 projects royalty credit) (Financial or Otherwise) are expected to generate at least $30 million CDN in incremental royalties
over 20 years, while providing up to $15 million CDN in royalty deductionsover five years. Over a 20-year period, this could also result in CO2 storageof a minimum of 22 MT, equivalent to an average of 1.1 MT per year.
• A maximum of $15 million CDN will be provided over five years in theform of oil and/or natural gas royalty credits to offset up to 30 per cent ofcompanies’ approved costs in approved CO2 projects.
• A maximum of $5 million CDN in royalty credits may be approved for asingle CO2 project.
Projects supported under this program will result in up to $50 million CDNin additional industry investment over five years
Time Period Since Initiation The royalty credit program is a temporary feature of Alberta’s royalty system,which was introduced in 2003.
A maximum of $15 million CDN will be provided over five years in the formof royalty credits.
Approval of applications will be constrained by total program funding, timelimit for the program and project selection criteria. The royalty credit canbe claimed periodically upon commencement of CO2 injection, as expensesare incurred, without awaiting production from the project site.

www.globalsubsidies.org
THE GLOBAL SUBSIDIES INITIATIVE FOSSIL FUELS – AT WHAT COST? GOVERNMENT SUPPORT FOR UPSTREAM OIL ACTIVITIES IN THREE CANADIAN PROVINCES: ALBERTA, SASKATCHEWAN, AND NEWFOUNDLAND AND LABRADOR Page 82
12.2.8 CO2 PROJECTS ROYALTY CREDIT (Continued)
Source Documents http://www.energy.alberta.ca/Tenure/pdfs/FISREG.pdf
http://inform.energy.gov.ab.ca/Documents/Published/IL-2003-17.PDF
http://www.gov.ab.ca/acn/200404/16359.html
12.2.9 EXPERIMENTAL PROJECT PETROLEUM ROYALTY REDUCTION
Subsidy Category Government-Owned Energy Minerals – Royalty Relief or Reductions in OtherTaxes Due on Extraction
Subsidy Name Experimental Project Petroleum Royalty Reduction
Jurisdiction Provincial – Alberta
Granting Organization Government of Alberta
Objective of Subsidy The Experimental Project Petroleum Royalty Reduction encourages the useof new technology in recovering crude oil.
Recipient of Subsidy The Experimental Project Petroleum Royalty Reduction applies to any oilwell included in an experimental scheme that is:
• Approved by EUB as an experimental scheme and that continues to retainthat approved status, and
• Subsequently approved by the Minister for royalty reduction under theExperimental Project Petroleum Royalty Regulation (AR 65/92).
Size of Subsidy Experimental oil projects approved by the AEUB are eligible for a flat royalty (Financial or Otherwise) rate of 5 per cent of production.
Crown royalty is calculated at 5 per cent of the Crown interest share ofeligible production from each well-event in an approved scheme.
Time Period Since Initiation The Experimental Project Petroleum Royalty Program reduces the royaltyassociated with experimental schemes. It was introduced in 1979 toencourage the development of new and improved methods for crude oilrecovery.
The effective date for an approved royalty reduction is specified by theMinister in the approval. Typically, it will commence as follows:
• the approval date of the new scheme for the experimental project, or
• the expiry date of the previous experimental royalty period for the project,whichever is later.
The term for which an approved royalty reduction is effective is specified bythe Minister in the approval. In most instances, it is based on the effectiveperiod of the EUB experimental scheme approval. For schemes expected toproduce at near commercial levels, the term may relate to a fixed volume ofcrude oil production.
www.globalsubsidies.org
THE GLOBAL SUBSIDIES INITIATIVE FOSSIL FUELS – AT WHAT COST? GOVERNMENT SUPPORT FOR UPSTREAM OIL ACTIVITIES IN THREE CANADIAN PROVINCES: ALBERTA, SASKATCHEWAN, AND NEWFOUNDLAND AND LABRADOR Page 83
12.2.9 EXPERIMENTAL PROJECT PETROLEUM ROYALTY REDUCTION (Continued)
Time Period Since Initiation As listed in the 2007 New Royalty Framework, to simplify the royalty system,(continued) several special royalty programs will be eliminated, including the
experimental project petroleum royalty reduction.
Source Documents http://www.energy.alberta.ca/Oil/pdfs/PetroleumRoyaltyGuidelines.pdf
http://www.energy.alberta.ca/Tenure/pdfs/FISREG.pdf
http://inform.energy.gov.ab.ca/Documents/Published/IL-1992-08.PDF
http://www.energy.gov.ab.ca/Org/pdfs/royalty_Oct25.pdf
12.2.10 REACTIVATED WELL ROYALTY EXEMPTION
Subsidy Category Government-Owned Energy Minerals – Royalty Relief or Reductions in OtherTaxes Due on Extraction
Subsidy Name Reactivated Well Royalty Exemption
Jurisdiction Provincial – Alberta
Granting Organization Government of Alberta
Objective of Subsidy This is a permanent royalty policy to encourage reactivation of wells. Itprovides royalty holidays for successfully reactivating crude oil or oil sandswells that are shut in.
The Reactivated Well Royalty Exemption program was developed in order toaddress the circumstances of a maturing conventional oil sector in the early1990s.
The program was implemented to encourage incremental productionthrough reactivation of shut-in oil wells.
Recipient of Subsidy A reactivated well is an oil well or an oil sands well that was reactivated onor after October 1, 1992, after the well did not produce any substanceduring its qualifying period. This period comprises the 12 consecutivemonths preceding the month in which reactivation took place, if that monthwas October, November or December 1992 or January 1993. If the wellwas reactivated in February 1993 or later, the period consists of thepreceding 24 months.
Eligible oil from a reactivated well is oil or oil sands obtained from a pool oroil sands deposit that was penetrated by the well at the time the wellcommenced reactivated production. Production from deeper pools ordeposits penetrated after the well commenced or resumed production is noteligible. An application is not required to qualify for the program.
www.globalsubsidies.org
THE GLOBAL SUBSIDIES INITIATIVE FOSSIL FUELS – AT WHAT COST? GOVERNMENT SUPPORT FOR UPSTREAM OIL ACTIVITIES IN THREE CANADIAN PROVINCES: ALBERTA, SASKATCHEWAN, AND NEWFOUNDLAND AND LABRADOR Page 84
12.2.10 REACTIVATED WELL ROYALTY EXEMPTION (Continued)
Size of Subsidy The royalty holiday is available from the reactivation date until 8,000 m3
(Financial or Otherwise) have been produced in aggregate from the reactivated well.
Production of crude oil or oil sands from all events in the reactivated well isexempt from Crown royalty that would otherwise be payable under thePetroleum Royalty Regulation or the Oil Sands Royalty Regulation, 1984.
Production from each producing event of an eligible reactivated well thathas retained Old Oil status will be certified as New Oil after the well reachesthe 8,000 m3 production limit.
Effective August 22, 2006, the following major royalty policy changes wereimplemented:
• Conversion of the existing 8,000 m3 production volume cap to a$150,000 CDN royalty value cap effective September 1, 2007.
• Existing wells will have their accumulated royalty reduction volume underthe program converted to a dollar amount based on the monthly par pricewhen the royalty reductions were received.
The royalty reduction for existing wells exceeding the maximum royalty valuecap will be terminated effective September 1, 2007.
Time Period Since Initiation The reactivated well royalty exemption took effect in January, 1993.Amendments to the original exemption were enacted on August 22, 2006.
The program will be reviewed prior to the expiry date of September 1, 2012.
Source Documents http://inform.energy.gov.ab.ca/Documents/Published/IL-1993-03.pdf
http://www.energy.alberta.ca/Tenure/pdfs/FISREG.pdf
http://inform.energy.gov.ab.ca/Documents/Published/IL-2006-22.pdf
www.globalsubsidies.org
THE GLOBAL SUBSIDIES INITIATIVE FOSSIL FUELS – AT WHAT COST? GOVERNMENT SUPPORT FOR UPSTREAM OIL ACTIVITIES IN THREE CANADIAN PROVINCES: ALBERTA, SASKATCHEWAN, AND NEWFOUNDLAND AND LABRADOR Page 85
12.2.11 LOW PRODUCTIVITY WELL ROYALTY REDUCTION
Subsidy Category Government-Owned Energy Minerals – Royalty Relief or Reductions in OtherTaxes Due on Extraction
Subsidy Name Low Productivity Well Royalty Reduction
Jurisdiction Provincial – Alberta
Granting Organization Government of Alberta
Objective of Subsidy This is a permanent oil royalty policy to encourage additional productionfrom low-productivity wells.
The Low Productivity Well Royalty Reduction program was developed inorder to address the high marginal royalty rates facing investment in oil wellproductivity enhancements.
The program was implemented to encourage incremental productionthrough investment in low-producing oil wells.
Recipient of Subsidy Wells eligible for this royalty reduction are wells that meet the following criteria:
• A low-productivity well is an oil well or oil sands well.
• The well did not produce more than 121 m3 of oil or oil sands in anymonth during the qualifying period.
• The qualifying period consists of the 12 consecutive months that end inSeptember, October, November or December 1992, or the 24 consecutivemonths ending in January 1993 or later.
• Average monthly production for the well is 73 m3 or less during the mostrecent six months that the well produced, providing those months occurredwithin the qualifying period.
• Eligible oil from a low-productivity well is oil or oil sands obtained from apool or oil sands deposit that was penetrated by the well at the end of thewell’s qualifying period. Production from deeper pools or depositspenetrated after the well’s qualifying period is not eligible.
Size of Subsidy Royalty is capped at 5 per cent for up to 16,000 m3 in aggregate crude oil (Financial or Otherwise) or oil sands production from each eligible well after the date of qualification.
Royalty under the Petroleum Royalty Regulation or the Oil Sands RoyaltyRegulation is calculated on each month’s production from each event withina well; royalty for each event is reduced if it exceeds 5 per cent of the Crownproduction.
Effective August, 2006, the following major royalty policy changes wereimplemented:
• Conversion of the existing 16,000 m3 production volume cap to a$50,000 CDN royalty value cap effective September 1, 2007.
• Existing wells will have their accumulated royalty reduction volume underthe program converted to a dollar amount based on the monthly par pricewhen the royalty reductions were received.
www.globalsubsidies.org
THE GLOBAL SUBSIDIES INITIATIVE FOSSIL FUELS – AT WHAT COST? GOVERNMENT SUPPORT FOR UPSTREAM OIL ACTIVITIES IN THREE CANADIAN PROVINCES: ALBERTA, SASKATCHEWAN, AND NEWFOUNDLAND AND LABRADOR Page 86
12.2.11 LOW PRODUCTIVITY WELL ROYALTY REDUCTION (Continued)
• Creation of three well production ranges with corresponding thresholdquantities effective September 1, 2007. The well production range forexisting wells will be determined based on historical well productivity. Theroyalty rates will be calculated based on the lower of actual production orthreshold quantity for each well effective September 1, 2007.
Production Range Threshold Quantity
24 m3 per month or less 24 m3
>24 m3 and < or = 47 m3 per month 47 m3
>47 m3 and < or = 73 m3 per month 73 m3
Time Period Since Initiation Enacted in January 1993, no application will be required for the low-productivity oil royalty adjustment. Well production history will be reviewedby the Department. The royalty adjustment will be established for eligiblewells when the Department calculates royalty after qualification criteria havebeen met. However, initial processing will occur during March 1993 for theproduction month of January 1993.
Royalty adjustments will be retroactive either to October 1, 1992, or thequalification date of the well. The royalty reduction for existing wellsexceeding the maximum royalty value cap will be terminated effectiveSeptember 1, 2007. The program will be reviewed prior to the expiry dateof September 1, 2012.
Source Documents http://inform.energy.gov.ab.ca/Documents/Published/IL-2006-23.pdf
http://inform.energy.gov.ab.ca/Documents/Published/IL-1993-02.pdf
http://www.energy.alberta.ca/Tenure/pdfs/FISREG.pdf
Size of Subsidy (Financial or Otherwise)(Continued)
www.globalsubsidies.org
THE GLOBAL SUBSIDIES INITIATIVE FOSSIL FUELS – AT WHAT COST? GOVERNMENT SUPPORT FOR UPSTREAM OIL ACTIVITIES IN THREE CANADIAN PROVINCES: ALBERTA, SASKATCHEWAN, AND NEWFOUNDLAND AND LABRADOR Page 87
12.2.12 INNOVATIVE ENERGY TECHNOLOGIES PROGRAM (IETP)
Subsidy Category Government-Owned Energy Minerals – Royalty Relief or Reductions in OtherTaxes Due on Extraction
Subsidy Name Innovative Energy Technologies Program (IETP)
Jurisdiction Provincial – Alberta
Granting Organization Government of Alberta
Objective of Subsidy The IETP is designed to encourage the development of innovativetechnologies that will increase resource recovery. The program promotes theuse of new or innovative technologies to increase environmentally soundrecoveries for existing reserves and encourage responsible development ofnew oil, natural gas and in situ bitumen reserves.
The program is also designed to assist industry to find commercial technicalsolutions to the gas over bitumen issue that will allow efficient and orderlyproduction of both resources.
IETP will encourage innovation and faster commercialization of newtechnologies by sharing in the financial risk.
Recipient of Subsidy Program evaluation criteria will be based on a project proposal’sdemonstration of compliance with Alberta Energy’s objectives of developinginnovation, encouraging dissemination of technology and providing positiveeconomic benefits to the people of Alberta without causing harm to theenvironment.
The allocation of funding to specific projects will be based on the merits ofthe project. Flexibility will be provided on funding allocation to oil, gas andoil sands projects to ensure that all three commodity areas have access tofunds from this program.
Size of Subsidy This represents a $200 million CDN commitment over five years by the (Financial or Otherwise) Department of Energy to provide royalty adjustments to several pilot and
demonstration projects. Successful applicants in the program are providedwith royalty adjustments up to a maximum of 30 per cent of approvedproject costs. Industry must provide the remaining 70 per cent or more oftotal project costs.
The total industry/government commitment to important new technologies,assuming full subscription of the program, will be at least $667 millionCDN. The royalty adjustment for any one project is limited to a maximumof $10 million CDN.
There are currently 28 projects that have been approved and publiclyannounced.
www.globalsubsidies.org
THE GLOBAL SUBSIDIES INITIATIVE FOSSIL FUELS – AT WHAT COST? GOVERNMENT SUPPORT FOR UPSTREAM OIL ACTIVITIES IN THREE CANADIAN PROVINCES: ALBERTA, SASKATCHEWAN, AND NEWFOUNDLAND AND LABRADOR Page 88
12.2.12 INNOVATIVE ENERGY TECHNOLOGIES PROGRAM (IETP) (Continued)
Time Period Since Initiation Announced June 2004, this program offers royalty adjustments of up to$200 million CDN over five years to specific pilot and demonstrationprojects that use new or innovative technologies to increase environmentallysound recoveries for existing reserves and encourage responsibledevelopment of new oil, natural gas and in situ bitumen reserves.
The deadline to apply for the Innovative Energy Technologies Program(IETP), Round 2, was extended to December 31, 2006. The deadline forsubmission of applications for the third round is May 31, 2007.
Source Documents http://inform.energy.gov.ab.ca/Documents/Published/IL-2004-33.pdf
http://www.energy.gov.ab.ca/Oil/768.asp
http://inform.energy.gov.ab.ca/Documents/Published/IL-2005-27.pdf
http://inform.energy.gov.ab.ca/Documents/Published/IL-2007-04.pdf
12.2.13 ROYALTY TAX DEDUCTION (RESPONSE TO RESOURCE ALLOWANCE)
Subsidy Category Government-Owned Energy Minerals – Royalty Relief or Reductions in OtherTaxes Due on Extraction
Subsidy Name Royalty Tax Deduction
Jurisdiction Provincial – Alberta
Granting Organization Government of Alberta
Objective of Subsidy Tax and Revenue Administration (TRA), Alberta Finance and Enterprise,administers the Alberta Corporate Tax Act, which provides for the calculation of:
• Alberta corporate income tax for corporations with a permanentestablishment in Alberta, including Alberta deductions and credits suchas the Alberta royalty tax deduction, Alberta small business deduction,Alberta foreign investment income tax credit, Alberta politicalcontributions tax credit and scientific research and experimentaldevelopment (SR&ED) tax credit;
• Alberta royalty tax credit (ARTC) for corporations that pay eligible AlbertaCrown royalties;
• Alberta royalty credit for individuals and trusts (RCIT) that pay eligibleAlberta crown royalties; and
• Insurance corporations tax payable by corporations carrying on thebusiness of insurance in Alberta.
www.globalsubsidies.org
THE GLOBAL SUBSIDIES INITIATIVE FOSSIL FUELS – AT WHAT COST? GOVERNMENT SUPPORT FOR UPSTREAM OIL ACTIVITIES IN THREE CANADIAN PROVINCES: ALBERTA, SASKATCHEWAN, AND NEWFOUNDLAND AND LABRADOR Page 89
12.2.13 ROYALTY TAX DEDUCTION (RESPONSE TO RESOURCE ALLOWANCE)(Continued)
Recipient of Subsidy Crown royalties are paid by companies to the provincial government for theright to extract natural resources owned by Albertans.
Size of Subsidy The current corporate income tax rate is 10.0 per cent of the amount taxable in Alberta where:
Alberta Taxable Income = (Canadian Taxable Income – Royalty TaxDeduction) x (Alberta Allocation Factor)
Royalty Tax Deduction = (Disallowed Crown Royalties and Freehold MineralTax paid but not allowed as a deduction for federal income taxes) – (25 percent Resource Allowance)
Alberta Allocation Factor = Taxable income in Alberta/Taxable income inCanada
The royalty tax deduction can only reduce the tax to zero. Unuseddeductions can be carried forward.
Time Period Since Initiation Responding to federal resource tax changes that came into effect January 1,2003, Alberta amended its Corporate Tax Act
Source Documents http://www.energy.alberta.ca/Tenure/pdfs/FISREG.pdf
http://www.finance.alberta.ca/publications/tax_rebates/corporate/overview.html#announce_rtc
12.2.14 ROYALTY PAYMENTS
The summary below provides a description of royalty payments. The newly created Alberta Royalty Regime(2009) briefly described could be considered a subsidy.
Subsidy Category Government-Owned Energy Minerals – Process of Paying Royalties Due
Subsidy Name Royalty Payments
Jurisdiction Provincial – Alberta
Granting Organization Government of Alberta
Objective of Subsidy Royalties are an important part of Alberta’s overall fiscal framework. Theyensure that Albertans, represented by the government, receive a portion ofthe benefits arising from the development of the province’s resources. Theyare also an important policy tool that can shape economic and resourcedevelopment. Royalty systems, namely the level of government take,endeavour to strike balance between two, at times competing, objectives:returning a share of the profits to the resource owner and encouraging thedevelopment of the resource.
www.globalsubsidies.org
THE GLOBAL SUBSIDIES INITIATIVE FOSSIL FUELS – AT WHAT COST? GOVERNMENT SUPPORT FOR UPSTREAM OIL ACTIVITIES IN THREE CANADIAN PROVINCES: ALBERTA, SASKATCHEWAN, AND NEWFOUNDLAND AND LABRADOR Page 90
12.2.14 ROYALTY PAYMENTS (Continued)
Recipient of Subsidy For companies that develop natural resources, however, the resource isusually owned by the government. As a result, if a company wants to developthe resource, it must pay a price, or a portion of the economic value of theresource, to the government. This price is referred to as a royalty,representing the cost that must be paid to the resource owner in exchangefor the right to develop the resource. Royalties are the cost of obtaining thebenefits associated with a property right—in Alberta’s case, the right todevelop a resource that is owned by the government representing allAlbertans. They ensure that Albertans receive a portion of the benefitsarising from the development of the province’s energy resources.
Size of Subsidy The province already accepts crude oil in lieu of cash royalties on (Financial or Otherwise) conventional and heavy oils. The oil is then sold by an agent of the Crown
(the Alberta Petroleum Marketing Commission) into the market with theproceeds paid to the Government of Alberta. Amendments to the Mines andMinerals Act made in November 2008 now allow the province to collect rawbitumen, or products from bitumen, anywhere along the value chain, in lieuof cash royalties. These products may then be sold at market prices toencourage more value-added development within the province. As withconventional oil, proceeds would be paid to the Government of Alberta. Fornatural gas and coal, the province receives royalties in the form of cashpayment. Royalty Collected – Total revenue collected:
• 2006/07 $12.260 billion CDN
• 2007/08 $11.271 billion CDN
• 2008/09 $12.176 billion CDN
• 2009/10 $6.103 billion (Budget 2009)
Time Period Since Initiation The history of Alberta’s royalty regime dates back over 70 years. WhenAlberta entered Confederation in 1905, the federal government retainedrights over natural resources. However, with the passage of the NaturalResources Transfer Acts in 1930, the Western provinces of Manitoba,Saskatchewan and Alberta gained exclusive jurisdiction over their naturalresources.
Alberta first set its royalty rate using a 5 per cent flat rate (of net revenue)for both oil and gas, which was later raised to 10 per cent by 1935. In1941, the government raised the royalty rate to a flat 12.5 per cent andintroduced a variable rate option where producers could choose betweenthe 12.5 per cent flat rate or a variable rate of five to 15 per cent based onproduction. By 1972, the royalty rate increased to 25 per cent of industrynet revenue in response to increasing world prices.
www.globalsubsidies.org
THE GLOBAL SUBSIDIES INITIATIVE FOSSIL FUELS – AT WHAT COST? GOVERNMENT SUPPORT FOR UPSTREAM OIL ACTIVITIES IN THREE CANADIAN PROVINCES: ALBERTA, SASKATCHEWAN, AND NEWFOUNDLAND AND LABRADOR Page 91
12.2.14 ROYALTY PAYMENTS (Continued)
Time Period Since Initiation The period between 1974 and 1997 saw many important variations to the(Continued) royalty system responding to changing conditions in the oil and gas industry.
In an effort to level the “playing field,” the government introduced pricesensitivity features to account for the volatility in energy prices throughoutthe 1970s and 1980s. In February 2007, Premier Ed Stelmach appointedan Alberta Royalty Review Panel whose members were asked to provideadvice on how to restructure Alberta’s royalty system. The Panel deliveredits report in September 2007 and, following an analysis of the Panel’s report,Premier Stelmach announced on October 23, 2007 the newly createdAlberta Royalty Regime. The regime was implemented January 1, 2009.
Source Documents http://www.energy.alberta.ca/Org/pdfs/Energy_Economic.pdf
http://www.energy.alberta.ca/Org/pdfs/Royalty_Jurisdiction.pdf
http://www.energy.alberta.ca/Tenure/pdfs/tenure_brochure.pdf
http://www.internationallawoffice.com/Newsletters/Detail.aspx?g=4c592667-d57b-4039-b667-9a0417cc689b&l=7D6Z826
12.2.15 LEASING OF MINERAL RIGHTS
In the process of leasing mineral rights, there is no inherent subsidy indicated unless it is clear that leasearrangements were being reduced somehow.
Subsidy Category Government-Owned Energy Minerals – Process for Mineral Leasing
Subsidy Name Leasing of Mineral Rights
Jurisdiction Provincial – Alberta
Granting Organization Government of Alberta
Objective of Subsidy Industry acquires leases from the province to develop Crown resourcesthrough a competitive bid auction, which occurs about every two weeks.
The province receives revenue from bonus bids from the successful auctionof mineral leases, rentals and fees associated with the leases, and throughmunicipal and corporate income taxes. While these are not royalties, they areall part of the return Albertans receive for the development their resources.
By facilitating the leasing of these rights, the tenure system makes itpossible for individuals and companies to explore for and develop Alberta’smineral resources for the benefit of the citizens of the province.
www.globalsubsidies.org
THE GLOBAL SUBSIDIES INITIATIVE FOSSIL FUELS – AT WHAT COST? GOVERNMENT SUPPORT FOR UPSTREAM OIL ACTIVITIES IN THREE CANADIAN PROVINCES: ALBERTA, SASKATCHEWAN, AND NEWFOUNDLAND AND LABRADOR Page 92
12.2.15 LEASING OF MINERAL RIGHTS (Continued)
Recipient of Subsidy The Department of Energy manages Crown-owned mineral rights on behalfof the citizens of the province.
Alberta benefits from a wealth of Crown-owned natural resources, but relieson the private sector to develop these resources.
Crown mineral rights are acquired through either a public offering or directapplication process.
The Public Offering process includes the following: companies apply to theDepartment of Energy and request that lands be offered for tenure,competitive bidding process—bonus bids, mineral agreements, royaltiespaid to the province to fund programs for Albertans.
Size of Subsidy The Department of Energy leases mineral rights for industry exploration and (Financial or Otherwise) development through a competitive sealed bid auction held about every two
weeks.
Successful bids received are referred to as “bonus bids.”
• 2006/07 $2.463 billion CDN
• 2007/08 $1.128 billion CDN
• 2008/09 $1.112 billion CDN
• 2009/10 $0.631 billion (Budget 2009)
Leases issued are charged an annual rent of $3.50 CDN per hectare foreach hectare covered by the agreement.
• 2006/07 $159 million CDN
• 2007/08 $159 million CDN
• 2008/09 $160 million CDN
• 2009/10 $143 million CDN (Budget 2009)
Time Period Since Initiation Alberta’s earliest tenure legislation for surface-mineable oil sands wasestablished for the Bituminous Sands Area near Fort McMurray in the1950s. (This area is now considered part of the Athabasca Oil Sands Area.)Under this legislation, the Alberta Government issued three-year explorationagreements, which could be converted to 21-year leases.
Legislative changes introduced in the late 1980s provided for 21-yearrenewals of oil sands leases, provided that that the leases were producing aprescribed volume of bitumen.
In the fall of 1997, a joint, industry-government committee—the IndustryOil Sands Tenure Advisory Committee (IOSTAC)—was formed to review theoil sands tenure system. The committee proposed several improvements,which are now part of the Oil Sands Tenure Regulation.
Source Documents http://www.energy.alberta.ca/Org/pdfs/Energy_Economic.pdf
http://www.energy.alberta.ca/OilSands/pdfs/GDE_OST_2009_Ch1.pdf
http://www.energy.alberta.ca/AbRel/docs/Standard_DOE_101_December_07.pps #1036,6,Slide 6
www.globalsubsidies.org
THE GLOBAL SUBSIDIES INITIATIVE FOSSIL FUELS – AT WHAT COST? GOVERNMENT SUPPORT FOR UPSTREAM OIL ACTIVITIES IN THREE CANADIAN PROVINCES: ALBERTA, SASKATCHEWAN, AND NEWFOUNDLAND AND LABRADOR Page 93
12.3 PROVINCIAL – SASKATCHEWAN
12.3.1 ENHANCED OIL RECOVERY (EOR) ROYALTY REGIME
Subsidy Category Government-Owned Energy Minerals – Royalty Relief or Reductions in OtherTaxes Due on Extraction
Subsidy Name Enhanced Oil Recovery (EOR) Royalty Regime
Jurisdiction Provincial – Saskatchewan
Granting Organization Government of Saskatchewan
Objective of Subsidy The EOR royalty and tax system is a cost-sensitive system that was designedto recognize the higher investment and operating costs associated withimplementing and operating EOR projects. Accordingly, the royalty and taxlevel is dependent on the profitability of each project.
Recipient of Subsidy The EOR royalty regime applies to any project that enhances the totalrecovery of oil through the use of thermal recovery techniques or approvedrecovery techniques other than water floods.
ELIGIBLE PROJECT COSTS AND INVESTMENTS
1. EOR OPERATING COSTS
EOR operating costs include all operating costs that are directly related orattributable to the production of “EOR oil.” A separate 10 per centallowance is provided in recognition of overhead and administrativeexpenses. Examples of direct operating costs include lifting, injection,disposal and general maintenance costs associated with the project.
In cases where both “EOR oil” and “non-EOR oil” is produced from an“EOR project,” the direct operating costs that are eligible as EOR operatingcosts are determined by subtracting the “direct non-EOR operating costs”from the “total direct operating costs” of the project. The non-EOR operatingcosts are determined by multiplying the volume of oil that is not “EOR oil”by the “direct non-EOR operating costs factor” that is established by orderof the minister.
2. EOR INVESTMENT
In order for investments to qualify under the EOR royalty/tax regime, theymust be directly related to the implementation and/or operation of an “EORproject” and be approved by the minister as EOR investments. Expensesthat may be categorized as either an investment or an operating cost will beconsidered an investment, including the cost of substances other than waterinjected into EOR wells.

www.globalsubsidies.org
THE GLOBAL SUBSIDIES INITIATIVE FOSSIL FUELS – AT WHAT COST? GOVERNMENT SUPPORT FOR UPSTREAM OIL ACTIVITIES IN THREE CANADIAN PROVINCES: ALBERTA, SASKATCHEWAN, AND NEWFOUNDLAND AND LABRADOR Page 94
12.3.1 ENHANCED OIL RECOVERY (EOR) ROYALTY REGIME (Continued)
Size of Subsidy The royalty/tax rates before and after investment payout are the same as (Financial or Otherwise) existed for the previous CO2 regime except the after-payout rate for freehold
oil has been reduced from 11 per cent to 8 per cent.
Rates Prior to Payout: 1 per cent of gross EOR revenues from Crown Lands,0 per cent of gross EOR revenues from Freehold Lands.
Rates After Payout: 20 per cent of EOR operating income from Crown Lands,8 per cent of EOR operating income from Freehold Lands.
Payout: Occurs when the project has recovered all of its investments &operating costs including a 5 per cent annual gross up of unrecovered costs.
Time Period Since Initiation Two separate royalty rate structures exist, one for projects that commencedoperation prior to April 1, 2005 and the other for projects or project expansionsthat commenced operation on or after April 1, 2005. In both cases, the royaltylevel is sensitive to project profitability and investment payout.
Source Documents http://www.er.gov.sk.ca/adx/aspx/adxGetMedia.aspx?DocID=5756,5755,3430,3384,2936,Documents&MediaID=27475&Filename=pr-ic11.pdf
http://www.er.gov.sk.ca/adx/aspx/adxGetMedia.aspx?DocID=3532,3430,3384,5460,2936,Documents&MediaID=9005&Filename=EOR+Letter+(March+21++2005).PDF
http://www.er.gov.sk.ca/adx/aspx/adxGetMedia.aspx?DocID=5756,5755,3430,3384,2936,Documents&MediaID=27476&Filename=pr-ic11a.pdf
http://www.er.gov.sk.ca/adx/aspx/adxGetMedia.aspx?DocID=10291,10289,3384,5460,2936,Documents&MediaID=25535&Filename=SER+CO2+Presentation+%232+%28Mar+3%29.pdf

www.globalsubsidies.org
THE GLOBAL SUBSIDIES INITIATIVE FOSSIL FUELS – AT WHAT COST? GOVERNMENT SUPPORT FOR UPSTREAM OIL ACTIVITIES IN THREE CANADIAN PROVINCES: ALBERTA, SASKATCHEWAN, AND NEWFOUNDLAND AND LABRADOR Page 95
12.3.2 ROYALTY TAX REBATE
This section discusses a historic subsidy and its removal, not a current subsidy.
Subsidy Category Government-Owned Energy Minerals – Royalty Relief or Reductions in OtherTaxes Due on Extraction
Subsidy Name Royalty Tax Rebate
Jurisdiction Provincial – Saskatchewan
Granting Organization Government of Saskatchewan
Objective of Subsidy The Royalty Tax Rebate (RTR) helps to offset the provincial portion ofincome taxes that are payable as a result of the federal government’sdecision to disallow provincial royalties and similar taxes as deductions indetermining taxable income. As a consequence of the federal government’sinitiative to reintroduce full deductibility of provincial resource royalties forfederal and provincial income tax purposes, the Saskatchewan Royalty TaxRebate is no longer necessary and will be allowed to wind down.
Recipient of Subsidy Application Procedure:
The Saskatchewan Royalty Tax Rebate for corporations is administered bythe Canada Revenue Agency (CRA) as a deduction from income tax payableunder the Income Tax Act, 2000 (Saskatchewan). For all taxation years,corporations eligible for the RTR must submit one copy of the SaskatchewanRoyalty Tax Rebate Calculation Form for Corporations (Schedule 400) totheir District Office of the CRA. A second copy must be sent toSaskatchewan Finance, Taxation and Intergovernmental Affairs Branch.
Size of Subsidy The current corporate income tax rate is 17 per cent of taxable income (Financial or Otherwise) earned in Saskatchewan, less the royalty tax rebate. The small business rate
is 8 per cent. The royalty tax rebate is the royalties/taxes less the 25 percent Resource Allowance. The rebate cannot increase the tax. Unuseddeductions can be carried forward.
Time Period Since Initiation The Saskatchewan Royalty Tax Rebate (RTR) was established in 1975 byan amendment to the Income Tax Act of Saskatchewan. The RTR wasintroduced in response to the federal government’s November 18, 1974budget, which announced that Crown royalties and similar taxes levied afterMay 6, 1974 could no longer be deducted as a business expense for incometax purposes.
Source Documents http://www.energy.alberta.ca/Tenure/pdfs/FISREG.pdf
http://www.finance.gov.sk.ca/Default.aspx?DN=f29f0583-c327-44ac-ae3c-e723cbff5b53
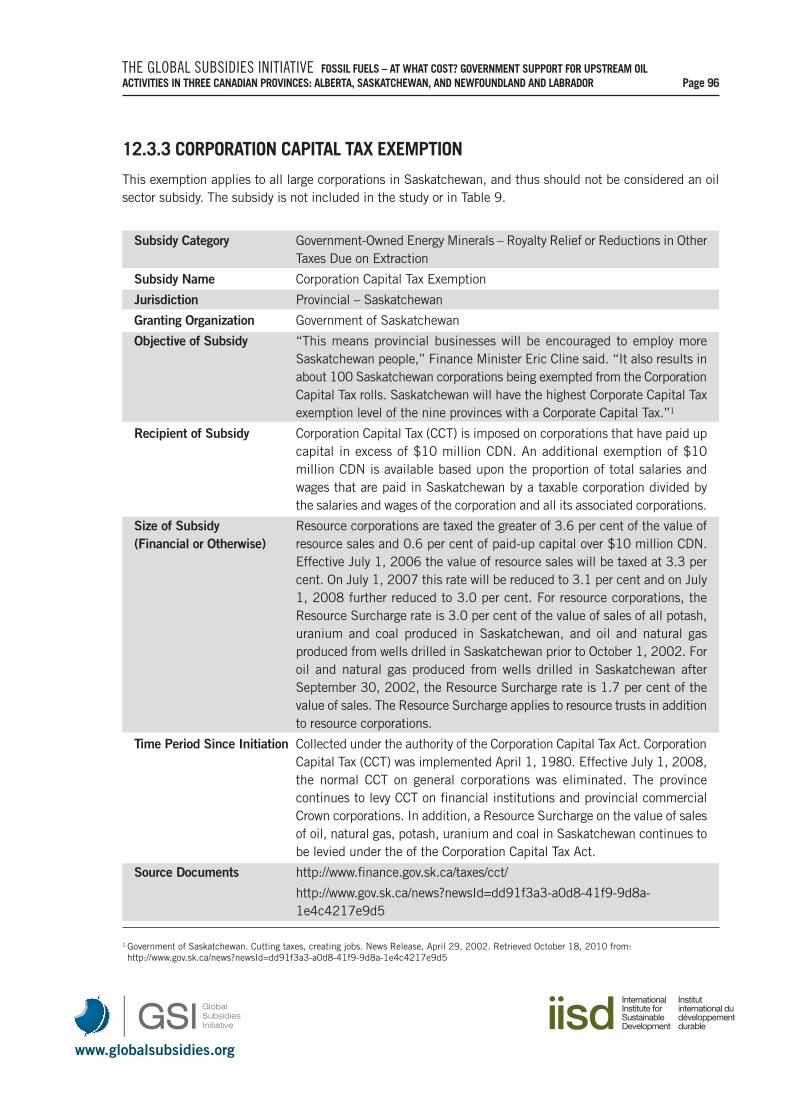
www.globalsubsidies.org
THE GLOBAL SUBSIDIES INITIATIVE FOSSIL FUELS – AT WHAT COST? GOVERNMENT SUPPORT FOR UPSTREAM OIL ACTIVITIES IN THREE CANADIAN PROVINCES: ALBERTA, SASKATCHEWAN, AND NEWFOUNDLAND AND LABRADOR Page 96
12.3.3 CORPORATION CAPITAL TAX EXEMPTION
This exemption applies to all large corporations in Saskatchewan, and thus should not be considered an oilsector subsidy. The subsidy is not included in the study or in Table 9.
Subsidy Category Government-Owned Energy Minerals – Royalty Relief or Reductions in OtherTaxes Due on Extraction
Subsidy Name Corporation Capital Tax Exemption
Jurisdiction Provincial – Saskatchewan
Granting Organization Government of Saskatchewan
Objective of Subsidy “This means provincial businesses will be encouraged to employ moreSaskatchewan people,” Finance Minister Eric Cline said. “It also results inabout 100 Saskatchewan corporations being exempted from the CorporationCapital Tax rolls. Saskatchewan will have the highest Corporate Capital Taxexemption level of the nine provinces with a Corporate Capital Tax.”1
Recipient of Subsidy Corporation Capital Tax (CCT) is imposed on corporations that have paid upcapital in excess of $10 million CDN. An additional exemption of $10million CDN is available based upon the proportion of total salaries andwages that are paid in Saskatchewan by a taxable corporation divided bythe salaries and wages of the corporation and all its associated corporations.
Size of Subsidy Resource corporations are taxed the greater of 3.6 per cent of the value of (Financial or Otherwise) resource sales and 0.6 per cent of paid-up capital over $10 million CDN.
Effective July 1, 2006 the value of resource sales will be taxed at 3.3 percent. On July 1, 2007 this rate will be reduced to 3.1 per cent and on July1, 2008 further reduced to 3.0 per cent. For resource corporations, theResource Surcharge rate is 3.0 per cent of the value of sales of all potash,uranium and coal produced in Saskatchewan, and oil and natural gasproduced from wells drilled in Saskatchewan prior to October 1, 2002. Foroil and natural gas produced from wells drilled in Saskatchewan afterSeptember 30, 2002, the Resource Surcharge rate is 1.7 per cent of thevalue of sales. The Resource Surcharge applies to resource trusts in additionto resource corporations.
Time Period Since Initiation Collected under the authority of the Corporation Capital Tax Act. CorporationCapital Tax (CCT) was implemented April 1, 1980. Effective July 1, 2008,the normal CCT on general corporations was eliminated. The provincecontinues to levy CCT on financial institutions and provincial commercialCrown corporations. In addition, a Resource Surcharge on the value of salesof oil, natural gas, potash, uranium and coal in Saskatchewan continues tobe levied under the of the Corporation Capital Tax Act.
Source Documents http://www.finance.gov.sk.ca/taxes/cct/
http://www.gov.sk.ca/news?newsId=dd91f3a3-a0d8-41f9-9d8a-1e4c4217e9d5
1 Government of Saskatchewan. Cutting taxes, creating jobs. News Release, April 29, 2002. Retrieved October 18, 2010 from:http://www.gov.sk.ca/news?newsId=dd91f3a3-a0d8-41f9-9d8a-1e4c4217e9d5
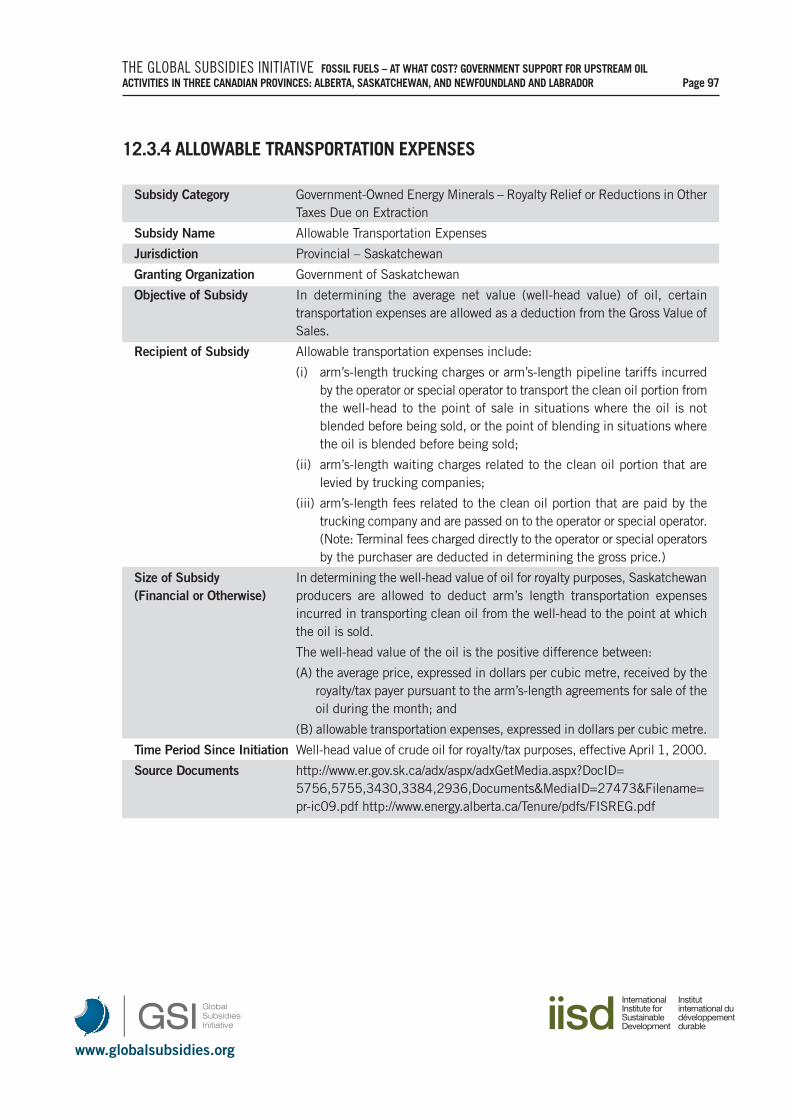
www.globalsubsidies.org
THE GLOBAL SUBSIDIES INITIATIVE FOSSIL FUELS – AT WHAT COST? GOVERNMENT SUPPORT FOR UPSTREAM OIL ACTIVITIES IN THREE CANADIAN PROVINCES: ALBERTA, SASKATCHEWAN, AND NEWFOUNDLAND AND LABRADOR Page 97
12.3.4 ALLOWABLE TRANSPORTATION EXPENSES
Subsidy Category Government-Owned Energy Minerals – Royalty Relief or Reductions in OtherTaxes Due on Extraction
Subsidy Name Allowable Transportation Expenses
Jurisdiction Provincial – Saskatchewan
Granting Organization Government of Saskatchewan
Objective of Subsidy In determining the average net value (well-head value) of oil, certaintransportation expenses are allowed as a deduction from the Gross Value ofSales.
Recipient of Subsidy Allowable transportation expenses include:
(i) arm’s-length trucking charges or arm’s-length pipeline tariffs incurredby the operator or special operator to transport the clean oil portion fromthe well-head to the point of sale in situations where the oil is notblended before being sold, or the point of blending in situations wherethe oil is blended before being sold;
(ii) arm’s-length waiting charges related to the clean oil portion that arelevied by trucking companies;
(iii) arm’s-length fees related to the clean oil portion that are paid by thetrucking company and are passed on to the operator or special operator.(Note: Terminal fees charged directly to the operator or special operatorsby the purchaser are deducted in determining the gross price.)
Size of Subsidy In determining the well-head value of oil for royalty purposes, Saskatchewan (Financial or Otherwise) producers are allowed to deduct arm’s length transportation expenses
incurred in transporting clean oil from the well-head to the point at whichthe oil is sold.
The well-head value of the oil is the positive difference between:
(A) the average price, expressed in dollars per cubic metre, received by theroyalty/tax payer pursuant to the arm’s-length agreements for sale of theoil during the month; and
(B) allowable transportation expenses, expressed in dollars per cubic metre.
Time Period Since Initiation Well-head value of crude oil for royalty/tax purposes, effective April 1, 2000.
Source Documents http://www.er.gov.sk.ca/adx/aspx/adxGetMedia.aspx?DocID=5756,5755,3430,3384,2936,Documents&MediaID=27473&Filename=pr-ic09.pdf http://www.energy.alberta.ca/Tenure/pdfs/FISREG.pdf
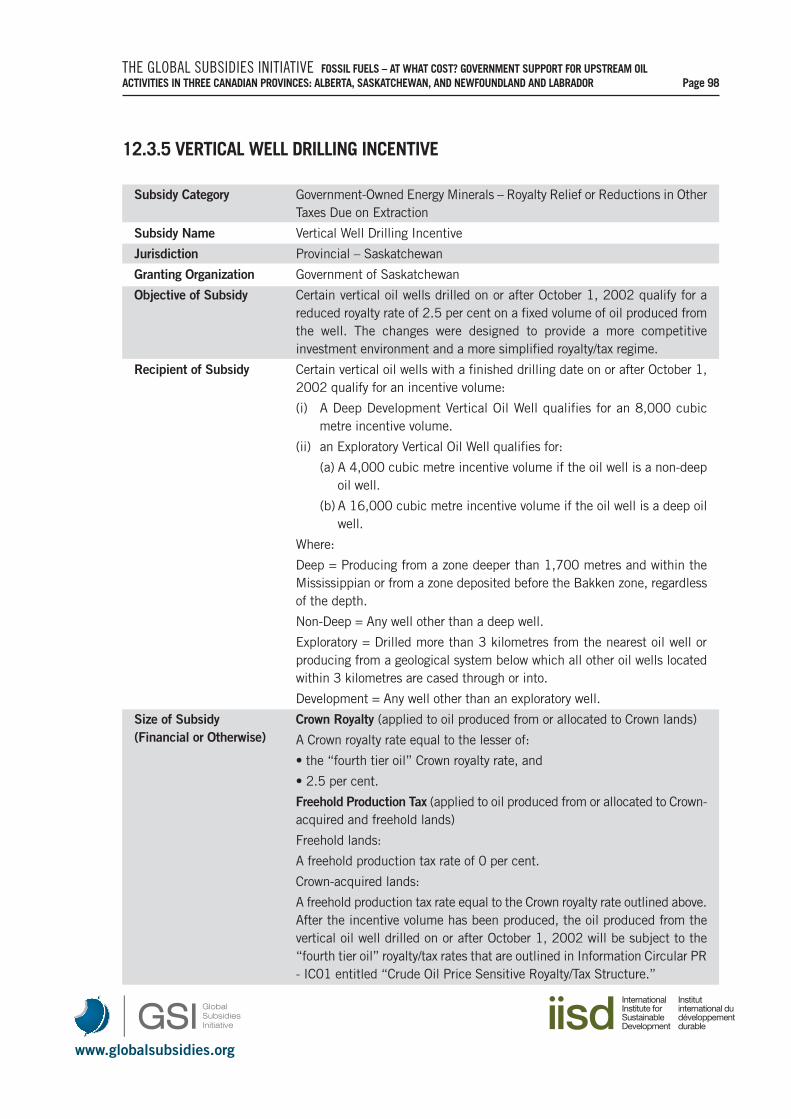
www.globalsubsidies.org
THE GLOBAL SUBSIDIES INITIATIVE FOSSIL FUELS – AT WHAT COST? GOVERNMENT SUPPORT FOR UPSTREAM OIL ACTIVITIES IN THREE CANADIAN PROVINCES: ALBERTA, SASKATCHEWAN, AND NEWFOUNDLAND AND LABRADOR Page 98
12.3.5 VERTICAL WELL DRILLING INCENTIVE
Subsidy Category Government-Owned Energy Minerals – Royalty Relief or Reductions in OtherTaxes Due on Extraction
Subsidy Name Vertical Well Drilling Incentive
Jurisdiction Provincial – Saskatchewan
Granting Organization Government of Saskatchewan
Objective of Subsidy Certain vertical oil wells drilled on or after October 1, 2002 qualify for areduced royalty rate of 2.5 per cent on a fixed volume of oil produced fromthe well. The changes were designed to provide a more competitiveinvestment environment and a more simplified royalty/tax regime.
Recipient of Subsidy Certain vertical oil wells with a finished drilling date on or after October 1,2002 qualify for an incentive volume:
(i) A Deep Development Vertical Oil Well qualifies for an 8,000 cubicmetre incentive volume.
(ii) an Exploratory Vertical Oil Well qualifies for:
(a) A 4,000 cubic metre incentive volume if the oil well is a non-deepoil well.
(b) A 16,000 cubic metre incentive volume if the oil well is a deep oilwell.
Where:
Deep = Producing from a zone deeper than 1,700 metres and within theMississippian or from a zone deposited before the Bakken zone, regardlessof the depth.
Non-Deep = Any well other than a deep well.
Exploratory = Drilled more than 3 kilometres from the nearest oil well orproducing from a geological system below which all other oil wells locatedwithin 3 kilometres are cased through or into.
Development = Any well other than an exploratory well.
Size of Subsidy Crown Royalty (applied to oil produced from or allocated to Crown lands) (Financial or Otherwise) A Crown royalty rate equal to the lesser of:
• the “fourth tier oil” Crown royalty rate, and
• 2.5 per cent.
Freehold Production Tax (applied to oil produced from or allocated to Crown-acquired and freehold lands)
Freehold lands:
A freehold production tax rate of 0 per cent.
Crown-acquired lands:
A freehold production tax rate equal to the Crown royalty rate outlined above.After the incentive volume has been produced, the oil produced from thevertical oil well drilled on or after October 1, 2002 will be subject to the“fourth tier oil” royalty/tax rates that are outlined in Information Circular PR- IC01 entitled “Crude Oil Price Sensitive Royalty/Tax Structure.”
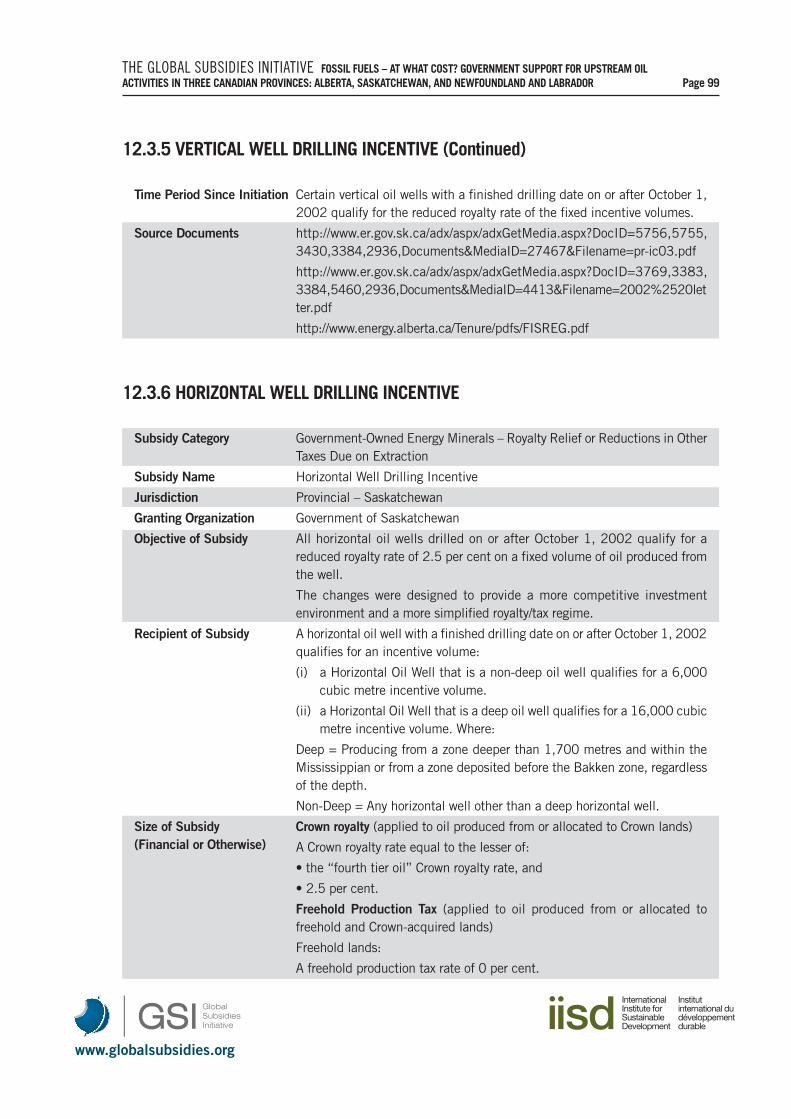
www.globalsubsidies.org
THE GLOBAL SUBSIDIES INITIATIVE FOSSIL FUELS – AT WHAT COST? GOVERNMENT SUPPORT FOR UPSTREAM OIL ACTIVITIES IN THREE CANADIAN PROVINCES: ALBERTA, SASKATCHEWAN, AND NEWFOUNDLAND AND LABRADOR Page 99
12.3.5 VERTICAL WELL DRILLING INCENTIVE (Continued)
Time Period Since Initiation Certain vertical oil wells with a finished drilling date on or after October 1,2002 qualify for the reduced royalty rate of the fixed incentive volumes.
Source Documents http://www.er.gov.sk.ca/adx/aspx/adxGetMedia.aspx?DocID=5756,5755,3430,3384,2936,Documents&MediaID=27467&Filename=pr-ic03.pdf
http://www.er.gov.sk.ca/adx/aspx/adxGetMedia.aspx?DocID=3769,3383,3384,5460,2936,Documents&MediaID=4413&Filename=2002%2520letter.pdf
http://www.energy.alberta.ca/Tenure/pdfs/FISREG.pdf
12.3.6 HORIZONTAL WELL DRILLING INCENTIVE
Subsidy Category Government-Owned Energy Minerals – Royalty Relief or Reductions in OtherTaxes Due on Extraction
Subsidy Name Horizontal Well Drilling Incentive
Jurisdiction Provincial – Saskatchewan
Granting Organization Government of Saskatchewan
Objective of Subsidy All horizontal oil wells drilled on or after October 1, 2002 qualify for areduced royalty rate of 2.5 per cent on a fixed volume of oil produced fromthe well.
The changes were designed to provide a more competitive investmentenvironment and a more simplified royalty/tax regime.
Recipient of Subsidy A horizontal oil well with a finished drilling date on or after October 1, 2002qualifies for an incentive volume:
(i) a Horizontal Oil Well that is a non-deep oil well qualifies for a 6,000cubic metre incentive volume.
(ii) a Horizontal Oil Well that is a deep oil well qualifies for a 16,000 cubicmetre incentive volume. Where:
Deep = Producing from a zone deeper than 1,700 metres and within theMississippian or from a zone deposited before the Bakken zone, regardlessof the depth.
Non-Deep = Any horizontal well other than a deep horizontal well.
Size of Subsidy Crown royalty (applied to oil produced from or allocated to Crown lands)(Financial or Otherwise) A Crown royalty rate equal to the lesser of:
• the “fourth tier oil” Crown royalty rate, and
• 2.5 per cent.
Freehold Production Tax (applied to oil produced from or allocated tofreehold and Crown-acquired lands)
Freehold lands:
A freehold production tax rate of 0 per cent.
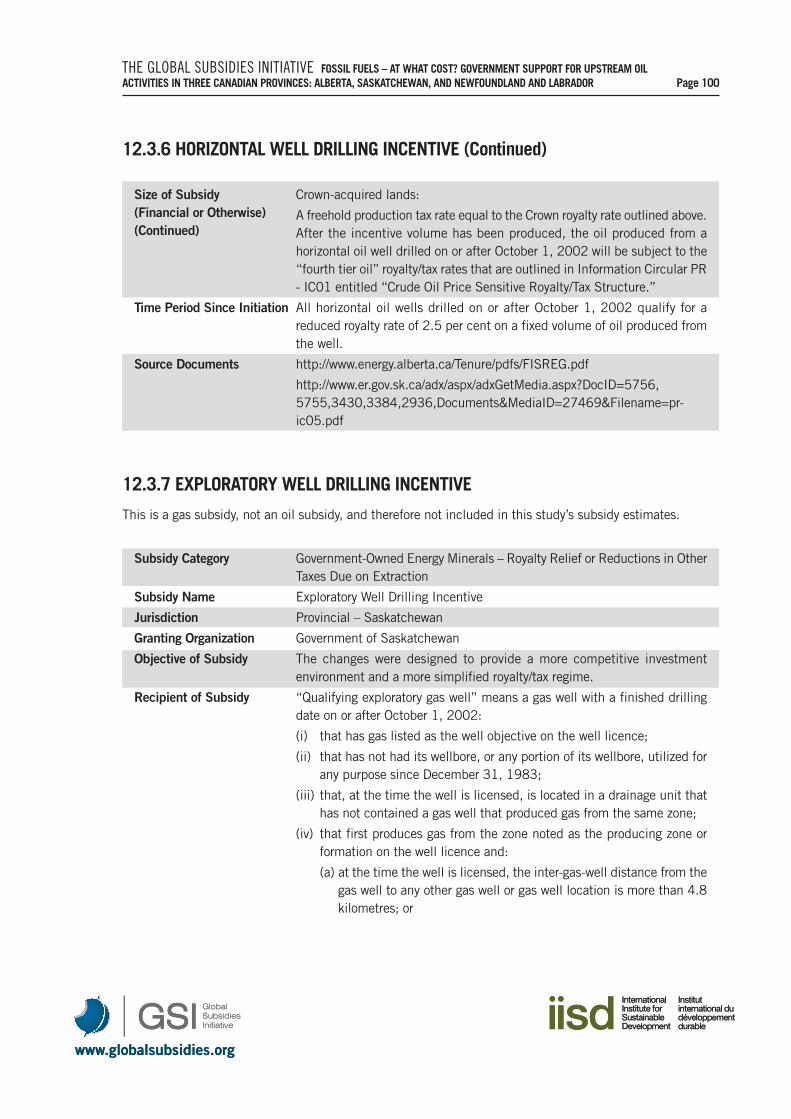
www.globalsubsidies.org
THE GLOBAL SUBSIDIES INITIATIVE FOSSIL FUELS – AT WHAT COST? GOVERNMENT SUPPORT FOR UPSTREAM OIL ACTIVITIES IN THREE CANADIAN PROVINCES: ALBERTA, SASKATCHEWAN, AND NEWFOUNDLAND AND LABRADOR Page 100
www.globalsubsidies.org
12.3.6 HORIZONTAL WELL DRILLING INCENTIVE (Continued)
Size of Subsidy Crown-acquired lands:(Financial or Otherwise) A freehold production tax rate equal to the Crown royalty rate outlined above. (Continued) After the incentive volume has been produced, the oil produced from a
horizontal oil well drilled on or after October 1, 2002 will be subject to the“fourth tier oil” royalty/tax rates that are outlined in Information Circular PR- IC01 entitled “Crude Oil Price Sensitive Royalty/Tax Structure.”
Time Period Since Initiation All horizontal oil wells drilled on or after October 1, 2002 qualify for areduced royalty rate of 2.5 per cent on a fixed volume of oil produced fromthe well.
Source Documents http://www.energy.alberta.ca/Tenure/pdfs/FISREG.pdf
http://www.er.gov.sk.ca/adx/aspx/adxGetMedia.aspx?DocID=5756,5755,3430,3384,2936,Documents&MediaID=27469&Filename=pr-ic05.pdf
12.3.7 EXPLORATORY WELL DRILLING INCENTIVE
This is a gas subsidy, not an oil subsidy, and therefore not included in this study’s subsidy estimates.
Subsidy Category Government-Owned Energy Minerals – Royalty Relief or Reductions in OtherTaxes Due on Extraction
Subsidy Name Exploratory Well Drilling Incentive
Jurisdiction Provincial – Saskatchewan
Granting Organization Government of Saskatchewan
Objective of Subsidy The changes were designed to provide a more competitive investmentenvironment and a more simplified royalty/tax regime.
Recipient of Subsidy “Qualifying exploratory gas well” means a gas well with a finished drillingdate on or after October 1, 2002:
(i) that has gas listed as the well objective on the well licence;
(ii) that has not had its wellbore, or any portion of its wellbore, utilized forany purpose since December 31, 1983;
(iii) that, at the time the well is licensed, is located in a drainage unit thathas not contained a gas well that produced gas from the same zone;
(iv) that first produces gas from the zone noted as the producing zone orformation on the well licence and:
(a) at the time the well is licensed, the inter-gas-well distance from thegas well to any other gas well or gas well location is more than 4.8kilometres; or

www.globalsubsidies.org
THE GLOBAL SUBSIDIES INITIATIVE FOSSIL FUELS – AT WHAT COST? GOVERNMENT SUPPORT FOR UPSTREAM OIL ACTIVITIES IN THREE CANADIAN PROVINCES: ALBERTA, SASKATCHEWAN, AND NEWFOUNDLAND AND LABRADOR Page 101
www.globalsubsidies.org
12.3.7 EXPLORATORY WELL DRILLING INCENTIVE (Continued)
(b) produces gas from a zone within an older geological system thanthe oldest geological system in which:
(I) any other gas well is cased through or into, if, at the time thegas well is licensed, the inter-gas-well distance from the othergas well to the gas well is 4.8 kilometres or less;
(II) any other gas well is open-hole completed into, if, at the timethe gas well is licensed, the inter-gas-well distance from theother gas well to the gas well is 4.8 kilometres or less; or
(III) any other gas well location is licensed through or into, if, atthe time the gas well is licensed, the inter-gas-well distancefrom the other gas well location to the gas well is 4.8kilometres or less;
(v) or a gas well with a finished drilling date on or after October 1,2002 that is approved by the minister as a qualifyingexploratory gas well.
Size of Subsidy Only gas wells classified as qualifying exploratory gas wells receive an (Financial or Otherwise) incentive volume.
A Qualifying Exploratory Gas Well qualifies for a 25,000 103 m3 royalty/taxincentive volume. The royalty/tax incentive volume for a qualifyingexploratory gas well receives the following royalty/tax rates:
Crown Royalty (applied to gas produced from or allocated to Crown lands)
A Crown royalty rate equal to the lessor of:
• the “fourth tier gas” Crown royalty rate; and
• 2.5 per cent.
Freehold Production Tax (applied to gas produced from or allocated toCrown-acquired and freehold lands)
Freehold lands: A freehold production tax rate of 0 per cent.
Crown-acquired lands: A freehold production tax rate equal to the Crownroyalty rate outlined above.
After the incentive volume has been produced, the gas produced from thequalifying exploratory gas well drilled on or after October 1, 2002 will besubject to the “fourth tier gas” royalty/tax rates that are outlined inInformation Circular PR - IC02 entitled “Natural Gas Price SensitiveRoyalty/Tax Structures.”
Time Period Since Initiation All qualifying exploratory oil wells drilled on or after October 1, 2002 areeligible for a reduced royalty rated of 2.5 per cent on a fixed incentivevolume.
Source Documents http://www.er.gov.sk.ca/adx/aspx/adxGetMedia.aspx?DocID=5756,5755,3430,3384,2936,Documents&MediaID=27468&Filename=pr-ic04.pdf
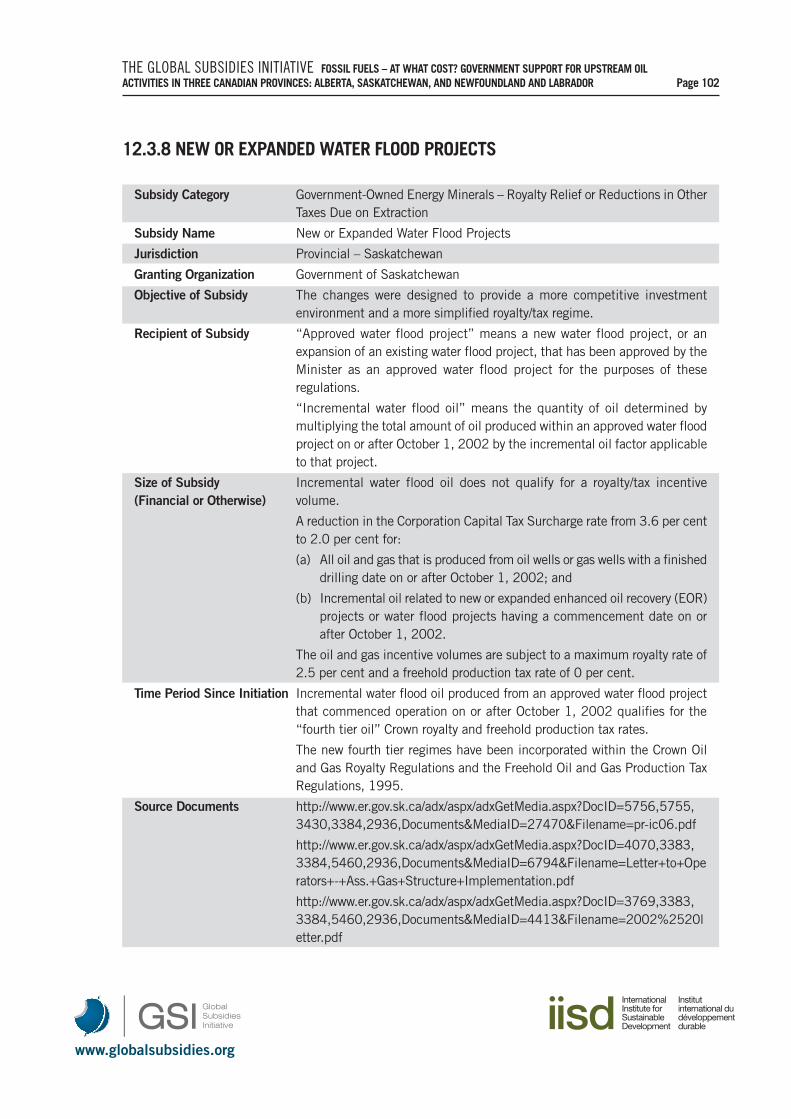
www.globalsubsidies.org
THE GLOBAL SUBSIDIES INITIATIVE FOSSIL FUELS – AT WHAT COST? GOVERNMENT SUPPORT FOR UPSTREAM OIL ACTIVITIES IN THREE CANADIAN PROVINCES: ALBERTA, SASKATCHEWAN, AND NEWFOUNDLAND AND LABRADOR Page 102
12.3.8 NEW OR EXPANDED WATER FLOOD PROJECTS
Subsidy Category Government-Owned Energy Minerals – Royalty Relief or Reductions in OtherTaxes Due on Extraction
Subsidy Name New or Expanded Water Flood Projects
Jurisdiction Provincial – Saskatchewan
Granting Organization Government of Saskatchewan
Objective of Subsidy The changes were designed to provide a more competitive investmentenvironment and a more simplified royalty/tax regime.
Recipient of Subsidy “Approved water flood project” means a new water flood project, or anexpansion of an existing water flood project, that has been approved by theMinister as an approved water flood project for the purposes of theseregulations.
“Incremental water flood oil” means the quantity of oil determined bymultiplying the total amount of oil produced within an approved water floodproject on or after October 1, 2002 by the incremental oil factor applicableto that project.
Size of Subsidy Incremental water flood oil does not qualify for a royalty/tax incentive(Financial or Otherwise) volume.
A reduction in the Corporation Capital Tax Surcharge rate from 3.6 per centto 2.0 per cent for:
(a) All oil and gas that is produced from oil wells or gas wells with a finisheddrilling date on or after October 1, 2002; and
(b) Incremental oil related to new or expanded enhanced oil recovery (EOR)projects or water flood projects having a commencement date on orafter October 1, 2002.
The oil and gas incentive volumes are subject to a maximum royalty rate of2.5 per cent and a freehold production tax rate of 0 per cent.
Time Period Since Initiation Incremental water flood oil produced from an approved water flood projectthat commenced operation on or after October 1, 2002 qualifies for the“fourth tier oil” Crown royalty and freehold production tax rates.
The new fourth tier regimes have been incorporated within the Crown Oiland Gas Royalty Regulations and the Freehold Oil and Gas Production TaxRegulations, 1995.
Source Documents http://www.er.gov.sk.ca/adx/aspx/adxGetMedia.aspx?DocID=5756,5755,3430,3384,2936,Documents&MediaID=27470&Filename=pr-ic06.pdf
http://www.er.gov.sk.ca/adx/aspx/adxGetMedia.aspx?DocID=4070,3383,3384,5460,2936,Documents&MediaID=6794&Filename=Letter+to+Operators+-+Ass.+Gas+Structure+Implementation.pdf
http://www.er.gov.sk.ca/adx/aspx/adxGetMedia.aspx?DocID=3769,3383,3384,5460,2936,Documents&MediaID=4413&Filename=2002%2520letter.pdf
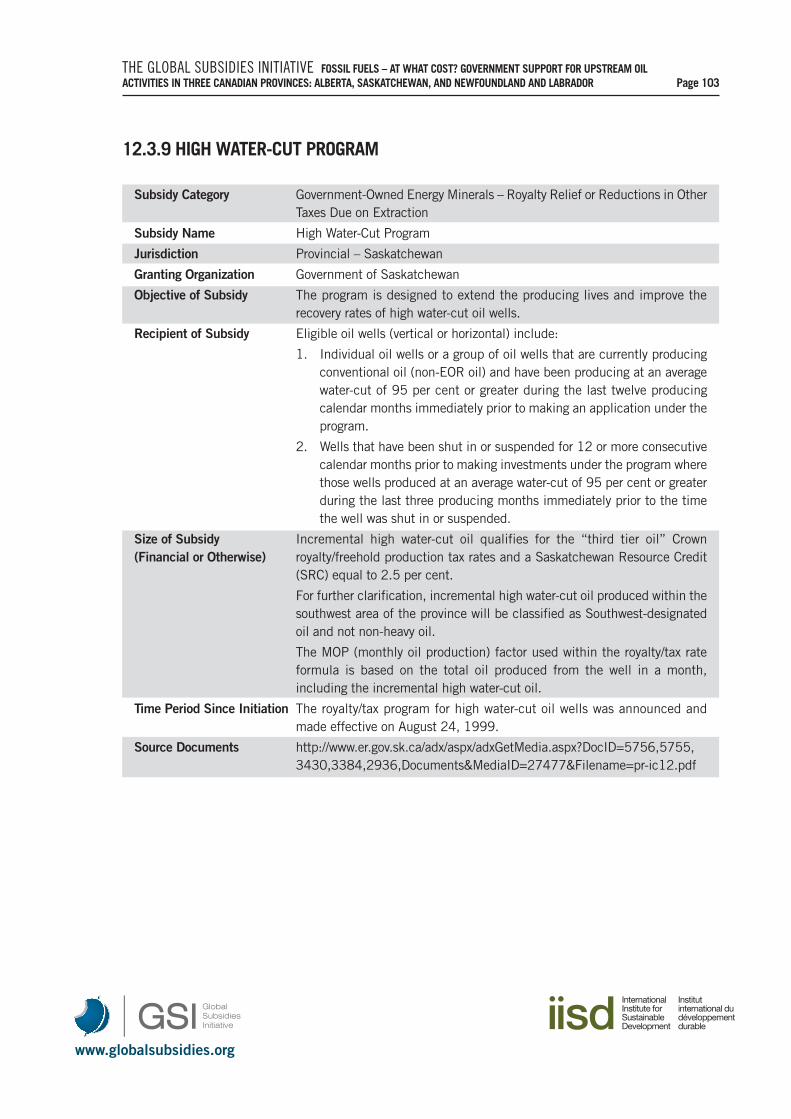
www.globalsubsidies.org
THE GLOBAL SUBSIDIES INITIATIVE FOSSIL FUELS – AT WHAT COST? GOVERNMENT SUPPORT FOR UPSTREAM OIL ACTIVITIES IN THREE CANADIAN PROVINCES: ALBERTA, SASKATCHEWAN, AND NEWFOUNDLAND AND LABRADOR Page 103
12.3.9 HIGH WATER-CUT PROGRAM
Subsidy Category Government-Owned Energy Minerals – Royalty Relief or Reductions in OtherTaxes Due on Extraction
Subsidy Name High Water-Cut Program
Jurisdiction Provincial – Saskatchewan
Granting Organization Government of Saskatchewan
Objective of Subsidy The program is designed to extend the producing lives and improve therecovery rates of high water-cut oil wells.
Recipient of Subsidy Eligible oil wells (vertical or horizontal) include:
1. Individual oil wells or a group of oil wells that are currently producingconventional oil (non-EOR oil) and have been producing at an averagewater-cut of 95 per cent or greater during the last twelve producingcalendar months immediately prior to making an application under theprogram.
2. Wells that have been shut in or suspended for 12 or more consecutivecalendar months prior to making investments under the program wherethose wells produced at an average water-cut of 95 per cent or greaterduring the last three producing months immediately prior to the timethe well was shut in or suspended.
Size of Subsidy Incremental high water-cut oil qualifies for the “third tier oil” Crown (Financial or Otherwise) royalty/freehold production tax rates and a Saskatchewan Resource Credit
(SRC) equal to 2.5 per cent.
For further clarification, incremental high water-cut oil produced within thesouthwest area of the province will be classified as Southwest-designatedoil and not non-heavy oil.
The MOP (monthly oil production) factor used within the royalty/tax rateformula is based on the total oil produced from the well in a month,including the incremental high water-cut oil.
Time Period Since Initiation The royalty/tax program for high water-cut oil wells was announced andmade effective on August 24, 1999.
Source Documents http://www.er.gov.sk.ca/adx/aspx/adxGetMedia.aspx?DocID=5756,5755,3430,3384,2936,Documents&MediaID=27477&Filename=pr-ic12.pdf
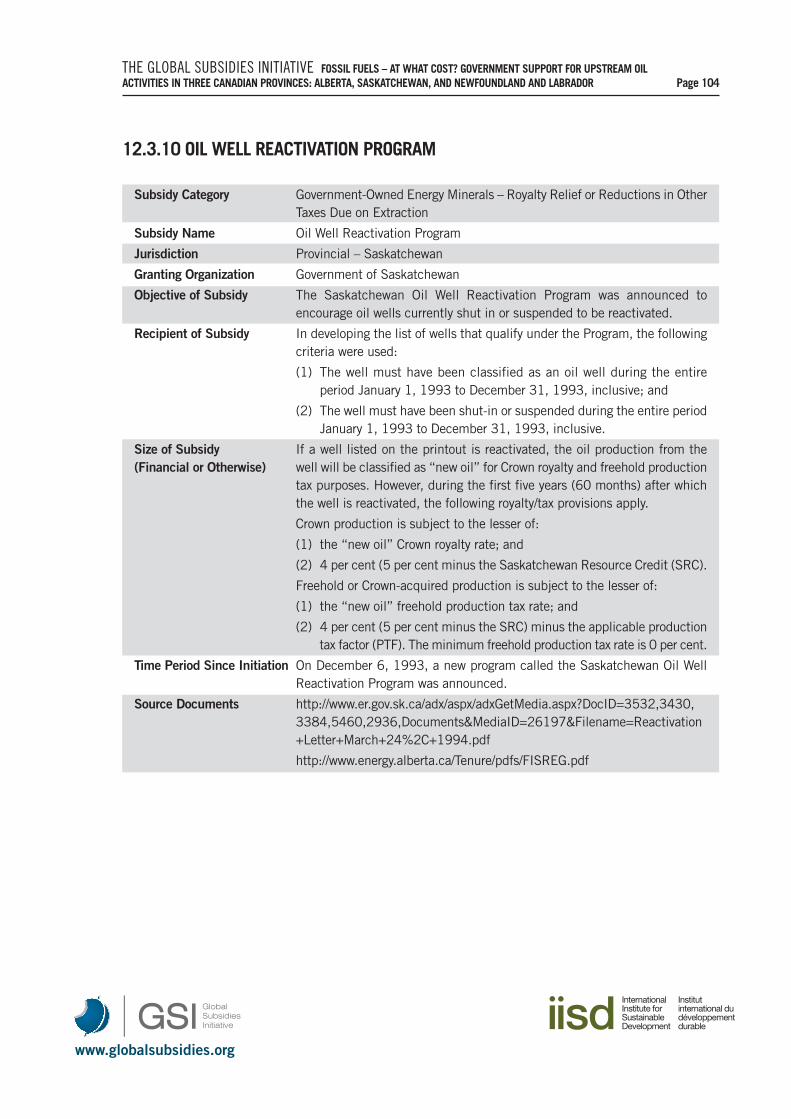
www.globalsubsidies.org
THE GLOBAL SUBSIDIES INITIATIVE FOSSIL FUELS – AT WHAT COST? GOVERNMENT SUPPORT FOR UPSTREAM OIL ACTIVITIES IN THREE CANADIAN PROVINCES: ALBERTA, SASKATCHEWAN, AND NEWFOUNDLAND AND LABRADOR Page 104
12.3.10 OIL WELL REACTIVATION PROGRAM
Subsidy Category Government-Owned Energy Minerals – Royalty Relief or Reductions in OtherTaxes Due on Extraction
Subsidy Name Oil Well Reactivation Program
Jurisdiction Provincial – Saskatchewan
Granting Organization Government of Saskatchewan
Objective of Subsidy The Saskatchewan Oil Well Reactivation Program was announced toencourage oil wells currently shut in or suspended to be reactivated.
Recipient of Subsidy In developing the list of wells that qualify under the Program, the followingcriteria were used:
(1) The well must have been classified as an oil well during the entireperiod January 1, 1993 to December 31, 1993, inclusive; and
(2) The well must have been shut-in or suspended during the entire periodJanuary 1, 1993 to December 31, 1993, inclusive.
Size of Subsidy If a well listed on the printout is reactivated, the oil production from the (Financial or Otherwise) well will be classified as “new oil” for Crown royalty and freehold production
tax purposes. However, during the first five years (60 months) after whichthe well is reactivated, the following royalty/tax provisions apply.
Crown production is subject to the lesser of:
(1) the “new oil” Crown royalty rate; and
(2) 4 per cent (5 per cent minus the Saskatchewan Resource Credit (SRC).
Freehold or Crown-acquired production is subject to the lesser of:
(1) the “new oil” freehold production tax rate; and
(2) 4 per cent (5 per cent minus the SRC) minus the applicable productiontax factor (PTF). The minimum freehold production tax rate is 0 per cent.
Time Period Since Initiation On December 6, 1993, a new program called the Saskatchewan Oil WellReactivation Program was announced.
Source Documents http://www.er.gov.sk.ca/adx/aspx/adxGetMedia.aspx?DocID=3532,3430,3384,5460,2936,Documents&MediaID=26197&Filename=Reactivation+Letter+March+24%2C+1994.pdf
http://www.energy.alberta.ca/Tenure/pdfs/FISREG.pdf

www.globalsubsidies.org
THE GLOBAL SUBSIDIES INITIATIVE FOSSIL FUELS – AT WHAT COST? GOVERNMENT SUPPORT FOR UPSTREAM OIL ACTIVITIES IN THREE CANADIAN PROVINCES: ALBERTA, SASKATCHEWAN, AND NEWFOUNDLAND AND LABRADOR Page 105
12.3.11 WORKOVER RECLASSIFICATION PROGRAM
Subsidy Category Government-Owned Energy Minerals – Royalty Relief or Reductions in OtherTaxes Due on Extraction
Subsidy Name Workover Reclassification Program
Jurisdiction Provincial – Saskatchewan
Granting Organization Government of Saskatchewan
Objective of Subsidy The Workover Reclassification Program was introduced in July 1982 toencourage workovers to be performed on oil wells or on oil field equipmentthat would result in the recovery of incremental oil from oil wells that arecurrently producing oil classified as “old oil” for Crown royalty/freeholdproduction tax purposes.
Recipient of Subsidy “Approved workover” means a workover:
(i) that is performed on an oil well or on oil field equipment associatedwith an oil well:
(a) that is producing oil that is all or partially classified as “old oil” forCrown royalty and freehold production tax purposes; and
(b) that produced an average of less than 5 cubic metres of oil per day(approximately 30 barrels per day) during the last six months inwhich the well was producing; and
(ii) that in the opinion of the Minister:
(a) will result in incremental oil being produced from the oil well andwill also result in higher Crown royalty/freehold production taxrevenues being received by the province; and
(b) is uneconomic without “old oil” being reclassified to “new oil” forroyalty/tax purposes.
Size of Subsidy Under this program, all or a portion of the “old oil” production from the oil (Financial or Otherwise) wells may be reclassified to “new oil.” The royalty classification of any well
that produces old oil (pre-1974) may be reclassified to new oil for royaltypurposes if the operator undertakes an approved major workover to improveoil recovery rates.
Time Period Since Initiation The Workover Reclassification Program was introduced in July 1982. Underthe Workover Reclassification Program, the reclassification of oil from “oldoil” to “new oil” is effective the first of the month following the month inwhich Energy and Resources receives notification that the approvedworkover has been completed.
Source Documents http://www.er.gov.sk.ca/adx/aspx/adxGetMedia.aspx?DocID=5756,5755,3430,3384,2936,Documents&MediaID=27471&Filename=pr-ic07.pdf
http://www.energy.alberta.ca/Tenure/pdfs/FISREG.pdf
www.globalsubsidies.org
THE GLOBAL SUBSIDIES INITIATIVE FOSSIL FUELS – AT WHAT COST? GOVERNMENT SUPPORT FOR UPSTREAM OIL ACTIVITIES IN THREE CANADIAN PROVINCES: ALBERTA, SASKATCHEWAN, AND NEWFOUNDLAND AND LABRADOR Page 106
12.4 PROVINCIAL – NEWFOUNDLAND AND LABRADOR
12.4.1 FISCAL EQUALIZATION OFFSET PAYMENTS
This is a provincial and federal balance issue and not related directly to providing oil subsidies.
Subsidy Category Government-Owned Energy Minerals – Royalty Relief or Reductions in OtherTaxes Due on Extraction
Subsidy Name Fiscal Equalization Offset Payments
Jurisdiction Provincial – Newfoundland and Labrador
Granting Organization Government of Canada, Government of Newfoundland and Labrador
Objective of Subsidy The Government of Canada recognizes the unique economic and fiscalchallenges faced by Newfoundland and Labrador and the strongcommitment of the province to improve its fiscal situation.
To make payments to the province to compensate for part of the reductionin fiscal equalization entitlements that would result from offshore revenuesbeing included in the equalization program.
To make natural resource sectors internationally competitive, economicallyproductive, and contribute to the social well-being of Canadians.
Recipient of Subsidy Government of Newfoundland and Labrador
Size of Subsidy The Atlantic Accord Agreement document reflects an understanding (Financial or Otherwise) between the Government of Canada and the Government of Newfoundland
and Labrador that:
• Newfoundland and Labrador receives and will continue to receive 100 percent of offshore resource revenues as if these resources were on land;
• the Government of Canada intends to provide additional offset paymentsto the province with respect to offshore-related equalization reductions,effectively allowing it to retain the benefit of 100 per cent of its offshoreresource revenues.
Total program contributions in 2008–2009: $556.7 million CDN.
Time Period Since Initiation Agreement start date: 2002
Commencing in 2006–2007, and continuing through 2011–2012, theannual offset payments shall be equal to 100 per cent of any reductions inequalization payments resulting from offshore resource revenues.
A successor arrangement would be put in place for the period 2012–2013to 2019–2020 if the province qualifies for an equalization payment in2010–2011 or 2011–2012 and its per capita debt servicing charges havenot become lower than those of at least four other provinces.
No later than March 31, 2019, the parties agree to review the currentarrangement.
Source Documents http://www.gov.nl.ca/atlanticaccord/agreement.htm
http://www.gs.gov.nl.ca/printer/publications/aa_mou.pdf

www.globalsubsidies.org
THE GLOBAL SUBSIDIES INITIATIVE FOSSIL FUELS – AT WHAT COST? GOVERNMENT SUPPORT FOR UPSTREAM OIL ACTIVITIES IN THREE CANADIAN PROVINCES: ALBERTA, SASKATCHEWAN, AND NEWFOUNDLAND AND LABRADOR Page 107
13. GOVERNMENT OWNERSHIP OF ENERGY-RELATED ENTERPRISES
13.1 FEDERAL
13.1.1 EQUITY INVESTMENT
Subsidy Category Government Ownership of Energy-Related Enterprises – Security-RelatedEnterprises
Subsidy Name Equity Investment
Jurisdiction Newfoundland and Labrador
Granting Organization Federal Government
Objective of Subsidy Risk and benefit sharing of offshore development projects
Recipient of Subsidy If the equity investment does not produce profits, it could be argued thatthe investment reduces the risk exposure of oil companies; however, ingeneral this is not considered to be a subsidy for the sector.
Size of the Subsidy Ottawa holds an 8.5 per cent stake through the Canada Hibernia Holding (Financial or Otherwise) Company, for which the federal government paid $290 CDN million in the
early 1990s. In 2008–2009, the feds pocketed $288 million CDN in profitwhen the oil price was more than $100 CDN a barrel. In the past sevenyears, the federal government has reaped more than $1 billion CDN in profit.
Time Period Since Initiation Investment in 1997; the stake is currently still under federal jurisdictionbut may be transferred to Newfoundland and Labrador in future.
Source Documents http://www.ey.com/Publication/vwLUAssets/EastCoastOffshore_Iss17Apr10/$FILE/EastCoastOffshoreIssue17Apr10.pdf
www.globalsubsidies.org
THE GLOBAL SUBSIDIES INITIATIVE FOSSIL FUELS – AT WHAT COST? GOVERNMENT SUPPORT FOR UPSTREAM OIL ACTIVITIES IN THREE CANADIAN PROVINCES: ALBERTA, SASKATCHEWAN, AND NEWFOUNDLAND AND LABRADOR Page 108
13.2 PROVINCIAL – NEWFOUNDLAND AND LABRADOR
13.2.1 EQUITY INVESTMENT
Subsidy Category Government Ownership of Energy-Related Enterprises – Security RelatedEnterprises
Subsidy Name Equity Investment
Jurisdiction Newfoundland and Labrador
Granting Organization Government of Newfoundland and Labrador through Nalcor Energy, aNewfoundland and Labrador Crown-owned energy corporation
Objective of Subsidy Risk and benefit sharing of offshore development projects
Recipient of Subsidy If the equity investment does not produce profits, it could be argued thatthe investment reduces the risk exposure for oil companies; however, ingeneral, this is not considered to be a subsidy for the sector.
Size of the Subsidy Nalcor acquired a 4.9 per cent equity stake in Hebron ($110 million CDN) (Financial or Otherwise) and a five per cent share of the White Rose expansion. It also plans a 10
per cent interest in most of the Hibernia South field for approximately $30million CDN.
In 2009–2010 Nalcor received $40 million CDN to “facilitate itsparticipation in oil and gas activities and other energy projects.”
Time Period Since Initiation Investments in 2009
Source Documents http://www.thetelegram.com/index.cfm?sid=335179&sc=82
http://www.nalcorenergy.com/assets/derrick%20sturge’s%20presentation_nalcor%20agm%2006%2009_web%20posting.pdf
http://www.budget.gov.nl.ca/Budget2008/highlights.htm
www.globalsubsidies.org
THE GLOBAL SUBSIDIES INITIATIVE FOSSIL FUELS – AT WHAT COST? GOVERNMENT SUPPORT FOR UPSTREAM OIL ACTIVITIES IN THREE CANADIAN PROVINCES: ALBERTA, SASKATCHEWAN, AND NEWFOUNDLAND AND LABRADOR Page 109
13.3 SASKATCHEWAN
13.3.1 SASKATCHEWAN CARBON DIOXIDE EOR AND STORAGE INITIATIVE
Subsidy Category Government-Owned Energy Minerals – Environmental Issues
Subsidy Name Saskatchewan Carbon Dioxide EOR and Storage Initiative
Jurisdiction Provincial - Saskatchewan
Granting Organization Government of Saskatchewan – Ministry of Energy and Resources
Objective of Subsidy The initiative will first prepare engineering, economic, administrative andlegal information required to assess the different barriers to implementingCO2 EOR in oil fields in Saskatchewan and then joint cost-share the designand implementation of new pilot projects in two or more Saskatchewan oilfields. The aim of the pilot projects is to demonstrate the technical andeconomic potential of EOR in these reservoirs.
Recipient of Subsidy Collaboration between government and industry
Size of Subsidy $7.2 million CDN, five-year initiative(Financial or Otherwise)
Time Period Since Initiation 2009 to 2014
Source Documents http://www.er.gov.sk.ca/Default.aspx?DN=9eb5e74d-ba2c-486d-8796-ad6008f69180
http://www.er.gov.sk.ca/adx/aspx/adxGetMedia.aspx?DocID=10291,10289,3384,5460,2936,Documents&MediaID=25534&Filename=SER+CO2+Info+Opening+Remarks+(Mar+6+09).pdf
www.globalsubsidies.org
THE GLOBAL SUBSIDIES INITIATIVE FOSSIL FUELS – AT WHAT COST? GOVERNMENT SUPPORT FOR UPSTREAM OIL ACTIVITIES IN THREE CANADIAN PROVINCES: ALBERTA, SASKATCHEWAN, AND NEWFOUNDLAND AND LABRADOR Page 110
13.3.2 UPSTREAM EMISSION REDUCTION INITIATIVE
Subsidy Category Government-Owned Energy Minerals – Environmental Issues
Subsidy Name Upstream Emission Reduction Initiative
Jurisdiction Provincial - Saskatchewan
Granting Organization Government of Saskatchewan – Ministry of Energy and Resources
Objective of Subsidy To conduct a joint review with industry to look at opportunities to reduceemissions in the upstream oil and gas sector and develop technologicalopportunities to reduce GHG emissions.
Recipient of Subsidy Oil and gas sector
Size of Subsidy Saskatchewan will participate in the Upstream Emission Reduction Initiative(Financial or Otherwise) at an annual contribution of $300,000 CDN to support one or two large
projects in Saskatchewan per year with industry. In addition, Saskatchewanwould also provide up to an additional $100,000 CDN per year as theprovincial contribution to smaller oil and gas industry emission reductionsprojects in Saskatchewan.
Time Period Since Initiation Announced in 2007
Source Documents http://www.er.gov.sk.ca/Default.aspx?DN=56b82248-d453-4f75-90f2-0a12ec55707c
http://www.capp.ca/getdoc.aspx?dt=PDF&docID=146183
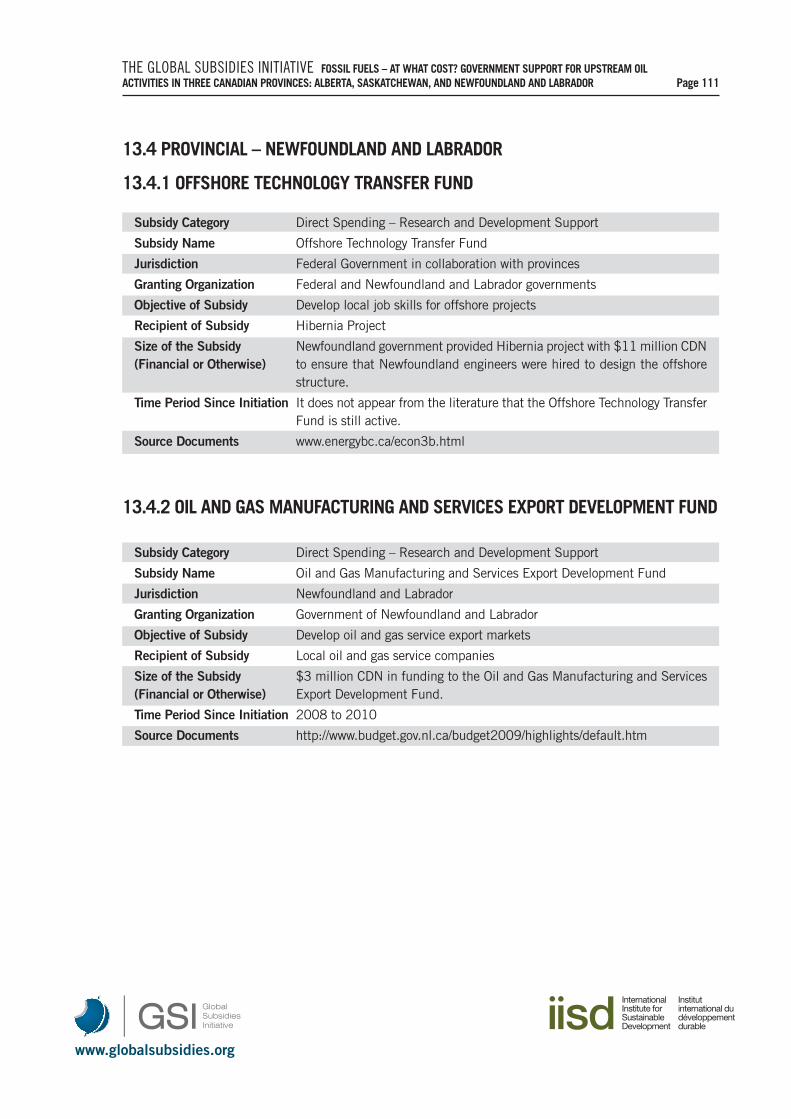
www.globalsubsidies.org
THE GLOBAL SUBSIDIES INITIATIVE FOSSIL FUELS – AT WHAT COST? GOVERNMENT SUPPORT FOR UPSTREAM OIL ACTIVITIES IN THREE CANADIAN PROVINCES: ALBERTA, SASKATCHEWAN, AND NEWFOUNDLAND AND LABRADOR Page 111
13.4 PROVINCIAL – NEWFOUNDLAND AND LABRADOR
13.4.1 OFFSHORE TECHNOLOGY TRANSFER FUND
Subsidy Category Direct Spending – Research and Development Support
Subsidy Name Offshore Technology Transfer Fund
Jurisdiction Federal Government in collaboration with provinces
Granting Organization Federal and Newfoundland and Labrador governments
Objective of Subsidy Develop local job skills for offshore projects
Recipient of Subsidy Hibernia Project
Size of the Subsidy Newfoundland government provided Hibernia project with $11 million CDN (Financial or Otherwise) to ensure that Newfoundland engineers were hired to design the offshore
structure.
Time Period Since Initiation It does not appear from the literature that the Offshore Technology TransferFund is still active.
Source Documents www.energybc.ca/econ3b.html
13.4.2 OIL AND GAS MANUFACTURING AND SERVICES EXPORT DEVELOPMENT FUND
Subsidy Category Direct Spending – Research and Development Support
Subsidy Name Oil and Gas Manufacturing and Services Export Development Fund
Jurisdiction Newfoundland and Labrador
Granting Organization Government of Newfoundland and Labrador
Objective of Subsidy Develop oil and gas service export markets
Recipient of Subsidy Local oil and gas service companies
Size of the Subsidy $3 million CDN in funding to the Oil and Gas Manufacturing and Services (Financial or Otherwise) Export Development Fund.
Time Period Since Initiation 2008 to 2010
Source Documents http://www.budget.gov.nl.ca/budget2009/highlights/default.htm
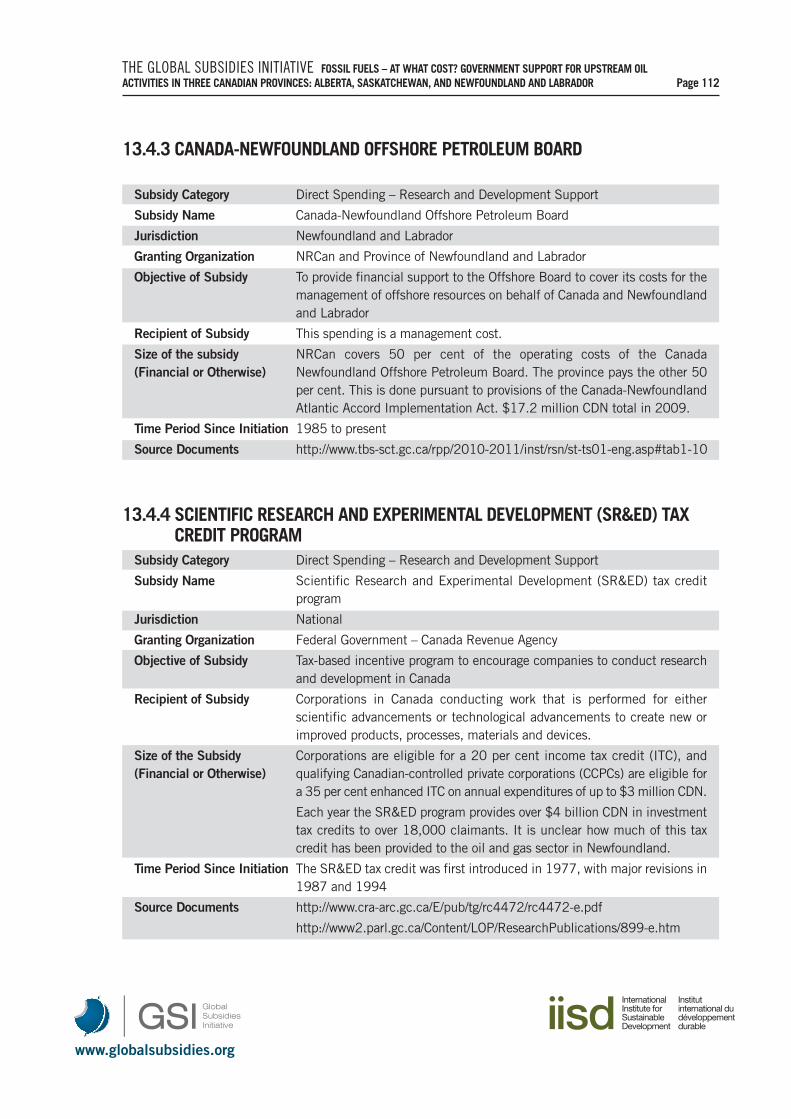
www.globalsubsidies.org
THE GLOBAL SUBSIDIES INITIATIVE FOSSIL FUELS – AT WHAT COST? GOVERNMENT SUPPORT FOR UPSTREAM OIL ACTIVITIES IN THREE CANADIAN PROVINCES: ALBERTA, SASKATCHEWAN, AND NEWFOUNDLAND AND LABRADOR Page 112
13.4.3 CANADA-NEWFOUNDLAND OFFSHORE PETROLEUM BOARD
Subsidy Category Direct Spending – Research and Development Support
Subsidy Name Canada-Newfoundland Offshore Petroleum Board
Jurisdiction Newfoundland and Labrador
Granting Organization NRCan and Province of Newfoundland and Labrador
Objective of Subsidy To provide financial support to the Offshore Board to cover its costs for themanagement of offshore resources on behalf of Canada and Newfoundlandand Labrador
Recipient of Subsidy This spending is a management cost.
Size of the subsidy NRCan covers 50 per cent of the operating costs of the Canada (Financial or Otherwise) Newfoundland Offshore Petroleum Board. The province pays the other 50
per cent. This is done pursuant to provisions of the Canada-NewfoundlandAtlantic Accord Implementation Act. $17.2 million CDN total in 2009.
Time Period Since Initiation 1985 to present
Source Documents http://www.tbs-sct.gc.ca/rpp/2010-2011/inst/rsn/st-ts01-eng.asp#tab1-10
13.4.4 SCIENTIFIC RESEARCH AND EXPERIMENTAL DEVELOPMENT (SR&ED) TAXCREDIT PROGRAM
Subsidy Category Direct Spending – Research and Development Support
Subsidy Name Scientific Research and Experimental Development (SR&ED) tax creditprogram
Jurisdiction National
Granting Organization Federal Government – Canada Revenue Agency
Objective of Subsidy Tax-based incentive program to encourage companies to conduct researchand development in Canada
Recipient of Subsidy Corporations in Canada conducting work that is performed for eitherscientific advancements or technological advancements to create new orimproved products, processes, materials and devices.
Size of the Subsidy Corporations are eligible for a 20 per cent income tax credit (ITC), and (Financial or Otherwise) qualifying Canadian-controlled private corporations (CCPCs) are eligible for
a 35 per cent enhanced ITC on annual expenditures of up to $3 million CDN.
Each year the SR&ED program provides over $4 billion CDN in investmenttax credits to over 18,000 claimants. It is unclear how much of this taxcredit has been provided to the oil and gas sector in Newfoundland.
Time Period Since Initiation The SR&ED tax credit was first introduced in 1977, with major revisions in1987 and 1994
Source Documents http://www.cra-arc.gc.ca/E/pub/tg/rc4472/rc4472-e.pdf
http://www2.parl.gc.ca/Content/LOP/ResearchPublications/899-e.htm
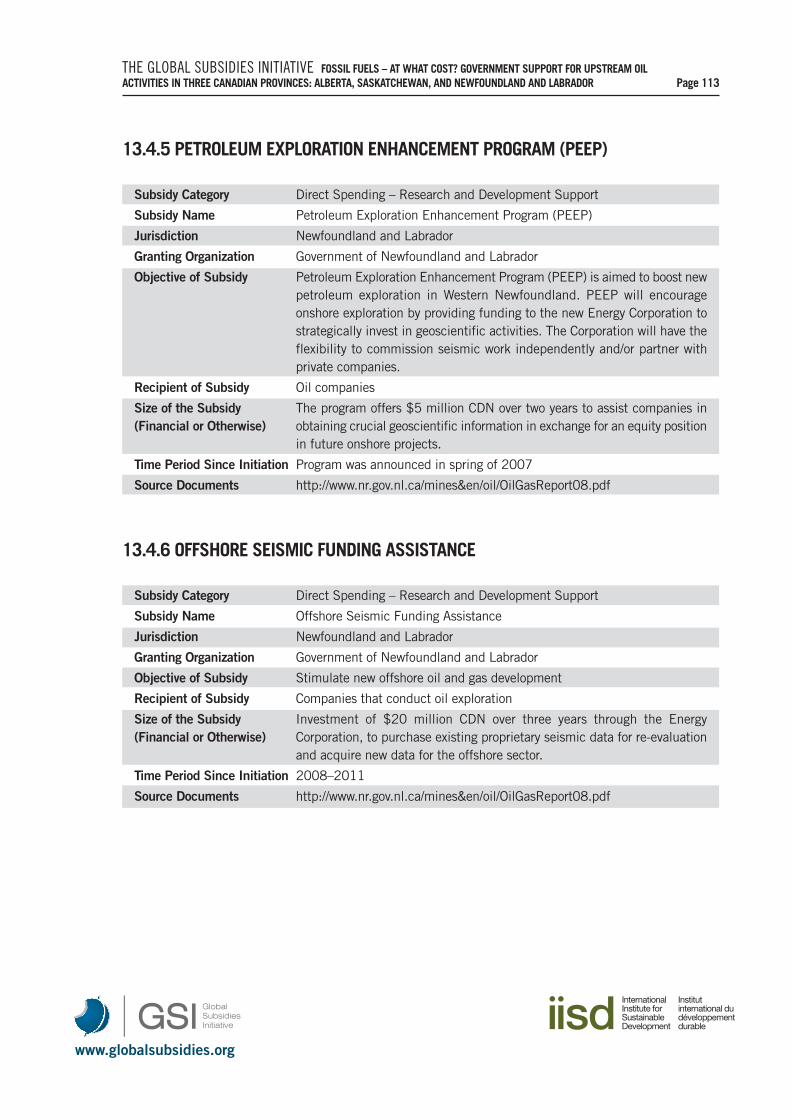
www.globalsubsidies.org
THE GLOBAL SUBSIDIES INITIATIVE FOSSIL FUELS – AT WHAT COST? GOVERNMENT SUPPORT FOR UPSTREAM OIL ACTIVITIES IN THREE CANADIAN PROVINCES: ALBERTA, SASKATCHEWAN, AND NEWFOUNDLAND AND LABRADOR Page 113
13.4.5 PETROLEUM EXPLORATION ENHANCEMENT PROGRAM (PEEP)
Subsidy Category Direct Spending – Research and Development Support
Subsidy Name Petroleum Exploration Enhancement Program (PEEP)
Jurisdiction Newfoundland and Labrador
Granting Organization Government of Newfoundland and Labrador
Objective of Subsidy Petroleum Exploration Enhancement Program (PEEP) is aimed to boost newpetroleum exploration in Western Newfoundland. PEEP will encourageonshore exploration by providing funding to the new Energy Corporation tostrategically invest in geoscientific activities. The Corporation will have theflexibility to commission seismic work independently and/or partner withprivate companies.
Recipient of Subsidy Oil companies
Size of the Subsidy The program offers $5 million CDN over two years to assist companies in (Financial or Otherwise) obtaining crucial geoscientific information in exchange for an equity position
in future onshore projects.
Time Period Since Initiation Program was announced in spring of 2007
Source Documents http://www.nr.gov.nl.ca/mines&en/oil/OilGasReport08.pdf
13.4.6 OFFSHORE SEISMIC FUNDING ASSISTANCE
Subsidy Category Direct Spending – Research and Development Support
Subsidy Name Offshore Seismic Funding Assistance
Jurisdiction Newfoundland and Labrador
Granting Organization Government of Newfoundland and Labrador
Objective of Subsidy Stimulate new offshore oil and gas development
Recipient of Subsidy Companies that conduct oil exploration
Size of the Subsidy Investment of $20 million CDN over three years through the Energy (Financial or Otherwise) Corporation, to purchase existing proprietary seismic data for re-evaluation
and acquire new data for the offshore sector.
Time Period Since Initiation 2008–2011
Source Documents http://www.nr.gov.nl.ca/mines&en/oil/OilGasReport08.pdf
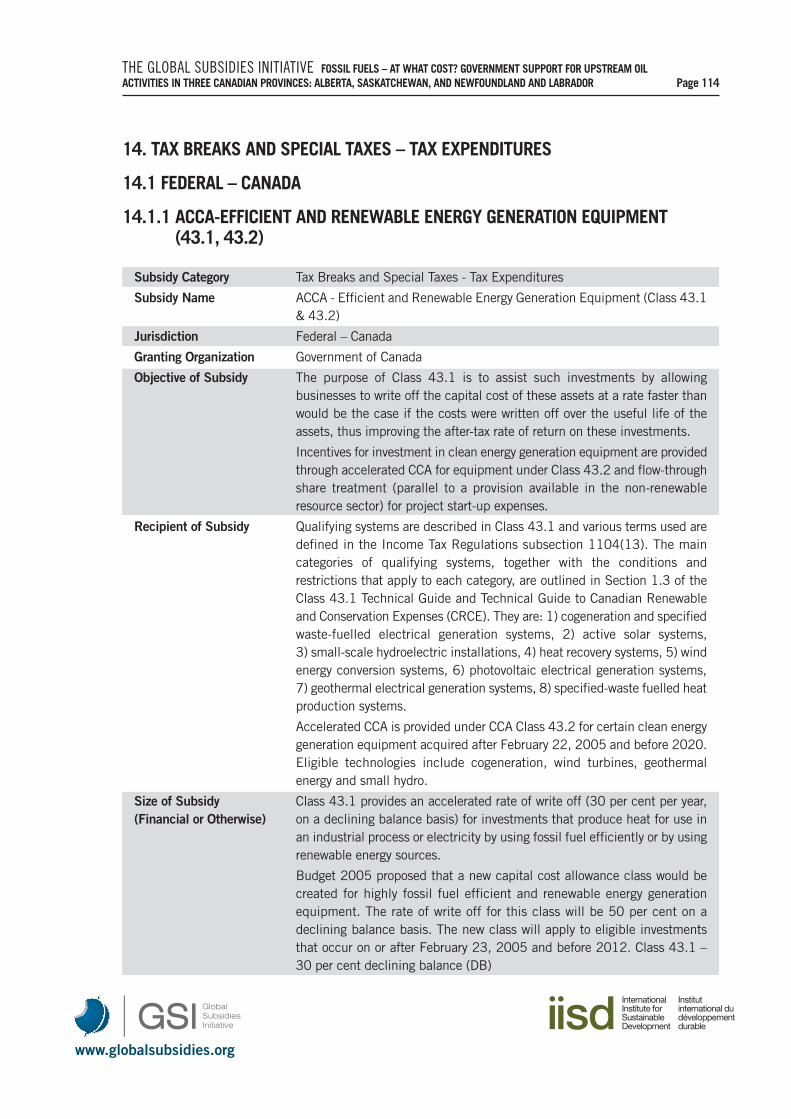
www.globalsubsidies.org
THE GLOBAL SUBSIDIES INITIATIVE FOSSIL FUELS – AT WHAT COST? GOVERNMENT SUPPORT FOR UPSTREAM OIL ACTIVITIES IN THREE CANADIAN PROVINCES: ALBERTA, SASKATCHEWAN, AND NEWFOUNDLAND AND LABRADOR Page 114
14. TAX BREAKS AND SPECIAL TAXES – TAX EXPENDITURES
14.1 FEDERAL – CANADA
14.1.1 ACCA-EFFICIENT AND RENEWABLE ENERGY GENERATION EQUIPMENT (43.1, 43.2)
Subsidy Category Tax Breaks and Special Taxes - Tax Expenditures
Subsidy Name ACCA - Efficient and Renewable Energy Generation Equipment (Class 43.1& 43.2)
Jurisdiction Federal – Canada
Granting Organization Government of Canada
Objective of Subsidy The purpose of Class 43.1 is to assist such investments by allowingbusinesses to write off the capital cost of these assets at a rate faster thanwould be the case if the costs were written off over the useful life of theassets, thus improving the after-tax rate of return on these investments.
Incentives for investment in clean energy generation equipment are providedthrough accelerated CCA for equipment under Class 43.2 and flow-throughshare treatment (parallel to a provision available in the non-renewableresource sector) for project start-up expenses.
Recipient of Subsidy Qualifying systems are described in Class 43.1 and various terms used aredefined in the Income Tax Regulations subsection 1104(13). The maincategories of qualifying systems, together with the conditions andrestrictions that apply to each category, are outlined in Section 1.3 of theClass 43.1 Technical Guide and Technical Guide to Canadian Renewableand Conservation Expenses (CRCE). They are: 1) cogeneration and specifiedwaste-fuelled electrical generation systems, 2) active solar systems,3) small-scale hydroelectric installations, 4) heat recovery systems, 5) windenergy conversion systems, 6) photovoltaic electrical generation systems,7) geothermal electrical generation systems, 8) specified-waste fuelled heatproduction systems.
Accelerated CCA is provided under CCA Class 43.2 for certain clean energygeneration equipment acquired after February 22, 2005 and before 2020.Eligible technologies include cogeneration, wind turbines, geothermalenergy and small hydro.
Size of Subsidy Class 43.1 provides an accelerated rate of write off (30 per cent per year, (Financial or Otherwise) on a declining balance basis) for investments that produce heat for use in
an industrial process or electricity by using fossil fuel efficiently or by usingrenewable energy sources.
Budget 2005 proposed that a new capital cost allowance class would becreated for highly fossil fuel efficient and renewable energy generationequipment. The rate of write off for this class will be 50 per cent on adeclining balance basis. The new class will apply to eligible investmentsthat occur on or after February 23, 2005 and before 2012. Class 43.1 –30 per cent declining balance (DB)
THE GLOBAL SUBSIDIES INITIATIVE FOSSIL FUELS – AT WHAT COST? GOVERNMENT SUPPORT FOR UPSTREAM OIL ACTIVITIES IN THREE CANADIAN PROVINCES: ALBERTA, SASKATCHEWAN, AND NEWFOUNDLAND AND LABRADOR Page 115
www.globalsubsidies.org
14.1.1 ACCA-EFFICIENT AND RENEWABLE ENERGY GENERATION EQUIPMENT (43.1, 43.2) (Continued)
Size of Subsidy Class 43.1 includes prescribed energy conservation property (CRCE). This(Financial or Otherwise) class is broadened to include biogas production equipment and distribution (Continued) equipment acquired on or after February 23, 2005.
Class 43.2 – 50 per cent DB
Class 43.2 includes certain high-efficiency cogeneration systems andrenewable energy generation equipment acquired on or after February 23,2005, and before 2012. This accelerated CCA rate will also apply to biogasproduction equipment and distribution equipment used in district energysystems that rely on efficient cogeneration, acquired on or after February23, 2005, and before 2012.
Time Period Since Initiation Class 43.1 was introduced in the 1996 budget and it currently provides anaccelerated CCA rate of 30 per cent for certain types of renewable energyand energy efficiency equipment. Since the introduction of Class 43.1, therehave been several additions and modifications to the class. Most recently,the December 10, 2001 Budget Plan expanded eligibility for this class toproperty that generates electricity using blast furnace gas produced at steelmills. In addition, the capacity restriction was increased so that more smallhydro-electric projects now qualify for Class 43.1.
Class 43.2:
• Prior to 1976 – All power generation assets fell into Classes 1, 2 or 8 (4,6 or 20 per cent DB)
• 1976−1994 – Class 34 (50 per cent straight-line CCA) existed, NRCancertification required
• 1994−present – Class 43.1 (30 per cent DB) replaced Class 34, NRCancertification not required
• 2005−2012 (to be extended to 2020 as per Budget 2008)
Source Documents http://oee.nrcan.gc.ca/corporate/statistics/neud/dpa/policy_e/ details.cfm?searchType=default§oranditems=1|0&max=50&pageId=1&categoryID=1®ionalDeliveryId=all&programTypes=all&keywords=&ID=977&attr=0
http://www.cra-arc.gc.ca/E/pub/tp/it476r/it476r-e.html
http://www.fin.gc.ca/activty/consult/class431-1-eng.asp
http://www.geo-exchange.ca/en/UserAttachments/flex603_Tom%20Jewett-%20GeoExchange%20Technology%20and%20Class%2043%202.pdf
http://www.ic.gc.ca/eic/site/fte-fte.nsf/eng/00004.html
www.globalsubsidies.org
THE GLOBAL SUBSIDIES INITIATIVE FOSSIL FUELS – AT WHAT COST? GOVERNMENT SUPPORT FOR UPSTREAM OIL ACTIVITIES IN THREE CANADIAN PROVINCES: ALBERTA, SASKATCHEWAN, AND NEWFOUNDLAND AND LABRADOR Page 116
14.1.2 ACCA-OIL SANDS
Subsidy Category Tax Breaks and Special Taxes – Tax Expenditures
Subsidy Name ACCA – Oil Sands
Jurisdiction Federal – Canada
Granting Organization Government of Canada
Objective of Subsidy March 19, 2007 budget commitment to phase out the accelerated capitalcost allowance (ACCA) for the oil sands. Fiscal policy adjustmentsincorporating the “polluter pays” principle are essential to achieving thebudget’s objective of “preserving and protecting our environment,” andending the ACCA is a step in the right direction.
Recipient of Subsidy The 100 per cent ACCA applicable for oil sands projects will be phased outby 2015 because, as the budget itself acknowledges, “this preferentialtreatment is no longer required.” Between 2011 and 2015, the preferentialACCA will be brought into line with the 25 per cent level currently applicableto conventional oil and gas.
Size of Subsidy Subject to these factors, the revenue cost associated with providing (Financial or Otherwise) accelerated CCA for oil sands (as compared with the regular 25 per cent
CCA rate) was forecast, at the time of Budget 2007, to be on average $300million CDN annually for the period 2007–2011.
Because of a 100 per cent ACCA, the company only pays income tax onthe income from the project once it has written off all capital costs.Conventional oil and natural gas qualify for a 25 per cent capital costallowance, significantly lower than that applicable to the oil sands.
Eleven oil sands projects currently under construction will receive the full100 per cent ACCA under grandfathering clauses. A further 45 plannedprojects will receive substantial capital cost allowances because they willbe completed before 2015. As a result, over 90 per cent of oil sandsprojects currently announced will receive substantial subsidies.
Time Period Since Initiation Budget 2007 announced the phase-out of the existing accelerated capitalcost allowance (CCA) for general investment in oil sands projects, leavingin place the regular 25 per cent CCA rate for these assets (OAG, 2008).The economic conditions have changed significantly since this tax breakwas introduced in the mid-1990s, and it is neither appropriate nor necessaryunder current economic conditions.
The cost would tend to decline as the phase-out proceeds over the 2011–2015 period. While for grandfathered projects accelerated CCA claims couldarise after 2015, these are expected to decline quickly since thegrandfathering only applies to costs incurred before 2012 (OAG, 2008).
Source Documents http://pubs.pembina.org/reports/Owner_FullRpt_Web.pdf
http://www.greenbudget.ca/pdf/Budget_Analysis_2007.pdf
http://www.oag-bvg.gc.ca/internet/English/pet_215_e_28951.html
www.globalsubsidies.org
THE GLOBAL SUBSIDIES INITIATIVE FOSSIL FUELS – AT WHAT COST? GOVERNMENT SUPPORT FOR UPSTREAM OIL ACTIVITIES IN THREE CANADIAN PROVINCES: ALBERTA, SASKATCHEWAN, AND NEWFOUNDLAND AND LABRADOR Page 117
14.1.3 CEE, CDE, COGPE
Subsidy Category Tax Breaks and Special Taxes – Tax Expenditures
Subsidy Name Canadian Exploration Expense (CEE)1; Canadian Development Expense(CDE)2; Canadian Oil and Gas Property Expense (COGPE)3
Jurisdiction Federal – Canada
Granting Organization Government of Canada
Objective of Subsidy The goal of exploration is to obtain new and valuable knowledge about thelocation of a previously unknown resource, the discovery and profitability ofwhich is uncertain. Special tax treatment of exploration costs (e.g., 100 percent deductibility as Canadian exploration expense and various federal andprovincial exploration tax credits) recognizes that exploration createsbenefits for other businesses beyond the firm that incurred the originalexpenditure—that is, exploration can generate positive externalities. In manyways, this is similar to research and development (R&D) costs that areincurred to gain knowledge about improved processes and products. R&Dcosts receive special tax treatment in many countries, including Canada,because of the fact that this investment can generate significant benefitsbeyond those captured by the firm performing the activity.
Recipient of Subsidy CEE: includes geological, geophysical, geochemical, drilling and completionexpenses, cost of building a temporary access road or preparing a site forthe well.
CDE: includes expenses incurred in drilling or converting a well for thedisposal of waste liquids; injection of water, gas or other substances;monitoring fluid levels or pressure changes; drilling for water or gas forinjection; drilling and completing a well after the commencement ofproduction or drilling and completing a well; building a temporary accessroad or preparing a site for the well to the extent that the expense is not aCanadian exploration expense.
COGPE: includes the cost of any right, license or privilege to explore or drillfor petroleum, natural gas or related hydrocarbons, the cost of any oil or gaswell, and any rental or royalty.
Size of Subsidy CEE is deductible at a rate of 100 per cent. The CEE balance of exploration (Financial or Otherwise) must be fully deducted against income with any unclaimed portion carried
forward indefinitely.
CDE is deductible at a rate of 30 per cent on a declining balance basis.
COGPE is deductible at a rate of 10 per cent and includes the costs of acquiringan oil or gas well in Canada, an interest or right to explore, drill or extractpetroleum or natural gas, or a qualifying interest or right in oil or gas production.
Time Period Since Initiation Four provisions—Canadian exploration expenses, Canadian developmentexpenses, Canadian oil and gas property expenses, and capital costallowances—determine the timing of the deduction of capital expenditures.
Source Documents http://www.fin.gc.ca/activty/pubs/rsc_1-eng.asp http://www.fin.gc.ca/drleg-apl/wmmNov06n_3-eng.asp
www.globalsubsidies.org
THE GLOBAL SUBSIDIES INITIATIVE FOSSIL FUELS – AT WHAT COST? GOVERNMENT SUPPORT FOR UPSTREAM OIL ACTIVITIES IN THREE CANADIAN PROVINCES: ALBERTA, SASKATCHEWAN, AND NEWFOUNDLAND AND LABRADOR Page 118
14.1.4 ATLANTIC CANADA INVESTMENT TAX CREDIT (AITC)
Subsidy Category Tax Breaks and Special Taxes – Tax Expenditures
Subsidy Name Atlantic Canada Investment Tax Credit (AITC)
Jurisdiction The federal AITC applies in the following jurisdictions: Newfoundland, NewBrunswick, Nova Scotia, Prince Edward Island, the Gaspé region and theirassociated offshore areas. Only Newfoundland receives AITC for the oil andgas sector.
Granting Organization Federal Department of Finance – Federal Government
Objective of Subsidy The federal AITC reduces federal corporate income taxes by 10 per cent ofthe cost of qualifying investments. The objective is to stimulate newinvestment in the Atlantic Provinces. Compared to corporate rate cuts, thebroad-based, Atlantic investment-tax credit is directed more specifically atnew capital projects, with a greater impact in reducing the effective tax rateon capital for the same revenue cost as corporate rate cuts.
Recipient of Subsidy AITC is earned on eligible expenditures on new buildings, machinery andequipment employed in the following qualifying activities: farming, fishing,logging, mining, oil and gas, and manufacturing and processing. However,the investment-tax credit is primarily targeted to resource and manufacturingindustries and some capital goods are excluded from eligibility. The AITC isavailable for the provinces of Newfoundland, New Brunswick, Nova Scotia,Prince Edward Island, the Gaspé region and their associated offshore areas.
Size of the Subsidy Prior to 1995, the Atlantic investment tax credit (AITC) was available at a (Financial or Otherwise) rate of 15 per cent with respect to eligible expenditures in the Atlantic
region. The 1994 budget reduced the AITC rate to 10 per cent for eligibleexpenditures incurred after 1994.The AITC is refundable at a rate of 40 percent for qualifying CCPCs and individuals.
Total 2009 projected tax expenditure: $256 million CDN
Between 2004 and 2009 the average annual expenditure was $282 millionCDN annually. Approximately half of the AITC program is paid to the oil andgas sector, or roughly $125 million CDN annually.
Time Period Since Initiation The AITC has been in place since at least 1994 to the present.
Source Documents Department of Finance Canada. 2009 Tax expenditures and evaluations2009: Part 1. http://www.fin.gc.ca/taxexp-depfisc/2009/taxexp0901-eng.asp
http://www.fin.gc.ca/taxexp-depfisc/1999/taxexp99_5-eng.asp
J. M. Mintz & M. Smart. 2003. Brooking no favourites. A new approachto regional development in Atlantic Canada. C.D. Howe. No. 192.,http://www.cdhowe.org/pdf/commentary_192.pdf

www.globalsubsidies.org
THE GLOBAL SUBSIDIES INITIATIVE FOSSIL FUELS – AT WHAT COST? GOVERNMENT SUPPORT FOR UPSTREAM OIL ACTIVITIES IN THREE CANADIAN PROVINCES: ALBERTA, SASKATCHEWAN, AND NEWFOUNDLAND AND LABRADOR Page 119
14.2 PROVINCIAL – ALBERTA
14.2.1 TOWNSHIP 53
This describes the removal of a subsidy.
Subsidy Category Tax Breaks and Special Taxes – Tax Expenditures
Subsidy Name Township 53
Jurisdiction Provincial – Alberta
Granting Organization Government of Alberta
Objective of Subsidy Reclassify conventional wells labelled as oil sands so that the oil sands ratedoes not apply.
Recipient of Subsidy Currently, there are different royalty and taxation regimes north and southof Township 53 in Alberta. This is based on an “oilsands” classification thatis a possible classification for oil producers north of Township 53, providingthem with a more beneficial royalty status.
The heavy oil and oil sands in Alberta located at Township 53 are related toCold Heavy Oil Production with Sand (CHOPS).
Size of Subsidy Alberta Energy Utilities Board classifications for royalty and tax purposes (Financial or Otherwise) are based on a geographical line, the south boundary to Township 53. North
of this line, exclusive of the surface mining area in the Athabasca Deposit,the EUB classifies all deposits as oil sands, and the royalty regimes aredetermined by this classification. Primary oil production in such cases isreferred to as “primary bitumen” production north of Township 53, but southof this Township, such production is called “primary heavy oil” production,even though the technologies may be identical, the strata contiguous, andthe reservoir and oil properties completely similar. Production throughCHOPS is therefore subjected to different royalty and taxation regimes, eventhough the deposits, the crude oil properties and the extractive methods areperhaps identical.
Time Period Since Initiation In February 2007 the Government of Alberta assembled a panel to examinethe province’s royalty and tax regime. They proposed a reclassification ofexisting and future primary oil sands wells as heavy oil wells in Township53 (south of Cold Lake).
Source Documents http://www.energy.alberta.ca/OilSands/pdfs/RPT_Chops_chptr1.pdf
http://www.energy.alberta.ca/OilSands/pdfs/RPT_Chops_recomm.pdf
http://membernet.capp.ca/raw.asp?x=1&e=PDF&dt=NTV&dn=126685
www.globalsubsidies.org
THE GLOBAL SUBSIDIES INITIATIVE FOSSIL FUELS – AT WHAT COST? GOVERNMENT SUPPORT FOR UPSTREAM OIL ACTIVITIES IN THREE CANADIAN PROVINCES: ALBERTA, SASKATCHEWAN, AND NEWFOUNDLAND AND LABRADOR Page 120
14.2.2 FLOW-THROUGH SHARES
Subsidy Category Tax Breaks and Special Taxes – Tax Expenditures
Subsidy Name Flow-Through Shares (FTS)
Jurisdiction Provincial – Alberta
Granting Organization Government of Alberta
Objective of Subsidy Junior resource corporations often have difficulty raising capital to financetheir exploration and development activities. Moreover, many are in a non-taxable position and do not need to deduct their resource expenses. TheFTS mechanism allows the issuer corporation to transfer the resourceexpenses to the investor. A junior resource corporation, in particular, benefitsgreatly from FTS financing.
Recipient of Subsidy Certain corporations in the mining, oil and gas, and renewable energy andenergy conservation sectors may issue FTS to help finance their explorationand project development activities. The FTS must be newly issued sharesthat have the attributes generally attached to common shares.
Size of Subsidy The FTS program provides tax incentives to investors who acquire FTS by (Financial or Otherwise) allowing:
• deductions for resource expenses renounced by eligible corporations; and
• investment tax credits for individuals (excluding trusts) on resourceexpenses in the mining sector that qualify as flow-through miningexpenditures.
The type of expenses a PBC can renounce are:
• Canadian exploration expenses (CEEs), which are added to the cumulativeCanadian exploration expense (cumulative CEE) pool and can be deductedup to the maximum of 100 per cent; or
• Canadian development expenses (CDEs), which are added to thecumulative Canadian development expense (cumulative CDE) pool andcan be deducted up to the maximum of 30 per cent.
FTS investors may benefit from:
• deductions from income through renounced expenses;
• an investment tax credit (ITC) on flow-through mining expenditures forindividuals; and
• amounts renounced to the partnership, which can be allocated to thepartners.
CEE is most attractive to investors buying FTS because they get a 100 percent deduction from tax rather than merely 30 per cent for CDE, but bothcan be the subject of flow-through financings. Alberta companies who haveraised flow-through money, for example, in late 2008 to spend in 2009,may find that though they have earned Alberta Drilling Credits, and are nodoubt delighted to get the cheque, they may well find it reduces theirqualifying CEE expense by the same amount.
www.globalsubsidies.org
THE GLOBAL SUBSIDIES INITIATIVE FOSSIL FUELS – AT WHAT COST? GOVERNMENT SUPPORT FOR UPSTREAM OIL ACTIVITIES IN THREE CANADIAN PROVINCES: ALBERTA, SASKATCHEWAN, AND NEWFOUNDLAND AND LABRADOR Page 121
14.2.2 FLOW-THROUGH SHARES (Continued)
Time Period Since Initiation The investor and the corporation must have entered into an FTS agreementon or before March 31, 2008. Under the “look-back” rule, funds raisedwith the benefit of the credit in 2008, for example, can be spent on eligibleexploration up to the end of 2009.
Source Documents http://www.sepac.ca/pdf/articles/2009/DOB%20-%20091105.pdf
http://www.cra-arc.gc.ca/tx/bsnss/tpcs/fts-paa/menu-eng.html
14.2.3 ACCA
Subsidy Category Tax Breaks and Special Taxes – Tax Expenditures
Subsidy Name ACCA
Jurisdiction Provincial – Alberta
Granting Organization Government of Alberta
Objective of Subsidy ACCA allows the individual oil sands projects, though not the parent companyitself, to write off all of their capital costs before they start to pay incometax. The accelerated capital cost allowance under Class 43.1 and Class 43.2of the Income Tax Regulations makes investments in energy efficiency andrenewable power financially more attractive for industry. Because the cost ofan asset can be depreciated and deducted more quickly for income taxpurposes, income taxes payable early in the life of an asset are reduced andmore funds are available to invest in the asset. See ACCA – Oil Sands, federaljurisdiction for further details as this applies across Canada.
Recipient of Subsidy ACCA is subject to certain conditions. The most noteworthy being: (a) thecosts must be for the purpose of expanding production and not just for plantmaintenance and (b) the ACCA is “ring fenced,” meaning it can only beclaimed against the income of the project and not that of the entirecorporation.
To be an allowed cost of a project, a cost must be:
• directly attributable to the project;
• reasonable under the circumstances;
• incurred by or on behalf of the project owners;
• incurred on or after the effective date of the project;
• incurred for one of the purposes set out in the Regulation, that is to say,to recover, purchase, process, transport or market oil sands products;provide services in support of these activities; or conduct research on oilsands recovery.
www.globalsubsidies.org
THE GLOBAL SUBSIDIES INITIATIVE FOSSIL FUELS – AT WHAT COST? GOVERNMENT SUPPORT FOR UPSTREAM OIL ACTIVITIES IN THREE CANADIAN PROVINCES: ALBERTA, SASKATCHEWAN, AND NEWFOUNDLAND AND LABRADOR Page 122
14.2.3 ACCA (Continued)
Size of Subsidy A 50 per cent accelerated CCA is provided under Class 43.2, accelerated (Financial or Otherwise) CCA is provided under Class 43.1 (30 per cent).
The federal estimated annual fiscal cost of this measure, as announced inthe Economic and Fiscal Update of November 14, 2005 and reaffirmed inthe 2006 budget, in fiscal 2005–2006 is $5 million CDN, in fiscal 2006–2007 is $10 million CDN, and in fiscal 2007–2008 is $20 million CDN,then $25 million CDN for each of the next three years thereafter.
Time Period Since Initiation The accelerated capital cost allowance, implemented in 1996, has appliedto both surface and underground mining in the oil sands. CAPP argues thatthe ACCA is a tax deferral, not a subsidy. Royalty Review Alberta supportstaking away the ACCA as it is no longer needed, as in the case of the FederalACCA.
Per the 2007 New Royalty Framework, the government will eliminate theprovincial portion of the ACCA for oil sands projects, consistent with thefederal government’s recent elimination of the allowance.
To qualify for Class 43.2, higher-efficiency (efficiency = 72 per cent)systems that use fossil fuels, specified-waste-fuelled electrical generationsystems and renewable energy systems must be acquired between February22, 2005 and January 1, 2012.
Source Documents http://www.energy.alberta.ca/Org/pdfs/TechReport-1_OilSands.pdf
http://www.energy.alberta.ca/Tenure/pdfs/FISREG.pdf
http://www.energy.alberta.ca/Org/pdfs/royalty_Oct25.pdf
http://www.ic.gc.ca/eic/site/fte-fte.nsf/eng/00004.html
www.globalsubsidies.org
THE GLOBAL SUBSIDIES INITIATIVE FOSSIL FUELS – AT WHAT COST? GOVERNMENT SUPPORT FOR UPSTREAM OIL ACTIVITIES IN THREE CANADIAN PROVINCES: ALBERTA, SASKATCHEWAN, AND NEWFOUNDLAND AND LABRADOR Page 123
14.3 PROVINCIAL – SASKATCHEWAN
14.3.1 FREEHOLD DRILLING INCENTIVE
Subsidy Category Tax Breaks and Special Taxes – Tax Expenditures
Subsidy Name Freehold Drilling Incentive
Jurisdiction Provincial – Saskatchewan
Granting Organization Government of Saskatchewan
Objective of Subsidy The changes were designed to provide a more competitive investmentenvironment and a more simplified royalty/tax regime.
• The freehold production tax structure is similar in concept to the Crownroyalty structure. Like Crown royalty rates, production tax rates aresensitive to the individual productivity of each well; tax levels are alsoadjusted each month based on the level of the reference price set by theprovince for each of the oil types.
• The amount of tax payable on the production of freehold oil is determined inmuch the same way as the royalty payable on the production of Crown oil.
Recipient of Subsidy Newly drilled oil wells in Saskatchewan qualify for “volume-based” drillingincentives ranging from 0 to 16,000 cubic metres.
Newly drilled exploratory gas wells in Saskatchewan qualify for a25,000,000 cubic metre “volume-based” drilling incentive.
Vertical, horizontal and exploratory wells qualify for the freehold tax rate of0 up to the specified volume bases.
Size of Subsidy Freehold Production Tax (applied to oil produced from or allocated to Crown-(Financial or Otherwise) acquired and freehold lands)
Freehold lands:
A freehold production tax rate of 0 per cent
Crown-acquired lands:
A freehold production tax rate equal to the Crown royalty rate outlined above
Royalty/tax rates for production after incentive volume:
After the incentive volume has been produced, the oil produced from thevertical oil well drilled on or after October 1, 2002 will be subject to the“fourth tier oil” royalty/tax rates.
Time Period Since Initiation All wells qualifying for the freehold production tax rate up to the qualifyingvolume base have to have a drilling date on or after October 1, 2002.
Source Documents http://www.er.gov.sk.ca/adx/aspx/adxGetMedia.aspx?DocID=5756,5755,3430,3384,2936,Documents&MediaID=27469&Filename=pr-ic05.pdf
http://www.er.gov.sk.ca/adx/aspx/adxGetMedia.aspx?DocID=5756,5755,3430,3384,2936,Documents&MediaID=27468&Filename=pr-ic04.pdf
http://www.er.gov.sk.ca/adx/aspx/adxGetMedia.aspx?DocID=5756,5755,3430,3384,2936,Documents&MediaID=27467&Filename=pr-ic03.pdf

www.globalsubsidies.org
THE GLOBAL SUBSIDIES INITIATIVE FOSSIL FUELS – AT WHAT COST? GOVERNMENT SUPPORT FOR UPSTREAM OIL ACTIVITIES IN THREE CANADIAN PROVINCES: ALBERTA, SASKATCHEWAN, AND NEWFOUNDLAND AND LABRADOR Page 124
14.3.2 PROVINCIAL SALES TAX EXEMPTION
Subsidy Category Tax Breaks and Special Taxes – Tax Expenditures
Subsidy Name Provincial Sales Tax Exemption on Equipment and Services used by the oil,gas, and potash industry
Jurisdiction Provincial – Saskatchewan
Granting Organization Government of Saskatchewan
Objective of Subsidy A tax remission (rebate) is provided on certain mobile capital equipmentthat is used by the oil, gas and potash industries directly in the followingactivities:
(a) exploration
(b) development
(c) testing
(d) servicing the Provincial Sales Tax does not apply to the services listedin “Recipient of Subsidy,” as used by the oil, gas, and potash industry.These tax exemptions provide an incentive for oil and gas productionand simplify the provincial tax regime.
Recipient of Subsidy The equipment must be used primarily in the above activities and must becapitalized in the contractor’s records:
(i) All drilling and service rigs
(ii) Standard rig components, such as draw works, rotary tables, mudpumps, blow-out preventers, drill pipe and drill collars
(iii) Testing equipment
(iv) Mobile equipment used for seismic exploration, formation testing,cementing, perforating, fracturing, acidizing and similar operations,including the trucks or trailers on which this equipment is permanentlymounted
(v) Capitalized replacement parts for the above equipment
Tax does not apply to charges for contract services, such as drilling, wellstimulation, seismic exploration and surveys, coring, logging, formationtesting, cementing, perforating, down-hole pumping, well stimulation(fracturing and acidizing) and similar operations.
Size of Subsidy The equipment and services exempt will not have to remit the 5 per cent (Financial or Otherwise) sales tax, which applies to the purchase, importation or rental of certain
goods and services in the province.
PST budget of expected revenues: 2009/10 (Budget) $1,155,600,000CDN
Time Period Since Initiation These tax exemptions were introduced in March, 1985
Source Documents http://www.finance.gov.sk.ca/revenue/pst/bulletins/pst13.pdf
http://www.finance.gov.sk.ca/taxes/pst
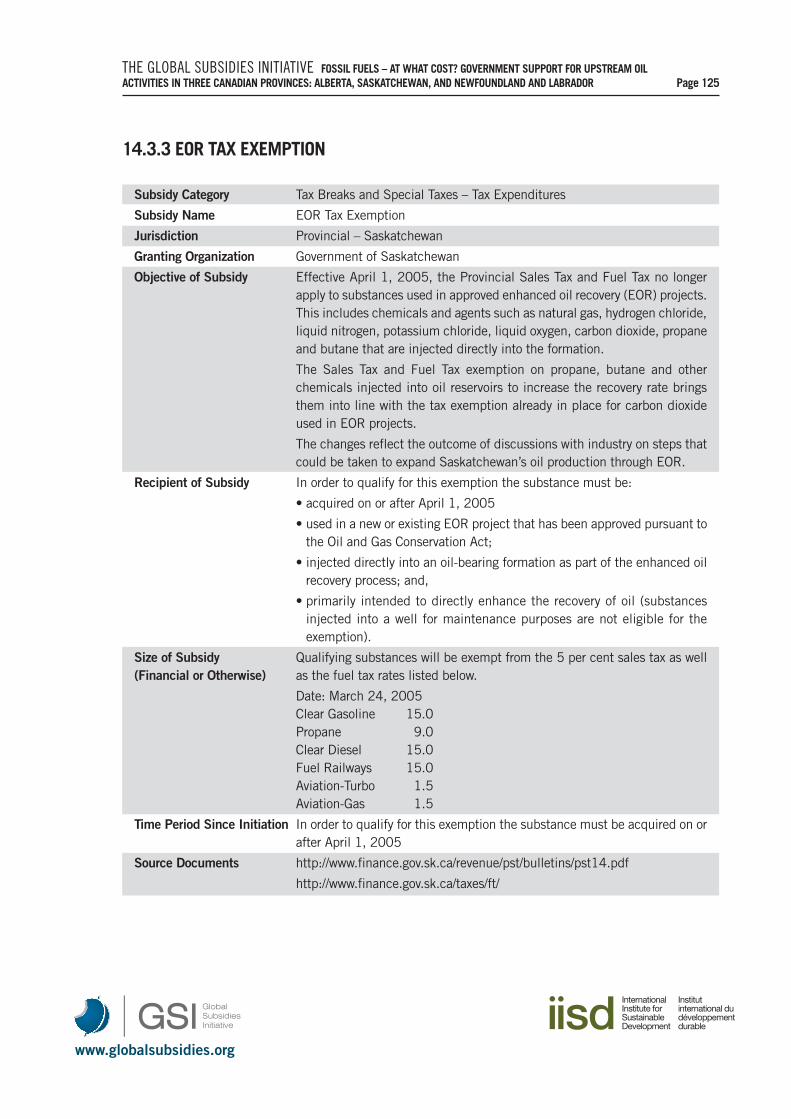
www.globalsubsidies.org
THE GLOBAL SUBSIDIES INITIATIVE FOSSIL FUELS – AT WHAT COST? GOVERNMENT SUPPORT FOR UPSTREAM OIL ACTIVITIES IN THREE CANADIAN PROVINCES: ALBERTA, SASKATCHEWAN, AND NEWFOUNDLAND AND LABRADOR Page 125
14.3.3 EOR TAX EXEMPTION
Subsidy Category Tax Breaks and Special Taxes – Tax Expenditures
Subsidy Name EOR Tax Exemption
Jurisdiction Provincial – Saskatchewan
Granting Organization Government of Saskatchewan
Objective of Subsidy Effective April 1, 2005, the Provincial Sales Tax and Fuel Tax no longerapply to substances used in approved enhanced oil recovery (EOR) projects.This includes chemicals and agents such as natural gas, hydrogen chloride,liquid nitrogen, potassium chloride, liquid oxygen, carbon dioxide, propaneand butane that are injected directly into the formation.
The Sales Tax and Fuel Tax exemption on propane, butane and otherchemicals injected into oil reservoirs to increase the recovery rate bringsthem into line with the tax exemption already in place for carbon dioxideused in EOR projects.
The changes reflect the outcome of discussions with industry on steps thatcould be taken to expand Saskatchewan’s oil production through EOR.
Recipient of Subsidy In order to qualify for this exemption the substance must be:
• acquired on or after April 1, 2005
• used in a new or existing EOR project that has been approved pursuant tothe Oil and Gas Conservation Act;
• injected directly into an oil-bearing formation as part of the enhanced oilrecovery process; and,
• primarily intended to directly enhance the recovery of oil (substancesinjected into a well for maintenance purposes are not eligible for theexemption).
Size of Subsidy Qualifying substances will be exempt from the 5 per cent sales tax as well (Financial or Otherwise) as the fuel tax rates listed below.
Date: March 24, 2005 Clear Gasoline 15.0 Propane 9.0 Clear Diesel 15.0 Fuel Railways 15.0 Aviation-Turbo 1.5 Aviation-Gas 1.5
Time Period Since Initiation In order to qualify for this exemption the substance must be acquired on orafter April 1, 2005
Source Documents http://www.finance.gov.sk.ca/revenue/pst/bulletins/pst14.pdf
http://www.finance.gov.sk.ca/taxes/ft/

www.globalsubsidies.org
THE GLOBAL SUBSIDIES INITIATIVE FOSSIL FUELS – AT WHAT COST? GOVERNMENT SUPPORT FOR UPSTREAM OIL ACTIVITIES IN THREE CANADIAN PROVINCES: ALBERTA, SASKATCHEWAN, AND NEWFOUNDLAND AND LABRADOR Page 126
14.3.4 FLOW-THROUGH SHARES
Subsidy Category Tax Breaks and Special Taxes – Tax Expenditures
Subsidy Name Flow-Through Shares
Jurisdiction Provincial – Saskatchewan
Granting Organization Government of Saskatchewan
Objective of Subsidy Flow-Through Shares (FTS) are a tax-advantaged investment in the Canadiannatural resource sector. Taxpayers in the highest marginal tax rate canreduce their taxable income and receive refundable or non-refundable tax-credits depending on their province of residency.
Provincial flow-through initiatives have been announced that apply to theprovincial portion of income tax relating to eligible expenses in relevantjurisdictions.
FTS financing provides further indication that federal and provincialincentives have contributed to higher overall expenditure levels, to a revivalin junior company and off-mine-site spending and to increased financingopportunities for project proponents.
Recipient of Subsidy Certain corporations in the mining, oil and gas, and renewable energy andenergy conservation sectors may issue FTS to help finance their explorationand project development activities. The FTS must be newly issued sharesthat have the attributes generally attached to common shares.
Size of Subsidy The FTS program provides tax incentives to investors who acquire FTS by (Financial or Otherwise) allowing deductions for resource expenses renounced by eligible
corporations and investment tax credits for individuals (excluding trusts) onresource expenses in the mining sector that qualify as flow-through miningexpenditures.
Saskatchewan has a 10 per cent provincial FTS tax credit that applies tothe provincial portion of income tax relating to eligible expenses.
Source Documents http://www.nrcan-rncan.gc.ca/mms-smm/busi-indu/met-qfi/2006/rep-rap-eng.htm,
http://www.nrcan-rncan.gc.ca/mms-smm/busi-indu/met-qfi/2002/eir-eif-eng.htm
http://www.neilfriesen.com/exempt-securities/flow-through-shares/,
http://www.pdac.ca/pdac/advocacy/financial/flow-through-brochure.pdf
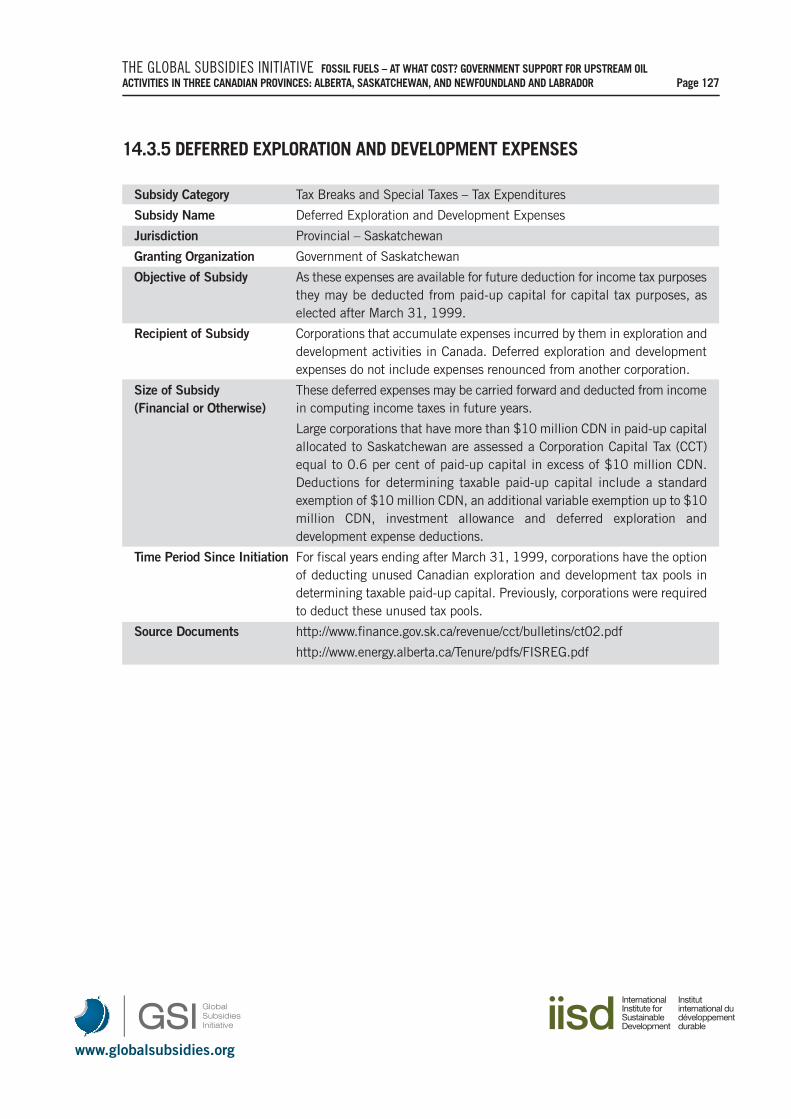
www.globalsubsidies.org
THE GLOBAL SUBSIDIES INITIATIVE FOSSIL FUELS – AT WHAT COST? GOVERNMENT SUPPORT FOR UPSTREAM OIL ACTIVITIES IN THREE CANADIAN PROVINCES: ALBERTA, SASKATCHEWAN, AND NEWFOUNDLAND AND LABRADOR Page 127
14.3.5 DEFERRED EXPLORATION AND DEVELOPMENT EXPENSES
Subsidy Category Tax Breaks and Special Taxes – Tax Expenditures
Subsidy Name Deferred Exploration and Development Expenses
Jurisdiction Provincial – Saskatchewan
Granting Organization Government of Saskatchewan
Objective of Subsidy As these expenses are available for future deduction for income tax purposesthey may be deducted from paid-up capital for capital tax purposes, aselected after March 31, 1999.
Recipient of Subsidy Corporations that accumulate expenses incurred by them in exploration anddevelopment activities in Canada. Deferred exploration and developmentexpenses do not include expenses renounced from another corporation.
Size of Subsidy These deferred expenses may be carried forward and deducted from income (Financial or Otherwise) in computing income taxes in future years.
Large corporations that have more than $10 million CDN in paid-up capitalallocated to Saskatchewan are assessed a Corporation Capital Tax (CCT)equal to 0.6 per cent of paid-up capital in excess of $10 million CDN.Deductions for determining taxable paid-up capital include a standardexemption of $10 million CDN, an additional variable exemption up to $10million CDN, investment allowance and deferred exploration anddevelopment expense deductions.
Time Period Since Initiation For fiscal years ending after March 31, 1999, corporations have the optionof deducting unused Canadian exploration and development tax pools indetermining taxable paid-up capital. Previously, corporations were requiredto deduct these unused tax pools.
Source Documents http://www.finance.gov.sk.ca/revenue/cct/bulletins/ct02.pdf
http://www.energy.alberta.ca/Tenure/pdfs/FISREG.pdf
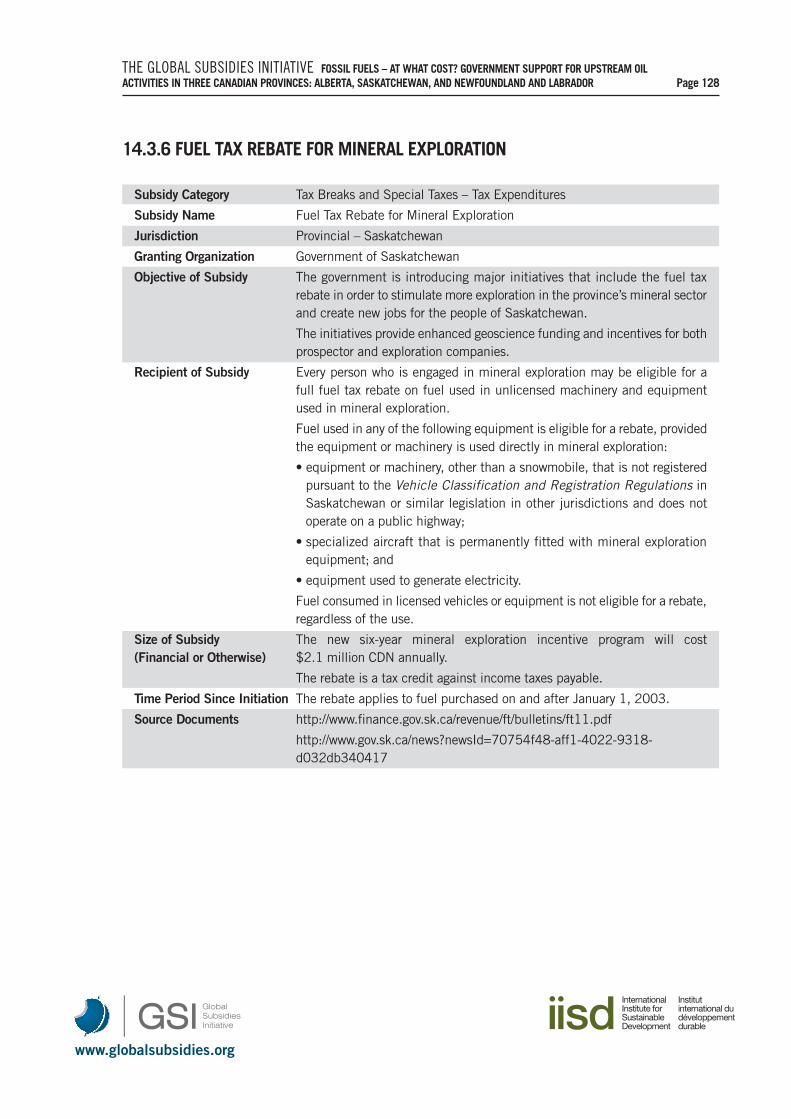
www.globalsubsidies.org
THE GLOBAL SUBSIDIES INITIATIVE FOSSIL FUELS – AT WHAT COST? GOVERNMENT SUPPORT FOR UPSTREAM OIL ACTIVITIES IN THREE CANADIAN PROVINCES: ALBERTA, SASKATCHEWAN, AND NEWFOUNDLAND AND LABRADOR Page 128
14.3.6 FUEL TAX REBATE FOR MINERAL EXPLORATION
Subsidy Category Tax Breaks and Special Taxes – Tax Expenditures
Subsidy Name Fuel Tax Rebate for Mineral Exploration
Jurisdiction Provincial – Saskatchewan
Granting Organization Government of Saskatchewan
Objective of Subsidy The government is introducing major initiatives that include the fuel taxrebate in order to stimulate more exploration in the province’s mineral sectorand create new jobs for the people of Saskatchewan.
The initiatives provide enhanced geoscience funding and incentives for bothprospector and exploration companies.
Recipient of Subsidy Every person who is engaged in mineral exploration may be eligible for afull fuel tax rebate on fuel used in unlicensed machinery and equipmentused in mineral exploration.
Fuel used in any of the following equipment is eligible for a rebate, providedthe equipment or machinery is used directly in mineral exploration:
• equipment or machinery, other than a snowmobile, that is not registeredpursuant to the Vehicle Classification and Registration Regulations inSaskatchewan or similar legislation in other jurisdictions and does notoperate on a public highway;
• specialized aircraft that is permanently fitted with mineral explorationequipment; and
• equipment used to generate electricity.
Fuel consumed in licensed vehicles or equipment is not eligible for a rebate,regardless of the use.
Size of Subsidy The new six-year mineral exploration incentive program will cost (Financial or Otherwise) $2.1 million CDN annually.
The rebate is a tax credit against income taxes payable.
Time Period Since Initiation The rebate applies to fuel purchased on and after January 1, 2003.
Source Documents http://www.finance.gov.sk.ca/revenue/ft/bulletins/ft11.pdf
http://www.gov.sk.ca/news?newsId=70754f48-aff1-4022-9318-d032db340417
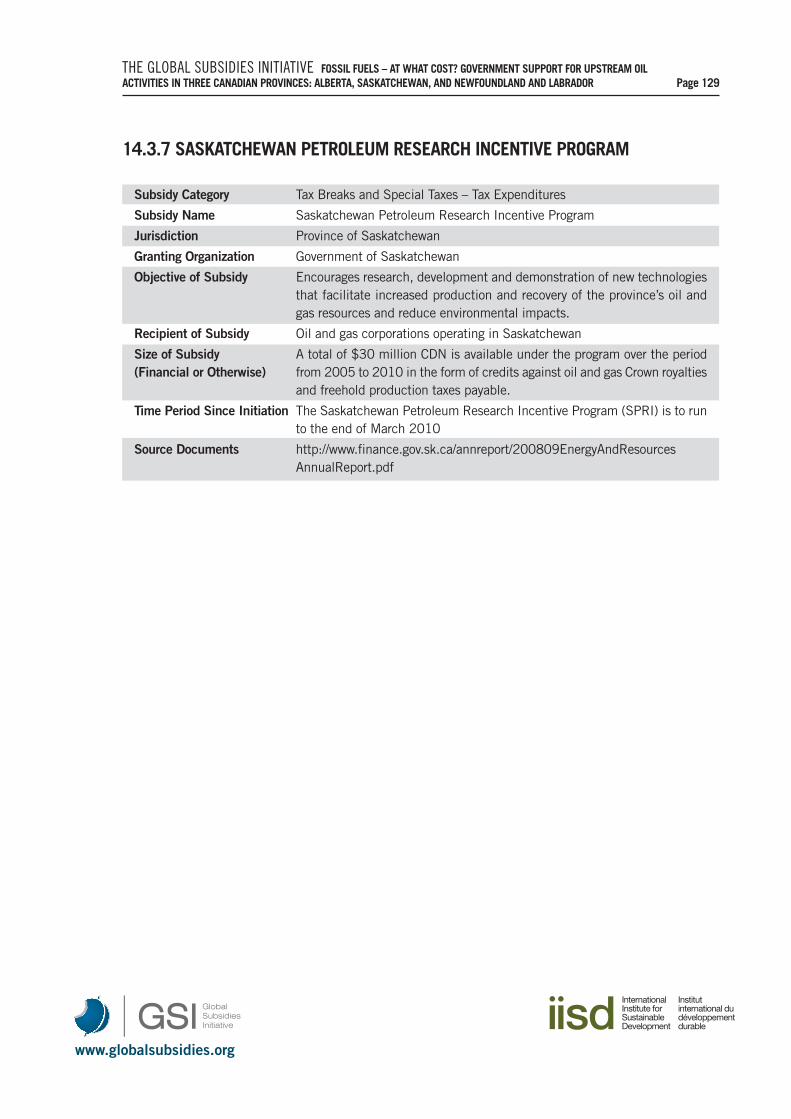
www.globalsubsidies.org
THE GLOBAL SUBSIDIES INITIATIVE FOSSIL FUELS – AT WHAT COST? GOVERNMENT SUPPORT FOR UPSTREAM OIL ACTIVITIES IN THREE CANADIAN PROVINCES: ALBERTA, SASKATCHEWAN, AND NEWFOUNDLAND AND LABRADOR Page 129
14.3.7 SASKATCHEWAN PETROLEUM RESEARCH INCENTIVE PROGRAM
Subsidy Category Tax Breaks and Special Taxes – Tax Expenditures
Subsidy Name Saskatchewan Petroleum Research Incentive Program
Jurisdiction Province of Saskatchewan
Granting Organization Government of Saskatchewan
Objective of Subsidy Encourages research, development and demonstration of new technologiesthat facilitate increased production and recovery of the province’s oil andgas resources and reduce environmental impacts.
Recipient of Subsidy Oil and gas corporations operating in Saskatchewan
Size of Subsidy A total of $30 million CDN is available under the program over the period (Financial or Otherwise) from 2005 to 2010 in the form of credits against oil and gas Crown royalties
and freehold production taxes payable.
Time Period Since Initiation The Saskatchewan Petroleum Research Incentive Program (SPRI) is to runto the end of March 2010
Source Documents http://www.finance.gov.sk.ca/annreport/200809EnergyAndResourcesAnnualReport.pdf
www.globalsubsidies.org
THE GLOBAL SUBSIDIES INITIATIVE FOSSIL FUELS – AT WHAT COST? GOVERNMENT SUPPORT FOR UPSTREAM OIL ACTIVITIES IN THREE CANADIAN PROVINCES: ALBERTA, SASKATCHEWAN, AND NEWFOUNDLAND AND LABRADOR Page 130
14.4 PROVINCIAL – NEWFOUNDLAND AND LABRADOR
14.4.1 PST EXEMPTION ON START-UP CAPITAL AND OPERATING EXPENDITURES
Subsidy Category Tax Breaks and Special Taxes – Tax Expenditures
Subsidy Name Waiving PST on start-up capital expenditures and operating expenditures
Jurisdiction Newfoundland and Labrador
Granting Organization Government of Newfoundland and Labrador
Objective of Subsidy Stimulate new capital investments in Newfoundland and Labrador
Recipient of Subsidy Hibernia and Terra Nova Projects
Size of the Subsidy The provincial government waived PST on start-up capital expenditures at (Financial or Otherwise) the outset of the project, worth an estimated $186 million CDN. PST was
also waived on operating expenditures amounting to approximately $1million/year CDN. Note that new offshore projects (e.g., White Rose) nolonger receive this subsidy.
Time Period Since Initiation Starting in 1985. Documentation does not reveal the end-date for thissubsidy.
Source Documents http://www.livingoceans.org/files/PDF/energy/Dale_Marshall_re_Hibernia.pdf
14.4.2 FUEL TAX EXEMPTION FOR OFFSHORE PROJECTS
Subsidy Category Tax Breaks and Special Taxes – Overall tax burden by industry
Subsidy Name Fuel tax exemption
Jurisdiction Newfoundland and Labrador
Granting Organization Government of Newfoundland and Labrador
Objective of Subsidy Reduce operational costs for offshore oil and gas development
Recipient of Subsidy Hibernia and Terra Nova Projects, as well as potentially new projects
Size of the Subsidy Provincial fuel tax rates (cents/Litre) are as follows: gasoline 16.5, (Financial or Otherwise) diesel 16.5, marine fuel 3.5, aviation fuel 0.7.
Gasoline used by manufacturers in fixed or stationary manufacturingequipment used directly in manufacturing is eligible for tax rebate. Totalrebate/exemption provided to offshore projects is unknown but likely lessthan $10 million CDN annually.
Time Period Since Initiation Unknown but it appears to be current.
Source Documents http://www.fin.gov.nl.ca/fin/tax_programs_incentives/business/gasolinetax.html
http://www.fin.gov.nl.ca/fin/publications/gas_tax.pdf
www.globalsubsidies.org
THE GLOBAL SUBSIDIES INITIATIVE FOSSIL FUELS – AT WHAT COST? GOVERNMENT SUPPORT FOR UPSTREAM OIL ACTIVITIES IN THREE CANADIAN PROVINCES: ALBERTA, SASKATCHEWAN, AND NEWFOUNDLAND AND LABRADOR Page 131
14.4.3 FUEL TAX EXEMPTION FOR ONSHORE OIL EXPLORATION
Subsidy Category Tax Breaks and Special Taxes – Overall tax burden by industry
Subsidy Name Fuel Tax Exemption
Jurisdiction Newfoundland and Labrador
Granting Organization Government of Newfoundland and Labrador
Objective of Subsidy Stimulate onshore oil exploration
Recipient of Subsidy Companies conducting oil exploration
Size of the Subsidy Tax exemption for gasoline consumed by off-road equipment used in onshore (Financial or Otherwise) oil exploration will be implemented effective April 1, 2009. The provincial
fuel tax rate on gasoline is 16.5 cents/Litre. Total exemption value is notknown but likely less than $10 million CDN annually.
Time Period Since Initiation Since 2009
Source Documents http://www.budget.gov.nl.ca/budget2009/highlights/default.htm
15. CREDIT SUPPORT
15.1 PROVINCIAL – NEWFOUNDLAND AND LABRADOR
15.1.1 CANADA-NEWFOUNDLAND OFFSHORE DEVELOPMENT FUND
Subsidy Category Credit Support – Subsidized credit to domestic infrastructure
Subsidy Name Canada-Newfoundland Offshore Development Fund
Jurisdiction Newfoundland and Labrador
Granting Organization Both federal and Newfoundland and Labrador governments
Objective of Subsidy Stimulate new investment in offshore infrastructure and develop local jobsand construction benefits
Recipient of Subsidy Hibernia Project
Size of the Subsidy Both the federal and provincial levels of government subsidized the Bull (Financial or Otherwise) Arm facility, where the offshore drilling structure for Hibernia was built, by
up to $95 million CDN.
Time Period Since Initiation Start date 1985–86
Source Documents http://www.energybc.ca/econ3b.html
http://www.budget.gov.nl.ca/budget2009/estimates/estimates2009.pdf
http://www.budget.gov.nl.ca/
www.globalsubsidies.org
THE GLOBAL SUBSIDIES INITIATIVE FOSSIL FUELS – AT WHAT COST? GOVERNMENT SUPPORT FOR UPSTREAM OIL ACTIVITIES IN THREE CANADIAN PROVINCES: ALBERTA, SASKATCHEWAN, AND NEWFOUNDLAND AND LABRADOR Page 132
15.1.2 CANADA-NEWFOUNDLAND OFFSHORE DEVELOPMENT FUND
Subsidy Category Credit Support – Government Loans and Loan Guarantees
Subsidy Name Canada-Newfoundland Offshore Development Fund
Jurisdiction Newfoundland and Labrador
Granting Organization Federal and Newfoundland and Labrador governments
Objective of Subsidy Stimulate new investment in development of offshore oil projects
Recipient of Subsidy Hibernia Project
Size of the Subsidy In 1988, Mobil Oil obtained a $1.04 billion CDN grant from the federal (Financial or Otherwise) government along with a $1.66 billion CDN loan guarantee.
Time Period Since Initiation Start date 1985–86
Source Documents http://www.energybc.ca/econ3b.html
http://www.budget.gov.nl.ca/budget2009/estimates/estimates2009.pdf
http://www.budget.gov.nl.ca/
16. ENVIRONMENTAL ISSUES
16.1 PROVINCIAL – ALBERTA
16.1.1 ORPHAN WELL FUND
Subsidy Category Environmental Issues – Responsibility for closure and post closure risks
Subsidy Name Orphan Well Fund
Jurisdiction Provincial – Alberta
Granting Organization Government of Alberta
Objective of Subsidy The province is providing $30 million CDN to be invested by the OrphanWell Association in abandonment and reclamation projects with a focus onhigh-priority, very old “legacy” sites and on final reclamation efforts forabandoned sites—all of which pre-date the creation of the Orphan WellAssociation and the establishment of modern industry practices andregulatory standards.
Recipient of Subsidy There are more than 600 estimated sites that fall into these categories.
Size of Subsidy $30 million CDN(Financial or Otherwise)
Time Period Since Initiation Initiated in 2009
Source Documents http://www.alberta.ca/ACN/200903/25402CDEFE818-F1BC-5D66-DF309066E457F2A4.html
www.globalsubsidies.org
THE GLOBAL SUBSIDIES INITIATIVE FOSSIL FUELS – AT WHAT COST? GOVERNMENT SUPPORT FOR UPSTREAM OIL ACTIVITIES IN THREE CANADIAN PROVINCES: ALBERTA, SASKATCHEWAN, AND NEWFOUNDLAND AND LABRADOR Page 133
17. ANNEX 2: CALCULATION OF TAX DEFERRAL FROM CANADIAN DEVELOPMENTAND EXPLORATION EXPENSES
In Annex 2, we provide detail on how we estimate the tax expenditures for the federal Canadian developmentexpense and the Canadian exploration expense tax expenditure programs. Both of these programs provideaccelerated depreciation for expenditures that results in lowering taxes payable. We use three approaches toestimate the federal and provincial taxes reduced and subsequent subsidy to the industry. Data is fromStatistics Canada’s Reconciliation of Profit in the oil and gas sector in 2008, including federal and provincialtax rates. Two calculation methods, adopted from GSI (2010) are used to bound a range: year-by-year basisand lump-sum comparison. The table below provides the results, with the average of the two methods reportedin the main document above. Note that because the federal program reduces net income for which provincialtaxes are payable, federal and provincial taxes are avoided. In the main report, the aggregate provincialestimates is pro-rated to the provinces based on the 2008 value of production.
TABLE A2-1: VALUE OF TAX DEFERRAL FROM CDE AND CEE IN 2008 (IN $MILLION, 2009)Year-by-Year Basis Preset Value Lump Sum
Federal Provincial Federal Provincial
CDE $510 $264 $422 $232
CEE $214 $111 $240 $132Source: EnviroEconomics calculations
CALCULATION ON YEAR-BY-YEAR BASIS
This method calculates the current year tax loss on the grounds that it is impossible to predict future taxliability, and so tax revenue reduced in a year is the value of the subsidy. Essentially, we remove the benefitof the tax deferral from the profit statement of the sector (Statistics Canada, 2008), and determine the impacton tax payable in 2008. The Commissioner of Environment and Sustainable development suggested that thisapproach is a reasonable way to estimate the benefit (Office of the Auditor General of Canada, 2000). Thisis then apportioned to oil production and split between exploration and development. There are a number ofreasons why this is a reasonable approach:
• Recapture of the tax may not occur if the recipient was not profitable at the end of the period.
• Earlier losses could also be carried forward to offset current profits, which then reduces the future liability.
• Finally, if new equipment is purchased towards the end of the depreciation period, the acceleratedwrite-off could be rolled over, again reducing the tax liability on the original equipment (GSI, 2010).
The limit of this approach is that it assumes the entity will not be profitable at any time in the future andtherefore likely overestimates the subsidy.
The subsidy is calculated by simply the ADy = (CCAt – Db) Tf,p
Where, ADy = accelerated depreciation yearlyCCAt = capital cost allowance for tax purposesDb = depreciation bookTf,p = corporate tax rate
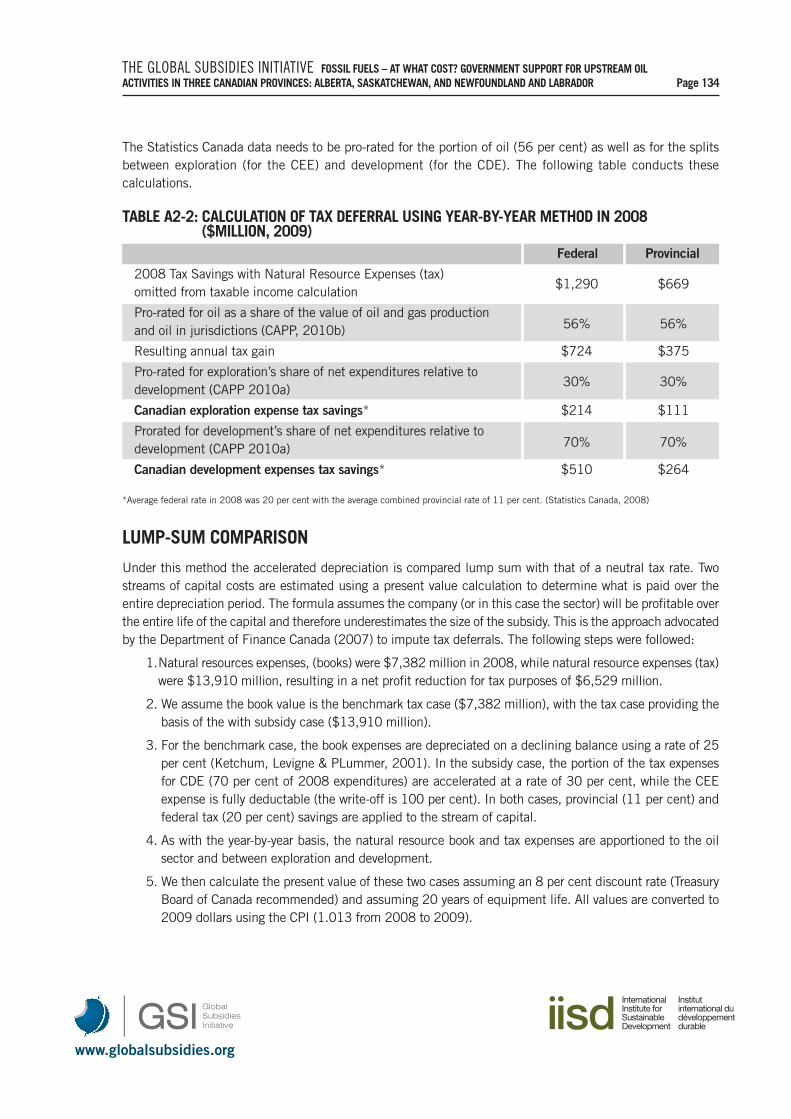
www.globalsubsidies.org
THE GLOBAL SUBSIDIES INITIATIVE FOSSIL FUELS – AT WHAT COST? GOVERNMENT SUPPORT FOR UPSTREAM OIL ACTIVITIES IN THREE CANADIAN PROVINCES: ALBERTA, SASKATCHEWAN, AND NEWFOUNDLAND AND LABRADOR Page 134
The Statistics Canada data needs to be pro-rated for the portion of oil (56 per cent) as well as for the splitsbetween exploration (for the CEE) and development (for the CDE). The following table conducts thesecalculations.
TABLE A2-2: CALCULATION OF TAX DEFERRAL USING YEAR-BY-YEAR METHOD IN 2008($MILLION, 2009)
Federal Provincial
2008 Tax Savings with Natural Resource Expenses (tax) omitted from taxable income calculation
$1,290 $669
Pro-rated for oil as a share of the value of oil and gas production and oil in jurisdictions (CAPP, 2010b) 56% 56%
Resulting annual tax gain $724 $375
Pro-rated for exploration’s share of net expenditures relative to development (CAPP 2010a)
30% 30%
Canadian exploration expense tax savings* $214 $111
Prorated for development’s share of net expenditures relative to development (CAPP 2010a) 70% 70%
Canadian development expenses tax savings* $510 $264
*Average federal rate in 2008 was 20 per cent with the average combined provincial rate of 11 per cent. (Statistics Canada, 2008)
LUMP-SUM COMPARISON
Under this method the accelerated depreciation is compared lump sum with that of a neutral tax rate. Twostreams of capital costs are estimated using a present value calculation to determine what is paid over theentire depreciation period. The formula assumes the company (or in this case the sector) will be profitable overthe entire life of the capital and therefore underestimates the size of the subsidy. This is the approach advocatedby the Department of Finance Canada (2007) to impute tax deferrals. The following steps were followed:
1.Natural resources expenses, (books) were $7,382 million in 2008, while natural resource expenses (tax)were $13,910 million, resulting in a net profit reduction for tax purposes of $6,529 million.
2. We assume the book value is the benchmark tax case ($7,382 million), with the tax case providing thebasis of the with subsidy case ($13,910 million).
3. For the benchmark case, the book expenses are depreciated on a declining balance using a rate of 25per cent (Ketchum, Levigne & PLummer, 2001). In the subsidy case, the portion of the tax expensesfor CDE (70 per cent of 2008 expenditures) are accelerated at a rate of 30 per cent, while the CEEexpense is fully deductable (the write-off is 100 per cent). In both cases, provincial (11 per cent) andfederal tax (20 per cent) savings are applied to the stream of capital.
4. As with the year-by-year basis, the natural resource book and tax expenses are apportioned to the oilsector and between exploration and development.
5. We then calculate the present value of these two cases assuming an 8 per cent discount rate (TreasuryBoard of Canada recommended) and assuming 20 years of equipment life. All values are converted to2009 dollars using the CPI (1.013 from 2008 to 2009).
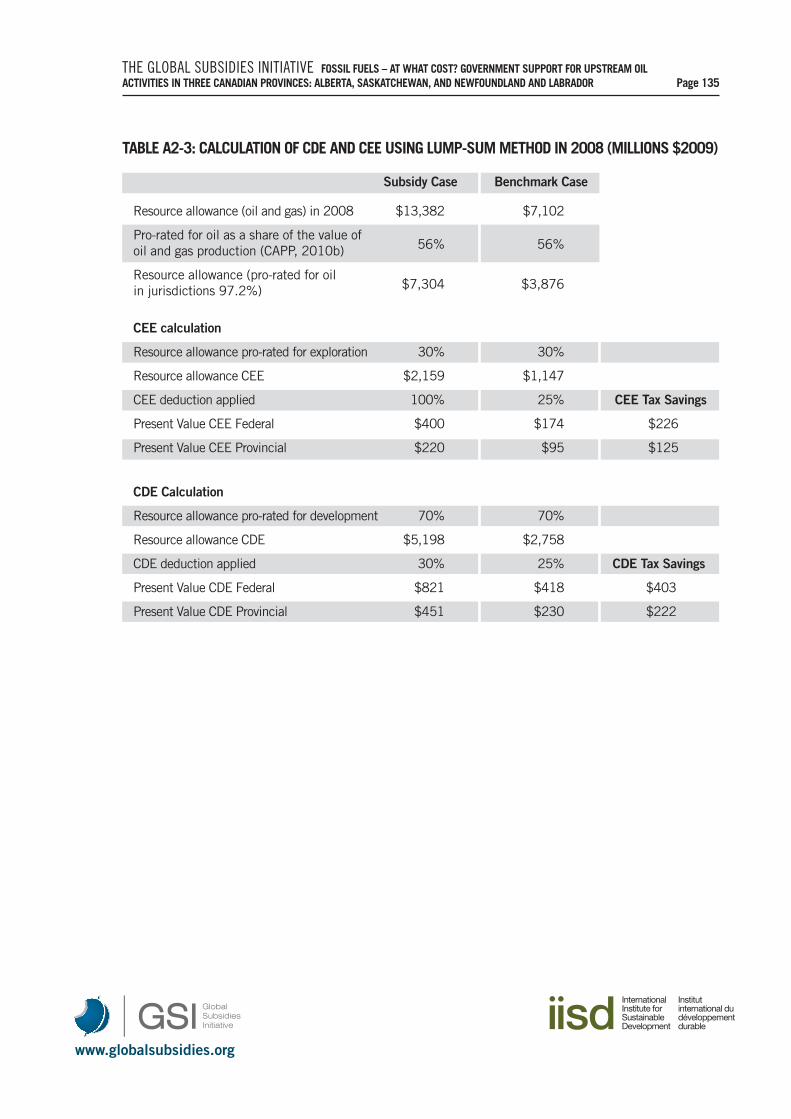
www.globalsubsidies.org
THE GLOBAL SUBSIDIES INITIATIVE FOSSIL FUELS – AT WHAT COST? GOVERNMENT SUPPORT FOR UPSTREAM OIL ACTIVITIES IN THREE CANADIAN PROVINCES: ALBERTA, SASKATCHEWAN, AND NEWFOUNDLAND AND LABRADOR Page 135
TABLE A2-3: CALCULATION OF CDE AND CEE USING LUMP-SUM METHOD IN 2008 (MILLIONS $2009)
Subsidy Case Benchmark Case
Resource allowance (oil and gas) in 2008 $13,382 $7,102
Pro-rated for oil as a share of the value of oil and gas production (CAPP, 2010b) 56% 56%
Resource allowance (pro-rated for oil in jurisdictions 97.2%) $7,304 $3,876
CEE calculation
Resource allowance pro-rated for exploration 30% 30%
Resource allowance CEE $2,159 $1,147
CEE deduction applied 100% 25% CEE Tax Savings
Present Value CEE Federal $400 $174 $226
Present Value CEE Provincial $220 $95 $125
CDE Calculation
Resource allowance pro-rated for development 70% 70%
Resource allowance CDE $5,198 $2,758
CDE deduction applied 30% 25% CDE Tax Savings
Present Value CDE Federal $821 $418 $403
Present Value CDE Provincial $451 $230 $222

www.globalsubsidies.org
THE GLOBAL SUBSIDIES INITIATIVE FOSSIL FUELS – AT WHAT COST? GOVERNMENT SUPPORT FOR UPSTREAM OIL ACTIVITIES IN THREE CANADIAN PROVINCES: ALBERTA, SASKATCHEWAN, AND NEWFOUNDLAND AND LABRADOR Page 136
18. ANNEX 3: THE GEEM COMPUTABLE GENERAL EQUILIBRIUM MODEL
To complete the analysis, we employ a computable general equilibrium (CGE) model called GEEM, which isan economic model that balances supply and demand for commodities and services in all markets throughprices. The current GEEM model represents British Columbia, Alberta, Saskatchewan, Manitoba, Ontario,Quebec, Atlantic Canada and the United States as separate regions, and each region interacts through tradeof commodities and services. Capital is assumed to be mobile between provinces/states within each country,while labour is assumed to be mobile within regions (inter-region migration is not assumed to be influencedby the policy). In the model, a representative household in each region is the owner of primary factors (labour,capital and natural resources), which they rent to producers who combine them with intermediate inputs tocreate commodities. Commodities can be sold to other producers (as intermediate inputs), to final consumers,or to other regions and the rest of the world as exports. Commodities can also be imported from other regionsor the rest of the world. The key economic flows in GEEM are captured schematically in Figure A3-1.
FIGURE A3-1: OVERALL STRUCTURE OF THE GEEM MODEL FOR A SINGLE REGION (E.G., BRITISH COLUMBIA)
GEEM functions by initially developing a representation of the North American economy in the absence ofnew policies in a specific year (e.g., 2020). This representation is based on the input-output tables publishedby Statistics Canada and sector growth rates provided by Informetrica. After the model has been developedfor a specific year, we introduce policies, such as carbon taxes, cap-and-trade systems or technologyregulations. These policies initially unbalance the model, as firms become more or less profitable under thepolicy at a given set of commodity and factor prices (e.g., natural gas prices and wage rates), and householdsmay not be able to maintain current consumption patterns at their previous incomes given additional emissionscosts. The GEEM model restores equilibrium within the economic system by adjusting all prices, sector outputsand household consumption patterns. Using the new equilibrium, we can estimate the effects of the policieson various economic indicators such as gross domestic product or employment.
GEEM assumes that all markets clear – prices adjust until supply equals demand. Most markets are assumedto be perfectly competitive, such that producers never make excess profits. However, an exception is madefor the resource extraction sectors that are assumed to earn extra profits due to resource rent. The presence
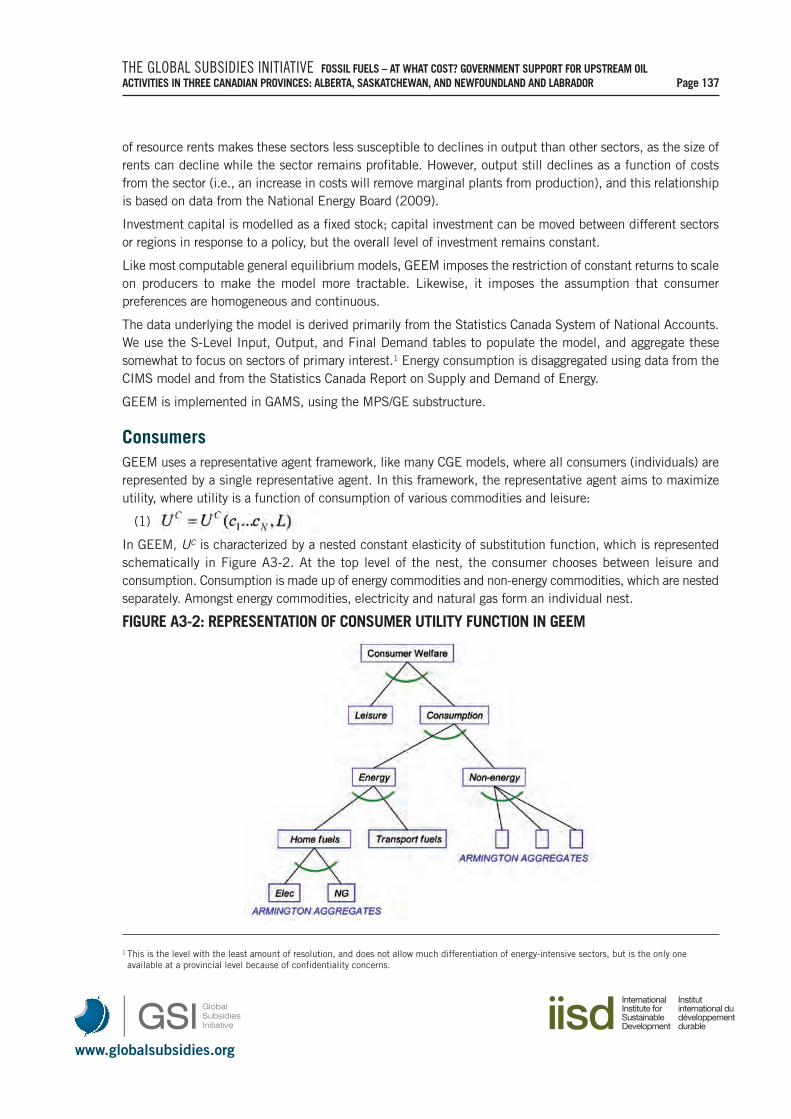
www.globalsubsidies.org
THE GLOBAL SUBSIDIES INITIATIVE FOSSIL FUELS – AT WHAT COST? GOVERNMENT SUPPORT FOR UPSTREAM OIL ACTIVITIES IN THREE CANADIAN PROVINCES: ALBERTA, SASKATCHEWAN, AND NEWFOUNDLAND AND LABRADOR Page 137
of resource rents makes these sectors less susceptible to declines in output than other sectors, as the size ofrents can decline while the sector remains profitable. However, output still declines as a function of costsfrom the sector (i.e., an increase in costs will remove marginal plants from production), and this relationshipis based on data from the National Energy Board (2009).
Investment capital is modelled as a fixed stock; capital investment can be moved between different sectorsor regions in response to a policy, but the overall level of investment remains constant.
Like most computable general equilibrium models, GEEM imposes the restriction of constant returns to scaleon producers to make the model more tractable. Likewise, it imposes the assumption that consumerpreferences are homogeneous and continuous.
The data underlying the model is derived primarily from the Statistics Canada System of National Accounts.We use the S-Level Input, Output, and Final Demand tables to populate the model, and aggregate thesesomewhat to focus on sectors of primary interest.1 Energy consumption is disaggregated using data from theCIMS model and from the Statistics Canada Report on Supply and Demand of Energy.
GEEM is implemented in GAMS, using the MPS/GE substructure.
ConsumersGEEM uses a representative agent framework, like many CGE models, where all consumers (individuals) arerepresented by a single representative agent. In this framework, the representative agent aims to maximizeutility, where utility is a function of consumption of various commodities and leisure:
(1)
In GEEM, UC is characterized by a nested constant elasticity of substitution function, which is representedschematically in Figure A3-2. At the top level of the nest, the consumer chooses between leisure andconsumption. Consumption is made up of energy commodities and non-energy commodities, which are nestedseparately. Amongst energy commodities, electricity and natural gas form an individual nest.
FIGURE A3-2: REPRESENTATION OF CONSUMER UTILITY FUNCTION IN GEEM
1 This is the level with the least amount of resolution, and does not allow much differentiation of energy-intensive sectors, but is the only oneavailable at a provincial level because of confidentiality concerns.
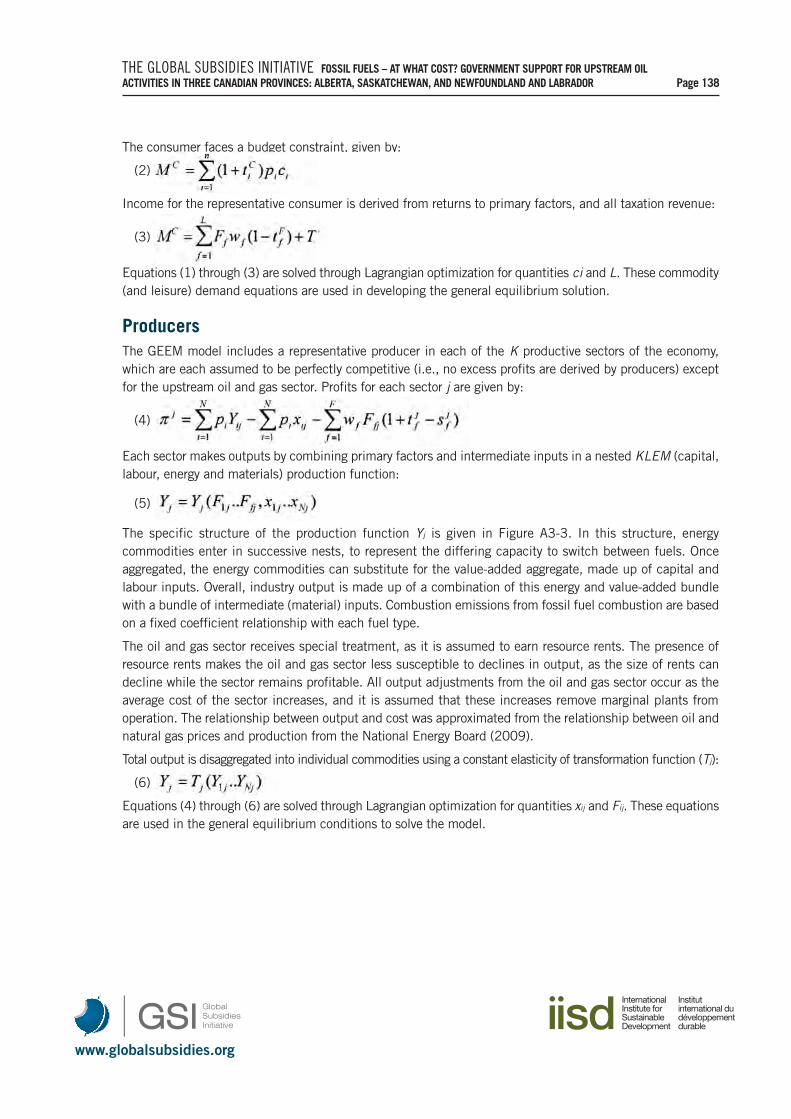
www.globalsubsidies.org
THE GLOBAL SUBSIDIES INITIATIVE FOSSIL FUELS – AT WHAT COST? GOVERNMENT SUPPORT FOR UPSTREAM OIL ACTIVITIES IN THREE CANADIAN PROVINCES: ALBERTA, SASKATCHEWAN, AND NEWFOUNDLAND AND LABRADOR Page 138
The consumer faces a budget constraint, given by:
(2)
Income for the representative consumer is derived from returns to primary factors, and all taxation revenue:
(3)
Equations (1) through (3) are solved through Lagrangian optimization for quantities ci and L. These commodity(and leisure) demand equations are used in developing the general equilibrium solution.
ProducersThe GEEM model includes a representative producer in each of the K productive sectors of the economy,which are each assumed to be perfectly competitive (i.e., no excess profits are derived by producers) exceptfor the upstream oil and gas sector. Profits for each sector j are given by:
(4)
Each sector makes outputs by combining primary factors and intermediate inputs in a nested KLEM (capital,labour, energy and materials) production function:
(5)
The specific structure of the production function Yj is given in Figure A3-3. In this structure, energycommodities enter in successive nests, to represent the differing capacity to switch between fuels. Onceaggregated, the energy commodities can substitute for the value-added aggregate, made up of capital andlabour inputs. Overall, industry output is made up of a combination of this energy and value-added bundlewith a bundle of intermediate (material) inputs. Combustion emissions from fossil fuel combustion are basedon a fixed coefficient relationship with each fuel type.
The oil and gas sector receives special treatment, as it is assumed to earn resource rents. The presence ofresource rents makes the oil and gas sector less susceptible to declines in output, as the size of rents candecline while the sector remains profitable. All output adjustments from the oil and gas sector occur as theaverage cost of the sector increases, and it is assumed that these increases remove marginal plants fromoperation. The relationship between output and cost was approximated from the relationship between oil andnatural gas prices and production from the National Energy Board (2009).
Total output is disaggregated into individual commodities using a constant elasticity of transformation function (Tj):
(6)
Equations (4) through (6) are solved through Lagrangian optimization for quantities xij and Fij. These equationsare used in the general equilibrium conditions to solve the model.
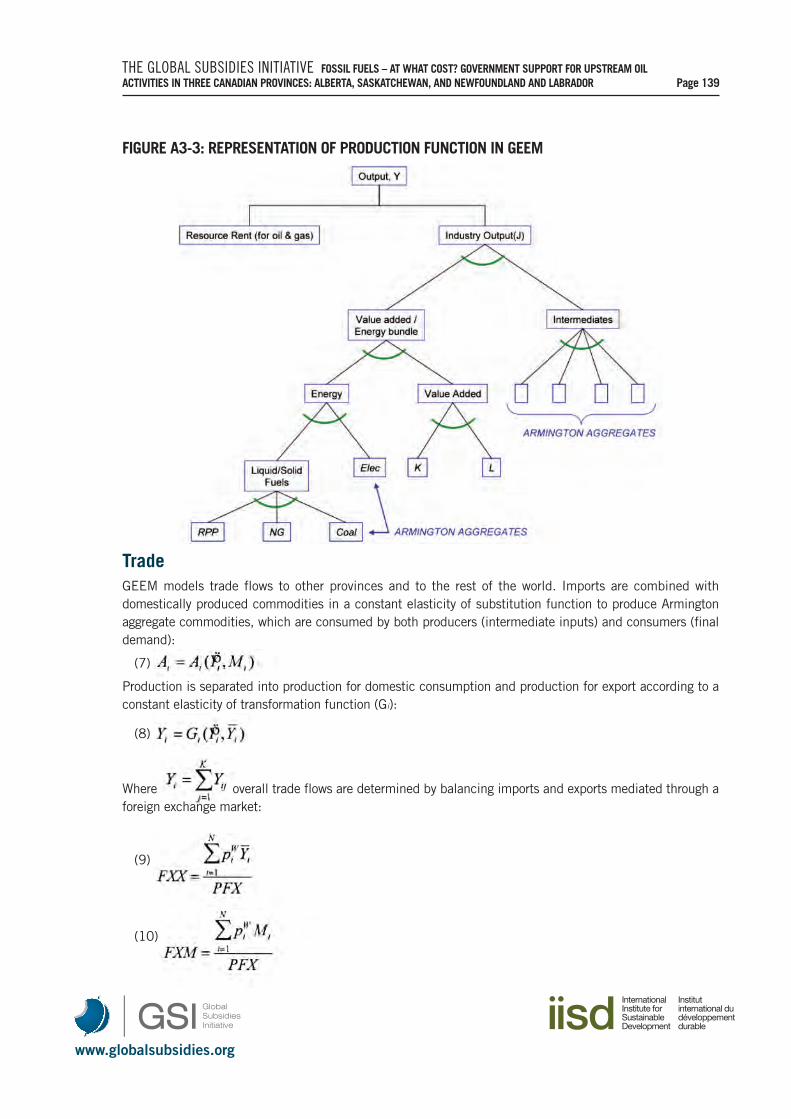
www.globalsubsidies.org
THE GLOBAL SUBSIDIES INITIATIVE FOSSIL FUELS – AT WHAT COST? GOVERNMENT SUPPORT FOR UPSTREAM OIL ACTIVITIES IN THREE CANADIAN PROVINCES: ALBERTA, SASKATCHEWAN, AND NEWFOUNDLAND AND LABRADOR Page 139
FIGURE A3-3: REPRESENTATION OF PRODUCTION FUNCTION IN GEEM
TradeGEEM models trade flows to other provinces and to the rest of the world. Imports are combined withdomestically produced commodities in a constant elasticity of substitution function to produce Armingtonaggregate commodities, which are consumed by both producers (intermediate inputs) and consumers (finaldemand):
(7)
Production is separated into production for domestic consumption and production for export according to aconstant elasticity of transformation function (Gi):
(8)
Where overall trade flows are determined by balancing imports and exports mediated through aforeign exchange market:
(9)
(10)
www.globalsubsidies.org
THE GLOBAL SUBSIDIES INITIATIVE FOSSIL FUELS – AT WHAT COST? GOVERNMENT SUPPORT FOR UPSTREAM OIL ACTIVITIES IN THREE CANADIAN PROVINCES: ALBERTA, SASKATCHEWAN, AND NEWFOUNDLAND AND LABRADOR Page 140
(11)
Runs in GEEM are constrained such that the balance of trade deficit (BTD) that prevailed in the benchmarkscenario is replicated in the counterfactual scenario. The world price is given by:
(12)
VARIABLE DEFINITIONS
ConsumersUC Consumer utility
ci Quantity of commodity i consumed by consumer
L Quantity of leisure consumed by consumer
pi Price of commodity i
tiC Consumption tax rate on commodity i
tfF Direct factor tax rate on factor f
T Sum of all direct and indirect tax revenue
ProducersYij Quantity of output of commodity i by sector j
Yj Total output of all commodities by sector j
xij Quantity of intermediate input of commodity i by sector j
pj Profit of sector j
Ffj Quantity of factor f required by sector j
wf Returns to factor f
tfj Indirect factor tax rate on factor f employed by sector j
sfj Indirect factor subsidy rate on factor f employed by sector j
TradeProduction of commodity i for domestic consumption
Production of commodity i for export to rest of world
BTD Balance of trade deficit with the rest of world
FXM Foreign exchange outlays for imports
FXX Foreign exchange receipts from exports
PFX Price of foreign exchange (exchange rate)
piW World price of commodity i
tix Tax on exports of commodity i
tim Tax on imports of commodity i
www.globalsubsidies.org
THE GLOBAL SUBSIDIES INITIATIVE FOSSIL FUELS – AT WHAT COST? GOVERNMENT SUPPORT FOR UPSTREAM OIL ACTIVITIES IN THREE CANADIAN PROVINCES: ALBERTA, SASKATCHEWAN, AND NEWFOUNDLAND AND LABRADOR Page 141
ABOUT THE AUTHORS
Dave Sawyer is the proprietor of Sawyer EnviroEconomic Consulting. He is trained in both the quantitativeand qualitative aspects of economics. His work experience has called for a variety of applied analysis in thearea of environmental, natural resource and regulatory economics. He has completed a significant number ofprojects focused on assessing regulatory proposals and management instruments, estimating health andenvironmental benefits, feasibility and cost-benefit analysis. He has 14 years of environmental economicexperience and has recently completed work on climate policy for Environment Canada, the NationalRoundtable on Environment and Economy, the Auditor General of Canada, the Auditor General of Alberta,and the governments of Alberta, Ontario, Manitoba and British Columbia. His international assignments haveincluded the Caribbean, China, Indonesia, Philippines and Vietnam.
Seton Stiebert is a professionally designated engineer who has worked in the environmental consulting fieldfor the past twelve years. He is currently an associate of EnviroEconomics in Ottawa, and has previously beenboth a senior engineer with Marbek Resource Consultants and project manager for RWDI Air Inc.
Mr. Stiebert has developed expertise in emission inventories and mitigation strategies, air quality impactassessments and air dispersion modelling, and has been a technical advisor to a number of clean developmentmechanism (CDM) projects for Foreign Affairs and International Trade Canada. His experience includesinvestigating a broad range of GHG emission controls and management tools, including: emission trading,environmental charges, fiscal incentives and regulatory instruments for all sectors of the economy at both thefederal and provincial jurisdictional level.
www.globalsubsidies.org
THE GLOBAL SUBSIDIES INITIATIVE (GSI) OF THE INTERNATIONAL INSTITUTE FOR SUSTAINABLE DEVELOPMENT (IISD)
The International Institute for Sustainable Development (IISD) launched the Global Subsidies Initiative (GSI)in December 2005 to put a spotlight on subsidies – transfers of public money to private interests – and howthey undermine efforts to put the world economy on a path toward sustainable development.
Subsidies are powerful instruments. They can play a legitimate role in securing public goods that wouldotherwise remain beyond reach. But they can also be easily subverted. The interests of lobbyists and theelectoral ambitions of officeholders can hijack public policy. Therefore, the GSI starts from the premise thatfull transparency and public accountability for the stated aims of public expenditure must be the cornerstonesof any subsidy program.
But the case for scrutiny goes further. Even when subsidies are legitimate instruments of public policy, theirefficacy – their fitness for purpose – must still be demonstrated. All too often, the unintended and unforeseenconsequences of poorly designed subsidies overwhelm the benefits claimed for these programs. Meanwhile,the citizens who foot the bills remain in the dark.
When subsidies are the principal cause of the perpetuation of a fundamentally unfair trading system, and lieat the root of serious environmental degradation, the questions have to be asked: Is this how taxpayers wanttheir money spent? And should they, through their taxes, support such counterproductive outcomes?
Eliminating harmful subsidies would free up scarce funds to support more worthy causes. The GSI’s challengeto those who advocate creating or maintaining particular subsidies is that they should be able to demonstratethat the subsidies are environmentally, socially and economically sustainable – and that they do not underminethe development chances of some of the poorest producers in the world.
To encourage this, the GSI, in cooperation with a growing international network of research and media partners,seeks to lay bare just what good or harm public subsidies are doing; to encourage public debate and awarenessof the options that are available; and to help provide policy-makers with the tools they need to secure sustainableoutcomes for our societies and our planet
www.globalsubsidies.org
The GSI is an initiative of the International Institute for Sustainable Development (IISD). Established in 1990,the IISD is a Canadian-based not-for-profit organization with a diverse team of more than 150 people locatedin more than 30 countries. The GSI is headquartered in Geneva, Switzerland and works with partners locatedaround the world. Its principal funders have included the governments of Denmark, the Netherlands, NewZealand, Norway, Sweden and the United Kingdom. The William and Flora Hewlett Foundation have alsocontributed to funding GSI research and communications activities.
FURTHER DETAILS AND CONTACT INFORMATION
For further information contact Ms. Kerryn Lang at: [email protected] or [email protected] or +41.22.917.8920.
GSI ProgrammeInternational Institute for Sustainable Development9 chemin de Balexert, 1219, Geneva, SwitzerlandFax: +41.22.917.8054