fossil versus contemporary sources of fine elemental and organic carbonaceous particulate matter
TRANSCRIPT

Atmos. Chem. Phys., 11, 12067–12084, 2011www.atmos-chem-phys.net/11/12067/2011/doi:10.5194/acp-11-12067-2011© Author(s) 2011. CC Attribution 3.0 License.
AtmosphericChemistry
and Physics
Fossil versus contemporary sources of fine elemental and organiccarbonaceous particulate matter during the DAURE campaign inNortheast Spain
M. C. Minguill on1,2, N. Perron1,*, X. Querol2, S. Szidat3,4, S. M. Fahrni1,3,4, A. Alastuey2, J. L. Jimenez5,6, C. Mohr1,A. M. Ortega6,7, D. A. Day5,6, V. A. Lanz1, L. Wacker8, C. Reche2, M. Cusack2, F. Amato2, G. Kiss9, A. Hoffer9,S. Decesari10, F. Moretti 10, R. Hillamo11, K. Teinil a11, R. Seco12,** , J. Penuelas12, A. Metzger13, S. Schallhart13,M. M uller13, A. Hansel13, J. F. Burkhart 14, U. Baltensperger1, and A. S. H. Prevot1
1Paul Scherrer Institut, Laboratory of Atmospheric Chemistry, 5232 Villigen PSI, Switzerland2Institute of Environmental Assessment and Water Research (IDAEA), CSIC, 08034 Barcelona, Spain3Dept. of Chemistry and Biochemistry, University of Bern, 3012 Berne, Switzerland4Oeschger Centre for Climate Change Research, University of Bern, 3012 Berne, Switzerland5Dept. of Chemistry and Biochemistry, University of Colorado, Boulder, CO, USA6Cooperative Institute for Research in Environmental Sciences (CIRES), USA7Dept. of Atmospheric and Oceanic Science, University of Colorado, Boulder, CO, USA8Laboratory of Ion Beam Physics, ETH Honggerberg, 8093 Zurich, Switzerland9Air Chemistry Group of the Hungarian Academy of Sciences, University of Pannonia, 8201 Veszprem, Hungary10Institute for Atmospheric Sciences and Climate (ISAC), CNR, Bologna, Italy11Finnish Meteorological Institute, Air Quality Research, 00101 Helsinki, Finland12Unitat d’Ecologia Global CREAF-CEAB-CSIC, Centre de Recerca Ecologica i Aplicacions Forestals (CREAF),Universitat Autonoma de Barcelona, 08193 Bellaterra, Barcelona, Spain13Institute of Ion Physics and Applied Physics, Innsbruck University, 6020 Innsbruck, Austria14Norwegian Institute for Air Research (NILU), 2027 Kjeller, Norway* now at: Dept. of Nuclear Physics, University of Lund, 221 00 Lund, Sweden** now at: Atmospheric Chemistry Division, National Center for Atmospheric Research, Boulder, CO 80301, USA
Received: 26 July 2011 – Published in Atmos. Chem. Phys. Discuss.: 19 August 2011Revised: 28 October 2011 – Accepted: 16 November 2011 – Published: 6 December 2011
Abstract. We present results from the international fieldcampaign DAURE (Determination of the sources of atmo-spheric Aerosols in Urban and Rural Environments in theWestern Mediterranean), with the objective of apportion-ing the sources of fine carbonaceous aerosols. Submicronfine particulate matter (PM1) samples were collected dur-ing February–March 2009 and July 2009 at an urban back-ground site in Barcelona (BCN) and at a forested regionalbackground site in Montseny (MSY). We present radiocar-bon (14C) analysis for elemental and organic carbon (ECand OC) and source apportionment for these data. Wecombine the results with those from component analysisof aerosol mass spectrometer (AMS) measurements, and
Correspondence to:M. C. Minguillon([email protected])
compare to levoglucosan-based estimates of biomass burn-ing OC, source apportionment of filter data with inorganiccomposition + EC + OC, submicron bulk potassium (K) con-centrations, and gaseous acetonitrile concentrations.
At BCN, 87 % and 91 % of the EC on average, in win-ter and summer, respectively, had a fossil origin, whereasat MSY these fractions were 66 % and 79 %. The con-tribution of fossil sources to organic carbon (OC) at BCNwas 40 % and 48 %, in winter and summer, respectively,and 31 % and 25 % at MSY. The combination of results ob-tained using the14C technique, AMS data, and the correla-tions between fossil OC and fossil EC imply that the fos-sil OC at Barcelona is∼47 % primary whereas at MSY thefossil OC is mainly secondary (∼85 %). Day-to-day vari-ation in total carbonaceous aerosol loading and the relativecontributions of different sources predominantly dependedon the meteorological transport conditions. The estimated
Published by Copernicus Publications on behalf of the European Geosciences Union.

12068 M. C. Minguillon et al.: Fossil vs. contemporary sources of fine EC and OC
biogenic secondary OC at MSY only increased by∼40 %compared to the order-of-magnitude increase observed forbiogenic volatile organic compounds (VOCs) between win-ter and summer, which highlights the uncertainties in theestimation of that component. Biomass burning contribu-tions estimated using the14C technique ranged from simi-lar to slightly higher than when estimated using other tech-niques, and the different estimations were highly or moder-ately correlated. Differences can be explained by the contri-bution of secondary organic matter (not included in the pri-mary biomass burning source estimates), and/or by an over-estimation of the biomass burning OC contribution by the14C technique if the estimated biomass burning EC/OC ratioused for the calculations is too high for this region. Acetoni-trile concentrations correlate well with the biomass burningEC determined by14C. K is a noisy tracer for biomass burn-ing.
1 Introduction
Ambient aerosols have adverse effects on human health (e.g.,Nel, 2005; Pope and Dockery, 2006; Krzyzanowski and Co-hen, 2008). They also affect climate through their direct (ab-sorption and scattering) and indirect (cloud interactions) ef-fects on the Earth’s radiative balance (Forster et al., 2007),ecosystems and crops through their deposition of acids, tox-ics, and nutrients (e.g., Matson et al. 2002; Grantz et al.,2003), and regional visibility (e.g., Watson, 2002).
Submicron particulate matter (PM1, particles with an aero-dynamic diameter<1 µm) contains substantial fractions ofcarbonaceous aerosol (Murphy et al., 2006; Jimenez et al.,2009). Carbonaceous aerosol comprises a wide variety of or-ganic compounds, collectively referred to as organic matter(OM), elemental carbon (EC), and carbonate mineral dust,the latter typically being negligible in submicron aerosolsince it is mainly present in the coarse fraction (Sillanpaaet al., 2005).
Carbonaceous aerosols are responsible for some of theadverse effects on human health produced by particles (Liet al., 2003; Mauderly and Chow, 2008). Some organiccompounds are respiratory irritants (such as carbonyls andacids), carcinogens (such as polycyclic aromatic hydrocar-bons (PAHs)), and toxins (Mauderly and Chow, 2008). ECinduces respiratory and cardiovascular problems (Highwoodand Kinnersley, 2006; and references therein) and may ad-sorb toxic or carcinogenic organic species which may thenbe absorbed into lung tissue (Gerde et al., 2001).
An accurate knowledge of the sources of EC and OM isnecessary to design strategies aimed at mitigating the ef-fects of aerosols. Known sources of carbonaceous aerosolsare biomass, biofuel, and waste burning, residential heat-ing, cooking, fossil-fuel combustion (including road traf-fic emissions), and biogenic emissions (Hildemann et al.,
1994; Schauer et al., 1996). Biogenic emissions contributeto primary organic aerosol (POA) and secondary organicaerosol (SOA), which is formed from biogenic gases such asisoprene and monoterpenes. Biogenic POA is dominantly inthe supermicron mode while biogenic SOA is concentratedin the submicron mode (Poschl et al., 2010).
Radiocarbon (14C) analysis is a powerful tool used tohelp apportion the sources of carbonaceous aerosols (Cur-rie, 2000; Szidat, 2009), due to its ability to differentiate be-tween aerosol carbon arising from contemporary and fossilsources. In contemporary carbonaceous sources14C is foundat levels similar to those in CO2 in the present-day atmo-sphere, or higher for sources of “stored carbon” such as woodburning. In contrast, in fossil sources, whose age greatly ex-ceeds the half-life of14C (5730 years),14C has completelydecayed. The radiocarbon content of a carbonaceous sampleis expressed as the “fraction of modern carbon” (fM), andis referenced to the ratio14C/12C in atmospheric CO2 in theyear 1950 (Stuiver and Polach, 1977):
fM =(14C/12C)sample
(14C/12C)AD1950(1)
Values of fM range from zero for fossil sources to more thanone for contemporary sources. The fM for contemporarysources exceeds unity due to the atmospheric nuclear weapontests in the 1950s and 1960s that significantly increased theradiocarbon content of the atmosphere (Levin et al., 2010).Here we will use the term “modern carbon” only to refer tomeasurements relative to the 1950 standard, and the terms“contemporary” or “non-fossil,” and “fossil” carbon to referto quantities after correction of the excess bomb radiocarbon.Since EC and OC may have different sources, source appor-tionment of EC and OC separately (as opposed to only totalcarbon, TC) provides additional valuable information.
Several previous studies have reported contemporary andfossil fractions of carbonaceous aerosols in urban and ruralEuropean areas in PM1, PM2.5, PM10 and Total SuspendedParticles (TSP, Table 1). In urban areas, EC was found tobe 84–97 % fossil in summer or spring and 30–91 % fossilin winter or autumn, whereas the OC fraction was 28–47 %fossil in summer or spring and 32–45 % fossil in winter orautumn. In rural areas, the ranges are very wide, EC was27–97 % fossil and OC was 9–58 % fossil in any season.In general, the fossil contribution in rural areas was usuallylower than the equivalent urban area for both EC and OC. Fornearly all sites, the fossil contribution was larger in EC thanin OC, and it was more important in summer than in winterfor EC, whereas for OC the difference between summer andwinter was variable, probably due to the different influencesof biogenic emissions depending on the site. Other studiesin Asian areas such as the Maldives, West India and Japanreported lower fossil contributions to black carbon (BC, 31–58 %, Table 1) and lower or similar fossil contributions toOC (6–38 %, Table 1). This is probably a consequence of themore common use of biomass burning for cooking in Asia
Atmos. Chem. Phys., 11, 12067–12084, 2011 www.atmos-chem-phys.net/11/12067/2011/

M. C. Minguillon et al.: Fossil vs. contemporary sources of fine EC and OC 12069
with respect to Europe. Finally, in Mexico City the fossilcontribution to OC was higher than that found in Europeanor Asian areas (49–62 %), even during high-fire periods (Ta-ble 1).
The present study is part of the international field cam-paign DAURE (Determination of the sources of atmosphericAerosols in Urban and Rural Environments in the WesternMediterranean) (Pandolfi et al., 2011b; Jorba et al., 2011;http://tinyurl.com/daure09). The objective of DAURE is tostudy the causes of regional scale aerosol pollution episodesduring winter and summer in the Western MediterraneanBasin (WMB). The WMB presents unique atmospheric dy-namics regulated by complex climatic and orographic effectswhich control the concentration, composition and transportof PM (Mill an et al., 1997). In general, in summertime,local circulation dominates the atmospheric dynamics overthe WMB, enhancing the regional accumulation of pollu-tants and the stratification of polluted air masses (Millan etal., 1997). In winter, the inflow of clean Atlantic air massesinto the WMB favors the reduction of pollution levels. How-ever, during some periods characterized by winter anticy-clonic conditions, pollution from the coast and valleys isaccumulated due to thermal inversions persisting for a fewdays. After several days under anticyclonic conditions localupslope breezes can be driven by solar radiation pushing pol-luted air masses from the valley towards rural mountainousareas, thereby markedly increasing the PM levels in the ru-ral mountainous areas (Perez et al., 2008a; Pey et al., 2009,2010). Specific scenarios during the campaign are describedlater. Together with these transport scenarios, the large emis-sions from the densely populated and industrialized areas,sporadic forest fires, and large shipping emissions give rise toa complex phenomenology for aerosol formation and trans-formation.
In this context, the present work focuses on characterizingthe sources of fine carbonaceous aerosols, by using the14Cmethod and comparing it to results from other apportionmentmethods such as receptor modeling of filter PM measure-ments (inorganic composition, EC and OC concentrations)and Aerosol Mass Spectrometer (AMS) data, and biomassburning source estimates from levoglucosan measurements.This is the first time that these techniques have been appliedsimultaneously in the Mediterranean region.
2 Methodology
2.1 Sampling
Two sampling sites were selected: Barcelona (BCN), an ur-ban background site (41◦23′24′′ N 02◦06′58′′ E, 80 m a.s.l.),and Montseny (MSY), a forested regional background site50 km away from Barcelona (41◦46′46′′ N 02◦21′29′′ E,720 m a.s.l.), which is part of the European Supersite forAtmospheric Aerosol Research (EUSAAR) network (http:
//www.eusaar.net). Sampling was carried out during two dif-ferent seasons: February–March 2009, called the DAUREwinter campaign (DAURE-W), and July 2009, called theDAURE summer campaign (DAURE-S).
Submicron fine particulate matter (PM1) samples werecollected on quartz fiber filters (Munktell in DAURE-W andPallflex 2500QAT-UP in DAURE-S) using DIGITEL (DH-77 in DAURE-W and DHA-80 in DAURE-S) high volume(30 m3 h−1) samplers with a PM1 impactor inlet. Samplingperiods were 48 h in winter and 24 h in summer. We at-tempted to minimize artefacts after sampling by keepingthe samples at−20◦C after sampling and prior to analysis.With the instrumentation deployed during this study it is notpossible to estimate the possible sampling artefacts, whichare both positive (capture of semivolatile gases in the filter)and negative (evaporation of semivolatile particle species).For quartz filters one might rather expect positive artefacts.Those are however not expected to be very large at high OCloadings. Here we assume that the possible sampling arte-facts (evaporated or condensed material) have the same fM asthat of the original particle material, i.e. we assumed that theartefacts do not affect the fM results. From all samples col-lected, 7 samples from each site were selected from DAURE-W and 6 from DAURE-S. These 26 samples were used for14C analysis. Selection of the samples was based upon si-multaneous availability of samples at both sites, preliminaryresults (at the time of sample selection) from AMS measure-ments (only winter), and the EC and OC concentrations, toinvestigate different atmospheric scenarios. Two blank filterswere processed and analyzed following the same methodol-ogy as the collected samples and concentrations were sub-tracted to those found for the samples in order to calculatethe ambient concentrations. All the concentrations are re-ported under ambient temperature and pressure conditions.
NOx concentrations were measured at both sites by con-ventional gas phase air pollution monitors (Thermo Scien-tific, Model 42i) by the Department of the Environment ofthe Generalitat de Catalunya.
2.2 Analyses of EC and OC and intercomparison
EC and OC concentrations were determined using the 26samples collected for14C analysis plus the two blank filtersby a thermo-optical method with a Sunset OC/EC Field An-alyzer (RT 3080, Sunset Laboratory Inc., USA), which wasused off-line (Bae et al., 2004). The EUSAAR2 protocol(Cavalli et al., 2010) was used. These results will be referredto as Sunset1. Blank OC concentrations were 4–23 % (11 %on average) of the sample concentrations and blank EC con-centrations were below 0.1 % of the sample concentrations.These Sunset1 concentrations of EC and OC were comparedto other measurements:
– EC and OC concentrations measured by a differentSunset OC/EC analyzer (laboratory model) using the
www.atmos-chem-phys.net/11/12067/2011/ Atmos. Chem. Phys., 11, 12067–12084, 2011

12070 M. C. Minguillon et al.: Fossil vs. contemporary sources of fine EC and OC
EUSAAR2 protocol. In DAURE-S, the analysis wascarried out on the same filters used for Sunset1. InDAURE-W, it was carried out on PM1 12 h samples col-lected on quartz fiber filters (Munktell) using high vol-ume (30 m3 h−1) samplers (DIGITEL DHA-80). Theseresults will be referred to as Sunset2.
– EC and OC concentrations measured by gauge pressurein a calibrated volume during the EC and OC separationand collection for subsequent14C analysis (Szidat et al.,2004b, see description in Sect. 2.3).
– OC concentrations calculated from OM concentrationsmeasured by AMS (method details in Aiken et al.,2008) in DAURE-W. The calculations were done usingOM:OC ratios determined by high-resolution analysisof the AMS mass spectra. On average, the OM:OC ratiowas 1.6 at BCN and 2.0 at MSY. The specific OM:OCratios for different OA components were very similar:1.29 at MSY and 1.21 at BCN for hydrocarbon-like or-ganic aerosol (HOA); 1.52 at MSY and 1.53 at BCN forbiomass burning organic aerosol (BBOA); 2.04 at MSYfor oxygenated organic aerosol (OOA) and 1.61 (semi-volatile OOA, SV-OOA) and 2.14 (low-volatility OOA,LV-OOA) at BCN.
– EC concentrations measured by the Sunset instrumentduring the CO2 collection for14C measurements corre-sponding to the third stage of the thermal program, asexplained in Sect. 2.3.
– Black carbon concentrations measured by a Multi An-gle Absorption Photometer (MAAP) with a PM10 in-let. Absorption coefficients used were 10.4 m2 g−1 and9.2 m2 g−1 for MSY and BCN, respectively (Pandolfi etal., 2011a; Reche et al., 2011)
The results are generally consistent within the uncertaintiesin the different measurements, especially in terms of trends,while some differences in the absolute magnitudes are ap-parent (Fig. S1). At BCN the bulk OC from the AMS wassubstantially higher than that measured by the rest of the in-struments (Fig. S1), which we attribute to higher than usualuncertainties in the calibration of that instrument due to cus-tom modifications of the ionization region. Therefore abso-lute concentrations of OC from different sources calculatedbased on these different measurements should be comparedwith caution, while fractional contributions should be moredirectly comparable. In the following, the EC and OC con-centrations used are those measured by the Sunset1 instru-ment (using the samples collected for14C analysis), unlessotherwise specified. Associated error bars of EC and OCmeasured by Sunset1 lower than 20 % of the concentrationwere increased to 20 % to better reflect the uncertainty inthe measurements, shown by the differences among differ-ent methods (Fig. S1) and based on round-robin tests within
the EUSAAR project (EUSAAR Deliverable NA2/D10 newreport).
2.3 Separation of carbonaceous fractions and14Cmeasurements
The method for the separation of carbonaceous particle frac-tions is based on the different chemical and thermal behaviorof OC and EC in the presence of oxygen gas as shown by La-vanchy et al. (1999). This separation is complicated by thefact that there is not a clear boundary between OC and EC,since OC compounds are less volatile and more optically ab-sorptive with increasing molecular weight and functionality;and the least refractory part of EC may show similar chemi-cal and physical behavior as high molecular weight OC. Theseparation method has been described in detail elsewhere(Szidat et al., 2004a). Briefly, OC is oxidized on a filter at340◦C in a stream of pure oxygen for 10 min. Evolved CO2is trapped cryogenically, quantified manometrically in a cali-brated volume, and sealed in ampoules for14C measurement.Using this method, part of the OC pyrolyses on the filter toform refractory material (an artifact known as “charring”)and is therefore not collected. This approach assumes iden-tical fM of the measured and the neglected fraction, whichwas shown to be correct for “Urban Dust” in NIST referencematerial SRM 1649a (Szidat et al., 2004b). The uncertaintydue to this loss of OC can be estimated as 0.03 (absolutevalue) of fMOC. This is based on an estimation of∼20 %of OC losses and fMEC measurements with and without wa-ter extraction prior to CO2 collection (Szidat et al., 2004a).Therefore, the uncertainties reported here take into accountthe14C measurement uncertainty (see explanation in the endof this section) and this charring uncertainty of 0.03.
Isolation of EC for accurate14C determination targets acomplete removal of OC prior to EC collection with the bestpossible EC recovery. Since the modern fractions of EC andOC can differ significantly (e.g. Szidat et al., 2004a, 2009),incomplete OC removal could bias the result of the fM in theEC fraction (fMEC). For this study, a new method for EC col-lection (modified from that described by Szidat et al., 2004a)developed in our laboratory was used. A detailed descriptioncan be found in the Supplementary Material (Sect. S3 andS4, Figs. S2, S3 and S4). Briefly, water extraction is carriedout prior to separation and EC collection, so that water sol-uble organic and inorganic compounds are removed (Szidatet al., 2004a, 2009). This minimizes a possible positive arti-fact due to the aforementioned OC charring during the firstthermal steps (to remove OC). This charring would produceadditional EC-like material, which would be combusted andcollected during the EC step at 650◦C. This new method in-cludes the coupling of a Sunset instrument to the cryo-trapsystem (as opposed to an oven with a fixed temperature withthe Szidat et al. (2004a) method), so that the thermal cyclesare defined accurately (see Supp. Material). The combus-tion process is carried out under pure oxygen. The thermal
Atmos. Chem. Phys., 11, 12067–12084, 2011 www.atmos-chem-phys.net/11/12067/2011/

M. C. Minguillon et al.: Fossil vs. contemporary sources of fine EC and OC 12071
Table 1. Compilation of literature values of % fossil carbon in different fractions and sites and results from the present study.
Reference Fraction Location Comments EC method∗ EC or BC OC TC
Szidat et al., 2006 PM10 Zurich urban summer Theodore 94 31winter 75 32spring 88 28
Szidat et al., 2007 PM10 Alpine Valleys winter Theodore 29–96 9–28Szidat et al., 2007 PM1 Alpine Valleys spring Theodore 27–82 9–58Perron et al., 2010 PM10 Industrial Alpine Valley winter Theodore 53–82 16–45Szidat et al., 2009 PM10 Sweden urban summer Theodore 84–97 31–47
winter 87–91 35–45Szidat et al., 2009 PM2.5 Sweden rural winter Theodore 64–70 35–40Zencak et al., 2007 TSP Sweden background winter BC, CTO375 12Zencak et al., 2007 TSP Sweden urban winter BC, CTO375 30Andersson et al., 2011 TSP Sweden background winter BC, CTO375 62
autumn 55Andersson et al., 2011 TSP Sweden urban winter BC, CTO375 57
autumn 65Gilardoni et al., 2011 PM2.5 Italy rural year None, 52 22
calculated indirectlyGelencser et al., 2007 PM2.5 Aveiro, Portugal, rural winter None, 17 20
summer calculated indirectly 92 17Gelencser et al., 2007 PM2.5 Puy de Dome, winter None, 94 26
France, elevated rural summer calculated indirectly 97 14Gelencser et al., 2007 PM2.5 Schauinsland, winter None, 86 15
Germany, elevated rural summer calculated indirectly 95 17Gelencser et al., 2007 PM2.5 Sonnblick (Austrian Alps), winter None, 80 29
free troposphere summer calculated indirectly 95 16Gelencser et al., 2007 PM2.5 K-Puszta, Hungary, rural winter None, 59 25
summer calculated indirectly 90 10Gustaffson et al., 2009 TSP Maldives rural winter BC, CTO375 31Gustaffson et al., 2009 TSP West India mountain spring BC, CTO375 36Handa et al., 2010 PM10 Okinawa Island, Japan Asian dust event BC, CTO375 59 38
(spring)non Asian dust BC, CTO375 33 6event (spring)
Aiken et al., 2010 PM1 Mexico City low fire – 62 72(winter-spring)high fire – 49 59(winter-spring)
This study PM1 Barcelona urban summer Modified 91 48winter 87 40
This study PM1 Montseny rural summer Modified 79 25winter 66 31
∗ Method for isolating the elemental carbon: Theodore method (Szidat et al., 2004a and b) has yields of 60–80 % of the total EC determinedby thermo-optical methods; BC, CTO375 method (Gustafsson et al., 1997 and 2001) recovers a fraction called BC, having yields of around10 % of the total EC determined by thermo-optical methods.
www.atmos-chem-phys.net/11/12067/2011/ Atmos. Chem. Phys., 11, 12067–12084, 2011

12072 M. C. Minguillon et al.: Fossil vs. contemporary sources of fine EC and OC
program is set to minimize a possible negative artifact result-ing from removal of the least refractory part of EC in thefirst thermal steps prior to EC collection. This method al-lows us to collect more EC compared to the 60–80 % recov-ery obtained with the Szidat et al. (2004a) method and thefM obtained are thus more representative of the complete ECfraction. The EC recovery was on average 90 % and 86 %for DAURE-W and DAURE-S, respectively. A rough esti-mate of the uncertainty generated by the 10–14 % EC losswould be an underestimation of fMEC by 0.02–0.04 (Perron,2010), which results in<5 % (absolute percent) possible un-derestimation of the biomass burning EC contribution. Thispossible bias in the fMEC should be taken only as an esti-mate and therefore it is discussed here but not included in thecalculations.
The samples from the MSY summer campaign had verylow EC concentrations. Therefore six individual combus-tions of each of the samples were carried out and the CO2collected was combined for a single subsequent14C analy-sis.
After the separation and collection of OC and EC as CO2samples,14C analyses were performed at ETH Zurich withthe Accelerator Mass Spectrometer MICADAS using a gasion source (Ruff et al., 2007, 2010). The fM for each sam-ple was then blank subtracted using an average of the fM ofthe two blank filters analyzed, and taking into account theamount of C analyzed in each sample and in the blank filters.fM measurement uncertainty was calculated based on the Ac-celerator Mass Spectrometer sample and blank uncertaintiesand the amounts of C analyzed. On average, fMOC measure-ment uncertainty was 2.4 % and 4 % of the correspondingfMOC for winter and summer, respectively; and fMEC mea-surement uncertainty was 6 % and 28 % of the correspondingfMEC for winter and summer, respectively.
2.4 Source apportionment of EC and OC using14Cdata
Source apportionment of EC and OC is based on their con-centrations,14C isotopic ratios of these two components, andthe expected fM of the corresponding sources. The refer-ence values for the different sources used in the present studyare fMf = 0 (for fossil sources); fMbb = 1.083 (for biomassburning), corresponding to emissions from burning of 25-year-old trees harvested in 2007–2008 as determined with atree-growth model (Mohn et al., 2008); and fMbio = 1.045(for biogenic sources), corresponding to 2008–2009 fromthe long-term series of atmospheric14CO2 measurements atJungfraujoch research station (Levin et al., 2010). In the caseof EC, the fM of non-fossil sources (fMnf) equals fMbb giventhat biomass burning is the only source of non-fossil EC. Inthe case of OC, fMnf is assumed to be the average of fMbband fMbio, given that the fractions from biomass burningand from biogenic sources are not known a priori, and bothsources are thought to play a role in this region. An iterative
procedure could be used to refine the initial estimates. Itwould consist of calculating fMnf based on the fractions ofbiogenic and biomass burning contributions derived from theanalysis, and using fMnf to the initial calculations, recalcu-lating the fractions of biogenic and biomass burning contri-butions, and with those recalculate fMnf, and keep doing sountil the recalculated fMnf shows a very small change withrespect to the previous iteration. However the subsequentdifferences in the results are small, especially compared tothe measurement and method uncertainties, and such a pro-cedure is not used here.
EC is apportioned into ECf and ECnf, the former at-tributed to combustion of fossil fuel and the latter attributedto biomass burning (ECbb). ECf can be mainly attributedto road traffic according to previous studies that found thatEC in Barcelona is mainly related to road traffic emissions(Perez et al., 2010). Residential heating as a source of ECf isnot expected to be very high in the study area due to moder-ate average temperatures during DAURE-W (13.3± 2.8◦Cin Barcelona and 9.5± 4.0◦C in Montseny; Pandolfi et al.,2011b), and due to the fact that only 9 % of the residen-tial heating in Barcelona uses solid or liquid fossil fuel, therest uses natural gas (62 %), electricity (28 %), wood (0.4 %)and other minor systems (0.2 %) (INE, 2001). Other sourcessuch as shipping may also make a contribution to ECf inBarcelona, although their contribution to PM was found tobe relatively low (approximately 20 % of the contribution ofvehicular exhaust emissions; Amato et al., 2009).
OC is separated into OCf and OCnf. OCf is attributed toPOA and SOA from fossil fuel combustion. As per ECf , thecontribution of residential heating to OCf is expected to below. As discussed before, OCnf may have different origins,such as biomass burning POA and SOA, as well as biogenicSOA. However, some other sources such as cooking, biofuelcombustion, brake lining dust, natural rubber in tire dust, andothers may account for a substantial fraction of the total con-temporary carbon, especially in urban areas (Hildemann etal., 1994). In particular several recent studies report a highfraction of cooking aerosol in urban areas (Zheng et al., 2007;Allan et al., 2010; Huang et al., 2010; Sun et al., 2011). Wefirst present results as OCnf, without differentiating betweenbiomass burning OC (OCbb), biogenic OC (OCbio), and otherOCnf sources.
In a second step, which allows for comparison with re-sults from other methods, the contribution of biomass burn-ing to OC is estimated based on an assumed ratio for EC/OCin biomass burning emissions (EC/OC)bbe, together with theECbb determined by14C:
OCbb =ECbb
(EC/OC)bbe(2)
Nevertheless, the wide range of (EC/OC)bbe ratios found inliterature (Table S1) leads to high uncertainties in the esti-mation of OCbb. The (EC/OC)bbe ratio depends on manyfactors, such as the biofuel type and the combustion method
Atmos. Chem. Phys., 11, 12067–12084, 2011 www.atmos-chem-phys.net/11/12067/2011/

M. C. Minguillon et al.: Fossil vs. contemporary sources of fine EC and OC 12073
used. For calculations here, an average (EC/OC)bbe ratioof 0.3 was used, based upon the reported values for com-mon biofuel species in the Mediterranean, with similar com-bustion methods to those used in Spain (Fine et al., 2004;Goncalves et al., 2010), and agricultural fires (Chow et al.,2010). SOA formation from biomass burning emissions isquite variable, and a recent summary of seven field studiesreports that the net addition of OA mass due to SOA for-mation averages to 25 % of the POA (Cubison et al., 2011).Therefore SOA formation from biomass burning emissionsmay lead to a∼20 % underestimation of the OCbb on aver-age.
2.5 Other source apportionment methods and biomassburning tracers
Results from three other methods are used here for com-parison with the14C-based method for DAURE-W. First,measurements of levoglucosan, an organic tracer of biomassburning (Simoneit et al., 1999) are used. Levoglucosan wasdetermined using the same filters used for14C analyses (PM148 h samples) by two methods: gas chromatography-massspectrometry (Agilent 6890N gas chromatograph coupledto a mass spectrometer Agilent 5973N) by the HungarianAcademy of Sciences (lev-HAS), and by proton nuclear mag-netic resonance (HNMR, Tagliavini et al., 2006) by the In-stitute of Atmospheric Sciences and Climate of the ItalianNational Research Council (lev-ISAC). There are two addi-tional data sets of levoglucosan concentrations (Supp. Mate-rial Sect. S5 and Fig. S5) measured by different laboratories,but in this work we used the average of the concentrationsof lev-HAS and lev-ISAC as they are consistent with eachother, and for maximum overlap with the14C dataset.
The contribution of primary OC from biomass burningcan be estimated from levoglucosan concentrations togetherwith the levoglucosan/OC ratio in biomass burning emissions(lev/OC)bbe:
OCbb =lev
(lev/OC)bbe(3)
However, the variability of (lev/OC)bbe ratio in the literatureis large (Table S1), and the data available for Europe, com-pared to the US, is scarce (Szidat et al., 2009 and referencestherein), which results in substantial uncertainty for the re-sults from this method. It is also known that levoglucosan canbe oxidized photochemically in the atmosphere (Henniganet al., 2010; Cubison et al., 2011) and that it can evaporatedue to its semi-volatile character (Oja and Suuberg, 1999).Thus estimates from this method using ratios measured forconcentrated primary emissions should be considered lowerlimits. An average (lev/OC)bbe ratio of 0.12 was used (Fineet al., 2004; Schmidl et al., 2008; Sullivan et al., 2008; Szi-dat et al., 2009; Goncalves et al., 2010; Saarnio et al., 2010).Nevertheless, given the wide range of ratios reported in the
literature, uncertainties were calculated to cover the ratiosranging from 0.07 to 0.17.
A second method used here for the estimation of OMsources, including OMbb, is based on factor analysis of AMSmeasurements. Two high-resolution AMSs were deployed atthe BCN and MSY sites (Mohr et al., 2011; Pandolfi et al.,2011b). The AMS instruments, data processing, and analy-sis techniques have been described in detail elsewhere (De-Carlo et al., 2006; Canagaratna et al., 2007). Positive MatrixFactorization (PMF) of the organic mass spectral data ma-trix provides information on different sources/componentsof the OA (Lanz et al., 2007; Ulbrich et al., 2009), suchas hydrocarbon-like organic aerosol (HOA), used as a sur-rogate for urban combustion POA, BBOA as a surrogatefor POA from biomass burning, and oxygenated OA (OOA)as a surrogate for total SOA. As discussed above, biomassburning emissions can give rise to SOA from organic gasesand also from semi-volatile species from the evaporation ofthe POA (DeCarlo et al., 2010; Cubison et al., 2011). TheSOA formed from biomass burning emissions produces sim-ilar mass spectra to SOA from other sources (Jimenez et al.,2009) and thus it is lumped together in the oxygenated OA(OOA) factor. The details of the PMF methods and resultsfor BCN can be found in Mohr et al. (2011). For MSY, PMFwas performed on the organicm/z vs. time matrix using thePMF2.exe program and analyzed with the PMF EvaluationTool (PET,http://tinyurl.com/PMF-guide) according to theprocedures described on Ulbrich et al. (2009). 771 resolv-able ions were fitted in the high-resolution analysis software,PIKA, for m/z 10–206, and were used in the PMF analy-sis. An 8-factor solution (FPEAK=0) was used since this wasthe lowest number of factors at which the HOA and BBOAfactors showed a clear separation from each other and fromOOA. Six factors were recombined to make up the OOA fac-tor. The BBOA and HOA factors used here are those fromthe 8-factor solution. More details can be found in the Supp.Material (Sect. S6).
The third method used to estimate the biomass burningcontribution is based on receptor modeling of offline filterPM1 data. The offline dataset is discussed in detail else-where (Pandolfi et al., 2011b). Briefly, 12 h PM1 sampleswere collected on quartz fiber filters (Munktell) using DIGI-TEL DHA-80 high volume (30 m3 h−1) samplers. Major andtrace elements, some ions, and nitrate, sulfate, ammoniumand chloride concentrations were determined following theprocedure described in Querol et al. (2001). OC and EC con-centrations were measured by a Sunset laboratory instrument(results inter-compared in Sect. 2.2, reported as Sunset2).Positive Matrix Factorization (PMF by means of the ME-2scripting; Paatero, 1999; Amato et al., 2009) was applied tothis dataset. Species included in the PMF can be found inFig. S6. Results are referred to in this study as PMF-OF (OFstanding for offline filter dataset). Details on the receptormodel and individual uncertainties are available in Amato etal. (2009). This method provides, among other data products,
www.atmos-chem-phys.net/11/12067/2011/ Atmos. Chem. Phys., 11, 12067–12084, 2011

12074 M. C. Minguillon et al.: Fossil vs. contemporary sources of fine EC and OC
an estimate of the biomass burning contribution to bulk sub-micron OC. Nevertheless, the model was not able to identifythe biomass burning source in BCN, as explained in Sect. 3.7.At MSY, the solution chosen had 6 factors (mineral, anthro-pogenic, sea salt, biomass burning, secondary sulfate, andsecondary nitrate). The source profile of the biomass burn-ing source can be found in Fig. S6.
Finally, the correlations of the different biomass burningOA estimates and tracers with ECbb (which is the most di-rect biomass burning tracer) were evaluated. PMF-AMSBBOA was used for DAURE-W. Levoglucosan concentra-tions (average of lev-HAS and lev-ISAC data sets) were usedfor DAURE-W. Acetonitrile concentrations measured by aHigh Sensitivity Proton Transfer Reaction Quadrupole MassSpectrometer (PTR-MS; Lindinger et al., 1998) at BCN inDAURE-W and DAURE-S, and by a Proton Transfer Reac-tion Time of Flight (PTR-TOF, Graus et al., 2010; Mulleret al., 2010) at MSY in DAURE-W were used. Submi-cron potassium (K) concentrations were used for DAURE-Wand DAURE-S. K concentrations were part of the PMF-OFdataset discussed above (Pandolfi et al., 2011b). Soluble Kconcentrations were determined in water extractions of thesame samples and they were very similar to total K concen-trations. Hence, total K concentrations were used. Althoughsome biomass burning estimates reported in literature arebased on K, several recent studies have concluded that fineK can in some instances be dominated by other sources andcan be a poor tracer for biomass burning (Zhang et al., 2010;Aiken et al., 2010).
3 Results and discussion
3.1 EC and OC concentrations
The carbonaceous aerosol at BCN and MSY during theDAURE campaigns showed differences in concentration,fractional composition, and source influences (Figs. 1 and 2).At BCN, the contribution of EC to total carbon was substan-tially higher than at MSY both in DAURE-W and DAURE-S,representing, on average, 32–37 % at BCN and 15–16 % atMSY. Conversely, the OC fractional contribution was higherat MSY than at BCN (Fig. 1), although the absolute concen-trations of OC were higher at BCN (Fig. 2) during DAURE-W, and similar to those at MSY in DAURE-S. OC/EC aver-age ratios (1.7–2.1 at BCN and 5.3–5.8 at MSY) were similarand lower, respectively, than those reported by previous stud-ies at the same sampling sites (2.5 for PM1 at BCN and 11for PM2.5 at MSY; Perez et al., 2008b; Pey et al., 2009).
3.2 EC sources
During the winter period, ECf accounted for 87± 1 % (aver-age± propagated measurement uncertainty of only14C mea-surements) of EC at BCN, whereas at MSY this percentagewas 66± 3 %. In summertime, these values were 91± 1 %and 79± 4 % at BCN and MSY, respectively. As explained
DAURE-Winter DAURE-Summer
BCN1.4; 28%
1.3; 27%
2.0; 41%
0.21; 4%
0.10; 3%
1.05; 33%
0.95; 30%
1.08; 34%
MSY
0.22; 10%
0.6; 26%
1.2; 59%
0.11; 5%
0.24; 12%
0.4; 21%
1.3; 64%
0.06; 3%
ECnf ECf OCf OCnfECnf ECf OCf OCnf
Figure 1 Fig. 1. Fossil (f) and non-fossil (nf) fractions of total carbon; con-
centrations in µg m−3 and % of total carbon.
0.0
0.5
1.0
1.5
2.0
2.5
winter winter summer summer
BCN MSY BCN MSY
µg m
-3
ECnf ECf OCf OCnfECnf ECf OCf OCnf
Figure 2
Fig. 2. Average absolute concentrations of the fossil (f) and non-fossil (nf) fractions of EC and OC (µg m−3).
above, ECf is attributed to fossil fuel combustion, mostlyroad traffic, and ECnf to biomass burning.
The high contribution of fossil fuel combustion to EC con-centrations in BCN is in agreement with Perez et al. (2010)and Reche et al. (2011), who found that black carbonconcentrations varied mainly according to road traffic con-ditions. In both seasons, the ECf contribution to EC at theurban site is higher than at the rural site, as expected. In ab-solute values, the difference is larger. ECf at BCN was 6.3times higher than at MSY in winter and 4.5 times higher in
Atmos. Chem. Phys., 11, 12067–12084, 2011 www.atmos-chem-phys.net/11/12067/2011/

M. C. Minguillon et al.: Fossil vs. contemporary sources of fine EC and OC 12075
summer (Fig. 2). This is consistent with the BCN/MSY ra-tios found for NOx concentrations, 9 and 6 for winter andsummer, respectively, although the instruments do not mea-sure purely NOx and also include some of the more oxidizednitrogen species (NOz, Steinbacher et al., 2007; Dunlea etal., 2007). Assuming that a substantial fraction of the NOx atMSY comes from the coastal polluted regions similar to theBCN urban area, these ratios can be considered estimates ofthe dilution of urban and regional pollution during transportto MSY. CO concentrations were not available for compar-ison. The fact that the ratios are higher for NOx than ECis consistent with the fact that NOx is a reactive tracer witha lifetime on the order of 1 day and some of the reactionproducts (HNO3) deposit very quickly to the surface and arenot sampled by NOx analyzers, while EC is unreactive. Thehigher contributions of ECnf in winter with respect to sum-mer are likely due to higher emissions from residential heat-ing and open burning of agricultural biomass (banned by lawfrom 15 March to 15 October, Spanish Decreto 64/1995), aswild fires are expected to make a low contribution, with theexception of infrequent short impact periods (Fig. S7).
3.3 Fossil vs. contemporary OC
During the winter period, OCf (thought to be mainly due toroad traffic, as explained above) was 40± 4 % of OC at BCNand 31± 4 % at MSY. These values are similar to those ob-tained during winter at Zurich, Switzerland (32 % OCf /OC,Szidat et al., 2006), and at Goteborg, Sweden (35–45 % at anurban site and 35–40 % at a rural site, Szidat et al., 2009).A priori, it could be expected that fossil sources may havea higher influence in Spain due to the lesser use of woodburning for residential heating (less than 1 % of the heatingenergy, INE, 2001). On the other hand, biogenic SOA maybe higher under milder Spanish winter conditions comparedto Switzerland or Sweden since the temperatures are higher,and biogenic volatile organic compounds (VOCs) emissionsstill occur in winter albeit at lower intensity than in summer(Seco et al., 2011). Therefore the differences in both sourcesmay compensate each other, leading to similar OCf fractions.
In summer OCf was 48± 4 % of OC at BCN and 25± 5 %at MSY; this again being comparable to contributions atGoteborg, Sweden, in summer (31–47 %, Szidat et al., 2009).Summer results for BCN (with the highest OCf fraction fromthe present study) are comparable to results from MexicoCity (49–62 %, Aiken et al., 2010). Absolute OCf concentra-tions in winter were higher than in summer (by 0.4 µg m−3)
at BCN. This was likely due to stronger accumulation of pol-lutants during the cold season with lower atmospheric dis-persion, and perhaps to higher fossil combustion such as forresidential heating.
At MSY, OC concentrations were similar for both sea-sons (Fig. 2). The ratio BCN/MSY for OCf concentrationswas 2.1–2.4, which is lower than the corresponding ratiofor ECf mentioned above (4.5–6.3). This is consistent with
formation of fossil SOA during transport from urban and re-gional sources to the MSY site, and also consistent with thehigher NOx ratios discussed above. Further evidence is pro-vided by the comparison of the ratios of OCf /ECf for bothsites. The average ratio± standard deviation (variability)was 1.0± 0.1 in winter and 0.9± 0.2 in summer at BCN, and2.6± 0.7 in winter and 1.8± 0.5 in summer at MSY. The er-ror for MSY in summer (0.5) is the propagated measurementuncertainty, since no variability is available because therewas only one pooled sample for EC. The low variability ofthe ratios in BCN suggests that the OCf is mainly primary, orthat the secondary fraction changes little, e.g. if it is formedfast enough (Robinson et al., 2007; Chirico et al., 2010) sothat it still correlates with the ECf . This is also supportedby the good correlation between OCf and ECf (R2
= 0.81,Fig. S8). At MSY the larger ratios indicate that a substan-tial fraction of the OCf may be due to fossil SOA formationdriven by photochemical reactions during the transport to therural site. The larger variability of the OCf /ECf at MSY, al-though partially due to the relatively high measurement un-certainty, indicates that the formation of fossil SOA may bemore variable. The difference in the ratio in winter and sum-mer at MSY is not significant due to the high uncertainties.
OCnf at BCN was twice as high in winter than in summer.This can be attributed to a higher contribution of biomassburning and reduced mixing in winter with respect to sum-mer in the Barcelona region, as indicated by the fact that ECnfwas also twice as high in winter. At MSY, OCnf was simi-lar in summer and winter, despite the lower biomass burn-ing contribution in summer as evidenced by the lower ECnf.This can likely be explained by a higher contribution of bio-genic SOA in summer, due to higher biogenic emissions andenhanced photochemistry. Seco et al. (2011) report sum-mer/winter ratios of∼10 for biogenic VOCs ambient con-centrations at the rural site.
3.4 Further source apportionment of the non-fossil OC
OCnf can be apportioned to the different sources with someadditional assumptions. The estimations carried out in thepresent study include biomass burning (OCbb), biogenicSOA (OCbio) and other non-fossil contributions called inthis study as urban non-fossil OC (OCurb−nf), such as cook-ing and tire wear. Results are shown in Fig. 3. OCbb wasestimated with the method described in Sect. 2.4 (Eq. 2).OCbb is estimated to account for 30–35 % of the OCnf atboth sites and seasons (17–21 % of total OC), with the ex-ception of MSY in summer, where it only accounted for16 % of the OCnf (12 % of total OC). The contributionfrom OCurb−nf was calculated from the OCf contribution,based on the assumption that OCurb−nf is ∼20 % of thetotal urban OC contribution (OCf + OCurb−nf) (Hildemannet al., 1994; Hodzic et al., 2010). OCurb−nf was estimatedas 0.2–0.3 µg m−3 at BCN, which is 16–23 % of the OCnf(10–12 % of total OC). At MSY, the OCurb−nf was lower(0.14 and 0.11 µg m−3 in winter and summer, respectively,
www.atmos-chem-phys.net/11/12067/2011/ Atmos. Chem. Phys., 11, 12067–12084, 2011
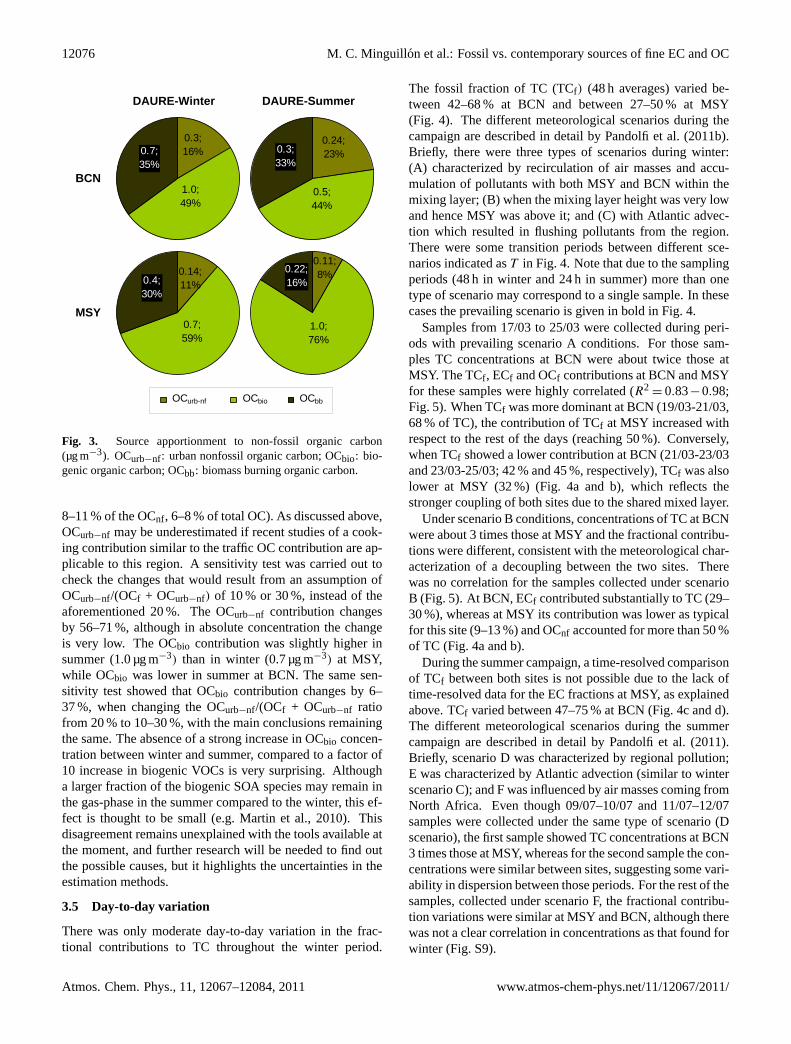
12076 M. C. Minguillon et al.: Fossil vs. contemporary sources of fine EC and OC
DAURE-Winter DAURE-Summer
BCN
0.3; 16%0.7;
35%
1.0; 49%
0.24; 23%0.3;
33%
0.5; 44%
MSY
0.14; 11%0.4;
30%
0.7; 59%
0.11; 8%0.22;
16%
1.0; 76%
OCurb-nf OCbio OCbbOCurb-nf OCbio OCbb
Figure 3 Fig. 3. Source apportionment to non-fossil organic carbon
(µg m−3). OCurb−nf: urban nonfossil organic carbon; OCbio: bio-genic organic carbon; OCbb: biomass burning organic carbon.
8–11 % of the OCnf, 6–8 % of total OC). As discussed above,OCurb−nf may be underestimated if recent studies of a cook-ing contribution similar to the traffic OC contribution are ap-plicable to this region. A sensitivity test was carried out tocheck the changes that would result from an assumption ofOCurb−nf/(OCf + OCurb−nf) of 10 % or 30 %, instead of theaforementioned 20 %. The OCurb−nf contribution changesby 56–71 %, although in absolute concentration the changeis very low. The OCbio contribution was slightly higher insummer (1.0 µg m−3) than in winter (0.7 µg m−3) at MSY,while OCbio was lower in summer at BCN. The same sen-sitivity test showed that OCbio contribution changes by 6–37 %, when changing the OCurb−nf/(OCf + OCurb−nf ratiofrom 20 % to 10–30 %, with the main conclusions remainingthe same. The absence of a strong increase in OCbio concen-tration between winter and summer, compared to a factor of10 increase in biogenic VOCs is very surprising. Althougha larger fraction of the biogenic SOA species may remain inthe gas-phase in the summer compared to the winter, this ef-fect is thought to be small (e.g. Martin et al., 2010). Thisdisagreement remains unexplained with the tools available atthe moment, and further research will be needed to find outthe possible causes, but it highlights the uncertainties in theestimation methods.
3.5 Day-to-day variation
There was only moderate day-to-day variation in the frac-tional contributions to TC throughout the winter period.
The fossil fraction of TC (TCf) (48 h averages) varied be-tween 42–68 % at BCN and between 27–50 % at MSY(Fig. 4). The different meteorological scenarios during thecampaign are described in detail by Pandolfi et al. (2011b).Briefly, there were three types of scenarios during winter:(A) characterized by recirculation of air masses and accu-mulation of pollutants with both MSY and BCN within themixing layer; (B) when the mixing layer height was very lowand hence MSY was above it; and (C) with Atlantic advec-tion which resulted in flushing pollutants from the region.There were some transition periods between different sce-narios indicated asT in Fig. 4. Note that due to the samplingperiods (48 h in winter and 24 h in summer) more than onetype of scenario may correspond to a single sample. In thesecases the prevailing scenario is given in bold in Fig. 4.
Samples from 17/03 to 25/03 were collected during peri-ods with prevailing scenario A conditions. For those sam-ples TC concentrations at BCN were about twice those atMSY. The TCf , ECf and OCf contributions at BCN and MSYfor these samples were highly correlated (R2
= 0.83−0.98;Fig. 5). When TCf was more dominant at BCN (19/03-21/03,68 % of TC), the contribution of TCf at MSY increased withrespect to the rest of the days (reaching 50 %). Conversely,when TCf showed a lower contribution at BCN (21/03-23/03and 23/03-25/03; 42 % and 45 %, respectively), TCf was alsolower at MSY (32 %) (Fig. 4a and b), which reflects thestronger coupling of both sites due to the shared mixed layer.
Under scenario B conditions, concentrations of TC at BCNwere about 3 times those at MSY and the fractional contribu-tions were different, consistent with the meteorological char-acterization of a decoupling between the two sites. Therewas no correlation for the samples collected under scenarioB (Fig. 5). At BCN, ECf contributed substantially to TC (29–30 %), whereas at MSY its contribution was lower as typicalfor this site (9–13 %) and OCnf accounted for more than 50 %of TC (Fig. 4a and b).
During the summer campaign, a time-resolved comparisonof TCf between both sites is not possible due to the lack oftime-resolved data for the EC fractions at MSY, as explainedabove. TCf varied between 47–75 % at BCN (Fig. 4c and d).The different meteorological scenarios during the summercampaign are described in detail by Pandolfi et al. (2011).Briefly, scenario D was characterized by regional pollution;E was characterized by Atlantic advection (similar to winterscenario C); and F was influenced by air masses coming fromNorth Africa. Even though 09/07–10/07 and 11/07–12/07samples were collected under the same type of scenario (Dscenario), the first sample showed TC concentrations at BCN3 times those at MSY, whereas for the second sample the con-centrations were similar between sites, suggesting some vari-ability in dispersion between those periods. For the rest of thesamples, collected under scenario F, the fractional contribu-tion variations were similar at MSY and BCN, although therewas not a clear correlation in concentrations as that found forwinter (Fig. S9).
Atmos. Chem. Phys., 11, 12067–12084, 2011 www.atmos-chem-phys.net/11/12067/2011/
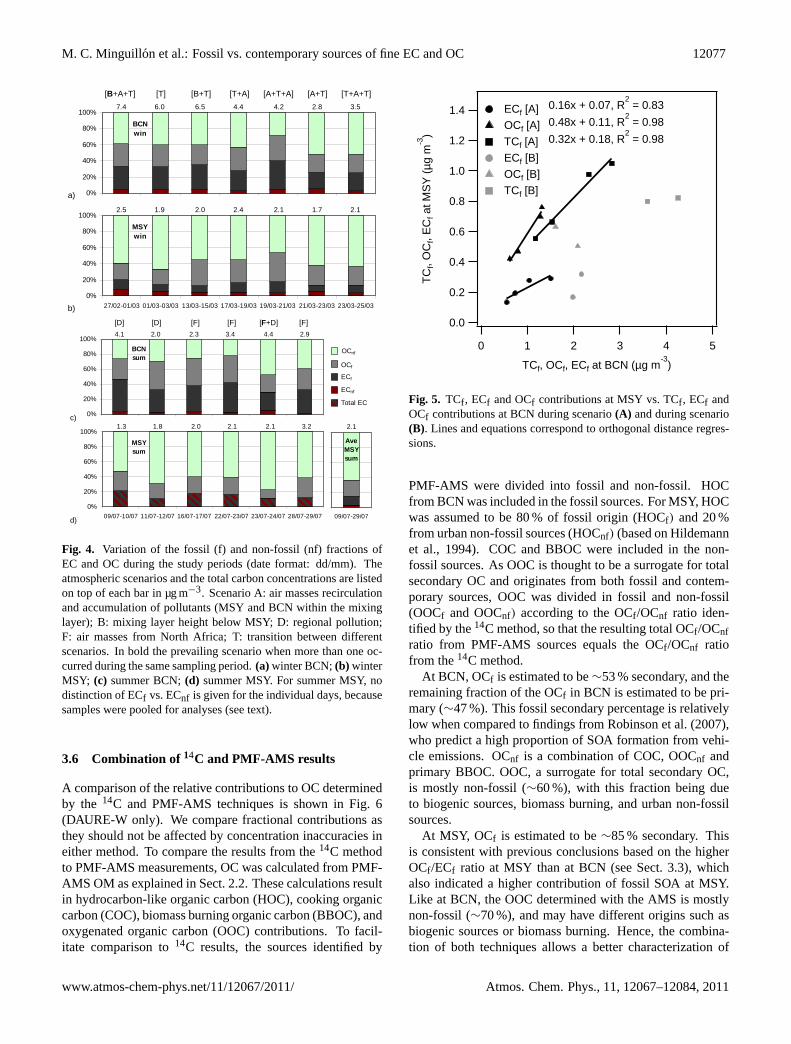
M. C. Minguillon et al.: Fossil vs. contemporary sources of fine EC and OC 12077
[B+A+T] [T] [B+T] [T+A] [A+T+A] [A+T] [T+A+T]
a) 0%
20%
40%
60%
80%
100%BCNwin
7.4 6.0 6.5 4.4 4.2 2.8 3.5
b) 0%
20%
40%
60%
80%
100%
27/02-01/03 01/03-03/03 13/03-15/03 17/03-19/03 19/03-21/03 21/03-23/03 23/03-25/03
MSYwin
2.5 1.9 2.0 2.4 2.1 1.7 2.1
Figure 4
[D] [D] [F] [F] [F+D] [F]
c) 0%
20%
40%
60%
80%
100%BCNsum
4.1 2.0 2.3 3.4 4.4 2.9
OCnf
OCf
ECf
ECnf
Total EC
OCnf
OCf
ECf
ECnf
d)
0%
20%
40%
60%
80%
100%
09/07-10/07 11/07-12/07 16/07-17/07 22/07-23/07 23/07-24/07 28/07-29/07
MSYsum
1.3 1.8 2.0 2.1 2.1 3.2
09/07-29/07
2.1
Ave MSYsum
Figure 4
Fig. 4. Variation of the fossil (f) and non-fossil (nf) fractions ofEC and OC during the study periods (date format: dd/mm). Theatmospheric scenarios and the total carbon concentrations are listedon top of each bar in µg m−3. Scenario A: air masses recirculationand accumulation of pollutants (MSY and BCN within the mixinglayer); B: mixing layer height below MSY; D: regional pollution;F: air masses from North Africa; T: transition between differentscenarios. In bold the prevailing scenario when more than one oc-curred during the same sampling period.(a) winter BCN;(b) winterMSY; (c) summer BCN;(d) summer MSY. For summer MSY, nodistinction of ECf vs. ECnf is given for the individual days, becausesamples were pooled for analyses (see text).
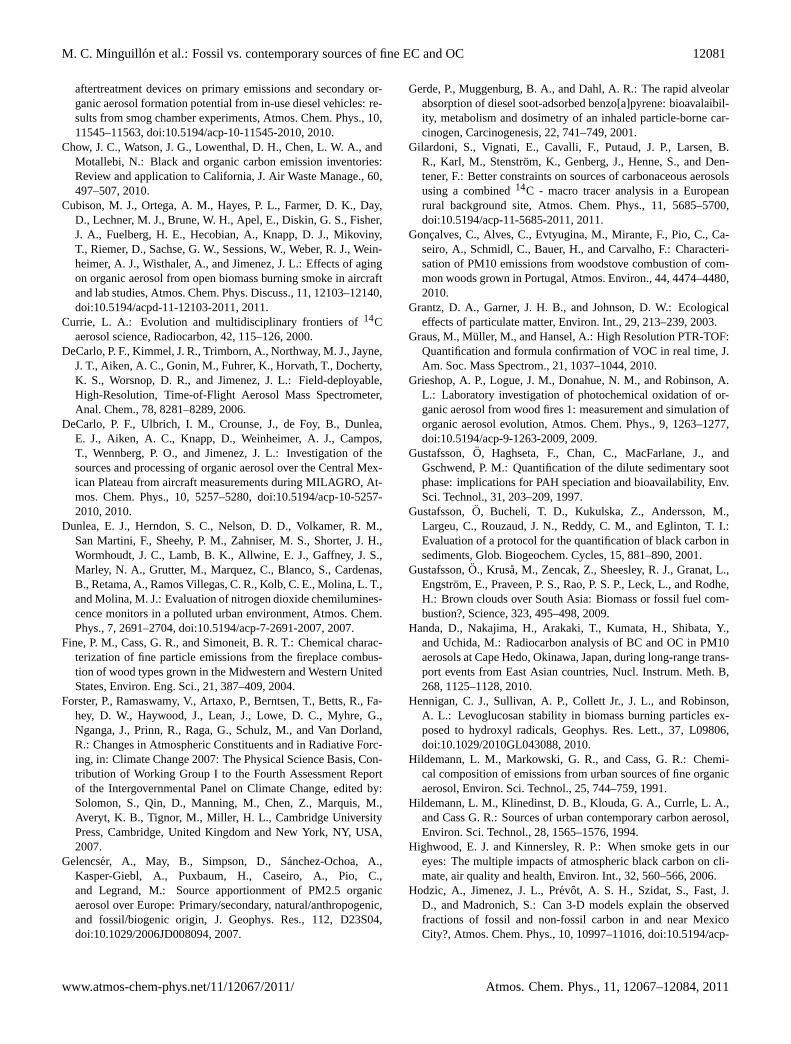
3.6 Combination of14C and PMF-AMS results
A comparison of the relative contributions to OC determinedby the 14C and PMF-AMS techniques is shown in Fig. 6(DAURE-W only). We compare fractional contributions asthey should not be affected by concentration inaccuracies ineither method. To compare the results from the14C methodto PMF-AMS measurements, OC was calculated from PMF-AMS OM as explained in Sect. 2.2. These calculations resultin hydrocarbon-like organic carbon (HOC), cooking organiccarbon (COC), biomass burning organic carbon (BBOC), andoxygenated organic carbon (OOC) contributions. To facil-itate comparison to14C results, the sources identified by
1.4
1.2
1.0
0.8
0.6
0.4
0.2
0.0
TCf,
OC
f, EC
f at M
SY (µ
g m
-3)
543210
TCf, OCf, ECf at BCN (µg m-3)
ECf [A] OCf [A] TCf [A] ECf [B] OCf [B] TCf [B]
0.16x + 0.07, R2 = 0.830.48x + 0.11, R2 = 0.980.32x + 0.18, R2 = 0.98
Figure 5
Fig. 5. TCf , ECf and OCf contributions at MSY vs. TCf , ECf andOCf contributions at BCN during scenario(A) and during scenario(B). Lines and equations correspond to orthogonal distance regres-sions.
PMF-AMS were divided into fossil and non-fossil. HOCfrom BCN was included in the fossil sources. For MSY, HOCwas assumed to be 80 % of fossil origin (HOCf) and 20 %from urban non-fossil sources (HOCnf) (based on Hildemannet al., 1994). COC and BBOC were included in the non-fossil sources. As OOC is thought to be a surrogate for totalsecondary OC and originates from both fossil and contem-porary sources, OOC was divided in fossil and non-fossil(OOCf and OOCnf) according to the OCf /OCnf ratio iden-tified by the14C method, so that the resulting total OCf /OCnfratio from PMF-AMS sources equals the OCf /OCnf ratiofrom the14C method.
At BCN, OCf is estimated to be∼53 % secondary, and theremaining fraction of the OCf in BCN is estimated to be pri-mary (∼47 %). This fossil secondary percentage is relativelylow when compared to findings from Robinson et al. (2007),who predict a high proportion of SOA formation from vehi-cle emissions. OCnf is a combination of COC, OOCnf andprimary BBOC. OOC, a surrogate for total secondary OC,is mostly non-fossil (∼60 %), with this fraction being dueto biogenic sources, biomass burning, and urban non-fossilsources.
At MSY, OCf is estimated to be∼85 % secondary. Thisis consistent with previous conclusions based on the higherOCf /ECf ratio at MSY than at BCN (see Sect. 3.3), whichalso indicated a higher contribution of fossil SOA at MSY.Like at BCN, the OOC determined with the AMS is mostlynon-fossil (∼70 %), and may have different origins such asbiogenic sources or biomass burning. Hence, the combina-tion of both techniques allows a better characterization of
www.atmos-chem-phys.net/11/12067/2011/ Atmos. Chem. Phys., 11, 12067–12084, 2011

12078 M. C. Minguillon et al.: Fossil vs. contemporary sources of fine EC and OC
BCN MSY
0.9
1.0
1.1
1.4
0.4
0%
10%
20%
30%
40%
50%
60%
70%
80%
90%
100%
AMS
0.3
0.9
0.6
1.2
0%
10%
20%
30%
40%
50%
60%
70%
80%
90%
100%
14C
FOSS
ILN
ON
-FO
SSIL
14C
0.08
0.4
1.0
0.12
HOCnf
0.02
0%
10%
20%
30%
40%
50%
60%
70%
80%
90%
100%
AMS
0.14
0.7
0.4
0.6
0%
10%
20%
30%
40%
50%
60%
70%
80%
90%
100%
14C
FOSS
ILN
ON
-FO
SSIL
14C
OCbbOCbioOCurb-nfOCf
OCbb
OCbio
OCurb-nf
OCf
BBOCOOCnfCOCOOCfHOC
OOCnf
OOCf
OCbbOCbioOCurb-nfOCf
OCbb
OCbio
OCurb-nf
OCf
BBOCOOCnfHOCnfOOCfHOCf
OOCnf
HOCnf
OOCf
HOCf Figure 6
Fig. 6. Relative source apportionment to organic carbon duringDAURE-W according to the14C technique and PMF results ofAMS measurements. Numbers indicate the absolute concentra-tions in µg m−3. BCN averages exclude 01/03–03/03 and 13/03–15/03 samples because of low availability of AMS data. HOC:hydrocarbon-like organic carbon; OOC: oxygenated organic car-bon (secondary); COC: cooking organic carbon; BBOC: primarybiomass burning organic carbon; OCurb−nf: urban non-fossil or-ganic carbon.
the carbonaceous aerosol sources, distinguishing the primaryand secondary contributions. These conclusions remain thesame if the aforementioned assumed 80 % fossil origin ofHOC changes from 70 % to 90 %.
3.7 Comparison of biomass burning OC determined bydifferent approaches
In Fig. 7 we compare the biomass burning OC (OCbb)
concentrations during winter estimated using the14C datawith those from several other techniques, including PMF-AMS, PMF-OF, and the tracer-based method using levoglu-cosan. Note that for the results from the PMF-AMS andlevoglucosan methods the concentrations refer to only pri-mary BBOC (Grieshop et al., 2009; DeCarlo et al., 2010).No biomass burning source was identified at BCN by PMF-OF although this technique enabled identification of such asource at MSY. Lack of identification at BCN may be due tothe presence of multiple additional sources, which compli-cate the identification of relatively small sources (the relativecontribution of BBOC to OC was lower than that at MSYaccording to AMS-PMF results).
Biomass burning contributions estimated by the14C tech-nique are similar or in most cases slightly higher than thosefrom other techniques, with the exception of the three firstsamples at BCN (Fig. 7). The difference compared to the
0.0
0.5
1.0
1.5
2.0
2.5
27/2-01/3 01/3-03/3 13/3-15/3 17/3-19/3 19/3-21/3 21/3-23/3 23/3-25/3 Average
Biom
ass
burn
ing
OC
(µg
m-3
)
14C PMF-AMS lev
BCN
* *
14C
0.0
0.2
0.4
0.6
0.8
1.0
27/2-01/3 01/3-03/3 13/3-15/3 17/3-19/3 19/3-21/3 21/3-23/3 23/3-25/3 Average
Biom
ass
burn
ing
OC
(µg
m-3
)
14C PMF-AMS lev PMF-OF
MSY
14C
Figure 7
Fig. 7. Concentrations of OC due to biomass burning (µg m−3)estimated with different methods: the14C technique, PMF-AMS,levoglucosan-tracer method, and PMF-OF. *: low AMS data avail-ability for the 48h period. Error bars in the14C technique accountfor the uncertainty of the14C method and the uncertainty of the(EC/OC)bbe ratio (from 0.2 to 0.4); error bars in the PMF-AMS arean estimation of the uncertainty of the biomass burning contribu-tion; error bars in the levoglucosan-tracer method reflect the vari-ability of the (lev/OC)bbe ratio from 0.07 to 0.17; error bars in thePMF-OF are standard deviation of the four 12h samples included ineach of the 48h average periods. Date format: dd/m.
AMS and levoglucosan results may be partially explained bythe presence of biomass burning SOC, which is not includedin the OCbb calculated using these methods, and would be ex-pected to be∼25 % of POA (Cubison et al., 2011). It is alsopossible that the biomass burning OC contribution estimatedby the 14C method is overestimated, if the (EC/OC)bbe as-sumed for our calculations is too low for the biomass burningtaking place in the study area. Nevertheless, the differentestimates follow the same time trend, with the exception ofPMF-OF. Thus it appears that PMF-OF is less accurate in theretrieval of this source. The biomass burning source profiledetermined by PMF-OF can be found in Fig. S6.
It is of interest to further evaluate the similarities of the dif-ferent biomass burning estimation methods and tracers, with-out the possible systematic uncertainties associated with theconversion factors used to estimate the OCbb from differenttracers (such as (EC/OC)bbe, (lev/OC)bbe, and OM/OC forbiomass burning). Scatter plots of the different tracers andestimates are shown in Fig. 8. BBOA estimated by PMF-AMS correlates well with ECbb (R2
= 0.83, using all sam-ples), as seen in Fig. 8a. The correlation of levoglucosanconcentrations with ECbb shows anR2
= 0.57 with a slopeof 0.20 using all samples (Fig. 8b). The slope is the lev/ECbb
Atmos. Chem. Phys., 11, 12067–12084, 2011 www.atmos-chem-phys.net/11/12067/2011/

M. C. Minguillon et al.: Fossil vs. contemporary sources of fine EC and OC 12079
a)
3.5
3.0
2.5
2.0
1.5
1.0
0.5
0.0
BB
OA
PM
F-A
MS
(µg
m-3
)
0.300.200.100.00
ECbb (µg m-3)
15.4x - 1.8R2 = 0.83
BCN MSY
b)
0.07
0.06
0.05
0.04
0.03
0.02
0.01
0.00
Levo
gluc
osan
(µg
m-3
)
0.300.200.100.00
ECbb (µg m-3)
0.20x - 0.006R2 = 0.57
BCN MSY
c)
0.7
0.6
0.5
0.4
0.3
0.2
0.1
0.0
Ace
toni
trile
(ppb
v)
0.300.200.100.00
ECbb (µg m-3)
2.4x - 0.17R2 = 0.67
BCN_win MSY_win BCN_sum
d)
0.35
0.30
0.25
0.20
0.15
0.10
0.05
0.00
K (µ
g m
-3)
0.300.200.100.00
ECbb (µg m-3)
0.58x + 0.04R2 = 0.51
BCN_win MSY_win BCN_sum MSY_sum
0.41x + 0.004R2 = 0.48
Figure 8
Fig. 8. Scatter plot of(a) biomass burning organic aerosol contri-bution estimated from PMF-AMS vs. biomass burning elementalcarbon estimated by14C method (ECbb) in DAURE-W; (b) lev-oglucosan concentrations (average of lev-HAS and lev-ISAC mea-surements) vs. ECbb in DAURE-W; (c) K concentrations vs. ECbbin DAURE-W (purple) and DAURE-S (green), error bars indicatemeasurement uncertainty, only shown for two data points for clar-ity; (d) acetonitrile concentrations vs. ECbb in DAURE-W; dottedline indicates typical continental background acetonitrile concen-trations (although lower background values are possible for air withrecent contact with the ocean). Correlation coefficients were calcu-lated using all data points shown in the plots. Regression lines werecalculated with orthogonal distance regressions.
ratio, which is in the lower range of the lev/ECbb valuesfound in the literature, which vary from 0.15 to 2 in mostcases (Schmidl et al., 2008; Sullivan et al., 2008; Goncalveset al., 2010; Saarnio et al., 2010), although much higher val-ues (up to 10 or 15) have also been reported (Fine et al., 2004;Sullivan et al., 2008). This may indicate lower initial emis-sion ratios, or some oxidation or evaporation of levoglucosanduring atmospheric transport.
Acetonitrile concentrations show correlation with ECbb(R2
= 0.67, Fig. 8c). Although concentrations at MSY wereclose to typical acetonitrile continental background concen-trations (e.g. Aiken et al., 2010), they are consistent with lowECbb concentrations.
K concentrations show lower correlation with ECbb forlow concentrations (Fig. 8d), withR2
= 0.51 in DAURE-W andR2
= 0.48 in DAURE-S. The winter data suggest thepresence of a background level of bulk K (intercept whenECbb=0) of ∼40 ng m−3, which may be due to sources otherthan biomass burning, such as food cooking (Hildemann etal., 1991; Schauer et al., 1999), vegetative detritus (Hilde-mann et al., 1991), fly ash (Lee and Pacyna 1999), and dust
such as feldspars and clay minerals. This is consistent withfindings by Zhang et al. (2010) and Aiken et al. (2010), andthe latter authors reported a background non-biomass burn-ing K concentration of∼120 ng m−3 in Mexico City. More-over, K emissions depend on the burning conditions. Theinfluence of cooking on the K concentrations is supported bythe higherR2 (0.74) found for multilinear regression of Kconcentrations vs. BBOA and COA concentrations found byPMF-AMS at BCN, compared to theR2 (0.54) for K con-centrations vs. BBOA. Nevertheless, the noise in the K datais quite high (see measurement uncertainty as error bars fortwo data points in Fig. 8c), which should be considered whenevaluating the robustness of the conclusions from these data.Therefore, given the moderate correlation of K with ECbband the high uncertainty in K concentrations, K is not the besttracer for biomass burning emissions for the present study.
4 Conclusions
The contribution of EC to TC at BCN was substantiallyhigher than at MSY both in the winter and the summer cam-paign. The OC contribution, although higher at MSY as afraction of TC, was higher at BCN in absolute concentration.
At BCN, 87 and 91 % of the EC, in winter and summer, re-spectively, had a fossil origin (mainly road traffic), whereasat MSY these percentages were 66 and 79 %, respectively.In absolute values, ECf at BCN was 4.5–6.3 times that atMSY, which is in agreement with dilution ratios estimatedfrom NOx concentrations. Higher concentrations of ECnfwere found in winter than summer and attributed to a higherbiomass burning contribution during winter.
The contribution of fossil sources to OC (mainly POA andSOA from road traffic) was 40 % at BCN and 31 % at MSY inwinter, and 48 % at BCN and 25 % at MSY in summer. Thesevalues are similar to those observed in Zurich, Switzerland,and in Goteborg, Sweden. The highest contribution of fossilsources to total carbon found in the present study is similarto the average values from Mexico City. The absolute OCfconcentrations in winter were slightly higher than in sum-mer at BCN due to stronger accumulation of pollutants dueto reduced dispersion, whereas at MSY the concentrationswere similar for both seasons. By combining results fromthe14C and PMF-AMS techniques, we can estimate that theOCf at BCN is∼47 % primary. The formation of secondaryOCf appears to be rapid enough that the OCf /ECf stays aboutconstant for the timescales of our samples. At MSY the OCfis mainly secondary (∼85 %), as determined both by the highOCf /ECf ratio at MSY, and the combination of14C and PMF-AMS results.
OCnf at BCN was higher in winter than in summer proba-bly due to a higher contribution of biomass burning. At MSY,OCnf was higher in summer which is explained by a highercontribution of biogenic emissions (partially offset by de-creased biomass burning). Nevertheless, the estimated bio-genic secondary OC does not increase proportionally to the
www.atmos-chem-phys.net/11/12067/2011/ Atmos. Chem. Phys., 11, 12067–12084, 2011

12080 M. C. Minguillon et al.: Fossil vs. contemporary sources of fine EC and OC
order-of-magnitude increase observed for biogenic volatileorganic compounds (VOCs) between winter and summer,which highlights the uncertainties in the estimation of thatcomponent.
There was moderate day-to-day variation throughout thestudy periods (with the fossil contribution to total carbon be-ing between 42–68 % at BCN and 27–50 % at MSY in win-ter, and between 47–75 % at BCN in summer), but the differ-ences between BCN and MSY in TC levels and source con-tributions depended largely on the meteorological conditions.Hence, during regional pollution accumulation episodes,concentrations and source distributions were similar at bothsites; whereas during stagnation episodes when the bound-ary layer was below the MSY sampling site, the sites weredecoupled and the total carbon levels and fossil sources con-tribution were higher at BCN than at MSY.
Biomass burning OC contributions estimated by the14Ctechnique were similar or slightly higher than those fromother techniques, nonetheless they were reasonably corre-lated. The difference with the PMF-AMS and levoglucosanmethod results could be partially explained by the contribu-tion of SOA formed from biomass burning emissions (notincluded in the OCbb from these methods), and/or an over-estimation of OCbb contribution due to a non-representativebiomass burning EC/OC ratio used for the calculations. Bulksubmicron K concentrations, although commonly used astracer for biomass burning, appear influenced by additionalsources other than biomass burning during winter, as ob-served in some previous studies. PMF-AMS BBOA and ace-tonitrile concentrations are the biomass burning markers thatcorrelate better with ECbb.
Supplementary material related to thisarticle is available online at:http://www.atmos-chem-phys.net/11/12067/2011/acp-11-12067-2011-supplement.pdf.
Acknowledgements.This work was supported by the AccionComplementaria DAURE CGL2007-30502-E/CLI, the GRACCIEproject CSD2007-00067, the VAMOS project CGL2010-19464/CLI, and the Departament de Medi Ambient i Habitatge ofthe Generalitat de Catalunya. This work was also supported by theEU FP6 project EUCAARI and the IMBALANCE project withinthe Centre of Competence for Environment and Sustainability(CCES). M. C. Minguillon was partially supported by a Postdoc-toral Grant in the frame of Programa Nacional de Movilidad deRecursos Humanos del Plan nacional de I-D+I 2008–2011 from theSpanish Ministry of Science and Innovation. D. A. Day, A. M. Or-tega, and J. L. Jimenez were partially supported by US NSF grantsATM-0920940 and ATM-0919189 (from Atm. Chem. and OISE –Office of International Science and Engineering), and by NOAAgrant NA08OAR4310565. A. M. Ortega was supported by DOESCGF (ARRA/ORISE/ORAU) Fellowship DE-AC05-06OR23100.J. Penuelas and R. Seco were supported by the Spanish Govern-ment projects CGL2010-17172 and Consolider Ingenio MontesCSD2008-00040, and by a postdoctoral grant from Fundacion
Ramon Areces to R. Seco. The National Center for AtmosphericResearch is sponsored by the National Science Foundation.
Edited by: A. Petzold
References
Aiken, A. C., Decarlo, P. F., Kroll, J. H., Worsnop, D. R., Huff-man, J. A., Docherty, K. S., Ulbrich, I. M., Mohr, C., Kimmel,J. R., Sueper, D., Sun, Y., Zhang, Q., Trimborn, A., Northway,M., Ziemann, P. J., Canagaratna, M. R., Onasch, T. B., Alfarra,M. R., Prevot, A. S. H., Dommen, J., Duplissy, J., Metzger,A., Baltensperger, U., and Jimenez, J. L.: O/C and OM/OC ra-tios of primary, secondary, and ambient organic aerosols withhigh-resolution time-of-flight aerosol mass spectrometry, Envi-ron. Sci. Technol., 42, 4478–4485, 2008.
Aiken, A. C., de Foy, B., Wiedinmyer, C., DeCarlo, P. F., Ul-brich, I. M., Wehrli, M. N., Szidat, S., Prevot, A. S. H., Noda,J., Wacker, L., Volkamer, R., Fortner, E., Wang, J., Laskin, A.,Shutthanandan, V., Zheng, J., Zhang, R., Paredes-Miranda, G.,Arnott, W. P., Molina, L. T., Sosa, G., Querol, X., and Jimenez,J. L.: Mexico city aerosol analysis during MILAGRO using highresolution aerosol mass spectrometry at the urban supersite (T0)Part 2: Analysis of the biomass burning contribution and thenon-fossil carbon fraction, Atmos. Chem. Phys., 10, 5315–5341,doi:10.5194/acp-10-5315-2010, 2010.
Allan, J. D., Williams, P. I., Morgan, W. T., Martin, C. L., Flynn,M. J., Lee, J., Nemitz, E., Phillips, G. J., Gallagher, M. W., andCoe, H.: Contributions from transport, solid fuel burning andcooking to primary organic aerosols in two UK cities, Atmos.Chem. Phys., 10, 647–668,doi:10.5194/acp-10-647-2010, 2010.
Amato, F., Pandolfi, M., Escrig, A., Querol, X., Alastuey, A., Pey,J., Perez, N., and Hopke, P. K.: Quantifying road dust resuspen-sion in urban environment by Multilinear Engine: a comparisonwith PMF2, Atmos. Environ., 43, 2770–2780, 2009.
Andersson, A., Sheesley, R. J., Krusa, M., Johansson, C., andGustafsson,O.: 14C-Based source assessment of soot aerosolsin Stockholm and the Swedish EMEP-Aspvreten regional back-ground site, Atmos. Environ., 45, 215–222, 2011.
Bae, M. S., Schauer, J. J., DeMinter, J. T., Turner, J. R., Smith,D., and Cary, R. A.: Validation of a semi-continuous instrumentfor elemental carbon and organic carbon using a thermal-opticalmethod, Atmos. Environ., 38, 2885–2893, 2004.
Canagaratna, M. R., Jayne, J. T., Jimenez, J. L., Allan, J. D., Al-farra, M. R., Zhang, Q., Onasch, T. B., Drewnick, F., Coe, H.,Middlebrook, A., Delia, A., Williams, L. R., Trimborn, A. M.,Northway, M. J., DeCarlo, P. F., Kolb, C. E., Davidovits, P., andWorsnop, D. R.: Chemical and microphysical characterization ofambient aerosols with the Aerodyne Aerosol Mass Spectrometer,Mass Spectrom. Rev., 26, 185–222, 2007.
Cavalli, F., Viana, M., Yttri, K. E., Genberg, J., and Putaud, J.-P.: Toward a standardised thermal-optical protocol for measuringatmospheric organic and elemental carbon: the EUSAAR proto-col, Atmos. Meas. Tech., 3, 79–89,doi:10.5194/amt-3-79-2010,2010.
Chirico, R., DeCarlo, P. F., Heringa, M. F., Tritscher, T., Richter,R., Prevot, A. S. H., Dommen, J., Weingartner, E., Wehrle,G., Gysel, M., Laborde, M., and Baltensperger, U.: Impact of
Atmos. Chem. Phys., 11, 12067–12084, 2011 www.atmos-chem-phys.net/11/12067/2011/
M. C. Minguillon et al.: Fossil vs. contemporary sources of fine EC and OC 12081
aftertreatment devices on primary emissions and secondary or-ganic aerosol formation potential from in-use diesel vehicles: re-sults from smog chamber experiments, Atmos. Chem. Phys., 10,11545–11563,doi:10.5194/acp-10-11545-2010, 2010.
Chow, J. C., Watson, J. G., Lowenthal, D. H., Chen, L. W. A., andMotallebi, N.: Black and organic carbon emission inventories:Review and application to California, J. Air Waste Manage., 60,497–507, 2010.
Cubison, M. J., Ortega, A. M., Hayes, P. L., Farmer, D. K., Day,D., Lechner, M. J., Brune, W. H., Apel, E., Diskin, G. S., Fisher,J. A., Fuelberg, H. E., Hecobian, A., Knapp, D. J., Mikoviny,T., Riemer, D., Sachse, G. W., Sessions, W., Weber, R. J., Wein-heimer, A. J., Wisthaler, A., and Jimenez, J. L.: Effects of agingon organic aerosol from open biomass burning smoke in aircraftand lab studies, Atmos. Chem. Phys. Discuss., 11, 12103–12140,doi:10.5194/acpd-11-12103-2011, 2011.
Currie, L. A.: Evolution and multidisciplinary frontiers of14Caerosol science, Radiocarbon, 42, 115–126, 2000.
DeCarlo, P. F., Kimmel, J. R., Trimborn, A., Northway, M. J., Jayne,J. T., Aiken, A. C., Gonin, M., Fuhrer, K., Horvath, T., Docherty,K. S., Worsnop, D. R., and Jimenez, J. L.: Field-deployable,High-Resolution, Time-of-Flight Aerosol Mass Spectrometer,Anal. Chem., 78, 8281–8289, 2006.
DeCarlo, P. F., Ulbrich, I. M., Crounse, J., de Foy, B., Dunlea,E. J., Aiken, A. C., Knapp, D., Weinheimer, A. J., Campos,T., Wennberg, P. O., and Jimenez, J. L.: Investigation of thesources and processing of organic aerosol over the Central Mex-ican Plateau from aircraft measurements during MILAGRO, At-mos. Chem. Phys., 10, 5257–5280,doi:10.5194/acp-10-5257-2010, 2010.
Dunlea, E. J., Herndon, S. C., Nelson, D. D., Volkamer, R. M.,San Martini, F., Sheehy, P. M., Zahniser, M. S., Shorter, J. H.,Wormhoudt, J. C., Lamb, B. K., Allwine, E. J., Gaffney, J. S.,Marley, N. A., Grutter, M., Marquez, C., Blanco, S., Cardenas,B., Retama, A., Ramos Villegas, C. R., Kolb, C. E., Molina, L. T.,and Molina, M. J.: Evaluation of nitrogen dioxide chemilumines-cence monitors in a polluted urban environment, Atmos. Chem.Phys., 7, 2691–2704,doi:10.5194/acp-7-2691-2007, 2007.
Fine, P. M., Cass, G. R., and Simoneit, B. R. T.: Chemical charac-terization of fine particle emissions from the fireplace combus-tion of wood types grown in the Midwestern and Western UnitedStates, Environ. Eng. Sci., 21, 387–409, 2004.
Forster, P., Ramaswamy, V., Artaxo, P., Berntsen, T., Betts, R., Fa-hey, D. W., Haywood, J., Lean, J., Lowe, D. C., Myhre, G.,Nganga, J., Prinn, R., Raga, G., Schulz, M., and Van Dorland,R.: Changes in Atmospheric Constituents and in Radiative Forc-ing, in: Climate Change 2007: The Physical Science Basis, Con-tribution of Working Group I to the Fourth Assessment Reportof the Intergovernmental Panel on Climate Change, edited by:Solomon, S., Qin, D., Manning, M., Chen, Z., Marquis, M.,Averyt, K. B., Tignor, M., Miller, H. L., Cambridge UniversityPress, Cambridge, United Kingdom and New York, NY, USA,2007.
Gelencser, A., May, B., Simpson, D., Sanchez-Ochoa, A.,Kasper-Giebl, A., Puxbaum, H., Caseiro, A., Pio, C.,and Legrand, M.: Source apportionment of PM2.5 organicaerosol over Europe: Primary/secondary, natural/anthropogenic,and fossil/biogenic origin, J. Geophys. Res., 112, D23S04,doi:10.1029/2006JD008094, 2007.
Gerde, P., Muggenburg, B. A., and Dahl, A. R.: The rapid alveolarabsorption of diesel soot-adsorbed benzo[a]pyrene: bioavalaibil-ity, metabolism and dosimetry of an inhaled particle-borne car-cinogen, Carcinogenesis, 22, 741–749, 2001.
Gilardoni, S., Vignati, E., Cavalli, F., Putaud, J. P., Larsen, B.R., Karl, M., Stenstrom, K., Genberg, J., Henne, S., and Den-tener, F.: Better constraints on sources of carbonaceous aerosolsusing a combined14C - macro tracer analysis in a Europeanrural background site, Atmos. Chem. Phys., 11, 5685–5700,doi:10.5194/acp-11-5685-2011, 2011.
Goncalves, C., Alves, C., Evtyugina, M., Mirante, F., Pio, C., Ca-seiro, A., Schmidl, C., Bauer, H., and Carvalho, F.: Characteri-sation of PM10 emissions from woodstove combustion of com-mon woods grown in Portugal, Atmos. Environ., 44, 4474–4480,2010.
Grantz, D. A., Garner, J. H. B., and Johnson, D. W.: Ecologicaleffects of particulate matter, Environ. Int., 29, 213–239, 2003.
Graus, M., Muller, M., and Hansel, A.: High Resolution PTR-TOF:Quantification and formula confirmation of VOC in real time, J.Am. Soc. Mass Spectrom., 21, 1037–1044, 2010.
Grieshop, A. P., Logue, J. M., Donahue, N. M., and Robinson, A.L.: Laboratory investigation of photochemical oxidation of or-ganic aerosol from wood fires 1: measurement and simulation oforganic aerosol evolution, Atmos. Chem. Phys., 9, 1263–1277,doi:10.5194/acp-9-1263-2009, 2009.
Gustafsson,O, Haghseta, F., Chan, C., MacFarlane, J., andGschwend, P. M.: Quantification of the dilute sedimentary sootphase: implications for PAH speciation and bioavailability, Env.Sci. Technol., 31, 203–209, 1997.
Gustafsson,O, Bucheli, T. D., Kukulska, Z., Andersson, M.,Largeu, C., Rouzaud, J. N., Reddy, C. M., and Eglinton, T. I.:Evaluation of a protocol for the quantification of black carbon insediments, Glob. Biogeochem. Cycles, 15, 881–890, 2001.
Gustafsson,O., Krusa, M., Zencak, Z., Sheesley, R. J., Granat, L.,Engstrom, E., Praveen, P. S., Rao, P. S. P., Leck, L., and Rodhe,H.: Brown clouds over South Asia: Biomass or fossil fuel com-bustion?, Science, 323, 495–498, 2009.
Handa, D., Nakajima, H., Arakaki, T., Kumata, H., Shibata, Y.,and Uchida, M.: Radiocarbon analysis of BC and OC in PM10aerosols at Cape Hedo, Okinawa, Japan, during long-range trans-port events from East Asian countries, Nucl. Instrum. Meth. B,268, 1125–1128, 2010.
Hennigan, C. J., Sullivan, A. P., Collett Jr., J. L., and Robinson,A. L.: Levoglucosan stability in biomass burning particles ex-posed to hydroxyl radicals, Geophys. Res. Lett., 37, L09806,doi:10.1029/2010GL043088, 2010.
Hildemann, L. M., Markowski, G. R., and Cass, G. R.: Chemi-cal composition of emissions from urban sources of fine organicaerosol, Environ. Sci. Technol., 25, 744–759, 1991.
Hildemann, L. M., Klinedinst, D. B., Klouda, G. A., Currle, L. A.,and Cass G. R.: Sources of urban contemporary carbon aerosol,Environ. Sci. Technol., 28, 1565–1576, 1994.
Highwood, E. J. and Kinnersley, R. P.: When smoke gets in oureyes: The multiple impacts of atmospheric black carbon on cli-mate, air quality and health, Environ. Int., 32, 560–566, 2006.
Hodzic, A., Jimenez, J. L., Prevot, A. S. H., Szidat, S., Fast, J.D., and Madronich, S.: Can 3-D models explain the observedfractions of fossil and non-fossil carbon in and near MexicoCity?, Atmos. Chem. Phys., 10, 10997–11016,doi:10.5194/acp-
www.atmos-chem-phys.net/11/12067/2011/ Atmos. Chem. Phys., 11, 12067–12084, 2011

12082 M. C. Minguillon et al.: Fossil vs. contemporary sources of fine EC and OC
10-10997-2010, 2010.Huang, X.-F., He, L.-Y., Hu, M., Canagaratna, M. R., Sun, Y.,
Zhang, Q., Zhu, T., Xue, L., Zeng, L.-W., Liu, X.-G., Zhang,Y.-H., Jayne, J. T., Ng, N. L., and Worsnop, D. R.: Highlytime-resolved chemical characterization of atmospheric submi-cron particles during 2008 Beijing Olympic Games using anAerodyne High-Resolution Aerosol Mass Spectrometer, Atmos.Chem. Phys., 10, 8933–8945,doi:10.5194/acp-10-8933-2010,2010.
INE (Instituto Nacional de Estadistica, Spanish National Instituteof Statistics), Censos de Poblacion y Viviendas 2001, Resultadosdefinitivos, 2001.
Jimenez, J. L., Canagaratna, M. R., Donahue, N. M., Prevot, A. S.H., Zhang, Q., Kroll, J. H., DeCarlo, P. F., Allan, J. D., Coe,H., Ng, N. L., Aiken, A. C., Docherty, K. S., Ulbrich, I. M.,Grieshop, A. P., Robinson, A. L., Duplissy, J., Smith, J. D., Wil-son, K. R., Lanz, V. A., Hueglin, C., Sun, Y. L., Tian, J., Laak-sonen, A., Raatikainen, T., Rautiainen, J., Vaattovaara, P., Ehn,M., Kulmala, M., Tomlinson, J. M., Collins, D. R., Cubison, M.J., Dunlea, E. J., Huffman, J. A., Onasch, T. B., Alfarra, M. R.,Williams, P., Bower, K., Kondo, Y., Schneider, J., Drewnick, F.,Borrmann, S., Weimer, S., Demerjian, K., Salcedo, D., Cottrell,L., Griffin, R., Takami, A., Miyoshi, T., Hatakeyama, S., Shi-mono, A., Sun, J. Y., Zhang, Y. M., Dzepina, K., Kimmel, J.R., Sueper, D., Jayne, J. T., Herndon, S. C., Trimborn, A. M.,Williams, L. R., Wood, E. C., Middlebrook, A. M. , Kolb, C.E., Baltensperger, U., and Worsnop, D. R.: Evolution of organicaerosols in the atmosphere, Science, 326, 1525–1529, 2009.
Jorba, O., Pandolfi, M., Spada, M., Baldasano, J. M., Pey, J.,Alastuey, A., Arnold, D., Sicard, M., Artinano, B., Revuelta,M. A., and Querol, X.: The DAURE field campaign: meteoro-logical overview, Atmos. Chem. Phys. Discuss., 11, 4953–5001,doi:10.5194/acpd-11-4953-2011, 2011.
Krzyzanowski, M. and Cohen, A.: Update of WHO air qualityguidelines, Air Qual. Atmos. Health, 1, 7–13, 2008.
Lanz, V. A., Alfarra, M. R., Baltensperger, U., Buchmann, B.,Hueglin, C., and Prevot, A. S. H.: Source apportionment ofsubmicron organic aerosols at an urban site by factor analyti-cal modelling of aerosol mass spectra, Atmos. Chem. Phys., 7,1503–1522,doi:10.5194/acp-7-1503-2007, 2007.
Lavanchy, V. M. H., Gaggeler, H. W., Nyeki, S., and Baltensperger,U.: Elemental carbon (EC) and black carbon (BC) measurementswith a thermal method and an aethalometer at the high-alpineresearch station Jungfraujoch, Atmos. Environ., 33, 2759–2769,1999.
Lee, D. S. and Pacyna, J. M.: An industrial emissions inventory ofcalcium for Europe, Atmos. Environ., 33, 1687–1697, 1999.
Levin, I., Naegler, T., Kromer, B., Diehl, M., Francey, R. J., Gomez-Pelaez, A. J., Steele, L. P., Wagenbach, D., Weller, R., and Wor-thy, D. E.: Observations and modelling of the global distributionand long-term trend of atmospheric14CO2, Tellus B, 62, 26–46,2010.
Li, N., Sioutas, C., Cho, A., Schmitz, D., Misra, C., Sempf, J.,Wang, M. Y., Oberley, T., Froines, J., and Nel, A.: Ultrafine par-ticulate pollutants induce oxidative stress and mitocondrial dam-age, Environ. Health Perspec., 111, 455–460, 2003.
Lindinger, W., Hansel, A., and Jordan, A.: On-line monitoring ofvolatile organic compounds at pptv levels by means of proton-transfer-reaction mass spectrometry (PTR-MS) – Medical appli-
cations, food control and environmental research, Int. J. MassSpectrom., 173, 191–241, 1998.
Martin, S. T., Andreae, M. O., Althausen, D., Artaxo, P., Baars, H.,Borrmann, S., Chen, Q., Farmer, D. K., Guenther, A., Gunthe,S. S., Jimenez, J. L., Karl, T., Longo, K., Manzi, A., Muller, T.,Pauliquevis, T., Petters, M. D., Prenni, A. J., Poschl, U., Rizzo,L. V., Schneider, J., Smith, J. N., Swietlicki, E., Tota, J., Wang, J.,Wiedensohler, A., and Zorn, S. R.: An overview of the Amazo-nian Aerosol Characterization Experiment 2008 (AMAZE-08),Atmos. Chem. Phys., 10, 11415–11438,doi:10.5194/acp-10-11415-2010, 2010.
Matson, P., Lohse, K. A., and Hall, S. J.: The globalization of nitro-gen deposition: Consequences for terrestrial ecosystems, Ambio,31, 113–119, 2002.
Mauderly, J. L. and Chow, J. C.: Health effects of organic aerosols,Inhal. Toxicol., 20, 257–288, 2008.
Mill an, M. M., Salvador, R., Mantilla, E., and Kallos, G.: Photoox-idant dynamics in the Mediterranean basin in summer: Resultsfrom European research projects, J. Geophys. Res., 102, 8811–8823,doi:10.1029/96JD03610, 1997.
Mohn, J., Szidat, S., Fellner, J., Rechberger, H., Quartier, R., Buch-mann, B., and Emmenegger, L.: Determination of biogenic andfossil CO2 emitted by waste incineration based on14CO2 andmass balances, Bioresource Technol., 99, 6471–6479, 2008.
Mohr, C., DeCarlo, P. F., Heringa, M. F., Chirico, R., Slowik, J.G., Richter, R., Reche, C., Alastuey, A., Querol, X., Seco, R.,Penuelas, J., Jimenez, J. L., Crippa, M., Zimmermann, R., Bal-tensperger, U., and Prevot, A. S. H.: Identification and quan-tification of organic aerosol from cooking and other sources inBarcelona using aerosol mass spectrometer data, Atmos. Chem.Phys. Discuss., 11, 27383–27420,doi:10.5194/acpd-11-27383-2011, 2011.
Muller, M., Graus, M., Ruuskanen, T. M., Schnitzhofer, R., Bam-berger, I., Kaser, L., Titzmann, T., Hortnagl, L., Wohlfahrt,G., Karl, T., and Hansel, A.: First eddy covariance flux mea-surements by PTR-TOF, Atmos. Meas. Tech., 3, 387–395,doi:10.5194/amt-3-387-2010, 2010.
Murphy, D. M., Cziczo, D. J., Froyd, K. D., Hudson, P. K., Matthew,B. M., Middlebrook, A. M., Peltier, R. E., Sullivan, A., Thomson,D. S., and Weber, R. J.: Single particle mass spectrometry oftropospheric aerosol particles, J. Geophys. Res., 111, D23S32,doi:10.1029/2006JD007340, 2006.
Nel A.: Air pollution-related illness: Effects of particles, Science,308, 804–806, 2005.
Oja, V. and Suuberg, E. M.: Vapor pressures and enthalpies of sub-limation of D-glucose, D-xylose, cellobiose, and levoglucosan,J. Chem. Eng. Data, 44, 26–29, 1999.
Paatero, P.: The Multilinear Engine – a table-driven least squaresprogram for solving multilinear problems, including the n-wayparallel factor analysis model, J. Comput. Graph. Stat., 8, 854–888, 1999.
Pandolfi, M., Cusack, M., Alastuey, A., and Querol, X.: Variabilityof aerosol optical properties in the Western Mediterranean Basin,Atmos. Chem. Phys., 11, 8189–8203,doi:10.5194/acp-11-8189-2011, 2011a.
Pandolfi, M., Querol, X., Alastuey, A., Jimenez, J., Jorba, O., Stohl,A., Comeron, A., Sicard, M., Pey, J, vanDrooge, B., and theDAURE team: Source and origin of PM in the Western Mediter-ranean Basin: An Overview of the DAURE campaign, in prepa-
Atmos. Chem. Phys., 11, 12067–12084, 2011 www.atmos-chem-phys.net/11/12067/2011/

M. C. Minguillon et al.: Fossil vs. contemporary sources of fine EC and OC 12083
ration, Atmos. Chem. Phys. Discuss., in prep., 2011b.Perez, N., Pey, J., Castillo, S., Viana, M., Alastuey, A., and Querol,
X.: Interpretation of the variability of levels of regional back-ground aerosols in the Western Mediterranean, Sci. Total Envi-ron., 407, 527–540, 2008a.
Perez, N., Pey, J., Querol, X., Alastuey, A., Lopez, J. M., andViana, M.: Partitioning of major and trace components in PM10–PM2.5–PM1 at an urban site in Southern Europe, Atmos. Envi-ron., 42, 1677–1691, 2008b.
Perez, N., Pey, J., Cusack, M., Reche, C., Querol, X., Alastuey,A., and Viana, M.: Variability of particle number, black carbonand PM10, PM2.5 and PM1 levels and speciation: Influence ofroad traffic emissions on urban air quality, Aerosol Sci. Tech.,44, 487–499, 2010.
Perron, N.: Radiocarbon-supported source apportionment of car-bonaceous aerosols, PhD Thesis, University of Bern, Bern, 2010.
Perron, N., Sandradewi, J., Alfarra, M. R., Lienemann, P., Gehrig,R., Kasper-Giebl, A., Lanz, V. A., Szidat, S., Ruff, M., Fahrni,S., Wacker, L., Baltensperger, U., and Prevot, A. S. H.: Com-position and sources of particulate matter in an industrialisedAlpine valley, Atmos. Chem. Phys. Discuss., 10, 9391–9430,doi:10.5194/acpd-10-9391-2010, 2010.
Pey, J., Perez, N., Castillo, S., Viana, M., Moreno, T., Pandolfi, M.,Lopez-Sebastian, J. M., Alastuey, A., and Querol., X.: Geochem-istry of regional background aerosols in the Western Mediter-ranean, Atmos. Res., 94, 422–435, 2009.
Pey, J., Perez, N., Querol, X., Alastuey, A., Cusack, M., and Reche,C.: Intense winter atmospheric pollution episodes affecting theWestern Mediterranean, Sci. Total Environ., 408, 1951–1959,2010.
Pope III, C. A. and Dockery, D. W.: Health effects of fine particulateair pollution: Lines that connect, J. Air Waste Manage., 56, 709–742, 2006.
Poschl, U., Martin, S. T., Sinha, B., Chen, Q., Gunthe, S. S.,Huffman, J. A., Borrmann, S., Farmer, D. K., Garland, R. M.,Helas, G., Jimenez, J. L., King, S. M., Manzi, A., Mikhailov, E.,Pauliquevis, T., Petters, M. D., Prenni, A. J., Roldin, P., Rose, D.,Schneider, J., Su, H., Zorn, S. R., Artaxo, P., and Andreae, M. O.:Rainforest aerosols as biogenic nuclei of clouds and precipitationin the Amazon, Science, 329, 1513–1516, 2010.
Querol, X., Alastuey, A., Rodrıguez, S., Plana, F., Mantilla, E., andRuiz, C. R.: Monitoring of PM10 and PM2.5 ambient air lev-els around primary particulate anthropogenic emission sources,Atmos. Environ., 35, 848–858, 2001.
Reche, C., Querol, X., Alastuey, A., Viana, M., Pey, J., Moreno, T.,Rodrguez, S., Gonzalez, Y., Fernandez-Camacho, R., de la Rosa,J., Dall’Osto, M., Prevot, A. S. H., Hueglin, C., Harrison, R. M.,and Quincey, P.: New considerations for PM, black carbon andparticle number concentration for air quality monitoring acrossdifferent European cities, Atmos. Chem. Phys., 11, 6207–6227,doi:10.5194/acp-11-6207-2011, 2011.
Robinson, A. L., Donahue, N. M., Shrivastava, M. K., Weitkamp,E. A., Sage, A. M., Grieshop, A. P., Lane, T. E., Pierce, J. R., andPandis, S. N.: Rethinking organic aerosols: Semivolatile emis-sions and photochemical aging, Science, 315, 1259–1262, 2007.
Ruff, M., Wacker, L., Gaggeler, H. W., Suter, M., Synal, H. A., andSzidat, S.: A gas ion source for radiocarbon measurements at 200kV, Radiocarbon, 49, 307–314, 2007.
Ruff, M., Szidat, S., Gaggeler, H. W., Suter, M., Synal, H. A., and
Wacker, L.: Gaseous radiocarbon measurements of small sam-ples, Nucl. Instrum. Meth. B, 268, 790–794, 2010.
Saarnio, K., Aurela, M., Timonen, H., Saarikoski, S., Teinila, K.,Makela, T., Sofiev, M., Koskinen, J., Aalto, P. P., Kulmala, M.,Kukkonen, J., and Hillamo, R.: Chemical composition of fineparticles in fresh smoke plumes from boreal wild-land fires inEurope, Sci. Total Environ., 408, 2527–2542, 2010.
Schauer, J. J., Rogge, W. F., Hildemann, L. M., Mazurek, M. A.,and Cass, G. R.: Source apportionment of airborne particulatematter using organic compounds as tracers, Atmos. Environ., 30,3837–3855, 1996.
Schauer, J. J., Kleeman, M. J., Cass, G. R., and Simoneit, B. R.T.: Measurement of emissions from air pollution sources, 1. C-1through C-29 organic compounds from meat charbroiling, Envi-ron. Sci. Technol., 33, 1566–1577, 1999.
Schmidl, C., Marr, I. L., Caseiro, A., Kotianova, P., Berner, A.,Bauer, H., Kasper-Giebl, A., and Puxbaum, H.: Chemical char-acterisation of fine particle emissions from wood stove combus-tion of common woods growing in mid-European Alpine regions,Atmos. Environ., 42, 126–141, 2008.
Seco, R., Penuelas, J., Filella, I., Llusia, J., Molowny-Horas, R.,Schallhart, S., Metzger, A., Muller, M., and Hansel, A.: Con-trasting winter and summer VOC mixing ratios at a forest site inthe Western Mediterranean Basin: the effect of local biogenicemissions, Atmos. Chem. Phys. Discuss., 11, 20389–20431,doi:10.5194/acpd-11-20389-2011, 2011.
Sillanpaa, M., Frey, A., Hillamo, R., Pennanen, A. S., and Salo-nen, R. O.: Organic, elemental and inorganic carbon in particu-late matter of six urban environments in Europe, Atmos. Chem.Phys., 5, 2869–2879,doi:10.5194/acp-5-2869-2005, 2005.
Simoneit, B. R. T., Schauer, J. J., Nolte, C. G., Oros, D. R., Elias, V.O., Fraser, M. P., Rogge, W. F., and Cass, G. R.: Levoglucosan, atracer for cellulose in biomass burning and atmospheric particles,Atmos. Environ., 33, 173–182, 1999.
Steinbacher, M., Zellweger, C., Schwarzenbach, B., Bugmann, S.,Buchmann, S., Ordonez, C., Prevot, A. S. H., and Hueglin, C.:Nitrogen oxide measurements at rural sites in Switzerland: Biasof conventional measurement techniques, J. Geophys. Res., 112,D11307,doi:10.1029/2006JD007971, 2007.
Stuiver, M. and Polach, H. A.: Reporting of14C Data – Discussion,Radiocarbon, 19, 355–363, 1977.
Sullivan, A. P., Holden, A. S., Patterson, L. A., McMeeking, G.R., Kreidenweis, S. M., Malm, W. C., Hao, W. M., Wold, C. E.,and Collett, J. L.: A method for smoke marker measurementsand its potential application for determining the contribution ofbiomass burning from wildfires and prescribed fires to ambientPM2.5 organic carbon, J. Geophys. Res.-Atmos., 113, D22302,doi:10.1029/2008JD010216, 2008.
Sun, Y.-L., Zhang, Q., Schwab, J. J., Demerjian, K. L., Chen, W.-N., Bae, M.-S., Hung, H.-M., Hogrefe, O., Frank, B., Rattigan,O. V., and Lin, Y.-C.: Characterization of the sources and pro-cesses of organic and inorganic aerosols in New York city witha high-resolution time-of-flight aerosol mass apectrometer, At-mos. Chem. Phys., 11, 1581–1602,doi:10.5194/acp-11-1581-2011, 2011.
Szidat, S.: Sources of Asian haze, Science, 323, 470–71, 2009.Szidat, S., Jenk, T. M., Gaggeler, H. W., Synal, H.-A., Fisseha,
R., Baltensperger, U., Kalberer, M., Samburova, V., Wacker, L.,Saurer, M., Schwikowski, M., and Hajdas, I.: Source apportion-
www.atmos-chem-phys.net/11/12067/2011/ Atmos. Chem. Phys., 11, 12067–12084, 2011

12084 M. C. Minguillon et al.: Fossil vs. contemporary sources of fine EC and OC
ment of aerosols by14C measurements in different carbonaceousparticle fractions, Radiocarbon 46, 475–484, 2004a.
Szidat, S., Jenk, T. M., Gaggeler, H. W., Synal, H.-A., Hajdas, I.,Bonani, G., Saurer, M.: THEODORE, a two-step heating systemfor the EC/OC determination of radiocarbon (14C) in the envi-ronment, Nucl. Instrum. Meth. B, 223/224, 829–836, 2004b.
Szidat, S., Jenk, T. M., Synal, H.-A., Kalberer, M., Wacker, L., Ha-jdas, I., Kasper-Giebl, A., and Baltensperger, U.: Contributionsof fossil fuel, biomass-burning, and biogenic emissions to car-bonaceous aerosols in Zurich as traced by14C, J. Geophys. Res.,111, D07206,doi:10.1029/2005JD006590, 2006.
Szidat, S., Prevot, A. S. H., Sandradewi, J., Alfarra, M. R.,Synal, H. A., Wacker, L., and Baltensperger, U.: Dominantimpact of residential wood burning on particulate matter inAlpine valleys during winter, Geophys. Res. Lett., 34, L05820,doi:10.1029/2006GL028325, 2007.
Szidat, S., Ruff, M., Perron, N., Wacker, L., Synal, H.-A., Hallquist,M., Shannigrahi, A. S., Yttri, K. E., Dye, C., and Simpson, D.:Fossil and non-fossil sources of organic carbon (OC) and ele-mental carbon (EC) in Goteborg, Sweden, Atmos. Chem. Phys.,9, 1521–1535,doi:10.5194/acp-9-1521-2009, 2009.
Tagliavini, E., Moretti, F., Decesari, S., Facchini, M. C., Fuzzi,S., and Maenhaut, W.: Functional group analysis by HNMR/chemical derivatization for the characterization of organicaerosol from the SMOCC field campaign, Atmos. Chem. Phys.,6, 1003–1019,doi:10.5194/acp-6-1003-2006, 2006.
Ulbrich, I. M., Canagaratna, M. R., Zhang, Q., Worsnop, D. R., andJimenez, J. L.: Interpretation of organic components from Posi-tive Matrix Factorization of aerosol mass spectrometric data, At-mos. Chem. Phys., 9, 2891–2918,doi:10.5194/acp-9-2891-2009,2009.
Watson, J.: Visibility: Science and regulation, J. Air Waste Man-age., 52, 628–713, 2002.
Zencak, Z., Elmquist, M., and Gustafsson, O.: Quantificationand radiocarbon source apportionment of black carbon in atmo-spheric aerosols using the CTO-375 method, Atmos. Environ.,41, 7895–7906, 2007.
Zhang, X., Hecobian, A., Zheng, M., Frank, N. H., and Weber, R.J.: Biomass burning impact on PM 2.5 over the southeastern USduring 2007: integrating chemically speciated FRM filter mea-surements, MODIS fire counts and PMF analysis, Atmos. Chem.Phys., 10, 6839–6853,doi:10.5194/acp-10-6839-2010, 2010.
Zheng, M., Cass, G. R., Ke, L., Wang, F., Schauer, J. J., Edgerton, E.S., and Russell, A. G.: Source apportionment of daily fine partic-ulate matter at Jefferson street, Atlanta, GA, during summer andwinter, J. Air Waste Manag. Assoc., 57, 228–242, 2007.
Atmos. Chem. Phys., 11, 12067–12084, 2011 www.atmos-chem-phys.net/11/12067/2011/