fostering skills for inclusive workforce ... - the world bank
TRANSCRIPT

Report No: ACS13117 .
Republic of Cameroon FOSTERING SKILLS FOR INCLUSIVE
WORKFORCE DEVELOPMENT, COMPETITIVENESS, AND GROWTH
A FRAMEWORK FOR ACTION
. April 2015
. GEDDR
AFRICA
.
Document of the World Bank
Pub
lic D
iscl
osur
e A
utho
rized
Pub
lic D
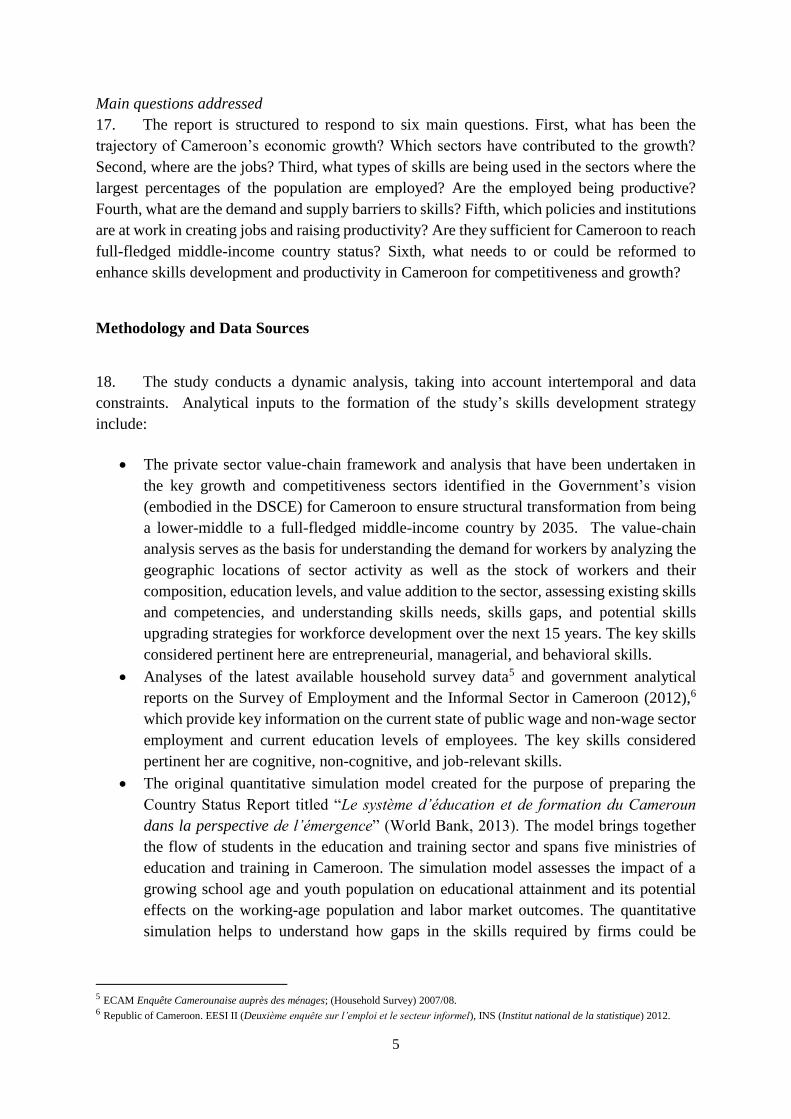
iscl
osur
e A
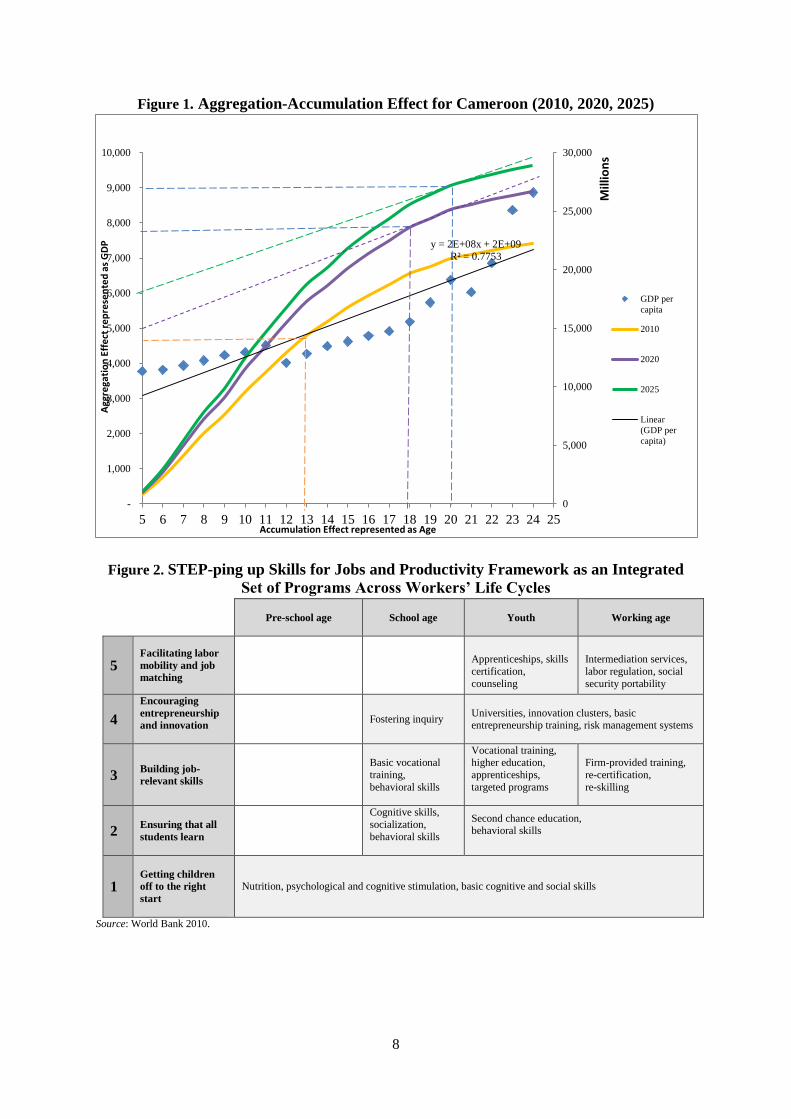
utho
rized
Pub
lic D
iscl
osur
e A
utho
rized
Pub
lic D
iscl
osur
e A
utho
rized

ii
.
.
Standard Disclaimer:
.
This volume is a product of the staff of the International Bank for Reconstruction and Development/ The World Bank. The findings, interpretations, and conclusions expressed in this paper do not necessarily reflect the views of the Executive Directors of The World Bank or the governments they represent. The World Bank does not guarantee the accuracy of the data included in this work. The boundaries, colors, denominations, and other information shown on any map in this work do not imply any judgment on the part of The World Bank concerning the legal status of any territory or the endorsement or acceptance of such boundaries.
.
Copyright Statement:
.
The material in this publication is copyrighted. Copying and/or transmitting portions or all of this work without permission
may be a violation of applicable law. The International Bank for Reconstruction and Development/ The World Bank
encourages dissemination of its work and will normally grant permission to reproduce portions of the work promptly.
For permission to photocopy or reprint any part of this work, please send a request with complete information to the
Copyright Clearance Center, Inc., 222 Rosewood Drive, Danvers, MA 01923, USA, telephone 978-750-8400, fax 978-750-4470,
http://www.copyright.com/.
All other queries on rights and licenses, including subsidiary rights, should be addressed to the Office of the Publisher, The
World Bank, 1818 H Street NW, Washington, DC 20433, USA, fax 202-522-2422, e-mail [email protected].

iii
Contents
Acknowledgments ........................................................................................................... vii
Abbreviations and Acronyms ........................................................................................ viii
Executive Summary ....................................................................................................... xiii
Chapter 1. Introduction and Background ........................................................................ 1
Objective and Scope ........................................................................................................................... 1
Context and Rationale ......................................................................................................................... 2
Conceptual framework for the study ................................................................................................... 4
Main questions addressed ................................................................................................................... 5
Methodology and Data Sources .......................................................................................................... 5
Chapter 2. The Macro Aggregation-Accumulation Model .............................................. 7
Labor-intensive Competitiveness and Growth .................................................................................... 7
The Aggregation-Accumulation Model .......................................................................................... 7
The aggregation effect, 1960-2012 ............................................................................................... 10
Demographics and employment........................................................................................................ 13
Workforce participation and productivity ......................................................................................... 17
Chapter 3. Enterprises and Workforce ........................................................................... 21
Landscape of Enterprises and Employment ...................................................................................... 22
Enterprise and workforce characteristics ...................................................................................... 22
Visible and invisible underemployment ........................................................................................... 27
Enterprise-level constraints ............................................................................................................... 30
Benchmarking Skills and Workforce Productivity ........................................................................... 30
Benchmarking Innovation and Workforce Indicators ....................................................................... 32
Investment climate constraints to enterprise productivity ................................................................ 33
Skills Utilization and Labor Laws .................................................................................................... 33
Chapter 4. Key Economic Sectors for Jobs, Value Addition, Competitiveness, and
Growth .............................................................................................................................. 36
Infrastructure ..................................................................................................................................... 36
Forestry (Wood and Wood Processing) ............................................................................................ 39
Agriculture and Agribusiness............................................................................................................ 42
Institutions and Agriculture .............................................................................................................. 43
Cotton Textiles .................................................................................................................................. 45
Palm Oil ............................................................................................................................................ 45
Tourism ............................................................................................................................................. 48
Extractives......................................................................................................................................... 50
Information and Communication Technology .................................................................................. 54
The Foundations for Workforce Value Addition .............................................................................. 55

iv
Conclusion ........................................................................................................................................ 55
Chapter 5. Skills Accumulation and the Stock and Flow of Workforce ........................ 57
Education System and Enrollments .................................................................................................. 57
Educational Attainment across Age Groups ..................................................................................... 60
Returns to Education ......................................................................................................................... 65
Anticipated Outcomes of Reforms in Education and Training ......................................................... 67
Conclusion ........................................................................................................................................ 69
Chapter 6. Assessing the Workforce Development System ............................................ 70
Summary of Benchmarking Results ................................................................................................. 71
Strategic Framework: Aligning Workforce Development with Economic and Social Priorities . 71
System Oversight: Governing Workforce Development .................................................................. 73
Service Delivery: Managing for Results ........................................................................................... 75
Chapter 7. Prospects, Conclusions and Policy Recommendations ................................. 77
Framework for Action ....................................................................................................................... 77
Governance and Institutional Arrangements ..................................................................................... 81
Information Management System for Jobs ....................................................................................... 82
Public-Private Partnerships ............................................................................................................... 82
Alternate Financing Options for Skills Programs ............................................................................. 84
Monitoring and Evaluation Systems for Skills Development Programs .......................................... 85
Expected Outcomes .......................................................................................................................... 85
The SABER-WfD Analytical Framework ....................................................................... 96
List of Boxes
Box 1. Cameroon’s Education System .................................................................................. 58
Box 2. Job-Relevant Skills and the Boundaries of Job Training Policies ............................. 78
Box 3. Traditional Apprenticeship Support ........................................................................... 79
Box 4. Access Nigeria Jobs Information Management System ............................................. 82
Box 5. Singapore and Skills Development ............................................................................ 83
A Strategy for Building a Pipeline of Skills for a Whole Industry ........................................ 83
Box 6. India’s National Association of Software and Services Companies .......................... 83
Box 7. World Bank-SAP and Skills Development in Africa ................................................. 84
Box 8. Programs to Reach Smaller Employers in Chile, Malaysia, and Singapore .............. 85
Box 9. Main Results of ECAM III ......................................................................................... 88
Box 10: 2001 Non-Farm Enterprise Module ........................................................................ 89
Box 11. Main Findings of 2010 EESI-2 ................................................................................ 90
Box 12 Government Ministries Involved in Employment-Related and Productivity
Enhancement Activities ....................................................................................................... 134
Box 13. Skilling up Vietnam: Preparing the workforce for a modern market economy ..... 139
Box 14. Successful and Widely Known ECD Program:..................................................... 140

v
Brazil’s Better Early Childhood Development Program (UNESCO, 2009) ........................ 140
List of Tables Table 1. Macroeconomic, Employment, and Education Indicators [2010] .......................................... 13
Table 2. Changes in Workforce Participation and Unemployment Rate by ......................................... 15
Table 3. Regional distribution of small, medium-size, and large enterprises, 2009 ............................. 22
Table 4. Definitions of Enterprises by Size, 2009 ................................................................................ 23
Table 5. Number of Permanent and Temporary per sector Employees by Size of Enterprise, 2009 .... 23
Table 6. Distribution of per sector Employees by Gender and Sector, 2009 ........................................ 24
Table 7. Binding Constraints to Raising Productivity .......................................................................... 31
Table 8. Innovation and Workforce Indicators ..................................................................................... 32
Table 9. Structure of employment for all infrastructure, 2005 and 2006 (%) ....................................... 37
Table 10. Characteristics of Infrastructure Workforce by Age Group and Type of Work, 2005 (%) .. 38
Table 11. Education Levels of Infrastructure Workers ......................................................................... 38
Table 12. Value Chain in the Wood Industry ....................................................................................... 40
Table 13. Regional Distribution of Employment in the Wood Industry ............................................... 41
Table 14. Hierarchy of Agroindustry and Worker Needs ..................................................................... 43
Table 15. Programs and Institutions in the Agriculture Sector ............................................................. 44
Table 16. Raw palm oil production (2003-2008) .................................................................................. 46
Table 17. Agroindustries and Their Locations ...................................................................................... 46
Table 18. Workforce in the Palm Oil Value Chain ............................................................................... 47
Table 19. Public Entities Involved in Tourism ..................................................................................... 49
Table 20. The Quality of Tourism Training .......................................................................................... 50
Table 21. Minerals, Estimated investment, and Employment, 2012-15 ............................................... 51
Table 22. Estimated impact of mining operations in the medium-term (2015-2025) ........................... 52
Table 23. Strategic Occupations in Mining .......................................................................................... 53
Table 24. Estimated Induced jobs in Mining ........................................................................................ 53
Table 25. Training Institutes and University Programs by Location .................................................... 54
Table 26. Sectors and constrains regarding workforce availability ...................................................... 55
Table 27. Gross Enrollments (%) in Public and Private Education and Training, 2000-01 and 2010-11
.............................................................................................................................................................. 59
Table 28. Education Levels and the Structure of Employment (2010) ................................................. 60
Figure 26. Enrollments in Education by Wealth Table 29. Education and Enrollments 2010-11 62
Table 30: Simulation Results of Educational Attainment ..................................................................... 91
Table 31. Potential New Entrants into the Workforce by Level of Education (all scenarios) .............. 93
Table 32. Cameroon: Benchmarking Scores 2014 ................................................................................ 96
Table 33. Synopses of Various Training and ...................................................................................... 102
Table 34. Coverage of Government and Development Partner .......................................................... 136
List of Figures
Figure 1. Aggregation-Accumulation Effect for Cameroon (2010, 2020, 2025) .................................... 8
Figure 2. STEP-ping up Skills for Jobs and Productivity Framework as an Integrated Set of Programs
Across Workers’ Life Cycles .................................................................................................................. 8

vi
Figure 3. GDP Per Capita, 1960-2012 (constant 2005 US$) ................................................................ 10
Figure 4. Poverty Headcount and Number of Poor, 2001, 2007, and 2011 .......................................... 11
Figure 5. Sectoral Contributions to GDP, 2006-11 (%) ........................................................................ 12
Figure 6. Sectoral Contributions to GDP, 1990, 2005, and 2011 ......................................................... 12
Figure 7. Demographic Profile.............................................................................................................. 14
Figure 8. Employment Structure and Distribution of Employment by Sector and Location, 2010 ...... 16
Figure 9. Employment by Sector, 1986-2010 (% of employment) ....................................................... 17
Figure 10. Total Factor Productivity 1977-2011 .................................................................................. 18
Figure 11. Apparent productivity .......................................................................................................... 18
Figure 12. Evolution of Workforce Productivity by average age of worker......................................... 20
Figure 13. Distribution of permanent employees by sector .................................................................. 25
Figure 14. Education Levels and Employment by Economic Sector, 2009 .......................................... 26
Figure 15. Education Levels and Public and Non-public Employment, 2009 ...................................... 26
Figure 16. Education Levels and Wage, Nonwage, and Agricultural Employment, 2009 ................... 27
Figure 17. Visible and Invisible Underemployment by Gender, Education Level, Region, Residence,
Economic Sector, and Institutional Type .............................................................................................. 28
Figure 18. Main barriers to entrepreneurship (% cited by entrepreneurs) ............................................ 30
Figure 19. Labor Productivity Benchmarking in Various Countries .................................................... 31
Figure 20. Benchmarking the Composition of Economic Sectors across Countries ............................ 35
Figure 21. Transversal Profile and Probabilistic Profile of Student Flow, 2011 .................................. 59
Figure 22. Primary Completion Rates, 1991-2011 Figure 23. School Life Expectancy, 2001-11 60
Figure 24. Schooling among the Working Age Population ................................................................. 61
Figure 25. Highest Level of Education Attained among....................................................................... 61
Figure 26. Enrollments in Education by Wealth Table 29. Education and Enrollments 2010-11 62
Figure 27. Educational Attainment of Children and Youth (ages 5-24), 2010 ..................................... 63
Figure 28. Public Spending on Education, 2010 (% of GDP) .............................................................. 64
Figure 29. Enrollments in Higher Education, 2010 Figure 30. Enrollments by Discipline in Higher 65
Figure 31. Rates of Return for Additional Years of Schooling by Education Level ............................ 66
Figure 32. Simulation Results of Improvements in Educational Attainment and Potential Workforce
Entrants, 2015, 2020, 2025, and 2030................................................................................................... 68
Figure 33. Dimension 1: Scores for the Strategic Framework .............................................................. 72
Figure 34. Dimension 2: Scores for System Oversight ........................................................................ 74
Figure 35. Dimension 3: Scores for Service Delivery ......................................................................... 75
Figure 36: Functional Dimensions and Policy Goals in the SABER-WfD Framework ....................... 94
Figure 37: SABER-WfD Scoring Rubrics ............................................................................................ 95
Figure 38. Which skills are used most in your current job? ................................................................ 106
Figure 39. Skills that need to be improved to better succeed in current job. ...................................... 107
Figure 40. Skills to promote/grow to fulfil career goals. .................................................................... 107
Figure 41. Most important skills for securing a job ............................................................................ 110
Figure 42. Most helpful training at this point. .................................................................................... 110

vii
Acknowledgments This report is a product of collaboration between the World Bank Central Africa Education, Poverty
Reduction and Education, Finance and Private Sector Development teams, and a Government of
Cameroon multi-sectoral team. The work was led, and the report was prepared by Shobhana Sosale.
Kristen Majgaard, Ramahatra Mamy Rakotomalala, and Samira Halabi were the main contributors at
the concept note stage of the study. The peer reviewers at concept note stage were Amit Dar, Xiaoyan
Liang, Dena Ringold and Tape Mengistae. The Advisory Committee for the study at concept stage
comprised Emanuela di Gropello, John Giles, Patrick Premand, and Jee-Peng Tan. The final draft report
has benefited with inputs from peer reviewers Souleymane Coulibaly, Venkatesh Sundararaman, John
Giles, Gilberto de Barros, Alphonsus Tji Achomuma, and Birger Fredriksen (external reviewer). Jee-
Peng Tan, Viviana Gomez Venegas, and Ryan Peter Flynn were instrumental in all stages of client
training, data collection, and data scoring for the SABER-Workforce Development tool. The team is
grateful to Kristen Himelein and Rose Mungai for their timely support with data. The team
acknowledges the support for logistics for the numerous consultations from integral team members
Natalie Tchoumba Bitnga, Rose-Claire Pakabomba, and Laurence Hougue Bouguen, and to Francine
le Touzé for the French translation of the document.
The multi-sectoral Government team comprising staff from ministries of education & training, youth,
agriculture, forestry, industry and mining, Groupement Inter-patronal du Cameroun (GICAM)
provided valuable inputs and guidance for the preparation of the workforce development analysis. Short
background papers based on extensive consultations with the Government multi-sectoral team on public
sector employees, youth leaders and constituent groups and information about ongoing programs and
projects from secondary data/literature review for the note were prepared by consultants Judith
Lewetchou Efouefack, Eleni Papakosta, Monica Chavez, and Vincent Perrot.
The report has benefited from the deliberations of the Program for Applied Sciences, Engineering and
Technology (PASET) workshop that took place from June 10-12, 2014 in Dakar, Senegal. Pre-
workshop consultations with the Ministry of Employment, Vocational Education and Training
(MINEFOP), Ministry of Higher Education (MINESUP), and Ministry for Science and Innovation
(MINRESI) added value to the document. Overall guidance was provided by Gregor Binkert and Peter
Nicolas Materu.
The initial versions of the skills analysis, policies and institutions for workforce development and the
background papers were progressively presented during the preparation phase of the study to the
Government multi-ministry team officials, GICAM, and public and private sector education and
training stakeholders in Cameroon.
The World Bank is grateful for the support from the Ministry of Economy, Planning and Regional
Integration (MINEPAT), Ministry of Finance (MINFI), Ministry of Employment, Vocational Education
and Training (MINEFOP), Ministry of Higher Education (MINESUP), Ministry of Youth
(MINEJEUNE), Ministry of Science and Innovation (MINRESI) at various phases of the preparation
and completion of this report. The team is also grateful to the Youth Group leaders and their constituents
for their valuable inputs for the preparation of the study. In addition, the authors would like to thank
officials of the various Ministries for sharing valuable data and information.

viii
Abbreviations and Acronyms
AAACP-ACP Agricultural Commodities Program
AAF Accumulation-Aggregation Framework
ACE Africa Centers of Excellence
ADC Aéroports du Cameroun
AES-SONEL National Electric Company
Société Nationale d'Electricité
AFD French Development Agency
Agence Française de Développement
AfDB African Development Bank
ALMP Active Labor Market Programs
ARIZ Monitoring Financial Risks
Accompagnement du Risque Financier
ASPPA Projet d'appui aux stratégies paysannes et à la professionnalisation de l'agriculture
ATPO Association of Oilseed Product Transformers
Association des Transformateurs des Produits Oléagineux
BAC Baccalaureate
BEPC Brevet d'Etudes du Premier Cycle
BHA Hydraulically Assembled Wood
C2D Contrat de désendettement et de développement
CAD Computer aided design
CAM Computer aided management
CAP Certificate d'Aptitude Professionnelle
CAS World Bank Country Assistance Strategy
CCI International Trade Center
Centre du commerce international
CDC Cameroon Development Corporation
CEM Cameroon Economic Memorandum
CEMAC Central African Economic and Monetary Community
CEP Primary Study Certificate
Certificat d'Etude Primaire
CFC Crédit Foncier du Cameroun
CFM Vocational Training Center
Centre de Formation Professionnelle aux Métiers
CFPE Vocational Training Centers of Excellence
Centres de Formation Professionnelle d'Exellence
CFPM Mining Vocational Training Center
Centre de Formation Professionnelle des Mines
CFPS Vocational Sectoral Training Centers
Centres de Formation Professionnelle Sectorielle
CFR Rural Training Centers
Centres de Formation Rurale
CMPJ Multifunctional Center for Youth Development
Centre Multifonctionelles de Promotion de la Jeunesse
CNUCED Conférence des Nations unies sur le Commerce et le Développement
CQP Vocational Qualification Certificate
Certificat de Qualification Professionnelle
CRA Regional Centers for Agriculture
Centres Régionaux d'Agriculture
CVET Continuing Vocational Education and Training
DEFACC Agricultural Education Cooperative and Community Division

ix
Division de l'Enseignement Agricole Coopérative et Communautaire
DHS Demographic and Heath Survey
EDS Enquête Démographique et de Santé
DSCE Strategy Document for Growth and Employment
Document de Stratégie pour la Croissance et l'Emploi
ECAM Household Consumption Survey
Enquête Camerounaise auprès des Ménages
ECD Early Childhood Development
EESI Employment and Informal Sector Surveys
Enquête sur l'Emploi et le Secteur Informel au Cameroun
EFSEAR Training School for Rural Development Specialists
École pour la Formation des Spécialistes en Aménagement Rural
EGEM School of Geology and Mining
École de Géologie et d'Exploitation Minière
ENATH National School of Tourism and Hospitality
Nationale de Tourisme et d'Hôtellerie
ENEF National School of Forestry and Water Resources
École Nationale des Eaux et Forêts
EPA Economic Partnership Agreement
ESW Economic and Sector Work
ETA Technical Schools of Agriculture
Écoles Techniques d'Agriculture
EU European Union
FAAS- FASA Faculty of Agronomy and Agricultural Sciences
Faculté d'Agronomie et des Sciences Agricoles
FAO Food and Agriculture Organization
FCFA CFA franc
FDI Foreign Direct Investment
FEFWE-FMBEEFaculty of Employment in Wood, Water and Environment
Faculté des Métiers Bois, Eaux et Environmment
FIDA Fond international pour le développement de l'agriculture
FNE National Employment Fund
FNE-PAJERU Rural and urban Youth Support Program
Programe d'appui à la Jeunesse Rurale et Urbaine
FNE-PREJ Retirement and Youth Employment Program
Programme Retraite Emploi Jeune
FSLC First School Leaving Certificate
G4S Group 4 Securicor
GCE A/L General Certificate of Education Advanced/Level
GCE O/L General Certificate of Education Ordinary/Level
GCEOL/L General Certificate of Education Ordinary/Level
GDP Gross Domestic Product
GER Gross Enrollment Ration
GICAM Groupement Inter-patronal du Cameroun
GIPA Interprofessional Group for Craftsmen
Groupement Interprofessionnel des Artisans
GoC Government of Cameroon
GTHE- ENSET General Technical Higher Education
École Normale Supérieur de l'Enseignement Technique
HE Household Enterprises
IFAD International Fund for Agriculture Development
IFC International Finance Corporation

x
ILO International Labor Organization
IMF International Monetary Fund
INS Institut National de Statistique
IRAD Institut de recherche agricole pour le développement
IT Information Technology
ITES Information Technology enabled-services
IVET Initial Vocational Education and Training
JICA Japanese International Cooperation Agency
MDG Millennium Development Goals
MIC Middle Income Country
MICROPAR Referral Program for Micro-Enterprises
Programme de Parrainage des Micro-Entreprises
MIDENO North West Development Authority
MINADER Ministry of Agriculture and Rural Development
MINAGRI Ministère de l'agriculture
MINAS Ministry of Social Affairs
MINDUH Ministry of Urban Development and Housing
MINEDUB Ministry of Primary Education
MINEFI Ministry of Economy and Finance
MINFOF Ministère des Forets et de la Faune
MINEFOP Ministry of Employment, Vocational Education and Training
MINEPAT Ministère de l'Economie, de la Planification et de L'Amenagement du Territoire
MINEPIA Ministry of Livestock, Fisheries and Animal Industry
Ministère de l'elevage, des peches et des industries animals
MINESEC Ministry of Secondary Education
MINESUP Ministry of Higher Education
Ministère de l'Enseignement Supérieur
MINFOF Ministry of Tourism
MINIMIDT Ministry of Industry, Mines and Technological Development
MINJEUN Ministry of Youth
MINPRMESA Ministry of Small and Medium Size Enterprises, Social Economy and Handicrafts
MINPROFF Ministry of Women's Empowerment and Family
MINTOUR Ministry of Tourism
MINTSS Ministry of Labor and Social Security
NEET Formal Employment Sector
NER Net Enrolment rate
NGO Non-governmental Organization
NQF National Qualifications Framework
NSWF- ENEF National School of Water and Forests
École Nationale des Eaux et Forêts
OHADA Organization for the Harmonization of African Business Law
Organisation pour l'Harmonisation en Afrique du Droit des Affairs
OMT Organisation mondiale du Tourisme
ONCPB Office national de commercialisation des produits de base
PADER Support Program for Rural Jobs
Programme d'Appui aux Emplois Des Ruraux
PAIJA Support Programme for Youths Inclusions in Agriculture
PAPESAC Support Cluster for Professionalization of Higher Education in Central Africa
Pôle d'Appui à la Professionnalisation de l'Enseignement Supérieur en Afrique Centrale
PASEC Program for the Analysis of Education Systems
Programme d'Analyse des Systèmes Éducatifs de la CONFEMEN
PCFC Projet Compétitivité des Filières de Croissance

xi
PCR Primary Completion Rates
PED Graduate Employment Program
Programme Emploi Diplômé
PETU Technological Excellence Cluster
Pôle d'Excellence Technologique
PIAASI Programme Intégré d'Appui aux Acteurs du Secteur Informel
PNVRA National Program to Promote Public Access to Agricultural Research
PPF Production Possibility Frontier
PRSP Poverty Reduction Strategy Paper
PSVC Private Sector Value-Chain
PTA Parent-teacher Associations
PTR Pupil-teacher ratio
RCSEAFW Regional Center for Specialized Education in Agriculture, Forestry ad Wood
CRESA Centre Régional d'Enseignement Spécialisé en Agriculture, Forêt et Bois
RGE Recensement général Des Entreprises
SABER Systems Approach for Better Education Results
SAP Skills for Africa Program
SAR Craft and Rural Department
Section Artisanale et Rurale
SAR/SM Section Artisanale Rurale et Section Ménagère
SCNPD National Civic Service for Participation in Development
Service Civique national de Participation au Développement
SF Science of Forestry
Sciences Forestière
SM Household Department
Section Ménagère
SME Small and Medium Enterprises
SMIG Salaire Minimum Interprofessionnel Garanti
SNPHPC Syndicat national des producteurs de l'huile de palme au Cameroun
SOCAPALM Société Camerounaise de Palmeraies
SODECOTON Mission de développement du nord-entreprises paraétatiques
SOWEDA South West Development Authority
SSA Sub-Saharan Africa
STEP Skills Towards Employability and Productivity
TVA Value Added Tax
Taxe à Valuer Ajouter
TVET Technical Industrial Vocational and Entrepreneurship Training
UICN International Union for Conservation of Nature and Natural Resources
Union Internationale de la Conservation de la Nature et des Ressources naturelles
UIT Academic and Technological Institute-Wood
Institut Universitaire et Technologique-Bois
UITTW University Institute of Technical Training in Wood
Institut Universitaire de Technologique Bois
UNDP United Nations Development Programme
UNESCO United Nations Organization for Education, Science and Culture
UNEXPALM Operations Union of Palm Oil
Union des Exploitants de Palmier à huile
UPI- IUP Informal Production Unit
USAID United States Agency for International Development
UTA Unité de travail annuel
VCA Value Chain Analysis
WB World Bank

xii
WBG World Bank Group
WDI World Development Indicators
WfD Workforce Development
WSCD Workforce Skills and Competencies Development
WWF World Wildlife Fund
ZEP Education priority areas
Zones d'Education Prioritaires

xiii
Executive Summary
Vision 2035 describes the Government of Cameroon’s goals for the country’s growth and
development—the main one being for Cameroon to become an emerging economy by 2035.
The vision includes medium-term objectives, with a focus on alleviating poverty, becoming a
middle-income country, becoming a newly industrialized country, and consolidating
democracy and national unity while respecting the country’s diversity. Vision 2035 also serves
as the long-term anchor for the Government’s recently updated poverty reduction strategy,
which puts employment at center stage.
The vision, officially known as the Strategy for Growth and Employment (Document de
Stratégie pour la Croissance et l’Emploi, or DSCE), was finalized in 2010. Among other
aspects, the DSCE identifies unemployment and weak productivity as key challenges for the
country’s development.1 Thus it seeks to:
Develop more robust formal and informal employment opportunities by strengthening
human development.
Increase productivity in agriculture, mining, and key value chains (timber, tourism, and
ICT).
Stimulate growth through investments in critical infrastructure (notably energy, roads,
port infrastructure, and water supply and sanitation) and through improvements in the
business climate and regional integration.
The DSCE sets an ambitious target of reducing underemployment from 76 percent of the
workforce to 50 percent by 2020 by creating tens of thousands of formal jobs. But based on
results from the first two years of its implementation, the DSCE is far from achieving that
target.
This report is intended to support Cameroon’s efforts to augment the skills of its workforce to
increase labor productivity and competitiveness and to create jobs—while recognizing that
many factors other than skills can inhibit labor productivity and job creation. (This report uses
the terms workforce and labor force interchangeably.) More specifically, the study is intended
to help inform a national strategy for skills development and related policies and institutions in
support of competitiveness, productivity, and job creation.
The study presents empirical analyses of skills development as it relates to the labor market to
promote labor competitiveness and job creation. A sector-specific approach to skills
development has been adopted while paying attention to employment-intensive sectors and
addressing growth-intensive investments. The study reaches conclusions and offers policy
recommendations based on its efforts to answer six questions:
What has been the trajectory of Cameroon’s economic growth? Which sectors have
contributed to growth?
Where are jobs being created?
1 The DSCE was approved by an Inter-ministerial Committee on August 26, 2009 and covers the period 2009-2019.

xiv
What types of skills are being used in the sectors where the highest percentages of the
population are employed? Are the employed being productive?
What are the demand and supply barriers to skills?
Which policies and institutions are at play? Are they sufficient for Cameroon to reach
full-fledged middle-income country status?
What needs to or could be reformed to enhance skills development and productivity for
competitiveness and growth?
The sectors analyzed by the study are infrastructure, forestry/wood and wood processing,
agriculture, and agribusiness (with a focus on cotton textiles, palm oil, tourism, and extractives)
another sector, technology and innovation, has also been included. The priority sectors were
chosen based on:
Their estimated potential for job creation.
Their estimated potential for increasing productivity. The skills development
perspective of job creation is seen as being relatively narrow, because the constraints
to job creation in a particular sector in Cameroon often lie outside traditional labor
policies, including skills development.
Labor concentration.
Whether jobs in the sectors cut across the formal and informal sectors where most of
the poor and vulnerable are engaged.
Prospects for creating economic opportunity through job creation and workforce value
addition in most of the selected sectors.
Their potential to remain labor-intensive, while also being the most amenable to
structural transformation.
Given the large informal sector in Cameroon, the diagnostic and policy work includes both
analyses of and recommendations for opportunities in the formal sector and increasing
productivity in both the informal and formal sectors. A particular challenge in studying skills
for the informal sector has been to identify appropriate tools.
Recognizing the need for a mix of tools to address the challenge of skills development, for
what purpose, and how, the conceptual framework for this study integrates three themes and
sub-themes. First, an Aggregation-Accumulation Framework that helps model growth and
skills development using proxies and, together with the Skills Toward Employment and
Productivity (STEP) framework, shows the potential for shifting the production possibility
frontier (PPF). Second, an assessment of the stock and flow of workforce skills, since policy
conclusions and recommendations differ for the two. Third, an application of the SABER-
Workforce Development (WfD) framework to analyze policies and institutions that have been
conducive to or have retarded skills development.
The Aggregation-Accumulation Model (AAM) helps measure the change in GDP over time
(the independent variable) due to changes in skills accumulation as measured by educational
attainment (the dependent variable), with all other factors of production (land, capital) held
equal. It is acknowledged that educational attainment is a weak proxy for assessing the
distribution of skills and is largely insufficient to inform policy. But in the absence of better
measures to assess skills, educational attainment is the best quantitative measure. Learning

xv
assessments would also serve as a good measure for skills. However, learning has not been
measured consistently in Cameroon. The country participates in the regional assessment
PASEC and has maintained its position as one of the top three placements in PASEC. But
PASEC tests have changed over time, casting doubt on the comparability of country results.
The study takes stock of economic growth until 2012, the aspects that have contributed to or
detracted from skills accumulation, the structure of the labor market and its shift over time
from the primary agricultural sector to the tertiary services sector, and the education and skills
of the workforce. Demand-side analysis has been conducted by reviewing the value chain
analyses financed by the Private Sector Development and Competitiveness Project of the
World Bank’s Finance and Private Sector Development Department to assess the types of skills
most sought by the primary, secondary, and tertiary sectors. Supply-side analysis has been
undertaken by assessing the extent to which skills development is being fostered by the
education and training sector.
The strategy and indicators for measuring the supply and demand of skills were developed by:
Reviewing the evolution of growth and sectoral contributions to growth, employment,
and associated education levels of the workforce.
Drawing on labor market analyses by the National Statistics Institute and the
International Labour Organization.
Mapping the demand for skills using the 2011 employers’ survey.
Linking sector-oriented employment and skills needs for value addition in the value
chain analyses by the World Bank’s Africa Region Trade and Competitiveness
Department.
Conducting empirical analysis using the SABER-Workforce Development tool for the
diagnostics of the existing skills development policy and institutional framework for
workforce development.
Drawing on an extensive literature review.
Several key conclusions emerged. First, there is significant deadweight loss with respect to the
available skills in the system and the use of those skills. Meaning, the most highly educated
people—those who have completed university education—have the highest unemployment
rates. That is partly because they tend to opt out of lower-skill jobs and partly because of the
shortage of jobs requiring highly skilled workers. Moreover, most university graduates have
generalized skills as opposed to specialized skills. University graduates also often avoid taking
jobs in rural and remote areas. Finally, the education and training system is highly inefficient,
making education and training costly for households. These costs outweigh the private and
social benefits of education and training. Combined, these factors create a mismatch between
the quantity and quality of skills. Supply is not commensurate with the demand for workforce
skills.
Second, about 90 percent of workers in Cameroon are underemployed and in informal jobs.
Only 5-6 percent work in the formal sector, and the business environment is not conducive to
self-employment. Entrepreneurs cite high taxes, a difficult tax regime, extensive corruption,
problems with access to credit, excessive bureaucracy, unfair competition, problems with

xvi
energy and water, transportation challenges, and a cumbersome judicial system to be the main
disincentives to starting a company and doing business. Workforce training and skills is also
ranked among the list of barriers. That would be a major problem overall in the medium-to
long-term even though most enterprises are small or medium in size. The selection of
workforce over time would become incommensurate with increased potential that the market
can actually bear. Another challenge is that most workers in the informal sector lack
entrepreneurial and technical skills—a major contributor to reduced productivity. This report
also discusses constraints on skills development that all sectors are facing.
Third, Cameroon lags behind most countries in terms of competitiveness: it is ranked 168 out
of 189 economies. It is ranked at 132 for starting a business, mainly because of cumbersome
and time-consuming procedures, long wait times for obtaining licenses to operate, high costs,
and the absence of minimum capital to start small and medium-size enterprises. Cameroon lags
behind Malaysia, Thailand, and Vietnam in terms of the size of the manufacturing sector
despite having almost relative and equal growth in the services industry. Cameroon has latent
potential to improve its manufacturing base through the promotion of light manufacturing in
agribusiness, wood processing, and ancillary sectors to the extractives industry. The main
impediments are the business environment (tax regime, excessive bureaucracy, unfair
competition, cumbersome judicial system, etc.) and the low skills base, leading to low
productivity.
Well-performing economies on Doing Business indicators (World Bank 2013) tend to be more
inclusive along two dimensions. They have smaller informal sectors, so more people have
access to formal markets and can benefit from regulations such as social protection and
workplace safety regulations. They are also more likely to have gender equality under the law.
Women make up nearly half the population in Cameroon, and boosting their productivity
would benefit the country.
Finally, country-level, time-based benchmarking shows that Cameroon’s system is between
“latent” and “emerging” for all the functional dimensions of policies and institutions in the
SABER-WfD analytical framework—strategic, system oversight, and service delivery. The
findings represent an average. A deeper examination of the underlying scores across the nine
policy areas reveals some confounding aspects to the system, requiring a more nuanced
approach to understanding the system. Specifically, there is a strategic framework (policy areas
of strategic direction and coordination, but not demand-led) that is tending toward an
“emerging” system. This is largely due to centralized preparation of vision and strategy
documents and action plans. But system oversight and service delivery dimensions are more
skewed toward a “latent” system. That is, there is limited collective engagement across
education and training ministries, and other ministries that provide specialized skills. This is
due to a highly fragmented approach to workforce skills development oversight and service
delivery.
Taking into account all these elements, the prospects for Cameroon to move from lower- to
middle-income status are promising. There are implications for creating more dynamic and

xvii
responsive workforce skills and a competencies development system to address potential new
jobs and requirements. A new strategy is required to foster the accumulation of skills and
competencies for value addition to labor-intensive sectors, for economic diversification, and
for structural transformation. Cameroon requires a unified, action-oriented framework for skills
development to promote collective action for improving system oversight and assuring service
delivery for results.
This report culminates with a proposed framework for action constructed on 10 principles:
optimization, concentration and assimilation, adequacy, specialization versus generalization,
facilitation, concatenation, relevance, maximization, portability, and structural transformation.
For each of these areas some directions are proposed, including suggestions for global good
practices that Cameroon could draw upon. Recommendations are also provided for revised and
renewed governance and institutional arrangements. These include developing a management
information system for jobs and promoting public-private partnerships. Some alternate
financing options for skills programs are also discussed. Finally, monitoring and evaluation
systems are proposed.
The expected outcomes are reducing systemic inefficiencies, promoting options, and boosting
the contribution of the informal sector to support Cameroon’s competitiveness and growth. The
main risk is that the Government might not endorse the recommendations. But that might not
be a substantial risk since mitigation measures have included extensive country-level
consultations through crowdsourcing and close engagement with the Government’s multi-
sectoral team.

1
Chapter 1. Introduction and Background
Objective and Scope
1. The overarching goal of this study is to facilitate Cameroon’s strategic objective of
ensuring a well-educated human resources base in support of its quest to emerge as a strong
middle-income economy by 2035. This strategic objective is communicated in various national
documents, especially the vision documents Cameroun emergent à l’horizon 2035 and the 2010
Strategy Document for Growth and Employment (Document de Stratégie pour la Croissance
et l’Emploi 2010, or DSCE), which emphasize a shift away from focusing on poverty reduction
to fostering growth as the source of prosperity and employment, premised on income
redistribution and poverty reduction.
2. The DSCE identifies agriculture, agribusiness (cotton textiles, palm oil, cocoa, and
coffee), forestry (wood and wood processing), mining, and tourism as the key engines of
economic growth and employment. Light manufacturing in these sectors are emerging as viable
options. Building on the themes and the vision, the World Bank sees the focus on labor-
intensive production for value-addition, promoting competitiveness, and structural, spatial, and
social transformation as likely critical drivers of economic growth.2
3. This study is intended to support Cameroon in preparing a national strategy for skills
development, related policies and institutions to boost competitiveness and productivity, and
job creation—while being aware that many factors other than skills can limit productivity and
job creation, including weak governance, bureaucracy, infrastructure, and taxation policies that
directly affect the business environment.
4. The study focuses on skills development for the informal and formal labor markets. For
this purpose the authors have undertaken empirical analyses on growth accumulation effects,
skills development through the education and training system that is presented by examining
skills accumulation effects, and value-chain analysis that shows the constraints for the demand
and supply of skilled and unskilled labor in Cameroon. Labor markets are dynamic. There will
always be skills gaps and mismatches. Hence the review of the education and training system
and its potential to build a skilled workforce as an accumulative approach.
5. This report also presents a comprehensive diagnostic of skills development policies and
institutions in Cameroon. It analyzes the various mechanisms for skills development and their
alignment with emerging sector demand. The underlying approach is that the development of
a critical mass of skilled labor with strong foundational and higher-order skills could contribute
to improving competitiveness, meeting the labor needs of a transforming economy, and
promoting growth. Challenges facing the business and investment climate—weak governance,
2 World Bank. 2014. Some facts on Cameroon’s Growth and Poverty Dynamics. Presentation relating to the Cameroon Economic
Memorandum (CEM) 2015, other finance and private sector development value-chain reports that have progressively demonstrated the
need for economic diversification, and the Education Sector Country Status Report 2013 entitled Le système d’éducation et de formation du Cameroun dans la perspective de l’émergence.

2
excessive bureaucracy, inadequate infrastructure, and cumbersome taxation policies—that
retard firm productivity and competitiveness and in turn reduce labor demand are discussed as
overall key complementary factors that require attention. However, their effects are not
analyzed in depth because these factors are considered exogenous to skills development.
6. The study attempts to bridge a knowledge gap about the skills mismatch in Cameroon,
and address the question of how education and training can make valuable contributions to
developing skills, spurring growth, increasing competitiveness, and helping Cameroon evolve
to higher-value products and services. A significant challenge is in attempting to unify the
currently fragmented approach to increasing the supply of skills, which is delivered by several
ministries and private organizations. The fragmentation of skills supply—combined with a
large rural population, extensive informality, and high underemployment—pose considerable
challenges.
7. The study is a natural next step to the analytical and operational work on
competitiveness and growth that have been undertaken over the past five years. Specifically,
the note complements the value-chain studies in agriculture, agribusiness (cotton textiles, palm
oil), forestry (wood and wood processing), and tourism that have already been prepared, and
the National Statistical Institute’s detailed analysis of employment, the role of the informal
sector, and labor characteristics, including skills levels using the second enterprise survey
(EESI II) dataset. The extent to which firms can attract and absorb workers is discussed.
8. This introductory chapter defines the context, rationale, and scope of the study, sets out
the conceptual framework, describes the questions addressed by the study, explains the
methodology, and identifies the data sources.
Context and Rationale
Cameroon’s socioeconomic context as it relates to skills and competencies
9. Cameroon is a lower-middle-income country aspiring to reach full middle-income
status by 2035. During the first two decades after independence (1960), growth in Cameroon
was resource intensive, with productivity and efficiency playing only minor roles. Between
1996 and 2003, despite less favorable external conditions, structural reform-led growth was
possible due to long-term foundations for enhanced productivity. Over the past decade growth
has slowed as the foundations and policy resolve have weakened both in agriculture and non-
mining industries.3 While populations in most of the world are aging, Cameroon (like other
African countries) has one of the youngest. Cameroon cannot afford to miss the demographic
dividend to achieve its vision.4
3 Ibid. 4 The demographic dividend is the growth in a country’s economy resulting from changes in the age structure and dependency ratios of its
population due to the demographic transition. The first dividend occurs with the decline of birth rates and increase in labor supply. The second
when significant number of workers are motivated to invest for their financial security in retirement. Governments have a 30 to 50-year
window of opportunity to capitalize on the larger share of working age population, if productively employed for economic development and growth. (Human Development in Africa: Strategic Directions, World Bank, Africa Region 2013).

3
10. The Document du Stratégie pour la Croissance et l’Emploi (DSCE) has identified
economic diversification through five sectors and two subsectors for purposes of generating
employment and orienting growth. They are infrastructure, forestry (wood, wood processing),
agriculture and agribusiness (with a focus on cotton textiles, palm oil), tourism, and extractives.
This study is based on analyzing skills demand, supply, and development in these sectors. A
sixth sector, technology and innovation, has also been included. This is an area that requires
urgent attention in Cameroon in order to raise its competitiveness to international levels.
11. The first two criteria for selecting the priority sectors are their estimated job creation
potential and estimated productivity gains. The skills development perspective of job creation
is seen as being relatively narrow. This is because in many cases the constraints to job creation
in a sector in Cameroon lie outside of traditional labor policies, including skills development.
For example, the main constraints to improving job creation and raising productivity in the
cotton sector in Cameroon involve the large number of small family plantations, lack of
knowledge about new technologies, transportation barriers, and lack of information on market
pricing signals. While these types of constraints lie outside the skills area, they could do more
for jobs than other types of investments. Therefore, a larger perspective has been taken to
recognize the broader context.
12. The criteria for selecting the priority sectors are also that the selected sectors have high
labor concentration, that jobs cut across both the formal and the informal sectors where most
of the poor and vulnerable are engaged, that there are prospects for creating economic
opportunity through job creation and workforce value addition in some of the sectors, and that
they could potentially continue to remain labor-intensive while also being most amenable to
structural transformation. Sectors that contribute to growth are not necessarily or automatically
labor-intensive.
13. By focusing investments on skills development and complementary business
development areas in these sectors, the Government of Cameroon could create significant value
addition in terms of jobs and workforce contributions to growth and productivity. Together the
sectors could expand the national market through synergistic interdependence. They could
create sustained jobs and steer the country away from seasonal employment. And they could
put Cameroon on the path to becoming self-sufficient and promote export-oriented growth. The
output aggregation and workforce skills accumulated over time would enable the country to
sustain growth and attain its vision of becoming a full-fledged middle-income country by 2035.
Cameroon’s competitiveness and access to national, regional, and international markets could
improve.
14. This study attempts to understand the skills in demand by employers, the constraints on
the development of those skills, and the skills that make a difference in raising productivity.
Formal wage work accounts for only 4-6 percent of employment in Cameroon. Therefore, the
study looks broadly at both the informal sector—which accounts for about 90 percent of
employment—and formal sector firms. From the perspective of skills development, the study

4
tries to identify the types of skills that could raise productivity for workers in the informal
sector. Drawing on existing literature, the roles of both the formal education sector and
informal learning opportunities (such as apprenticeships and on-the-job training) are studied to
determine policy recommendations.
Conceptual framework for the study
15. Skills development drives productivity and can boost employment and earnings. But
employment depends on job creation. Skills development is essential to improve productivity
and attract foreign direct investment (Ansu and Tan, 2012). Cameroon has long protected local
industries from foreign competition and direct investment. Local investment levels are also
low. Weak skills have led to suboptimal jobs and earnings, than high level of skills to high-
paying jobs. Thus, informality prevails and the majority of informal sector workers are
underemployed.
16. Cameroon’s approach to general education and training requires review. Higher levels
of specialized—not generalized—higher education are required for Cameroon to achieve
structural transformation. Moreover, structural transformation takes time. Thus this study’s
conceptual framework integrates three themes and sub-themes:
An Aggregation-Accumulation Framework that helps model growth aggregation (with
GDP serving as the proxy) and skills accumulation (with years of educational
attainment serving as the proxy). The framework shows that, with all else held equal,
changes in educational attainment can increase GDP over time.
To estimate the supply of skills, it is necessary to take into consideration both the stock
and flow of the workforce. Therefore, the study addresses:
a. The stock of workers in the sectors selected for the study, with their
characteristics—especially skill levels (opportunities and constraints)—analyzed
using a framework to assess their job-relevant skills, their constraints and barriers
to finding employment, the demand for their skills, and the socioeconomic
constraints to skills supply as filters for the different sectors.
b. The flow of future workers by analyzing the current education and training sector
using the Skills Toward Employability and Productivity (STEP) framework and
its potential contribution to economic growth. Skills are assessed by disaggregating
the concept into developing foundational skills (getting off to the right start
through early childhood development), ensuring that all children learn literacy and
numeracy, building job-relevant skills, encouraging entrepreneurship, innovation,
and management skills, and fostering skills for labor mobility to permit ease of
movement from the formal to the informal sector and vice versa, since the
workforce is often dynamic—especially in an environment such as Cameroon,
where job stability is not assured.
Using the SABER-Workforce Development (SABER-WfD) framework to analyze the
policies and institutions that have been conducive to or retarded skills development.
5
Main questions addressed
17. The report is structured to respond to six main questions. First, what has been the
trajectory of Cameroon’s economic growth? Which sectors have contributed to the growth?
Second, where are the jobs? Third, what types of skills are being used in the sectors where the
largest percentages of the population are employed? Are the employed being productive?
Fourth, what are the demand and supply barriers to skills? Fifth, which policies and institutions
are at work in creating jobs and raising productivity? Are they sufficient for Cameroon to reach
full-fledged middle-income country status? Sixth, what needs to or could be reformed to
enhance skills development and productivity in Cameroon for competitiveness and growth?
Methodology and Data Sources
18. The study conducts a dynamic analysis, taking into account intertemporal and data
constraints. Analytical inputs to the formation of the study’s skills development strategy
include:
The private sector value-chain framework and analysis that have been undertaken in
the key growth and competitiveness sectors identified in the Government’s vision
(embodied in the DSCE) for Cameroon to ensure structural transformation from being
a lower-middle to a full-fledged middle-income country by 2035. The value-chain
analysis serves as the basis for understanding the demand for workers by analyzing the
geographic locations of sector activity as well as the stock of workers and their
composition, education levels, and value addition to the sector, assessing existing skills
and competencies, and understanding skills needs, skills gaps, and potential skills
upgrading strategies for workforce development over the next 15 years. The key skills
considered pertinent here are entrepreneurial, managerial, and behavioral skills.
Analyses of the latest available household survey data5 and government analytical
reports on the Survey of Employment and the Informal Sector in Cameroon (2012),6
which provide key information on the current state of public wage and non-wage sector
employment and current education levels of employees. The key skills considered
pertinent her are cognitive, non-cognitive, and job-relevant skills.
The original quantitative simulation model created for the purpose of preparing the
Country Status Report titled “Le système d’éducation et de formation du Cameroun
dans la perspective de l’émergence” (World Bank, 2013). The model brings together
the flow of students in the education and training sector and spans five ministries of
education and training in Cameroon. The simulation model assesses the impact of a
growing school age and youth population on educational attainment and its potential
effects on the working-age population and labor market outcomes. The quantitative
simulation helps to understand how gaps in the skills required by firms could be
5 ECAM Enquête Camerounaise auprès des ménages; (Household Survey) 2007/08. 6 Republic of Cameroon. EESI II (Deuxième enquête sur l’emploi et le secteur informel), INS (Institut national de la statistique) 2012.

6
bridged. Here foundational skills, higher-order job-relevant skills, and skills for labor
mobility are considered important.
The Systems Approach for Better Education Results (SABER) Workforce
Development (WfD) framework and diagnostic tool,7 to:
(a) Systematically document policies and institutions that influence the performance of
Cameroon’s education and training system. The tool encompasses initial, continuing,
and targeted vocational education and training that are offered through multiple
channels, focusing on programs at the secondary and post-secondary levels.
(b) Benchmark against evidence-based global standards.
(c) Foster dialogue and action on reforms.
The analyses were undertaken through consultations with a Government multi-sectoral
team and youth groups. The analyses have served as the basis for prioritizing
interventions. The SABER-WfD framework and diagnostic tool is useful for
identifying strengths and weaknesses of the system, especially in developing a system
responsive to the labor market. SABER-WfD has nine policy drivers grouped under
three dimensions: strategic direction, system oversight, and service delivery. The
instrument does not guide the prioritization and sequencing of reforms, so it is used in
conjunction with the value-chain demand-side analyses to determine areas for
prioritization and sequencing.
7 The Systems Approach for Better Education Results (SABER) Workforce Development (WfD) framework was introduced by the World
Bank’s Human Development Network Education Team in 2012.

7
Chapter 2. The Macro Aggregation-Accumulation Model
This chapter addresses several questions: What has been the trajectory of Cameroon’s
economic growth? What is the current employment structure in the economy, and in which
sectors? What is the projected trajectory of growth? And what new types of jobs are likely to
emerge?
19. The chapter brings together the concepts of aggregation and accumulation as an
approach to understanding the twin effects on moving the Production Possibility Frontier (PPF)
for Cameroon. The discussion explores trends in economic growth over time, sector
contributions and shifts over time, associated movements in jobs, shifts in the labor force
participation and productivity over time, the stock and flow of skills mixes and mismatches,
and the Government’s approach to tackling jobs and skills challenges. The Skills Toward
Employability and Productivity (STEP) framework is superimposed to show the path of skills
accumulation and its potential effects for value addition and prospects for improving
competitiveness and growth.
Labor-intensive Competitiveness and Growth
The Aggregation-Accumulation Model
20. The Aggregation-Accumulation Model (AAM) helps measure changes in GDP over
time (the independent variable) due to changes in skills accumulation (the dependent variable),
all other factors of production (land, capital) held equal (Figure 1). Cameroon’s trajectory over
time is captured using actual data on GDP and educational attainment.8 The drivers of the
change are discussed, and the potential positive impact over time is explained.
21. Along the X axis of Figure 1, the Skills Toward Employability and Productivity (STEP)
framework demonstrates skills accumulation over time. Together the AAM and the STEP
framework show how the Production Possibility Frontier (PPF) can shift. The underlying
assumption is that even if Cameroon moves from labor-intensive to capital-intensive
competitiveness and growth, worker skills would still need to be addressed. This is because
Cameroon’s labor market does not ensure job stability. The argument is that by enhancing the
quality and quantity of the skills base in conjunction with changes to the business environment,
Cameroon can elevate its regional and global competitiveness and create an enabling
environment for stable jobs.
8 It is acknowledged that educational attainment is a weak proxy for assessing the distribution of skills and is largely insufficient to inform
policy. However, in the absence of better measures to assess skills, educational attainment serves as the best quantitative measure. Learning
assessments would also serve as a good measure for skills. However, in Cameroon learning has not been measured consistently incountry.
Cameroon participates in the regional assessment PASEC. So far Cameroon has maintained its one in top three placements in the PASEC. But
the PASEC tests themselves have undergone change over time, casting doubt on the comparability of results.
8
Figure 1. Aggregation-Accumulation Effect for Cameroon (2010, 2020, 2025)
Figure 2. STEP-ping up Skills for Jobs and Productivity Framework as an Integrated
Set of Programs Across Workers’ Life Cycles
Pre-school age
School age Youth
Working age
5 Facilitating labor
mobility and job
matching
Apprenticeships, skills
certification,
counseling
Intermediation services,
labor regulation, social
security portability
4
Encouraging
entrepreneurship
and innovation
Fostering inquiry Universities, innovation clusters, basic entrepreneurship training, risk management systems
3 Building job-
relevant skills
Basic vocational
training,
behavioral skills
Vocational training,
higher education,
apprenticeships,
targeted programs
Firm-provided training,
re-certification,
re-skilling
2 Ensuring that all
students learn
Cognitive skills,
socialization,
behavioral skills
Second chance education, behavioral skills
1
Getting children
off to the right
start
Nutrition, psychological and cognitive stimulation, basic cognitive and social skills
Source: World Bank 2010.
y = 2E+08x + 2E+09
R² = 0.7753
0
5,000
10,000
15,000
20,000
25,000
30,000
-
1,000
2,000
3,000
4,000
5,000
6,000
7,000
8,000
9,000
10,000
5 6 7 8 9 10 11 12 13 14 15 16 17 18 19 20 21 22 23 24 25
Mill
ion
s
Agg
rega
tio
n E
ffe
ct r
ep
rese
nte
d a
s G
DP
Mill
ion
s
Accumulation Effect represented as Age
GDP per
capita
2010
2020
2025
Linear
(GDP per
capita)

9
22. The AAM is based on estimating GDP as a measure of growth and output over time, as
well as a proxy for measuring productivity (output per labor hour). The trend over time shows
output aggregation. Age in years serves as a proxy for measuring educational attainment and
skills accumulation. The numbers for 2010 are actual data. The estimated GDP trend line shows
the projections for Cameroon from 2010 through 2025. The intersection of the age and GDP
trend lines shows the levels of aggregation and accumulation points. In 2010 there was
significant visible and invisible underemployment and high child labor in Cameroon. Over
time, there was also investment in education and some investment in training. In 2010 there
was considerable deadweight loss (measured as the distance between the GDP trend line and
the educational attainment curve for ages 13 and above) of skills usage in the system.
Investments in skills development for youth ages 14 and above could result in greater value
addition through a better-skilled workforce. This could help strengthen the light manufacturing
base that is already prevalent in the sectors analyzed by this study.
23. The STEP-ping up Skills for Jobs and Productivity Framework provides a means of
integrating skills development across potential workforce over the life cycle (Figure 2). Moving
up the steps correlates with the Y axis dimension of skills accumulation in Figure 1, where
educational attainment measured in years is used as the proxy. Tracing the path and assessing
progress in each step, it would be appropriate to conclude that Cameroon:
Has been relatively successful in moving forward with steps 1 and 2, though step 1
requires some concerted attention. The step 2 requirements of fostering inquiry,
providing basic vocational training, imparting and acquiring behavioral skills, fostering
cognitive skills, and socialization for school-age students are already receiving some
attention. But sustained efforts are needed, and tradeoffs should be carefully assessed
in guiding transitions to the next levels.
Is having difficulty in making the transition to step 3—building job-relevant skills. Key
challenges include making skills development programs more accessible to purchasers
or beneficiaries; and encouraging providers or suppliers to design and offer more
responsive and adaptable programs suited to the needs of the market. Demand-side
financing options need to be actively considered. There are other options. But the cost-
effectiveness of comparable programs to determine scalability requires more attention.
Fostering responsive supply-side programs means providing the right incentives linked
to performance and results, and an enabling environment conducive for entrepreneurs
to impart skills development. The certification and recertification of providers and skills
require urgent attention.
Is having great difficulty with step 4—encouraging entrepreneurship and innovation.
Is lagging behind on step 5—facilitating labor mobility and job matching.
24. For Cameroon to emerge as a middle-income country, structural transformation through
economic opportunity will be critical. Inclusive workforce skills development in concert with
a better business environment could elevate labor and enterprise value addition, boost
competitiveness, and sustain growth. The efforts would help advance Cameroon’s development
frontier. Disaggregating the model, each of the aggregation and accumulation effects are
explained below. Specific aspects of skills development are discussed in subsequent chapters.

10
The aggregation effect, 1960-2012
25. Economic growth in Cameroon was modest over 2003-13 (Figure 3) and was
undermined by the global economic crisis, which weakened demand for Cameroon’s non-oil
exports, such as wood, timber, and rubber. Non-oil exports are the drivers of economic growth,
though activity in the oil industry picked up in 2012. In recent years the economy has
rebounded, with real GDP growth approaching 4.7 percent in 2012. Only about 14 percent of
human capital per labor unit had secure jobs.
Figure 3. GDP Per Capita, 1960-2012 (constant 2005 US$)
Source: World Bank, 2014; World Development Indicators, Various Years.
26. Per capita GDP rose 52 percent between 1978 and 1986. The oil sector contributed
significantly to the Government budget, growing from 1.4 percent of GDP (9 percent of total
revenue) in 1980 to about 9 percent of GDP (41 percent of total revenue) in 1985. The
Government had adopted a development strategy dominated by expanding the capital budget
from an average of 2 percent of GDP during 1965-77 to an average of 9 percent during 1978-
86, and reducing current outlays from an average of 16 percent to 12 percent. This resulted in
a relatively large public sector. National physical infrastructure improvements included more
roads and irrigated land. However, the share of private investment in GDP remained largely
unchanged (Ghure, 1997; Charliers and Nçho-Oguie, 2009).
27. GDP per capita was $1,165 in 2012. Despite attaining lower-middle-income country
status, poverty rates are still relatively high. While the annual population growth rate is high
(more than 2 percent), real growth in GDP per capita averaged only 1 percent a year over the
past decade, 2003-13. Poverty rates fell by 13 percentage points between 1996 and 2001, but
have since stagnated at around 40 percent.9 Further, national average poverty figures mask
major regional disparities. While 56 percent of the population lived in urban areas in 2007, 87
percent of the poor were in rural areas. Further, there is a growing income gap between regions,
9 The most recent poverty data are from 2007. A new ECAM (Enquête Camerounaise auprès des ménages; Household Survey) was awaited
in 2013.

11
urban and rural areas, and rich and poor people. Between 2001 and 2007 poverty rates increased
in four regions (Adamaoua, Far North, North, and East; Figure 4), with the two northern regions
seeing the biggest increases and human development indicators—including access to
schooling, primary completion rates, literacy, access to water and sanitation, and life
expectancy—registering slower growth in these regions than in other parts of the country.
Spatial and geographic disparities between rural and urban areas and poverty-based gender
disparities have also become more pronounced.
28. The evolution of poverty is consistent with patterns of economic growth (World Bank,
2014). Average real non-oil economic growth per capita of 1.2 percent a year over time is
meaningful but not high. A limited reduction in rural poverty is therefore realistic. Moreover,
while the primary sector (agriculture, forestry, fisheries, and stock breeding) was the most
dynamic over 2007-11, the relatively small share of the primary sector in non-oil GDP (around
25 percent) is also consistent with limited progress on poverty reduction in rural areas.
Figure 4. Poverty Headcount and Number of Poor, 2001, 2007, and 2011
Source: Cameroon Poverty Assessment, 2013; Himelein, 2014. World Bank staff estimates using ECAM1 (1996), ECAM2 (2001),
ECAM3 (2007), and the DHS (2011).
29. Over 1986-2011 sectoral contributions to GDP growth also shifted, reflecting changing
workforce needs. In 1990 and 2005 the tertiary sector (services) was the largest contributor to
GDP growth, followed by the secondary sector (mining, manufacturing, utilities, and
construction, but excluding oil) and the primary sector (agriculture, forestry, fisheries, and
stock breeding). By 2011, growing tertiary and primary sectors overshadowed the contribution
of the secondary sector (Figure 5 and Figure 6). This could be attributed to the post-oil boom
recession era, 1986-1994, and the post-devaluation period (1994-2012).
2007 2011 2001
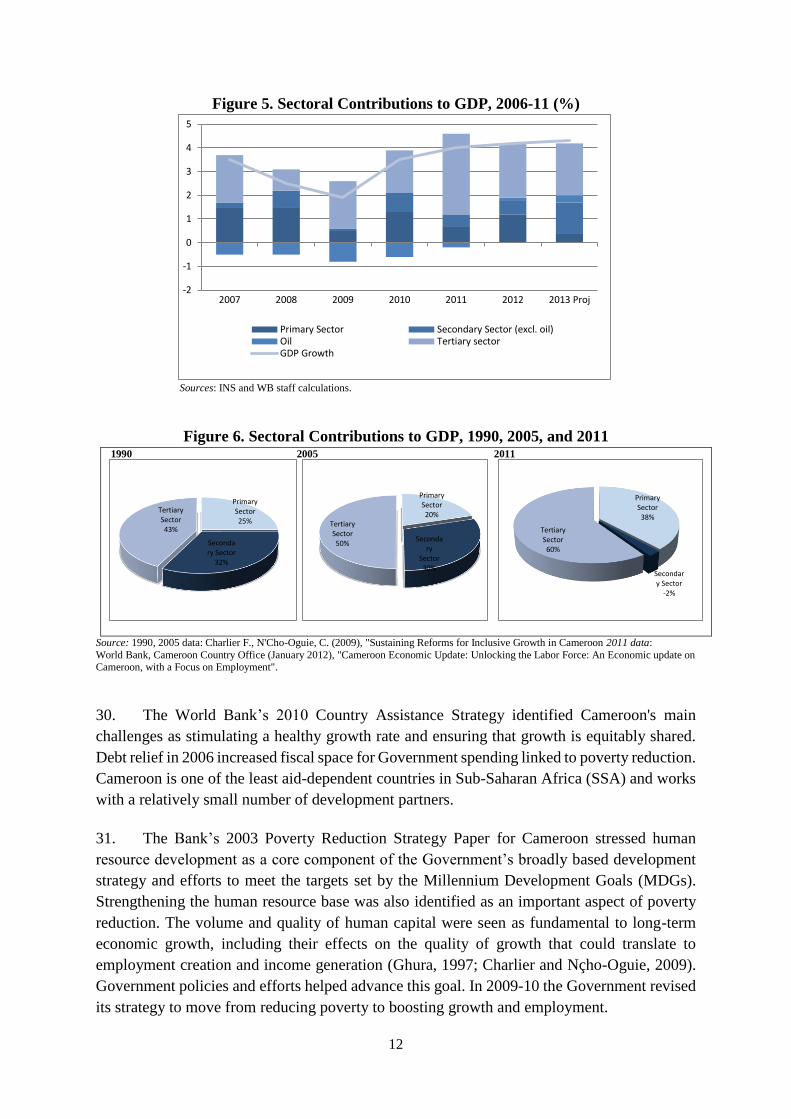
12
Figure 5. Sectoral Contributions to GDP, 2006-11 (%)
Sources: INS and WB staff calculations.
Figure 6. Sectoral Contributions to GDP, 1990, 2005, and 2011 1990 2005 2011
Source: 1990, 2005 data: Charlier F., N'Cho-Oguie, C. (2009), "Sustaining Reforms for Inclusive Growth in Cameroon 2011 data:
World Bank, Cameroon Country Office (January 2012), "Cameroon Economic Update: Unlocking the Labor Force: An Economic update on Cameroon, with a Focus on Employment".
30. The World Bank’s 2010 Country Assistance Strategy identified Cameroon's main
challenges as stimulating a healthy growth rate and ensuring that growth is equitably shared.
Debt relief in 2006 increased fiscal space for Government spending linked to poverty reduction.
Cameroon is one of the least aid-dependent countries in Sub-Saharan Africa (SSA) and works
with a relatively small number of development partners.
31. The Bank’s 2003 Poverty Reduction Strategy Paper for Cameroon stressed human
resource development as a core component of the Government’s broadly based development
strategy and efforts to meet the targets set by the Millennium Development Goals (MDGs).
Strengthening the human resource base was also identified as an important aspect of poverty
reduction. The volume and quality of human capital were seen as fundamental to long-term
economic growth, including their effects on the quality of growth that could translate to
employment creation and income generation (Ghura, 1997; Charlier and Nçho-Oguie, 2009).
Government policies and efforts helped advance this goal. In 2009-10 the Government revised
its strategy to move from reducing poverty to boosting growth and employment.
-2
-1
0
1
2
3
4
5
2007 2008 2009 2010 2011 2012 2013 Proj
Primary Sector Secondary Sector (excl. oil)Oil Tertiary sectorGDP Growth
Primary Sector25%
Secondary Sector
32%
Tertiary Sector 43%
Primary Sector20%
Secondary
Sector30%
Tertiary Sector 50%
Primary Sector38%
Secondary Sector
-2%
Tertiary Sector 60%

13
32. In 2012, despite concerted efforts, Cameroon was largely off track for achieving the
MDGs. Recent data indicate that the MDG for universal primary schooling, which was once
considered possible to achieve, is not feasible. The gender parity index fell from 0.88 in 2004
to 0.85 in 2010.10 Further, lack of progress on the MDGs related to water and sanitation,
teaching and learning materials, and school re-entry support structures for girls might be
affecting education enrollments and attainment for out-of-school children (particularly girls
and vulnerable groups, including ethnic minorities) and life expectancy in general. Still,
Government efforts over time have raised Cameroon to lower-middle-income status (Table 1).
Table 1. Macroeconomic, Employment, and Education Indicators [2010]
Macroeocnomic Indicators Data
GDP growth (annual %) 4.6
Exports of goods and services (% of GDP) 29.2
Imports of goods and services (% of GDP) 31.9
Tax revenue (% of GDP)* 11.2
Poverty headcount ratio at national poverty line (% of population)** 39.9
Employment
Population (Total in Mil) 21.7
Unemployment, total (% of total labor force) (national estimate) 3.8
Urban population 11.4
Employment in agriculture (% of total employment)*** 53.3
Employment in industry (% of total employment)*** 12.6
Employment in services (% of total employment)*** 34.1
Education
Ratio of girls to boys in primary and secondary education (%) 86.9
School enrollment, primary (% net) 91.5
School enrollment, primary (% gross) 110.6
School enrollment, secondary (% gross) 50.4
School enrollment, secondary (% net)**** 14.7
Literacy rate, adult total (% of people ages 15 and above)*** 71.3
Literacy rate, adult total (% of people ages 15 and above)***** 65.1 Note: * 1999; ** 2007; *** 2010; **** 1981; ***** 2011;
Source: World Bank, World Development Indicators, 2014; and Cameroon Education Sector Status Report, 2013—
Le Système d'education et de formation du Cameroun dans le perspective de l'emergence, 2013
Demographics and employment
33. The results of the third population census in 2005 showed that Cameroon had 18.1
million inhabitants. By 2010 that had jumped to 20.6 million. Cameroon has a large, relatively
healthy, young population (Figure 7). The share of young people is expected to increase over
the next two decades. They could help increase the country’s economic competitiveness sub-
10
United Nations Development Programme (UNDP) database for Cameroon, (2012 update).

14
regionally and regionally. Over the next decade, a significant number of young people are
expected to enter the job market. As in other Sub-Saharan countries, youth make up about 40
percent of the population in Cameroon and could generate a demographic dividend, with
human resource benefits—or costs, if not appropriately addressed. Cameroon’s young
population offers a huge opportunity to build an educated, trained, skilled, employable
workforce to drive economic diversification and economic transformation.
Figure 7. Demographic Profile
Source: Population Division of the Department of Economic and Social Affairs of the United Nations Secretariat, various years.
34. A recent report on youth labor markets in Sub-Saharan Africa and around the world
finds that the lack of prospects for secure employment, along with increased education, access
to modern technology, and exposure to the perceived advantages of developed economies, risks
creating frustration among youth (Elder and Koné, 2014). That, in turn, could result in political
unrest and emigration. According to a 2010 report by the McKinsey Global Institute, only about
23 percent of young people in Cameroon had stable employment, 73 percent were in vulnerable
employment, and 4 percent were unemployed. Therefore, the political economy aspects
warrant equal attention. The DSCE sets a national target for youth employment of 50 percent
by 2020—an ambitious goal. Key to reaching the target is maintaining access to education and
training while improving their quality.
35. Since 2000 the emphasis has almost exclusively been on improving access to education.
But improved access to education is not enhancing economic growth. The main reasons for this
are the relatively low quality of education and mismatches in skills and competencies. Further,
formal private sector jobs have been very slow to grow, resulting in growing numbers of jobs
in the informal sector. While informal could be considered as normal, the potential contribution
of the informal sector to the economy, especially for enhanced tax payments, is not being taken
into account. And low tax revenue is undermining Cameroon’s growth and competitiveness.
36. Changes in employment and workforce participation have been relatively slow over the
past decade and will not increase significantly without concerted policies and enforcement.
Between 2001 and 2010 the population grew by about 2.3 percent a year. The active workforce
increased by 2.8 percent a year. But the workforce participation rate declined, as did the
unemployment rate, leading to the conclusion that informality increased over period. The rate
0
2000
4000
6000
8000
10000
12000
14000
16000
18000
199
0
199
5
200
0
200
5
201
0
201
5
202
0
202
5
203
0
203
5
204
0
204
5
205
0
0-14
15-24
25-34
Age

15
for the active workforce aged 15-59 in 2001 was around 19.6 percent, representing only 7.1
percent of active workforce in the age group—a decrease of 60 percent. Youth aged 25-34
years experienced a less dramatic change, with the rate decreasing from 18.7 percent in 2001
to 8.2 percent in 2010—a decrease of 53 percent.
Table 2. Changes in Workforce Participation and Unemployment Rate by
Population Age Group (%)
Age Workforce Participation Rate Unemployment Rate
2001 2005 2010 2001 2005 2010
15-59 years 66.1 64.1 60.0 35.0 12.0 11.3
25-34 years 93.0 90.3 88.0 18.7 9.1 8.2
35-49 years 94.5 93.8 93.0 7.9 3.4 3.3
50-59 years 91.6 90.5 88.7 5.7 3.0 2.3 Note: (a) Population with no education.
Source: World Bank, 2013: Authors calculations using INS data.
37. Sectoral breakdowns show that most employment is in the informal sector, increasing
from 82.2 percent in 2001 to 84.1 percent in 2010 among workers aged 15-59. In the informal
sector there was a significant reduction in the share of workers in agriculture, from 68.1 percent
in 2001 to 56.6 percent in 2010, while the number of agricultural jobs rose from about 3.0
million to 3.5 million. Those employed in the informal non-agricultural sector increased during
the period. Economic activity among 25-34-year-olds fell only slightly, from 94.8 percent in
2001 to 93 percent in 2010. Employment in the formal sector also decreased for this age group,
from 21.2 percent in 2001 to 19.1 percent in 2010, with an increase in the number of unskilled
workers.
38. In 2012 Cameroon had an estimated population of 21 million. Therefore, over the next
decade Government could anticipate a growing workforce. Taking into account the change in
unemployment over time, it is important to assess the potential direction of future employment
and the spread between skilled and unskilled employees.
39. Most young adults are unemployed, holding out for public sector jobs, underemployed
in the public sector, or working in unpaid or poorly paid household enterprises. Three aspects
deserve examination: workforce participation and its evolution over the past two decades and
distribution across economic sectors, to understand the stock of workers; the consequences of
the evolution in terms of employment creation; and estimated labor productivity from an
intertemporal perspective and its effects on intersectoral mobility.
40. Workforce participation rose from 3.5 million in 1985 to 5.8 million in 2005—an annual
growth rate of 2.5 percent.11 During the same period there was a shifting population
distribution across economic sectors. By 2010 the workforce showed increasing signs of being
skewed toward the informal non-wage sector (Figure 8).
11 Country Status Report (Rapport d’Etat sur le Système d’Education Nationale) entitled Le système d’éducation et de formation du
Cameroun dans la perspective de l’émergence. May 2013. World Bank.

16
Figure 8. Employment Structure and Distribution of Employment by Sector and
Location, 2010
Source: Republic of Cameroon, Institut National de Statistique, EESI II, 2010.
41. Data on employment by sector over 1986-2010 reveal declining trends for agriculture
and industry and a growing trend for services (Figure 9). During 1978-86 there was an
increased emphasis on capital spending that was reflected in substantial improvements to
infrastructure. The increase in the primary sector’s contribution to GDP while there was a
decline in employment in agriculture could be due to improved technology and productivity.
In 1986 the estimated active workforce in the primary sector (agriculture, forestry, fisheries)
was 2.04 million. By 2005 that number had fallen to 1.9 million. The share of the workforce
employed in agriculture witnessed a considerable decline from 57.6 percent in 1985 to 32.3
percent in 2005 a drop of nearly 1.3 percentage points a year. Between 1985 and 2005 only
about 150,000 workers were employed in the secondary sector (industry). During the same
period the numbers employed in the tertiary sector (services) increased from 1.35 million to
3.81 million, or from 38.1 percent of the labor force to 65.2 percent. Thus employment
opportunities in the tertiary sector increased dramatically.
6%
4%
37%53%
Public
Formal private
Informal nonagriculture
Informal agriculture
0
10
20
30
40
50
60
70
80
Public Private Informalagriculture
Informal nonagriculture
Urban
Rural

17
Figure 9. Employment by Sector, 1986-2010 (% of employment)
Source: World Development Indicators and staff calculations (1965-2006); and
Cameroonian authorities and Bank staff calculations (2007-2012).
42. The preference for employment in the tertiary sector is creating significant competition
and entry barriers. Within the tertiary sector, it is important to distinguish between the formal
sector (where firms are registered, are not required to pay import duties, and employees earn
reasonable salaries and social security benefits) and the informal sector (which comprises some
small enterprises and retail services, often involves intermittent employment, and is fraught
with unemployment). During 1985-2005 it seems that the numbers employed in the modern
services subsector nearly doubled. But this was a relatively small increase relative to the
working-age group (15-64 years). A large portion of this age group entered the informal
services subsector. That is, from 858,000 individuals in 1985, or 24 percent of the labor force,
to 2.8 million in 2005, or 48 percent. It is unclear to what extent they have served as a key input
into the production function for economic growth. The increase could reflect unemployment
redistribution that masks the overall constraints to access the overall formal and tertiary formal
sectors.
Workforce participation and productivity
43. During 1977-2011 improved productivity defined as output per labor hour contributed
about 14 percent to real GDP growth, whereas labor and capital each contributed about 53
percent (Figure 10).
0
10
20
30
40
50
60
70
80
90
Agriculture Industry Services

18
Figure 10. Total Factor Productivity 1977-2011
Source: Government INS data and WB Staff calculations, 2014.
44. The apparent average productivity of the aggregate workforce in Cameroon—in both
the formal and informal sectors—and their value addition over time declined between 1985
and 2000.12 This could be attributed to climate effects on agriculture, increase in the salaries of
public officials in 2008, the revaluation of the Salaire Minimum Interprofessionnel Garanti
(SMIG) intervention in 2008. Workforce productivity showed signs of picking up after 2000
(Figure 11).
Figure 11. Apparent productivity
of the workforce by economic sector (1985-2007)
Source: World Bank, 2013.
12 Represents the labor force participation in various sectors of the economy and the respective ‘productivity’ (output per worker hour) that is
attributable to each sector (source IMF-World Bank). The calculation helps to determine the apparent productivity of the workforce and to
assess the change over time. But the aggregate figures need to be complemented by separating the modern services sub-sector and the informal
services sub-sector. For purposes of this report, the value addition in the informal services sub-sector is estimated to be the difference between
(i) the value addition in the public and services sector; and (ii) the value addition in the modern informal sector by taking estimates and the average salary/remuneration (from the household survey).
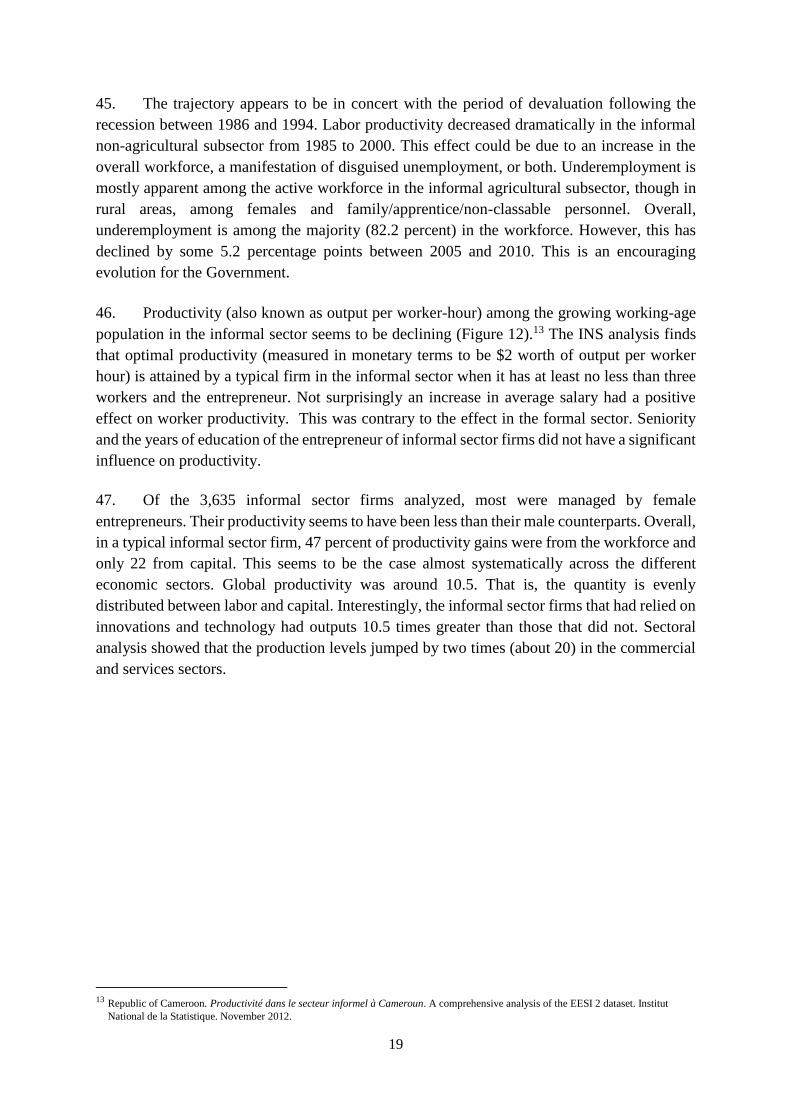
19
45. The trajectory appears to be in concert with the period of devaluation following the
recession between 1986 and 1994. Labor productivity decreased dramatically in the informal
non-agricultural subsector from 1985 to 2000. This effect could be due to an increase in the
overall workforce, a manifestation of disguised unemployment, or both. Underemployment is
mostly apparent among the active workforce in the informal agricultural subsector, though in
rural areas, among females and family/apprentice/non-classable personnel. Overall,
underemployment is among the majority (82.2 percent) in the workforce. However, this has
declined by some 5.2 percentage points between 2005 and 2010. This is an encouraging
evolution for the Government.
46. Productivity (also known as output per worker-hour) among the growing working-age
population in the informal sector seems to be declining (Figure 12).13 The INS analysis finds
that optimal productivity (measured in monetary terms to be $2 worth of output per worker
hour) is attained by a typical firm in the informal sector when it has at least no less than three
workers and the entrepreneur. Not surprisingly an increase in average salary had a positive
effect on worker productivity. This was contrary to the effect in the formal sector. Seniority
and the years of education of the entrepreneur of informal sector firms did not have a significant
influence on productivity.
47. Of the 3,635 informal sector firms analyzed, most were managed by female
entrepreneurs. Their productivity seems to have been less than their male counterparts. Overall,
in a typical informal sector firm, 47 percent of productivity gains were from the workforce and
only 22 from capital. This seems to be the case almost systematically across the different
economic sectors. Global productivity was around 10.5. That is, the quantity is evenly
distributed between labor and capital. Interestingly, the informal sector firms that had relied on
innovations and technology had outputs 10.5 times greater than those that did not. Sectoral
analysis showed that the production levels jumped by two times (about 20) in the commercial
and services sectors.
13 Republic of Cameroon. Productivité dans le secteur informel à Cameroun. A comprehensive analysis of the EESI 2 dataset. Institut
National de la Statistique. November 2012.

20
Figure 12. Evolution of Workforce Productivity by average age of worker
Source: Republic of Cameroon, INS. November 2012.
48. Promoting growth alone does not improve living conditions for all. Thus the World
Bank promoted the notion of pro-poor growth (World Bank, 2005). Among the active working
population, 90 percent were in the informal sector, of which approximately 52 percent are in
the informal agricultural/farm sector (INS, EESI I, 2005) and about 35 percent in the informal
non-farm sector are battling low productivity and under-employment. Further, over 20 percent
of them in rural areas are in the informal non-farm sub-sector. The concentration of workers in
this sub-sector is not because work here is attractive, but because the formal sector is closed to
them. Their working conditions are precarious, they are low revenue earning, they use
outmoded production mechanisms, they are by and large poorly managed, and because the
informal sector is the only means of avoiding unemployment (Bem and others 2013).
49. The small, informal, small and medium-size firms are not registered with the Chamber
of Commerce, and they do not adhere to formal accounting procedures as per the Organization
for the Harmonization of African Business Law (l’Organisation pour l’Harmonisation en
Afrique du Droit des Affaires, or OHADA14) requirements (INS, 2006). They are by and large
inefficient. The proprietors and employees of those in the informal sector are poorly prepared
due to low-quality basic education and post-basic education, especially vocational and
technical training. Inclusive workforce development is fundamental to addressing pro-poor
growth.
14 The Organization for the Harmonization of African Business Law [l’Organisation pour l’Harmonisation en Afrique du Droit des Affaires
(OHADA) was created in Port-Louis, Mauritius on October 19, 1993. It became effective on September 18, 1995. OHADA is intended to create for African member countries an economic zone with juridical security to attract foreign direct investments and to consolidate national
investments. But OHADA law is heavily inspired by the French business laws. The OHADA law does not taken into account sufficiently the
socioeconomic context of Africa. The member countries of OHADA have predominantly a large informal sector. In Cameroon a little over 90
percent of all employment is in the informal sector. OHADA law is not adapted to the informal sector. A study has been undertaken to outline
the extent to which OHADA law could be adapted to the national level specificities (informal sector) of Cameroon. (Source: L’OHADA et le
secteur informel, l’exemple du Cameroun. Kwemo, Stéphanie. Editions Larcier (October 1, 2012). The details of the study are not discussed in detail in the World Bank report since the topic is beyond the scope of the study.
0
100
200
300
400
500
600
700
800
900
1000
Less than 25 years 25-29 years old 30-34 years old 35-39 years old 40-44 years old 45-49 years old 50 years old andolder
Industry Commerce Services

21
Chapter 3. Enterprises and Workforce
This chapter responds to the following questions: What is the current status of skills among
Cameroon’s workforce? Do workers have the education and training required to increase
productivity? And what are the key constraints to skills development?
50. Like many other Sub-Saharan countries, Cameroon’s labor market has few formal jobs
and a large informal labor force. Unemployment is low because most Cameroonians cannot
afford not to work. But most jobs have low productivity and generate little income. Domestic
help personnel are required to work up to 54 hours a week, and security guards and chauffeurs
are required to work 56 hours. But the average work week is only 39 hours, reflecting
involuntary underemployment in workers’ main occupations. This is due to employment
conditions or an inefficient economy. Thus the challenge is to improve the productivity and
earnings of those already working—whether in the formal or informal sector—while also
creating more jobs in the formal sector. Those goals could be achieved through a thriving
private sector, a skilled workforce, and a streamlined public sector that creates an enabling
environment for changes to policies and institutions.
51. The DSCE sets ambitious targets for Cameroon. A responsive labor market is a
prerequisite for Cameroon to move up from lower-middle-income to full-fledged middle-
income status. This chapter discusses the emerging landscape of the labor market, the
distribution of employment by economic sector, the education levels and skills of the current
labor force, and the training programs in place. The chapter captures the private sector/demand-
side assessment of the stock of workers and their skills, skills mismatches, and other labor
supply constraints. Investment climate constraints affecting enterprise productivity are also
assessed.
52. The most recent survey data were used to identify the workforce characteristics of
enterprises in Cameroon. Data analyses are based on three datasets: the Demographic and
Health Survey (DHS), Household Consumption Survey (ECAM), and Enterprise Surveys.
Enterprise Surveys are conducted by the World Bank, International Finance Corporation, and
their partners across all geographic regions and cover small, medium-size, and large firms.15
They focus on the many factors that shape the business environment. These factors can be
accommodating or constraining for firms and play an important role in whether a country will
prosper. An accommodating business environment encourages firms to operate efficiently by
providing incentives for firms to innovate and raise productivity—key factors for sustainable
development. A more productive private sector, in turn, expands employment and pays the
taxes needed for public investments in education, health, and other services. In contrast, a poor
15 Enterprises Surveys are administered to a representative sample of firms in the nonagricultural formal private economy. The sample is
consistently defined in all countries and includes the manufacturing sector, services sector, and transportation and construction sectors. Public
utilities, government services, healthcare, and financial services sectors are not included. The surveys collect a wide range of qualitative and
quantitative data through in-person interviews with firm managers and owners about the business environment in their countries and the
productivity of their firms. Topics covered include infrastructure, trade, finance, regulations, taxes and business licensing, corruption, crime,
informality, finance, innovation, labor, and perceptions about obstacles to doing business. The data collected through the surveys link a
country’s business environment characteristics with firm productivity and performance. The surveys are useful to policymakers and researchers, and are repeated over time to track changes and benchmark the effects of reforms on firms’ performance.

22
business environment increases the obstacles to conducting business activities and decreases a
country’s prospects for reaching its potential in terms of employment, production, and welfare
(World Bank and International Finance Corporation, 2009).
Landscape of Enterprises and Employment16
Enterprise and workforce characteristics
53. Enterprises by region, size, and number of workers. Yaoundé is the political capital of
Cameroon; Douala is the economic capital. The country has 10 geographic regions. Micro,
small, medium-size, and large enterprises are concentrated in Douala (35.1 percent) and
Yaoundé (23.9 percent), followed by the West, South-West, and North-West regions (Table 3).
Regions in the Anglophone part of the country appear to be more entrepreneurial and inclined
toward private sector employment, while the Francophone part of the country—with the
exception of Yaoundé—is more oriented toward the Francophone system of public sector
employment. Most enterprises are in the tertiary sector (85.3 percent), followed by the
secondary sector (12.9 percent) and primary sector (0.4 percent). Some enterprises did not
declare their sector of economic activity.
Table 3. Regional distribution of small, medium-size, and large enterprises, 2009
Region
Primary
sector
(%)
Secondary
sector
(%)
Tertiary
sector
(%)
Undec-
lared
(%)
Number of
enterprises
Share
of total
(%)
Douala 0.2 11.8 86.1 2.0 33,004 35.1
Yaoundé 0.1 14.5 84.1 1.3 22,436 23.9
West 0.6 16.1 81.3 2.0 8,327 8.9
South-West 0.6 15.1 83.7 0.5 6,866 7.3
North-West 0.3 16.7 82.3 0.7 6,487 6.9
Adamaoua 0.6 8.2 90.7 0.5 2,740 2.9
Center (excluding Yaoundé) 1.1 7.4 90.4 1.2 2,695 2.9
East 0.6 6.0 93.1 0.3 1,736 1.8
Far North 0.5 7.5 90.8 1.2 2,585 2.8
Littoral (excluding Douala) 1.5 10.7 84.8 3.0 1,704 1.8
North 1.3 14.9 82.8 0.9 2,942 3.1
South 0.4 9.0 90.2 0.4 2,447 2.6
Total
(%)
345
(0.4)
12,154
(12.9)
80,109
(85.3)
1,361
(1.4)
93,969 100
Note: Number of enterprises surveyed by the Institut Nationale de Statistique (INS) in 2009. Most recent data available.
Source: Republic of Cameroon, Institut Nationale de Statistique (INS), Enterprise Survey, 2009. Recensement Général des Entreprises:
Rapport principal des résultats. 2009.
16 This section draws on Cameroon National Institute of Statistics Recensement Général des Entreprises (2009) and World Bank Group
Enterprise Surveys: Cameroon Country Profile (2009).
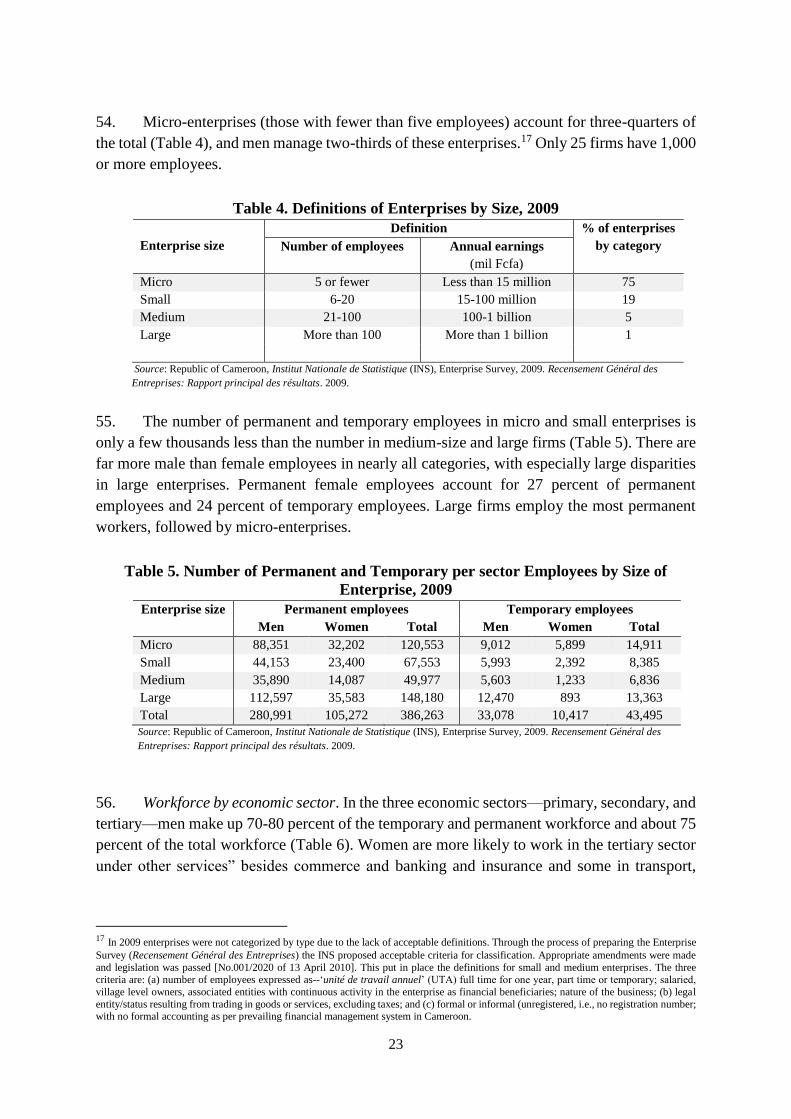
23
54. Micro-enterprises (those with fewer than five employees) account for three-quarters of
the total (Table 4), and men manage two-thirds of these enterprises.17 Only 25 firms have 1,000
or more employees.
Table 4. Definitions of Enterprises by Size, 2009
Enterprise size
Definition % of enterprises
by category Number of employees Annual earnings
(mil Fcfa)
Micro 5 or fewer Less than 15 million 75
Small 6-20 15-100 million 19
Medium 21-100 100-1 billion 5
Large More than 100 More than 1 billion 1
Source: Republic of Cameroon, Institut Nationale de Statistique (INS), Enterprise Survey, 2009. Recensement Général des
Entreprises: Rapport principal des résultats. 2009.
55. The number of permanent and temporary employees in micro and small enterprises is
only a few thousands less than the number in medium-size and large firms (Table 5). There are
far more male than female employees in nearly all categories, with especially large disparities
in large enterprises. Permanent female employees account for 27 percent of permanent
employees and 24 percent of temporary employees. Large firms employ the most permanent
workers, followed by micro-enterprises.
Table 5. Number of Permanent and Temporary per sector Employees by Size of
Enterprise, 2009
Enterprise size Permanent employees Temporary employees
Men Women Total Men Women Total
Micro 88,351 32,202 120,553 9,012 5,899 14,911
Small 44,153 23,400 67,553 5,993 2,392 8,385
Medium 35,890 14,087 49,977 5,603 1,233 6,836
Large 112,597 35,583 148,180 12,470 893 13,363
Total 280,991 105,272 386,263 33,078 10,417 43,495
Source: Republic of Cameroon, Institut Nationale de Statistique (INS), Enterprise Survey, 2009. Recensement Général des
Entreprises: Rapport principal des résultats. 2009.
56. Workforce by economic sector. In the three economic sectors—primary, secondary, and
tertiary—men make up 70-80 percent of the temporary and permanent workforce and about 75
percent of the total workforce (Table 6). Women are more likely to work in the tertiary sector
under other services” besides commerce and banking and insurance and some in transport,
17 In 2009 enterprises were not categorized by type due to the lack of acceptable definitions. Through the process of preparing the Enterprise
Survey (Recensement Général des Entreprises) the INS proposed acceptable criteria for classification. Appropriate amendments were made
and legislation was passed [No.001/2020 of 13 April 2010]. This put in place the definitions for small and medium enterprises. The three
criteria are: (a) number of employees expressed as--‘unité de travail annuel’ (UTA) full time for one year, part time or temporary; salaried,
village level owners, associated entities with continuous activity in the enterprise as financial beneficiaries; nature of the business; (b) legal
entity/status resulting from trading in goods or services, excluding taxes; and (c) formal or informal (unregistered, i.e., no registration number; with no formal accounting as per prevailing financial management system in Cameroon.

24
where they account for 44 percent of permanent employees and 53 percent of temporary
employees.
Table 6. Distribution of per sector Employees by Gender and Sector, 2009
Sector
Subsector
Permanent employees Temporary employees
Men Women Total Men Women Total
Primary
Agriculture 20,361 6,169 26,530 772 122 894
Livestock
management
405 144 549 42 36 78
Sylviculture 6,533 254 6,787 289 29 318
Fisheries 30 9 39 9 3 12
Subtotal 27,329 6,576 33,905 1,112 190 1,302
Secondary
Mining 953 209 1,162 25 3 28
Food industry 15,208 4,239 19,447 6,604 123 6,727
Other
manufacturing
industries
39,843
10,150
49,993
4,608 1,727 6,335
Electricity, water,
and gas
6,378 2,152 8,530 1,055 32 1,087
Construction 7,389 1,368 8,757 2,383 238 2,621
Subtotal 69,771 18,118 87,889 14,675 2,123 16,798
Tertiary
Commerce 84,907 20,551 105,458 3,756 1,382 5,138
Transport 12,346 2,695 15,041 634 110 744
Banking and
insurance
7,072 5,512 12,584 257 290 547
Other services 77,382 51,462 128,844 12,554 6,304 18,858
Subtotal 181,707 80,220 261,927 17,201 8,086 25,287
Undeclared 2,184 358 2,542 90 18 108
Total 280,991 105,272 386,263 33,078 10,417 43,495
Source: Republic of Cameroon, Institut Nationale de Statistique (INS), Enterprise Survey, 2009. Recensement Général des
Entreprises: Rapport principal des résultats. 2009.
57. An overwhelming number of permanent employees are either self-employed or work in
small, medium-size, and large enterprises in the tertiary sector, especially in the “other
services” and commerce subsectors (Figure 13).

25
Figure 13. Distribution of permanent employees by sector
Source: Republic of Cameroon, Institut Nationale de Statistique (INS), Enterprise Survey, 2009. Recensement Général des
Entreprises: Rapport principal des résultats. 2009.
58. Workforce by gender, region, education level, and sector. The DSCE projected 800,000
salaried employees in the formal sector by 2020. But there are only 386,263 permanent
employees in 2010 in the private sector, of which about 281,000 (73 percent) are male and
105,000 (27 percent) are female. These numbers reflect the low absorptive capacity of
enterprises. Public enterprises have about 196,000 permanent employees. Most are
concentrated around Douala (47 percent) and Yaoundé (21 percent). Only about 73 percent of
the active labor force—the majority of them men—are permanently employed or working as
apprentices and drawing a regular salary. These data reflect the fragile state of Cameroon’s
formal sector.
59. Most workers who have no education, are out of school, or have not completed primary
education work in agriculture, followed by industry (Figure 14). These tend to be nonwage
jobs. By contrast, workers with post-secondary education and not in Technical, Industrial,
Vocational, and Entrepreneurship Training (TVET) earn wages.
0 20000 40000 60000 80000 100000 120000 140000
Commerce
Transport
Banking and insurance
Other services
Mining
Food industry
Other manufacturing industries
Electricity, water and gas
Construction
Agriculture
Livestock
Forestry
Fishing and fish farming
Tert
iary
Sec
tor
Seco
nd
ary
Sect
or
Pri
mar
y Se
cto
r
105458
15041
12584
128844
1162
19447
49993
8530
8757
26530
549
6787
39

26
Figure 14. Education Levels and Employment by Economic Sector, 2009
Source: Cameroon DHS 2009; World Bank staff estimates.
60. Few employees with incomplete primary education work in the public sector (Figure
15). Those who have completed lower secondary, upper secondary, and post-secondary
education are more likely to be in Government service, where there is job security and assured
pay. Many others are also in TVET, which provides them with a purpose to continue
education—though they are not assured of jobs once they complete training.
Figure 15. Education Levels and Public and Non-public Employment, 2009
Source: Cameroon DHS 2009; World Bank staff estimates.
61. A large share of the less educated workforce finds refuge in the informal sector (Figure
16). Again, most are underemployed. More women are in the informal sector, working multiple
jobs or transient low-paying jobs. Thus their employment situation is more precarious than for
men. Nearly 87 percent of women entrepreneurs in the informal sector operate without a
professional address. Frictional unemployment is high.
0% 20% 40% 60% 80% 100%
no education
incomplete primary
completed primary
completed lower secondary
completed upper secondary
TVET
post secondary
agricultu
industry
services
0% 20% 40% 60% 80% 100%
no education
incomplete primary
completed primary
completed lower secondary
completed upper secondary
TVET
post secondary
non-publi
public

27
Figure 16. Education Levels and Wage, Nonwage, and Agricultural Employment, 2009
Source: Cameroon DHS 2009; World Bank staff estimates. The wage category includes those employed in the public sector receiving wages
plus those working in the private, non-agriculture sector receiving wages. The non-wage category includes those working in the non-farm
sector (small enterprises/informal sector). The agriculture category includes those employed in the private, agriculture sector receiving
wages plus those working in the farm sector (small/family farms). (DHS, 2009)
Visible and invisible underemployment
62. Visible underemployment is considerably higher for women than men—as is invisible
underemployment (Figure 17). Invisible unemployment characterizes those employed whose
hourly revenue is less than the minimum hourly. It is calculated by taking the ratio of the
number of employed earning less than the minimum hourly income and the employed
population (Second Survey of Employment and the Informal Sector in Cameroon (EESI 2),
November 2012, Pg. 38). In 2010 visible underemployment was highest among those with a
university education, while invisible underemployment was highest among those with no
education. Visible underemployment had fallen in most regions, with Adamaoua and West
showing the greatest declines, but it increased significantly in the South-West. Invisible
underemployment fell slightly in most regions. Visible underemployment was higher in urban
areas, while invisible underemployment was much higher in rural areas. Visible
underemployment mainly increased in the tertiary sector, while invisible underemployment
was higher in the primary sector. Visible underemployment increased significantly in the public
sector, while invisible underemployment increased in the informal agricultural sector.
0% 20% 40% 60% 80% 100%
no education
incomplete primary
completed primary
completed lower secondary
completed upper secondary
TVET
post secondary
wage
non-wage
agricultu

28
Figure 17. Visible and Invisible Underemployment by Gender, Education Level, Region,
Residence, Economic Sector, and Institutional Type
11.6
11.7
11.8
11.9
12
12.1
12.2
12.3
12.4
12.5
Male Female
Percentage of visible underemployment
by gender
2005
2010
0
10
20
30
40
50
60
70
80
90
Male Female
Percentage of invisible underemployment
by gender
2005
2010
0
5
10
15
20
25
Percentage of visible underemployment
by level of education
2005
2010
0
10
20
30
40
50
60
70
80
90
Percentage of invisible underemployment
by level of education
2005
2010
0
5
10
15
20
25
30
Percentage of visible undermployment
by region
2005
2010
0
10
20
30
40
50
60
70
80
90
100
Dou
ala
Yao
un
de
Adam
aoua
Cen
tre
Est
Extr
ême-
No
rd
Lit
tora
l
Nord
Nord
-Ou
est
Oues
t
Sud
Sud
-Oues
t
Percentage of invisible underemployment
by region
2005
2010

29
0
2
4
6
8
10
12
14
16
urban Rural
Percentage of visible underemployment
by residence
2005
2010
0
10
20
30
40
50
60
70
80
90
urban Rural
Percentage of invisible underemployment
by residence
2005
2010
0
5
10
15
20
25
Primary
sector
Industry Commerce Services
Percentage of visible underemployment
by sector of activity
2005
2010
0
10
20
30
40
50
60
70
80
90
Primary
sector
Industry Commerce Services
Percentage of invisible underemployment
by sector of activity
2005
2010
0
5
10
15
20
25
Percentage of visible underemployment
by institutional type
2005
2010
0
10
20
30
40
50
60
70
80
90
Percentage of invisible underemployment
by institutional type
2005
2010

30
63. One of the main goals of the DSCE is to reduce national underemployment from 76
percent of the workforce in 2005 to 50 percent by 2020. Underemployment dropped by 5
percentage points between 2005 and 2010. Still, in 2010 there was high invisible
underemployment, at 82 percent and visible underemployment of 8.5 percent. The encouraging
trend between 2005 and 2010 needs to be sustained through higher levels of employment
creation in the formal sector—a goal that can be achieved through structural transformation
projects. During that period, education and training programs also underwent qualitative and
quantitative changes.
Enterprise-level constraints
64. As noted, the majority of enterprises and workers in Cameroon are in the informal
sector. Entrepreneurs say that most of the barriers they face relate to the business environment:
practices in the informal sector (a key finding of the Bank’s 2009 Enterprise Survey), high taxes
and a difficult tax regime, widespread corruption, problems accessing credit, excessive
bureaucracy, unfair competition, poor infrastructure, high financing costs, little or no informal
dialogue to promote collective action weak energy and water systems, transportation
challenges, a cumbersome judicial system, problems with training and skills, and inadequate
labor legislation (Figure 18). As a result, Cameroon is not competitive in global markets. If the
human dimension—training and skills—is not addressed, increasing the supply of machinery,
capital investments, and finance will not raise productivity.
Figure 18. Main barriers to entrepreneurship (% cited by entrepreneurs)
Source: Recensement général Des Entreprises (RGE 2009): Rapport principal des résultats, Republic of Cameroon, p.66. Enterprise Surveys, Cameroon Country Report 2009.
Benchmarking Skills and Workforce Productivity
65. The 2009 Enterprise Survey found that 15.5 percent of managers of enterprises in
Cameroon did not have a formal education. Those managers employed 6.8 percent of the
workforce. About 28.7 percent had completed primary education, and they employed 13.3
percent of employees. Another 38.2 percent of managers had a secondary education and
0 10 20 30 40 50 60
No obstacle
Preferential schemes (free zones)
Other
Opportunities
Supply of raw materials
Labor legislation
Training/ Skills
Justice system
Transportation
Energy and water
Absence or inadequacy of sector dialogue
Cost of financing
Infrastructure
Unfair competition
Bureaucracy
Access to credit
Corruption
Tax system
0.51.4
2.55.96.2
8.110.210.711
12.216.4
1818.4
25.835.2
37.650.6
58.8

31
employed 24.4 percent of employees. And 37.1 percent had completed university education,
but they managed only 12.8 percent of employees. Thus the less educated managers oversee a
larger share of employees. This is one of the main weaknesses of the county’s private sector—
and, coupled with poor infrastructure, financial constraints, and a weak business environment,
it has caused enterprise productivity to suffer. Labor productivity benchmarking for a sample
of countries is shown in Figure 19.
Figure 19. Labor Productivity Benchmarking in Various Countries
Notes: Weighted averages, no controls. Sales are in 2009 US$.
Source: World Bank, Enterprise Surveys.
66. There are a few binding constraints to raising productivity for small and medium-size
enterprises in Cameroon (Table 7). Respondents cited weak entrepreneurial skills as well as
technical skills among workers, but not behavioral skills.
Table 7. Binding Constraints to Raising Productivity
Constraint Skill type Explanation
Weak entrepreneurial skills
Managerial skills of the firm’s
owner
Needed for efficient and reliable
production processes; business is well-
known
Technical skills of the firm’s
owner
Know-how and ability to innovate
products in response to shifts in market
demand
Weak worker skills Technical skills Efficient production and high-quality
output
$13,466.00
$23,148.00
$28,337.00
$36,624.00
$40,545.00
$45,391.00
$47,190.00
$60,964.00
$83,782.00
$105,945.00
$113,095.00
$8,741.00
$18,124.00
$25,579.00
$36,624.00
$36,398.00
$41,923.00
$45,081.00
$58,628.00
$81,657.00
$101,952.00
$107,539.00
$0 $20,000 $40,000 $60,000 $80,000 $100,000 $120,000
Vietnam 2009
Thailand 2006
Ethiopia 2011
Kenya 2007
Malaysia 2007
Cameroon 2009
Mexico 2010
South Africa 2007
Brazil 2009
China 2012
Russia 2012
Sales/Total Workers Sales/FT Worker

32
Benchmarking Innovation and Workforce Indicators
67. Cameroon lags behind most countries in terms of competitiveness, with a ranking of
168 among 189 economies. It ranks at 132 for starting a business, mainly because of
cumbersome and time-consuming procedures, long wait times for obtaining licenses to operate,
high operating costs, and the absence of minimum capital to start small and medium-size
enterprises. As of June 2013 no reforms had been reported in any of these areas since the
previous year. Economies that improve in the areas measured by the World Bank. Doing
Business, are more likely to also implement reforms in other areas, such as governance, health,
education, and gender equality. Economies that perform well on Doing Business indicators do
not necessarily have smaller governments. A key area of regulation measured by Doing
Business that constantly affects firms relates to employing workers. But Cameroon lags behind
many countries in this area. It has no business registry, and the absence of a minimum capital
requirement hinders business development and growth.
68. In the formal sector, Cameroon scores well on seven Enterprise Survey indicators for
innovation and workforce relative to the Sub-Saharan average, and on some indicators when
compared to lower-middle-income countries elsewhere. In 2009, 68.3 percent of the firms
surveyed had annual financial statements that were reviewed by external auditors. The high-
risk governance environment could explain this requirement of all firms. But a plausible
explanation is also that Cameroon has very few trained and certified accountants, so firms have
to seek external auditors to audit their financial statements. A second explanation is that firms
receiving foreign direct investment (FDI) are required to have their financial statements
externally reviewed. In terms of the use of innovation and technology for business, Cameroon
ranks on par with other lower-middle-income countries in using email to communicate with
clients and suppliers, but lags behind in having firm-specific websites. Finally, Cameroon lags
behind other lower-middle-income countries in hiring both temporary and permanent full-time
workers (Table 8).
Table 8. Innovation and Workforce Indicators
Indicator
Small
firms
(1-19
employees)
Medium-
size firms
(20-29
employees)
Large
firms
(100+
employees)
Cameroon
Sub-
Saharan
Africa
Lower-
middle-
income
average
% of firms with internationally
recognized quality certification
9.1
31.6
58.0
20.4
13.0
16.0
% of firms with annual financial
statements reviewed by external
auditors
61.6 78.1 79.3 68.3 42.3 48.2
% of firms with their own website 14.8 38.6 68.1 27.5 16.3 32.0
% of firms using email to
communicate with client/suppliers
49.4
70.1
85.6
59.3
44.0
58.3
Average number of temporary
workers
1.6
5.9
24.9
5.3
5.2
11.5
Average number of permanent, full-
time workers
8.6
32.0
201.4
35.3
25.7
60.9
% of full-time female workers 30.4 23.8 21.4 27.6 22.9 31.1 Source: Enterprise Surveys: Cameroon Country Report 2009. World Bank and International Finance Corporation.

33
Investment climate constraints to enterprise productivity
69. Well-performing economies on Doing Business indicators tend to be more inclusive
along at least two dimensions. They tend to have smaller informal sectors, meaning that more
people have access to the formal market—whether in the tertiary sector or in the primary and
secondary sectors—and can benefit from regulations such as social protections and workplace
safety regulations. They are also more likely to have gender equality under the law as measured
by the World Bank Group’s Women, Business and the Law indicators. This means not
hampering the productivity of formal businesses through overly burdensome rules. And it
means not needlessly depriving the economy of the skills and contributions of women. Other
important factors are a well-educated workforce, well-developed infrastructure, and stable
macroeconomic policies.
70. A thriving private sector with new firms entering the market—creating jobs and
developing innovative products—could contribute to a more prosperous Cameroon. The
Government could play a crucial role in supporting a dynamic ecosystem for firms that
establishes the enabling environment, by developing rules, strengthening property rights,
establishing a system for resolving disputes at manageable cost, increasing the predictability
of economic transactions, creating financial regulations that permit access to seed
funding/capital for entrepreneurs to test innovations, and setting boundaries for enforcement.
Entrepreneurs would have greater access to capital to start small and medium-size firms, create
jobs, and serve as engines of growth. Opportunities for business development in the leading
growth sectors—agriculture and agribusiness, forestry/wood processing, infrastructure
(including energy, mining, and petroleum), and tourism—identified in the DSCE.
Skills Utilization and Labor Laws
71. Knowing Cameroon’s labor laws is crucial to understanding working conditions for
employees and their motivation to use their skills. This relates directly to creating an enabling
environment for skilled and unskilled workers to take jobs, whether full-time or part-time. It
also relates to the salary levels of the workforce. Cameroon’s labor laws are based on the Code
du travail, 1974 and the Code du travail du Cameroun, 1992. There is also a National Labor
Council. The key elements of the Labor Code are:
Industrial and commercial enterprises: 40-hour work week
Public sector: 48-hour work week
Agricultural sector: 48-hour work week
Domestic help: 54-hour work week
Security guards and chauffeurs: 56-hour work week
But as discussed, in practice the average work week in Cameroon is only about 39 hours. There
is visible underemployment among the active workforce when they work less than 35 hours a
week in a principal job due to either the employer or because there is no economic justification
for working more. Invisible underemployment is also prevalent because much of the active
workforce earns less than the guaranteed minimum hourly wage.

34
72. National underemployment includes both forms of underemployment—visible and
invisible. According to official data, in 2005 nearly 75 percent of the active workforce was
underemployed. The situation had not improved by 2010. If anything, it deepened: nearly 90
percent of the active workforce was in the informal nonwage sector. Unemployment insurance
does not exist in Cameroon. About 60 percent of the unemployed surveyed preferred a salaried
job, about 22 percent preferred to work independently, and less than 20 percent were indifferent
to the type of employment. By contrast, about 70 percent preferred to be employed full-time
with a 44-hour work week (EESI, 2005 and Njodo, 2012).
73. For Cameroon to accelerate economic growth, it needs to build a thriving and
competitive private sector and a simpler public sector to create an enabling environment for
policy and institutional development. In 2009-10 Cameroon elaborated value chains in each of
the sectors identified as contributing the most to growth. The value chains set out the minimum
thresholds for entering markets, creating jobs, and developing innovative products. The
thresholds include the skills and competencies that would best serve future needs for
developing the sectors. A discussion of value addition in the anticipated growth sectors and the
opportunities and constraints are set out in the next Chapter.
74. Benchmarking of Cameroon and two other Sub-Saharan countries against three
Southeast Asian countries shows that the sectoral composition is consistent (Figure 20):
agricultural contributions have declined over time and industry has increased. Manufacturing
does not show such a dramatic change upward in Cameroon, whereas it does in Thailand and
Malaysia. And services has always been larger than any other sector. If Cameroon aspires to
have an export-oriented economy like some Southeast Asian countries, fostering light
manufacturing could bring big payoffs. It is worth noting that the shares of industry in the three
Southeast Asian economies are almost on par with services, and that there has been a significant
increase over time. But where could it start?

35
Figure 20. Benchmarking the Composition of Economic Sectors across Countries
Source: World Development Indicators, Various years. World Bank staff estimates.
0
10
20
30
40
50
60
70
80
1965 2007
% o
f G
DP
a. Cameroon
0
10
20
30
40
50
60
70
80
1980 2010
% o
f G
DP
b. Senegal
0
10
20
30
40
50
60
70
80
1965 2010
% o
f G
DP
c. Ghana
0
10
20
30
40
50
60
70
80
1965 2010
% o
f G
DP
d. Thailand
0
10
20
30
40
50
60
70
80
1985 2010
% o
f G
DP
e. Malaysia
0
10
20
30
40
50
60
70
80
1985 2010
% o
f G
DP
f. Vietnam
Agriculture Industry Manufacturing Services

36
Chapter 4. Key Economic Sectors for Jobs, Value Addition,
Competitiveness, and Growth
This chapter addresses two questions: What skills are valued in the sectors studied by this
report? And what are the payoffs to those skills?
75. The DSCE identifies unemployment and weak productivity as key challenges for
Cameroon’s development. Thus it seeks to:
Develop more robust formal and informal employment opportunities by strengthening
human development.
Increase productivity in agriculture, mining, and key value chains (such as timber,
tourism, and information and communication technology).
Stimulate growth through investments in critical infrastructure (particularly energy,
roads, port infrastructure, and water supply) and improvements in the business climate
and regional integration.
The DSCE sets an ambitious target of reducing underemployment from 76 percent in 2010 of
the workforce to 50 percent by 2020 by creating tens of thousands of formal jobs. But the
results achieved during the first two years of its implementation suggest that the DSCE is far
from achieving that goal.
76. The Government has identified infrastructure, forestry (wood and wood processing)
agriculture (agribusiness with a focus on cotton textiles and palm oil) tourism, and extractives
as sectors that would generate the most value addition and so accelerate economic growth. The
sectors are quite labor intensive, and could support Cameroon’s structural transformation.
Infrastructure
77. Infrastructure has great potential for workforce value addition and economic growth.
Developing workers’ skills in infrastructure involves fostering a range of generalists and
specialists. For the purposes of this study, infrastructure is defined as construction of public
and private buildings and public works. Infrastructure requires a host of light manufacturing
enterprises, and there are specific workforce and skills requirements in the infrastructure value
chain. For example, light manufacturing entrepreneurs engaged in the fabrication of
construction materials such as ceramics, tiles, bricks, cement-based items (such as balustrades
for stairs), and metal gates and doors. Public works require social and environmental
assessments conducted by qualified engineers, sociologists, anthropologists, communication
specialists to sensitize communities and the public, and sector experts for the construction of
health, education, and water and sanitation facilities. Between 1993 and 2005 employment
opportunities in public works increased by nearly half in Cameroon. Decentralized

37
management (maître d’ouvrage délégué) is the approach used for all construction and public
works.
78. Projections of workforce requirements over 2009-12 showed a significant increase in
the need for construction, rehabilitation, and maintenance of public and private buildings and
for public works. The International Labour Organization estimated that global workforce
requirements for infrastructure would increase 53 percent during that time, though the
workforce for roads was projected to increase by only 1.2 percent. But the demand for
construction of schools and other education facilities and health centers represents a significant
market for workforce. Based on Government projections for investment in infrastructure, for
each of the four fiscal years from 2009 to 2012, the ILO estimated direct jobs to increase by
36,000 in Cameroon, with 47 percent in construction and 45 percent in roads. That rhythm is
set to continue during 2013-20.
79. In 2005, 51.3 percent of public works enterprises in Cameroon were in Douala,
followed by 26.6 percent in Yaoundé.18 Together they comprised a major source of jobs.
Maroua in the Far North region accounted for 6.5 percent and Garoua in the Northern region
for 3.4 percent, followed by Bemenda, Limbé, and Bertoua. All other townships combined had
just 5.3 percent of public works enterprises.
80. About 70 percent of the workforce is employed in 72 percent of public works
enterprises and each year contributes less than FCFA 20 million towards government revenue
(about US$40,000). About 25 percent of employees in the remaining 22 percent of public work
enterprises contribute FCFA 50-100 million (US$100,000-US$2 million) a year, and the
remaining 5 percent employed in just 6 percent of public works enterprises contribute more
than FCFA 100 million (US$2 million) a year. Between 2003 and 2006 workforce productivity
declined, due to a drop in the national demand for construction and public works. Personnel
costs rose 7.3 percent during that time, and the value addition of the workforce fell from 1.86
percent in 2003 to 1.40 in 2006.
81. The structure of all infrastructure employment changed considerably between 2005 and
2006 (Table 9). The demand for skilled workers increased while that for unskilled worked
decreased. Construction and civil works engineering accounts for about 86 percent of all
infrastructure employment.
Table 9. Structure of employment for all infrastructure, 2005 and 2006 (%)
Category 2005 2006
Specialists 5.1 5.3
Skilled technicians 6.7 8.0
Technicians (agents de maîtrise) 17.1 22.7
Unskilled workers 68.7 64.0
Total 100.0 100.0
Source: ILO 2010; INS and ILO staff calculations.
18 The year 2005 was the latest for which data when the value-chain analysis for infrastructure was prepared in 2010. More recent data are in
the EESI II 2010 dataset, but were not available to the task team to update the analysis. The analysis will be updated when INS shares the 2010 data.

38
82. In 2005, 35.2 percent of infrastructure workers were aged 10-24, 36.3 percent were 25-
39, and 21.7 percent were 40-54 (Table 10). Thus a huge number were youth, including those
of school age (10-16). About 89.6 percent of technical personnel at the concept stage had
completed higher education, while 22.4 percent of unskilled workers (those without specific
qualifications) had completed lower, secondary education, 17.8 percent had completed first
cycle of technical secondary education, and 39.6 percent had completed primary education.
Table 10. Characteristics of Infrastructure Workforce by Age Group and Type of Work, 2005
(%)
Age group
Technical
personnel/
concept
stage
Technical
personnel/
rehabilitation
Specialized
workforce
Workforce
without
specific
qualifications
Share of
total
10-24 0.0 8.6 36.5 35.8 35.2
25-39 44.6 48.1 37.5 33.8 36.3
40-54 40.7 38.9 17.1 27.0 21.7
55-69 10.5 4.5 8.9 2.5 6.3
> 70 4.3 0.0 0.0 0.9 0.4
Total 100.0 100.0 100.0 100.0 100.0
Source: ILO 2010; INS and ILO staff calculations.
83. Major constraints for infrastructure development in Cameroon include a shortage of
qualified workers in areas such as accounting, governance, and production of construction
materials. There is also a dearth of qualified environmental experts to conduct environmental
assessments. Most workers have only primary education (Table 11).
Table 11. Education Levels of Infrastructure Workers
Level of education
Technical
personnel/
concept
stage
Technical
personnel/
rehabilitation
Specialized
workforce
Workforce
without
specific
qualifications
%
None 5.6% 3.9% 4.7%
Primary 5.4% 46.2% 39.6% 42.2%
1st cycle general secondary 7.8% 13.9% 22.4% 16.9%
2nd cycle general secondary 10.5% 3.3% 7.0% 6.3% 6.7%
1st cycle secondary technical 16.0% 14.6% 17.8% 15.6%
2nd cycle secondary technical 42.8% 8.1% 8.6% 8.7%
Higher education 89.6% 24.7% 4.6% 1.4% 5.1%
Total 100.0% 100.0% 100.0% 100.0% 100.0%
Source: ILO 2010; INS and ILO staff calculations.
84. Entrepreneurs in Cameroon consider adequate the skills imparted by the country’s
prominent, large, and specialized institutes of technical training. But skills for potential
entrepreneurs require attention. Skills development in commerce and business management—
including basics of economics, taxation, project management, accounting, and specialized
software for accounting, auditing, and record keeping—are critical for increasing workforce

39
value addition. Management training is also required, particularly for civil works inspectors
on industry standards, project managers, human resources managers, accountants, and auditors.
Finally, there is a tendency to abandon projects or to have significant delays. Employment
suffers and workers have little incentive to complete projects.
85. For potential employees, prior technical training in a host of specializations is needed
including in areas such as carpentry, masonry, electricity, plumbing, painting, and roofing.
Some workforce development solutions include capacity development by integrating training
on a large-scale of the required quality within agreed timeframes, to facilitate job opportunities
and on-the-job training. Government plans for skills development are not synchronized with
market needs. Further, multinational corporations are unwilling to build the required capacity
and transfer knowledge on new techniques and technologies. The Government needs to foster
the conditions for such initiatives and devote efforts to new forms of technical training and
technology transfer.
86. Infrastructure has been shifting from labor-intensive to capital-intensive processes, and
is increasingly computerized. More higher-end skills are needed, including supervisory
engineers and long-term skills development. But medium- and short-term skills development
are also crucial. Yet the unskilled account for most infrastructure workers. And infrastructure
is heavily oriented toward seasonal employment.
87. Structural transformation will require skilled workers with engineering, science, and
technology backgrounds. Training needs to be tested and certified. Priority areas include
specialized higher education in engineering (civil, mechanical, sanitation, water, plumbing,
electrical), technology (computer-aided design, or CAD), and computer-aided management
(CAM). But the paradox for infrastructure in Cameroon is that the sector’s most highly
educated and its illiterate workers find employment last. Nearly half of workers aged 25-34
with at least an undergraduate degree were unemployed (ILO 2010; ILO staff estimates based
on ECAM 3 data). Thus a high-quality technical education could better serve people in that age
bracket seeking work in infrastructure. But workers with a strong engineering and technology
background could attract foreign direct investment and achieve structural transformation.
Forestry (Wood and Wood Processing)
88. Cameroon has the second largest natural forest area in sub-Saharan Africa, strict laws
on forest management, and the region’s most developed forestry industry in sub-Saharan
Africa. Limits on exports of wood logs have helped create jobs, particularly among small
enterprises involved in wood processing. The largest enterprises are owned by firms from
France, Lebanon, Italy, Belgium, Greece, the Netherlands, China, and Malaysia. Most of them
operate in Douala, Yaoundé, and Limbé.
89. In 2005 Cameroon’s wood industry contributed about 6 percent to GDP. That same
year, the wood and wood processing industry accounted for 170,000 jobs—150,000 in the

40
informal sector and 20,000 in the formal sector. Because startup costs are relatively low, many
illegal and unregistered small enterprises are in operation. They mostly employ unskilled
workers such as artisans and carpenters. The laws of 1999 paved the way for second-stage
transformation in the country’s value chain
90. The wood industry had generated a value of 228 billion Fcfa (US$456 million) in 2005.
The Government sought to diversify products, attract new importers, and develop local wood
producers. Those efforts were expected to create 21,000 full-time jobs and 15,000 part-time
ones, with the value addition estimated at 126 billion Fcfa (US$252 million). The estimated
cost was 1.36 billion Fcfa (US$2.72 million), for a benefit-cost ratio of Fcfa 0.92 of gross
revenue for every franc invested. The Government provides subsidies for large enterprises.
Small enterprises receive none, so they tend to be informal.
91. The value chain in the wood industry is based on Government classifications of
enterprises (Table 12). Most wood enterprises (134) are involved in stage 1 transformation, 36
in the first two stages, 21 in the first three stages, and 8 in all four stages (MINEFOF 2012).
Table 12. Value Chain in the Wood Industry
Stage 1
Transformation
Stage 2
transformation
Stage 3
transformation
Stage 4
transformation
Definition
Primary processing
of wood logs;
sawmill trades
Heavy manufacturing
Capital-intensive
Transformation of stage 1 products into
semi-finished or finished outputs through
supplementary processing
Light manufacturing
amenable /
labor-intensive
Making available
products for final
consumption
Light manufacturing
amenable /
labor-intensive
Examples
• Sawing timber of
all sizes
• Creating squared
washers and studs
• Slicing and peeling
of veneer
• Hydraulically
assembled wood
(BHA)
• Reconstituted
solid wood
• Paneling, parquet
floors, wrinkles,
decks
• Drying of all sawn
products
• Fabricating wood
briquettes/bricks
• Laminating and
gluing
• Fabricating
particle board
• Backing wood to
prevent
deterioration
• Other wooden
gadgets
• Furniture
• Doors and
doorframes
• Windows
• All ready to use
wood products
Source: Government of Cameroon Decision 2637/D/MINEFOF of June 12, 2012; MINEPAT, PCFC Value Chain Report, January 2014.
92. Wood enterprises and jobs are concentrated around the Center, East, Littoral, and South
Regions (Table 13). Their location is linked to forest cover and infrastructure, making
transportation of raw materials and final products relatively efficient. The most recent data
from MINEPAT and MINEFOF indicate that 77.6 percent of the wood industry workforce is
composed of specialized workers. This is in keeping with the national legislation of collective
enterprises for the wood industry (access, transformation, and forest byproducts). Professional
workers comprise about 18.1 percent, and only 3.5 percent are high-level graduates (with a

41
master’s degree or professional engineers). Moreover, only 2 percent of this last category is
employed.
Table 13. Regional Distribution of Employment in the Wood Industry
Enterprise typology Region Full-time
employees
Wood transformation enterprises
Center 39.0%
East 30.6%
Littoral 20.5%
South 9.8%
Artisanal enterprises
Center 40.7%
East 22.0%
Littoral 20.1%
South 17.2%
Source: Ibid
93. All stages of the forestry and wood industry are labor-intensive and offer employment
opportunities. Jobs in rural areas include sawers, assistant sawers, porters, chauffeurs, and
assistant chauffeurs; in urban areas employment opportunities include vendors, transporters,
door-to-door salespeople, and food vendors who use processed wood materials (such as bowls,
plates, and trays). In addition, potential spillover benefits exist in linking the outputs of the
wood industry to the value addition of tourism (see below).
94. Cameroon could increase the economic contribution of its forestry and wood industry.
There are not enough qualified workers for stages two and three transformation of raw
materials to produce export-quality products (carpentry, panels, woodworking, carpentry,
wood construction, cooperage, drying, packaging, pallets). The country also suffers from the
absence of a well-organized structure for vocational and technical training for the wood
industry, the lack of opportunities for apprenticeships, and forestry experts (mid- to high-level
expertise) with knowledge about conservation, reforestation, and forestry management.
95. An analysis of vocational and technical education and training in Cameroon’s public
and private wood industry found many weaknesses:
Several training centers affiliated with universities offer training in wood processing—
but they are not producing enough graduates and offer few courses.
The centers have poorly qualified but highly paid trainers, making courses expensive.
Most training centers do not have conducive learning environments: not just staff, but
also learning materials and equipment.19
Still, the training centers are the only providers of formal training for wood processing. There
are also many informal training centers and programs offering low-quality training.
19 Ministère de l’Economie, de la Planification et de L’Aménagement du Territoire (MINEPAT) diagnostic
commissioned for the ‘Projet Compétitivité des Filières de Croissance’ (PCFC). World Bank financed IDA-47800
CM. Report prepared by Pro-Invest. January 2014.

42
Cameroon needs to invest in training in the commercial production of saplings, scaling up the
use of sustainable technology, and upgrading the skills of trainers.
Agriculture and Agribusiness
96. The Government of Cameroon has identified six areas in agriculture as key profitable:
cotton, palm oil, maize, manioc, banana-plantain, and aviculture. The main stages in the value
chain for agriculture are the supply of inputs, production on farms, collection, processing, and
final delivery.20 Cameroon could become a major Sub-Saharan source of manioc, maize, and
banana-plantain—creating a lot of jobs and revenue, as well as developing skills.
97. This study analyzed only cotton and palm oil. Cotton is a major source of revenue for
populations in the relatively poor parts of Cameroon—especially the North Region. Cotton can
also benefit other sectors (such as tourism) at the national level, and could earn major revenue
through regional and international exports. Palm oil offers promise for agribusiness and has
high potential for exports. There is also significant national market for it. Most cotton is
cultivated in the North Region, while palm oil, cocoa, and coffee grow well in the West, South,
and Central Regions.
98. Cameroon has a good foundation for agroindustry. The country’s 1 million small farms
specialize in traditional agriculture, improved rainfed agriculture, intensive irrigated
cultivation, pastoralism, and agro-pastoralism, producing many cereals and other foods.
Medium-size and large farms are more specialized and typically have professional managers,
salaried employees, and more mechanization. There are about 20 large public and private
agroindustries, and their outputs are often exported. They have salaried employees and depend
on the inputs from small and medium-size farms.
99. Agriculture production is organized in a hierarchy of inputs, with improvements
changes in scale at each level (Table 14).
20 World Bank. June 2008. Cameroun : Étude de compétitivité de la chaîne de valeur du secteur agricole. Report No.AAA25-CM. Agriculture
and Rural Development Department. Africa Region. Washington, D.C.

43
Table 14. Hierarchy of Agroindustry and Worker Needs
Small scale Medium scale / taking to scale Large scale
----------------------------------------------------------------------------------------------------------------------------
Farm-level;
inputs use
relatively small
Farm-level;
improved management
of inputs
Commercial
level
production
Agro-industrial large
enterprises;
Extensive inputs use
Manual
(Intensive ; 1 ha in total)
Manual
(Intensive; 3 ha in total)
Manual
(Intensive tending towards
extensive ;
5 ha au total)
Tractors or manual
(extensive)
Small-scale inputs Medium-scale inputs Medium-larger scale
inputs
Large-scale inputs
Markets close to farms Markets in the
proximity of farms
Markets far off; products
have to be transported
In-house production; raw
material transported to
site of production
Limited use of
equipment
Greater use of
equipment
Use of technologically
adapted equipment
Modern
equipment
Family
workers
Combination of family
workers plus some
salaried workers/
contractors
Mostly
salaried
workforce
Only
salaried
workers
Entrepreneurship skills;
Unskilled workforce;
apprenticeship
Entrepreneurship skills;
Some managerial skills;
Unskilled and skilled
workforce
Entrepreneurship skills;
Management skills;
Skilled workforce
Management skills;
Skilled workforce
Source: World Bank, 2008.
100. Agriculture suffers from a limited number of workers trained in good farming practices,
management skills, and access to inexpensive inputs. As in other sectors, many agricultural
jobs are informal. Investors could offer opportunities for investment—but investors would need
to see a potential for returns. Young people do not consider agriculture an exciting career path.
Reestablishing agriculture as agribusiness, with the potential for technology-based innovations,
would make it more attractive.
Institutions and Agriculture
101. Reforms in the 1990s promoted liberalization and privatization of economic activities
in Cameroon. As in the other sectors, there are a number of players in the agriculture sector
(Table 15). Each of the programs has distinct capacity building elements.

44
Table 15. Programs and Institutions in the Agriculture Sector
Program Institutions involved Focus
National program to promote
public access to agricultural
research (PNVRA)
World Bank/IDA
Government21 (MINAGRI; MINEPIA;
MIDENO; SOWEDA; SODECOTON)
African Development Bank
National policy for improving and
sustaining agricultural productivity;
Technical capacity (operational and
financial) development;
Improving information on services;
Accelerating technology transfer.
Program for the reform of the
fertilizers sub-sector
USAID
National Office for the commercialization of
basic agricultural products [l’Office national
de commercialisation des produits de base
(ONCPB)]
Support to private sector producers;
Commercialization of fertilizers;
Institutional capacity development
Project to support Strategies of
farmers and the
professionalization of agriculture
[Projet d’appui aux stratégies
paysannes et à la
professionnalisation de
l’agriculture (ASPPA)]
Churches
Non-governmental organizations
International donors/
development partners [French Development
Cooperation --Agence Française de
Développement (AFD) program such as the
C2D—Contrat des désendettements et de
développement]
Institutional capacity development;
Professionalization of small farmers
All ACP Agricultural
Commodities Program (AAACP)
European Union (EU) (cocoa, coffee, milk)
World Bank, FAO, Centre du commerce
international (CCI), CNUCED and CFC
(cotton)
Fond international pour le développement de
l’agriculture (FIDA)
Preparing sustainable strategies for
agricultural production to improve
revenues and access to resources for
producers
Source: World Bank, June 2008.
102. A number of programs for institutional capacity development support the current
workforce and could help transfer technological know-how. But Government officials say that
the programs bring financing but little knowledge transfer.
103. In the short term, food prices need to be lowered to help poor people. Over time, small
farmers need to become more productive. Increasing access to better inputs and production
technologies could improve output, which would require technical training for farmers in areas
such as information sharing—such as through text messages. Lower transportation costs would
also help.
104. All cost reduction strategies will require improving production technologies and the
knowledge of farmers. Approaches to fertilizer use, direct imports of fertilizers, rationalizing
the distribution channels by using collective management techniques, and information on value
added tax could improve production, lower costs, and make Cameroon’s products more
competitive.
105. Cameroon’s agricultural products enjoy regional markets in Gabon, Guinea Equatorial,
the Central African Republic, the Republic of Congo, and Chad. The Economic Partnership
Agreement (EPA) negotiated between CEMAC (Communauté Économique et Monétaire de
21 Government includes the following ministries and missions: Ministère de l’agriculture (MINAGRI), Ministère de l’élevage, des pêches et
des industries animals (MINEPIA), Mission de développement du nord-enterprises paraétatiques (ex. SODECOTON), l’institut de recherche agricole pour le développement (IRAD). Source: World Bank, 2008.

45
l’Afrique Centrale) countries and the European Union could lower Cameroonian tariffs and
open the country’s market to foreign competition. Investments in technology, inputs, and credit
will be key drivers. Using options such as savings and insurance to raise agricultural
productivity (as in Rwanda) and combining financing and skills development approaches
would help maximize returns.
Cotton Textiles
106. Cameroon has a regional comparative advantage in converting cotton textiles into mass
clothing, and in distribution. These are the third and fourth stages in the value chain. (The first
two are the transformation of raw cotton into fiber and fiber into cloth, thread, and the like.) It
is the only country in Central Africa that has manufacturing capacity for making final products
that satisfy the national market.
107. Cameroon needs to foster regional exports. Workers can produce innovative cotton
loincloths and textiles. They have long produced stretch material, know their clients’ needs,
and are nearby. Cotton textiles could also boost tourism (see below).
108. Some constraints make it difficult for cotton to move to foreign markets. Most output
is produced by informal workers with limited knowledge. They have limited expertise and
training. Apprenticeships are the main way of transferring know-how. And regulations on
intellectual property are weak. The shortcomings arise from infrastructure weaknesses, the low
level of pre-service training, and few options for re-tooling or learning new methods of
production.
109. Some workforce skills development solutions include capacity development by
integrating training in basic, homogenous techniques of production, mastering export-oriented
procedures for external markets, promoting capacity for large deliveries, and improving job
opportunities and training.
Palm Oil
110. Palm oil production could reduce poverty in Cameroon. Because such activities are not
mechanized, they require that jobs be created in forests. Revenue from palm oil is fairly stable.
The industry is relatively small and caters to national and regional consumption. It is not a full-
fledged secondary level transformation industry. About 135,000 hectares are farmed and about
30,000 hectares have been reserved for agroindustry, with a transformation capacity of about
250,000 metric tons of palm oil that could grow by nearly 10,000 hectares a year. Table 16
shows the evolution of raw palm oil production in Cameroon over time. Palm oil cultivation
area increased by nearly a third between 2003 and 2008 (Table 16).

46
Table 16. Raw palm oil production (2003-2008)
2003 2004 2005 2006 2007 2008
Agro-
industrialists 116,520 119,390 127,435 128,854 131,485 131,485
Village level
plantations 52,680 58,680 64,880 70,680 76,680 82,680
Total 169,200 178,070 192,115 199,534 208,165 214,165
Source: World Bank, November 2009.
111. The Government has found it impossible to determine how many jobs palm oil can
generate. Approximately 65,000 direct and indirect jobs are estimated for palm oil production.
Plantations (agroindustries) use large numbers of unskilled hourly workers, making it a village-
level industry. Elevating the agroindustry to a larger scale would create more jobs.
112. The five main agroindustries in Cameroon produced about 145,000 metric tons in 2008
(Table 17). The enterprises employ around 30,000 direct employees, for a global investment of
110 billion Fcfa (US$220 million). Privatization led to significant returns. In agroindustry the
objective was to remove entry barriers for new operators with available capital and knowledge
about the production of palm oil for commercial purposes. SOCAPALM was privatized
successfully. This resulted in more forest areas being cultivated for harvesting palm oil.
Table 17. Agroindustries and Their Locations
Social denomination Location Production (in tons)
SOCAPALM Mbongo, Nkapa, Kienke, Eseka 83,000
CDC Limbe, Idenau 18,000
SPFS Apouh (Edea) 15,000
SAFACAM Dizangue (Edea) 12,000
PAMOL Lobe 16,000
Source: World Bank, November 2009. Etude sur la filière porteuse d’emploi « Palmier à Huile ». MINEFOP and ILO. Lebailly, Philippe
and Jean Tentchou. International Consultants.
113. Most village plantations are artisanal. In 2009 the trade union that represents small
farmers—l’Union des Exploitants de Palmier à Huile (UNEXPALM)—brought together nearly
1 million planters among 10,000 small farmers who cultivate about 35,000 hectares. They
produced about 30,000 tons of raw palm oil. Improvements in harvesting could increase those
yields.
114. More extension workers are needed to improve cultivation. A major challenge has been
about attracting qualified workforce from the Anglophone regions of the country to work in
the more remote Southern and Eastern regions. More densely populated and urbanized areas
are home to most qualified workers, but more data on palm oil workers are needed.
115. The palm oil value chain is amenable to labor-intensive production (Table 18).

47
Table 18. Workforce in the Palm Oil Value Chain
Category Characteristics Potential and Needs
Producers
Cueilleurs
Village plantations
Represented by the Union [l’Union des
exploitants de palmier à huile du Cameroun
(UNEXPALM)]
Supply 10-20 % to artisans
Cultivation of primary product typically in old
abandoned industrial plantations
They focus on rapid returns to capital
investment
Generally poor and vulnerable
They often take the route of risk mitigation
than profit maximization
Data/statistics on numbers of producers
unavailable
Most important category
for skills development
Data/statistics on numbers
of producers
Agro-industrialists
Producers are protected by two trade unions:
the National Union of Palm Oil Producers of
Cameroon [le Syndicat national des
producteurs de l’huile de palme au Cameroun
(SNPHPC)]
The Association of Palm Oil by-Products
Transformers [L’Association des
Transformateurs des Produits Oléagineaux
(ATPO)] [30,000 jobs with 6,000 jobs for
transformation]
Five large and most established (old) ones:
Ferme Suisse, Pamol, Safacam, CDC and
SOCAPALM
Procuring primary products
Organizing its collection (in bulk/wholesale)
Mid- and high-level
management skills
Village plantations mostly
inaccessible to the agro-
industrialists
Local transformers
Informal sector
Artisanal transformers
Set up in make-shift or rented premises
Mostly manual transformation not automation
Low level of outputs (between 15-18% at most
from the best performers compared to industry
equivalent of 22%)
The by-products are used as fuel for cooking
walnuts
Amenable to light manufacturing
Product diversification,
management, and
marketing skills
A major handicap since the
almonds of palms are
highly sought by the soap-
making industry
Information about markets
for primary and by-
products
Data/statistics
Commercial agents
Importers who supply to transformers
Wholesalers who target mostly agro-
industrialists
Middlemen linked to wholesalers
Located in the informal rural setting or urban
setting
Marketing skills,
negotiating skills
Information
Data/statistics
Transporters
All types and modes (walking, pushcarts,
bicycle, cars, vans, trucks…) at different
stages of transformation
Management and
Organization skills,
Defensive driving skills

48
Fats and soap-making
industry
Stage II transformation
Use modern factories to transform palm oil—
Light manufacturing
Export quality production
High distribution costs—not competitive
Knowledge about the
industry
Management skills
Source: World Bank, November 2009.
116. Cameroon’s ability to produce palm oil is relatively weak. Maximum production yields
18-19 tons per hectare, compared with 25 in Indonesia—which, along with Malaysia, is among
the world’s top producers. For the more extensive production system, Cameroon can produce
9 tons a hectare, while Asian countries can produce 11.
117. Wages are among the top costs of palm oil production. Farmers say that they pay
workers about 20,000 Fcfa (about US$40 on average per ton produced). But workers say that
they receive only 12,000 Fcfa (about US$24). According to SMIG, a worker is supposed to
receive 28,000 Fcfa per month. For small farmers, transportation is a close second cost.
118. The palm oil industry is a precarious option for young workers. They do not have access
to factors of production: land, human, and financial capital. In urban areas youth tend to attend
school and university. In rural areas they are less likely to do so.
Tourism
119. Tourism could create decent jobs and foster Cameroon’s economic growth. With
modest investment in infrastructure, tourism has the potential to create more than 5,100 short-
term and permanent direct, indirect, and induced jobs.22 Building three-star hotels with
conference facilities could create jobs and generate investments.
120. The Government has not invested effectively in tourism. Weak infrastructure
(communications, roads, sanitation) and a lacking service culture are major obstacles. Further,
the Ministry of Tourism (MINFOF) does not have regional departments, and there are no
synergies between the ministry and national security to promote tourism in Cameroon.
UNWTO-OMT envisioned the arrival of 500,000 visitors in 2007, but only 196,000 arrived.
The global fiscal crisis and its impact on Cameroon’s economy further depressed tourism the
following year (2008).
121. MINFOF’s budget rose 234 percent for recurrent and 333 percent for investment
spending between fiscal years 1996/97 to 2009. Yet the budget for tourism accounts for just 1
percent of the national budget. Moreover, the tourism industry is poorly organized, caters to
few tourists, and has not contributed much to GDP.
122. Tourism is most prominent in the Littoral and Central Regions. It has generated 5,633
jobs in Limbe (Littoral) and 3,979 in Kribi (Littoral). Tourist agencies are also concentrated
22 MINEFOP and ILO. 2009. “ Projet d’Appui à la Promotion de l’Emploi et à la Réduction de la Pauvreté : Etude sur le filière porteuses
d’emploi « Le Tourisme ». Onana, Zacharie Ewolo. Yaoundé.

49
around the two regions. Most tourist hotels are unclassified (no stars). Domestic travel is
difficult due to limited infrastructure—only major highways, with inadequate railroads and
unreliable lights.
123. About 20 public entities are engaged in tourism activities (Table 19). Coordinating them
is a challenge, and the industry remains at a nascent stage. Still, Cameroon’s plants and animals
could generate significant tourism revenue.
Table 19. Public Entities Involved in Tourism
Entity Responsibility
Ministry of Environment and Protection of Nature Management of protected areas
Ministry of Forestry and Fauna Management of forests, fauna, conserved areas,
hunting and exports of “trophées”
Ministry of Culture Inventory of principal cultural activities and
promotion of national culture
Ministry of Higher Education High level training and mastery in tourism studies
Ministry of Secondary Education Mid-level training in tourism studies
Ministry of Technical and Vocational Education
and Training Technical and vocational training in tourism studies
Ministry of Finance Tourism finance, accounting for tourism satellites,
immigration and exchange
Ministry of Economy, Planning, and Regional
Integration
Programming investments, territorial management
(tourist zones)
Ministry of Agriculture and Rural Development Export of foodstuffs
Ministry of Defense Security of people and tourists
Ministry of the Interior and Decentralization Oversight of local offices/agencies of tourism
National Security Delegation Assuring security of persons, goods, border control,
visa administration at national borders
Ministry of Small and Medium Enterprises, Social
and Artisan Administration Exports of artisanal products
Ministry of Commerce Investment code
Ministry of National Health National health and vaccinations
Ministry of Transport and National Airports
Authority
Transport tariffs, Aéroports du Cameroun (ADC)
administration
Ministry of Communication
Promotion of tourism through information for tourists
and communication/media campaigns to sensitize the
population
Ministry of External Relations Visas and communication of information regarding
Cameroon to tourists
Ministry of Scientific Research and Innovation Research in codification of Cameroonian cuisine
Ministry of Public Works
Construction, maintenance and rehabilitation of
tourist sites, roads/highways in general, public water
and sanitation, airports
Source: MINEFOP and ILO, 2009.
124. Tourism training is offered by 38 public and private institutions:
Among the public institutions, five technical training institutes offer hotel management.
The most prominent are in Kribi and Limbé. The University of Yaoundé I has two
faculties for hotel management and tourism, but they only provide licenses for tourist

50
guides. The School for Hotels and Tourism of CEMAC, in N’gaoundéré, offers the
most diverse training. The Ministry of Higher Education (MINESUP)—in
collaboration with the Ministry of Tourism and the French Cooperation (Coopération
Française)—offers a license in tourism and hotel management in select universities,
and the Training Institute in Garoua (North Region) for preparation of tourist guides.
Among the private institutions, the most prominent are the Centers for Short-term Rapid
Training (attestation programs, not diplomas) in Yaoundé and Douala and higher
education institutions that provide Brevet de Technicien Supérieur (BTS) in tourism
and hotel management.
Most ecotourism projects are initiated by NGOs such as the World Wildlife Fund
(WWF), International Union of Nature and Natural Resources Conservation (UICN),
and Birdlife International.
125. The quality of training varies, but in most cases falls short of its potential (Table 20).
Table 20. The Quality of Tourism Training
Aspect Assessment
Training environment
Generally poor and not conducive to learning. Most training centers are
in noisy neighborhoods, in rented buildings intended for residences.
Short-term courses in hotels do not have the required facilities. Trainees
pay all of their expenses.
Program options
Not well defined. No options for on-the-job training. Tourism has been
reduced to hotels and restaurants. The conceptualization, organization,
and distribution of tourism related voyages/trips relating to tourism
packages is entirely missing. This domain could offer significant job
opportunities.
Relevance to market demand Programs are poorly targeted, insufficiently elaborated, and not adapted
to the tourism industry.
Pedagogical support Highly theoretical and relatively disconnected from reality.
Training personnel Not up to the standards required for training tourism professionals.
Extractives
126. Among extractive industries, mining has the most potential to create a lot of jobs. But
it requires significant infrastructure investments as well as a steady supply of commodities.
Creating jobs in mining will depend on the extent of excavations and the choice of technology
(labor-intensive or machine-intensive). Thus, it is difficult to project job creation in mining.
127. The Government has identified diamond, cobalt-nickel, iron, and bauxite as some of
the key minerals for excavation. The Capacity Development in Mining Project (PRECASEM)
had estimated some levels of investment and employment for 2012-15 (Table 21).

51
Table 21. Minerals, Estimated investment, and Employment, 2012-15 Project Estimated
Investment
Estimated
Employment
Transformation
(Units)
Territorial
Management
Estimated
Exports
Diamond (Mobilong)
US$233 mil
4,000 (direct jobs during
the excavation phase of
transformation)
Sediment sorting Local infrastructure
6,000 carats
Cobalt-nickel US$617 mil 800 (direct jobs) 450 (indirect jobs)
Ore processing plant 4,000-5,500 tons of cobalt
Iron ore (Mbalam)
US$4.68 bil 3,000 (direct jobs) Ore processing plant
Railway, port
terminal, local
infrastructure
No production
Bauxite
(Minim-Martap) US$5 bil
7,000 (direct jobs), 6,000 – 8,000 (indirect
jobs)
Aluminum refinery, dam, hydroelectric
power plant
Railway, port terminal, local
infrastructure
No production
128. In keeping with the Strategic Development for the Geology and Mining Sector in
Cameroon, projections for the medium-term (2015-25) are:
The completion of iron ore excavations in Mbalam in 2016 and of bauxite in Minim-
Martap in 2019, and the commencement of production.
The next stage of transformation following the excavation of diamond mines in
Mobilong and cobalt in Lomié.
The construction of gold mines in the industrial South-East in 2018, of uranium in Poli,
Lolodorf, in 2019, and of titanium in Akonolinga in 2019.
By 2020 the excavations would be complete and production would commence.
129. The jobs forecast for the medium-term (2015-2025) are provided in Table 22.

52
Table 22. Estimated impact of mining operations in the medium-term (2015-2025)
Project Investment Employment Transformation
factories
Territorial
Management
Estimated
Exports
Diamond (Mobilong)
US$223 mil net 4,000 (direct jobs)
Sediment sorting Local infrastructure constructed
6,000 carats
Cobalt- Nickel (Lomié)
US$617 mil net
800
(direct jobs) 450
(indirect jobs)
Ore processing plant Integration of roads and bridges
4,000-5,500 tons of cobalt
Iron Ore (Mbalam)
US$4.68 bil net
US$3.14 bil (Phase 2)
3,000 (direct jobs)
Ore processing plant Ore enrichment plant
Railway, port
terminal, local infrastructure
30 metric tons of iron
Bauxite (Minim-
Martap) US$5 bil net
1,500-2,000 (direct
jobs)
4,000 (indirect jobs)
Aluminium refinery, dam, hydroelectric
power plant
Railway, port terminal, local
infrastructure
3 metric tons of
aluminium
Gold (Industrial
South-East Region
of Cameroon)
US$200 mil (estimated)
500 (estimated jobs)
Processing plant Local infrastructure 3,000 kgs of gold
Uranium
(Poli-Kitongo Lolodorf Teubang)
US$1 bil
(estimated)
500
(estimated jobs)
Ore processing plant
and yellow cake manufacturing
Local infrastructure
800 tons per year
of enriched mineral
Titanium (Akonoling)
US$300 mil (estimated)
600
(direct jobs) 300
(indirect jobs)
Mineral processing Local infrastructure 30, 000 tons per year of rutile
130. The long-term (2025-2080) estimates translate to:
• Continued and progressive excavations and extraction of the mines already in place
except if new reserves are found in the neighboring areas (probable).
• The production of new resources currently known as Colombo tantalite, syénite
néphélinique, granites (rose or black), or those discovered during the process of
geological and mineral exploration.
131. With respect to jobs, taking into account the short, medium, and long-term needs, the
occupations could be classified under strategic categories (Table 23):

53
Table 23. Strategic Occupations in Mining
Occupations Needs Where should the training be
received?
Jobs in Prospection - Geologist
- Geomtric Topographer
- Geochemist
- Geophysicist
- Driller
- In the short-term: stable
- In the medium-term:
depends considerably on the
success of the first phase
transformation phase
Graduates and post-graduates
from Universities with
specialized programs of study in
geology
Jobs in construction - Civil engineering Supervisors: Head of
civil engineering and construction
- Masons
- Plumbers
- Logisticians (transport road and rail)
- Electricians (industrial et buildings)
- Mechanical engineers
- In the short-term :important
– In the medium-term :
depends on the extent and
pace of excavations/
exploration
(commencement of mining
operations)
- Graduates and post-graduates
from Universities with
specialized programs of study in
civil and mechanical engineering
- Diploma holders from
technical training institutes or
vocational training centers
Jobs in excavation/exploration - Metallurgists/Chemists
- Head of Mining sub-sector
- Engine operators
- Electro-mechanists
- Maintenance technicians
- Technicians in electronics/Automotives
- Welders/solders
- Coordinator of Health and Security
- Head of community relations
- Jobs depend on the pace of
construction and excavation.
They follow within a space of
2-5 years after sites have
been constructed and
excavated.
- Degree holders from
Universities with specialized
programs in engineering
- Diploma holders from
technical training
institutes/vocational training
institutes
Closing and renovation of sites - Social and Environmental specialist
- Needed for the long-term
- Degree holders/graduates from
Universities with specialized
programs in environmental
sciences
132. An analysis of employment needs undertaken by the PRECASEM project reveals a
considerable number of induced jobs by mineral and mining site. In the short-term they total
about 24,300 jobs, in the medium-term approximately 13,400 and in the long-term about
10,400.
133. Table 24 shows the mapping of induced jobs by mineral, mining site, and time period:
Table 24. Estimated Induced jobs in Mining
Mineral Mining Site
Induced Jobs
Short-term
(2013-2020)
Medium-term
(2020-2030)
Long-term
(2030-2080)
Diamonds Mobilong 4,000 2,000 1,000
Cobalt-Nickel Lomié 800 800 800
Iron ore Mbalam/Djoum 12,000 6,000 4,000
Bauxite Mini-Martap 7,000 3,000 3,000
Gold South-East 500 500 500
Uranium Poli 500 500
Titanium Akonolinga 600 600
Total 24,300 13,400 10,400

54
134. Among the primary challenges for Cameroon is a dearth of qualified workforce in all
specialized areas. While there are centers of professional training, technical training institutes,
and some programs in universities (Table 25), the quantity and quality of the trained are
insufficient to meet the estimated demand. Further evaluation of the institutions is required to
assess the programs being offered, the curriculum, their quality and relevance to the mining
industry, whether graduates are finding jobs, and which programs are most popular and why.
Table 25. Training Institutes and University Programs by Location
Les Centres de Formation professionnelle
Location
Centre de formation Professionnelle lassalien Van Haygen Bertoua
Centre de Formation Professionnelle aux Métiers d l’Industrie de
Nyom (CFMIN)
Yaoundé
Centre de Formation professionnelle aux Métiers Miniers
(CEPROMINES)
Yaoundé
Techniciens Génie Civil Réunis formation (TGCR) Yaoundé
Professionnal Excelency Training Center (PTEC) Edéa
Centre de Formation Professionnelle Continue de la Salle (CFPC) Douala
Centre de Formation Professionnelle Amour Fraternité (CEFOPRAF) Douala
Techniciens et Ingénieurs en Agro-Alimentaire (TINAGRI) Ngaoundéré
Homelex Sarl Douala
Matgénie Yaoundé
Technical Training Colleges
Lycée Technique Edéa
Lycée Technique Kousséri
Lycée Technique Sanmélima
University-affiliated Colleges/Institutes
Ecole de Géologie et des Mines (EGEM) Maiguenga
Ecole Nationale Supérieure des Sciences Agro Industrielles (ENSAI) N’Gaoundéré
Institut Universitaire de Technologie N’Gaoundéré
Institut Universitaire du Sahel Maroua
Les organismes d’intervention en Hygiène Sécurité Environnement
Barakat SA
Douala
Information and Communication Technology
135. There is a large untapped market for new entrants in Cameroon’s markets, particularly
in information technology (IT) and information technology enabled-services (ITES). Structural
change could be fostered by developing basic skills, assessment, and certification programs in
internationally benchmarked ITES. The potential of social media could also be harnessed.
136. IT skills can enhance competitiveness in a broad range of sectors, including e-
government initiatives. Improving the competitiveness of Cameroon would require: (i) a
sustained flow of employable skills, including IT skills: (ii) competitive labor costs; (iii)
conducive business climate; (iv) infrastructure and quality relevant to the industry; (v)
sustaining investments in IT-related secondary and post-basic education.

55
137. For Cameroon to achieve structural transformation, it must identify skill gaps in
technology and innovation. The assessment could form the basis for providing training and
certifying skilled individuals. Cameroonian youth lack market-relevant skills in IT and ITES.
Higher education enrollments in applied sciences, engineering, and technology are very low.
Women’s representation is especially low in science and technology courses, research
professions, and leadership.
The Foundations for Workforce Value Addition
138. The value-chain analyses conducted for this study focused on the lack of workers with
needed skills (Table 26). Slow job growth was cited as the second main problem, followed by
lack of access to financial and social capital, problems with job matching, insufficient
entrepreneurial skills, insufficient basic skills, and employer discrimination. The value-chain
analyses were less useful at forecasting labor and skill needs.
Table 26. Sectors and constrains regarding workforce availability
Constraints Infrastructure. Wood Ag / Agri-
bus. Cotton Palm oil Tourism Technology
Job-relevant skills constraints
Insufficient basic skills x X
Technical skills mismatch x xxx x x xxx X
Behavioral skills mismatch
Insufficient entrepreneurial
skills x X
Lack of labor demand Slow job-growth economy x X x X
Employer discrimination x
Job search constraints Job matching x X
Signaling competencies X
Firm start-up constraints Lack of access to financial or
social capital xx x X
Social constraints on the
supply side
Excluded-group constraints
(ethnicity, gender, etc.) x X
Source: Cunningham, Wendy, Maria Laura Sanchez-Puerta, Alice Wuermli, November 2010. Active Labor Market Programs for Youth: A
Framework to Guide Youth Employment Interventions. World Bank Employment Policy Primer. No. 16. Washington, D.C.
Conclusion
139. Cameroon has latent potential for creating productive jobs in infrastructure, wood
processing, cotton textiles, palm oil, and tourism. The strategic basis (enabling environment,
laws, regulations) exist to varying degrees for each of the sectors. The Government needs to
ensure a minimum threshold of capital-intensive investments for structural transformation of
production processes. Labor-intensive structural transformation is also required. Workforce
value addition would be a key condition to enhance the skills development and accumulation
effect. Together the aggregation and accumulation effects could result in sustained, inclusive
growth.

56
140. An unduly heavy and centralized system—with a plethora of ministries, institutions,
and oversight structures—is paralyzing action in Cameroon. Civil service reforms and
streamlined workforce development could help. Structural reforms are needed to tackle the
quantity and quality of workforce development. The Government has already begun efforts in
primary education, and is preparing to introduce basic education reform by 2016. Further, it
has pledged to prepare forward-looking TVET and university education systems. These aspects
are reviewed and the skills accumulation factors are analyzed in the next chapter.

57
Chapter 5. Skills Accumulation and the Stock and Flow of Workforce
This chapter responds to several questions: How is the Government addressing workforce
constraints? How are Cameroon’s ongoing reforms in education and training likely to affect
workforce development over the next decade? Will the flow of potential workers have the skills
and competencies needed to increase economic productivity and contribute to growth? And
what role should private employers play in developing worker skills?
141. Investing in skills is costly. Few governments can afford to finance the extent and
quality of worker skills required—creating a vicious cycle in which high costs constrain
investment in skills, which impedes economic growth and so limits the resources available for
investing in skills. Recognizing this, Ansu and Tan (2012) propose a two-pronged approach.
First, skills development should be integrated with economic development plans. Purposeful
and flexible arrangements would help meet employers’ immediate demand for skills,
particularly in prospective growth sectors. Second, longer-run efforts at systemwide
improvement could equip all citizens with strong literacy and numeracy skills, increase the
education system’s orientation toward science and technology, and strengthen links with the
working world, particularly in tertiary education.
142. This chapter provides a critical review of skills accumulation in Cameroon. This is
considered a gradual process that is best analyzed from the perspective of the education and
training system. Age-based educational attainment is the proxy used to capture the skills
accumulation process, from foundational skills at early grades through higher-order skills at
the university level. Changes in levels of educational attainment over time were tested using
an education and training simulation model. The quantitative and qualitative effects of ongoing
basic education reforms, rates of return to education, and trends in the supply of labor are
measured. The chapter also reviews how the policies, institutions, and programs of the TVET
system contribute to skills formation at the vocational and professional technical levels.
Employment trends offer the demand-side counterpart information.
Education System and Enrollments
143. Several ministries are in charge of Cameroon’s education system, with one each for:
primary, secondary, vocational and professional technical, and higher education (Box 1).
Another ministry oversees youth affairs and policies. In addition, two education systems
operate in parallel: one for Francophone areas and one for Anglophone (see Appendixes 12
and 13 for greater detail on their structures). The Government is trying to create a unified
system.

58
Box 1. Cameroon’s Education System
Pre-primary: 2 years. Responsible entities—Communities, Private Sector.
Primary. Responsible ministry—MINEDUB .
The Francophone system lasts 6 years and ends with the Certificat d’Étude Primaire (CEP).
The Anglophone system lasts 7 years and ends with the First School Leaving Certificate (FSLC).
Under both systems the end of primary school marks preparation for vocational training or
entrance to secondary.
Secondary. 6 years (3 lower secondary and 3 upper secondary)—MINESEC.
Post-primary. 2 years (for rural artisans and ménagères (domestic help).
Secondary and teacher training Responsible ministry—MINESUP.
The Francophone system for secondary general education (based on a competitive entrance
examination) lasts 4 years and ends with the Brevet d’Études du Premier Cycle (BEPC). The
Anglophone system lasts 5 years and ends with General Certificate of Education Ordinary/Level
(GCEOL/L).
For secondary technical education, there are two cycles. The first lasts 4 years and, in the
Francophone system, ends with the Certificate d’Aptitude Professionnelle (CAP). The second
cycle lasts 3 years. In the Francophone system this cycle is open to BEPC and CAP graduates to
receive a Baccelauréat de Technicien or Brevet de Technicien. In the Anglophone system the
second cycle ends with the General Certificate of Education Advanced Level, which provides
access to higher education or jobs. Both systems require the successful conclusion of the
probatoire (provisional) to graduate from the second cycle of secondary technical education.
Vocational and professional technical training. Responsible ministry—MINEFOP.
Institutes offer short-term training and are affiliated with MINEFOP.
Post-secondary or higher education. Responsible ministry—MINESUP.
Several public and private institutions offer post-secondary or higher education: Government
universities: Yaoundé I, Yaoundé II, Douala, Buea, Dschang, N’gaoundéré, Maroua, and
Bemenda.
University technical training institutes (UTIs), which last 2-3 years and are in Douala, Bandjoun
and N’gaoundéré. Entrance to UTIs is competitive for Cameroon nationals; an education
portfolio comprising educational background and related experience is required for foreign
nationals. Graduates receive a Diplôme Universitaire de Technologie (DUT) or Brevet de
Technicien Supérieur (BTS).
Private universities: Catholic University of Central Africa, Catholic University, University of
Yaoundé-South Joseph Ndi Samba, and Institute Siantou Supérieur.
Major training institutes: most are affiliated with universities.
Source: Education Sector Strategy 2013-2020, Ministries of Education, Government of Cameroon 2013.
144. Between 2007 and 2011 Cameroon increased access to and completion of primary
education (Table 27), though girls’ completion rate grew less in the Zones d’Éducation
Prioritaires (ZEP) (Education Priority Zones). There were notable increases in the net
enrollment rate and primary completion rate (for both sexes) and a reduction in the repetition
rate. Though there were improvements in the ZEP—particularly in the Far North, North,
Adamaoua, North-West, and East regions, the disadvantaged pockets of urban and peri-urban
areas, and the frontier parts of the country—progress was much slower than in the rest of the
country. For example, the overall primary completion rate rose from 51 percent in 2007 to 80
percent in 2011, but for girls it only went from 38 percent in 2007 to 43 percent in 2011. The
2016 target for primary completion set in the Government’s education strategy for 2013-20 is
ambitious, at 84 percent for the ZEP.

59
Table 27. Gross Enrollments (%) in Public and Private Education and Training, 2000-01 and
2010-11
Public Private
2000-01 2010-11 2000-01 2010-11
Pre-primary 13.3 27.2 58,0 61,9
Primary 102.8 112.9 27,0 22,2
1st cycle Secondary General Education 28.8 53.4 29,0 24,1
2nd cycle Secondary General Education 16.3 30.2 29,0 30,5
1st cycle Secondary Technical Education 7.3 13.5 42,0 16,8
2nd cycle Secondary Technical Education 3.8 8.1 39,5 26,4
Professional Training Nd 69,9
University Education
(Students/100,000 inhabitants)
454 1,103 7,6 14,6
Source: World Bank, 2013.
145. Data for 2011 from two sources—the National Statistical Yearbook and Enquête
Démographique et de Santé [EDS; Demographic Health Survey (DHS)]—show student flow
declining across the education system, factoring in dropouts and repetition rates (Figure 21).
Figure 21. Transversal Profile and Probabilistic Profile of Student Flow, 2011
Source: World Bank, 2013.
146. An analysis of student flow by level of education and sector of employment shows a
changing pattern over time and important disconnects between jobs and the education levels of
graduates (Table 28).
0%
20%
40%
60%
80%
100%
120%
140%
SIL
/CL
1
CP
/CL
2
CE
1/C
L3
CE
2/C
L4
CM
1/C
L5
CM
2/C
L6
6è
& F
1
5è
& F
2
4è
& F
3
3è
& F
4
2nde
& F
5
1èr
e &
Low
6
Ter
m &
Upp 6
% a
cces
Annuaire 2011 EDS 2011
SIL/CL1 Class 1 (primary level) CP/CL2 Class 2 (primary level) CE1/CL3 Class 3 (primary level) CE2/CL4 Class 4 (primary level) CM1/CL5 Class 5 (primary level) CM2/CL6 Class 6 (primary level) 6 è & F1 Form 1(secondary level, 1st cycle) 5 è & F2 Form 2 (secondary level, 1st cycle) 4 è & F3 Form 3 (secondary level, 1st cycle) 3 è & F4 Form 4 (secondary level, 1st cycle) 2nde è & F5 Form 5 (secondary level, 2nd cycle) 1ère & Low Lower 6 (secondary level, 2nd cycle) Term & Upp 6 Upper 6 (secondary level, 2nd cycle)

60
Table 28. Education Levels and the Structure of Employment (2010) Education level of graduates Access to employment
Education level Number % of
total
Activity Employment Number % of
total
University complete 16,782 3.6 Senior Management 13,444 2.9
University incomplete 50,723 11.0 Mid-level Management 14,156 3.1
Upper secondary complete 29,425 6.4 Skilled Employees 23,505 5.1
Upper secondary incomplete 78,467 17.0 Unskilled Employees 36,496 7.9
Lower secondary complete 55,389 12.0 Informal Non-agricultural 119,001 25.8
Lower secondary incomplete
96,930 21.0 Informal Agricultural 115,047 24.9
Primary complete 46,157 10.0 Unemployed 6,445 1.4
No schooling and primary
incomplete
87,699 19.0 Inactive 133,479 28.9
Total 461,573 100.0 Total 461,573 100.0
Source: World Bank, 2013.
Educational Attainment across Age Groups
147. Educational attainment has improved in Cameroon in recent decades. The primary
completion rate rose from 53 percent in 2001 to about 80 percent in (Figure 22). School life
expectancy—the number of years of education children entering school can expect to receive
in their lives—increased by four years over the same period, a sharp improvement relative to
international comparators (Figure 23). These improvements reflect the abolition of school fees
for primary education in 2000, which increased enrollments, as did the improved service
delivery that resulted from the contract teachers program in 2007-11. Secondary enrollments
more than doubled over the past two decades, with nearly 1.3 million students in 2009. Overall,
children spend 2.5 more years in school than they did two decades ago, totaling an average of
10 years—well into secondary school.
Figure 22. Primary Completion Rates, 1991-2011 Figure 23. School Life Expectancy, 2001-11
40 50 60 70 80 90
100
1991 2001 2011
Figure 23a: Primary Completion Rates,
1991-2011 (in percent)
Cameroon SSA Low income Middle income
Sources: Education Country Status Reports (2003&2013), UNESCO Institute of Statistics
5
6
7
8
9
10
11
12
2001 2011
Figure 14: School Life Expectancy, 2001-2011(in years)
Cameroon* SSA Low income Middle income
Sources: Education Country Status Reports (2003&2013), UNESCO Institute of Statistics

61
148. Average years of total schooling (primary and secondary) have also risen among
Cameroon’s working age population (Figure 24). Countrywide, the share of this group (ages
15-64) with no schooling fell by more than half between 1990 and 2010, to just under 20
percent (Figure 25). It is becoming increasingly common for workers to have completed
secondary education. Still, the increases have been lower than in full-fledged middle-income
countries such as Malaysia and Thailand. Even though access to education increased, its quality
fell.
149. The evolution of the education system has been uneven.23 Budget cuts in the 1990s
caused a 10 percentage point drop (from 94 to 84 percent) in the primary education gross
enrollment ratio. The budget cuts also affected teachers. Civil servants saw their salaries cut
drastically in 1993, and teacher recruitment was restricted. Consequently, class sizes grew to
more than 60 students, with significant variations between regions. Regions and communities
used different strategies to address the growing need for teachers. of Schooling (15-64 years)
Attained (15-64 years)
Figure 24. Schooling among the Working Age Population
(ages 15-64), 1990-2010
Figure 25. Highest Level of Education Attained among
the Working Age Population (ages 15-64), 1990-2010
Source: Barro-Lee, 2010.
23 World Bank. June 2012. Education for All-Fast Track Initiative: Support to the Education Sector. Implementation Completion and Results Report. Report No: ICR00002369. Washington, D.C.
0
1
2
3
4
5
6
7
Ave
rage
nu
mb
er o
f ye
ars
Avg. Years of TotalSchooling
Avg. Years of PrimarySchooling
Avg. Years of SecondarySchooling
0
5
10
15
20
25
30
35
40
45
% o
f p
op
ula
tio
n
No Schooling
PrimarycompletedSecondarycompleted
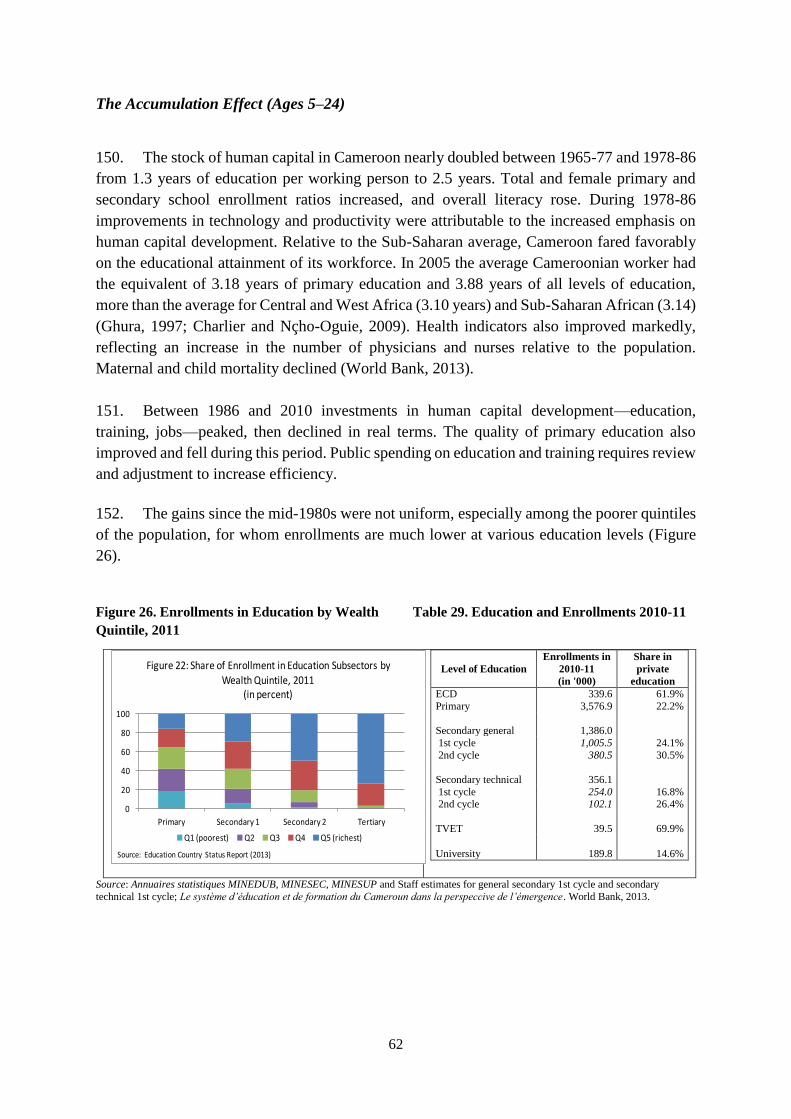
62
The Accumulation Effect (Ages 5–24)
150. The stock of human capital in Cameroon nearly doubled between 1965-77 and 1978-86
from 1.3 years of education per working person to 2.5 years. Total and female primary and
secondary school enrollment ratios increased, and overall literacy rose. During 1978-86
improvements in technology and productivity were attributable to the increased emphasis on
human capital development. Relative to the Sub-Saharan average, Cameroon fared favorably
on the educational attainment of its workforce. In 2005 the average Cameroonian worker had
the equivalent of 3.18 years of primary education and 3.88 years of all levels of education,
more than the average for Central and West Africa (3.10 years) and Sub-Saharan African (3.14)
(Ghura, 1997; Charlier and Nçho-Oguie, 2009). Health indicators also improved markedly,
reflecting an increase in the number of physicians and nurses relative to the population.
Maternal and child mortality declined (World Bank, 2013).
151. Between 1986 and 2010 investments in human capital development—education,
training, jobs—peaked, then declined in real terms. The quality of primary education also
improved and fell during this period. Public spending on education and training requires review
and adjustment to increase efficiency.
152. The gains since the mid-1980s were not uniform, especially among the poorer quintiles
of the population, for whom enrollments are much lower at various education levels (Figure
26).
Figure 26. Enrollments in Education by Wealth Table 29. Education and Enrollments 2010-11 Quintile, 2011
Level of Education
Enrollments in
2010-11
(in '000)
Share in
private
education
ECD 339.6 61.9%
Primary 3,576.9 22.2%
Secondary general 1,386.0
1st cycle 1,005.5 24.1%
2nd cycle 380.5 30.5%
Secondary technical 356.1
1st cycle 254.0 16.8% 2nd cycle 102.1 26.4%
TVET 39.5 69.9%
University 189.8 14.6%
Source: Annuaires statistiques MINEDUB, MINESEC, MINESUP and Staff estimates for general secondary 1st cycle and secondary
technical 1st cycle; Le système d’éducation et de formation du Cameroun dans la perspeccive de l’émergence. World Bank, 2013.
0
20
40
60
80
100
Primary Secondary 1 Secondary 2 Tertiary
Figure 22: Share of Enrollment in Education Subsectors by
Wealth Quintile, 2011(in percent)
Q1 (poorest) Q2 Q3 Q4 Q5 (richest)
Source: Education Country Status Report (2013)

63
153. The educational attainment of children and youth (ages 5-24) starts to decline around
age 10 (Figure 27).
Figure 27. Educational Attainment of Children and Youth (ages 5-24), 2010
Source: Le système d’éducation et de formation du Cameroun dans la perspective de l’émergence,
World Bank, 2013.
154. There are also significant numbers in these age groups who have no education, are out
of school, or have not completed primary education. Since 2010 the rising costs of schooling
have started to be reflected in educational attainment levels among children and youth. Greater
numbers from age 12 and up are not in school or training or are in the formal employment
sector [young people Not in Employment, Education, or Training (NEET)]. Most have a
secondary general education that does not prepare them for informal employment, few have
secondary technical education, and even fewer have a higher education. With growing numbers
completing primary education and a portion of them completing lower secondary education, in
the coming years (2014 and beyond) a post-basic education crisis is likely to emerge. There is
also increasing pressure from youth for diversified post-basic education (technical, vocational,
university).
155. Though policy states that education is free, school costs are rising for households. A
paquet minimum (minimum package) is intended to defray the expenses of tuition and supplies.
But practice does not match policy. The paquet minimum does not arrive on time, so households
are expected to pay for expenses such as textbooks, Parents-Teachers Association (PTA)
teacher salaries, and examination fees. But many households refuse to do so or are able to make
only minimal payments. This is having two main effects. First, student-textbook ratios, at 12:1,
are among the lowest in Sub-Saharan Africa, other learning aids are also missing, and low pay
undermines incentives for PTA teachers. Second, the quality of education is falling, especially
in disadvantaged areas (urban pockets of poverty, rural areas, the ZEP, and frontier areas).
Learning levels have dropped, reflecting the deteriorating quality of education despite
0%
10%
20%
30%
40%
50%
60%
70%
80%
90%
100%
5 6 7 8 9 10 11 12 13 14 15 16 17 18 19 20 21 22 23 24
Ages

64
increased access. The Government, with support from its development partners, is trying to
reverse the decline in education quality.
156. Government and household spending on education and training could be considered
investments. Although Government spending on education rose from 1.9 percent of GDP in
2000 to 3.3 percent in 2003, it has since stagnated—remaining below the regional average of
4.3 percent (Figure 28). Further, the distribution of these limited public resources is unequal.
In 2011 secondary education received a disproportionately large allocation relative to primary
and higher education. Most Sub-Saharan governments spend the most on primary education.
Figure 28. Public Spending on Education, 2010 (% of GDP)
Source: Education Country Status Report, 2013; World Bank staff estimates.
Balancing Improvements in Basic Education with Vocational, Technical, and Higher
Education
157. Despite improvements, secondary enrollments in Cameroon are low compared with
peer countries. In 2008 the gross enrollment ratio in Cameroon was similar to levels in the
Democratic Republic of Congo, Eritrea, Guinea, and Liberia, but well below those in Ghana,
Kenya, and South Africa. Secondary education is split into general and technical streams, but
in 2008 technical secondary education accounted for less than 20 percent of total enrollment.
158. Vocational training is not closely linked to the needs of the labor market. Vocational
institutions enroll a small number of students and focus on a few sectors such as construction
(about 25 percent of enrollment) while leaving out other important areas of the economy, such
as tourism (3 percent of enrollment) and agriculture (less than 1 percent). Apprenticeships,
which could be an efficient way to deliver training aligned with the needs of private employers,
can only occur informally because there is no legal framework for private companies to partner
with training centers. As a result, most youth do not seem to receive any professional training
(especially in the Northern regions). And when they do, they tend to get it on the job (with the
exception of the South-West region).
159. Though enrollments in higher education have increased significantly, the proposed
programs might not meet the needs of the job market. Enrollments have more than doubled
0
1
2
3
4
5
Cameroon Low incomecountries
Sub-SaharanAfrica
Middle incomecountries

65
since 2005, mainly in public tertiary education institutions, following the creation of new
universities (Figure 29). But the allocation of students by discipline could suggest that there is
a gap with the needs of Cameroon’s economy. Engineering, for instance, accounted for just 5
percent of higher education enrollments in 2010 (Figure 30)—a level too low to support
Cameroon’s plans to invest in a number of large energy and transport projects. Health attracted
just 2 percent of students.
Figure 29. Enrollments in Higher Education, 2010 Figure 30. Enrollments by Discipline in Higher
Education (excluding teacher training), 2010
Source: INS, EESI 2005 and World Bank staff calculations in Country Economic Update, Unlocking the Labor Force—An Economic
Update on Cameroon. 2012. World Bank.
Returns to Education
160. An assessment of returns to education for Cameroon shows that youth who have
completed upper secondary general/technical education have the potential to earn 40.3 percent
more than youth that have completed only lower secondary general/technical education (Figure
31). Further, youth with some higher education could earn 60.9 percent more than those who
have only an upper secondary general/technical education. Thus each additional year of
schooling could generate significant private returns. Moreover, a better-educated population
could contribute to GDP growth and economic competitiveness—provided they are supported
by a good business environment and sound macroeconomic policies.
0
50
100
150
200
250
2005 2006 2007 2008 2009 2010
Private
Public
Human Sciences
20%
Law24%Economics
and Managemen
ts26%
Sciences22%
Engineering5%
Health2% Education
Sciences1%
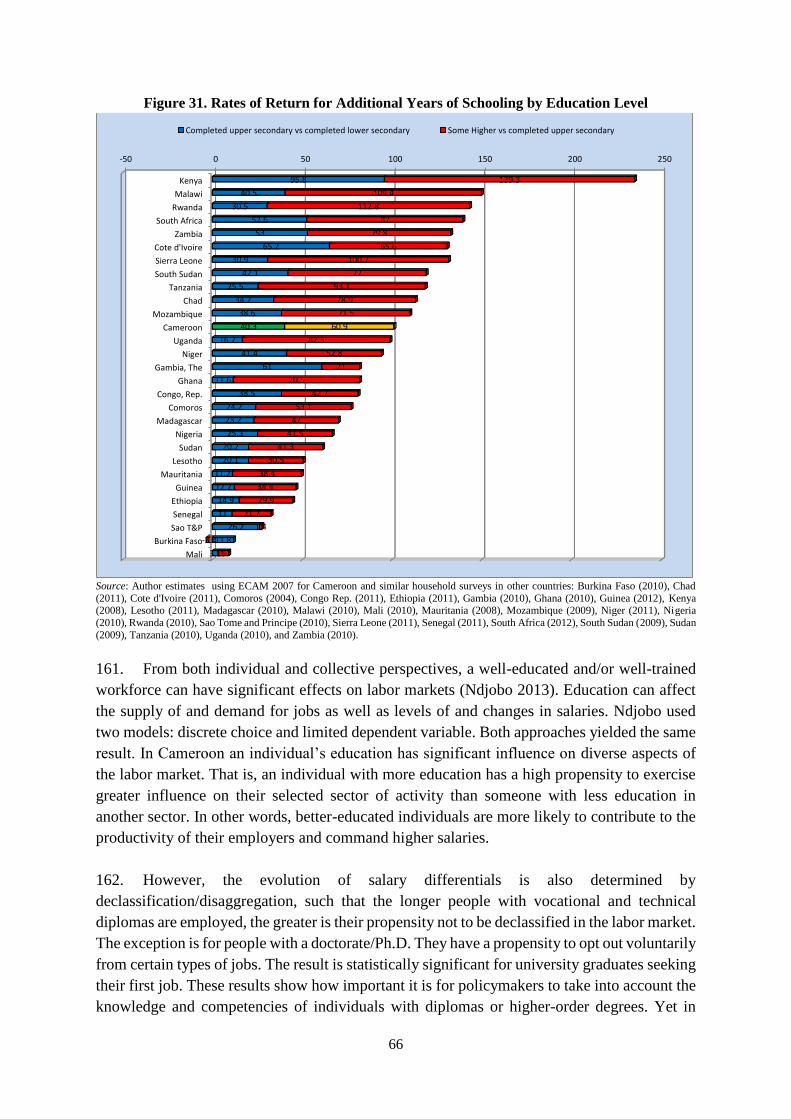
66
Figure 31. Rates of Return for Additional Years of Schooling by Education Level
Source: Author estimates using ECAM 2007 for Cameroon and similar household surveys in other countries: Burkina Faso (2010), Chad
(2011), Cote d'Ivoire (2011), Comoros (2004), Congo Rep. (2011), Ethiopia (2011), Gambia (2010), Ghana (2010), Guinea (2012), Kenya (2008), Lesotho (2011), Madagascar (2010), Malawi (2010), Mali (2010), Mauritania (2008), Mozambique (2009), Niger (2011), Nigeria
(2010), Rwanda (2010), Sao Tome and Principe (2010), Sierra Leone (2011), Senegal (2011), South Africa (2012), South Sudan (2009), Sudan
(2009), Tanzania (2010), Uganda (2010), and Zambia (2010).
161. From both individual and collective perspectives, a well-educated and/or well-trained
workforce can have significant effects on labor markets (Ndjobo 2013). Education can affect
the supply of and demand for jobs as well as levels of and changes in salaries. Ndjobo used
two models: discrete choice and limited dependent variable. Both approaches yielded the same
result. In Cameroon an individual’s education has significant influence on diverse aspects of
the labor market. That is, an individual with more education has a high propensity to exercise
greater influence on their selected sector of activity than someone with less education in
another sector. In other words, better-educated individuals are more likely to contribute to the
productivity of their employers and command higher salaries.
162. However, the evolution of salary differentials is also determined by
declassification/disaggregation, such that the longer people with vocational and technical
diplomas are employed, the greater is their propensity not to be declassified in the labor market.
The exception is for people with a doctorate/Ph.D. They have a propensity to opt out voluntarily
from certain types of jobs. The result is statistically significant for university graduates seeking
their first job. These results show how important it is for policymakers to take into account the
knowledge and competencies of individuals with diplomas or higher-order degrees. Yet in
-50 0 50 100 150 200 250
Kenya
Malawi
Rwanda
South Africa
Zambia
Cote d'Ivoire
Sierra Leone
South Sudan
Tanzania
Chad
Mozambique
Cameroon
Uganda
Niger
Gambia, The
Ghana
Congo, Rep.
Comoros
Madagascar
Nigeria
Sudan
Lesotho
Mauritania
Guinea
Ethiopia
Senegal
Sao T&P
Burkina Faso
Mali
95.8
40.5
30.5
52.6
53
65.2
30.9
42.1
25.5
34.2
38.6
40.3
16.7
41.4
61
11.6
38.5
24.2
23.2
25.3
20.2
20.1
11.2
12.2
14.9
11
26.2
11.8
3.1
139.3
109.4
112.8
87
79.8
65.6
100.7
77
93.1
78.9
71.5
60.9
82.3
52.8
21
70.5
42.7
53.1
47
41.5
41.3
30.5
38.4
34.4
29.9
21.7
1.4
-3.4
6
Completed upper secondary vs completed lower secondary Some Higher vs completed upper secondary

67
Cameron, individuals, enterprises, and the state are not benefiting from investments in
education.
163. Analysis in the ESSI 2010 INS report shows that one in four youth are already in a
vocational training program, with four out of ten persons in urban areas (and approximately
one in two in the big metropolises of Yaoundé and Douala) in a vocational training program.
However, only two out of ten in rural areas (and only one out of twenty in the Extreme North
region) are enrolled in vocational programs. In the informal sector, professional vocational
education and training is not marginal as official numbers appear to indicate.
164. Further, over the last decade higher education in Cameroon has gained prominence. In
1991 only about 29,000 students were enrolled. The number increased to 70,000 students in
2001, and by 2011 about 207,887 students were enrolled. That is, an increase of a little over
three times over the course of ten years, or about an average increase of 12 percent per year.
Between 2008 and 2009 alone about 40,000 additional students were enrolled in universities.
165. Youth groups surveyed for this study said that knowing languages (English/French) is
the most important skill for securing a job, and completion of university as the most useful
training. Young people expressed concern about Cameroon’s economic situation. They said
that it undermines their opportunities for future employment. They also said that not enough
jobs are available—and that it was the main reason for their unemployment or simply not
looking for jobs.
Anticipated Outcomes of Reforms in Education and Training
166. Cameroon is taking action to upgrade the quality of education. Measures are under way
to make public spending on education more efficient, reduce out-of-pocket expenses for
households—especially poor and disadvantaged ones—by providing them with textbooks,
reduce the numbers of PTA teachers by moving them to contract teacher status, improve
literacy and numeracy in primary education, and combine primary and lower secondary
education to span nine years as basic education. Cameroon will conduct a reading literacy
assessment as a fundamental building block for foundational skills starting in 2015. Together
these efforts will likely lead more out-of-school children to enroll in the lower grades. Over
time, the primary completion rate will likely improve. If the quality of education is maintained,
the combined effects would potentially benefit society because the social rates of return would
increase.
167. To increase schooling and offer alternate paths to general education and training, the
Government is preparing new strategies for TVET and higher education with the goal of
increasing investments in both. Doing so would better align the education and training system
to the labor market needs of a middle-income country. The Government’s ambitious targets
require three key adjustments:

68
Rationalizing public spending on education to boost efficiency.
Improving service delivery by ensuring, among other aspects, that a greater percentage
of the education budget is decentralized to support school-based management.
Improving sector governance.
168. The estimated changes in educational attainment over time, factoring in the likely
impact of ongoing and potential reforms, are simulated in Figure 32. The four scenarios for
2015, 2020, 2025, and 2030 are based on the base case simulation model prepared for the
Cameroon Education Country Status Report (Le système d’éducation et de formation du
Cameroun dans la perspective de l’émergence) in Figure 27. Simulation results are provided
in Appendix 2.
Figure 32. Simulation Results of Improvements in Educational Attainment and Potential
Workforce Entrants, 2015, 2020, 2025, and 2030
2015
2020
2025
2030
Source: Le système d’éducation et de formation du Cameroun dans la perspective de l’émergence. World Bank and Republic of Cameroon,
2013.
0%
10%
20%
30%
40%
50%
60%
70%
80%
90%
100%
5 6 7 8 9 10 11 12 13 14 15 16 17 18 19 20 21 22 23 24
Ages
0%
10%
20%
30%
40%
50%
60%
70%
80%
90%
100%
5 6 7 8 9 10 11 12 13 14 15 16 17 18 19 20 21 22 23 24
Ages
0%
10%
20%
30%
40%
50%
60%
70%
80%
90%
100%
5 6 7 8 9 10 11 12 13 14 15 16 17 18 19 20 21 22 23 24
Ages
0%
10%
20%
30%
40%
50%
60%
70%
80%
90%
100%
5 6 7 8 9 10 11 12 13 14 15 16 17 18 19 20 21 22 23 24
Ages

69
Conclusion
169. Economic growth in Cameroon has not been accompanied by a commensurate increase
in competitiveness. This is partly due to the absence of structural transformation and economic
diversification and to an employment structure that has been increasingly skewed toward the
tertiary services informal sector—where nonwage, low-return employment, relatively high
poverty rates, and disguised unemployment prevail.
170. Education and training could significantly contribute to economic growth and to the
number and type of jobs in Cameroon. But that will also require aligning workforce
development with key economic and social priorities, ensuring appropriate governance of the
workforce development system, and managing service delivery for results.
171. Education and training are only one determinant—albeit an important one—of the
number and type of jobs. Education and training do not constitute human capital until they are
used effectively as a factor of production. The supply of and demand for workforce
development (especially training) encounter labor market rigidities such as pricing and the
quantity of the workforce. Education and training systems show more structural dynamism than
does the labor market, where rigidities lead to employment in some cases and
underemployment in others (Anderson, 1963 in the U.S. context and Boudon, 1973 in the
French context in World Bank, 2013). For education and training to have significant influence,
the skills and competencies acquired by workers need to be relevant to the labor market.

70
Chapter 6. Assessing the Workforce Development System
This chapter responds to the following questions: What policies and institutions are involved
in workforce development in Cameroon? What forces are driving the strategic direction of
workforce development, and are they credible? What oversight mechanisms are in place, and
are they effective? And which aspects of service delivery are working, and which are not?
Based on the answers to those questions, the SABER Workforce Development (WfD) tool
benchmarks the country using a four-point scale—latent, emerging, established, and
advanced—for each element of the workforce development system.
172. Cameroon has a dual education system: Francophone and Anglophone. Dual languages
of instruction and dual modalities of education coexist. Schooling options are also diverse, with
public education and private education, and within the latter private secular, religious schools
(Catholic and Protestant), and private Muslim schools. This diversity offers choices for
schooling but is challenging from policy and institutional perspectives. Quality technical and
vocational education and training better facilitates school to work transition.
173. As noted in Chapter 5, skills development is costly and time consuming. But such
efforts have been a long time in the making in Cameroon. With appropriate policies and
institutions, the Government’s goal of reaching fully fledged middle-income status could
become a reality if the country continues to focus on strengthening education and training, with
specific attention to skills development through TVET and university education. Developing
skills in the formal and informal sectors alike is going to be key to increasing competitiveness
and growth.
174. The workforce development benchmarking conducted for this study shows that
Cameroon’s policies and institutions must be adjusted for workforce development. To achieve
middle-income status by 2030, urgent action is required. The Government’s aspirations are set
out in the DSCE. Its vision and targets for inclusive foundational skills development in basic
education are described in the Education Sector Strategy 2013-2020. Targets are less clear for
post-basic vocational and technical education and training and for higher education. The skills
development landscape in Cameroon is complex and fragmented. Spread over five ministries
of education, training, and youth, as well as other ministries, the system suffers from inadequate
funding, inconsistent governance, and incoherence, and is largely supply-driven. Individual
ministerial programs rely on internal rationales and budgets. But the sum of the parts is not
addressing Cameroon’s current and emerging human development needs. The Government
recognizes the shortcomings of the system.
175. This chapter summarizes this study’s diagnosis of workforce development policies and
institutions.24 The SABER-WfD tool was used to gather evidence and validate the findings (see
Appendix 3). Complementary evidence from secondary sources was also used—specifically,
24 The detailed diagnostics is available in the Cameroon SABER-Workforce Development, and Country Report 2014, World Bank
(forthcoming).

71
the sources cited in the references (Appendix 4) and multiple consultations with a team of
experts from the ministries of economy, planning and regional integration (MINEPAT),
finance (MINFI), education and training (MINEDUB, MINESEC, MINEFOP, MINESUP),
youth (MINJEUNE), agriculture, mining, and forestry. The data were combined, triangulated,
rated, and scored across the three SABER-WfD dimensions and nine policy goals, and
validated through consultations.
Summary of Benchmarking Results
176. The SABER-WfD assessment results rate Cameroon’s system between “latent” and
“emerging” for all the functional dimensions of policies and institutions in the SABER-WfD
analytical framework: strategic framework, system oversight, and service delivery. These
findings represent an average. A deeper examination of the underlying scores for the nine
policy areas reveals some confounding aspects, requiring a more nuanced approach to
understanding the workforce development system.
177. Specifically, the strategic framework—with policy areas of strategic direction and
coordination, not demand-led—is latent. The system is primarily characterized by centralized
preparation of vision and strategy documents and action plans, although with some level of
with decentralized consultations. System oversight and service delivery are also latent. That
is, there is limited collaboration and coordination across education and training ministries and
other ministries that provide specialized skills. This is due to a highly fragmented approach to
workforce development oversight and service delivery.
Strategic Framework: Aligning Workforce Development with Economic and Social
Priorities
178. The SABER-WfD analytical framework for rating the strategic framework reflects the
status of policies and institutions associated with three policy goals: articulating a strategic
direction for workforce development, prioritizing a demand-led approach for workforce
development, and fostering coordination among key stakeholders (Figure 33).
Strategic direction (emerging)
179. The DSCE lays the groundwork and provides guidance on workforce development. The
Government and stakeholders conduct Economic Outlook assessments at national level.
Further, MINEFOP, the Interdepartmental Committee for the follow-up of the DSCE, meetings
between the Government and the multi-donor group, the Ministry of Finance upstream
macroeconomic budget analysis, and MINEPAT reports such as the analyses of economic
policy, demographic analyses and migration division provide direction on workforce
development. The stakeholders have adapted the regulatory framework to promote workforce
development. However, it is unclear if their implementation is monitored systematically.
Finally, the impact of core (literacy and mathematical skills) competencies or cognitive and
non-cognitive skills that the workforce must have are also not evaluated systematically.

72
180. Many stakeholders are involved in workforce development efforts in Cameroon. But it
is unclear whether there are any active advocates with a clear vision of how workforce
development can be used to achieve the country’s social and economic goals. The Groupement
Inter-Patronal du Cameroun (GICAM), representing employers, is perhaps the most active
nongovernment stakeholder. But it is unclear how well GICAM represents the informal private
sector—which accounts for nearly 90 percent of the labor market. Further, it is unclear whether
government and nongovernment stakeholders have a shared strategic agenda for workforce
development. Finally, the approach to workforce development is not demand-led, and there is
limited coordination.
Figure 33. Dimension 1: Scores for the Strategic Framework
Demand-led approach (tending toward latent)
181. The Government seems to conduct studies on the country’s economic prospects under
the DSCE, but it is not clear whether they also assess the implications for skills development.
Other studies appear to be ad hoc and only cover some economic sectors, and it is also unclear
whether they specifically address the alignment of worker skills and national economic
prospects. Other assessments are donor driven. Though some constraints seem to have been
identified in one of the priority economic sectors, it is unclear whether skills constraints have
as well. It is also unclear whether steps have been taken to address these constraints.
182. Employers have a formal, institutionalized space to participate in policy dialogue at the
Cameroon Business Forum (CBF). However, this is an unofficial and non-institutionalized
platform. The Government Inter-Ministerial Committee is the official platform for workforce
development. The Committee meets twice a year. Private sector and civil society organization
representatives are also invited to participate. However, businesses seem to rarely contribute
to the impact of the main strategic decisions regarding skills development. The Government
seems to be encouraging employers to develop the skills of their employees, both in the formal
and informal sectors. However, there is little evidence on the types of incentives or measures,
and whether they are implemented or not, and where applicable, if their impact is assessed and
how.
1 2 3 4
1. Direction
2. Demand-led
3. Coordination
Str
ate
gic
F
ram
ew
ork
Overall 1.6
2.0
1.4
1.3

73
Coordination among stakeholders (tending toward latent)
183. The mandates of government ministries and agencies with responsibilities for
workforce development often overlap; no mechanism ensures coordination of strategies and
programs. The legal roles and responsibilities of nongovernment stakeholders are not clear,
and there is little evidence that mechanisms exist for coordination with government entities.
There seem to be strategic workforce development measures such as the Contrat de
désendettement et de développement (C2D; Contract for Debt Relief and Development)
program, which has an implementation plan, budget, and some monitoring arrangements.
System Oversight: Governing Workforce Development
184. The scores for system oversight reflect the status of policies and institutions associated
with three policy goals: ensuring efficiency and equity in funding, ensuring relevant and
reliable standards, and diversifying pathways for skills acquisition (Figure 34).
Efficient and equitable funding (between latent and emerging)
185. The Government relies on the program budget and the medium-term expenditure
frameworks in line with the GAR to calculate the budget appropriations for TVET institutions
programs. Decisions are made by the two chambers of the Parliament that include
representatives of the people. Programs fostering on-the-job training for small and medium-
size enterprises benefit from government support. Most government funding for active labor
market programs (ALMPs) benefits youth and rural groups. Support is determined through an
ad hoc process involving only government officials in the implementing agencies. There are
no recent formal impact evaluations of funding for training programs in initial or continuing
vocational education and training (IVET and CVET) or the ALMPs. The government facilitates
formal partnerships between training providers and employers. Various ministries and
institutions form partnerships with training service providers.
186. With respect to recurrent expenditure by cycle/type, in addition to vocational training
costs, the unit costs range from 47,000 FCFA (primary education) to 392,000 FCFA (level 2
technical secondary education), 87,000 FCFA for undergraduate general secondary education
(119,000 FCFA for technical undergraduate level) and 236,000 FCFA for general secondary.
The unit cost of higher education is estimated to be about 280 000 FCFA, while pre-school is
118,000 FCFA. The structure of these costs shows that technical education is about 36 percent
more expensive than the first cycle of general secondary education and 66 percent more
expensive than the second cycle of general secondary education. Pre-school unit cost is
approximately 2.5 times more than that of primary education, which is likely to be detrimental
for its development. General secondary is almost exactly in tandem with international norms,
which indicates a level of expenditure per pupil in Cameroon identical to that of countries with
the same level of GDP per capita (World Bank 2013). However, compared with other education
subsectors, the Government provides a disproportionately low allocation to vocational and
technical training.

74
Figure 34. Dimension 2: Scores for System Oversight
Relevant and reliable standards (nearly latent).
187. Training institutions operate in a context of fierce competition from both local firms
and foreign companies in their respective areas of activity. The market sets the standards.
Therefore, to remain competitive and ensure that their businesses are revitalised, the
institutions are obliged to follow recognized and accepted standards when they develop their
programs. Otherwise, they will be overturned by competition. The IGF and the DFOP are the
structures in charge of setting accreditation standards for institutions and training programs.
Their respective roles are noteworthy. In addition, professions are organized to control
admission standards at entrance since access is mostly through competitively selective
recruitment. This is strictly followed in daily practice. Moving to higher levels is largely
dependant on the acquisition of diplomas or new qualifications. Finally, employment and
income are positively influenced by the acquisition of qualifications by category, or
classification type.
188. Cameroon has competency standards for some occupations, but there is no national
qualifications framework. There is limited evidence on stakeholder engagement with the
setting of competency standards and the extent to which training providers use standards when
developing competency-based curricula. It is also unclear whether competency-based testing
is used for skilled and semiskilled occupations. There is no evidence that there are skills testing
for major occupations and, if there is, whether it assesses both theoretical knowledge and
practical skills, and whether certificates awarded have any impact on employment and
earnings. There does not seem to be a system for establishing accreditation standards for
training institutions and programs. Accreditation does not seem to be needed for training
providers, and they have no incentives to seek and retain accreditation.
Pathways for skills acquisition (latent)
189. MINEFOP is responsible for the «Program for the Development of Vocational
Education and Training» in Cameroon. A priority element for the program is the regulation of
the flow of students from primary to secondary, vocational and higher education. However, in
practice, the coordination of activities across the sub-sectors does not conform to the priority.
With respect to the stock of graduates from the system, there is limited data on the programs
and career paths of those who are already employed. There are many institutes of higher
education that focus on vocational training. The professionalization of higher education is
concretized through the sub-sector medium-term expenditure framework (MTEF). However,
1 2 3 4
4. Funding
5. Standards
6. Pathways Sy
ste
m O
ve
rsig
ht
Overall 1.4
1.7
1.4
1.2

75
the linkages between the training programs and the labor market are at best tenuous. The
Government is conscious of building the skills of citizens. Some measures have been taken to
encourage options for skills and career development for those who are already employed.
Service Delivery: Managing for Results
The rating for service delivery reflects the status of policies and institutions associated with the
policy goals: encouraging excellence in training programs, fostering relevant training
programs, and enhancing accountability for results (Figure 35).
Figure 35. Dimension 3: Scores for Service Delivery
Training excellence (tending toward latent)
190. MINEFOP approves all training institutions that can operate on Cameroonian territory.
These establishments also receive some financial support in the form of grants and scholarships
to achieve the strategic objectives set out for public training institutions. The Government has
not yet enforced the reform of the SAR-SM in the training centers for specific trades. Further,
it has pursued only in a limited manner the construction and equipping of the vocational centers.
In order to improve training practice, MINEFOP has recently created the enabling environment
for partners to build, equip, and develop and offer programs for the National Institute of
Training of Trainers. The foundation stone was laid by His Excellency the Prime Minister,
Head of Government at the beginning of the year 2015. This is important progress towards
leading Cameroon to be among the emerging countries.
191. The Government occasionally revises its policies relating to non-State training
institutions. However, it is unclear whether or not training institutions are autonomous. It
appears that some of them are able to retain profits, to establish boards of directors and some
options to investigate complaints. But more information is needed to integrate these elements.
Training relevance (latent)
192. Though the Government seems to aim to establish formal links and encourage
significant collaboration between training providers and industry, there is not enough evidence
to determine whether this is being achieved. There are some tenuous links between training
providers and industry, but it is not clear whether firms provide input into the design of
curricula. Despite the Government’s stated intentions, there is no evidence that industry plays
any role in specifying facility standards. There seem to be links between training and research
institutions on the development of training programs and general assessments of the system.
But it has not been determined whether these links are formal.
1 2 3 4
7. Excellence
8. Relevance
9. Accountability Se
rvic
e
De
liv
ery
Overall 1.4
1.1
1.3
1.7

76
Accountability for results (tending toward emerging)
193. Public training providers seem to collect some data and occasionally produce reports.
Private training providers could be asked to collect and report data, but that does not seem to
occur. Moreover, procedures for managing data are unclear. The Government occasionally
conducts or sponsors skills-related surveys, but not impact evaluations. It is unclear whether
the Government makes any use of the data or whether information on the labor market
outcomes of graduates is collected and published.
194. Public sector training service providers seem to collect data and prepare reports
occasionally. However, private sector training providers do not appear to be doing so, or
communicating available data. More importantly, overall country level data management
procedures are imprecise. From time to time, the Government conducts or finances skills
surveys, but not impact evaluations. It is unclear if the Government uses the data or if
information about graduates in the labor market are collected and published.
Conclusion
195. The overall conclusion of the SABER-WfD assessment is that Cameroon has latent
potential in most domains of workforce development and is tending toward an emerging system
in others. This is a good springboard for policy and institutional action. The strategic
framework for skills and workforce development shows promise. But with system oversight
and service delivery, Cameroon faces significant challenges. The country is performing at a
low equilibrium level, with significant deadweight loss because general education drives the
skills development agenda. Most workers are in poor jobs, are underemployed, and lack
incentives for increasing productivity.

77
Chapter 7. Prospects, Conclusions and Policy Recommendations
This chapter responds to the following questions: what are the implications for Cameroon of
creating a more dynamic, responsive system for workforce skills and competencies
development? And what strategies could help foster the accumulation of skills and
competencies for value addition to labor-intensive sectors and for economic diversification and
structural transformation?
196. Cameroon has latent potential to create an enabling environment for developing
inclusive workforce skills, increasing productivity, promoting competitiveness, sustaining
growth, and achieving structural transformation. But it requires a unified, action-oriented
framework for skills development to promote collective action in improving system oversight
and service delivery.
Framework for Action
197. Urgent action is required for Cameroon to catch up with global trends, address the needs
of youth for skills development and job creation, increase its competitiveness and economic
growth, and especially to become a middle-income country. Some principles could guide
policy-making in three areas: developing a strategic framework, improving system oversight,
and strengthening service delivery. Ten such principles are:
Creating an apex authority to optimize the continuous development of skills in order to
promote social inclusion, create jobs and encourage economic growth. The apex
authority could rationalize the system of skills development, set up a Standards,
Qualification, and Accreditation Board to address inefficiencies and streamline
programs. A public expenditure review and efficiency analysis of education and
training systems would help pinpoint problems.
Concentrating official links among training services providers and preparing a
framework on skills and qualifications. The Government has already established and
continues to establish close collaboration with training service providers, businesses,
and other partners through various contributions, grants, partnerships, and the
promotion of collaborative networks for action. However, a framework of skills and
qualifications could strongly unify the current fragmented and divided skills
development system. Such a framework could be developed in close collaboration with
training providers and companies in key growth sectors of the economy. Those engaged
in the sectors could help to evaluate the jobs and set the required skills. Different roles
played by individuals and the performance of organizations could then be directly
linked to the development and the reorganization of skills development programs.
Creating a competency framework to help assess, maintain, and monitor the knowledge,
skills, behaviors, and attributes needed for people in specific job streams to perform

78
effectively. Making the competency framework publicly available would help guide
job seekers.
Creating a competency framework can be time consuming but is worth the effort. The
approach would measure current competency levels to ensure that the current workforce
has the expertise needed for value addition to the economy. This would help determine
the extent to which the skills of the existing workforce could be upgraded and inform
decisions about curricular changes to introduce new knowledge and skills for the future
workforce. Job-relevant skills are worthy of attention from job training programs, but
their limitations need to be acknowledged (Box 2). The education and training system
would be the ideal conveyor of new skills, competencies, and attributes, and budgets
for training and development should be based on structural needs.
Box 2. Job-Relevant Skills and the Boundaries of Job Training Policies
Job-relevant skills are competencies and abilities valued by employers and useful for self-
employment. They include technical skills relevant to specific jobs as well as other cognitive and
noncognitive skills that enhance worker productivity. These other skills include:
Problem-solving skills—the capacity for critical thinking and analysis.
Learning skills—the ability to acquire new knowledge, distill lessons of experience, and
apply them in search of innovations.
Communication skills—including writing skills, collecting and using information to
communicate with others, fluency in foreign languages, and use of information and
communication technology.
Personal skills—for self-management, making sound judgments, and managing risks.
Social skills—for collaborating with and motivating others in a team, managing client
relations, exercising leadership, resolving conflicts, and developing social networks.
Source: Banerji and others, 2010, Stepping Up Skills for More Jobs and Higher Productivity, World Bank, Washington, D.C.
Ensuring an adequate supply of appropriate skills would involve building foundational
knowledge and skills to enable labor mobility. Such skills are needed to secure even an
entry-level position in low-skill markets. One of the main goals of Cameroon’s
Education Sector Strategy 2013-2020 is to promote foundational education and skills
for all children, especially those between 6 and 15.
Other Government goals include improving the quality of primary education and
increasing access to education at all levels, including reaching a pre-primary enrollment
rate of 50 percent by 2020. Brazil’s early childhood development program is well-
known (Box 14). Cameroon would benefit from drawing on this example.
Second chance education for those who do not complete secondary education due to
reasons such as early marriage or pregnancy or the high opportunity cost of schooling
could be addressed through appropriate targeting and incentive programs. Relevant
education and flexible second chance education programs would be helpful.

79
Incorporating life skills gradually could help streamline second chance education.
Accelerated programs for highly motivated youth could be an incentive.
Specialization versus generalization. Specialized skills development should be
embraced, as opposed to generalized education and training.
Facilitating economic opportunities and create a favorable environment to develop
from the application skills and use them effectively. Economic opportunity could be
created through demand-driven skills development and upgrading. For example,
employers could be given tax incentives to hire interns, and the selection of interns
could serve as a proxy for skills demand. School-to-work transition could be facilitated
through cross-sectoral approaches (education, youth, labor, planning), especially for at-
risk youth.
An experiential learning approach integrates learning-by-doing and exposes trainees to
real work situations. Traditional forms of experiential learning include apprenticeships
and under-study. Kenya has used this approach (Box 3). A trainee typically works with
a master craftsperson or equivalent who imparts knowledge by requiring the trainee to
perform tasks that have a direct bearing on commercial output. This approach might be
a good fit for the agribusiness, cotton textiles, palm oil, and tourism sectors.
Box 3. Traditional Apprenticeship Support
Between 1996 and 1998 the NGO Strengthening Informal Training and Enterprise (SITE) managed a
British-assisted project to support and develop traditional apprenticeships in Kenya. The project
concentrated on metalwork, woodwork, and textiles. A total of 420 master craftspersons and 280
apprentices were trained directly, and about 1,400 apprentices received training from the project’s host
trainers.
The project had a positive impact. Traditional apprenticeship training became more efficient and effective,
increasing productivity and earnings for the master craftspersons who received it. The number of
apprentices of the master craftspersons who participated increased by 15-20 percent. The masters who
received training saw increased turnover and profits as a direct result of their new skills, new products, new
markets, and better workshop layouts and production organization. Some of the lessons from the project
were that:
Master craftsperson were not interested in skills training unless it was delivered in the context of a
broader business improvement context.
Training for masters needs to be delivered flexibly, taking into account time constraints and opportunity
costs.
Master craftspersons provide training not necessarily to charge high training fees, but to increase
income from production as a direct result of apprentices’ on-the-job training.
Training proved to be a good entry point for upgrading technology in enterprises.
Attempts to create links between the Jua Kali (meaning “Under the Hot Sun”) and the training
institutions were disappointing. Independent trainers are more flexible and suitable.
Collaboration with informal sector associations is crucial.
Skills development, carefully and appropriately targeted, can be instrumental in improving the
performance of informal enterprises. New skills can lead to increased growth, innovation, and
productivity.
Source: Johanson and Van Adam, 2004; Haan, 2006.

80
Concatenating transitions and links for skills development. A bridges-and-ladders
approach to skills development is preferable to islands of skills development. Making
this change in Cameroon will require redefining the mandate of the education and
training system—for example, by increasing the emphasis on science and mathematics
in secondary education, aggregating the efforts of polytechnics and technical colleges
to address skills deficiencies, and promoting research in science and technology and
fostering innovation in universities. Education and training need to reward youth for
home-grown innovations. Creating skills for adopting and adapting technologies is key
for Cameroon’s structural transformation.
Ensuring the relevance of skills by clearing a qualifications and standards
framework.The qualifications and standards framework should be linked to the skills
most relevant to the labor market. Sector-specific workforce forecasting would need to
be developed, especially in the sectors where workforce value addition is deemed
greatest.
Maximizing the use of human resources, especially young female adults and women.
To draw on a reservoir of untapped capacity, gender-sensitive skills development could
be beneficial. In Cameroon, as in other countries, there is a performance gap between
male and female entrepreneurs (World Bank, 2014). Female entrepreneurs are
concentrated in less productive sectors and activities. They face several constraints:
initial conditions (access to finance, education, and information and networks), sector
sorting (forced into sectors with low productivity or low growth potential, preferences
and managerial choices (taking the household as the unit of analysis), and institutions,
legal frameworks, and the business environment.
Female entrepreneurial decisions and activities are constrained by a complex
interaction of social norms, legal institutions, and differences in subjective preferences.
All these factors affect the decision to become an entrepreneur, the sector of activity,
and management choices—including growth ambitions. Policies should address the
challenges facing female entrepreneurs.
Possible solutions include developing business education and networking opportunities
for female entrepreneurs, addressing gaps due to the lack of enabling initial conditions,
and better diagnosing the key constraints within the socioeconomic setting. Business
training for women—supported by grants—can be effective and can raise profits. There
are other social spillover benefits to supporting female entrepreneurs. Women tend to
plough profits back into their businesses or spend them on the education and health of
their children and families.
Creating portable skills and competencies. Entrepreneurship skills are portable goods,
as are basic literacy and numeracy. The generalized education that most youth acquire
in Cameroon is useful only up to a point. Without entrepreneurship skills and other

81
cognitive and noncognitive skills, survival in both the informal and formal sectors is
hardly guaranteed.
Augmenting knowledge and competencies for structural transformation. A strong
workforce must be equipped with appropriate knowledge and skills to be highly
productive and generate innovations (Africa Center for Economic Transformation).
Cameroon’s youth could drive structural transformation. To do so, they require
knowledge of science, technology, and engineering—areas where the country’s
education and training system is weak. At the secondary and tertiary levels there is
inadequate emphasis on knowledge of science, technology, engineering, and
mathematics (STEM). Skills in these areas are essential in the technology-oriented
global economy. Post-basic education requires major overhauling to introduce STEM-
related subjects.
Better skills are also needed in applied science, engineering, and technology (ASET).
ASET focuses on the continuum of skills development from the secondary through
TVET and higher education levels. A preliminary foundational step would be to
introduce sound science and mathematics curriculums in secondary education. This
would make youth trainable to work in applied science, engineering, and technology
areas, and prepare talented youth for university education in these areas.
Technical and vocational and higher education institutions could emphasize specific
skills such as internationally benchmarked IT-enabled services, accompanied by skills
assessment and certification programs. This sector could be a locomotive for
Cameroon’s economic transformation.
Finally, Cameroon needs to prepare itself to respond to the huge indirect and induced
demand for skills for auxiliary trades. For example, the Kribi Port will create a number
of direct, indirect, and induced jobs, including jobs in infrastructure, hotels and
hospitality, and tourism. A range of skilled and unskilled workers will be needed.
Career pathways need to be identified to elevate jobs in certain sectors to the level of
careers. Further, the presumption is that the workforce and skills needed in various
sectors are static. But sectors change over time, and retraining and reskilling of workers
become necessary. Together the focus sectors for this study could reinforce one another,
creating national and regional markets, jobs, and credible careers.
Governance and Institutional Arrangements
198. The institutional arrangements for skill-building policies to manage the relationship
between supply and demand are very important in Cameroon. The Republic of Korea and
Singapore have set up governance arrangements that help articulate demand and supply in a
dynamic way. The institutional context in Cameroon is considerably weaker due to the complex
decision-making process, which involves multiple actors. For Cameroon to reach its full

82
potential and become a middle-income country, the status of skills development needs to be
elevated. The country needs to focus on transforming business and talent and on modernizing
technology.
Information Management System for Jobs
199. Cameroon needs to develop a management information system for jobs, including jobs
forecasting. Good practice examples are available in Sub-Saharan Africa, such as the Access
Nigeria Jobs Information Management System (Box 4). In addition, job fairs would help bring
together potential employers and employees and provide a venue for exchanging information
and identifying talent. Cameroon also needs to move rapidly into IT business process
organization and skills development.
200. Curriculum review to identify the skills gaps, inputs into the architecture for standards
and qualifications frameworks at TVET and higher education levels, appropriate learning
assessments to examine outcomes more closely linked to skills areas and to review learning
outcomes in areas such as IT/ITES and job readiness that are missing, and determining the
ways of addressing the gaps and how they can be closed.
Box 4. Access Nigeria Jobs Information Management System
The ACCESS Nigeria Project, which is financed by the World Bank, supports the development of new
workforce equipped with the skills and training required by industry. Doing so will enable Nigeria to compete
in fast-growing economic areas, particularly IT-enabled services and the services sector generally, including
banking, telecommunications, business process organization services, energy, and hospitality. To empower
participants and create jobs, the project uses a three-pronged approach: assessment, training, and certification.
Overall, the project seeks to provide Nigerian technology and university graduates with access to employment
opportunities in IT-enabled services and beyond, offer Nigerian companies access to a large pool of talented
individuals seeking jobs in the services sector, and give domestic and international clients access to a global
hub for IT-enabled services.
To ensure job placement upon completion of training and the overall success of the project, the Bank and its
partner ODIN (Open Data Innovations Network) have been engaged at all stages with all identified
stakeholders. As part of those efforts, the project created the Access Nigeria Information Management System
(ANJIMS), an interactive electronic engagement platform. The system will connect registered stakeholders—
job candidates, training providers, employers, and the ACCESS Nigeria team—and collate, store, analyze,
report on, and share job-related information and data from them. It will also enable prospective employers to
be fully integrated with the operations of ACCESS Nigeria, with a view of matchmaking and eventual job
placement.
Source: http://www.anjims.org/?page_id=113.
Public-Private Partnerships
201. Promoting work-based training. This would depend on the willingness of employers to
train potential or existing workforce. The approach of creating new institutions with explicit
linkages to industry could bring positive results. The approach has been taken by Ireland,
Malaysia, and Singapore (Box 5) among others.

83
Box 5. Singapore and Skills Development
A Strategy for Building a Pipeline of Skills for a Whole Industry
Singapore’s approach of learning-by-doing to build a recognized worldwide and world-class system of technical training is instructive.
In 1961 Singapore set up the Economic Development Board (EDB) as a statutory board under the Ministry of Finance in an effort to attract foreign direct investment to the country. The key elements of the strategy for skills development was to include six training-cum-
production workshops run in parallel to the school system under the Engineering Industry Development Authority (EIDA). With funding
from the United Nations Development Plan and technical assistance and contributions of machinery from Japan, Britain, and France. However, the six centers turned out to be an administrative problem to the EIDA. The Authority underwent three management changes.
The centers were not cost-effective. At the end of four years, the government had spent $12 million on EIDA, but only 86 people had
graduated. The scheme was closed in 1973. Then EDB experimented with Worker Retraining Schemes. The EDB worked with the Ministry of Education to offer on the premises of existing educational facilities, retraining courses in technical subjects (such as metal
work, machine turning and fitting, radio maintenance and reports, and plumbing. The programs were remedial options for students who
were performing below standards. The formal system of technical and vocational training was left untouched. Instead, the strategy adopted was one of leapfrogging and a mission-centric approach designed to go in tandem with the EDB’s investment promotion and
industry development effort. The strategy was to affiliate with leading international industry partners with proven training systems, to
learn the training business from them, to train to their needs, and to adapt and improve the methods to meet local needs. The first
arrangement was with the Tata Group (India’s largest engineering firm at the time. It makes trucks, excavators, locomotives, machine
tools, etc.). The strategy provided a prototype for scaling up a successful model of company-affiliated training. EDB wish to attract Tata
as an investor in Singapore, setup a training facility that would produce workers trained in the way Tata required (that is, similar to the training schools that supplied Tata’s workers in India). The Government of Singapore provided the land and buildings, contributed 70
percent of the operating costs of the center, and paid the stipends of the trainees, all of whom had signed a bond to serve the EDB or any
company as directed by the government for a period of five years. The training center opened in 1972. It trained twice the number of staff that Tata required. Tata hired the best of the graduating trainees while EDB retained the rest as a marketing asset to attract other
engineering firms to Singapore. In effect the strategy built a pipeline of skills to grow a whole industry rather than to meet the needs of
a single company. Two company-affiliated training centers were set up (Rollei-Werke and Philips). Other approaches were: joint training programs through “transnational” partnership. This approach avoided the proliferation of new institutions. The practice of pooling
training resources to serve companies in the industry cluster was forged. The approach contained key ingredients for Singapore to acquire
the advanced skills for growing its new technology-intensive industries, the secondment of experts to Singapore, the training of EDB lecturers and technical staff, commitment to upgrade equipment and software, and commitment from participating companies to remain
in the scheme for at least three years.
Source: Chiang, 1998 in Ansu and Tan, May 2012.
202. The Cameroon Chamber of Commerce could emulate India’s NASSCOM model (Box
6). The approach could make a difference to new small and medium-size enterprises in IT and
IT-enabled services.
Box 6. India’s National Association of Software and Services Companies
The National Association of Software and Services Companies (NASSCOM) is a nonprofit trade association
created in 1988 by India’s information technology and business process outsourcing industries. Its mission is
to promote sustainable industry growth and to harness technology to benefit society. NASSCOM is a global
trade body with more than 1,500 members, over 250 of which are companies from China, the European Union,
Japan, the United Kingdom, and the United States. NASSCOM's member companies are engaged in e-
commerce, IT-enabled and business process outsourcing services, and software development, services, and
products. NASSCOM facilitates business and trade in software and services and encourages the advancement
of research in software technology. It sponsors a variety of activities: policy advocacy, events and
international conferences, international affiliations, and skills development.
Source: http://www. NASSCOM.in
203. Public-private partnerships such as the World Bank-SAP skills development program
in Africa could facilitate applications-based accounting and other training for youth in
Cameroon (Box 7).

84
Box 7. World Bank-SAP and Skills Development in Africa
SAP Africa (a subsidiary of SAP AG) and the World Bank planned to collaborate on skills development in
Africa. This move came shortly after the launch of SAP’s Skills for Africa Program to provide IT training to
2,500 students to boost access to IT education and support entrepreneurs. After announcing the collaboration,
SAP Africa CEO Pfungwa Serima attended a series of meetings across the United States focused on refining
synergies between SAP’s African operations and the Bank’s goals for Africa. “SAP recognizes that promoting
education and training is one of the best ways to improve the problem of chronic youth unemployment, an
issue affecting the technology industry as a whole,” Serima said. “With growth and the scarcity of skills on
the African continent a prominent issue on our minds, we anticipate that our collaboration with the World
Bank will amplify our efforts to develop world-class IT and business skills and give Africa’s youth an
opportunity to play a role in contributing towards Africa’s future economic growth and infrastructure
development.” The first phase of the joint skills development initiative was expected to be rolled out in 2013.
A pilot of the Skills for Africa Program began in Kenya in 2012 with 100 students. Additional SAP
investments in the region range from a multilateral partnership to improve Ghana’s shea butter supply chain
to working with South Africa’s Standard Bank Group to bring mobile banking services to people who do not
have bank accounts.
Source: Triple Pundit, May 2013.
Alternate Financing Options for Skills Programs
204. Financing could be an effective tool for channeling the flow of students through the
life-cycle stages of skills development. Given rising demand and unit costs, the Government
of Cameroon needs to consider alternate financing options for skills programs including:
Earmarked grants for vulnerable, marginalized, and excluded populations such as the
poor, women, and the handicapped.
Secondary education bursary schemes to support the efforts of parents.
TVET bursaries.
A training levy used to shore up financing for skills development.
Incentives for major businesses to demonstrate corporate social responsibility.
Efforts to attract foreign direct investment, which would provide technical assistance,
opportunities for knowledge transfer, and skills development options.
A variety of financing options could be developed and fashioned along the models of Chile,
Malaysia, and Singapore (Box 8).

85
Box 8. Programs to Reach Smaller Employers in Chile, Malaysia, and Singapore
Chile provides an income tax rebate program for firms that train their workers, whether directly or
through registered contractors. The rebate can reach a maximum of 1 percent of a firm’s payroll,
with a floor that benefits smaller firms. This model allows firms to choose the content and provider
of their training programs according to their needs. Smaller firms that do not have the capacity to
design and deliver training programs can use intermediary technical assistance institutions (OTICs)
to organize training for delivery by training providers. OTICS are nonprofits established for specific
sectors or regions. They are not training providers and are prohibited from delivering training
directly.
Singapore’s Skills Development Fund (SDF) and Malaysia’s Human Resource Development Fund
(HRDF) have explicit programs targeting small enterprises. They provide services such as vouchers
to ease cash-flow constraints, grants for training needs analysis and course design, and
simplification of administrative approvals. Singapore offers a training voucher to companies with
fewer than 50 workers. The voucher allowed firms to pay 30-50 percent of training costs, while the
SDF supported the balance. In Malaysia large enterprises with excess training capacity are
encouraged to offer training to employees of other enterprises, particularly small and medium-size
ones lacking the expertise and resources to do so themselves. Small enterprises that send workers
to such training are eligible for grants from the HRDF.
SDF grants were also extended to enterprises to hire consultants to conduct companywide analyses
of training needs, leading to the submission of worker training plans to the SDF. Subsequent
financing helped smaller firms access the specialized resources needed to assess training needs and
design appropriate training programs. The HRDF helps companies select the most suitable programs
for the skill development of all employees. The SDF made available a wide range of preapproved
public courses for companies to subscribe to under its Approved in Principle System. This program
was effective in attracting small companies that had neither the expertise nor the critical mass to
conduct such programs on their own. Malaysia’s HRDF offered a similar Approved Training
Program.
Source: Galhardi, 2002; Sehnbruch, 2006; Hirosato, 2007.
Monitoring and Evaluation Systems for Skills Development Programs
To improve data collection on day-to-day management of the program(s) with the
ultimate objective of improving results.
The aspects of identifying and tracking a good “control group” would be a core
element.
Best practice examples of skills evaluations.
Expected Outcomes
205. For Cameroon to become a middle-income country, a first step would be to reduce
systemic inefficiencies and streamline service delivery in education and skills development.
Efforts should be made in three areas.

86
Reducing Systemic Inefficiencies
Addressing employer constraints by reducing the transaction costs of doing business—
specifically, taking steps to reduce corruption and governance challenges; reducing
bureaucracy for startup firms; improving enabling infrastructure; involving the private
sector in sector dialogue and decisions; improving transportation options; and
guaranteeing the supply of raw materials.
Simplifying governance and institutional arrangements by reviewing legislation,
reducing the number of ministries responsible for technical and vocational training,
rationalizing service delivery, and improving oversight through public-private
partnerships and community involvement.
Promoting Options
Developing a range of financing and service delivery options to respond to different
demands for skills development and enhancing service delivery.
Exploring managerial skills and micro- and small enterprises in industrial clusters, with
a view toward developing industrial parks (World Bank, 2009).
Boosting the Contribution of the Informal Sector
Addressing human development and skills constraints and needs by rationalizing the
post-basic education sector. If the human dimension of skills development is not
addressed, capital investments and finance alone cannot raise productivity in
Cameroon. The savoir faire is a key element for improving productivity.
Exploiting the synergies of knowledge and technology transfers for economic growth.

87
Appendix 1
1. Data Sources on Employment in Cameroon25
There are three main sources of data and information on employment in Cameroon: (a) the 1996, 2001, and 2007
Household Consumption Surveys, (b) the Non-Farm Enterprise Module of the 2001 Household Survey, and (c)
the 2005 and 2010 Employment and Informal Sector Surveys.
1. Household Consumption Surveys
There have been three Household Consumption Surveys (Enquête Camerounaise auprès des Ménages or ECAM)
undertaken in Cameroon, one in 1996, 2002, and 2007. The first survey (ECAM-I) was conducted by the Ministry
of Economy and Finance (MINEFI) in 1996 over a three-month period and comprised a random sample of
approximately 1,800 households across the country’s ten provinces, of which 1,731 households were actually
visited.
The second survey (ECAM-II) was conducted by the National Institute of Statistics over a six-month period in
2001. It was much larger in its coverage relative to ECAM-I and comprised 11,553 households, of which 10,992
were actually visited. The format of ECAM-II, however, was identical to that of ECAM-I in terms of strata and
territory and the National Institute of Statistics undertook a reconciliation process with support from the World
Bank in order to render both surveys comparable.26
The most recent survey (ECAM-III) was undertaken in 2007 (Box 9). In order to insure comparability with the
2001 and 2006 surveys, the methodology of ECAM-III was the same as that for ECAM-II. It surveyed 12,000
households across 12 regions (each province plus Douala and Yaoundé) and three strata (urban, semi-urban, and
rural). A “light” survey on employment and earnings during the year involving 3,000 households was also
conducted, with a view to obtain seasonal coefficients that could assist in assessing the employment situation
within a year (i.e., seasonality). The results of the light survey are forthcoming.
25 Ames and Godang. 2012. Employment in Cameroon: Stock Take of Studies and Programs, Assessment of Existing Gaps
and Opportunities, and Proposed Next Steps. 26 Institute Nationale de Statistique (INS), 2002.

88
Box 9. Main Results of ECAM III The ECAM-II and ECAM-III household surveys allow for both a snapshot at each point in time (2001 and 2007)
as well as a comparison of the evolution of individual indicators over the two time periods. The following are the
main findings and trends derived from these surveys.
Employment distribution: About 85% of employment was with regard to self-employment/non-wage, while wage
employment constituted only 15%. Of the 85%, the majority (60%) was self-employment on the family farm, with
the remaining 25% being employment in non-farm enterprises. Wage employment was principally in the private
sector (9%), with the public sector (4%) and agriculture (2%) comprising the remainder. Although the main
aggregates were broadly unchanged over the period 2001 to 2007, there employment on family farms increased
(from 56% in 2001 to 60% in 2002) while employment in non-farm enterprises declined (from 29% to 25%).
Household Enterprises by Industry: HE activity was principally with regard to wholesale/retail trade (50%),
manufacturing (23%), other services (11%), and transportation/communication (10%). Over time, the share of
wholesale/retail trade declined (from 68% in 2001), while the shares of manufacturing, other services increased
slightly. Transportation/communication increased in share by 8 percentage points during this period. Although
manufacturing remained constant in share in urban areas, it nearly doubled in importance (from 18% to 32%) in
rural areas over this period. Other services, however, increased in relative importance in rural areas (by 6
percentage points), while they declined in importance (by 3 percentage points) in urban areas.
Employment distribution by sex: Female employment was principally with regard to self-employment/non-wage
(91%), and was significantly greater than male employment (78%) in this area. This was the case regarding
employment on family farms (68% for women and 52% for men), with the opposite being true for women
employment in non-farm enterprises (23% versus 26% for men). In turn, male wage employment (22%) was greater
in importance relative to female wage employment (9%), which was the case for both public and private wage
employment. There was no significant change in these ratios for women over the period 2001 to 2007, while wage
employment declined marginally in importance for males and self-employment/non-wage employment increased
marginally (by 1.4 percentage points).
Employment by area: Self-employment/non-wage employment constituted the greatest share of employment in
both urban (71%) and rural areas (92%), but was relatively more important in the later. Employment in rural areas
was principally with regard to family farms (78% versus 14% for non-farm enterprises), while the opposite was
the case in the urban areas (45% for non-farm enterprises versus 26% for family farms). Wage employment was
greatest in urban areas (29%) versus rural areas (8%), with relatively larger shares for urban private and public
wage employment and relatively lower shares for agriculture wage employment. Over time, the distribution of
employment across activities remained relatively constant in rural areas, while there was a sharp reduction (from
38% in 2002 to 29% in 2007) in urban wage employment and an equally large increase in importance of self-
employment/non-wage in urban areas (from 62% in 2001 to 71% in 2007).
Source of household income: Family farms constituted the most important sources of incomes for households
(64%) and increased in relative importance since 2001 (57%). In turn, non-farm enterprises declined in relative
importance (from 42% in 2001 to 38% in 2007), while the shares of wage employment remained largely unchanged.
Education distribution of the labor force: In 2007, close to two-thirds of wage earners had a primary education
or less (63%), down from 72% in 2001. The percentage of workers with primary education or below was greater
in rural areas (76%) than in urban areas (39%). Over time, there was a 6 percentage point decline in rural workers
with a primary education or below and a 9 percentage point decline in urban workers.
Source: Cameroon National Institute of Statistics, ECAM-II and ECAM-III.

89
2. Non-Farm Enterprise Module of 2001 Household Consumption Survey
The 2001 ECAM Household survey included a module on the non-farm enterprise sector. This provided a detailed
perspective of the non-farm sector at a particular point in time across a wide set of indicators (Box 10). However,
since the 2007 ECAM survey did not include such a module, there is no scope to assess developments across these
indicators since 2001. It does, however, provide a useful snap shot at a single point in time (albeit a decade ago)
of the composition and activities of informal sector and/or household enterprises.
3. Employment and Informal Sector Surveys (EESI)
There have also been two Employment and Informal Sector Surveys (Enquete sur l’Emploi et le Secteur Informel
au Cameroun or EESI), one in 2005 and the other in 2010. These followed an initial 1-2-3 survey that was focused
solely on the city of Yaoundé, which was a major limitation since the data could not be extrapolated at the national
level. The EESI surveys, however, were national in coverage. They involved a two-phased statistical survey which
evaluated the employment situation facing individuals (phase 1) and the economic activities of households and
their members in the informal sector (phase 2). Data were provided for key informal sector employment indicators
for Yaoundé, Douala and the 10 provincial administrations, with each province subdivided into rural, semi-urban,
and urban categories. Data on enterprises were broken down by type of enterprises within the informal sector
called informal production units (UPIs). The 2005 exercise surveyed a total of 5,274 UPIs, of which 4,815 were
actually interviewed. The 2010 survey expanded to 8,160 UPIs, of which 7,932 (97.2%) were actually surveyed.
A total of 22, 949 persons 10 years or older were captured by the survey with a 99.2% success rate. The EESI-2
data allows for a comparative analysis of the performance of these key indicators by over time (2005 – 2010). The
main findings are presented below (Box 11).
Box 10: 2001 Non-Farm Enterprise Module The 2001 Non-Farm Enterprise Module provides data on Household Enterprises (HEs) broken down by owner
and by enterprise. The main findings are summarized below:
By Owner
Share of households: 36% of households in Cameroon have an HE.
Source of employment: HE is the primary source of employment for over two thirds of HE owners.
Gender: Largely Female (56.8%) versus Male (43.2%).
Education: 95% have less than a high school education, 55% have less than a primary education,
with one-third have no formal education whatsoever.
Age: two-thirds of HE owners are ages 20-44 and a quarter are age 45+.
By Enterprise
Location: Most HEs are located in rural areas (56%) but are also significant in urban areas (44%).
Age of enterprise: 44% have been around for 5 years, with 17% being less than one year.
Number of months operated a year: About one third of the HEs are operated only 1-3 months per
year, another third only 4-6 months per year and the remainder 7-12 months per year.
Sector: Over two-thirds of HEs are in wholesale/retail trade, with manufacturing (17%) and services
(12%) comprising the other main sectors of activity.
Source: Cameroon National Institute of Statistics, ECAM-II, Non-Farm Enterprise Module, 2001.

90
Box 11. Main Findings of 2010 EESI-2
Overview: The survey involved 4,705 informal units of production (IUP) across the country and was divided
into one component on the labor market and another component on the informal sector.
Size of Household: The average size of a Cameroonian household is 4.4 persons, which remain stable relative
to 2005 EESI (4.5). Household are larger in rural areas (4.7) than in urban areas (4.0). The size is greater in
the North (5.9), the Extreme North (5.4), and Adamaoua (4.9), in contrast to the South (3.3)
Head of Household: The average head of household in Cameroon is a man (74%), 42 years old (39 years in
urban areas and 44 years in rural areas) with a primary education or less.
Structure of the population
Men (49.6%) and Women (50.4%)
Ages 0-14 (43.7%); ages 15-64 (53.1%); and ages 65+ (3.3%).
Migrants 67.3% and Non-migrants (32.7%). The principal reason given justifying migration was
regrouping of the family (53.3%) et job search (25.1%).
7 out of 10 persons (71.2%) of persons 15 years or more are literate.
The average age of active workers is 33 years.
Employment
The employment rate is 66.4% and varies significantly between men (71.7%) and women (52.2%)
and rural (74.6%) and urban (54.7%) areas.
The proportion of salaried jobs is low (20%) and is higher in urban areas (41.1%) than in rural areas
(9.4%), and in the towns of Yaoundé (50.5%) and Douala (41.9%)
The breakdown by socio-professional categories are as follows: Les cadre (5%); Workers and
employees (15.2%); Independent workers (47.2%); and Family aids (29.7%)
1.41 million children ages 10-17 are engaged in employment (40% of people in this age group).
The present generation is better educated than the previous one and prefers public sector jobs.
There is a lack of awareness of public and private agencies that assist in helping people enter the job
market.
Unemployment
The unemployment rate (ILO sense) is estimated at 3.8%, with Yaoundé (10%) and Douala (9.1%)
registering the highest unemployment rate relative to the other regions such as the South (5.5%),
South West (4.4%) , and Adamaoua (4.3%)
Unemployment is essentially an urban phenomenon with the rate being higher in urban (8.1%) versus
rural (1.4%) areas. It is highly concentrated in Douala and Yaoundé, with double-digit rates.
Unemployment mainly affects the youth, especially aged 15-34, where the unemployment rate
estimated at 15.5%.
Women (4.5%) face a slightly higher unemployment rate than men (3.1%), and are also the most
discouraged when it comes to looking for employment.
More than half of the unemployed have been looking for a salaried job for more than a year.
The minimum acceptable income to the unemployed for a job averages FCFA 59,800 per month
(FCFD 70,900 for men and FCFA 54,000 for women), which is twice the minimum wage.
Under-employment
The main problem of the labor market in Cameroon is not unemployment, but under-employment.
Nearly three out of four workers are underemployed (71%) or 6.3 million persons, with problem
being more significant in rural areas (78.8%) than in urban areas (55.7%).
The visible under-employment rate (where the persons works involuntarily less than 35 hours per
week) is 12.3% of the active population and ranges from 10.9% for those unschooled to 23% for
those with a superior level of instruction.
The invisible under-employment rate (where hourly wage is below the level fixed by the law) is
63.7% of the active population or 5.7 million persons.
Source: Cameroon National Institute of Statistics.
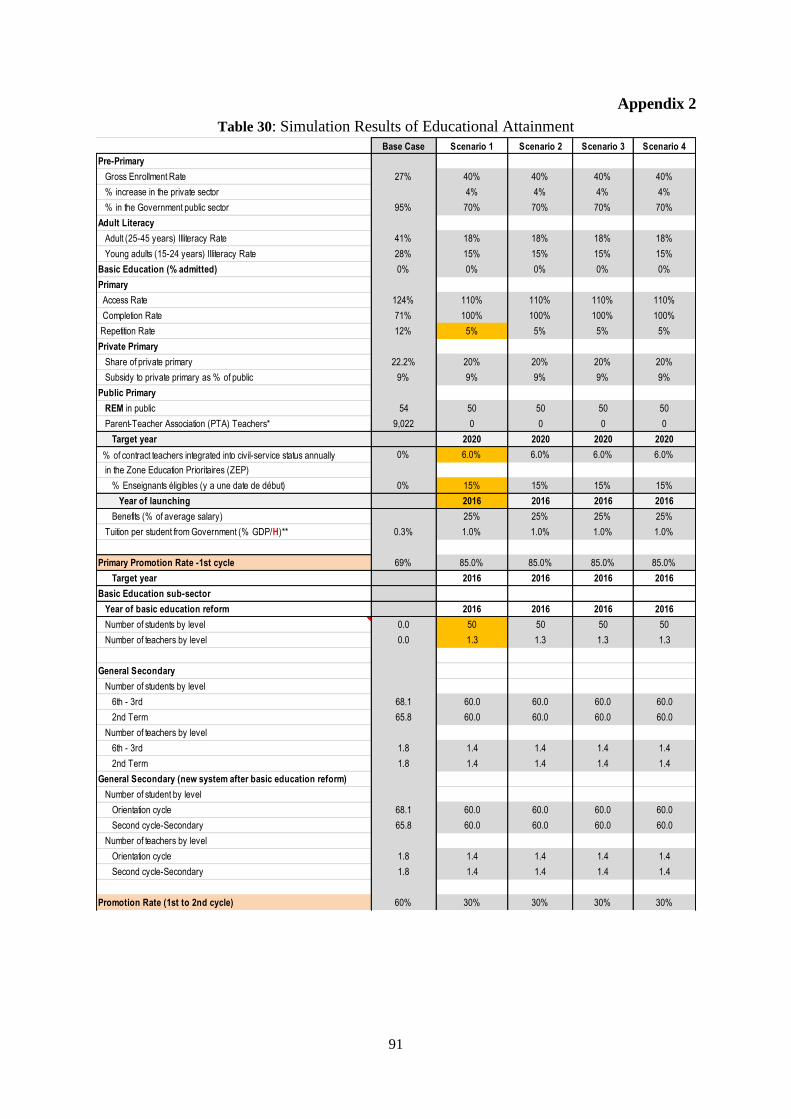
91
Appendix 2
Table 30: Simulation Results of Educational Attainment
Base Case Scenario 1 Scenario 2 Scenario 3 Scenario 4
Pre-Primary
Gross Enrollment Rate 27% 40% 40% 40% 40%
% increase in the private sector 4% 4% 4% 4%
% in the Government public sector 95% 70% 70% 70% 70%
Adult Literacy
Adult (25-45 years) Illiteracy Rate 41% 18% 18% 18% 18%
Young adults (15-24 years) Illiteracy Rate 28% 15% 15% 15% 15%
Basic Education (% admitted) 0% 0% 0% 0% 0%
Primary
Access Rate 124% 110% 110% 110% 110%
Completion Rate 71% 100% 100% 100% 100%
Repetition Rate 12% 5% 5% 5% 5%
Private Primary
Share of private primary 22.2% 20% 20% 20% 20%
Subsidy to private primary as % of public 9% 9% 9% 9% 9%
Public Primary
REM in public 54 50 50 50 50
Parent-Teacher Association (PTA) Teachers* 9,022 0 0 0 0
Target year 2020 2020 2020 2020
% of contract teachers integrated into civil-service status annually 0% 6.0% 6.0% 6.0% 6.0%
in the Zone Education Prioritaires (ZEP)
% Enseignants éligibles (y a une date de début) 0% 15% 15% 15% 15%
Year of launching 2016 2016 2016 2016
Benefits (% of average salary) 25% 25% 25% 25%
Tuition per student from Government (% GDP/H)** 0.3% 1.0% 1.0% 1.0% 1.0%
Primary Promotion Rate -1st cycle 69% 85.0% 85.0% 85.0% 85.0%
Target year 2016 2016 2016 2016
Basic Education sub-sector
Year of basic education reform 2016 2016 2016 2016
Number of students by level 0.0 50 50 50 50
Number of teachers by level 0.0 1.3 1.3 1.3 1.3
General Secondary
Number of students by level
6th - 3rd 68.1 60.0 60.0 60.0 60.0
2nd Term 65.8 60.0 60.0 60.0 60.0
Number of teachers by level
6th - 3rd 1.8 1.4 1.4 1.4 1.4
2nd Term 1.8 1.4 1.4 1.4 1.4
General Secondary (new system after basic education reform)
Number of student by level
Orientation cycle 68.1 60.0 60.0 60.0 60.0
Second cycle-Secondary 65.8 60.0 60.0 60.0 60.0
Number of teachers by level
Orientation cycle 1.8 1.4 1.4 1.4 1.4
Second cycle-Secondary 1.8 1.4 1.4 1.4 1.4
Promotion Rate (1st to 2nd cycle) 60% 30% 30% 30% 30%

92
Base Case Scenario 1 Scenario 2 Scenario 3 Scenario 4
Distribution by level of education (%)
General 79% 79% 79% 79% 79%
Technical and professional 21% 21% 21% 21% 21%
TVET enrollments (REM)
TVET 1 - TVET 4 or 5 26.0 25 25 25 25
TVET 5 or 6 - TVET 7 10.6 20 20 20 20
Public sector vocational training : Quality (1 less or 2 more)
Quality of vocational training (1 average or 2 would be better) 1 1 1 1
% exits from primary integrated system in the SAR/SM-CFM 10% 10% 10% 10%
% exists from secondary integrated system in the CFPR 20% 20% 20% 20%
Expenditure on assets and services/learning related (FCFA '000)
SAR/SM 129 257.4 257.4 257.4 257.4
CFPR 129 386.2 386.2 386.2 386.2
Target Year 2,016 2,016 2,016 2,016
Higher Education (University)
Choice (1: based on enrollments ; 2: /100 000 persons) 1 1 1 2
Number of students for every 100 000 persons 1,216 2,100 2,100 2,100 2,100
% in private sector 15% 20% 20% 20% 20%
Higher education: Quality (1 at least or 2 plus) 1 1 1 1
Passing rate in baccalauréat 55% 70% 70% 70% 70%
Transition rate to upper secondary 63% 60% 60% 60% 60%
% of bachelor's level graduates going to public sector universities 85% 75% 75% 75% 75%
Share of general education programs 81% 70% 70% 70% 70%
Pupil-teacher ratio (general programs) 64 55 55 55 55
Pupil-teacher ratio (technical and professional programs) 25 35 35 35 35
Monthly salary of a teacher (Per capita GDP/population) 7.5 9 9 9 9
Unit cost per student (GDP per capita/population) general programs 0.05 0.07 0.07 0.07 0.07
Unit cost per student (GDP per capita/population) TVET programs 0.15 0.20 0.20 0.20 0.20
% of students receiving merit scholarships 36% 12% 12% 12% 12%
Per capita amount per scholarship (% GDP/population) 8% 10% 10% 10% 10%
Research allocation per teacher (GDP/population) 2.7 4 4 4 4
Unit cost of MINFI subsidies (GDP/population) 0.16 0.16 0.16 0.16 0.16
National Resources
Fiscal impact (% ): Revenue (Public sector/GDP) 17.5% 17.5% 20.0% 20.0% 20.0%
Education finance and expenditures and Revenue Public Sector/Revenue 18.3% 17.2% 18.0% 19.0% 20.0%
Target year for launching 2020 2016 2016 2016
Changes in salary 0% 12.3% 15.0% 15.0%
Notes : * PTA teachers are scheduled to be phased out by 2016-17; ** reflects 'paquet minimum'.

93
Table 31. Potential New Entrants into the Workforce by Level of Education (all scenarios)
Base Scenario 1 Scenario 2 Scenario 3 Scenario 4
Distribution by level of education (%)
2010-
2011
2013 to
2015
2019-
2020
2024-
2025
2013 to
2015
2019-
2020
2024-
2025
2013 to
2015
2019-
2020
2024-
2025
2013 to
2015
2019-
2020
2024-
2025
Ministry of Basic Education 34.7% 33.1% 40.9% 38.9% 33.2% 40.9% 38.6% 33.2% 40.9% 38.4% 33.2% 40.9% 38.4%
Pre-primary 3.2% 2.8% 2.3% 1.9% 2.9% 2.3% 1.9% 2.9% 2.4% 1.9% 2.9% 2.4% 1.9%
Primary 31.3% 28.0% 26.0% 23.7% 27.9% 25.5% 22.9% 27.9% 25.4% 22.6% 27.9% 25.4% 22.6%
Observation cycle 0.0% 1.9% 12.0% 12.6% 2.0% 12.4% 13.0% 2.0% 12.5% 13.1% 2.0% 12.5% 13.1%
Basic Non-formal Education 0.0% 0.0% 0.0% 0.0% 0.0% 0.0% 0.0% 0.0% 0.0% 0.0% 0.0% 0.0% 0.0%
Adult Literacy 0.1% 0.4% 0.6% 0.7% 0.4% 0.7% 0.7% 0.4% 0.7% 0.7% 0.4% 0.7% 0.7%
Ministry of Secondary Education 43.6% 39.9% 29.8% 32.7% 39.2% 29.0% 32.2% 39.0% 28.8% 32.2% 39.0% 28.8% 32.2%
1st cycle (old cycle--general secondary) 15.0% 11.6% 0.0% 0.0% 11.4% 0.0% 0.0% 11.3% 0.0% 0.0% 11.3% 0.0% 0.0%
2nd cycle (old cycle--general secondary) 14.5% 16.2% 7.4% 0.0% 15.9% 6.9% 0.0% 15.9% 6.7% 0.0% 15.9% 6.7% 0.0%
Orientation cycle 0.0% 0.0% 11.3% 12.7% 0.0% 11.7% 13.2% 0.0% 11.8% 13.3% 0.0% 11.8% 13.3%
Secondary education--new cycle 0.0% 0.0% 0.0% 7.0% 0.0% 0.0% 7.3% 0.0% 0.0% 7.3% 0.0% 0.0% 7.3%
Primary education teacher training 1.5% 1.1% 1.3% 1.4% 1.1% 1.4% 1.4% 1.1% 1.4% 1.4% 1.1% 1.4% 1.4%
Technical and vocational education and training 12.6% 11.0% 9.7% 11.5% 10.7% 9.0% 10.3% 10.7% 8.9% 10.2% 10.7% 8.9% 10.2% Ministry of Technical & Professional Vocational
Education 2.9% 3.1% 3.2% 2.4% 3.1% 3.1% 2.2% 3.1% 3.1% 2.3% 3.1% 3.1% 2.3%
Ministry of Higher Education 18.8% 23.9% 26.1% 26.1% 24.5% 27.0% 27.0% 24.7% 27.2% 27.1% 24.7% 27.2% 27.1%
Total 100.0% 100.0% 100.0% 100.0% 100.0% 100.0% 100.0% 100.0% 100.0% 100.0% 100.0% 100.0% 100.0%
Source: Education & Training Simulation Model for Cameroon. World Bank, 2013.

94
Appendix 3
SABER-WfD: Detailed scores for Cameroon Figure 36: Functional Dimensions and Policy Goals in the SABER-WfD Framework
SABER-Workforce Development The SABER-Workforce Development is a comprehensive diagnostic of the country’s workforce development (WfD) policies and
institutions. The results are based on a new World Bank tool designed for this purpose. Known as SABER-WfD, the tool is part of the World Bank’s initiative on Systems Approach for Better Education Results (SABER)27 whose aim is to provide systematic documentation
and assessment of the policy and institutional factors that influence the performance of education and training systems. The SABER-
WfD tool encompasses initial, continuing and targeted vocational education and training that are offered through multiple channels, and focuses largely on programs at the secondary and post-secondary levels.
Analytical Framework The tool is based on an analytical framework28 that identifies three functional dimensions of WfD policies and institutions:
(1) Strategic framework, which refers to the praxis of high-level advocacy, partnership, and coordination, typically across
traditional sectoral boundaries, in relation to the objective of aligning WfD in critical areas to priorities for national
development; (2) System Oversight, which refers to the arrangements governing funding, quality assurance and learning pathways that shape
the incentives and information signals affecting the choices of individuals, employers, training providers and other
stakeholders; and (3) Service Delivery, which refers to the diversity, organization and management of training provision, both state and non-state,
that deliver results on the ground by enabling individuals to acquire market- and job-relevant skills.
Taken together, these three dimensions allow for systematic analysis of the functioning of a WfD system as a whole. The focus in the
SABER-WfD framework is on the institutional structures and practices of public policymaking and what they reveal about capacity in the system to conceptualize, design, coordinate and implement policies in order to achieve results on the ground. Each dimension is
composed of three Policy Goals that correspond to important functional aspects of WfD systems (see Figure 36). Policy Goals are further
broken down into discrete Policy Actions and Topics that reveal more detail about the system.
Figure 36: Functional Dimensions and Policy Goals in the SABER-WfD Framework
Implementing the Analysis Information for the analysis is gathered using a structured SABER-WfD Data Collection Instrument (DCI). The instrument is designed to collect, to the extent possible, facts rather than opinions about WfD policies and institutions. For each Topic, the DCI poses a set of
multiple choice questions which are answered based on documentary evidence and interviews with knowledgeable informants. The
answers allow each Topic to be scored on a four-point scale against standardized rubrics based on available knowledge on global good practice (See Figure 3). Topic scores are averaged to produce Policy Goal scores, which are then aggregated into Dimension scores.29
The results are finalized following validation by the relevant national counterparts, including the informants themselves.
27 For details on SABER see http://www.worldbank.org/education/saber. 28 For an explanation of the SABER-WfD framework see Tan et al 2013 and Appendix 3 for an overview of the structure of the framework. 29 Since the composite scores are averages of the underlying scores, they are rarely whole numbers. For a given composite score, X, the
conversion to the categorical rating shown on the cover is based on the following rule: 1.00 ≤ X ≤ 1.75 converts to “Latent”; 1.75 < X ≤ 2.50, to “Emerging;” 2.50 < X ≤ 3.25, to “Established;” and 3.25 < X ≤ 4.00, to “Advanced.”

95
Figure 37: SABER-WfD Scoring Rubrics
Since the composite scores are averages of the underlying scores, they are rarely whole numbers. For a given composite score, X, the conversion to the categorical rating shown on the cover is based on the following rule: 1.00 ≤ X ≤ 1.75 converts to “Latent”; 1.75 <
X ≤ 2.50, to “Emerging;” 2.50 < X ≤ 3.25, to “Established;” and 3.25 < X ≤ 4.00, to “Advanced.”
Source: Tan et al. 2013.
Figure 37: SABER-WfD Scoring Rubrics

96
The SABER-WfD Analytical Framework
Table 32. Cameroon: Benchmarking Scores 2014 Policy Goal Policy Action
Topic
Dim
ensi
on
1
Str
ate
gic
Fra
mew
ork
G1
Setting a Strategic Direction
Provide sustained advocacy for WfD at the top leadership level
G1_T1 2 Advocacy for WfD to Support Economic Development
G1_T2 2
Strategic Focus and Decisions by the WfD Champions
G
2
Fostering a Demand-Led
Approach
Establish clarity on the demand for skills and areas of critical constraint
G2_T1 2
Overall Assessment of Economic Prospects and Skills Implications
G2_T2 1
Critical Skills Constraints in Priority Economic Sectors
Engage employers in setting WfD priorities and in enhancing skills-upgrading for workers
G2_T3 1
Role of Employers and Industry
G2_T4 2
Skills-Upgrading Incentives for Employers
G2_T5 1
Monitoring of the Incentive Programs
G3
Strengthening
Critical
Coordination
Formalize key WfD roles for coordinated action on strategic priorities
G3_T1 1
Roles of Government Ministries and Agencies
G3_T2 1
Roles of Non-Government WfD Stakeholders
G3_T3 2
Coordination for the Implementation of Strategic WfD Measures
Dim
ensi
on
2
Syst
em O
ver
sigh
t
G4
Ensuring
Efficiency and
Equity in Funding
Provide stable funding for effective programs in initial,
continuing and targeted vocational education and training
G4_T1 info Overview of Funding for WfD
G4_T2 3 Recurrent Funding for Initial Vocational Education and Training
(IVET)
G4_T3 2 Recurrent Funding for Continuing Vocational Education and Training
Programs (CVET)
G4_T4 2 Recurrent Funding for Training-related Active Labor Market
Programs (ALMPs)
Monitor and enhance equity in funding for training G4_T5 1 Equity in Funding for Training Programs
Facilitate sustained partnerships between training institutions and employers
G4_T6 2
Partnerships between Training Providers and Employers
G5
Assuring Relevant
and Reliable
Standards
Broaden the scope of competency standards as a basis for
developing qualifications frameworks
G5_T1 2
Competency Standards and National Qualifications Frameworks
G5_T2 1 Competency Standards for Major Occupations
Establish protocols for assuring the credibility of skills
testing and certification
G5_T3 1 Occupational Skills Testing
G5_T4 1 Skills Testing and Certification
G5_T5 1 Skills Testing for Major Occupations
Develop and enforce accreditation standards for
maintaining the quality of training provision
G5_T6 info Government Oversight of Accreditation
G5_T7 2 Establishment of Accreditation Standards
G5_T8 2 Accreditation Requirements and Enforcement of Accreditation
Standards
G5_T9 1 Incentives and Support for Accreditation
G
6
Diversifying Pathways for
Skills Acquisition
Promote educational progression and permeability through multiple pathways, including for TVET students
G6_T1 1 Learning Pathways
G6_T2 2 Public Perception of Pathways for TVET
Facilitate life-long learning through articulation of skills
certification and recognition of prior learning
G6_T3 1 Articulation of Skills Certification
G6_T4 1 Recognition of Prior Learning
Provide support services for skills acquisition by workers, job-seekers and the disadvantaged
G6_T5 1 Support for Further Occupational and Career Development
G6_T6 1
Training-related Provision of Services for the Disadvantaged
Dim
ensi
on
3
Ser
vic
e D
eliv
ery
G
7
Enabling
Diversity and
Excellence in
Training Provision
Encourage and regulate non-state provision of training
G7_T1 1 Scope and Formality of Non-State Training Provision
G7_T2 1 Incentives for Non-State Providers
G7_T3 1 Quality Assurance of Non-State Training Provision
G7_T4 2 Review of Policies towards Non-State Training Provision
Combine incentives and autonomy in the management of
public training institutions
G7_T5 1 Targets and Incentives for Public Training Institutions
G7_T6 1 Autonomy and Accountability of Public Training Institutions
G7_T7 1 Introduction and Closure of Public Training Programs
G8
Fostering
Relevance in Public Training
Programs
Integrate industry and expert input into the design and delivery of public training programs
G8_T1
2 Links between Training Institutions and Industry
G
8
Fostering Relevance in
Public Training
Programs
Integrate industry and expert input into the design and delivery of public training programs
G8_T1 1 Links between Training Institutions and Industry
G8_T2 1 Industry Role in the Design of Program Curricula
G8_T3 2 Industry Role in the Specification of Facility Standards
G8_T4 2 Links between Training and Research Institutions
Recruit and support administrators and instructors for enhancing the market-relevance of public training
programs
G8_T5 1 Recruitment and In-Service Training of Heads of Public Training
Institutions
G8_T6 1 Recruitment and In-Service Training of Instructors of Public Training
Institutions
G
9
Enhancing Evidence-based
Accountability for
Results
Expand the availability and use of policy-relevant data for
focusing providers' attention on training outcomes,
efficiency and innovation
G9_T1 2 Administrative Data from Training Providers
G9_T2 2 Survey and Other Data
G9_T3 1 Use of Data to Monitor and Improve Program and System
Performance
Note:
1. Latent (Limited Engagement)
2. Emerging (Some instances of good practice)
3. Established (Systemic good practice)
4. Advanced (Systemic good practice meeting global standards)
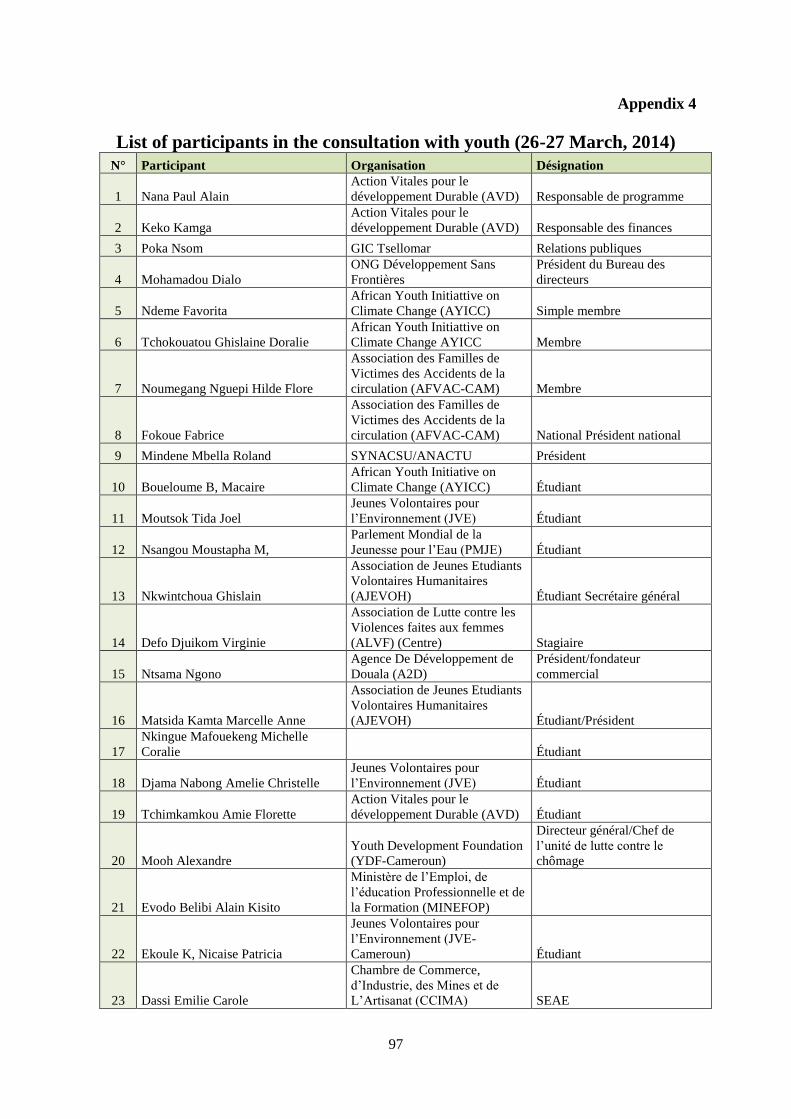
97
Appendix 4
List of participants in the consultation with youth (26-27 March, 2014)
N° Participant Organisation Désignation
1 Nana Paul Alain
Action Vitales pour le
développement Durable (AVD) Responsable de programme
2 Keko Kamga
Action Vitales pour le
développement Durable (AVD) Responsable des finances
3 Poka Nsom GIC Tsellomar Relations publiques
4 Mohamadou Dialo
ONG Développement Sans
Frontières
Président du Bureau des
directeurs
5 Ndeme Favorita
African Youth Initiattive on
Climate Change (AYICC) Simple membre
6 Tchokouatou Ghislaine Doralie
African Youth Initiattive on
Climate Change AYICC Membre
7 Noumegang Nguepi Hilde Flore
Association des Familles de
Victimes des Accidents de la
circulation (AFVAC-CAM) Membre
8 Fokoue Fabrice
Association des Familles de
Victimes des Accidents de la
circulation (AFVAC-CAM) National Président national
9 Mindene Mbella Roland SYNACSU/ANACTU Président
10 Boueloume B, Macaire
African Youth Initiative on
Climate Change (AYICC) Étudiant
11 Moutsok Tida Joel
Jeunes Volontaires pour
l’Environnement (JVE) Étudiant
12 Nsangou Moustapha M,
Parlement Mondial de la
Jeunesse pour l’Eau (PMJE) Étudiant
13 Nkwintchoua Ghislain
Association de Jeunes Etudiants
Volontaires Humanitaires
(AJEVOH) Étudiant Secrétaire général
14 Defo Djuikom Virginie
Association de Lutte contre les
Violences faites aux femmes
(ALVF) (Centre) Stagiaire
15 Ntsama Ngono
Agence De Développement de
Douala (A2D)
Président/fondateur
commercial
16 Matsida Kamta Marcelle Anne
Association de Jeunes Etudiants
Volontaires Humanitaires
(AJEVOH) Étudiant/Président
17
Nkingue Mafouekeng Michelle
Coralie Étudiant
18 Djama Nabong Amelie Christelle
Jeunes Volontaires pour
l’Environnement (JVE) Étudiant
19 Tchimkamkou Amie Florette
Action Vitales pour le
développement Durable (AVD) Étudiant
20 Mooh Alexandre
Youth Development Foundation
(YDF-Cameroun)
Directeur général/Chef de
l’unité de lutte contre le
chômage
21 Evodo Belibi Alain Kisito
Ministère de l’Emploi, de
l’éducation Professionnelle et de
la Formation (MINEFOP)
22 Ekoule K, Nicaise Patricia
Jeunes Volontaires pour
l’Environnement (JVE-
Cameroun) Étudiant
23 Dassi Emilie Carole
Chambre de Commerce,
d’Industrie, des Mines et de
L’Artisanat (CCIMA) SEAE

98
No, Participant Organisation Désignation
24 Mballa Viviane
Ministère des Mines, de
l’Industrie et du Développement
Technologie (MINMIDT) CCD
25 Bilo'O Meye Suzanne
Jeunes Volontaires pour
l’Environnement (JVE) Membre
26 Yene Ernest Fondation Conseil Jeune (FCJ) Président
27 Bionde Nick Armand
Youth Development Foundation
(YDF-Cameroun) Responsable de programme
28 Ndjiki Apollinaire APSADJE Président
29 Ngongom Catherine Josiane
Human Right and Freedom
Movement (HRFM) Membre
30 Sandrine Gabriel Mbamba
Association Jeunesse Verte du
Cameroun (AJVC) Relations publiques
31 Alemfack Efozo Nelly-Diane
Jeunes Volontaires pour
l'environnement Directeur exécutif
32 Rabeantoandro Haingomalala
Association de Lutte contre les
Violences faites aux femmes
(ALVF) (Centre) Responsable de programme
33 Nde Athanase
Human Right and Freedom
Movement (HRFM) Rapporteur
34 Ndebi Jean Roger Gerard
Human Right and Freedom
Movement (HRFM) Coordinateur national
35 Mukum Cenotar E,
Association de Jeunes Etudiants
Volontaires Humanitaires
(AJEVOH) Journaliste
36 Mikamb Mi Touamot Gaelle Pamela
Jeunes Volontaires pour
l’Environnement (JVE) Rapporteur
37 Mondeke Iyoma Guy Richard
Parlement Mondial des Jeunes
pour l'Eau (PMJE) Membre
38 Ngo Tjol II Malorie Syporah Solidarité Sans Frontière (SSF) Membre
39 Iloba Dominique Solidarité Sans Frontière (SSF) Membre
40 Eyenga Sandrine
Association Jeunesse Verte du
Cameroun (AJVC) Membre
41 Wamba Suffo Alexis
TUNZA AFRICA&JYE
CAMEROUN Secrétaire général
42 Foe Ekoa BENE Christophe Enfant de Soleil Membre
43 Ngo Mahop Brigitte N, Solidarité Sans Frontière (SSF) Responsable de programme
44 Bouli Nana Louis Cyrille Fondation Ecolia Responsable financier
45 Moudang Jean Vincent Fondation Ecolia Vice-président
46 Boog Jacques Etienne Fondation Ecolia Secrétaire général
47 Achounna Emosin
Le Groupement pour
l’Education et
l’Investissement(GEI) Président
48 Bobiongono Serge Bertrand ICES Spécialiste informatique
49 Nkoth Guy William APSADJE Délégué
50 Thierry Balla APSADJE Délégué
51 Blondel Silenou
Jeunes Volontaires pour
l’Environnement (JVE) Président
52 Enongene Ebong George Ngolle
Ministère de l’Agriculture et du
Développement Rural
(DDLC/MINADER) Cadre
53 Bika Nsam J, Bertrand GIC Belomar Cadre technique et logistique
54
Essomba Bala Martial Enfant du Soleil Responsable

99
No, Participant Organisation Désignation
55 Nikoyo Armand
Youth Development Foundation
(YDF-Cameroun) Membre
56 Mba-Zoa Jacky Laury Enfant du Soleil Membre
57 Kolla Dassi Jores
Réseau des jeunes pour les forêts
d’Afrique Centrale(REJEFAC) Membre
58 Bille Jean Jules
Jeunes Volontaires pour
l’Environnement (JVE-
Cameroun) Membre

100
Appendix 5
List of participants in consultation with Government (25 March, 2014)
N° Participant Organisation Désignation
1 Bandibeno William
Ministère des Domaines, du
Cadastre et des Affaires
Foncières (MINDCAF/DEPC)
Assistant du responsable des
études de première classe
CEA1/Celcoop
2 Sandtoungou Serge
Ministère de la Jeunesse et de
l’Education Civique (MINJEC) Chef de l’unité des statistiques
3 Ndetou Nguessitheu A,
Ministère de l’Environnement et
de la Protection de la Nature
(MINEPDED) CSSP
4 Zemengue Marcel H,
Ministère de l’Environnement et
de la Protection de la Nature
(MINEPDED) CEA2/CPCOOP
5 Mbarga Marie Christiane
Ministère de l’Autonomisation
des Femmes et de la Famille
(MINPROFF) C/Cellule Coop
6 Nkoa Pierre Bernard
Ministère de l’Enseignement
Secondaire (MINESEC)
C/Cellule Études et
Programmation DPPC
7 Dr Mpouak Oswald
Ministère de l'Elevage, des
Pêches et des Industries
Animales (MINEPIA)
C/Cellule Enseignement et
Formation
8 Dr Mfouapon Njueya Martin Luther
Ministère de l'Elevage, des
Pêches et des Industries
Animales (MINEPIA) CEA3/CEFZJH
9 Hebeg Colette Gilsèle
Ministère de l’Agriculture et du
Développement Rural
(MINADER) Cadre/CAPPA
10 Belinga Marc
Ministère des Petites et
Moyennes Entreprises de
l’Economie Sociale et de
l’Artisanat (MINPMEESA)
DPME exécutif
Cadre
11 Tabi Akono François
Ministère de l’Emploi, de
l’éducation Professionnelle et de
la Formation (IF1/MINEFOP) MINEFOP
12 Ngathe Kon Philippe
Ministère de l’Emploi, de
l’éducation Professionnelle et de
la Formation (Ct1/MINEFOP) CT1
13 Ngonga Georgette
Ministre du Travail et de la
Sécurité Sociale (CT1/MINTSS) CT1
14 Bohimo Mouendji Edouard
Chef Cellule des études et des
projets/ Ministre du Travail et de
la Sécurité Sociale (MINTSS) C/CEP
15 Achidi Ngu Valerie
Ministère de l’Agriculture et du
Développement Rural
(MINADER/DEPC/CPIE)
Économiste dans le domaine de
l’agriculture
16
Avomo Epouse Abene Victorine
Chambre de Commerce,
d’Industrie, des Mines et de
L’Artisanat (CCIMA)
Chef du département de
promotion des ventes/ Chef de
promotion du service
17
Bikek Son Honoré Ministère de l’Emploi, de
l’éducation Professionnelle et de
la Formation
(MINEFOP//DFOP)
Chef du service des
approbations et des
reclassifications
professionnelles

101
List of participants in consultation with Government (12-13 December, 2013)
N° Participant Organisation Désignation
1
Chekem Marie-Louise
Ministère de l’Autonomisation
des Femmes et de la Famille
(MINPROFF)
Chef des divisions de
recherche/planification et
coopération
2
Fonpumdap Jean-Jacques
Ministère de l’Emploi, de
l’éducation Professionnelle et de
la Formation
(MINEFOP/DRMO)
Assistant du directeur de la
réglementation et de la
planification de la main-
d’œuvre
3 Mohamadou Aminou
Ministère des Finances
(MINFI/DAE) Chargé d’études
4 Nana Fadimatou
Ministre de la Fonction Publique
et de la Réforme Administrative
(MINFOPRA/DRPPCE)
Assistant de première classe
Chargé d’études/unité
Chef des études et des
statistiques
5 Ndebi Ntamack Donatien
Ministère de l’Emploi, de
l’éducation Professionnelle et de
la Formation (MINEFOP)
6
Ndip Remes Ministère de l’Enseignement
Secondaire (MINESEC/DPPC)
Référent DSCE/ Chef d’unité
de suivi et d’évaluation de
projet
7
Njimbon Etienne
Ministère de l’Emploi, de
l’éducation Professionnelle et de
la Formation
(MINEFOP)
Chef de division de promotion
de l’emploi
8 Ouwe Louise Honorine
Ministère de l’Emploi, de
l’éducation Professionnelle et de
la Formation
(MINEFOP) Attaché à l’éducation
9
Samba François
Ministère de l’Industrie, des
Mines et du Développement
Technologique (MINMIDT)
Chargé d’études assistant de
première classe, suivi de l’unité
10 Sandja Teddy Jenkis
Ministère des Mines, de
l’Industrie et du Développement
Technologie
(MINMIDT/DEPCO) Cadre
11 Perrot Vincent Banque mondiale Consultant
12 Sosale, Shobhana Banque mondiale Chef de projet
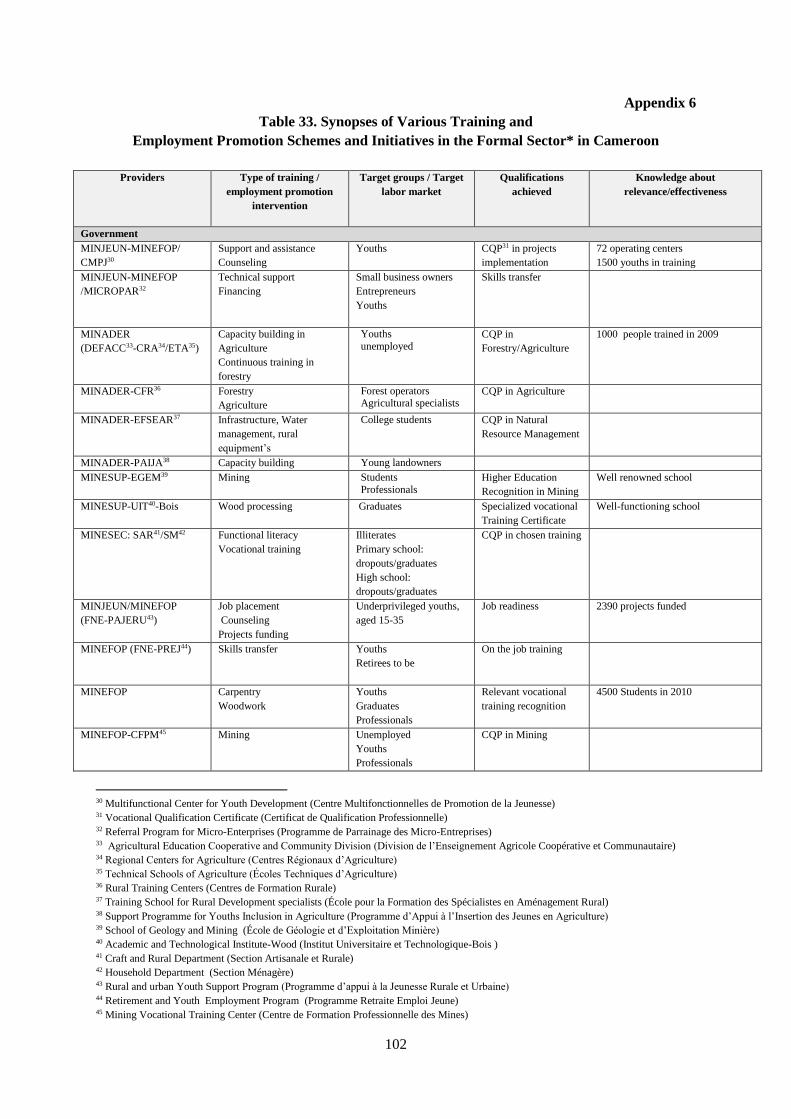
102
Appendix 6
Table 33. Synopses of Various Training and
Employment Promotion Schemes and Initiatives in the Formal Sector* in Cameroon
Providers Type of training /
employment promotion
intervention
Target groups / Target
labor market
Qualifications
achieved
Knowledge about
relevance/effectiveness
Government
MINJEUN-MINEFOP/
CMPJ30
Support and assistance
Counseling
Youths CQP31 in projects
implementation
72 operating centers
1500 youths in training
MINJEUN-MINEFOP
/MICROPAR32
Technical support
Financing
Small business owners
Entrepreneurs
Youths
Skills transfer
MINADER
(DEFACC33-CRA34/ETA35)
Capacity building in
Agriculture
Continuous training in
forestry
Youths
unemployed
CQP in
Forestry/Agriculture
1000 people trained in 2009
MINADER-CFR36 Forestry
Agriculture
Forest operators Agricultural specialists
CQP in Agriculture
MINADER-EFSEAR37 Infrastructure, Water
management, rural
equipment’s
College students CQP in Natural
Resource Management
MINADER-PAIJA38 Capacity building Young landowners
MINESUP-EGEM39 Mining Students
Professionals Higher Education
Recognition in Mining
Well renowned school
MINESUP-UIT40-Bois Wood processing Graduates
Specialized vocational
Training Certificate
Well-functioning school
MINESEC: SAR41/SM42 Functional literacy
Vocational training
Illiterates
Primary school:
dropouts/graduates
High school:
dropouts/graduates
CQP in chosen training
MINJEUN/MINEFOP
(FNE-PAJERU43)
Job placement
Counseling
Projects funding
Underprivileged youths,
aged 15-35
Job readiness 2390 projects funded
MINEFOP (FNE-PREJ44) Skills transfer Youths
Retirees to be
On the job training
MINEFOP Carpentry
Woodwork
Youths
Graduates
Professionals
Relevant vocational
training recognition
4500 Students in 2010
MINEFOP-CFPM45 Mining Unemployed
Youths
Professionals
CQP in Mining
30 Multifunctional Center for Youth Development (Centre Multifonctionnelles de Promotion de la Jeunesse) 31 Vocational Qualification Certificate (Certificat de Qualification Professionnelle) 32 Referral Program for Micro-Enterprises (Programme de Parrainage des Micro-Entreprises) 33 Agricultural Education Cooperative and Community Division (Division de l’Enseignement Agricole Coopérative et Communautaire) 34 Regional Centers for Agriculture (Centres Régionaux d’Agriculture) 35 Technical Schools of Agriculture (Écoles Techniques d’Agriculture) 36 Rural Training Centers (Centres de Formation Rurale) 37 Training School for Rural Development specialists (École pour la Formation des Spécialistes en Aménagement Rural) 38 Support Programme for Youths Inclusion in Agriculture (Programme d’Appui à l’Insertion des Jeunes en Agriculture) 39 School of Geology and Mining (École de Géologie et d’Exploitation Minière) 40 Academic and Technological Institute-Wood (Institut Universitaire et Technologique-Bois ) 41 Craft and Rural Department (Section Artisanale et Rurale) 42 Household Department (Section Ménagère) 43 Rural and urban Youth Support Program (Programme d’appui à la Jeunesse Rurale et Urbaine) 44 Retirement and Youth Employment Program (Programme Retraite Emploi Jeune) 45 Mining Vocational Training Center (Centre de Formation Professionnelle des Mines)

103
Providers Type of training /
employment promotion
intervention
Target groups / Target
labor market
Qualifications
achieved
Knowledge about
relevance/effectiveness
MINEFOP-FNE-PADER46 Training and placement
Projects funding
Youths in rural areas Self-employment
Qualification
36000 people trained and
self-employed
MINFOF-ENEF47 Agronomist engineers
Forest managers
Forest operators
Professionals
Graduates
Specialized certificate
in forestry
Well renowned school
PED48 Internship placement Youths
Local enterprises
On the job training 1000 youths enrolled in 2010
MINJEUN-SCNPD49 Project design, monitoring
and management
Youths CQP in projects
development/
implementation
6000 youths trained
129,000 CFA Francs funding for
each project
MINPMEESA-GIPA50 Capacity building for
entrepreneurs
Apprenticeship
Craftsmen CQP in Craftsmanship
Partnerships
MINEFOP-South Korean
government
(CFPE51)
Advanced technical training
(electricity, auto mechanics,
carpentry, design, etc.)
Youths (Unemployed and
graduates)
CQP in chosen
discipline
Training centers in a building
process
MINEFOP- AFD
(CFPS52)
Initial and continuing
training in industrial
maintenance, food
processing, transport,
logistic
Unemployed
Graduates
CQP in relevant
domains
Operating training centers
MINADER-MINEPIA-AFD
(AFOP1&2)
Agriculture
Stock rearing
Young high school
graduates
CQP in agriculture 42 operating public centers
More than 2260 post-primary
students and 441 high school
graduates trained
AFD-GICAM (CFM53) Agro-processing, capacity
building, construction,
electricity, accounting and
IT.
Jobseekers
Private sector
professionals
Youths
Business owners
CQP in the
Agroindustry
Ongoing program
Development Partners
French cooperation-
PAPESAC54
Capacity building
Higher education
Support of training facilities
and Universities
Government
University administrators
University lecturers
Researchers
Students
Program Management
Ongoing program
AFD- ARIZ55 Entrepreneurship Microfinance institutions 322 companies assisted in 2012
CONFEJS - FIJ Self-employment Youths (less than 30) 37 youths trained in 2012
UNESCO-PETU56 Technology
Research
Engineering
College graduates
Scholars
Researchers
Professionals
Master’s degree
PhD in relevant fields
Operating institutions under de
supervision of MINESUP
Internationally renowned
46 Support Program for Rural Jobs (Programme d’Appui aux Emplois Des Ruraux) 47 National School of Forestry and Water Resources (École Nationale des Eaux et Forêts) 48 Graduate Employement Program (Programme Emploi Diplômé) 49 National Civic Service for Participation in Development (Service Civique National de Participation au Développement) 50 Interprofessional Group for Craftsmen (Groupement Interprofessionnel des Artisans) 51 Vocational Training Centers of Excellence (Centres de Formation Professionnelle d’Excellence) 52 Vocational Sectoral Training Centers (Centres de Formation Professionnelle Sectorielle) 53 Vocational Training Center (Centre de Formation aux Métiers) 54 Support Cluster for Professionalization of Higher Education in Central Africa (Pôle d’Appui à la Professionnalisation de l’Enseignement
Supérieur en Afrique Centrale) 55 Monitoring Financial Risk (Accompagnement du Risque Financier) 56 Technological Excellence Cluster (Pôle d’Excellence Technologique)

104
Providers Type of training /
employment promotion
intervention
Target groups / Target
labor market
Qualifications
achieved
Knowledge about
relevance/effectiveness
The World Bank-ACE57 Research
ICT
STEM
College graduates
Scholars
Researchers
Professionals
Master’s degree
PhD in relevant fields
Operating institutions
Private Investors
AES-SONEL58/G4S59 Security Youths (Riparian) (CQP) Security agent
qualification
500 youths trained and hired
AES-SONEL/SCADA Training and job placement
Control, Supervision
Riparian Capacity building in
electricity
40 people hired in the community
AES-SONEL/T-Line
Watchers
Training and job placement
Surveillance
Riparian Capacity building in
electricity
108 watchers recruited (coming
from 54 villages) in 2012
550 T-lines Secured
* Formal sector is defined as those sectors that provide assured employment and a salary to employees.
57 Africa Centers of Excellence 58 National Electric Company (Société Nationale d’Électricité) 59 Group 4 Securicor

105
Appendix 7
Synthesis of Consultations with Public Sector Employees
Key Findings
The goal of the consultations with public sector employees was to identify the skills
public sector employees used mostly in their current job: written communication and language
skills (English/French) and most importantly the skills they lack/need to improve to be
successful in their job: language skills (English/French) and discipline specific training. At the
same time the survey focused on the obstacles faced by public sector employees when
searching for jobs, the main obstacle being skills and job market inadequacy and the amount
of assistance available when searching for employment; 70% of respondents received little to
no assistance.
Information from public sector employees was collected during a workshop and
included skills public sector employees use at their current job, the skills they need to improve
to succeed in their current job, the skills they need to promote to fulfill their career goals, the
kind of training they received from their current job, if any, who has paid for the training, the
type of training that would be helpful for their careers, the main obstacles to finding
employment and the type of assistance they received when looking for a job.
Methodology
18 Public Sector employees from Cameroon participated in the workshop between the
ages of 30 and 60. During consultations with public sector employees they provided
information on 36 questions, including background, current employment and experience, skills,
training and education, future employment and demographic questions.
Findings
Profile of Public Sector Employees
89% of public sector employees have received a post-graduate/ post-doctoral degree;
83% of them would pay for post-secondary education if it can help them secure another
position; all of public sector employees participated in internships during or after school. The
majority of public sector employees, 65% of them would prefer to work in the private sector
instead of the public sector because of higher salaries.
Current employment
Approximately 53% of the public sector employees are performing administrative
work, 29% managerial work and 18% technical work. 67% of public sector employees chose
this area of work because they were qualified to be in that position due to their education.
Public sector employees describe their current employment as decent and the main motivation
for performing their job is promotion opportunities, followed by on the job experience, job
security, training and finally salary.
Skills
The skills that are mostly used by public sector employees in their current job are
written communication, followed by English/French (language skills), computer literacy and
teamwork. The main skills public sector employees need to improve to better succeed in their
current job are English/French (language skills), discipline specific training, computer literacy

106
and people management. The main skills they would like to improve to fulfil their career goals
are discipline specific training, English/French (language skills), creativity and leadership
skills.
Training- Education
For 61% of public sector employees their current job offers in-service training,
including administrative pre-service training for 31% of them and technical training for 26%
of them. More than half of public sector employees consulted were offered training in the past
12 months; that training was offered by a government organization for the majority of them
and it was either free of charge or it was paid by the employee. The type of training that would
be helpful for public sector employees at this point in their careers is professional training,
followed by entrepreneurship to start their own business and foreign language training. The
education received by 67% of the public sector employees did not adequately prepare them for
their current job.
Future employment
The main obstacle undermining the chances of future employment is skills and job
market inadequacy according to 65% of public sector employees followed by the overall
economic situation of the country. The main obstacles in finding employment include the lack
of available jobs, lack of work experience, followed by unsuitable vocational education,
discriminatory prejudices and poor working conditions in available jobs. 70% of public sector
employees received little to no assistance while looking for a job, while 82% of them received
no help from employment services, on job search, education or training opportunities, job
placement etc.
Figure 38. Which skills are used most in your current job?
0 2 4 6 8 10 12 14 16
English/ french
Computer literacy
Time management
Discipline specific trainig
Discipline specific theory
Creativity
Entrepreneurship
Work Ethic
Teamwork
Oral communication
Problem solving
Leadership
Motivation
People management
Written communication
Number of responses

107
Figure 39. Skills that need to be improved to better succeed in current job.
Figure 40. Skills to promote/grow to fulfil career goals.
0 2 4 6 8 10 12
English/ french
Computer literacy
Time management
Discipline specific trainig
Discipline specific theory
Creativity
Entrepreneurship
Work Ethic
Teamwork
Oral communication
Problem solving
Leadership
Motivation
People management
Written communication
Number of responses
0 2 4 6 8 10 12
English/ french
Computer literacy
Time management
Discipline specific trainig
Discipline specific theory
Creativity
Entrepreneurship
Work Ethic
Teamwork
Oral communication
Problem solving
Leadership
Motivation
People management
Written communication
Number of responses

108
Appendix 8
Synthesis of Consultations with Youth Groups
Key findings
The main goal of the consultations with youth groups was to identify the most important
skills for securing a job and the skills youth think are relevant to them for securing a job in the
future. Language skills (English/French) are the most important for securing a job according
to respondents, and completion of university is the most useful training. Young people
expressed concern about the economic situation of the country, which undermines their
opportunities for future employment. Similarly, according to respondents there are not enough
jobs in the market, which was identified as the main reason they are unemployed or not looking
for jobs.
Methodology
The information was collected during consultations with various youth groups in
Cameroon to elicit their own concerns. The number of youth consulted was 96 people between
the ages of 21 and 50 and it included both group leaders and their constituents. Members of
youth groups were asked to give their views on 35 questions including background, current
employment and experience, skills, training and education, future employment and
demographic questions.
Findings
Profile of youth consulted
33% of young people are available for work and actively looking for employment, 20%
are students, 16% are self-employed and 12% are engaged in training. More than half of them
have finished post-graduate school and 40% of them have either finished university or
vocational school. Nearly all respondents would pay for post-secondary education if it could
help them secure another position in the future and 87% of them participated in internships
during or after school.
Current employment and experience
2/3 of the young people worked while studying, and more than half from those that
worked were getting paid for their work. The main motivation for working while studying was
to gain experience, followed by making connections to help them with future employment. The
majority of respondents are employed in the private/informal sector followed by those that are
self-employed. 30% are doing professional work in their current job, followed by 22% that are
doing managerial and 19% who are doing technical work.
The main reason members of the youth groups decided to follow this area of work was
primarily because they were qualified but also many of them could not get their dream job.
Qualifying their current job most of respondents claimed it was a survival job, followed by
their job being decent. For 61% of young people, their current job guarantees growth
opportunities and for 14% of them it guarantees job security. The main motivation, according
to respondents, for being in their current job is on the job experience, followed by training, job
security and promotion.

109
Skills, training and education
The main skills identified as the most important for securing a job are English/French
(language skills), followed by computer literacy, discipline scientific training, motivation,
creativity and teamwork. For 2/3 of respondents their education prepared them adequately for
their current job. The type of training most useful for young people at this point is completion
of university followed by professional training, foreign language training and entrepreneurship
training to start their own business.
Future employment
The main obstacle that could undermine future employment opportunities is according
to respondents the overall economic situation of the country, followed by skills and job market
inadequacy. The majority of people received little to no help when searching for a job; 62% of
the youth consulted received no assistance or advice from employment services when searching
for employment. The main obstacle in finding a job is the lack of jobs available in the market
followed by the lack of work experience, unsuitable general education, poor working
conditions in available jobs, and discriminatory prejudices. The main reasons why respondents
are not working or are currently not looking for employment are they are not meeting the
employers’ requirements for the positions and also they are not able to find suitable work.
Self-employment
More than half of the respondents were self-employed. Being more independent when
working was identified as the main reason they chose to be self-employed. Likewise, a number
of people chose to be self-employed because they could not find a wage or salary job followed
by more flexible work hours. 43% of those that are self-employed received no help and used
their personal savings to start their business. The two most important problems self-employed
youth faces are problems with internet service and insufficient training to prepare them for their
jobs.
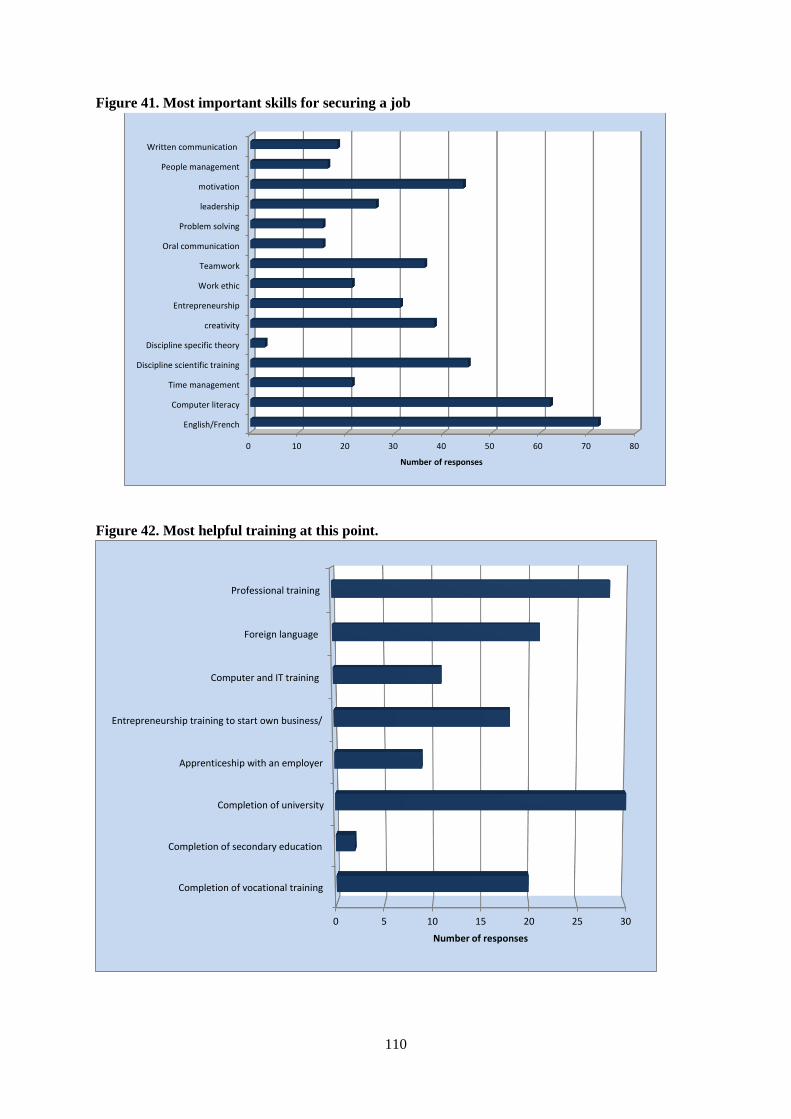
110
Figure 41. Most important skills for securing a job
Figure 42. Most helpful training at this point.
0 10 20 30 40 50 60 70 80
English/French
Computer literacy
Time management
Discipline scientific training
Discipline specific theory
creativity
Entrepreneurship
Work ethic
Teamwork
Oral communication
Problem solving
leadership
motivation
People management
Written communication
Number of responses
0 5 10 15 20 25 30
Completion of vocational training
Completion of secondary education
Completion of university
Apprenticeship with an employer
Entrepreneurship training to start own business/
Computer and IT training
Foreign language
Professional training
Number of responses

111
Appendix 9
Coopération Banque mondiale/Cameroun
Enquête auprès de la Jeunesse
World Bank/Cameroon Cooperation
Youth Skills Survey
Disclaimer:
- This survey has a restricted distribution and may be used by recipients only to provide information.
- This survey is not intended for employment. Your response to this survey is voluntary.
- This survey is not authorized for further distribution. - Please contribute to its effectiveness by responding only once.
Avertissement:
- Ce questionnaire est soumis à politique de restriction dans sa distribution et ne peut être utilisé par les répondants que dans
le but de fournir des informations.
- Ce questionnaire n’offre aucune garantie d’emploi. Les réponses sont soumises de façon exclusivement volontaire.
- Ce questionnaire n’est pas autorisé à une distribution ultérieure. - Veuillez s'il vous plaît contribuer à l’effectivité de cette enquête en ne répondant qu'une seule fois
Directions/Consigne: Please read each question carefully and respond accordingly/ : Merci de lire attentivement chacune
des questions et entourer la lettre correspondant à votre choix
I. Background information/ Information de Base
1. Current status / Situation actuelle
a. Employed/Employé
b. Work for wage/salary w/employer (full or part-time) / Salarié(e) à temps plein ou partiel
c. Self-employed/own-account worker/travailleur indépendant
d. Available and actively looking for work/Disponible et activement à la recherche d’un emploi
e. Engaged in training/ En formation
f. Engaged in home duties / Engagé(e) dans un travail à domicile
g. Did not work or seek work for other reasons / N'a pas travaillé ou cherché du travail pour d'autres raisons
h. Student/ Etudiant
i. Just graduated/ Jeune diplomé(e)
2. Most recent educational activity/ Activité scolaire la plus récente
a. I have never studied/ Je n’ai jamais été à l’école
b. I left before graduating from secondary/ J’ai arrêté les études sans être diplomé(e) du secondaire
c. I have completed primary and secondary/J’ai achevé les cycles primaire et secondaire
d. I have completed primary, secondary, and vocational/J’ai achevé les cycles : primaire secondaire et
professionnel
e. I have completed primary, secondary, and university /J’ai achevé les cycles : primaire, secondaire et
universitaire
f. I am currently studying /Je suis encore scolarisé(e)
a. Primary level/ Niveau de l’enseignement primaire
b. Vocational school/En formation professionnelle
c. Secondary level / Niveau de l’Enseignement secondaire
d. Higher education level /= Niveau Licence de l’Enseignement supérieur
e. Post-graduate, post-doctoral level Post-graduate, post-doctoral level/ Niveau Maîtrise, Doctorat ou
post-doctorat
3. What is the highest level of education/training you have attained? /Quel est votre niveau de formation le plus
élevé?
a. Elementary education /Cycle Primaire et Élémentaire
b. Secondary education/Education secondaire
c. Vocational education /Formation professionnelle

112
Coopération Banque mondiale/Cameroun
Enquête auprès de la Jeunesse
World Bank/Cameroon Cooperation
Youth Skills Survey
d. University/Premier cycle universitaire
e. Post-graduate studies/Second cycle universitaire (Maîtrise, Doctorat, Post-Doctorat)
f. Other/Autre :--------------------------------------------------------------------------------------------------------------------
4. Would you pay for post-secondary education if it would help you to secure another position? /Investiriez-vous de
l’argent dans des études universitaires si cela vous aidait à trouver un nouvel emploi ?
a. Yes / Oui
b. No / Non
5. Field of study/ Filière d’étude
a. Education and humanities/Éducation et Sciences humaines
b. Social sciences/Sciences sociales
c. Medicine/Médecine
d. Scientific, technical, and engineering / Science technique, et ingénierie
e. Tourism/Tourisme
f. Other/Autre : -------------------------------------------------------------------------------------------------------------------
6. Did you participate in any of the following, post or during school? /Avez-vous pris part aux activités suivantes
pendant ou après vos études?
a. Internships/Stages
b. Mentoring/Parainnage
c. None of the above/Aucun des sus-mentionnés
7. What is the highest level of education/training you hope to attain? Quel le niveau d’étude souhaitez-vous
atteindre ?
a. Elementary education / Formation primaire----------------------------------------------------------
b. Vocational education/ Formation professionnelle : Level/ Niveau----------------------------------
c. Secondary educaiton/ Niveau de l’enseignement secondaire -------------------------------------------
d. University/ Premier Cycle Universitaire : level/Niveau:------------------------------------------------------------------
e. Post- graduate studies/ studies : Maîtrise/Doctorat/Post-doctorat------------------------------------------------------- f. Other/ Autre----------------------------------------------------------------------------------------------------
II. Employment/Experience professionnelle
8. Did you work while you studied? /Avez-vous travaillé durant vos études?
a. Yes/Oui
b. No/Non
9. If so, was the work paid?/Si oui, cet emploi était-il remunéré?
a. Yes/Oui
b. No/Non
10. What was your primary motivation in working while studying? /Qu’elle était votre motivation première à
combiner travail et études?
a. Earn money / Gagner de l’argent?
b. Gain experience / Accumuler de l’expérience professionnelle?
c. Make connections that could help with future employment / Se constituer un réseau de connaissances
nécessaires à un emploi futur ?
d. Other / Autre : ------------------------------------------------------------------------------------------------------------------
11. In what sector are you currently employed?Dans quel secteur êtes-vous actuellement employé(e)?
a. Public sector/ Fonction publique
b. Private/ informal sector/ Secteur privé / informel
c. Self-employed/ Indépendant
d. Other/ Autre:-----------------------------------------------------------------------------------------

113
Coopération Banque mondiale/Cameroun
Enquête auprès de la Jeunesse
World Bank/Cameroon Cooperation
Youth Skills Survey
12. Which of the following describes the type of work you do in your current job? /Comment décririez-vous votre
travail actuel?
a. Manual work/Manutention
b. Clerical work / Assistance
c. Technical work / Intervention technique
d. Administrative work / Travail administratif
e. Managerial work / Coordination
f. Professionnal work/ Travail lié à une formation professionnelle
g. Other / Autre:------------------------------------------------------------------------------------------------------------
13. Why have you decided to choose this area work? /Qu’est-ce qui vous a poussé à choisir cette profession/ce
secteur d’activité ?
a. I was qualified because of my education / Mon parcours scolaire
b. I couldn’t get my dream job / Je n’arrivais pas à décrocher l’emploi souhaité
c. Lack of education / Manque d’éducation
d. Other / Autre: ------------------------------------------------------------------------------------------------------------
14. How would you qualify your current employment? / Comment qualifierez-vous votre emploi actuel
a. Decent / Acceptable
b. Dream job / Emploi souhaité
c. Survival job / emploi de survie
d. Other / autre: ------------------------------------------------------------------------------------------------------------
15. Which of the following does your current job guarantee? Que vous garantit votre emploi actuel?
a. Job security / Sécurité d’emploi
b. Growth opportunities / Possibilités d’évolution
c. Other / Autre : ------------------------------------------------------------------------------------------------------------
16. Which of the following motivates you most for your job (please rate your preference)/ Qu’est-ce qui vous motive
le plus dans votre position actuelle? Veuillez marquer votre niveau de motivation selon une échelle de 1 à 5 1 = Peu ou pas motivé du tout ; 5= Très motivé
a. Salary ____ Le salaire
b. Promotion ____ Possibilité de promotion
c. Job security ____ Sécurité de l’emploi
d. Training _____ Opportunité de formation
e. On the job experience ____ Accumulation de l’expérience professionnelle
17. Which of the following skills are most important for securing a job (please select up to 5)? Lesquelles de ces
compétences sont les plus importantes pour garantir un emploi (merci de choisir au plus 5)
a. English/French/Français- Anglais
b. Computer literacy / Connaissances en informatique
c. Time management / Gestion du temps
d. Discipline specific training / Formation spécifique
e. Discipline specific theory / Théorie spécifique
f. Creativity / Créativité
g. Entrepreneurship / Entrepenariat
h. Work ethic / Éthique de travail
i. Teamwork / Travail en équipe
j. Oral communication / Communication orale
k. Problem solving / Résolution de problème
l. Leadership / Leadership
m. Motivation / Motivation
n. People management / Gestion du personnel
o. Written communication / Communication écrite
18. Do you feel your education adequately prepared you for a job? Avez-vous le sentiment que votre formation vous
a préparé de façon adéquate à votre emploi?
a. Yes/Oui
b. No/Non

114
Coopération Banque mondiale/Cameroun
Enquête auprès de la Jeunesse
World Bank/Cameroon Cooperation
Youth Skills Survey
19. What do you think could undermine your chances of future employment opportunities?/Qu’est ce qui selon vous
pourrait réduire vos chances d’employabilité future ?
a. Long-term studies / De longues études
b. Skills and job market inadequacy / Incompatibilité entre les compétences et le marché du travail
c. Overall economic situation of the country / Situation économique générale
d. Other / Autres: -----------------------------------------------------------------------------------------------------------------
20. How much help/assistance have you received when looking for a job?/Quel degré d’assistance avez-vous reçu
pendant votre recherche d’emploi ?
a. Little to no help / Peu ou aucune assistance du tout
b. Some help / Une certaine assistance
c. A lot of help / Une grande assistance
21. Which of these professions are exciting and fulfilling for you? /Lesquelles des professions ci-dessous jugez-vous
passisonnante et enrichissante
a. Engineer / Ingénieur
b. Doctor/surgeon / Médecin/Chirurgien
c. Accountant / Comptable
d. Financial analyst / Analyste financier
e. School teacher / Enseignant
f. IT technician / Informaticien
g. Web developer/ Developpeur site Web
h. Lodging manager / Agent immobilier
i. Police officer / Officier de police
j. Graphic designer / Plasticien
k. Teacher assistance / Professeur/Maître assistant
l. Customer service / Service client
m. Medical assistant / Assistant(e) medical(e)
n. Desk clerk/reception / Réceptionniste
o. Secretary / Secrétaire
p. Fire-fighter / Sapeur pompier
q. Recruiting specialist / Agent de recrutement
r. Health care technician / Technicien de la santé
s. Sales representative / Représentant Commercial
t. Social worker / Travailleur social
u. Marketing agent / Commercial
v. Child care worker /Assistante Maternelle/Puéricultrice
w. Real estate agent/ Agent immobilier
x. Auto mechanic / Mécanicien
y. Electrician / Électricien
22. How much do you expect to earn per month? /Combien vous attendiez-vous à gagner par mois ?
a. Below/ Moins de 75,000 CFA
b. Between / Entre 75,000 CFA - 175,000 CFA
c. Between / Entre 175,000 CFA - 250,000 CFA
d. Above / 250,000 CFA et plus
23. What kind of training do you think would be most helpful for you at this point? quelle formation pensez-vous
être le plus utile pour vous à votre niveau actuel?
a. Completion of vocational training / Achèvement de la formation professionnelle
b. Completion of secondary education / Achèvement des études secondaires
c. Completion of university / Achèvement des études Universitaires
d. Apprenticeship with an employer / Apprentissage chez un employeur
e. Entrepreneurship training to start own business/formation en entrepreneuriat pour se lancer dans les affaires
f. Computer and IT training / Informatique
g. Foreign language / Langue étrangère
h. Professional training / Formation professionnelle

115
Coopération Banque mondiale/Cameroun
Enquête auprès de la Jeunesse
World Bank/Cameroon Cooperation
Youth Skills Survey
24. Have you ever received any advice/help/assistance from employment services?Avez-vous reçu des conseils, de
l’aide ou de l’assistance des services d’aide à l’emploi?
a. None / Aucun
b. Advice on how to search for a job / Conseils relatifs à la recherche d’emploi
c. Information on vacancies / Information sur des postes vacants
d. Guidance on education and training opportunities / Orientations sur des opportunités d’étude ou de formation
e. Placecement in education or training programs / Placement dans une école ou un dans un programme de
formation
f. Other/ Autre :-----------------------------------------------------------------------------------------------------------
25. What would you say has been an obstacle in finding a job? /Qu’est ce qui selon vous a constitué un obstacle à
trouver du travail ?
a. No education / Aucune éducation
b. Unsuitable general education / Éducation générale inadéquate
c. Unsuitable vocational education / Formation technique inadéquate
d. No suitable training opportunities / Aucune opportunité de formation adéquate
e. Requirements for job higher than education/training received / Nécessité d’une éducation de plus haut niveau
f. No work experience / Aucune experience professionnelle
g. Not enough jobs available / Pas assez d’opportunités d’emploi
h. Considered too young / Considéré très jeune
i. Being male/female / Genre (Homme/Femme)
j. Discriminatory prejudices / Discrimination
k. Low wages in available jobs / Salaire bas pour les positions disponibles
l. Poor working conditions in available jobs / Mauvaises conditions de travail
m. Other / Autres: -----------------------------------------------------------------------------------------------------------
26. If you are not currently employed, what has been your main reason for not working or looking for work? Si vous
n’êtes pas actuellement employé(e), quelles sont les principales raisons de votre situation de chercheur d’emploi
ou de chômeur?
a. Own illness, injury, pregnancy/ maladie, accident, grossesse
b. Personal family responsibilities/ Responsabilités familiales
c. Education leave or training/ Arrêt scolaire ou de formation
d. Arrangements for self-employment to start at later date/ préparation pour un travail indépendent à une date
ultérieure
e. Slow hiring period/ Période de basse activité pour le recrutement
f. Belief in no suitable work available (in area of relevance to one’s skills, capacities)/ Aucun emploi adapté
dans le domaine de compétences
g. Lack employers requirements (qualifications, training, experience, age, etc.)/ Ne réponds pas aux critères des
Employeurs (qualifications, formation, expérience, âge, etc…)
h. Could not find suitable work /N’a pas trouvé un travail adapté
i. Do not know how or where to seek work/ Ne sais pas comment et où chercher du travail
j. Not yet started to seek work/N’a pas encore commencé des recherches d’ emploi
k. No reason given/ Pas de raison
III. Self-Employed/Entrepreneurs
27. Why did you choose to be self-employed or an own-account worker rather than work for someone else (as a wage
and salaried worker)? Pourquoi avez-vous choisi d’être à votre propre compte au lieu de travailler pour une
entreprise ou quelqu’un d’autre comme salarié ?
a. Could not find a wage or salary job/ Je n’ai pas trouvé d’emploi salarié
b. Greater independence as self-employed/own-account worker/ Grande indépendance en tant que travailleur
indépendant
c. More flexible hours of work/ heures de travail plus souples
d. Higher income level/revenus plus élevés
e. Other/autres: --------------------------------------------------------------------------------------------------------------------
28. Do you have anyone helping you in your business/economic activity?/ Recevez--vous de l’assistance dans votre
activité ?
a. Paid employees/ Un salarié

116
Coopération Banque mondiale/Cameroun
Enquête auprès de la Jeunesse
World Bank/Cameroon Cooperation
Youth Skills Survey
b. Family members/ Un membre de votre famille
c. No help, working alon/ aucune aide, travaille seul(e)
29. Where did you get the money to start your current business? Comment avez-vous eu l’argent qui vous a permis
de demarrer votre affaire personnel ?Comment avez-vous financé votre activité ?
a. No money needed/ pas eu besoin d’argent
b. Personal savings/ épargnes personnelles
c. Savings from other family members/ Fonds d’appuis reçus de la famille
d. Loan from family or friends/ Prêts effectués auprès de la famille et des amis
e. Loan from bank or commercial institution/ Prêts effectués auprès d’une Banque
f. Loan from private money lender/ Fonds reçus d’un organisme de crédit privé
g. Loan/assistance from government institution/ Prêt reçus d’un organisme gouvernemental
h. Loan/assistance from NGO, donor project, etc/ Prêt reçus d’un organisme non gouvernemental/ Projet, etc..
i. Funds from savings and credit/group/Fonds d’un groupe d’épargnes ou de crédits
j. Credit from customer/middleman/agent/supplier/Fonds d’un groupe d’épargne ou de crédit
k. Other sources : Autre sources: -----------------------------------------------------------------------------------------------
30. What are the two most important problems you face in running your business?Quels sont les 2 problèmes les
plus importants auxquels vous faites face dans la gestion de votre activité ?
a. Business information /Information sur l’activité
b. Marketing services/Services de marketing
c. Financial services/Services financiers
d. Accounting/Comptabilité
e. Legal services/ Services juridiques
f. Counseling/advice/Conseil
g. Business training/ Formation en gestion d’entreprise
h. Language training/ Formation en linguistique Langue
i. Skills training/ Formation professionelle
j. Internet service/ Accès/Service d’accès Internet
k. Access to technology/ Accès au matériel technologique
l. Product development/Développment de produit
m. Other/Autre: --------------------------------------------------------------------------------------------------------------------
IV. Demographic information/ Informations démographiques
31. Age / âge
a. Moins de 20 ans
b. 21-30 ans
c. 31-40ans
d. 41-50 ans e. 51 ans et plus
32. Sex / Sexe
a. Male b. Female
33. Quelle est votre province d’origine?
a. Adamaoua
b. Centre c. Est

117
Coopération Banque mondiale/Cameroun
Enquête auprès de la Jeunesse
World Bank/Cameroon Cooperation
Youth Skills Survey
d. Extreme-Nord
e. Littoral
f. Nord
g. Nord-Ouest
h. Ouest
i. Sud j. Sud-Ouest
34. What is your language of expression? / Quelle est votre langue d’expression?
a. English / Anglais
b. French / Français
35. What is your marital status? Quel votre statut d’état civil
a. Single - Célibataire
b. Married- Marié (e)
c. Separated- Séparé (e)
d. Widowed- Veuf (ve)
e. Co-habitation – En cohabitation

118
Appendix 10
Proposed Action Plan
1. Setting Strategic Direction
Policy Goal
Workforce Development Domain/Issues/Findings Strategic Directions for Reforms and Policy Actions Responsibility Timing
Fu
nct
ion
al D
imen
tio
n 1
. Str
ateg
ic F
ram
ewo
rk
Principle of Optimization: Provide sustained advocacy for WfD at the top leadership level
Topic 1. Advocacy for WfD to support economic development
Some visible champions advocate for WfD to support economic development on an ad-hoc and limited basis. They have taken a few specific measures to adjust the regulatory framework for WfD. However, the implementation of the adjustments is not systematically monitored. Based on multiple data sources both the government and other WfD stakeholders appear to conduct routine assessments of the country's economic prospects and skills implications only for key growth sectors. But they do not assess the implications of foundational skills (literacy and numeracy), cognitive and non-cognitive skills that are necessary albeit not sufficient conditions
Government leaders exercise sustained advocacy for WfD with support from non-government leaders, and collaborate on the WfD policy agenda for selected industries or economic sectors
PRIMATURE with MINEPAT Secretariat Short-term
Advocate for workforce development as a priority for economic growth: Bring together strategic sectors that contribute to or have the potential to contribute to growth, outline systematic demand-led criteria, and build in with well-defined coordination, roles and responsibilies, build capacity of those in charge of advocacy
Cameroon Inter-Ministerial Steering Group for Workforce Development (CIMSGWD) comprising membership of MINFI, MINEPAT, MINEFOP, MINESUP, GICAM, MINEJEUN, INS, Sector Skills Committees/ Councils, Association of Informal Sector Actors, representation from Youth Groups, Development Partners focusing on education & training and skills development, CIEP, Technical Secretariar, Technical Monitoring Committe of the implementation of DSCE (CTSE), MINESEC and MINADER
Short-term then ongoing
Absence of active advocates with a clear vision on how WfD could be a tool to achieve the country's social and economic goals
There is no evidence of the government taking actions to improve public perception of TVET
Adopt strategic communications about the importance of workforce development for competitiveness and economic growth

119
Topic 2. Strategic focus and decisions by WfD champions
Cameroon's DSCE provides a basis and some direction for workforce development
Develop a strategic agenda and mechanism for inclusive workforce development, evaluate economic prospects and its implications for skills, and commission studies on the country's economic prospects under the DSCE with clear assessment of the implications for skills
Cameroon Inter-Ministerial Steering Group for Workforce Development (CIMSGWD) Working Groups, INS, Development Partners, CIEP, CTSE, MINEFOP and MINTSS
Short-term then periodic and regular
WfD champions have taken specific action on strategic WfD priorities through a few interventions, but no arrangements exist to monitor and review implementation progress.
Conduct systematic monitoring and review of implementation progress both with public and private sectors by making a clear disctinction in the 6187 budget line (stock internship training)
2. Fostering a demand-led approach
Policy Goal
Workforce Development Domain/Issues/Findings Strategic Directions for Reforms and Policy Actions Responsibility Timing
Fu
nct
ion
al D
imen
tio
n 1
. Str
ateg
ic F
ram
ewo
rk
Principle of specialization versus generalization: Establish clarity on the demand for skills and areas of critical constraint: promote a demand-driven approach
Topic 3. Overall assessment of economic prospects and skills implications
Insufficient strategic direction for WfD that is demand-led and well coordinated. There are some indications that the Government provides incentives for skills development and upgrading for employees in the formal ad informal sector, but not enough evidence to confirm the nature of these programs and whether they are implemented
Towards addressing demand-led workforce development, conduct regular labor market surveys and studies to review/assess the demand for skills, activated and develop a labor market information system (LMIS)
Cameroon Inter-Ministerial Steering Group for Workforce Development (CIMSGWD), INS, Development Partners, MINEFOP
Medium-term then periodic and regular
Although incentive programs to encourage skills upgrading by employers seem to exist, it is not clear what they consist of and whether they are reviewed for impact
Conduct periodic reviews and assess the impact of skills upgrading programs by employers
Engage employers in setting WfD priorities and in enhancing skills-upgrading for workers

120
Employers seem to have a formal institutionalized space to participate in policy dialogue at the CbF. However, it is not clear whether this mechanism is currently active and working, and if WfD-specific discussions take place in this scenario
Engage employers in setting WfD priorities and in enhancing skills-upgrading for workers; strengthen firms' demand for skills to improve productivity through active involvement of employers using the CbF platform for policy dialogue
Cameroon Inter-Ministerial Steering Group for Workforce Development (CIMSGWD)
Ongoing
Principle of Adequacy: Address critical challenges on the future supply of skills
Topic 4. Critical skills constraints in priority economic sectors
Insufficient systematic assessment (monitoring and evaluation) of foundational skills (literacy and numeracy), cognitive and non-cognitive skills that are necessary conditions for workforce development, diffusion of findings, and targeted programs for the disadvantaged and vulnerable (girls, women, children with disabilities)
Improve access to, quality, and monitoring for each of the areas below:
Foundational skills--Early childhood development (ECD); ECCD MINEDUB, Development Partners Medium through long-term
Formative skills: Literacy and numeracy
MINEDUB, MINESEC, Development Partners
Medium through long-term Introduce career guidance in curricula (areas where students can use the knowledge they acquire)
Demand-driven TIVET programs in various trades linked to the key growth sectors
MINEFOP, GICAM, Development Partners Medium through long-term
Revise curricula to make programs more responsive to labor market needs; incorporate soft skills, problem-solving skills and critical thinking skills
Strengthen public sector training institutions
Specify targets for public training institutions
Foster private sector training institutions
Involve the private sector in institutional management
Develop labor market responsive curricula incorporating soft and critical skills (communications, writing, problem solving, critical thinking)
Introduce career guidance in the curricula
Recruit teachers with industry experience

121
Provide support for teachers to acquire further occupational and career development
Provide targeted support for training programs targeted to disadvantaged populations on a systematic basis
CIMSGWD, Development Partners Ongoing
Higher Education
MINESUP, Development Partners Medium through long-term
Absence of national level data on skills supply Coordinate the regular collection of quality data on key indicators (enrolments, programs, staffing, financial data, data from graduate tracer studies) to assess skills supply
INS with MINEDUB, MINESEC, MINEFOP, MINESUP, MINEJEUN, Development Partners
Ongoing
Principle of Facilitation: Engage employers in setting WfD priorities and in enhancing skills-upgrading of workers
Topic 5. Role of employers and industry
Many small enterprises are not registered and operate illegally
Require all enterprises (small/medium/large) to be registered
Cameroon Inter-Ministerial Steering Group for Workforce Development (CIMSGWD), Sector Skills Councils, Development Partners, INS
Medium-term followed by periodic evaluations
Provide tax incentives for enterprises to enhance option for firms to be registered
There is no sufficient incubation for innovations Patent innovations, Establish incentives by promoting innovation
Topic 6. Skills-upgrading incentives for employers
Enterprises do not invest in training employees fearing poaching of human resources and knowledge
Provide measure incentives for enterprises to enhance options for employers skills' upgrading
MINFI, MINEPAT, GICAM, MINJUSTICE, MINPMEESA, MINTSS, CBF, employer organizations (GICAM)
Medium-term followed by periodic revisions to calibrate incentives and regulations to evolving economic circumstances
Enterprises do not invest in training employees fearing poaching of industry intellectual property
Develop regulations for intellectual property to help protect small enterpreneurs

122
Topic 7. Monitoring of the incentive programs
Periodic assessment of the incentive programs to determine efficacy and efficiency CIMSGWD, CTSE
3. Strengthening Critical Coordination
Policy Goal
Workforce Development Domain/Issues/Findings Strategic Directions for Reforms and Policy Actions Responsibility Timing
Fu
nct
ion
al D
imen
sio
n 1
. Str
ateg
ic F
ram
ewo
rk
Principle of concentration and assimilation: Formalize key WfD roles for coordinated action on strategic priorities
Topic 8. Roles of Government ministries and agencies
Absence of unified vision regarding workforce development
Ensure coherence of key strategic workforce development priorities CIMSGWD, INS, Development Partners Ongoing
Topic 9. Roles of Non-government WfD stakeholders
Evidence about the existence of coordination mechanisms with government entities is rather weak
Prepare terms of reference setting out key WfD roles for coordinated action on strategic priorities
CIMSGWD, INS, Development Partners, Civil Society Organization (ROJAC, DMJ,…)
Medium-term
The mandates of government ministries and agencies with responsibility for WfD overlap in multiple areas; no mechanism exists to ensure coordination of WfD strategies and programs. The legally-defined roles and responsibilities of non-government stakeholders are not clear
Institutionalize the structure of workforce development roles and responsibilities by prioritizing the establishment of the Cameroon Inter-Ministerial Steering Group for Workforce Development (CIMSGWD) comprising membership of MINFI, MINEPAT, MINEFOP, MINESUP, GICAM, MINEJEC, MINPMEESA, Sector Skills Committees/ Councils, Association of Informal Sector Actors, representatives of Youth Groups, and Development Partners
MINEPAT AND KEY GROWTH SECTORS MINISTRIES
Medium-term

123
Topic 10. Coordination for the iplementation of strategic WfD measures
Absence of communication on workforce development
Facilitate communication and interaction among all workforce development stakeholders through the regular publication of a newsletter on workforce development
Cameroon Inter-Ministerial Steering Group for Workforce Development (CIMSGWD)
Medium-term then periodic and regular
Absence of concerted planning and stratgizing for workforce development
Ensure semi-annual planning, review of action plan, stocktaking of actions, review of impact evaluation results, and development of priorities at Workforce Development Fora
Plate forme non gouvernementale
5. Ensuring Efficiency and Equity in Funding
Policy Goal
Workforce Development Domain/Issues/Findings Strategic Directions for Reforms and Policy Actions Responsibility Timing
Fu
nct
ion
al D
imen
sio
n 2
. Sys
tem
Ove
rsig
ht
Principle of facilitation: Provide stable funding for effective programs in initial, continuing and targeted vocational education and training
Topic 11. Overview of funding for WfD
Articulate funding strategy
The Government relies on routine historical budgeting processes to determine funding for technical vocational education and training (TVET) institutions and programs
Institute performance-based funding for public sector training institutions MINFI, MINEPAT, CIMSGWD, Development Partners, CIEP, CCIMA and others
Medium-term then periodic and regular
Topic 12. Recurrent funding for initial vocational education and training (TVET)
The Government determines recurrent funding for TVET through a formal process involving only government officials and produces an annual report on TVET for internal purposes
Institute recurrent funding for TVET through a formal process involving both government officials and private sector employers; produce annual report on the basis to inform the public
MINFI, MINEPAT, CIMSGWD, Development Partners, MINEFOP and MINPMEESA
Medium-term then regular with periodic assessment

124
Topic 13. Recurrent funding for continuing vocational education and training (TVET)
Institute recurrent funding for continuing TVET through a formal process involving both government officials and private sector employers; produce annual report on the basis to inform the public
Topic 14. Recurrent funding for Training-related Active Labor Market Programs (ALMPs)
Programs fostering on-the-job training in Small and Medium Enterprises (SMEs) benefit from government
support. Government funding for targeted ALMPs benefits mainly youth and rural groups. Support is
determined through an ad-hoc process involving only government officials in the correponding implementing
agencies
Formalize and systematize funding for targeted ALMPs benefiting youth and rural groups and make the process transparent
MINADER, MINJEC
Mise en place du programme de gestion prévisionnelle de l'emploi et des compétences au niveau territoriale (GPECT-CAM)
MINEFOP GICAM CCIMA Court terme
Monitor and enhance equity in funding for training
Topic 15. Equity in funding for training programs
Allocate funds to achieve efficient results
It is unclear if multiple criteria are used to determine funding for the institutions and programs, and whether the criteria are reviewed periodically and consistently
Clarify criteria applied to determine funding for public sector training institutions MINFI, MINEPAT, CIMSGWD, Development Partners
Medium-term; thereon ongoing
Clarify criteria for and periodicity of review of funding for public sector training institutions
There are no recent formal impact evaluations of funding for beneficiaries of training programs either at the IVET, CVET levels or under the ALMPs
Introduce tracer studies to track beneficiaries of training programs funded by the Government
MINEFOP, GICAM, INS, Development Partners, Ministries in charge of education and training
Medium-term then periodic and regular
Facilitate sustained partnerships between training institutions and employers
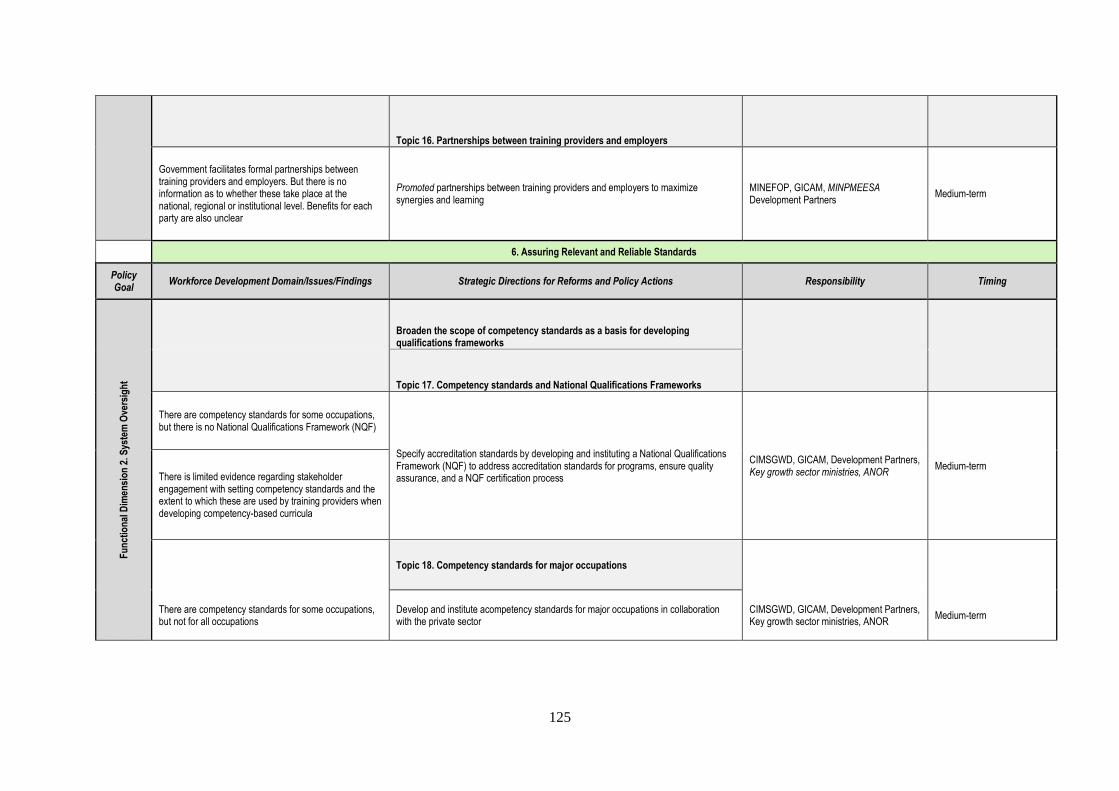
125
Topic 16. Partnerships between training providers and employers
Government facilitates formal partnerships between training providers and employers. But there is no information as to whether these take place at the national, regional or institutional level. Benefits for each party are also unclear
Promoted partnerships between training providers and employers to maximize synergies and learning
MINEFOP, GICAM, MINPMEESA Development Partners
Medium-term
6. Assuring Relevant and Reliable Standards
Policy Goal
Workforce Development Domain/Issues/Findings Strategic Directions for Reforms and Policy Actions Responsibility Timing
Fu
nct
ion
al D
imen
sio
n 2
. Sys
tem
Ove
rsig
ht
Broaden the scope of competency standards as a basis for developing qualifications frameworks
Topic 17. Competency standards and National Qualifications Frameworks
There are competency standards for some occupations, but there is no National Qualifications Framework (NQF)
Specify accreditation standards by developing and instituting a National Qualifications Framework (NQF) to address accreditation standards for programs, ensure quality assurance, and a NQF certification process
CIMSGWD, GICAM, Development Partners, Key growth sector ministries, ANOR
Medium-term There is limited evidence regarding stakeholder engagement with setting competency standards and the extent to which these are used by training providers when developing competency-based curricula
Topic 18. Competency standards for major occupations
There are competency standards for some occupations, but not for all occupations
Develop and institute acompetency standards for major occupations in collaboration with the private sector
CIMSGWD, GICAM, Development Partners, Key growth sector ministries, ANOR
Medium-term

126
There is limited evidence regarding stakeholder engagement with setting competency standards and the extent to which these are used by training providers when developing competency-based curricula
Establish protocols for assuring the credibility of skills testing and certification
Topic 19. Occupational skills testing
Unclear whether competency-based testing is used for skilled and semi-skilled occupations. There is no evidence that there are skills testing for major occupations, and whether it assesses both theoretical knowledge and practical skills, and whether certificates awarded have any impact on employment and earnings
Develop protocols for assessing the credibility of public and private sector skills programs
CIMSGWD, INS, Development Partners Short-term
Develop competency-based testing for skills and semi-skilled occupations
MINEDUB, MINESEC, MINEFOP, MINESUP, MINJEC, Sector skills committees/councils, INS, Development Partners
Medium-term
Topic 20. Skills testing and certification
Qualifications certified by non-education ministers are not recognized for admission into formal programs under the Ministry of Education
Assess qualifications certified by non-education ministers against national accreditation standards for equivalency
MINEDUB, MINESEC, MINEFOP, MINESUP, MINJEC, Development Partners, CCIMA
Medium-term
Outline threshold conditions and entry level guidelines for recognition of non-education ministers certified qualifications and admission into formal programs under the Ministry of Education
Recognition of prior learning is just now receiving some attention, reflected in the development of a regulatory framework with the support of donors
Develop regulatory framework (threshold conditions, guidelines) for recognition of prior learning for continuing education programs
Topic 21. Skills testing for major occupations
Unclear whether competency-based testing is used for skilled and semi-skilled occupations. There is no
Develop protocols for major occupations CIMSGWD, INS, Development Partners Short-term

127
evidence that there are skills testing for major occupations, and whether it assesses both theoretical knowledge and practical skills, and whether certificates awarded have any impact on employment and earnings
Develop competency-based testing for the major occupations
MINEDUB, MINESEC, MINEFOP, MINESUP, MINJEC, Sector skills committees/councils, INS, Development Partners
Medium-term
Develop and enforce accreditation standards for maintaining the quality of training provision
Topic 22. Government oversight of accreditation
Absence of central oversight for the accreditation of training institutions
Terms of reference and action to establish Government working group for oversight of accreditation
CIMSGWD Short-term
Topic 23. Establishment of accreditation standards
There is no National Accreditation Framework (NQF)
Specify accreditation standards by developing and instituting a National Accreditation Framework (NAF) to address accreditation standards for programs, renewal of accreditation by training institutions, and a NAF certification process
CIMSGWD working group on accreditation , CCIMA, Key growth sectors ministries,
MINEFOP
Medium-term There is limited evidence regarding stakeholder engagement with setting accreditation standards and the extent to which these are used by potential training providers
Topic 25. Incentives and support for accreditation
Absence of evidence of incentives and support for training institutions to become accredited
Outline incentives and support for training institutions to seek accreditation Medium-term
Prévoir la régulation et donner des possibilités de reclassement au niveau du MINFOPRA et MINTSS
MINFOPRA , MINTSS Medium term
4. Diversifying pathways for Skills Acquisition
Policy Goal
Workforce Development Domain/Issues/Findings Strategic Directions for Reforms and Policy Actions Responsibility Timing
Fu
nct
ion
al
Dim
ensi
on
2.
Sys
tem
Ove
rsig
ht
Principle of concatenation: Promote educational progression and permeability through multiple pathways, including for TVET students

128
Topic 26. Develop learning pathways and foster articulation across levels and programs
Weak of pathways for learning, gathering credits, and building credentials Build bridges and ladders in the education and training system and facilitate credit
transfers, credit portability
MINEDUB, MINESEC, MINEFOP, MINESUP, MINJEC, MINFOF, MINADER, MINEPIA, MINPROFF
Medium term
Topic 27. Public perception of pathways for TVET
There is no evidence as to whether students in technical and vocational education have options for further formal skills acquisition beyond the secondary level
Launch strategic communications to improve information dissemination regarding learning and career pathways beyond secondary education
CIMSGWD, MINESEC, MINEFOP, MINEJEC
Medium-term
Facilitate lifelong learning through articulation of skills certification and recognition of prior learning
Infrastructure for lifelong learning largely absent. There are limited opportunities for lifelong learning. Limited evidence regarding demand for TVET programs.
Develop the infrastructure for lifelong learning through pathways for formal adult education programs and other forms of learning including setting up public venues for knowledge dissemination (museums, learning centers, public libraries)
Ministry of Culture, Ministry of Commerce, Ministry of Tourism, GICAM, CCIMA
Medium through long-term
Topic 28. Articulation of skills certification
Refer Topic 20 on Skills Testing and Certification
Topic 29. Recognition of prior learning
Recognition of prior learning is just now receiving some attention, reflected in the development of a regulatory framework with the support of donors
Refer Topic 20 and Topic 27
Provide support services for skills acquisition by workers, job-seekers and the disadvantaged
Topic 30. Support for further occupational and career development
Set policies and procedures to renew programs
Limited number of registered private sector training institutions Create a market for learning by leveraging the private sector for both pre-employment
and on-the-job training
Ministry of Commerce, GICAM Medium through long-term

129
Review and updates for existing programs CIMSGWD, INS, Development Partners Periodic and regular
Topic 31. Training-related provision of services for the disadvantaged
Absence of targeted policies for training services for minority groups
Develop policies for training services for disadvantaged and vulnerable groups CMSGWD working group Medium-term
7. Enabling Diversity and Excellence in Training Provision
Policy Goal
Workforce Development Domain/Issues/Findings Strategic Directions for Reforms and Policy Actions Responsibility Timing
Fu
nct
ion
al D
imen
sio
n 3
. Ser
vice
Del
iver
y
Encourage and regulate non-state provision of training
Topic 32. Scope and formality of non-state training provision
There seem to be limited measures for quality assurance, but there is no information on what these are
Promote diversity in training provision by encouraging formal private sector training provision CIMSGWD, Development Partners, CCIMA
Short-term
Develop quality assurance measures for non-formal training Medium-term
Topic 33. Incentives for non-state providers
CIMSGWD working groups, MINEFOP, CCIMA
Medium-term
Refer related topics 3, 5, 6, 25, & 45
Topic 34. Quality assurance of non-state training provision
Refer 17
Topic 35. Review of policies towards non-state training provision
Refer related topic 3, 5, 6, 17, 25, 38, 45.
Combine incentives and autonomy in the management of public training institutions
Topic 36. Targets and incentives for public training institutions
Refer topics 4 and 38

130
Motivate public training institutions to respond to demand for skills
Topic 37. Autonomy and accountability of public training institutions
It is unclear if public training providers have autonomy. Some seem to be able to generate and retain revenues, have a management board and limited channels to address complaints
Provide autonomy to public sector training institutions enabling them to generate and retain revenues, establish a management board comprising public sector employees, Sector Skills Committees/Council members, and GICAM members
CIMSGWD, MINEFOP, CCIMA, Corporations of key growth sectors ministries
Medium-term then ongoing
Create a complaints redressal mechanism
It is unclear if approvals and closures of training programs are well informed and follow a rigorous process
Specify norms and rigorous processes for assessing the validity and external efficiency (labor market outcomes) of training programs
CIMSGWD, Development Partners Medium-term
Topic 38. Introduction and closure of public training programs
Public providers seem to offer training, but there is not enough evidence regarding the conditions under which public institutions are set up and conditions under which they are closed
Incentivize public providers to meet workforce development standards by publicly recognizing and rewarding public providers who do adhere consistently to established standards Cameroon Inter-Ministerial Steering Group
for Workforce Development (CIMSGWD) and Sector Skills Councils
Medium-term
Develop regulations for intellectual property to help protect public sector employees
Patent innovations
8. Fostering Relevance in Training Programs
Policy Goal
Workforce Development Domain/Issues/Findings Strategic Directions for Reforms and Policy Actions Responsibility Timing
Principle of relevance: Integrate industry and expert input into the design and delivery of public training programs
Topic 39. Links between training institutions and industry

131
Fu
nct
ion
al D
imen
sio
n 3
. Ser
vice
Del
iver
y
Link training industry and research institutions
There seems to be some informal links between training and research institutions around the development of training programs and general assessment of the system
Specify and develop systematic formal links between training and research institutions through annual seminars/conferences
CIMSGWD, MINRESI Medium-term then ongoing
There is limited evidence of the extent to which government is successful in establishing formal links and encouraging significant collaboration between training providers and industry
Establish formal links between training providers and industry through annual WfD congresses
MINEFOP, GICAM, Sector skills Committees/Councils, Development Partners
Ongoing
Integrate industry and expert input into the design and delivery of public training programs
Topic 40. Links between training institutions and industry
MINEFOP, GICAM, MINFI MINEPAT CCIMA Sector skills Committees/Councils, Development Partners
Medium-term then on an ongoing basis
Refer topics 4, 5, 6, 16, 32, 33, 34, 35, 36, & 39
Topic 41. Industry role in the design of program curricula
Refer topic 4
Topic 42. Industry role in the specification of facility standards
Refer topics 17, 18, 19, 20, 21, 22, 23 & 25
Topic 43. Links between training and research institutions
Recruit and support administrators and instructors for enhancing the market-relevance of public training programs
Topic 44. Recruitment and in-service training of heads of public training institutions

132
Institutional set-up exists; extant public training institutions have heads of institutions
Review of management competencies, assessment of competency levels, development of in-service training programs, administration of training programs, and certification of programs
Topic 45. Recruitment and in-service training of instructors of public training institutions
Institutional set-up exists; extant public training institutions have instructors of institutions Review of competencies required for instructors, assessment of competency levels,
development of in-service training programs, administration of training programs, and certification of programs
Although there are some links between training providers and industry in some sectors, it is unclear whether firms provide input into the design of curricula. Further, despite government stated intentions, there is not enough evidence that industry has any role in specifying facility standards
Design training with industry inputs MINEFOP, GICAM, Sector skills Committees/Councils, Development Partners, Add keys growth sectors ministries
Medium-term
Establish Sector Skills Councils for the key growth sectors to advise Government on sectoral skills needs, standards (minimum requirements), qualifications frameworks, governance and financing options
CIMSGWD Add keys growth sectors ministries
Short-term
Improve competence of WfD administrators and instructors keys growth sectors ministries
Limited data and information are available to verify competence of WfD administrators and instructors
Provide incentives for periodic participation of WfD administrators and instructors in conferences to improve their understanding of subject-matter, develop networks to exchange knowledge, and foster peer learning
CIMSGWD, Development Partners, Add keys growth sectors ministries
Ongoing
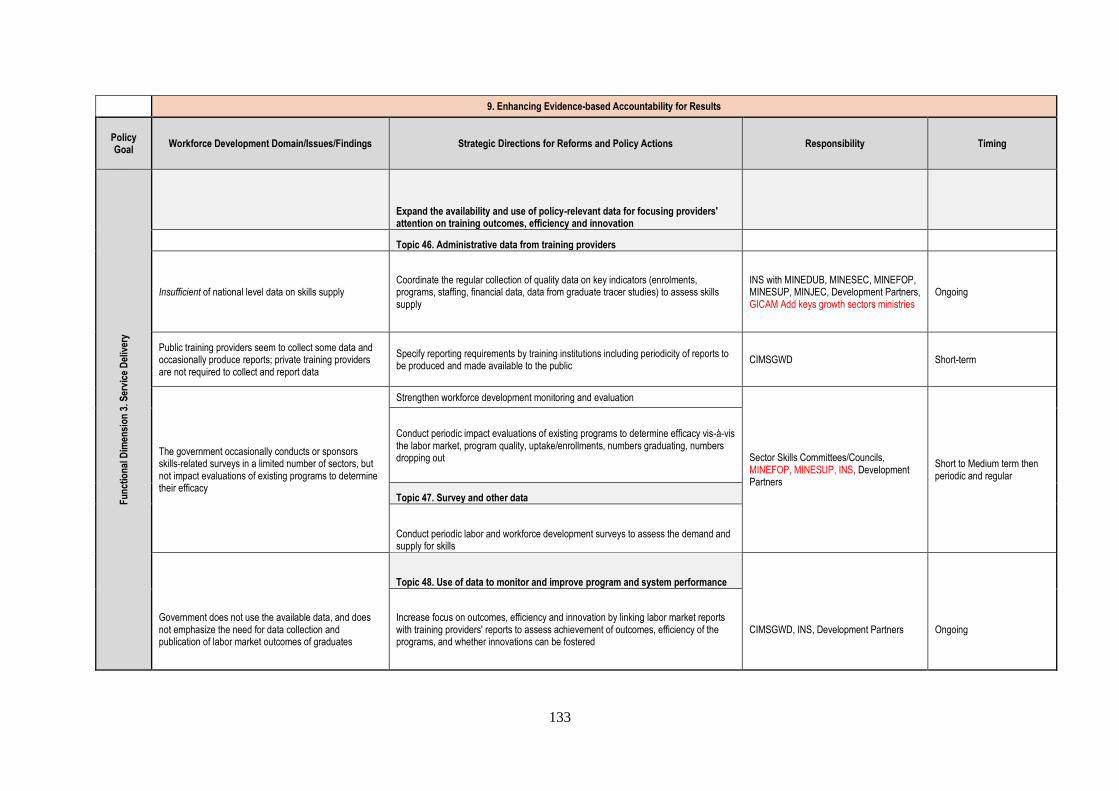
133
9. Enhancing Evidence-based Accountability for Results
Policy Goal
Workforce Development Domain/Issues/Findings Strategic Directions for Reforms and Policy Actions Responsibility Timing
Fu
nct
ion
al D
imen
sio
n 3
. Ser
vice
Del
iver
y
Expand the availability and use of policy-relevant data for focusing providers' attention on training outcomes, efficiency and innovation
Topic 46. Administrative data from training providers
Insufficient of national level data on skills supply Coordinate the regular collection of quality data on key indicators (enrolments, programs, staffing, financial data, data from graduate tracer studies) to assess skills supply
INS with MINEDUB, MINESEC, MINEFOP, MINESUP, MINJEC, Development Partners, GICAM Add keys growth sectors ministries
Ongoing
Public training providers seem to collect some data and occasionally produce reports; private training providers are not required to collect and report data
Specify reporting requirements by training institutions including periodicity of reports to be produced and made available to the public
CIMSGWD Short-term
The government occasionally conducts or sponsors skills-related surveys in a limited number of sectors, but not impact evaluations of existing programs to determine their efficacy
Strengthen workforce development monitoring and evaluation
Sector Skills Committees/Councils, MINEFOP, MINESUP, INS, Development Partners
Short to Medium term then periodic and regular
Conduct periodic impact evaluations of existing programs to determine efficacy vis-à-vis the labor market, program quality, uptake/enrollments, numbers graduating, numbers dropping out
Topic 47. Survey and other data
Conduct periodic labor and workforce development surveys to assess the demand and supply for skills
Topic 48. Use of data to monitor and improve program and system performance
Government does not use the available data, and does not emphasize the need for data collection and publication of labor market outcomes of graduates
Increase focus on outcomes, efficiency and innovation by linking labor market reports with training providers' reports to assess achievement of outcomes, efficiency of the programs, and whether innovations can be fostered
CIMSGWD, INS, Development Partners Ongoing
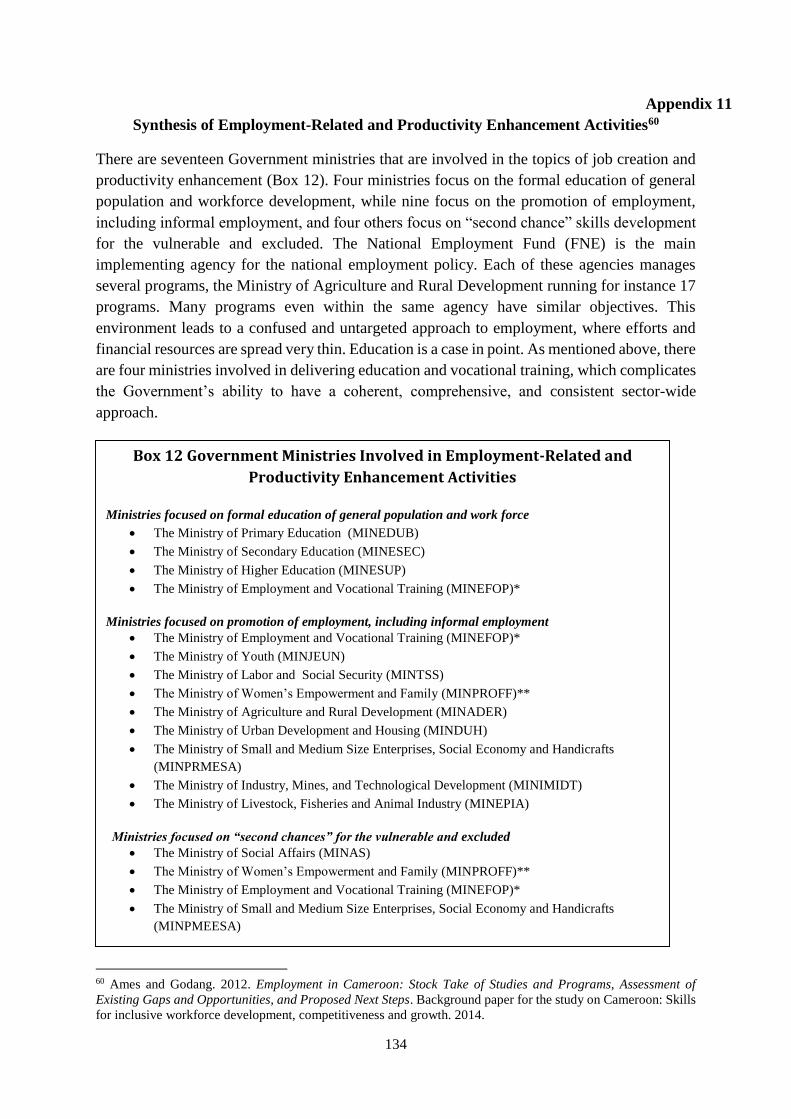
134
Appendix 11
Synthesis of Employment-Related and Productivity Enhancement Activities60
There are seventeen Government ministries that are involved in the topics of job creation and
productivity enhancement (Box 12). Four ministries focus on the formal education of general
population and workforce development, while nine focus on the promotion of employment,
including informal employment, and four others focus on “second chance” skills development
for the vulnerable and excluded. The National Employment Fund (FNE) is the main
implementing agency for the national employment policy. Each of these agencies manages
several programs, the Ministry of Agriculture and Rural Development running for instance 17
programs. Many programs even within the same agency have similar objectives. This
environment leads to a confused and untargeted approach to employment, where efforts and
financial resources are spread very thin. Education is a case in point. As mentioned above, there
are four ministries involved in delivering education and vocational training, which complicates
the Government’s ability to have a coherent, comprehensive, and consistent sector-wide
approach.
60 Ames and Godang. 2012. Employment in Cameroon: Stock Take of Studies and Programs, Assessment of
Existing Gaps and Opportunities, and Proposed Next Steps. Background paper for the study on Cameroon: Skills
for inclusive workforce development, competitiveness and growth. 2014.
Box 12 Government Ministries Involved in Employment-Related and
Productivity Enhancement Activities
Ministries focused on formal education of general population and work force
The Ministry of Primary Education (MINEDUB)
The Ministry of Secondary Education (MINESEC)
The Ministry of Higher Education (MINESUP)
The Ministry of Employment and Vocational Training (MINEFOP)*
Ministries focused on promotion of employment, including informal employment
The Ministry of Employment and Vocational Training (MINEFOP)*
The Ministry of Youth (MINJEUN)
The Ministry of Labor and Social Security (MINTSS)
The Ministry of Women’s Empowerment and Family (MINPROFF)**
The Ministry of Agriculture and Rural Development (MINADER)
The Ministry of Urban Development and Housing (MINDUH)
The Ministry of Small and Medium Size Enterprises, Social Economy and Handicrafts
(MINPRMESA)
The Ministry of Industry, Mines, and Technological Development (MINIMIDT)
The Ministry of Livestock, Fisheries and Animal Industry (MINEPIA)
Ministries focused on “second chances” for the vulnerable and excluded
The Ministry of Social Affairs (MINAS)
The Ministry of Women’s Empowerment and Family (MINPROFF)**
The Ministry of Employment and Vocational Training (MINEFOP)*
The Ministry of Small and Medium Size Enterprises, Social Economy and Handicrafts
(MINPMEESA)

135
Similarly with developing partners, Cameroon has seven main traditional partners that provide
support in the areas of job creation and productivity enhancements, especially:
The African Development Bank (AfDB)
The European Union (EU)
The Food and Agriculture Organization (FAO)
The Agence Françaises de Développement (AFD)
The International Fund for Agriculture Development (IFAD)
The Japanese International Cooperation Agency (JICA)
The World Bank Group (WBG), including the International Finance Corporation (IFC)
Lack of coordination could also be here a source of concern with very similar programs run by
different donors. AFD, for instance, manages a « Programme d’Appui à la Compétitivité des
Exploitations Agricoles », while the EU runs a « Programme d’Amélioration de la Productivité
Agricole ». Both programs cover similar zones and include similar interventions.61
Limited explicit targeting of the informal sector
With the exception of PIAASI, the informal sector has not been the object of any explicit
program despite its importance as a job provider. The Government seems to have preferred
handling this sector through programs covering issues closely related to it rather than dealing
heads on with the constraints faced by this sector. Furthermore, efforts seem to have been
focused on ways to lure operators away from the informal sector and attract them to formality,
although survey results would tend to indicate that most of them are satisfied with the greater
flexibility informality provides them. Furthermore, although the stock-taking uncovered
various interventions at the local level aimed at facilitating non-farm informal businesses, many
municipalities are still trying to contain or repress these activities.
Even when the program explicitly targets the informal sector, as in the case of PIAASI, the
results are mixed. Launched in 2005, the program aimed at facilitating migration from the
informal to the formal sector. In this regard, the priority was put on youth and on women, and
the main objectives were to: (1) organize activities into professional groups; (2) provide
training; and (3) provide financial assistance. The program tried to reach as many people as
possible, was rolled out in all the regions, and covered all activities, without proper targeting.
As a result, the program over extended itself rapidly. Not being able to deal with the
specificities of each activity, its portfolio remained mostly urban. Financial resources were
spread thin, not providing enough of an incentive to operators to become formal. Increases in
investment were limited. Furthermore, the repayment rate on the loans was low (40 percent).
61 There are also various private, non-governmental or faith-based groups involved in employment-related activities. However, most of these
are small interventions and, hence, are beyond the scope of the present stock take exercise

136
Bank focus on the formal sector
The Bank’s involvement has primarily been in the formal sector (Table 34). In terms of
coverage by institution, Government projects in support of employment are mainly with regard
to the farm sector (18 projects), informal non-farm sector (18), and youth (13 projects).
Similarly, the majority of development partner projects outside of the World Bank Group are
with regard to the farm sector (10 projects), the informal non-farm sector (3 projects), youth (2
projects) and women (1 project). In stark contrast, the majority of the World Bank Group
activities with implications for employment are with regard to the formal sector (19 projects),
with the Bank also supporting the farm sector to a lesser degree (1 project) and the IFC aiding
the non-farm informal sector (3 activities).
Table 34. Coverage of Government and Development Partner
Employment-Related Programs and Projects
Government Development Partners World Bank/IFC
Formal Sector 0 0 14/5
Farm Sector 18 10 1/0
Informal Sector:
Household Enterprises 0 0 0/0
Other Enterprises 18 3 0/3
Youth Employment 13 2 0/0
Women Employment 0 1 0/0

137
Appendix 12
Francophone Education and Training System

138
Appendix 13
Anglophone Education and Training System

139
Appendix 14
Skills Development Solutions in Select Countries
Box 13. Skilling up Vietnam: Preparing the workforce for a modern market economy
Education has played an important role in making Vietnam a development success story over the last twenty years. Vietnam’s rapid
economic growth in the 1990s was driven predominantly by productivity increases that came in the wake of a rapid shift of employment
out of low productivity agriculture into higher productivity non-farm jobs. Vietnam’s economy began to industrialize and modernize. Poverty fell dramatically. And education played an enabling role. Vietnam’s committed effort to promote access to primary education
for all and to ensure its quality through centrally setting minimum quality standards has contributed to its reputation for having a well-
educated, young workforce. Literacy and numeracy among Vietnam’s adult workforce is widespread and more so than in other countries, including wealthier ones. Recognizing that capital investments is one of the main sources of economic growth, Vietnam has also
recognized that making its workforce more productive and alleviating skills barriers to labor mobility is central to Vietnam’s economic
modernization. Economic modernization will involve a shift in labor demand from predominantly manual and elementary jobs towards more skill-intensive non-manual jobs, from jobs that largely involve routine tasks to those with non-routine tasks, from old jobs to “new”
jobs. And “new” jobs will require new skills. Despite impressive literacy and numeracy achievements among Vietnamese workers, many
Vietnamese firms report a shortage of workers with adequate skills as a significant obstacle to their activity. Employers identify job-specific technical skills as the most important skill they are looking for when hiring both white and blue collar workers. Employers are
equally looking for cognitive skills and behavioral skills. Job-specific technical skills, working well in teams and being able to solve
problems are considered important behavioral and cognitive skills for blue collar workers. Employers expect white collar workers to be able to think critically, solve problems, and present their work in a convincing manner to clients and colleagues. Vietnam’s new jobs
require that workers have good foundational skills, such as good reading ability. Workers also need more advanced skills that help them
to be responsive to changes in workplace demands. Vietnam’s focused investments over the last decades in universalizing primary education completion and expanding access to all levels of education has paid off. This has allowed increasing shares of the population
to take advantage of expanding economic opportunities. Strengthening the skills development system is an important element of Vietnam’s restructuring needs to ensure that the structural transformation proceeds apace and Vietnam succeeds as a middle income
country (MIC). The SABER Analytical Framework for Workforce Development (WfD) benchmarking results shows that already in 2011
Vietnam had a strongly emerging system of policies and institutions. That is, the country has (i) a strategic framework that provides clarifies the direction for WfD, prioritizes a demand-led approach, and has strong critical coordination mechanism fit for a solid middle-
income country; (ii) system oversight that provides diverse pathways for skills acquisition, and assures relevant and reliable standards;
and (iii) in the area of service delivery the system fosters relevance in training programs, and provides incentives for excellence in training provision. In the areas of ensuring efficiency and equity in funding and enhancing accountability for results alone more efforts are
required in Vietnam.
Source: World Bank. Vietnam Development Report 2014. Skilling up Vietnam: Preparing the workforce for a modern market economy;
World Bank. Vietnam: Workforce Development, SABER Country Report 2012.

140
Box 14. Successful and Widely Known ECD Program:
Brazil’s Better Early Childhood Development Program (UNESCO, 2009)
PIM, headed by the State Department of Health, coordinates efforts by the State Departments of Education, Culture, Justice and Social Development. The program’s concept and implementation reflects a deep recognition of the relevance and complexity of child development
and is fully committed to promoting it through the articulation of the necessary sectors and resources. The program’s basic premise is that
child development is a complex process that comprises several dimensions: neurological, affective, cognitive and social. It cannot be decontextualized; rather, a child’s environment, the family and the community it belongs to play a core role.
PIM was strongly based on lessons learned from the Cuban program “Educa a Tu Hijo” (Cuba, Ministry of Education, 2002). Defined as a non-formal, non-institutional, community- based, family-oriented Early Child Development (ECD) Program, of an intersectorial nature,
the program has operated under the responsibility of the Ministry of Education in Cuba since its implementation from 1992-94.
Like Educa a Tu Hijo, PIM is organized around a structural troika: Family, Community and Intersectoriality. The family is viewed as the
most important primary human group in the early years of an individual’s life. It is an affective unit of relationship, care, protection and education, not necessarily based on blood or legal ties. The importance of family becomes even more critical in light of the fact that almost
75.28% of the population aged 0 to 6 years has no access to early childhood education facilities in Rio Grande do Sul. (IBGE, 2007;
Ministry of Education/INEP, 2007) The program views the community as a central space for potentialities and human, material and institutional resources. Its customs, traditions and cultural production are key elements for the education, health and development of
children. Intersectoriality is considered a key element to the success of PIM. Integration among governmental departments of health,
education, social services and culture, as well as the full commitment of administrators in all spheres, are gradually converting PIM into a reality that is not only feasible but also increasingly promising. Moreover, the program’s articulation with the second and third sectors has
also contributed to positive results.
PIM provides assisted families with two modalities of care: Individual and Group Care, complemented by a community-based approach.
All parental guidance and child stimulation activities are planned and carried out in a playful way, appropriate to children’s ages and/ or
women’s stages of pregnancy, and take into consideration the developmental dimensions targeted by the program, its theoretical framework, and the local context and cultural aspects.
The Individual Care Modality is designed for families with children aged 0 to 2 years and 11 months, and pregnant women assisted by the program. Children are seen once a week and pregnant women are seen once every two weeks in home visits lasting approximately 1 hour.
Each visit has three distinct stages: a review of the previous visit and an exploration of the present topic (during which the Home Visitor
explains the benefits of the proposed activities for the various developmental aspects of the child and/or for the mother-baby dyad); the actual activity, observed and supported by the Family Visitor; and the final assessment stage.
The Group Care Modality is designed for families with children aged 3 to 6 and/or pregnant women in weekly and monthly schedules, respectively. Meetings can happen in community centers, church halls, parks, and homes big enough to accommodate all participants and
include games and playful educational activities planned by Home Visitors under the supervision of PIM technical coordination team. The
main goal of the group modality for pregnant women is to provide relevant information on topics such as child delivery and the importance of breastfeeding, as well as to promote socialization and the exchange of experiences.
As a result of the program’s consolidation and effectiveness, a State Law has been passed - State Law #12544 – so as to guarantee the continuity of investments in early childhood at the local level. This law establishes PIM as a public policy that aims at promoting the
holistic development for children from pregnancy to the age of six as a complement to family and community actions.
Source: Excerpt from UNESCO’s The Better Early Childhood Development Program: An Innovative Brazilian Public Policy by
Alessandra Schneider, Vera Regina Ramires, Maria da Graça Gomes Paiva, and Leila Almeida.

141
Appendix 15
Methodology
Transition rate:
Where:
Transition Rate (from cycle or level of education h to h+1 in school year t)
Number of pupils enrolled in the first grade at level of education h+1 in school year t+1
Number of pupils repeating the first grade at level of education h+1 in school year t+1
Number of pupils enrolled in final grade n at level of education h in school year t
Gross enrolment rate:
Where:
Gross Enrolment Ratio at level of education h in school year t
Enrolment at the level of education h in school year t
Population in age group which officially corresponds to level of education h in school year t
Adult literacy: Promotion rate:
Where: Where:
Adult literacy Rate (15+) in year t Promotion Rate at grade i in school
year t
Adult Literate Population (15+) in year t New entrants to grade i+1, in school year t+1
Adult Population (15+) in year t Number of pupils enrolled in grade i, in school
year t

142
Repetition rate: Pupil-Teacher Ratio:
Where: Where:
Repetition Rate at grade i in school year t Pupil-teacher ratio at level of
education
h in school year t
Number of pupils repeating grade I, in school Total number of pupils or (students)
at year t+1 level of education h in
school year t
Number of pupils enrolled in grade I, in school Total number of teachers at level of
year t education h in school year t
Access rate/ Gross Intake Ratio in the first Grade of Primary:
Where:
Gross Intake Ratio in school year t
Number of new entrants in the first grade of primary education, in school year t
Population of official primary school entrance-age in a, in school year t
Primary completion rate/ Gross Intake Ration in the Last Grade of Primary (GIRLG):
Where:
Gross Intake Ratio in the Last Grade of primary in school year t
Number of new entrants in the last grade l of primary education, in school year t
Population of theoretical entrance age a in the last grade of primary, in school year t
United Nations Education Scientific and Cultural Organization, Institute for Statistics (UIS), November 2009,
Education Indicators, Technical Guidelines.

143
List of References
Almeida, Rita, Jere Behrman, David Robalino. Eds. 2012. The Right Skills for the Job?
Rethinking Training Policies for Workers. World Bank. Washington, D.C., USA.
Ansu, Yaw and Jee-Peng Tan. May 2012. In “Good Growth and Governance in Africa:
Rethinking Development Strategies” by Noman, Akbar, Kwesi Botchwey, Howard Stein, and
Joseph E. Stiglitz. Oxford Scholarship Online: May 2012, DOI:
10.1093/acprof:oso/9780199698561.001.0001.)
Banerji, A., Wendy Cunningham, Ariel Fiszbein, Elizabeth King, Harry Patrinos, David
Robalino, and Jee-Peng Tan. 2010. Stepping Up Skills for More Jobs and Higher Productivity.
World Bank, Washington, D.C.
Barro, R.J. and Lee J.W. (2010), “A New Data Set of Educational Attainment in the World,
1950-2010”, NBER Working Paper 15902
Bem, Justin, Pierre Joubert Nguetse Tegoum, Tatiana Morel Samo Tcheeko, Jackson Essoh.
July 2013. Efficience de production du secteur informel non-agricole et réduction de la
pauvreté au Cameroun. Partnership for Economic Policy (PEP). Working paper 2013-06.
Research undertaken by the Center for Research for International Development (CRDI),
financed by the Department for International Development (DFID), UK Aid and the
Government of Canada
Charlier, Florence and Charles Nçho-Oguie. 2009. Sustaining Reforms for Inclusive Growth in
Cameroon. A Development Policy Review. The World Bank, Washington, D.C.
Dinh, Hinh T., V. Palmade, V. Chandra, and F. Cossar. 2012. Light Manufacturing in Africa:
Targeted Policies to Enhance Private Investment and Create Jobs. Africa Development
Forum. World Bank. Washington, D.C., USA.
Filmer, Deon and Louise Fox with Karen Brooks, Aparijita Goyal, Taye Mengistae, Patrick
Premand, Dena Ringold, Siddharth Sharma, and Sergiy Zorya. 2014. Youth Employment in
Sub-Saharan Africa. World Bank and Agence Française de Développement. Washington, D.C.,
USA.
Ghura, Dhaneshwar. 1997. Private Investment and Endogenous Growth: Evidence from
Cameroon. IMF Working Paper No. WP/97/165. Washington, D.C.
Gouvernement du Cameroun. La population du Cameroun en 2010. Institut National de
Statistique. 2011, Yaoundé, Cameroun.
International Finance Corporation, Islamic Development Bank. April 2011. Education for
Employment: Realizing Arab Youth Potential. Education for Employment (e4e). Washington,
D.C.
International Monetary Fund. World Economic Outlook, October 2013. Washington, D.C.
ILO School to Work Transition Survey, 2009

144
http://www.ilo.org/wcmsp5/groups/public/---
ed_emp/documents/instructionalmaterial/wcms_140858.pdf
IFC Education for Employment, e4e, 2011
http://www.e4earabyouth.com/pdf/MGLPDF136022536640.pdf
Ministère de l’Emploi et de la Formation Professionnelle et Organisation Internationale du
Travail—Bureau Sous Régional pour l’Afrique centrale avec Ministère de l’Enseignement de
la Formation et Professionnelle (MINEFOP) et BIT/BSR. Novembre 2009. Etude sur la filière
porteuse d’Emploi « Le Tourisme ». Projet d’Appui à la Promotion de l’Emploi et à la
Réduction de la Pauvreté. Rapport définitif par Zacharie Ewolo Onana. Yaoundé, Cameroun.
Ministère de l’Emploi et de la Formation Professionnelle et Organisation Internationale du
Travail—Bureau Sous Régional pour l’Afrique centrale. Novembre 2009. Etude de la filière
Bois au Cameroun : Identification des interventions porteuses d’emplois. Rapport Final.
Elaborée par Ed Perry, Consultant international et Kolokosso A. Bediang, Consultant national.
Yaoundé, Cameroun.
_________________. Novembre 2009. Etude sur la filière porteuse d’Emploi « Palmier à
Huile ». Rapport Final. Elaboré par Lebailly Philippe, Consultant international et Tentchou
Jean, Consultant national. Yaoundé, Cameroun.
Ndjobo, Patrick Marie Nga. 2012/13. Analyse des impacts de l’éducation sur le fonctio-
nnement du marché du travail au Cameroun. Faculty of Economics and Management. Ph.D.
Dissertation/Thesis directed by Prof. Yves André Abessolo (Agrégé des Facultés des Sciences
Economiques). University of Yaounde 2. Cameroon.
Organisation International du Travail (OIT). Octobre 2009. Etude sur le potentiel d’emploi
dans le secteur des infrastructures au Cameroun. Rapport Définitif par Samuel Yemene (Chef
de Mission, Martine Ekoue Niyabi, Donnat Takuete, Francis Teubissi. Avec la collaboration
de Vincent Kouete et Angélique Matene Sob. Yaoundé, Cameroun.
République of Cameroun. Janvier 2014. Diagnostique de la formation technique et
professionnelle et la présentation d’un plan d’action dans les métiers du Bois au Cameroun.
Réalisation d’une étude diagnostique pour le Projet Compétitivité des Filières de Croissance
(PCFC). Crédit IDA 47800 CM. Ministère de l’Economie de la Planification et de
l’Aménagement du Territoire. Pro-Invest : Au Service du Développement. Yaoundé,
Cameroun.
___________________. Novembre 2012. Deuxième enquête sur l’emploi et le secteur informel
au Cameroun (ESSI 2): Insertion sur le marché du travail. Institut National de la Statistique,
Yaoundé, Cameroun.
__________________. Novembre 2012. Deuxième enquête sur l’emploi et le secteur informel
au Cameroun (ESSI 2): Distorsions et mobilité sur le marché du travail. Institut National de
la Statistique, Yaoundé, Cameroun.

145
__________________. Novembre 2012. Deuxième enquête sur l’emploi et le secteur informel
au Cameroun (ESSI 2): Productivité dans le secteur informel. Institut National de la Statistique,
Yaoundé, Cameroun.
__________________ . Septembre 2010. Recensement général des entreprises (RGE 2009) :
Rapport principal des résultats. Institut National de la Statistique, Yaoundé, Cameroun.
Cunningham, Wendy, M. L. Sanchez-Puerta, A. Wuermli. Employment Policy Primer: Active
Labor Market Programs for Youth: A Framework to Guide Youth Employment Interventions.
World Bank. No.58601/10. November 2010. Washington, D.C.
World Bank and International Finance Corporation. Doing Business 2014: Understanding
Regulations for Small and Medium-Size Enterprises. Comparing Business Regulations for
Domestic Firms in 189 Economies.
World Bank. 2009. Cluster Initiatives for Competitiveness: A Practical Guide and Toolkit.
Washington, D.C., World Bank.
__________. 2005. Pro-poor Growth in the 1990s: Lessons and Insights from 14 countries.
Technical Report. Washington, D.C.