foundation design: west seattle bridgeonlinepubs.trb.org/onlinepubs/trr/1984/982/982-009.pdf ·...
TRANSCRIPT
Transportation Research Record 982 57
Foundation Design: West Seattle Bridge
JOHN H. CLARK
ABSTRACT
Development of foundation design for the West Seattle Freeway Bridge required extensive geotechnical investigations including a seismic intensity determination. This bridge is one of the first major structures to be designed in accordance with the guidelines developed by the Applied Technology Council (ATC-06). Design constraints, procedures, solutions, and details are described.
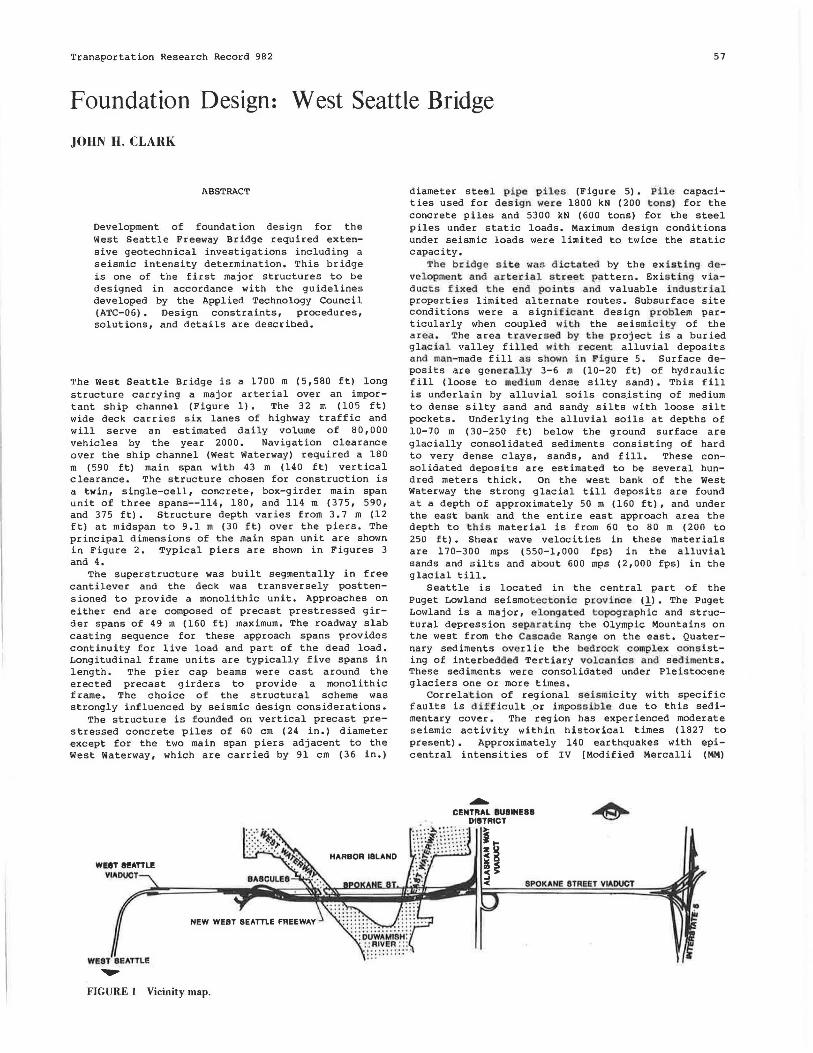
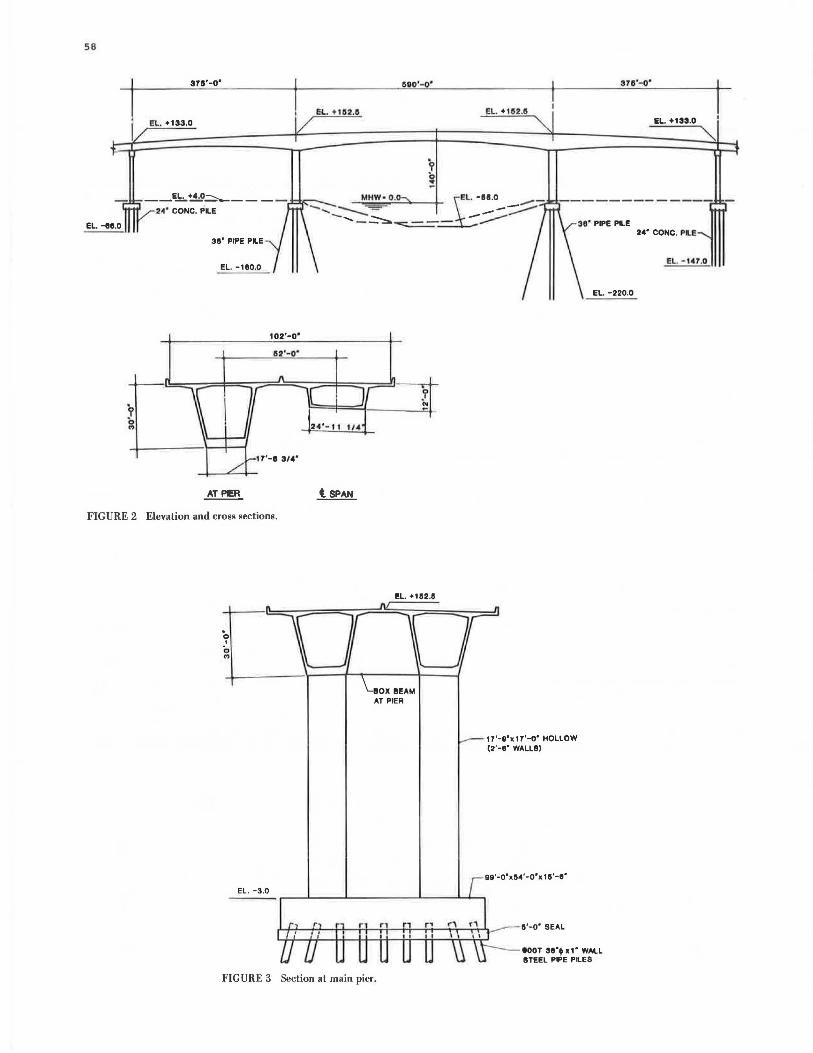
The West Seattle Bridge is a 1700 m (5,580 ft) long structure carrying a major arterial over an important ship channel (Figure 1). The 32 m (105 ft) wide deck carries six lanes of highway traffic and will serve an estimated daily volume of 80,000 vehicles by the year 2000. Navigation clearance over the ship channel (West Waterway) required a 180 m (590 ft) main span with 43 m (140 ft) vertical clearance. The structure chosen for construction is a twin, single-cell, concrete, box-girder main span unit of three spans--114, 180, and 114 m (375, 590, and 375 ft). Structure depth varies from 3.7 m (12 ft) at midspan to 9.1 m (30 ft) over the piers. The principal dimensions of the main span unit are shown in Figure 2. Typical piers are shown in Figures 3 and 4.
The superstructure was built segmentally in free cantilever and the deck was transversely posttensioned to provide a monolithic unit. Approaches on either end are composed of precast prestressed girder spans of 49 m (160 ft) maximum. The roadway slab casting sequence for these approach spans provides continuity for live load and part of the dead load. Longitudinal frame units are typically five spans in length. The pier cap beams were cast around the erected precast girders to provide a monolithic frame. The choice of the structural scheme was strongly influenced by seismic design considerations.
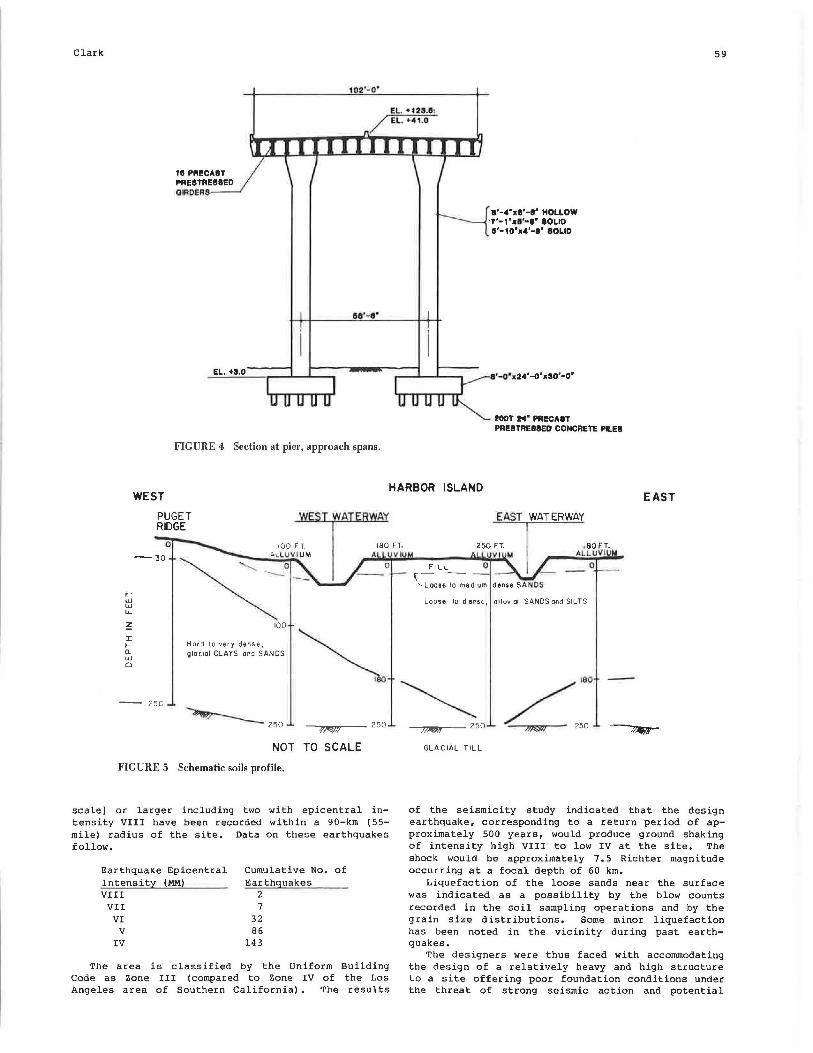
The structure is founded on vertical precast pres tressed concrete piles of 60 cm (24 in.) diameter except for the two main span piers adjacent to the West Waterway, which are carried by 91 cm ( 36 in.)
WIST ftATTLE VIADUCT
WEST SEATTLE ..... FIGURE 1 Vicinity map.
HARBOR ISLAND
diameter steel pipe piles (Figure 5). Pile capacities used for design were 1800 kN (200 tons) for the concrete piles and 5300 kN (600 tons) for the steel piles under static loads. Maximum design conditions under seismic loads were limited to twice the static capacity.
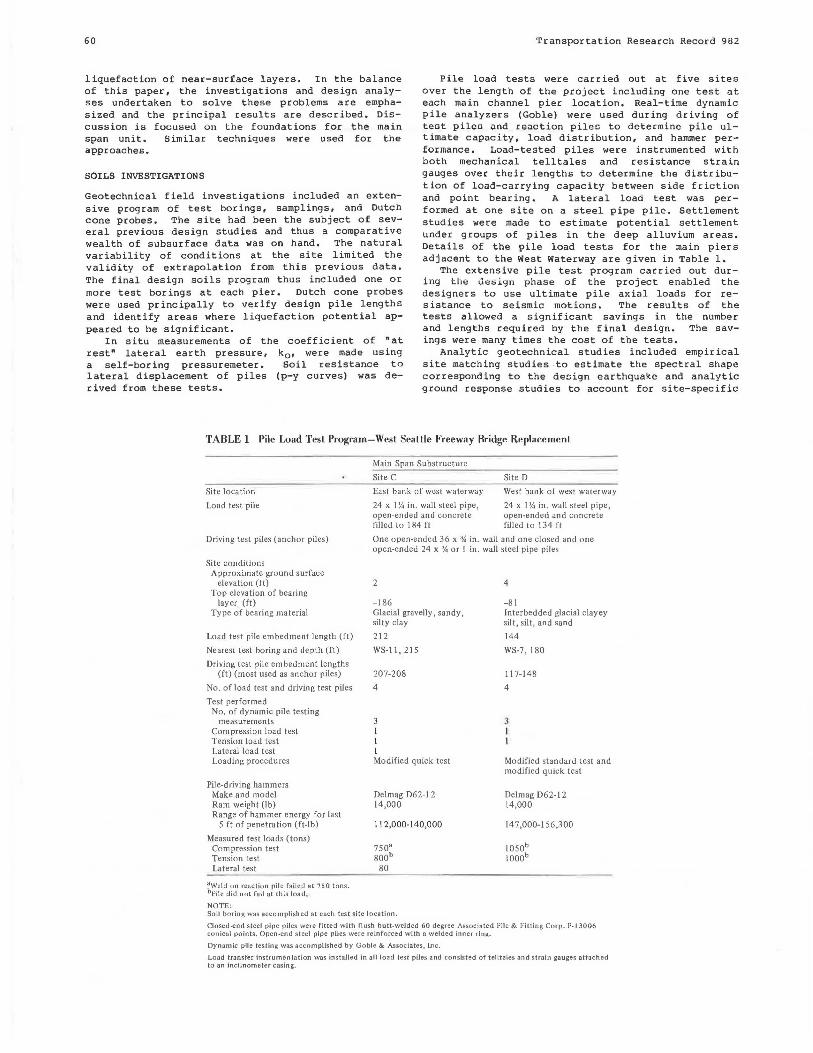
The bridge site was dictated by the existing development and arterial street pattern. Existing viaducts fixed the end points and valuable industrial properties limited alternate routes. Subsurface site conditions were a significant design problem particularly when coupled with the seismicity of the area. The area traversed by the project is a buried glacial valley filled with recent alluvial deposits and man-made fill as shown in Figure 5. Surface deposits are generally 3-6 m (10-20 ft) of hydraulic fill (loose to medium dense silty sand). This fill is underlain by alluvial soils cons.isting of medium to dense silty sand and sandy silts with loose silt pockets. Underlying the alluvial soils at depths of 10-70 m (30-250 ft) below the ground surface are glacially consolidated sediments consisting of hard to very dense clays, sands, and fill. These consolidated deposits are estimated to be several hundred meters thick. On the west bank of the West Waterway the strong glacial till deposits are found at a depth of approximately 50 m (160 ft), and under the east bank and the entire east approach area the depth to this material is from 60 to 80 m (200 to 250 ft). Shear wave velocities in these materials are 170-300 mps (550-1,000 fps) in the alluvial sands and silts and about 600 mps (2,000 fps) in the glacial till.
Seattle is located in the central part of the Puget Lowland seismotectonic province (.!) • The Puget Lowland is a major, elongated topographic and structural depression separating the Olympic Mountains on the west from the Cascade Range on the east. Quaternary sediments overlie the bedrock complex consisting of interbedded Tertiary volcanics and sediments. These sediments were consolidated under Pleistocene glaciers one or more times.
Correlation of regional seismicity with specific faults is difficult .or impossible due to this sedimentary cover. The region has experienced moderate seismic activity within historical times (1827 to present) • Approximately 140 earthquakes with epicentral intensities of IV [Modified Mercalli (MM)
SPOKANE STREET VIADUCT
58
318'-0" aeo·- o· 318'- 0"
El. +1112.11 EL. +152.5
El. +133.0 EL. +133.0
"""
El. -88.0
--~~~----·..=.,..-~~ MHW•O.O ~L. -H.O 2.t' CONC. PILE -..._ --._-- ---::::/-
- -.... _ _::-::,.-=:..=.:=-- - --- 38' PIPE PILE 24" CONC. PILE
38' PIPE PILE
EL. -180.0 EL. -147 ,0
El. -220.0
102•-o•
a2·- o·
'
l lf 'J 0
2<1'- 1 l "" .. ,.....11·-e 3/4"
/
FIGURE 2 Elevation and cross sections.
EL. +1112.11
oo.~o
EL. -3.0
llOX l!EAM AT PIER
FIGURE 3 Section at main pier.
17'-8"x 17'-o• HOLLOW (2'-8" WALLB)
99'-0'xll.t'-o'x 111•-e•
a·-o· SEAL
IOOT 38"• x 1 • WM.L llTl!EL PIPE Pit.ES
Clark
111 PRECAST ~ESTREllSED
OIADERS
EL. +3.0
102·-o·
1111·-11•
FIGURE 4 Section at pier, approach spans.
8'·4'1111'·11' HOLLOW ·7•-1•1111·~1· IOLID 5'-10'x4'-I' SOio.iD
ll'·0'1124'-0"x30'-0"
IGOT M" PAl!CAST PRESTRESSED CONCRETE Pl.ES
59
HARBOR ISLAND
..... w w "-
WEST
PUGET RIDGE
--30
100
EAST
dense SAN DS
Loose lo dens<. 1 alluvial SANDS and SILTS
~ I ..... a. w 0
-- 25C
Hard lo very dense, Qlac1al CLAYS and SANDS
~250 ~~/·'
WWII 250 //Allff 250 /IN// 250
NOT TO SCALE
FIGURE 5 Schematic soils profile.
scale] or larger including two with epicentral intensity VIII have been recorded within a 90-km (55-mile) radius of the site. Data on these earthquakes follow.
Earthquake Epicentral Intensity (MM)
VIII VII
VI v
IV
Cumulative No. of Earthquakes
2
7 32 86
143
The area is classified by the Uniform Building Code as Zone III (compared to Zone IV of the Los Angeles area of Southern California). The results
GLACIAL TILL
of the seismicity study indicated that the design earthquake, corresponding to a return period of approximately 500 years, would produce ground shaking of intensity high VIII to low IV at the site. The shock would be approximately 7. 5 Richter magnitude occurring at a focal depth of 60 km.
Liquefaction of the loose sands near the surface was indicated as a possibility by the blow counts recorded in the soil sampling operations and by the grain size distributions. Some minor liquefaction has been noted in the vicinity during past earthquakes.
The designers were thus faced with accommodating the design of a relatively heavy and high structure to a site offering poor foundation conditions under the threat of strong seismic action and potential
60
liquefaction of near-surface layers. In the balance of this paper, the investigations and design analyses undertaken to solve these problems are emphasized and the principal results are described. Discussion is focused on the foundations for the main span unit. Similar techniques were used for the approaches.
SOILS INVESTIGATIONS
Geotechnical field investigations included an extensive program of test borings, samplings, and Dutch cone probes. The site had been the subject of several previous design studies and thus a comparative wealth of subsurface data was on hand. The natural variability of conditions at the site limited the validity of extrapolation from this previous data. The final design soils program thus included one or more test borings at each pier. Dutch cone probes were used principally to verify design pile lengths and identify areas where liquefaction potential appeared to be significant.
In situ measurements of the coefficient of "at rest" lateral earth pressure, k0 , were made using a self-boring pressuremeter. Soil resistance to lateral displacement of piles (p-y curves) was derived from these tests.
Transportation Research Record 982
Pile load tests were carried out at five sites over the length of the project including one test at each main channel pier location. Real-time dynamic pile analyzers (Goble) were used during driving of test piles und reuction piles to determine pile ultimate capacity, load distribution, and hammer performance. Load-tested piles were instrumented with both mechanical telltales and resistance strain gauges over their lengths to determine the distribution of load-carrying capacity between side friction and point bearing. A lateral load test was performed at one site on a steel pipe pile. Settlement studies were made to estimate potential settlement under groups of piles in the deep alluvium areas. Details of the pile load tests for the main piers adjacent to the West Waterway are given in Table 1.
The extensive pile test program carried out during the design phase of the project enabled the designers to use ultimate pile axial loads for resistance to seismic motions. The results of the tests allowed a significant savings in the number and lengths required by the final design. The savings were many times the cost of the tests.
Analytic geotechnical studies included empirical site matching studies -to estimate the spectral shape corresponding to the design earthquake and analytic ground response studies to account for site-specific
TABLE 1 Pile Load Test Program-West Seattle Freeway Rridge Replar.ement
Site location
Load test pile
Driving test piles (anchor piles)
Site conditions Approximate ground surface
elevation (ft) Top elevation of bearing
layer (ft) Type of bearing material
Load test pile em bedment length (ft)
Nearest test boring and depth (ft)
Driving test pile cmbedment lengths (ft) (most used as anchor piles)
No. of load test and driving test piles
Test performed No. of dynamic pile testing
measurements Compression load test Tension load test Lateral load test Loading procedures
Pile-driving hammers Make and model Ram weight (lb) Range of hammer energy for last
5 ft of penetration (ft-lb)
Measured test loads (tons) Compression test Tension test Lateral test
8Weld on reaction pile failed at 750 tons. bPile did not rail at this load .
NOTE:
Main Span Substructure
Site C
East bank of west waterway
24 x IV. in. wall steel pipe, open-ended and concrete filled to 184 ft
Site D
West bank of west waterway
24 x IV. in. wall steel pipe, open-ended and concrete filled to 134 ft
One open-ended 36 x % in. wall and one closed and one open-ended 24 x % or I in. wall steel pipe piles
2
-186 Glacial gravelly, sandy, silty clay
212
WS-11, 215
207-208
4
Modified quick test
Delmag 062-12 14,000
112,000-140,000
750• 800b
80
4
-81 lnterbedded glacial clayey silt, silt, and sand
144
WS-7,180
117-148
4
3 I I
Modified standard test and modified quick test
Delmag 062-12 14,000
14 7,000-156,300
Soil boring was accomplished at ench test site location.
Closed-end steel pipe piles were ritted wilh nush butt-welded 60 degree Associated Pile & Fitting Corp. P-13006 conical points. Open-end steel pipe piles were reinforced with a welded inner ring.
Dynamic pile testing was accomplished by Goble & Associates, Inc.
Load trnnsfer instrumentation was installed in all load test piles and consisted of telltales and strain gauges attached to an incHnometer casing.
Clark
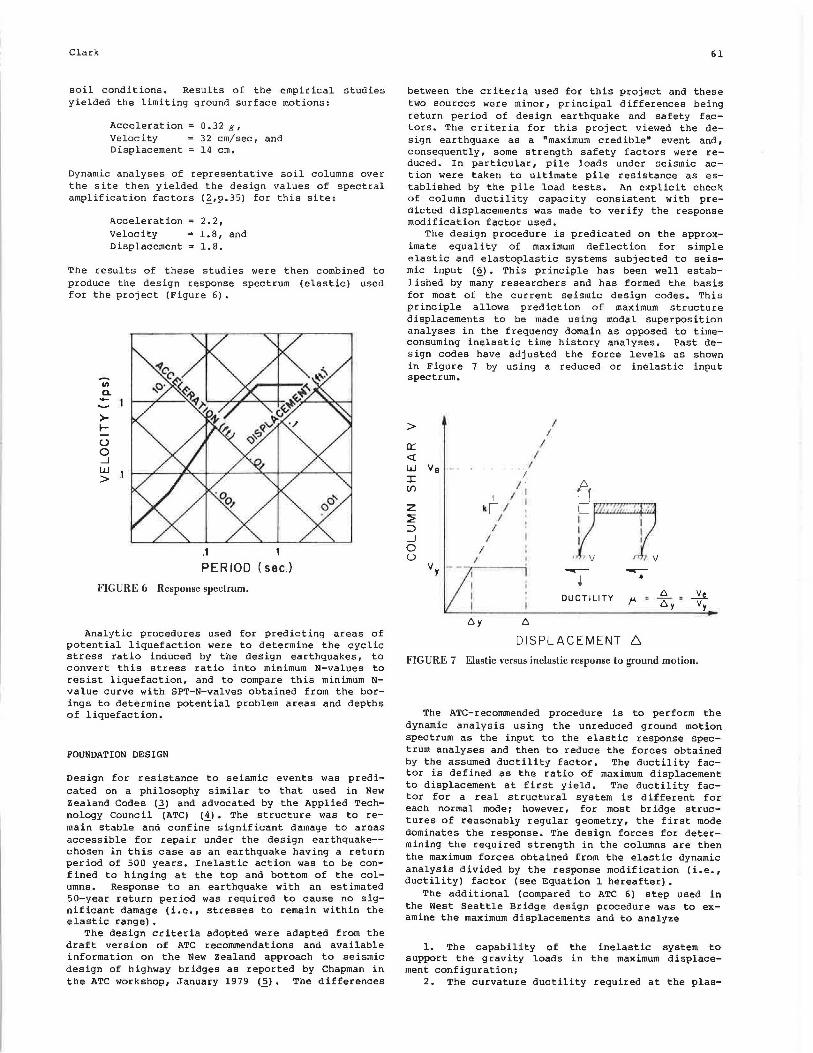
soil conditions. Results of the empirical studies yielded the limiting ground surface motions:
Acceleration Velocity Displacement
0 .32 g,
32 cm/sec, and 14 cm.
Dynamic analyses of representative soil columns over the site then yielded the design values of spectral amplification factors (~,p.35) for this site:
Acceleration Velocity Displacement
2.2, 1.8, and 1.8.
The results of these studies were then combined to produce the design response spectrum (elastic) used for the project (Figure 6) •
en Cl. ->t-u 0 _J
w >
.1 1
PERIOD (sec.)
FIGURE 6 Response spectrum.
Analytic procedures used for predicting areas of potential liquefaction were to determine the cyclic stress ratio induced by the design earthquakes, to convert this stress ratio into minimum N-values to resist liquefaction, and to compare this minimum Nvalue curve with SPT-N-valves obtained from the borings to determine potential problem areas and depths of liquefaction.
FOUNDATION DESIGN
Design for resistance to seismic events was predicated on a philosophy similar to that used in New Zealand Codes Ill and advocated by the Applied Technology Council (ATC) !!l. The structure was to remain stable and confine significant damage to areas accessible for repair under the design earthquake-chosen in this case as an earthquake having a return period of 500 years. Inelastic action was to be confined to hinging at the top and bottom of the columns. Response to an earthquake with an estimated 50-year return period was required to cause no significant damage (i.e., stresses to remain within the elastic range) •
The design criteria adopted were adapted from the draft version of ATC recommendations and available information on the New Zealand approach to seismic design of highway bridges as reported by Chapman in the ATC workshop, January 1979 12>· The differences
61
between the criteria used for this project and these two sources were minor, principal differences being return period of design earthquake and safety factors. The criteria for this project viewed the design earthquake as a "maximum credible" event and, consequently, some strength safety factors were reduced. In particular, pile loads under seismic action were taken to ultimate pile resistance as established by the pile load tests. An explicit check of column ductility capacity consistent with predicted displacements was made to verify the response modification factor used.
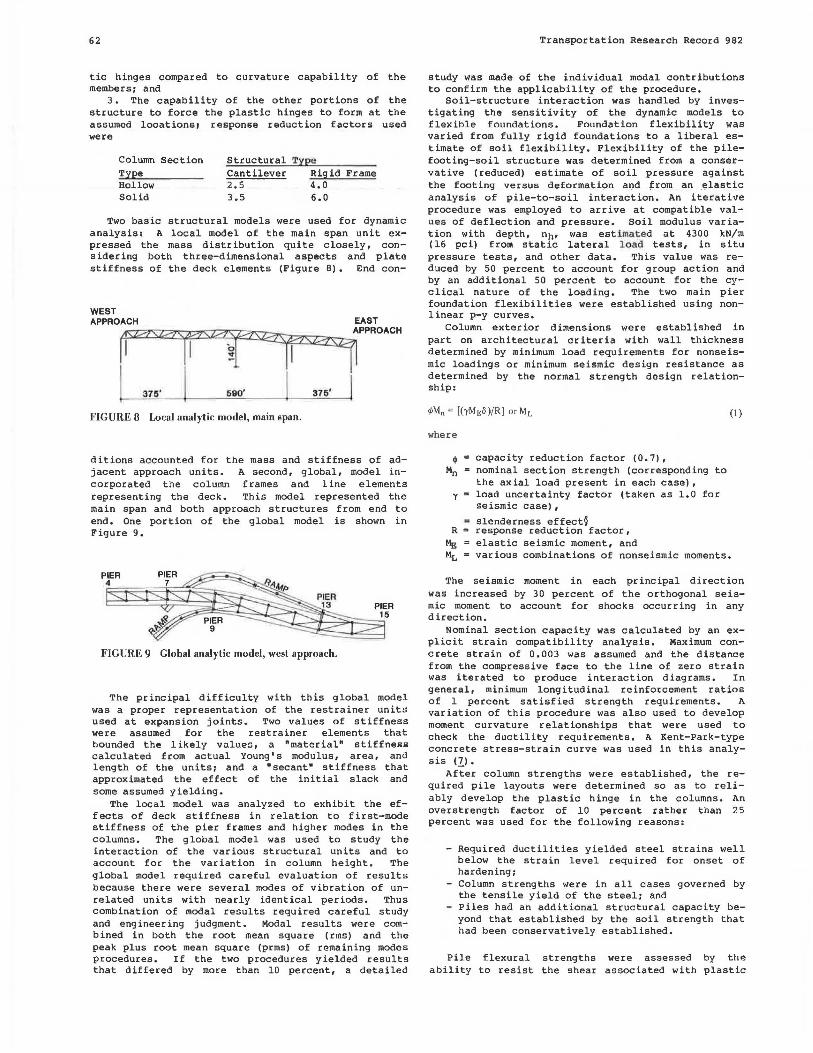
The design procedure is predicated on the approximate equality of maximum deflection for simple elastic and elastoplastic systems subjected to seismic input (_§). This principle has been well established by many researchers and has formed the basis for most of the current seismic design codes. This principle allows prediction of maximum structure displacements to be made using modal superposition analyses in the frequency domain as opposed to timeconsuming inelastic time history analyses. Past design codes have adjusted the force levels as shown in Figure 7 by using a reduced or inelastic input spectrum.
> I I
a:: I <:{ I w lie -. . I
I 1 A (/) I I
I I I z kj I n ~ I :::> I _J I 0 I u I v v
l/y I ----- -• • I I DUCTILITY
6 ~ r - 6 y I lly
6y 6
DISPLACEMENT 6 FIGURE 7 Elastic versus inelastic response to ground motion.
The ATC-recommended procedure is to perform the dynamic analysis using the unreduced ground motion spectrum as the input to the elastic response spectrum analyses and then to reduce the forces obtained by the assumed ductility factor. The ductility factor is defined as the ratio of maximum displacement to displacement at first yield. The ductility factor for a real structural system is different for each normal mode; however, for most bridge structures of reasonably regular geometry, the first mode dominates the response. The design forces for determining the required strength in the columns are then the maximum forces obtained from the elastic dynamic analysis divided by the response modification (i.e., ductility) factor (see Equation 1 hereafter) •
The additional (compared to ATC 6) step used in the West Seattle Bridge design procedure was to examine the maximum displacements and to analyze
1. The capability of the inelastic system to support the gravity loads in the maximum displacement configuration;
2. The curvature ductility required at the plas-
62
tic hinges compared to curvature capability of the membersi and
3. The capability of the other portions of the structure to force the plastic hinges to form at the assumed looations1 response reduction factors used were
Column Section Type
Structural Type
Hollow Solid
Cantilever 2.5 3.5
Riqid Frame 4.0 6.0
Two basic structural models were used for dynamic analysis: A local model of the main span unit expressed the mass distribution quite closely, considering both three-dimensional aspects and plate stiffness of the deck elements (Figure B). End con-
3715' 1590' 3715'
FIGURE ll Local analytic model, main span.
ditions accounted for the mass and stiffness of adjacent approach units. A second, global, model incorporated the column frames and line elements representing the deck. This model represented the main span and both approach structures from end to end. One portion of the global model is shown in Figure 9.
FIGURE 9 Global analytic model, west approach.
The principal difficulty with this global model was a proper representation of the restrainer units used at expansion joints. Two values of stiffness were assumed for the restrainer elements that bounded the 1 ikely valuec, a •material• stiffness calculated from actual Young's modulus, area, and length of the unitsi and a •secant" stiffness that approximated the effect of the initial slack and some assumed yielding.
The local model was analyzed to exhibit the effects of deck stiffness in relation to first-mode stiffness of the pier frames and higher modes in the columns. The global model was used to study the interaction of the various structural units and to account for the variation in column height. The global model required careful evaluation of results because there were several modes of vibration of unrelated units with nearly identical periods. Thus combination of modal results required careful study and engineering judgment. Modal results were combined in both the root mean square ( rms) and the peak plus root mean square (prms) of remaining modes procedures. If the two procedures yielded results that differed by more than 10 percent, a detailed
Transportation Research Record 982
study was made of the individual modal contributions to confirm the applicability of the procedure.
Soil-structure interaction was handled by investigating the sensitivity of the dynamic models to flexible foundations. Foundation flexibility was varied from fully rigid foundations to a liberal estimate of soil flexibility. Flexibility of the pilefooting-soil structure was determined from a conservative (reduced) estimate of soil pressure against the footing vers_us deformati1;m and from an _t;!lastic analysis of pile-to-soil interaction. An iterative procedure was employed to arrive at compatible values of deflection and pressure. Soil modulus variation with depth, nhr was estimated at 4300 kN/m (16 pci) from static lateral load tests, in situ pressure tests, and other data. This value was reduced by 50 percent to account for group action and by an additional 50 percent to account for the cyclical nature of the loading. The two main pier foundation flexibilities were established using non-1 inear p-y curves.
Column exterior dimensions were established in part on architectural criteria with wall thickness determined by minimum load requirements for nonseismic loadings or minimum seismic design resistance as determined by the normal strength design relationship:
where
~ capacity reduction factor (0.7), Mn • nominal section strength (corresponding to
the axial load present in each case), y = load uncertainty factor (taken as 1.0 for
seismic case) ,
a slenderness effect9 R response reduction factor,
"1E; elastic seismic moment, and
(1)
ML various combinations of nonseismic moments.
The seismic moment in each principal direction was increased by 30 percent of the orthogonal seismic moment to account for shocks occurring in any direction.
Nominal section capacity was calculated by an explicit strain compatibility analysis. Maximum concrete strain of 0.003 was assumed and the distance from the compressive face to the line of zero strain was iterated to produce interaction diagrams. In general, minimum longitudinal reinforcement ratios of 1 percent satisfied strength requirements. A variation of this procedure was also used to develop moment curvature relationships that were used to check the ductility requirements. A Kent-Park-type concrete stress-strain curve was used in this analysis <ll .
After column strengths were established, the required pile layouts were determined so as to reliably develop the plastic hinge in the columns. An overstrength factor of 10 percent rather than 25 percent was used for the following reasons:
- Required ductilities yielded steel strains well below the strain level required for onset of hardening;
- Column strengths were in all cases governed by the tensile yield of the steel; and
- Piles had an additional structural capacity beyond that established by the soil strength that had been conservatively established.
Pile flexural strengths were assessed by the ability to resist the shear associated with plastic
Clark
hinging in the columns. This analysis accounted for partial passive resistance against the pile . cap as described previously. Vertical piles were used throughout except under the two main piers immediately adjacent to the ship channel. Future channel widening will result in a significant length, 10 m (32 ft), of exposed pile. Battered piles were thus used for lateral resistance in these two piers. Steel pipe piles were selected for these elements to provide greater ductility than would be available from concrete piles. This was felt to be necessary to partly offset the less predictable behavior of the batter pile system.
Soil densification was used to mitigate the effects of potential liquefaction. An area extending twice the estimated depth of potential liquefaction beyond the outlines of each footing was densified using the Vibro-flotation technique. Vibro-flotation probe spacing was determined by densification results checked by Dutch cone probes. Soil densification was also used to stabilize the east bank of the West Waterway against slope failure during the design earthquake.
DETAILING
Careful attention was given to detailing required to achieve the desired level of seismic performance in order to ensure the ability of the structure to form the plastic hinges in the assumed locations and to sustain the inelastic rotations required without loss of stability. Points of particular concern were the connection of piles into the footings, footing reinforcing, confinement reinforcing in the columns, splicing of the longitudinal reinforcing in the columns, and cap beam and superstructure reinforcing required to force the plastic hinges into the columns.
Piles were extended into the footing 76 cm (30 in.) for concrete piles and 122 cm (48 in.) for steel piles. A mild steel reinforcing cage was extended an additional 152 cm (60 in.) beyond the end of the pile. The bottom layer of reinforcing was placed between piles and a top mat of reinforcing and a face mat on footing sides was used to completely knit together the footing block. Exterior piles were provided with "hairpin" reinforcing to prevent the cracking out of a corner of the footing by pile moment.
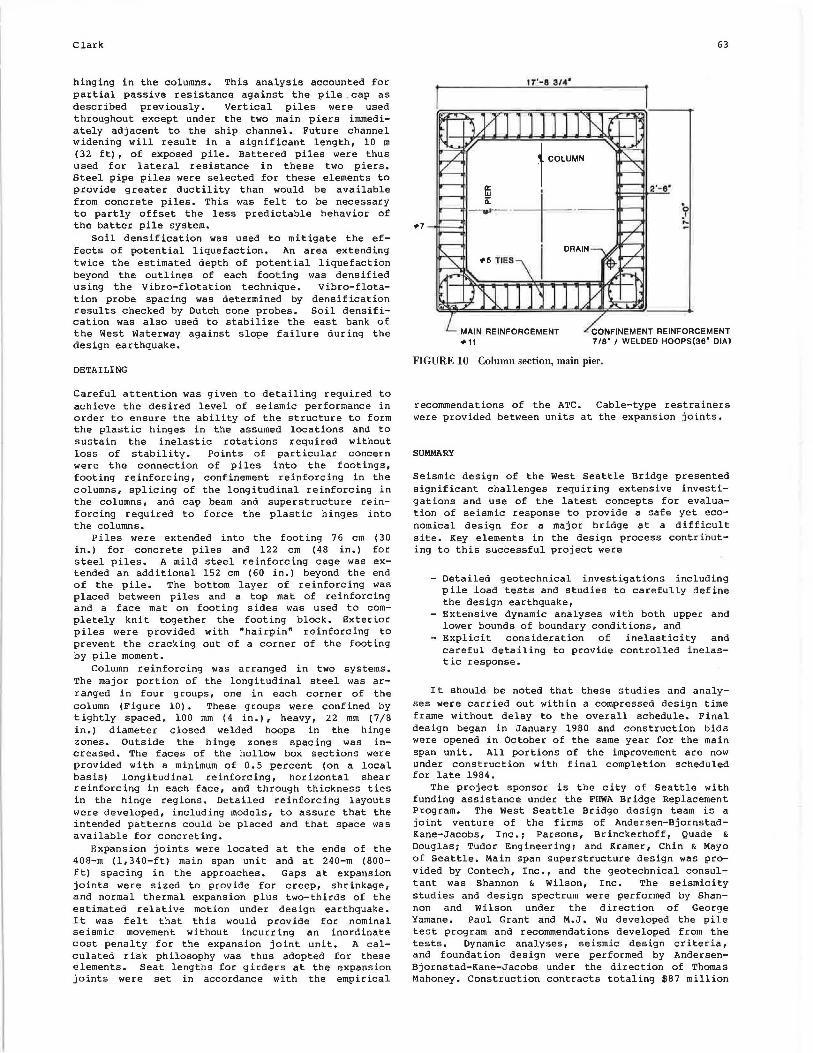
Column reinforcing was arranged in two systems. The major portion of the longitudinal steel was arranged in four groups, one in each corner of the column (Figure 10). These groups were confined by tightly spaced, 100 mm (4 in.), heavy, 22 mm (7/8 in.) diameter closed welded hoops in the hinge zones. Outside the hinge zones spacing was increased. The faces of the hollow box sections were provided with a minimum of 0.5 percent (on a local basis) longitudinal reinforcing, horizontal shear reinforcing in each face, and through thickness ties in the hinge reg ions. Detailed reinforcing layouts were developed, including models, to assure that the intended patterns could be placed and that space was available for concreting.
Expansion joints were located at the ends of the 408-m (1,340-ft) main span unit and at 240-m (800-ft) spacing in the approaches. Gaps at expansion joints were sized to provide for creep, shrinkage, and normal thermal expansion plus two-thirds of the estimated relative motion under design earthquake. It was felt that this would provide for nominal seismic movement without incurring an inordinate cost penalty for the expansion joint unit. A calculated risk philosophy was thus adopted for these elements. Seat lengths for girders at the expansion joints were set in accordance with the empirical
1 T'-8 314"
63
2'- 6"
0 I
;...
CONFINEMENT REINFORCEMENT T/8' I WELDED HOOPS(36' DIA)
FIGURE 10 Column section, main pier.
recommendations of the ATC. Cable-type restrainers were provided between units at the expansion joints.
SUMMARY
Seismic design of the West Seattle Bridge presented significant challenges requiring extensive investigations and use of the latest concepts for evaluation of seismic response to provide a safe yet economical design for a major bridge at a difficult site. Key elements in the design process contributing to this successful project were
- Detailed geotechnical investigations including pile load tests and studies to carefully define the design earthquake,
- Extensive dynamic analyses with both upper and lower bounds of boundary conditions, and
- Explicit consideration of inelasticity and careful detailing to provide controlled inelastic response.
It should be noted that these studies and analyses were carried out within a compressed design time frame without delay to the overall schedule. Final design began in January 1980 and construction bids were opened in October of the same year for the main span unit. All portions of the improvement are now under construction with final completion scheduled for late 1984.
The project sponsor is the city of Seattle with funding assistance under the FHWA Bridge Replacement Program. The West Seattle Bridge design team is a joint venture of the firms of Andersen-BjornstadKane-Jacobs, Inc.; Parsons, Brinckerhoff, Quade &
Douglas; Tudor Engineering; and Kramer, Chin & Mayo of Seattle. Main span superstructure design was provided by Contech, Inc., and the geotechnical consultant was Shannon & Wilson, Inc. The seismicity studies and design spectrum were performed by Shannon and Wilson under the direction of George Yamane. Paul Grant and M.J. Wu developed the pile test program and recommendations developed from the tests. Dynamic analyses, seismic design criteria, and foundation design were performed by AndersenBjornstad-Kane-Jacobs under the direction of Thomas Mahoney. Construction contracts totaling $87 million
64
have been awarded to Kiewit-Grice and Moseman Construction.
It is estimated that the cost impact of the more refined seismic design is limited almost entirely to a small increase in design effort. This additional design effort is a small price to pay for the increased ability of this major structure to survive a major seismic event.
REFERENCES
1. S.T. Algermissen and S.T. Harding. The Puget Sound Earthquake of Apr i1 29, 1965. Preliminary Seismological Report. u.s. Coast and Geodetic Survey, Washington, D.C., 1965.
2. N .M. Newmark and W .J. Hall. Earthquake Spectra and Design Engineering. Earthquake Engineering Research Institute, Berkeley, Calif., 1982.
3. Highway Bridge Design Brief. MWD Publication CDP 7-02/D. New Zealand Ministry of Works and Development, Wellington, 1978.
Transportation Research Record 982
4. Seismic Design Guidelines for Highway Bridges. ATC-6. Applied Technology Council, Berkeley, Calif., 1981.
5. H.E. Chapman. An Overview of the State of Practice in Earthquake Resistant Design of Bridges in New Zealand. Proc., Workshop on Earthquake Resistance of Highway Bridges, Report ATC-6-1, Applied Technology Council, Palo Alto, Calif., 1979.
6. A.S. Veletsos and N.M. Newmark. Effect of Inelastic Behavior on the Response of Simple Systems to Earthquake Motions. Proc., Second World Conference on Earthquake Engineering, Tokyo and Kyoto, Japan, 1960.
7. R. Park and T. Paulay. Reinforced Concrete Structures. Wiley, New York, 1975.
Publication of this paper sponsored by Committee on Dynamics and Field Testing of Bridges.
Prestressed Concrete Highway Bridges 1n the Federal Republic of Germany-
Construction Methods and Experiences KURT RAHLWES
ABSTRACT
Approximately 63 percent of all bridge surf aces on federal highways in the Federal Republic of Germany consist of prestressed concrete built since 1950. In a short period of time a large volume of work has been accomplished using a new method of construction. Most of the structures meet fully all serviceability, durability, and functional standards with an acceptable maintenance outlay. A few negative experiences could, however, not be avoided. Their causes were faults in design and construction, as well as weak points in the technical regulations, which formed the basis for the design. This report describes the construction principles used in prestressed road bridges, the faults and damage that occurred, and the measures taken to avoid them.
In 1980 approximately 30 percent of the 27,000 bridges in the federal highway and freeway system of west Germany were prestressed concrete bridges <1>·
This constitutes about 63 percent of the total bridge surface area. Almost all of these prestressed concrete bridges have been built since 1950.
TENDER AND BIDDING PROCEDURE
The client, generally a government agency, works out a design that comprises the technical boundary conditions. The required services and quantities are established on the basis of a preliminary analysis. When the contract is awarded, the contractor, in addition to the actual construction, has to supply and take responsibility for the final structural analysis and the shop drawings. All design documents are checked to the last digit and approved by a federally licensed independent engineer. Construction is continuously supervised by staff of the transportation department. Payment is generally based on unit prices.
In addition to bidding on the original design, the contractor generally has the option of submitting an alternative design. He is responsible for submitting complete and binding quantities and services with the design. When a contract is awarded for a design, payments are made based on unit prices and required material quantities but only up to the total sum submitted in the bid. Approximately 75