foundation of california state university, monterey bay · overall presentation of the financial...
TRANSCRIPT

Foundation of California State University, Monterey Bay
Annual Report
For the Years Ended
Junes 30, 2018 and 2017

Foundation of California State University, Monterey Bay Annual Report
For the Years Ended Junes 30, 2018 and 2017
Table of Contents
Page • Independent Auditors’ Report 1 – 3 • Management’s Discussion and Analysis 4 – 11 • Financial Statements for the Years ended Junes 30, 2018 and 2017
♦ Statements of Net Position 13 ♦ Statements of Revenues, Expenses and Changes in Net Position 14 ♦ Statements of Cash Flows 15 – 16 ♦ Notes to Financial Statements 17 – 30
• Supplemental Information 32 – 40
• Independent Auditors’ Report On Internal Control Over Financial
Reporting and on Compliance and Other Matters Based on an Audit of Financial Statements Performed in Accordance With Government Auditing Standards 41 – 42
(i)

G GLENN BURDET TE CERTIFIED P U BLI C ACCOUNTANTS
Independent Auditors' Report
Board of Directors
Foundation of California State University, Monterey Bay
Seaside, California
Report on the Financial Statements We have audited the accompanying statements of net position of Foundation of California State University,
Monterey Bay (the Foundation), a component unit of California State University, Monterey Bay, as of June 30,
2018 and 2017, and the related statements of revenues, expenses, and changes in net position and cash flows
for the years then ended, and the related notes to the financial statements, which collectively comprise the
Foundation's basic financial statements as listed in the table of contents.
Management's Responsibility for the Financial Statements Management is responsible for the preparation and fair presentation of these financial statements in accordance
with accounting principles generally accepted in the United States of America; this includes the design,
implementation, and maintenance of internal control relevant to the preparation and fair presentation· of
financial statements that are free from material misstatement, whether due to fraud or error.
Auditor's Responsibility Our responsibility is to express an opinion on these financial statements based on our audits. We conducted
our audits in accordance with auditing standards generally accepted in the United States of America and the
standards applicable to financial audits contained in Government Auditing Standards, issued by the
Comptroller General of the United States. Those standards require that we plan and perform the audits to
obtain reasonable assurance about whether the financial statements are free of material misstatement.
An audit involves performing procedures to obtain audit evidence about the amounts and disclosures in the
financial statements. The procedures selected depend on the auditor's judgment, including the assessment of
the risks of material misstatement of the financial statements, whether due to fraud or error. In making those
risk assessments, the auditor considers internal control relevant to the entity' s preparation and fair presentation
of the financial statements in order to design audit procedures that are appropriate in the circumstances, but
not for the purpose of expressing an opinion on the effectiveness of the entity' s internal control. Accordingly,
we express no such opinion. An audit also includes evaluating the appropriateness of accounting policies used
and the reasonableness of significant accounting estimates made by management, as well as evaluating the
overall presentation of the financial statements.
GLENN BURDETTE.COM
SAN LUIS OBISPO 1150 Palm Street
San Luis Obispo, CA 93401
p 805 544 1441
J 805 544 4351
PASO ROBLES
102 South Vine Street, Ste. A
Paso Robles, CA 93446
p 805 23? 3995
f 805 239 9332
SANTA MARIA
2222 South Broadwa~. Ste. A
Santa Maria, CA 93454
p 805 922 4010
f 805 922 4286

2
Board of Directors Foundation of California State University, Monterey Bay Seaside, California Page 2 We believe that the audit evidence we have obtained is sufficient and appropriate to provide a basis for our audit opinion. Opinions In our opinion, the financial statements referred to above present fairly, in all material respects, the financial position of Foundation of California State University, Monterey Bay as of June 30, 2018 and 2017, and the changes in financial position and cash flows for the years then ended in accordance with accounting principles generally accepted in the United States of America. Other Matters Required Supplementary Information Accounting principles generally accepted in the United States of America require that the Management’s Discussion and Analysis on pages 4 through 11 be presented to supplement the basic financial statements. Such information, although not a basic part of the financial statements, is required by the Government Accounting Standards Board, who considers it to be an essential part of financial reporting for placing the basic financial statements in an appropriate operational, economic, or historical context. We have applied certain limited procedures to the required supplementary information in accordance with auditing standards generally accepted in the United States of America, which consisted of inquiries of management about the methods of preparing the information and comparing the information for consistency with management’s responses to our inquiries, the basic financial statements, and other knowledge we obtained during our audit of the basic financial statements. We do not express an opinion or provide any assurance on the information because the limited procedures do not provide us with sufficient evidence to express an opinion or provide any assurance. Other Information Our audit was conducted for the purpose of forming an opinion on the financial statements that collectively comprise the Foundation of California State University, Monterey Bay’s basic financial statements. The accompanying supplementary information for inclusion in the financial statements of the California State University on pages 32 through 40 is presented for purposes of additional analysis as required by the California State University and is not a required part of the basic financial statements. The supplementary information is the responsibility of management and was derived from and relates directly to the underlying accounting and other records used to prepare the basic financial statements. Such information has been subjected to the auditing procedures applied in the audit of the basic financial statements and certain additional procedures, including comparing and reconciling such information directly to the underlying accounting and other records used to prepare the basic financial statements or to the basic financial statements themselves, and other additional procedures in accordance with auditing standards generally accepted in the United States of America. In our opinion, the supplementary information is fairly stated in all material respects in relation to the basic financial statements taken as a whole.

3
Board of Directors Foundation of California State University, Monterey Bay Seaside, California Page 3 Other Reporting Required by Government Auditing Standards In accordance with Government Auditing Standards, we have also issued our report dated September 11, 2018, on our consideration of the Foundation of California State University, Monterey Bay’s internal control over financial reporting and on our tests of its compliance with certain provisions of laws, regulations, contracts, and grant agreements and other matters. The purpose of that report is to describe the scope of our testing of internal control over financial reporting and compliance and the results of that testing, and not to provide an opinion on internal control over financial reporting or on compliance. That report is an integral part of an audit performed in accordance with Government Auditing Standards in considering the Foundation of California State University, Monterey Bay’s internal control over financial reporting and compliance.
Glenn Burdette Attest Corporation San Luis Obispo, California September 11, 2018
4
Foundation of California State University, Monterey Bay Management’s Discussion and Analysis
June 30, 2018 and 2017
The Foundation of California State University, Monterey Bay (Foundation) is an auxiliary in good standing of California State University, Monterey Bay (CSUMB or University). The Foundation is an IRC Section 501(c)(3) not-for-profit public benefit corporation and its primary objective is to support the University. The Foundation provides support for the advancement of education and fosters, encourages and promotes the scientific, literary, educational and charitable activities of the University. In addition, it administers scholarships and endowments and manages the endowment investments.
Foundation management believes that having this separate philanthropic organization will
elevate the level of interest in University fundraising in the community, improve the University’s ability to raise funds for scholarships and endowments, streamline the accounting process, and simplify investment tracking and reporting for all vested parties.
As management of the Foundation, we offer readers of these financial statements this narrative
overview and analysis of the financial activities of the Foundation for the fiscal years ended June 30, 2018 and 2017. We encourage readers to read the information presented here in conjunction with additional information that we have provided in the Foundation’s financial statements, which follow this narrative. The Foundation’s financial statements are presented here and are incorporated in the University’s financial statements as a component unit.
Financial Highlights
• At June 30, 2018, the Foundation’s total net position increased by 8.6 percent or $2.0 million from
$23.5 million to $25.5 million. • Total operating revenues decreased by 37.3 percent or $16,000 from $43,000 to $27,000. • Total operating expenses increased by 265.8 percent or $787,000 from $296,000 to $1.1 million. • Scholarship expenses increased by 367.4 percent or $751,000 from $205,000 to $956,000. • Gifts and donations, noncapital, decreased by 25.8 percent or $156,000 from $603,000 to
$447,000. • Realized and unrealized gains on investments decreased by $875,000 or 54.2 percent from a $1.6
million gain to a $739,000 gain. • Additions to permanent endowments decreased by 62.0 percent or $468,000 from $754,000 to
$286,000. • Interagency transfer for scholarships increased in 2017/18 to $491,000 as a result of the transfer
of scholarship funds from the Corporation, leaving the majority of the endowment payout now in the Foundation.

5
Foundation of California State University, Monterey Bay Management’s Discussion and Analysis
June 30, 2018 and 2017
Overview of the Financial Statements This annual report consists of a series of financial statements. The Statements of Net Position,
Statements of Revenues, Expenses and Changes in Net Position and Statements of Cash Flow (on pages 13 through 16) all provide information about the Foundation’s activities and present a long-term view of its finances.
These statements are prepared using the accrual basis of accounting which recognizes
expenses when incurred and revenue when earned rather than when payment is made or received and is widely used by most private sector companies. They also report the Foundation’s net position and change in net position. You can think of the Foundation’s net position – the difference between assets (plus deferred outflows of resources) and liabilities (plus deferred inflows of resources) – as one way to measure the Foundation’s financial health, or fiscal position. Over time, increases or decreases in the Foundation’s net position are one indicator of whether its financial health is improving or declining.
Condensed Comparative Financial Information
Net position in 2017/18 increased by 8.6 percent or $2.0 million, primarily as a result of a net
transfer of scholarship assets from the University Corporation (Corporation). In fiscal year 2016/17, net position increased by $2.9 million or 14.1 percent over 2015/16. This increase was due to additions to permanent endowments and favorable market returns.
The accompanying audited financial statements as of and for the years ended June 30, 2018
and 2017 are reported in accordance with standards and requirements of the GASB as are the following schedules.

6
Foundation of California State University, Monterey Bay Management’s Discussion and Analysis
June 30, 2018 and 2017
Table 1: Condensed Summary of Net Position as of June 30, 2018, 2017, and 2016
2018 2017 2016Assets
Current assets $ 1,646,697 $ 677,183 $ 455,412 Noncurrent assets:
Endowment investments 23,700,881 22,838,274 20,216,033Other noncurrent assets 400,439 29,454 6,037
Total Assets 25,748,017 23,544,911 20,677,482
LiabilitiesCurrent liabilities 214,516 39,179 82,949
Total Liabilities 214,516 39,179 82,949
Net PositionRestricted for:
Nonexpendable – endowments 13,877,334 13,590,960 12,716,806Expendable 11,645,374 9,909,110 7,872,197
Unrestricted 10,793 5,662 5,530Total Net Position $ 25,533,501 $ 23,505,732 $ 20,594,533
Assets
Current assets, or assets that can normally be converted to cash in less than one year, consist
of Cash and cash equivalents, Receivables, Pledges receivable, net, and Prepaid expenses and other assets. In 2017/18, most Current assets increased due to the Special Item transfer of scholarship funds from the Corporation.
Cash and cash equivalents increased in 2017/18 by 235.6 percent or $1.0 million from
$425,000 to $1.4 million. In 2016/17, Cash and cash equivalents increased by $11,000 or a 2.7 percent increase and was composed of only alumni and unrestricted funds.
In 2017/18, Receivables decreased 29.7 percent or $75,000 from $252,000 to $177,000. This
net decrease is a result of the absence of a contribution last made in 2016/17 and is being supplanted by another donor contribution of a significantly lesser amount. In 2016/17, Receivables increased by $210,000 or 503.1 percent to $252,000 from $42,000 due to a significant contribution received through the Corporation.
Pledges receivable, net increased in 2017/18 by 100.0 percent or $44,000. All Pledges
receivable are designated towards immediate use scholarships.

7
Foundation of California State University, Monterey Bay Management’s Discussion and Analysis
June 30, 2018 and 2017
Noncurrent assets consist of Restricted cash and cash equivalents, Pledges receivable, net, and Endowment investments.
Restricted cash and cash equivalents consist of cash and money market balances associated
with endowments. In 2017/18, Restricted cash and cash equivalents increased to $372,000 from $29,000 for a $343,000 or 1,161.8 percent change. This was mostly due to investments being liquidated to fund the endowment payout made in June 2018. The remainder of the proceeds from the sale of investments, the cash balance in a term endowment, and an endowment contribution received days before June 30, 2018, make up the change. In 2016/17, Restricted cash and cash equivalents increased by $23,000 or 387.9 percent from $6,000 to $29,000 as a result of an endowment contribution received just before June 30, 2017 being invested in July 2017.
In 2017/18, Pledges receivable, net increased by $29,000 or 100.0 percent due to the Special
Item transfer of scholarship funds from the Corporation.
Liabilities Current liabilities, amounts owed within one year, consist of Accounts payable, Payable to
Corporation, and Due to University.
In 2017/18, Accounts payable increased to $8,000 from $1,000 for a $7,000 or 589.5 percent increase as a result of procurement card expenses incurred in June 2018. Accounts payable in 2016/17 increased by $300 or 37.0 percent from $800 to $1,000 as a result of sales and use tax due and payable in July 2017.
The Payable to Corporation increased in 2017/18 from $24,000 to $195,000 for a 708.7
percent or $171,000 increase. The change is mostly due to the endowment payout to program support funds held in the Corporation. Payable to Corporation in 2016/17 increased to $24,000 from $6,000 for an $18,000 or 326.6 percent increase. This was primarily due to deposits received by the Foundation for the Corporation in June 2017.
Results of Operations
In fiscal year 2017/18, the Foundation’s net position increased by 8.6 percent or $2.0 million
mostly as a result of the Special Item transfer of scholarships from Corporation of $1.4 million, $774,000 in investment income, $739,000 of investment appreciation, $734,000 in contributions to scholarships and endowments, offset by $1.2 million in net operating loss and contributions to both the University and the Corporation totaling $379,000.

8
Foundation of California State University, Monterey Bay Management’s Discussion and Analysis
June 30, 2018 and 2017
Table 2: Condensed Summary of Changes in Net Position for Years Ended June 30, 2018, 2017, and 2016
2018 2017 2016
Operating RevenuesSales and services of auxiliary enterprises 9,432$ 37,063$ 17,060$ Other operating revenues 17,485 5,863 4,990
Total Operating Revenues 26,917 42,926 22,050
Operating ExpensesSalaries and benefits - - 457 Scholarships 955,925 204,500 245,500 Other operating expenses 126,495 91,409 104,905
Total Operating Expenses 1,082,420 295,909 350,862
Operating Loss (1,055,503) (252,983) (328,812)
Nonoperating Revenues (Expenses)Gifts and donations, noncapital 447,209 602,581 539,126 Endowment distribution to Corporation (645,417) (672,022) (693,315) Other nonoperating revenues 1,646,728 2,479,670 83,338
Total Nonoperating Revenues (Expenses) 1,448,520 2,410,229 (70,851)
Other Changes in Net PositionCapital grants and gifts (21,943) - - Special Item-transfer of net assets from Corporation 1,370,320 - - Additions to permanent endowments 286,375 753,953 1,830,023
Total Other Changes in Net Position 1,634,752 753,953 1,830,023
Increase in Net Position 2,027,769 2,911,199 1,430,360
Net PositionNet position — beginning of year 23,505,732 20,594,533 19,164,173
Net position — end of year 25,533,501$ 23,505,732$ 20,594,533$

9
Foundation of California State University, Monterey Bay Management’s Discussion and Analysis
June 30, 2018 and 2017
Operating revenues consist of Sales and services of auxiliary enterprises and Other operating revenues.
Sales and services of auxiliary in 2017/18 decreased 74.6 percent or $28,000 from $37,000 to
$9,000 as a result of the transfer of alumni funds to the Corporation. In 2016/17, Sales and services of auxiliary enterprises increased $20,000 or 117.3 percent to $37,000 from $17,000. The increase was due to improving event and merchandise sales by the Alumni Association.
In 2017/18, Other operating revenues increased from $6,000 to $17,000 for a 198.2 percent
or $11,000 change. The increase in commencement sales, along with the change in vendors are responsible for this change. Other operating revenues in 2016/17 increased by 17.5 percent or $1,000 from $5,000 to $6,000 due to the increase in commencement sales.
Operating expenses consist of Supplies and services, Travel, Scholarships, Insurance, and
Other operating expenses. In 2017/18, Scholarships increased 367.4 percent or $751,000 from $205,000 to $956,000 due
to the transfer of all scholarship funds from the Corporation. Scholarships decreased from $246,000 in 2015/16 to $205,000 in 2016/17. This 16.7 percent or $41,000 decrease was a result of fewer scholarship recipients in the Imagine College and RISE programs.
Other operating expenses in 2017/18 increased to $75,000 from $38,000 for a $37,000 or 96.3
percent change. This is mostly due to costs associated with a campus-wide strategic initiative to update the vision statement. Other operating expenses decreased in 2016/17 by 12.9 percent or $14,000 from $105,000 to $91,000. This was mainly due to the Alumni Association having fewer mixers and events and spending less on promotional items.
Nonoperating revenues (expenses) consist of Gifts and donations - noncapital, Endowment
distribution, Interagency transfer for scholarships, Contribution from Corporation, University Support, noncapital, Investment income, and Realized and unrealized gains and losses on investments.
Gifts and donations, noncapital decreased from $603,000 to $447,000 for a $155,000 or 25.8
percent decrease. This decrease was mostly a result of an increase in scholarships of $326,000 which was offset by a substantial decrease in contributions to term and quasi endowments of $463,000. In 2016/17, Gifts and donations, noncapital increased to $603,000 from $539,000 for an 11.8 percent change or $63,000 increase. The net increase was primarily the result of increased contributions to two large programs offset with a decrease in another.

10
Foundation of California State University, Monterey Bay Management’s Discussion and Analysis
June 30, 2018 and 2017
Interagency transfer for scholarships increased in 2017/18 to $491,000 as a result of the transfer of scholarship funds from the Corporation, leaving the majority of the endowment payout now in the Foundation instead of going to the Corporation as in the past.
In 2017/18, the Contribution from/to Corporation increased 1,070.8 percent or $284,000. This
increase is a result of the transfer of non-scholarship funds from the Foundation to the Corporation. Contribution from/to Corporation in 2016/17 changed minimally from $20,000 to $27,000.
Investment income in 2017/18 decreased to $774,000 from $939,000 for 17.6 percent or
$165,000 change as a result of a reallocation of assets. In 2016/17, Investment income increased from $639,000 to $939,000 for a 47.0 percent or $300,000 change as a result of an expanding endowment portfolio.
Realized and unrealized gains declined in 2017/18 from $1.6 million to $739,000 for a 54.2 percent or $875,000 decrease as a result of a change in the asset allocation and downturn in the market. In 2016/17, the Foundation recognized $1.6 million in realized and unrealized gains, a $2.1 million or 428.0 percent improvement over the $492,000 in losses in 2015/16, and was a result of favorable market conditions.
Other Changes in Net Position
Additions to permanent endowments decreased in 2017/18 to $286,000 from $754,00 for a
62.0 percent or $468,000 change. This is due to the creation of one endowment in 2017/18 versus three in 2016/17 and fewer contributions to corpus. In 2016/17, additions to permanent endowments totaled $754,000. Contributions included gifts for the creation of three new endowments and contributions towards existing funds.
In 2017/18, a Transfer of assets from the Corporation of $1.4 million was made in order to
move all scholarships funds to the Foundation.
Currently Known Facts, Decisions and Conditions The Foundation’s management believes the following will impact future reporting periods:
Market Conditions Endowment investments account for 92.0 percent of the Foundation’s total assets. The
Foundation manages its investments via its Investment Committee, which works in conjunction with the investment consultant, Verus Investments. It is important to remember that the majority of the Foundation’s investments participate in a long-term investment strategy and that there is a smoothing effect of returns over time. Future investment earnings will continue to fluctuate and be affected by interest rate fluctuations and uncertain market conditions.

11
Foundation of California State University, Monterey Bay Management’s Discussion and Analysis
June 30, 2018 and 2017
Requests for Information
This report is designed to provide an overview of the Foundation’s finances for those with an interest in this area. Questions concerning any of the information found in this report or requests for additional information should be directed to:
Controller
University Corporation at Monterey Bay 100 Campus Center
Building 201, Suite 101B Seaside, CA 93955

12
Foundation of California State University, Monterey Bay Financial Statements
For the Years Ended June 30, 2018 and 2017

13
Foundation of California State University, Monterey Bay Statements of Net Position
June 30, 2018 and 2017
2018 2017
Current Assets:Cash and cash equivalents 1,426,013$ 424,912$ Receivables:
Corporation 31,138 251,717 University 6,926 - Other 138,970 -
Pledges receivable, net 43,650 - Prepaid expenses and other assets - 554
Total Current Assets 1,646,697 677,183
Noncurrent Assets:Restricted cash and cash equivalents 371,661 29,454 Pledges receivable, net 28,778 - Endowment investments 23,700,881 22,838,274
Total Noncurrent Assets 24,101,320 22,867,728 Total Assets 25,748,017 23,544,911
Current Liabilities:Accounts payable 7,612 1,104 Payable to Corporation 194,693 24,075 Due to University 12,211 14,000
Total Current Liabilities 214,516 39,179 Total Liabilities 214,516 39,179
Net Position:Restricted for:
Nonexpendable - endowments 13,877,334 13,590,960 Expendable:
Pledges receivable 72,428 - Scholarships 6,918,365 5,240,673 Other 4,654,581 4,668,437
Unrestricted 10,793 5,662 Total Net Position 25,533,501$ 23,505,732$
Assets
Liabilities
Net Position
The accompanying notes are an integral part of these financial statements.
14
Foundation of California State University, Monterey Bay Statements of Revenues, Expenses and Changes in Net Position
Years Ended June 30, 2018 and 2017
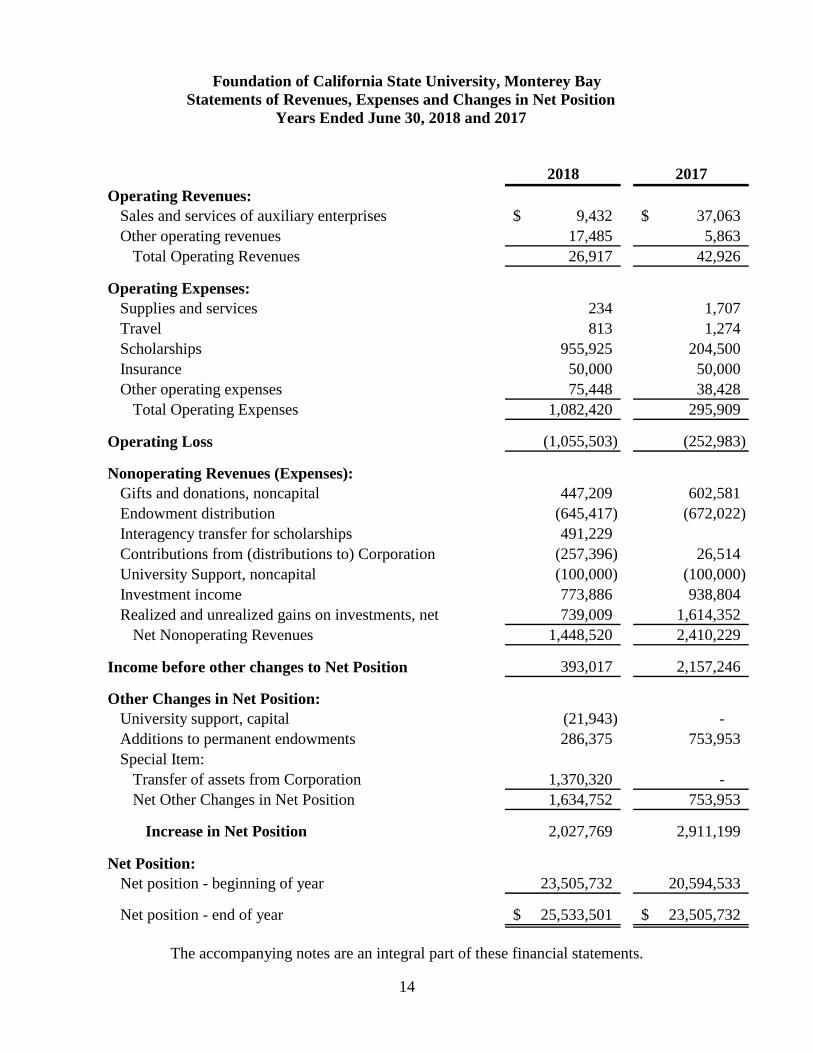
2018 2017Operating Revenues:
Sales and services of auxiliary enterprises 9,432$ 37,063$ Other operating revenues 17,485 5,863
Total Operating Revenues 26,917 42,926
Operating Expenses:Supplies and services 234 1,707 Travel 813 1,274 Scholarships 955,925 204,500 Insurance 50,000 50,000 Other operating expenses 75,448 38,428
Total Operating Expenses 1,082,420 295,909
Operating Loss (1,055,503) (252,983)
Nonoperating Revenues (Expenses):Gifts and donations, noncapital 447,209 602,581 Endowment distribution (645,417) (672,022) Interagency transfer for scholarships 491,229 Contributions from (distributions to) Corporation (257,396) 26,514 University Support, noncapital (100,000) (100,000) Investment income 773,886 938,804 Realized and unrealized gains on investments, net 739,009 1,614,352
Net Nonoperating Revenues 1,448,520 2,410,229
Income before other changes to Net Position 393,017 2,157,246
Other Changes in Net Position:University support, capital (21,943) - Additions to permanent endowments 286,375 753,953 Special Item:
Transfer of assets from Corporation 1,370,320 - Net Other Changes in Net Position 1,634,752 753,953
Increase in Net Position 2,027,769 2,911,199
Net Position:Net position - beginning of year 23,505,732 20,594,533
Net position - end of year 25,533,501$ 23,505,732$
The accompanying notes are an integral part of these financial statements.

15
Foundation of California State University, Monterey Bay Statements of Cash Flows
Years Ended June 30, 2018 and 2017
2018 2017Cash Flows from Operating Activities:
Receipts from sales and services of auxiliary enterprises 2,506$ 37,063$ Payments to vendors (178,539) (295,611) Payments/Receipts from Corporation, net 170,618 (191,551) Payments to University (823,714) (62,500) Other receipts 17,485 5,863 Other payments (74,894) (554)
Net Cash Used in Operating Activities (886,538) (507,290)
Cash Flows from Noncapital Financing Activities:Gifts and donations 595,360 602,581 Additions to permanent endowments 286,375 753,953 Endowment distribution to Corporation (645,417) (672,022) Interagency transfer for scholarships 491,229 - Contributions to University, noncapital (100,000) (100,000) Contributions from Corporation 973,954 26,514
Net Cash Provided by Noncapital Financing Activities 1,601,501 611,026
Cash Flows from Capital Related Financing Activities:Capital grants and gifts (21,943) -
Net Cash Used in Capital Related Financing Activities (21,943) -
Cash Flows from Investing Activities:Proceeds from sale of investments 1,677,009 888,395 Purchase of investments (1,800,607) (1,905,056) Investment income received 773,886 947,576
Net Cash Provided by (Used) in Investing Activities 650,288 (69,085)
Net Increase in Cash 1,343,308 34,651
Cash and Cash Equivalents - Beginning of year 454,366 419,715
Cash and Cash Equivalents - End of Year 1,797,674$ 454,366$
The accompanying notes are an integral part of these financial statements

16
Foundation of California State University, Monterey Bay Statements of Cash Flows (Continued) Years Ended June 30, 2018 and 2017
2018 2017Reconciliation of Cash and Cash Equivalents to
Statements of Net Position:Cash and cash equivalents 1,426,013$ 424,912$ Restricted cash and cash equivalents 371,661 29,454
Cash and Cash Equivalents - End of Year 1,797,674$ 454,366$
Reconciliation of Operating Loss to Net CashUsed by Operating Activities:
Operating loss (1,055,503)$ (252,983)$ Change in assets and liabilities:
Receivables (6,926) (209,983) Prepaid expenses and other assets 554 (554) Accounts payable 6,508 298 Payable to Corporation 170,618 18,432 Due to University (1,789) (62,500) Net Cash Used in Operating Activities (886,538)$ (507,290)$
Supplemental Schedule of Noncash Financing and Investing
Activities:Contributions of investments 32,266$ 7,571$ Increase in fair value of investments 739,009$ 1,614,352$ Transfer of investment assets from Corporation 1,370,320$ -$
The accompanying notes are an integral part of these financial statements

17
Foundation of California State University, Monterey Bay Notes to Financial Statements
June 30, 2018 and 2017
NOTE 1. SUMMARY OF SIGNIFICANT ACCOUNTING POLICIES Description of Reporting Entity The Foundation of California State University, Monterey Bay (Foundation), a nonprofit 501(c)(3) public benefit corporation, began operations in July 2010 to support the academic mission of the California State University, Monterey Bay (University). The Foundation is an auxiliary organization of the University and is presented in the University's financial statements as a component unit. The Foundation is governed by the Board of Directors, which is comprised of community members, the University President, a faculty member, an alumni member, and a student member. The activities administered by the Foundation include the following:
• Public relations and community outreach programs • Endowment management • Private giving • Fund development, including support for alumni programs • Fund management • Fundraising activities
Basis of Presentation – The Financial statements have been prepared using the economic resources measurement focus and the accrual basis of accounting in accordance with accounting principles generally accepted in the United States of America as prescribed by the Governmental Accounting Standards Board (GASB). Revenues are recorded when earned and expenses are recorded when a liability is incurred, regardless of the timing of related cash flows. Grants, gifts, and similar items are recognized as soon as all eligibility requirements have been met. Other Accounting Policies Cash and Cash Equivalents – Cash and cash equivalents include all highly liquid investments purchased with original maturities of three months or less. The Foundation considers all balances in demand deposit and money market accounts to be cash equivalents for the purposes of the Statements of Net Position and Statements of Cash Flows.

18
Foundation of California State University, Monterey Bay Notes to Financial Statements
June 30, 2018 and 2017
NOTE 1. SUMMARY OF SIGNIFICANT ACCOUNTING POLICIES (Continued) Investments – Investments are reported at fair value using quoted market prices and net book value at the financial statement date. Realized and unrealized gains and losses are included in the Statements of Revenues, Expenses and Changes in Net Position. Receivables – Receivables consist of monies due from the University Corporation at Monterey Bay (Corporation), the University, and a decedent donor’s trust. No allowance for doubtful accounts is calculated as management believes these receivables are collectible. Pledges Receivable – Pledges are unconditional promises to make future payments to the Foundation. Pledges receivable are recognized as gift revenue in the period pledged when all applicable eligibility requirements are met. Multi-year pledges are recorded at the discounted net present value of expected future cash flows shown net of the allowance for doubtful accounts of $2,240 at June 30, 2018. Conditional pledges which depend on the occurrence of a specified future or uncertain event are recognized as gift revenue when the conditions are substantially met. Endowments – Endowments are managed in a unitized investment pool. Investment earnings and related expenses are allocated based upon each individual endowment’s unit market value. Endowment investments include cash and money market funds. In January 2009, California adopted the Uniform Prudent Management of Institutional Funds Act (UPMIFA) and therefore the Foundation has the ability to spend from endowments that are underwater. Under UPMIFA, there is elimination of the “historic dollar value” rule and the Foundation may spend from these endowments as it determines is prudent after considering donor intent, the purpose of the fund and relevant economic factors. Also, there is broader investment freedom as long as decisions are made with regard to the overall resources of the institution and its charitable purpose. In April 2011, the Foundation Board approved a 70/30 hybrid spending policy. 70% of the spending rate is determined by last year’s spending adjusted for inflation as calculated by CPI (Consumer Price Index) as of December and the remaining 30% is determined by 4.5% of the average of the endowment’s market value for the last twelve quarters. This spending policy was used to determine the payout rate for the 2018/19 academic year, resulting in $645 thousand. For the 2017/18 academic year, the hybrid spending policy was used in the calculation and the resulting payout was $662 thousand. Endowment reserves (accumulated net appreciation) on true endowments totaling $4.8 million as of June 30, 2018, were included in restricted-expendable net position.

19
Foundation of California State University, Monterey Bay Notes to Financial Statements
June 30, 2018 and 2017
NOTE 1. SUMMARY OF SIGNIFICANT ACCOUNTING POLICIES (Continued) Net Position – The Foundation’s net position is required to be classified for accounting and reporting purposes into the following net position categories:
Net investment in capital assets includes capital assets, net of accumulated depreciation and amortization, and deferred outflows of resources, less the outstanding principal balances of debt attributable to the acquisition, construction, or improvement of those assets. The Foundation does not have any assets in this category. Restricted, nonexpendable consists of net position subject to externally imposed restrictions that they must be retained in perpetuity. Net position in this category consists of permanent endowments held by the Foundation. Restricted, expendable consists of net position subject to externally imposed restrictions that can be fulfilled by the actions of the Foundation pursuant to those restrictions or that expire by the passage of time. Unrestricted consists of all other categories of net position. Unrestricted may be designated for use by management of the Foundation. These designations limit the area of operations for which expenditures of net position may be made and require that unrestricted net position be used to support future operations in these areas.
The Foundation has adopted a policy of utilizing restricted–expendable funds, when available, prior to unrestricted funds. Classification of Current and Noncurrent Assets and Liabilities – The Foundation considers assets to be current that can reasonably be expected, as part of its normal business operations, to be converted to cash and be available for liquidation of current liabilities within twelve months of the Statements of Net Position date. Liabilities that can reasonably be expected, as part of normal business operations, to be liquidated within twelve months of the Statements of Net Position date are considered to be current. All other assets and liabilities are considered to be noncurrent. Classification of Revenues and Expenses – The Foundation considers operating revenues and expenses in the Statements of Revenues, Expenses and Changes in Net Position to be those revenues and expenses that result from exchange transactions or from other activities that are connected directly to the Foundation’s primary functions. Exchange transactions include charges for services rendered and the acquisition of goods and services.

20
Foundation of California State University, Monterey Bay Notes to Financial Statements
June 30, 2018 and 2017
NOTE 1. SUMMARY OF SIGNIFICANT ACCOUNTING POLICIES (Continued) In accordance with GASB Statement No. 35, certain significant revenues relied upon and budgeted for fundamental operational support of the core mission of the Foundation are mandated to be recorded as Nonoperating revenues. Nonoperating revenues and expenses include the Foundation’s net investment income, private gifts for other than capital purposes and endowment distributions to the Corporation. Capital gifts and additions to permanent endowments are classified as Other changes in net position. Use of Estimates – The preparation of financial statements in conformity with generally accepted accounting principles requires management to make estimates and assumptions that affect the reported amounts of assets and liabilities and disclosure of contingent liabilities as of the date of the financial statements and the reported amounts of revenues and expenses during the reporting period. Actual results could differ from those estimates. Reclassifications – Certain reclassifications have been made to the prior year financial statements to conform to the current year presentation. Fair Value Measurements – As defined in GASB Statement No. 72, Fair Value Measurement and Application, fair value is the price that would be received to sell an asset or paid to transfer a liability in an orderly transaction between market participants at the measurement date. The Foundation uses valuation techniques that are appropriate under the circumstances and for which sufficient data are available to measure fair value. Valuation techniques maximize the use of relevant observable inputs and minimize the use of unobservable inputs. GASB Statement No. 72 establishes a hierarchy of inputs to valuation techniques used to measure fair value. That hierarchy has three levels:
Level 1 – Quotes prices (unadjusted) in active markets for identical assets or liabilities; Level 2 – Observable inputs, other than Level 1 prices, for the asset or liability, either directly or indirectly; Level 3 – Unobservable inputs for the asset or liability.
For fiscal year ended June 30, 2018, the application of valuation techniques applied to the Foundation’s financial statements has been consistent.

21
Foundation of California State University, Monterey Bay Notes to Financial Statements
June 30, 2018 and 2017
NOTE 1. SUMMARY OF SIGNIFICANT ACCOUNTING POLICIES (Continued) Income Taxes – The Foundation is exempt from federal income tax under Section 501(c)(3) of the Internal Revenue Code. However, income from certain activities not directly related to the Foundation’s tax-exempt purpose is subject to taxation as unrelated business income. No liability for income taxes has been recorded since the amount is not expected to be significant. In addition, the Foundation qualifies for the charitable contribution deduction under Section 170(b)(1)(A)(iv) and has been classified as an organization that is not a private foundation under Section 509(a)(1). The Foundation follows accounting standards generally accepted in the United States of America, which requires, among other things, the recognition and measurement of tax positions based on a "more likely than not" (likelihood greater than 50%) approach. As of June 30, 2018, management has considered its tax positions and believes that the Organization did not maintain any tax positions that did not meet the "more likely than not" threshold. The Organization does not expect any material changes through June 30, 2019. However, tax returns remain subject to examination by the Internal Revenue Service for fiscal years ending on or after June 30, 2015, and by the California Franchise Tax Board for fiscal years ending on or after June 30, 2014. Recent Pronouncements – In November 2016, GASB issued Statement No. 83, Certain Asset Retirement Obligations. Statement No. 83 establishes criteria for determining the timing and pattern of recognition of a liability and a corresponding deferred outflow of resources for asset retirement obligations (AROs). An ARO is a legally enforceable liability associated with the retirement of a tangible capital asset. This Statement requires that recognition occur when the liability is both incurred and reasonably estimable. The provisions of Statement No. 83 are effective for fiscal years beginning after June 15, 2018. Management has not yet determined the impact of this Statement on its financial statements. In January 2017, GASB issued Statement No. 84, Fiduciary Activities. Statement No. 84 establishes criteria for identifying fiduciary activities of all state and local governments. Activities meeting the criteria should be reported in a fiduciary fund in the basic financial statements. This Statement also provides for recognition of a liability to the beneficiaries in a fiduciary fund when an event has occurred that compels the entity to disburse fiduciary resources. The provisions of Statement No. 84 are effective for fiscal years beginning after December 15, 2018. Management has not yet determined the impact of this Statement on its financial statements.
22
Foundation of California State University, Monterey Bay Notes to Financial Statements
June 30, 2018 and 2017
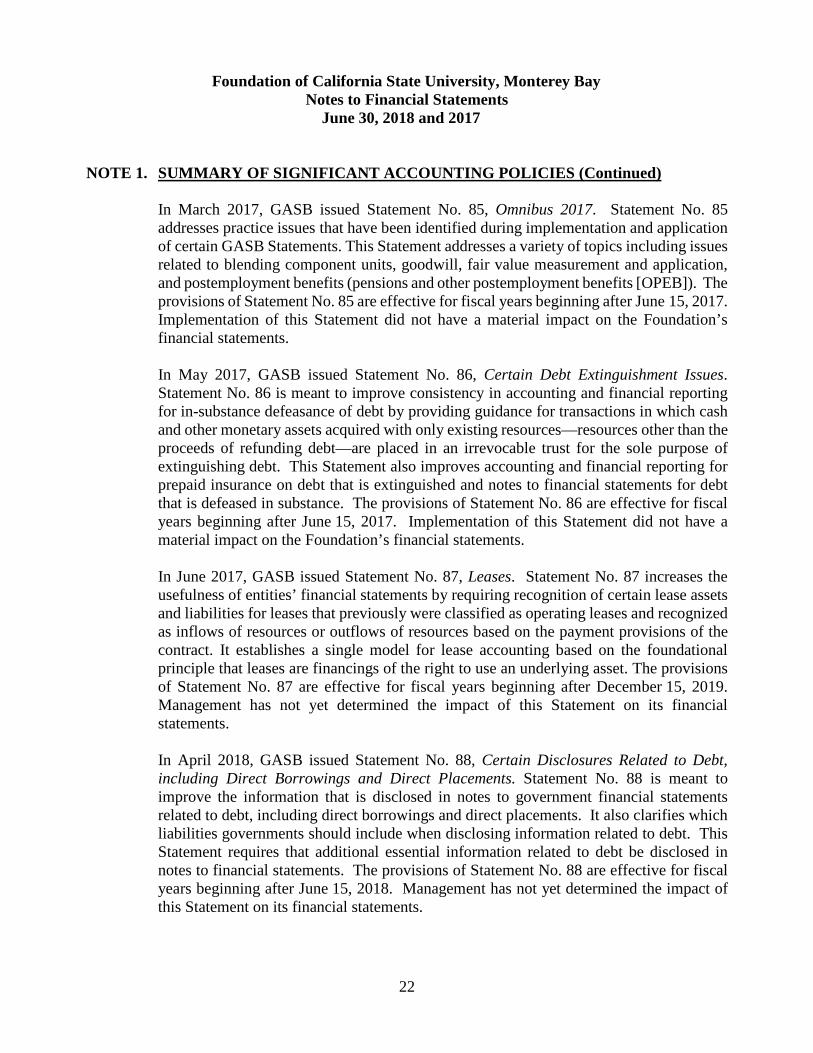
NOTE 1. SUMMARY OF SIGNIFICANT ACCOUNTING POLICIES (Continued) In March 2017, GASB issued Statement No. 85, Omnibus 2017. Statement No. 85 addresses practice issues that have been identified during implementation and application of certain GASB Statements. This Statement addresses a variety of topics including issues related to blending component units, goodwill, fair value measurement and application, and postemployment benefits (pensions and other postemployment benefits [OPEB]). The provisions of Statement No. 85 are effective for fiscal years beginning after June 15, 2017. Implementation of this Statement did not have a material impact on the Foundation’s financial statements. In May 2017, GASB issued Statement No. 86, Certain Debt Extinguishment Issues. Statement No. 86 is meant to improve consistency in accounting and financial reporting for in-substance defeasance of debt by providing guidance for transactions in which cash and other monetary assets acquired with only existing resources—resources other than the proceeds of refunding debt—are placed in an irrevocable trust for the sole purpose of extinguishing debt. This Statement also improves accounting and financial reporting for prepaid insurance on debt that is extinguished and notes to financial statements for debt that is defeased in substance. The provisions of Statement No. 86 are effective for fiscal years beginning after June 15, 2017. Implementation of this Statement did not have a material impact on the Foundation’s financial statements. In June 2017, GASB issued Statement No. 87, Leases. Statement No. 87 increases the usefulness of entities’ financial statements by requiring recognition of certain lease assets and liabilities for leases that previously were classified as operating leases and recognized as inflows of resources or outflows of resources based on the payment provisions of the contract. It establishes a single model for lease accounting based on the foundational principle that leases are financings of the right to use an underlying asset. The provisions of Statement No. 87 are effective for fiscal years beginning after December 15, 2019. Management has not yet determined the impact of this Statement on its financial statements. In April 2018, GASB issued Statement No. 88, Certain Disclosures Related to Debt, including Direct Borrowings and Direct Placements. Statement No. 88 is meant to improve the information that is disclosed in notes to government financial statements related to debt, including direct borrowings and direct placements. It also clarifies which liabilities governments should include when disclosing information related to debt. This Statement requires that additional essential information related to debt be disclosed in notes to financial statements. The provisions of Statement No. 88 are effective for fiscal years beginning after June 15, 2018. Management has not yet determined the impact of this Statement on its financial statements.
23
Foundation of California State University, Monterey Bay Notes to Financial Statements
June 30, 2018 and 2017
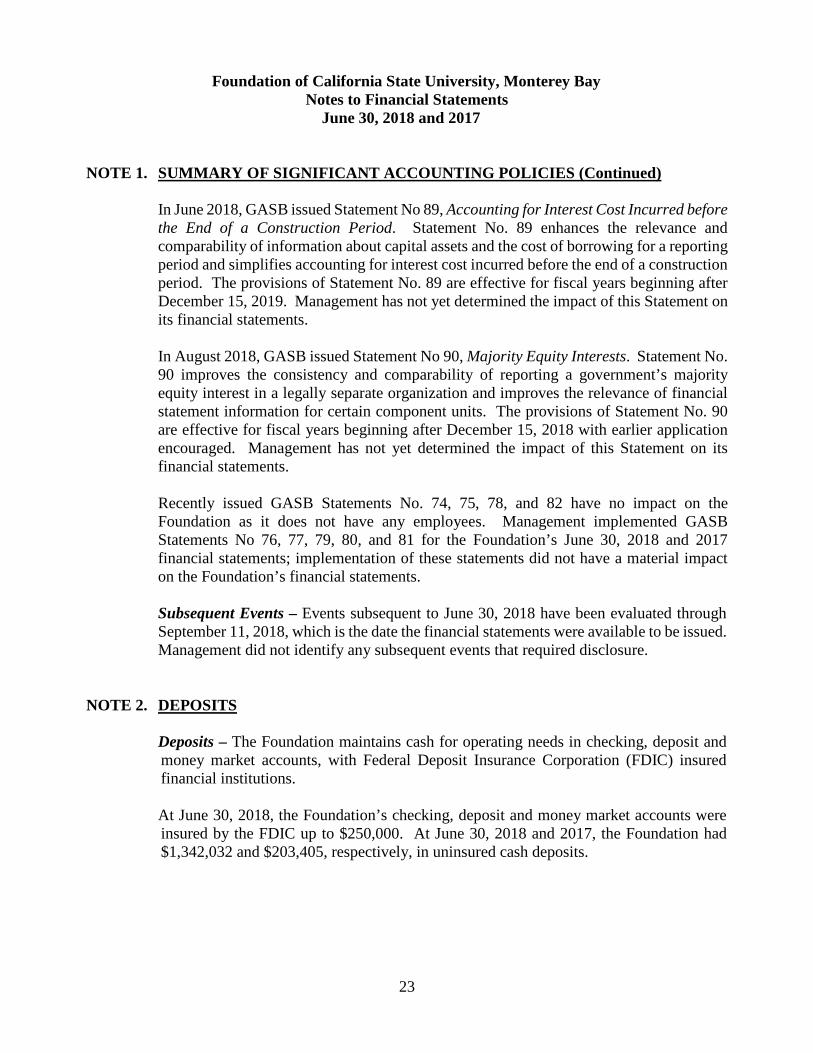
NOTE 1. SUMMARY OF SIGNIFICANT ACCOUNTING POLICIES (Continued) In June 2018, GASB issued Statement No 89, Accounting for Interest Cost Incurred before the End of a Construction Period. Statement No. 89 enhances the relevance and comparability of information about capital assets and the cost of borrowing for a reporting period and simplifies accounting for interest cost incurred before the end of a construction period. The provisions of Statement No. 89 are effective for fiscal years beginning after December 15, 2019. Management has not yet determined the impact of this Statement on its financial statements. In August 2018, GASB issued Statement No 90, Majority Equity Interests. Statement No. 90 improves the consistency and comparability of reporting a government’s majority equity interest in a legally separate organization and improves the relevance of financial statement information for certain component units. The provisions of Statement No. 90 are effective for fiscal years beginning after December 15, 2018 with earlier application encouraged. Management has not yet determined the impact of this Statement on its financial statements. Recently issued GASB Statements No. 74, 75, 78, and 82 have no impact on the Foundation as it does not have any employees. Management implemented GASB Statements No 76, 77, 79, 80, and 81 for the Foundation’s June 30, 2018 and 2017 financial statements; implementation of these statements did not have a material impact on the Foundation’s financial statements. Subsequent Events – Events subsequent to June 30, 2018 have been evaluated through September 11, 2018, which is the date the financial statements were available to be issued. Management did not identify any subsequent events that required disclosure.
NOTE 2. DEPOSITS Deposits – The Foundation maintains cash for operating needs in checking, deposit and money market accounts, with Federal Deposit Insurance Corporation (FDIC) insured financial institutions. At June 30, 2018, the Foundation’s checking, deposit and money market accounts were insured by the FDIC up to $250,000. At June 30, 2018 and 2017, the Foundation had $1,342,032 and $203,405, respectively, in uninsured cash deposits.

24
Foundation of California State University, Monterey Bay Notes to Financial Statements
June 30, 2018 and 2017
NOTE 3. INVESTMENTS Investments comprised the following at June 30, 2018 and 2017:
2018 2017Mutual Funds:
Equity Funds 13,037,880$ 12,900,232$ Bond Funds 5,575,800 5,588,556 Other Funds 2,916,809 3,316,331
Alternative Funds:ASB Real Estate 1,091,781 1,033,155
Private Assets:Private Credit Funds 1,078,611 -
Total * 23,700,881$ 22,838,274$
* Total excludes Money Market fund balance of $214,227 and $1,079 atJune 30, 2018 and 2017, respectively.
Investment Fair Values The Foundation categorizes its fair values measurements within the fair value hierarchy established by generally accepted accounting principles. At June 30, 2018 and 2017, the Foundation’s mutual funds were valued using quoted market prices in active markets and are all classified within Level 1 of the fair value hierarchy. At June 30, 2018 and 2017, the Foundation’s alternative funds and private assets were valued by the administrator of the fund using net book value to value the investments and are classified within Level 3 of the fair value hierarchy. For the year ended June 30, 2018, the table below sets forth a summary of changes in the fair value of the Foundation’s Level 3 investment:
Balance - beginning of year 1,033,155$ Purchases 1,051,276 Reinvested dividends 31,535 Unrealized gains relating to instruments held at the
reporting date 148,606 Distributions (79,383) Fees (14,797)
Balance - end of year 2,170,392$

25
Foundation of California State University, Monterey Bay Notes to Financial Statements
June 30, 2018 and 2017
NOTE 3. INVESTMENTS (Continued) Investment Policies The Foundation’s Board oversees the management of its investments and establishes investment policy. The Board has delegated to its Investment Committee the implementation of the investment policy. The Investment Committee establishes investment guidelines and selects investment managers. The Foundation prohibits investments that jeopardize the safety of principal concept or non-profit status of the Foundation. The Foundation has developed and implemented a socially responsible investing policy. The endowed portfolio is an investment pool in which a large number of individual endowments participate in order to benefit from diversification and economies of scale. The primary investment objective of the endowed investment portfolio is growth of principal sufficient to preserve purchasing power and to provide income to support current and future expenditures consistent with endowment restrictions. The long term goal is that the total return on the portfolio, net of investment and administration fees, should equal the rate of inflation, plus the payout rate which is used to support current activities. Investments authorized by the Investment Committee include high quality, readily marketable securities. The equity portion of the investments may include both domestic and international equities, including foreign currency denominated, common and preferred stocks and actively managed and passive (index) strategies. Overall, the investments are measured against the Standard & Poor’s 500, Russell 2500, MSCI Europe, Australasia, and Far East (EAFE), MSCI All County World Index (ACWI) ex US and MSCI Emerging Markets indices. The fixed income portion of the investments may include both domestic and international securities, along with common bond substitutes. Investment guidelines establish set ranges for the percentage of the total bond portfolio that can be invested in U.S. government, investment grade, non-investment grade and foreign bonds. The fixed income portfolio is measured against the Barclays Capital Aggregate Bond and JP Morgan EMBI Global Total Return. The Alternatives portion includes funds which seek to achieve a real rate of return in excess of U.S. inflation. These funds can be made up of a mixture of stocks, bonds and other assets such as commodities. The portfolio is measured against the NCREIF ODCE, HFRI Fund of Funds Index and the PIMCO Custom Benchmark (45% BC U.S. TIPS, 20% Bloomberg Commodity, 15% JPM ELMI + (Unhedged), 10% DJ U.S. Select REIT, 10% Bloomberg Gold Subindex).

26
Foundation of California State University, Monterey Bay Notes to Financial Statements
June 30, 2018 and 2017
NOTE 3. INVESTMENTS (Continued) Investment Risk Factors There are many factors that can affect the value of investments. Some, such as custodial credit risk, concentration of credit risk, and foreign currency risk may affect both the equity and fixed income securities. Equity securities respond to such investment behavioral factors as economic conditions, individual company earnings, performance and market liquidity, while fixed income securities are sensitive to credit risks and changes in interest rates. Equity securities held by the Foundation through mutual funds comprised $13,037,880 or 54.7 percent of the total investments of the Foundation. Equities are subject to both unsystematic and systematic risk. Unsystematic risk is the risk of a price change due to the unique circumstances of a specific security or group of related securities. The Foundation addresses unsystematic risk by investing in widely diversified equity mutual funds. Equity securities are also subject to systematic risk or market risk. Systematic risk recognizes that equity securities, as an asset class, can change in value as a result of such factors as inflation, exchange rates, political instability, war, economic conditions and interest rates. This type of risk is not specific to a particular company or industry and cannot be substantially mitigated by diversification. Credit Risk Fixed income securities are subject to credit risk, which is the chance that a bond issue will fail to pay interest or principal in a timely manner, or that negative perceptions of the issuer’s ability to make these payments will cause security prices to decline. The following schedule of credit risk profile of Foundation’s investments summarizes the fair value of the fixed income securities subject to credit risk. The Foundation maintains policies to manage credit risk which include requiring minimum credit ratings issued by nationally recognized statistical rating organizations, including Standard and Poor’s or Moody’s Investor Services, for certain investments. For investments in securities rated below investment grade, the Foundation and its investment advisor monitor the investments and fund manager to determine if the portfolio is managed according to the stated guidelines. A security’s tier can be established either by an independent rating organization or by a determination of the investment adviser. Money market fund shares and U.S. government securities are automatically considered Tier 1 securities.

27
Foundation of California State University, Monterey Bay Notes to Financial Statements
June 30, 2018 and 2017
NOTE 3. INVESTMENTS (Continued) The credit ratings of the Foundation’s fixed income securities held in investments and money market funds at June 30, 2018, are as follows:
Fair Value RatingBond Mutual Funds:
Met West Total Return Bond I 2,453,124$ (1)Dodge & Cox Income 2,470,407 (2)JP Morgan Emerging ETF 652,269 (3)
Money Market Fund:Schwab Government Money Fund 214,227 Not Rated
Total 5,790,027$
(1) Credit ratings range from AAA to below CCC with 96% at rating of BBB or above.(2) Credit ratings range from AAA to below Ba with 92% at a Baa rating or above.(3) Credit ratings range from AA to below B with 52% at a BBB rating or above.
Custodial Credit Risk Custodial risk is the risk that in the event of the failure of the custodian, the investments may not be returned. Substantially all of the Foundation’s investments are issued, registered or held in the name of the Foundation by custodian banks and brokers, as its agent. Other types of investments represent ownership interest that do not exist in physical or book entry form. Concentration of Credit Risk Concentration of credit risk is the risk associated with a lack of diversification, such as having substantial investments in a few individual issuers; thereby exposing the organization to greater risks resulting from adverse conditions or developments. The Foundation maintains investment policies that limit the holdings of any individual security (except those issued or guaranteed by the federal government) to 10% of invested funds. GASB requires disclosure of investments in any one individual issuer that represent 5% or more of total investments. The Foundation had no investments that exceeded this threshold at June 30, 2018 or 2017. Interest Rate Risk Interest rate risk is the risk that fixed income securities will decline because of rising interest rates. The Foundation measures interest rate risk using the weighted average maturity method.

28
Foundation of California State University, Monterey Bay Notes to Financial Statements
June 30, 2018 and 2017
NOTE 3. INVESTMENTS (Continued) The weighted average maturities of the Foundation’s fixed income securities and money market funds at June 30, 2018, were as follows:
Fair ValueBond Mutual Funds:
Met West Total Return Bond I 2,453,124$ 6.1Dodge & Cox Income 2,470,407 8.0JP Morgan Emerging ETF 652,269 12.1
Money Market Fund:Schwab Government Money Fund 214,227 0.1
Total 5,790,027$
Weighted Average Maturity
(Years)
Foreign Currency Risk Exposure from foreign currency risk results from investments in foreign currency denominated equity or fixed income investments. The Foundation maintains international equity investments by investing in international mutual funds that are broadly diversified over many developed and emerging markets. Exposure from foreign currency risk from these investments is permitted and it may be fully or partially hedged by the individual mutual fund managers but hedging is not permitted for speculation or to create leverage. As of June 30, 2018, the exposure to foreign currency risk of the International Equity Funds was as follows:
Fair ValueEuro 932,390$ Japanese Yen 543,970 British Pound 497,644 Korean Won 440,887 Brazilian Real 368,718 Taiwan Dollar 280,590 Indian Rupee 235,009 Swiss Franc 226,868 Chinese Yuan 152,320 South African Rand 144,637 Other Currencies 3,103,989
Total International Funds Subject to Foreign Currency Risk 6,927,022$
Currency
Other currencies are individually less than 1% of the Foundation’s international equity funds.

29
Foundation of California State University, Monterey Bay Notes to Financial Statements
June 30, 2018 and 2017
NOTE 4. PLEDGES RECEIVABLE Pledges receivable at June 30, 2018 were as follows:
Academic scholarships 75,000$ Less: Allowance for doubtful accounts (2,240) Less: Unamortized discount (332) Pledges receivable, net 72,428$
Pledges due in:
One year or less 45,000$ One to five years 30,000
Total 75,000$
NOTE 5. OPERATING AGREEMENTS CSU The Foundation entered into a new operating agreement with the Trustees of the CSU on July 1, 2015 with a term end date of June 30, 2025. It describes the terms and conditions under which the Foundation may operate as an auxiliary organization within the CSU. No amounts are paid to the Trustees of the CSU under this agreement. Corporation On July 1, 2010 the Foundation entered into an agreement with the Corporation for accounting and financial reporting services. This agreement will renew automatically in 12-month increments unless terminated by choice by either party. The Corporation currently does not charge the Foundation for services; however, it reserves the right to establish an annual fixed fee in future years.
NOTE 6. RISK MANAGEMENT The Foundation manages its risk through the purchase of insurance through California State University Risk Management Authority (CSURMA)/Auxiliaries Organization Risk Management Authority (AORMA), a joint powers public entity risk pool, for coverage of liability and general organizational risk. CSURMA/AORMA provides self-insured omission claims under $25,000 are self-insured. There have been no settlements in the past year that have exceeded insurance limits. There are no self-insurance claims liabilities recorded in the accompanying financial statements because any amounts at June 30, 2018, are expected to be minimal. Likewise, no amounts have been paid to CSURMA/AORMA by June 30, 2018, related to the Foundation’s estimated future funding for claims liability.

30
Foundation of California State University, Monterey Bay Notes to Financial Statements
June 30, 2018 and 2017
NOTE 7. RELATED PARTY TRANSACTIONS The Foundation is involved in transactions with the Corporation and the University. Amounts at June 30 and transactions for the years then ended are summarized below:
2018 2017University:
Foundation receivable from the University 6,926$ -$ Foundation payable to the University 12,211 14,000 Payments for salaries of University personnel working on
contracts, grants, and other programs 215,967 - Payments for other than salaries of University personnel 219,117 61 Gifts, grants, or capital contributions to the University 826,815 199,500
2018 2017
Corporation:Foundation receivable from the Corporation 31,138$ 251,717$ Foundation payable to the Corporation 194,693 24,075 Expense reimbursements to Corporation 51,527 15,529 Endowment distribution to Corporation 154,188 672,023 Net contributions from Corporation 1,112,924 150,744

31
Supplemental Information

See independent accountants' audit report. 32
Assets:Current assets:
Cash and cash equivalents $ 1,426,013 Short-term investments — Accounts receivable, net 177,034 Capital lease receivable, current portion — Notes receivable, current portion — Pledges receivable, net 43,650 Prepaid expenses and other current assets —
Total current assets 1,646,697 Noncurrent assets:
Restricted cash and cash equivalents 371,661 Accounts receivable, net — Capital lease receivable, net of current portion — Notes receivable, net of current portion — Student loans receivable, net — Pledges receivable, net 28,778 Endowment investments 23,700,881 Other long-term investments — Capital assets, net — Other assets —
Total noncurrent assets 24,101,320 Total assets 25,748,017
Deferred outflows of resources:Unamortized loss on debt refunding — Net pension liability — Net OPEB liability — Others —
Total deferred outflows of resources — Liabilities:
Current liabilities:Accounts payable 214,516 Accrued salaries and benefits — Accrued compensated absences, current portion — Unearned revenues — Capital lease obligations, current portion — Long-term debt obligations, current portion — Claims liability for losses and loss adjustment expenses, current portion — Depository accounts — Other liabilities —
Total current liabilities 214,516 Noncurrent liabilities:
Accrued compensated absences, net of current portion — Unearned revenues — Grants refundable — Capital lease obligations, net of current portion — Long-term debt obligations, net of current portion — Claims liability for losses and loss adjustment expenses, net of current portion — Depository accounts — Net other postemployment benefits liabilityNet pension liability — Other liabilities —
Total noncurrent liabilities — Total liabilities 214,516
Deferred inflows of resources:Service concession arrangements — Net pension liability — Net OPEB liability — Unamortized gain on debt refunding — Nonexchange transactions — Others —
Total deferred inflows of resources — Net Position:
Net investment in capital assets — Restricted for: —
Nonexpendable – endowments 13,877,334 Expendable: —
Scholarships and fellowships 6,990,793 Research — Loans — Capital projects — Debt service — Others 4,654,581
Unrestricted 10,793 Total net position $ 25,533,501
Foundation of CSU Monterey BaySchedule of Net Position
June 30, 2018(for inclusion in the California State University)

See independent accountants' audit report. 33
Revenues:Operating revenues:
Student tuition and fees, gross $ — Scholarship allowances (enter as negative) —
Grants and contracts, noncapital:Federal — State — Local — Nongovernmental —
Sales and services of educational activities — Sales and services of auxiliary enterprises, gross 9,432
Scholarship allowances (enter as negative) — Other operating revenues 17,485
Total operating revenues 26,917 Expenses:
Operating expenses:Instruction — Research — Public service 3,066 Academic support 3,672 Student services 19,477 Institutional support 100,280 Operation and maintenance of plant — Student grants and scholarships 955,925 Auxiliary enterprise expenses — Depreciation and amortization —
Total operating expenses 1,082,420 Operating income (loss) (1,055,503)
Nonoperating revenues (expenses):State appropriations, noncapital — Federal financial aid grants, noncapital — State financial aid grants, noncapital — Local financial aid grants, noncapital — Nongovernmental and other financial aid grants, noncapital — Other federal nonoperating grants, noncapital — Gifts, noncapital 347,209 Investment income (loss), net 1,512,895 Endowment income (loss), net — Interest expense — Other nonoperating revenues (expenses) - excl. interagency transfers (411,584) Other nonoperating revenues (expenses) - interagency transfers —
Net nonoperating revenues (expenses) 1,448,520 Income (loss) before other revenues (expenses) 393,017
State appropriations, capital — Grants and gifts, capital 1,348,377 Additions (reductions) to permanent endowments 286,375
Increase (decrease) in net position 2,027,769 Net position:
Net position at beginning of year, as previously reported 23,505,732 Restatements — Net position at beginning of year, as restated 23,505,732 Net position at end of year $ 25,533,501
Foundation of CSU Monterey BaySchedule of Revenues, Expenses, and Changes in Net Position
June 30, 2018(for inclusion in the California State University)

See independent accountants' audit report. 34
1 Restricted cash and cash equivalents at June 30, 2018:Portion of restricted cash and cash equivalents related to endowments $ 371,661 All other restricted cash and cash equivalents —
Total restricted cash and cash equivalents $ 371,661
2.1 Composition of investments at June 30, 2018: Current
Unrestricted Current Restricted Total CurrentNoncurrent Unrestricted
Noncurrent Restricted Total Noncurrent Total
State of California Surplus Money Investment Fund (SMIF) $ — — — — — — — State of California Local Agency Investment Fund (LAIF) — — — — — — — Corporate bonds — — — — — — — Certificates of deposit — — — — — — — Mutual funds — — — — 21,530,489 21,530,489 21,530,489 Money Market funds — — — — — — — Repurchase agreements — — — — — — — Commercial paper — — — — — — — Asset backed securities — — — — — — — Mortgage backed securities — — — — — — — Municipal bonds — — — — — — — U.S. agency securities — — — — — — — U.S. treasury securities — — — — — — — Equity securities — — — — — — — Exchange traded funds (ETFs) — — — — — — — Alternative investments:
Private equity (including limited partnerships) — — — — 1,078,611 1,078,611 1,078,611 Hedge funds — — — — — — — Managed futures — — — — — — — Real estate investments (including REITs) — — — — 1,091,781 1,091,781 1,091,781 Commodities — — — — — — — Derivatives — — — — — — — Other alternative investment types — — — — — — —
Other external investment pools (excluding SWIFT) Add description — — — — — — — Add description — — — — — — — Add description — — — — — — — Add description — — — — — — — Add description — — — — — — — Add description — — — — — — — Other major investments: Add description — — — — — — — Add description — — — — — — — Add description — — — — — — — Add description — — — — — — — Add description — — — — — — — Add description — — — — — — —
Total investments — — — — 23,700,881 23,700,881 23,700,881
Less endowment investments (enter as negative number) — (23,700,881) (23,700,881) (23,700,881) Total investments $ — — — — — — —
2.2 Investments held by the University under contractual agreements at June 30, 2018: N/APortion of investments in note 2.1 held by the University under contractual
agreements at June 30, 2018 : — — — — — — —
2.3 Restricted current investments at June 30, 2018 related to: Amount Add description $ — Add description — Add description — Add description — Add description — Add description — Add description —
Total restricted current investments at June 30, 2018 $ —
Foundation of CSU Monterey BayOther Information
June 30, 2018(for inclusion in the California State University)

See independent accountants' audit report. 35
Foundation of CSU Monterey BayOther Information
June 30, 2018(for inclusion in the California State University)
2.4 Restricted noncurrent investments at June 30, 2018 related to: AmountEndowment investment $ 23,700,881 Scholarships — Inflation reserves — University projects — Add description — Add description — Add description — Add description —
Total restricted noncurrent investments at June 30, 2018 $ 23,700,881 2.5 Fair value hierarchy in investments at June 30, 2018:
Total
Quoted Prices in Active Markets for
Identical Assets (Level 1)
Significant Other Observable
Inputs (Level 2)
Significant Unobservable
Inputs (Level 3)
Net Asset Value (NAV)
State of California Surplus Money Investment Fund (SMIF) $ — — — — — State of California Local Agency Investment Fund (LAIF) — — — — — Corporate bonds — — — — — Certificates of deposit — — — — — Mutual funds 21,530,489 21,530,489 — — — Money Market funds — — — — — Repurchase agreements — — — — — Commercial paper — — — — — Asset backed securities — — — — — Mortgage backed securities — — — — — Municipal bonds — — — — — U.S. agency securities — — — — — U.S. treasury securities — — — — — Equity securities — — — — — Exchange traded funds (ETFs) — — — — — Alternative investments:
Private equity (including limited partnerships) 1,078,611 — — 1,078,611 — Hedge funds — — — — — Managed futures — — — — — Real estate investments (including REITs) 1,091,781 — — 1,091,781 — Commodities — — — — — Derivatives — — — — — Other alternative investment types — — — — —
Other external investment pools (excluding SWIFT) Add description — — — — — Add description — — — — — Add description — — — — — Add description — — — — — Add description — — — — — Add description — — — — — Other major investments: Add description — — — — — Add description — — — — — Add description — — — — — Add description — — — — — Add description — — — — — Add description — — — — —
Total investments $ 23,700,881 21,530,489 — 2,170,392 —
Fair Value Measurements Using

See independent accountants' audit report. 36
Foundation of CSU Monterey BayOther Information
June 30, 2018(for inclusion in the California State University)
3.1 Composition of capital assets at June 30, 2018: N/A Balance Transfers of
Balance Prior period June 30, 2017 Completed BalanceJune 30, 2017 Adjustments Reclassifications (restated) Additions Reductions CWIP June 30, 2018
Nondepreciable/nonamortizable capital assets:Land and land improvements $ — — — — — — — — Works of art and historical treasures — — — — — — — — Construction work in progress (CWIP) — — — — — — — — Intangible assets:
Rights and easements — — — — — — — — Patents, copyrights and trademarks — — — — — — — — Internally generated intangible assets in progress — — — — — — — — Licenses and permits — — — — — — — — Other intangible assets:
— — — — — — — — — — — — — — — — — — — — — — — — — — — — — — — — — — — — — — — —
Total intangible assets — — — — — — — —
Total nondepreciable/nonamortizable capital assets — — — — — — — —
Depreciable/amortizable capital assets:Buildings and building improvements — — — — — — — — Improvements, other than buildings — — — — — — — — Infrastructure — — — — — — — — Leasehold improvements — — — — — — — — Personal property:
Equipment — — — — — — — — Library books and materials — — — — — — — —
Intangible assets:Software and websites — — — — — — — — Rights and easements — — — — — — — — Patents, copyright and trademarks — — — — — — — — Licenses and permits — — — — — — — — Other intangible assets:
— — — — — — — — — — — — — — — — — — — — — — — — — — — — — — — — — — — — — — — —
Total intangible assets — — — — — — — —
Total depreciable/amortizable capital assets — — — — — — — —
Total capital assets — — — — — — — —
Less accumulated depreciation/amortization:Buildings and building improvements — — — — — — — Improvements, other than buildings — — — — — — — Infrastructure — — — — — — — Leasehold improvements — — — — — — — Personal property:
Equipment — — — — — — — Library books and materials — — — — — — —
Intangible assets:Software and websites — — — — — — — Rights and easements — — — — — — — Patents, copyright and trademarks — — — — — — — Licenses and permits — — — — — — — Other intangible assets:
— — — — — — — — — — — — — — — — — — — — — — — — — — — — — — — — — — —
Total intangible assets — — — — — — — —
Total accumulated depreciation/amortization — — — — — — — — Total capital assets, net $ — — — — — — — —
Add description
Add description
Add descriptionAdd description
Add description
Add description
Add description
Add descriptionAdd descriptionAdd description
Add descriptionAdd descriptionAdd description
Add descriptionAdd description
See independent accountants' audit report. 37
Foundation of CSU Monterey BayOther Information
June 30, 2018(for inclusion in the California State University)
3.2 Detail of depreciation and amortization expense for the year ended June 30, 2018: N/ADepreciation and amortization expense related to capital assets $ — Amortization expense related to other assets —
Total depreciation and amortization $ —
4 Long-term liabilities activity schedule: N/ABalance
Balance Prior period June 30, 2017 Balance Current Long-termJune 30, 2017 adjustments Reclassifications (restated) Additions Reductions June 30, 2018 portion portion
$ — — — — — — — — — — — — — — — — — —
Capital lease obligations:Gross balance — — — — — — — — — Unamortized premium / (discount) on capital lease obligations — — — — — — — — —
Total capitalized lease obligations — — — — — — — — — Long-term debt obligations:
Auxiliary revenue bonds — — — — — — — — — Commercial paper — — — — — — — — — Notes payable related to SRB — — — — — — — — — Others: (list by type) Add description — — — — — — — — — Add description — — — — — — — — — Add description — — — — — — — — — Add description — — — — — — — — — Add description — — — — — — — — — Add description — — — — — — — — —
Total long-term debt obligations — — — — — — — — —
Unamortized bond premium / (discount) — — — — — — — — — Total long-term debt obligations, net — — — — — — — — — Total long-term liabilities $ — — — — — — — — —
5 Future minimum lease payments - Capital lease obligations: N/A
Principal and Principal and Principal andPrincipal Only Interest Only Interest Principal Only Interest Only Interest Principal Only Interest Only Interest
Year ending June 30:2019 — — — — — — — — — 2020 — — — — — — — — — 2021 — — — — — — — — — 2022 — — — — — — — — — 2023 — — — — — — — — — 2024 - 2028 — — — — — — — — — 2029 - 2033 — — — — — — — — — 2034 - 2038 — — — — — — — — — 2039 - 2043 — — — — — — — — — 2044 - 2048 — — — — — — — — — 2049 - 2053 — — — — — — — — — 2054 - 2058 — — — — — — — — — 2059 - 2063 — — — — — — — — — 2064 - thereafter — — — — — — — — —
Total minimum lease payments — — — — — — — — — Less amounts representing interest — Present value of future minimum lease payments — Unamortized net premium (discount) — Total capital lease obligations —
Less: current portion — Capital lease obligations, net of current portion $ —
Accrued compensated absencesClaims liability for losses and loss adjustment expenses
Capital lease obligations related to SRB All other capital lease obligations Total capital lease obligations

See independent accountants' audit report. 38
Foundation of CSU Monterey BayOther Information
June 30, 2018(for inclusion in the California State University)
6 Long-term debt obligations schedule: N/A
Principal and Principal and Principal andPrincipal Only Interest Only Interest Principal Only Interest Only Interest Principal Only Interest Only Interest
2019 $ — — — — — — — — — 2020 — — — — — — — — — 2021 — — — — — — — — — 2022 — — — — — — — — — 2023 — — — — — — — — — 2024 - 2028 — — — — — — — — — 2029 - 2033 — — — — — — — — — 2034 - 2038 — — — — — — — — — 2039 - 2043 — — — — — — — — — 2044 - 2048 — — — — — — — — — 2049 - 2053 — — — — — — — — — 2054 - 2058 — — — — — — — — — 2059 - 2063 — — — — — — — — — 2064 - thereafter — — — — — — — — —
Total minimum payments — — — — — — — — — Less amounts representing interest — Present value of future minimum payments — Unamortized net premium (discount) — Total long-term debt obligations —
Less: current portion — Long-term debt obligations, net of current portion $ —
7 Calculation of net position:7.1 Calculation of net position - Net investment in capital assets N/ACapital assets, net of accumulated depreciation $ — Capital lease obligations, current portion — Capital lease obligations, net of current portion — Long-term debt obligations, current portion — Long-term debt obligations, net of current portion — Portion of outstanding debt that is unspent at year-end (enter as positive numb — Other adjustments: (please list) Add description — Add description — Add description — Add description — Add description — Net position - Net investment in capital assets $ —
7.2 Calculation of net position - Restricted for nonexpendable - endowmentsPortion of restricted cash and cash equivalents related to endowments $ 371,661 Endowment investments 23,700,881 Other adjustments: (please list) Restricted expendable endowments (Quasi & Term) (5,220,044) Restricted expendable appreciation (dividends and gains) of — true endowments (4,817,955) Endowment donations in restricted cash (157,209) Add description — Add description — Add description — Add description — Add description — Add description — Net position - Restricted for nonexpendable - endowments $ 13,877,334
-$
Auxiliary revenue bonds
Year ending June 30:
All other long-termdebt obligations Total long-term debt obligations

See independent accountants' audit report. 39
Foundation of CSU Monterey BayOther Information
June 30, 2018(for inclusion in the California State University)
8 Transactions with related entities:Amount
Payments to University for salaries of University personnel working on contracts, grants, and other programs $ 215,967 Payments to University for other than salaries of University personnel 219,117 Payments received from University for services, space, and programs — Gifts-in-kind to the University from discretely presented component units — Gifts (cash or assets) to the University from discretely presented component units 826,815 Accounts (payable to) University (enter as negative number) (12,211) Other amounts (payable to) University (enter as negative number) — Accounts receivable from University (enter as positive number) 6,926 Other amounts receivable from University —
9 Other postemployment benefits (OPEB) liability N/AIntentionally left blank - not required/applicable eff FY17/18
10 N/A
Description Amount Add description $ — Add description — Add description — Add description — Add description — Add description — Add description — Add description — Add description — Add description —
Total pollution remediation liabilities $ —
Less: current portion — Pollution remediation liabilities, net of current portion $ —
11 The nature and amount of the prior period adjustment(s) recorded to beginning net position:Net Position
Class AmountDr. (Cr.)
Net position as of June 30, 2017, as previously reported $ 23,505,732 Prior period adjustments:
1 (list description of each adjustment) — 2 (list description of each adjustment) — 3 (list description of each adjustment) — 4 (list description of each adjustment) — 5 (list description of each adjustment) — 6 (list description of each adjustment) — 7 (list description of each adjustment) — 8 (list description of each adjustment) — 9 (list description of each adjustment) —
10 (list description of each adjustment) — Net position as of June 30, 2017, as restated $ 23,505,732
Pollution remediation liabilities under GASB Statement No. 49:

See independent accountants' audit report. 40
Foundation of CSU Monterey BayOther Information
June 30, 2018(for inclusion in the California State University)
Provide a detailed breakdown of the journal entries (at the financial statement line item level) booked to record each prior period adjustment:Debit Credit
Net position class:______________________ $ — — 1 (breakdown of adjusting journal entry)
Net position class:______________________ — — 2 (breakdown of adjusting journal entry)
Net position class:______________________ — — 3 (breakdown of adjusting journal entry)
Net position class:______________________ — — 4 (breakdown of adjusting journal entry)
Net position class:______________________ — — 5 (breakdown of adjusting journal entry)
Net position class:______________________ — — 6 (breakdown of adjusting journal entry)
Net position class:______________________ — — 7 (breakdown of adjusting journal entry)
Net position class:______________________ — — 8 (breakdown of adjusting journal entry)
Net position class:______________________ — — 9 (breakdown of adjusting journal entry)
Net position class:______________________ — — 10 (breakdown of adjusting journal entry)
12 Natural Classifications of Operating Expenses:
Insurance TravelScholarships and
fellowshipsSupplies and other
servicesOther Operating
ExpenseTotal operating
expensesInstruction $ — — — — — — Research — — — — — — Public service — — — — 3,066 3,066 Academic support — — — 196 3,476 3,672 Student services — — — — 19,477 19,477 Institutional support 50,000 813 — 38 49,429 100,280 Operation and maintenance of plant — — — — — — Student grants and scholarships — — 955,925 — — 955,925 Auxiliary enterprise expenses — — — — — — Depreciation and amortization — — — — — —
Total $ 50,000 813 955,925 234 75,448 1,082,420

G GLENN BURDETT E CERTIFIED PUBLIC ACCOUNTANTS
Independent Auditors' Report on Internal Control over Financial Reporting
and on Compliance and Other Matters Based on an Audit of Financial Statements
Performed in Accordance with Government Auditing Standards
Board of Directors
Foundation of California State University, Monterey Bay
Seaside, California
We have audited, in accordance with the auditing standards generally accepted in the United States of America
and the standards applicable to financial audits contained in Government Auditing Standards issued by the
Comptroller General of the United States, the statements of net position and related statements of revenues,
expenses and changes in net position and cash flows of Foundation of California State University, Monterey
Bay (the Foundation), a component unit of California State University, Monterey Bay, as of and for the year
ended June 30, 2018, and the related notes to the financial statements, which collectively comprise the
Foundation's basic financial statements, and have issued our report thereon dated September 11 , 2018.
Internal Control Over Financial Reporting
In planning and performing our audit of the financial statements, we considered the Foundation's internal
control over financial reporting (internal control) to determine the audit procedures that are appropriate in the
circumstances for the purpose of expressing our opinion on the financial statements, but not for the purpose of
expressing an opinion on the effectiveness of the Foundation' s internal control. Accordingly, we do not
express an opinion on the effectiveness of the Foundation ' s internal control.
A deficiency in internal control exists when the design or operation of a control does not allow management
or employees, in the normal course of performing their assigned functions , to prevent, or detect and correct,
misstatements on a timely basis. A material weakness is a deficiency, or a combination of deficiencies, in
internal control, such that there is a reasonable possibility that a material misstatement of the entity's financial
statements will not be prevented, or detected and corrected on a timely basis. A significant deficiency is a
deficiency, or a combination of deficiencies, in internal control that is less severe than a material weakness,
yet important enough to merit attention by those charged with governance.
GLENNBURDETTE.COM
41
SAN LUIS OBISPO 1150 Palm Street
San Luis Obispo, CA 93401
p 805 544 1441
J 805 5444351
PASO ROBLES
102 Sou th Vine Street, Ste. A
Paso Robles, CA 93446
p 805 237 3995
f 805 239 9332
SANTA MARIA
2222 South Broadway, Ste. A
Santa Maria, CA 93454
p 805 922 4010
f 805 922 4286

42
Board of Directors Foundation of California State University, Monterey Bay Seaside, California Page 2 Our consideration of internal control was for the limited purpose described in the first paragraph of this section and was not designed to identify all deficiencies in internal control that might be material weaknesses or significant deficiencies. Given these limitations, during our audit we did not identify any deficiencies in internal control that we consider to be material weaknesses. However, material weaknesses may exist that have not been identified. Compliance and Other Matters As part of obtaining reasonable assurance about whether the Foundation’s financial statements are free of material misstatement, we performed tests of its compliance with certain provisions of laws, regulations, contracts, and grant agreements, noncompliance with which could have a direct and material effect on the determination of financial statement amounts. However, providing an opinion on compliance with those provisions was not an objective of our audit, and accordingly, we do not express such an opinion. The results of our tests disclosed no instances of noncompliance or other matters that are required to be reported under Government Auditing Standards. Purpose of this Report The purpose of this report is solely to describe the scope of our testing of internal control and compliance and the results of that testing, and not to provide an opinion on the effectiveness of the entity’s internal control or on compliance. This report is an integral part of an audit performed in accordance with Government Auditing Standards in considering the entity’s internal control and compliance. Accordingly, this communication is not suitable for any other purpose.
Glenn Burdette Attest Corporation San Luis Obispo, California September 11, 2018