fourier transform and frequency domain
TRANSCRIPT
Fourier Transform and Frequency Domain
16-385 Computer VisionSpring 2018, Lecture 3 (part 2)http://www.cs.cmu.edu/~16385/
Overview of today’s lecture
• Some history.
• Fourier series.
• Frequency domain.
• Fourier transform.
• Frequency-domain filtering.
• Revisiting sampling.
Slide credits
Most of these slides were adapted from:
• Kris Kitani (15-463, Fall 2016).
Some slides were inspired or taken from:
• Fredo Durand (MIT).• James Hays (Georgia Tech).

Some history
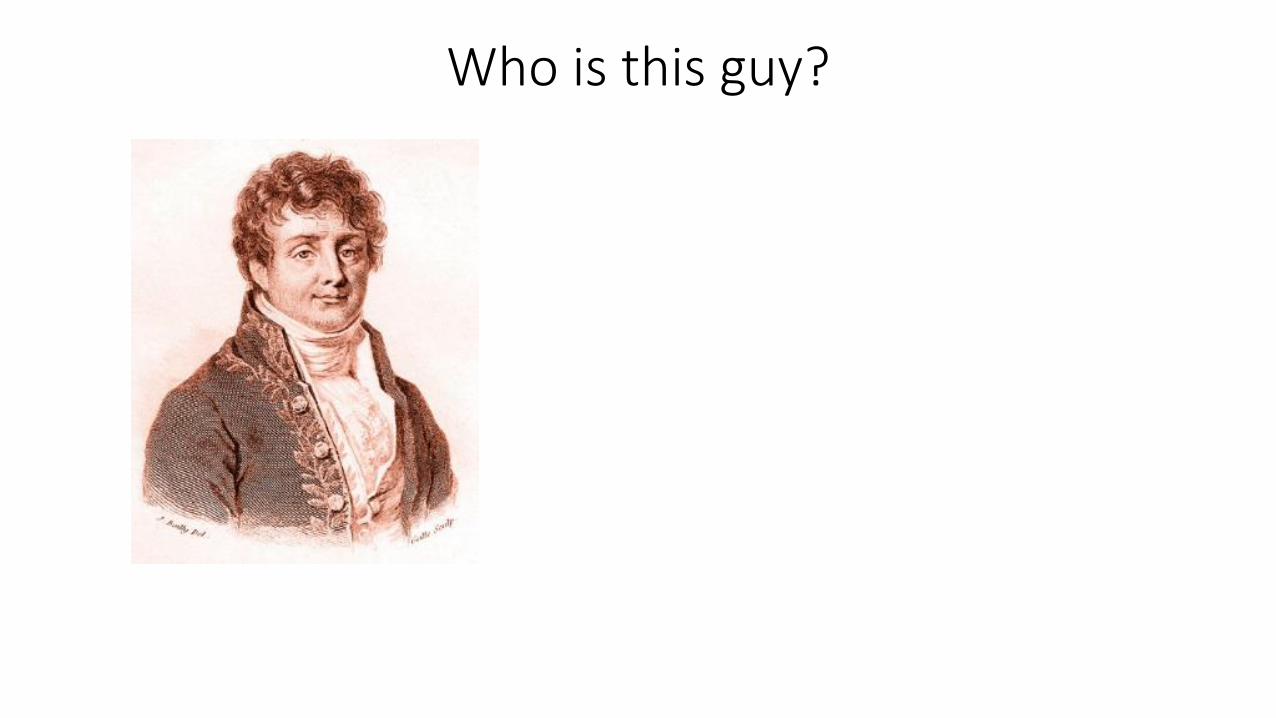
Who is this guy?
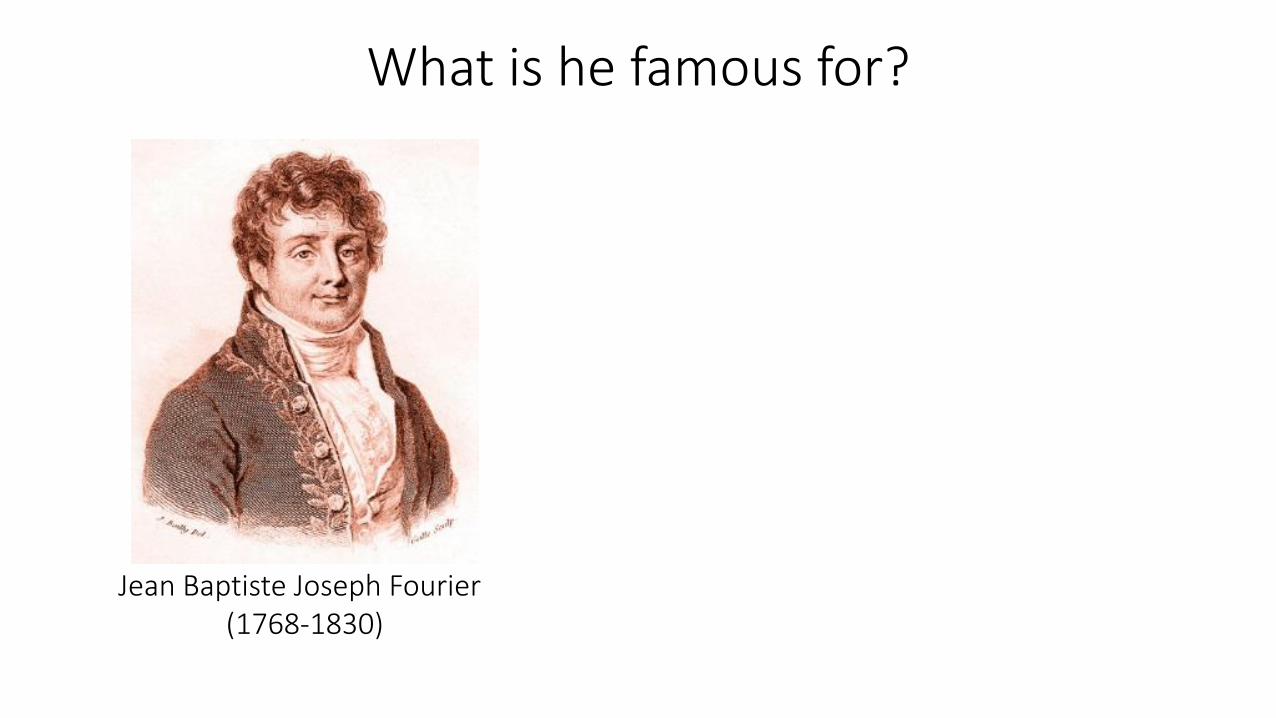
What is he famous for?
Jean Baptiste Joseph Fourier (1768-1830)
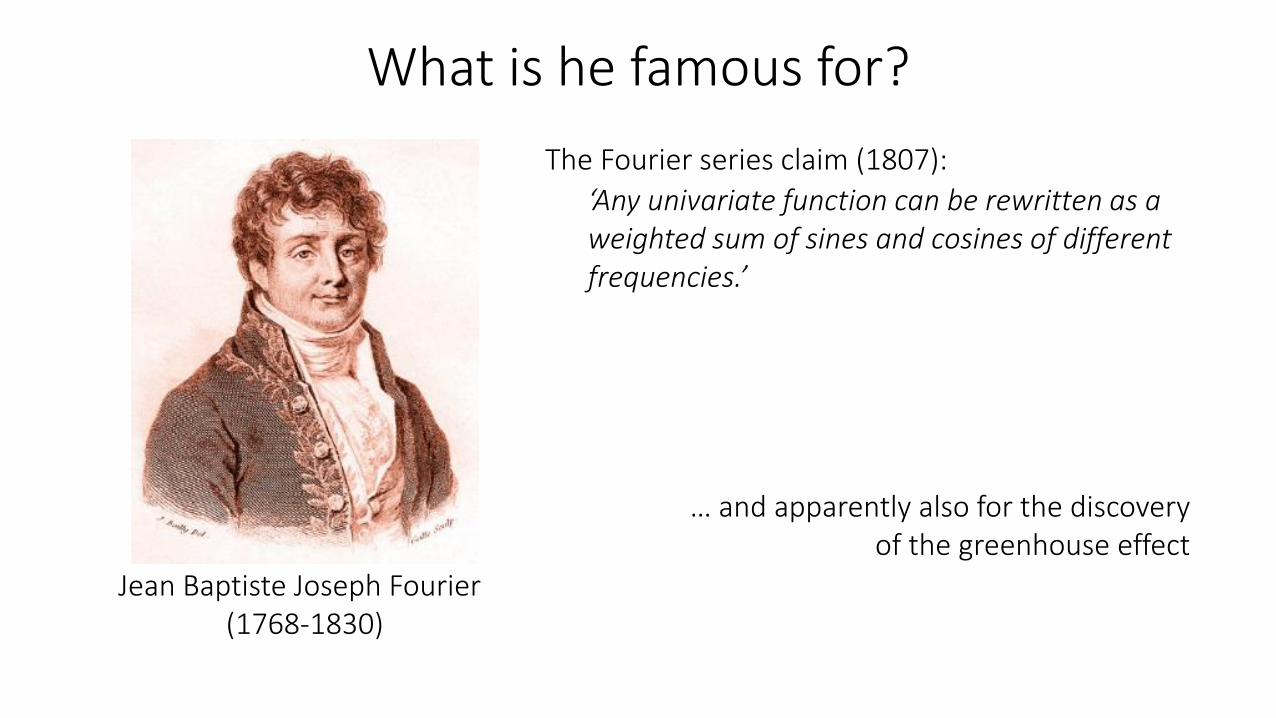
What is he famous for?
Jean Baptiste Joseph Fourier (1768-1830)
‘Any univariate function can be rewritten as a weighted sum of sines and cosines of different frequencies.’
The Fourier series claim (1807):
… and apparently also for the discovery of the greenhouse effect
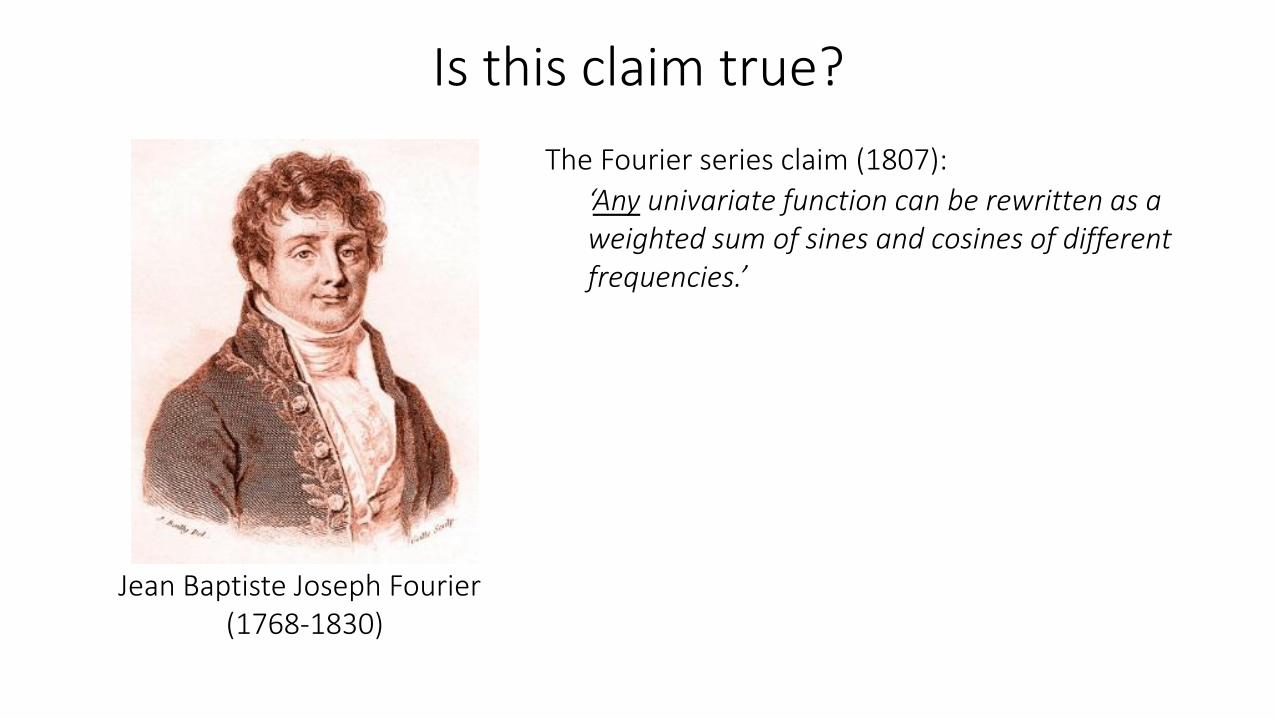
Is this claim true?
Jean Baptiste Joseph Fourier (1768-1830)
‘Any univariate function can be rewritten as a weighted sum of sines and cosines of different frequencies.’
The Fourier series claim (1807):
Is this claim true?
Jean Baptiste Joseph Fourier (1768-1830)
‘Any univariate function can be rewritten as a weighted sum of sines and cosines of different frequencies.’
The Fourier series claim (1807):
Well, almost.• The theorem requires additional conditions.• Close enough to be named after him.• Very surprising result at the time.
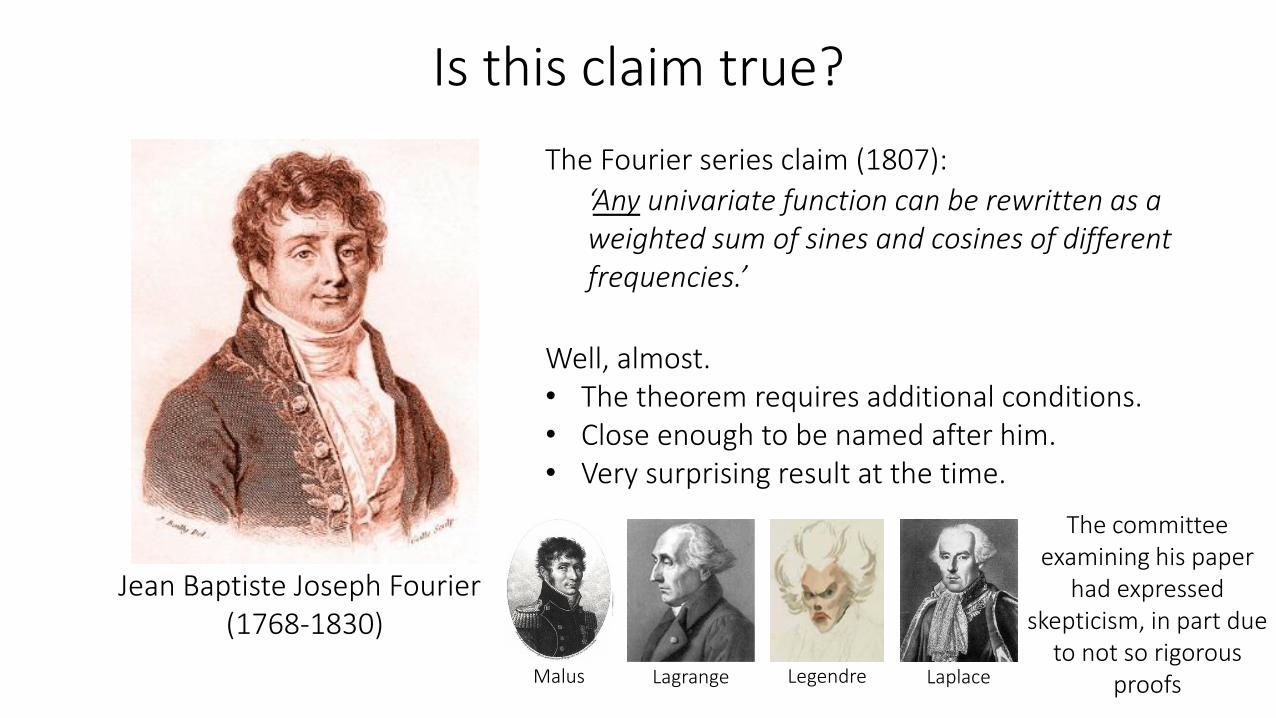
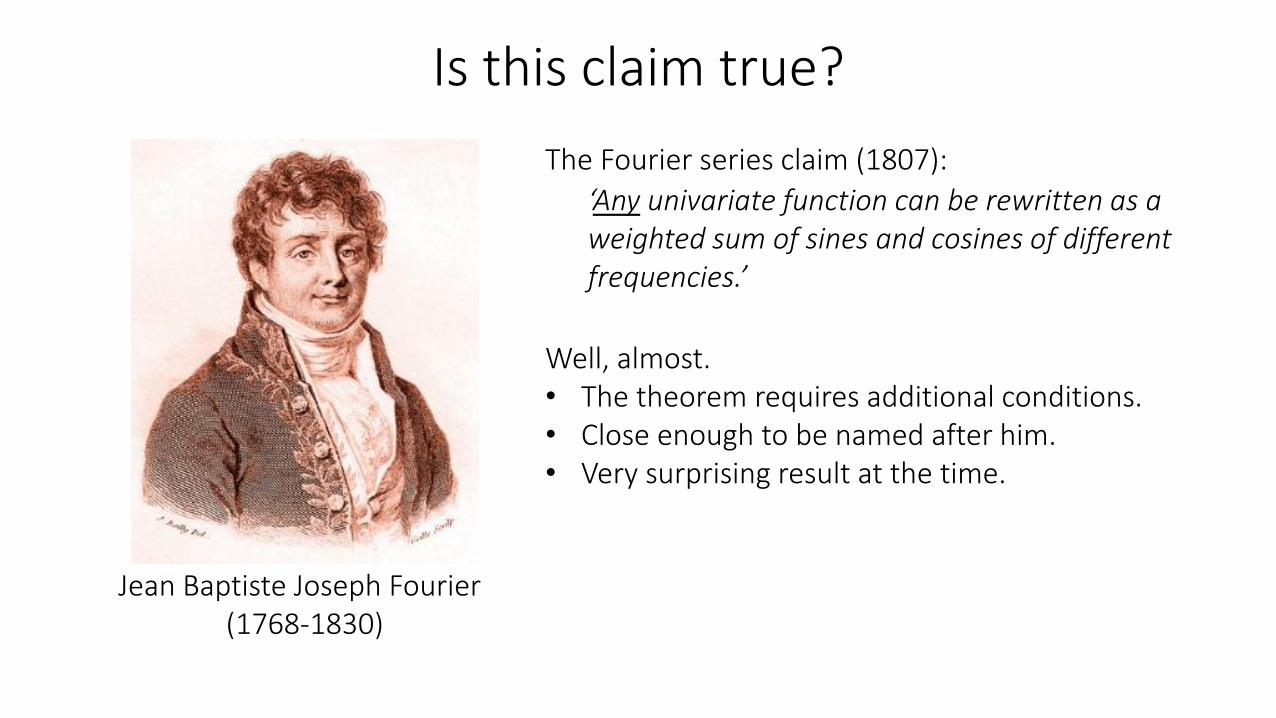
Malus Lagrange Legendre Laplace
The committee examining his paper
had expressed skepticism, in part due
to not so rigorous proofs
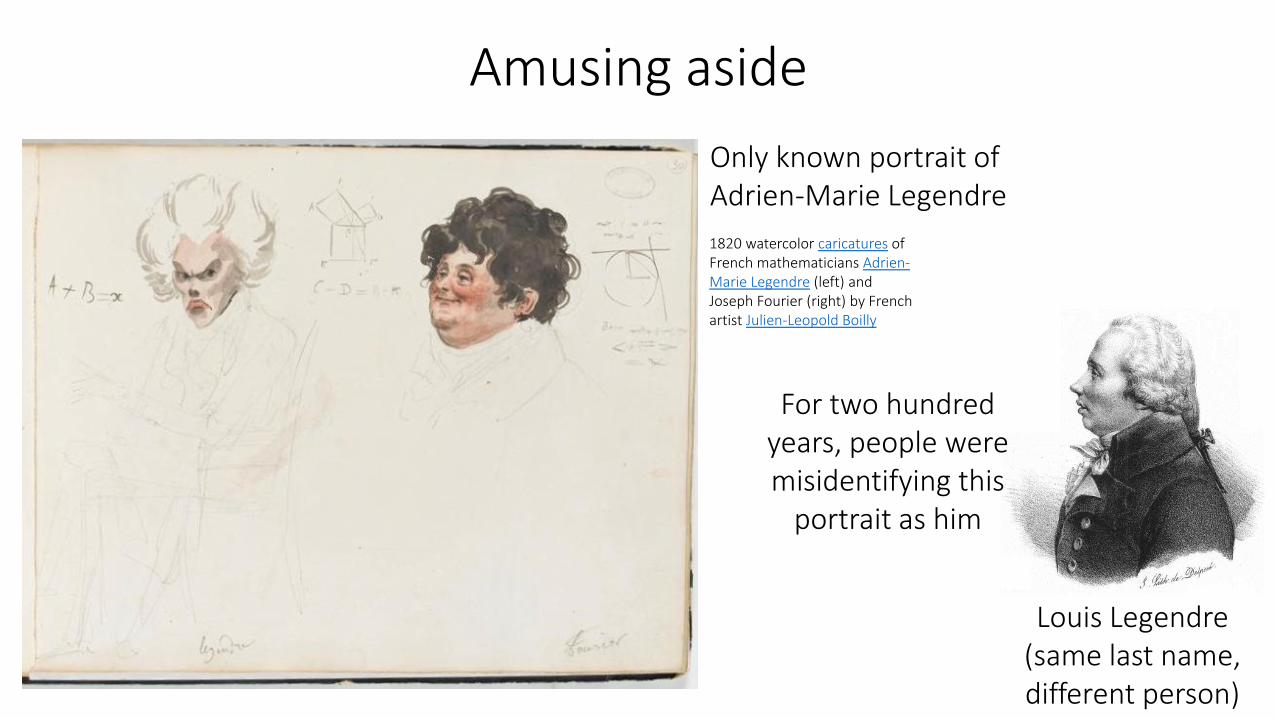
Amusing aside
1820 watercolor caricatures of French mathematicians Adrien-Marie Legendre (left) and Joseph Fourier (right) by French artist Julien-Leopold Boilly
Only known portrait of Adrien-Marie Legendre
For two hundred years, people were misidentifying this
portrait as him
Louis Legendre(same last name, different person)
Fourier series
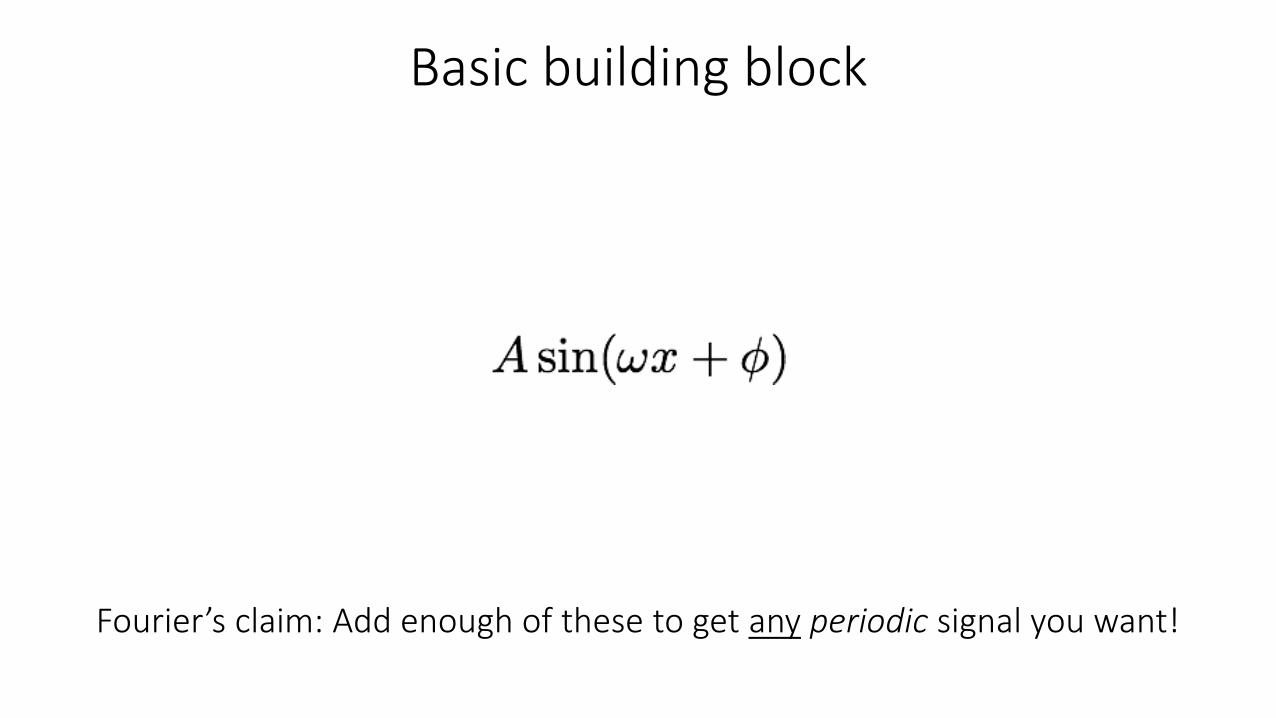
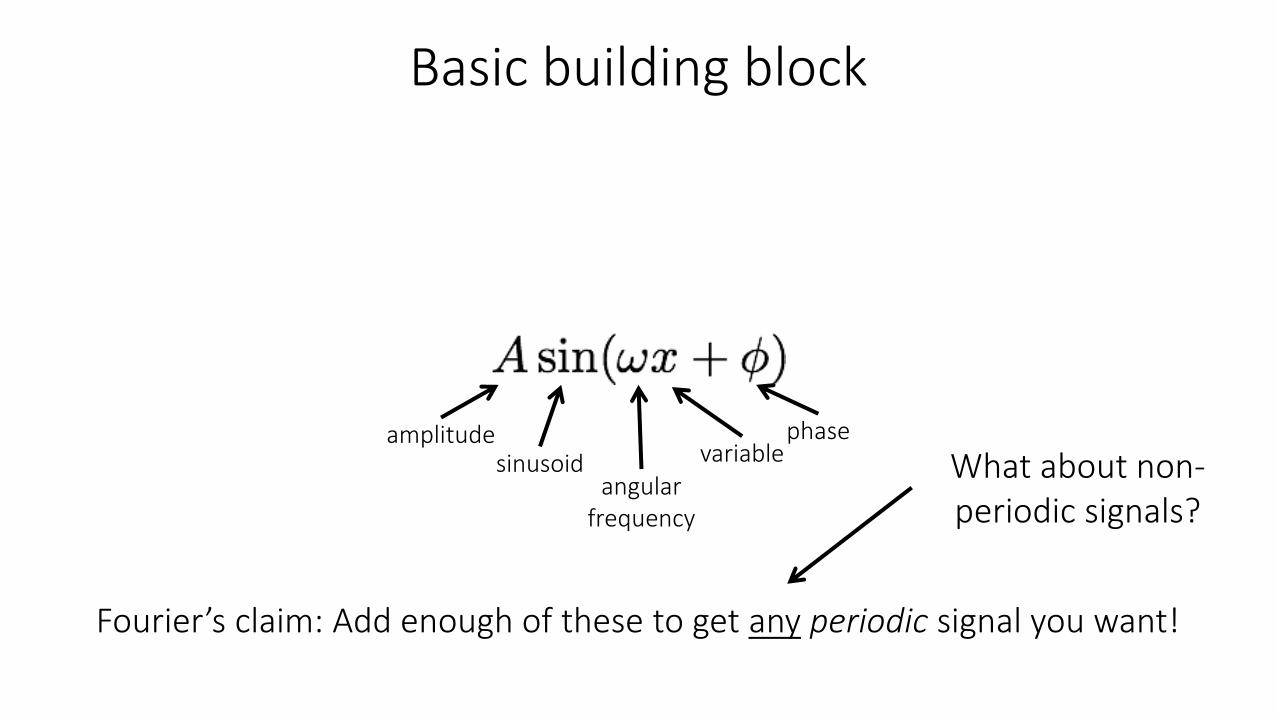
Fourier’s claim: Add enough of these to get any periodic signal you want!
Basic building block
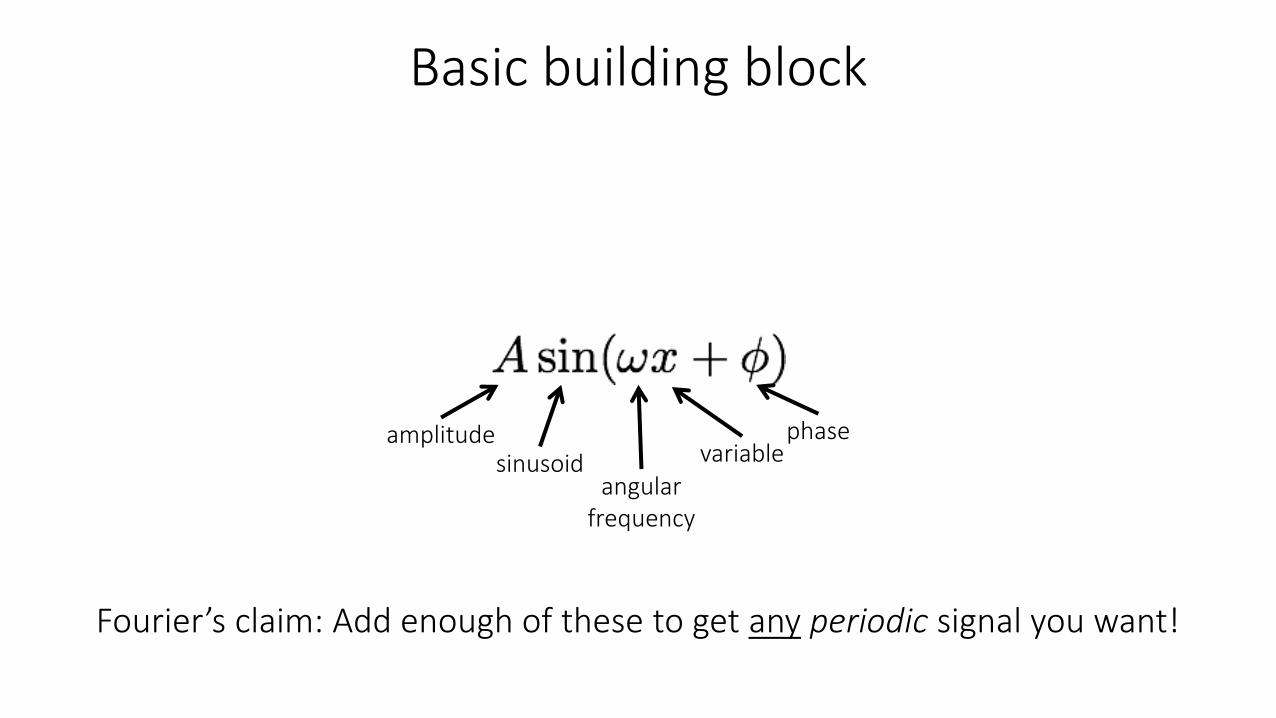
Fourier’s claim: Add enough of these to get any periodic signal you want!
amplitude
angularfrequency
variablephase
sinusoid
Basic building block
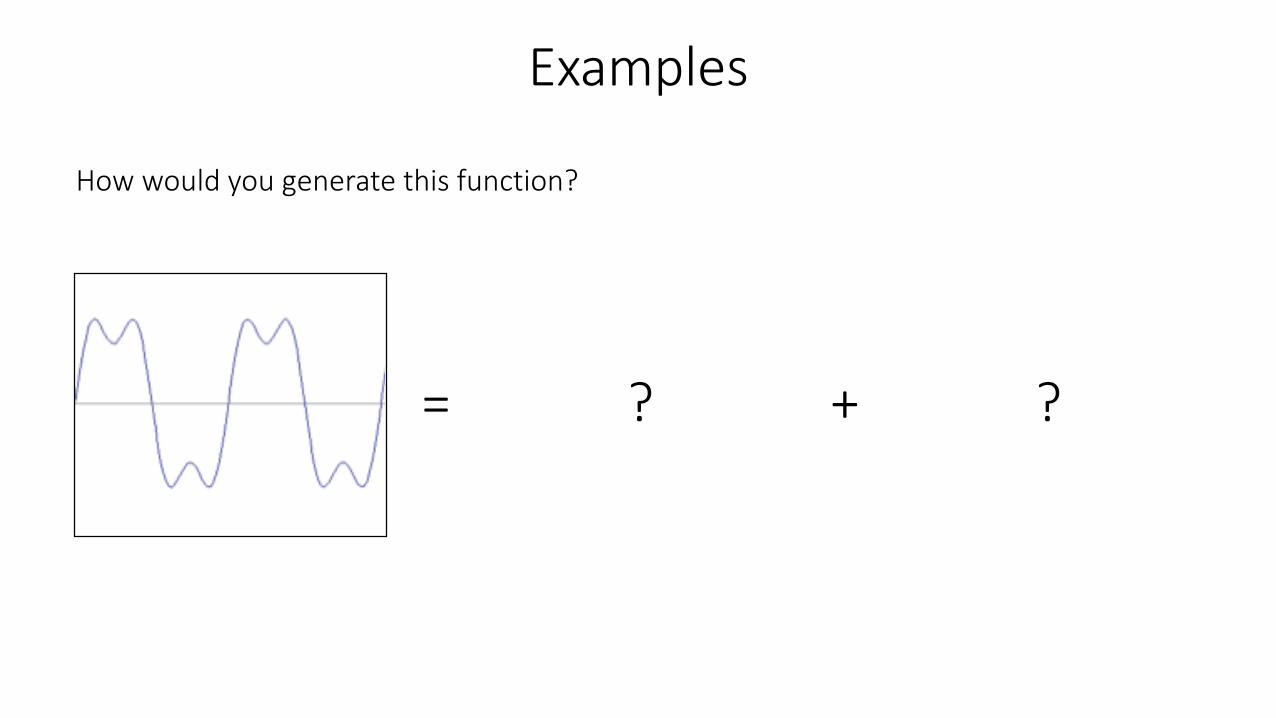
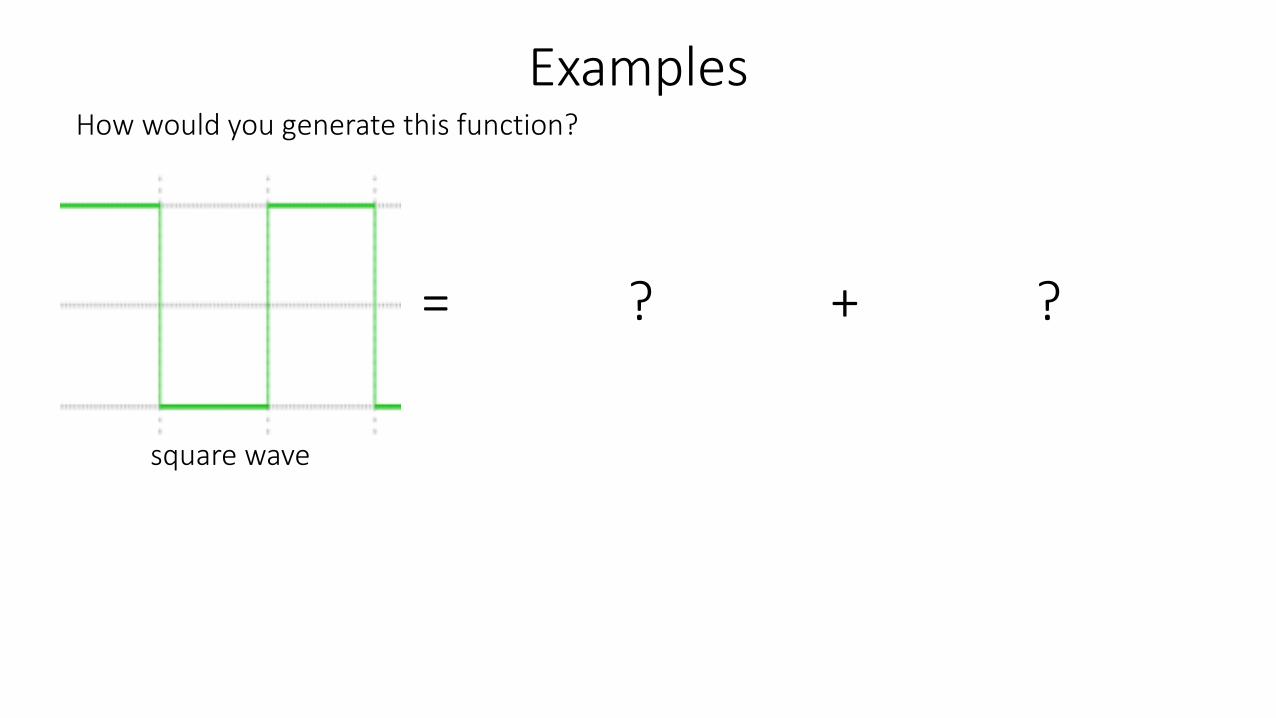
How would you generate this function?
Examples
= +? ?
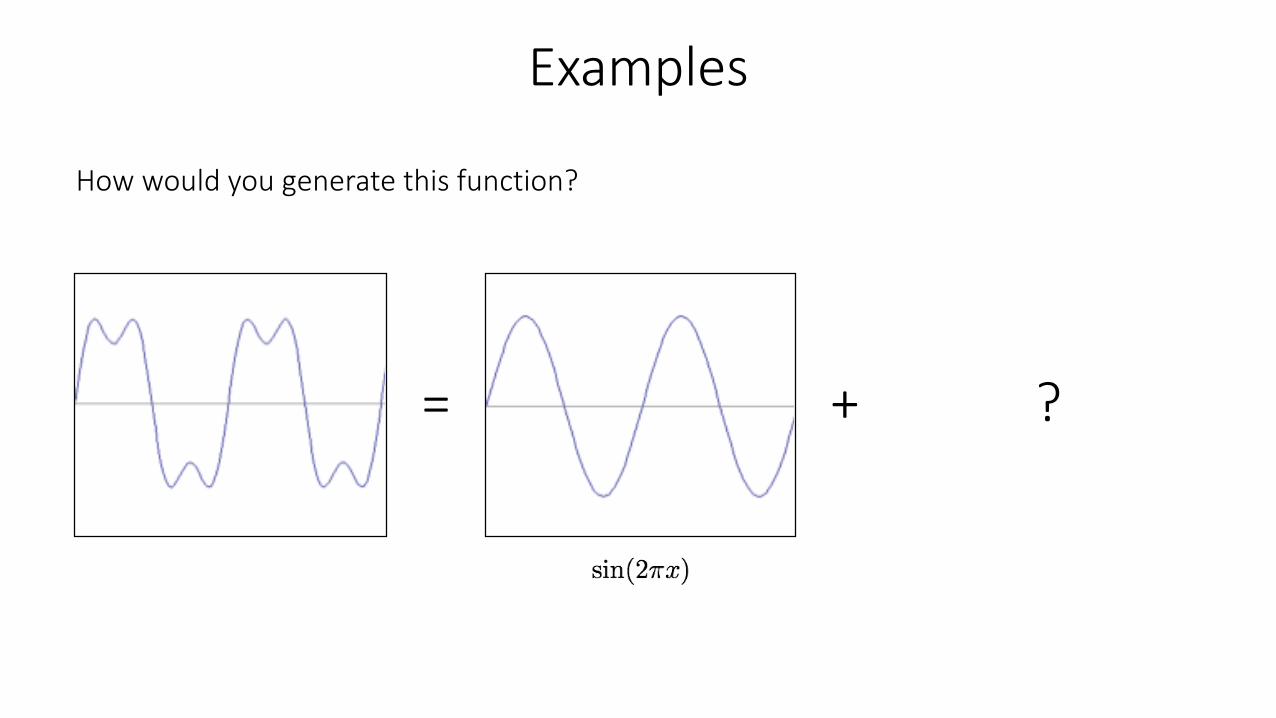
How would you generate this function?
Examples
= +? ?
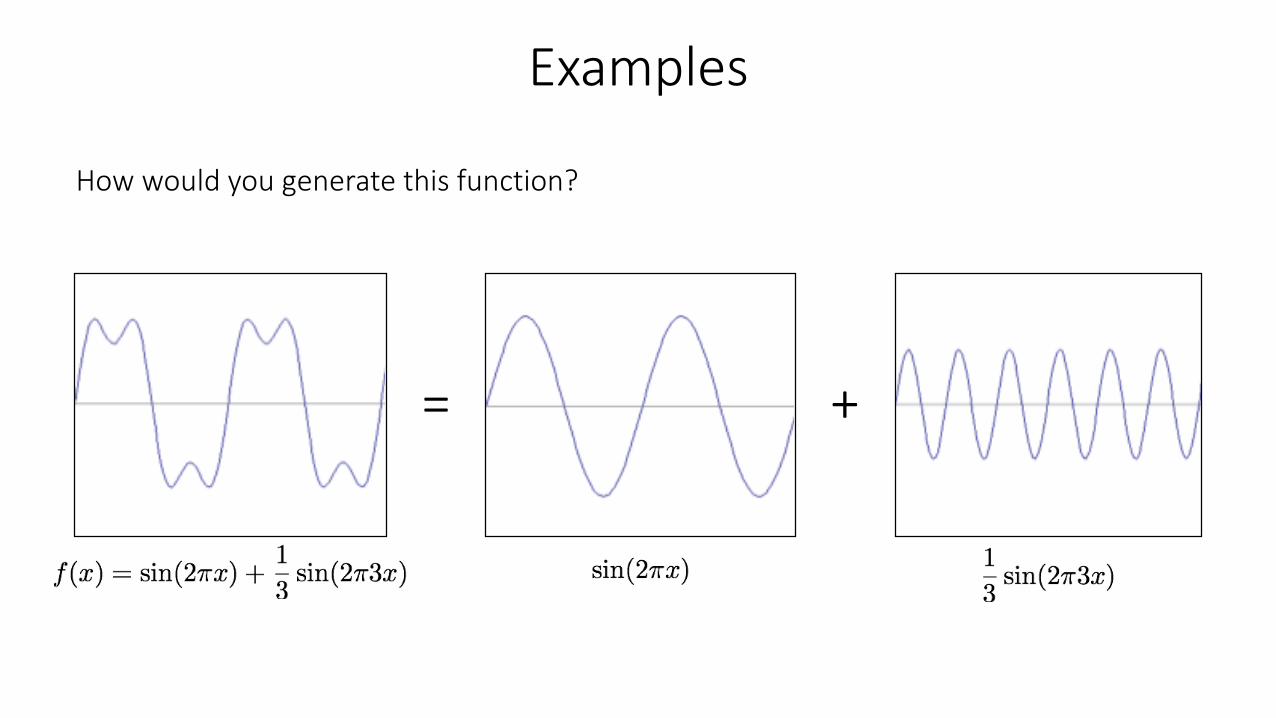
How would you generate this function?
Examples
= +? ?
How would you generate this function?
Examples
+? ?
square wave
=
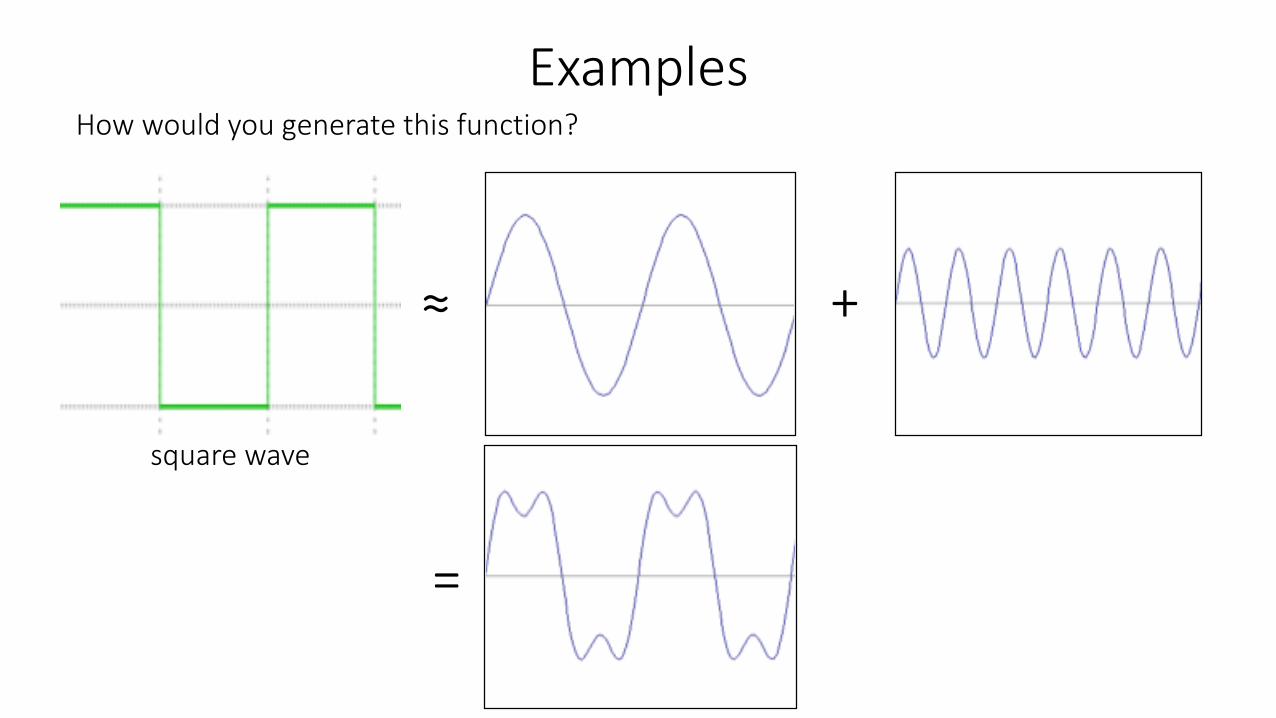
How would you generate this function?
Examples
=
+? ?
square wave
≈

How would you generate this function?
Examples
=
+? ?
square wave
≈
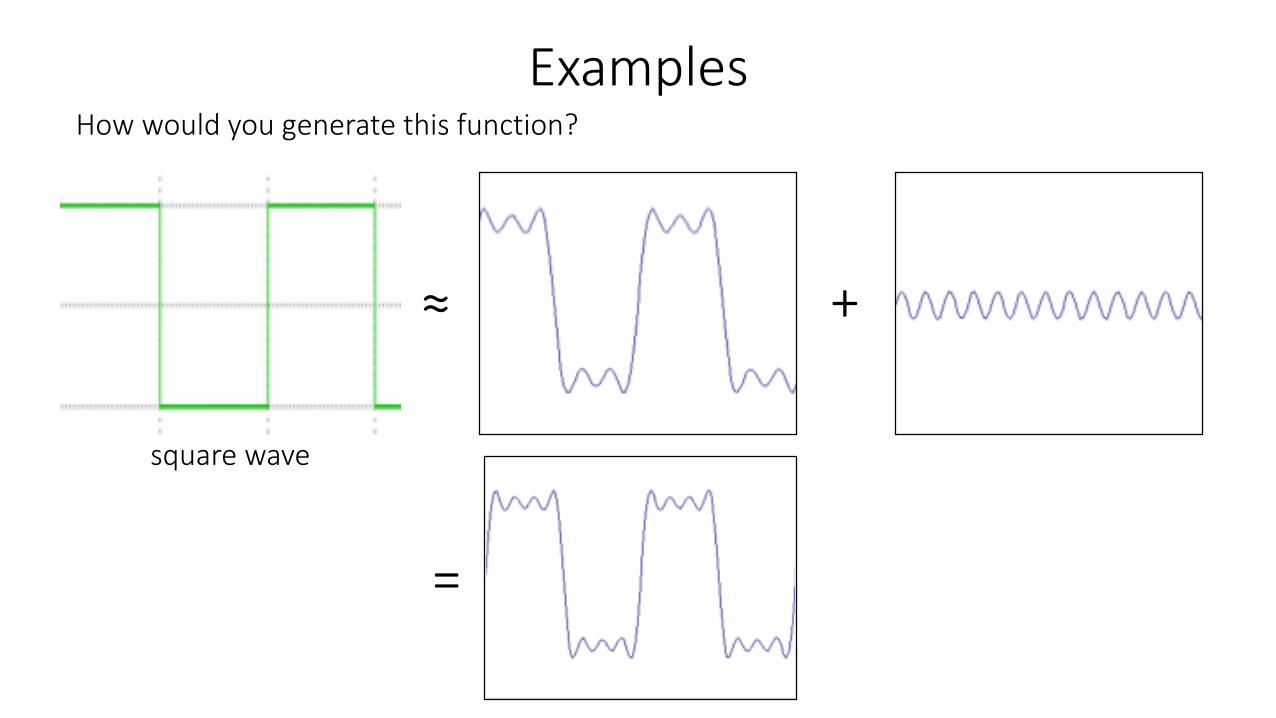
How would you generate this function?
Examples
=
+? ?
square wave
≈
How would you generate this function?
Examples
=
+? ?
square wave
≈
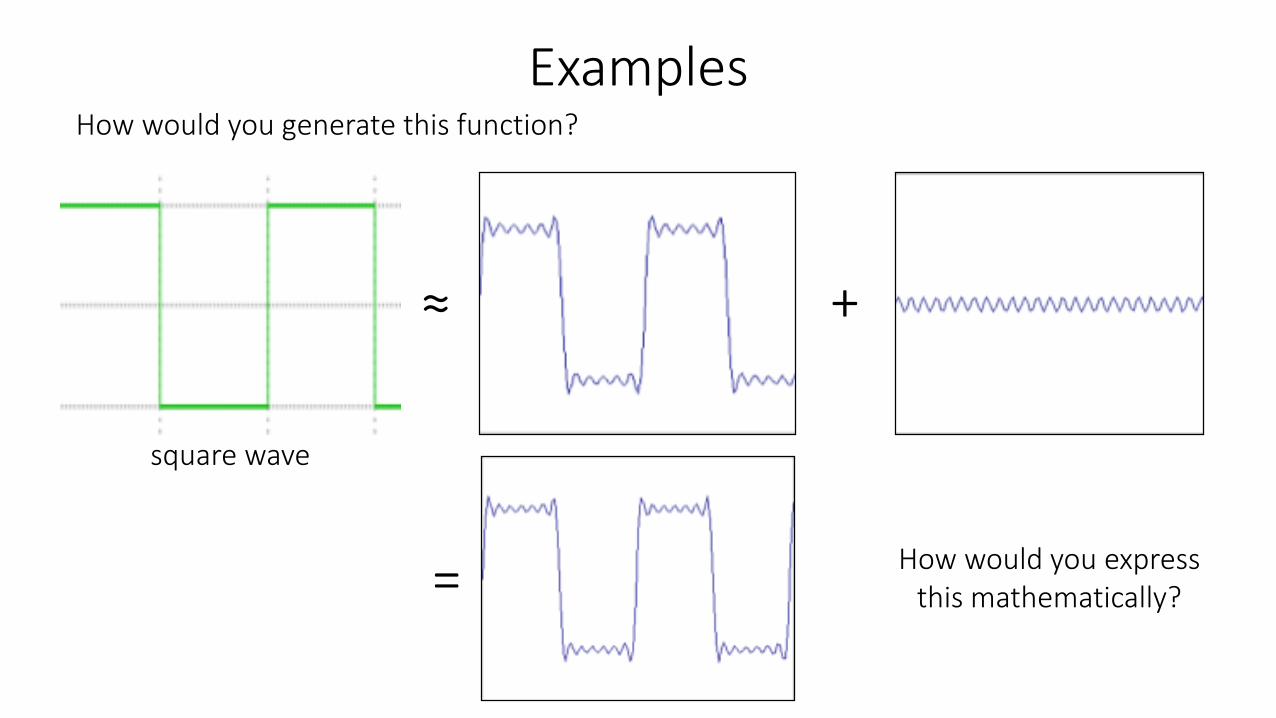
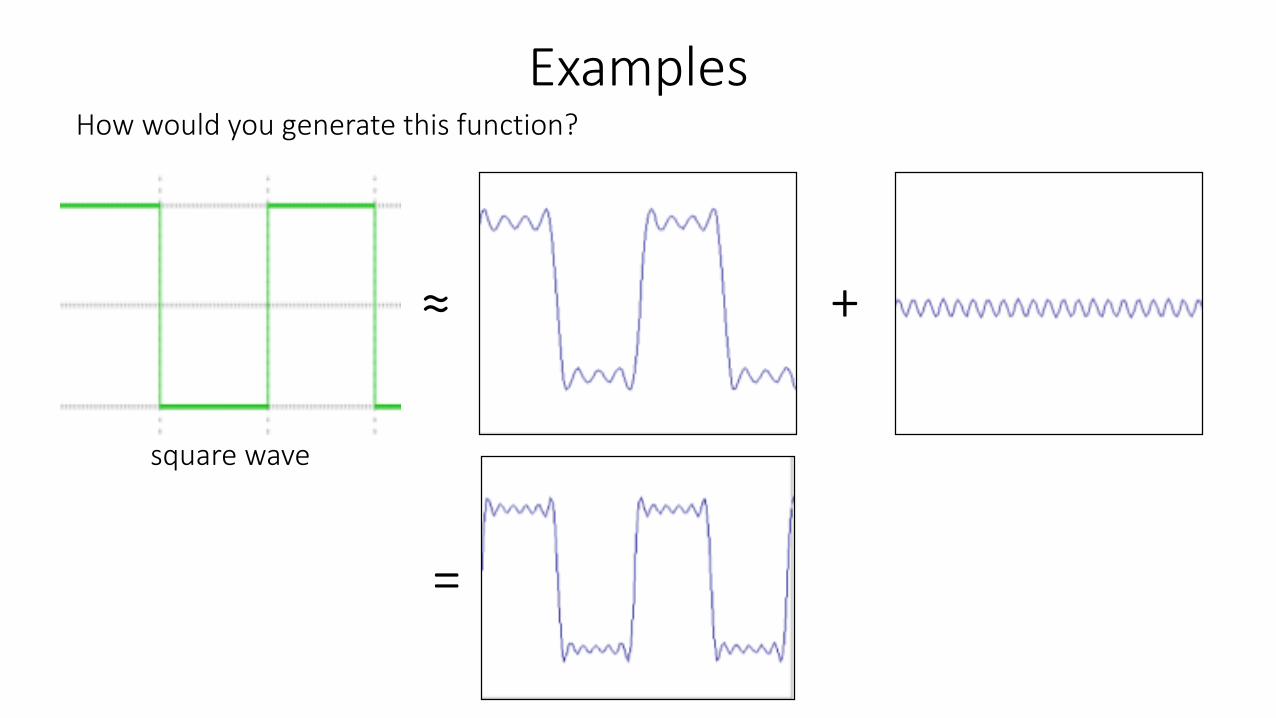
How would you generate this function?
Examples
=
+? ?
square wave
≈
How would you express this mathematically?
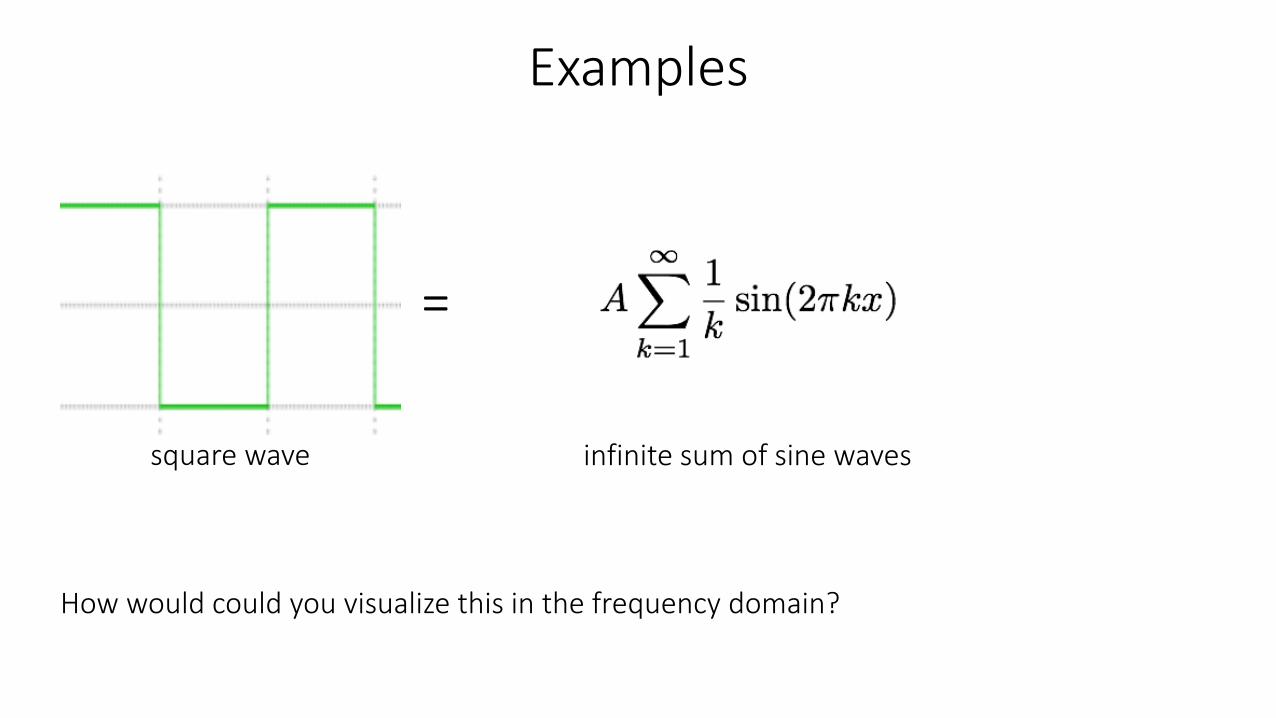
Examples
square wave
=
infinite sum of sine waves
How would could you visualize this in the frequency domain?
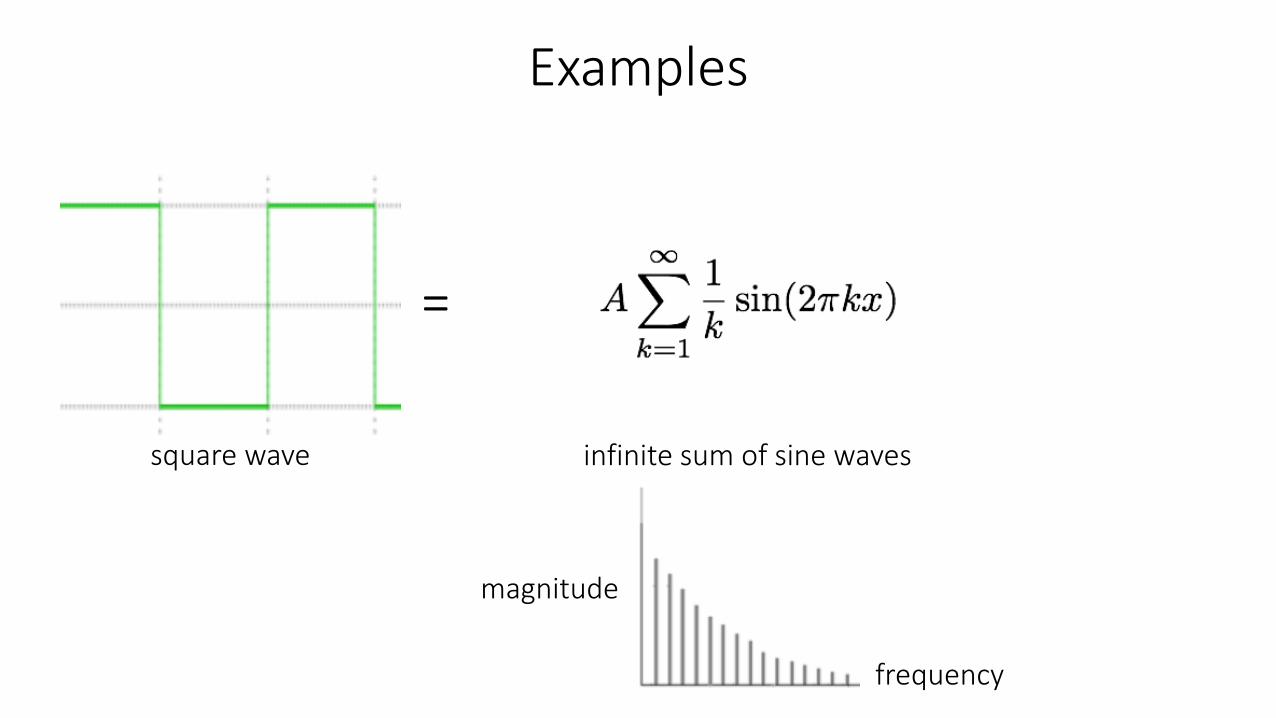
Examples
square wave
=
infinite sum of sine waves
magnitude
frequency
Frequency domain
frequency
amplitude
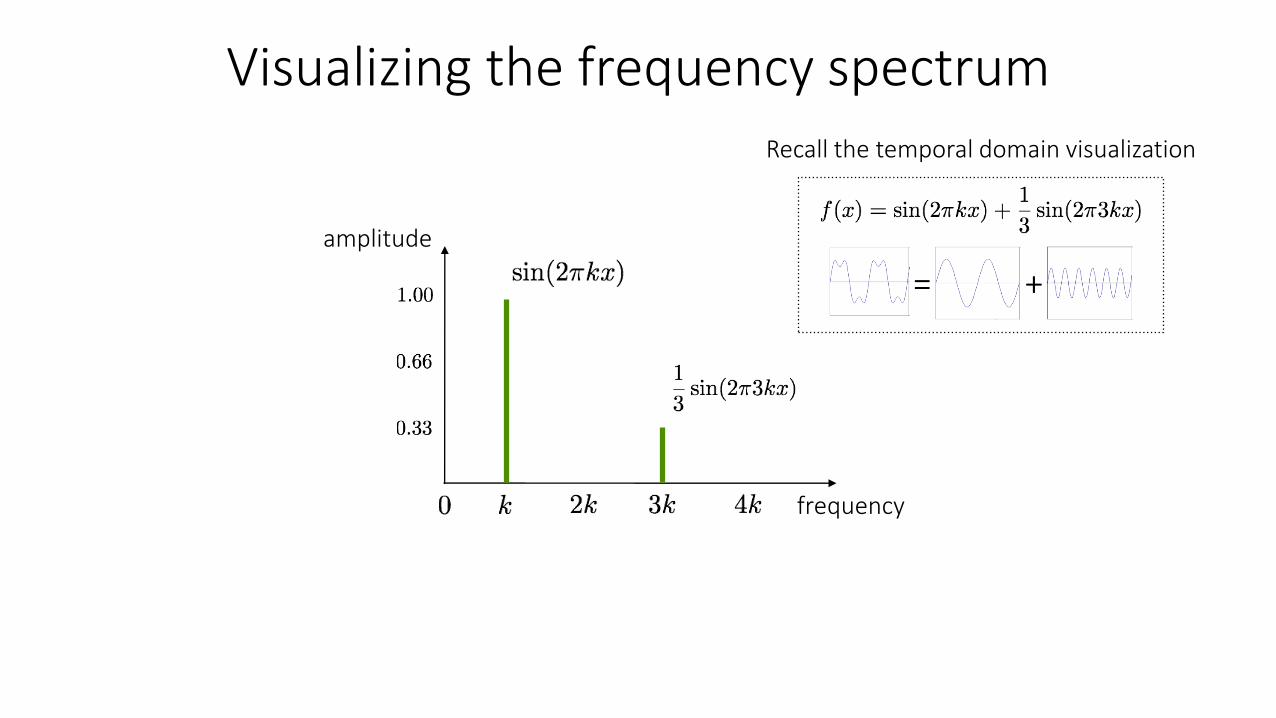
Visualizing the frequency spectrum
frequency
amplitude
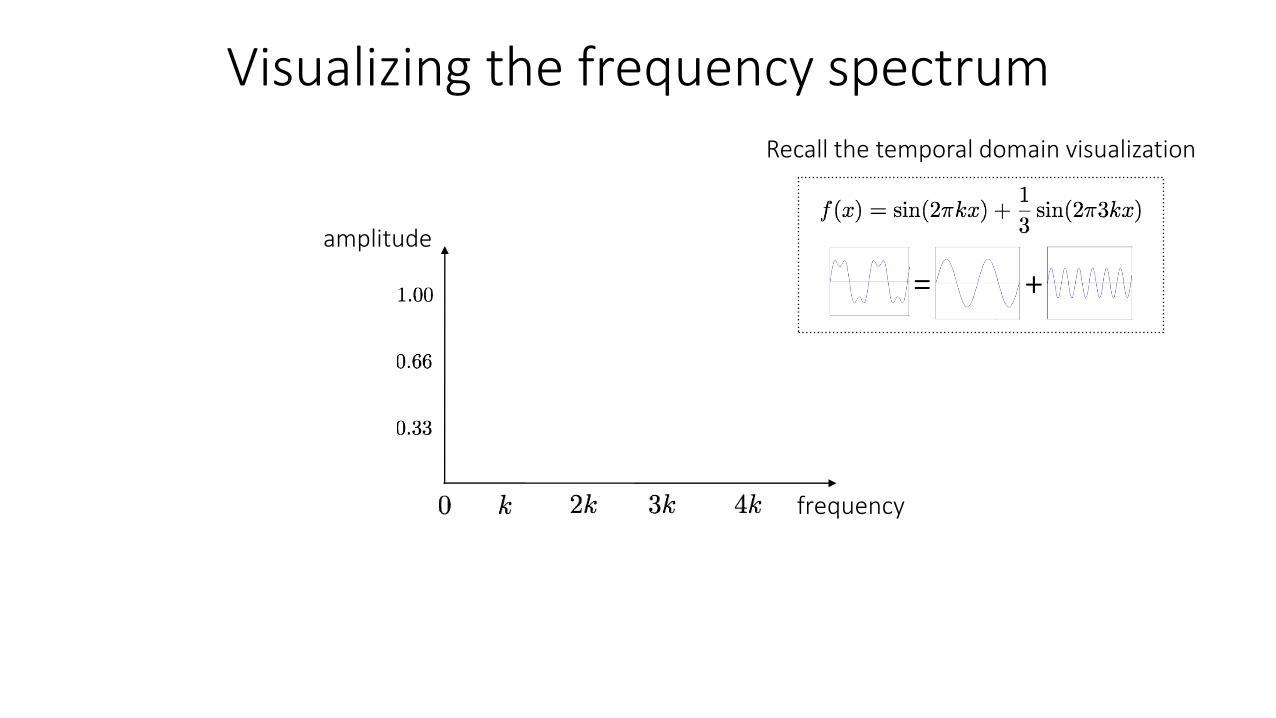
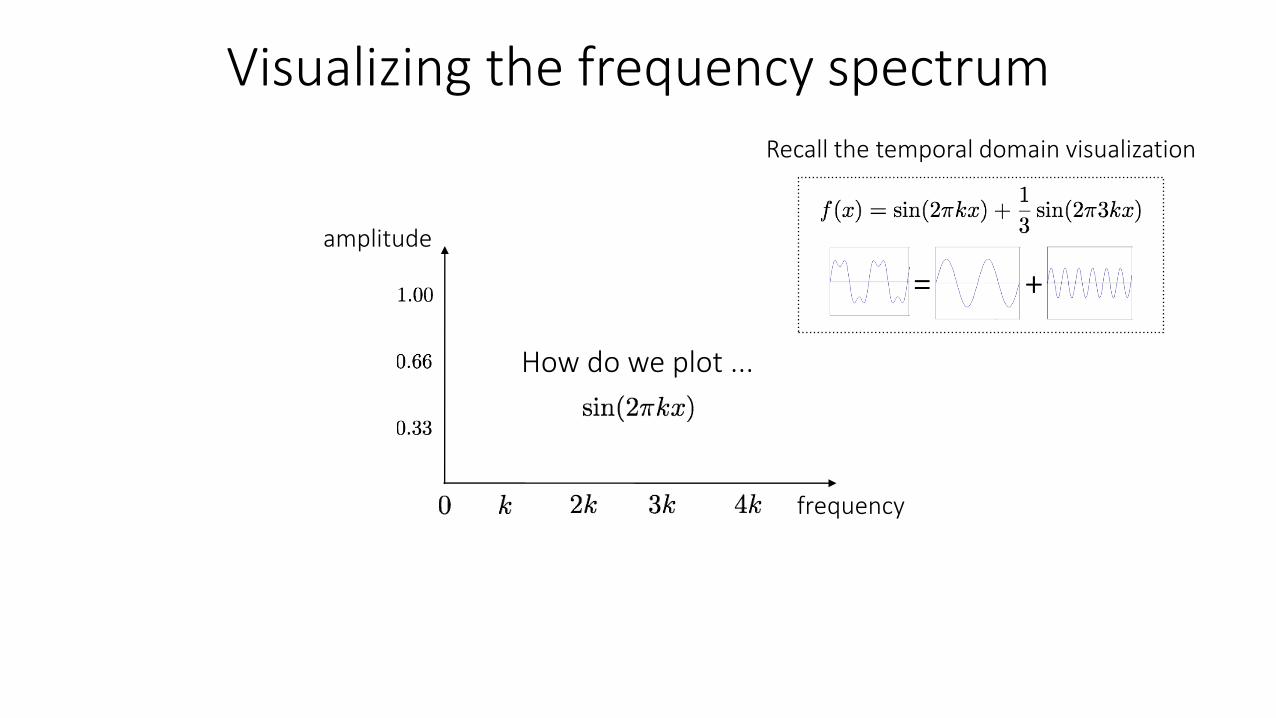
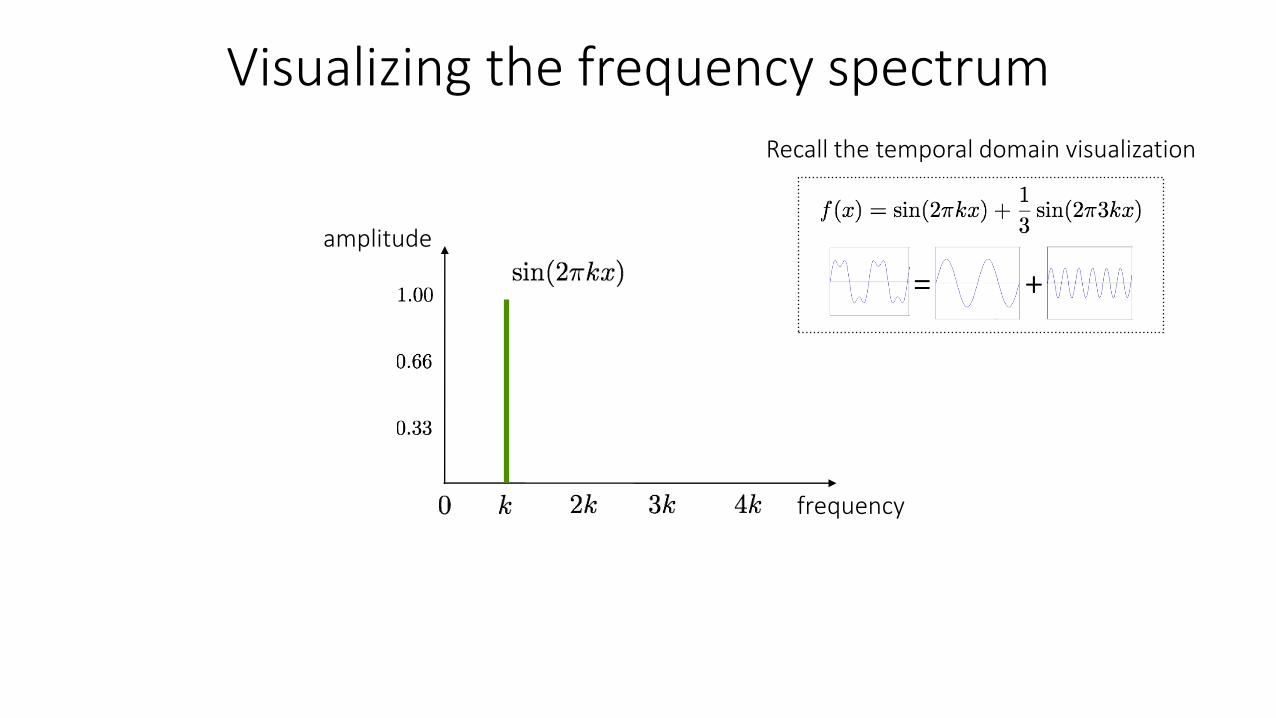
Visualizing the frequency spectrumRecall the temporal domain visualization
+=
frequency
amplitude
Visualizing the frequency spectrumRecall the temporal domain visualization
+=
How do we plot ...
frequency
amplitude
Visualizing the frequency spectrumRecall the temporal domain visualization
+=
frequency
amplitude
Visualizing the frequency spectrumRecall the temporal domain visualization
+=
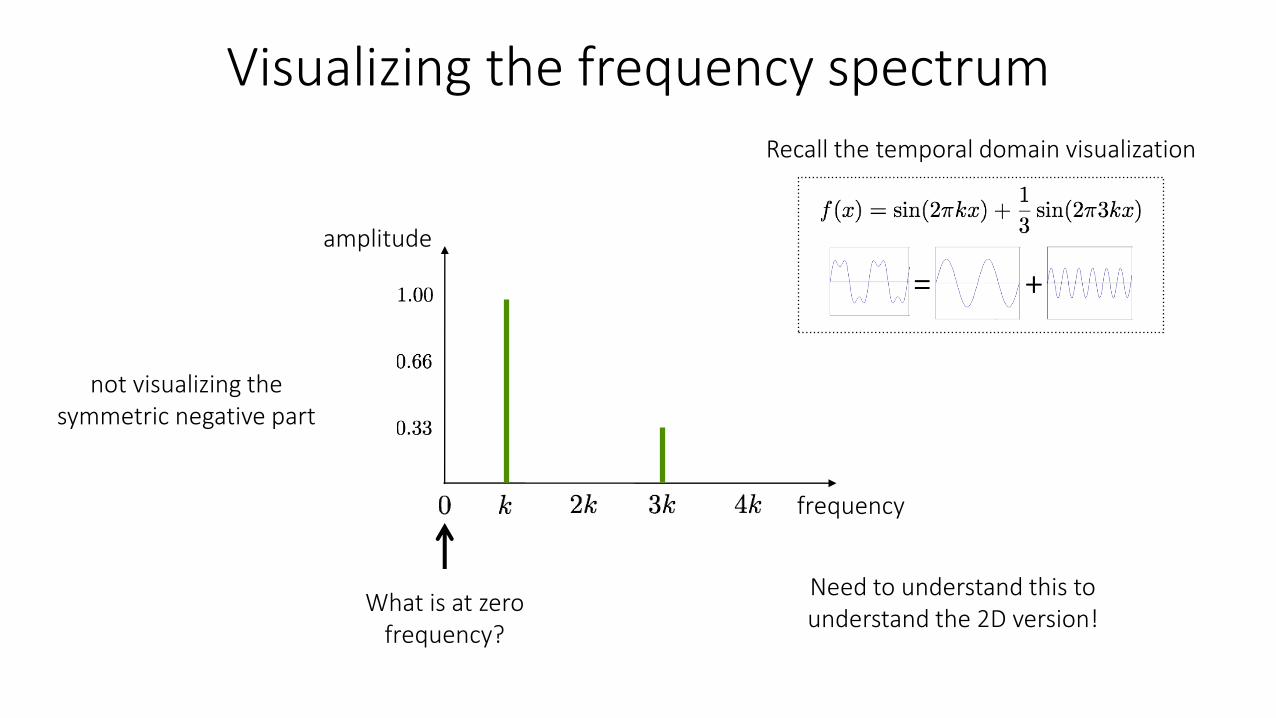
not visualizing the symmetric negative part
Need to understand this to understand the 2D version!
frequency
amplitude
Visualizing the frequency spectrum
What is at zero frequency?
Recall the temporal domain visualization
+=
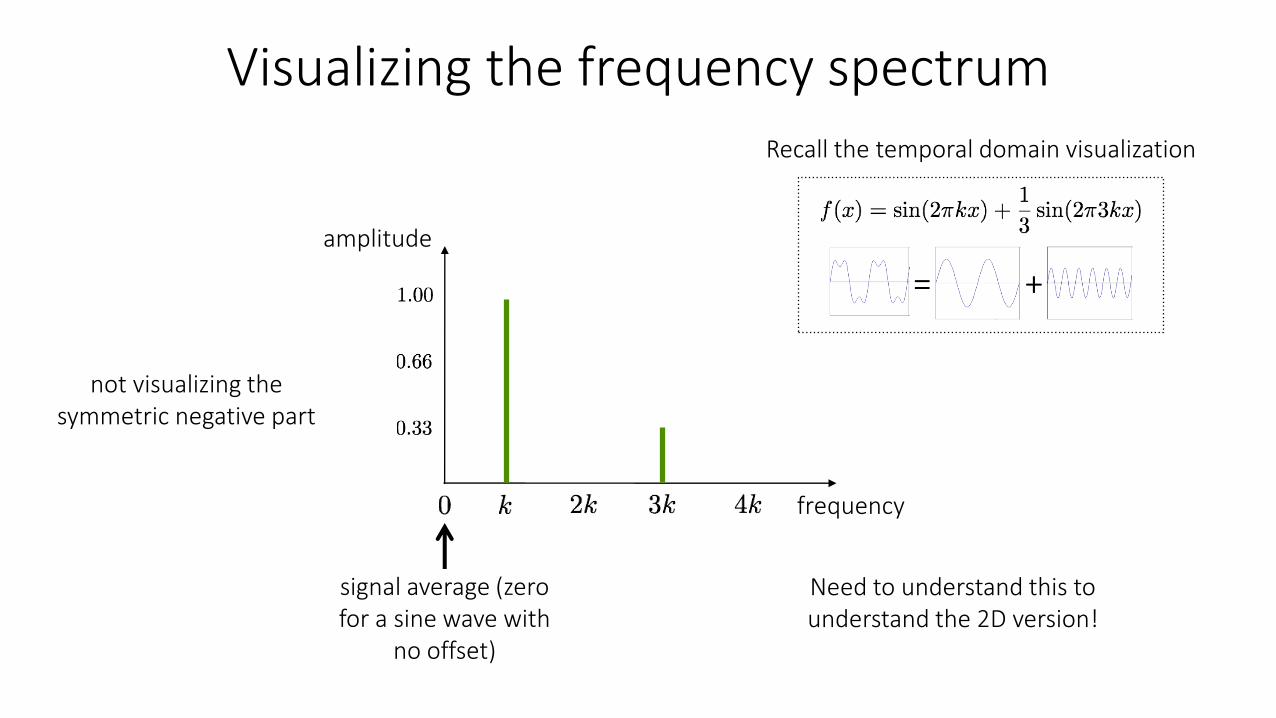
not visualizing the symmetric negative part
Need to understand this to understand the 2D version!
frequency
amplitude
Visualizing the frequency spectrum
signal average (zero for a sine wave with
no offset)
Recall the temporal domain visualization
+=
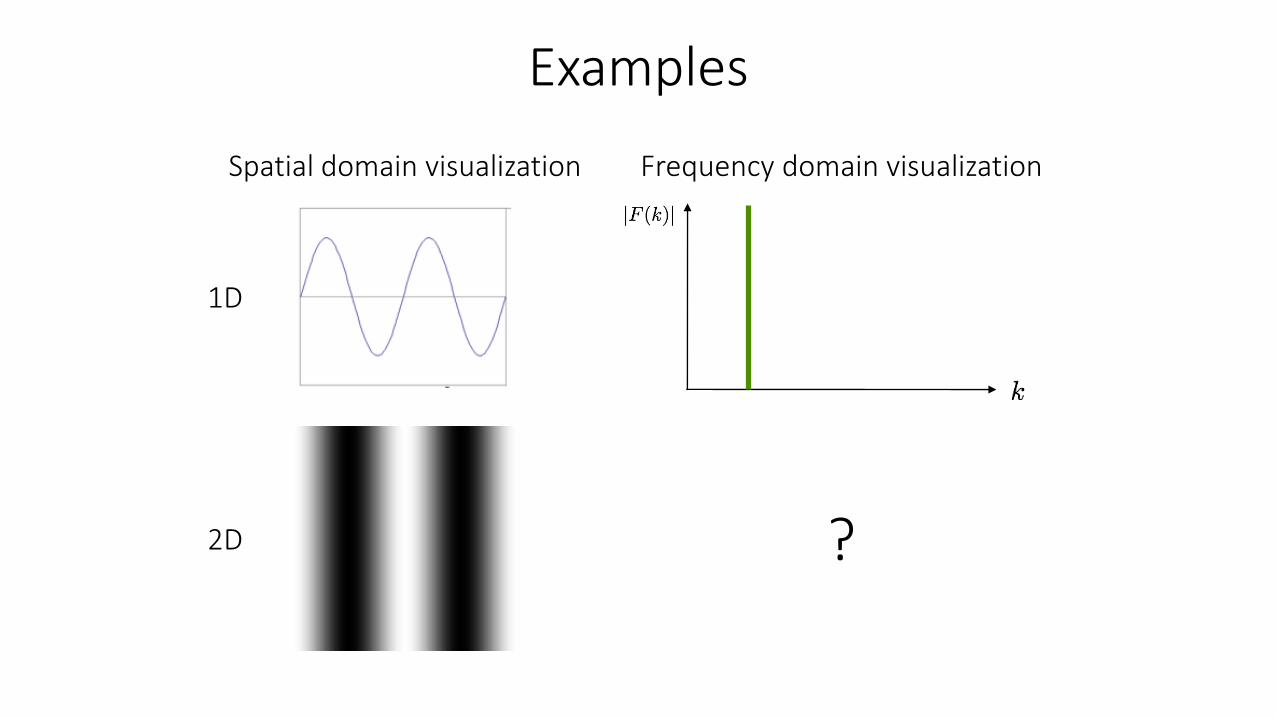
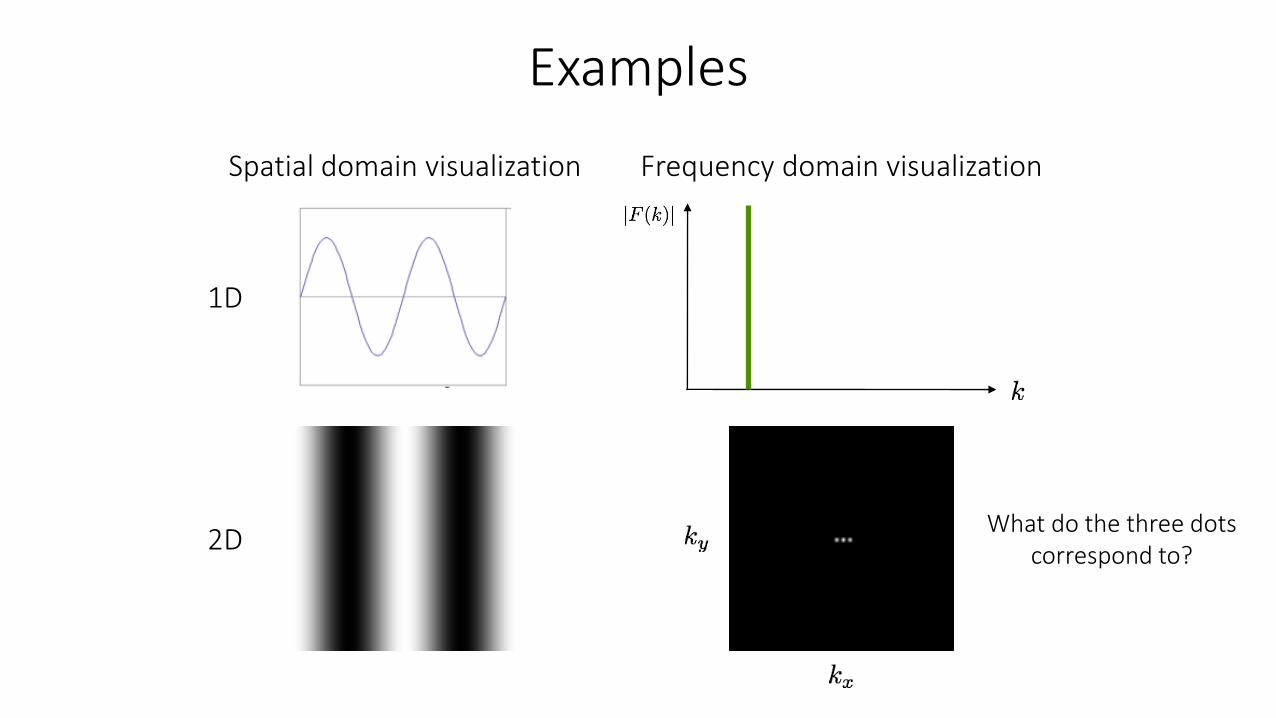
Spatial domain visualization Frequency domain visualization
1D
2D
Examples
?
Spatial domain visualization Frequency domain visualization
1D
2D
Examples
What do the three dots correspond to?
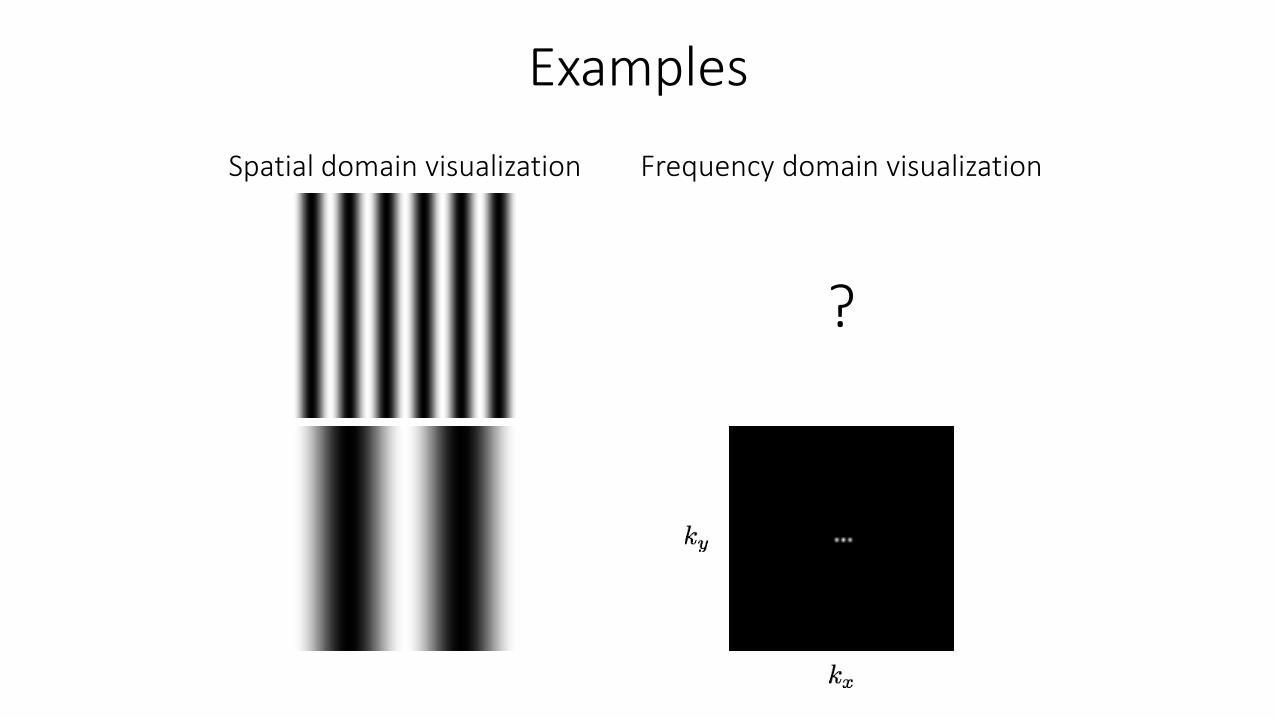
Spatial domain visualization Frequency domain visualization
Examples
?
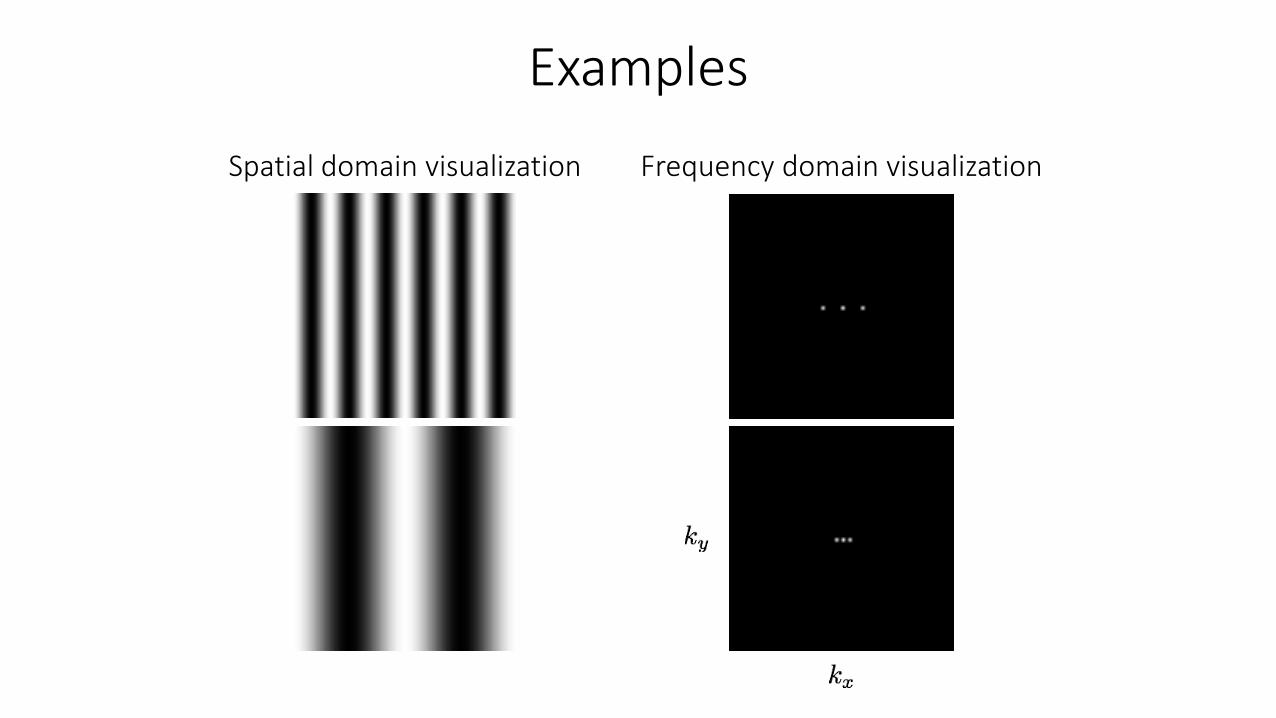
Spatial domain visualization Frequency domain visualization
Examples
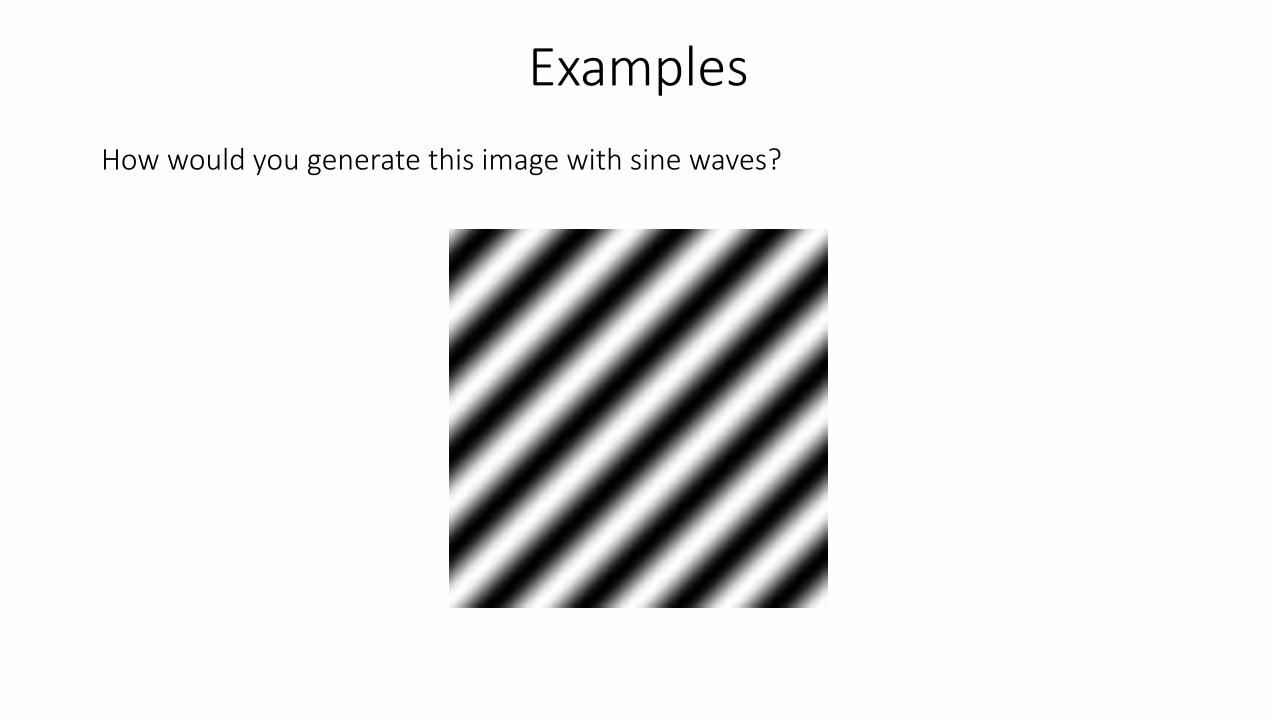
How would you generate this image with sine waves?
Examples
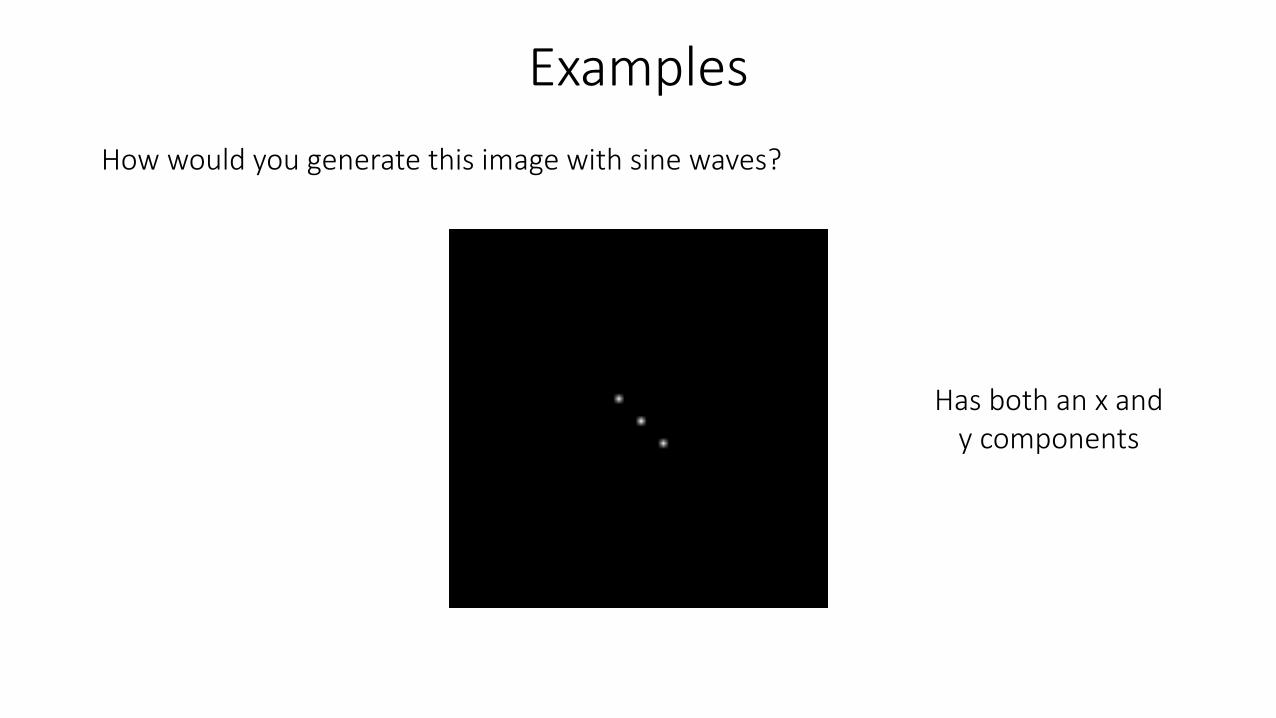
How would you generate this image with sine waves?
Examples
Has both an x and y components
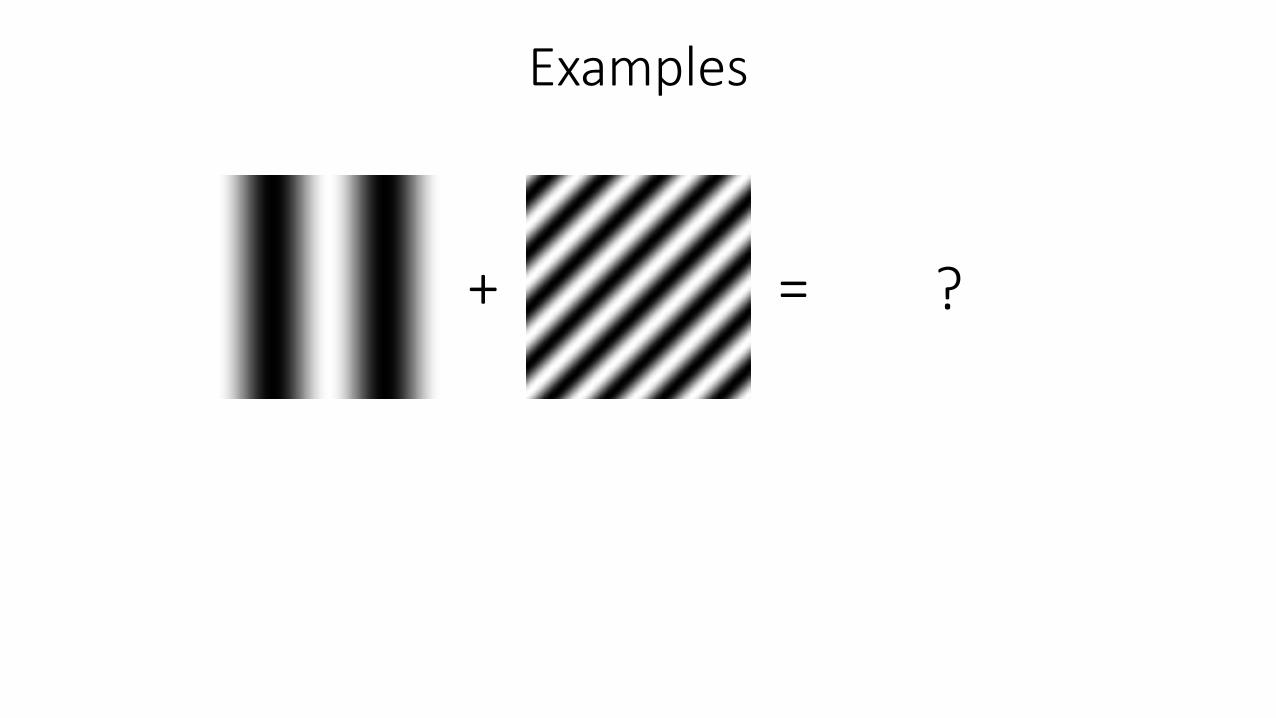
Examples
=+ ?
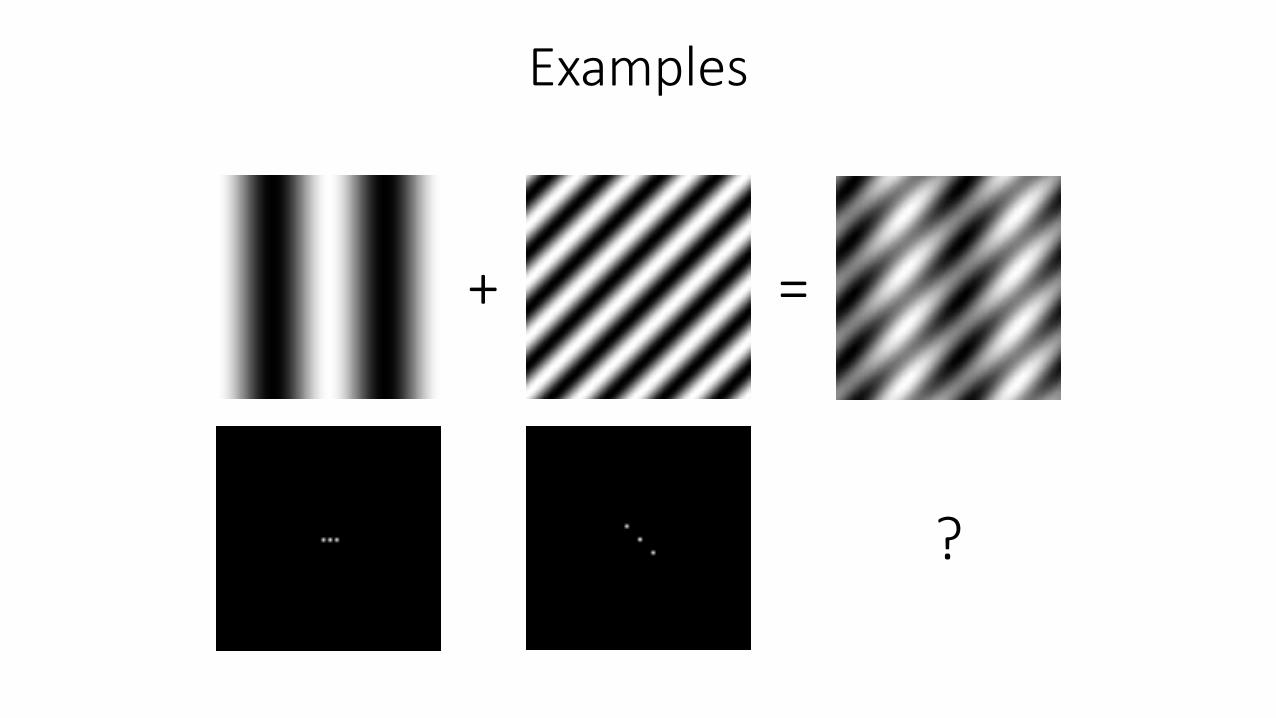
Examples
=+
?
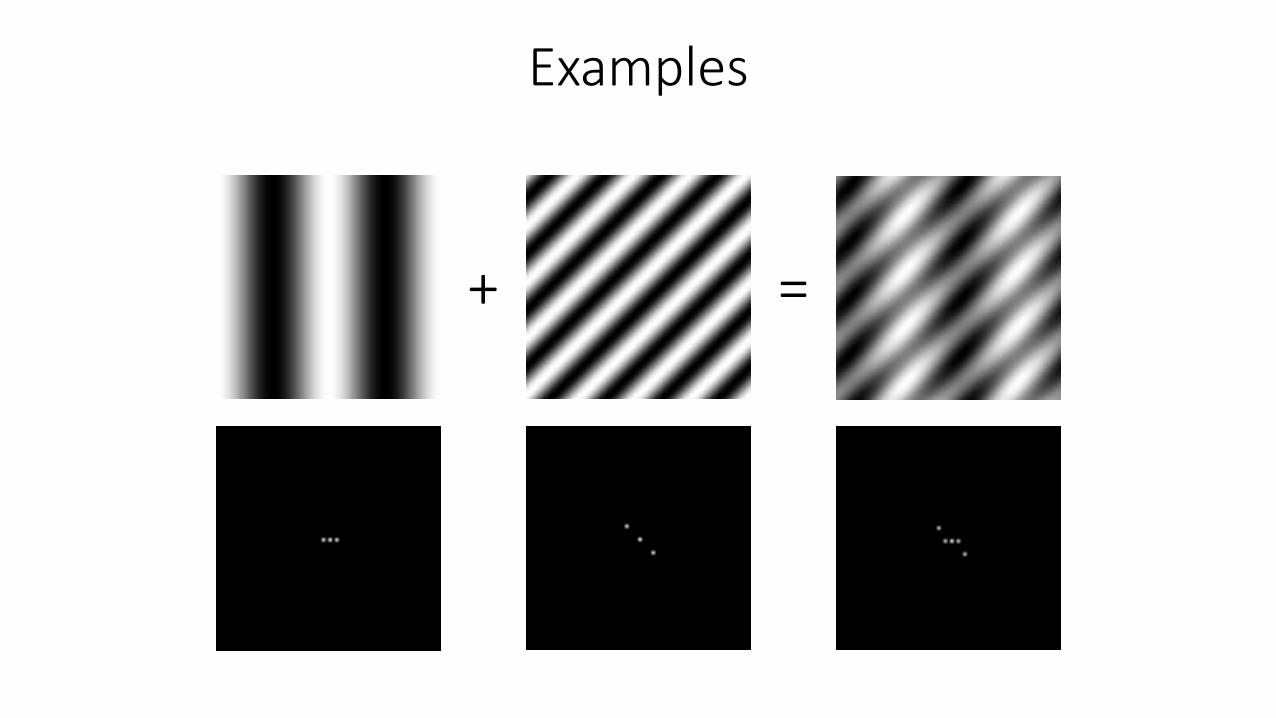
Examples
=+
Fourier’s claim: Add enough of these to get any periodic signal you want!
amplitude
angularfrequency
variablephase
sinusoid
Basic building block
What about non-periodic signals?
Fourier transform
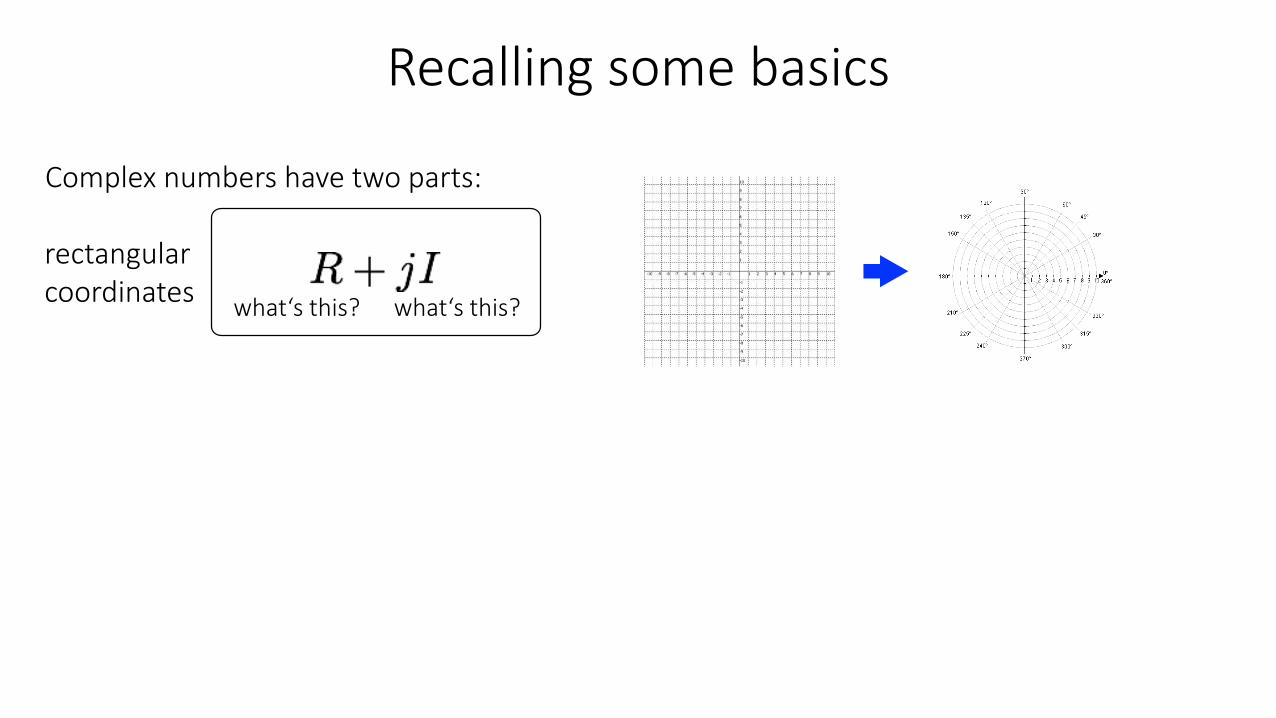
Recalling some basics
rectangularcoordinates
Complex numbers have two parts:
what‘s this? what‘s this?
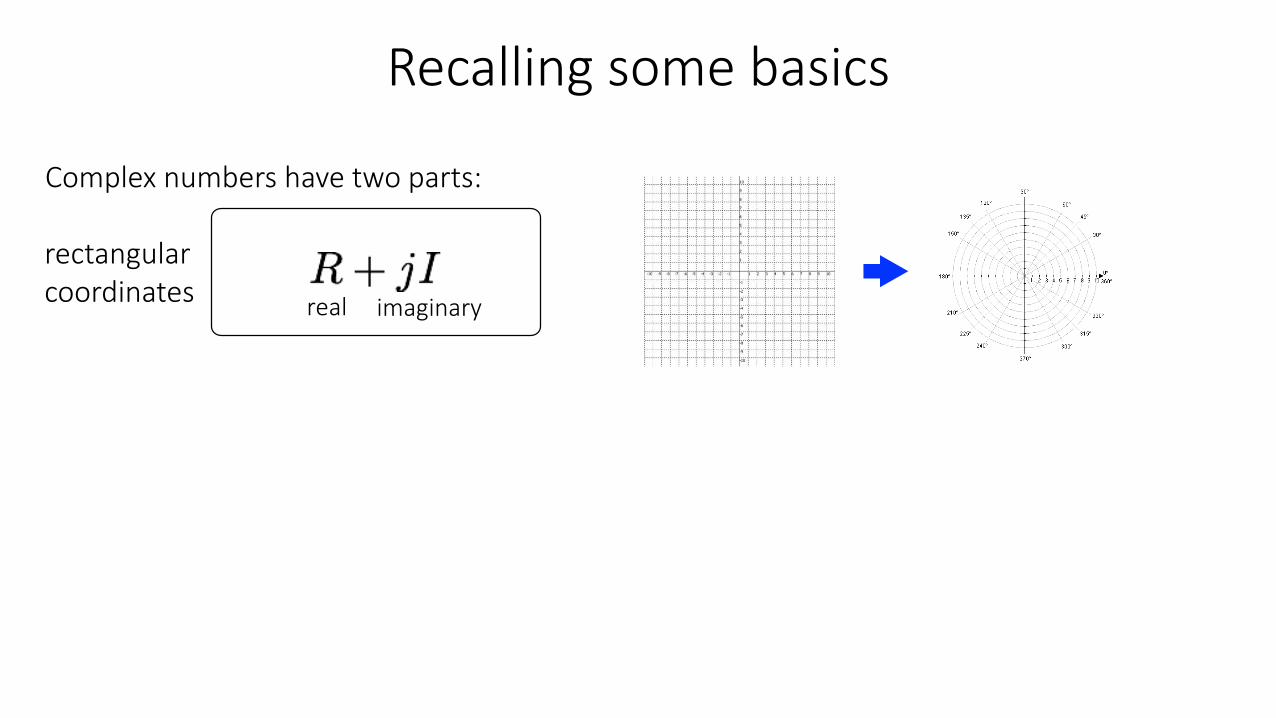
Recalling some basics
rectangularcoordinates
Complex numbers have two parts:
real imaginary
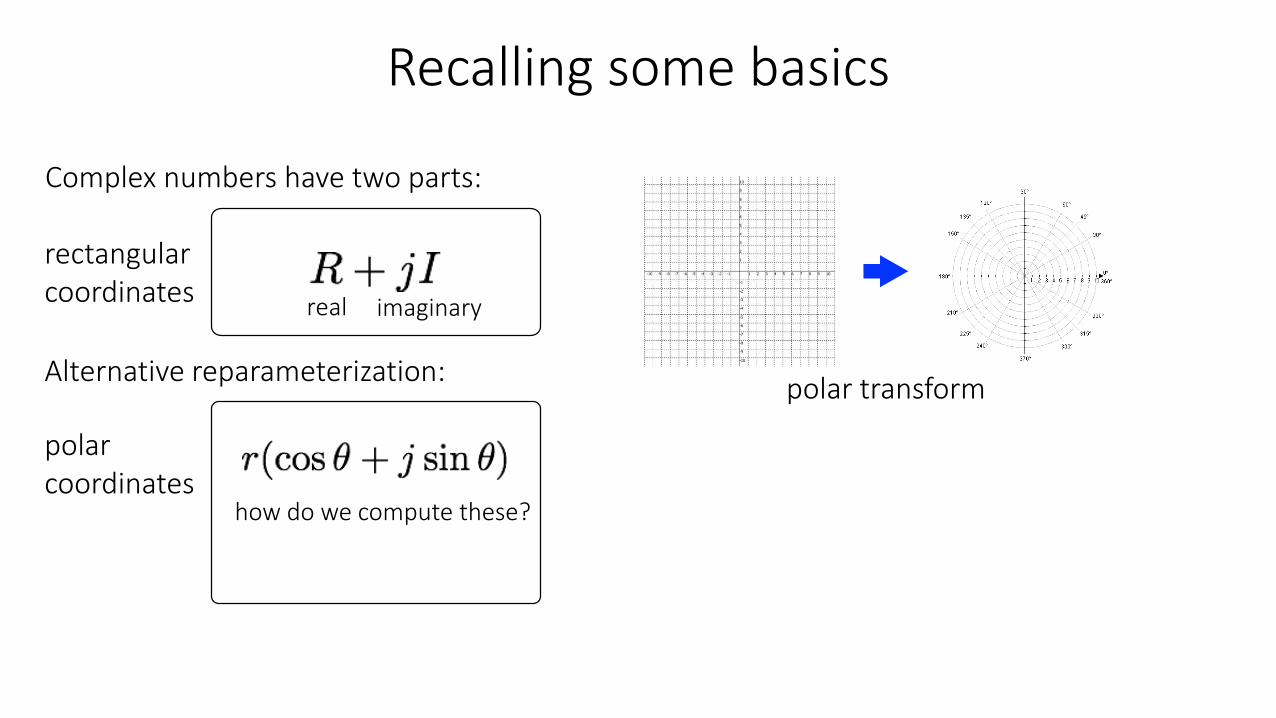
Recalling some basics
rectangularcoordinates
polar coordinates
Complex numbers have two parts:
real imaginary
Alternative reparameterization:
how do we compute these?
polar transform
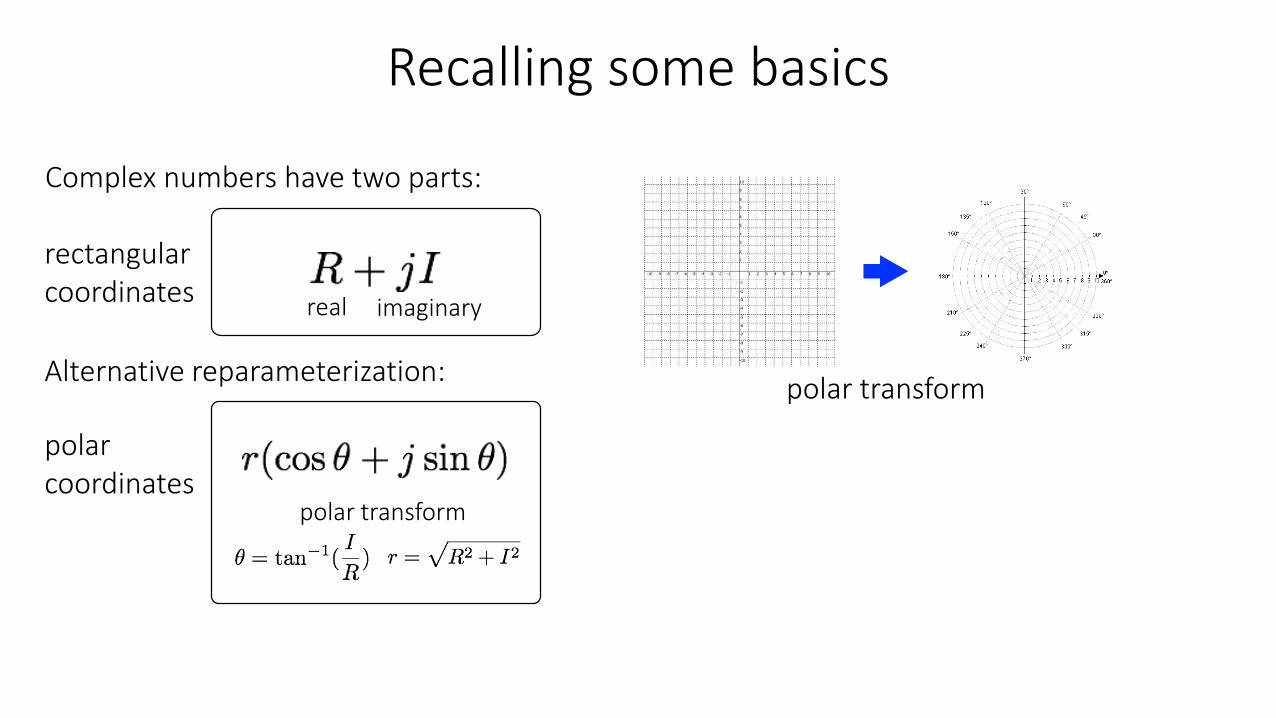
Recalling some basics
rectangularcoordinates
polar coordinates
Complex numbers have two parts:
real imaginary
Alternative reparameterization:
polar transform
polar transform
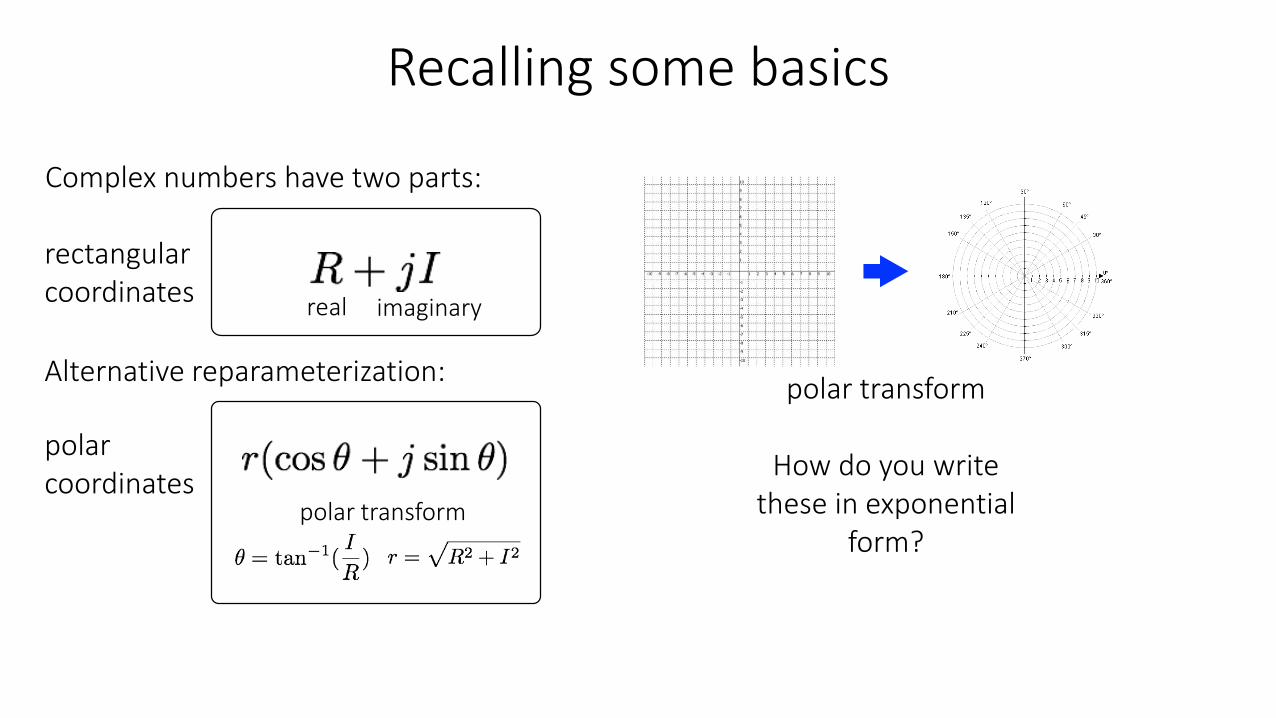
Recalling some basics
rectangularcoordinates
polar coordinates
Complex numbers have two parts:
real imaginary
Alternative reparameterization:
polar transform
polar transform
How do you write these in exponential
form?
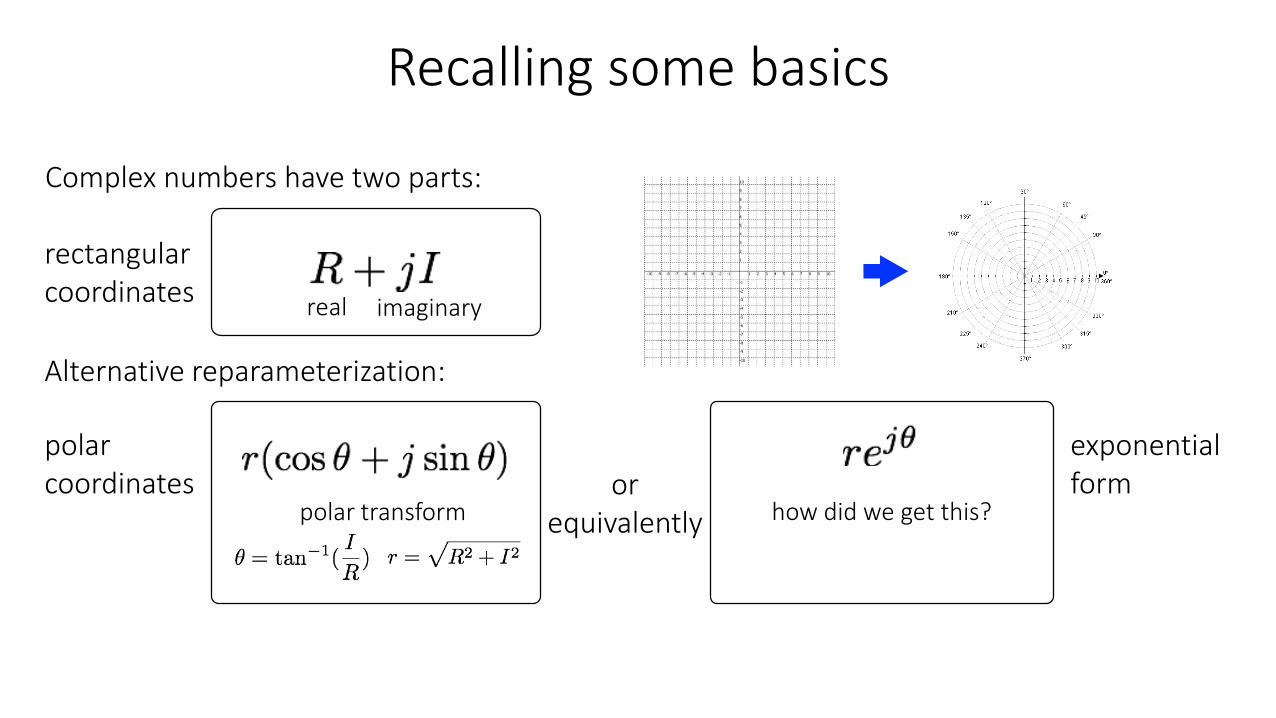
Recalling some basics
rectangularcoordinates
polar coordinates
Complex numbers have two parts:
real imaginary
Alternative reparameterization:
or equivalentlypolar transform
exponential form
how did we get this?
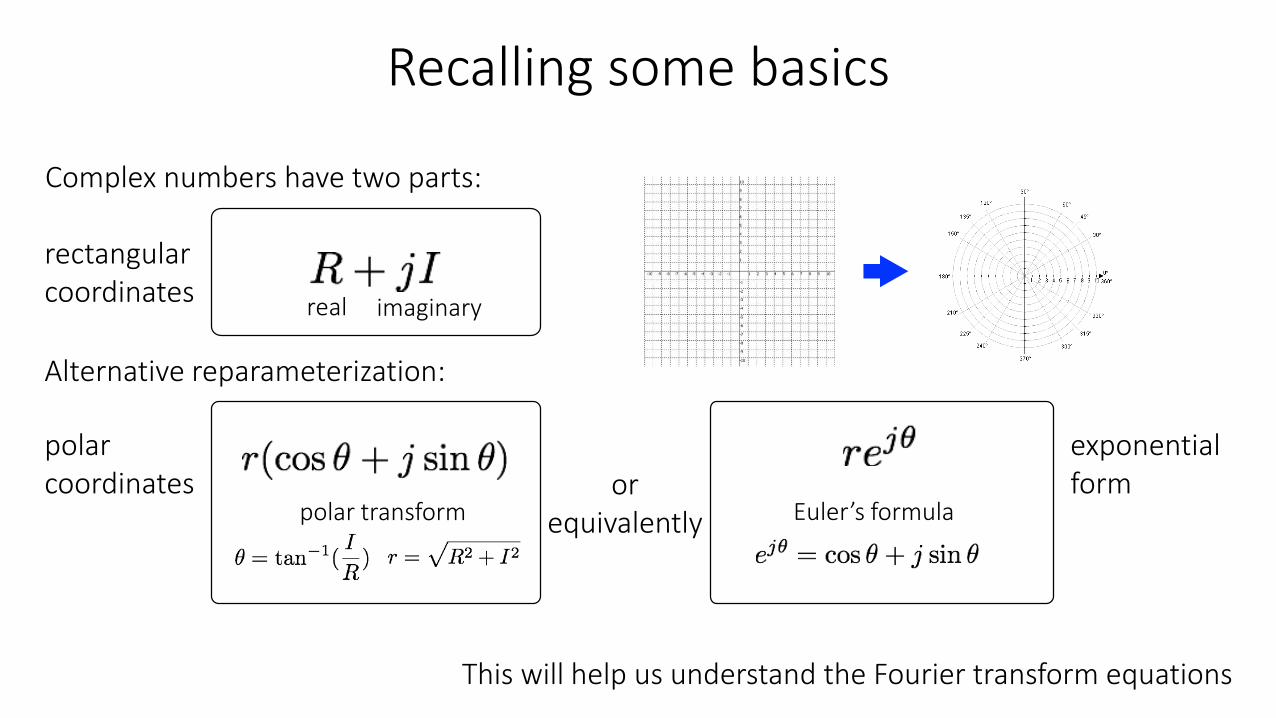
This will help us understand the Fourier transform equations
Recalling some basics
rectangularcoordinates
polar coordinates
Complex numbers have two parts:
real imaginary
Alternative reparameterization:
or equivalentlypolar transform
exponential form
Euler’s formula
Fourier transform
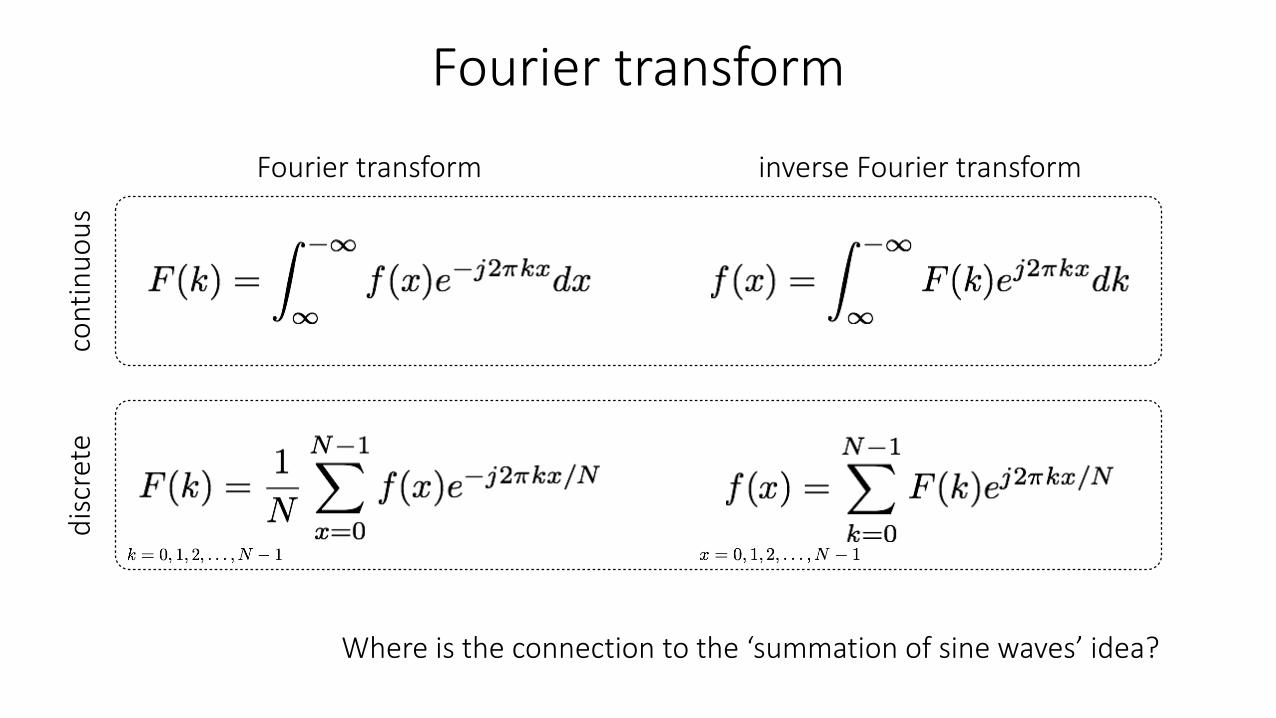
Fourier transform
dis
cret
eco
nti
nu
ou
s
inverse Fourier transform
Where is the connection to the ‘summation of sine waves’ idea?
Fourier transform
Fourier transform
dis
cret
eco
nti
nu
ou
s
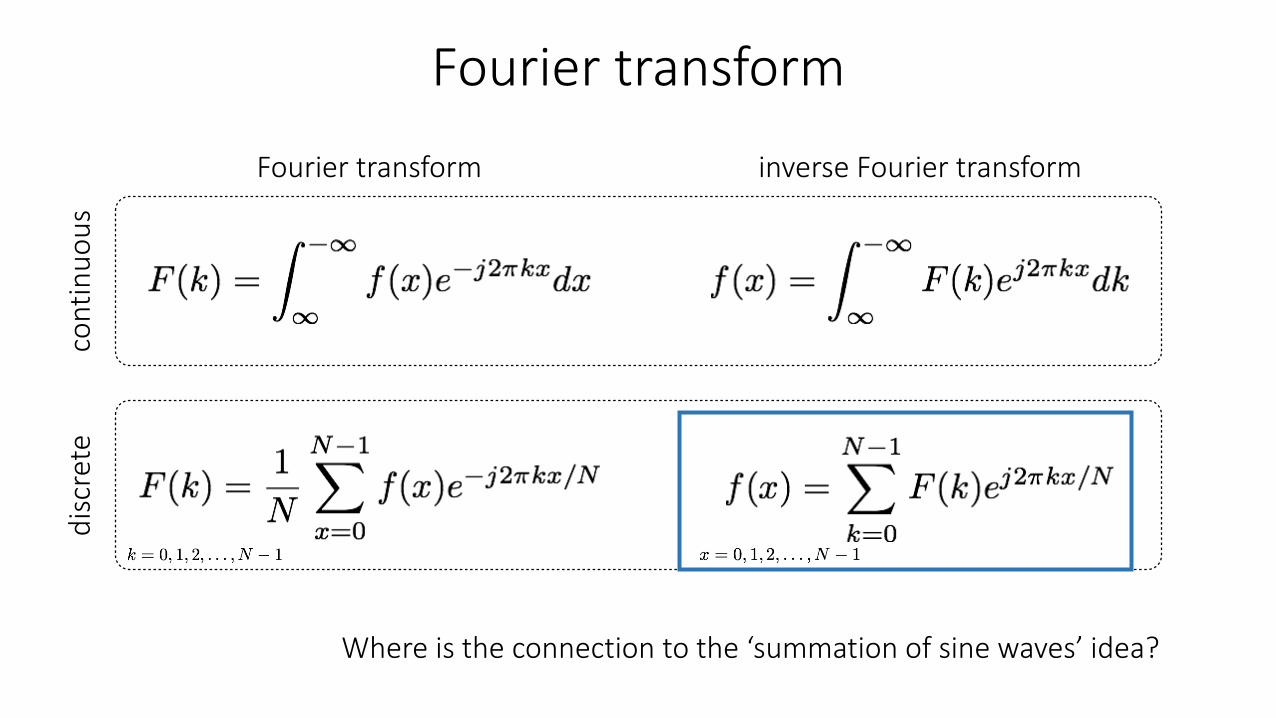
inverse Fourier transform
Where is the connection to the ‘summation of sine waves’ idea?
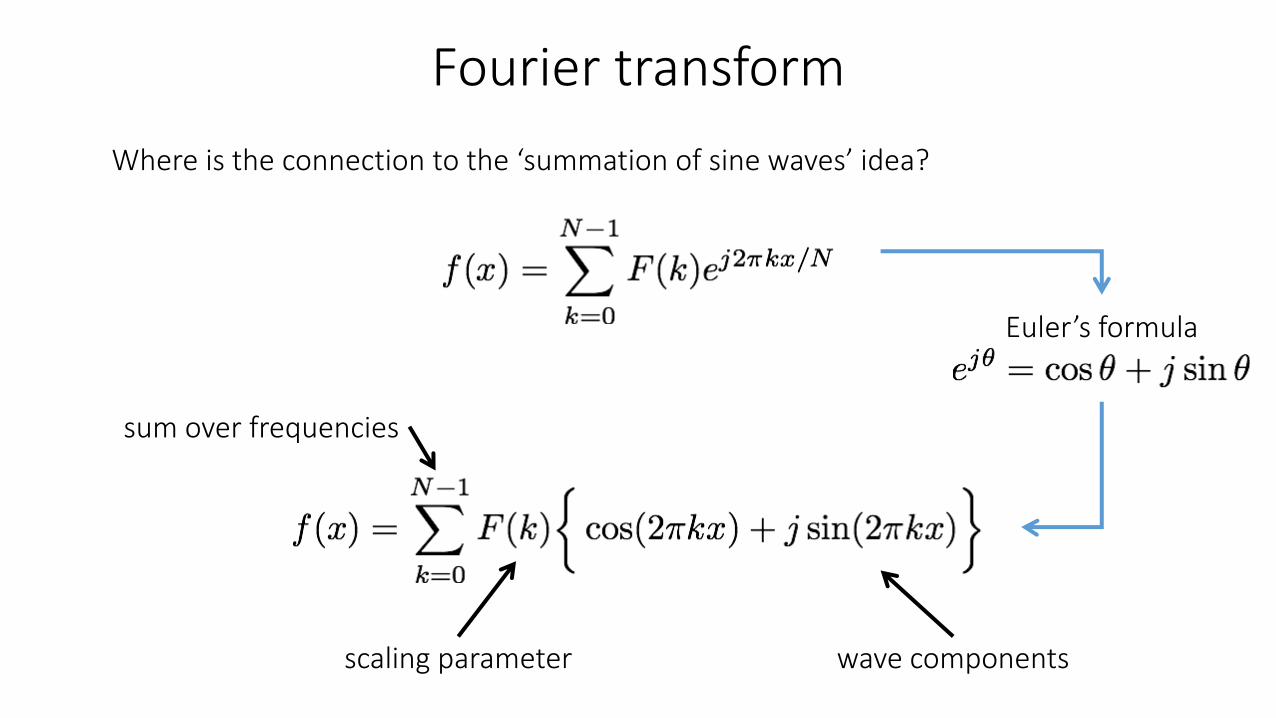
Where is the connection to the ‘summation of sine waves’ idea?
wave componentsscaling parameter
sum over frequencies
Euler’s formula
Fourier transform
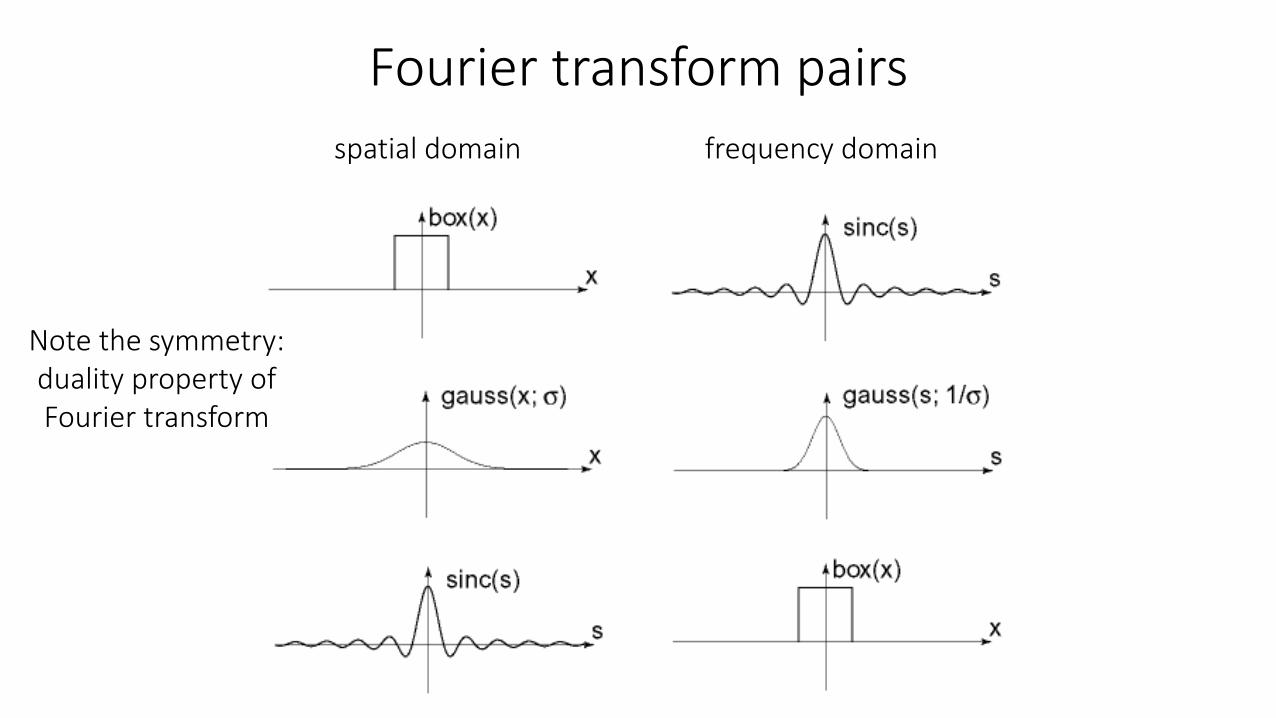
Fourier transform pairsspatial domain frequency domain
Note the symmetry: duality property of Fourier transform
Computing the discrete Fourier transform (DFT)
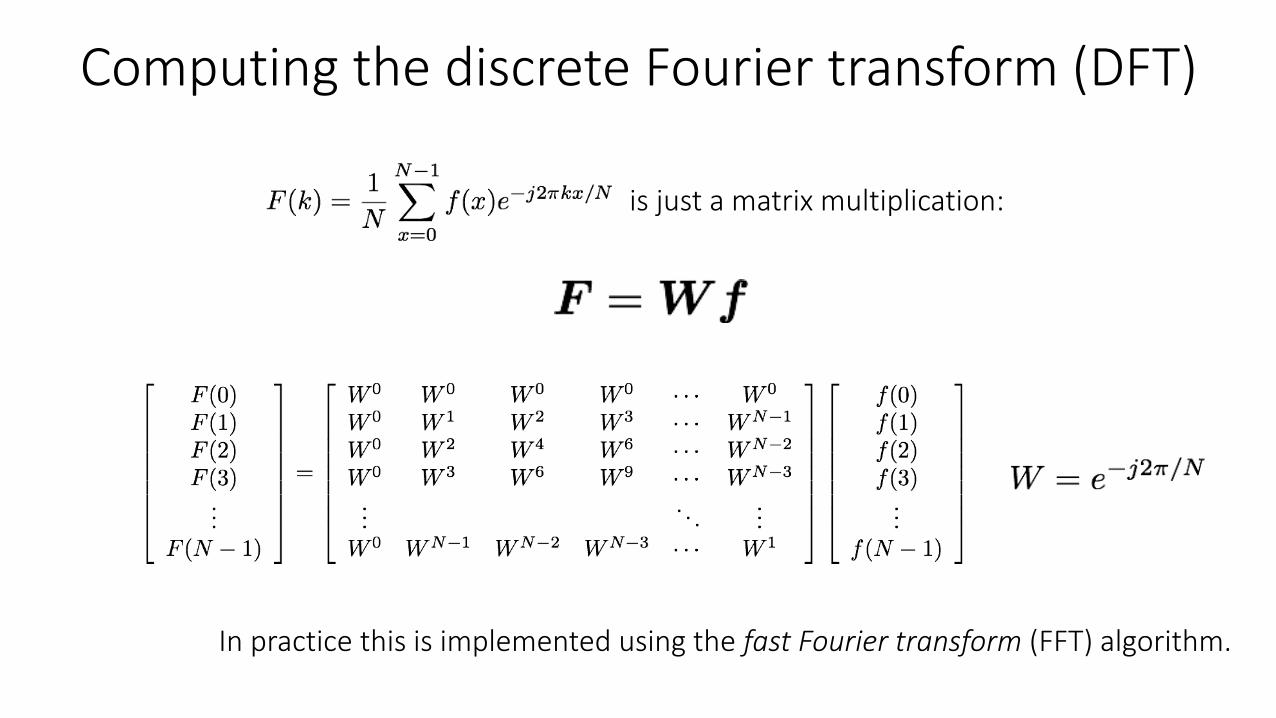
Computing the discrete Fourier transform (DFT)
is just a matrix multiplication:
In practice this is implemented using the fast Fourier transform (FFT) algorithm.
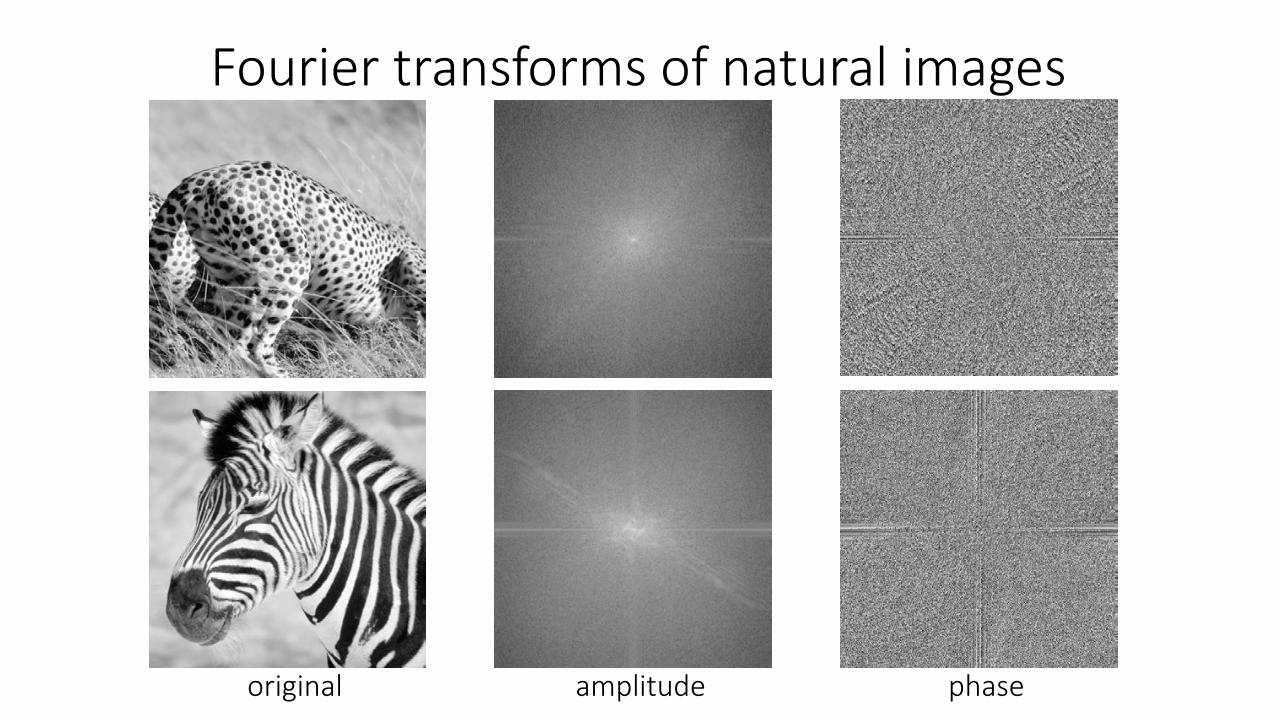
Fourier transforms of natural images
original amplitude phase
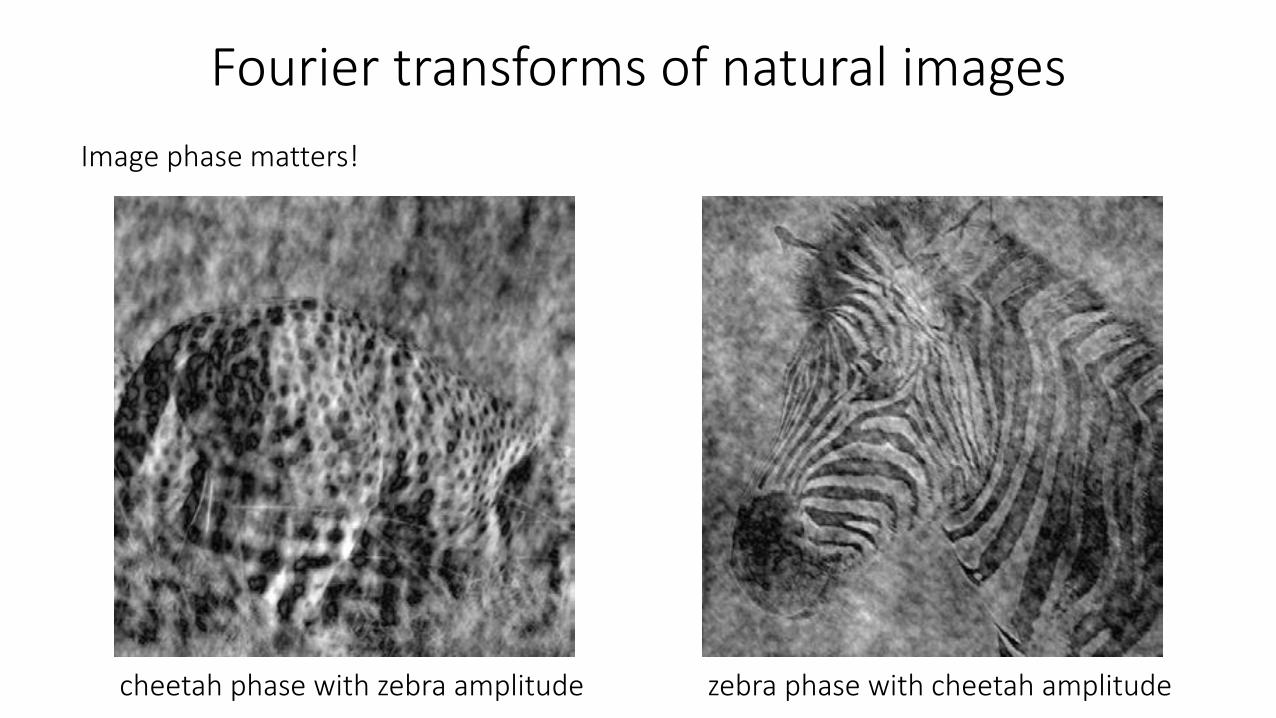
Fourier transforms of natural images
cheetah phase with zebra amplitude
Image phase matters!
zebra phase with cheetah amplitude
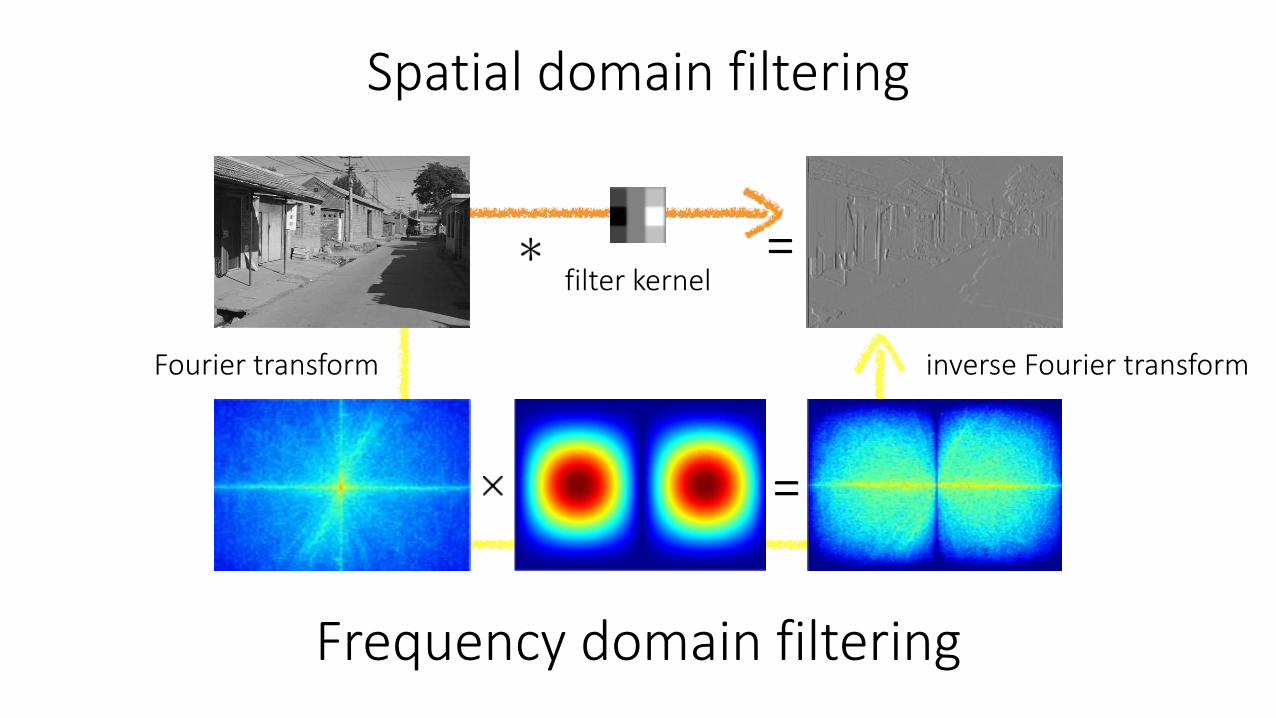
Frequency-domain filtering

Why do we care about all this?
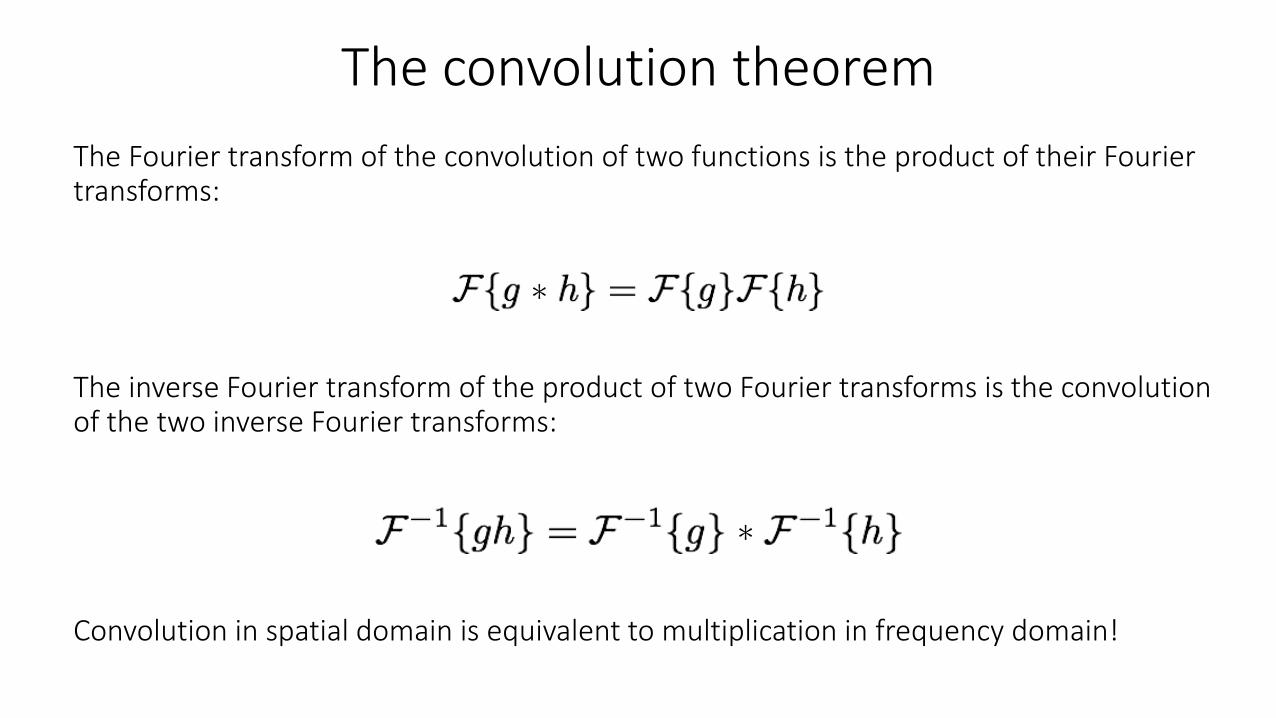
Convolution in spatial domain is equivalent to multiplication in frequency domain!
The convolution theorem
The Fourier transform of the convolution of two functions is the product of their Fourier transforms:
The inverse Fourier transform of the product of two Fourier transforms is the convolution of the two inverse Fourier transforms:
What do we use convolution for?
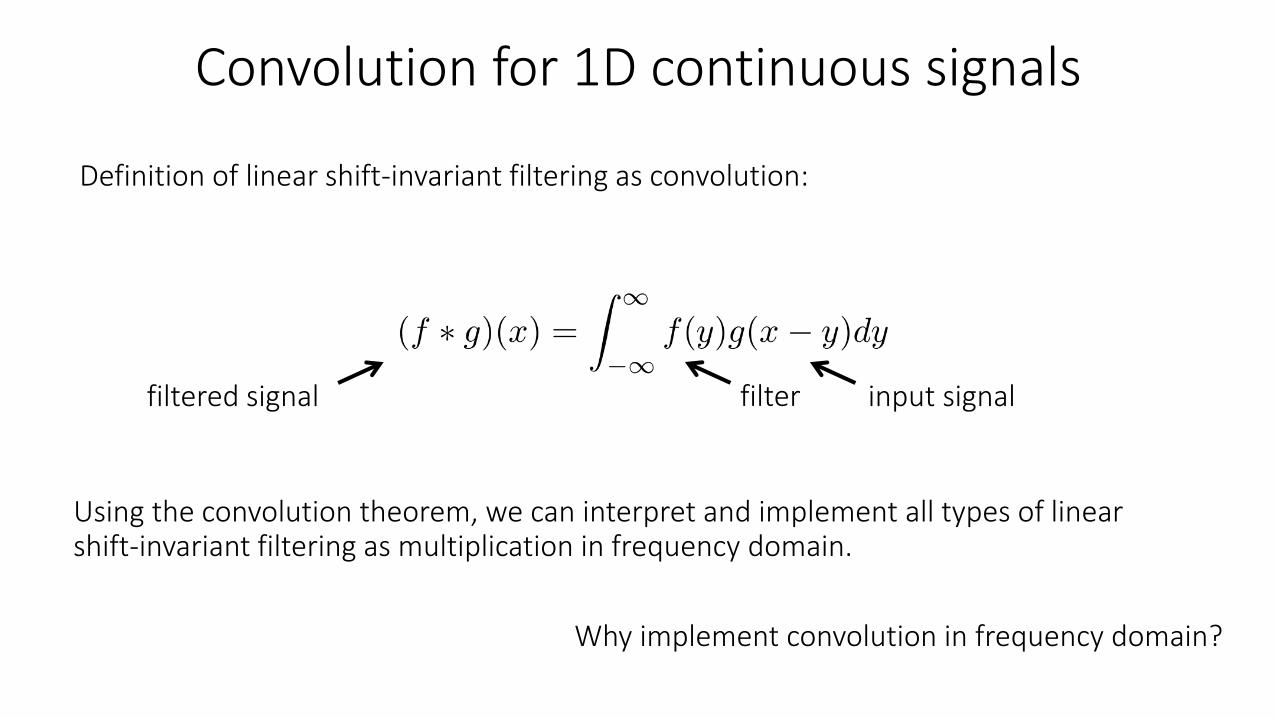
Convolution for 1D continuous signals
Definition of linear shift-invariant filtering as convolution:
filtered signal input signalfilter
Using the convolution theorem, we can interpret and implement all types of linear shift-invariant filtering as multiplication in frequency domain.
Why implement convolution in frequency domain?
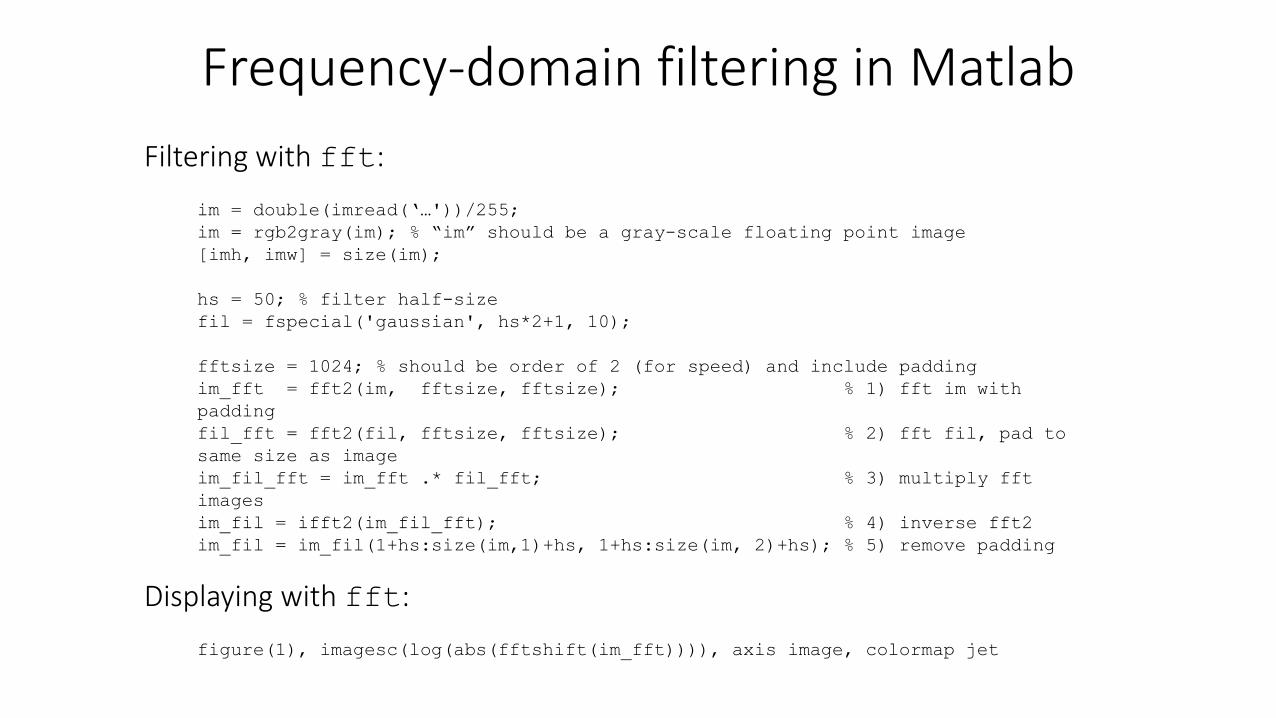
Filtering with fft:
im = double(imread(‘…'))/255;
im = rgb2gray(im); % “im” should be a gray-scale floating point image
[imh, imw] = size(im);
hs = 50; % filter half-size
fil = fspecial('gaussian', hs*2+1, 10);
fftsize = 1024; % should be order of 2 (for speed) and include padding
im_fft = fft2(im, fftsize, fftsize); % 1) fft im with
padding
fil_fft = fft2(fil, fftsize, fftsize); % 2) fft fil, pad to
same size as image
im_fil_fft = im_fft .* fil_fft; % 3) multiply fft
images
im_fil = ifft2(im_fil_fft); % 4) inverse fft2
im_fil = im_fil(1+hs:size(im,1)+hs, 1+hs:size(im, 2)+hs); % 5) remove padding
figure(1), imagesc(log(abs(fftshift(im_fft)))), axis image, colormap jet
Frequency-domain filtering in Matlab
Displaying with fft:
=filter kernel
=
Spatial domain filtering
Frequency domain filtering
Fourier transform inverse Fourier transform
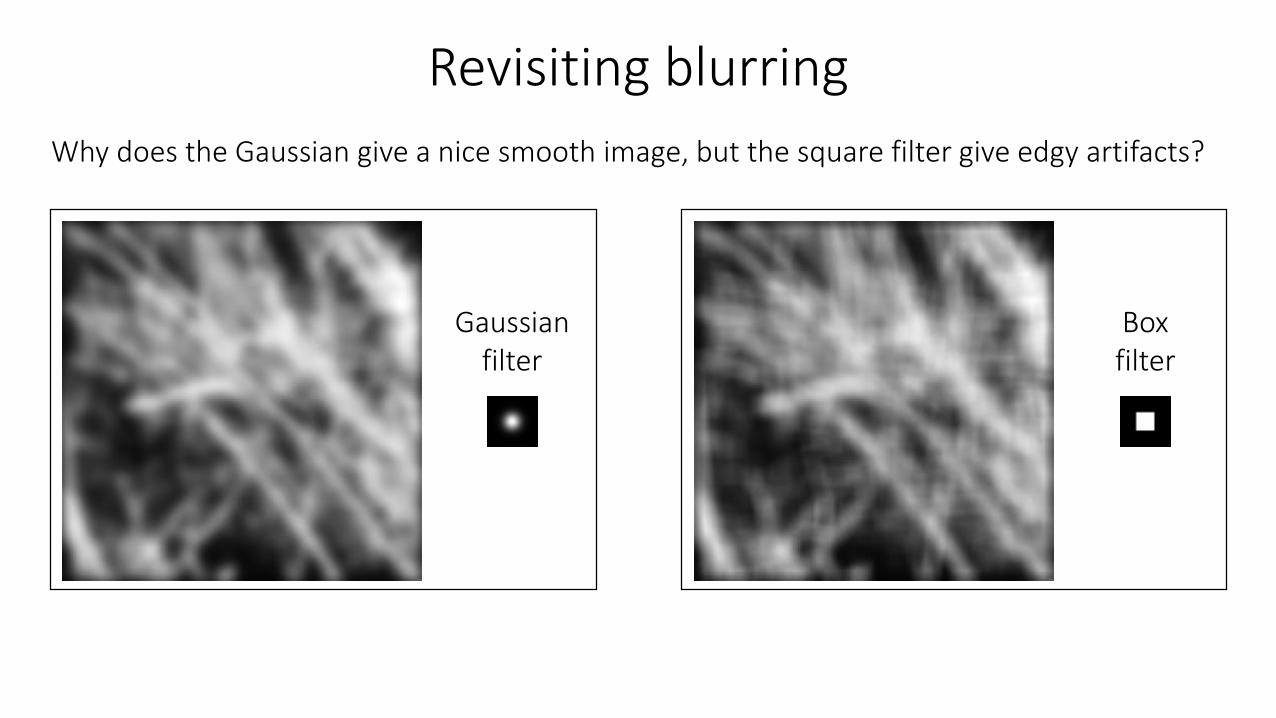
Why does the Gaussian give a nice smooth image, but the square filter give edgy artifacts?
Gaussian filter
Box filter
Revisiting blurring
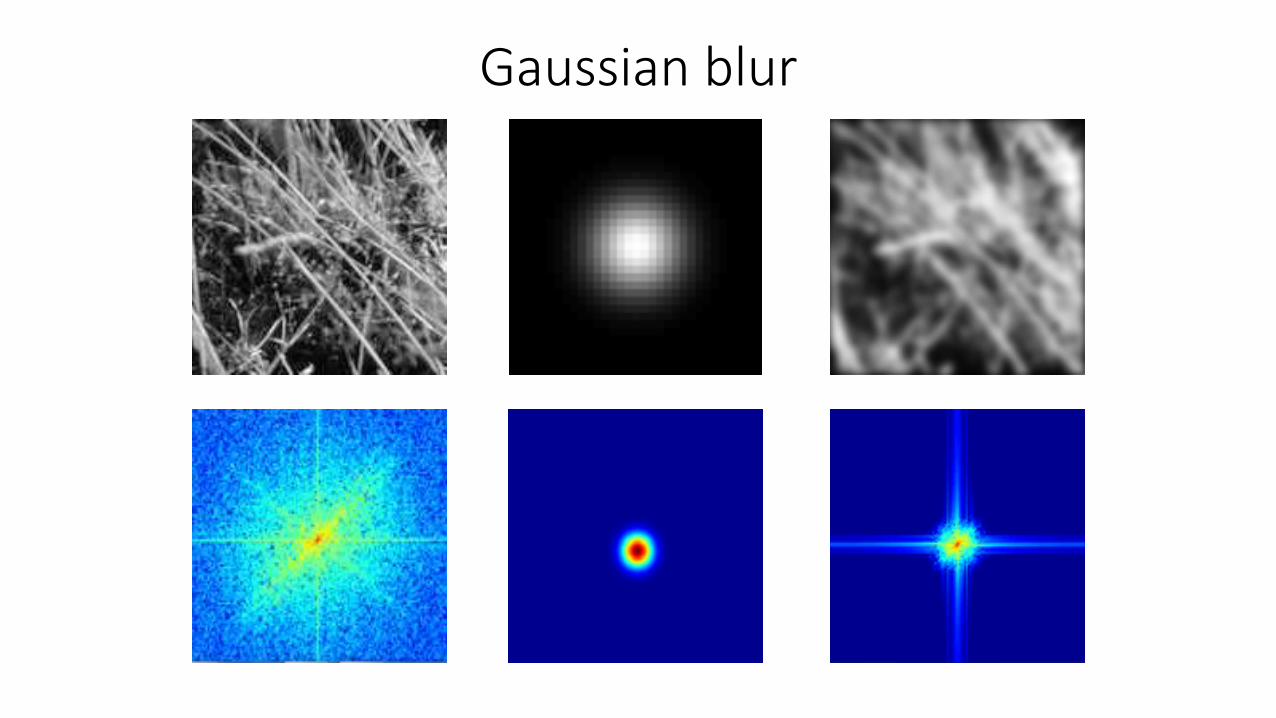
Gaussian blur
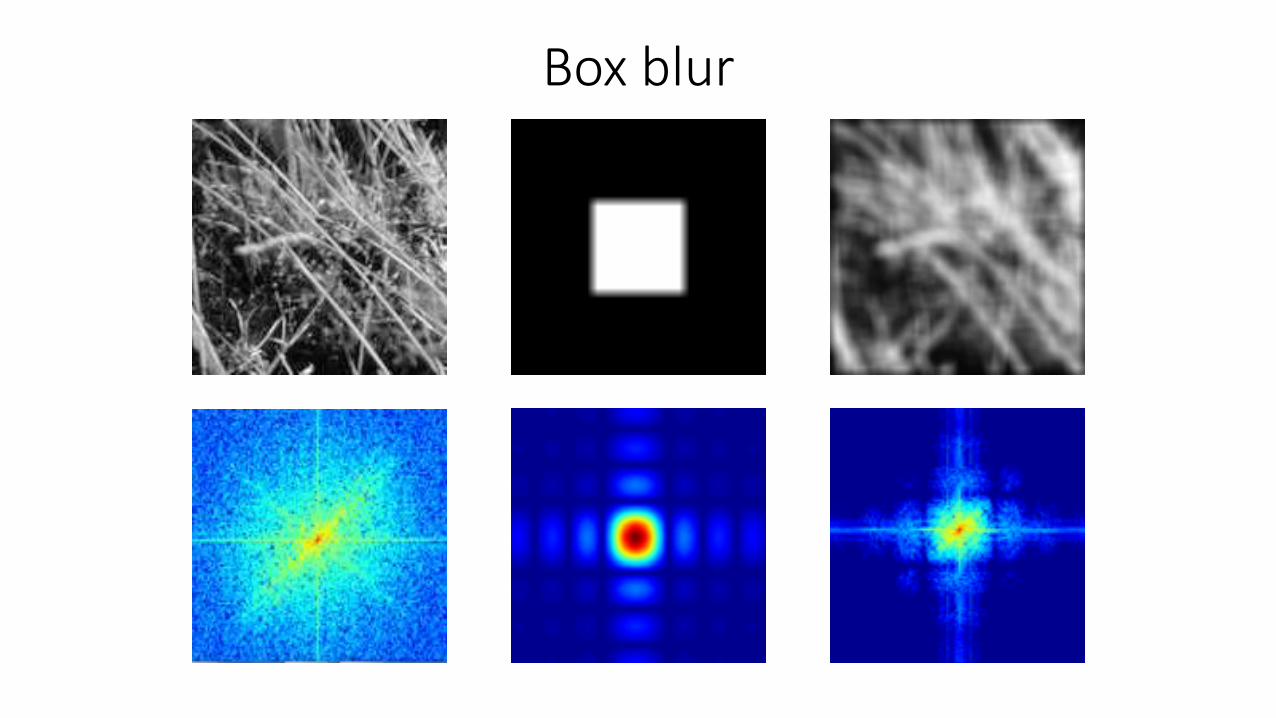
Box blur
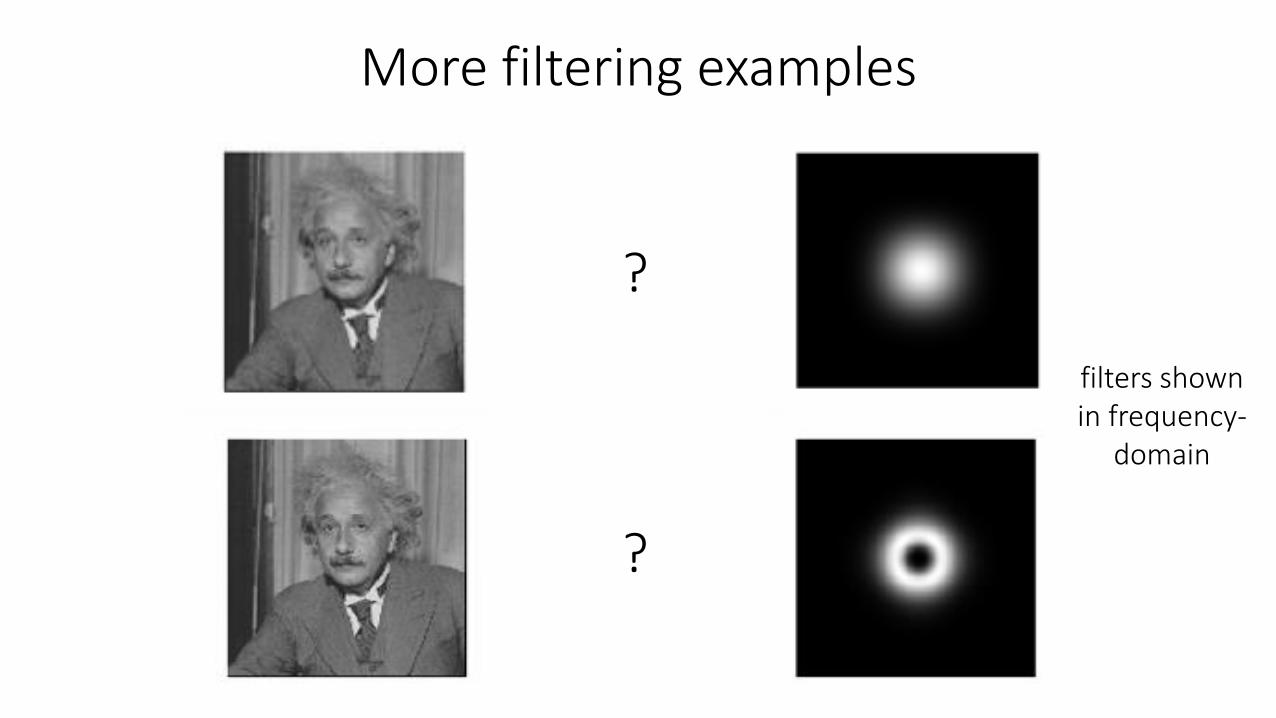
More filtering examples
?
?
filters shown in frequency-
domain
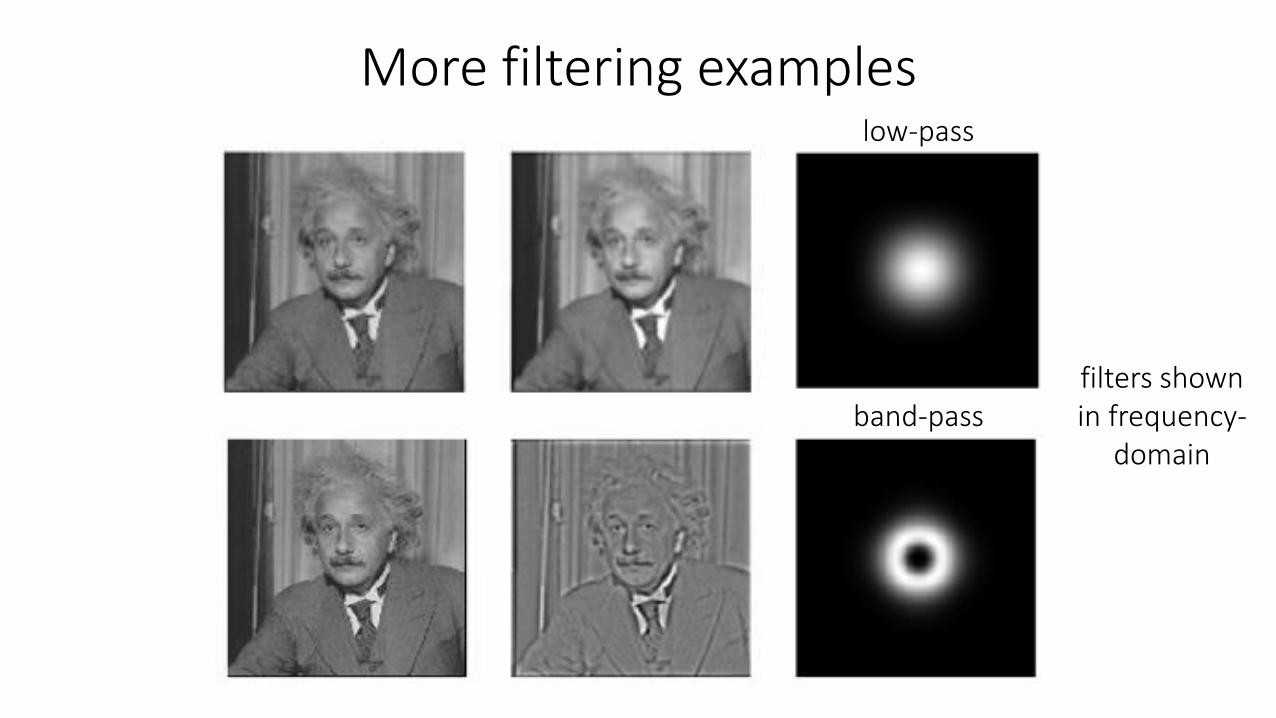
More filtering exampleslow-pass
band-passfilters shown in frequency-
domain
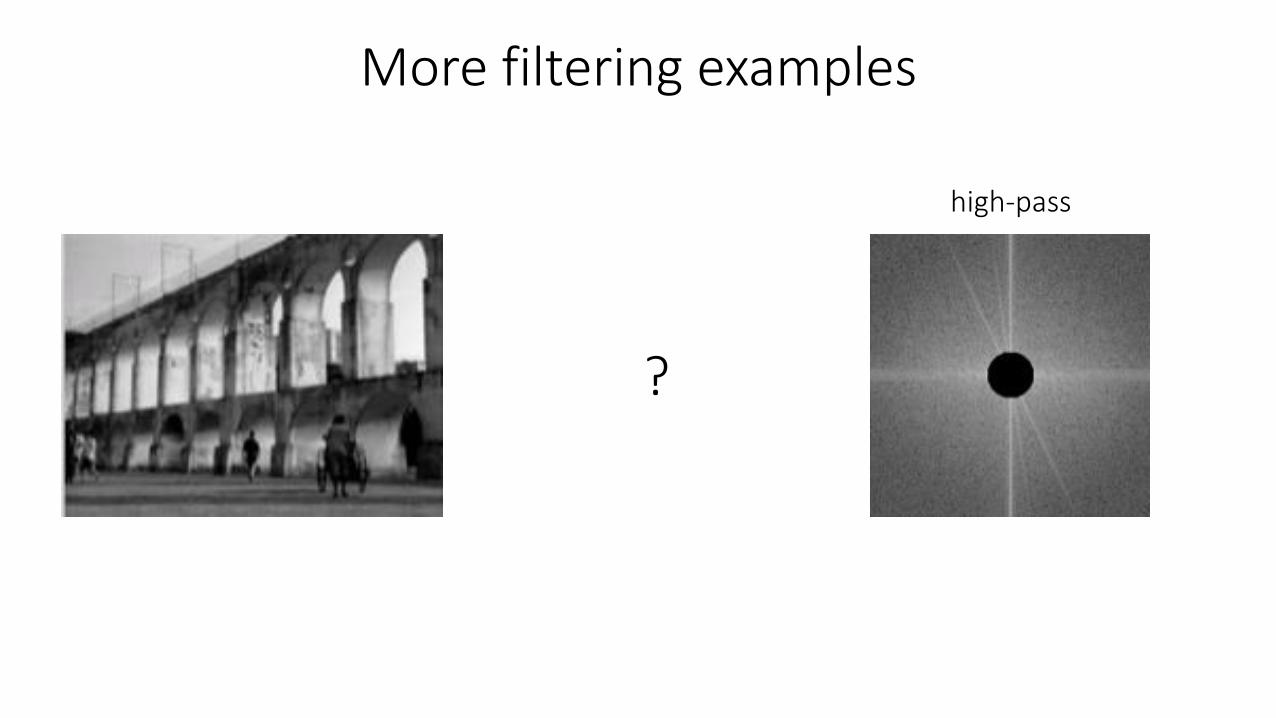
high-pass
?
More filtering examples
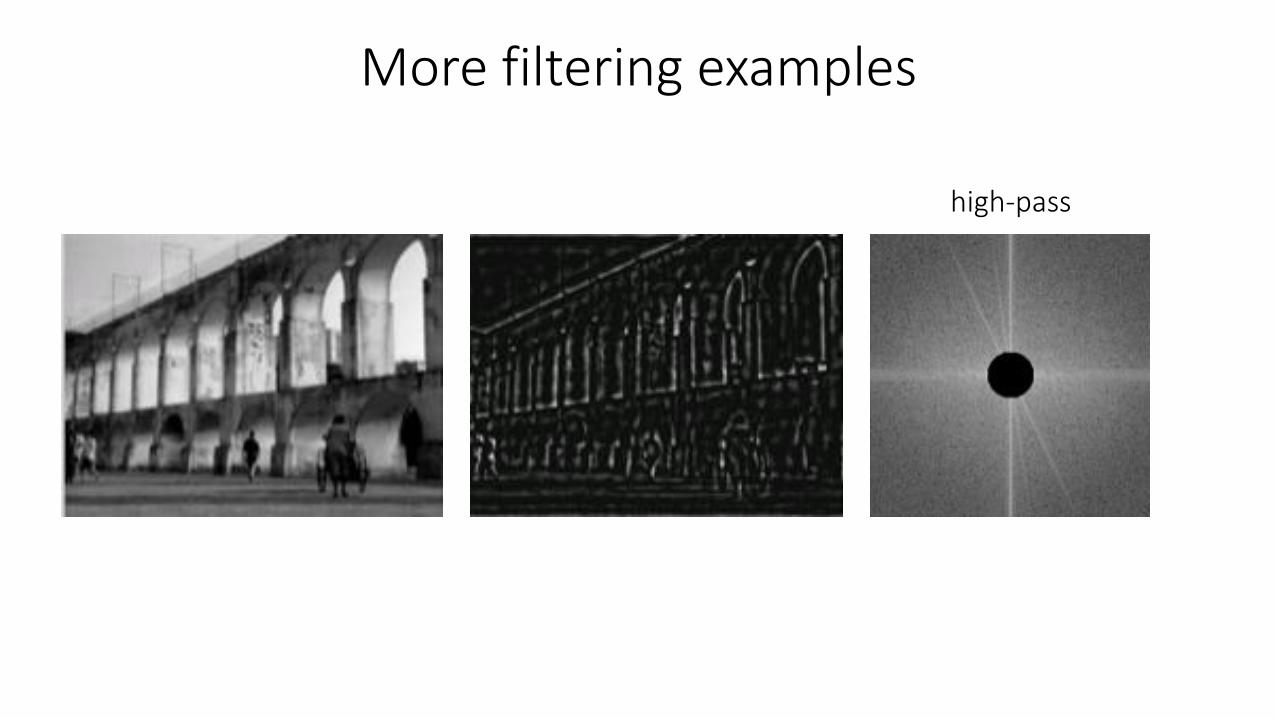
high-pass
More filtering examples
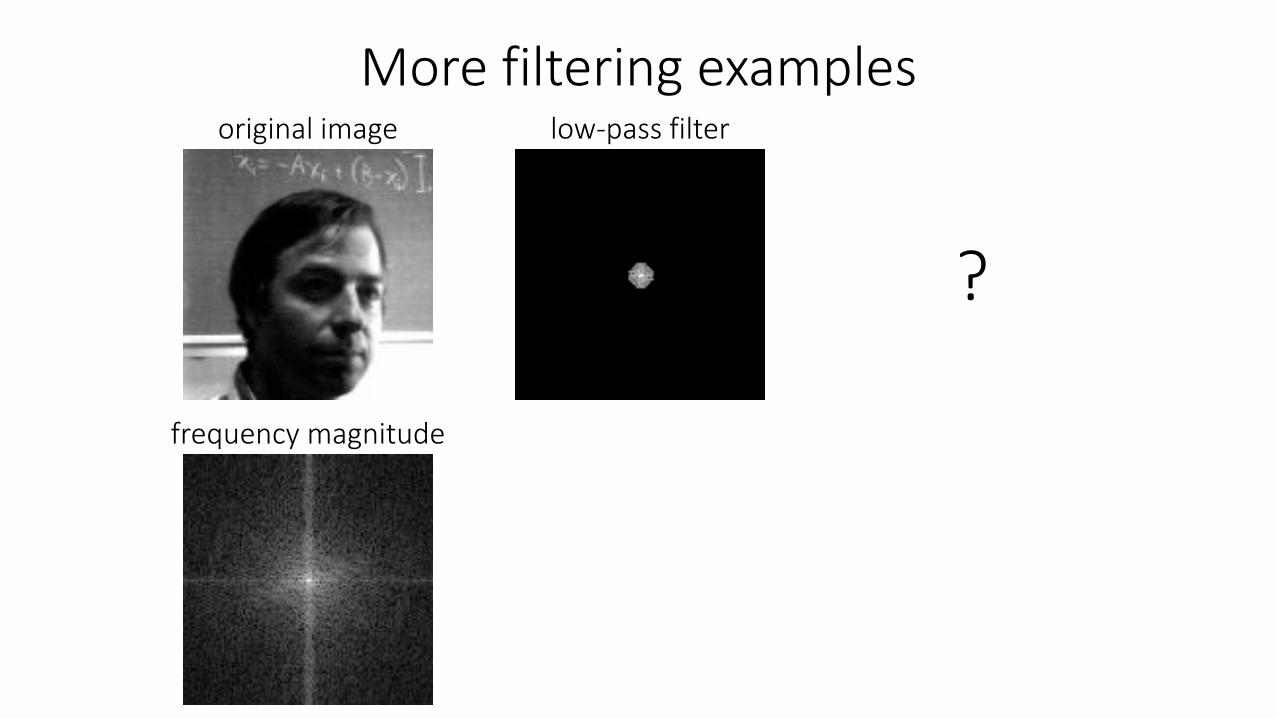
More filtering examples
frequency magnitude
original image low-pass filter
?
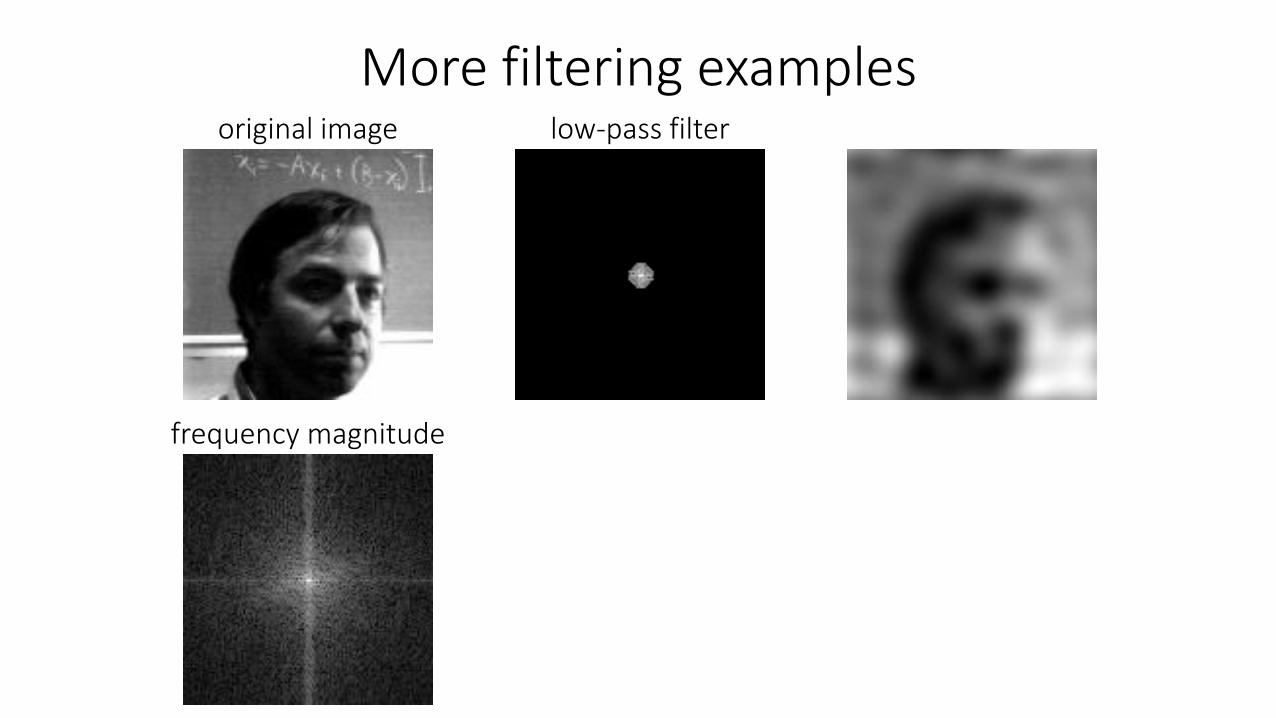
More filtering examples
frequency magnitude
original image low-pass filter
More filtering examples
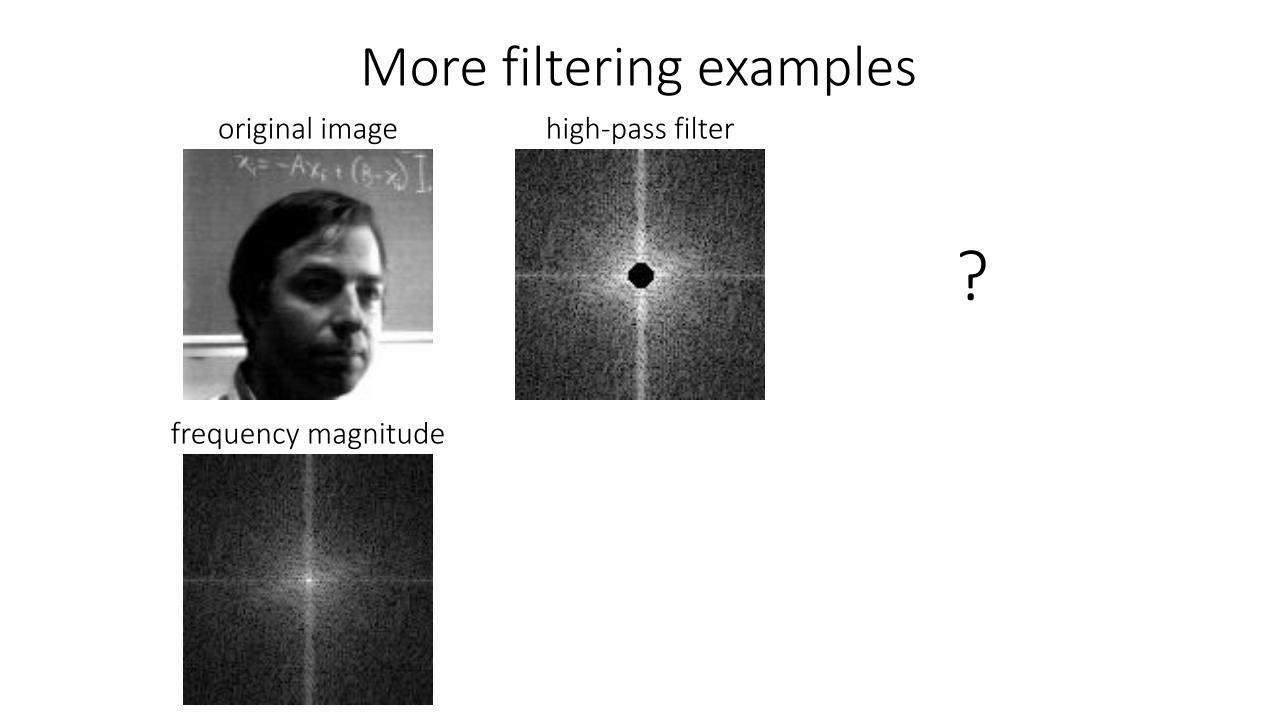
frequency magnitude
original image high-pass filter
?
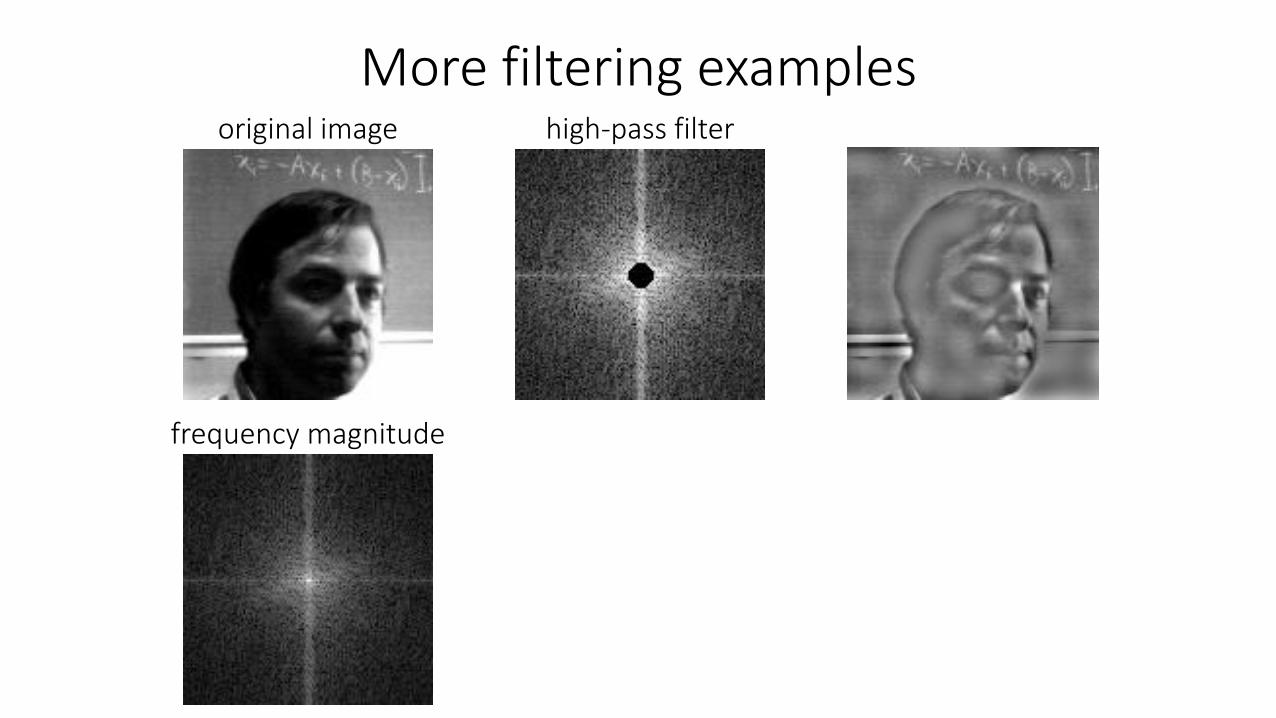
More filtering examples
frequency magnitude
original image high-pass filter
More filtering examples
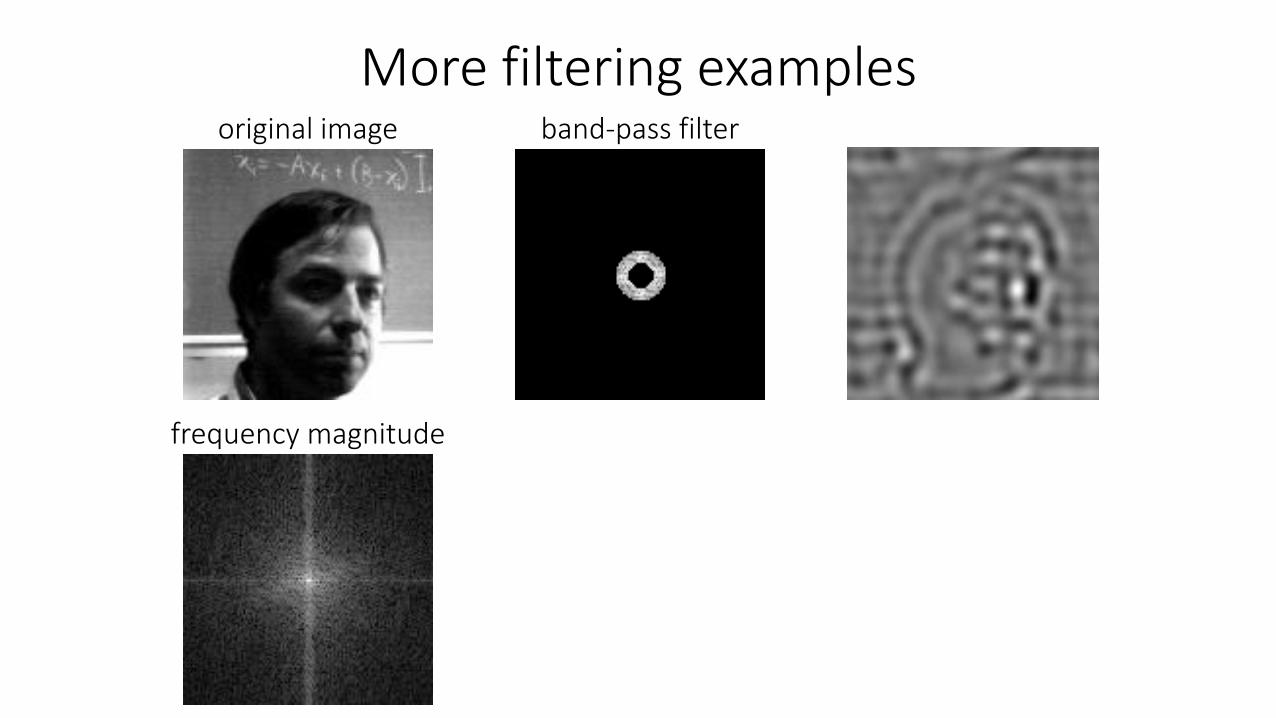
frequency magnitude
original image band-pass filter

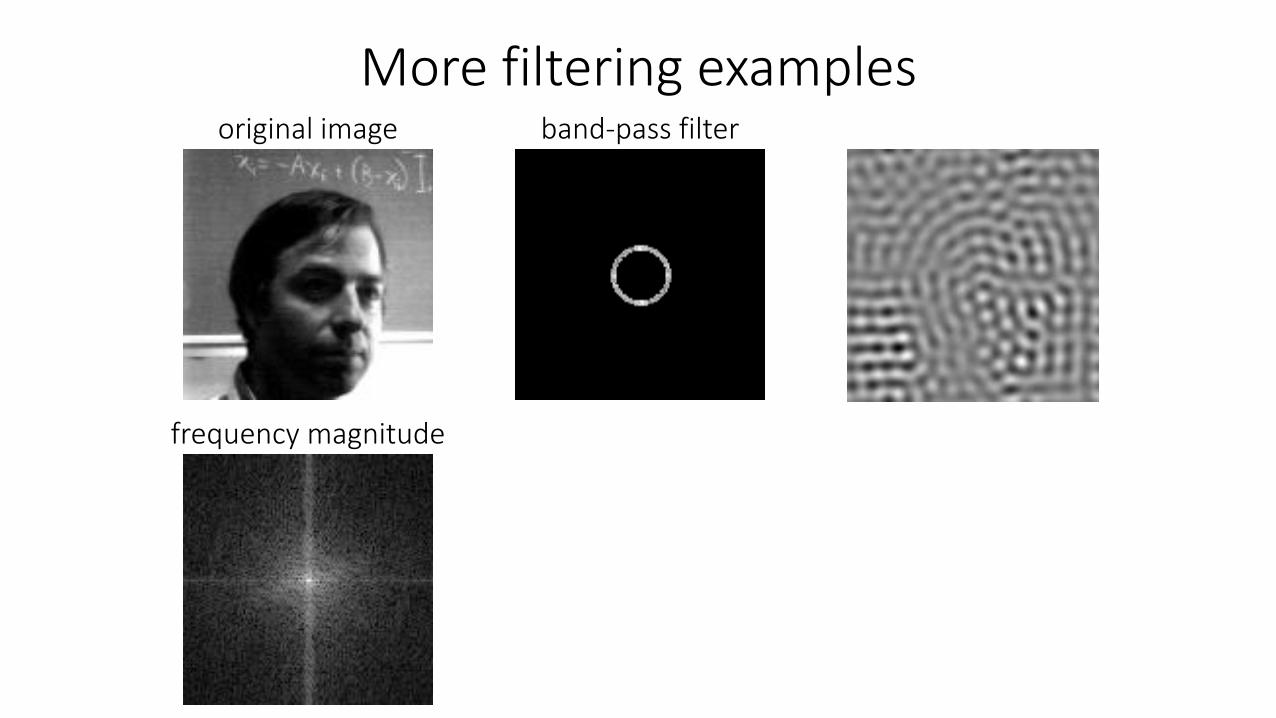
More filtering examples
frequency magnitude
original image band-pass filter

More filtering examples
frequency magnitude
original image band-pass filter
More filtering examples
frequency magnitude
original image band-pass filter

Revisiting sampling
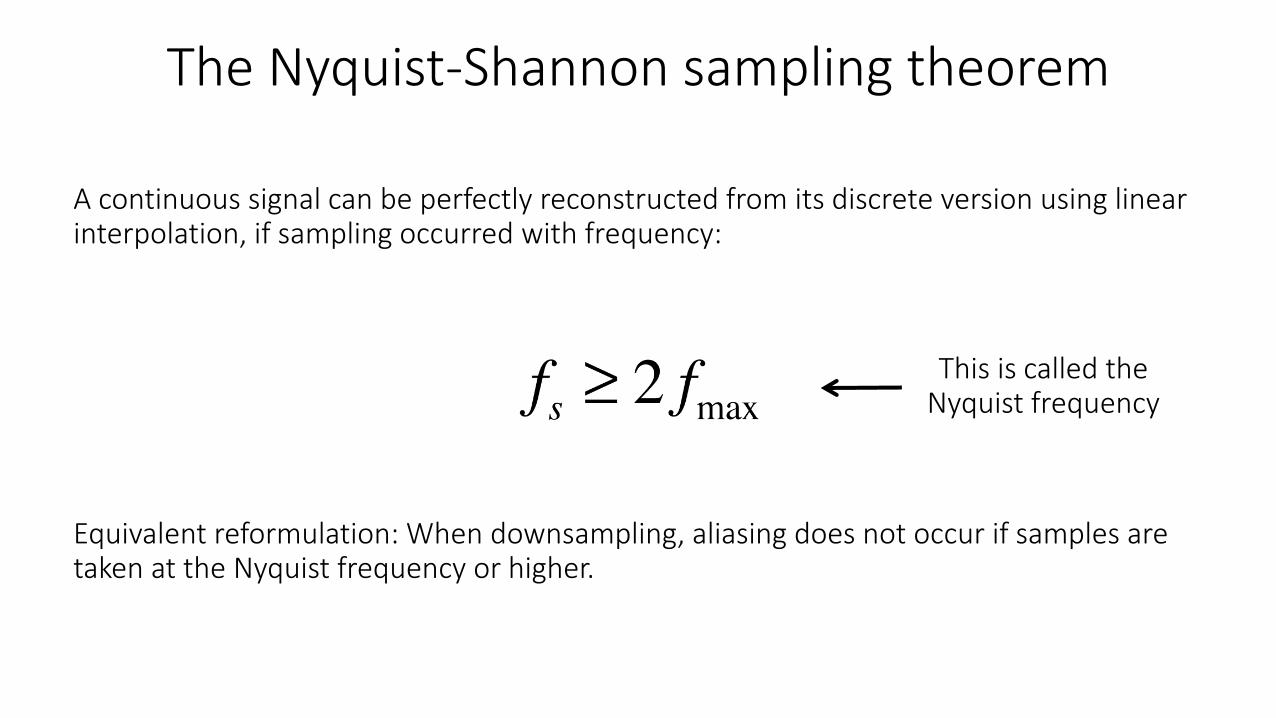
The Nyquist-Shannon sampling theorem
A continuous signal can be perfectly reconstructed from its discrete version using linear interpolation, if sampling occurred with frequency:
Equivalent reformulation: When downsampling, aliasing does not occur if samples are taken at the Nyquist frequency or higher.
This is called the Nyquist frequency
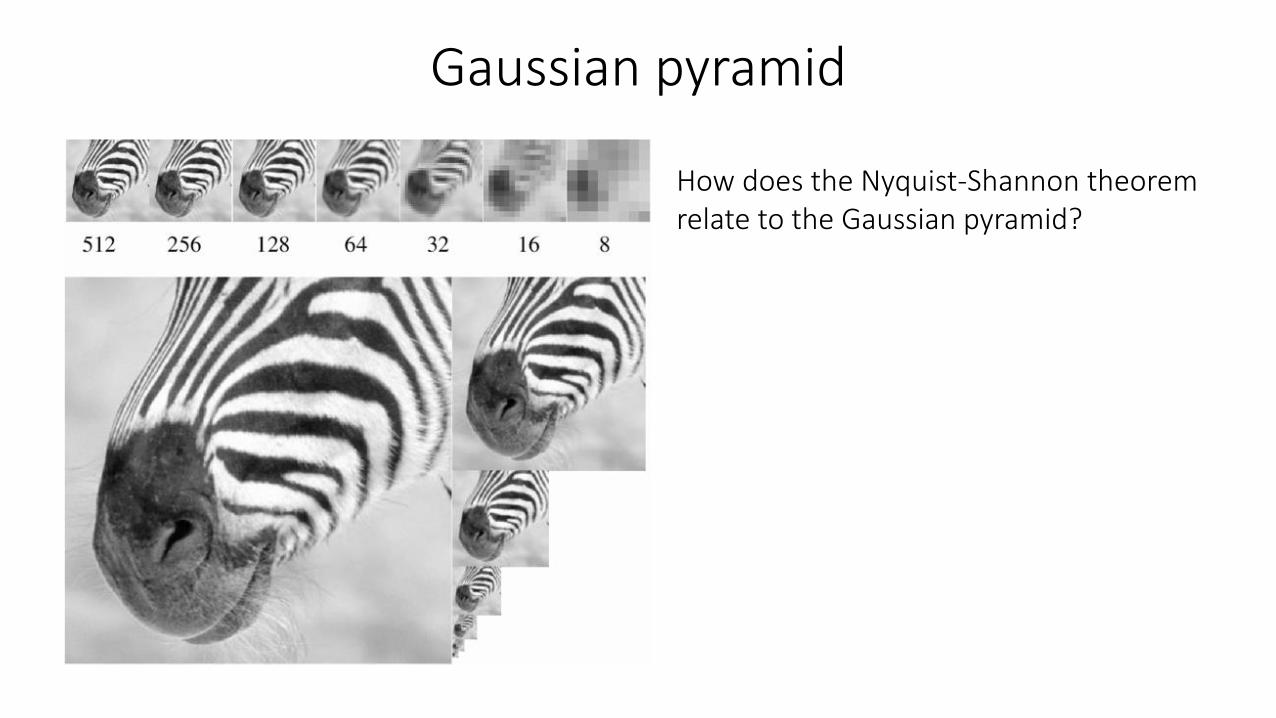
How does the Nyquist-Shannon theorem relate to the Gaussian pyramid?
Gaussian pyramid
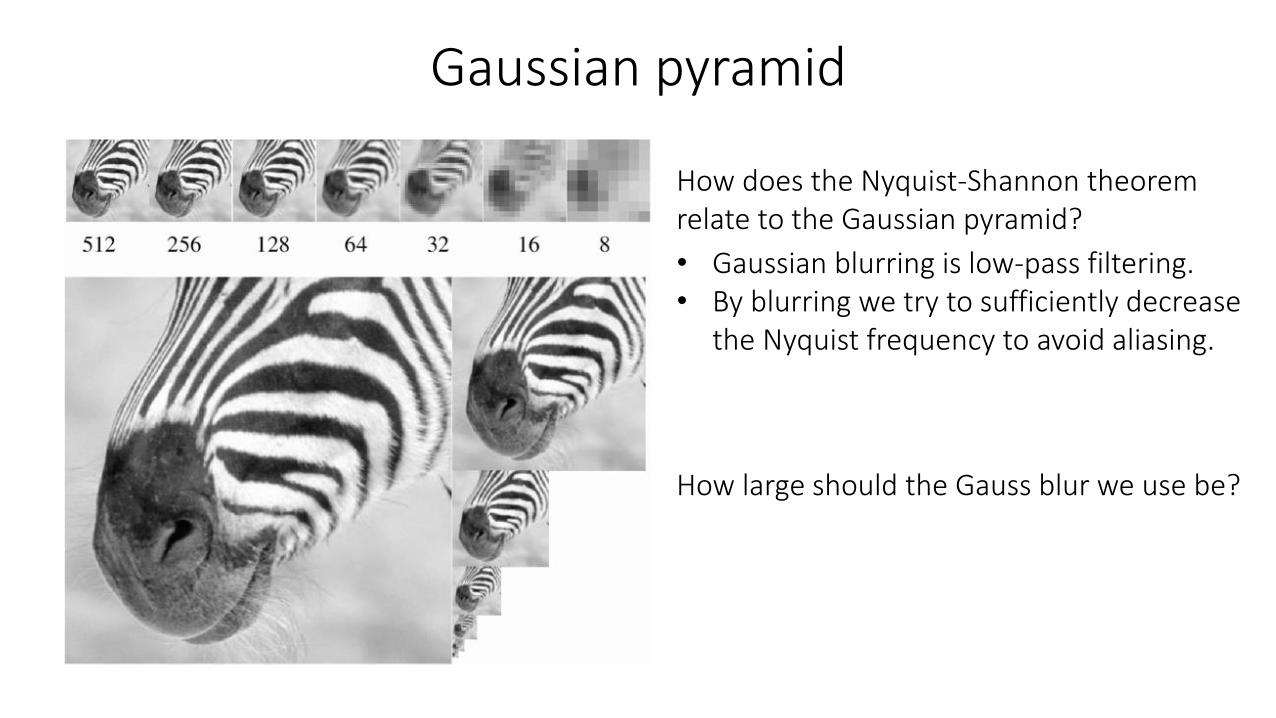
How does the Nyquist-Shannon theorem relate to the Gaussian pyramid?
Gaussian pyramid
• Gaussian blurring is low-pass filtering.• By blurring we try to sufficiently decrease
the Nyquist frequency to avoid aliasing.
How large should the Gauss blur we use be?
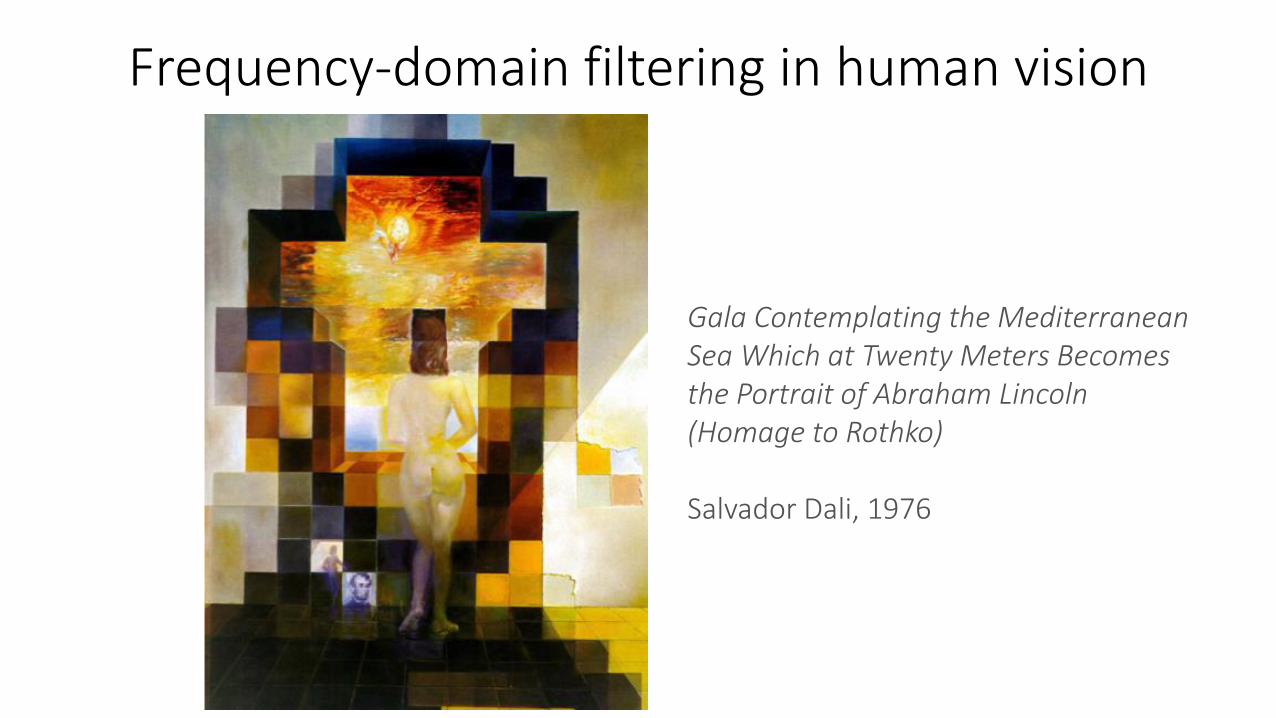
Gala Contemplating the Mediterranean Sea Which at Twenty Meters Becomes the Portrait of Abraham Lincoln (Homage to Rothko)
Salvador Dali, 1976
Frequency-domain filtering in human vision
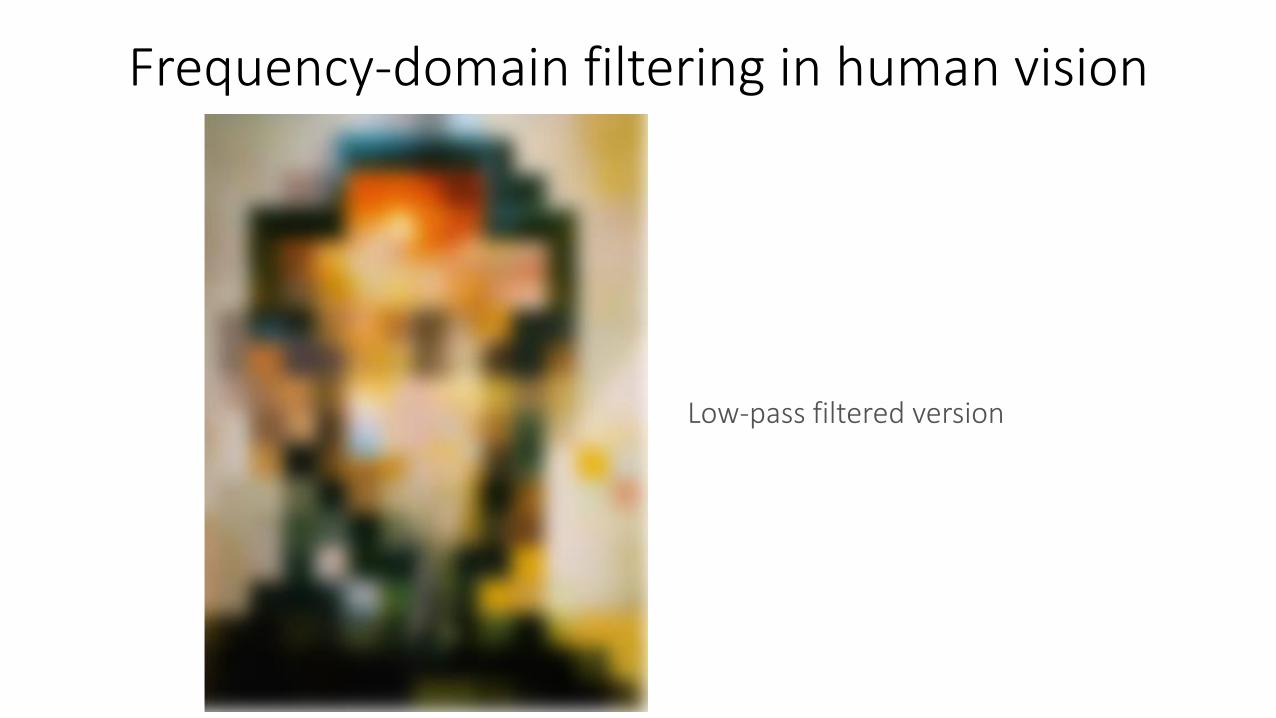
Low-pass filtered version
Frequency-domain filtering in human vision
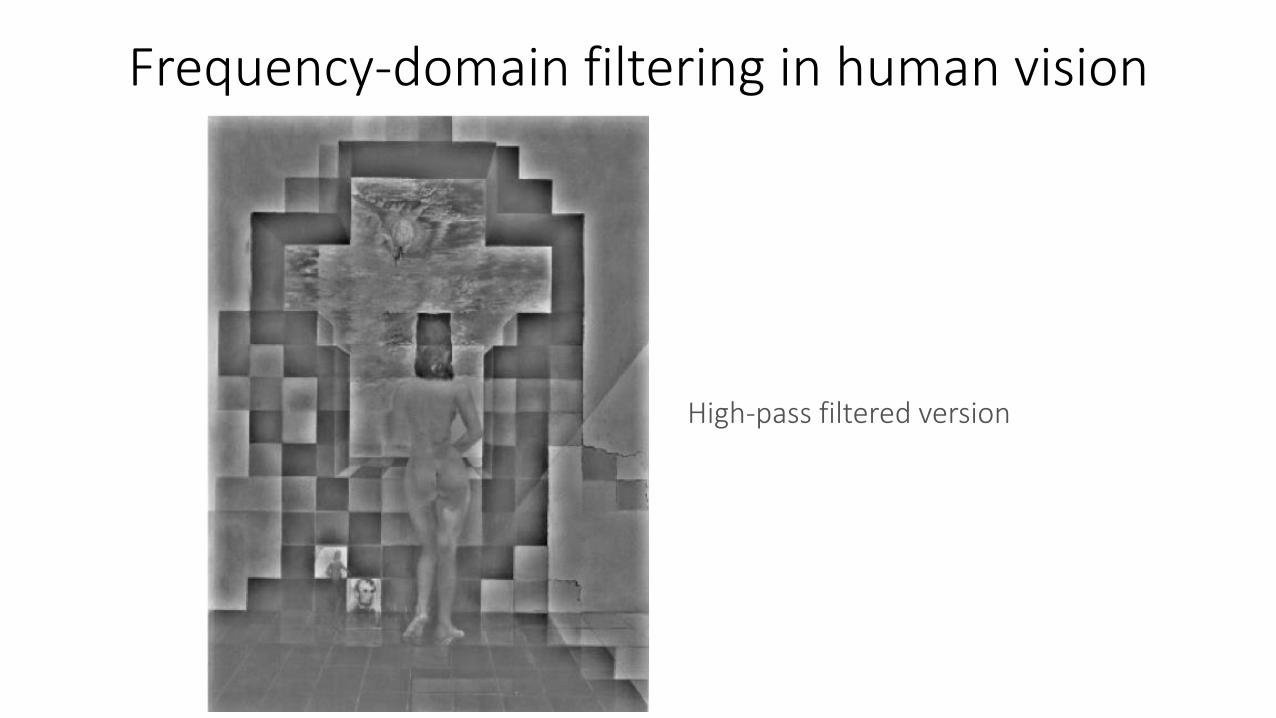
High-pass filtered version
Frequency-domain filtering in human vision
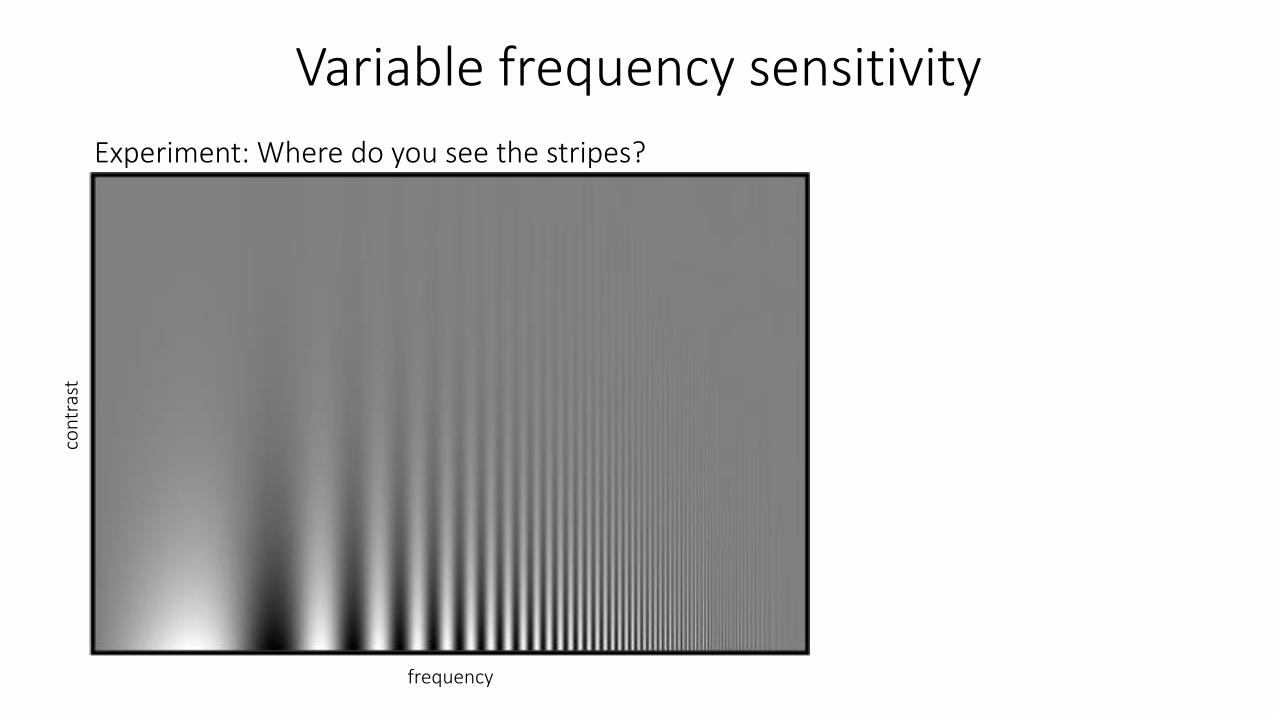
Variable frequency sensitivity
Experiment: Where do you see the stripes?
frequency
con
tras
t
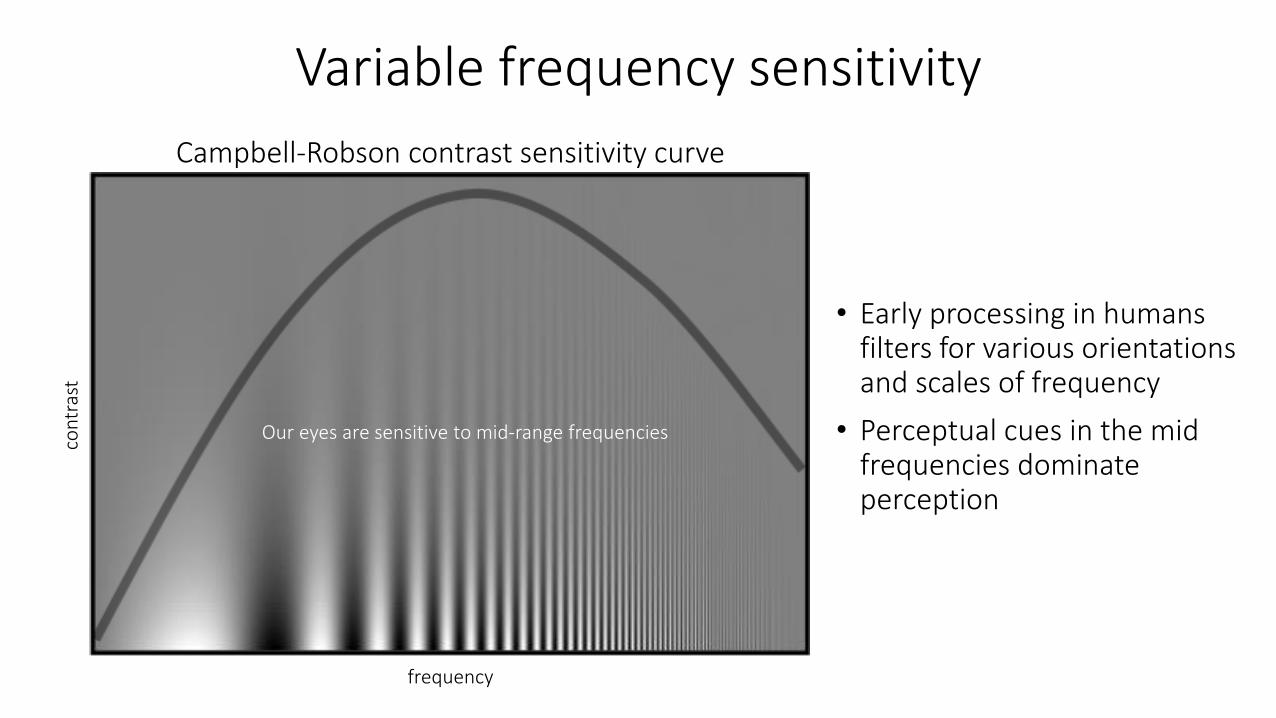
Campbell-Robson contrast sensitivity curve
frequency
con
tras
t
Our eyes are sensitive to mid-range frequencies
Variable frequency sensitivity
• Early processing in humans filters for various orientations and scales of frequency
• Perceptual cues in the mid frequencies dominate perception
References
Basic reading:• Szeliski textbook, Sections 3.4.
Additional reading:• Hubel and Wiesel, “Receptive fields, binocular interaction and functional architecture in the cat's visual
cortex,” The Journal of Physiology 1962a foundational paper describing information processing in the visual system, including the different types of filtering it performs; Hubel and Wiesel won the Nobel Prize in Medicine in 1981 for the discoveries described in this paper