fourth quarter 2013 - meg energy
TRANSCRIPT

1
FOURTH QUARTER 2013 Report to Shareholders for the period ended December 31, 2013
MEG Energy Corp. reported fourth quarter and full year 2013 operational and financial results on February 6, 2014. Highlights included:
Strong performance from the recently commissioned Phase 2B project and continued success of RISER driving record exit production of 48,557 barrels per day (bpd), 13% above the top end of guidance and setting a strong foundation for MEG's near‐term target of 80,000 bpd by 2015;
Establishing Canada's first well‐head to unit‐train rail loading connection via pipeline, with MEG's first unit‐train shipment made in December 2013;
Annual net operating costs of $10 per barrel, maintaining MEG's position as a low‐cost producer; and
A 13% increase in proved reserves to 1.4 billion barrels and a 10% increase in proved plus probable reserves to 2.9 billion barrels.
"The use of proven technologies was a key component to our performance in 2013 and will remain the central focus of our future plans. The success of MEG's RISER initiative, coupled with the strong start‐up performance of Christina Lake Phase 2B in the fourth quarter, were the main contributors to our solid production results in 2013," said Bill McCaffrey, MEG President and Chief Executive Officer. "Exit rates were about 13 per cent above the high end of our expectations, which provides a strong foundation for a very exciting year in 2014 as we ramp‐up toward our near‐term target of 80,000 barrels per day by 2015."
Exit rate production for the month of December averaged 48,557 bpd. Annual production for 2013 averaged 35,317 bpd, an increase of 23% over 2012 volumes of 28,773 bpd, marking MEG's fifth consecutive year of annual production gains. Production for the fourth quarter of 2013 increased to a record 42,251 bpd from fourth quarter 2012 production of 32,292 bpd.
Average non‐energy operating costs for 2013, at $9.00 per barrel, were at the low end of MEG's targeted range of $9 to $11 per barrel, an improvement of 7% from 2012 averages. Net operating costs (including energy costs and revenue from electricity sales) for 2013 averaged $10.01 per barrel, consistent with 2012 full‐year results and maintaining MEG's low operating cost position. Net operating costs for the fourth quarter of 2013 were $11.22 per barrel compared to fourth quarter 2012 results of $8.95 per barrel. The difference in fourth quarter net operating costs reflects the benefit of lower non‐energy operating costs, offset by higher natural gas energy costs and lower realized prices for electricity sales.
Concurrent with the ramp‐up of production in the fourth quarter, MEG commissioned its proprietary 900,000 barrel Stonefell storage terminal and completed its proprietary pipeline connection to the Canexus rail‐loading facility at Bruderheim, establishing the first direct well‐head to rail pipeline connection in the Canadian oil industry. The first unit‐train of MEG product was loaded in December with additional unit‐trains loaded in January.

2
"The strategic advantage of having storage capability at the Stonefell Terminal was demonstrated in the fourth quarter," said McCaffrey. "With the Alberta oil industry subject to unscheduled pipeline apportionment, we were able to continue producing at maximum rates while positioning ourselves to take greater control of which markets our barrels are sold into, and the timing for the sale of those barrels."
While fourth quarter 2013 production levels were up 31% from the same period in 2012, sales volumes increased 10% due to approximately 6,300 bpd of production being placed in storage, used as line‐fill or capitalized in association with the commissioning of Phase 2B.
Fourth quarter 2013 cash flow from operations was $22.6 million ($0.10 per share, diluted) compared to cash flow from operations of $56.1 million ($0.27 per share, diluted) in the fourth quarter of 2012. Cash flow for the fourth quarter of 2013 was impacted by production volumes that were not sold in the quarter (as noted above), as well as wider light‐heavy oil differentials and an increase in diluent costs compared to the same period in 2012.
MEG recognized a net loss for the fourth quarter of 2013 of $148.2 million compared to a net loss of $18.7 million for the fourth quarter of 2012. The loss is primarily due to the unrealized foreign exchange loss on conversion of the company's U.S. dollar denominated debt as a result of the strengthening of the U.S. dollar against the Canadian dollar.
Capital and growth strategy
MEG's capital program in 2013 was approximately $2.1 billion. Investment was primarily focused on completion of Christina Lake Phase 2B, continued application of RISER at Christina Lake Phases 1 and 2, early work on RISER 2B, and infrastructure to support MEG's future growth and marketing strategies.
"We've already put the capital in place to reach our target of 80,000 barrels per day by 2015," said McCaffrey. "The investment focus in 2014 is on our next stage of growth through the RISER 2B initiative. The expansion of our existing assets through this brownfield approach will significantly lower the capital intensity of new production and accelerate our cash flows compared to a typical greenfield expansion."
MEG ended the year with net debt of $2.9 billion, including $1.2 billion in cash and cash equivalents. MEG's capital resources also include an undrawn US$2.0 billion revolving credit facility.
Reserves update
GLJ Petroleum Consultants Ltd. (GLJ), an independent reservoir engineering firm, completed an evaluation of MEG's bitumen reserves and resources effective as of December 31, 2013. Proved bitumen reserves increased by 13% to an estimated 1.4 billion barrels from the previous year. Proved plus probable reserves increased to 2.9 billion barrels from 2.6 billion barrels reflecting higher expected recovery factors and further resource delineation. GLJ's estimate of contingent resources (on a best estimate basis) was approximately 3.7 billion barrels, compared to 3.4 billion barrels a year earlier.
The pre‐tax net present value of the future net cash flows of the proved reserves and of the proved plus probable reserves, discounted at 10% per annum, were $13.5 billion and $21.0 billion, respectively. A summary of GLJ's report, along with important information regarding net present value calculations and the classification of reserves and contingent resources is included under the heading "Reserves and Resources."

3
OPERATIONAL AND FINANCIAL HIGHLIGHTS
The following table summarizes selected operational and financial information of the Corporation for the periods ended:
Three months ended December 31 Year ended December 31
2013 2012 2013 2012
Bitumen production – bpd 42,251 32,292 35,317 28,773
Bitumen sales – bpd 35,990 32,722 33,715 28,845
Steam to oil ratio (SOR) 2.9 2.4 2.6 2.4
West Texas Intermediate (WTI) US$/bbl 97.43 88.18 97.96 94.21
Differential – Blend vs WTI ‐ % 40.6% 29.9% 32.7% 31.2%
Bitumen realization ‐ $/bbl 38.22 45.67 49.28 46.93
Net operating costs(1) ‐ $/bbl 11.22 8.95 10.01 9.98
Non‐energy operating costs ‐ $/bbl 8.09 8.70 9.00 9.71
Cash operating netback(2) ‐ $/bbl 23.78 34.44 35.87 34.18
Total cash capital investment(3) ‐ $000 389,232 494,916 2,188,353 1,598,514
Net income (loss) ‐ $000 (148,182) (18,740) (166,405) 52,569
Per share, diluted (0.67) (0.09) (0.75) 0.26
Operating earnings (loss) ‐ $000(4) (32,685) (538) 386 21,242
Per share, diluted(4) (0.15) (0.00) 0.00 0.11
Cash flow from operations ‐ $000(4) 22,648 56,106 253,424 212,514
Per share, diluted(4) 0.10 0.27 1.13 1.06
Cash, cash equivalents and short‐term investments ‐ $000 1,179,072 2,007,841 1,179,072 2,007,841
Long‐term debt ‐ $000 4,004,575 2,488,609 4,004,575 2,488,609
Bitumen Reserves and Contingent Resources (millions of barrels, before royalties)
Bitumen Reserves (millions of barrels, before royalties)
Proved (1P) Reserves(5) 1,446 1,284
Probable Reserves(6) 1,451 1,360
Proved Plus Probable (2P) Reserves(5)(6) 2,897 2,644
Bitumen Contingent Resources (millions of barrels, before royalties)
Best Estimate Contingent Resources (2C)(7)(8)(9) 3,653 3,420
(1) Net operating costs include energy and non‐energy operating costs, reduced by power sales. Please refer to Cash Operating
Netbacks discussed further under the heading "RESULTS OF OPERATIONS". (2)
Cash operating netbacks are calculated by deducting the related diluent, transportation, field operating costs and royalties from proprietary sales volumes and power revenues, on a per barrel basis. Please refer to note 3 of the Cash Operating Netbacks table within "RESULTS OF OPERATIONS".
(3) Includes capitalized interest of $22.9 million and $76.5 million for the three months and year ended December 31, 2013 respectively ($10.4 million and $30.6 million for the three months and year ended December 31, 2012).

4
(4) Operating earnings, cash flow from operations and the related per share amounts do not have standardized meanings
prescribed by IFRS and therefore may not be comparable to similar measures used by other companies. The Corporation uses these non‐IFRS measurements for its own performance measures and to provide its shareholders with a measurement of the Corporation's ability to internally fund future capital investments. These non‐IFRS measurements are reconciled to net income (loss) and net cash provided by operating activities in accordance with IFRS under the heading "NON‐IFRS MEASUREMENTS" and discussed further in the "ADVISORY" section.
(5) "Proved Reserves" are those reserves that can be estimated with a high degree of certainty to be recoverable. It is likely that the actual remaining quantities recovered will exceed the estimated proved reserves. Proved Reserves are also referred to as "1P Reserves".
(6) "Probable Reserves" are those additional reserves that are less certain to be recovered than Proved Reserves. It is equally likely that the actual remaining quantities recovered will be greater or less than the sum of the estimated proved plus probable reserves. Proved plus probable reserves are also referred to as "2P Reserves".
(7) "Contingent Resources" are those quantities of petroleum estimated, as of a given date, to be potentially recoverable from known accumulations using established technology or technology under development, but which are not currently considered to be commercially recoverable due to one or more contingencies. Such contingencies include further reservoir delineation, additional facility and reservoir design work, submission of regulatory applications and the receipt of corporate approvals. It is also appropriate to classify as contingent resources the estimated discovered recoverable quantities associated with a project in the early evaluation stage. Contingent resources are further classified in accordance with the level of certainty associated with the estimates and may be sub‐classified based on project maturity and/or characterized by their economic status. There is no certainty that it will be commercially viable to produce any portion of the contingent resources.
(8) There are three categories in evaluating Contingent Resources: Low Estimate, Best Estimate and High Estimate. The resource numbers presented all refer to the Best Estimate category. Best Estimate is a classification of resources described in the Canadian Oil and Gas Evaluation (COGE) Handbook as being considered to be the best estimate of the quantity that will actually be recovered. It is equally likely that the actual remaining quantities recovered will be greater or less than the Best Estimate. If probabilistic methods are used, there should be a 50% probability (P50) that the quantities actually recovered will equal or exceed the Best Estimate. Best Estimate Contingent Resources are also referred to as "2C Resources".
(9) These volumes are the arithmetic sums of the Best Estimate Contingent Resources for Christina Lake, Surmont and the Growth Properties.
Bitumen production for the three months ended December 31, 2013 averaged 42,251 bpd compared to 32,292 bpd for the same period in 2012. Production for the year ended December 31, 2013 averaged 35,317 bpd compared to 28,773 bpd for the year ended December 31, 2012. The increase in production volumes in 2013 compared to 2012 is due to the implementation of RISER on Christina Lake Phases 1 and 2 and the startup of Christina Lake Phase 2B. The expanded steam generation capacity and improved reservoir efficiency from the RISER implementation has enabled the Corporation to place additional wells into production in 2013. Steam injection into the Phase 2B well pairs commenced in the third quarter of 2013 and the Corporation achieved first production from Phase 2B in the fourth quarter of 2013.
Bitumen sales averaged 35,990 bpd for the fourth quarter of 2013 and 33,715 bpd for the year ended December 31, 2013. Production volumes exceeded sales volumes in the fourth quarter of 2013 due to approximately 6,300 bpd of production being placed in storage, used as line‐fill or capitalized in association with the commissioning of Phase 2B.
For the three months ended December 31, 2013, the average steam to oil ratio ("SOR") was 2.9, compared to an average SOR of 2.4 during the three months ended December 31, 2012. For the year ended December 31, 2013, the average SOR was 2.6, compared to an average SOR of 2.4 for the year ended December 31, 2012. The increase in the average SOR for these periods is the result of Phase 2B start‐up. It is anticipated that the SOR for the next several months will be higher than historical values due to the start‐up of new well pairs in Phase 2B. Each of these new well pairs will require steam preheating prior to conversion to production mode. Once well pairs commence production, the SOR will decrease. The Corporation continues to focus on increasing production and improving efficiency of current production through a lower SOR, which is an important efficiency indicator that measures the average amount of steam that is injected into the reservoir for each barrel of bitumen produced.

5
Bitumen realizations decreased in the fourth quarter of 2013 as compared to the fourth quarter of 2012. The decrease in bitumen realizations is due primarily to the widening of the differential between the price of West Texas Intermediate ("WTI") and the Corporation's blend sales. The price of WTI increased to an average of US$97.43 per barrel during the fourth quarter of 2013 from US$88.18 per barrel during the fourth quarter of 2012. However, the differential between the price of WTI and the Corporation's blend sales price increased to 40.6% in the fourth quarter of 2013, compared to 29.9% in the fourth quarter of 2012.
Bitumen realizations increased for the year ended December 31, 2013 as compared to the year ended December 31, 2012 primarily as a result of the increase in the price of WTI. The price of WTI averaged US$97.96 per barrel during 2013 compared to US$94.21 per barrel during 2012. For the year ended December 31, 2013, the differential between WTI and the Corporation's blend sales price was 32.7% compared to a differential of 31.2% for the year ended December 31, 2012.
Net operating costs include energy and non‐energy operating costs reduced by power sales. For the three months ended December 31, 2013 net operating costs were $11.22 per barrel, compared to $8.95 per barrel for the three months ended December 31, 2012. The increase in net operating costs, on a per barrel basis, is attributable to:
the increase in energy operating costs, as natural gas prices increased to $3.55 per thousand cubic feet ("mcf") during the fourth quarter of 2013, from an average of $3.21 per mcf during the fourth quarter of 2012;
a decrease in power realizations to $44.63 per megawatt hour during the fourth quarter of 2013, from $79.62 per megawatt hour during the fourth quarter of 2012; and
the impacts of these changes were partially offset by a decrease in non‐energy costs, as expressed on a per barrel basis, to $8.09 per barrel in the fourth quarter of 2013, from $8.70 per barrel in the fourth quarter of 2012. This decrease is largely the result of higher production volumes from the implementation of RISER and the start‐up of Christina Lake Phase 2B.
Net operating costs on a per barrel basis for the year ended December 31, 2013 were $10.01 per barrel, compared to $9.98 per barrel for the year ended December 31, 2012. The increase in net operating costs on a per barrel basis is attributable to the increase in energy operating costs, as natural gas prices increased to $3.21 per mcf in 2013, from an average of $2.49 per mcf in 2012. This was partially offset by:
an increase in power realizations to $76.23 per megawatt hour in 2013 from $59.22 per megawatt hour in 2012, and;
a decrease in non‐energy costs, as expressed on a per barrel basis, to $9.00 per barrel in 2013, from $9.71 per barrel in 2012. This decrease is largely the result of higher production volumes from the implementation of RISER.
Power sales had the effect of offsetting 42% of energy operating costs during the fourth quarter of 2013 compared to 95% of energy operating costs during the fourth quarter of 2012. Power sales had the effect of offsetting 78% of energy operating costs during the year ended December 31, 2013 compared to 92% of energy operating costs during the year ended December 31, 2012. Power prices in the fourth quarter of 2013 were below the same period in 2012 as the result of lower Alberta power generation volatility in the fourth quarter of 2013 compared to the fourth quarter of 2012. However, power generation volatility in Alberta was higher during the first half of 2013, which resulted in full year 2013 power prices above 2012 levels.

6
Cash operating netback for the three months ended December 31, 2013 was $23.78 per barrel compared to $34.44 per barrel for the same period in 2012. The decrease in cash operating netback for the three months ended December 31, 2013 compared to the three months ended December 31, 2012 was primarily due to the decrease in bitumen realizations combined with the increase in net operating costs. Bitumen realizations were primarily impacted by higher differentials realized on the sale of the Corporation's blend product.
Cash operating netback for the year ended December 31, 2013 was $35.87 per barrel compared to $34.18 per barrel for the year ended December 31, 2012. The increase in cash operating netbacks is due largely to the increase in bitumen realizations for the year ended December 31, 2013 as compared to the year ended December 31, 2012.
Total cash capital investment was $389.2 million during the fourth quarter of 2013 compared to $494.9 million during the fourth quarter of 2012. Total cash capital investment for the year ended December 31, 2013 was $2.2 billion (including $76.5 million of capitalized interest) compared to $1.6 billion for the year ended December 31, 2012. Capital investment during 2013 has focused on the completion of Phase 2B, the RISER initiative, completion of the Stonefell Terminal, the expansion of the Access Pipeline, engineering, procurement of long‐lead equipment and site preparation for Phase 3A and delineation drilling at Christina Lake and Surmont.
The Corporation recognized a net loss for the fourth quarter of 2013 of $148.2 million, which was primarily due to the $127.8 million foreign exchange loss on conversion of the Corporation's U.S. dollar denominated debt. As at December 31, 2013, the Canadian dollar, at a rate of 1.0636, had decreased in value by approximately 3% against the U.S. dollar compared to its value as at September 30, 2013, when the rate was 1.0285. The net loss of $18.7 million for the fourth quarter of 2012 included a foreign exchange loss of $28.4 million on the conversion of the Corporation's U.S. dollar denominated debt.
The net loss for the year ended December 31, 2013 was $166.4 million, which was primarily due to the $213.7 million foreign exchange loss on conversion of the Corporation's U.S. dollar denominated debt. As at December 31, 2013, the Canadian dollar, at a rate of 1.0636, had decreased in value by approximately 7% against the U.S. dollar compared to its value as at December 31, 2012, when the rate was 0.9949. Net income for the year ended December 31, 2012 was $52.6 million and included a foreign exchange gain of $48.8 million on conversion of the Corporation’s U.S. dollar denominated debt.
Operating loss for the three months ended December 31, 2013 was $32.7 million compared to an operating loss of $0.5 million for the three months ended December 31, 2012. The increases in bitumen sales volumes and WTI in the fourth quarter of 2013 were primarily offset by higher differentials realized on the sale of the Corporation's blend product and higher depletion and depreciation compared to the same period in 2012.
The Corporation recognized operating earnings for the year ended December 31, 2013 of $0.4 million compared to operating earnings of $21.2 million for the year ended December 31, 2012. In 2013, the increase in cash operating netback resulting from higher bitumen sales volumes and bitumen realizations was offset by higher depletion and depreciation, general and administrative and interest expense compared to the same period in 2012.
Cash flow from operations was $22.6 million for the fourth quarter of 2013, compared to $56.1 million for the fourth quarter of 2012. The 10% increase in bitumen sales volumes in the fourth quarter of 2013, compared to the fourth quarter of 2012, was more than offset by a decrease in the bitumen realization.

7
Cash flow from operations was $253.4 million for the year ended December 31, 2013, compared to $212.5 million for the year ended December 31, 2012. Cash flow from operations increased due to higher bitumen sales volumes and bitumen realizations. These increases were partially offset by higher general and administrative and interest expense as compared to the same periods in 2012. Cash flow from operations was further impacted by approximately 6,300 bpd of production being placed in storage, used as line‐fill or capitalized in association with the commissioning of Phase 2B.
The Corporation's cash, cash equivalents and short‐term investments balance was $1.2 billion as at December 31, 2013 compared to $2.0 billion as at December 31, 2012. The Corporation's cash, cash equivalents and short‐term investments balances have been impacted by the increases in long‐term debt and capital investments over the past year. Long‐term debt increased to $4.0 billion as at December 31, 2013, from $2.5 billion as at December 31, 2012. The increase in long‐term debt is due to the increase in the senior secured term loan, the issuance of senior unsecured notes and the impact of foreign exchange on the U.S. dollar denominated debt. Effective February 25, 2013, the Corporation re‐priced, increased and extended its existing US$987.5 million senior secured term loan. The Corporation extended the maturity date to March 31, 2020 and increased its borrowing under the senior secured term loan by US$300.0 million. In addition, the Corporation reduced the interest rate on the term loan by 0.25 percent. During the fourth quarter of 2013 the Corporation issued US$1.0 billion in aggregate principal amount of 7.0% senior unsecured notes which will mature on March 31, 2024.
As at December 31, 2013, the Corporation's capital resources included $1.2 billion of cash and cash equivalents and an undrawn US$2.0 billion revolving credit facility. As at December 31, 2013, $133.9 million of the revolving credit facility was utilized to support letters of credit.
BUSINESS ENVIRONMENT
The following table shows industry commodity pricing information and foreign exchange rates on an annual and quarterly basis to assist in understanding the impact of commodity prices and foreign exchange rates on the Corporation's financial results:
Year ended December 31 2013 2012
2013 2012 Q4 Q3 Q2 Q1 Q4 Q3 Q2 Q1
Commodity Prices (Averages)
Crude oil prices
West Texas Intermediate (WTI) US$/bbl 97.96 94.21 97.43 105.83 94.22 94.37 88.18 92.22 93.49 102.92
West Texas Intermediate (WTI) C$/bbl 100.86 94.14 102.08 109.90 96.42 95.21 87.41 91.73 94.44 103.06
Western Canadian Select (WCS) C$/bbl 74.97 73.13 68.31 91.75 76.82 63.01 69.47 70.06 71.34 81.66
Differential – WTI vs WCS (C$/bbl) 25.89 21.01 33.77 18.15 19.60 32.20 17.94 21.67 23.10 21.39
Differential – WTI vs WCS (%) 25.7% 22.3% 33.1% 16.5% 20.3% 33.8% 20.5% 23.6% 24.5% 20.8%
Natural gas prices
AECO (C$/mcf) 3.16 2.38 3.52 2.42 3.51 3.18 3.20 2.27 1.89 2.14
Electric power prices
Alberta power pool (C$/MWh) 80.22 64.24 48.60 83.61 123.41 65.26 78.73 78.09 40.03 60.10
Foreign exchange rates
C$ equivalent of 1 US$ ‐ average 1.0296 0.9994 1.0477 1.0385 1.0233 1.0089 0.9913 0.9948 1.0102 1.0012
C$ equivalent of 1 US$ ‐ period end 1.0636 0.9949 1.0636 1.0285 1.0512 1.0156 0.9949 0.9837 1.0191 0.9991

8
The price of WTI is the current benchmark for Canadian crude oil, as it reflects mid‐continent North American prices and its Canadian dollar equivalent is the basis for determining royalties on the Corporation's bitumen sales. The average price for WTI for the fourth quarter of 2013 was US$97.43 per barrel compared to US$88.18 per barrel for the fourth quarter of 2012. The WTI price averaged US$97.96 per barrel for the year ended December 31, 2013 compared to US$94.21 per barrel for the year ended December 31, 2012.
Western Canadian Select ("WCS") is a blend of heavy oils, consisting of heavy conventional crude oils and bitumen, blended with sweet synthetic, light crude oil or condensate. WCS typically trades at a differential below the WTI benchmark price. During the fourth quarter of 2013, the WTI to WCS differential averaged 33.1% compared to 20.5% during the fourth quarter of 2012. The WTI to WCS differential averaged 25.7% for the year ended December 31, 2013 compared to 22.3% for the year ended December 31, 2012.
Ongoing pipeline congestion between the Western Canada and U.S. coastal markets negatively impacts the price received for WCS. Recent additions of crude‐by‐rail to access new markets as well as pipeline additions connecting the U.S. mid‐continent to the U.S. Gulf Coast and refinery modifications in the U.S. Midwest are anticipated to relieve some of this price pressure in the first half of 2014. Incrementally, initiatives to access additional markets, including the recently completed TransCanada Gulf Coast Pipeline and the ongoing construction of the Flanagan South pipeline and Seaway expansion, should help realign Canadian crude oil prices with international benchmarks.
Natural gas is a primary energy input cost for the Corporation, as it is used to generate steam for the SAGD process and to create electricity from the Corporation's cogeneration facilities. The benchmark AECO natural gas price averaged $3.52 per mcf during the three months ended December 31, 2013, compared to $3.20 per mcf during the same period in 2012. During the year ended December 31, 2013, the AECO natural gas price averaged $3.16 per mcf compared to $2.38 per mcf for the year ended December 31, 2012.
The Alberta power pool price averaged $48.60 per megawatt hour for the three months ended December 31, 2013, compared to $78.73 per megawatt hour for the same period in 2012. During the year ended December 31, 2013, the Alberta power pool price averaged $80.22 per megawatt hour compared to an average price of $64.24 per megawatt hour for 2012. Power prices in the fourth quarter were below the same period in 2012 as the result of lower power generation volatility. However, power generation volatility over the first half of 2013 resulted in full year 2013 prices above 2012 levels.
Changes in the value of the Canadian dollar relative to the U.S. dollar have an impact on the Corporation's bitumen revenues, as sales prices are determined by reference to U.S. benchmarks. Changes in the value of the Canadian dollar relative to the U.S. dollar also have an impact on principal and interest payments on the Corporation's U.S. dollar denominated debt. A decrease in the value of the Canadian dollar compared to the U.S. dollar has a positive impact on bitumen revenues and a negative impact on principal and interest payments, while an increase in the value of the Canadian dollar has a negative impact on bitumen revenues and a positive impact on principal and interest payments. As at December 31, 2013, the Canadian dollar, at a rate of 1.0636, had decreased in value by approximately 3% against the U.S. dollar compared to its value as at September 30, 2013, when the rate was 1.0285 and by approximately 7% against the U.S. dollar compared to its value as at December 31, 2012, when the rate was 0.9949.

9
RESULTS OF OPERATIONS
Three months ended
December 31 Year ended
December 31
2013 2012 2013 2012
Bitumen production – bpd 42,251 32,292 35,317 28,773
Steam to oil ratio (SOR) 2.9 2.4 2.6 2.4
Production
Production averaged 42,251 bpd for the fourth quarter of 2013, compared to 32,292 bpd for the fourth quarter of 2012. Production for the year ended December 31, 2013 averaged 35,317 bpd compared to 28,773 bpd for the year ended December 31, 2012. The increase in production volumes in 2013 compared to 2012 is due to the implementation of RISER on Phases 1 and 2 and the startup of Christina Lake Phase 2B, which achieved first production in the fourth quarter of 2013. Implementation of the RISER initiative within Phases 1 and 2 has expanded the steam generation capacity and improved reservoir efficiency, thereby enabling the Corporation to place additional wells into production in 2013.
For the three months ended December 31, 2013, the average SOR was 2.9, compared to an average SOR of 2.4 for the three months ended December 31, 2012. For the year ended December 31, 2013, the average SOR was 2.6, compared to an average SOR of 2.4 for the year ended December 31, 2012. The increase in the average SOR for these periods is the result of Phase 2B start‐up. It is anticipated that the SOR for the next several months will be higher than historical values due to the start‐up of new well pairs in Phase 2B. Each of these new well pairs will require steam preheating prior to conversion to production mode. Once well pairs commence production, the SOR will decrease. The Corporation continues to focus on increasing production and improving efficiency of current production through a lower SOR, which is an important efficiency indicator that measures the average amount of steam that is injected into the reservoir for each barrel of bitumen produced.
Cash Operating Netback – Three Months Ended December 31, 2013 versus December 31, 2012:
34.44
23.78
(0.46) (0.48) 0.61 (0.73)
(7.45)
0
0
0.00
0
(2.15)
0.00
5.00
10.00
15.00
20.00
25.00
30.00
35.00
40.00
4Q 2012 Bitumenrealization
Transportation Royalties Operating costs- non-energy
Operating costs- energy
Power sales 4Q 2013
$/bb
l

10
The following table summarizes the Corporation's cash operating netback for the three months ended December 31:
2013 2012
$000 $ per bbl $000 $ per bbl
Bitumen realization(1) 126,561 38.22 137,500 45.67
Transportation(2) (1,675) (0.51) (144) (0.05)
Royalties (8,978) (2.71) (6,709) (2.23)
Net bitumen revenue 115,908 35.00 130,647 43.39
Operating costs – non‐energy (26,787) (8.09) (26,179) (8.70)
Operating costs – energy (17,815) (5.38) (13,984) (4.65)
Power sales 7,447 2.25 13,248 4.40
Net operating costs (37,155) (11.22) (26,915) (8.95)
Cash operating netback(3) 78,753 23.78 103,732 34.44
Cash Operating Netback – Year Ended December 31, 2013 versus December 31, 2012:
34.1835.870.05 (0.68) 0.71 (1.16)2.35
-
0.42
0.00
5.00
10.00
15.00
20.00
25.00
30.00
35.00
40.00
2012 Bitumenrealization
Transportation Royalties Operating costs- non-energy
Operating costs- energy
Power sales 2013
$/bb
l

11
The following table summarizes the Corporation's cash operating netback for the years ended December 31:
2013 2012
$000 $ per bbl $000 $ per bbl
Bitumen realization(1) 606,458 49.28 495,425 46.93
Transportation(2) (3,172) (0.26) (3,231) (0.31)
Royalties (38,642) (3.14) (25,959) (2.46)
Net bitumen revenue 564,644 45.88 466,235 44.16
Operating costs – non‐energy (110,742) (9.00) (102,481) (9.71)
Operating costs – energy (56,844) (4.62) (36,538) (3.46)
Power sales 44,455 3.61 33,634 3.19
Net operating costs (123,131) (10.01) (105,385) (9.98)
Cash operating netback(3) 441,513 35.87 360,850 34.18
(1) Net of diluent costs. For further details, refer to the "Bitumen realization" section.
(2)
Net of third‐party recoveries on diluent transportation arrangements. For further details, refer to the "Transportation" section.
(3) Cash operating netbacks are calculated by deducting the related diluent, transportation, field operating costs and royalties from proprietary sales volumes and power revenues. Netbacks on a per‐unit basis are calculated by dividing related
production revenue, costs and royalties by bitumen sales volumes. Netbacks do not have a standardized meaning prescribed by IFRS and, therefore, may not be comparable to similar measures used by other companies. This non‐IFRS measurement is widely used in the oil and gas industry as a supplemental measure of the Corporation's efficiency and its ability to fund future growth through capital expenditures. "Cash operating netback" is reconciled to "Net income (loss)", the nearest IFRS measure, under the heading "NON‐IFRS MEASUREMENTS".
Bitumen realization
Bitumen produced at the Christina Lake project is mixed with purchased diluent and marketed as a heavy crude oil blend known as Access Western Blend ("AWB" or "blend"). Bitumen realization as discussed in this document represents the Corporation's realized proprietary blend sales revenues, net of the cost of diluent.
Three months ended
December 31 Year ended
December 31
($000) 2013 2012 2013 2012
Blend sales – proprietary 293,655 268,007 1,207,649 991,975
Cost of diluent (167,094) (130,507) (601,191) (496,550)
Bitumen realization 126,561 137,500 606,458 495,425
Blend sales for the three months ended December 31, 2013 were $293.7 million compared to $268.0 million for the three months ended December 31, 2012. The increase in blend sales for the fourth quarter of 2013 compared to the fourth quarter of 2012 is due to the 10% increase in sales volumes, partially offset by a decrease in the Corporation's average realized blend sales price. Blend sales averaged $60.60 per barrel for the fourth quarter of 2013, compared to $61.29 per barrel for the fourth quarter of 2012. Sales volumes increased as a result of the increased production volumes in the fourth quarter of 2013. Production increased compared to 2012 due to the implementation of RISER, which has allowed additional wells to be placed into production in 2013, and the startup of Christina Lake Phase 2B.

12
Blend sales for the year ended December 31, 2013 were $1.2 billion compared to $1.0 billion for the year ended December 31, 2012. The increase in blend sales for 2013 compared to 2012 is due to a 17% increase in sales volumes combined with an increase in the average realized price. Blend sales averaged $67.88 per barrel during the year ended December 31, 2013 compared to $64.78 per barrel for the year ended December 31, 2012.
The cost of diluent was $167.1 million for the three months ended December 31, 2013, compared to $130.5 million for the same period in 2012. The increase in the cost of diluent in the fourth quarter of 2013 compared to the fourth quarter of 2012 is a result of increased sales due to the implementation of RISER and the startup of Phase 2B, and an increase in the per barrel cost of diluent. On a per barrel basis, the Corporation's cost of diluent increased to $108.89 per barrel for the fourth quarter of 2013, from $95.78 per barrel for the fourth quarter of 2012.
The cost of diluent for the year ended December 31, 2013 was $601.2 million compared to $496.6 million for the year ended December 31, 2012. The total cost of diluent increased due to the increase in the per barrel cost of diluent and the higher volumes of diluent purchased as a result of increased bitumen sales. On a per barrel basis, the Corporation's average cost of diluent was $109.60 per barrel during the year ended December 31, 2013 compared to an average cost of $104.41 per barrel during the year ended December 31, 2012.
Transportation
Transportation costs, which include MEG's share of the operating costs for the Access Pipeline, net of third‐party recoveries, were $1.7 million for the three months ended December 31, 2013 compared to $0.1 million for the three months ended December 31, 2012. In the fourth quarter of 2013, the Corporation recognized third‐party recoveries of $4.1 million compared to $3.7 million in the fourth quarter of 2012. The increase in transportation costs for the three months ended December 31, 2013 compared to the same period in 2012 is primarily due to the additional costs associated with the Corporation beginning to ship product by rail in the fourth quarter of 2013. On a per barrel basis, transportation costs averaged $0.51 per barrel during the three months ended December 31, 2013, compared to $0.05 per barrel during the three months ended December 31, 2012.
Transportation costs totalled $3.2 million for both the year ended December 31, 2013 and December 31, 2012, net of $19.3 million and $13.0 million in recoveries, respectively. Transportation costs averaged $0.26 per barrel for the year ended December 31, 2013 compared to $0.31 per barrel for the year ended December 31, 2012.
Royalties
The Corporation's royalty expense is based on price‐sensitive royalty rates set by the Government of Alberta. The applicable royalty rates change depending on whether a project is pre‐payout or post‐payout, with payout being defined as the point in time when a project has generated enough net revenues to recover its cumulative costs. The royalty rate applicable to pre‐payout oil sands operations starts at 1% of bitumen sales and increases for every dollar that the WTI crude oil price in Canadian dollars is priced above $55 per barrel, to a maximum of 9% when the WTI crude oil price is $120 per barrel or higher. All of the Corporation's projects are currently pre‐payout.

13
Royalties were $9.0 million for the fourth quarter of 2013 compared to $6.7 million for the fourth quarter of 2012. The increase in royalties in the fourth quarter of 2013 is primarily a result of increased blend sales due to the implementation of RISER and the startup of Christina Lake Phase 2B and the increase in the Canadian dollar price of WTI. Royalties averaged $2.71 per barrel for the fourth quarter of 2013, compared to $2.23 per barrel for the fourth quarter of 2012. The Corporation's royalty rate averaged 7.1% for the fourth quarter of 2013 compared to 4.9% for the fourth quarter of 2012.
Royalties were $38.6 million for the year ended December 31, 2013 compared to $26.0 million for the year ended December 31, 2012. The increase in royalties for the year ended December 31, 2013 compared to the same period in 2012 is attributable to the increase in bitumen realizations, the increase in sales volumes and the increase in the Canadian dollar price of WTI. Royalties averaged $3.14 per barrel during the year ended December 31, 2013 compared to $2.46 per barrel for the year ended December 31, 2012. The Corporation's royalty rate averaged 6.4% for the year ended December 31, 2013 compared to 5.2% for the year ended December 31, 2012.
Operating Costs
Non‐energy operating costs were $26.8 million for the three months ended December 31, 2013, compared to $26.2 million for the three months ended December 31, 2012. Non‐energy operating costs decreased to an average of $8.09 per barrel in the fourth quarter of 2013, from $8.70 per barrel in the fourth quarter of 2012. For the year ended December 31, 2013, non‐energy operating costs were $110.7 million compared to $102.5 million for the year ended December 31, 2012. Non‐energy operating costs averaged $9.00 per barrel for the year ended December 31, 2013 compared to $9.71 per barrel for the same period in 2012. The increase in non‐energy related operating costs is primarily attributable to higher materials, camp and labor costs. These increases were more than offset on a per barrel basis by the increase in sales volumes.
Energy related operating costs were $17.8 million for the three months ended December 31, 2013 compared to $14.0 million for the three months ended December 31, 2012. On a per barrel basis, energy operating costs were $5.38 per barrel for the three months ended December 31, 2013 compared to $4.65 per barrel for the same period in 2012. Energy related operating costs were $56.8 million for the year ended December 31, 2013 compared to $36.5 million for the year ended December 31, 2012. On a per barrel basis, energy related operating costs were $4.62 per barrel for the year ended December 31, 2013 compared to $3.46 per barrel for the year ended December 31, 2012. The increase in energy related operating costs per barrel is primarily the result of higher natural gas prices. The benchmark AECO natural gas price averaged $3.52 per mcf for the fourth quarter of 2013, compared to $3.20 per mcf for the fourth quarter of 2012. The benchmark AECO natural gas price averaged $3.16 per mcf during the year ended December 31, 2013 compared to $2.38 per mcf for the year ended December 31, 2012.
Power Sales
With the completion of the Christina Lake Phase 2B cogeneration facility, the Corporation now has two 85 megawatt cogeneration facilities which produce steam for current SAGD operations. MEG's Christina Lake facilities utilize the heat produced by the cogeneration facility and a portion of the power generated. Surplus power is sold into the Alberta power pool.
Power sales were $7.4 million for the three months ended December 31, 2013, compared to $13.2 million for the three months ended December 31, 2012. The Corporation realized an average power price of $44.63 per megawatt hour for the three months ended December 31, 2013, compared to $79.62 per megawatt hour for the three months ended December 31, 2012. Power sales were $44.5 million for the year ended December 31, 2013, compared to $33.6 million for the year ended December

14
31, 2012. The average realized power price in 2013 was $76.23 per megawatt hour compared to $59.22 per megawatt hour in 2012. Variations in the Corporation's realized power prices during the periods are largely consistent with variations in the Alberta power pool prices during the periods noted. Power prices in the fourth quarter were below the same period in 2012 as the result of lower power generation volatility. However, generation volatility over the first half of 2013 resulted in full year 2013 prices above 2012 levels.
NON‐IFRS MEASUREMENTS
The following tables reconcile the non‐IFRS measurements "Operating earnings (loss)" and "Cash operating netback" to "Net income (loss)", the nearest IFRS measure, and also reconcile the non‐IFRS measurement "Cash flow from operations" to "Net cash provided by operating activities", the nearest IFRS measure. Operating earnings (loss) is defined as net income (loss) as reported, excluding the after‐tax unrealized foreign exchange gains and losses, unrealized gains and losses on derivative financial liabilities, and unrealized fair value gains and losses on other assets. Cash flow from operations excludes the net change in non‐cash operating working capital, while the IFRS measurement "Net cash provided by operating activities" includes these items. Cash operating netback is comprised of proprietary petroleum and power sales less royalties, operating costs, cost of diluent and transportation costs.
Three months ended December 31
Year ended December 31
($000) 2013 2012 2013 2012
Net income (loss) (148,182) (18,740) (166,405) 52,569
Add (deduct):
Unrealized foreign exchange (gain) loss, net of tax(1) 116,262 20,136 181,234 (39,090)
Unrealized (gain) loss on derivative financial liabilities, net of tax(2) (1,454) (1,934) (14,443) 9,651
Unrealized fair value (gain) loss on other assets, net of tax(3) 689 ‐ ‐ (1,888)
Operating earnings (loss) (32,685) (538) 386 21,242
Add (deduct):
Interest income (7,986) (4,650) (22,550) (19,896)
Depletion and depreciation 51,508 44,593 189,147 144,950
General and administrative 22,662 22,173 92,828 70,597
Stock‐based compensation 9,660 7,271 38,792 25,246
Research and development 1,645 966 5,588 5,157
Interest expense 37,768 27,600 110,306 91,816
Accretion 1,017 999 4,763 3,670
Gain on disposition of assets (1,410) ‐ (1,410) (3,075)
Realized (gain) loss on foreign exchange 1,180 372 2,916 (796)
Realized loss on derivative financial liabilities 1,212 1,169 4,720 4,518
Net marketing activity 1,131 1,537 2,365 1,762
Deferred income tax expense (recovery), operating (6,949) 2,240 13,662 15,659
Cash operating netback 78,753 103,732 441,513 360,850
(1) Unrealized foreign exchange losses result from the translation of U.S. dollar denominated long‐term debt and cash and
cash equivalents to period‐end exchange rates. Unrealized foreign exchange losses are presented net of a deferred tax expense of $3,837 for the three months ended December 31, 2013 and a deferred tax expense of $3,872 for the year ended December 31, 2013 (deferred tax recovery of $618 for the three months ended December 31, 2012 and a deferred tax recovery of $3,269 for the year ended December 31, 2012).

15
(2) Unrealized gains and losses on derivative financial liabilities result from the interest rate floor on the Corporation's long‐
term debt and interest rate swaps entered into to fix a portion of its variable rate long‐term debt, net of a deferred tax expense of $484 for the three months ended December 31, 2013 and a deferred tax expense of $4,813 for the year ended December 31, 2013 (deferred tax expense of $645 for the three months ended December 31, 2012 and a deferred tax recovery of $3,217 for the year ended December 31, 2012).
(3) Unrealized fair value gain on other assets results from the fair market valuation of other assets held during the year, net of a deferred tax recovery of $230 for the three months ended December 31, 2013 (deferred tax expense of $630 for the year ended December 31, 2012).
Three months ended
December 31 Year ended
December 31
Non‐IFRS Measurements ‐ Reconciliation of net cash provided by operating activities to cash flow from operations ($000) 2013 2012 2013 2012
Net cash provided by operating activities 3,939 48,491 129,963 240,824
Add:
Net change in non‐cash operating workingcapital items 18,709 7,615 123,461 (28,310)
Cash flow from operations 22,648 56,106 253,424 212,514
Depletion and Depreciation
Depletion and depreciation expense was $51.5 million for the three months ended December 31, 2013, compared to $44.6 million for the same period in 2012. For the year ended December 31, 2013, depletion and depreciation expense was $189.1 million compared to $145.0 million for the year ended December 31, 2012. The increase is primarily due to higher sales volumes and an increase in the rate per barrel as a result of an increase in GLJ's estimate of future development costs of the producing oil sands properties. The future development costs are a key element of the rate determination. Sales volumes increased by approximately 10% in the fourth quarter, and 17% year‐to‐date in 2013, as compared to the same periods in 2012. The depletion and depreciation rates for the three and twelve month periods ended December 31, 2013 were $15.56 per barrel, and $15.37 per barrel, respectively. This compared to depletion and depreciation rates of $14.98 per barrel for the three months ended December 31, 2012 and $13.76 per barrel for the year ended December 31, 2012. The Corporation's producing oil sands properties are depleted on a unit of production basis based on estimated proved reserves. Major facilities and equipment are depreciated on a unit of production basis over the estimated total productive capacity of the facilities and equipment. Pipeline and storage assets are depreciated on a straight‐line basis over their estimated useful lives.
General and Administrative Costs
Three months ended
December 31 Year ended
December 31
($000) 2013 2012 2013 2012
General and administrative costs 34,702 27,986 123,194 91,510
Capitalized general and administrative costs (12,040) (5,813) (30,366) (20,913)
General and administrative expense 22,662 22,173 92,828 70,597

16
General and administrative expense for the three months ended December 31, 2013 was $22.7 million, compared to $22.2 million for the same period in 2012. General and administrative expense for the year ended December 31, 2013 was $92.8 million compared to $70.6 million for the year ended December 31, 2012. The increase in expense is primarily the result of the planned growth in the Corporation's professional staff and office costs to support the operation and development of its oil sands assets.
Stock‐based Compensation
Three months ended
December 31 Year ended
December 31
($000) 2013 2012 2013 2012
Stock‐based compensation costs 14,192 9,189 50,060 32,042
Capitalized stock‐based compensation costs (4,532) (1,918) (11,268) (6,796)
Stock‐based compensation expense 9,660 7,271 38,792 25,246
The fair value of compensation associated with the granting of stock options, restricted share units ("RSUs") and performance share units ("PSUs") to directors, officers, employees and consultants is recognized by the Corporation in its consolidated financial statements. Fair value is determined using the Black‐Scholes option pricing model. Stock‐based compensation expense was $9.7 million for the three months ended December 31, 2013, compared to $7.3 million for the three months ended December 31, 2012. For the year ended December 31, 2013, stock‐based compensation expense was $38.8 million compared to $25.2 million for the year ended December 31, 2012. The increase in stock‐based compensation for the periods ended December 31, 2013 compared to the same periods in 2012 is due to the increased number of share based awards granted and as a result of the growth in the Corporation's professional staff. The Corporation capitalizes a portion of stock‐based compensation expense associated with capitalized salaries and benefits. The Corporation capitalized $4.5 million of stock‐based compensation to property, plant and equipment during the three months ended December 31, 2013, compared to $1.9 million during the three months ended December 31, 2012. The Corporation capitalized $11.3 million of stock‐based compensation for the year ended December 31, 2013 compared to $6.8 million during the year ended December 31, 2012.
Research and Development
Research and development expenditures related to the Corporation's research of crude quality improvement and related technologies have been expensed. Research and development expenditures were $1.6 million for the three months ended December 31, 2013, compared to $1.0 million for the three months ended December 31, 2012. For the year ended December 31, 2013, research and development expenditures were $5.6 million compared to $5.2 million for the year ended December 31, 2012.

17
Net Finance Expense
Three months ended
December 31 Year ended
December 31
($000) 2013 2012 2013 2012
Total interest expense 60,679 37,954 186,835 122,424
Less capitalized interest (22,911) (10,354) (76,529) (30,608)
Net interest expense 37,768 27,600 110,306 91,816
Accretion on decommissioning provision 1,017 999 4,763 3,670
Unrealized fair value (gain) loss on embedded derivative financial liabilities (2,097) (2,023) (14,352) 2,953
Unrealized fair value (gain) loss on interest rate swaps 159 (556) (4,904) 9,915
Realized loss on interest rate swaps 1,212 1,169 4,720 4,518
Fair value (gain) loss on other assets 919 ‐ ‐ (2,518)
Net finance expense 38,978 27,189 100,533 110,354
Average effective interest rate 6.2% 6.0% 6.0% 5.8%
Total interest expense was $60.7 million for the three months ended December 31, 2013, compared to $38.0 million for the three months ended December 31, 2012. The increase in the fourth quarter of 2013 is primarily due to the Corporation's issuance of US$1.0 billion in aggregate principal amount of 7.0% senior unsecured notes in the fourth quarter of 2013.
For the year ended December 31, 2013, total interest expense increased to $186.8 million compared to $122.4 million for the year ended December 31, 2012. Total interest expense increased primarily as a result of the increased debt outstanding. In the first quarter of 2013, the senior secured term loan was increased by US$300.0 million to approximately US$1.3 billion and in the fourth quarter of 2013, the Corporation issued US$1.0 billion in aggregate principal amount of 7.0% senior unsecured notes.
The Corporation recognized an unrealized gain on embedded derivative financial liabilities of $2.1 million during the fourth quarter of 2013, compared to an unrealized gain of $2.0 million during the fourth quarter of 2012. The Corporation recognized an unrealized gain on embedded derivative financial liabilities of $14.4 million for the year ended December 31, 2013 compared to an unrealized loss of $3.0 million for the same period in 2012. These gains and losses relate to the change in fair value of the interest rate floor associated with the Corporation's senior secured credit facilities. The interest rate floor is considered an embedded derivative as the floor rate was higher than the London Interbank Offered Rate ("LIBOR") at the time that the debt agreements were entered into. Accordingly, the fair value of the embedded derivatives at the time the debt agreements were entered into was netted against the carrying value of the long‐term debt and is amortized over the life of the debt agreements. The fair value of the embedded derivative is included in derivative financial liabilities on the balance sheet and gains and losses associated with changes in the fair value of the embedded derivative are included in net finance expense.
The Corporation has entered into interest rate swap contracts to effectively fix the interest rate at approximately 4.4% on US$748.0 million of the US$1.3 billion senior secured term loan until September 30, 2016. The Corporation realized a $1.2 million loss on these contracts for the three months ended December 31, 2013 and a loss of $4.7 million for the year ended December 31, 2013. This compared to a realized loss of $1.2 million for the three months ended December 31, 2012 and a loss of $4.5 million for the year ended December 31, 2012. In addition, the Corporation recognized an unrealized loss of $0.2

18
million on these contracts for the three months ended December 31, 2013 and an unrealized gain of $4.9 million for the year ended December 31, 2013. This compared to an unrealized gain of $0.6 million and an unrealized loss of $9.9 million during the same periods in 2012.
Net Foreign Exchange Gain (Loss)
Three months ended
December 31 Year ended
December 31
($000) 2013 2012 2013 2012
Foreign exchange gain (loss) on:
Long‐term debt (127,834) (28,449) (213,715) 48,822
US$ denominated cash and cash equivalents 15,409 7,695 36,353 (13,000)
Other (1,180) (372) (2,916) 796
Net foreign exchange gain (loss) (113,605) (21,126) (180,278) 36,618
C$‐US$ exchange rate as at December 31,
2013 September 30,
2013 December 31,
2012 September 30,
2012 December 31,
2011
C$ equivalent of 1 US$ 1.0636 1.0285 0.9949 0.9837 1.0170
The Corporation recognized a net foreign exchange loss for the three months ended December 31, 2013 of $113.6 million in comparison to a net foreign exchange loss of $21.1 million for the three months ended December 31, 2012. For the year ended December 31, 2013, the net foreign exchange loss was $180.3 million compared to a net foreign exchange gain of $36.6 million for the year ended December 31, 2012. The Canadian dollar weakened by approximately 3% during the fourth quarter of 2013, while it weakened by approximately 1% during the fourth quarter of 2012. During the year ended December 31, 2013, the Canadian dollar weakened in value compared to the U.S. dollar by approximately 7%. In comparison, the Canadian dollar strengthened by approximately 2% during the year ended December 31, 2012.
Net Marketing Activity
Three months ended
December 31 Year ended
December 31
($000) 2013 2012 2013 2012
Sales of purchased product 54,154 19,323 101,750 37,822
Purchased product and storage (55,285) (20,860) (104,115) (39,584)
Net marketing activity (1,131) (1,537) (2,365) (1,762)
Net marketing activity includes the Corporation's activities to secure pipeline capacity and to pursue opportunities to move product to a wider range of markets through the development of proprietary transportation and storage facilities.
Income Taxes
The Corporation recognized a deferred income tax recovery of $2.9 million for the three months ended December 31, 2013, compared to a deferred income tax expense of $2.3 million for the three months ended December 31, 2012. Deferred income tax expense was $22.3 million for the year ended December 31, 2013 compared to $9.8 million for the year ended December 31, 2012.

19
The Corporation's effective income tax rate is impacted by permanent differences and variances in taxable capital losses not recognized. The significant differences are:
The non‐taxable portion of foreign exchange gains and losses arising on the translation of the U.S. dollar denominated debt is a permanent difference. For the three months ended December 31, 2013, the non‐taxable loss was $63.9 million compared to a non‐taxable loss of $14.3 million for the same period in 2012. For the year ended December 31, 2013, the non‐taxable loss was $106.9 million compared to a non‐taxable gain of $24.4 million for the year ended December 31, 2012.
As at December 31, 2013, the Corporation had not recognized the tax benefit related to $86.0 million in unrealized taxable capital foreign exchange losses.
Non‐taxable stock‐based compensation expense was $9.7 million for the fourth quarter of 2013, in comparison to $7.3 million for the fourth quarter of 2012. For the year ended December 31, 2013, non‐taxable stock‐based compensation expense was $38.8 million compared to $25.2 million for the year ended December 31, 2012.
The Corporation is not currently taxable. As of December 31, 2013, the Corporation had approximately $6.8 billion of available tax pools and had recognized a deferred income tax liability of $93.8 million. In addition, at December 31, 2013, the Corporation had $508.1 million of capital investment in respect of incomplete projects which will increase available tax pools upon completion of the projects.
SUMMARY OF QUARTERLY RESULTS
The following table summarizes selected financial information for the Corporation for the preceding eight quarters:
2013 2012
($ millions, except per share amounts) Q4 Q3 Q2 Q1 Q4 Q3 Q2 Q1
Revenue 350.3 401.8 324.4 258.0 297.6 213.7 259.7 279.6
Net income (loss) (148.2) 115.4 (62.3) (71.3) (18.7) 47.5 (29.5) 53.4
Per share – basic (0.67) 0.52 (0.28) (0.32) (0.09) 0.24 (0.15) 0.28
Per share – diluted (0.67) 0.51 (0.28) (0.32) (0.09) 0.24 (0.15) 0.27
Revenue for the eight most recent quarters has been impacted by an increase in production and fluctuations in blend sales pricing. Revenues in the second quarter of 2013 and the third quarter of 2012 had reduced production volumes as the result of scheduled annual maintenance activities at the Christina Lake facilities.
Net income (loss) during the periods noted was impacted by:
increased production due to the implementation of RISER on Phases 1 and 2, which has allowed additional wells to be placed into production;
fluctuations in blend sales pricing due to changes in the price of WTI and the differential between WTI and the Corporation's AWB;

20
foreign exchange gains and losses attributable to fluctuations in the rate of exchange between the Canadian and U.S. dollar in translating the Corporation's U.S. dollar denominated debt (net of U.S. dollar denominated cash, cash equivalents and short‐term investments);
changes in the fair value of the LIBOR floor on the senior secured term loans (embedded derivative financial liability);
risk management activities for interest rate swaps;
an increase in depletion and depreciation expense as a result of the increase in production and higher estimated future development costs;
higher general and administrative expense as a result of the planned increase in office staff to support growth;
an increase in interest expense as a result of the increase in long‐term debt;
scheduled annual plant maintenance activities performed in May 2013 and September 2012; and
the startup of Christina Lake Phase 2B.
CAPITAL INVESTING
Three months ended
December 31 Year ended
December 31
($000) 2013 2012 2013 2012 Christina Lake Phase 2B 1,215 138,572 200,789 631,495Christina Lake Phase 3A 7,303 3,431 196,359 61,982RISER 27,982 94,720 502,711 166,782Inventory wells 30,875 40,824 132,260 92,277Delineation drilling and seismic 6,326 27,535 93,025 127,959Regulatory 2,024 882 5,109 5,577Other 65,089 15,871 198,027 47,797
Growth 140,814 321,835 1,328,280 1,133,869Access Pipeline 57,837 35,473 257,629 115,807Stonefell Terminal 14,416 52,375 124,155 136,399Field infrastructure 89,634 57,016 179,072 118,372
Infrastructure related to growth 161,887 144,864 560,856 370,578
Sustaining 42,481 11,588 100,305 42,277Land and other 21,139 6,275 122,383 21,182
Cash capital investment 366,321 484,562 2,111,824 1,567,906Capitalized interest 22,911 10,354 76,529 30,608
Total cash capital investment 389,232 494,916 2,188,353 1,598,514Non‐cash 5,138 5,307 39,799 21,169Total capital investment 394,370 500,223 2,228,152 1,619,683
MEG's capital investment for the three months ended December 31, 2013 totalled $394.4 million (including capitalized interest of $22.9 million and non‐cash items of $5.1 million), compared to $500.2 million (including capitalized interest of $10.4 million and non‐cash items of $5.3 million) invested during the three months ended December 31, 2012. For the year ended December 31, 2013, capital investment was $2.2 billion (including capitalized interest of $76.5 million and non‐cash items of $39.8 million) in comparison to $1.6 billion (including capitalized interest of $30.6 million and non‐cash items of $21.2 million) for the year ended December 31, 2012. Capital investment included $140.8 million in growth focused investment during the fourth quarter of 2013 and $1.3 billion for the year ended December 31, 2013, compared to $321.8 million and $1.1 billion in the corresponding periods of 2012.

21
MEG invested $1.2 million in Phase 2B of the Christina Lake project during the fourth quarter of 2013, and $200.8 million during the year ended December 31, 2013. The Phase 2B facility is now complete and attained first oil in the fourth quarter of 2013.
The Corporation invested $7.3 million for the three months ended, and $196.4 million for the year ended December 31, 2013 on engineering, purchasing of long‐lead equipment and materials, and site preparation activity for Phase 3A.
MEG invested $28.0 million during the fourth quarter of 2013 and $502.7 million during the year ended December 31, 2013 on RISER. The investment was made to accommodate the implementation of RISER on Phases 1 and 2 and to prepare Phase 2B for the first stage of adoption.
The Corporation invested $30.9 million for the drilling of inventory wells at the Christina Lake project during the fourth quarter of 2013 and $132.3 million during the year ended December 31, 2013. These inventory wells will be placed on production as freed‐up steam becomes available from the implementation of the enhanced Modified Steam and Gas Push (eMSAGP) process.
The Corporation invested $6.3 million during the fourth quarter of 2013 on delineation drilling and seismic and $93.0 million during the year ended December 31, 2013. The Corporation drilled 132 stratigraphic wells, one water observation well and four water source wells to support horizontal well placement, further delineate the resource base at Christina Lake and to increase deliverability to the source water system. A total of 24 stratigraphic wells, one water source well and three water test wells were completed at Surmont.
Other capital investment during 2013 includes $128.1 million of commissioning costs for Phase 2B of the Christina Lake project. These commissioning costs include labour and services, spare parts and inventory, initial chemicals and lubricants, and demobilization costs required for the Phase 2B facility.
A total of $161.9 million was invested during the fourth quarter and $560.9 million during the year ended December 31, 2013 in the Corporation's growth‐related infrastructure. During 2013 the Corporation invested $257.6 million on material purchases and construction related to the expansion of the 50%‐owned Access Pipeline. Regulatory approval of the pipeline expansion was received in 2012 and over half of the expansion for the 300 kilometer pipeline has been installed. The expansion is expected to be complete and in service by the fourth quarter of 2014. Investment in the Stonefell storage terminal totaled $124.2 million for the year ended December 31, 2013. The Stonefell storage terminal is a 900,000 barrel marketing terminal that is connected to the Access Pipeline. The Corporation completed the commissioning of the terminal in the fourth quarter of 2013 and it is now operational. The Corporation also completed the connection from the Stonefell storage terminal to the Canexus operated rail terminal in the fourth quarter and has commenced shipping blend by unit‐train rail facilities. The Corporation invested an additional $179.1 million in field infrastructure for current and future operations at Christina Lake.
The Corporation capitalizes interest associated with qualifying assets. During the three months ended December 31, 2013, $22.9 million of interest was capitalized, in comparison to $10.4 million during the three months ended December 31, 2012. A total of $76.5 million in interest was capitalized during the year ended December 31, 2013 compared to $30.6 million during the year ended December 31, 2012.
Land and other investments includes $39.0 million for land acquired northeast of Edmonton, Alberta in the second quarter of 2013 and $23.5 million to purchase undeveloped oil sands leases near Leismer, Alberta in the third quarter of 2013. Other investments include investments in administrative assets and amounts paid to maintain the right to participate in a potential pipeline project.

22
Non‐cash capital investment for the three months ended December 31, 2013 included $4.5 million in capitalized stock‐based compensation and $2.5 million in capitalized depletion and depreciation expense related to the commissioning of Phase 2B, partially offset by a $1.9 million reduction in the future reclamation and decommissioning provision associated with the Corporation's property, plant and equipment. Non‐cash capital investment for the year ended December 31, 2013 included a $26.0 million provision for future reclamation and decommissioning of the Corporation's property, plant and equipment, $11.3 million in capitalized stock‐based compensation and $2.5 million in capitalized depletion and depreciation expense related to the commissioning of Phase 2B.
ADVISORY
Forward‐Looking Information
This document may contain forward‐looking information including but not limited to: expectations of future production, revenues, expenses, cash flow, operating costs, SORs, pricing differentials, reliability, profitability and capital investments; estimates of reserves and resources; the anticipated reductions in operating costs as a result of optimization and scalability of certain operations; the anticipated capital requirements, timing for receipt of regulatory approvals, development plans, timing for completion, commissioning and start‐up, capacities and performance of the Access Pipeline expansion, the RISER initiative, the Stonefell Terminal, third party barging and rail facilities, the future phases and expansions of the Christina Lake project, the Surmont project and potential projects on the Growth Properties; and the anticipated sources of funding for operations and capital investments. Such forward‐looking information is based on management's expectations and assumptions regarding future growth, results of operations, production, future capital and other expenditures (including the amount, nature and sources of funding thereof), plans for and results of drilling activity, environmental matters, business prospects and opportunities.
By its nature, such forward‐looking information involves significant known and unknown risks and uncertainties, which could cause actual results to differ materially from those anticipated. These risks include, but are not limited to: risks associated with the oil and gas industry (e.g. operational risks and delays in the development, exploration or production associated with MEG's projects; the securing of adequate supplies and access to markets and transportation infrastructure; the availability of capacity on the electrical transmission grid; the uncertainty of reserve and resource estimates; the uncertainty of estimates and projections relating to production, costs and revenues; health, safety and environmental risks; risks of legislative and regulatory changes to, amongst other things, tax, land use, royalty and environmental laws), assumptions regarding and the volatility of commodity prices and foreign exchange rates; and risks and uncertainties associated with securing and maintaining the necessary regulatory approvals and financing to proceed with the continued expansion of the Christina Lake project and the development of the Corporation's other projects and facilities. Although MEG believes that the assumptions used in such forward‐looking information are reasonable, there can be no assurance that such assumptions will be correct. Accordingly, readers are cautioned that the actual results achieved may vary from the forward‐looking information provided herein and that the variations may be material. Readers are also cautioned that the foregoing list of assumptions, risks and factors is not exhaustive.

23
The forward‐looking information included in this document is expressly qualified in its entirety by the foregoing cautionary statements. Unless otherwise stated, the forward‐looking information included in this document is made as of the date of this document and the Corporation assumes no obligation to update or revise any forward‐looking information to reflect new events or circumstances, except as required by law. For more information regarding forward‐looking information see "Notice Regarding Forward Looking Information", "Risk Factors" and "Regulatory Matters" within MEG's Annual Information Form dated February 27, 2013 (the "AIF") along with MEG's other public disclosure documents. Copies of the AIF and MEG's other public disclosure documents are available through the SEDAR website (www.sedar.com) or by contacting MEG's investor relations department.
Estimates of Reserves and Resources
This document contains references to estimates of the Corporation's reserves and contingent resources. For supplemental information regarding the classification and uncertainties related to MEG's estimated reserves and resources please see "Independent Reserve and Resource Evaluation" in the AIF.
Non‐IFRS Financial Measures
This document includes references to financial measures commonly used in the crude oil and natural gas industry, such as net bitumen revenue, operating earnings, cash flow from operations and cash operating netback. These financial measures are not defined by IFRS as issued by the International Accounting Standards Board and therefore are referred to as non‐IFRS measures. The non‐IFRS measures used by the Corporation may not be comparable to similar measures presented by other companies. The Corporation uses these non‐IFRS measures to help evaluate its performance. Management considers net bitumen revenue, operating earnings and cash operating netback important measures as they indicate profitability relative to current commodity prices. Management uses cash flow from operations to measure the Corporation's ability to generate funds to finance capital expenditures and repay debt. These non‐IFRS measures should not be considered as an alternative to or more meaningful than net income (loss) or net cash provided by operating activities, as determined in accordance with IFRS, as an indication of the Corporation's performance. The non‐IFRS operating earnings and cash operating netback measures are reconciled to net income (loss), while cash flow from operations is reconciled to net cash provided by operating activities.
ADDITIONAL INFORMATION
Additional information relating to the Corporation, including its AIF, is available on MEG’S website at www.megenergy.com and is also available on SEDAR at www.sedar.com.

24
QUARTERLY SUMMARIES
2013 2012
Unaudited Q4 Q3 Q2 Q1 Q4 Q3 Q2 Q1
FINANCIAL ($000 unless specified)
Net income (loss) (148,182) 115,383 (62,312) (71,294) (18,740) 47,474 (29,534) 53,369
Per share, diluted (0.67) 0.51 (0.28) (0.32) (0.09) 0.24 (0.15) 0.27
Operating earnings (loss) (32,685) 56,171 13,612 (36,712) (538) (12,883) 11,134 23,529
Per share, diluted (0.15) 0.25 0.06 (0.16) 0.00 (0.07) 0.06 0.12
Cash flow from operations 22,648 144,521 79,184 7,071 56,106 24,442 59,975 71,991
Per share, diluted 0.10 0.64 0.35 0.03 0.27 0.12 0.30 0.36
Capital investment 394,370 477,335 674,576 681,871 500,223 406,526 341,840 371,094
Cash, cash equivalents and short‐term investments 1,179,072 647,096 1,203,457 1,803,338 2,007,841 1,607,036 1,111,150 1,402,390
Working capital 1,045,606 365,676 731,290 1,298,955 1,655,915 1,307,325 902,424 1,183,628
Long‐term debt 4,004,575 2,857,740 2,923,382 2,823,207 2,488,609 2,461,676 1,751,552 1,718,474
Shareholders' equity 4,788,430 4,919,407 4,771,616 4,817,253 4,870,534 4,092,556 4,027,652 4,049,633
BUSINESS ENVIRONMENT
West Texas Intermediate (WTI) US$/bbl 97.43 105.83 94.22 94.37 88.18 92.22 93.49 102.92
C$ equivalent of 1US$ ‐ average 1.0477 1.0385 1.0233 1.0089 0.9913 0.9948 1.0102 1.0012
Differential – WTI vs blend ($/bbl) 41.48 23.50 26.17 39.96 26.13 29.54 29.83 32.10
Differential – WTI vs blend (%) 40.6% 21.4% 27.1% 41.9% 29.9% 32.2% 31.6% 31.2%
OPERATIONAL ($/bbl unless specified)
Bitumen production – bpd 42,251 34,246 32,144 32,531 32,292 23,941 30,429 28,446
Bitumen sales – bpd 35,990 34,256 32,175 32,393 32,722 23,876 30,229 28,567
Diluent usage – bpd 16,680 13,032 14,176 16,239 14,810 9,466 13,800 13,919
Blend sales – bpd 52,670 47,288 46,351 48,632 47,532 33,342 44,029 42,486
Steam to oil ratio (SOR) 2.9 2.5 2.3 2.5 2.4 2.5 2.4 2.5
Blend sales 60.60 86.40 70.25 55.24 61.29 62.19 64.62 70.95
Cost of diluent (22.38) (12.07) (16.27) (25.20) (15.62) (15.70) (19.03) (20.80)
Bitumen realization 38.22 74.33 53.98 30.04 45.67 46.49 45.59 50.15
Transportation – net (0.51) (0.20) (0.17) (0.12) (0.05) (0.93) (0.03) (0.37)
Royalties (2.71) (5.14) (3.03) (1.58) (2.23) (2.10) (2.84) (2.63)
Operating costs – non‐energy (8.09) (9.20) (10.00) (8.81) (8.70) (15.23) (7.79) (8.24)
Operating costs – energy (5.38) (3.32) (4.85) (4.93) (4.65) (3.22) (2.62) (3.18)
Power sales 2.25 3.12 6.00 3.30 4.40 2.84 1.86 3.47
Cash operating netback 23.78 59.59 41.93 17.90 34.44 27.85 34.17 39.20
Power sales price (C$/MWh) 44.63 75.96 138.96 59.92 79.62 57.99 36.85 58.25
Power sales (MW/h) 76 59 58 74 75 49 64 71
Depletion and depreciation rate per bbl 15.56 15.54 15.13 15.16 14.98 13.39 13.01 13.44
COMMON SHARES
Shares outstanding, end of period (000) 222,507 222,489 221,829 221,256 220,190 195,248 194,326 193,986
Volume traded (000) 33,400 28,403 43,789 28,495 20,370 13,578 21,560 18,230
Common share price ($)
High 36.00 36.69 32.98 35.67 38.74 41.90 43.96 47.11
Low 28.60 28.81 25.50 30.89 30.25 35.20 32.92 36.73
Close (end of period) 30.61 35.54 28.83 32.61 30.44 37.39 36.49 38.46

25
Interim Financial Statements Consolidated Balance Sheet (Unaudited, expressed in thousands of Canadian dollars)
As at December 31, Note 2013 2012
Assets
Current assets
Cash and cash equivalents 20 $ 1,179,072 $ 1,474,843
Short‐term investments ‐ 532,998
Trade receivables and other 6 186,183 110,823
Inventories 7 129,943 17,536
1,495,198 2,136,200
Non‐current assets
Property, plant and equipment 8 7,254,951 5,267,885
Exploration and evaluation assets 9 579,497 554,349
Other intangible assets 10 63,205 46,033
Other assets 11 54,890 14,212
Total assets $ 9,447,741 $ 8,018,679
Liabilities
Current liabilities
Accounts payable and accrued liabilities 12 $ 416,288 $ 463,077
Current portion of long‐term debt 13 13,827 9,949
Current portion of provisions and other liabilities 14 19,477 7,259
449,592 480,285
Non‐current liabilities
Long‐term debt 13 3,990,748 2,478,660
Provisions and other liabilities 14 125,177 117,756
Deferred income tax liability 93,794 71,444
Total liabilities 4,659,311 3,148,145
Commitments and contingencies 22
Shareholders' equity
Share capital 15 4,751,374 4,694,378
Contributed surplus 15 126,666 102,219
Retained earnings (deficit) (92,493) 73,912
Accumulated other comprehensive income 2,883 25
Total shareholders' equity 4,788,430 4,870,534
Total liabilities and shareholders' equity $ 9,447,741 $ 8,018,679
The accompanying notes are an integral part of these condensed interim consolidated financial statements.
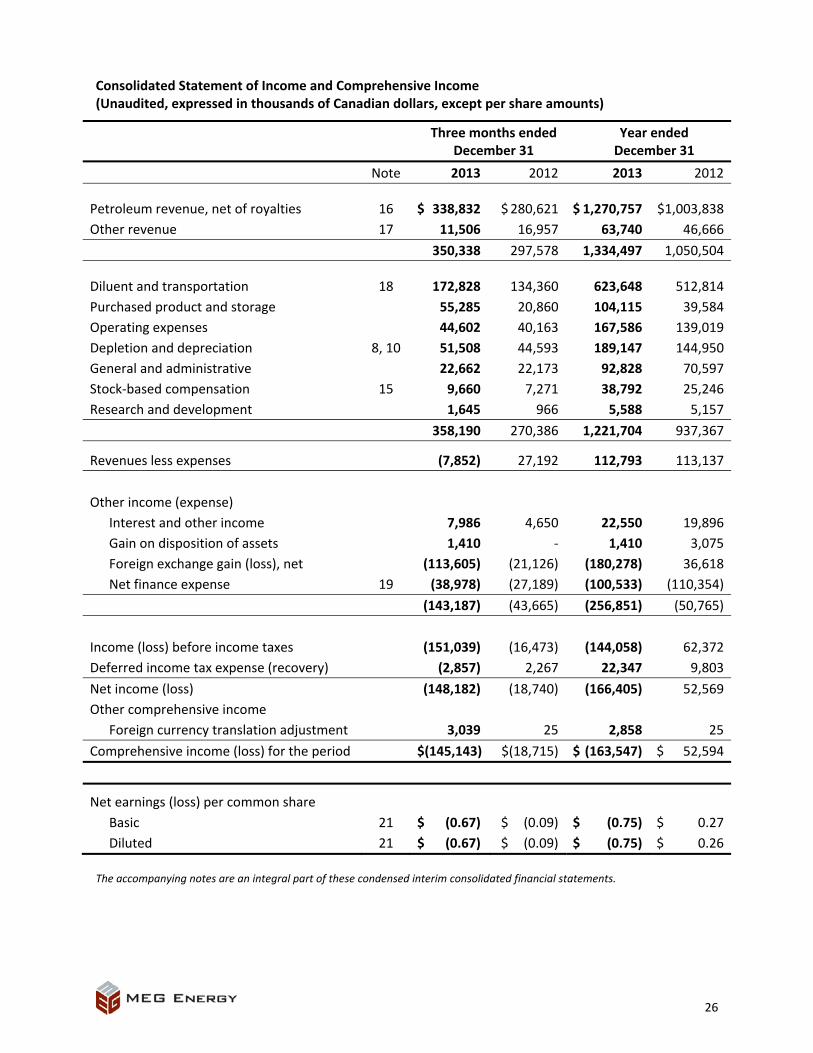
26
Consolidated Statement of Income and Comprehensive Income (Unaudited, expressed in thousands of Canadian dollars, except per share amounts)
Three months ended
December 31 Year ended December 31
Note 2013 2012 2013 2012
Petroleum revenue, net of royalties 16 $ 338,832 $ 280,621 $ 1,270,757 $1,003,838
Other revenue 17 11,506 16,957 63,740 46,666
350,338 297,578 1,334,497 1,050,504
Diluent and transportation 18 172,828 134,360 623,648 512,814
Purchased product and storage 55,285 20,860 104,115 39,584
Operating expenses 44,602 40,163 167,586 139,019
Depletion and depreciation 8, 10 51,508 44,593 189,147 144,950
General and administrative 22,662 22,173 92,828 70,597
Stock‐based compensation 15 9,660 7,271 38,792 25,246
Research and development 1,645 966 5,588 5,157
358,190 270,386 1,221,704 937,367
Revenues less expenses (7,852) 27,192 112,793 113,137
Other income (expense)
Interest and other income 7,986 4,650 22,550 19,896
Gain on disposition of assets 1,410 ‐ 1,410 3,075
Foreign exchange gain (loss), net (113,605) (21,126) (180,278) 36,618
Net finance expense 19 (38,978) (27,189) (100,533) (110,354)
(143,187) (43,665) (256,851) (50,765)
Income (loss) before income taxes (151,039) (16,473) (144,058) 62,372
Deferred income tax expense (recovery) (2,857) 2,267 22,347 9,803
Net income (loss) (148,182) (18,740) (166,405) 52,569
Other comprehensive income
Foreign currency translation adjustment 3,039 25 2,858 25
Comprehensive income (loss) for the period $(145,143) $(18,715) $ (163,547) $ 52,594
Net earnings (loss) per common share
Basic 21 $ (0.67) $ (0.09) $ (0.75) $ 0.27
Diluted 21 $ (0.67) $ (0.09) $ (0.75) $ 0.26
The accompanying notes are an integral part of these condensed interim consolidated financial statements.

27
Consolidated Statement of Changes in Shareholders' Equity (Unaudited, expressed in thousands of Canadian dollars)
The accompanying notes are an integral part of these condensed interim consolidated financial statements.
Note Share Capital
ContributedSurplus
RetainedEarnings
(Deficit)
Accumulated Other Comprehensive Income (AOCI)
TotalShareholders' Equity
Balance as at January 1, 2013 $ 4,694,378 $ 102,219 $ 73,912 $ 25 $ 4,870,534
Share issue costs, net of tax 79 79
Stock options exercised 15 40,522 (9,217) 31,305
RSUs vested and released 15 16,395 (16,395) ‐
Stock‐based compensation 15 50,059 50,059
Net loss (166,405) (166,405)
Other comprehensive Income 2,858 2,858
Balance as at December 31, 2013 $ 4,751,374 $ 126,666 $ (92,493) $ 2,883 $ 4,788,430
Balance as at January 1, 2012 $ 3,877,193 $ 85,568 $ 21,343 $ ‐ $ 3,984,104
Shares issued 800,125 800,125
Share issue costs, net of tax (18,988) (18,988)
Stock options exercised 26,520 (5,863) 20,657
RSUs vested and released 9,528 (9,528) ‐
Stock‐based compensation 32,042 32,042
Net income 52,569 52,569
Other comprehensive Income 25 25
Balance as at December 31, 2012 $ 4,694,378 $ 102,219 $ 73,912 $ 25 $ 4,870,534

28
Consolidated Statement of Cash Flow (Unaudited, expressed in thousands of Canadian dollars)
Three months ended
December 31 Year ended December 31
Note 2013 2012 2013 2012
Cash provided by (used in):
Operating activities
Net income (loss) $ (148,182) $(18,740) $ (166,405) $ 52,569
Adjustments for:
Depletion and depreciation 8,10 51,508 44,593 189,147 144,950
Stock‐based compensation 15 9,660 7,271 38,792 25,246
Unrealized (gain) loss on foreign exchange 112,425 20,753 177,362 (35,822)
Unrealized (gain) loss on derivative financial liabilities 19 (1,938) (2,579) (19,256) 12,868
Deferred income tax expense (recovery) (2,857) 2,267 22,347 9,803
Other 2,032 2,541 11,437 2,900
Net change in non‐cash operating working capital 20 (18,709) (7,615) (123,461) 28,310
Net cash provided by operating activities 3,939 48,491 129,963 240,824
Investing activities
Capital investments (389,232) (494,916) (2,188,353) (1,598,514)
Purchase of other assets 11 373 ‐ (41,517) ‐
Proceeds on disposition of assets 6,801 ‐ 6,801 7,456
Other 2,426 899 (1,422) 1,176
Net change in non‐cash investing working capital items 20 39,015 (143,200) 430,316 (230,638)
Net cash used in investing activities (340,617) (637,217) (1,794,175) (1,820,520)
Financing activities
Issue of shares, net of issue costs 15 330 781,176 31,747 795,466
Issue of long‐term debt, net of issue costs 13 1,021,418 ‐ 1,322,540 792,552
Repayment of long‐term debt (3,457) (2,489) (13,506) (9,988)
Financing costs ‐ ‐ (8,693) (5,622)
Net cash provided by financing activities 1,018,291 778,687 1,332,088 1,572,408
Effect of exchange rate changes on cash and cash equivalents held in foreign currency
15,409 7,695 36,353 (13,000)
Change in cash and cash equivalents 697,022 197,656 (295,771) (20,288)
Cash and cash equivalents, beginning of period 482,050 1,277,187 1,474,843 1,495,131
Cash and cash equivalents, end of period 20 $ 1,179,072 $1,474,843 $ 1,179,072 $ 1,474,843
The accompanying notes are an integral part of these condensed interim consolidated financial statements.

NOTES TO INTERIM CONSOLIDATED FINANCIAL STATEMENTS All amounts are expressed in thousands of Canadian dollars, unless otherwise noted. (Unaudited)
29
1. CORPORATE INFORMATION
MEG Energy Corp. (the "Corporation") was incorporated under the Alberta Business Corporations Act on March 9, 1999. The Corporation's shares trade on the Toronto Stock Exchange ("TSX") under the symbol "MEG". The Corporation owns a 100% interest in over 900 sections of oil sands leases in the Athabasca oil sands region of northern Alberta and is primarily engaged in a steam assisted gravity drainage oil sands development at its 80 section Christina Lake Regional Project ("Christina Lake project"). The Corporation is using a staged approach to development. The Corporation also holds a 50% interest in the Access Pipeline, a dual pipeline to transport diluent north from the Edmonton area to the Athabasca oil sands area and a blend of bitumen and diluent south from the Christina Lake project into the Edmonton area. In addition to Access Pipeline, the Corporation owns the Stonefell Terminal, located near Edmonton, Alberta, which offers 900,000 barrels of terminalling and storage capacity. The Stonefell Terminal is connected to the Access Pipeline and is also connected by pipeline to a third party rail‐loading terminal. The corporate office is located at 520 ‐ 3rd Avenue S.W., Calgary, Alberta, Canada.
2. BASIS OF PRESENTATION
The unaudited interim consolidated financial statements ("interim consolidated financial statements") were prepared using the same accounting policies and methods as those used in the Corporation's audited financial statements for the year ended December 31, 2012, except as described in Note 3 below. The interim consolidated financial statements are in compliance with International Accounting Standard 34, Interim Financial Reporting ("IAS 34"). Accordingly, certain information and footnote disclosure normally included in annual financial statements prepared in accordance with International Financial Reporting Standards ("IFRS"), as issued by the International Accounting Standards Board ("IASB"), have been omitted or condensed. The preparation of consolidated financial statements in accordance with IAS 34 requires the use of certain critical accounting estimates. It also requires management to exercise judgment in applying the Corporation's accounting policies. The areas involving a higher degree of judgment or complexity, or areas where assumptions and estimates are significant to the consolidated financial statements, have been set out in Note 3 of the Corporation's audited financial statements for the year ended December 31, 2012. These interim consolidated financial statements should be read in conjunction with the Corporation's audited financial statements for the year ended December 31, 2012, which are included in the Corporation's 2012 annual report. The accompanying interim consolidated financial statements include all adjustments, comprised of normal recurring adjustments considered necessary by management to fairly state the Corporation's results of operations, financial position and cash flows. The operating results for interim periods are not necessarily indicative of results that may be expected for any other interim period or for the full year.
3. CHANGE IN ACCOUNTING POLICIES
The Corporation has adopted the following new and revised standards, along with all consequential amendments, effective January 1, 2013. These changes are made in accordance with the applicable transitional provisions.

30
IFRS 10, Consolidated Financial Statements, replaces the guidance on control and consolidation in IAS 27, Consolidated and Separate Financial Statements, and SIC‐12, Consolidation – Special Purpose Entities. IFRS 10 requires consolidation of an investee only if the investor possesses power over the investee, has exposure to variable returns from its involvement with the investee and has the ability to use its power over the investee to affect its returns. Detailed guidance is provided on applying the definition of control. The accounting requirements for consolidation have remained largely consistent with IAS 27. The Corporation assessed its consolidation conclusions on January 1, 2013 and determined that the adoption of IFRS 10 did not result in any change in the consolidation status of its wholly‐owned subsidiary, MEG Energy (U.S.) Inc.
IFRS 11, Joint Arrangements, supersedes IAS 31, Interests in Joint Ventures, and requires joint arrangements to be classified either as joint operations or joint ventures depending on the contractual rights and obligations of each investor that jointly controls the arrangement. For joint operations, a company recognizes its share of assets, liabilities, revenues and expenses of the joint operation. An investment in a joint venture is accounted for using the equity method as set out in IAS 28, Investments in Associates and Joint Ventures. The other amendments to IAS 28 did not affect the Corporation. The Corporation classified its joint arrangements in accordance with IFRS 11 on January 1, 2013 and concluded that the adoption of the standard did not result in any changes in the accounting for its joint arrangements.
IFRS 13, Fair Value Measurement, provides a single framework for measuring fair value. The measurement of the fair value of an asset or liability is based on assumptions that market participants would use when pricing the asset or liability under current market conditions, including assumptions about risk. Under IFRS 13, the fair value of a liability must reflect the effect of non‐performance risk, which includes an entity's own credit risk. Upon adoption of IFRS 13, the Corporation began including an estimate of its own credit risk in determining the fair value of its derivative financial liabilities. The Corporation adopted IFRS 13 and the required change in valuation techniques on January 1, 2013 on a prospective basis. Upon adoption of IFRS 13, derivative financial liabilities decreased by $1.8 million.
The Corporation has adopted the amendments to IAS 1, Presentation of Financial Statements, effective January 1, 2013. These amendments required the Corporation to group other comprehensive income items by those that will be reclassified subsequently to profit or loss and those that will not be reclassified. These changes did not result in any adjustments to other comprehensive income or comprehensive income.
The Corporation has adopted the amendments to IAS 19, Employee Benefits, effective January 1, 2013. These amendments make significant changes to the recognition and measurement of defined benefit pension expense and termination benefits and to enhance the disclosure of all employee benefits. The adoption of these amendments did not have an impact on the Corporation's consolidated financial statements.
4. PRINCIPLES OF CONSOLIDATION
The interim consolidated financial statements of the Corporation comprise the Corporation and its wholly‐owned subsidiary, MEG Energy (U.S.) Inc. All intercompany transactions and balances are eliminated on consolidation.

31
5. FINANCIAL INSTRUMENTS AND DERIVATIVE FINANCIAL LIABILITIES
The financial instruments recognized on the balance sheet are comprised of cash and cash equivalents, short‐term investments, trade receivables and other, components of other assets, accounts payable and accrued liabilities, derivative financial liabilities and long‐term debt. As at December 31, 2013, short‐term investments, components of other assets and derivative financial liabilities were classified as held‐for‐trading financial instruments; cash and cash equivalents and trade receivables and other were classified as loans and receivables; and accounts payable and accrued liabilities were classified as other financial liabilities. Long‐term debt was carried at amortized cost.
The carrying value of cash and cash equivalents, short‐term investments, trade receivables and other, and accounts payable and accrued liabilities included on the balance sheet approximate the fair value of the respective assets and liabilities due to the short‐term nature of those instruments.
(a) Fair value measurement of components of other assets, derivative financial liabilities and long‐term debt
Fair value measurements using
As at December 31, 2013 Carryingamount Fair value
Quoted prices in active markets (Level 1)
Significant other observable inputs (Level 2)
Significantunobservable inputs (Level 3)
Recurring measurements:
Financial assets
Other assets $ 2,252 $ 2,252 $ ‐ $ ‐ $ 2,252
Financial liabilities
Derivative financial liabilities 30,981 30,981 ‐ 30,981 ‐
Long‐term debt 4,067,738 4,135,639 4,135,639 ‐ ‐
Fair value measurements using
As at December 31, 2012 Carryingamount Fair value
Quoted prices in active markets (Level 1)
Significant other observable inputs (Level 2)
Significantunobservable inputs (Level 3)
Recurring measurements:
Financial assets
Other assets $ 7,581 $ 7,581 $ ‐ $ ‐ $ 7,581
Financial liabilities
Derivative financial liabilities 37,195 37,195 ‐ 37,195 ‐
Long‐term debt 2,488,609 2,612,763 2,612,763 ‐ ‐

32
Level 1 fair value measurements are based on unadjusted quoted market prices.
The fair value of long‐term debt is derived using quoted prices in an active market.
Level 2 fair value measurements are based on valuation models and techniques where the significant inputs are derived from quoted prices or indices.
The fair value of derivative financial liabilities are derived using third party valuation models which require assumptions concerning the amount and timing of future cash flows and discount rates for the Corporation's interest rate swaps and floors. Management's assumptions rely on external observable market data including interest rate yield curves and foreign exchange rates.
Level 3 fair value measurements are based on unobservable information.
Other assets are comprised of investments in U.S. auction rate securities ("ARS"). The Corporation estimated the fair value of the ARS based on the following: (i) the underlying structure of the notes and the securities; (ii) the present value of future principal and interest payments discounted at rates considered to reflect current market conditions for similar securities; and (iii) consideration of the probabilities of default, based on the quoted credit rating for the respective notes and securities. These estimated fair values could change significantly based on future market conditions.
The Corporation recognizes transfers into and transfers out of fair value hierarchy levels as of the date of the event or change in circumstances that caused the transfer. There were no transfers between levels of the fair value hierarchy during the year ended December 31, 2013.
(b) Interest rate risk management
The Corporation is exposed to interest rate cash flow risk on its floating rate long‐term debt and periodically enters into interest rate swap contracts to manage its floating to fixed interest rate mix on long‐term debt. As noted below, in order to mitigate a portion of this risk, the Corporation has entered into interest rate swap contracts to effectively fix the interest rate on US$748.0 million of the US$1.275 billion senior secured term loan. At December 31, 2013, there was an unrealized loss on the interest rate swaps of $7.5 million (December 31, 2012 ‐ $12.4 million).
Amount Effective date Remaining term Fixed rate Floating rate
US$300 million September 30, 2011 Jan 2014‐Sept 2016 4.436% 3 month LIBOR(1)
US$150 million December 31, 2011 Jan 2014‐Sept 2016 4.376% 3 month LIBOR(1)
US$150 million January 12, 2012 Jan 2014‐Sept 2016 4.302% 3 month LIBOR(1)
US$148 million January 27, 2012 Jan 2014‐Sept 2016 4.218% 3 month LIBOR(1)
(1) London Interbank Offered Rate
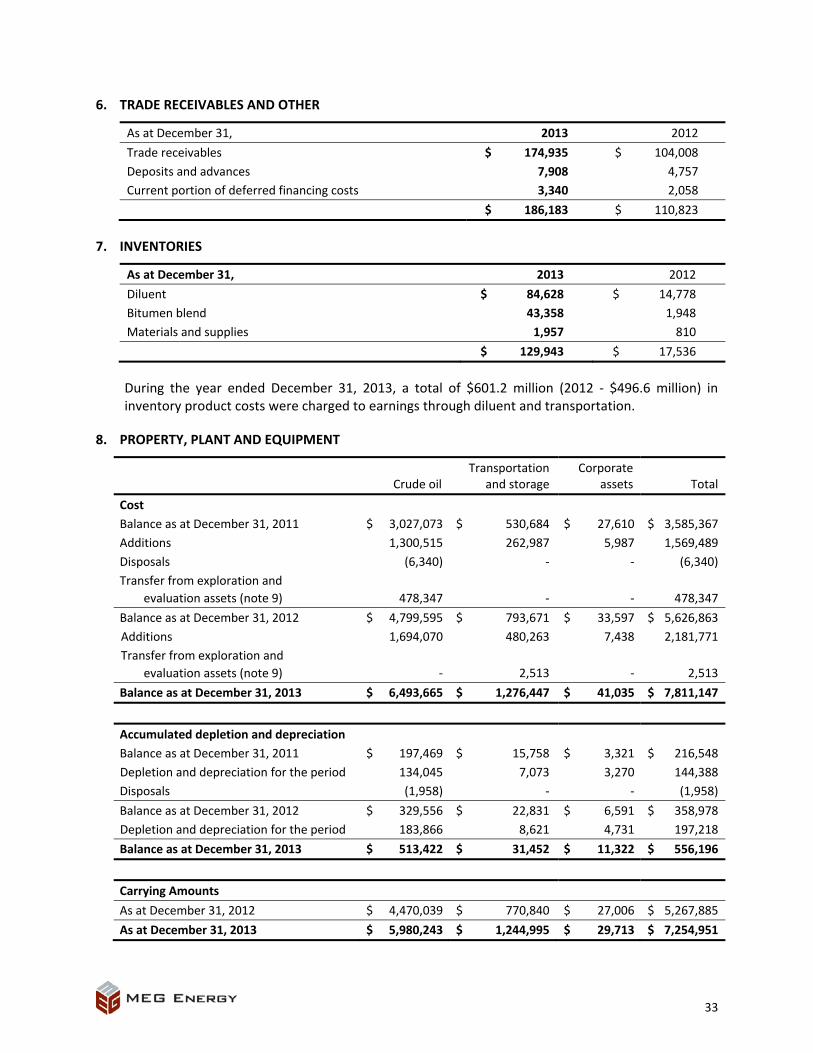
33
6. TRADE RECEIVABLES AND OTHER
As at December 31, 2013 2012
Trade receivables $ 174,935 $ 104,008
Deposits and advances 7,908 4,757
Current portion of deferred financing costs 3,340 2,058
$ 186,183 $ 110,823
7. INVENTORIES
As at December 31, 2013 2012
Diluent $ 84,628 $ 14,778
Bitumen blend 43,358 1,948
Materials and supplies 1,957 810
$ 129,943 $ 17,536
During the year ended December 31, 2013, a total of $601.2 million (2012 ‐ $496.6 million) in inventory product costs were charged to earnings through diluent and transportation.
8. PROPERTY, PLANT AND EQUIPMENT
Crude oil Transportation
and storage Corporate
assets Total
Cost
Balance as at December 31, 2011 $ 3,027,073 $ 530,684 $ 27,610 $ 3,585,367
Additions 1,300,515 262,987 5,987 1,569,489
Disposals (6,340) ‐ ‐ (6,340)
Transfer from exploration and
evaluation assets (note 9) 478,347 ‐ ‐ 478,347
Balance as at December 31, 2012 $ 4,799,595 $ 793,671 $ 33,597 $ 5,626,863
Additions 1,694,070 480,263 7,438 2,181,771
Transfer from exploration and
evaluation assets (note 9) ‐ 2,513 ‐ 2,513
Balance as at December 31, 2013 $ 6,493,665 $ 1,276,447 $ 41,035 $ 7,811,147
Accumulated depletion and depreciation
Balance as at December 31, 2011 $ 197,469 $ 15,758 $ 3,321 $ 216,548
Depletion and depreciation for the period 134,045 7,073 3,270 144,388
Disposals (1,958) ‐ ‐ (1,958)
Balance as at December 31, 2012 $ 329,556 $ 22,831 $ 6,591 $ 358,978
Depletion and depreciation for the period 183,866 8,621 4,731 197,218
Balance as at December 31, 2013 $ 513,422 $ 31,452 $ 11,322 $ 556,196
Carrying Amounts
As at December 31, 2012 $ 4,470,039 $ 770,840 $ 27,006 $ 5,267,885
As at December 31, 2013 $ 5,980,243 $ 1,244,995 $ 29,713 $ 7,254,951

34
During the year ended December 31, 2013, the Corporation capitalized $30.4 million (year ended December 31, 2012 ‐ $20.9 million) of general and administrative costs and $11.3 million (year ended December 31, 2012 ‐ $6.8 million) of stock‐based compensation costs relating to oil sands exploration and development activities. In addition, $76.5 million of interest and finance charges related to the development of capital projects were capitalized during the year ended December 31, 2013 (year ended December 31, 2012 ‐ $30.6 million).
9. EXPLORATION AND EVALUATION ASSETS
Cost
Balance as at December 31, 2011 $ 991,805
Additions 40,891
Transfer to property, plant and equipment (note 8) (478,347)
Balance as at December 31, 2012 $ 554,349
Additions 27,661
Transfer to property, plant and equipment (note 8) (2,513)
Balance as at December 31, 2013 $ 579,497
Exploration and evaluation assets consist of exploration projects which are pending the determination of proved or probable reserves. These assets are not subject to depletion, as they are in the exploration and evaluation stage, but are reviewed on a quarterly basis for any indication of impairment. As of December 31, 2013, no impairment has been recognized on these assets.
10. OTHER INTANGIBLE ASSETS
Cost
Balance as at December 31, 2011 $ 38,186
Additions 9,303
Balance as at December 31, 2012 $ 47,489
Additions 18,720
Balance as at December 31, 2013 $ 66,209
Accumulated depreciation
Balance as at December 31, 2011 $ 894
Depreciation 562
Balance as at December 31, 2012 $ 1,456
Depreciation 1,548
Balance as at December 31, 2013 $ 3,004
Carrying Amounts
As at December 31, 2012 $ 46,033
As at December 31, 2013 $ 63,205
Other intangible assets include the cost to maintain the right to participate in a potential pipeline project and the cost of software that is not an integral part of the related computer hardware.

35
11. OTHER ASSETS
As at December 31, 2013 2012
Long‐term pipeline linefill(a) $ 41,517 $ ‐
MAV notes(b) ‐ 5,475
Auction rate securities ("ARS")(c) 2,252 2,106
Deferred financing costs(d) 14,461 8,689
58,230 16,270
Less current portion of deferred financing costs (3,340) (2,058)
$ 54,890 $ 14,212
(a) The Corporation has entered into an agreement to transport diluent on a third‐party pipeline and is required to supply diluent linefill for the pipeline. As the pipeline is owned by a third‐party, the linefill is not considered to be a part of the Corporation's property, plant and equipment.
(b) In December 2013, the Corporation sold its remaining investment in the MAV notes for proceeds of $6.8 million and recognized a gain of $1.4 million.
(c) The investment in ARS is considered an illiquid asset and is recorded at its fair value based on a discounted cash flow valuation using observable information with changes in fair value included in net finance expense in the period in which they arise.
(d) Costs associated with establishing the Corporation's revolving credit facility are deferred and amortized over the term of the credit facility.
12. ACCOUNTS PAYABLE AND ACCRUED LIABILITIES
As at December 31, 2013 2012
Trade payables $ 114,752 $ 51,651
Accrued liabilities 230,984 370,431
Interest payable 56,564 36,848
Other payables 13,988 4,147
$ 416,288 $ 463,077
13. LONG‐TERM DEBT
As at December 31, 2013 2012
Senior secured term loan (December 31, 2013 – US$1.275 billion; December 31, 2012 ‐ US$987.5 million)(a) $ 1,355,558 $ 982,464
6.5% senior unsecured notes (US$750 million)(b) 797,700 746,175
6.375% senior unsecured notes (US$800 million)(c) 850,880 795,920
7.0% senior unsecured notes (US$1.0 billion)(d) 1,063,600 ‐
4,067,738 2,524,559
Less current portion of senior secured term loan (13,827) (9,949)
Less unamortized financial derivative liability discount (20,565) (10,324)
Less unamortized deferred debt issue costs (42,598) (25,626)
$ 3,990,748 $ 2,478,660

36
The U.S. dollar denominated debt was translated into Canadian dollars at the period end exchange rate of US$1 = C$1.0636 (December 31, 2012 ‐ US$1 = C$0.9949).
There are no maintenance financial covenants associated with the Corporation’s debt as at December 31, 2013 and 2012.
(a) On February 25, 2013, the Corporation re‐priced, increased and extended its existing US$987.5 million senior secured term loan. The Corporation extended the maturity date to March 31, 2020 and increased its borrowing under the senior secured term loan by US$300.0 million. In addition, the Corporation reduced the interest rate on the term loan by 25 basis points.
Effective May 24, 2013, the Corporation agreed to amend, extend and increase its revolving credit facility from US$1.0 billion to US$2.0 billion, with a maturity date of May 24, 2018. As at December 31, 2013, $133.9 million (December 31, 2012 ‐ $2.6 million) of the revolving credit facility was utilized to support letters of credit. As at December 31, 2013, no amount had been drawn under the revolving credit facility.
The senior secured credit facilities are comprised of a US$1.275 billion term loan and a US$2.0 billion revolving credit facility. The term loan bears a floating interest rate based on either U.S. Prime or LIBOR, at the Corporation's option, plus a credit spread of 175 or 275 basis points, respectively. The term loan also has an interest rate floor of 200 basis points based on U.S. Prime or 100 basis points based on LIBOR. The term loan is to be repaid in quarterly installment payments equal to US$3.25 million, with the balance due on March 31, 2020. Interest is paid quarterly. The Corporation has deferred the associated remaining debt issue costs of $6.1 million and is amortizing these costs over the life of the loan utilizing the effective interest method.
(b) Effective March 18, 2011, the Corporation issued US$750.0 million in aggregate principal amount of 6.5% Senior Unsecured Notes, with a maturity date of March 15, 2021. Interest is paid semi‐annually on March 15 and September 15. No principal payments are required until March 15, 2021. The Corporation has deferred the associated remaining debt issue costs of $11.2 million and is amortizing these costs over the life of the notes utilizing the effective interest method.
(c) Effective July 19, 2012, the Corporation issued US$800.0 million in aggregate principal amount of 6.375% Senior Unsecured Notes, with a maturity date of January 30, 2023. Interest is paid semi‐annually on January 30 and July 30. No principal payments are required until January 30, 2023. The Corporation has deferred the associated remaining debt issue costs of $12.2 million and is amortizing these costs over the life of the notes utilizing the effective interest method.
(d) Effective October 1, 2013, the Corporation issued US$800.0 million in aggregate principal amount of 7.0% Senior Unsecured Notes, with a maturity date of March 31, 2024. On November 6, 2013 an additional US$200 million of 7.0% Senior Unsecured Notes were issued under the same indenture. Interest is paid semi‐annually on March 31 and September 30, beginning on March 31, 2014. No principal payments are required until March 31, 2024. The Corporation has deferred the associated remaining debt issue costs of $13.1 million and is amortizing these costs over the life of the notes utilizing the effective interest method.

37
14. PROVISIONS AND OTHER LIABILITIES
As at December 31, 2013 2012
Derivative financial liabilities(a) $ 30,981 $ 37,195
Decommissioning provision(b) 108,695 82,087
Deferred lease inducements(c) 4,978 5,733
Provisions and other liabilities 144,654 125,015
Less current portion (19,477) (7,259)
Non‐current portion $ 125,177 $ 117,756
(a) Derivative financial liabilities
As at December 31, 2013 2012
1% interest rate floor $ 23,497 $ 24,807
Interest rate swaps 7,484 12,388
Derivative financial liabilities 30,981 37,195
Less current portion (13,886) (6,509)
Non‐current portion $ 17,095 $ 30,686
The interest rate floor on the senior secured term loan has been recognized as an embedded derivative as the floor rate exceeded the market rate of interest at the time that the debt was incurred. As a result, the interest rate floor derivative is required to be separated from the carrying value of long‐term debt and accounted for as a separate derivative financial liability measured at fair value, with gains and losses on re‐measurement included in net finance expense in the period in which they arise.
The Corporation is exposed to interest rate risk in relation to interest income earned on cash and cash equivalents and short‐term investments and in relation to interest expense on floating rate long‐term debt. To mitigate a portion of the risk of interest rate increases on long‐term debt, the Corporation periodically enters into interest rate swap contracts to manage its floating to fixed interest rate mix on long‐term debt. As of December 31, 2013, the Corporation had entered into interest rate swaps on US$748.0 million (note 5(b)) and these interest rate swap contracts expire on September 30, 2016. Interest rate swaps are classified as derivative financial liabilities and measured at fair value, with gains and losses on re‐measurement included in net finance expense in the period in which they arise.

38
(b) The following table presents the decommissioning provision associated with the reclamation and abandonment of crude oil and transportation and storage assets:
As at December 31, 2013 2012
Decommissioning provision, beginning of
Year $ 82,087 $ 65,360
Change in estimated future cash flow 15,082 ‐
Changes in discount rates (19,110) (3,846)
Liabilities incurred 30,068 18,218
Liabilities settled (4,195) (1,315)
Accretion 4,763 3,670
Decommissioning provision, end of year 108,695 82,087
Less current portion (4,848) ‐
Non‐current portion $ 103,847 $ 82,087
The total decommissioning provision is based on the estimated costs to reclaim and abandon the Corporation's crude oil properties and transportation and storage assets and the estimated timing of the costs to be incurred in future years. The Corporation has estimated the net present value of the decommissioning obligations to be $108.7 million as at December 31, 2013 (December 31, 2012 ‐ $82.1 million) based on an undiscounted total future liability of $293.8 million (December 31, 2012 ‐ $228.1 million) and a credit‐adjusted rate of 6.4% (December 31, 2012 – 5.7%). This obligation is estimated to be settled in periods up to 2064.
(c) Lease inducements were received when the Corporation entered into the corporate office lease. These inducements are recognized as a deferred liability and amortized through general and administrative expense over the life of the lease.
15. SHARE CAPITAL
(a) Authorized:
Unlimited number of common shares Unlimited number of preferred shares
(b) Changes in issued common shares are as follows:
2013 2012
Number ofshares Amount
Number of shares Amount
Balance, beginning of year 220,190,084 $ 4,694,378 193,471,705 $ 3,877,193
Shares issued ‐ ‐ 24,246,212 800,125
Share issue costs, net of tax ‐ 79 ‐ (18,988)
Issued upon exercise of stock options 1,893,732 40,522 2,243,319 26,520
Issued upon vesting and release of RSUs 423,080 16,395 228,848 9,528
Balance, end of year 222,506,896 $ 4,751,374 220,190,084 $ 4,694,378
On December 28, 2012, the Corporation issued 24,246,212 common shares at a price of $33.00 per share for gross proceeds of $800.1 million.

39
(c) Stock options outstanding:
The Corporation's stock option plan allows for the granting of options to directors, officers, employees and consultants of the Corporation. Options granted are generally fully exercisable by the third anniversary of the grant date and expire seven years after the grant date.
2013 2012
Stock
options
Weightedaverageexercise
priceper share
Stock options
Weightedaverage exercise
priceper share
Outstanding, beginning of year 9,147,404 $ 32.50 10,190,103 $ 27.12
Granted 1,774,854 30.95 1,456,537 35.67
Exercised (1,893,732) 16.53 (2,243,319) 9.21
Forfeited (169,498) 38.19 (255,917) 40.29
Outstanding, end of year 8,859,028 $ 35.49 9,147,404 $ 32.50
(d) Restricted share units and performance share units outstanding:
The Restricted Share Unit Plan allows for the granting of Restricted Share Units ("RSUs"), (including Performance Share Units ("PSUs"), effective June 13, 2013) to directors, officers, employees and consultants of the Corporation. An RSU, including a PSU, represents the right for the holder to receive a cash payment equal to the fair market value of the Corporation's common shares calculated at the date of such payment or, at the election of the Corporation, its equivalent in fully‐paid common shares. A PSU is an RSU, the vesting of which has been made conditional on the satisfaction of certain performance criteria. PSUs become eligible to vest if the Corporation satisfies the performance criteria identified by the Corporation's Board of Directors within a target range. A pre‐determined multiplier is then applied to PSUs that have become eligible to vest, dependent on the point in the target range to which such performance criteria are satisfied. RSUs granted under the Restricted Share Unit Plan generally vest annually over a three year period. PSUs granted under the Restricted Share Unit Plan generally vest on the third anniversary of the grant date, provided that the performance criteria have been satisfied, and that the holder remains actively employed, a director or a consultant with the Corporation on the vesting date.
RSUs and PSUs outstanding 2013 2012
Outstanding, beginning of year 953,804 554,362
Granted 2,157,534 664,796
Vested and released (423,080) (228,848)
Forfeited (98,558) (36,506)
Outstanding, end of year 2,589,700 953,804
(e) Deferred share units outstanding:
Effective June 13, 2013, the Corporation's Board of Directors approved the Deferred Share Unit Plan. The Deferred Share Unit Plan allows for the granting of Deferred Share Units ("DSUs") to directors of the Corporation. A DSU represents the right for the holder to receive a cash

40
payment equal to the fair market value of the Corporation's common shares calculated at the date of such payment or, at the election of the Corporation, its equivalent in fully‐paid common shares purchased through a broker. DSUs are vested when they are granted and are redeemed on the third business day following the date on which the holder ceases to be a director. At December 31, 2013, there were 8,874 DSUs outstanding.
(f) Contributed Surplus:
2013 2012
Balance, beginning of year $ 102,219 $ 85,568
Stock‐based compensation ‐ expensed 38,792 25,246
Stock‐based compensation ‐ capitalized 11,267 6,796
Stock options exercised (9,217) (5,863)
RSUs vested and released (16,395) (9,528)
Balance, end of year $ 126,666 $ 102,219
16. PETROLEUM REVENUE
Three months ended December 31
Year ended December 31
2013 2012 2013 2012
Petroleum sales:
Proprietary $ 293,657 $ 268,007 $ 1,207,650 $ 991,975
Third party 54,154 19,323 101,750 37,822
347,811 287,330 1,309,400 1,029,797
Royalties (8,979) (6,709) (38,643) (25,959)
Petroleum revenue $ 338,832 $ 280,621 $ 1,270,757 $ 1,003,838
17. OTHER REVENUE
Three months ended December 31
Year ended December 31
2013 2012 2013 2012
Power revenue $ 7,448 $ 13,248 $ 44,456 $ 33,634
Transportation revenue 4,058 3,709 19,284 13,032
Other revenue $ 11,506 $ 16,957 $ 63,740 $ 46,666
18. DILUENT AND TRANSPORTATION
Three months ended December 31
Year ended December 31
2013 2012 2013 2012
Diluent $ 167,094 $ 130,731 $ 601,191 $ 496,548
Transportation 5,734 3,629 22,457 16,266
Diluent and transportation $ 172,828 $ 134,360 $ 623,648 $ 512,814

41
19. NET FINANCE EXPENSE
Three months ended December 31
Year ended December 31
2013 2012 2013 2012
Total interest expense $ 60,679 $ 37,954 $ 186,835 $ 122,424
Less capitalized interest (22,911) (10,354) (76,529) (30,608)
Net interest expense 37,768 27,600 110,306 91,816
Accretion on decommissioning provision 1,017 999 4,763 3,670
Unrealized fair value (gain) loss on embedded derivative liabilities (2,097) (2,023) (14,352) 2,953
Unrealized fair value (gain) loss on interest rate swaps 159 (556) (4,904) 9,915
Realized loss on interest rate swaps 1,212 1,169 4,720 4,518
Unrealized fair value (gain) loss on other assets 919 ‐ ‐ (2,518)
Net finance expense $ 38,978 $ 27,189 $ 100,533 $ 110,354
20. SUPPLEMENTAL CASH FLOW DISCLOSURES
Three months ended December 31
Year ended December 31
2013 2012 2013 2012
Changes in non‐cash working capital
Operating activities:
Trade receivables and other $ (17,651) $(60,495) $ (75,107) $ 26,640
Inventories(a) (98,243) (1,894) (105,276) (8,329)
Accounts payable and accrued liabilities 97,185 54,774 56,922 9,999
Change in operating non‐cash working capital $ (18,709) $(7,615) $ (123,461) $ 28,310
Investing activities:
Short‐term investments $ 165,046 $ (203,149) $ 532,998 $ (381,060)
Accounts payable and accrued liabilities (126,031) 60,978 (103,711) 151,451
Trade receivables and other ‐ (1,029) 1,029 (1,029)
Change in investing non‐cash working capital $ 39,015 $(143,200) $ 430,316 $ (230,638)
Change in total non‐cash working capital $ 20,306 $ (150,815) $ 306,855 $ (202,328)
Cash and cash equivalents:
Cash $ 1,065,179 $ 224,241 $ 1,065,179 $ 224,241
Cash equivalents 113,893 1,250,602 113,893 1,250,602
$ 1,179,072 $ 1,474,843 $ 1,179,072 $ 1,474,843
(a) The three months and year ended December 31, 2013 amounts exclude a non‐cash increase in inventory of $7,131 (2012 – nil).
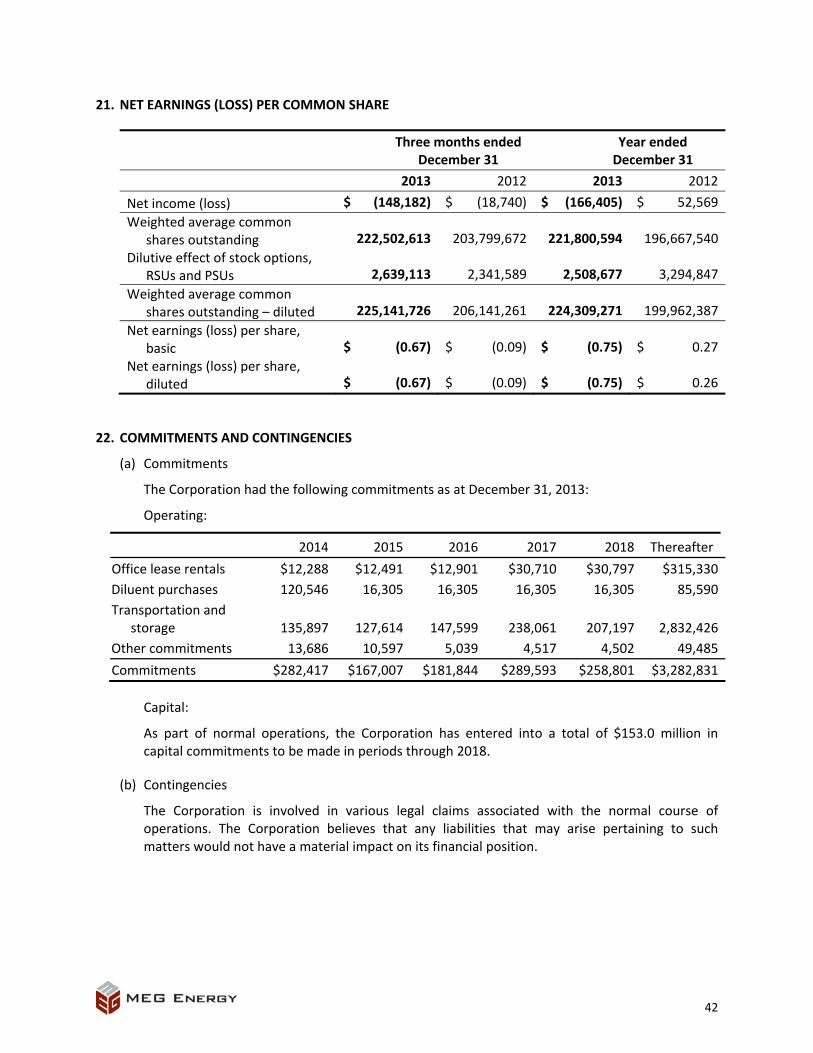
42
21. NET EARNINGS (LOSS) PER COMMON SHARE
Three months ended December 31
Year ended December 31
2013 2012 2013 2012
Net income (loss) $ (148,182) $ (18,740) $ (166,405) $ 52,569
Weighted average common shares outstanding 222,502,613 203,799,672 221,800,594 196,667,540
Dilutive effect of stock options, RSUs and PSUs 2,639,113 2,341,589 2,508,677 3,294,847
Weighted average common shares outstanding – diluted 225,141,726 206,141,261 224,309,271 199,962,387
Net earnings (loss) per share, basic $ (0.67) $ (0.09) $ (0.75) $ 0.27
Net earnings (loss) per share, diluted $ (0.67) $ (0.09) $ (0.75) $ 0.26
22. COMMITMENTS AND CONTINGENCIES
(a) Commitments
The Corporation had the following commitments as at December 31, 2013:
Operating:
2014 2015 2016 2017 2018 Thereafter
Office lease rentals $12,288 $12,491 $12,901 $30,710 $30,797 $315,330
Diluent purchases 120,546 16,305 16,305 16,305 16,305 85,590
Transportation and storage 135,897 127,614 147,599 238,061 207,197 2,832,426
Other commitments 13,686 10,597 5,039 4,517 4,502 49,485
Commitments $282,417 $167,007 $181,844 $289,593 $258,801 $3,282,831
Capital:
As part of normal operations, the Corporation has entered into a total of $153.0 million in capital commitments to be made in periods through 2018.
(b) Contingencies
The Corporation is involved in various legal claims associated with the normal course of operations. The Corporation believes that any liabilities that may arise pertaining to such matters would not have a material impact on its financial position.

43
Reserves and Resources
The Corporation has identified two projects on its oil sands leases, Christina Lake and Surmont. The Christina Lake project consists of 80 contiguous square miles of oil sands leases. Thirty miles north of Christina Lake, MEG holds 32 square miles of oil sands leases at Surmont. Outside of Christina Lake and Surmont, MEG also holds over 800 sections of oil sands leases that the Corporation refers to as the Growth Properties. The Growth Properties are currently in the resource definition stage of development and provide significant additional development opportunities.
GLJ, an independent reservoir engineering firm, was commissioned by MEG to evaluate the reserves and resources of the Corporation's oil sands leases. GLJ evaluated Christina Lake, Surmont and a portion of the Growth Properties. Collectively 453 sections of MEG's 970 sections of oil sands leases were evaluated. GLJ's reserves and resources report is effective as of December 31, 2013.
GLJ prepared estimates of reserves and resources in accordance with National Instrument 51‐101 of the Canadian Securities Administrators entitled Standards of Disclosure for Oil and Gas Activities ("NI 51‐101"), as well as the Canadian Oil and Gas Evaluation Handbook, or COGE Handbook, prepared jointly by the Society of Petroleum Evaluation Engineers (Calgary Chapter) and the Canadian Institute of Mining, Metallurgy & Petroleum (Petroleum Society). MEG's complete annual disclosure required under NI 51‐101 will be contained within MEG's annual information form to be filed on or before March 31, 2014.
The information set forth below relating to the Corporation's reserves and resources constitutes forward‐looking information which is subject to certain risks and uncertainties. See "Forward‐Looking Information" for important information regarding the Corporation's reserves and resources.
According to GLJ, MEG's proved reserves (1P) are 1,446 million barrels of bitumen. The Corporation's proved‐plus‐probable (2P) reserves are 2,897 million barrels and its best estimate contingent resources (2C) are 3,653 million barrels. It is estimated that Christina Lake can support over 200,000 barrels per day of sustained production for 30 years and that Surmont can support over 100,000 barrels per day of sustained production for over 20 years. These production capacities are based on the GLJ estimates of 2P reserves and 2C resources as of December 31, 2013.
In addition to the reported reserves, Christina Lake, Surmont and the Growth Properties also have "resources", which are quantities of recoverable bitumen that have not met the reserves requirements at this time. Some of these resources are classified as contingent resources, pending further delineation drilling, development planning, project design and regulatory submissions or approvals. The contingent resources values set out below should be considered indicative in nature only, pending further project design work to confirm project economics, development timing and capital estimates.
GLJ assigned contingent resources (best estimate) totalling 3,653 million barrels for the MEG leases it evaluated which consists of 946 million barrels for Christina Lake, 404 million barrels for Surmont and 2,303 million barrels for the Growth Properties. See footnotes three, four and five of the table below for further information regarding the meaning of contingent resources (best estimate).

44
The table below summarizes the proved and probable reserves and contingent resources (best estimate) volumes and values based on GLJ's evaluation.
Bitumen Reserves and Contingent Resources As at December 31 Bitumen Reserves (millions of barrels, before royalties) 2013 2012 % Change
Proved (1P) Reserves(1) 1,446 1,284 12.6
Probable Reserves(2) 1,451 1,360 6.7
Proved Plus Probable (2P) Reserves(1)(2) 2,897 2,644 9.6
Bitumen Contingent Resources (millions of barrels, before royalties)
Best Estimate Contingent Resources (2C)(3)(4)(5) 3,653 3,420 6.8
Pre‐tax 10% Present Value of Future Net Cash Flows(6) As at December 31
Bitumen Reserves ($ millions) 2013 2012 % Change
Proved (1P) Reserves(1)(6) 13,521 10,484 29.0
Probable Reserves(2)(6) 7,501 6,354 18.1
Proved Plus Probable (2P) Reserves(2)(6) 21,022 16,838 24.8
Bitumen Contingent Resources ($ millions)
Best Estimate Contingent Resources (2C)(3)(4)(5) 14,008 10,265 36.5 (1) "Proved Reserves" are those reserves that can be estimated with a high degree of certainty to be recoverable. It is likely
that the actual remaining quantities recovered will exceed the estimated proved reserves. Proved Reserves are also referred to as "1P Reserves".
(2) "Probable Reserves" are those additional reserves that are less certain to be recovered than Proved Reserves. It is equally likely that the actual remaining quantities recovered will be greater or less than the sum of the estimated proved plus probable reserves. Proved‐plus‐probable reserves are also referred to as "2P Reserves".
(3) "Contingent Resources" are those quantities of petroleum estimated, as of a given date, to be potentially recoverable from known accumulations using established technology or technology under development, but which are not currently considered to be commercially recoverable due to one or more contingencies. Such contingencies include further reservoir delineation, additional facility and reservoir design work, submission of regulatory applications and the receipt of corporate approvals. It is also appropriate to classify as contingent resources the estimated discovered recoverable quantities associated with a project in the early evaluation stage. Contingent resources are further classified in accordance with the level of certainty associated with the estimates and may be sub‐classified based on project maturity and/or characterized by their economic status. There is no certainty that it will be commercially viable to produce any portion of the contingent resources.
(4) There are three categories in evaluating Contingent Resources: Low Estimate, Best Estimate and High Estimate. The resource numbers presented all refer to the Best Estimate category. Best Estimate is a classification of resources described in the COGE Handbook as being considered to be the best estimate of the quantity that will actually be recovered. It is equally likely that the actual remaining quantities recovered will be greater or less than the Best Estimate. If probabilistic methods are used, there should be a 50% probability (P50) that the quantities actually recovered will equal or exceed the Best Estimate. Best Estimate Contingent Resources are also referred to as "2C Resources".
(5) These volumes are the arithmetic sums of the Best Estimate Contingent resources for Christina Lake, Surmont and Growth Properties.
(6) The estimated future net cash flows do not represent the fair market values of MEG's reserves or resources.

45
GLJ Forecast Pricing (as utilized in the GLJ 2013 Report)
Forecast Light and Medium
Crude Oil Exchange
Rate
BitumenWellheadCurrent Natural Gas
InflationRate
WTI at Cushing, Oklahoma (US$/bbl) US$/Cdn$ (Cdn$/bbl)
AECO Spot (Cdn$/mmcf) %/year
2014 97.50 0.95 64.89 4.03 2%
2015 97.50 0.95 74.29 4.26 2%
2016 97.50 0.95 72.30 4.50 2%
2017 97.50 0.95 68.12 4.74 2%
2018 97.50 0.95 69.00 4.97 2%
2019 97.50 0.95 73.50 5.21 2%
2020 98.54 0.95 72.93 5.33 2%
2021 100.51 0.95 72.92 5.44 2%
2022 102.52 0.95 74.63 5.55 2%
2023 104.57 0.95 76.36 5.66 2%
2024+ +2%/year 0.95 +2%/year +2%/yr 2%