fourth quarter 2015 earnings presentation
TRANSCRIPT
Fourth Quarter and Full Year
2015 Earnings Presentation
February 9, 2016

Safe Harbor Statement
Statements contained in this presentation that reflect our views about our future performance and constitute
“forward-looking statements” under the Private Securities Litigation Reform Act of 1995. Forward-looking
statements can be identified by words such as “believe,” “anticipate,” “appear,” “may,” “will,” “should,” “intend,”
“plan,” “estimate,” “expect,” “assume,” “seek,” “forecast,” and similar references to future periods. Our views
about future performance involve risks and uncertainties that are difficult to predict and, accordingly, our
actual results may differ materially from the results discussed in our forward-looking statements. We caution
you against relying on any of these forward-looking statements.
Our future performance may be affected by the levels of home improvement activity and new home
construction, our ability to maintain our strong brands and to develop and introduce new and improved
products, our ability to maintain our competitive position in our industries, our reliance on key customers, our
ability to achieve the anticipated benefits of our strategic initiatives, our ability to sustain the performance of
our cabinetry businesses, the cost and availability of raw materials, our dependence on third party suppliers,
and risks associated with international operations and global strategies. These and other factors are
discussed in detail in Item 1A, “Risk Factors” in our most recent Annual Report on Form 10-K, as well as in
our Quarterly Reports on Form 10-Q and in other filings we make with the Securities and Exchange
Commission. The forward-looking statements in this press release speak only as of the date of this press
release. Factors or events that could cause our actual results to differ may emerge from time to time, and it is
not possible for us to predict all of them. Unless required by law, we undertake no obligation to update publicly
any forward-looking statements as a result of new information, future events or otherwise.
2
Masco Q4 and Full Year 2015 Results
Topic
• Summary of Results Keith Allman
• Financial/Operations Review John Sznewajs
• Q&A
3
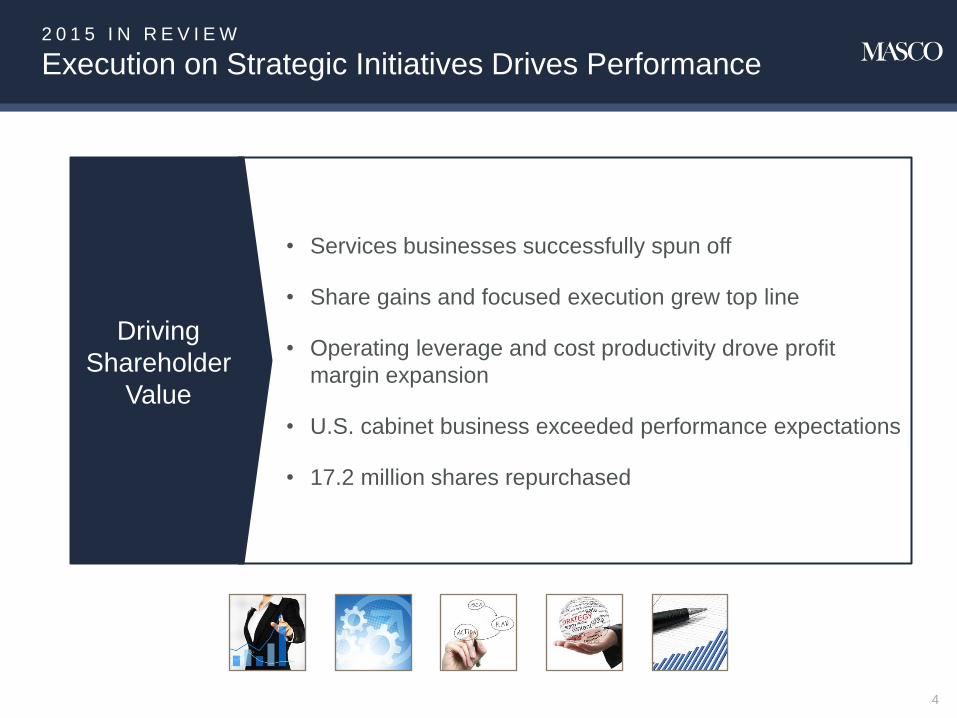
2 0 1 5 I N R E V I E W
Execution on Strategic Initiatives Drives Performance
• Services businesses successfully spun off
• Share gains and focused execution grew top line
• Operating leverage and cost productivity drove profit
margin expansion
• U.S. cabinet business exceeded performance expectations
• 17.2 million shares repurchased
4
Driving
Shareholder
Value

Masco Q4 and Full Year 2015 Results
Topic
• Summary of Results Keith Allman
• Financial/Operations Review John Sznewajs
• Q&A
5
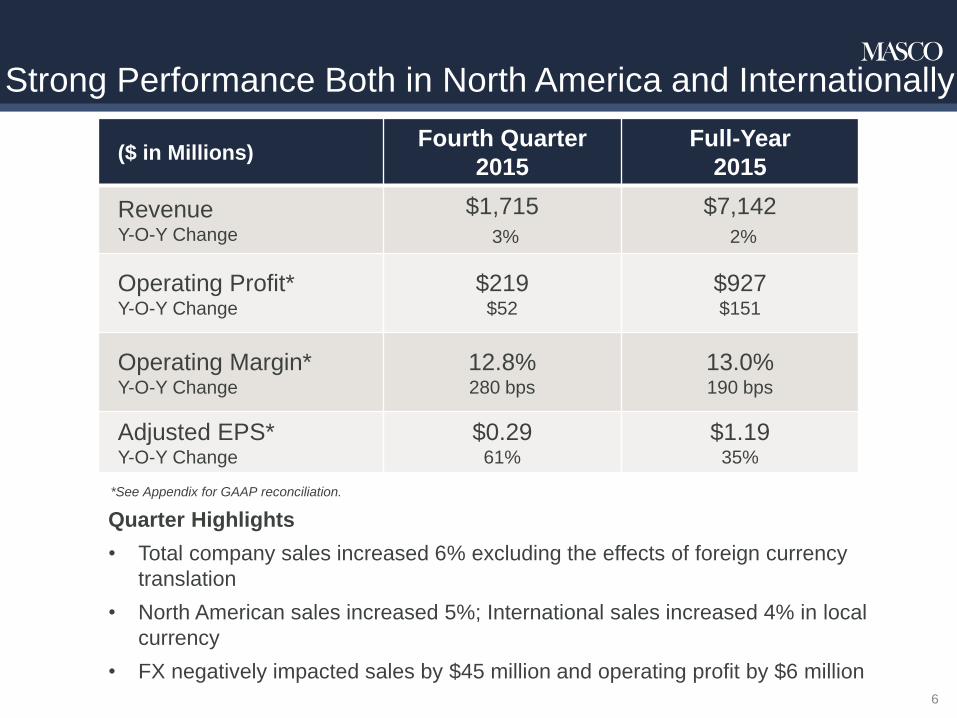
Strong Performance Both in North America and Internationally
6
*See Appendix for GAAP reconciliation.
Quarter Highlights
• Total company sales increased 6% excluding the effects of foreign currency
translation
• North American sales increased 5%; International sales increased 4% in local
currency
• FX negatively impacted sales by $45 million and operating profit by $6 million
($ in Millions) Fourth Quarter
2015
Full-Year
2015
Revenue Y-O-Y Change
$1,715
3%
$7,142
2%
Operating Profit* Y-O-Y Change
$219 $52
$927 $151
Operating Margin* Y-O-Y Change
12.8% 280 bps
13.0% 190 bps
Adjusted EPS* Y-O-Y Change
$0.29 61%
$1.19 35%

P L U M B I N G P R O D U C T S
7
Continued Positive Momentum on Top and Bottom Line
Quarter Highlights
• North American sales increased 14% excluding the impact of Canadian
currency; International sales increased 5% in local currency
• FX negatively impacted sales by approximately $41 million and operating
profit by $5 million
• Continued strong performance in retail and wholesale/trade channels
*Excludes business rationalization charges for the fourth quarter and full year 2015 of $7 million and $9 million,
respectively, and for the fourth quarter and full year 2014 of $3 million and $5 million, respectively.
($ in Millions) Fourth Quarter
2015
Full-Year
2015
Revenue Y-O-Y Change
$846
5%
$3,341
1%
Operating Profit* Y-O-Y Change
$133 $17
$521 $4
Operating Margin* Y-O-Y Change
15.7% 130 bps
15.6% -
D E C O R AT I V E A R C H I T E C T U R A L P R O D U C T S
8
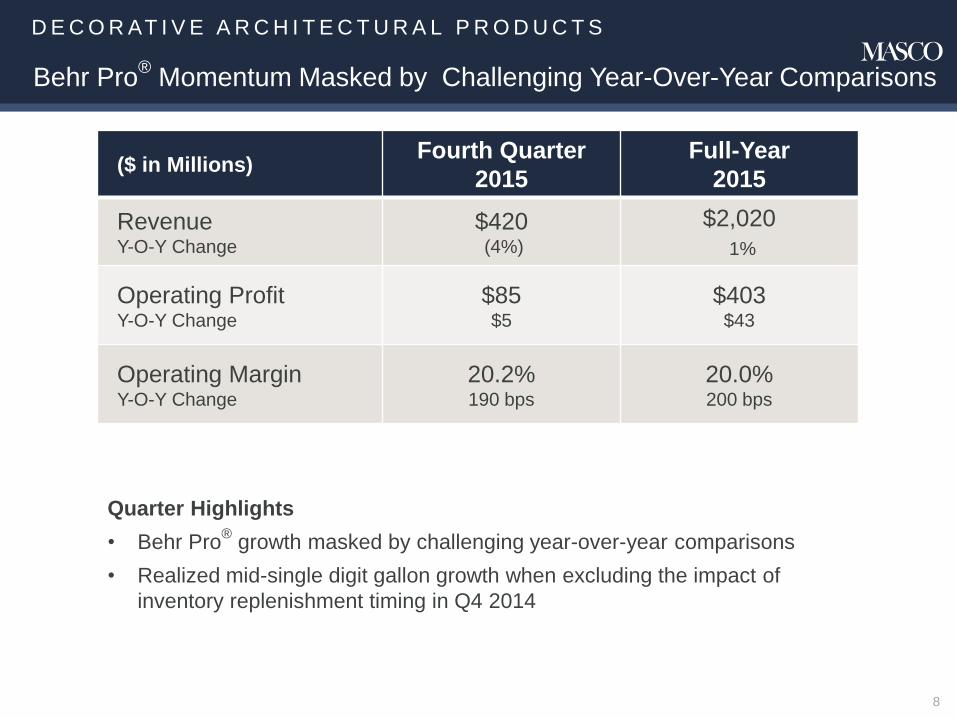
Behr Pro® Momentum Masked by Challenging Year-Over-Year Comparisons
Quarter Highlights
• Behr Pro® growth masked by challenging year-over-year comparisons
• Realized mid-single digit gallon growth when excluding the impact of
inventory replenishment timing in Q4 2014
($ in Millions) Fourth Quarter
2015
Full-Year
2015
Revenue Y-O-Y Change
$420 (4%)
$2,020
1%
Operating Profit Y-O-Y Change
$85 $5
$403 $43
Operating Margin Y-O-Y Change
20.2% 190 bps
20.0% 200 bps

C A B I N E T S A N D R E L AT E D P R O D U C T S
9
Operational Execution, Mix and Pricing Drove Performance
Quarter Highlights
• Strong retail sales more than offset the exit of certain less profitable direct-to-builder
business
• KraftMaid Vantage® continued its strong performance in the dealer channel
• Improved operating efficiencies, positive mix and pricing actions drove margin
expansion
*Excludes business rationalization charges for the fourth quarter and full year 2015 of $2 million and $5 million, respectively,
and gain from sale of property and equipment for the fourth quarter and full year 2015 of $2 million and $5 million, respectively.
Excludes business rationalization charges for full year 2014 of $31 million.
($ in Millions) Fourth Quarter
2015
Full-Year
2015
Revenue Y-O-Y Change
$254 5%
$1,025
3%
Operating Profit* Y-O-Y Change
$19 $26
$51 $82
Operating Margin* Y-O-Y Change
7.5% 1,040 bps
5.0% 810 bps
O T H E R S P E C I A LT Y P R O D U C T S
10
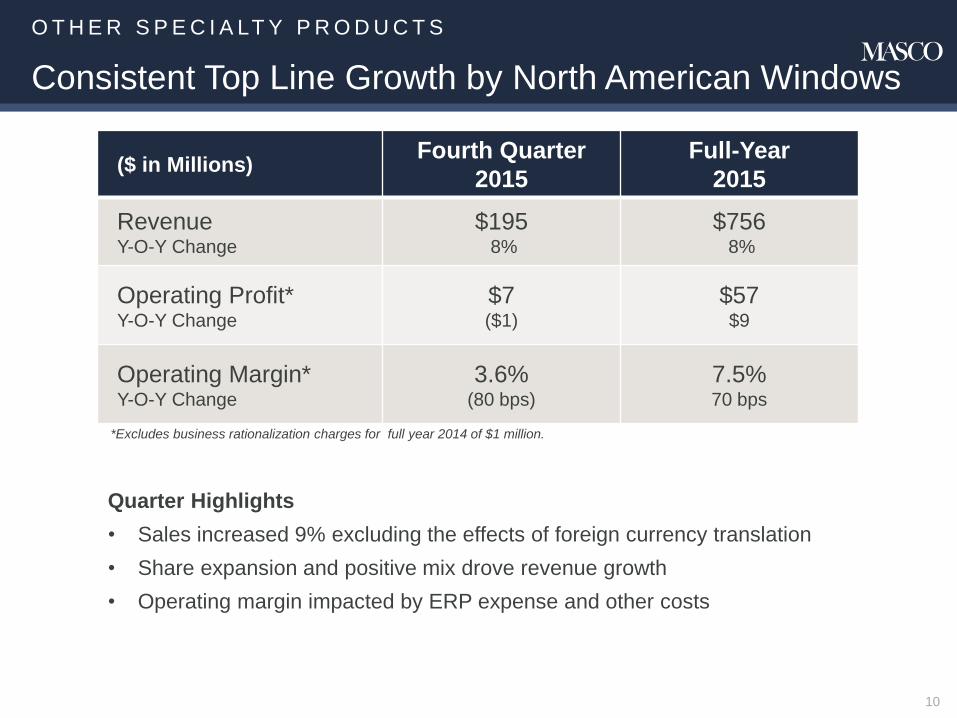
Consistent Top Line Growth by North American Windows
Quarter Highlights
• Sales increased 9% excluding the effects of foreign currency translation
• Share expansion and positive mix drove revenue growth
• Operating margin impacted by ERP expense and other costs
($ in Millions) Fourth Quarter
2015
Full-Year
2015
Revenue Y-O-Y Change
$195 8%
$756 8%
Operating Profit* Y-O-Y Change
$7 ($1)
$57 $9
Operating Margin* Y-O-Y Change
3.6% (80 bps)
7.5% 70 bps
*Excludes business rationalization charges for full year 2014 of $1 million.

Strong Balance Sheet and Disciplined Capital Allocation
Liquidity as of 12/31/2015
Cash and cash investments $1.5B
Short-term bank deposits $0.2B
Total $1.7B
11
Disciplined Capital Allocation
• Repurchased approximately 17.2 million shares in 2015
• Increased dividend by 6%
• Well positioned to retire $300-$500 million of debt

Masco Q4 and Full Year 2015 Results
Topic
• Summary of Results Keith Allman
• Financial/Operations Review John Sznewajs
• Q&A
12
Q&A

Appendix
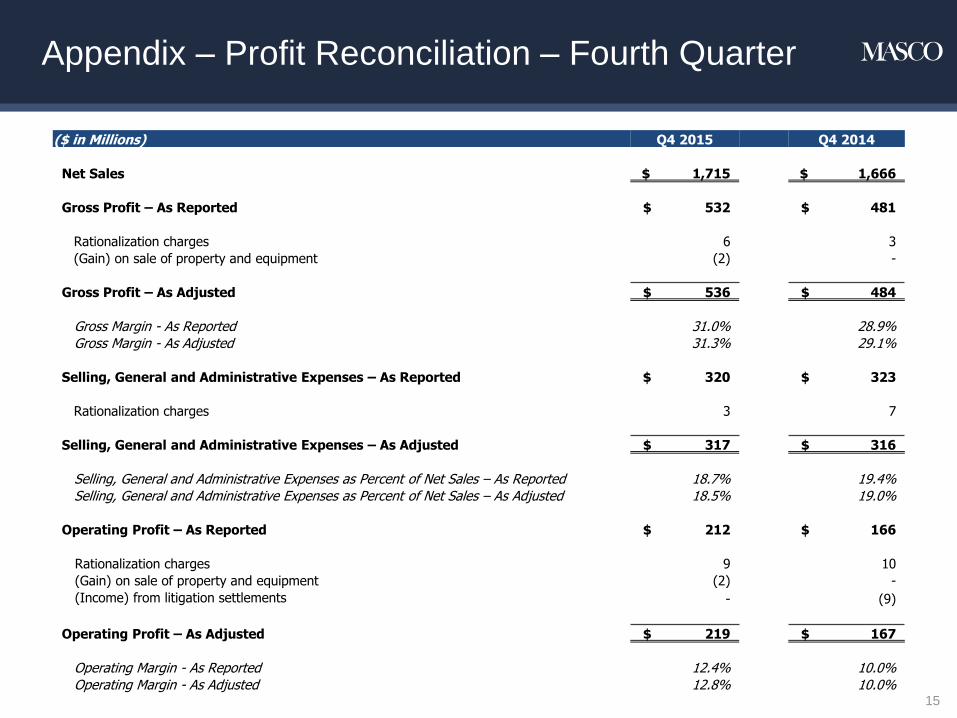
Appendix – Profit Reconciliation – Fourth Quarter
15
($ in Millions) Q4 2015 Q4 2014
Net Sales $ 1,715 $ 1,666
Gross Profit – As Reported $ 532 $ 481
Rationalization charges 6 3
(Gain) on sale of property and equipment (2) -
Gross Profit – As Adjusted $ 536 $ 484
Gross Margin - As Reported 31.0% 28.9% Gross Margin - As Adjusted 31.3% 29.1%
Selling, General and Administrative Expenses – As Reported $ 320 $ 323
Rationalization charges 3 7
Selling, General and Administrative Expenses – As Adjusted $ 317 $ 316
Selling, General and Administrative Expenses as Percent of Net Sales – As Reported 18.7% 19.4% Selling, General and Administrative Expenses as Percent of Net Sales – As Adjusted 18.5% 19.0%
Operating Profit – As Reported $ 212 $ 166
Rationalization charges 9 10
(Gain) on sale of property and equipment (2) -
(Income) from litigation settlements - (9)
Operating Profit – As Adjusted $ 219 $ 167
Operating Margin - As Reported 12.4% 10.0% Operating Margin - As Adjusted 12.8% 10.0%

Appendix – Profit Reconciliation – Full Year
16
($ in Millions) 2015 2014
Net Sales $ 7,142 $ 7,006
Gross Profit – As Reported $ 2,253 $ 2,060
Rationalization charges 8 35
(Gain) on sale of property and equipment (5) -
Gross Profit – As Adjusted $ 2,256 $ 2,095
Gross Margin - As Reported 31.5% 29.4% Gross Margin - As Adjusted 31.6% 29.9%
Selling, General and Administrative Expenses – As Reported $ 1,339 $ 1,347
Rationalization charges 10 29
Selling, General and Administrative Expenses – As Adjusted $ 1,329 $ 1,318
Selling, General and Administrative Expenses as Percent of Net Sales – As Reported 18.7% 19.2% Selling, General and Administrative Expenses as Percent of Net Sales – As Adjusted 18.6% 18.8%
Operating Profit – As Reported $ 914 $ 721
Rationalization charges 18 64
(Gain) on sale of property and equipment (5) -
(Income) from litigation settlements - (9)
Operating Profit – As Adjusted $ 927 $ 776
Operating Margin - As Reported 12.8% 10.3% Operating Margin - As Adjusted 13.0% 11.1%

Appendix – EPS Reconciliation – Fourth Quarter
17
(in Millions, Except per Common Share Data) Q4 2015 Q4 2014
Income from Continuing Operations before Income Taxes – As Reported $ 160 $ 111
Rationalization charges 9 10
(Income) from litigation settlements - (9)
(Gain) from financial investments, net (1) -
(Gain) on sale of property and equipment (2) -
Income from Continuing Operations before Income Taxes – As Adjusted $ 166 $ 112
Tax at 36% rate (60) (40)
Less: Net income attributable to noncontrolling interest 10 9
Income from Continuing Operations, as adjusted $ 96 $ 63
Income per common share, as adjusted $ 0.29 $ 0.18
Average Diluted Shares Outstanding 335 351

Appendix – EPS Reconciliation – Full Year
18
(in millions, except per common share data) 2015 2014
Income from Continuing Operations before Income Taxes – As Reported $ 689 $ 507
Rationalization charges 18 64
(Income) from litigation settlements - (9)
(Gains) from financial investments, net (6) (4)
(Earnings) losses from equity investments, net (2) 2
(Gain) on sale of property and equipment (5) -
Income from Continuing Operations before Income Taxes – As Adjusted $ 694 $ 560
Tax at 36% rate (250) (202)
Less: Net income attributable to non-controlling interest 39 47
Income from Continuing Operations, as adjusted $ 405 $ 311
Income per common share, as adjusted $ 1.19 $ 0.88
Average Diluted Shares Outstanding 341 352

($ in Millions) 2016 Estimate 2015 Actual1
Rationalization Charges2 ~ $8 $18
Tax Rate3 ~ 36% 43%
Interest Expense ~ $225 $225
General Corp. Expense4 ~ $100 $105
Capital Expenditures ~ $190 $152
Depreciation & Amortization ~ $140 $127
Shares Repurchased5 $400-500 $456
Shares Outstanding6
335 million 335 million
1. 2015 results exclude TopBuild Corp.
2. Based on 2016 business plans.
3. 2015 tax rate is impacted by a $21 million valuation allowance resulting from our decision to spin off TopBuild, and a $12 million net charge on substantially
all undistributed foreign earnings and change in tax law on related foreign earnings.
4. Excludes rationalization expenses of $4 million for the year ended December 31, 2015.
5. 2015 share repurchases include approximately 741,000 shares that were repurchased to offset grants of long-term stock awards.
6. Reflects weighted average diluted shares outstanding for the fourth quarter 2015 and assumes no share repurchases in 2016.
19
2016 Guidance Estimates
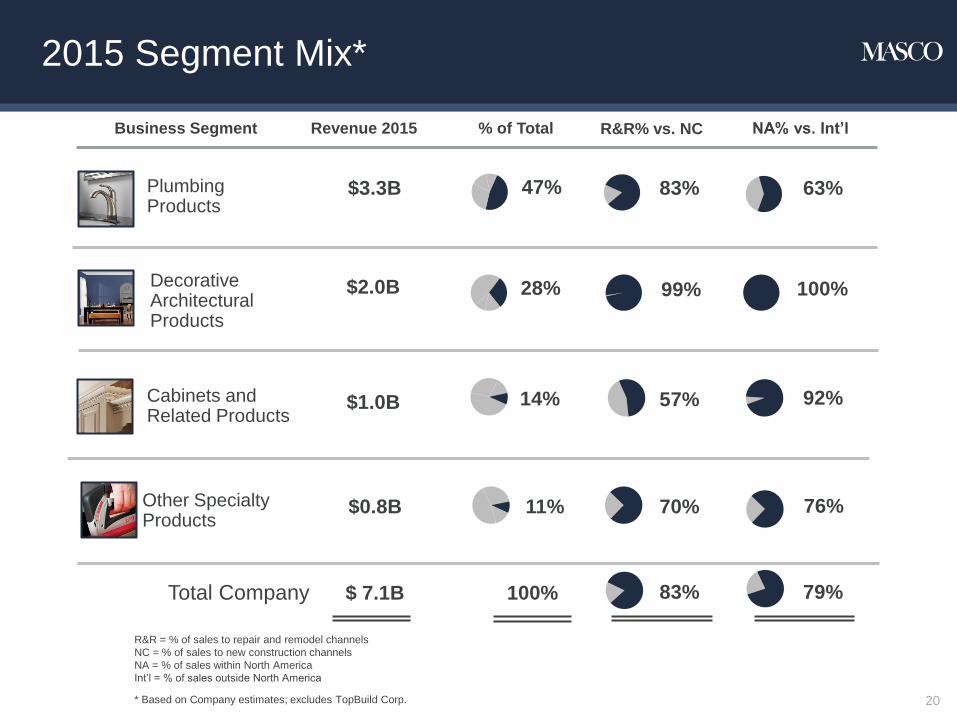
2015 Segment Mix*
R&R = % of sales to repair and remodel channels
NC = % of sales to new construction channels
NA = % of sales within North America
Int’l = % of sales outside North America
* Based on Company estimates; excludes TopBuild Corp.
Business Segment
Plumbing Products
Decorative Architectural Products
$3.3B
$2.0B
Revenue 2015 % of Total
47%
28%
$ 7.1B 100% Total Company
Other Specialty Products
$0.8B 11%
R&R% vs. NC NA% vs. Int’l
83% 63%
99% 100%
70% 76%
83% 79%
Cabinets and Related Products
$1.0B 14% 57% 92%
20

2015 International Revenue Split*
*Based on Company estimates; excludes TopBuild Corp.
International Sales Accounted for ~21%
of Total 2015 Masco Sales
29%
5%
8%
26%
5%
17%
10%
UK
Northern Europe
Southern Europe
Central Europe
Eastern Europe
Emerging markets
Other
21