fourth quarter 2017 earnings...
TRANSCRIPT

Fourth Quarter 2017 Earnings Presentation
February 21, 2018

2
Safe Harbor Statement NOTE:
This presentation contains certain statements that are not historical facts and that constitute “forward-looking statements” within the meaning of the Private Securities
Litigation Reform Act of 1995. Statements in this presentation addressing expectations, assumptions, beliefs, projections, estimates, future plans, strategies, and events,
developments that we expect or anticipate will occur in the future, and future operating results or financial condition are forward-looking statements. Forward-looking
statements in this presentation may include, but are not limited to, statements regarding future interest rates, our views on expected characteristics of future investment
environments, prepayment rates on our investment portfolio and risks posed by our investment portfolio, our future investment strategies, our future leverage levels and
financing strategies, the use of specific financing and hedging instruments and the future impacts of these strategies, future actions by the Federal Reserve, and other
central banks, and the expected performance of our investments. The words “will,” “believe,” “expect,” “forecast,” “anticipate,” “intend,” “estimate,” “assume,” “project,”
“plan,” “continue,” and similar expressions also identify forward-looking statements. These forward-looking statements reflect our current beliefs, assumptions and
expectations based on information currently available to us, and are applicable only as of the date of this presentation. Forward-looking statements are inherently subject
to risks, uncertainties, and other factors, some of which cannot be predicted or quantified and any of which could cause the Company’s actual results and timing of certain
events to differ materially from those projected in or contemplated by these forward-looking statements. Not all of these risks, uncertainties and other factors are known to
us. New risks and uncertainties arise over time, and it is not possible to predict those risks or uncertainties or how they may affect us. The projections, assumptions,
expectations or beliefs upon which the forward-looking statements are based can also change as a result of these risks and uncertainties or other factors. If such a risk,
uncertainty, or other factor materializes in future periods, our business, financial condition, liquidity and results of operations may differ materially from those expressed or
implied in our forward-looking statements.
While it is not possible to identify all factors, some of the factors that may cause actual results to differ from historical results or from any results expressed or implied by
our forward-looking statements, or that may cause our projections, assumptions, expectations or beliefs to change, include the risks and uncertainties referenced in our
Annual Report on Form 10-K for the year ended December 31, 2016 and subsequent filings with the Securities and Exchange Commission, particularly those set forth under
the caption “Risk Factors”.
3
4Q17 Highlights
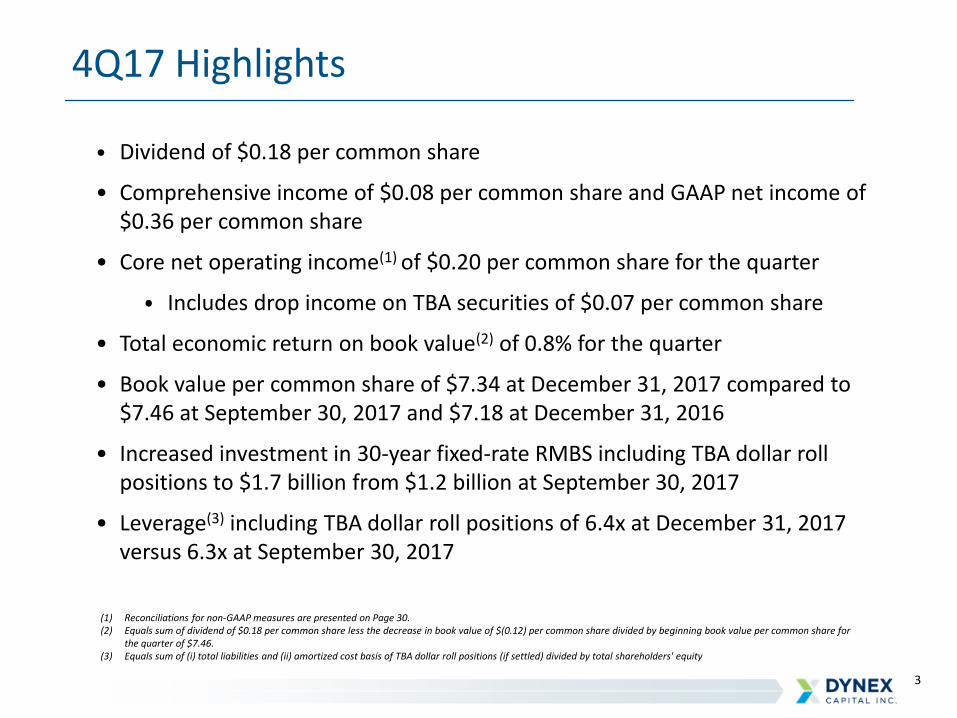
• Dividend of $0.18 per common share
• Comprehensive income of $0.08 per common share and GAAP net income of $0.36 per common share
• Core net operating income(1) of $0.20 per common share for the quarter
⦁ Includes drop income on TBA securities of $0.07 per common share
• Total economic return on book value(2) of 0.8% for the quarter
• Book value per common share of $7.34 at December 31, 2017 compared to $7.46 at September 30, 2017 and $7.18 at December 31, 2016
• Increased investment in 30-year fixed-rate RMBS including TBA dollar roll positions to $1.7 billion from $1.2 billion at September 30, 2017
• Leverage(3) including TBA dollar roll positions of 6.4x at December 31, 2017 versus 6.3x at September 30, 2017
(1) Reconciliations for non-GAAP measures are presented on Page 30.(2) Equals sum of dividend of $0.18 per common share less the decrease in book value of $(0.12) per common share divided by beginning book value per common share for
the quarter of $7.46.(3) Equals sum of (i) total liabilities and (ii) amortized cost basis of TBA dollar roll positions (if settled) divided by total shareholders' equity

4
2017 Full Year Highlights
• Dividends of $0.72 per common share
• Comprehensive income of $47 million or $0.93 per common share
• GAAP net income of $23 million or $0.46 per common share
• Core net operating income of $37 million or $0.73 per common share
• Total economic return (1) on book value of 12.3%
⦁ 10.1% from dividends declared
⦁ 2.2% from increase in book value
• Reallocated capital into more liquid, higher ROE investments by transitioning from hybrid ARMs into 30-year fixed-rate Agency RMBS
• Added hedges to limit impact of Fed hikes on funding costs
• Leverage including TBA dollar roll positions remained relatively stable ending year at 6.4x at December 31, 2017 versus 6.3x at December 31, 2016.
(1) Equals sum of dividend of $0.72 per common share plus the increase in book value of $0.16 per common share divided by beginning book value per share for the year of $7.18.
5
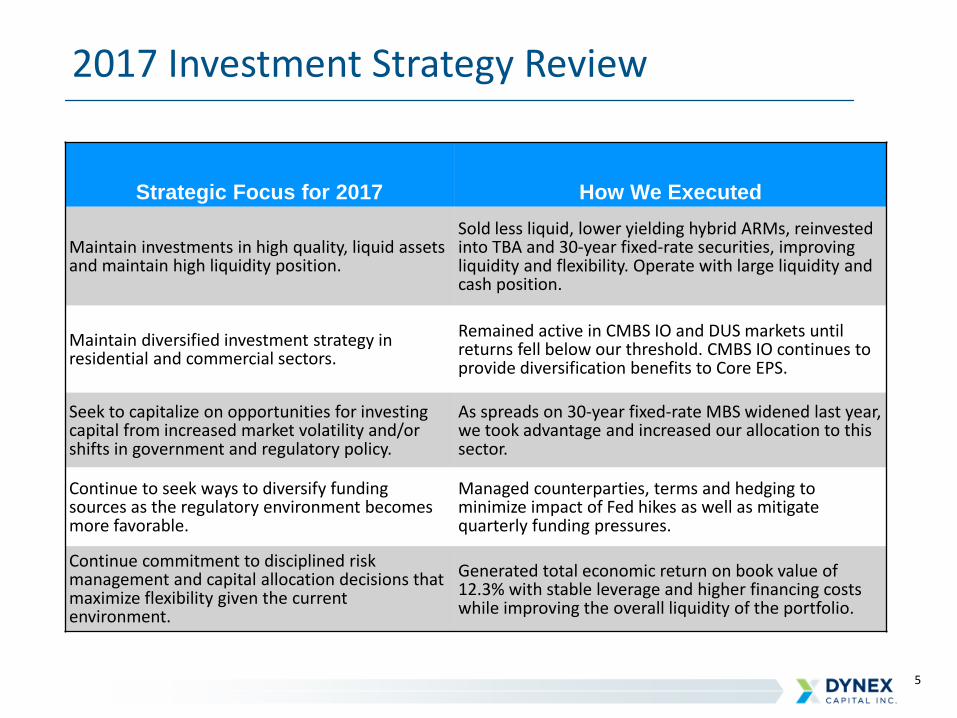
2017 Investment Strategy Review
Strategic Focus for 2017 How We Executed
Maintain investments in high quality, liquid assets and maintain high liquidity position.
Sold less liquid, lower yielding hybrid ARMs, reinvested into TBA and 30-year fixed-rate securities, improving liquidity and flexibility. Operate with large liquidity and cash position.
Maintain diversified investment strategy in residential and commercial sectors.
Remained active in CMBS IO and DUS markets until returns fell below our threshold. CMBS IO continues to provide diversification benefits to Core EPS.
Seek to capitalize on opportunities for investing capital from increased market volatility and/or shifts in government and regulatory policy.
As spreads on 30-year fixed-rate MBS widened last year, we took advantage and increased our allocation to this sector.
Continue to seek ways to diversify funding sources as the regulatory environment becomes more favorable.
Managed counterparties, terms and hedging to minimize impact of Fed hikes as well as mitigate quarterly funding pressures.
Continue commitment to disciplined risk management and capital allocation decisions that maximize flexibility given the current environment.
Generated total economic return on book value of 12.3% with stable leverage and higher financing costs while improving the overall liquidity of the portfolio.

6
Investment Portfolio Changes in 2017
Shifted from ARMs to fixed-rate securities and TBAs.
Increased overall liquidity of investment portfolio.
Investments at December 31, 2017 Investments at December 31, 2016
Total = $4,020 million Total =$3,231 million
7
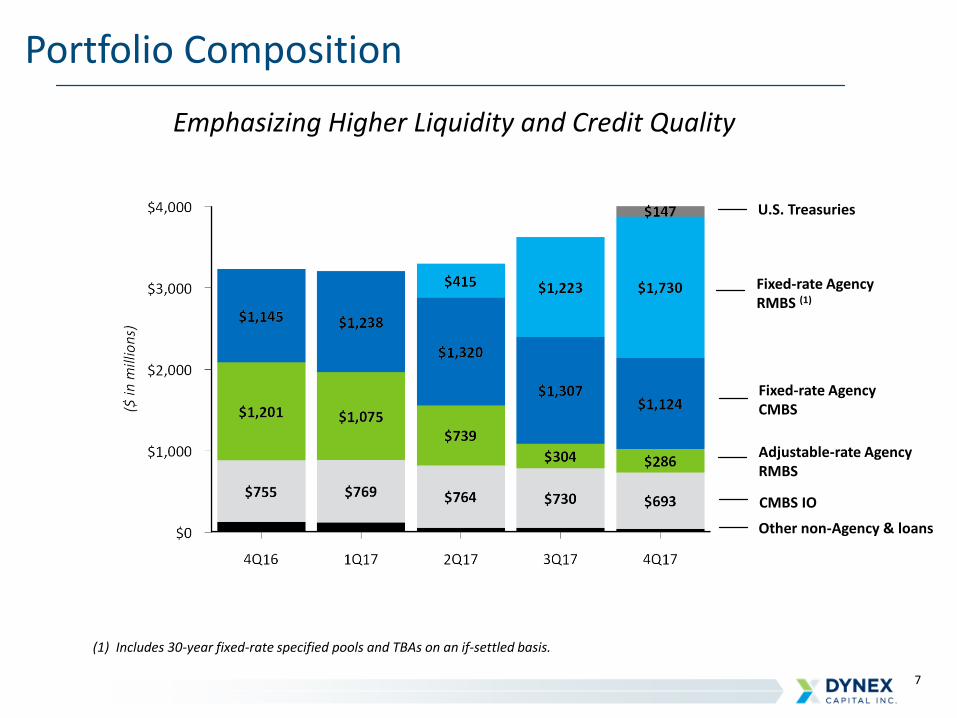
Emphasizing Higher Liquidity and Credit Quality
Portfolio Composition
Fixed-rate Agency CMBS
Adjustable-rate Agency RMBS
CMBS IO
Other non-Agency & loans
(1) Includes 30-year fixed-rate specified pools and TBAs on an if-settled basis.
Fixed-rate Agency RMBS (1)
U.S. Treasuries
8
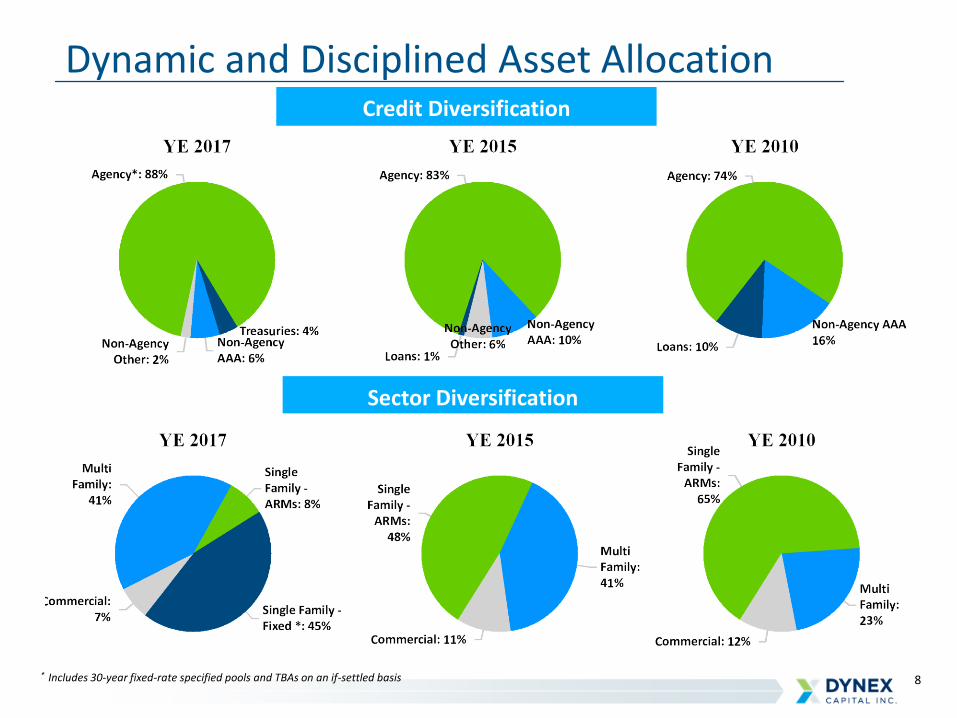
Credit Diversification
Dynamic and Disciplined Asset Allocation
* Includes 30-year fixed-rate specified pools and TBAs on an if-settled basis
Sector Diversification
9
Macroeconomic Themes
• We believe we are in a transition to a higher return environment where we will have the ability to investcapital at long term accretive returns for Dynex shareholders.
• We believe the length of transition will be uncertain, but several catalysts are already in motion – thereduction in the Fed’s balance sheet, the Fed’s apparent commitment to a rate hiking path, and fiscal policyactions which will materially increase the supply of U.S. Treasury debt.
• In the near term, we expect economic data in the US and globally to be positive. Underlying fundamentalsfully support this and appear to be poised to strengthen, fueled temporarily by tax cuts:
⦁ Growth was solid coming into 2018 and will be further boosted by tax cuts, consumption, governmentand business spending.
⦁ Employment picture continues to improve with the latest data confirming modest rise in wages as wellas JOLTs “quits” data confirming more confidence and mobility among workers.
⦁ While inflation is currently low, it is difficult to see how the amount of fiscal stimulus being employeddoes not create some inflationary pressure in the U.S.
• Global central banks are beginning to end the quantitative easing cycle led first by the U.S. The ECB isexpected to make an announcement regarding the end of QE in March. While the BoJ has maintained itscommitment to QE and a weaker yen, the Japanese economy has now grown for seven consecutive quartersfor the first time in more than 15 years.
• In the long-term, the amount of increasing global debt may prove a constraint to growth and inflation andcreate a more fragile global economy.
• However, markets remain vulnerable to surprise events, like a geopolitical issue, or a significant global equityor rates correction that impacts aggregate demand.
• Rapidly rising interest rates could also push equity markets lower or the economy into recession, causing ratesto decline in a "round trip" effect similar to 1987 and 1994.

10
Return Environment
• The post-crisis investment environment has been dominated by central banks which impacted the levelof rates, shape of the yield curve, asset credit spreads and realized market volatility.
• Led by the U.S., central banks are poised to begin the process of removing unprecedented stimulus fromtheir economies. The withdrawal of monetary and balance sheet stimulus should precipitate a transitionto a different investment environment.
• In the US, we see the following evolution:⦁ Interest rates: Fed policy and fiscal policy will materially increase the supply of government debt which
should put upward pressure on interest rates which we believe will result in a better return environment.
⦁ Shape of the yield curve: If long-term interest rates continue to increase, we expect the yield curve tosteepen which we believe will result in a better return environment. If the curve were to flatten, however,this historically has been a short-term event. Since 1989, all flat to inverted yield curve experiences havebeen followed by a Fed ease within 6 months. Unlike in the past, the Fed has more tools to impact long-term yields.
⦁ Spreads: MBS will have to be supported by private capital as the Fed's planned purchases significantlywane in 2H 2018. Credit spreads eventually could face corrections as less risky assets reprice or we face aneconomic slow down or an event occurs that causes revaluation of credit risk.
⦁ Return of volatility: Without central bank purchases, greater private capital involvement in marketscould begin to reflect risks more appropriately and be more volatile as participants adjust
• The above factors all point to opportunities to invest capital at long term accretive returns for Dynexshareholders. A key to our success will be managing effectively through this transitional period.
Returns will be impacted by central bank actions/reactions
11
Investment Strategy Focus & Outlook
• Disciplined risk management and capital allocation decisions that maximizeflexibility and liquidity given the current environment
⦁ Earnings and book value will be a function of risk posture
⦁ Since year end, we have actively managed our hedge position
• Capitalize on investment opportunities from increased market volatilityand/or shifts in government and regulatory policy
⦁ Invest in higher credit quality, more liquid assets and maintain highliquidity position
⦁ Continue diversified investment strategy in residential and commercialsectors given their complimentary cash flow and risk profiles
⦁ Significant spread widening will be needed to invest in lower ratedcredit
• Diversify funding sources as the regulatory environment becomes morefavorable
⦁ Repo spreads could narrow as a result of competition
Flexibility and discipline will be key during the transitional environment

12
10-year U.S. Treasury Yields/S&P 500 (1987-1988)
Lesson learned: Interest rates can be pushed to a level that will adversely impact equity prices and economic activity.
Source: Bloomberg
13
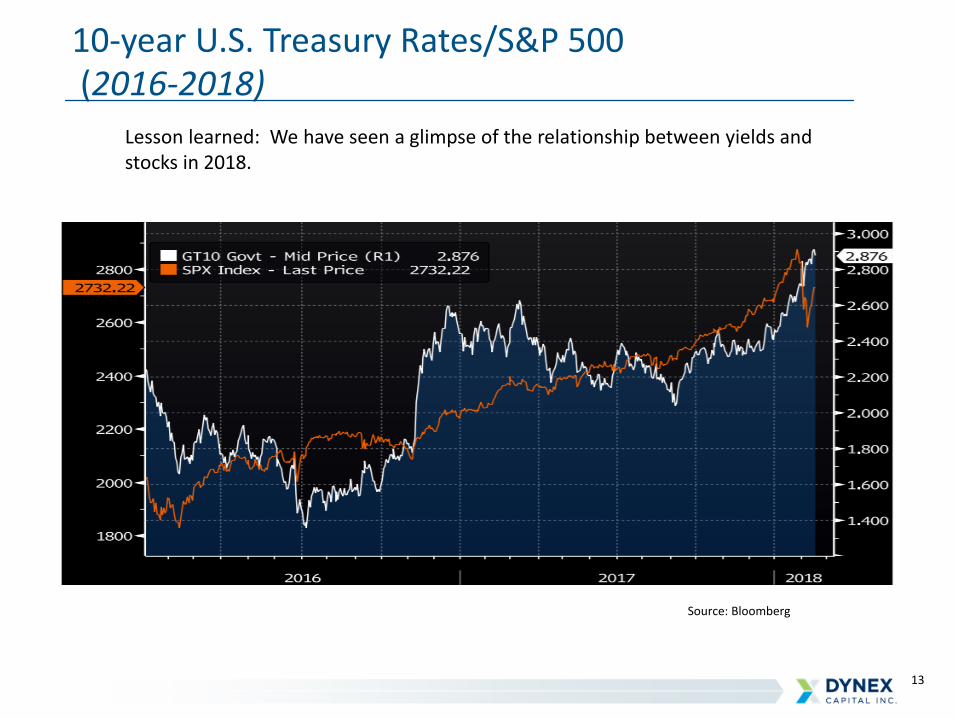
10-year U.S. Treasury Rates/S&P 500(2016-2018)
Lesson learned: We have seen a glimpse of the relationship between yields and stocks in 2018.
Source: Bloomberg
14
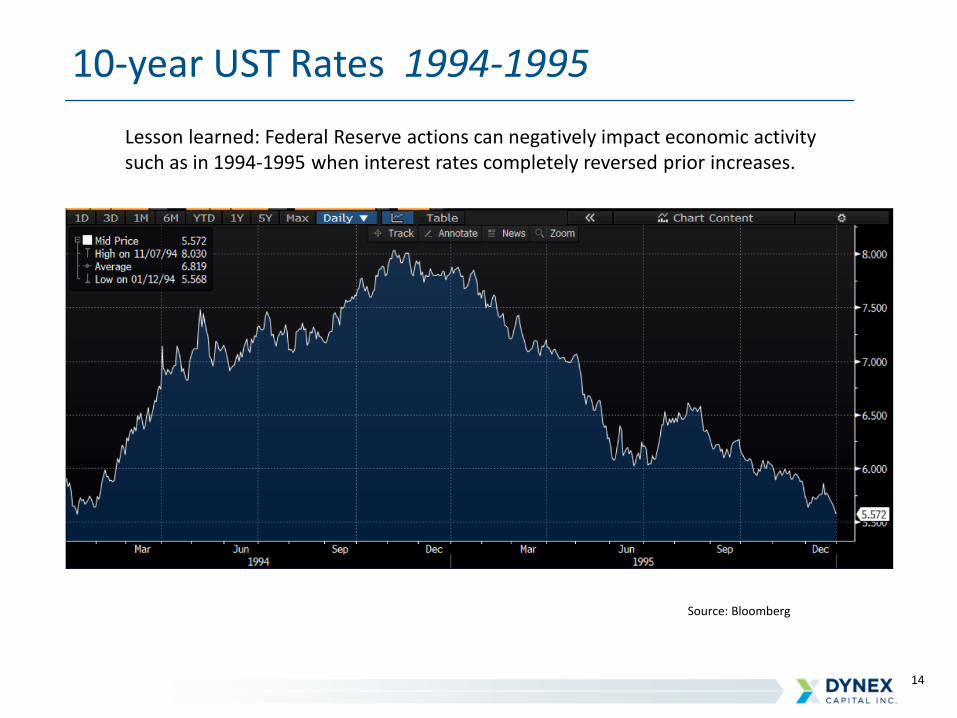
10-year UST Rates 1994-1995
Lesson learned: Federal Reserve actions can negatively impact economic activity such as in 1994-1995 when interest rates completely reversed prior increases.
Source: Bloomberg
15
Longer-Term Trends
• Substantial global demand for yield supports long term valuations ofmortgage REITs:
⦁ aging global population
⦁ low yields globally
• Expanding investment opportunities from growing RMBS/CMBS supply:
⦁ need for private capital to replace government balance sheets
⦁ favorable U.S. demographic trends driving householdformation/housing demand
• Potential greater returns on investments in the future:
⦁ Better risk premiums as Federal Reserve reduces its footprint
⦁ Less competition from GSEs for assets as their role changes
⦁ Lower regulatory costs over the long-term
Favorable secular trends should support our business model
16
Dynex Over the Last 10 Years
• Over the last 10 years through December 31, 2017, we have generated a compounded total shareholder return of 143% versus 131% for the Russell 2000 and 126% for the S&P 500.
• Throughout that time we have dynamically allocated our capital in RMBS/CMBS/CMBS IO and loans, taking advantage of the most favorable relative return opportunities.
• We have declared dividends on our common stock of approximately $392 million, or $9.67 per share over these 10 years.
• Collectively our management team averages over 30 years experience managing fixed income related assets, successfully navigating multiple market and business cycles.
• We are committed to disciplined risk-management in investing our capital.
• We are organized in a shareholder friendly, internal management structure with significant insider ownership.
Dynex offers a compelling story

17Source: SNL Financial
Total Return (%) January 1, 2008 - December 31, 2017
Long-Term Value is Driven by Above Average Dividends

18
Market Snapshot
Common Stock Preferred Stocks
NYSE Ticker: DX DXPrA DXPrB
Shares Outstanding (in millions): (as of 12/31/17) 55.83 2.3 3.59
Q4 Dividends per share: $0.18 $0.53125 $0.4765625
Dividend Yield:(annualized, based on 2/12/18 stock price) 11.65% 8.37% 8.12%
Share Price:(at 2/12/18) $6.18 $25.38 $23.48
Market Capitalization: (based on 12/31/17 shares outstanding and 2/12/18 stock price) $345.04 $58.37 $84.26
Price to Book: (based on 12/31/17 book value and 2/12/18 stock price) 84.2% - -

Supplemental Information
20
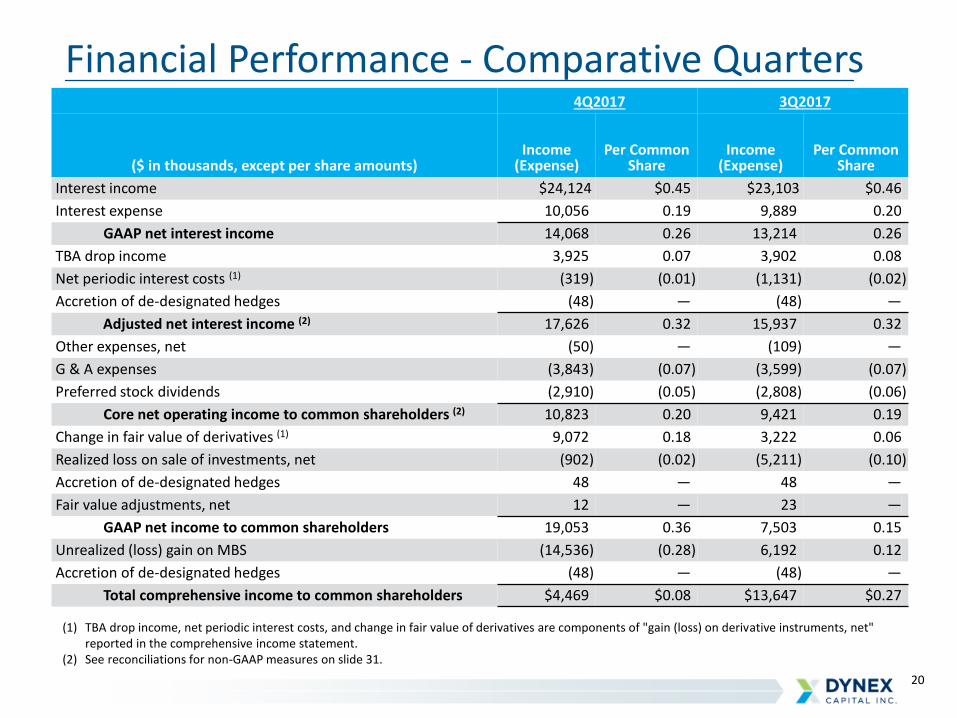
Financial Performance - Comparative Quarters
(1) TBA drop income, net periodic interest costs, and change in fair value of derivatives are components of "gain (loss) on derivative instruments, net" reported in the comprehensive income statement.
(2) See reconciliations for non-GAAP measures on slide 31.
4Q2017 3Q2017
($ in thousands, except per share amounts)Income
(Expense)Per Common
ShareIncome
(Expense)Per Common
Share
Interest income $24,124 $0.45 $23,103 $0.46
Interest expense 10,056 0.19 9,889 0.20
GAAP net interest income 14,068 0.26 13,214 0.26
TBA drop income 3,925 0.07 3,902 0.08
Net periodic interest costs (1) (319) (0.01) (1,131) (0.02)
Accretion of de-designated hedges (48) — (48) —
Adjusted net interest income (2) 17,626 0.32 15,937 0.32
Other expenses, net (50) — (109) —
G & A expenses (3,843) (0.07) (3,599) (0.07)
Preferred stock dividends (2,910) (0.05) (2,808) (0.06)
Core net operating income to common shareholders (2) 10,823 0.20 9,421 0.19
Change in fair value of derivatives (1) 9,072 0.18 3,222 0.06
Realized loss on sale of investments, net (902) (0.02) (5,211) (0.10)
Accretion of de-designated hedges 48 — 48 —
Fair value adjustments, net 12 — 23 —
GAAP net income to common shareholders 19,053 0.36 7,503 0.15
Unrealized (loss) gain on MBS (14,536) (0.28) 6,192 0.12
Accretion of de-designated hedges (48) — (48) —
Total comprehensive income to common shareholders $4,469 $0.08 $13,647 $0.27

21
($ in thousands, except per share amounts) $ AmountPer Common
Share
Common shareholders' equity, September 30, 2017 (1) $382,472 $7.46
GAAP net income:
Core net operating income (2) 10,823 0.20
Realized loss on sale of MBS, net (902) (0.02)
Change in fair value of derivatives 9,072 0.18
Other 60 —
Unrealized net losses on MBS (14,536) (0.27)
Dividends declared (10,050) (0.18)
Stock transactions (3) 32,902 (0.03)
Common shareholders' equity, December 31, 2017 (1) $409,841 $7.34
(1) Common shareholders' equity represents total shareholders' equity less the liquidation value of preferred stock outstanding as of the date indicated.(2) Reconciliations for non-GAAP measures are presented in the Appendix.(3) The decline of $(0.03) in book value per common share reflects the impact from the increase in number of common shares outstanding, net of impact from the increase in proceeds
recorded in shareholders' equity.
Book Value Rollforward
GAAP EPS: $0.36

22
Coupon
December 31, 2017
Par
Amortized Cost/Cost
Basis
Fair Value/Mark
et Value WALA 1 Month CPR
30-year fixed rate:
3.0% $244,374 $246,155 $244,818 13 5.5
4.0% 623,293 657,114 653,860 4 5.6
4.0% TBA (1) (2) (3) 795,000 829,425 830,908 N/A N/A
Adjustable-rate:
3.1% WAVG (4) 278,886 289,305 285,583 74 12.2
Total Agency RMBS and TBA Dollar Roll Positions $1,941,553 $2,021,999 $2,015,169
Agency RMBS Securities and TBAs
(1) Par, implied cost basis, and implied market value of TBA dollar roll positions represents amounts for the underlying Agency MBS as if settled.(2) The net carrying value of TBA dollar roll positions, which is the difference between their implied market value and their implied cost basis, was $1.5
million as of December 31, 2017 and is included on the consolidated balance sheet within “derivative assets”.(3) Excludes net short positions of TBA contracts used as hedges of impact from interest rate risk on book value resulting from fixed-rate Agency RMBS.(4) Adjustable-rate Agency RMBS coupon represents the weighted average based on amortized cost.

23
4Q 2017 3Q 2017
Type of Investment:Effective
YieldCost of Funds
Net Interest Spread
Effective Yield
Cost of Funds
Net Interest Spread
Fixed-rate Agency RMBS 3.02% 1.37% 1.65% 2.98% 1.30% 1.68%
Adjustable-rate Agency RMBS 2.11% 1.35% 0.76% 1.95% 1.27% 0.68%
Agency CMBS 2.80% 1.35% 1.45% 2.73% 1.27% 1.46%
CMBS IO 3.82% 2.13% 1.69% 3.89% 2.10% 1.79%
Non-Agency other 10.21% 2.19% 8.02% 9.21% 2.18% 7.03%
U.S. Treasuries 2.14% 1.25% 0.89% —% —% —%
Loans, net 3.97% 2.05% 1.92% 3.92% 1.97% 1.95%
Net Interest Spread 3.07% 1.53% 1.54% 2.95% 1.48% 1.47%
GAAP Net Interest Spreads

24
Repo Financing (as of December 31, 2017)
Active Counterparty by Region # % of all REPO
North America 7 61%
Asia 6 19%
Europe 3 20%
Total 16 100%
Active Counterparty by Type # % of all REPO
Broker/Dealers 4 29%
Domestic Banks 6 54%
Foreign Banks 6 17%
Total 16 100%
• We maintain a diversified funding platform with 34 established counterparties, currently active with 16 counterparties
• Our funding is well diversified by counterparty and geography• Repo markets remain highly liquid
($ in millions)

25
Interest Rate Swap Position
As of December 31, 2017
26
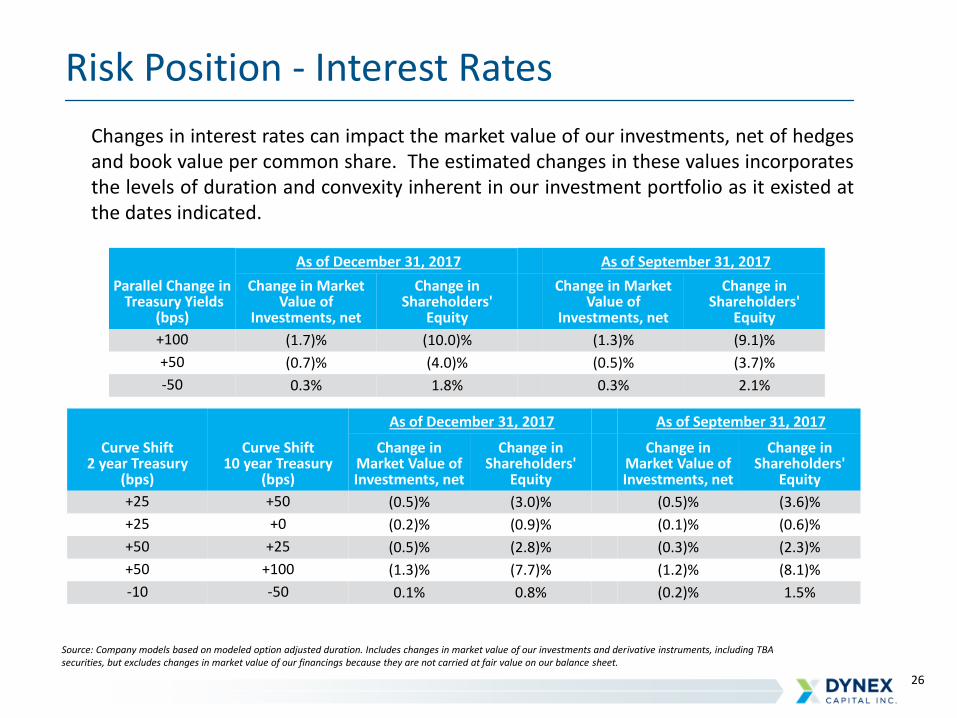
Risk Position - Interest Rates
Parallel Change inTreasury Yields
(bps)
As of December 31, 2017 As of September 31, 2017
Change in Market Value of
Investments, net
Change in Shareholders'
Equity
Change in Market Value of
Investments, net
Change in Shareholders'
Equity
+100 (1.7)% (10.0)% (1.3)% (9.1)%
+50 (0.7)% (4.0)% (0.5)% (3.7)%
-50 0.3% 1.8% 0.3% 2.1%
Source: Company models based on modeled option adjusted duration. Includes changes in market value of our investments and derivative instruments, including TBA securities, but excludes changes in market value of our financings because they are not carried at fair value on our balance sheet.
Curve Shift2 year Treasury
(bps)
Curve Shift10 year Treasury
(bps)
As of December 31, 2017 As of September 31, 2017
Change in Market Value of Investments, net
Change in Shareholders'
Equity
Change in Market Value of Investments, net
Change in Shareholders'
Equity
+25 +50 (0.5)% (3.0)% (0.5)% (3.6)%
+25 +0 (0.2)% (0.9)% (0.1)% (0.6)%
+50 +25 (0.5)% (2.8)% (0.3)% (2.3)%
+50 +100 (1.3)% (7.7)% (1.2)% (8.1)%
-10 -50 0.1% 0.8% (0.2)% 1.5%
Changes in interest rates can impact the market value of our investments, net of hedgesand book value per common share. The estimated changes in these values incorporatesthe levels of duration and convexity inherent in our investment portfolio as it existed atthe dates indicated.

27
Sensitivity to Changes in Credit Spreads
Parallel Change in Market Credit Spreads
As of December 31, 2017 As of September 31, 2017
Change in Market Value of
Investments, net
Change in Shareholders'
Equity
Change in Market Value of
Investments, net
Change in Shareholders'
Equity
+50 (3.1)% (17.5)% (2.6)% (17.9)%
+25 (1.1)% (6.5)% (1.3)% (8.8)%
-25 1.6% 9.2% 1.3% 8.8%
-50 3.2% 18.5% 2.6% 18.0%
Source: Company models based on modeled option adjusted duration. Includes changes in market value of our investments and derivative instruments, including TBA securities, but excludes changes in market value of our financings because they are not carried at fair value on our balance sheet. The projections for market value do not assume any change in credit spreads.
Changes in market credit spreads versus our hedges can impact the market value of ourinvestments, net of hedges and book value per common share. The estimated change inthese values incorporates portfolio and hedge characteristics as they existed at the datesindicated.

28
Dividend Character - YTD 12/31/2017 (Estimated)
($ in thousands)
GAAP net income to common shareholders $23,099
GAAP net income on taxable REIT subsidiary 39
GAAP net income to common shareholders excluding taxable REIT subsidiary 23,060
Differences between GAAP net income and taxable income:
Change in fair value of derivative instruments (3,088)
Loss on sale of investments (3,716)
Tax amortization on terminated derivative instruments (21,580)
Premium amortization 2,621
Other 1,636
Taxable income to common shareholders (1,067)
Add back: Capital losses 11,605
Taxable income - ordinary income $10,538
Common dividends paid deduction ($36,683)
Common dividend representing return of capital ($26,145)
% of common dividend representing non-taxable return of capital 71.3%

29
Reconciliation of GAAP Measures to Non-GAAP Measures
Quarter Ended
12/31/17 9/30/17 6/30/17 3/31/17 12/31/16
GAAP net interest income $14,068 $13,214 $16,142 $14,900 $16,105
Add: TBA drop income 3,925 3,902 1,351 — —
Add: net periodic interest costs (3) (319) (1,131) (1,352) (615) (140)
Less: de-designated hedge accretion (1) (48) (48) (73) (99) (99)
Non-GAAP adjusted net interest income $17,626 $15,937 $16,068 $14,186 $15,866
GAAP interest expense $10,056 $9,889 $8,714 $7,519 $6,753
Add: net periodic interest costs (3) 319 1,131 1,352 615 140
Less: de-designated hedge accretion (1) 48 48 73 99 99
Non-GAAP adjusted interest expense $10,423 $11,068 $10,139 $8,233 $6,992
(1) Amount recorded as a portion of "interest expense" in accordance with GAAP related to the accretion of the balance remaining in accumulated other comprehensive incomeas a result of the Company's discontinuation of hedge accounting effective June 30, 2013.
(2) Amount represents net realized and unrealized gains and losses on derivatives and excludes net periodic interest costs related to these instruments.(3) Amount represents net periodic interest costs on effective interest rate swaps outstanding during the period and exclude termination costs and changes in fair value of
derivative instruments.
($ in thousands except per share data)
Quarter Ended
12/31/17 9/30/17 6/30/17 3/31/17 12/31/16
GAAP net income (loss) to common shareholders $19,053 $7,503 ($10,073) $6,616 $66,758
Adjustments:
Accretion of de-designated cash flow hedges (1) (48) (48) (73) (99) (99)
Change in fair value of derivatives instruments, net (2) (9,072) (3,222) 15,801 (790) (56,686)
Loss on sale of investments, net 902 5,211 3,709 1,708 —
Fair value adjustments, net (12) (23) (30) (10) (17)
Core net operating income to common shareholders $10,823 $9,421 $9,334 $7,425 $9,956
Core net operating income per common share $0.20 $0.19 $0.19 $0.15 $0.20

30
Dynex Portfolio
Asset Class 12/31/17 9/30/17 6/30/17 3/31/17 12/31/16 9/30/16 06/30/16 12/31/15 06/30/15 12/31/14
Agency DUS 56 64 68 67 76 80 94 89 60 59
Fixed 30yr FN 3%* 26 29 36 34 36 18 26 37 21 9
Fixed 30yr FN 4%* 26 29 31 27 33 12 24 26 8 1
Freddie K AAA IO 100 120 145 150 200 230 255 225 150 155
AAA CMBS IO 100 120 110 145 195 215 240 240 175 —
AAA CMBS 74 83 88 93 91 100 104 138 92 88
Freddie K B 165 170 165 220 295 265 325 350 157 170
OtherAgency ARM 5/1 (new issue) 16 20 21 24 19 32 38 22 16 21
Fixed 30yr FN 3.5% 15 27 31 27 29 10 29 34 18 11
Freddie K C 235 280 275 350 435 490 540 480 228 250
IG Corporates 105 117 123 128 138 159 157 172 146 132
High Yield 396 415 441 456 476 558 628 746 521 562
AA CMBS 135 143 132 129 128 160 186 223 163 141
A CMBS 178 184 182 182 230 255 304 348 230 203
BBB CMBS 358 366 357 439 485 560 604 562 388 358
CRT.M3-2014 137 186 162 236 297 311 415 478 425 475
10y swap spreads (1.1) (4.4) (2.4) (0.4) (13.0) (14.0) (10.6) (8.5) 9.8 11.8
Credit Spreads (in bps)
Source: Blackrock, JP Morgan and Company data *Option Adjusted Spreads (OAS) using BlackRock prepayment and interest rate models

31
Investment Strategy
Diversified investment approach that performs in a variety of market environments
• Dynamic and disciplined capital allocation model enables capturing long-term value
• Invest in a high quality, liquid asset portfolio of primarily Agency investments
• Diversification is a key benefit
⦁ Balance between commercial and residential sectors provides diversified cash flow and prepayment profile
⦁ Agency CMBS protect the portfolio from extension risk. High quality CMBS IO add yield and are intended to limit credit exposure and prepayment volatility vs. lower rated tranches
⦁ Agency fixed rate RMBS will allow us to grow our balance sheet opportunistically
• Flexible portfolio duration position to reflect changing market conditions
32
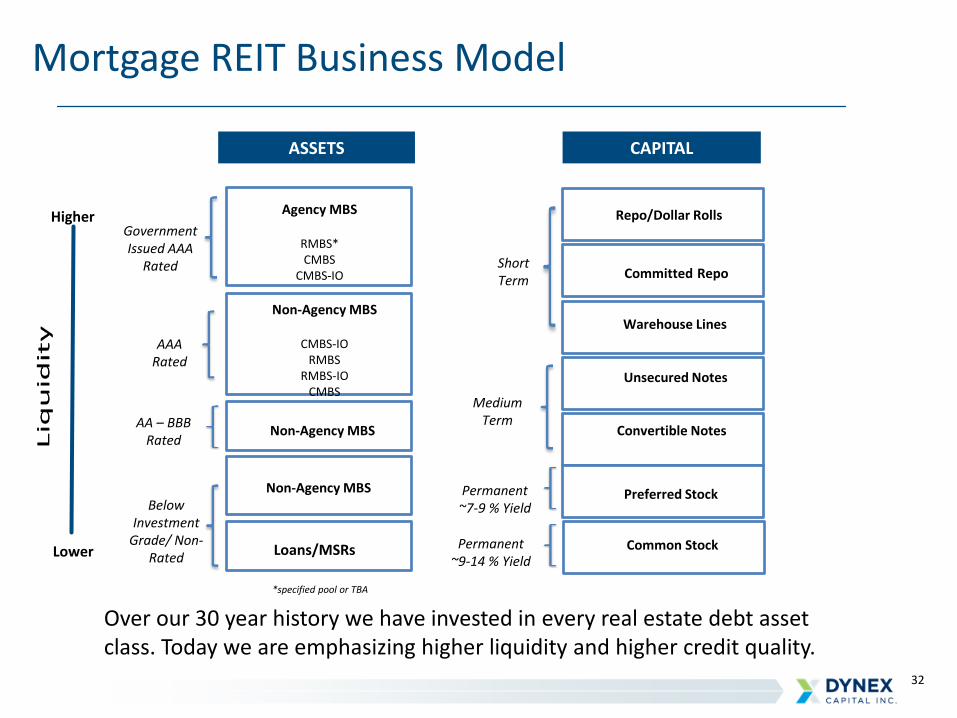
Government Issued AAA
Rated
AAA Rated
AA – BBB Rated
Below Investment
Grade/ Non-Rated
Agency MBS
RMBS* CMBS
CMBS-IO
Non-Agency MBS
CMBS-IORMBS
RMBS-IOCMBS
Non-Agency MBS
Non-Agency MBS
Loans/MSRs
Short Term
Medium Term
Permanent ~7-9 % Yield
Permanent ~9-14 % Yield
Repo/Dollar Rolls
Committed Repo
Warehouse Lines
Unsecured Notes
Convertible Notes
Preferred Stock
Common Stock
Mortgage REIT Business Model
ASSETS CAPITAL
Over our 30 year history we have invested in every real estate debt asset class. Today we are emphasizing higher liquidity and higher credit quality.
*specified pool or TBA
Higher
Lower
33
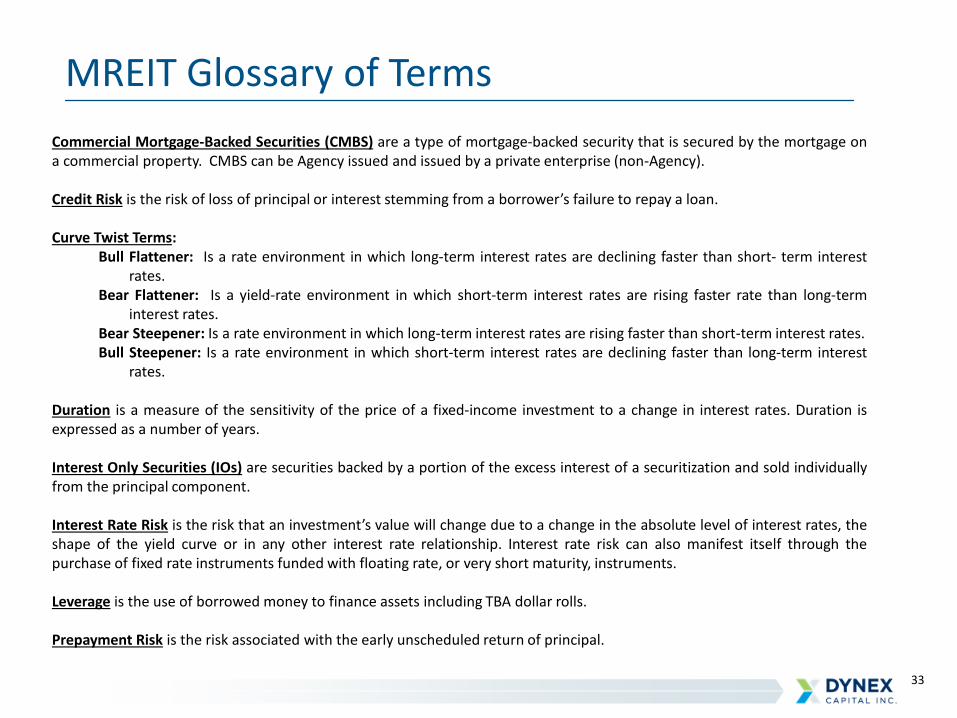
MREIT Glossary of Terms
Commercial Mortgage-Backed Securities (CMBS) are a type of mortgage-backed security that is secured by the mortgage ona commercial property. CMBS can be Agency issued and issued by a private enterprise (non-Agency).
Credit Risk is the risk of loss of principal or interest stemming from a borrower’s failure to repay a loan.
Curve Twist Terms:Bull Flattener: Is a rate environment in which long-term interest rates are declining faster than short- term interest
rates.Bear Flattener: Is a yield-rate environment in which short-term interest rates are rising faster rate than long-term
interest rates.Bear Steepener: Is a rate environment in which long-term interest rates are rising faster than short-term interest rates.Bull Steepener: Is a rate environment in which short-term interest rates are declining faster than long-term interest
rates.
Duration is a measure of the sensitivity of the price of a fixed-income investment to a change in interest rates. Duration isexpressed as a number of years.
Interest Only Securities (IOs) are securities backed by a portion of the excess interest of a securitization and sold individuallyfrom the principal component.
Interest Rate Risk is the risk that an investment’s value will change due to a change in the absolute level of interest rates, theshape of the yield curve or in any other interest rate relationship. Interest rate risk can also manifest itself through thepurchase of fixed rate instruments funded with floating rate, or very short maturity, instruments.
Leverage is the use of borrowed money to finance assets including TBA dollar rolls.
Prepayment Risk is the risk associated with the early unscheduled return of principal.

34
MREIT Glossary of TermsRepurchase Agreements are a short-term borrowing that uses loans or securities as collateral. The lender advances only aportion of the value of the asset (the advance rate). The inverse of the advance rate is the equity contribution of the borrower(the haircut).
Residential Mortgage-Backed Securities (RMBS) are a type of mortgage-backed debt obligation whose cash flows come fromresidential debt, such as mortgages, home-equity loans and subprime mortgages. Each security is typically backed by a pool ofmortgage loans created by US government agencies, banks, or other financial institutions. RMBS can be Agency issued orissued by a private enterprise (non-Agency).
Spread Risk is the potential price volatility resulting from the expansion and contraction of the security’s risk premium over abenchmark (or risk-free) interest rate.
TBA Dollar Roll is a financing mechanism for long positions in TBAs whereby an investor enters into an offsetting short positionand simultaneously enters into an identical TBA with a later settlement date.
To Be Announced (TBA) Securities are forward contracts involving the purchase or sale of non-specified Agency RMBS orCMBS.