fourth quarter 2019 results 2019 accomplishments 2020 ... · 2019 accomplishments 2020 strategic...
TRANSCRIPT

February 21, 2020
Fourth Quarter 2019 Results2019 Accomplishments
2020 Strategic Priorities and Guidance

2
Safe Harbor Statement Under the PrivateSecurities Litigation Reform Act of 1995
All information set forth in this presentation, except historical and factual information,represents forward-looking statements. This includes all statements about the company’splans, beliefs, estimates, and expectations. These statements are based on current estimates,projections and assumptions, which involve certain risks and uncertainties that could causeactual results to differ materially from those in the forward-looking statements. Importantfactors that may affect these forward-looking statements include, but are not limited to:intense competition; the ability to execute TDS’ business strategy; uncertainties in TDS’ futurecash flows and liquidity and access to the capital markets; the ability to make payments onTDS and U.S. Cellular indebtedness or comply with the terms of debt covenants; impacts ofany pending acquisitions/divestitures/exchanges of properties and/or licenses, including, butnot limited to, the ability to obtain regulatory approvals, successfully complete thetransactions and the financial impacts of such transactions; the ability of the company tosuccessfully manage and grow its markets; the access to and pricing of unbundled networkelements; the ability to obtain or maintain roaming arrangements with other carriers onacceptable terms; the state and federal telecommunications regulatory environment; thevalue of assets and investments; adverse changes in the ratings afforded TDS and U.S.Cellular debt securities by accredited ratings organizations; industry consolidation; advancesin telecommunications technology; pending and future litigation; changes in income tax rates,laws, regulations or rulings; changes in customer growth rates, average monthly revenue peruser, churn rates, roaming revenue and terms, the availability of wireless devices, or the mixof products and services offered by U.S. Cellular and TDS Telecom. Investors are encouragedto consider these and other risks and uncertainties that are discussed in documents furnishedto the Securities and Exchange Commission.

3
Upcoming conferences
• 3/2/20 - Raymond James 41th Annual Institutional InvestorsConference (Orlando, Florida)
◦ From management: Ken Meyers, Vicki Villacrez and JaneMcCahon
• 3/5/20 - Morgan Stanley Technology, Media & TelecomConference (San Francisco)
◦ From management: Ted Carlson, Doug Chambers, VickiVillacrez and Jane McCahon
• 3/6/20 - Strategas Securities Non Deal Roadshow (Portland,Oregon)
◦ From management: Jane McCahon

4

5
Building a stronger, more competitive customer-centric wireless carrier
Over the past few years:• Investments in the customer experience
• Unlimited Plans• Brand refresh• Website• Roaming
• Investments in culture• Focus on our associates and their
development, driving exceptionallyhigh engagement scores, lowturnover and customer satisfaction
• Investments in network – capacity,speed, security
• Spectrum, VoLTE, 4G networkmodernization/speed, 5G
$1,200
$1,000
$800
$600
$400
$200
$0
($in
mill
ions
)
2017 2018 2019
$820$963 $1,015
(3) - See slide 38 for explanations
Data Usage
300
250
200
150
100
50
02017 2018 2019
3 Year Adjusted EBITDA CAGR=7.5% Adjusted EBITDA (3)
Tota
l Sys
tem
Usa
ge (
MBs
in M
illio
ns)

6
• Attract new customers and strengthen ourbase
• Postpaid handset churn of 1.04% • Added 71,000 smartphone connections
• Drive revenue growth• Increase in Postpaid and Prepaid ARPU• Inbound roaming revenue increased
13%
• Continue to focus on cost structure
• Invest in network ◦ Spectrum, speed, data capacity,
dynamic network management, VoLTE,network modernization, 5G
2019 goals and accomplishments
Retail service Roaming
Other service
$3,500
$3,000
$2,500
$2,000
$1,500
$1,000
$500
$0
2017 2018 2019
$2,978 $2,978 $3,035
(1) - See slide 38 for explanations
Service Revenues (1)
($ in
mill
ions
)

7
Postpaid handsets
Gross Additions
150,000
125,000
100,000
75,000
50,000
25,000
0
Q4'18 Q1'19 Q2'19 Q3'19 Q4'19
136,000
102,000 102,000
124,000130,000
Net Additions
25,000
20,000
15,000
10,000
5,000
0
-5,000
-10,000
-15,000
-20,000
Q4'18 Q1'19 Q2'19 Q3'19 Q4'19
20,000
(14,000)(11,000)
(2,000)
2,000
Smartphone Connections
3,480,000
3,460,000
3,440,000
3,420,000
3,400,000
3,380,000
Q4'18 Q1'19 Q2'19 Q3'19 Q4'19
3,397,000
3,409,000
3,419,000
3,441,000
3,468,000

8
Postpaid churn rate
Handsets Total Postpaid
1.60%
1.40%
1.20%
1.00%
0.80%
0.60%
0.40%
0.20%
0.00%Q4'18 Q1'19 Q2'19 Q3'19 Q4'19
1.00% 0.99% 0.97%
1.09% 1.11%
1.29% 1.26% 1.23%
1.38% 1.38%

9
Total operating revenues($ in millions)
Retail service Roaming Other service Equipment sales
$1,200
$1,000
$800
$600
$400
$200
$0
Q4'18 Q1'19 Q2'19 Q3'19 Q4'19
$663 $659 $662 $663 $666
$38 $34 $44 $54 $42$53 $48 $51 $57 $55
$297
$1,051
$225
$966
$216
$973
$257
$1,031
$289
$1,052

10
Postpaid revenue
$48
$46
$44
$42
$40Q4'18 Q1'19 Q2'19 Q3'19 Q4'19
$45.58 $45.44$45.90 $46.16
$46.57
$125
$120
$115
$110
$105
$100Q4'18 Q1'19 Q2'19 Q3'19 Q4'19
$119.60 $118.84 $119.46 $119.87$120.99
Average Revenue Per User (ARPU) Average Revenue Per Account (ARPA)

11
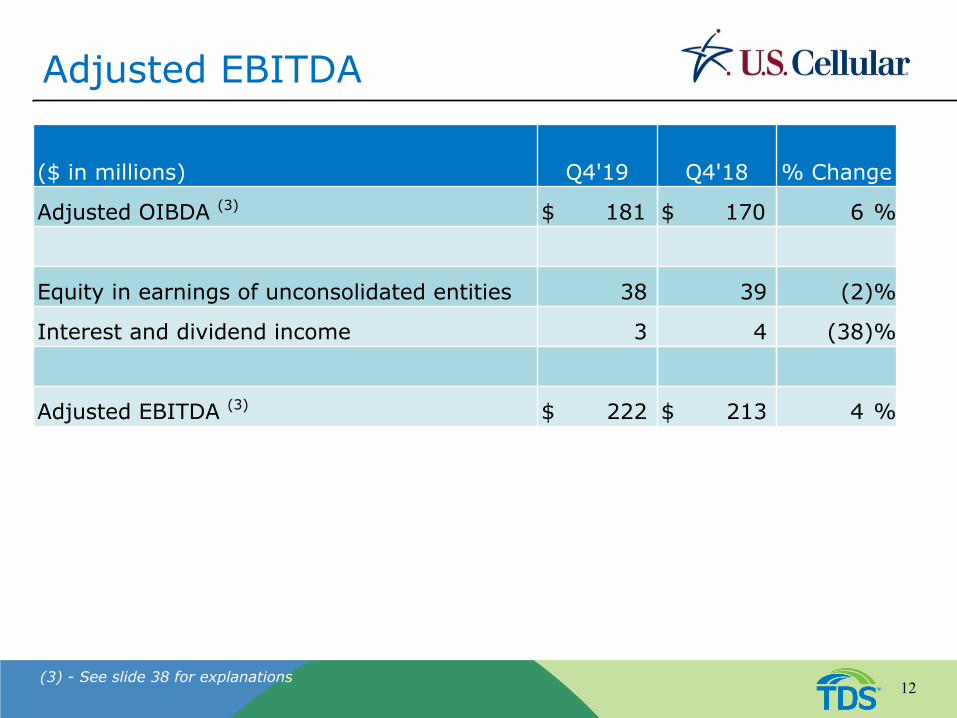
Adjusted OIBDA
($ in millions) Q4'19 Q4'18 % Change
Total operating revenues $ 1,052 $ 1,051 –
System operations expense 188 193 (2)%
Cost of equipment sold 305 315 (3)%
SG&A expenses 378 373 1 %
Total cash expenses (2) 871 881 (1)%
Adjusted OIBDA (3) $ 181 $ 170 6 %
(2), (3) - See slide 38 for explanations
12
Adjusted EBITDA
($ in millions) Q4'19 Q4'18 % Change
Adjusted OIBDA (3) $ 181 $ 170 6 %
Equity in earnings of unconsolidated entities 38 39 (2)%
Interest and dividend income 3 4 (38)%
Adjusted EBITDA (3) $ 222 $ 213 4 %
(3) - See slide 38 for explanations

13
($ in millions) 2019 2018 % ChangeTotal operating revenues $ 4,022 $ 3,967 1%
System operations expense 756 758 –Cost of equipment sold 1,028 1,031 –SG&A expenses 1,406 1,388 1% Total cash expenses (2) 3,190 3,177 –
Adjusted OIBDA (3) 832 790 5%
Equity in earnings of unconsolidated entities 166 159 5%Interest and dividend income 17 15 17%Other, net — (1) N/M
Adjusted EBITDA (3) $ 1,015 $ 963 5%
Annual financial results
N/M - Percentage change not meaningful
(2), (3) - See slide 38 for explanations

14
Elevate Brand Relevance• Expand addressable market• Structure targeted promotions• Website evolution and E-
commerce roadmapFocus on Customer Engagement
• Lifecycle management• Personalization• Digitalization• Retail channel optimization
Grow Revenue• Postpaid/Prepaid/B&G • Roaming• Fixed Wireless• Device protection plans• Accessories
2020 strategic priorities

15
Leverage Associate Engagement• Cultural strength• Recruitment and retention in tight labor
markets• Competitive advantageMaintain Expense Discipline• Continue to execute on cost savings
opportunitiesAdvance the Network• Continue to enhance customer experience on
and off network• Network modernization• Continue VoLTE market launches• Deployment of 5G
2020 strategic priorities

16
2020 guidance *
($ in millions)
As of February 20, 2020 2019 Estimates 2019 Actual 2020 EstimatesService revenues N/A** $3,035 $3,000-$3,100
Adjusted OIBDA (3) $750-$850 $832 $775-$900
Adjusted EBITDA (3) $925-$1,025 $1,015 $950-$1,075Capital expenditures $625-$725 $710 $850-$950
(3) - See slide 38 for explanations* There can be no assurance that final results will not differ materially from such estimated results.**2019 guidance was provided for Total operating revenues.
5G
VoLTE
Capacity
NetworkOperations
Sales/IS/Facilities
5G (mmWave)
5G (600 MHz)
2019 Actual Capital expenditures
2020 Estimated Capital expenditures

17

18
Over the past five years:• Invested in fiber-to-the-home (FTTH) within ILEC footprint• Piloted and launched out-of-territory (OOT) fiber program –
opportunity to drive growth and long-term value creation• Secured A-CAM and state broadband funding to address rural needs• Acquired cable companies – driving revenue and margin expansion
◦ Cable Adjusted EBITDA margin increased from 24% to 33%
Where we were (2015) Where we are (2019) Revenues of $876 million Revenues of $930 million
Transforming TDS Telecom into a premierbroadband company
Broadband& Video
Voice
CLEC
Regulatory &Wholesale
Broadband& Video
Voice
CLEC
Regulatory &Wholesale
Certain
Uncertain
21%
19%
20%
40%20%
53%13%
14%

19
• Investments in fiber - current fiber plans include ~230,000 FTTHservice addresses, of which ~50,000 were turned up in 2019
• Secured full funding of A-CAM program, nearly 25% of service addressobligation completed
• Broadband and video growth offsets secular declines• Lean cost management – redeploying resources from legacy areas to
fund broadband initiatives• Pre-sale results in our new OOT markets are at or above our pilot
market, Sun Prairie
2019 Wireline accomplishments
32% 19% 19% 26% 4%
Service Addresses at December 31, 2019*(793,300)
Un-UpgradedCopper
Copper 10 to 24 Mbps
Copper 25 to 100 Mbps
Fiber In-footprint
FiberOut-of-territory
*Includes ILEC and OOT, excludes CLEC

20
2019 Cable accomplishments
• Continue to enable and offer faster broadband data speeds◦ Increased broadband connections by 16%; 6% organic◦ 15% broadband revenue growth◦ Launched DOCSIS 3.1
• 17% increase in Adjusted EBITDA; increased margin by 250 basispoints
• Acquisition of Continuum outside Charlotte, North Carolina
40,000 Service AddressesAnnual Revenues over $20 million

21
TDS Telecom annual operating performance
($ in millions) 2019 2018 % ChangeWireline $ 683 $ 699 (2)%Cable 247 230 8 % Total operating revenues * 930 927 –
Cash expenses (2) 629 624 1 %
Adjusted EBITDA (3) $ 313 $ 313 –
Capital expenditures $ 316 $ 232 36 %
* Includes intercompany eliminations(2), (3) - See slide 38 for explanations

22
TDS Telecom fourth quarteroperating performance
($ in millions) Q4’19 Q4’18 % ChangeWireline $ 171 $ 173 (1)%Cable 64 60 7 % Total operating revenues * 235 232 1 %
Cash expenses (2) 162 159 2 %
Adjusted EBITDA (3) $ 75 $ 77 (3)%
Capital expenditures $ 124 $ 91 35 %
* Includes intercompany eliminations(2), (3) - See slide 38 for explanations

23
Fourth quarter Wireline highlights
• Growth in video connections and broadband penetration driving an increasein residential revenue per connection
• Demand for higher speeds is strong• Growth from fiber investments, and A-CAM support helps to offset legacy
revenue declines
$50.00
$40.00
$30.00
$20.00
$10.00
$0.00
Q4'18 Q4'19
$47.39$49.11
Residential revenue per connection
4%
(Y/Y)
Video Broadband
Voice
Residential Connections
300,000
250,000
200,000
150,000
100,000
50,000
0
Q4'18 Q1'19 Q2'19 Q3'19 Q4'19
3%
Broadbandconnections(Y/Y growth)
8%
Videoconnections(Y/Y growth)
24
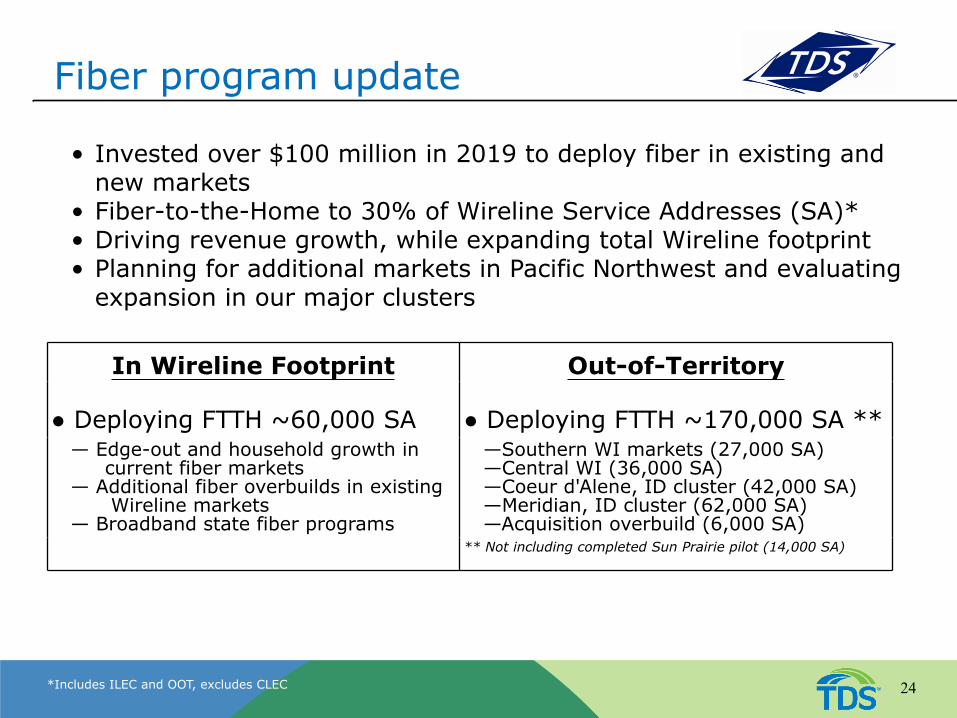
Fiber program update
• Invested over $100 million in 2019 to deploy fiber in existing andnew markets
• Fiber-to-the-Home to 30% of Wireline Service Addresses (SA)*• Driving revenue growth, while expanding total Wireline footprint• Planning for additional markets in Pacific Northwest and evaluating
expansion in our major clusters
In Wireline Footprint Out-of-Territory
● Deploying FTTH ~60,000 SA ● Deploying FTTH ~170,000 SA ** — Edge-out and household growth in
current fiber markets — Additional fiber overbuilds in existing
Wireline markets — Broadband state fiber programs
—Southern WI markets (27,000 SA) —Central WI (36,000 SA) —Coeur d'Alene, ID cluster (42,000 SA) —Meridian, ID cluster (62,000 SA) —Acquisition overbuild (6,000 SA) ** Not including completed Sun Prairie pilot (14,000 SA)
*Includes ILEC and OOT, excludes CLEC

25
Wireline operating performance
($ in millions) Q4’19 Q4’18 % Change
Residential $ 83 $ 80 3 %
Commercial 40 45 (10)%
Wholesale 47 48 –
Total operating revenues 171 173 (1)%
Cash expenses (2) 119 118 –
Adjusted EBITDA (3) $ 54 $ 58 (6)%
Capital expenditures $ 98 $ 73 35 %
(2), (3) - See slide 38 for explanations
26
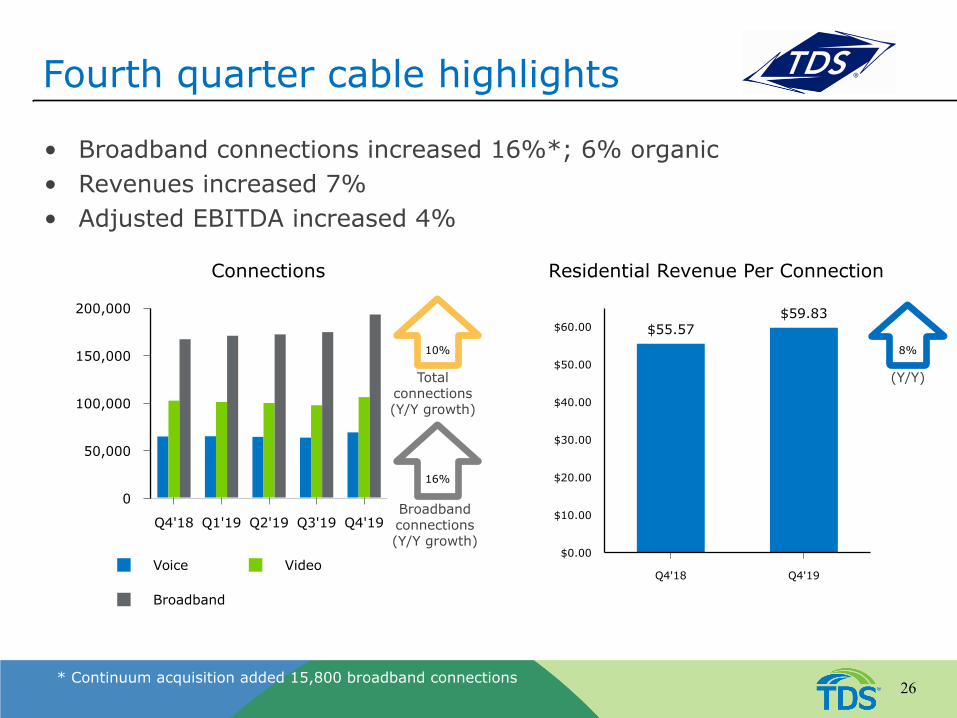
Fourth quarter cable highlights
• Broadband connections increased 16%*; 6% organic• Revenues increased 7%• Adjusted EBITDA increased 4%
Broadbandconnections(Y/Y growth)
Totalconnections (Y/Y growth)
Voice Video
Broadband
Connections
200,000
150,000
100,000
50,000
0
Q4'18 Q1'19 Q2'19 Q3'19 Q4'19
Residential Revenue Per Connection
$60.00
$50.00
$40.00
$30.00
$20.00
$10.00
$0.00
Q4'18 Q4'19
$55.57$59.83
(Y/Y)
8%
16%
10%
* Continuum acquisition added 15,800 broadband connections

27
Cable operating performance
($ in millions) Q4’19 Q4’18 % Change
Residential $ 53 $ 48 9 %
Commercial 11 12 (5)%
Total operating revenues 64 60 7 %
Cash expenses (2) 44 41 8 %
Adjusted EBITDA (3) $ 21 $ 20 4 %
Capital expenditures $ 26 $ 19 37 %
(2), (3) - See slide 38 for explanations

28
INVEST in BROADBAND• FTTH - primarily new markets
• Rapidly scaling up operations• Cable
• Drive penetration• Integrate Continuum• Evaluate additional acquisitions
• Meet A-CAM Obligations• Innovative Products and Marketing
• Speed, Capacity and Security• TDS TV+ launch to drive higher
broadband share• Managed Wi-Fi• Hyper-localized marketing and sales
2020 Strategic Priorities
Existingmarket
New market
Southern WisconsinFiber Cluster
Fully launched in 2020

29
Target markets where our formula wins• Attractive competitive environment• Build cost per household passed• Strong household formation• Attractive demographics• Supportive municipalities/regulatory environments
Operate Lean• Focus is continuous• Supply chain management rigor• Use of data analytics• Redeploy resources to growth opportunities
2020 Strategic Priorities
30
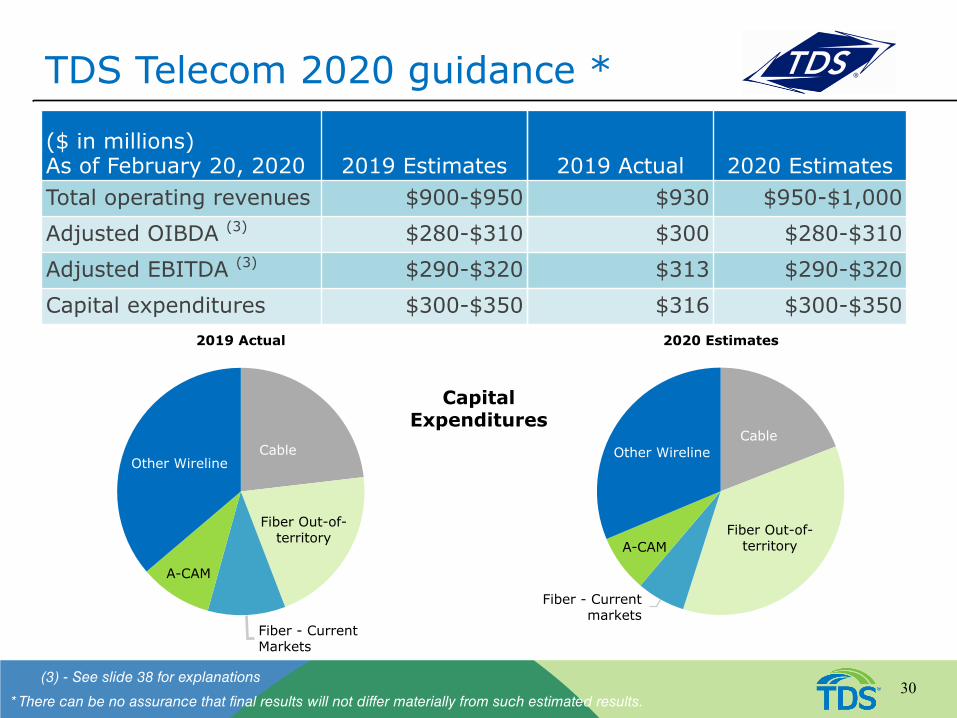
($ in millions)As of February 20, 2020 2019 Estimates 2019 Actual 2020 EstimatesTotal operating revenues $900-$950 $930 $950-$1,000Adjusted OIBDA (3) $280-$310 $300 $280-$310Adjusted EBITDA (3) $290-$320 $313 $290-$320Capital expenditures $300-$350 $316 $300-$350
* There can be no assurance that final results will not differ materially from such estimated results.
TDS Telecom 2020 guidance *
(3) - See slide 38 for explanations
Cable
Fiber Out-of-territory
Fiber - CurrentMarkets
A-CAM
Other Wireline
Cable
Fiber Out-of-territory
Fiber - Currentmarkets
A-CAM
Other Wireline
2019 Actual 2020 Estimates
CapitalExpenditures

31
2019 HMS highlights• Total revenues increased due to professional services and
equipment revenue growth• Continue to drive improvements in cost structure
2020 priorities• Execute a multi-cloud strategy to grow revenues• Continue to drive improvements in cost structure

32
Appendix

Adjusted OIBDA and Adjusted EBITDA reconciliation
Three Months Ended December 31, 2019 Three Months Ended December 31, 2018
($ in millions)U.S.
Cellular Wireline Cable
Total TDS
Telecom TDS (4)U.S.
Cellular Wireline Cable
Total TDS
Telecom TDS (4)
Net income (GAAP) $18 N/A N/A $18 $15 $21 N/A N/A $17 $20
Add back:
Income tax expense (benefit) (3) N/A N/A 7 (1) (4) N/A N/A 9 (2)
Income before income taxes (GAAP) 15 22 3 25 14 17 23 3 26 18
Add back:
Interest expense 23 (1) — (1) 37 29 — — — 43
Depreciation, amortization and accretion expense 178 33 17 51 236 162 35 17 52 222
EBITDA (3) (non-GAAP) 216 54 20 75 287 208 58 20 77 283
Add back:
(Gain) loss on asset disposals, net 6 — — — 6 5 — — — 5
Adjusted EBITDA (3) (non-GAAP) 222 54 21 75 293 213 58 20 77 288
Deduct:
Equity in earnings of unconsolidated entities 38 — — — 39 39 — — — 39
Interest and dividend income 3 2 — 3 5 4 2 — 3 8
Other, net — — — — (1) — 1 — 1 1
Adjusted OIBDA (3) (non-GAAP) $181 $52 $20 $72 $250 $170 $55 $19 $74 $240
33Numbers may not foot due to rounding.
(3), (4) - See slide 38 for explanations

Adjusted OIBDA and Adjusted EBITDA reconciliation – Estimated Results
2020 Estimated Results 2019 Estimated Results
($ in millions) U.S. Cellular TDS Telecom U.S. Cellular TDS Telecom
Net income (GAAP) N/A N/A N/A N/A
Add back:
Income tax expense N/A N/A N/A N/A
Income before income taxes (GAAP) $130-$255 $80-$110 $80-$180 $85-$115
Add back:
Interest expense 110 — 115 —
Depreciation, amortization and accretion 690 210 710 205
EBITDA (3) (non-GAAP) $930-$1,055 $290-$320 $905-$1,005 $290-$320
Add back:
(Gain) loss on asset disposals, net 20 — 20 —
(Gain) loss on sale of business and other exit costs, net — — — —
Adjusted EBITDA (3) (non-GAAP) $950-$1,075 $290-$320 $925-$1,025 $290-$320
Deduct:
Equity in earnings of unconsolidated entities 160 — 160 —
Interest and dividend income 15 10 15 10
Adjusted OIBDA (3) (non-GAAP) $775-$900 $280-$310 $750-$850 $280-$310
34
In providing estimated results, TDS has not completed the below reconciliation to net income because it does notprovide guidance for income taxes. TDS believes that the impact of income taxes cannot be reasonably predicted;therefore, the company is unable to provide such guidance.
(3) - See slide 38 for explanations

U.S. Cellular Adjusted EBITDA reconciliation (1)
Year ended December 31,($ in millions) 2019 2018 2017Net income (GAAP) $ 133 $ 164 $ 15Add back or deduct:
Income tax expense (benefit) 52 51 (287)Income (loss) before income taxes (GAAP) $ 185 $ 215 $ (272)Add back:
Interest expense 110 116 113Depreciation, amortization and accretion 702 640 615
EBITDA (3) (non-GAAP) $ 997 $ 971 $ 456Add back:
Loss on impairment of goodwill — — 370(Gain) loss on asset disposals, net 19 10 17(Gain) loss on sale of business and other exit costs, net (1) — (1)(Gain) loss on license sales and exchanges, net — (18) (22)
Adjusted EBITDA (3) (non-GAAP) $ 1,015 $ 963 $ 820Deduct:
Equity in earnings of unconsolidated entities 166 159 137Interest and dividend income 17 15 8Other, net — (1) —
Adjusted OIBDA (3) (non-GAAP) $ 832 $ 790 $ 675
(1), (3) - See slide 38 for explanations35

TDS Telecom Adjusted EBITDA reconciliationYear ended December 31,
($ in millions) 2019 2018Net income (GAAP) $ 92 $ 89Add back:
Income tax expense 30 16Income before income taxes (GAAP) $ 122 $ 105Add back:
Interest expense (3) (2)Depreciation, amortization and accretion 200 212
EBITDA (3) (non-GAAP) $ 320 $ 315Add back:
(Gain) loss on asset disposals, net (7) (2)Adjusted EBITDA (3) (non-GAAP) $ 313 $ 313Deduct:
Interest and dividend income 12 8Other, net — 2
Adjusted OIBDA (3) (non-GAAP) $ 300 $ 303
Numbers may not foot due to rounding.
(3) - See slide 38 for explanations36

Cable Adjusted EBITDA reconciliation (1)
Year ended December 31,($ in millions) 2019 2018 2017 2016 2015Income (loss) before income taxes (GAAP) $ 13 $ (1) $ 8 $ 2 $ 7Add back:
Depreciation, amortization and accretion 68 69 44 37 35EBITDA (3) (Non-GAAP) $ 81 $ 69 $ 52 $ 38 $ 42Add back or deduct:
(Gain) loss on asset disposals, net 1 1 2 2 1Adjusted EBITDA (3) (Non-GAAP) $ 82 $ 70 $ 54 $ 41 $ 42Deduct:
Interest and dividend income 2 1 — — —Adjusted OIBDA (3) (non-GAAP) $ 80 $ 69 $ 54 $ 41 $ 42
Numbers may not foot due to rounding.
(1), (3) - See slide 38 for explanations37

1) As of January 1, 2018, TDS and U.S. Cellular adopted the new revenue recognition standard, ASC 606, using a modifiedretrospective approach. Under this method, the new accounting standard is applied only to the most recent period presented.As a result, periods after this adoption date include the impacts of ASC 606, but prior periods remain as previously reported.
2) Total cash expenses represent total operating expenses as shown in the Consolidated Statement of Operations Highlights inthe TDS and U.S. Cellular SEC Forms 8-K, less depreciation, amortization and accretion and gain/losses.
3) EBITDA, Adjusted EBITDA and Adjusted OIBDA are defined as net income adjusted for the items set forth in thereconciliations on slides 33 through 37. EBITDA, Adjusted EBITDA and Adjusted OIBDA are not measures of financialperformance under Generally Accepted Accounting Principles in the United States (GAAP) and should not be considered asalternatives to Net income or Cash flows from operating activities, as indicators of cash flows or as measures of liquidity.TDS and U.S. Cellular do not intend to imply that any such items set forth in the reconciliations on slides 33 through 37 arenon-recurring, infrequent or unusual; such items may occur in the future. Management uses Adjusted EBITDA and AdjustedOIBDA as measurements of profitability, and therefore reconciliations to Net income are deemed appropriate. Managementbelieves Adjusted EBITDA and Adjusted OIBDA are useful measures of TDS’ and U.S. Cellular's operating results beforesignificant recurring non-cash charges, gains and losses, and other items as presented above as they provide additionalrelevant and useful information to investors and other users of TDS’ and U.S. Cellular's financial data in evaluating theeffectiveness of its operations and underlying business trends in a manner that is consistent with management’s evaluationof business performance. Adjusted EBITDA shows adjusted earnings before interest, taxes, depreciation, amortization andaccretion, and gains and losses, while Adjusted OIBDA reduces this measure further to exclude Equity in earnings ofunconsolidated entities and Interest and dividend income in order to more effectively show the performance of operatingactivities excluding investment activities. The tables on slides 33 through 37 reconcile EBITDA, Adjusted EBITDA andAdjusted OIBDA flow to the corresponding GAAP measure, Net income or Income before income taxes. Additionalinformation and reconciliations related to Non-GAAP financial measures for December 31, 2019, can be found on TDS’ andU.S. Cellular's website at investors.tdsinc.com or investors.uscellular.com.
4) The TDS column includes U.S. Cellular, TDS Telecom and also the impacts of consolidating eliminations, corporate operationsand non-reportable segments.
38