fourth quarter and annual results 2010 information …...discussion of factors that could cause...
TRANSCRIPT
Royal Philips ElectronicsFourth Quarter and Annual Results 2010
Information booklet
January 24th, 2011
2
Important informationForward-looking statementsThis document and the related oral presentation, including responses to questions following the presentation contain certain forward-looking statements withrespect to the financial condition, results of operations and business of Philips and certain of the plans and objectives of Philips with respect to these items, in particular the sections “Looking ahead” and “Outlook”. Examples of forward-looking statements include statements made about our strategy, estimates of sales growth, future EBITA and future developments in our organic business. By their nature, these statements involve risk and uncertainty because they relate to future events and circumstances and there are many factors that could cause actual results and developments to differ materially from those expressed or implied by these statements. These factors include but are not limited to domestic and global economic and business conditions, the successful implementation of our strategy and our ability to realize the benefits of this strategy, our ability to develop and market new products, changes in legislation, legal claims, changes in exchange and interest rates, changes in tax rates, pension costs and actuarial assumptions, raw materials and employee costs, our ability to identify and complete successful acquisitions and to integrate those acquisitions into our business, our ability to successfully exit certain businesses or restructure our operations, the rate of technological changes, political, economic and other developments in countries where Philips operates, industry consolidation and competition. As a result, Philips‟ actual future results may differ materially from the plans, goals and expectations set forth in such forward-looking statements. For a discussion of factors that could cause future results to differ from such forward-looking statements, see the Risk management chapter included in our Annual Report 2009 and the “Risk and uncertainties” section in our semi-annual financial report for the six months ended July 4, 2010.
Third-party market share dataStatements regarding market share, including those regarding Philips‟ competitive position, contained in this document are based on outside sources such as research institutes, industry and dealer panels in combination with management estimates. Where information is not yet available to Philips, those statements may also be based on estimates and projections prepared by outside sources or management. Rankings are based on sales unless otherwise stated.
Use of non-GAAP InformationIn presenting and discussing the Philips Group‟s financial position, operating results and cash flows, management uses certain non-GAAP financial measures. These non-GAAP financial measures should not be viewed in isolation as alternatives to the equivalent IFRS measures and should be used in conjunction with the most directly comparable IFRS measures. A reconciliation of such measures to the most directly comparable IFRS measures is contained in this document. Further information on non-GAAP measures can be found in our Annual Report 2009.
Use of fair-value measurementsIn presenting the Philips Group‟s financial position, fair values are used for the measurement of various items in accordance with the applicable accounting standards. These fair values are based on market prices, where available, and are obtained from sources that are deemed to be reliable. Readers are cautioned that these values are subject to changes over time and are only valid at the balance sheet date. When quoted prices do not exist, we estimated the fair values using appropriate valuation models, and when observable market data are not available, we used unobservable inputs. They require management to make significant assumptions with respect to future developments, which are inherently uncertain and may therefore deviate from actual developments. Critical assumptions used are disclosed in our 2009 financial statements. Independent valuations may have been obtained to support management‟s determination of fair values.
All amounts in millions of euro‟s unless otherwise stated; data included are unaudited. Financial reporting is in accordance with IFRS, unless otherwise stated. This document comprises regulated information within the meaning of the Dutch Financial Markets Supervision Act „Wet op het Financieel Toezicht‟.
2

1.Philips Introduction
2. Vision 2015: Strategy and Investment Proposition
3. Group results Q4 2010 and annual results 2010
4. Healthcare, Consumer Lifestyle and Lighting
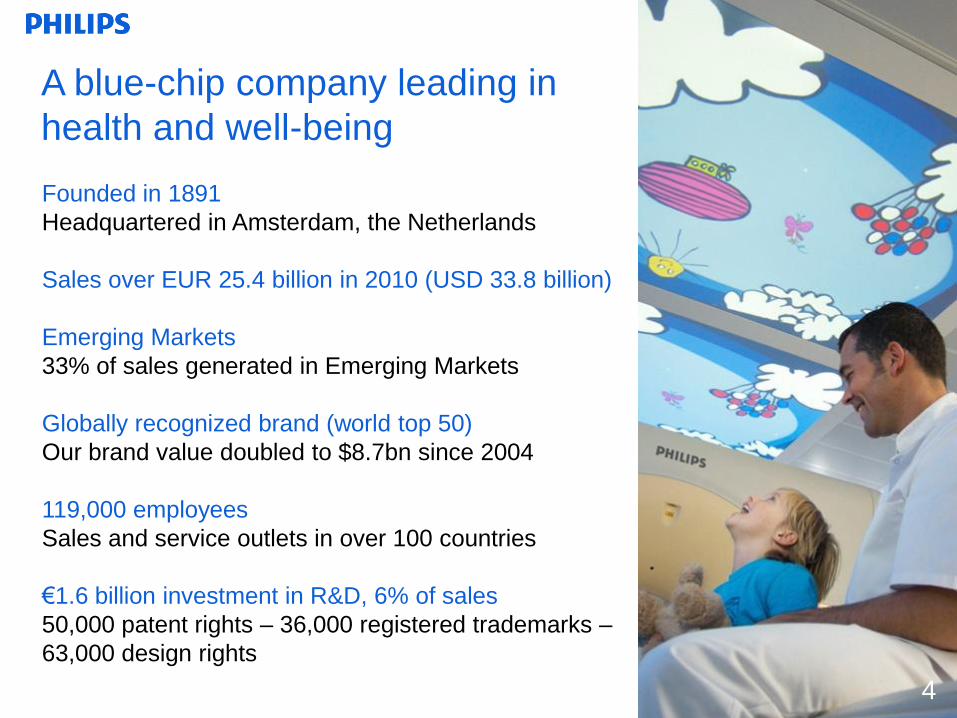
Founded in 1891
Headquartered in Amsterdam, the Netherlands
Sales over EUR 25.4 billion in 2010 (USD 33.8 billion)
Emerging Markets
33% of sales generated in Emerging Markets
Globally recognized brand (world top 50)
Our brand value doubled to $8.7bn since 2004
119,000 employees
Sales and service outlets in over 100 countries
€1.6 billion investment in R&D, 6% of sales
50,000 patent rights – 36,000 registered trademarks –
63,000 design rights
A blue-chip company leading in
health and well-being
4
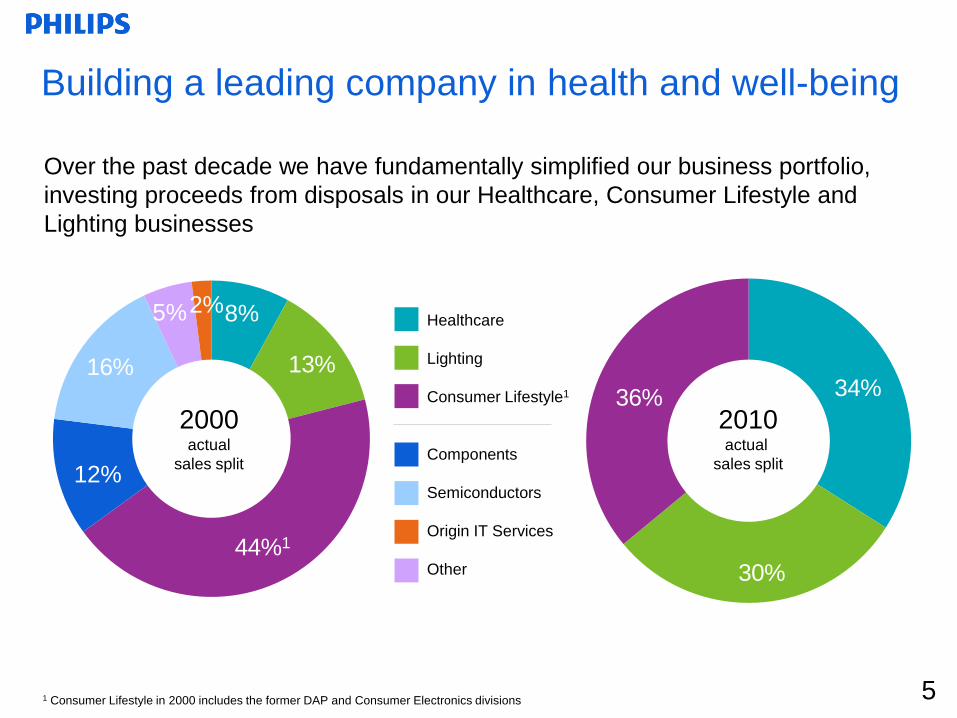
16% 13%
44%1
36% 34%
30%
Healthcare
Lighting
Consumer Lifestyle1
Components
Semiconductors
Origin IT Services
Other
Building a leading company in health and well-being
5
Over the past decade we have fundamentally simplified our business portfolio,
investing proceeds from disposals in our Healthcare, Consumer Lifestyle and
Lighting businesses
8%
12%
5%2%
2000actual
sales split
1 Consumer Lifestyle in 2000 includes the former DAP and Consumer Electronics divisions
2010actual
sales split
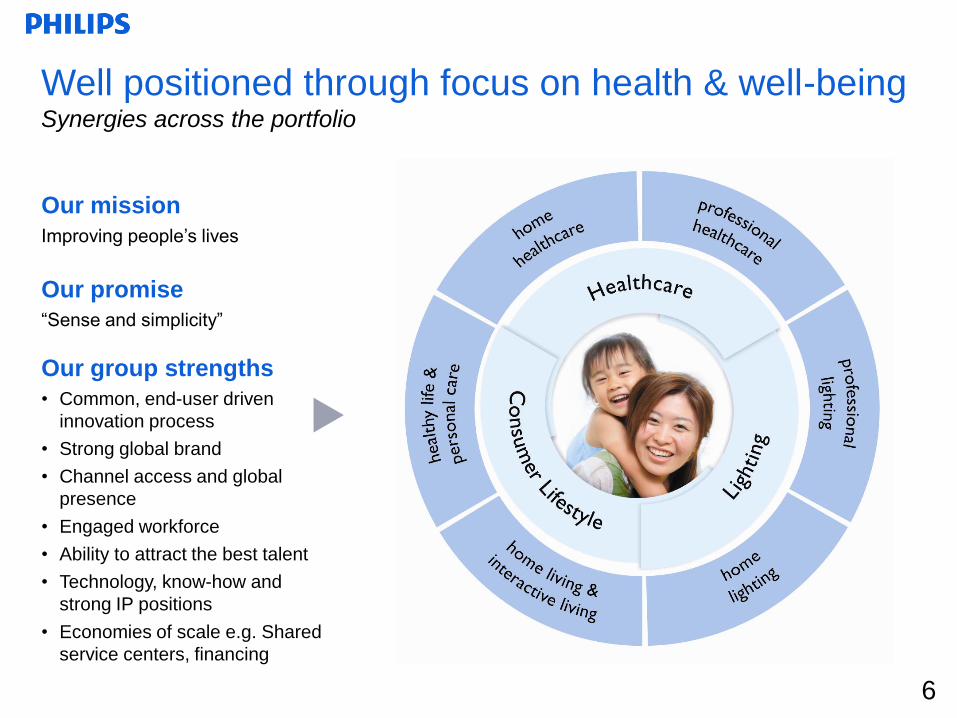
Well positioned through focus on health & well-being Synergies across the portfolio
6
Our mission
Improving people‟s lives
Our promise
“Sense and simplicity”
Our group strengths
• Common, end-user driven
innovation process
• Strong global brand
• Channel access and global
presence
• Engaged workforce
• Ability to attract the best talent
• Technology, know-how and
strong IP positions
• Economies of scale e.g. Shared
service centers, financing

Innovation process
We follow a rigorous process to create
meaningful innovations
Driving customer loyalty
We build customer loyalty to promote growth
and profitability
Creating brand value
Driven by our brand promise “sense and simplicity”
Philips people
We develop highly engaged “Philips people”
Emerging markets
We keep on expanding our global footprint
Our competitive difference will
make us win
7
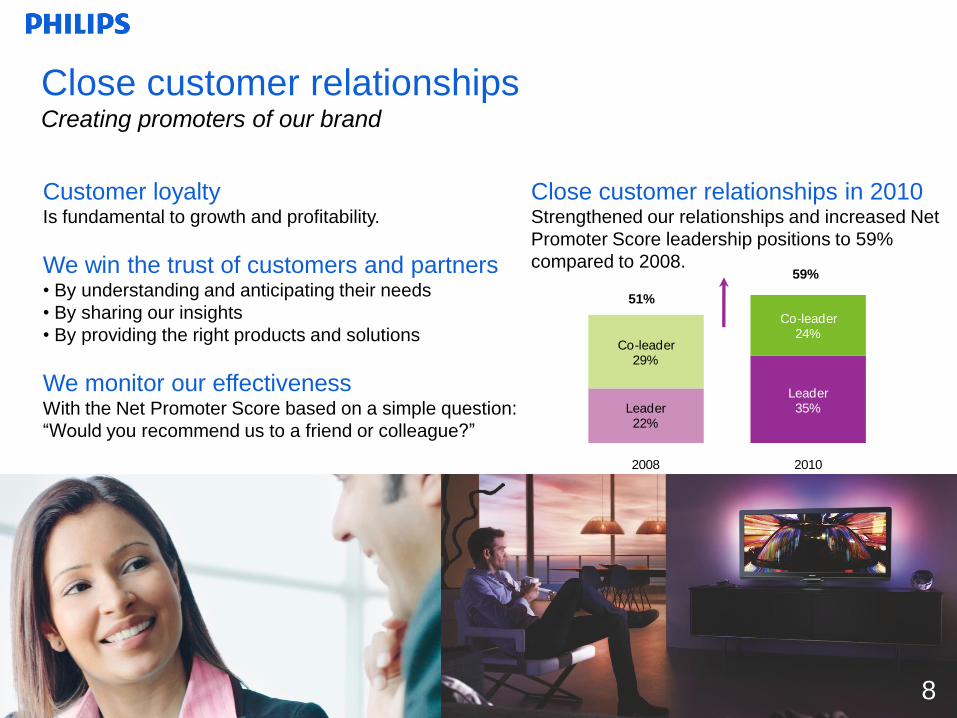
Leader22%
Leader35%
Co-leader29%
Co-leader24%
2008 2010
Close customer relationshipsCreating promoters of our brand
Customer loyaltyIs fundamental to growth and profitability.
We win the trust of customers and partners• By understanding and anticipating their needs
• By sharing our insights
• By providing the right products and solutions
We monitor our effectivenessWith the Net Promoter Score based on a simple question:
“Would you recommend us to a friend or colleague?”
8
51%
59%
Close customer relationships in 2010Strengthened our relationships and increased Net
Promoter Score leadership positions to 59%
compared to 2008.

4.4
5.96.7
7.78.3 8.1
8.7
2004 2005 2006 2007 2008 2009 2010
A strong brand drives salesA significant amount of sales is attributable to
the brand alone:
• Healthcare 29%
• Consumer Lifestyle 24%
• Lighting 21%
High brand value1 growthWith a 7% brand value increase in 2010, Philips
outpaced the average increase of 4% shown by
other brands
Strong internal brand82% of employees are “proud to work for Philips”
Brand campaign 2010Developing thought leadership in health and
well-being and making our trusted brand promise
of „sense and simplicity‟ meaningful in this area
The world‟s 42nd most valuable brand in 2010Brand value doubled since 2004
Value of the Philips brand1
USD billions
1 Source: Interbrand Brand Valuation 20109
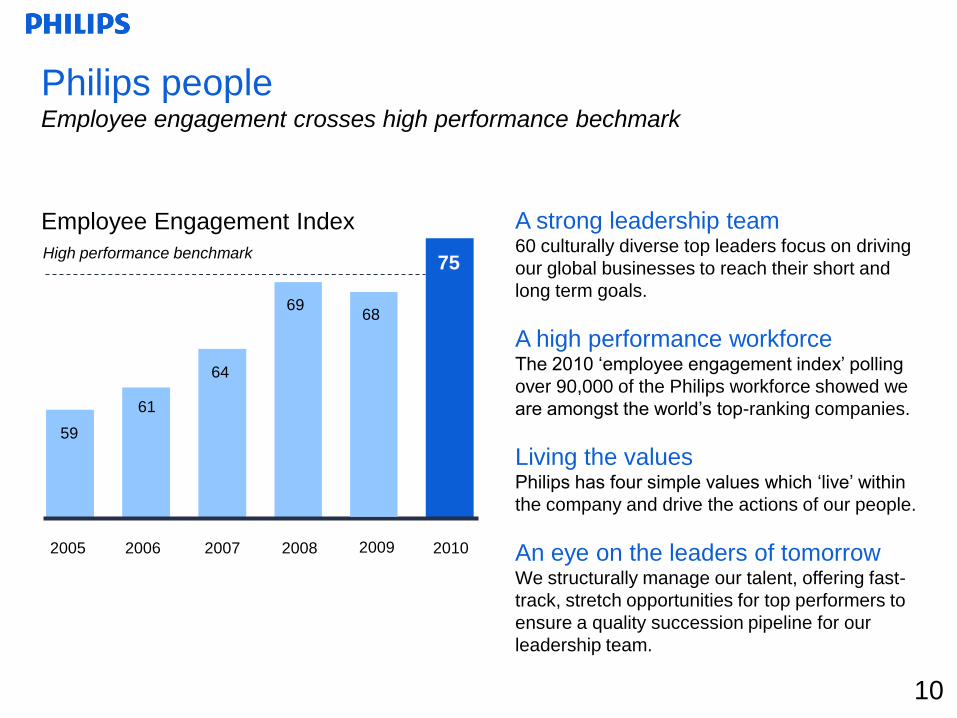
Philips peopleEmployee engagement crosses high performance bechmark
A strong leadership team60 culturally diverse top leaders focus on driving
our global businesses to reach their short and
long term goals.
A high performance workforceThe 2010 „employee engagement index‟ polling
over 90,000 of the Philips workforce showed we
are amongst the world‟s top-ranking companies.
Living the valuesPhilips has four simple values which „live‟ within
the company and drive the actions of our people.
An eye on the leaders of tomorrowWe structurally manage our talent, offering fast-
track, stretch opportunities for top performers to
ensure a quality succession pipeline for our
leadership team.
10
2010
75
69
64
61
59
2005 2006 2007 2008
High performance benchmark
Employee Engagement Index
68
2009

A strong position in emerging marketsRepresents a significant and growing part of our global footprint
111 Source: Consumer Heart BEAT brand equity study 2010
Emerging markets represent 33%
of sales Vision 2015 target of at least 40% by 2015
High corporate brand equity1
Consistently among the top-ranking players:
India: top 10%, China: top 10%,
Russia: top 40%, Brazil: top 10%
Championing growth with
dedicated strategiesBased on local market insights, supported by
increased marketing investments.
Increasing our footprint• Sales supported by an increase in branded
lighting shops in EM‟s to over 200 in China alone
• Construction of healthcare R&D facility for
Cardiovascular X-ray equipment India
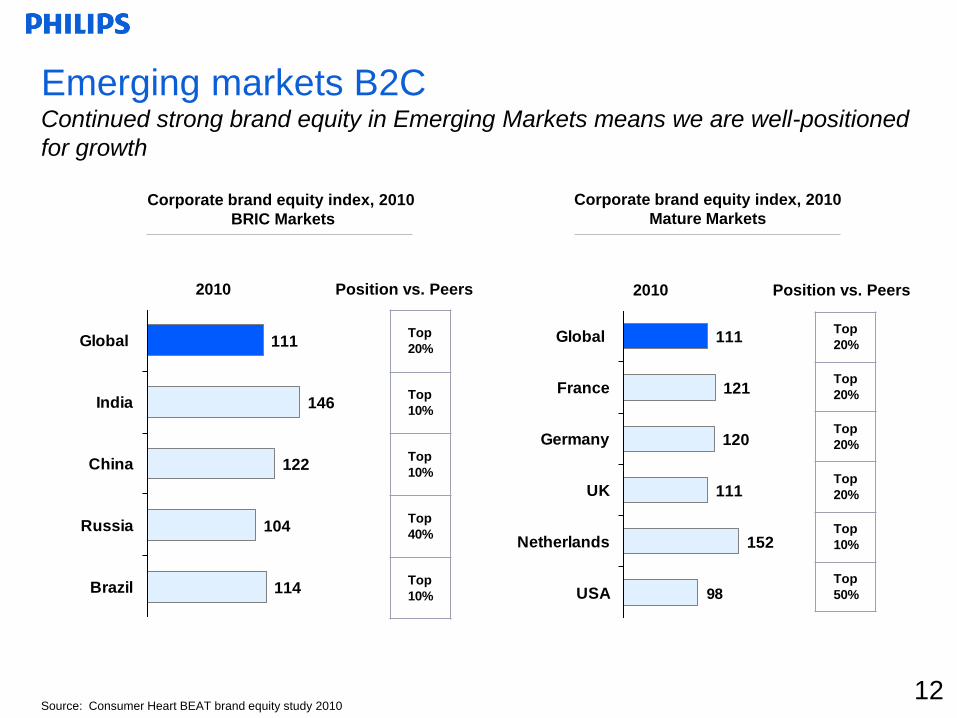
111
146
122
104
114
Global
India
China
Russia
Brazil
Top
20%
Top
10%
Top
10%
Top
40%
Top
10%
111
121
120
111
152
98
Global
France
Germany
UK
Netherlands
USA
Top
20%
Top
20%
Top
20%
Top
20%
Top
10%
Top
50%
Corporate brand equity index, 2010
BRIC Markets
2010 Position vs. Peers 2010 Position vs. Peers
Corporate brand equity index, 2010
Mature Markets
Source: Consumer Heart BEAT brand equity study 2010
Emerging markets B2CContinued strong brand equity in Emerging Markets means we are well-positioned
for growth
12

13
Sustainability as a driver for growth
Success of EcoVision4Our Green Product sales represented around 30%
of sales in 2009, 3 years ahead of our 2012 target.
And we will complete our 2012 goal of cumulative
EUR 1 billion of Green Investment in 2010.
Launch of our EcoVision5 program A clear example of how we continue to drive
business growth through Sustainability is the
launch of our EcoVision5 program in 2010.
Targets for the period 2010 – 2015• To bring care to 500 million people
• To improve the energy efficiency of our overall
portfolio by 50%
• To double the amount of recycled materials in
our products as well as to double the collection
and recycling of Philips products
1. Philips Introduction
2.Vision 2015: Strategy and Investment
Proposition
3. Group results Q4 2010 and annual results 2010
4. Healthcare, Consumer Lifestyle and Lighting
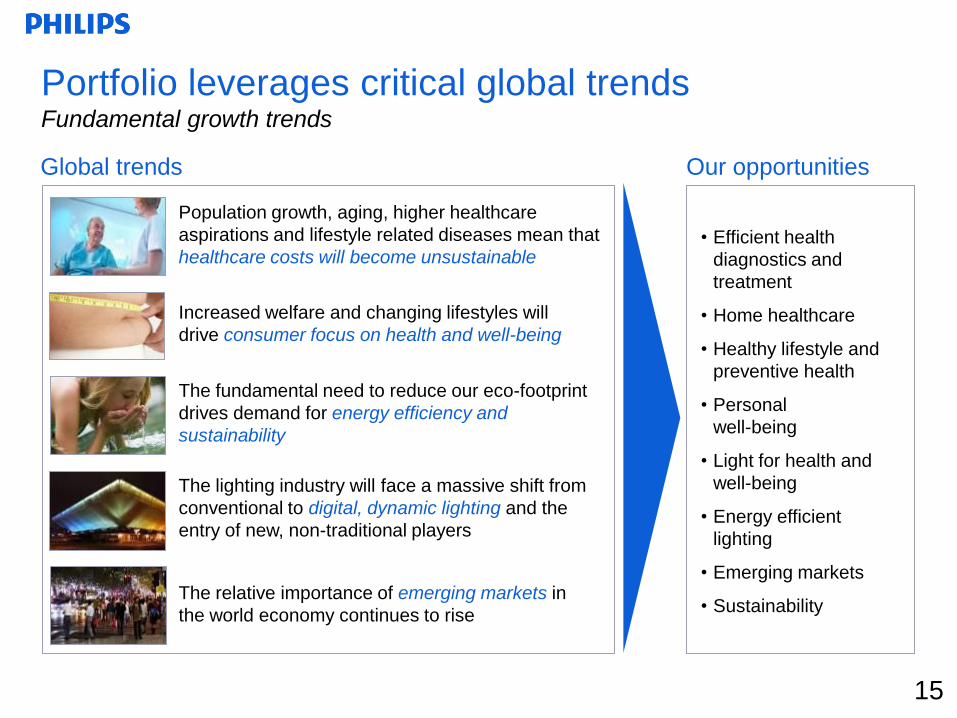
Portfolio leverages critical global trendsFundamental growth trends
Global trends
• Efficient health
diagnostics and
treatment
• Home healthcare
• Healthy lifestyle and
preventive health
• Personal
well-being
• Light for health and
well-being
• Energy efficient
lighting
• Emerging markets
• Sustainability
Our opportunities
The relative importance of emerging markets in
the world economy continues to rise
Population growth, aging, higher healthcare
aspirations and lifestyle related diseases mean that
healthcare costs will become unsustainable
The lighting industry will face a massive shift from
conventional to digital, dynamic lighting and the
entry of new, non-traditional players
Increased welfare and changing lifestyles will
drive consumer focus on health and well-being
The fundamental need to reduce our eco-footprint
drives demand for energy efficiency and
sustainability
15
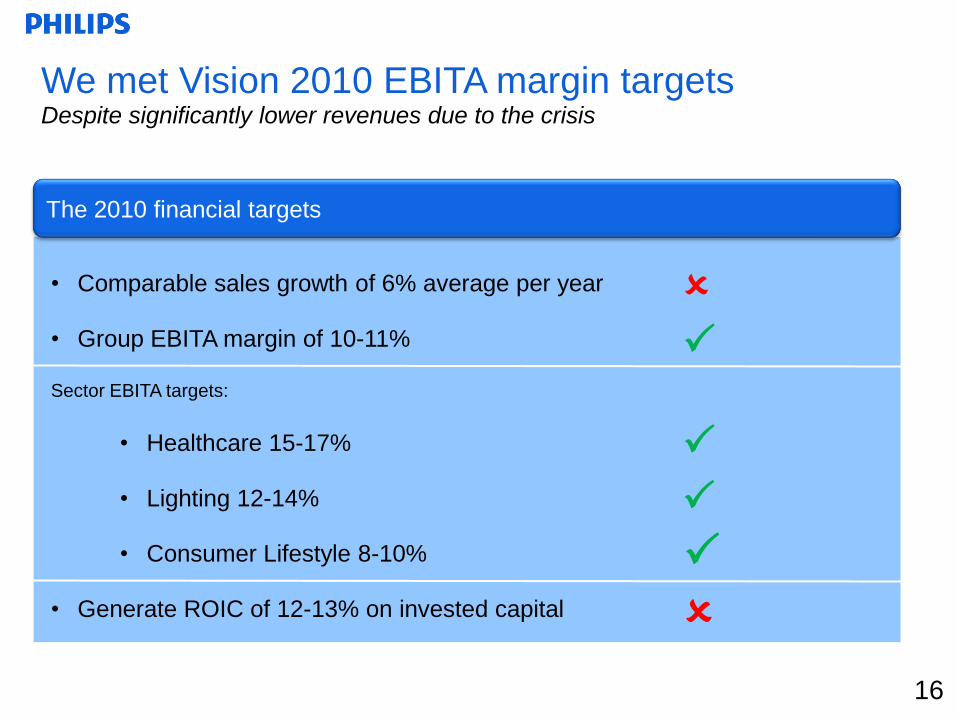
We met Vision 2010 EBITA margin targets Despite significantly lower revenues due to the crisis
• Comparable sales growth of 6% average per year
• Group EBITA margin of 10-11%
Sector EBITA targets:
• Healthcare 15-17%
• Lighting 12-14%
• Consumer Lifestyle 8-10%
• Generate ROIC of 12-13% on invested capital
The 2010 financial targets
16

Our ROIC is on the right trajectory after significant M&AROIC at 11.7% in Q4 2010
17
Notes:
EBIAT are earnings before interest after tax
Philips calculates ROIC % as: EBIAT/ NOC
Quarterly ROIC % is based on LTM EBIAT and average NOC over the last 5 quarters
Reported tax used to calculate EBIAT
• Early 2008 we doubled our asset
base, as we invested in growing our
home healthcare business with the
acquisition of Respironics and
strengthened our global leadership in
professional luminaires with the
acquisition of Genlyte
• Late 2008 and 2009 the crisis had a
severe impact on our revenues and
Earnings Before Interest and After
Tax (EBIAT), which caused our ROIC
to deteriorate sharply
• In 2010 we emerged as a structurally
stronger company with significantly
higher profitability levels, our ROIC is
now 3.6% above the WACC rate
Development of Return on Invested Capitalin billions of euro
WACC rate at 8.1%
in percentage
Significant acquisitions
ROIC
-4.0%
-2.0%
0.0%
2.0%
4.0%
6.0%
8.0%
10.0%
12.0%
14.0%
Q1 Q2 Q3 Q4 Q1 Q2 Q3 Q4 Q1 Q2 Q3 Q4
2008 2009 2010
6
5
4
3
2
1
0
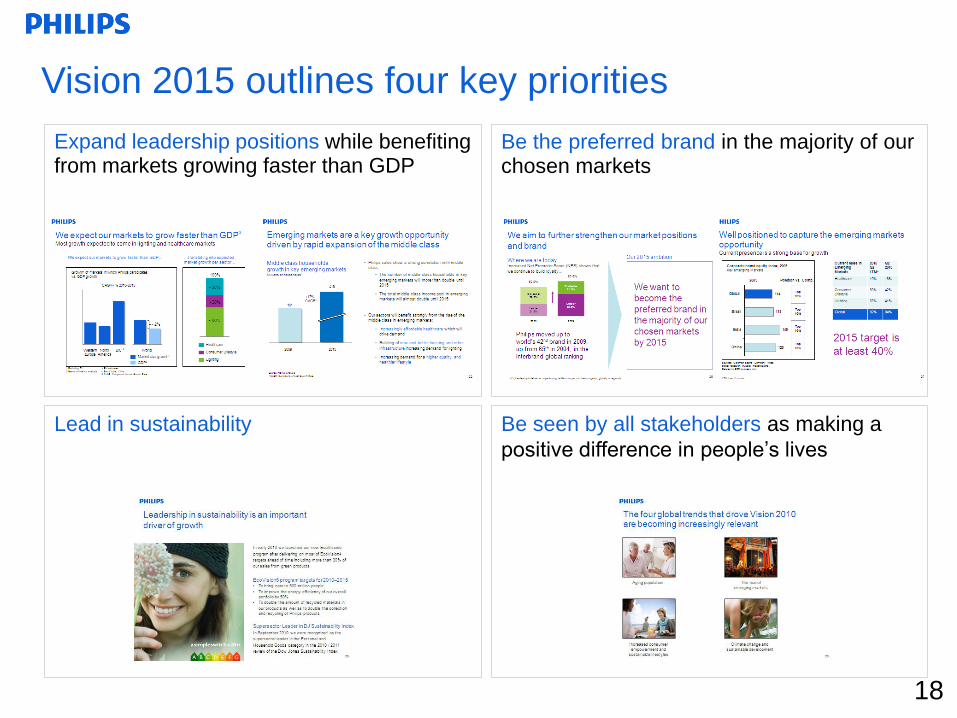
Vision 2015 outlines four key priorities
Expand leadership positions while benefiting from markets growing faster than GDP
Lead in sustainability
Be the preferred brand in the majority of our chosen markets
Be seen by all stakeholders as making a
positive difference in people‟s lives
18
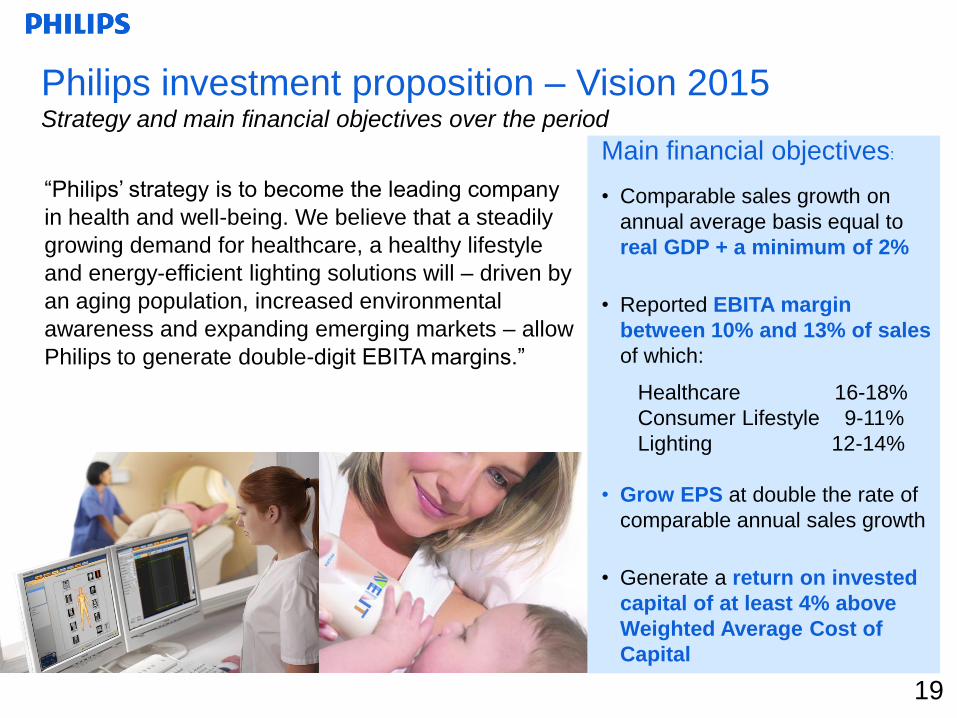
Main financial objectives:
• Comparable sales growth on
annual average basis equal to
real GDP + a minimum of 2%
• Reported EBITA margin
between 10% and 13% of sales
of which:
Healthcare 16-18%
Consumer Lifestyle 9-11%
Lighting 12-14%
• Grow EPS at double the rate of
comparable annual sales growth
• Generate a return on invested
capital of at least 4% above
Weighted Average Cost of
Capital
“Philips‟ strategy is to become the leading company
in health and well-being. We believe that a steadily
growing demand for healthcare, a healthy lifestyle
and energy-efficient lighting solutions will – driven by
an aging population, increased environmental
awareness and expanding emerging markets – allow
Philips to generate double-digit EBITA margins.”
Philips investment proposition – Vision 2015Strategy and main financial objectives over the period
19
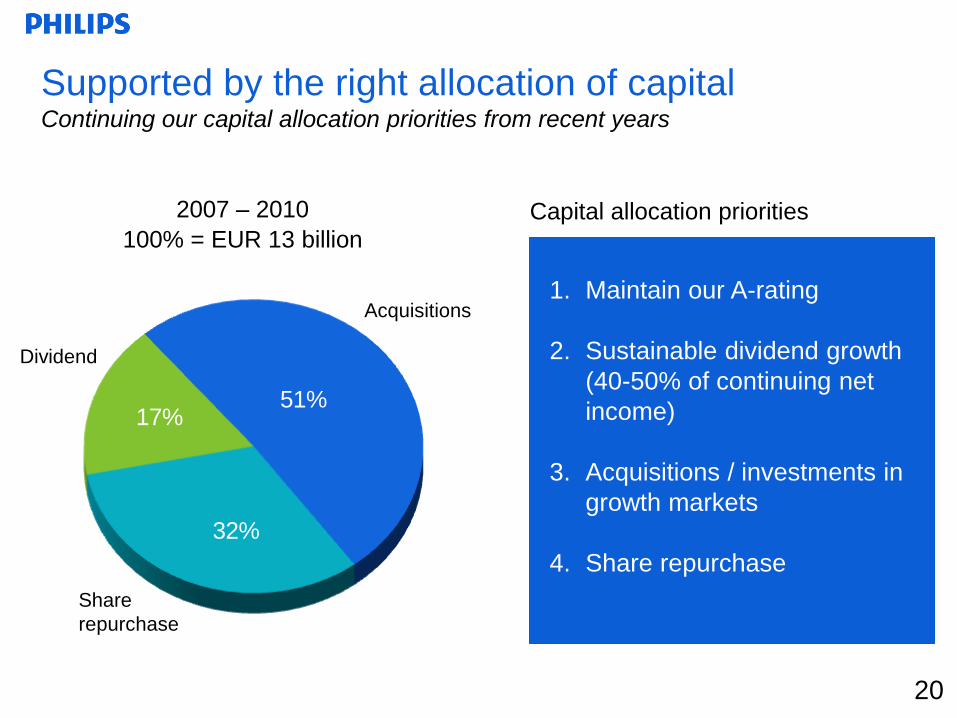
51%
32%
17%
Supported by the right allocation of capitalContinuing our capital allocation priorities from recent years
20
Acquisitions
2007 – 2010
100% = EUR 13 billion
Dividend
Share
repurchase
Capital allocation priorities
1. Maintain our A-rating
2. Sustainable dividend growth
(40-50% of continuing net
income)
3. Acquisitions / investments in
growth markets
4. Share repurchase
1. Philips Introduction
2. Vision 2015: Strategy and Investment Proposition
3.Group results Q4 2010 and annual
results 2010
4. Healthcare, Consumer Lifestyle and Lighting

22
Headlines in Quarter 4
Net income of EUR 465 million, an increase of EUR 205 million
compared to Q4 2009
EBITA of EUR 873 million at 11.8% of sales in the quarter
Nominal sales of EUR 7.4 billion, 2% higher year-on-year
Comparable sales declined 4%, primarily reflecting weak consumer
demand in Western Europe
Emerging market sales increased from 31% to 33% of Group sales
Strong cash flow of EUR 1.3 billion
Proposed dividend increased to EUR 0.75 per share
22

2323
Key Financials Summary – Q4 2010 and FY 2010EUR million
Q4 2009 Q4 2010 FY 2009 FY 2010
Sales 7,263 7,392 23,189 25,419
EBITA 662 873 1,050 2,552
Financial income and expenses (78) (63) (166) (122)
Income tax (230) (224) (100) (509)
Net income (loss) 260 465 424 1,452
Net Operating Capital 12,649 12,071 12,649 12,071
Net cash from operating activities 935 1,558 1,545 2,156
Net capital expenditures (209) (222) (682) (823)
Free cash flow 726 1,336 863 1,333
1 1 2 2
1 - 4Q10 includes on balance EUR 33M of gains and charges while 4Q09 included in total EUR (233)M gains and charges
2 - 2010 includes on balance EUR (114)M of gains and charges while 2009 included in total EUR (424)M gains and charges

2424
Sales by sector – Q4 2010EUR million
Q4 2009 Q4 2010 Comp currency portfolio Nom
Healthcare 2,405 2,642 2 8.7 (0.3) 10
Consumer Lifestyle 2,903 2,687 (11) 4.4 (0.9) (7)
Lighting 1,846 1,975 - 6.9 0.4 7
GM&S 109 88 (20) 1.1 - (19)
Group sales 7,263 7,392 (4) 6.3 (0.4) 2
Sales growth composition (in %)
1 Comparable growth Philips Group excluding television is (2)%
1
2525
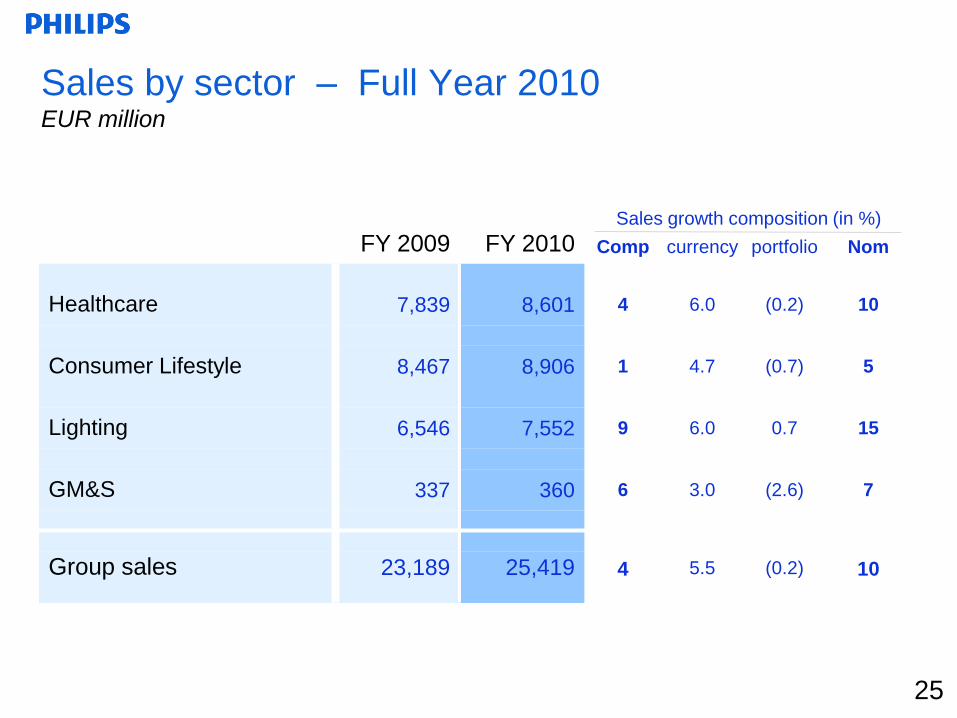
Sales by sector – Full Year 2010EUR million
FY 2009 FY 2010 Comp currency portfolio Nom
Healthcare 7,839 8,601 4 6.0 (0.2) 10
Consumer Lifestyle 8,467 8,906 1 4.7 (0.7) 5
Lighting 6,546 7,552 9 6.0 0.7 15
GM&S 337 360 6 3.0 (2.6) 7
Group sales 23,189 25,419 4 5.5 (0.2) 10
Sales growth composition (in %)
-30
-20
-10
0
10
20
2008 2009 2010 2008 2009 2010 2008 2009 2010 2008 2009 2010
-10
-5
0
5
10
15
20
25
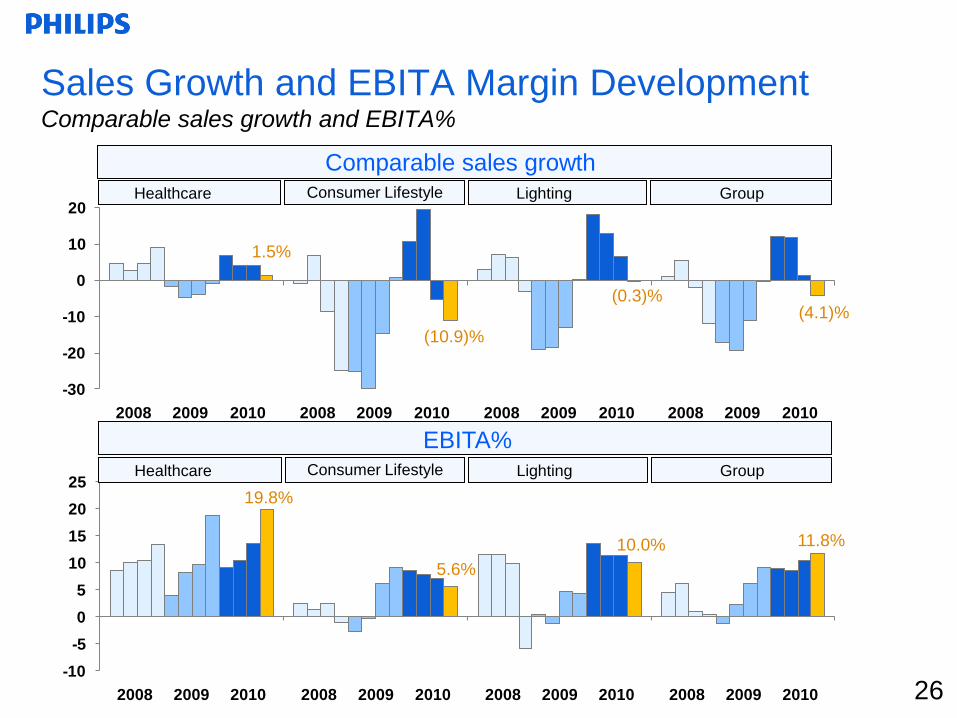
2008 2009 2010 2008 2009 2010 2008 2009 2010 2008 2009 2010 26
Healthcare Consumer Lifestyle Lighting Group
Sales Growth and EBITA Margin Development Comparable sales growth and EBITA%
26
Comparable sales growth
EBITA%
19.8%
5.6%
10.0% 11.8%
Healthcare Consumer Lifestyle Lighting Group
1.5%
(10.9)%
(0.3)%(4.1)%
2727
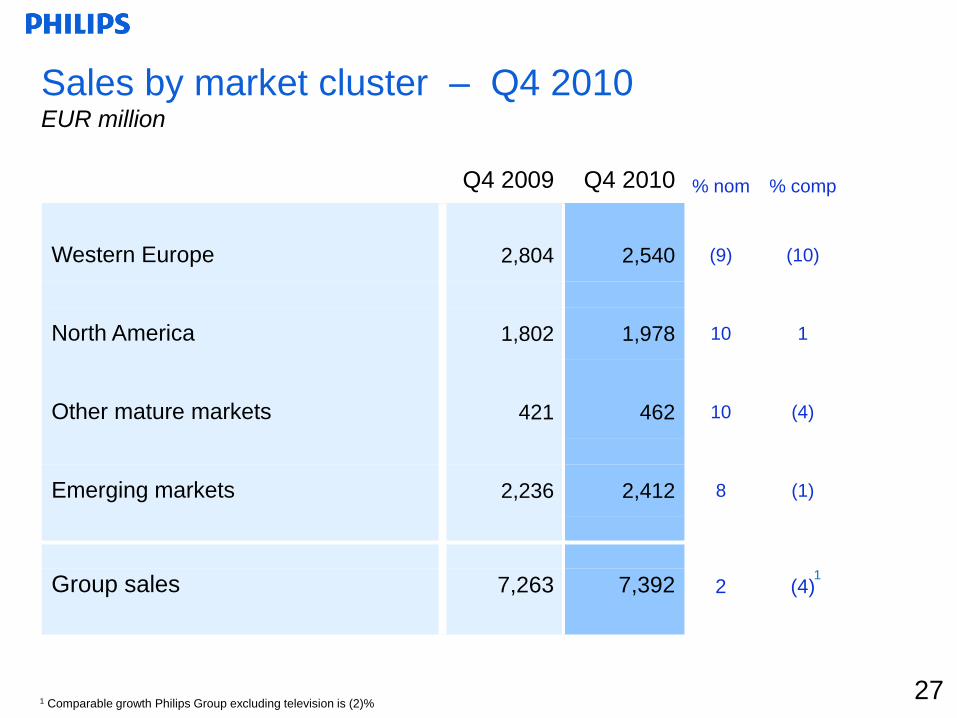
Sales by market cluster – Q4 2010EUR million
Q4 2009 Q4 2010 % nom % comp
Western Europe 2,804 2,540 (9) (10)
North America 1,802 1,978 10 1
Other mature markets 421 462 10 (4)
Emerging markets 2,236 2,412 8 (1)
Group sales 7,263 7,392 2 (4)
1 Comparable growth Philips Group excluding television is (2)%
1

0
5
10
15
20
25
30
35
40
45
2008 2009 2010 2008 2009 2010 2008 2009 2010 2008 2009 2010
-35
-25
-15
-5
5
15
25
35
45
2008 2009 2010 2008 2009 2010 2008 2009 2010 2008 2009 2010
Healthcare Consumer Lifestyle Lighting Group
Emerging Markets Sales: trend through Q4 2010 Sales growth in emerging markets
Sales in Emerging markets as percentage of sector sales
Comparable sales growth in Emerging markets
8%
(9)%
2%
(1)%
Healthcare Consumer Lifestyle Lighting Group
24%
38% 37%33%
281 Q4 2010 comparable Philips Group sales in emerging markets excluding TV is +3%, excluding TV and Brazil +7%
1
18%
34%38%
20%
38%41%
29
Emerging Markets – FY 2009 & FY 2010Sales in emerging markets
29
2009
2010
HealthcareConsumerLifestyle Lighting Philips Group
Mature
70%
Emerging
30%
Mature
67%
Emerging
33%
3030
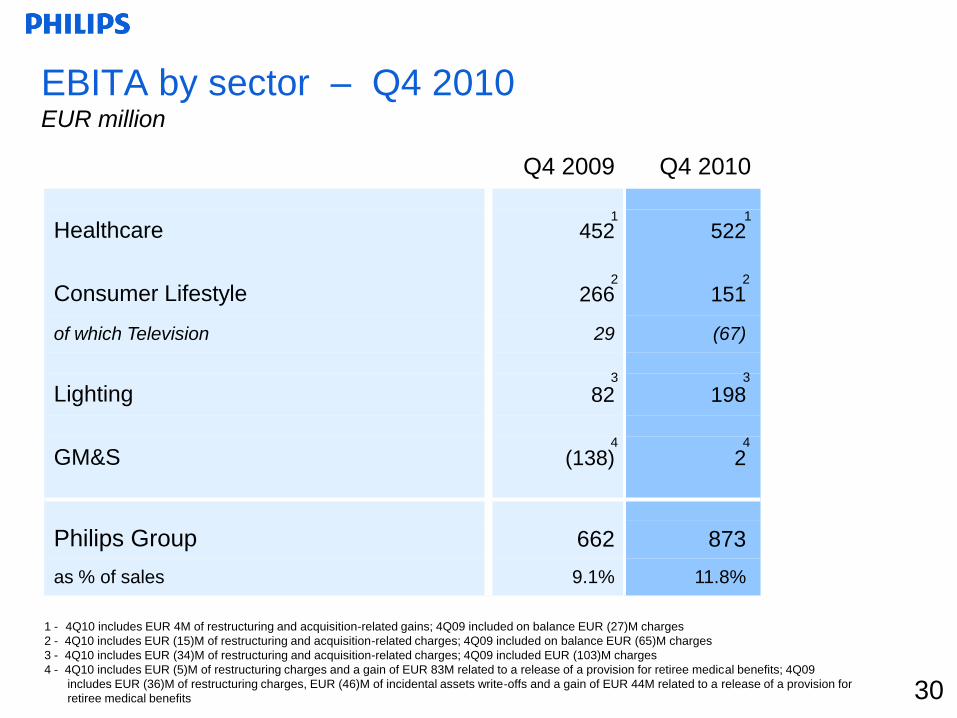
1 - 4Q10 includes EUR 4M of restructuring and acquisition-related gains; 4Q09 included on balance EUR (27)M charges
2 - 4Q10 includes EUR (15)M of restructuring and acquisition-related charges; 4Q09 included on balance EUR (65)M charges
3 - 4Q10 includes EUR (34)M of restructuring and acquisition-related charges; 4Q09 included EUR (103)M charges
4 - 4Q10 includes EUR (5)M of restructuring charges and a gain of EUR 83M related to a release of a provision for retiree medical benefits; 4Q09
includes EUR (36)M of restructuring charges, EUR (46)M of incidental assets write-offs and a gain of EUR 44M related to a release of a provision for
retiree medical benefits
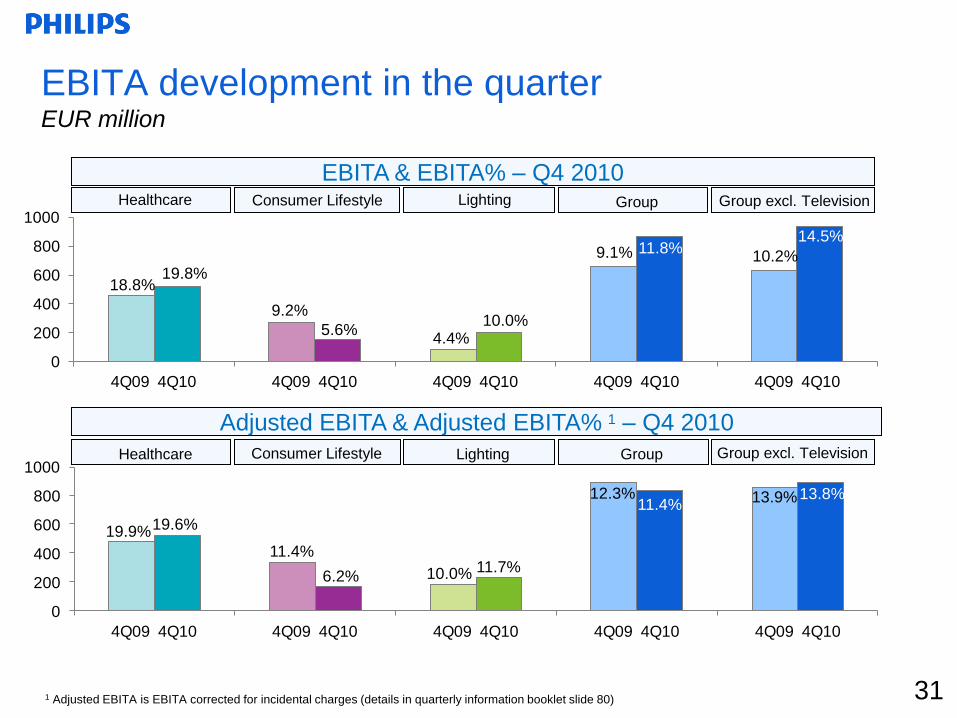
EBITA by sector – Q4 2010 EUR million
Q4 2009 Q4 2010
Healthcare 452 522
Consumer Lifestyle 266 151
of which Television 29 (67)
Lighting 82 198
GM&S (138) 2
Philips Group 662 873
as % of sales 9.1% 11.8%
1 1
2 2
3 3
4 4
0
200
400
600
800
1000
4Q09 4Q10 4Q09 4Q10 4Q09 4Q10 4Q09 4Q10 4Q09 4Q10
0
200
400
600
800
1000
4Q09 4Q10 4Q09 4Q10 4Q09 4Q10 4Q09 4Q10 4Q09 4Q10
11.8%
19.8%
5.6%10.0%
18.8%
4.4%
9.1%
Healthcare Consumer Lifestyle Lighting Group
9.2%
EBITA & EBITA% – Q4 2010
11.4%
19.6%
6.2%11.7%
19.9%
10.0%
12.3%
Healthcare Consumer Lifestyle Lighting Group
11.4%
Adjusted EBITA & Adjusted EBITA% 1 – Q4 2010
Group excl. Television
Group excl. Television
14.5%
10.2%
13.8%13.9%
EBITA development in the quarterEUR million
311 Adjusted EBITA is EBITA corrected for incidental charges (details in quarterly information booklet slide 80)

0
500
1000
1500
2000
2500
3000
2009 2010 2009 2010 2009 2010 2009 2010 2009 2010
0
500
1000
1500
2000
2500
3000
2009 2010 2009 2010 2009 2010 2009 2010 2009 2010
10.0%
13.8%
7.2%11.5%10.8%
2.2%
4.5%
Healthcare Consumer Lifestyle Lighting Group
4.0%
EBITA & EBITA% – FY 2010
10.5%
14.7%
7.9%12.8%12.2%
6.0%
6.4%
Healthcare Consumer Lifestyle Lighting Group
6.2%
Adjusted EBITA & Adjusted EBITA% 1 – FY 2010
Group excl. Television
Group excl. Television
12.0%
6.1%
12.4%
7.9%
Full year 2010 - EBITA development EUR million
321 Adjusted EBITA is EBITA corrected for incidental charges (details in quarterly information booklet slide 80)
-20%
-10%
0%
10%
20%
-10,000
-5,000
0
5,000
10,000
4Q08 1Q09 2Q09 3Q09 4Q09 1Q10 2Q10 3Q10 4Q10
0%
3%
6%
9%
12%
15%
0
750
1500
2250
3000
4Q08 1Q09 2Q09 3Q09 4Q09 1Q10 2Q10 3Q10 4Q10
Sales Comp. Sales Growth Adjusted EBITA%
Working capital Working capital as % of LTM sales
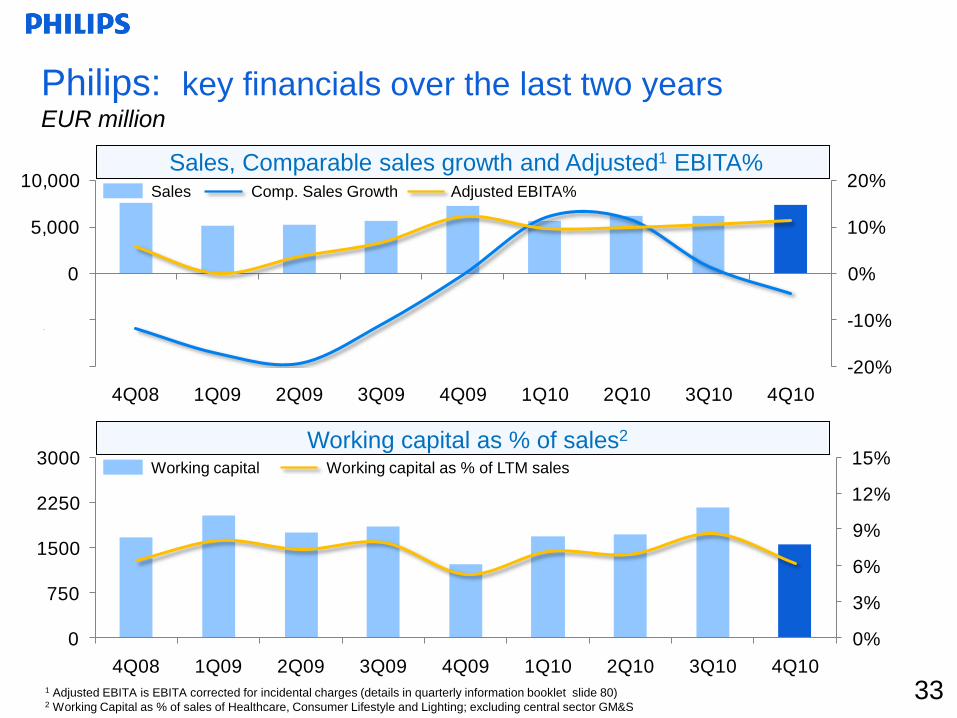
33331 Adjusted EBITA is EBITA corrected for incidental charges (details in quarterly information booklet slide 80)2 Working Capital as % of sales of Healthcare, Consumer Lifestyle and Lighting; excluding central sector GM&S
Philips: key financials over the last two yearsEUR million
Sales, Comparable sales growth and Adjusted1 EBITA%
Working capital as % of sales2

3434
Delivered on our fixed costs reduction program
1 These numbers exclude acquisition-related charges of EUR 130M for FY2008, EUR 101M for FY2009 and EUR 71M for FY20102 For 2009/ 2010 actual benefit realized per quarter see slide 81 34
RestructuringCost1 Cash out Benefit2
compared to 2008 baseline
EUR millionFY2008 FY2009 FY2010 FY2010 FY2009 FY2009 &
FY 2010
Healthcare (63) (42) (48) (24) 105 193
Consumer Lifestyle (198) (120) (42) (17) 200 294
Lighting (245) (225) (74) (112) 82 217
GM&S (31) (63) 2 (7) 31 37
TOTAL (537) (450) (162) (160) 418 741
In view of macro-economic developments, Philips accelerated their planned initiatives to further increase
organizational effectiveness and to lower fixed cost by streamlining operations and simplifying the structure.
Our restructuring plans announced since 2008 has lead to a reduction in our 2010 fixed cost base of EUR
741 million compared to the run rate in 2008.
3535
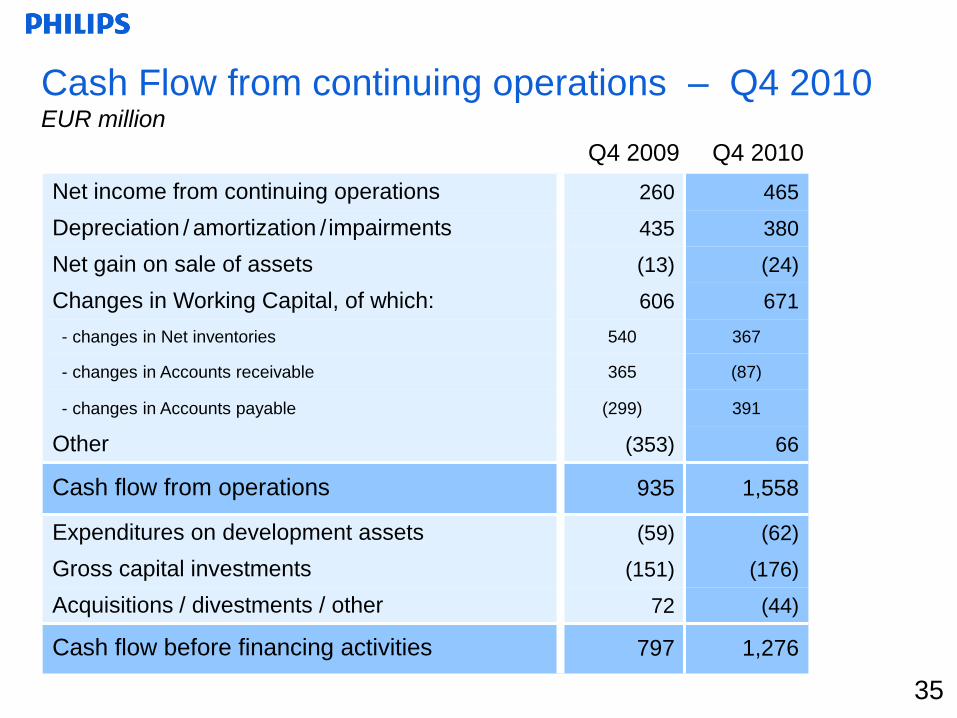
Q4 2009 Q4 2010
Net income from continuing operations 260 465
Depreciation / amortization / impairments 435 380
Net gain on sale of assets (13) (24)
Changes in Working Capital, of which: 606 671
- changes in Net inventories 540 367
- changes in Accounts receivable 365 (87)
- changes in Accounts payable (299) 391
Other (353) 66
Cash flow from operations 935 1,558
Expenditures on development assets (59) (62)
Gross capital investments (151) (176)
Acquisitions / divestments / other 72 (44)
Cash flow before financing activities 797 1,276
Cash Flow from continuing operations – Q4 2010 EUR million
0%
1%
2%
3%
4%
5%
6%
7%
8%
9%
10%
0
500
1000
1500
2000
2500
4Q08 1Q09 2Q09 3Q09 4Q09 1Q10 2Q10 3Q10 4Q10
36
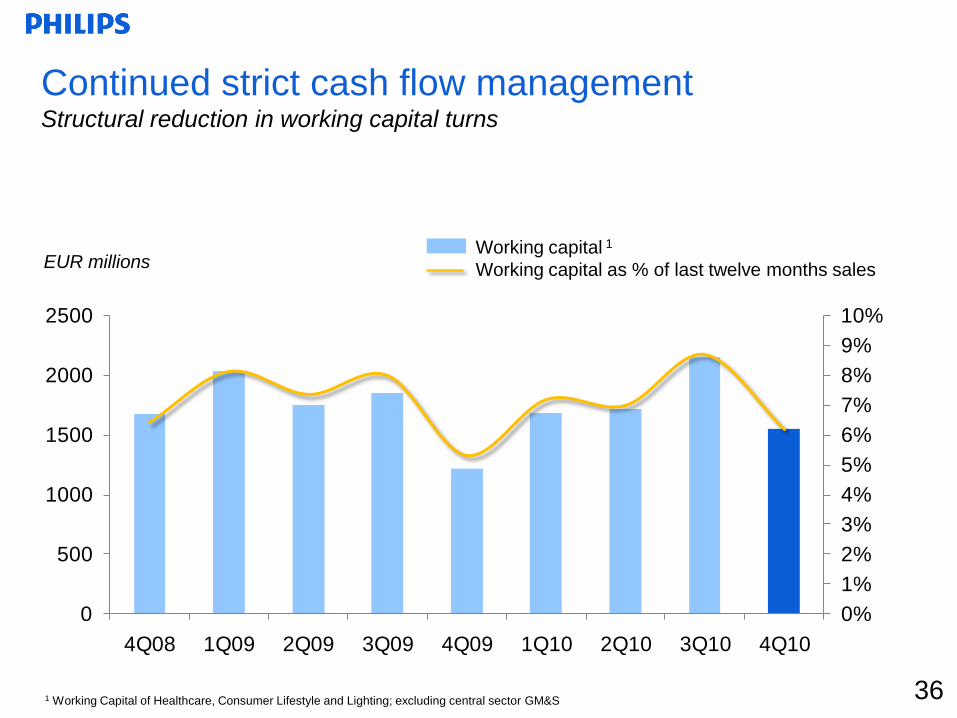
Continued strict cash flow management Structural reduction in working capital turns
EUR millions
361 Working Capital of Healthcare, Consumer Lifestyle and Lighting; excluding central sector GM&S
Working capital 1
Working capital as % of last twelve months sales
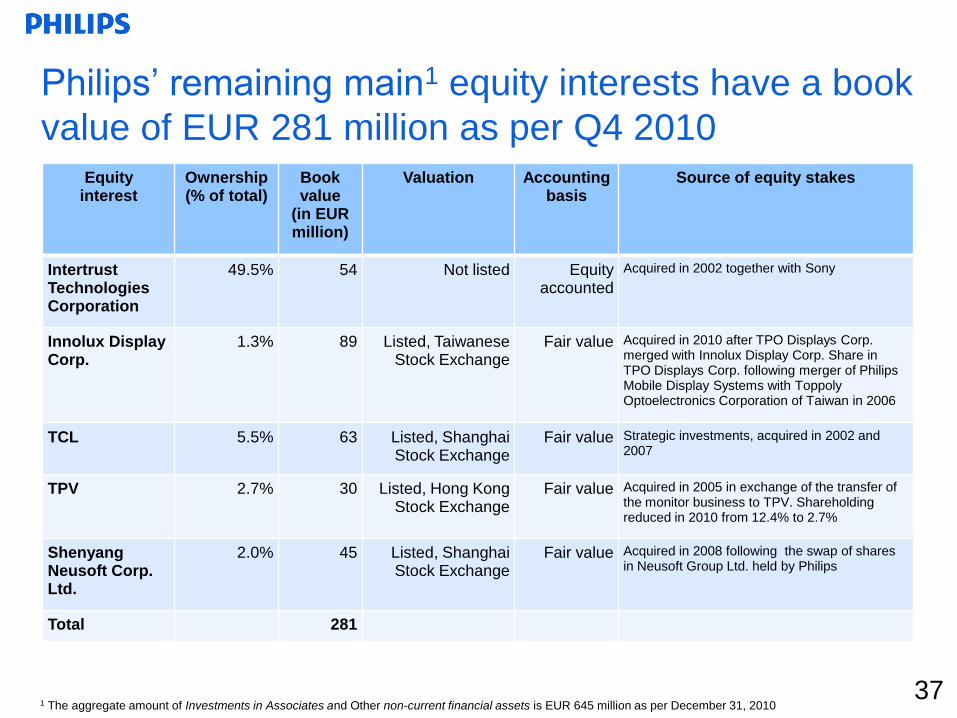
Philips‟ remaining main1 equity interests have a book
value of EUR 281 million as per Q4 2010Equity
interestOwnership(% of total)
Book value
(in EUR million)
Valuation Accounting basis
Source of equity stakes
Intertrust Technologies Corporation
49.5% 54 Not listed Equity accounted
Acquired in 2002 together with Sony
Innolux Display Corp.
1.3% 89 Listed, Taiwanese Stock Exchange
Fair value Acquired in 2010 after TPO Displays Corp. merged with Innolux Display Corp. Share in TPO Displays Corp. following merger of Philips Mobile Display Systems with Toppoly Optoelectronics Corporation of Taiwan in 2006
TCL 5.5% 63 Listed, Shanghai Stock Exchange
Fair value Strategic investments, acquired in 2002 and 2007
TPV 2.7% 30 Listed, Hong Kong Stock Exchange
Fair value Acquired in 2005 in exchange of the transfer of the monitor business to TPV. Shareholding reduced in 2010 from 12.4% to 2.7%
ShenyangNeusoft Corp. Ltd.
2.0% 45 Listed, Shanghai Stock Exchange
Fair value Acquired in 2008 following the swap of shares in Neusoft Group Ltd. held by Philips
Total 281
1 The aggregate amount of Investments in Associates and Other non-current financial assets is EUR 645 million as per December 31, 201037

0
500
1,000
1,500
2,000
2,500
3,000
2010 2011 2012 2013 2014 2015 2016 2017 2018 2021 2025 2026 2038
Philips' debt has a long maturity profile
1 Short term debt consists mainly of local credit facilities that are being rolled forward on a continuous basis. 38
Debt maturity profile as of December 2010Amounts in EUR millions
Characteristics of long-term debt
Maturities up to 2038
Average tenor of long-term debt is 9 years
No financial covenants
Long-term debt maturity < 12 months
Long –term debt
Short-term debt 1
Unutilized standby & other committed facilities

0.140.18 0.18
0.230.25
0.30
0.36 0.36 0.36 0.360.40
0.44
0.60
0.70 0.70 0.70
0.75
1995 1996 1997 1998 1999 2000 2001 2002 2003 2004 2005 2006 2007 2008 2009 2010 2011
39
A history of sustainable dividend growthEUR cents per share
39
“Our aim is to sustainably grow our dividend over time.
Philips‟ present dividend policy is based on an annual
pay-out ratio of 40 to 50% of continuing net income.”
1
1 Elective dividend, proposal subject to approval in the General Shareholders Meeting on March 31st, 2011
June 30, 2009 December 31, 2009 June 30, 2010(not reported)
December 31, 2010
Funded Status
Balance sheet position
Funded Status
Balance sheet position
Funded Status
Balance sheet position
Funded Status
Balance sheet position
NetherlandsPre-paid pension asset
1,5490
2,6581,497
1,9111,453
1,389 0
Other major plans (1,926) (1,711) (1,844) (2,263) (2,384) (1,258) (1,602)
Net balance sheet position major plans
(1,926) (347) (931) (1,602)
Funded status minor plans
(199) (197) (201) (203)
Net balance sheet position
(2,125) (544) (1,132) (1,809)
• The amount of pre-paid pension asset is the recognized amount of the surplus, an estimate of the net present value of future benefits (discounts/ refunds).
• Prepaid pension asset was zero in Q4, 2010 mainly due to the impact of the substantial longevity improvements (negative impact of approx. EUR 750 million) and the market movements in interest rates.
Philips Pensions Plans: Full Year UpdateEUR million
40
41
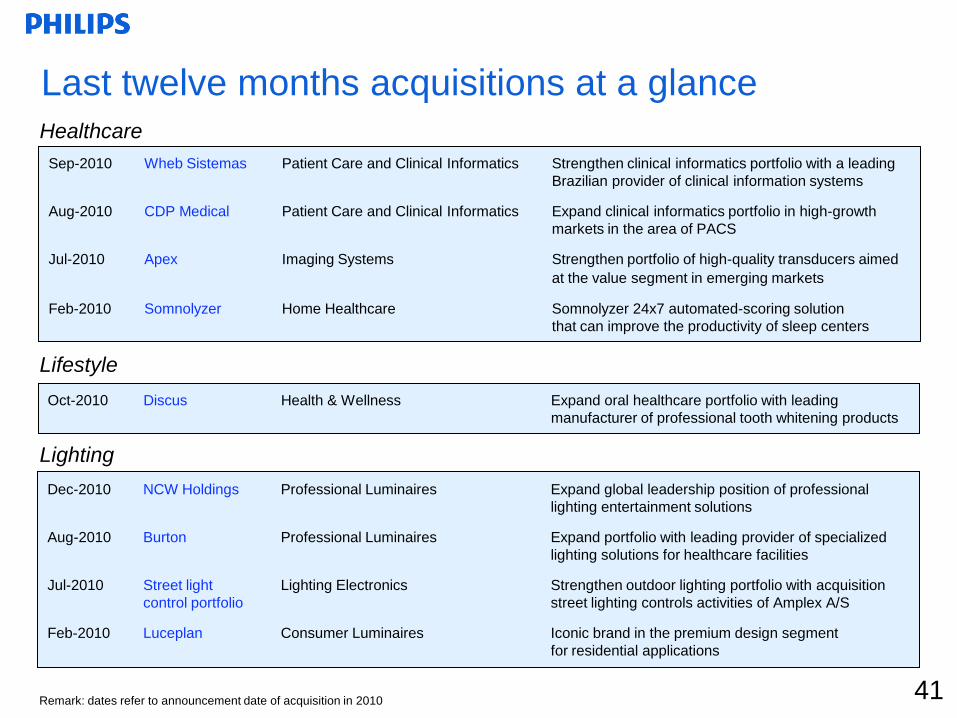
Oct-2010 Discus Health & Wellness Expand oral healthcare portfolio with leading
manufacturer of professional tooth whitening products
Dec-2010 NCW Holdings Professional Luminaires Expand global leadership position of professional
lighting entertainment solutions
Aug-2010 Burton Professional Luminaires Expand portfolio with leading provider of specialized
lighting solutions for healthcare facilities
Jul-2010 Street light Lighting Electronics Strengthen outdoor lighting portfolio with acquisition
control portfolio street lighting controls activities of Amplex A/S
Feb-2010 Luceplan Consumer Luminaires Iconic brand in the premium design segment
for residential applications
Sep-2010 Wheb Sistemas Patient Care and Clinical Informatics Strengthen clinical informatics portfolio with a leading
Brazilian provider of clinical information systems
Aug-2010 CDP Medical Patient Care and Clinical Informatics Expand clinical informatics portfolio in high-growth
markets in the area of PACS
Jul-2010 Apex Imaging Systems Strengthen portfolio of high-quality transducers aimed
at the value segment in emerging markets
Feb-2010 Somnolyzer Home Healthcare Somnolyzer 24x7 automated-scoring solution
that can improve the productivity of sleep centers
Last twelve months acquisitions at a glance
Remark: dates refer to announcement date of acquisition in 2010
Healthcare
Lifestyle
Lighting
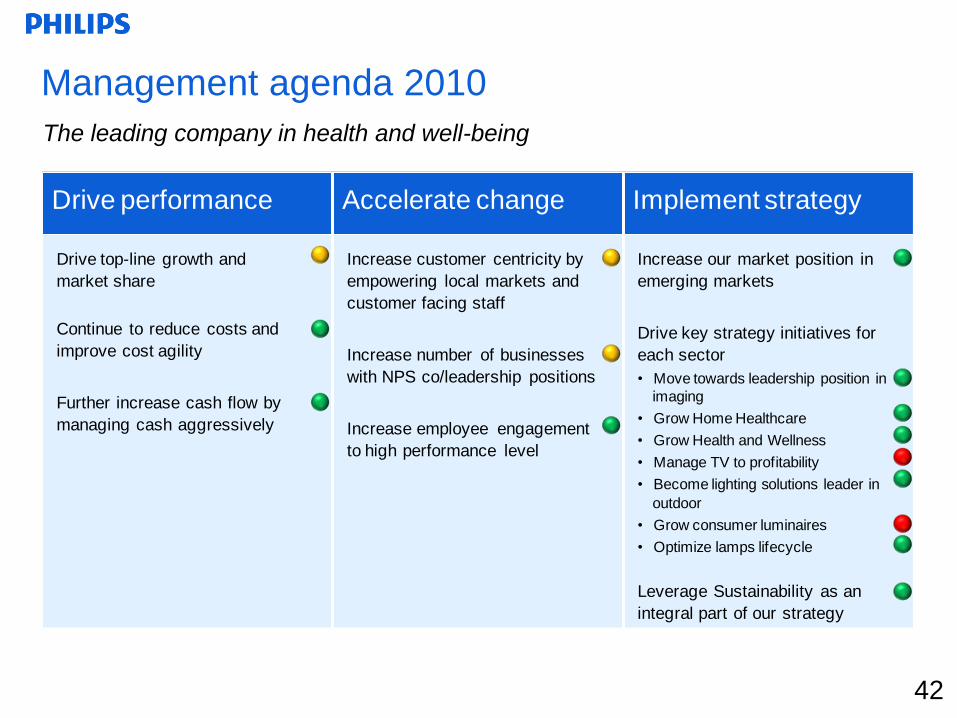
Drive performance Accelerate change Implement strategy
Drive top-line growth and
market share
Continue to reduce costs and
improve cost agility
Further increase cash flow by
managing cash aggressively
Increase customer centricity by
empowering local markets and
customer facing staff
Increase number of businesses
with NPS co/leadership positions
Increase employee engagement
to high performance level
Increase our market position in
emerging markets
Drive key strategy initiatives for
each sector
• Move towards leadership position in
imaging
• Grow Home Healthcare
• Grow Health and Wellness
• Manage TV to profitability
• Become lighting solutions leader in
outdoor
• Grow consumer luminaires
• Optimize lamps lifecycle
Leverage Sustainability as an
integral part of our strategy
42
Management agenda 2010
The leading company in health and well-being
42

Drive performance Improve capabilities Implement strategy
Make the turn to faster growth
and gain market share
Deliver on financial returns
Deliver on our Ecovision
sustainability commitments
Champion customer
responsiveness and adopt
culture of growth
Improve speed and execution
to market
“Resource to win” now to
ensure to achieve Vision 2015
Strengthen and grow in all
emerging markets - make
China a “home” market
Execute “must win” strategic
battles in key business-market
combinations
Pursue value-creating
acquisitions and invest in
growth to strengthen our
portfolio
43
Management agenda 2011
Accelerate growth to achieve Vision 2015
43
1. Philips Introduction
2. Vision 2015: Strategy and Investment Proposition
3. Group results Q4 2010 and annual results 2010
4.Healthcare, Consumer Lifestyle and
Lighting

45
Our focused health & well-being portfolio:
Healthcare, Consumer Lifestyle and LightingLast twelve months
Net Operating CapitalSales
100% = EUR 25.1B 1 100% = EUR 15.4B 1100% = EUR 2.9B 1, 2
Adjusted EBITA
Healthcare
Consumer
Lifestyle
Lighting
HealthcareConsumer
Lifestyle
Lighting
24%
33%
43%34%
30%
36%
58%
6%
36%
Consumer
Lifestyle
LightingHealthcare
1 Excluding Central sector (GM&S)2 EBITA adjustments based on the following charges; for Healthcare EUR 77M, for Consumer Lifestyle EUR 61M and for Lighting EUR 97M of
charges are excluded.45

14%
21%
26%39%
199966%
26%
8%
Imaging
Customer Service
Patient Care and
Clinical Informatics
Home Healthcare Solutions
Total sales EUR 2.5 billion
Total sales EUR 8.6 billion
The power of HealthcareFurther strengthening our global leadership
46
2010
Target margin 2010: 15-17%
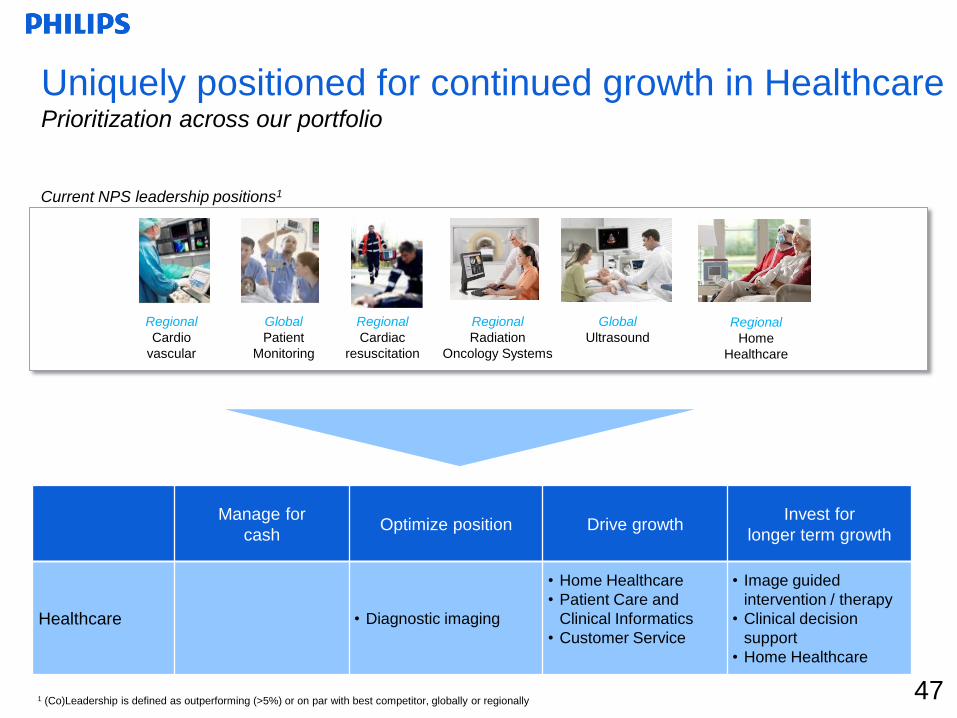
Uniquely positioned for continued growth in HealthcarePrioritization across our portfolio
Manage for
cashOptimize position Drive growth
Invest for
longer term growth
Healthcare • Diagnostic imaging
• Home Healthcare
• Patient Care and
Clinical Informatics
• Customer Service
• Image guided
intervention / therapy
• Clinical decision
support
• Home Healthcare
Regional
Cardio
vascular
Global
Patient
Monitoring
Regional
Radiation
Oncology Systems
Global
Ultrasound
Regional
Cardiac
resuscitation
Regional
Home
Healthcare
Current NPS leadership positions1
1 (Co)Leadership is defined as outperforming (>5%) or on par with best competitor, globally or regionally 47
48
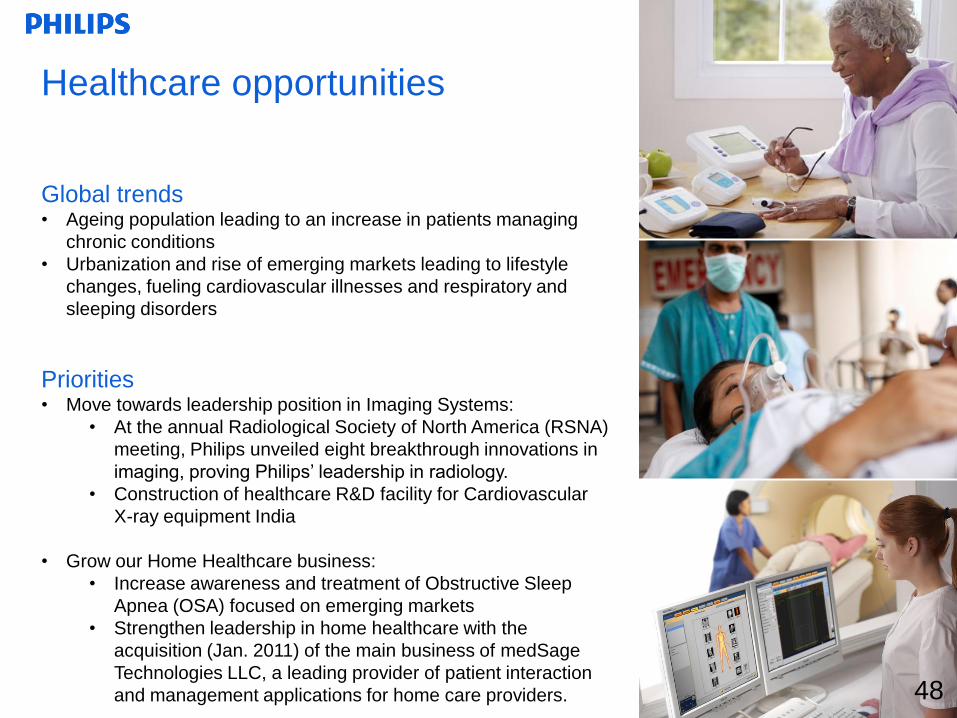
Healthcare opportunities
48
Global trends• Ageing population leading to an increase in patients managing
chronic conditions
• Urbanization and rise of emerging markets leading to lifestyle
changes, fueling cardiovascular illnesses and respiratory and
sleeping disorders
Priorities• Move towards leadership position in Imaging Systems:
• At the annual Radiological Society of North America (RSNA)
meeting, Philips unveiled eight breakthrough innovations in
imaging, proving Philips‟ leadership in radiology.
• Construction of healthcare R&D facility for Cardiovascular
X-ray equipment India
• Grow our Home Healthcare business:
• Increase awareness and treatment of Obstructive Sleep
Apnea (OSA) focused on emerging markets
• Strengthen leadership in home healthcare with the
acquisition (Jan. 2011) of the main business of medSage
Technologies LLC, a leading provider of patient interaction
and management applications for home care providers.

Depth and reach of Philips HealthcareWhat we do. Where we are.
€8.6Billion sales
in 2010
35,000+People employed
worldwide in 100 countries
450+Products & services
offered in over 100 countries
491 2010 split
8%of sales invested in R&D
in 2010
Philips Healthcare
Businesses1 Sales & services geographies1
Imaging
Systems
Home
Healthcare
Solutions
Patient Care
and Clinical
Informatics
Customer
Services
North America International
45% 35% 20%
Emerging
Markets
39% 14% 21% 26%
-10%
0%
10%
20%
30%
-1,000
0
1,000
2,000
3,000
4Q08 1Q09 2Q09 3Q09 4Q09 1Q10 2Q10 3Q10 4Q10
10%
13%
16%
19%
0
400
800
1,200
4Q08 1Q09 2Q09 3Q09 4Q09 1Q10 2Q10 3Q10 4Q10
Sales Comp. Sales Growth Adjusted EBITA%1
Working capital Working capital as % of LTM sales
50501 Adjusted EBITA is EBITA corrected for incidental charges (details on slide 80)
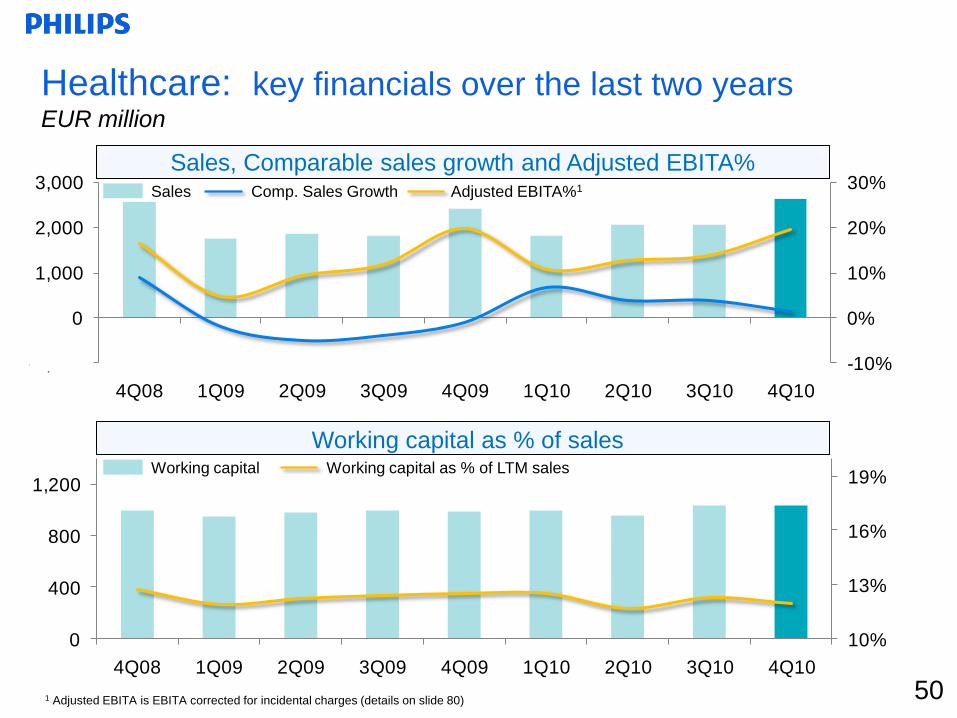
Healthcare: key financials over the last two yearsEUR million
Sales, Comparable sales growth and Adjusted EBITA%
Working capital as % of sales
29%
25%
41%
5% Emerging
51
Sales
% sales growth comp.
EBITA
EBITA as % of sales
EBIT
EBIT as % of sales
NOC
Employees (FTEs)
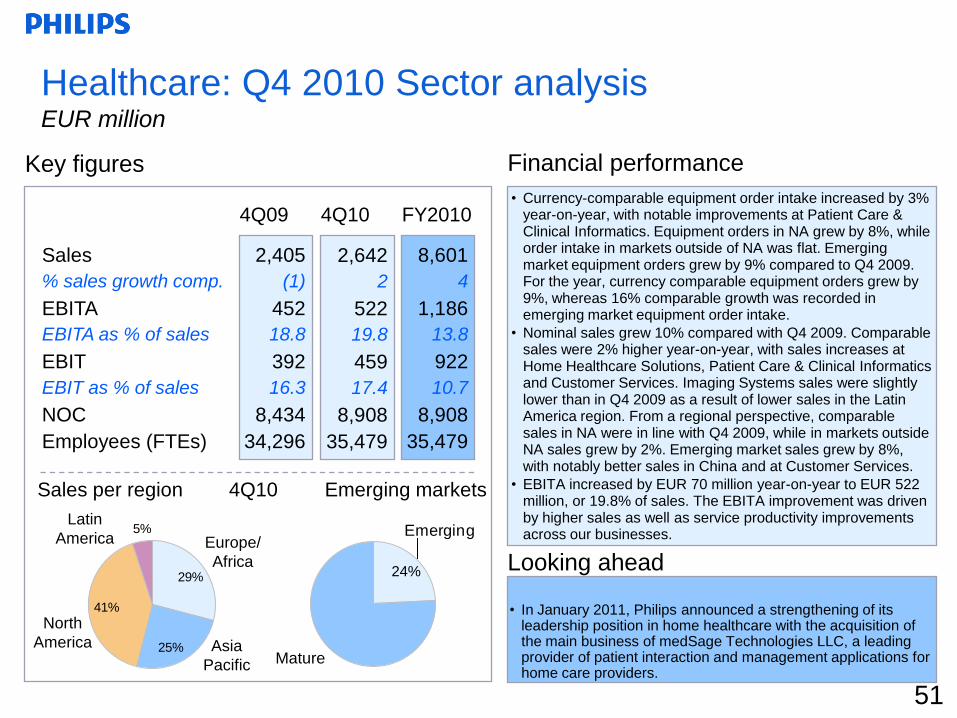
Healthcare: Q4 2010 Sector analysisEUR million
Looking ahead
4Q09
2,405
(1)
452
18.8
392
16.3
8,434
34,296
4Q10
8,601
4
1,186
13.8
922
10.7
8,908
35,479
FY2010
• In January 2011, Philips announced a strengthening of its leadership position in home healthcare with the acquisition of the main business of medSage Technologies LLC, a leading provider of patient interaction and management applications for home care providers.
Financial performanceKey figures
Sales per region 4Q10 Emerging markets
2,642
2
522
19.8
459
17.4
8,908
35,479
24%
Europe/
Africa
Asia
Pacific
North
America
Latin
America
Mature
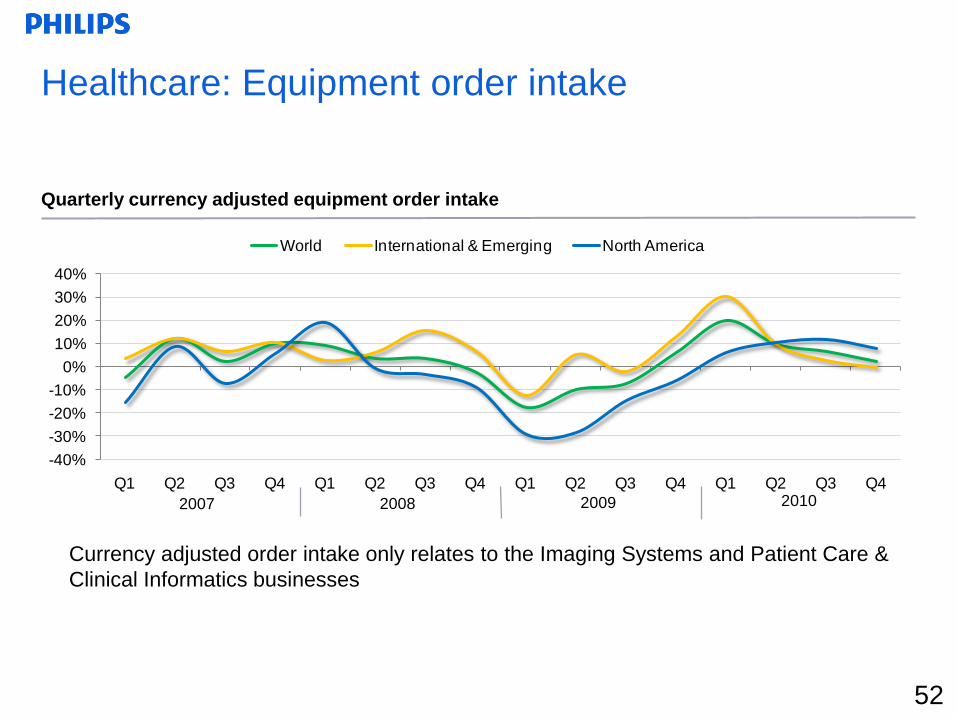
• Currency-comparable equipment order intake increased by 3% year-on-year, with notable improvements at Patient Care & Clinical Informatics. Equipment orders in NA grew by 8%, while order intake in markets outside of NA was flat. Emerging market equipment orders grew by 9% compared to Q4 2009. For the year, currency comparable equipment orders grew by 9%, whereas 16% comparable growth was recorded in emerging market equipment order intake.
• Nominal sales grew 10% compared with Q4 2009. Comparable sales were 2% higher year-on-year, with sales increases at Home Healthcare Solutions, Patient Care & Clinical Informatics and Customer Services. Imaging Systems sales were slightly lower than in Q4 2009 as a result of lower sales in the Latin America region. From a regional perspective, comparable sales in NA were in line with Q4 2009, while in markets outside NA sales grew by 2%. Emerging market sales grew by 8%, with notably better sales in China and at Customer Services.
• EBITA increased by EUR 70 million year-on-year to EUR 522 million, or 19.8% of sales. The EBITA improvement was driven by higher sales as well as service productivity improvements across our businesses.
-40%
-30%
-20%
-10%
0%
10%
20%
30%
40%
Q1 Q2 Q3 Q4 Q1 Q2 Q3 Q4 Q1 Q2 Q3 Q4 Q1 Q2 Q3 Q4
World International & Emerging North America
Currency adjusted order intake only relates to the Imaging Systems and Patient Care &
Clinical Informatics businesses
Quarterly currency adjusted equipment order intake
2007 2008 2009 2010
Healthcare: Equipment order intake
52
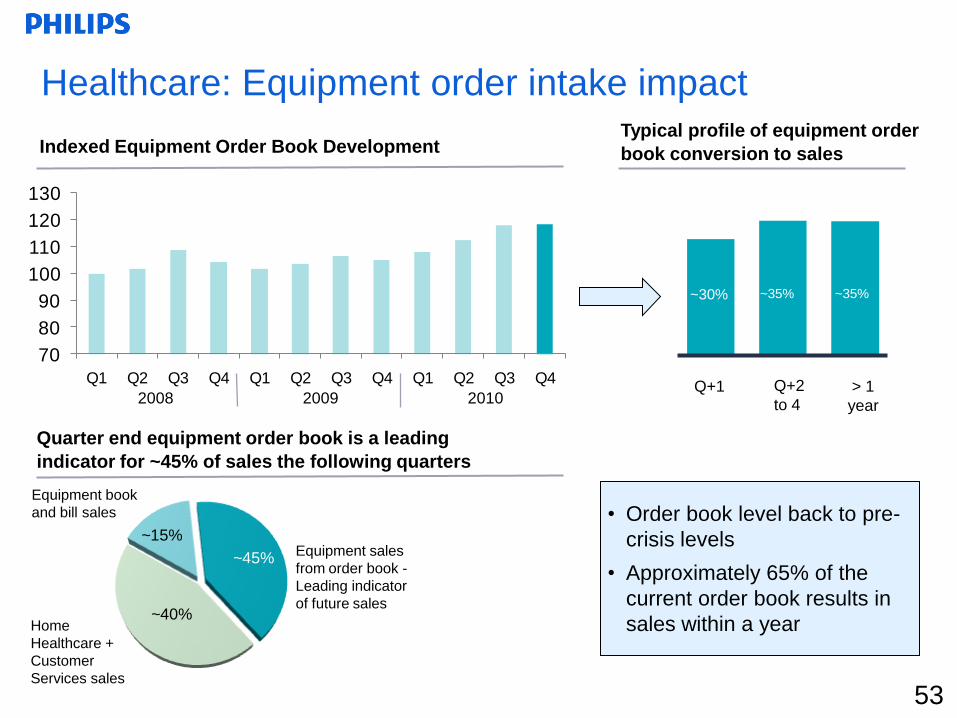
~15%
~45%
~40%
70
80
90
100
110
120
130
Q1 Q2 Q3 Q4 Q1 Q2 Q3 Q4 Q1 Q2 Q3 Q4
53
Healthcare: Equipment order intake impact
Indexed Equipment Order Book Development
Quarter end equipment order book is a leading
indicator for ~45% of sales the following quarters
Home
Healthcare +
Customer
Services sales
Equipment book
and bill sales
Equipment sales
from order book -
Leading indicator
of future sales
Typical profile of equipment order
book conversion to sales
> 1
year
~30% ~35%
Q+1 Q+2
to 4
~35%
2009 20102008
• Order book level back to pre-
crisis levels
• Approximately 65% of the
current order book results in
sales within a year
0
1,000
2,000
3,000
4,000
5,000
6,000
7,000
8,000
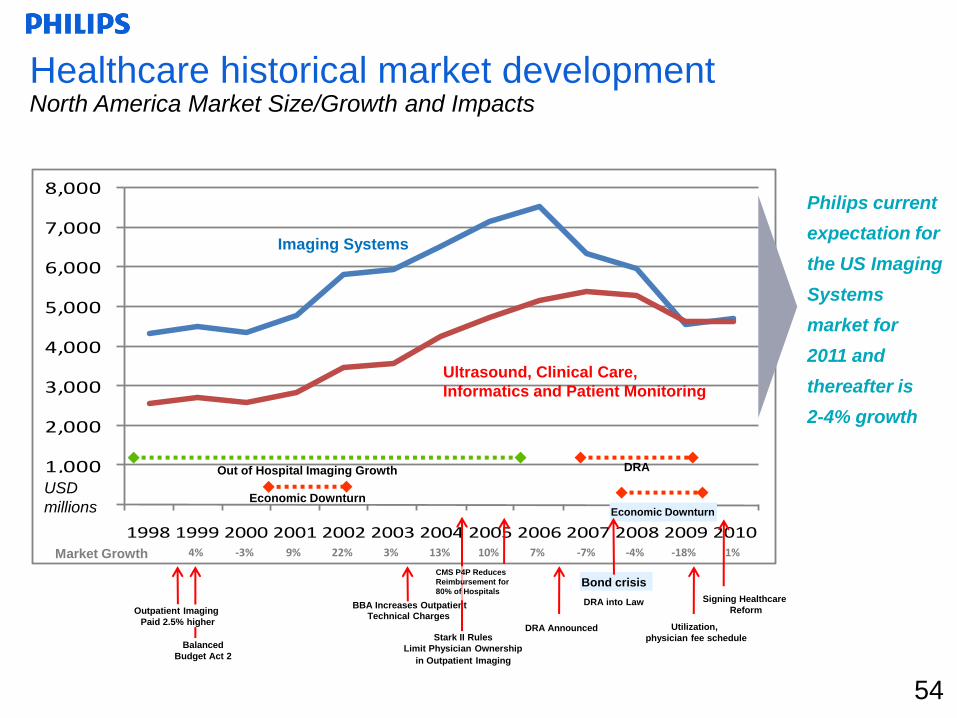
1998 1999 2000 2001 2002 2003 2004 2005 2006 2007 2008 2009 2010
Economic Downturn
Economic Downturn
Out of Hospital Imaging Growth DRA
Market Growth
BBA Increases Outpatient Technical Charges
Stark II Rules
Limit Physician Ownership
in Outpatient Imaging
DRA Announced
DRA into Law
Utilization,
physician fee schedule
Outpatient Imaging
Paid 2.5% higher
Bond crisis
Healthcare historical market developmentNorth America Market Size/Growth and Impacts
4% -3% 9% 22% 3% 13% 10% 7% -7% -4% -18% 1%
CMS P4P Reduces
Reimbursement for
80% of Hospitals
Balanced
Budget Act 2
Imaging Systems
Ultrasound, Clinical Care,
Informatics and Patient Monitoring
USD
millions
Philips current
expectation for
the US Imaging
Systems
market for
2011 and
thereafter is
2-4% growth
54
Signing Healthcare
Reform
2000
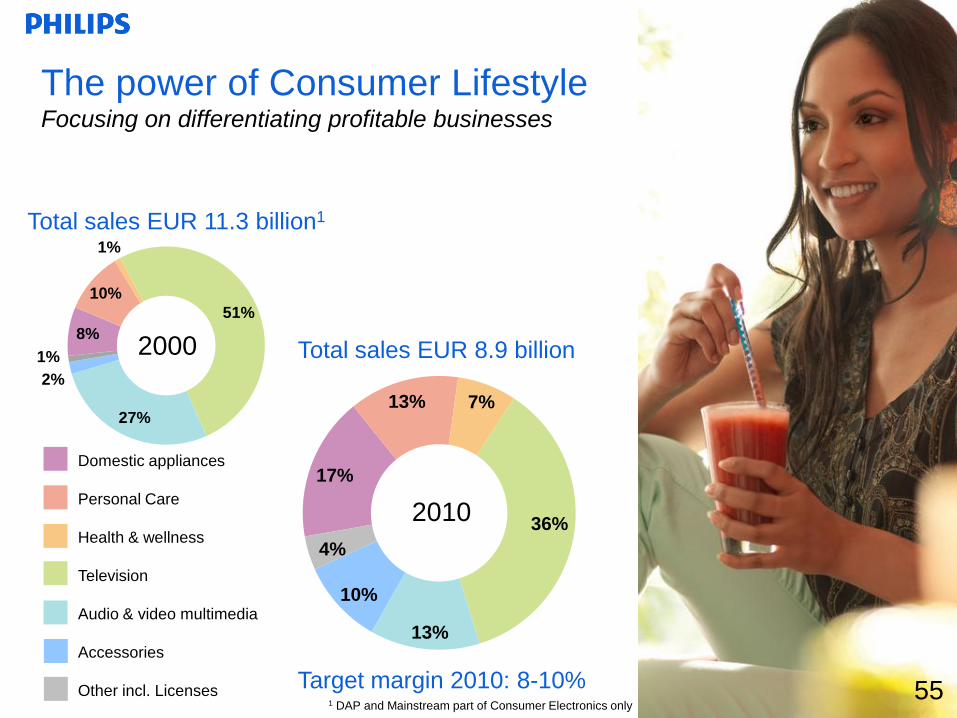
Total sales EUR 11.3 billion1
Total sales EUR 8.9 billion
The power of Consumer LifestyleFocusing on differentiating profitable businesses
8%
1%
51%
10%
27%
10%
17%
13%
36%
13% 7%
Domestic appliances
Personal Care
Health & wellness
Television
Audio & video multimedia
Accessories
Other incl. Licenses 55
4%
Target margin 2010: 8-10%
2010
1 DAP and Mainstream part of Consumer Electronics only
2%
1%
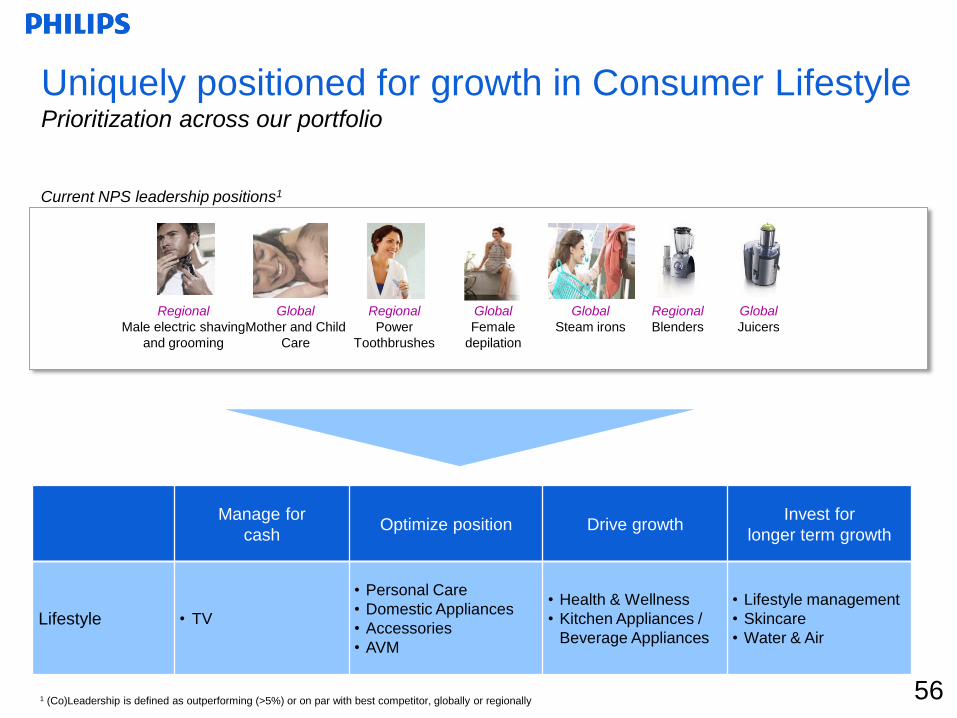
Uniquely positioned for growth in Consumer LifestylePrioritization across our portfolio
Regional
Male electric shaving
and grooming
Global
Mother and Child
Care
Global
Female
depilation
Global
Steam irons
Regional
Blenders
Global
Juicers
Regional
Power
Toothbrushes
Manage for
cashOptimize position Drive growth
Invest for
longer term growth
Lifestyle • TV
• Personal Care
• Domestic Appliances
• Accessories
• AVM
• Health & Wellness
• Kitchen Appliances /
Beverage Appliances
• Lifestyle management
• Skincare
• Water & Air
Current NPS leadership positions1
1 (Co)Leadership is defined as outperforming (>5%) or on par with best competitor, globally or regionally 56
57
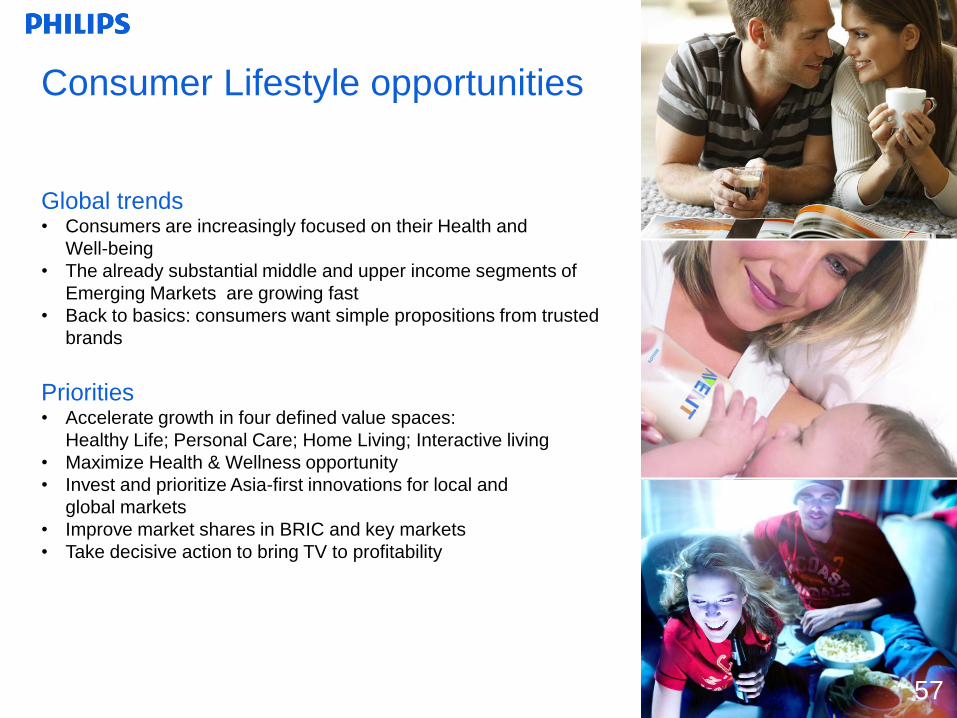
Consumer Lifestyle opportunities
57
Global trends• Consumers are increasingly focused on their Health and
Well-being
• The already substantial middle and upper income segments of
Emerging Markets are growing fast
• Back to basics: consumers want simple propositions from trusted
brands
Priorities• Accelerate growth in four defined value spaces:
Healthy Life; Personal Care; Home Living; Interactive living
• Maximize Health & Wellness opportunity
• Invest and prioritize Asia-first innovations for local and
global markets
• Improve market shares in BRIC and key markets
• Take decisive action to bring TV to profitability

Consumer LifestyleWhat we do. Where we are.
€8.9Billion sales
in 2010
17,000+People employed
worldwide
€0.3Billion negative NOC
for TV end 2010
58
4%of sales invested
in R&D in 2010
1 2010 split 2 Other category (4%) is mainly license income and is omitted from this overview
Philips Consumer Lifestyle
Businesses1 2 Geographies1
Personal
Care
Health &
Wellness
Domestic
Appliances
Television Audio
Video
Multimedia
Mature
Markets
60% 40%
Emerging
Markets
13% 7% 17% 36% 13%
Accessories
10%

-30%
-20%
-10%
0%
10%
20%
30%
-4,000
-2,000
0
2,000
4,000
4Q08 1Q09 2Q09 3Q09 4Q09 1Q10 2Q10 3Q10 4Q10
-8%
-4%
0%
4%
8%
12%
16%
-400
-300
-200
-100
0
100
200
300
4Q08 1Q09 2Q09 3Q09 4Q09 1Q10 2Q10 3Q10 4Q10
Sales Comp. Sales Growth Adjusted EBITA%1
Working capital Working capital as % of LTM sales
5959
Consumer Lifestyle: key financials over the last two yearsEUR million
Sales, Comparable sales growth and Adjusted EBITA%
Working capital as % of sales
1 Adjusted EBITA is EBITA corrected for incidental charges (details on slide 80)
63%14%
13%
10%
Emerging
60
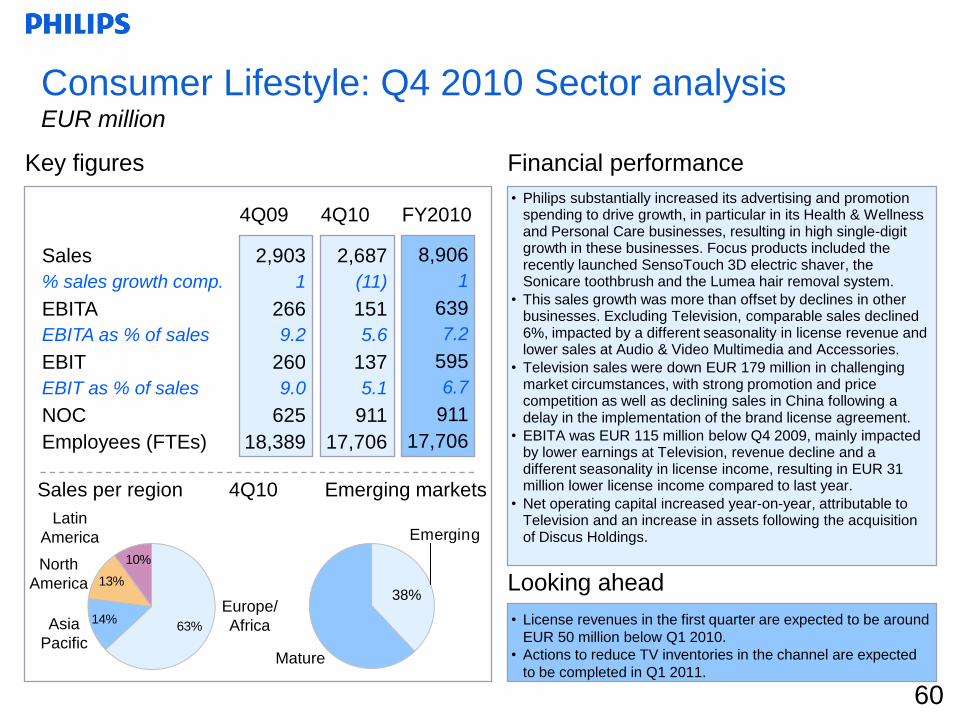
• Philips substantially increased its advertising and promotion spending to drive growth, in particular in its Health & Wellness and Personal Care businesses, resulting in high single-digit growth in these businesses. Focus products included the recently launched SensoTouch 3D electric shaver, the Sonicare toothbrush and the Lumea hair removal system.
• This sales growth was more than offset by declines in other businesses. Excluding Television, comparable sales declined 6%, impacted by a different seasonality in license revenue and lower sales at Audio & Video Multimedia and Accessories.
• Television sales were down EUR 179 million in challenging market circumstances, with strong promotion and price competition as well as declining sales in China following a delay in the implementation of the brand license agreement.
• EBITA was EUR 115 million below Q4 2009, mainly impacted by lower earnings at Television, revenue decline and a different seasonality in license income, resulting in EUR 31 million lower license income compared to last year.
• Net operating capital increased year-on-year, attributable to Television and an increase in assets following the acquisition of Discus Holdings.
60
Sales
% sales growth comp.
EBITA
EBITA as % of sales
EBIT
EBIT as % of sales
NOC
Employees (FTEs)
Consumer Lifestyle: Q4 2010 Sector analysisEUR million
2,903
1
266
9.2
260
9.0
625
18,389
8,906
1
639
7.2
595
6.7
911
17,706
Key figures Financial performance
4Q09 4Q10 FY2010
2,687
(11)
151
5.6
137
5.1
911
17,706
Looking ahead
• License revenues in the first quarter are expected to be around
EUR 50 million below Q1 2010.
• Actions to reduce TV inventories in the channel are expected
to be completed in Q1 2011.
Sales per region 4Q10 Emerging markets
38%Europe/
AfricaAsia
Pacific
North
America
Latin
America
Mature
0%
5%
10%
15%
20%
4Q08 1Q09 2Q09 3Q09 4Q09 1Q10 2Q10 3Q10 4Q10
-200
-150
-100
-50
0
50
4Q08 1Q09 2Q09 3Q09 4Q09 1Q10 2Q10 3Q10 4Q10
-500
-400
-300
-200
-100
0
4Q08 1Q09 2Q09 3Q09 4Q09 1Q10 2Q10 3Q10 4Q10
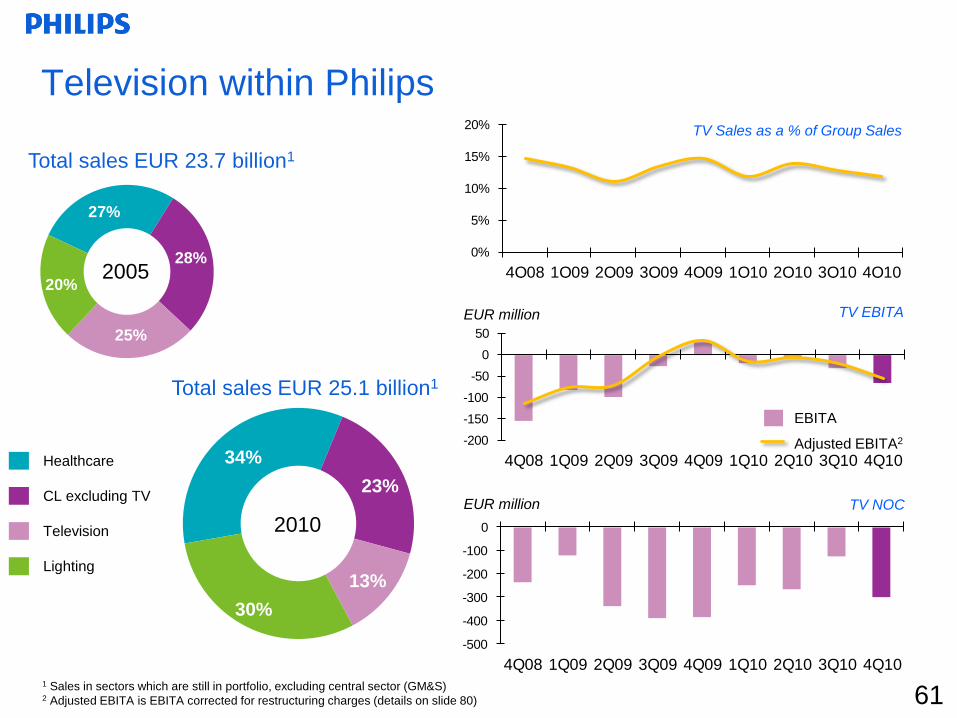
Television within Philips
61
TV Sales as a % of Group Sales
2005
Total sales EUR 23.7 billion1
28%
20%
27%
25%
Total sales EUR 25.1 billion1
23%
13%
34%Healthcare
CL excluding TV
Television
Lighting
30%
EUR million
1 Sales in sectors which are still in portfolio, excluding central sector (GM&S)2 Adjusted EBITA is EBITA corrected for restructuring charges (details on slide 80)
TV EBITA
TV NOC
EBITA
Adjusted EBITA2
EUR million
2010

Total sales EUR 4.9 billion1
Total sales EUR 7.6 billion
The power of LightingSimply enhancing life with light
Lamps & lighting electronics
Professional luminaires
Consumer luminaires
Automotive
Packaged LEDs
8%
73%
19%
8%
51%
6%
7%
28%
2000
62Target margin 2010: 12-14%
2010
1 Excluding batteries EUR 0.2 billion
Global
High Power
LEDs
Global
Professional
Luminaires
Global
Lighting
Electronics
Global
Lamps
Regional
Automotive
Lighting
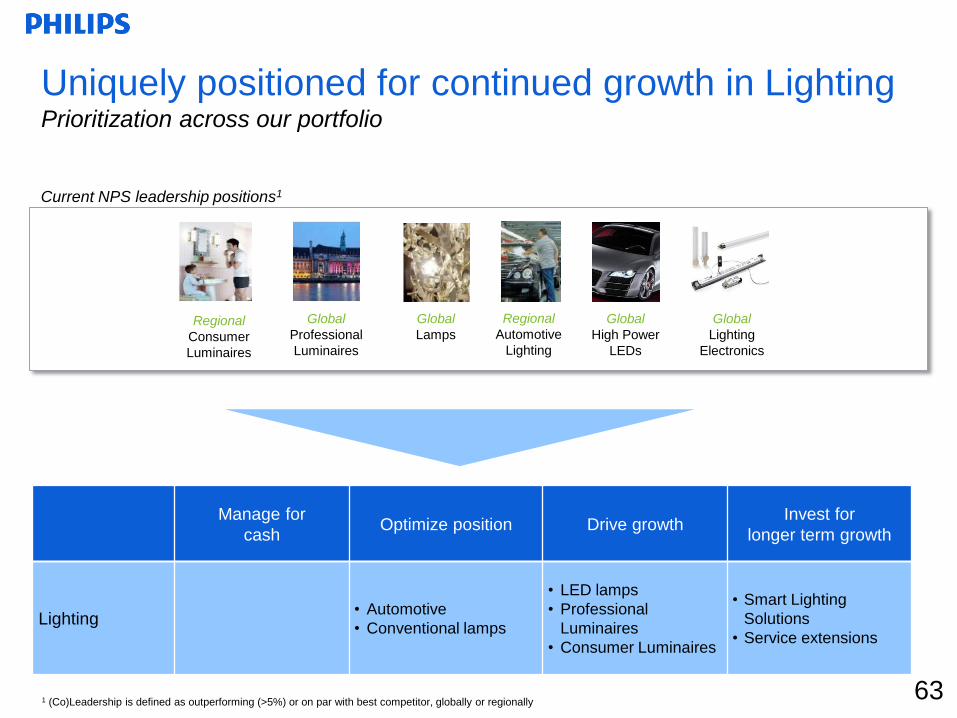
Uniquely positioned for continued growth in Lighting Prioritization across our portfolio
Regional
Consumer
Luminaires
Manage for
cashOptimize position Drive growth
Invest for
longer term growth
Lighting• Automotive
• Conventional lamps
• LED lamps
• Professional
Luminaires
• Consumer Luminaires
• Smart Lighting
Solutions
• Service extensions
Current NPS leadership positions1
1 (Co)Leadership is defined as outperforming (>5%) or on par with best competitor, globally or regionally63
64
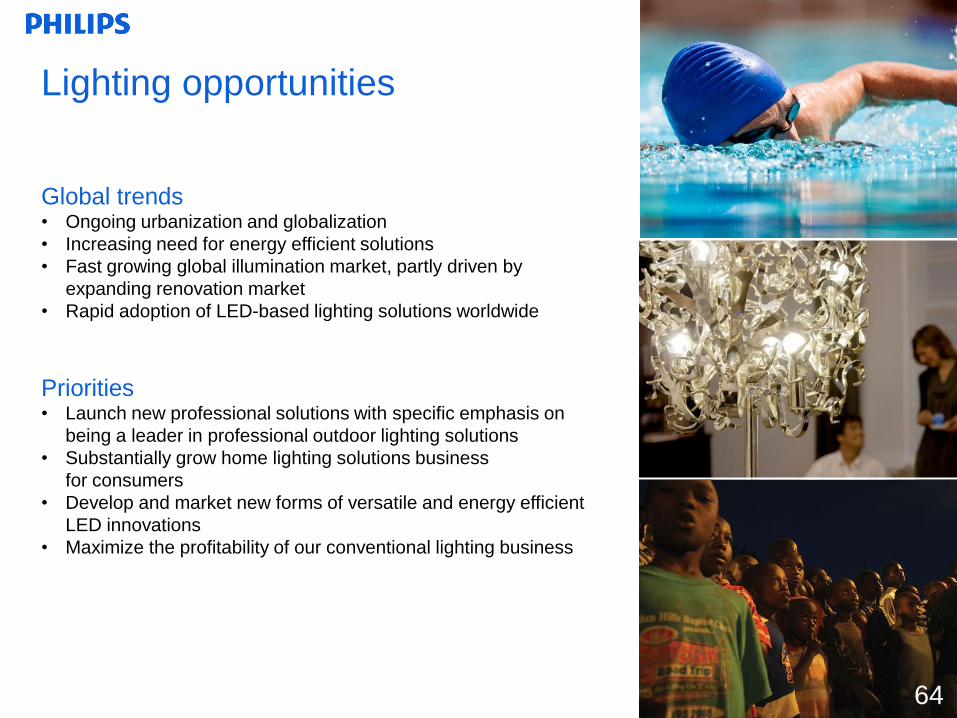
Lighting opportunities
64
Global trends• Ongoing urbanization and globalization
• Increasing need for energy efficient solutions
• Fast growing global illumination market, partly driven by
expanding renovation market
• Rapid adoption of LED-based lighting solutions worldwide
Priorities• Launch new professional solutions with specific emphasis on
being a leader in professional outdoor lighting solutions
• Substantially grow home lighting solutions business
for consumers
• Develop and market new forms of versatile and energy efficient
LED innovations
• Maximize the profitability of our conventional lighting business
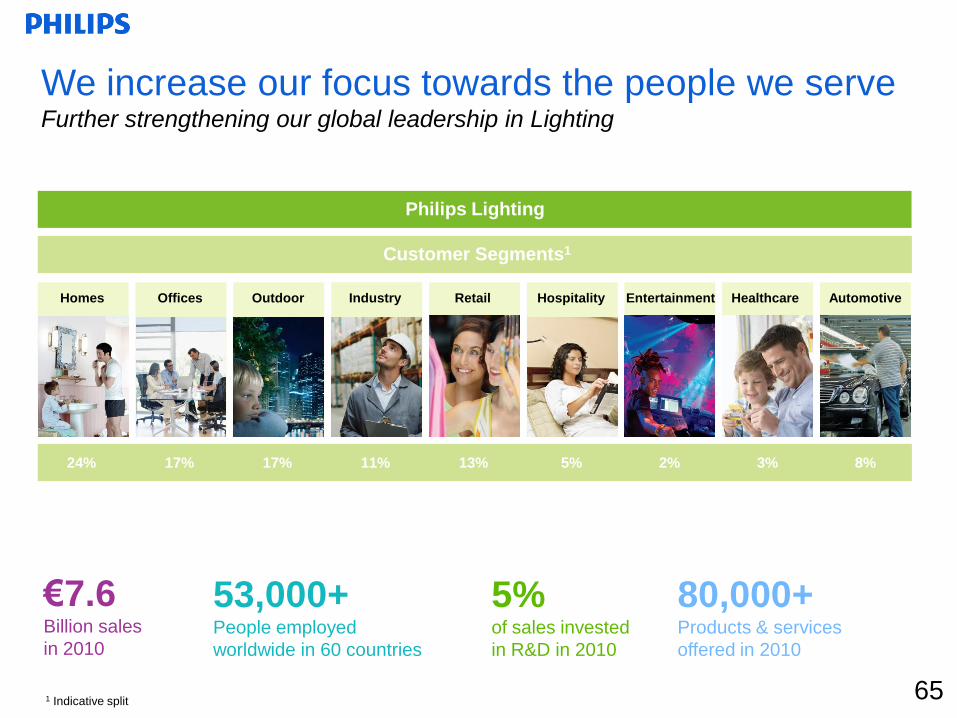
Philips Lighting
Customer Segments1
24% 17% 17% 11% 13% 5% 2% 3% 8%
Retail Entertainment Healthcare AutomotiveHomes Offices Outdoor Industry Hospitality
We increase our focus towards the people we serveFurther strengthening our global leadership in Lighting
€7.6Billion sales
in 2010
53,000+People employed
worldwide in 60 countries
5%of sales invested
in R&D in 2010
80,000+Products & services
offered in 2010
651 Indicative split
-20%
-10%
0%
10%
20%
-2,000
-1,000
0
1,000
2,000
4Q08 1Q09 2Q09 3Q09 4Q09 1Q10 2Q10 3Q10 4Q10
8%
12%
16%
20%
0
400
800
1,200
4Q08 1Q09 2Q09 3Q09 4Q09 1Q10 2Q10 3Q10 4Q10
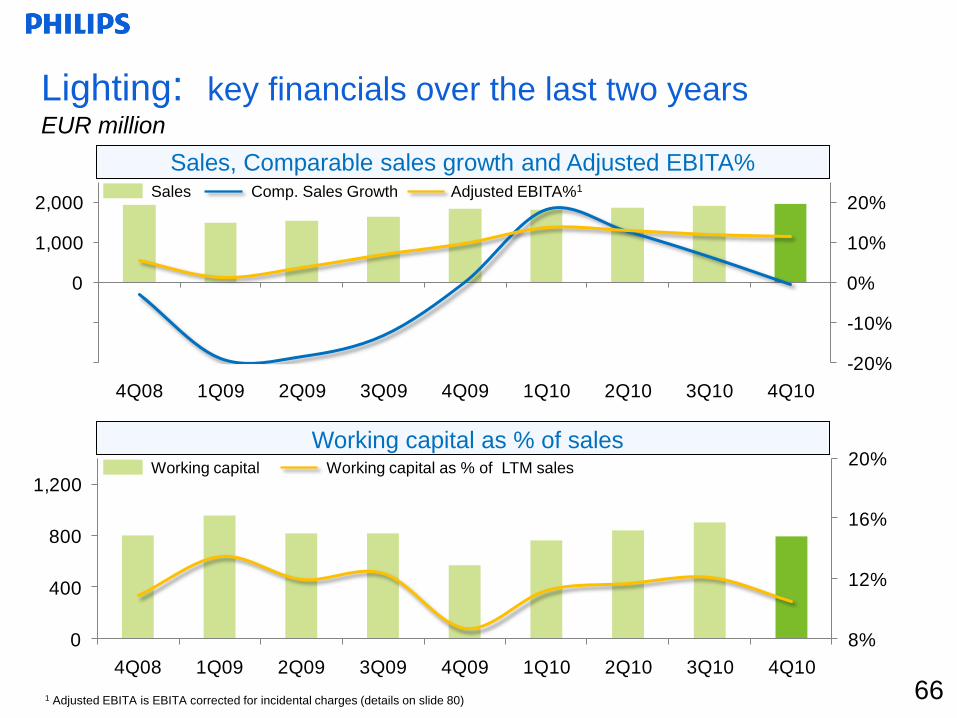
Working capital Working capital as % of LTM sales
Sales Comp. Sales Growth Adjusted EBITA%1
6666
Lighting: key financials over the last two yearsEUR million
Sales, Comparable sales growth and Adjusted EBITA%
Working capital as % of sales
1 Adjusted EBITA is EBITA corrected for incidental charges (details on slide 80)
40%
28%
26%
6%Emerging
6767
Sales
% sales growth comp.
EBITA
EBITA as % of sales
EBIT
EBIT as % of sales
NOC
Employees (FTEs)
Lighting: Q4 2010 Sector analysisEUR million
Looking ahead
• Nominal sales grew 7% compared with Q4 2009.
Comparable sales were in line with Q4 2009; robust sales
growth in LED and Lighting Systems & Controls was offset
by a sales decline in our consumer businesses. From a
geographic perspective, sales growth in North America
and emerging markets, India in particular, was offset by a
sales decline in Western Europe.
• LED-based sales grew 37% compared to Q4 2009,
representing 14% of total Lighting sales.
• EBITA more than doubled to EUR 198 million. Excluding
restructuring and acquisition-related charges of EUR 34
million (Q4 2009: EUR 103 million), EBITA amounted to
EUR 232 million, or 11.7% of sales. The substantial year-
on-year EBITA improvement was largely driven by a
favorable product mix and ongoing cost management.
• Net operating capital increased by EUR 457 million to
EUR 5,561 million, mainly due to currency impact and an
increase in working capital.
1,846
-
82
4.4
41
2.2
5,104
51,653
7,552
9
869
11.5
695
9.2
5,561
53,888
Financial performanceKey figures
4Q09 4Q10 FY2010
1,975
-
198
10.0
156
7.9
5,561
53,888
• In Jan. 2011, Philips has acquired NA based Optimum
Lighting LLC, a company specialized in customized
energy-efficient lighting solutions for the office, industry
and retail segments. This acquisition strengthens our
global leadership position in professional luminaires.
Sales per region 4Q10 Emerging markets
37%Europe/
Africa
Asia
Pacific
North
America
Latin
America
Mature
41%
73%
30%
21%29%
6%
EuropeNorth
America
Latin
America
Asia/
Pacific1Total
Lamps
Consumer
Luminaires
Professional
Luminaires
Lighting
Electronics
Automotive
Packaged
LEDs
Overall
Lighting
We are the leading global lighting company
20092008
Not leader LeaderCo-leaderNumber 1 Number 2 or 3 Not in top 3
Market leadership across most categoriesMarket share per Business Group by Region,
as at Jun „10
Increased customer loyaltyNet Promoter Score (NPS) in 2008, 2009
1 Excluding Japan
Source: Customer panels and Industry associations68

69
Sales recovery despite current weakness in the
luminaires (fixtures) market in mature economies
Philips
LightingNew Build
Replace-
mentTotal
Residential 12% 13% 25%
Commercial 30% 22% 52%
Other 17% 6% 23%
Total 59% 41% 100%-20
-10
30
20
10
0
Q3Q2Q1Q4Q3Q2Q1Q4 Q4
% comparable sales growth
2009 2010
Total lighting
Lamps and other businesses
Professional & Consumer Luminaires
Around 25% of Philips Lighting sales driven
by New Build in Western Europe & North
America (WE&NA)
Not yet firing on all cylinders: sales
recovery despite soft luminaires market
in mature economies
New Build WE&NA ROW Total
Residential 7% 5% 12%
Commercial 18% 12% 30%
Total 25% 17% 42%
69
„08
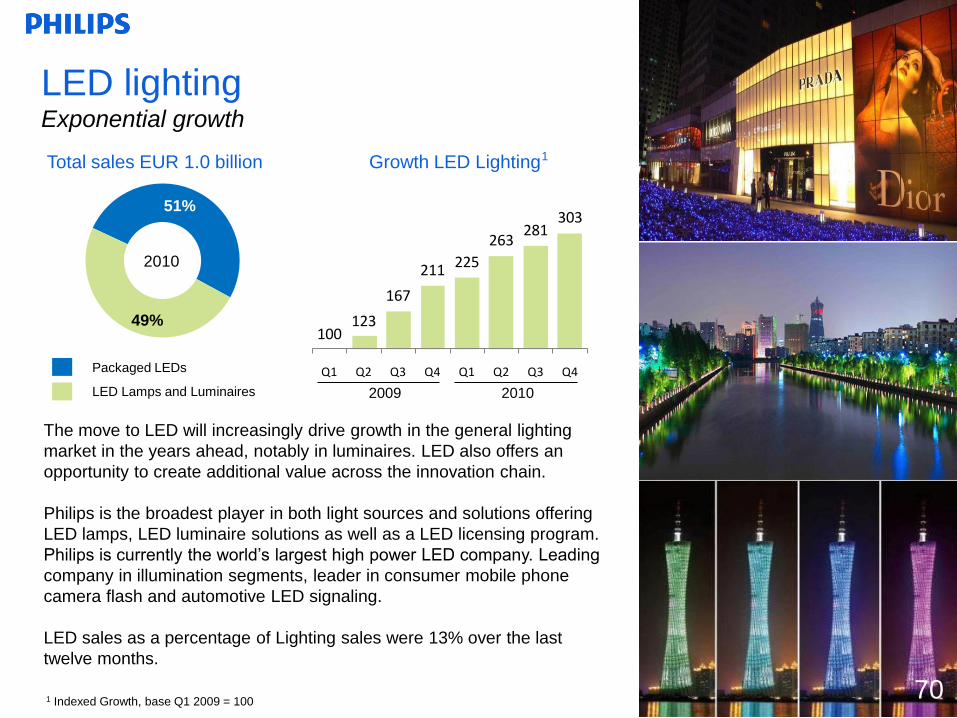
100123
167
211 225
263281
303
Q1 Q2 Q3 Q4 Q1 Q2 Q3 Q4
Growth LED Lighting
LED lightingExponential growth
Total sales EUR 1.0 billion
51%
49%
The move to LED will increasingly drive growth in the general lighting
market in the years ahead, notably in luminaires. LED also offers an
opportunity to create additional value across the innovation chain.
Philips is the broadest player in both light sources and solutions offering
LED lamps, LED luminaire solutions as well as a LED licensing program.
Philips is currently the world‟s largest high power LED company. Leading
company in illumination segments, leader in consumer mobile phone
camera flash and automotive LED signaling.
LED sales as a percentage of Lighting sales were 13% over the last
twelve months.
Packaged LEDs
LED Lamps and Luminaires
1 Indexed Growth, base Q1 2009 = 100
1
2010
70
2009 2010
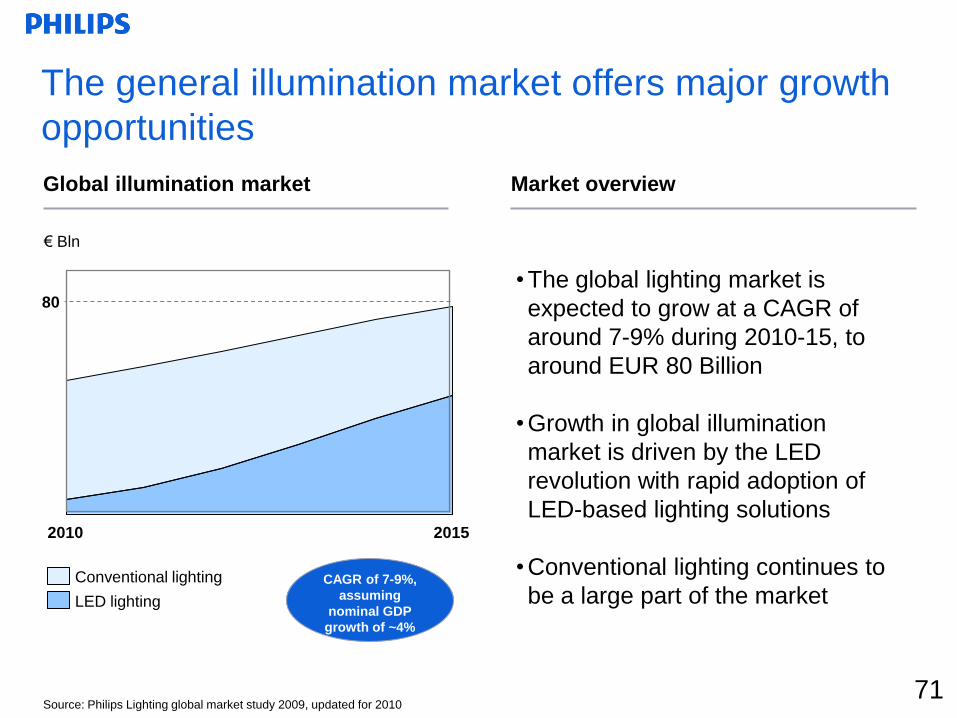
The general illumination market offers major growth
opportunities
LED lighting
Conventional lighting
Market overviewGlobal illumination market
• The global lighting market is
expected to grow at a CAGR of
around 7-9% during 2010-15, to
around EUR 80 Billion
• Growth in global illumination
market is driven by the LED
revolution with rapid adoption of
LED-based lighting solutions
• Conventional lighting continues to
be a large part of the market
Source: Philips Lighting global market study 2009, updated for 2010
20152010
€ Bln
80
CAGR of 7-9%,
assuming
nominal GDP
growth of ~4%
71
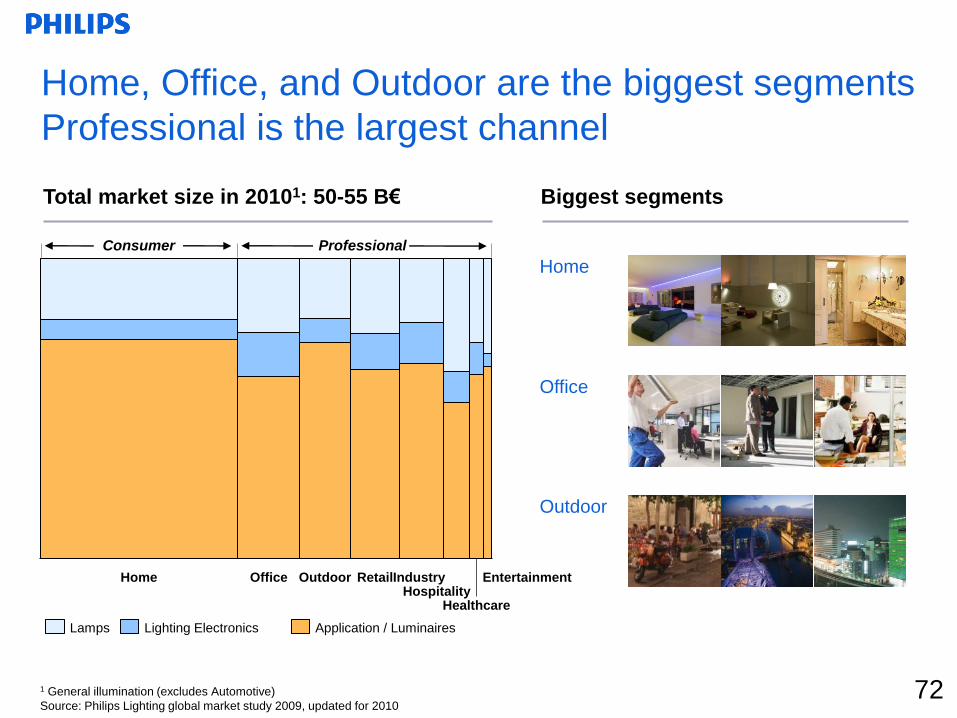
Application / LuminairesLighting ElectronicsLamps
Home
Home, Office, and Outdoor are the biggest segments
Professional is the largest channel
1 General illumination (excludes Automotive)
Source: Philips Lighting global market study 2009, updated for 2010
Biggest segments
Entertainment
HealthcareHospitality
IndustryRetailOfficeHome Outdoor
Consumer Professional
Total market size in 20101: 50-55 B€
Office
Outdoor
72

Group Management & ServicesAdding value to the businesses
73
Corporate TechnologiesPhilips Corporate Technologies encompasses
Corporate Research and Intellectual Property &
Standards (IP&S)
Corporate & Regional CostsCorporate center and country & regional
overheads
PensionsPension and other postretirement benefit costs
mostly related to former Philips‟ employees
Service Units and Other Global service units; Shared service centers;
Corporate Investments, New venture integration
and Philips Design

7474
Sales
% sales growth comp.
EBITA:
Corporate Technologies
Corporate & Regional Costs
Pensions
Service Units and Other
EBITA
EBIT
NOC
Employees (FTEs)
Sector analysis Q4 – Group Management & ServicesEUR million
• Sales declined from EUR 109 million in Q4 2009 to EUR
88 million, largely due to lower license revenue.
• EBITA amounted to EUR 2 million (income), a EUR 140
million improvement year-on-year.
• EBITA was favorably impacted by a EUR 83 million
pension plan change, partly offset by EUR 5 million
restructuring charges. Excluding these items, EBITA
amounted to an expense of EUR 76 million.
• In Q4 2009, EBITA included the favorable impact of a
EUR 44 million release of a postretirement benefit
provision, offset by EUR 46 million of asset write-offs,
including EUR 26 million for Corporate Investments. In
Q4 2009 earnings also included EUR 36 million
restructuring charges, mainly at Corporate Investments,
Research and Design.
109
(11)
(34)
(65)
51
(90)
(138)
(138)
(1,514)11,586
Financial performanceKey figures
4Q09 4Q10 FY2010
88
(20)
(25)
(44)
91
(20)
2
3
(3,308)11,928
360
6
(63)
(142)
100
(37)
(142)
(147)
(3,308)11,928
Looking ahead
• The cost level of GM&S is expected to be around EUR
280 million for the full year 2011.
• Philips will receive a total of 28 prestigious iF product
design awards in 2011.
• Eight Philips projects will receive a “Good Design 2010”
award, organized by The Chicago Athenaeum Museum
of Architecture and Design and The European Centre for
Architecture Art Design and Urban Studies.


76
Appendix
76
77
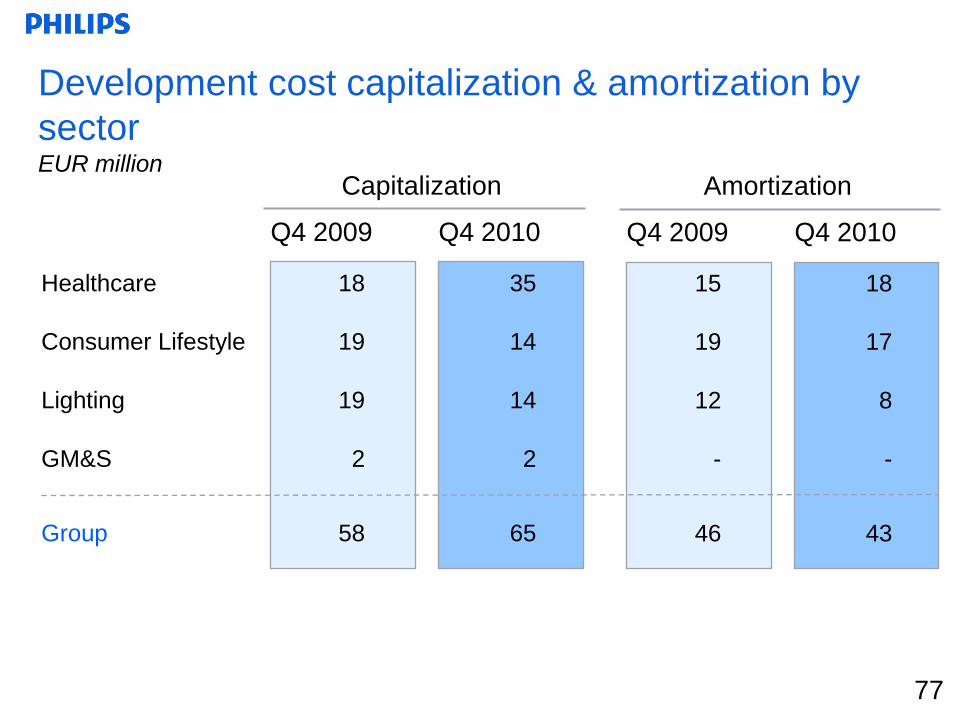
Development cost capitalization & amortization by
sectorEUR million
Q4 2010Q4 2009
18
19
19
2
58
35
14
14
2
65
Healthcare
Consumer Lifestyle
Lighting
GM&S
Group
Capitalization
Q4 2010Q4 2009
15
19
12
-
46
18
17
8
-
43
Amortization
77
78
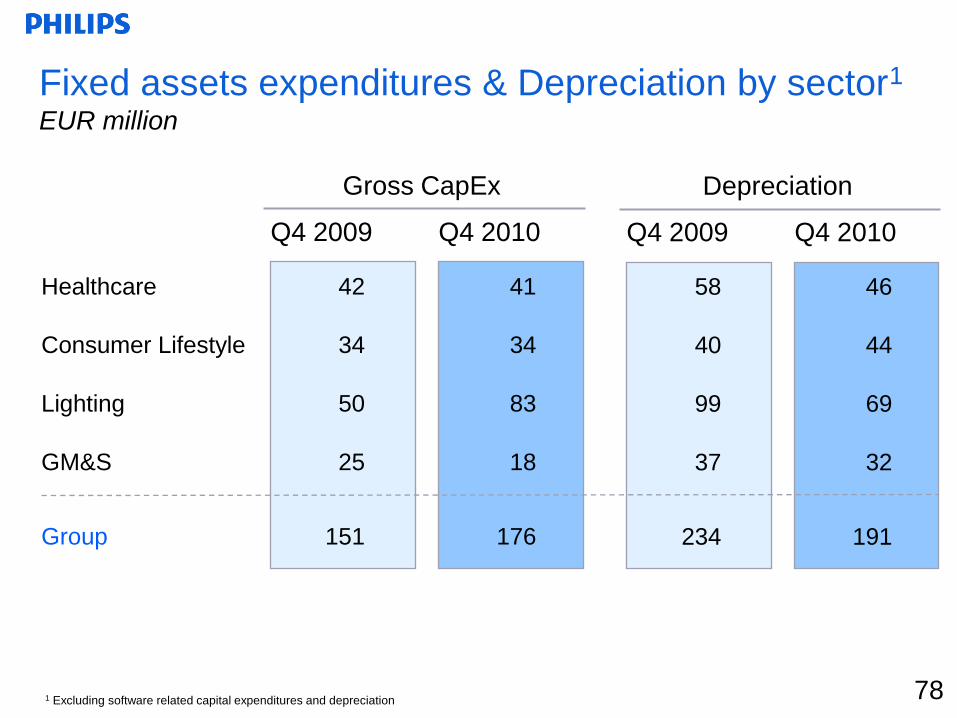
Fixed assets expenditures & Depreciation by sector1
EUR million
Q4 2010Q4 2009
42
34
50
25
151
41
34
83
18
176
Healthcare
Consumer Lifestyle
Lighting
GM&S
Group
Gross CapEx
Q4 2010Q4 2009
58
40
99
37
234
46
44
69
32
191
Depreciation
1 Excluding software related capital expenditures and depreciation 78
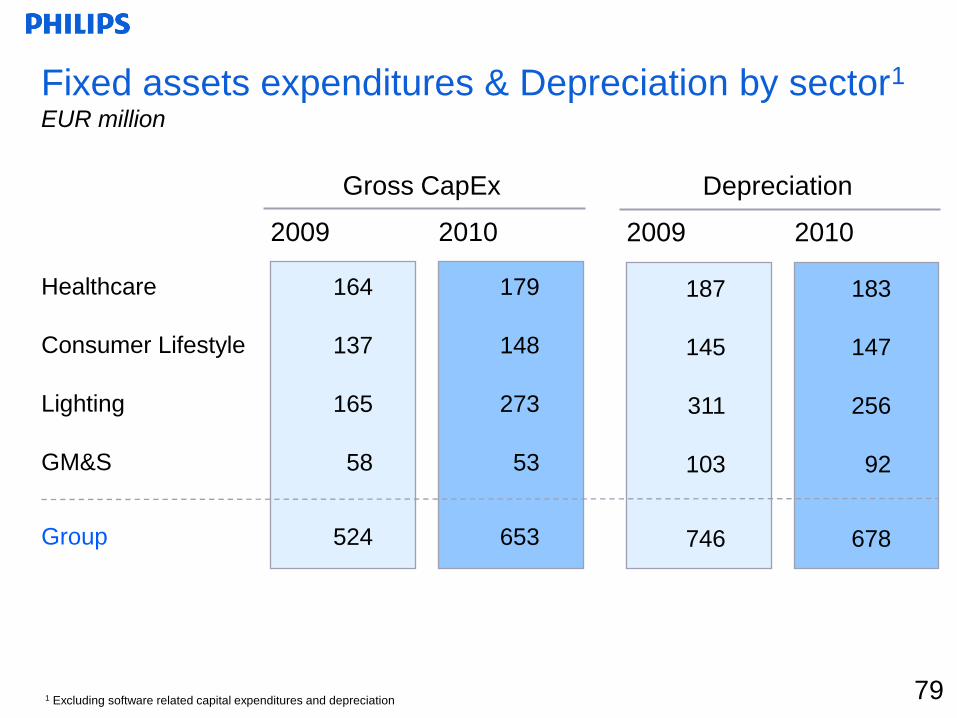
79
Fixed assets expenditures & Depreciation by sector1
EUR million
20102009
179
148
273
53
653
Healthcare
Consumer Lifestyle
Lighting
GM&S
Group
Gross CapEx
20102009
183
147
256
92
678
Depreciation
79
164
137
165
58
524
187
145
311
103
746
1 Excluding software related capital expenditures and depreciation

80
1Q09 2Q09 3Q09 4Q09 2009 1Q10 2Q10 3Q10 4Q10 2010
Acq.-related charges (15) (14) (17) (18) (64) (9) (8) (9) (3) (29)
Restructuring (10) (23) (10) (42) (20) (38) 3 7 (48)
Other Incidentals - -
Healthcare (15) (24) (40) (27) (106) (29) (46) (6) 4 (77)
Acq.-related charges (6) (10) (16) (3) (3) (7) (6) (19)
Restructuring (13) (30) (23) (54) (120) (10) (7) (16) (9) (42)
of which TV (6) (29) (23) (5) (63) (4) (3) (11) (12) (30)
Other Incidentals (30) (17) (1) (48)
Consumer Lifestyle (43) (47) (29) (65) (184) (13) (10) (23) (15) (61)
Acq.-related charges (3) (4) (6) (8) (21) (4) (5) (6) (8) (23)
Restructuring (16) (78) (36) (95) (225) (5) (32) (11) (26) (74)
Other Incidentals - -
Lighting (19) (82) (42) (103) (246) (9) (37) (17) (33) (97)
Restructuring (12) (14) (36) (63) 1 6 (5) 2
Other Incidentals 90 87 (2) 175 36 83 119
GM&S - 78 73 (38) 112 1 - 42 77 121
Grand Total (77) (76) (38) (233) (424) (50) (93) (4) 33 (114)
Restructuring, acquisition-related and other chargesEUR million
81
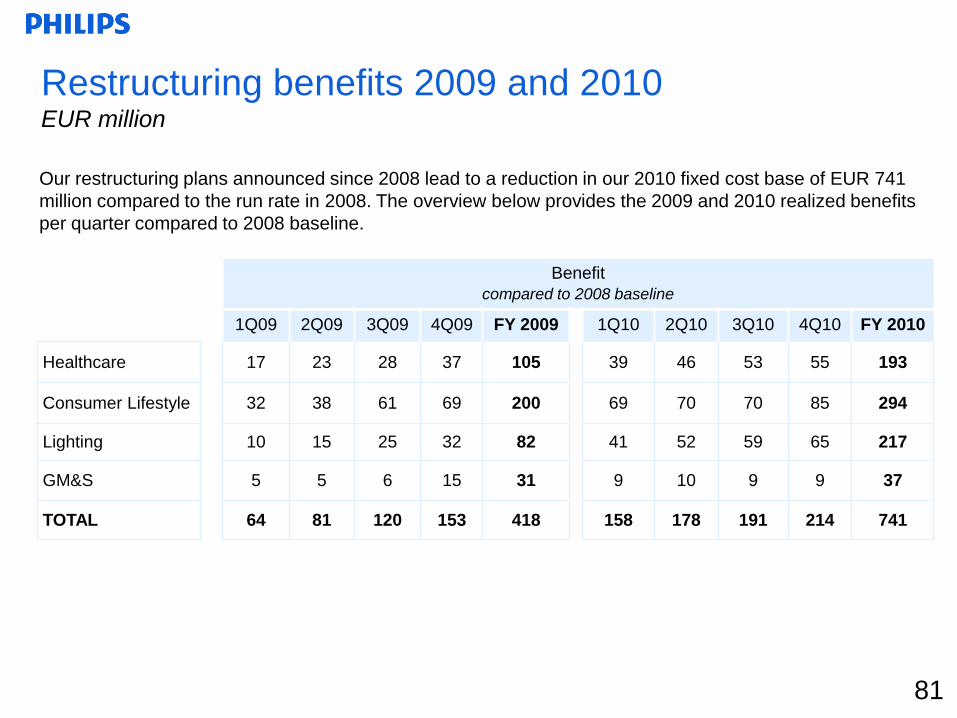
Benefit
compared to 2008 baseline
1Q09 2Q09 3Q09 4Q09 FY 2009 1Q10 2Q10 3Q10 4Q10 FY 2010
Healthcare 17 23 28 37 105 39 46 53 55 193
Consumer Lifestyle 32 38 61 69 200 69 70 70 85 294
Lighting 10 15 25 32 82 41 52 59 65 217
GM&S 5 5 6 15 31 9 10 9 9 37
TOTAL 64 81 120 153 418 158 178 191 214 741
Our restructuring plans announced since 2008 lead to a reduction in our 2010 fixed cost base of EUR 741
million compared to the run rate in 2008. The overview below provides the 2009 and 2010 realized benefits
per quarter compared to 2008 baseline.
Restructuring benefits 2009 and 2010EUR million
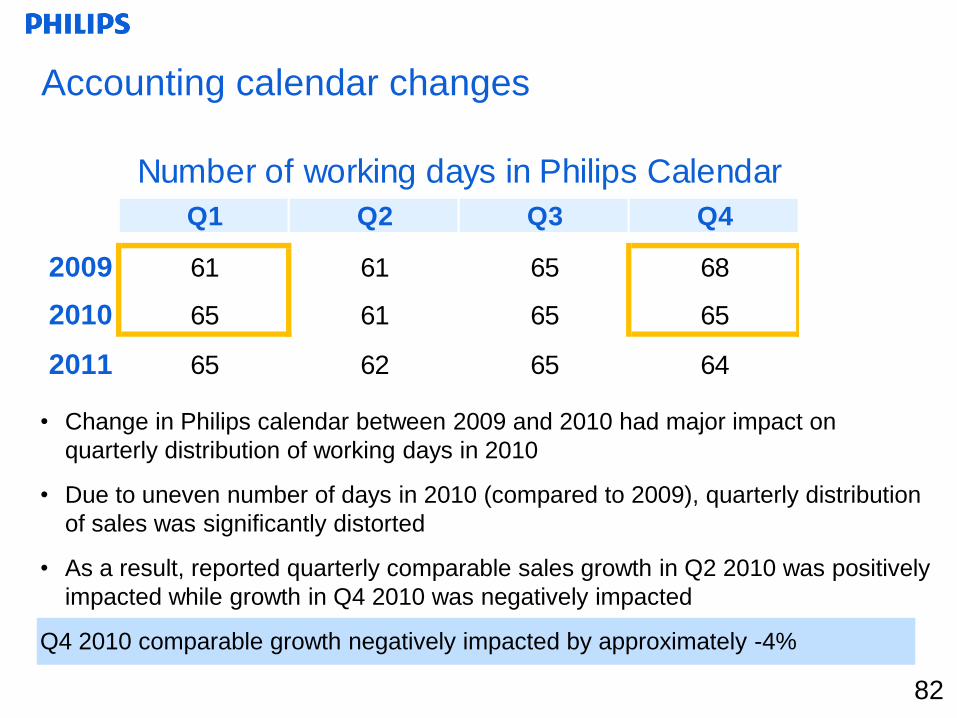
Accounting calendar changes
Q1 Q2 Q3 Q4
2009 61 61 65 68
2010 65 61 65 65
2011 65 62 65 64
Number of working days in Philips Calendar
• Change in Philips calendar between 2009 and 2010 had major impact on
quarterly distribution of working days in 2010
• Due to uneven number of days in 2010 (compared to 2009), quarterly distribution
of sales was significantly distorted
• As a result, reported quarterly comparable sales growth in Q2 2010 was positively
impacted while growth in Q4 2010 was negatively impacted
Q4 2010 comparable growth negatively impacted by approximately -4%
82