fourth quarter and full- year 2017 earnings | february 1,...
TRANSCRIPT
Fourth Quarter and Full- Year 2017 Earnings | February 1, 2018
Earnings Presentation | Fourth Quarter and Full-Year 2017
Forward-Looking Statements
Certain statements in these slides and made during this presentation may be considered forward-looking
statements. These statements reflect management’s current views and are subject to risks and uncertainties
that could cause actual results to differ materially from those expressed or implied in these statements.
Factors which could cause actual results to differ include but are not limited to: (i) the level of our
indebtedness and changes in interest rates; (ii) industry conditions, including but not limited to changes in
the cost or availability of raw materials, energy and transportation costs, competition we face, cyclicality and
changes in consumer preferences, demand and pricing for our products; (iii) global economic conditions and
political changes, including but not limited to the impairment of financial institutions, changes in currency
exchange rates, credit ratings issued by recognized credit rating organizations, the amount of our future
pension funding obligation, changes in tax laws and pension and health care costs; (iv) unanticipated
expenditures related to the cost of compliance with existing and new environmental and other governmental
regulations and to actual or potential litigation; (v) whether we experience a material disruption at one of our
manufacturing facilities; (vi) risks inherent in conducting business through joint ventures; and (vii) our ability
to achieve the benefits we expect from strategic acquisitions, divestitures and restructurings. These and
other factors that could cause or contribute to actual results differing materially from such forward-looking
statements are discussed in greater detail in the Company’s Securities and Exchange Commission filings.
We undertake no obligation to publicly update any forward-looking statements, whether as a result of new
information, future events or otherwise.
2
Earnings Presentation | Fourth Quarter and Full-Year 2017
Statements Relating to Non-GAAP Financial Measures
During the course of this presentation, certain non U.S. GAAP financial measures
will be presented, such as Adjusted Operating EPS, Adjusted EBIT, Adjusted
EBITDA, Adjusted EBITDA Margin, Free Cash Flow and Adjusted ROIC.
A reconciliation of all presented non-GAAP measures (and their components) to
U.S. GAAP financial measures is available on the company’s website at
internationalpaper.com under Performance/Investors.
3
Earnings Presentation | Fourth Quarter and Full-Year 2017
Ilim JV Information
All financial information and statistical measures regarding our 50/50 Ilim joint
venture in Russia (“Ilim”), other than historical International Paper Equity Earnings
and dividends received by International Paper, have been prepared by the
management of Ilim. Any projected financial information and statistical measures
reflect the current views of Ilim management and are subject to risks and
uncertainties that could cause actual results to differ materially from those
expressed or implied by such projections. See “Forward-Looking Statements.”
4
Earnings Presentation | Fourth Quarter and Full-Year 2017
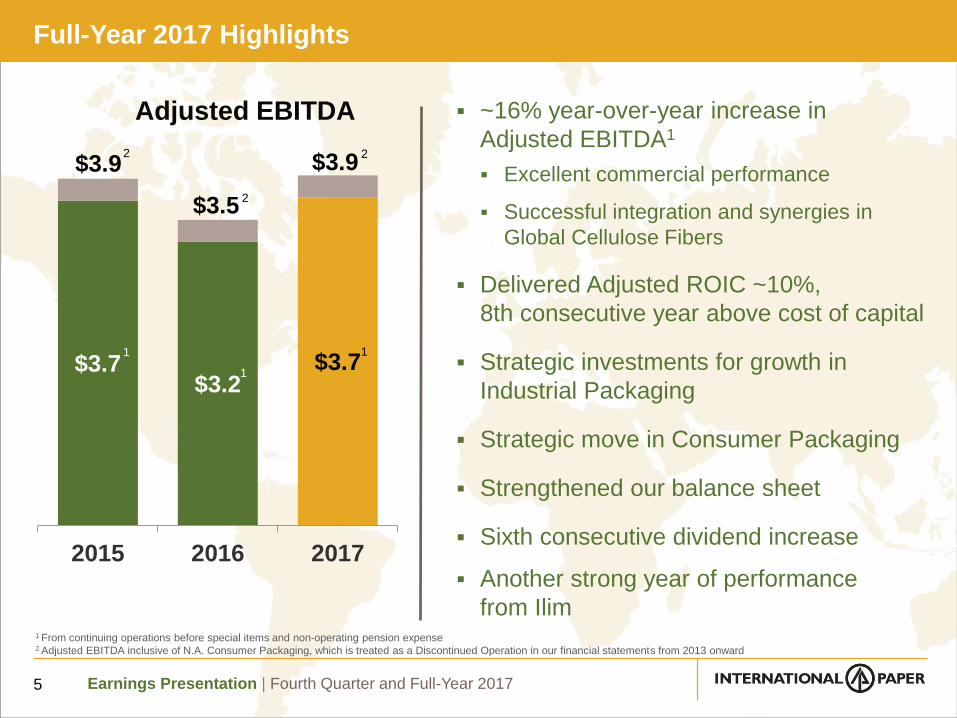
$3.7$3.2
$3.7
2015 2016 2017
Adjusted EBITDA
$3.9
Full-Year 2017 Highlights
~16% year-over-year increase in
Adjusted EBITDA1
Excellent commercial performance
Successful integration and synergies in
Global Cellulose Fibers
Delivered Adjusted ROIC ~10%,
8th consecutive year above cost of capital
Strategic investments for growth in
Industrial Packaging
Strategic move in Consumer Packaging
Strengthened our balance sheet
Sixth consecutive dividend increase
Another strong year of performance
from Ilim
5
1 From continuing operations before special items and non-operating pension expense2 Adjusted EBITDA inclusive of N.A. Consumer Packaging, which is treated as a Discontinued Operation in our financial statements from 2013 onward
1
1
1
$3.5
$3.92
2
2
Earnings Presentation | Fourth Quarter and Full-Year 2017
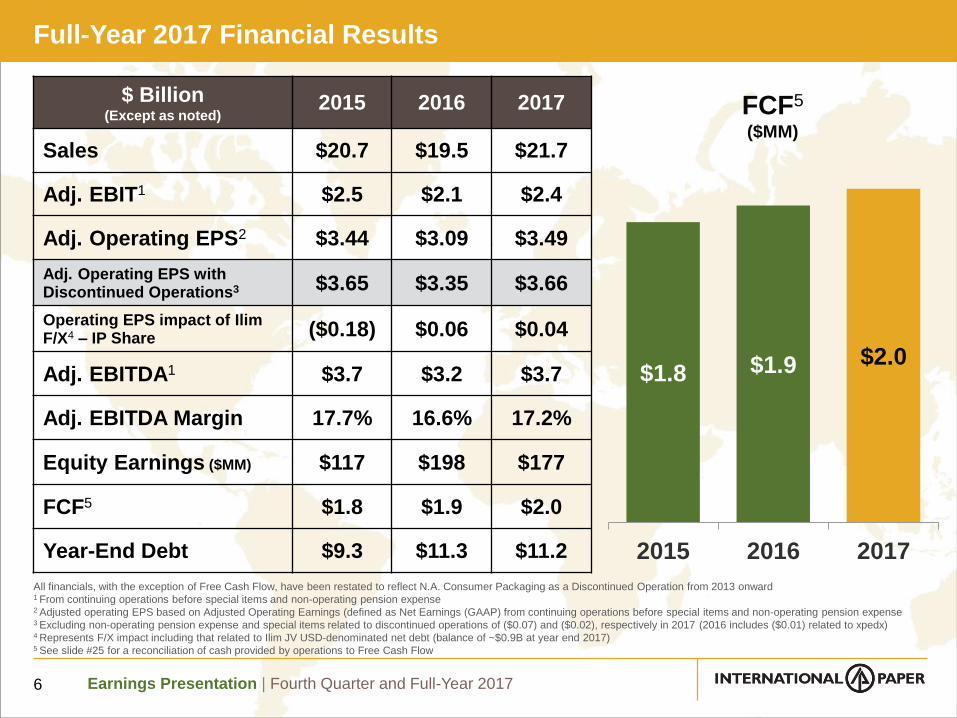
Full-Year 2017 Financial Results
$ Billion(Except as noted)
2015 2016 2017
Sales $20.7 $19.5 $21.7
Adj. EBIT1 $2.5 $2.1 $2.4
Adj. Operating EPS2 $3.44 $3.09 $3.49
Adj. Operating EPS with Discontinued Operations3 $3.65 $3.35 $3.66
Operating EPS impact of IlimF/X4 – IP Share ($0.18) $0.06 $0.04
Adj. EBITDA1 $3.7 $3.2 $3.7
Adj. EBITDA Margin 17.7% 16.6% 17.2%
Equity Earnings ($MM) $117 $198 $177
FCF5 $1.8 $1.9 $2.0
Year-End Debt $9.3 $11.3 $11.2
All financials, with the exception of Free Cash Flow, have been restated to reflect N.A. Consumer Packaging as a Discontinued Operation from 2013 onward1 From continuing operations before special items and non-operating pension expense2 Adjusted operating EPS based on Adjusted Operating Earnings (defined as Net Earnings (GAAP) from continuing operations before special items and non-operating pension expense3 Excluding non-operating pension expense and special items related to discontinued operations of ($0.07) and ($0.02), respectively in 2017 (2016 includes ($0.01) related to xpedx)4 Represents F/X impact including that related to Ilim JV USD-denominated net debt (balance of ~$0.9B at year end 2017)5 See slide #25 for a reconciliation of cash provided by operations to Free Cash Flow
6
$1.8 $1.9 $2.0
2015 2016 2017
FCF5
($MM)
Earnings Presentation | Fourth Quarter and Full-Year 2017
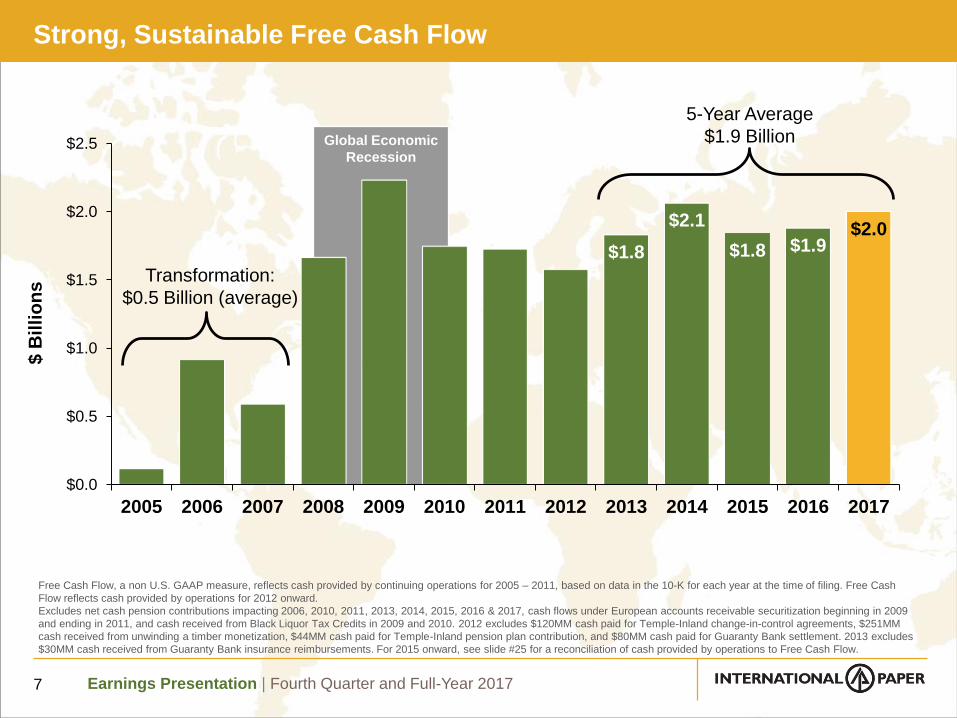
Global Economic
Recession
$1.8
$2.1
$1.8 $1.9$2.0
$0.0
$0.5
$1.0
$1.5
$2.0
$2.5
2005 2006 2007 2008 2009 2010 2011 2012 2013 2014 2015 2016 2017
$ B
illi
on
sStrong, Sustainable Free Cash Flow
Free Cash Flow, a non U.S. GAAP measure, reflects cash provided by continuing operations for 2005 – 2011, based on data in the 10-K for each year at the time of filing. Free Cash
Flow reflects cash provided by operations for 2012 onward.
Excludes net cash pension contributions impacting 2006, 2010, 2011, 2013, 2014, 2015, 2016 & 2017, cash flows under European accounts receivable securitization beginning in 2009
and ending in 2011, and cash received from Black Liquor Tax Credits in 2009 and 2010. 2012 excludes $120MM cash paid for Temple-Inland change-in-control agreements, $251MM
cash received from unwinding a timber monetization, $44MM cash paid for Temple-Inland pension plan contribution, and $80MM cash paid for Guaranty Bank settlement. 2013 excludes
$30MM cash received from Guaranty Bank insurance reimbursements. For 2015 onward, see slide #25 for a reconciliation of cash provided by operations to Free Cash Flow.
Transformation:
$0.5 Billion (average)
5-Year Average
$1.9 Billion
7
Earnings Presentation | Fourth Quarter and Full-Year 2017
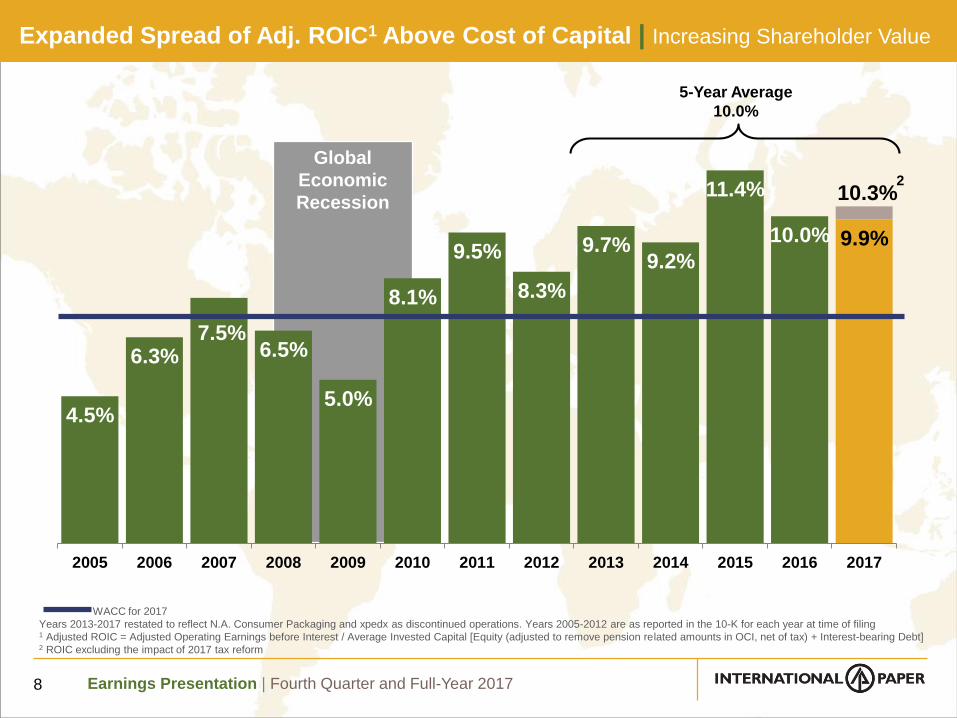
Global
Economic
Recession
4.5%
6.3%7.5%
6.5%
5.0%
8.1%
9.5%
8.3%
9.7%9.2%
11.4%
10.0% 9.9%
2005 2006 2007 2008 2009 2010 2011 2012 2013 2014 2015 2016 2017
Expanded Spread of Adj. ROIC1 Above Cost of Capital | Increasing Shareholder Value
8
5-Year Average
10.0%
WACC for 2017
Years 2013-2017 restated to reflect N.A. Consumer Packaging and xpedx as discontinued operations. Years 2005-2012 are as reported in the 10-K for each year at time of filing1 Adjusted ROIC = Adjusted Operating Earnings before Interest / Average Invested Capital [Equity (adjusted to remove pension related amounts in OCI, net of tax) + Interest-bearing Debt]2 ROIC excluding the impact of 2017 tax reform
10.3%2
Earnings Presentation | Fourth Quarter and Full-Year 2017
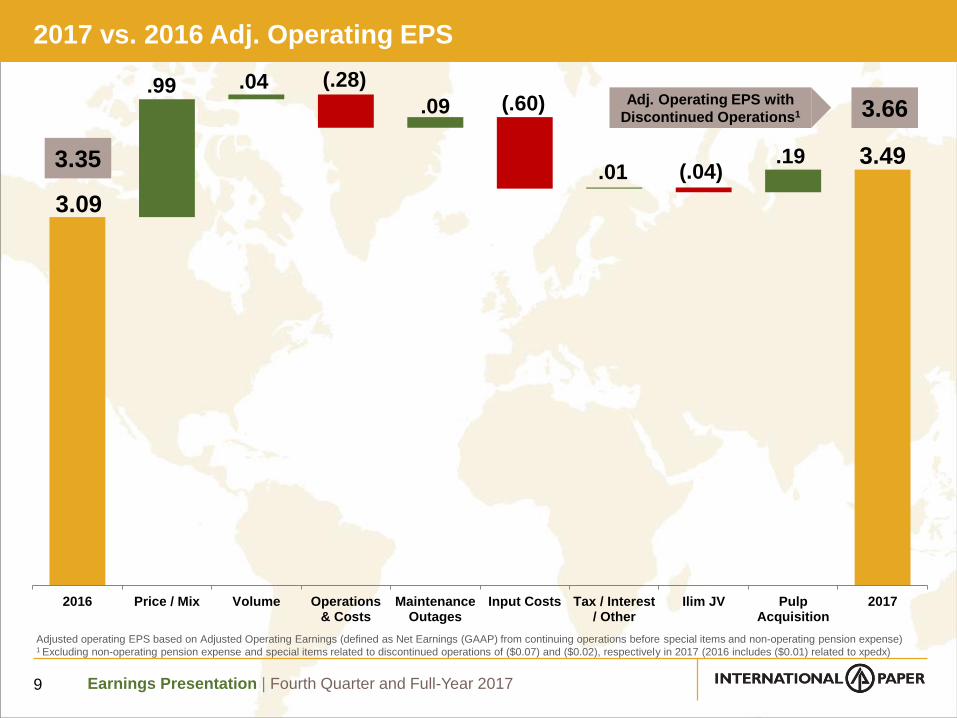
3.09
3.49
(.28)(.60)
(.04)
.99 .04.09
.01.19
2016 Price / Mix Volume Operations& Costs
MaintenanceOutages
Input Costs Tax / Interest/ Other
Ilim JV PulpAcquisition
2017
2017 vs. 2016 Adj. Operating EPS
9
Adjusted operating EPS based on Adjusted Operating Earnings (defined as Net Earnings (GAAP) from continuing operations before special items and non-operating pension expense)1 Excluding non-operating pension expense and special items related to discontinued operations of ($0.07) and ($0.02), respectively in 2017 (2016 includes ($0.01) related to xpedx)
3.66
3.35
Adj. Operating EPS with
Discontinued Operations1
Earnings Presentation | Fourth Quarter and Full-Year 2017
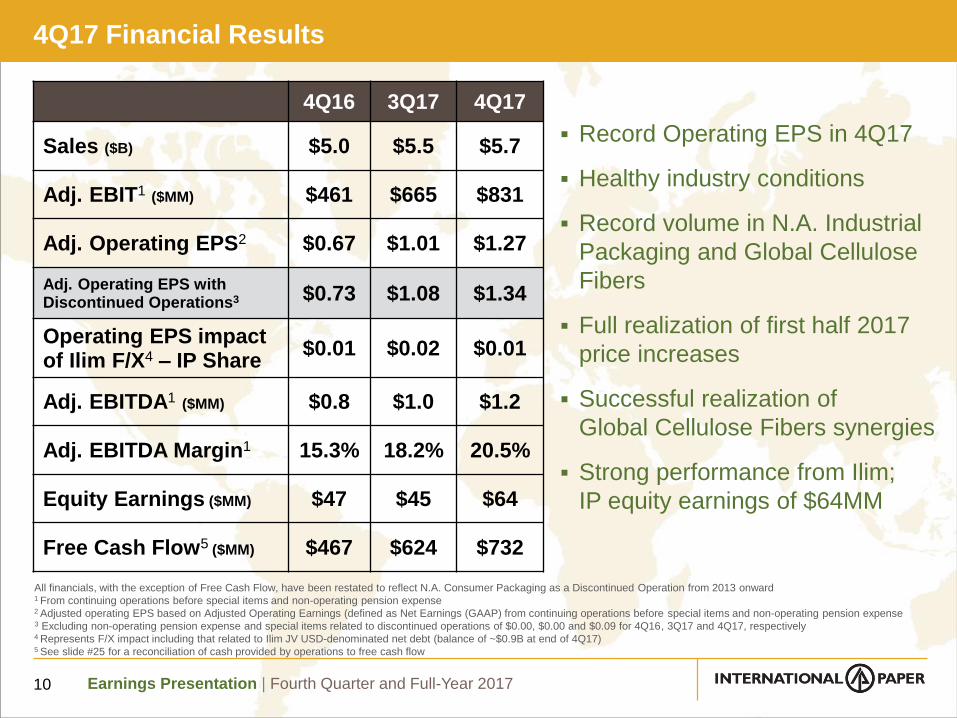
4Q17 Financial Results
4Q16 3Q17 4Q17
Sales ($B) $5.0 $5.5 $5.7
Adj. EBIT1 ($MM) $461 $665 $831
Adj. Operating EPS2 $0.67 $1.01 $1.27
Adj. Operating EPS with Discontinued Operations3 $0.73 $1.08 $1.34
Operating EPS impact of Ilim F/X4 – IP Share
$0.01 $0.02 $0.01
Adj. EBITDA1 ($MM) $0.8 $1.0 $1.2
Adj. EBITDA Margin1 15.3% 18.2% 20.5%
Equity Earnings ($MM) $47 $45 $64
Free Cash Flow5 ($MM) $467 $624 $732
All financials, with the exception of Free Cash Flow, have been restated to reflect N.A. Consumer Packaging as a Discontinued Operation from 2013 onward1 From continuing operations before special items and non-operating pension expense2 Adjusted operating EPS based on Adjusted Operating Earnings (defined as Net Earnings (GAAP) from continuing operations before special items and non-operating pension expense3 Excluding non-operating pension expense and special items related to discontinued operations of $0.00, $0.00 and $0.09 for 4Q16, 3Q17 and 4Q17, respectively4 Represents F/X impact including that related to Ilim JV USD-denominated net debt (balance of ~$0.9B at end of 4Q17)5 See slide #25 for a reconciliation of cash provided by operations to free cash flow
10
Record Operating EPS in 4Q17
Healthy industry conditions
Record volume in N.A. Industrial
Packaging and Global Cellulose
Fibers
Full realization of first half 2017
price increases
Successful realization of
Global Cellulose Fibers synergies
Strong performance from Ilim;
IP equity earnings of $64MM
Earnings Presentation | Fourth Quarter and Full-Year 2017
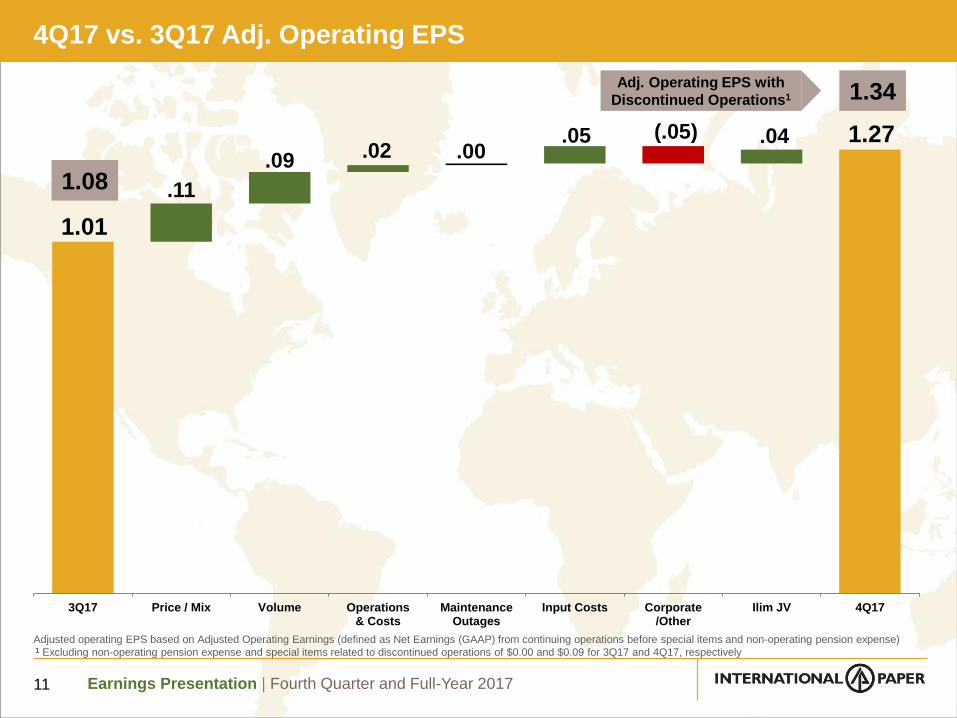
1.01
1.27(.05)
.11
.09 .02 .00.05 .04
3Q17 Price / Mix Volume Operations& Costs
MaintenanceOutages
Input Costs Corporate/Other
Ilim JV 4Q17
4Q17 vs. 3Q17 Adj. Operating EPS
11
Adjusted operating EPS based on Adjusted Operating Earnings (defined as Net Earnings (GAAP) from continuing operations before special items and non-operating pension expense)1 Excluding non-operating pension expense and special items related to discontinued operations of $0.00 and $0.09 for 3Q17 and 4Q17, respectively
1.34
1.08
Adj. Operating EPS with
Discontinued Operations1
Earnings Presentation | Fourth Quarter and Full-Year 2017
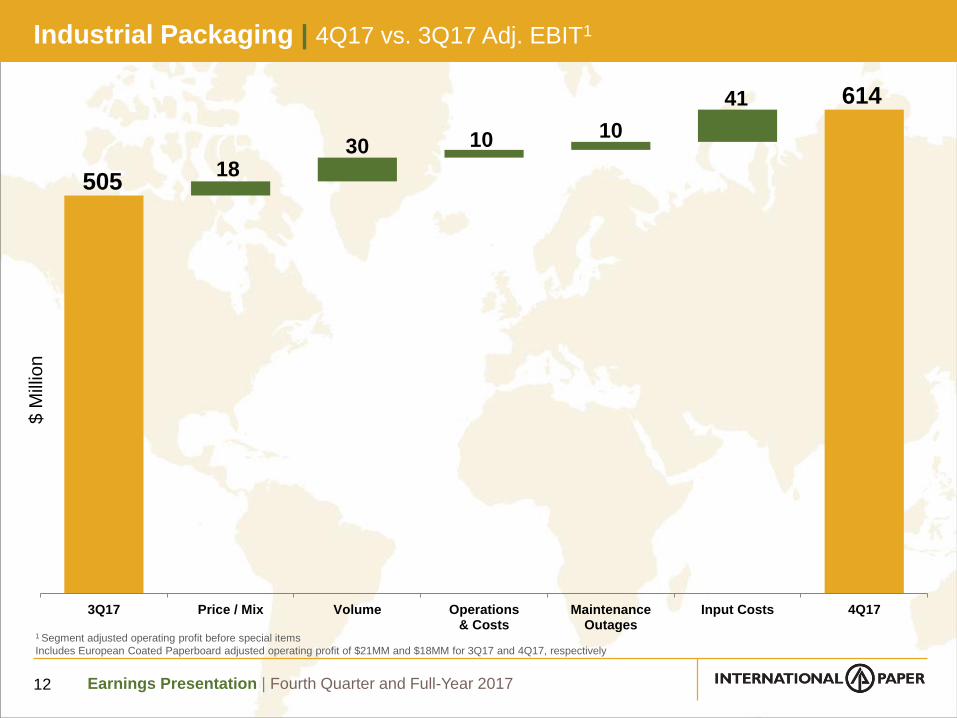
505
614
1830 10 10
41
3Q17 Price / Mix Volume Operations& Costs
MaintenanceOutages
Input Costs 4Q17
Industrial Packaging | 4Q17 vs. 3Q17 Adj. EBIT1
12
$ M
illio
n
1 Segment adjusted operating profit before special items
Includes European Coated Paperboard adjusted operating profit of $21MM and $18MM for 3Q17 and 4Q17, respectively
Earnings Presentation | Fourth Quarter and Full-Year 2017
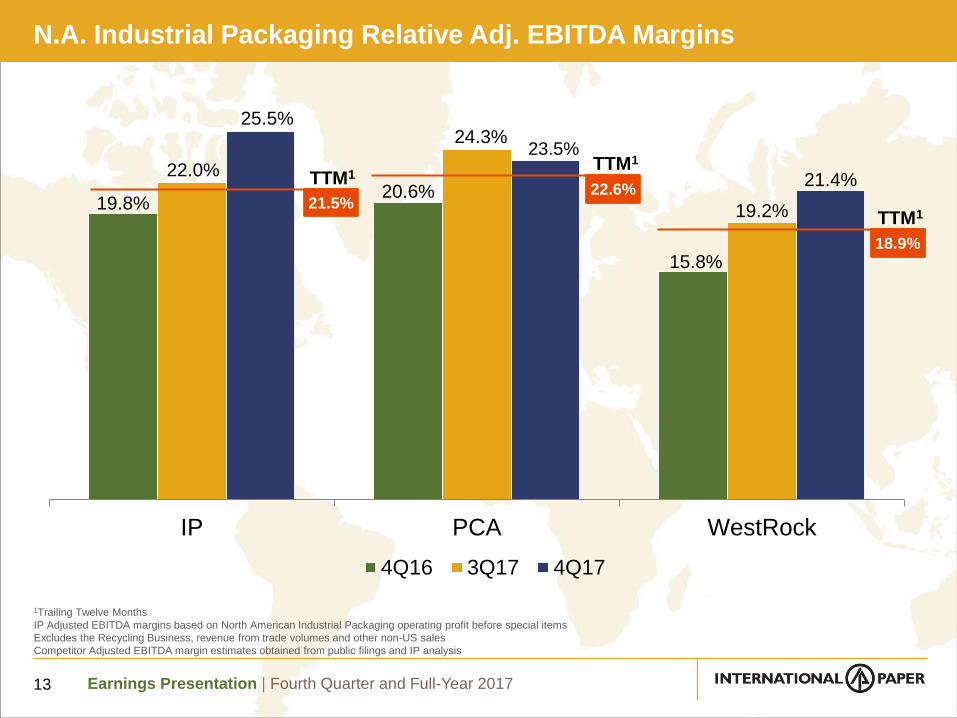
N.A. Industrial Packaging Relative Adj. EBITDA Margins
13
19.8%20.6%
15.8%
22.0%
24.3%
19.2%
25.5%
23.5%
21.4%
IP PCA WestRock
4Q16 3Q17 4Q17
1Trailing Twelve Months
IP Adjusted EBITDA margins based on North American Industrial Packaging operating profit before special items
Excludes the Recycling Business, revenue from trade volumes and other non-US sales
Competitor Adjusted EBITDA margin estimates obtained from public filings and IP analysis
TTM1
21.5%22.6%
TTM1
18.9%
TTM1
Earnings Presentation | Fourth Quarter and Full-Year 2017
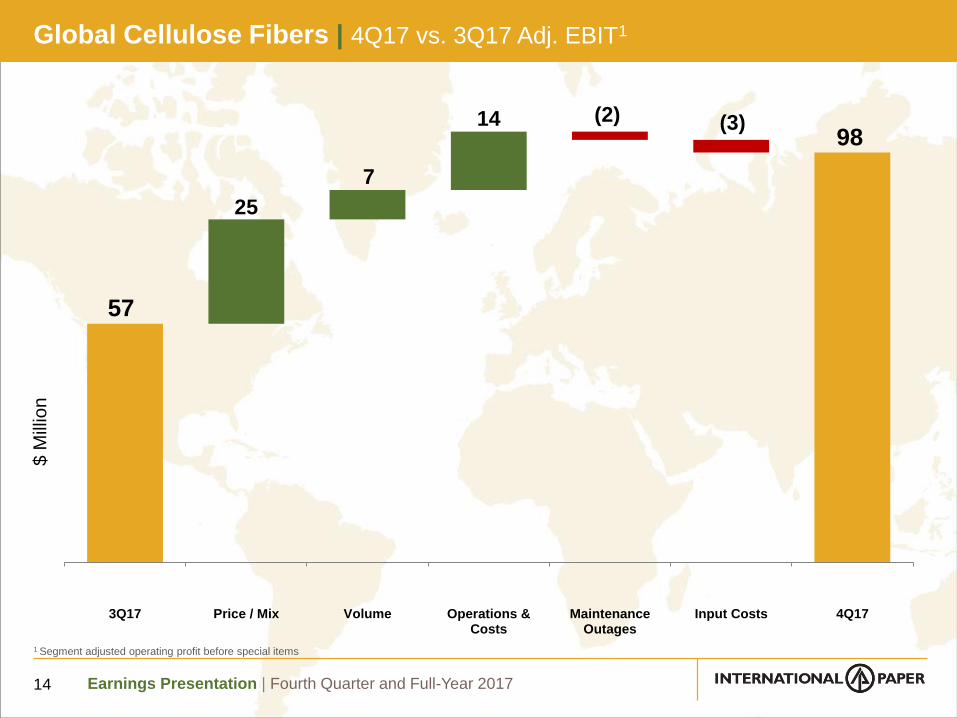
Global Cellulose Fibers | 4Q17 vs. 3Q17 Adj. EBIT1
14
1 Segment adjusted operating profit before special items
57
98(2) (3)
25
7
14
3Q17 Price / Mix Volume Operations &Costs
MaintenanceOutages
Input Costs 4Q17
$ M
illio
n
Earnings Presentation | Fourth Quarter and Full-Year 2017
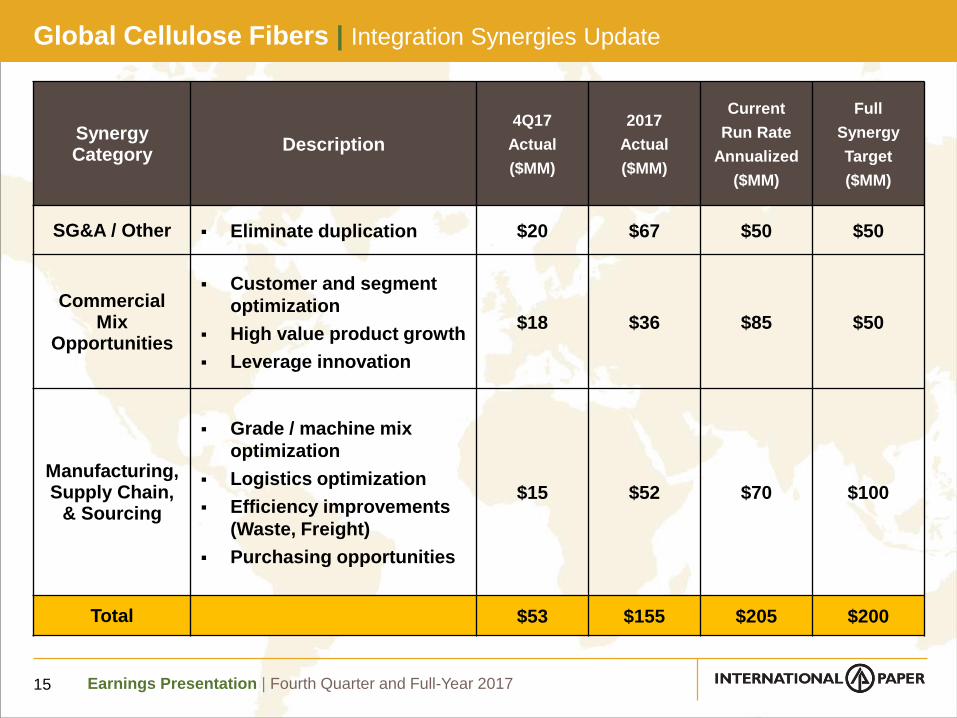
Global Cellulose Fibers | Integration Synergies Update
15
Synergy Category
Description
4Q17
Actual
($MM)
2017
Actual
($MM)
Current
Run Rate
Annualized
($MM)
Full
Synergy
Target
($MM)
SG&A / Other Eliminate duplication $20 $67 $50 $50
Commercial Mix
Opportunities
Customer and segment
optimization
High value product growth
Leverage innovation
$18 $36 $85 $50
Manufacturing, Supply Chain,
& Sourcing
Grade / machine mix
optimization
Logistics optimization
Efficiency improvements
(Waste, Freight)
Purchasing opportunities
$15 $52 $70 $100
Total $53 $155 $205 $200
Earnings Presentation | Fourth Quarter and Full-Year 2017
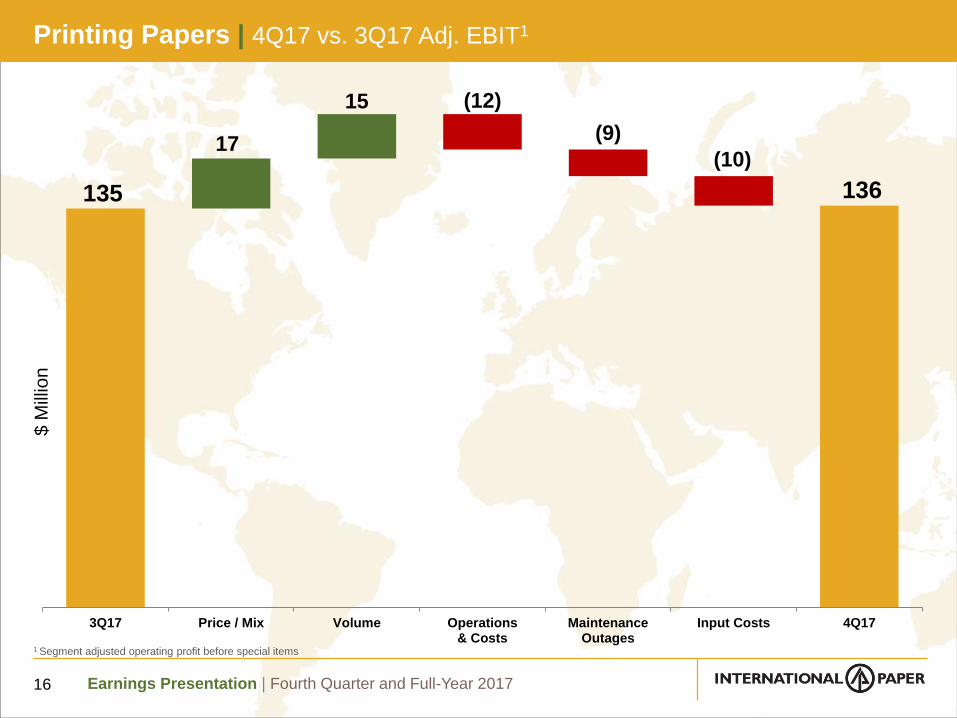
135 136
(12)
(9)
(10)17
15
3Q17 Price / Mix Volume Operations& Costs
MaintenanceOutages
Input Costs 4Q17
Printing Papers | 4Q17 vs. 3Q17 Adj. EBIT1
16
$ M
illio
n
1 Segment adjusted operating profit before special items
Earnings Presentation | Fourth Quarter and Full-Year 2017
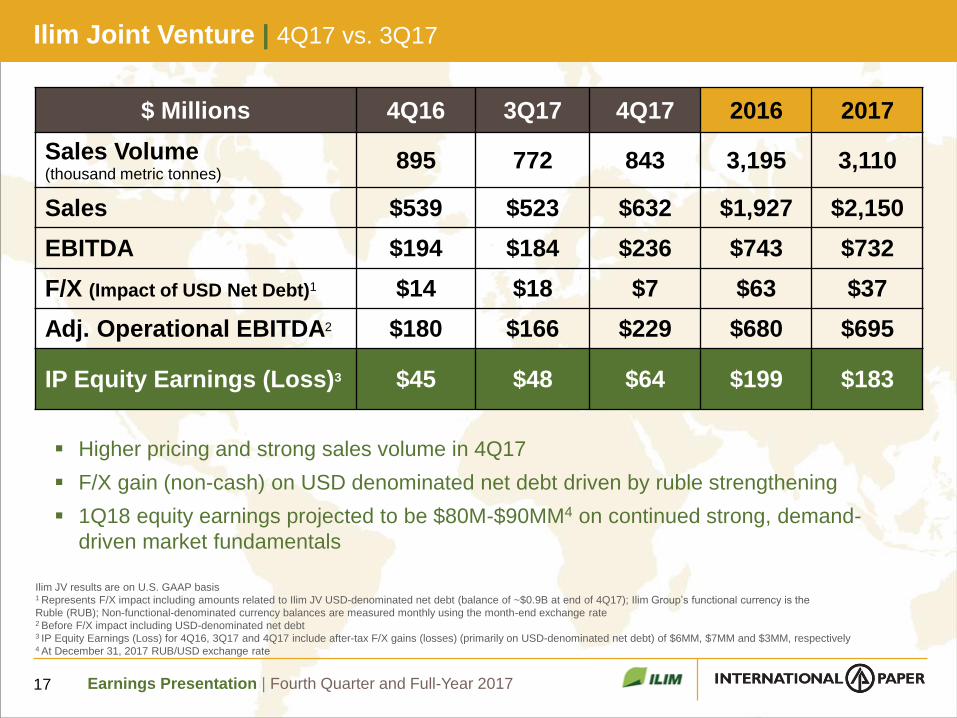
Ilim Joint Venture | 4Q17 vs. 3Q17
$ Millions 4Q16 3Q17 4Q17 2016 2017
Sales Volume (thousand metric tonnes)
895 772 843 3,195 3,110
Sales $539 $523 $632 $1,927 $2,150
EBITDA $194 $184 $236 $743 $732
F/X (Impact of USD Net Debt)1 $14 $18 $7 $63 $37
Adj. Operational EBITDA2 $180 $166 $229 $680 $695
IP Equity Earnings (Loss)3 $45 $48 $64 $199 $183
Higher pricing and strong sales volume in 4Q17
F/X gain (non-cash) on USD denominated net debt driven by ruble strengthening
1Q18 equity earnings projected to be $80M-$90MM4 on continued strong, demand-
driven market fundamentals
17
Ilim JV results are on U.S. GAAP basis 1 Represents F/X impact including amounts related to Ilim JV USD-denominated net debt (balance of ~$0.9B at end of 4Q17); Ilim Group’s functional currency is the
Ruble (RUB); Non-functional-denominated currency balances are measured monthly using the month-end exchange rate2 Before F/X impact including USD-denominated net debt3 IP Equity Earnings (Loss) for 4Q16, 3Q17 and 4Q17 include after-tax F/X gains (losses) (primarily on USD-denominated net debt) of $6MM, $7MM and $3MM, respectively4 At December 31, 2017 RUB/USD exchange rate
Earnings Presentation | Fourth Quarter and Full-Year 2017
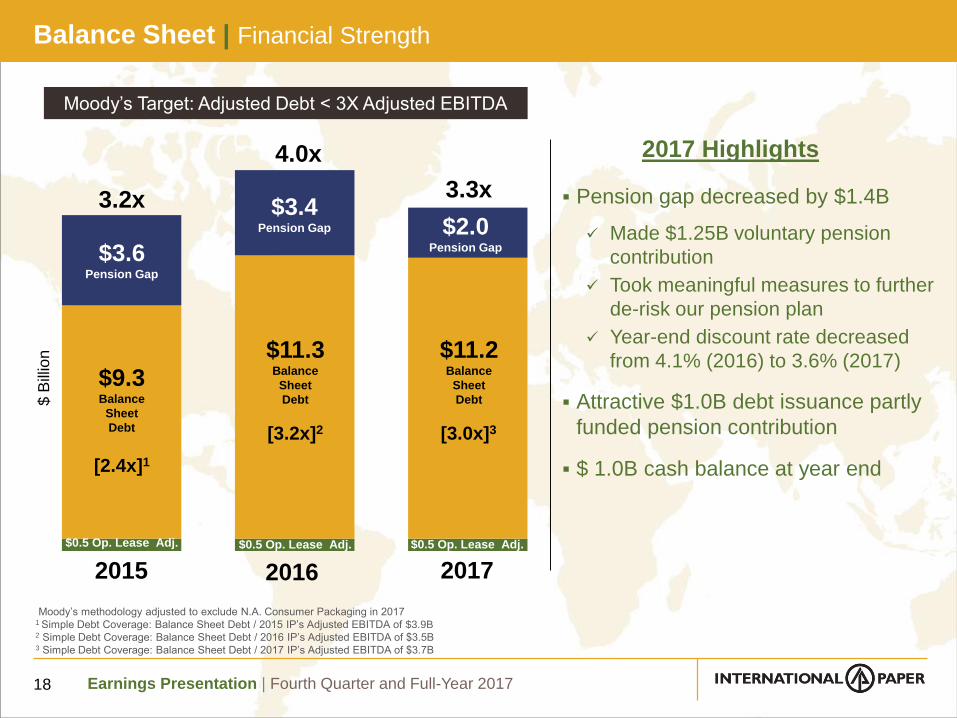
Balance Sheet | Financial Strength$
Bill
ion
3.2x
$9.3Balance
Sheet
Debt
$0.5 Op. Lease Adj. $0.5 Op. Lease Adj.
$3.4Pension Gap
20162015 2017
3.3x
[2.4x]1
Moody’s Target: Adjusted Debt < 3X Adjusted EBITDA
Pension gap decreased by $1.4B
Made $1.25B voluntary pension
contribution
Took meaningful measures to further
de-risk our pension plan
Year-end discount rate decreased
from 4.1% (2016) to 3.6% (2017)
Attractive $1.0B debt issuance partly
funded pension contribution
$ 1.0B cash balance at year end
$11.3Balance
Sheet
Debt
[3.2x]2
$0.5 Op. Lease Adj.
$3.6Pension Gap
4.0x
18
$11.2Balance
Sheet
Debt
$2.0Pension Gap
[3.0x]3
2017 Highlights
Moody’s methodology adjusted to exclude N.A. Consumer Packaging in 20171 Simple Debt Coverage: Balance Sheet Debt / 2015 IP’s Adjusted EBITDA of $3.9B2 Simple Debt Coverage: Balance Sheet Debt / 2016 IP’s Adjusted EBITDA of $3.5B3 Simple Debt Coverage: Balance Sheet Debt / 2017 IP’s Adjusted EBITDA of $3.7B
Earnings Presentation | Fourth Quarter and Full-Year 2017
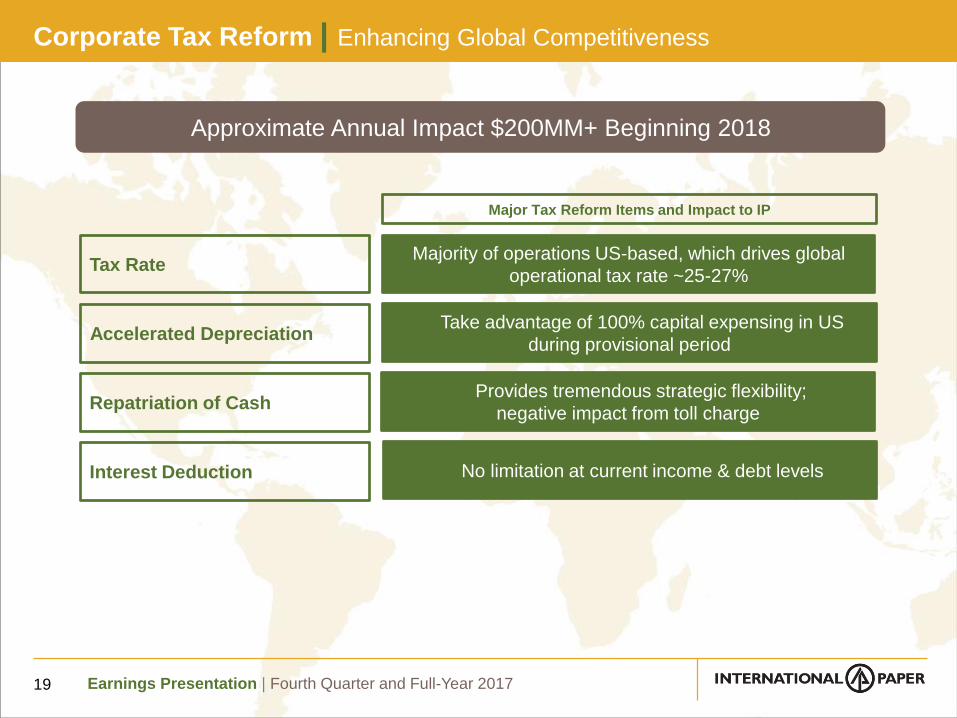
Corporate Tax Reform | Enhancing Global Competitiveness
19
Tax RateMajority of operations US-based, which drives global
operational tax rate ~25-27%
Interest Deduction No limitation at current income & debt levels
Accelerated DepreciationTake advantage of 100% capital expensing in US
during provisional period
Repatriation of CashProvides tremendous strategic flexibility;
negative impact from toll charge
Approximate Annual Impact $200MM+ Beginning 2018
Major Tax Reform Items and Impact to IP
Earnings Presentation | Fourth Quarter and Full-Year 2017
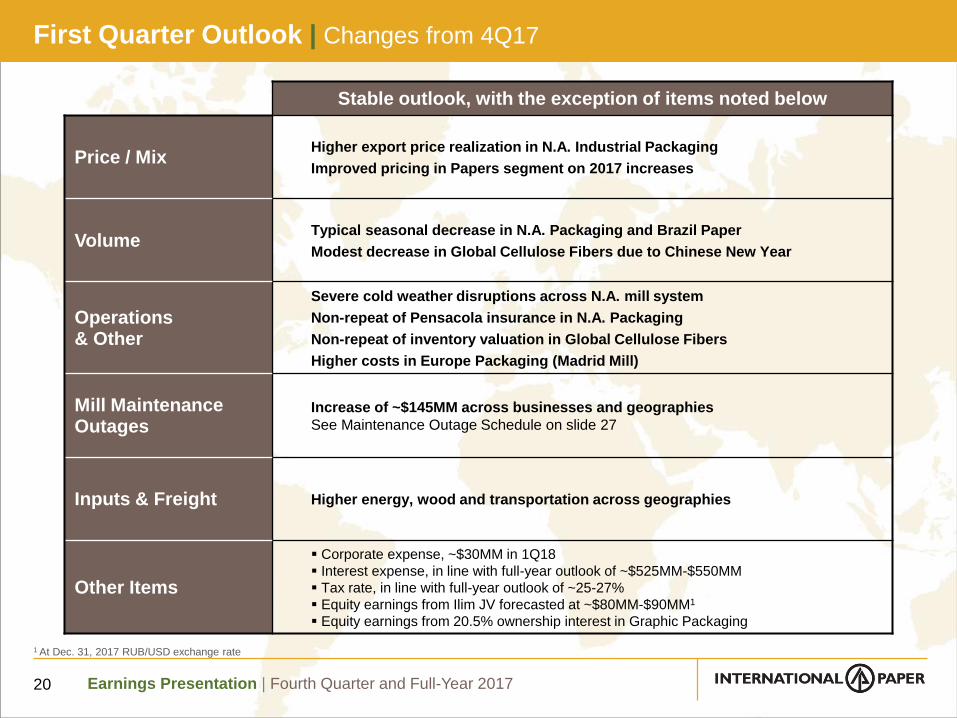
First Quarter Outlook | Changes from 4Q17
20
Stable outlook, with the exception of items noted below
Price / MixHigher export price realization in N.A. Industrial Packaging
Improved pricing in Papers segment on 2017 increases
VolumeTypical seasonal decrease in N.A. Packaging and Brazil Paper
Modest decrease in Global Cellulose Fibers due to Chinese New Year
Operations & Other
Severe cold weather disruptions across N.A. mill system
Non-repeat of Pensacola insurance in N.A. Packaging
Non-repeat of inventory valuation in Global Cellulose Fibers
Higher costs in Europe Packaging (Madrid Mill)
Mill Maintenance Outages
Increase of ~$145MM across businesses and geographies
See Maintenance Outage Schedule on slide 27
Inputs & Freight Higher energy, wood and transportation across geographies
Other Items
Corporate expense, ~$30MM in 1Q18
Interest expense, in line with full-year outlook of ~$525MM-$550MM
Tax rate, in line with full-year outlook of ~25-27%
Equity earnings from Ilim JV forecasted at ~$80MM-$90MM1
Equity earnings from 20.5% ownership interest in Graphic Packaging
1 At Dec. 31, 2017 RUB/USD exchange rate
Earnings Presentation | Fourth Quarter and Full-Year 2017
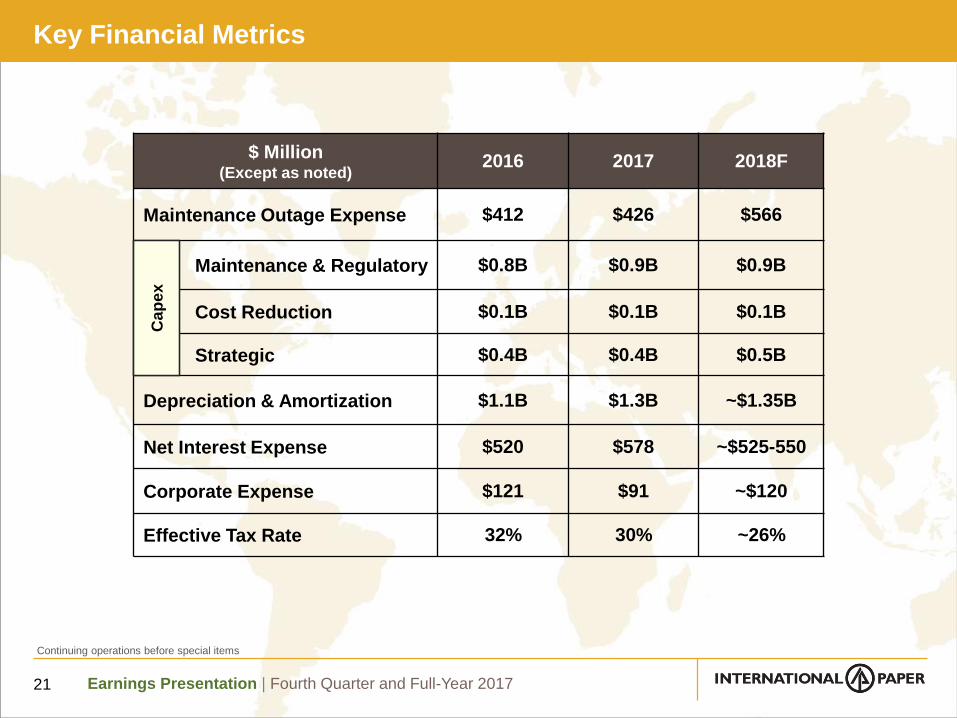
Key Financial Metrics
21
$ Million(Except as noted)
2016 2017 2018F
Maintenance Outage Expense $412 $426 $566
Maintenance & Regulatory $0.8B $0.9B $0.9B
Cost Reduction $0.1B $0.1B $0.1B
Strategic $0.4B $0.4B $0.5B
Depreciation & Amortization $1.1B $1.3B ~$1.35B
Net Interest Expense $520 $578 ~$525-550
Corporate Expense $121 $91 ~$120
Effective Tax Rate 32% 30% ~26%
Cap
ex
Continuing operations before special items
Earnings Presentation | Fourth Quarter and Full-Year 201722
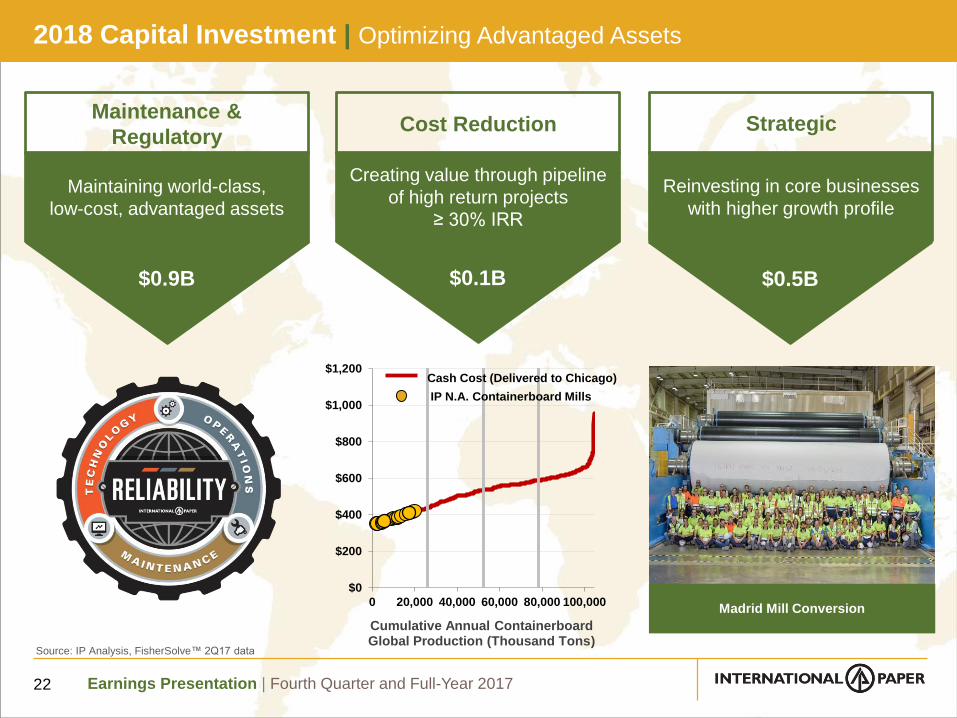
2018 Capital Investment | Optimizing Advantaged Assets
$0
$200
$400
$600
$800
$1,000
$1,200
0 20,000 40,000 60,000 80,000 100,000
Cumulative Annual Containerboard Global Production (Thousand Tons)
IP N.A. Containerboard Mills
Cash Cost (Delivered to Chicago)
Source: IP Analysis, FisherSolve™ 2Q17 data
Maintenance &
Regulatory
Maintaining world-class,
low-cost, advantaged assets
Madrid Mill Conversion
$0.9B $0.2B $0.4B
Cost Reduction Strategic
Creating value through pipeline
of high return projects
≥ 30% IRR
Reinvesting in core businesses
with higher growth profile
$0.1B $0.5B
Earnings Presentation | Fourth Quarter and Full-Year 2017
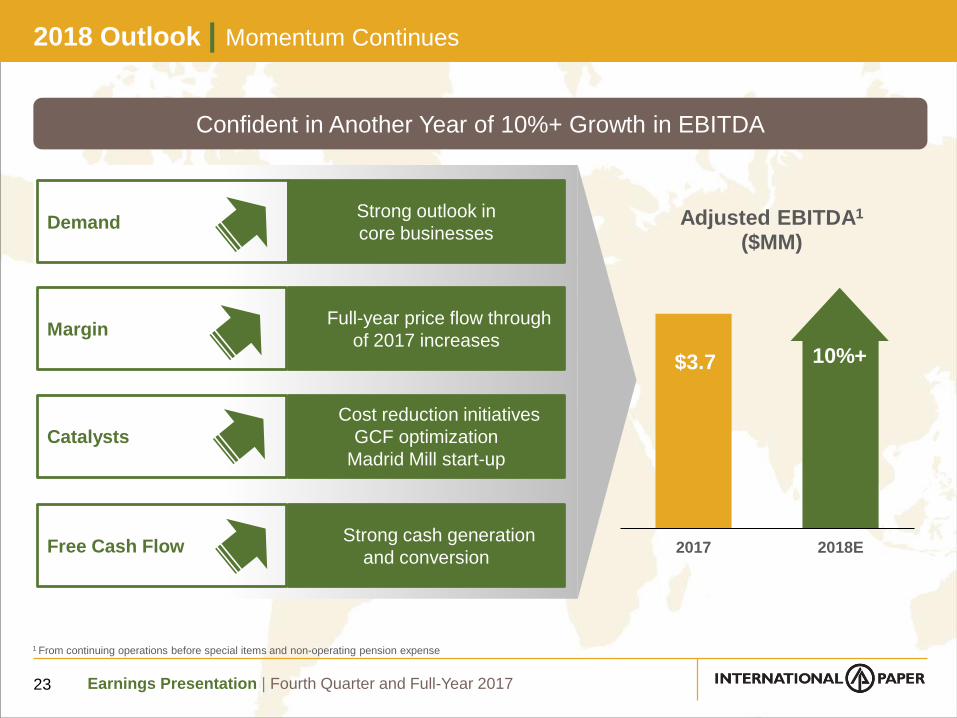
2018 Outlook | Momentum Continues
23
Confident in Another Year of 10%+ Growth in EBITDA
Free Cash FlowStrong cash generation
and conversion
Strong outlook in
core businessesDemand
Catalysts
Cost reduction initiatives
GCF optimization
Madrid Mill start-up
MarginFull-year price flow through
of 2017 increases
$3.7
2017 2018E
Adjusted EBITDA1
($MM)
10%+
1 From continuing operations before special items and non-operating pension expense
Earnings Presentation | Fourth Quarter and Full-Year 2017
AppendixInvestor Relations Contacts
Guillermo Gutierrez +1-901-419-1731
Michele Vargas +1-901-419-7287
Media Contact
Tom Ryan +1-901-419-4333
24
Earnings Presentation | Fourth Quarter and Full-Year 2017
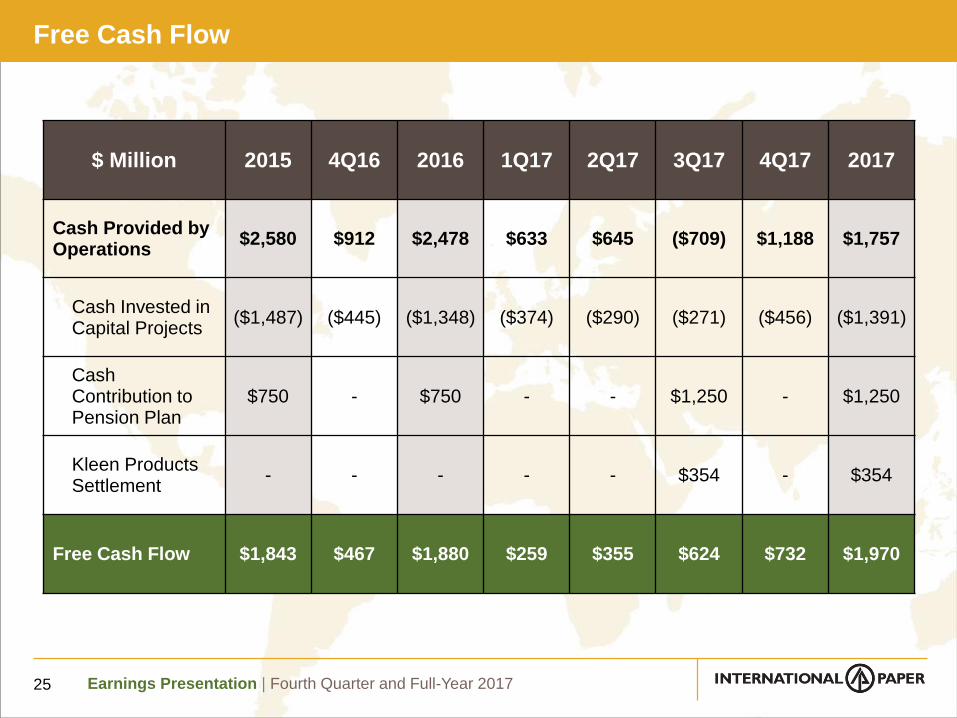
$ Million 2015 4Q16 2016 1Q17 2Q17 3Q17 4Q17 2017
Cash Provided by Operations
$2,580 $912 $2,478 $633 $645 ($709) $1,188 $1,757
Cash Invested in Capital Projects
($1,487) ($445) ($1,348) ($374) ($290) ($271) ($456) ($1,391)
Cash Contribution to Pension Plan
$750 - $750 - - $1,250 - $1,250
Kleen Products Settlement
- - - - - $354 - $354
Free Cash Flow $1,843 $467 $1,880 $259 $355 $624 $732 $1,970
Free Cash Flow
25
Earnings Presentation | Fourth Quarter and Full-Year 2017
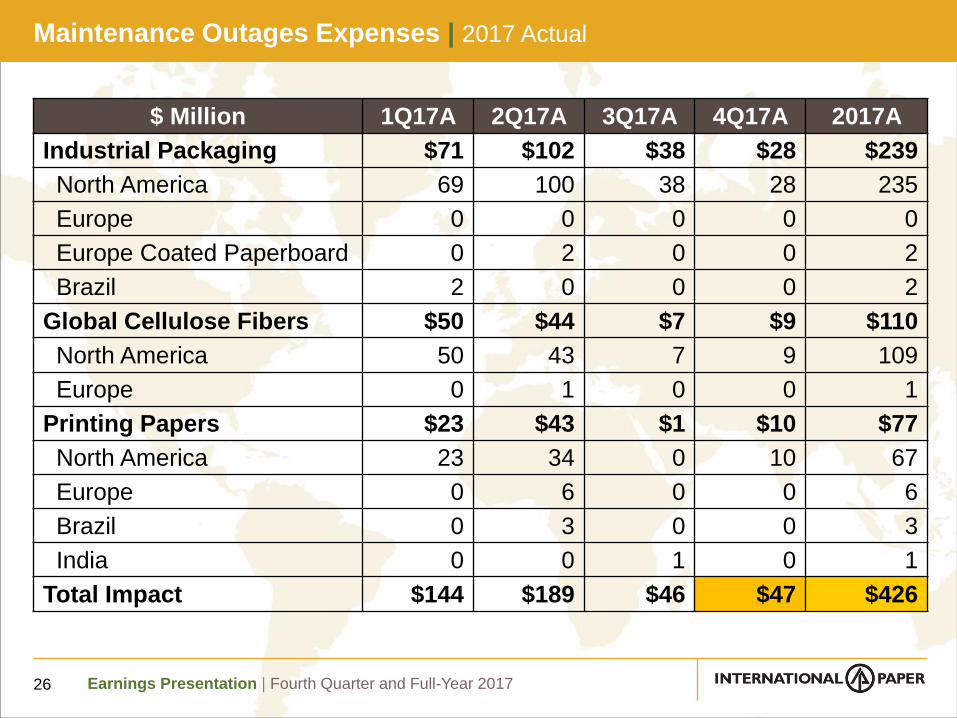
Maintenance Outages Expenses | 2017 Actual
26
$ Million 1Q17A 2Q17A 3Q17A 4Q17A 2017A
Industrial Packaging $71 $102 $38 $28 $239
North America 69 100 38 28 235
Europe 0 0 0 0 0
Europe Coated Paperboard 0 2 0 0 2
Brazil 2 0 0 0 2
Global Cellulose Fibers $50 $44 $7 $9 $110
North America 50 43 7 9 109
Europe 0 1 0 0 1
Printing Papers $23 $43 $1 $10 $77
North America 23 34 0 10 67
Europe 0 6 0 0 6
Brazil 0 3 0 0 3
India 0 0 1 0 1
Total Impact $144 $189 $46 $47 $426
Earnings Presentation | Fourth Quarter and Full-Year 2017
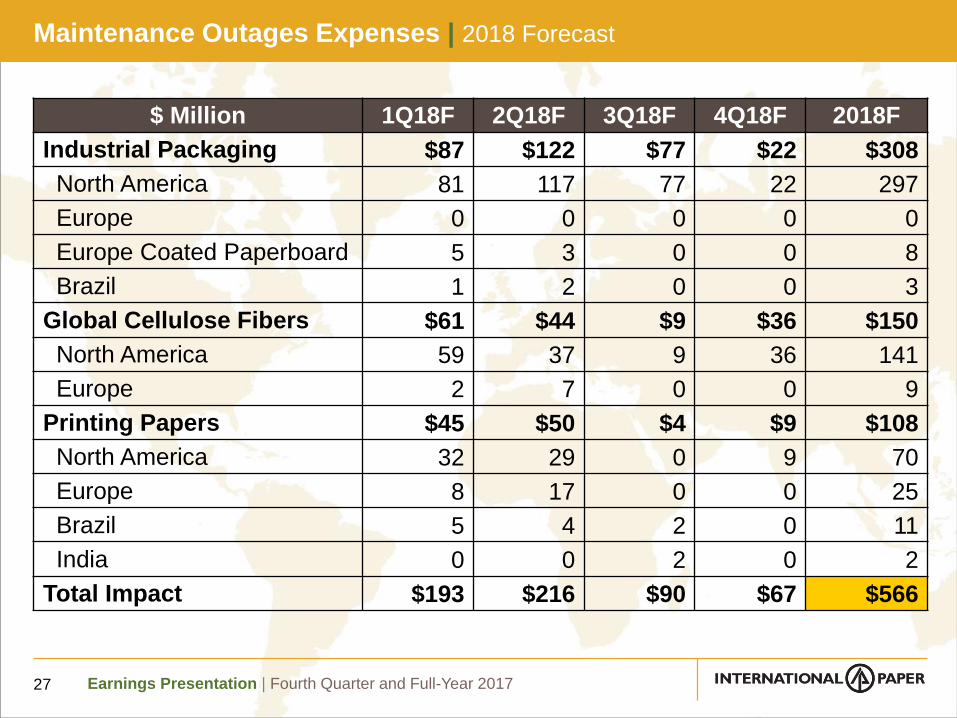
Maintenance Outages Expenses | 2018 Forecast
27
$ Million 1Q18F 2Q18F 3Q18F 4Q18F 2018F
Industrial Packaging $87 $122 $77 $22 $308
North America 81 117 77 22 297
Europe 0 0 0 0 0
Europe Coated Paperboard 5 3 0 0 8
Brazil 1 2 0 0 3
Global Cellulose Fibers $61 $44 $9 $36 $150
North America 59 37 9 36 141
Europe 2 7 0 0 9
Printing Papers $45 $50 $4 $9 $108
North America 32 29 0 9 70
Europe 8 17 0 0 25
Brazil 5 4 2 0 11
India 0 0 2 0 2
Total Impact $193 $216 $90 $67 $566
Earnings Presentation | Fourth Quarter and Full-Year 2017
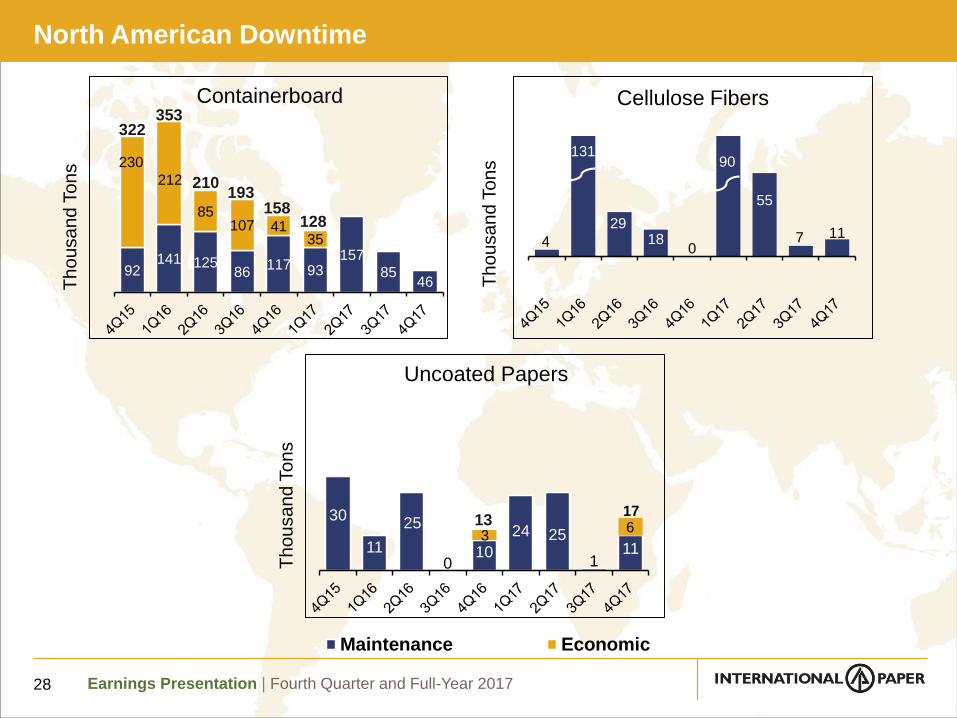
North American Downtime
28
92141 125
86117 93
157
8546
230
85107 41
35
Maintenance Economic
30
11
25
010
24 25
111
3617
4
2918
0
55
7 11
13190
Containerboard
Uncoated Papers
Cellulose Fibers
Th
ou
sa
nd
To
ns
Th
ou
sa
nd
To
ns
322353
210193
158
13
212
128
Th
ou
sa
nd
To
ns
Earnings Presentation | Fourth Quarter and Full-Year 2017
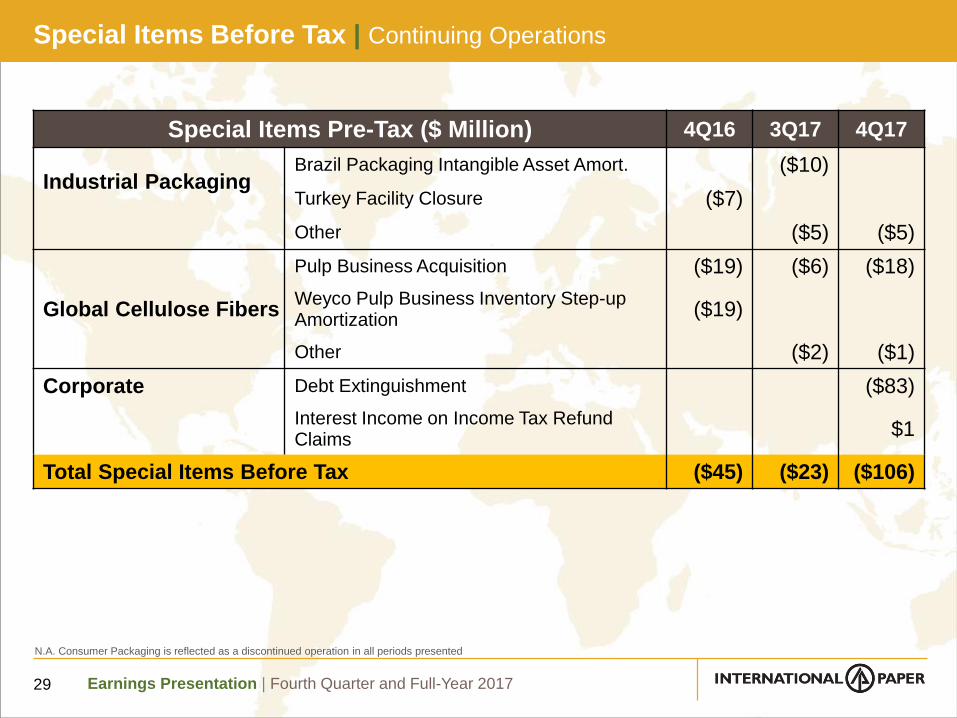
Special Items Pre-Tax ($ Million) 4Q16 3Q17 4Q17
Industrial PackagingBrazil Packaging Intangible Asset Amort. ($10)
Turkey Facility Closure ($7)
Other ($5) ($5)
Global Cellulose Fibers
Pulp Business Acquisition ($19) ($6) ($18)
Weyco Pulp Business Inventory Step-up Amortization
($19)
Other ($2) ($1)
Corporate Debt Extinguishment ($83)
Interest Income on Income Tax Refund Claims
$1
Total Special Items Before Tax ($45) ($23) ($106)
Special Items Before Tax | Continuing Operations
29
N.A. Consumer Packaging is reflected as a discontinued operation in all periods presented
Earnings Presentation | Fourth Quarter and Full-Year 2017
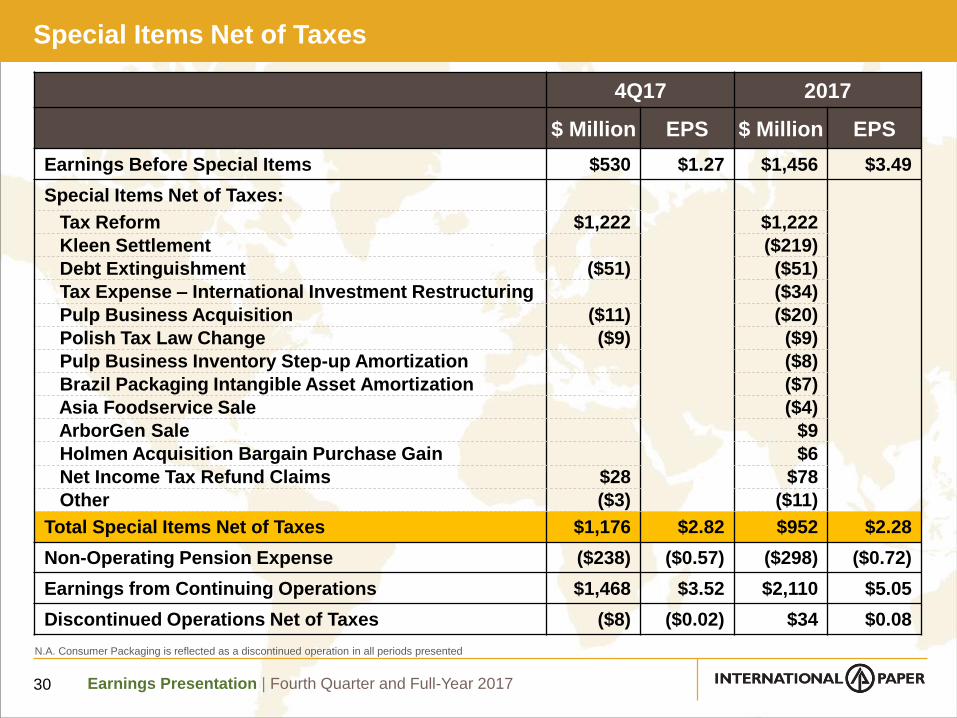
Special Items Net of Taxes
4Q17 2017
$ Million EPS $ Million EPS
Earnings Before Special Items $530 $1.27 $1,456 $3.49
Special Items Net of Taxes:
Tax Reform $1,222 $1,222
Kleen Settlement ($219)
Debt Extinguishment ($51) ($51)
Tax Expense – International Investment Restructuring ($34)
Pulp Business Acquisition ($11) ($20)
Polish Tax Law Change ($9) ($9)
Pulp Business Inventory Step-up Amortization ($8)
Brazil Packaging Intangible Asset Amortization ($7)
Asia Foodservice Sale ($4)
ArborGen Sale $9
Holmen Acquisition Bargain Purchase Gain $6
Net Income Tax Refund Claims $28 $78
Other ($3) ($11)
Total Special Items Net of Taxes $1,176 $2.82 $952 $2.28
Non-Operating Pension Expense ($238) ($0.57) ($298) ($0.72)
Earnings from Continuing Operations $1,468 $3.52 $2,110 $5.05
Discontinued Operations Net of Taxes ($8) ($0.02) $34 $0.08
30
N.A. Consumer Packaging is reflected as a discontinued operation in all periods presented
Earnings Presentation | Fourth Quarter and Full-Year 2017
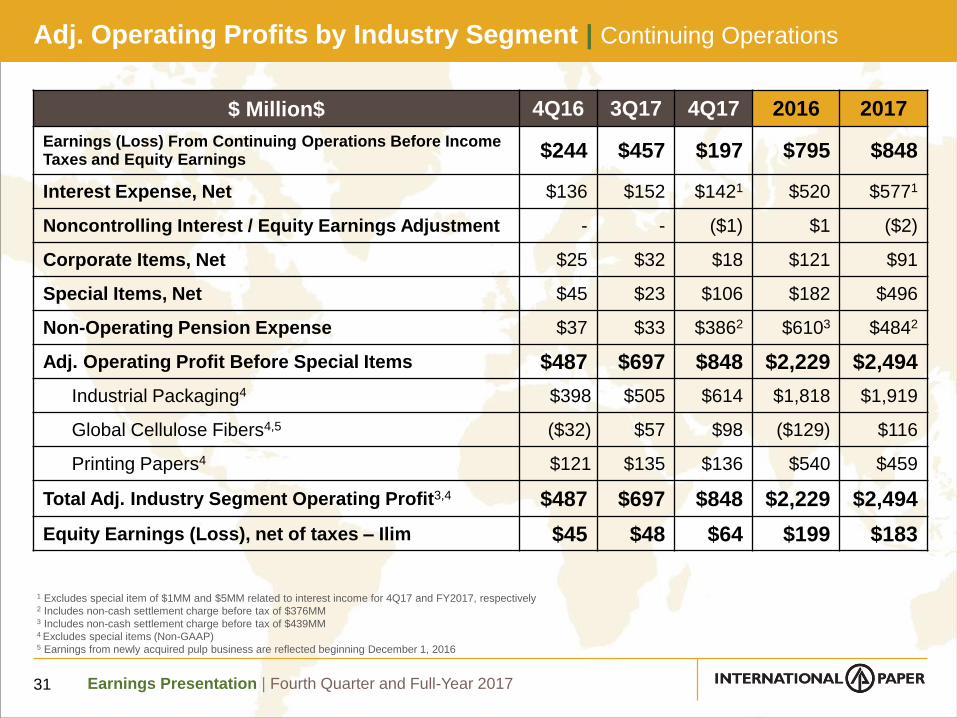
Adj. Operating Profits by Industry Segment | Continuing Operations
31
$ Million$ 4Q16 3Q17 4Q17 2016 2017
Earnings (Loss) From Continuing Operations Before Income Taxes and Equity Earnings $244 $457 $197 $795 $848
Interest Expense, Net $136 $152 $1421 $520 $5771
Noncontrolling Interest / Equity Earnings Adjustment - - ($1) $1 ($2)
Corporate Items, Net $25 $32 $18 $121 $91
Special Items, Net $45 $23 $106 $182 $496
Non-Operating Pension Expense $37 $33 $3862 $6103 $4842
Adj. Operating Profit Before Special Items $487 $697 $848 $2,229 $2,494
Industrial Packaging4 $398 $505 $614 $1,818 $1,919
Global Cellulose Fibers4,5 ($32) $57 $98 ($129) $116
Printing Papers4 $121 $135 $136 $540 $459
Total Adj. Industry Segment Operating Profit3,4 $487 $697 $848 $2,229 $2,494
Equity Earnings (Loss), net of taxes – Ilim $45 $48 $64 $199 $183
1 Excludes special item of $1MM and $5MM related to interest income for 4Q17 and FY2017, respectively2 Includes non-cash settlement charge before tax of $376MM3 Includes non-cash settlement charge before tax of $439MM4 Excludes special items (Non-GAAP)5 Earnings from newly acquired pulp business are reflected beginning December 1, 2016
Earnings Presentation | Fourth Quarter and Full-Year 2017
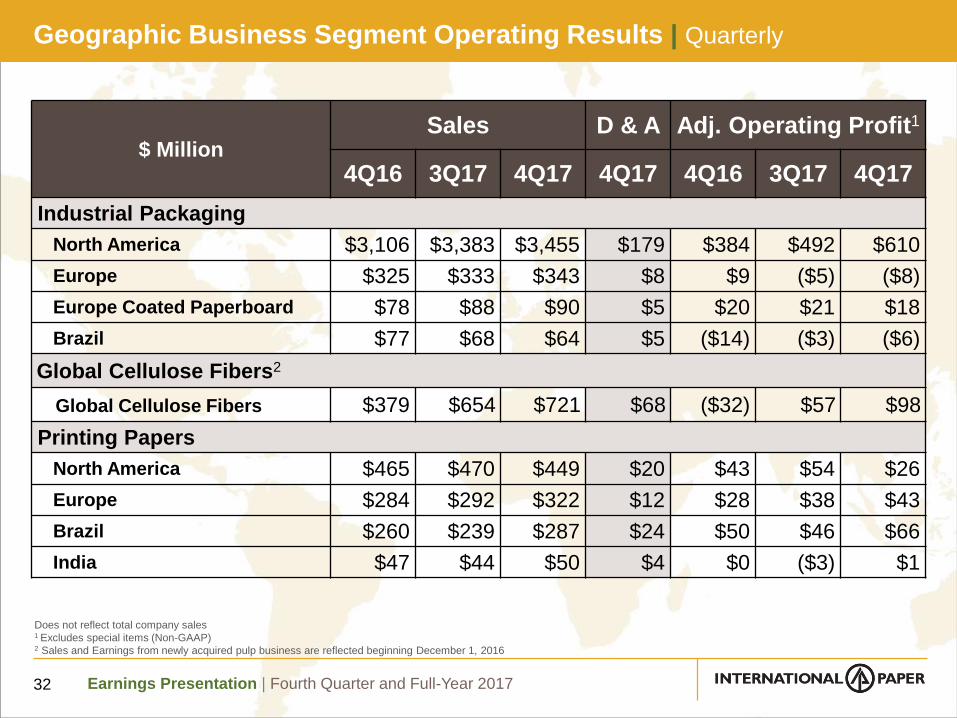
Geographic Business Segment Operating Results | Quarterly
32
$ MillionSales D & A Adj. Operating Profit1
4Q16 3Q17 4Q17 4Q17 4Q16 3Q17 4Q17
Industrial Packaging
North America $3,106 $3,383 $3,455 $179 $384 $492 $610
Europe $325 $333 $343 $8 $9 ($5) ($8)
Europe Coated Paperboard $78 $88 $90 $5 $20 $21 $18
Brazil $77 $68 $64 $5 ($14) ($3) ($6)
Global Cellulose Fibers2
Global Cellulose Fibers $379 $654 $721 $68 ($32) $57 $98
Printing Papers
North America $465 $470 $449 $20 $43 $54 $26
Europe $284 $292 $322 $12 $28 $38 $43
Brazil $260 $239 $287 $24 $50 $46 $66
India $47 $44 $50 $4 $0 ($3) $1
Does not reflect total company sales1 Excludes special items (Non-GAAP)2 Sales and Earnings from newly acquired pulp business are reflected beginning December 1, 2016
Earnings Presentation | Fourth Quarter and Full-Year 2017
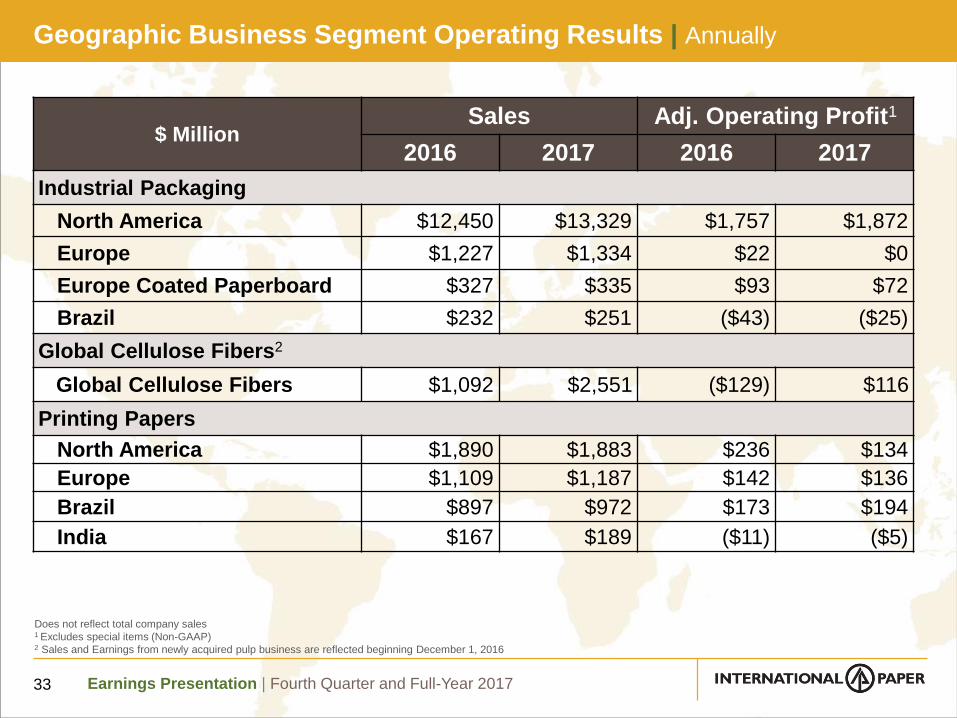
Geographic Business Segment Operating Results | Annually
33
$ MillionSales Adj. Operating Profit1
2016 2017 2016 2017
Industrial Packaging
North America $12,450 $13,329 $1,757 $1,872
Europe $1,227 $1,334 $22 $0
Europe Coated Paperboard $327 $335 $93 $72
Brazil $232 $251 ($43) ($25)
Global Cellulose Fibers2
Global Cellulose Fibers $1,092 $2,551 ($129) $116
Printing Papers
North America $1,890 $1,883 $236 $134
Europe $1,109 $1,187 $142 $136
Brazil $897 $972 $173 $194
India $167 $189 ($11) ($5)
Does not reflect total company sales1 Excludes special items (Non-GAAP)2 Sales and Earnings from newly acquired pulp business are reflected beginning December 1, 2016
Earnings Presentation | Fourth Quarter and Full-Year 2017
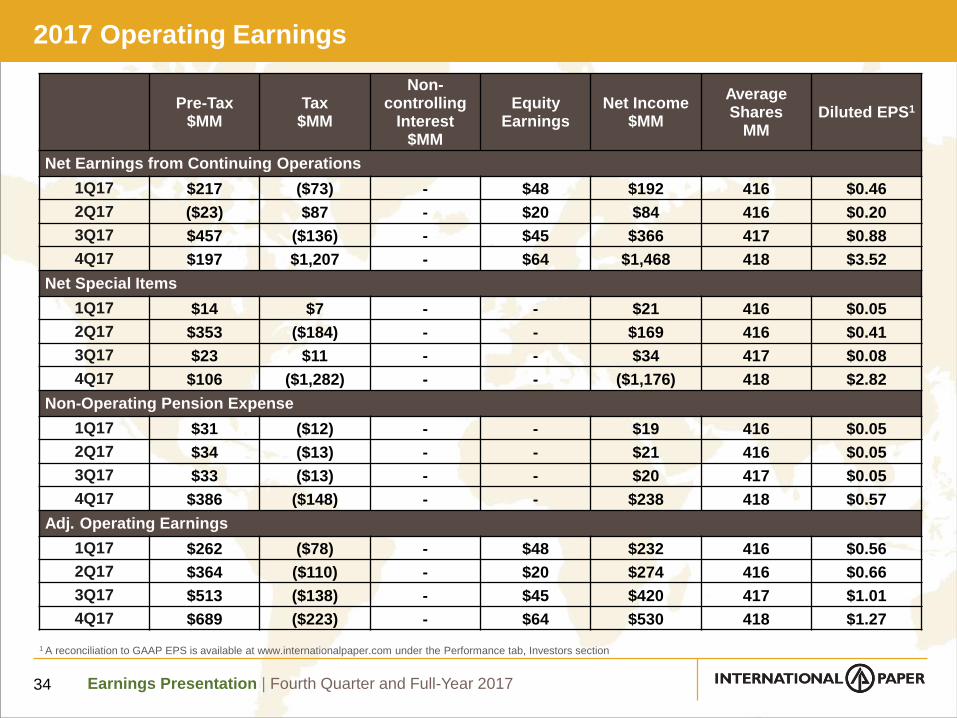
2017 Operating Earnings
34
Pre-Tax$MM
Tax$MM
Non-controlling
Interest$MM
EquityEarnings
Net Income$MM
Average Shares
MMDiluted EPS1
Net Earnings from Continuing Operations
1Q17 $217 ($73) - $48 $192 416 $0.46
2Q17 ($23) $87 - $20 $84 416 $0.20
3Q17 $457 ($136) - $45 $366 417 $0.88
4Q17 $197 $1,207 - $64 $1,468 418 $3.52
Net Special Items
1Q17 $14 $7 - - $21 416 $0.05
2Q17 $353 ($184) - - $169 416 $0.41
3Q17 $23 $11 - - $34 417 $0.08
4Q17 $106 ($1,282) - - ($1,176) 418 $2.82
Non-Operating Pension Expense
1Q17 $31 ($12) - - $19 416 $0.05
2Q17 $34 ($13) - - $21 416 $0.05
3Q17 $33 ($13) - - $20 417 $0.05
4Q17 $386 ($148) - - $238 418 $0.57
Adj. Operating Earnings
1Q17 $262 ($78) - $48 $232 416 $0.56
2Q17 $364 ($110) - $20 $274 416 $0.66
3Q17 $513 ($138) - $45 $420 417 $1.01
4Q17 $689 ($223) - $64 $530 418 $1.27
1 A reconciliation to GAAP EPS is available at www.internationalpaper.com under the Performance tab, Investors section
Earnings Presentation | Fourth Quarter and Full-Year 2017
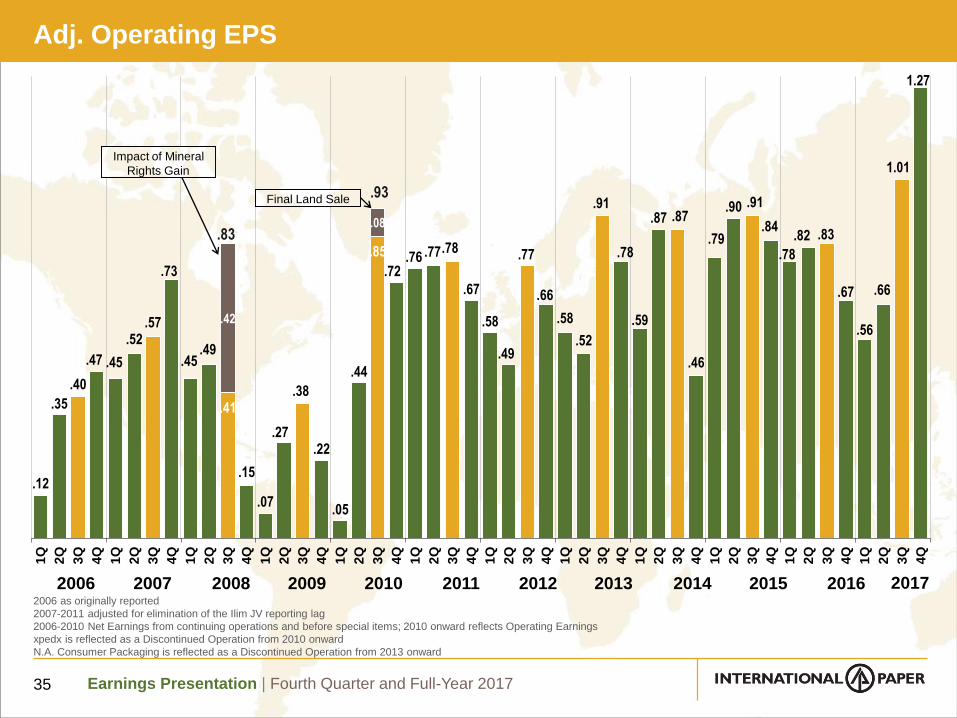
Adj. Operating EPS
35
2006 as originally reported
2007-2011 adjusted for elimination of the Ilim JV reporting lag
2006-2010 Net Earnings from continuing operations and before special items; 2010 onward reflects Operating Earnings
xpedx is reflected as a Discontinued Operation from 2010 onward
N.A. Consumer Packaging is reflected as a Discontinued Operation from 2013 onward
.12
.35
.40
.47 .45
.52.57
.73
.45.49
.41
.15
.07
.27
.38
.22
.05
.44
.85
.72.76 .77.78
.67
.58
.49
.77
.66
.58
.52
.91
.78
.59
.87 .87
.46
.79
.90 .91
.84
.78
.82 .83
.67
.56
.66
1.01
1.27
.42
.08
1Q
2Q
3Q
4Q
1Q
2Q
3Q
4Q
1Q
2Q
3Q
4Q
1Q
2Q
3Q
4Q
1Q
2Q
3Q
4Q
1Q
2Q
3Q
4Q
1Q
2Q
3Q
4Q
1Q
2Q
3Q
4Q
1Q
2Q
3Q
4Q
1Q
2Q
3Q
4Q
1Q
2Q
3Q
4Q
1Q
2Q
3Q
4Q
20172006 2007 20102008
Impact of Mineral
Rights Gain
2009
.83
2011
.93Final Land Sale
2012 2013 2014 2015 2016
Earnings Presentation | Fourth Quarter and Full-Year 2017
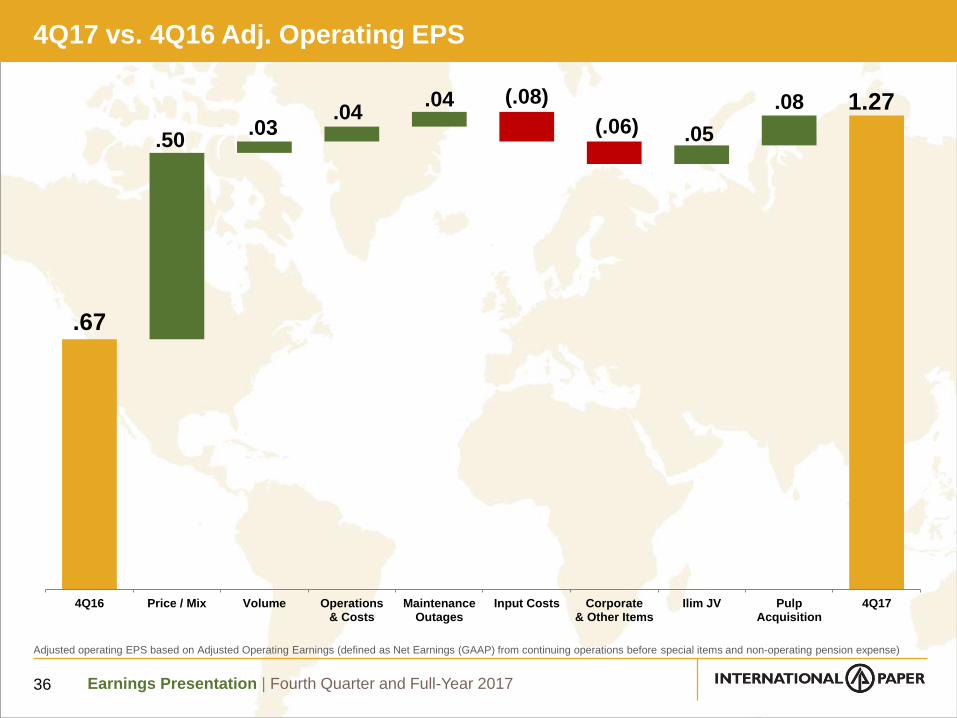
.67
1.27(.08)
(.06).50
.03.04
.04
.05
.08
4Q16 Price / Mix Volume Operations& Costs
MaintenanceOutages
Input Costs Corporate& Other Items
Ilim JV PulpAcquisition
4Q17
4Q17 vs. 4Q16 Adj. Operating EPS
36
Adjusted operating EPS based on Adjusted Operating Earnings (defined as Net Earnings (GAAP) from continuing operations before special items and non-operating pension expense)
Earnings Presentation | Fourth Quarter and Full-Year 2017
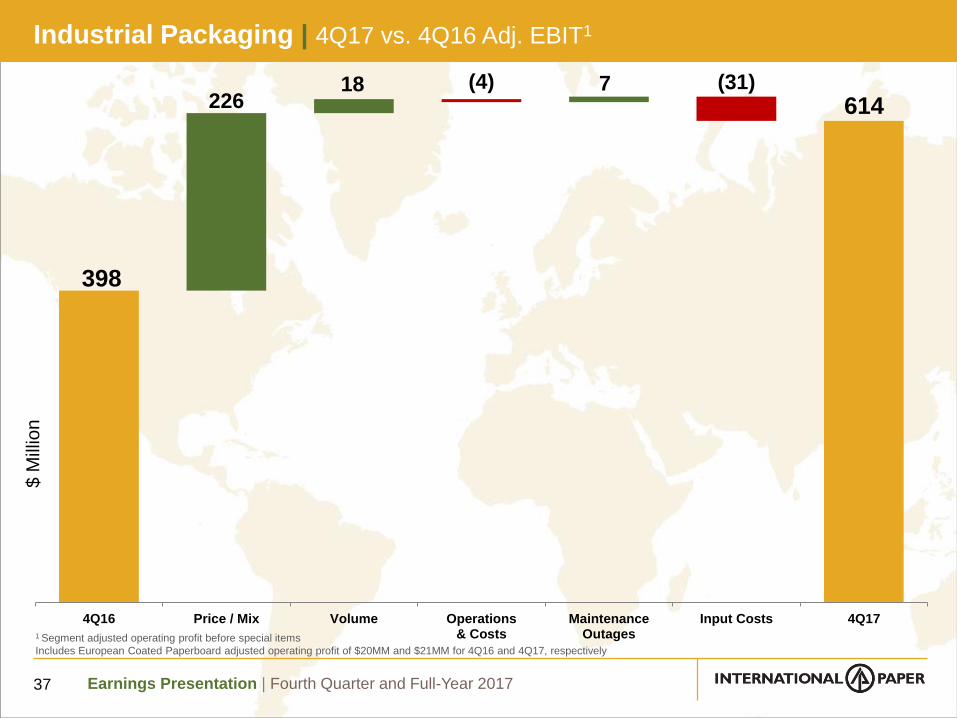
398
614(4) (31)
22618 7
4Q16 Price / Mix Volume Operations& Costs
MaintenanceOutages
Input Costs 4Q17
Industrial Packaging | 4Q17 vs. 4Q16 Adj. EBIT1
37
$ M
illio
n
1 Segment adjusted operating profit before special items
Includes European Coated Paperboard adjusted operating profit of $20MM and $21MM for 4Q16 and 4Q17, respectively
Earnings Presentation | Fourth Quarter and Full-Year 2017
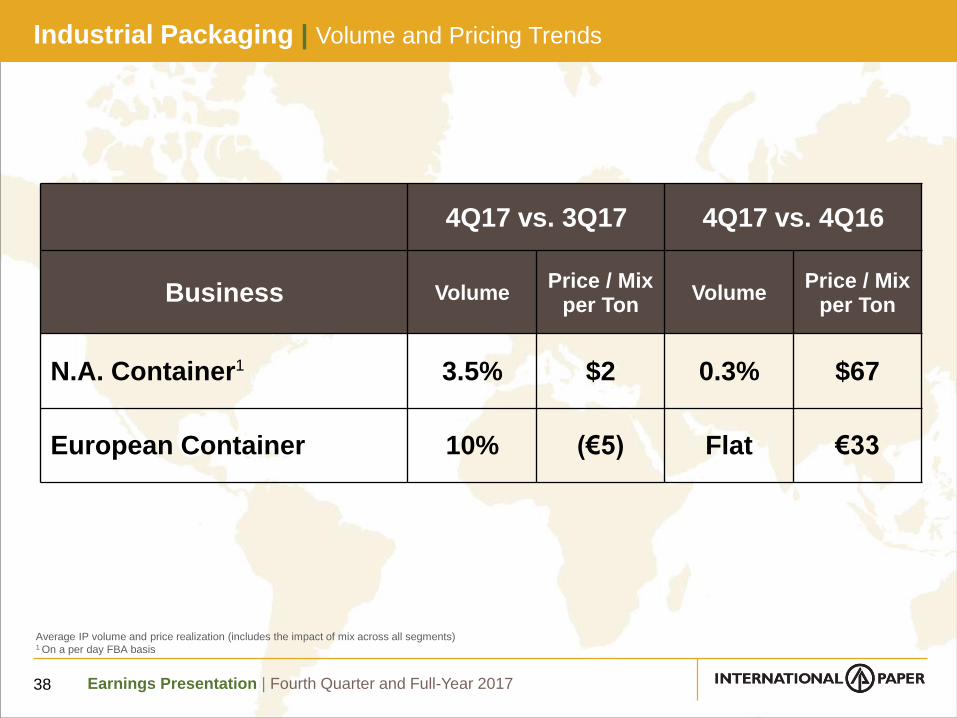
4Q17 vs. 3Q17 4Q17 vs. 4Q16
Business VolumePrice / Mix
per TonVolume
Price / Mixper Ton
N.A. Container1 3.5% $2 0.3% $67
European Container 10% (€5) Flat €33
Average IP volume and price realization (includes the impact of mix across all segments)1 On a per day FBA basis
Industrial Packaging | Volume and Pricing Trends
38
Earnings Presentation | Fourth Quarter and Full-Year 2017
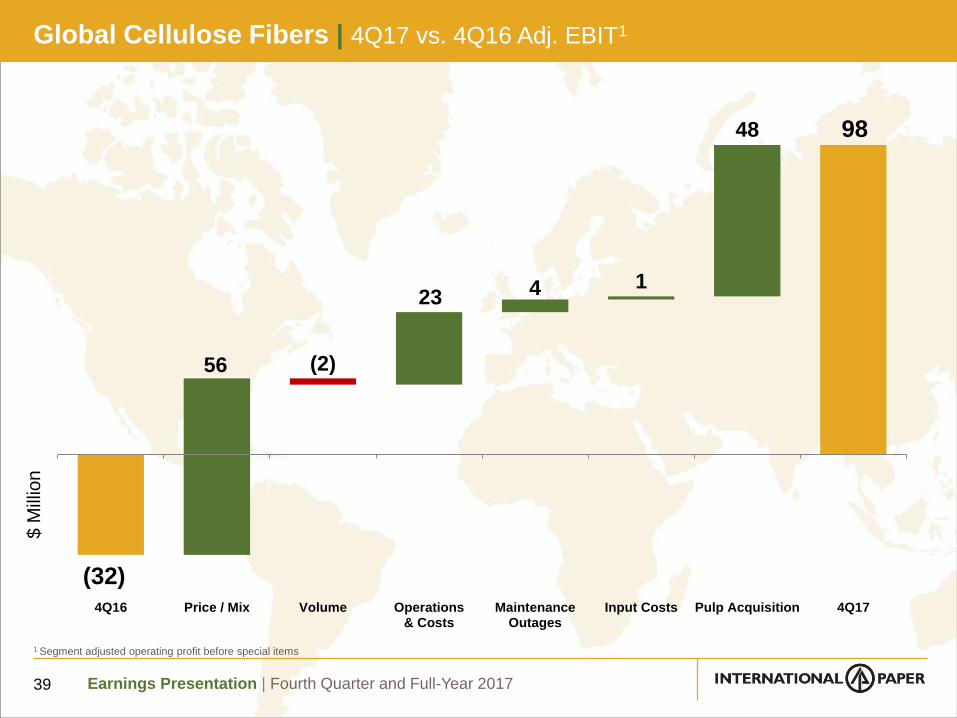
Global Cellulose Fibers | 4Q17 vs. 4Q16 Adj. EBIT1
39
1 Segment adjusted operating profit before special items
(32)
98
(2)56
23 4 1
48
4Q16 Price / Mix Volume Operations& Costs
MaintenanceOutages
Input Costs Pulp Acquisition 4Q17
$ M
illio
n
Earnings Presentation | Fourth Quarter and Full-Year 2017
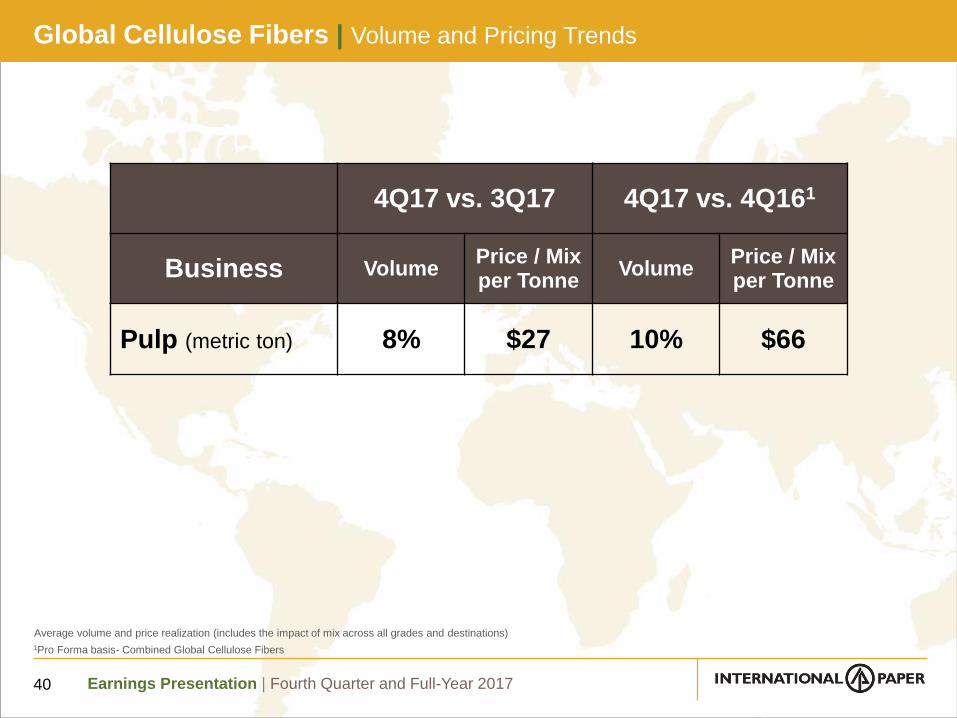
Global Cellulose Fibers | Volume and Pricing Trends
40
4Q17 vs. 3Q17 4Q17 vs. 4Q161
Business VolumePrice / Mixper Tonne
VolumePrice / Mixper Tonne
Pulp (metric ton) 8% $27 10% $66
Average volume and price realization (includes the impact of mix across all grades and destinations)
1Pro Forma basis- Combined Global Cellulose Fibers
Earnings Presentation | Fourth Quarter and Full-Year 2017
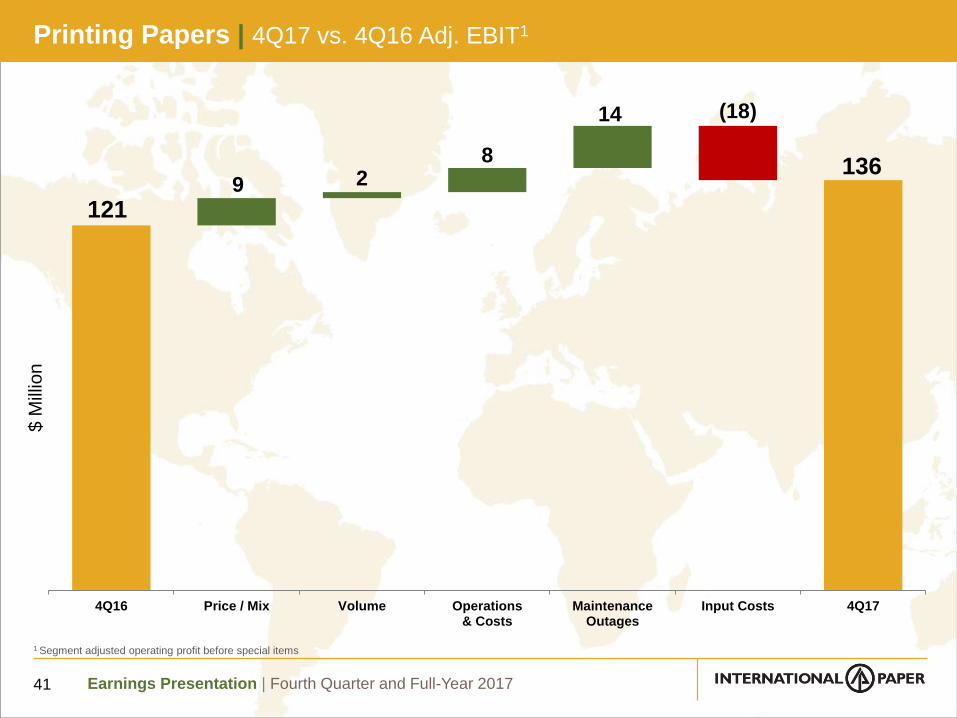
121
136
(18)
9 28
14
4Q16 Price / Mix Volume Operations& Costs
MaintenanceOutages
Input Costs 4Q17
Printing Papers | 4Q17 vs. 4Q16 Adj. EBIT1
41
$ M
illio
n
1 Segment adjusted operating profit before special items
Earnings Presentation | Fourth Quarter and Full-Year 2017
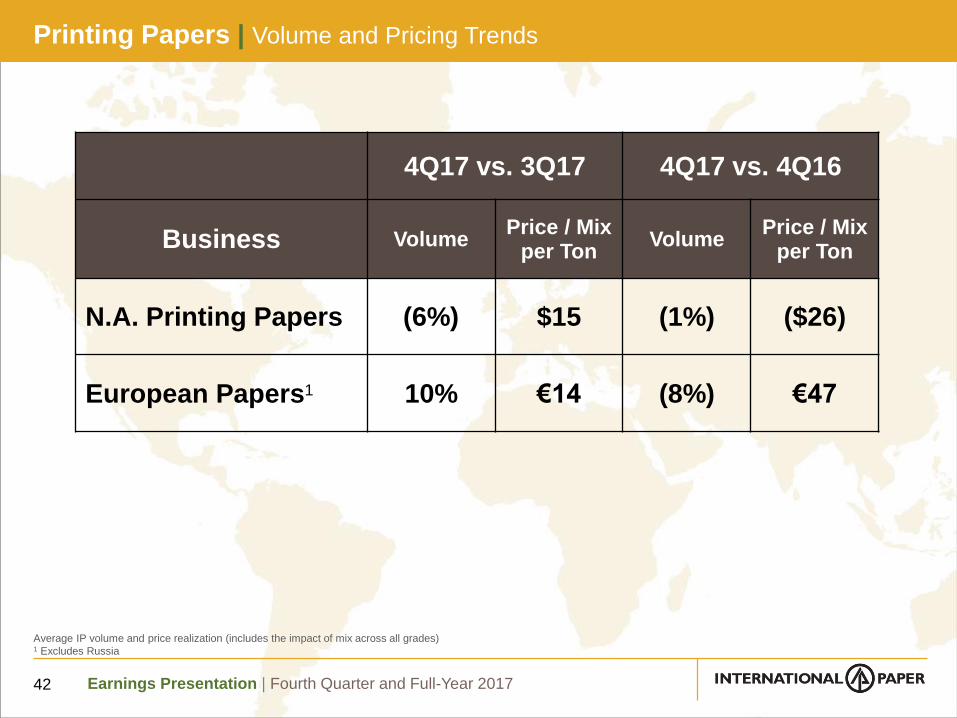
4Q17 vs. 3Q17 4Q17 vs. 4Q16
Business VolumePrice / Mix
per TonVolume
Price / Mixper Ton
N.A. Printing Papers (6%) $15 (1%) ($26)
European Papers1 10% €14 (8%) €47
Average IP volume and price realization (includes the impact of mix across all grades)1 Excludes Russia
Printing Papers | Volume and Pricing Trends
42
Earnings Presentation | Fourth Quarter and Full-Year 2017
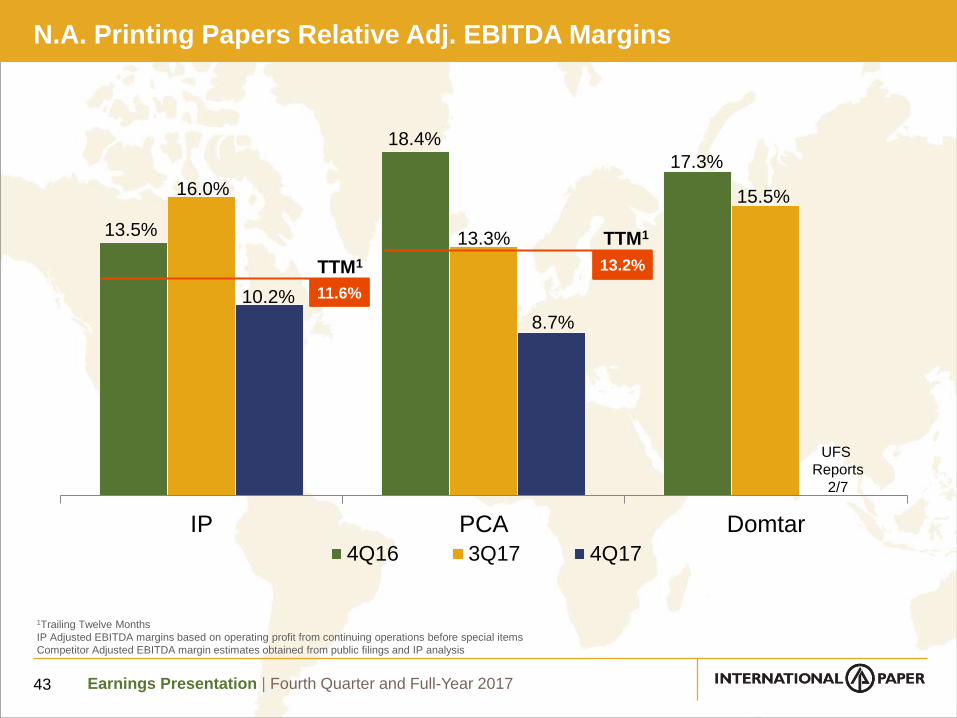
N.A. Printing Papers Relative Adj. EBITDA Margins
43
13.5%
18.4%
17.3%
16.0%
13.3%
15.5%
10.2%
8.7%
IP PCA Domtar
4Q16 3Q17 4Q17
UFS
Reports
2/7
1Trailing Twelve Months
IP Adjusted EBITDA margins based on operating profit from continuing operations before special items
Competitor Adjusted EBITDA margin estimates obtained from public filings and IP analysis
TTM1
11.6%
TTM1
13.2%
Earnings Presentation | Fourth Quarter and Full-Year 2017
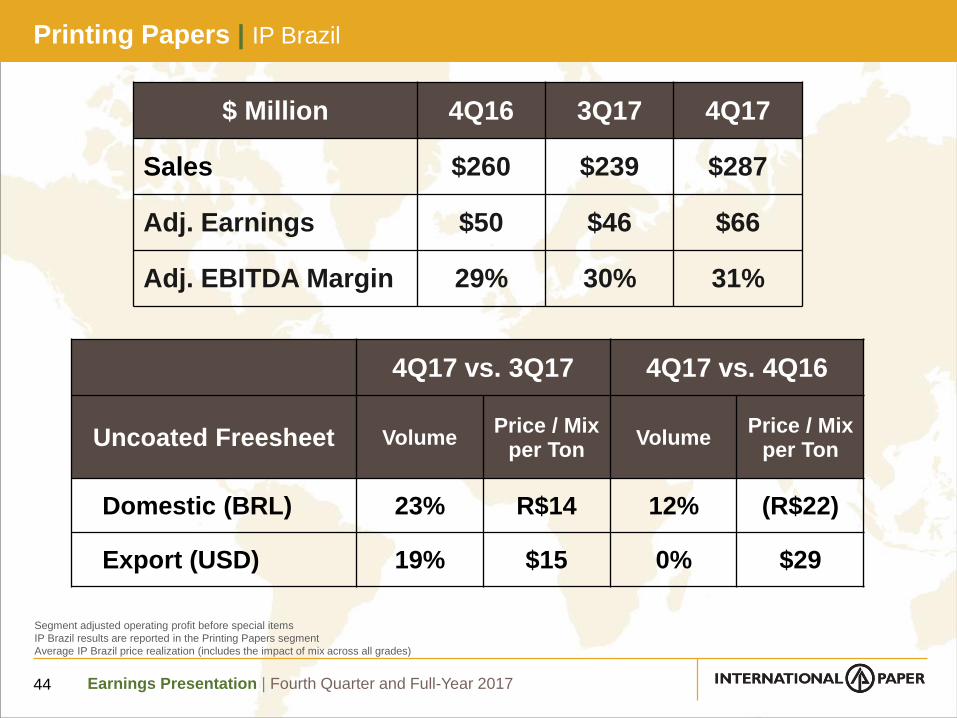
Printing Papers | IP Brazil
44
$ Million 4Q16 3Q17 4Q17
Sales $260 $239 $287
Adj. Earnings $50 $46 $66
Adj. EBITDA Margin 29% 30% 31%
4Q17 vs. 3Q17 4Q17 vs. 4Q16
Uncoated Freesheet VolumePrice / Mix
per TonVolume
Price / Mixper Ton
Domestic (BRL) 23% R$14 12% (R$22)
Export (USD) 19% $15 0% $29
Segment adjusted operating profit before special items
IP Brazil results are reported in the Printing Papers segment
Average IP Brazil price realization (includes the impact of mix across all grades)
Earnings Presentation | Fourth Quarter and Full-Year 2017
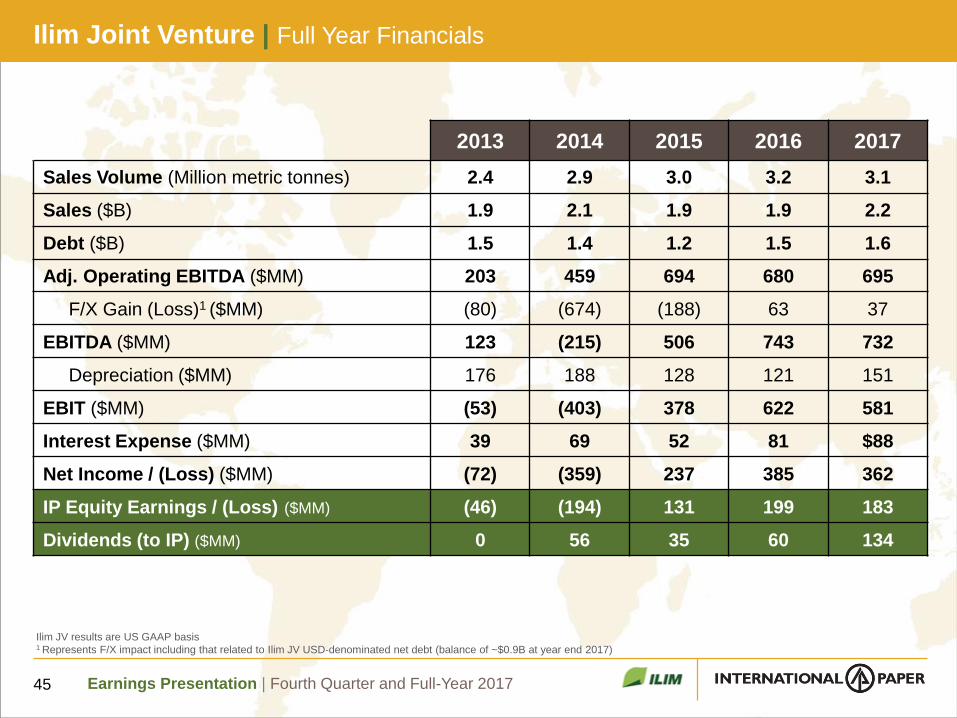
Ilim Joint Venture | Full Year Financials
45
2013 2014 2015 2016 2017
Sales Volume (Million metric tonnes) 2.4 2.9 3.0 3.2 3.1
Sales ($B) 1.9 2.1 1.9 1.9 2.2
Debt ($B) 1.5 1.4 1.2 1.5 1.6
Adj. Operating EBITDA ($MM) 203 459 694 680 695
F/X Gain (Loss)1 ($MM) (80) (674) (188) 63 37
EBITDA ($MM) 123 (215) 506 743 732
Depreciation ($MM) 176 188 128 121 151
EBIT ($MM) (53) (403) 378 622 581
Interest Expense ($MM) 39 69 52 81 $88
Net Income / (Loss) ($MM) (72) (359) 237 385 362
IP Equity Earnings / (Loss) ($MM) (46) (194) 131 199 183
Dividends (to IP) ($MM) 0 56 35 60 134
Ilim JV results are US GAAP basis 1 Represents F/X impact including that related to Ilim JV USD-denominated net debt (balance of ~$0.9B at year end 2017)
Earnings Presentation | Fourth Quarter and Full-Year 2017
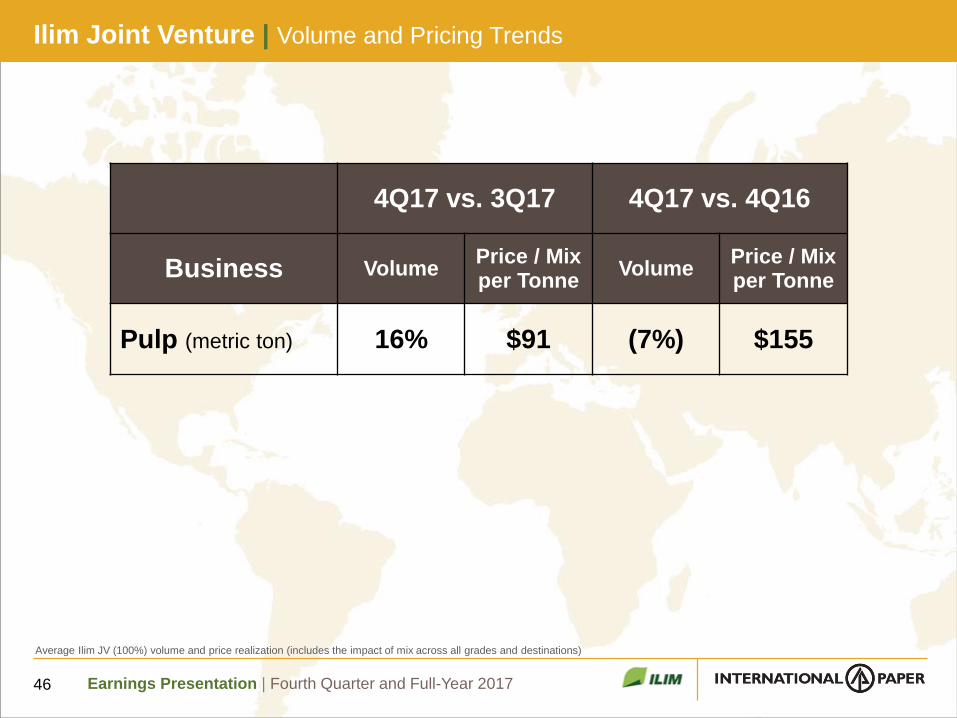
Ilim Joint Venture | Volume and Pricing Trends
46
4Q17 vs. 3Q17 4Q17 vs. 4Q16
Business VolumePrice / Mixper Tonne
VolumePrice / Mixper Tonne
Pulp (metric ton) 16% $91 (7%) $155
Average Ilim JV (100%) volume and price realization (includes the impact of mix across all grades and destinations)
Earnings Presentation | Fourth Quarter and Full-Year 2017
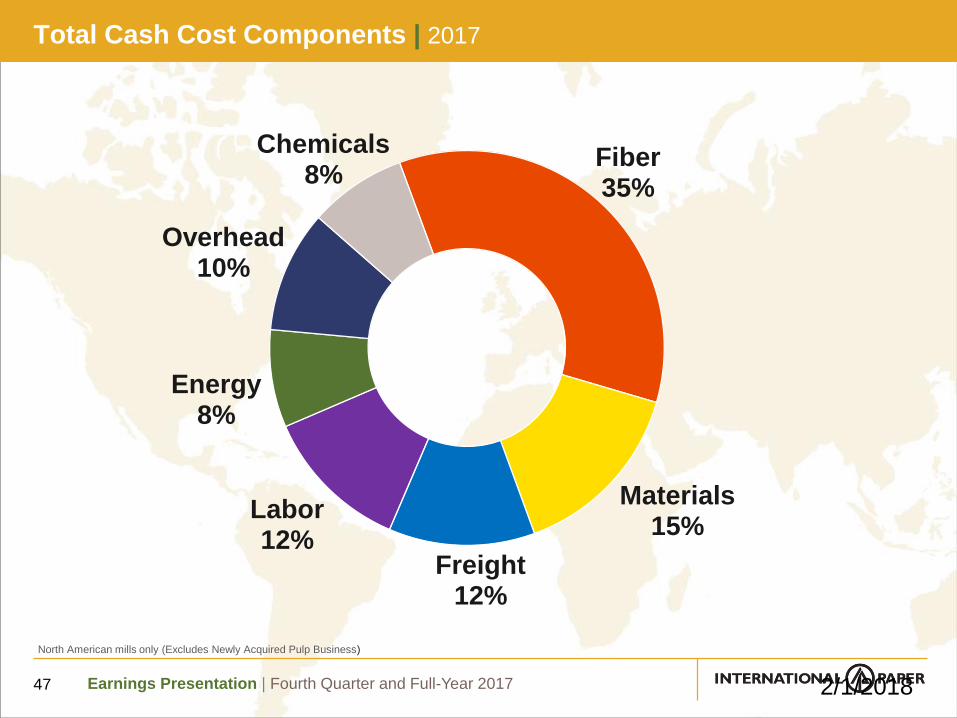
Total Cash Cost Components | 2017
Fiber35%
Materials15%
Freight12%
Labor12%
Energy8%
Overhead10%
Chemicals8%
47 2/1/2018
North American mills only (Excludes Newly Acquired Pulp Business)
Earnings Presentation | Fourth Quarter and Full-Year 2017
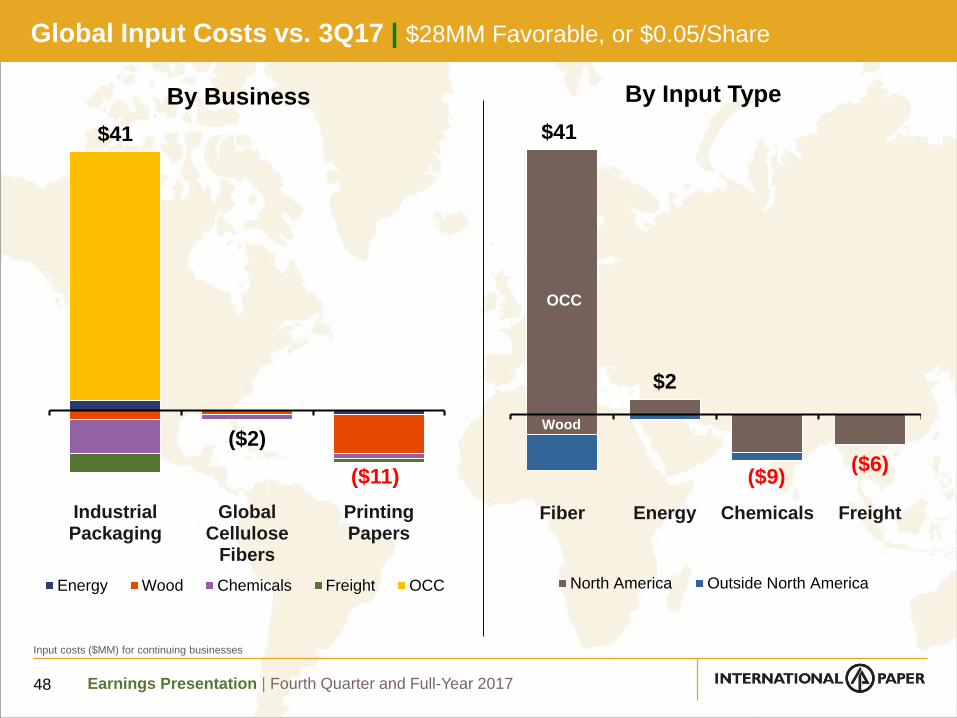
$41
$2
($9)($6)
Fiber Energy Chemicals Freight
North America Outside North America
$41
($2)
($11)
IndustrialPackaging
GlobalCellulose
Fibers
PrintingPapers
Energy Wood Chemicals Freight OCC
By Business By Input Type
Input costs ($MM) for continuing businesses
Global Input Costs vs. 3Q17 | $28MM Favorable, or $0.05/Share
48
OCC
Wood
Earnings Presentation | Fourth Quarter and Full-Year 2017
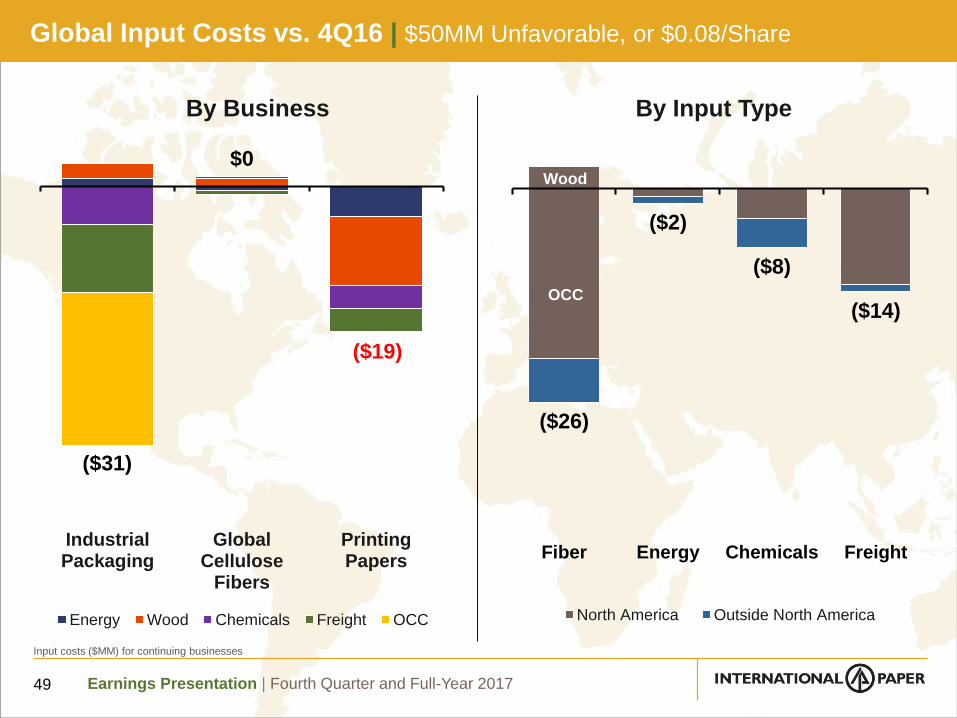
($26)
($2)
($8)
($14)
Fiber Energy Chemicals Freight
North America Outside North America
($31)
$0
($19)
IndustrialPackaging
GlobalCellulose
Fibers
PrintingPapers
Energy Wood Chemicals Freight OCC
By Business By Input Type
Global Input Costs vs. 4Q16 | $50MM Unfavorable, or $0.08/Share
49
OCC
Wood
Input costs ($MM) for continuing businesses
Earnings Presentation | Fourth Quarter and Full-Year 2017
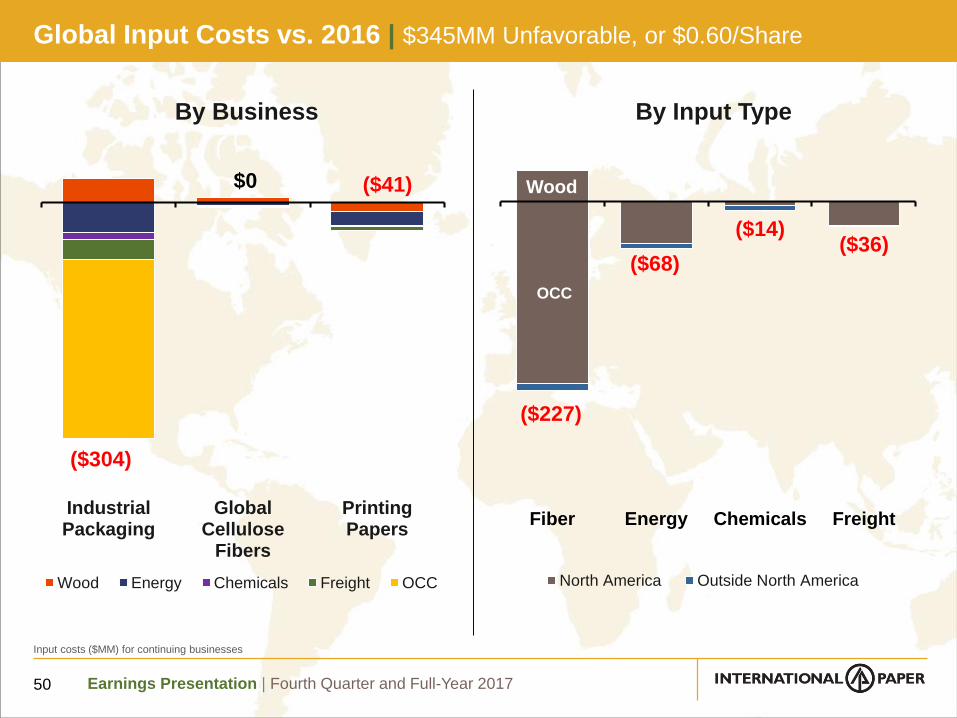
($227)
($68)
($14)($36)
Fiber Energy Chemicals Freight
North America Outside North America
($304)
$0 ($41)
IndustrialPackaging
GlobalCellulose
Fibers
PrintingPapers
Wood Energy Chemicals Freight OCC
By Business By Input Type
Global Input Costs vs. 2016 | $345MM Unfavorable, or $0.60/Share
OCC
Wood
50
Input costs ($MM) for continuing businesses
Earnings Presentation | Fourth Quarter and Full-Year 2017
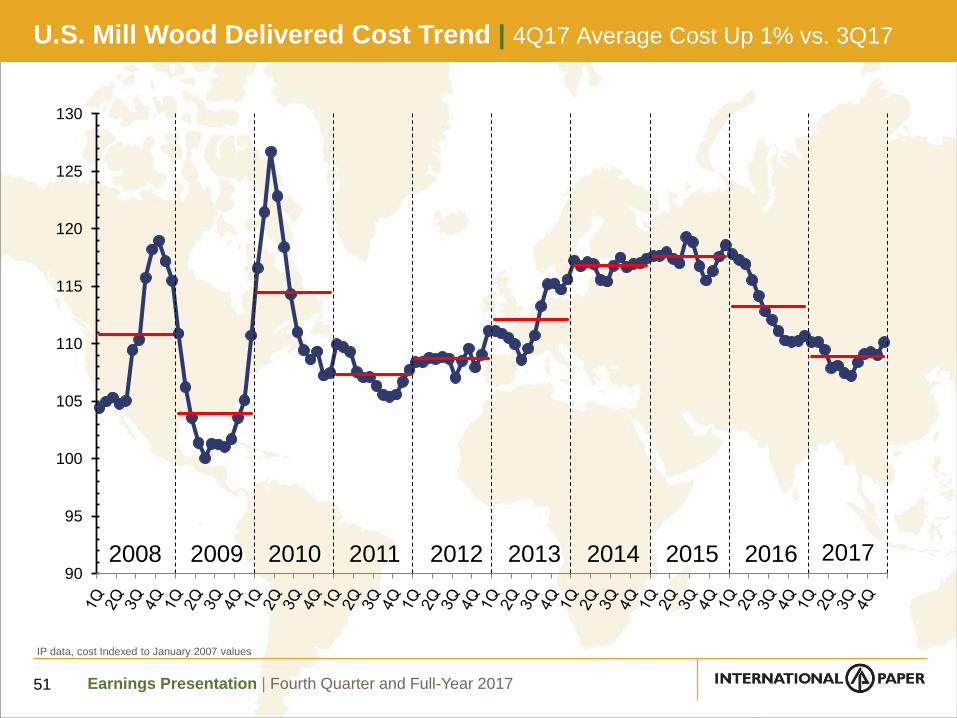
90
95
100
105
110
115
120
125
130
2017
U.S. Mill Wood Delivered Cost Trend | 4Q17 Average Cost Up 1% vs. 3Q17
51
IP data, cost Indexed to January 2007 values
2008 2009 2010 2011 2012 2013 2014 2015 2016
Earnings Presentation | Fourth Quarter and Full-Year 2017
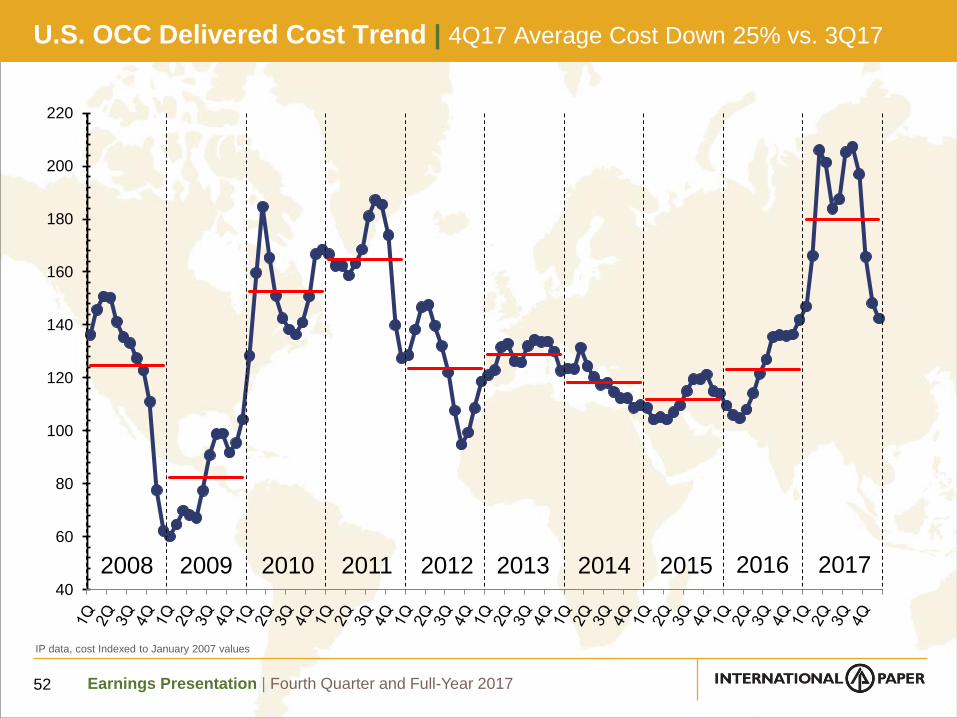
40
60
80
100
120
140
160
180
200
220
IP data, cost Indexed to January 2007 values
U.S. OCC Delivered Cost Trend | 4Q17 Average Cost Down 25% vs. 3Q17
52
2008 2009 2010 2011 2012 2013 2014 2015 2016 2017
Earnings Presentation | Fourth Quarter and Full-Year 2017
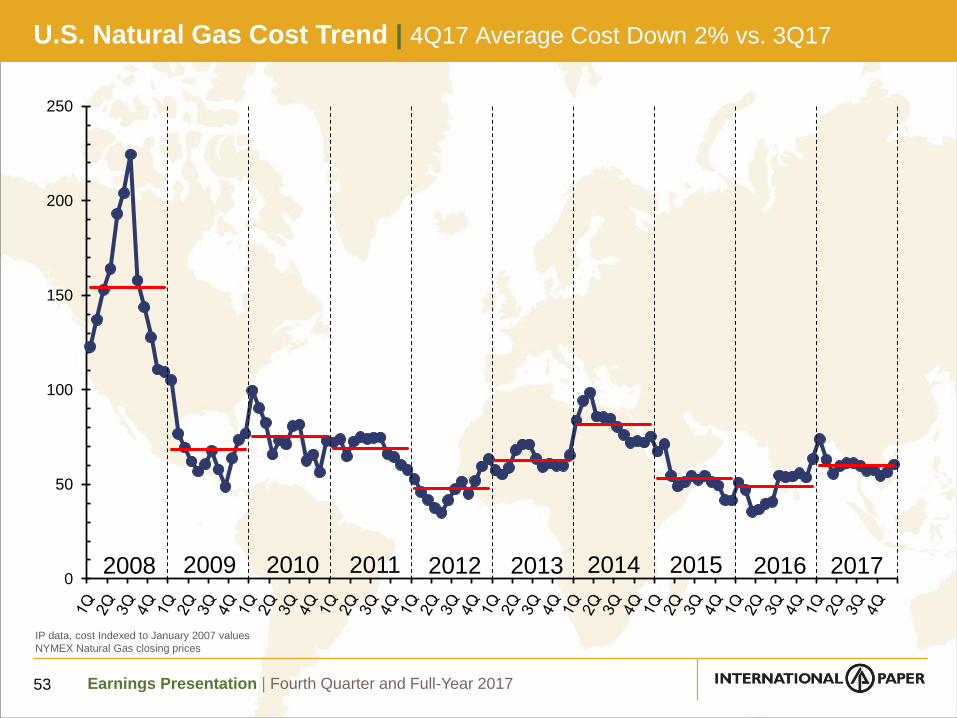
U.S. Natural Gas Cost Trend | 4Q17 Average Cost Down 2% vs. 3Q17
53
0
50
100
150
200
250
IP data, cost Indexed to January 2007 values
NYMEX Natural Gas closing prices
2008 2009 2010 2011 2012 2013 2014 2015 2016 2017
Earnings Presentation | Fourth Quarter and Full-Year 2017
0
50
100
150
200
250
300
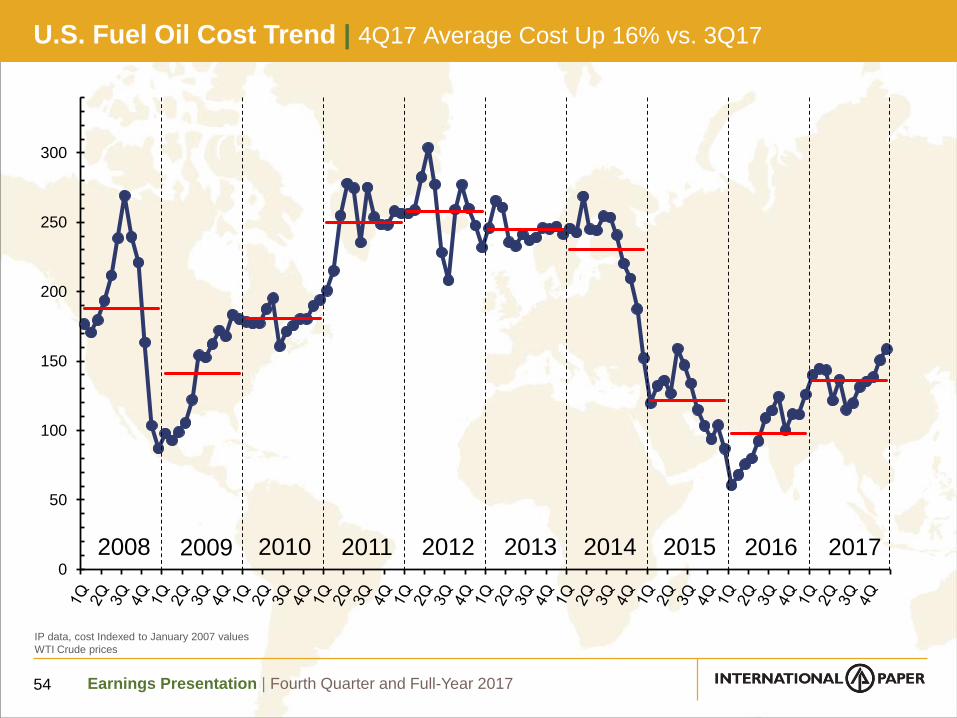
U.S. Fuel Oil Cost Trend | 4Q17 Average Cost Up 16% vs. 3Q17
54
IP data, cost Indexed to January 2007 values
WTI Crude prices
2008 2009 2010 2011 2012 2013 2014 2015 2016 2017
Earnings Presentation | Fourth Quarter and Full-Year 2017
75
100
125
150
175
200
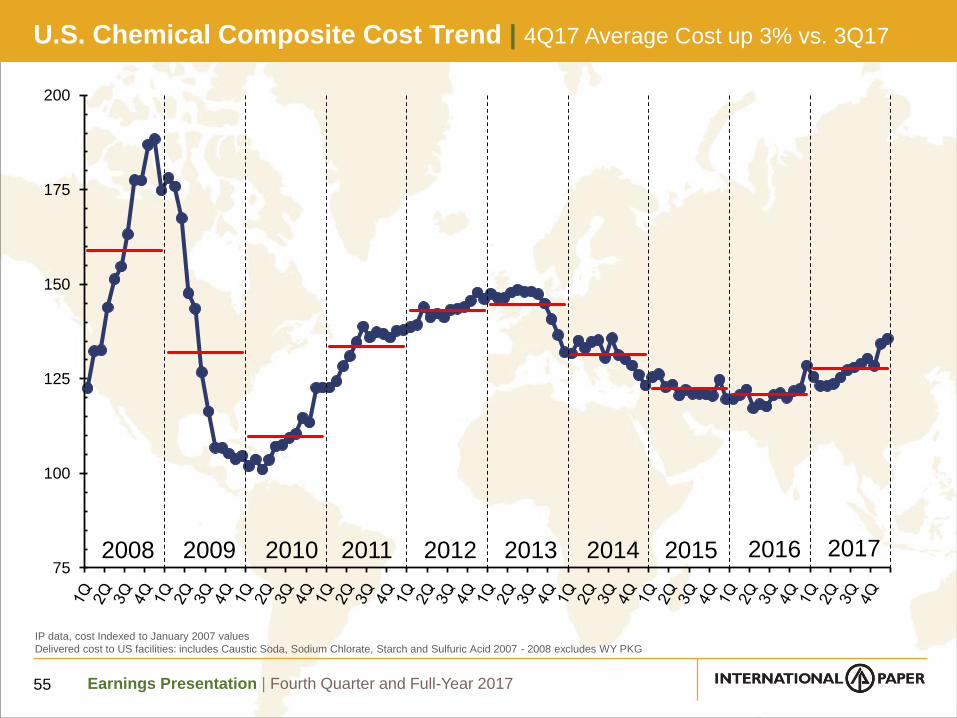
U.S. Chemical Composite Cost Trend | 4Q17 Average Cost up 3% vs. 3Q17
55
IP data, cost Indexed to January 2007 values
Delivered cost to US facilities: includes Caustic Soda, Sodium Chlorate, Starch and Sulfuric Acid 2007 - 2008 excludes WY PKG
2008 2009 2010 2011 2012 2013 2014 2015 2016 2017
Earnings Presentation | Fourth Quarter and Full-Year 2017
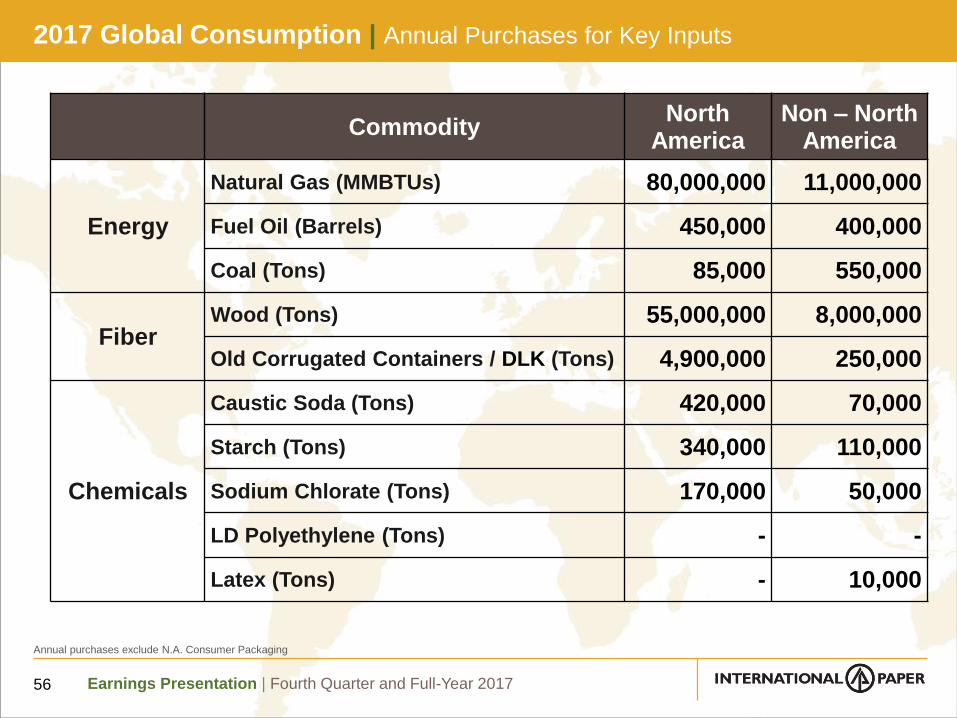
2017 Global Consumption | Annual Purchases for Key Inputs
56
CommodityNorth
AmericaNon – North
America
Energy
Natural Gas (MMBTUs) 80,000,000 11,000,000
Fuel Oil (Barrels) 450,000 400,000
Coal (Tons) 85,000 550,000
FiberWood (Tons) 55,000,000 8,000,000
Old Corrugated Containers / DLK (Tons) 4,900,000 250,000
Chemicals
Caustic Soda (Tons) 420,000 70,000
Starch (Tons) 340,000 110,000
Sodium Chlorate (Tons) 170,000 50,000
LD Polyethylene (Tons) - -
Latex (Tons) - 10,000
Annual purchases exclude N.A. Consumer Packaging