fox street 2 (rf) limited - investec · pdf fileinformation contained in this report pertains...
TRANSCRIPT

Physical address100 Graystone Drive, Sandown, Sandton, 2196, South Africa
Postal address
PO Box 785700, Sandton, 2146, South Africa
Fox Street 2 (RF) Limited
Investor Report
Reporting Period
22 May 2017 - 21 August 2017
Administration consultantFezeka Chikowero
Telephone +27 11 286 9336

Residential Mortgage Backed Securities Programme
Issue Date
Authorised Programme Size
Initial Nominal Notes Issued
Total Notes in Issue
Total Notes Redeemed1
Last Payment Date
Interest Accrual Period
Number of Days in Interest Period 91
Determination Date
Day Count Convention
Credit Enhancement Provider
Reported Currency
Prime Lending at Determination Date
1
Information contained in this report pertains to the assets and liabilities of Fox Street 2 (RF) Limited as at 31 July 2017 unless otherwise stipulated.
By 20 May 2016, the entire tranches of the Class A1, A2 and A3 notes were redeemed. In addition, R170.2m of the Class A4 notes were redeemed by 21 August 2017.
10.25%
ZAR 3 000 000 000
ZAR 1 467 000 000
Summary
Type of Programme
20 February 2014
31 July 2017
Following business day
Investec Private Bank
South African Rand
ZAR 846 754 219
ZAR 620 245 781
Payment Dates
21 August 2017
22 May 2017 - 21 August 2017
20 Day of February, May, August and November in Each year.
If such day is not a Business Day, the immediate following Business Day
2

Servicer Investec Bank Limited
Transfer Agent Investec Bank Limited
Security SPV Fox Street 2 Security SPV (RF) Proprietary Limited
Security SPV Owner Trustee TMF Corporate Services (South Africa) Proprietary Limited
Settlement Agent Nedbank Limited
+27 11 286 9336Fezeka Chikowero
Contact PersonTransaction Parties Contact Number
Settlement Agent +27 11 294 3937Thora Johannsen - Hanes
Debt Sponsor Investec Bank Limited
Hedge Counterparty Investec Bank Limited
Derivative Counterparty Investec Bank Limited
Owner Trustee Maitland Group South Africa Limited
Issuer Fox Street 2 (RF) Limited
Investec Bank LimitedOriginator
Rating Agency Global Credit Ratings
Servicer +27 11 286 8248
Investec Bank Limited
Investec Bank Limited
Investec Bank Limited
Security SPV Owner Trustee +27 11 666 0760Cheryl Clark
Shane Beamish
Administrator
Owner Trustee +27 11 530 8400Victor Botsi
Transaction Parties Entity Name
Calculation Agent
Administrator
Investec Bank LimitedAccount Bank
Arranger
Auditor to the Issuer KPMG Incorporated
3

Capital Structure as at 21 August 2017
Stock Code/
Tranche
Name
Step-up Date
Final
Redemption
Date
Spread over
3M JIBAR %
3M JIBAR %
(for current
period)
All in rate %Initial Nominal
Value (ZAR)
Cumulative
repayment of
Notes (ZAR)
Outstanding
Remaining Notes
(ZAR)
FS2A1 20-Aug-14 20-Feb-15 0.35 7.342 7.692 80 000 000 80 000 000 -
FS2A2 20-Aug-15 20-May-15 0.68 7.342 8.022 150 000 000 150 000 000 -
FS2A3 17-Feb-17 20-Aug-38 0.98 7.342 8.322 220 000 000 220 000 000 -
FS2A4 20-Nov-18 20-Aug-38 1.05 7.342 8.392 220 000 000 170 245 781 49 754 219
FS2A5 19-Feb-19 20-Aug-38 1.25 7.342 8.592 586 000 000 - 586 000 000
FS2B1 19-Feb-19 20-Aug-38 1.55 7.342 8.892 126 000 000 - 126 000 000
FS2C1 19-Feb-19 20-Aug-38 1.80 7.342 9.142 50 000 000 - 50 000 000
FS2D1 19-Feb-19 20-Aug-38 2.90 7.342 10.242 35 000 000 - 35 000 000
Total 1 467 000 000 620 245 781 846 754 219
Stock Code/
Tranche
name
ISINOriginal Fitch
rating
Current GCR
rating
Balance at
the
beginning of
the period
(ZAR)
Notes
issued in
current
period
(ZAR)
Note
repayment in
current period
(ZAR)
Balance at the
end of the period
(ZAR)
Note factor %
FS2A1 F1+(zaf) N/A - - - - 0%
FS2A2 AAA(zaf) N/A - - - - 0%
FS2A3 AAA(zaf) AAA(za)(sf) - - - - 0%
FS2A4 AAA(zaf) AAA(za)(sf) 84 403 362 - 34 649 143 49 754 219 23%
FS2A5 AAA(zaf) AAA(za)(sf) 586 000 000 - - 586 000 000 100%
FS2B1 A-(zaf) A+(za)(sf) 126 000 000 - - 126 000 000 100%
FS2C1 BBB-(zaf) BBB+(za)(sf) 50 000 000 - - 50 000 000 100%
FS2D1 BB(zaf) BB+(za)(sf) 35 000 000 - - 35 000 000 100%
Total 881 403 362 - 34 649 143 846 754 219
Stock Code/
Tranche
name
Interest accrued
in the period
(ZAR)
Interest shortfall
for the period
(ZAR)
Cumulative interest
shortfall (ZAR)
FS2A1 - - -
FS2A2 - - -
FS2A3 - - -
FS2A4 1 765 931 - -
FS2A5 12 552 794 - -
FS2B1 2 793 306 - -
FS2C1 1 139 619 - -
FS2D1 893 720 - -
Total 19 145 370 - -
Home Loans reconciliation:
No. of loans ZAR
Aggregate value of Home Loans at the beginning of the reporting period 983 947 860 579
Additional Home Loans - -
Participating assets purchased (including replacement assets) - -
Advances (Redraws, Re-advances, Further Advances) - 59 533 559
Redraws - 54 403 611
Re-advances - 4 772 410
Further Advances - 357 539
Contractual principal repayments - -15 381 636
Prepayments (including settlements) -21 -72 816 718
Recoveries - -
Predecessor assets sold - -4 686 457
Aggregate value of Home Loans at the end of the reporting period 962 914 509 327
-1 139 619
- -893 720
-
-
- -2 793 306
-
- - -
- -1 765 931
- -12 552 794
-
-
-
-
Accrued/ unpaid
interest at
beginning of period
(ZAR)
Interest paid in the period
(ZAR)
- -19 145 370
-
-
-
Accrued/ unpaid interest at
end of period (ZAR)
-
-
ZAG000112681
ZAG000112699
ZAG000112723
-
ZAG000112707
ZAG000112715
ZAG000112731
ZAG000112749
ZAG000112673
4

Available Quarterly Revenue Amounts 21-Aug-17
a. Interest received on Home Loans; 21 256 224
b. Fees (in relation to interest) relating to the Home Loans; 43 323
c. Recoveries (in relation to interest) relating to the Home Loans; -
d. Settlements (in relation to interest) relating to the Home Loans; -
e. Payments received under Derivative Contracts; 678 605
f. Interest earned on the Bank Accounts; 1 964 378
g. All other income of a revenue nature; and -
h. The amount recorded, if any, in the Liquidity Reserve Ledger. 20 468 609
Total Quarterly Interest Available Funds 44 411 140
Quarterly Revenue Priority of Payments
1.1.1) Liability or potential liability for Tax and any statutory fees, costs and expenses due and payable; -
1.1.2.1 Fees Trustee - pari passue and pro rata (inc. VAT); 17 664
1.1.2.1 Fees Director - pari passue and pro rata (inc. VAT); 26 733
1.1.2.4 Fees Audit - pari passue and pro rata (inc. VAT); 59 765
1.1.2.4 Fees Strate - pari passue and pro rata (inc. VAT); 7 827
1.1.2.4 Fees Rating - pari passue and pro rata (inc. VAT); 59 850
1.1.2.4 Fees JSE - pari passue and pro rata (inc. VAT); 16 958
1.1.2.4 Fees NCA - pari passue and pro rata (inc. VAT); 18 814
1.1.2.4 Fees Bank - pari passue and pro rata (inc. VAT); 2 155
1.1.3.1) Servicer Expenses - pari passu and pro rata (inc. VAT); 316 349
1.1.3.2) Administrator Expenses - pari passu and pro rata (inc. VAT); 99 477
1.1.4) Net amount due to Derivative Counterparty; -
1.1.5) Interest and fees due to the Warehouse Facility Provider; -
1.1.6) Interest and fees due to the Redraw Facility Provider; -
1.1.7.1) Amounts (other than principal) due in respect of the Class A1 Notes; -
1.1.7.2) Amounts (other than principal) due in respect of the Class A2 Notes; -
1.1.7.3) Amounts (other than principal) due in respect of the Class A3 Notes; -
1.1.7.4) Amounts (other than principal) due in respect of the Class A4 Notes; 1 765 931
1.1.7.5) Amounts (other than principal) due in respect of the Class A5 Notes; 12 552 794
1.1.8.1) To clear the Principal Deficiency Ledger of the Class A1 Notes; -
1.1.8.2) To clear the Principal Deficiency Ledger of the Class A2 Notes; -
1.1.8.3) To clear the Principal Deficiency Ledger of the Class A3 Notes; -
1.1.8.4) To clear the Principal Deficiency Ledger of the Class A4 Notes; -
1.1.8.5) To clear the Principal Deficiency Ledger of the Class A5 Notes; -
1.1.9) Amounts (other than principal) due in respect of the Class B Notes; 2 793 306
1.1.10) To clear the Principal Deficiency Ledger of the Class B Notes; -
1.1.11) Amounts (other than principal) due in respect of the Class C Notes; 1 139 619
1.1.12) To clear the Principal Deficiency Ledger of the Class C Notes; -
1.1.13) Amounts (other than principal) due to in respect of the Class D Notes; 893 720
1.1.14) To clear the Principal Deficiency Ledger of the Class D Notes; -
1.1.15) Amounts (other than principal) due to in respect of the Class E Notes; -
1.1.16) To clear the Principal Deficiency Ledger of the Class E Notes; -
1.1.17) Funding of Liquidity Reserve up to the Liquidity Reserve Required Amount; 19 837 641
1.1.18) Monthly allocation of excess amounts from the Liquidity Reserve to the Principal Available Funds; 630 968
1.1.19) Derivative Termination Amounts due to Derivative Counterparty in default -
1.1.20) Interest and fees due to Subordinated Loan Provider 4 171 569
1.1.21) Clearing of Subordinated Loan Principal Deficiency Ledger -
Credited to the Revenue Ledger -
1.1.22) Dividends due to Preference Shareholder -
Total Amount Quarterly Revenue Priority of Payments 44 438 686
-
5

Available Quarterly Principal Amounts 21-Aug-17
Balance carried forward -
a. Repayments to the extent relating to principal in respect of the Home Loans; 15 381 636
b. Prepayments to the extent relating to principal in respect of the Home Loans; 72 816 718
c. Recoveries to the extent relating to principal in respect of the Home Loans; -
d. Settlements to the extent relating to principal in respect of the Home Loans; -
e. Insurance Proceeds to the extent relating to principal in respect of the Home Loans; -
f. Net Proceeds received in respect of Replacement Assets sold; 4 686 457
g. Repurchase price received in respect of Repurchase Assets; -
h. Advances under the Warehouse Facility; -
i. Net Proceeds received in respect of Note issuances; -
j. other payments of a principal nature; -
k. The amount allocated to the Principal Available Funds Ledger as set out in item 18 of the Interest Pre-Enforcement Priority of Payments; 630 968
l. The amount recorded to the Redraw Reserve Ledger; and 18 954 331
m. The amount recorded, if any, in the Capital Reserve Ledger. -
Less: Readvances and Redraws on Home Loans 59 533 559
Total Quarterly Principal Available Funds 52 936 551
Quarterly Principal Priority of Payments
2.1.1) Unpaid Corporate existence expenses; -
2.1.2) Unpaid Issuer Expenses; -
2.1.3) Unpaid Servicer and Administration Fees; -
2.1.4) Principal due to the Warehouse Facility Provider; -
2.1.5) Principal due to the Redraw Facility Provider; -
2.1.6) Funding Redraw Reserve to Redraw Reserve Required Amount 18 287 408
2.1.7.1) Principal Due on the Class A1 Notes; -
2.1.7.2) Principal Due on the Class A2 Notes; -
2.1.7.3) Principal Due on the Class A3 Notes; -
2.1.7.4) Principal Due on the Class A4 Notes; 34 649 143
2.1.7.5) Principal Due on the Class A5 Notes; -
2.1.8) Principal Due on the Class B Notes; -
2.1.9) Principal Due on the Class C Notes; -
2.1.10) Principal Due on the Class D Notes; -
2.1.11) Principal Due on the Class E Notes; -
2.1.12) Interest due but unpaid in respect of the Notes; -
2.1.13) Funding of Capital Reserve to the Capital Reserve Required Amount; -
2.1.14) Acquisition of Additional Home Loans; -
2.1.15) Principal due to Subordinated Loan Provider -
Credited to the Principal Ledger -
2.1.16) Dividends due to Preference Shareholder -
Total Amount Quarterly Principal Priority of Payments 52 936 551
-
6

Current Key Portfolio Characteristics 31 July 2017
Number of Loans
Principal Balance
Min Loan Value 2
Max Loan Value
Average Loan Value
Min Current LTV 0.00%
Max Current LTV 99.25%
WA Current LTV 61.53%
Min Original LTV 0.01%
Max Original LTV 101.09%
WA Original LTV 70.99%
WA Asset Yield (related to the Prime rate)
WA seasoning (years)
WA remaining maturity (years)
WA Debt-to-Income
Owner Occupied 78.38%
Non-Owner Occupied 21.62%
Employed Borrowers 88.05%
Self Employed Borrowers 11.54%
Original Key Portfolio Characteristics3
20 February 2014
Number of Loans
Principal Balance
Min Loan Value
Max Loan Value
Average Loan Value
Min Current LTV 0.00%
Max Current LTV 100.74%
WA Current LTV 65.54%
Min Original LTV
Max Original LTV
WA Original LTV
WA Asset Yield (related to the Prime rate)
WA seasoning (years)
WA remaining maturity (years)
WA Debt-to-Income
Owner Occupied 90.06%
Non-Owner Occupied 9.94%
Employed Borrowers 87.78%
Self Employed Borrowers 12.19%
2
3
The negative loan balance is as a result of prepayments and/or repayments exceeding the capital balance owing.
5 538 162
950 633
-1.29%
914 509 327
-114 586
962
The original key portfolio characteristics relate to the asset pool as at 31 May 2014 (the determination date following the end of the prefunding period)
6.38
14.50
20.36%
16.77
11.84%
17.58%
101.25%
76.16%
-1.36%
3.27
1 306
1 470 424 121
-1 141 860
4 801 622
1 125 899
7

Current Principal Balance Distribution
Aggregate
Amount (ZAR)% of Total No. of Loans % of Total WA Asset Yield
WA Remaining
Maturity (years)WA Current LTV
<=0,00 -134 452 -0.01% 7 0.73% 8.94% 13.74 0.00%
0,00 - 500 000,00 72 136 479 7.89% 346 35.97% 8.87% 12.59 34.43%
500 000,00 - 1 000 000,00 201 348 054 22.02% 272 28.27% 8.94% 13.58 55.22%
1 000 000,00 - 1 500 000,00 178 290 916 19.50% 146 15.18% 8.95% 14.04 65.37%
1 500 000,00 - 2 000 000,00 136 655 805 14.94% 79 8.21% 8.99% 14.82 65.99%
2 000 000,00 - 2 500 000,00 81 230 134 8.88% 36 3.74% 8.88% 14.97 62.86%
2 500 000,00 - 3 000 000,00 104 518 401 11.43% 38 3.95% 8.92% 15.15 68.71%
3 000 000,00 - 3 500 000,00 65 133 528 7.12% 20 2.08% 9.06% 16.49 72.62%
3 500 000,00 - 4 000 000,00 41 423 752 4.53% 11 1.14% 8.98% 16.10 58.69%
4 000 000,00 - 4 500 000,00 17 745 166 1.94% 4 0.42% 9.16% 16.65 67.93%
>5 000 000,00 16 161 545 1.77% 3 0.31% 9.30% 15.62 83.32%
Total 914 509 327 100% 962 100%
ZAR
Mean
Minimum 4
Maximum
4 The negative loan balance is as a result of prepayments and/or repayments exceeding the capital balance owing.
31 July 2017
950 633
-114 586
5 538 162
Outstanding Principal Balance
(ZAR)
-5%
0%
5%
10%
15%
20%
25%
30%
-50
0
50
100
150
200
250
% o
f T
ota
l A
gg
reg
ate
am
ou
nt
Ag
gre
gate
Am
ou
nt
(ZA
R)
Current Principal Balance (ZAR)
No. of loans % of total assets
0%
5%
10%
15%
20%
25%
30%
35%
40%
0
50
100
150
200
250
300
350
400
% o
f T
ota
l N
o.
of
Lo
an
s
No
of
Lo
an
s
Current Principal Balance (No. of Loans)
No of loans % of total assets
8

Original Loan to Value (OLTV) as per Last Underwritten Date
OLTV PercentageAggregate
Amount (ZAR)% of Total No. of Loans % of Total WA Asset Yield
WA Remaining
Maturity (years)WA Current LTV
0,00% - 10,00% 6 548 792 0.72% 29 3.01% 887.12% 155.64 26.18%
10,00% - 20,00% 31 237 171 3.42% 38 3.95% 893.76% 178.68 29.13%
20,00% - 30,00% 28 141 771 3.08% 57 5.93% 863.71% 146.32 30.23%
30.00 % - 40.00% 38 292 476 4.19% 50 5.20% 872.61% 151.78 41.45%
40,00% - 50,00% 63 080 793 6.90% 77 8.00% 886.88% 173.77 42.29%
50,00% - 60,00% 99 305 611 10.86% 100 10.40% 884.17% 172.30 49.01%
60,00% - 70,00% 127 678 923 13.96% 111 11.54% 883.88% 174.65 54.78%
70,00% - 80,00% 164 957 383 18.04% 150 15.59% 888.70% 177.55 63.61%
80,00% - 90,00% 146 679 636 16.04% 139 14.45% 908.54% 178.86 73.10%
90,00% - 100,00% 205 037 499 22.42% 207 21.52% 916.21% 175.06 81.52%
100,00% - 102,00% 3 549 273 0.39% 4 0.42% 943.52% 220.23 83.41%
>102,00% - 0.00% 0.00% 0.00% 0.00 0.00%
Total 914 509 327 100% 962 100%
OLTV %
Mean 66.96%
Minimum 0.01%
Maximum 101.09%
31 July 2017
0.00%
5.00%
10.00%
15.00%
20.00%
25.00%
0
50
100
150
200
250
% o
f T
ota
l A
gg
reg
ate
Am
ou
nt
Ag
gre
gate
Am
ou
nt
(ZA
R)
Original Loan to Market Value as per Last Underwritten (ZAR)
Current Principal Balance R'm % of Asset Pool
0.00%
5.00%
10.00%
15.00%
20.00%
25.00%
0
50
100
150
200
250
% o
f T
ota
l N
o.
of
Lo
an
s
No
of
Lo
an
s
Original Loan to Market Value as per Last Underwritten (No. of Loans)
No. of loans % of Asset Pool
9

Current Principal Balance to Value (CLTV) as per Last Underwritten Date 31 July 2017
CLTV
Percentage
Aggregate
Amount (ZAR)% of Total No. of Loans % of Total WA Asset Yield
WA Remaining
Maturity (years)WA Current LTV
0.00% - 10.00% 10 221 249 1.12% 176 18.30% 8.72% 13.14 6.09%
10,00% - 20,00% 41 933 821 4.59% 88 9.15% 8.74% 13.85 15.40%
20,00% - 30,00% 49 939 059 5.46% 73 7.59% 8.70% 12.84 24.68%
30,00% - 40,00% 64 184 851 7.02% 71 7.38% 8.74% 13.52 35.72%
40,00% - 50,00% 112 562 900 12.31% 95 9.88% 8.83% 14.21 45.52%
50,00% - 60,00% 124 469 348 13.61% 100 10.40% 8.88% 14.14 55.46%
60,00% - 70,00% 136 664 771 14.94% 100 10.40% 8.89% 14.54 64.73%
70,00% - 80,00% 150 031 654 16.41% 104 10.81% 9.01% 14.95 74.84%
80,00% - 90,00% 133 498 217 14.60% 99 10.29% 9.19% 14.90 85.04%
90,00% - 100,00% 91 003 458 9.95% 56 5.82% 9.32% 16.00 94.36%
100,00% - 102,00%
>102,00%
Total 914 509 327 100% 962 100%
CLTV %
Mean 45.52%
Minimum 0.00%
Maximum 99.25%
0.00%
2.00%
4.00%
6.00%
8.00%
10.00%
12.00%
14.00%
16.00%
18.00%
0
20
40
60
80
100
120
140
160
% o
f T
ota
l A
gg
reg
ate
Am
ou
nt
Ag
gre
gate
Am
ou
nt
(ZA
R)
Current Principal Balance to Market Value as per Last Underwritten (ZAR)
Current Principal Balance R'm % of Asset Pool
0%
2%
4%
6%
8%
10%
12%
14%
16%
18%
20%
0
20
40
60
80
100
120
140
160
180
200
% o
f T
ota
l N
o.
of
Lo
an
s
No
. o
f L
oan
s
Current Principal Balance to Market Value as per Last Underwritten (No. of Loans)
No. of loans % of Asset Pool
10
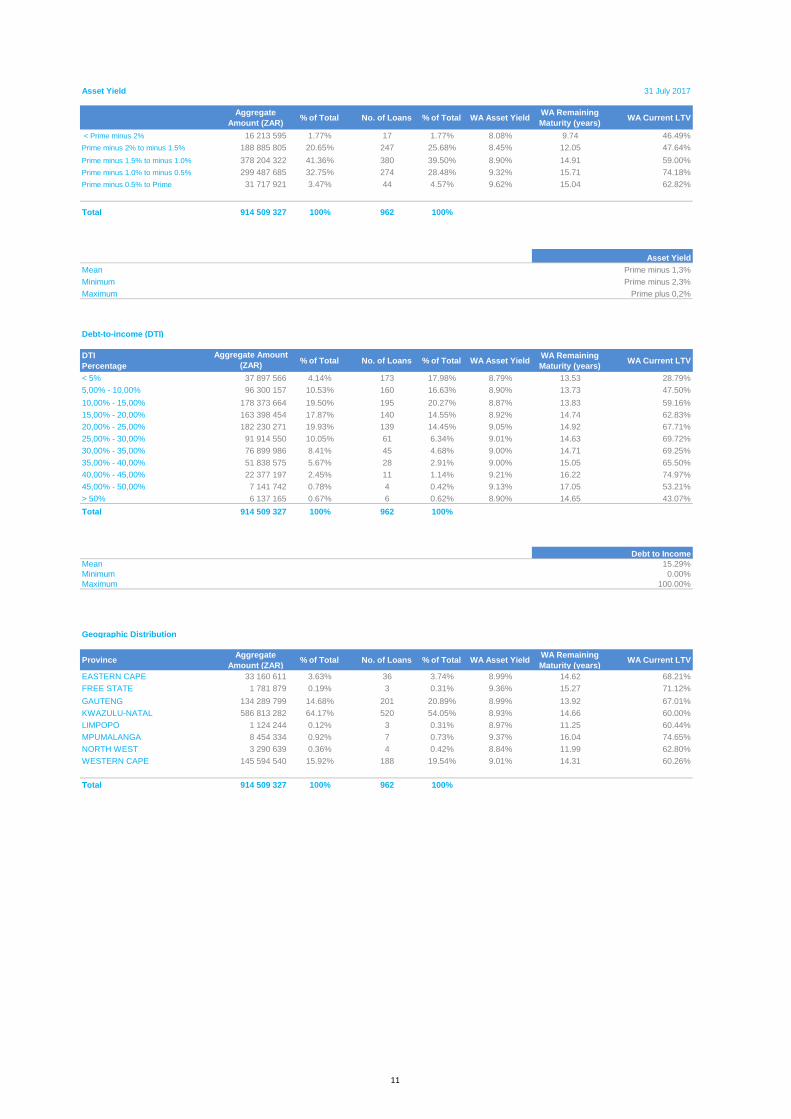
Asset Yield
Aggregate
Amount (ZAR)% of Total No. of Loans % of Total WA Asset Yield
WA Remaining
Maturity (years)WA Current LTV
< Prime minus 2% 16 213 595 1.77% 17 1.77% 8.08% 9.74 46.49%
Prime minus 2% to minus 1.5% 188 885 805 20.65% 247 25.68% 8.45% 12.05 47.64%
Prime minus 1.5% to minus 1.0% 378 204 322 41.36% 380 39.50% 8.90% 14.91 59.00%
Prime minus 1.0% to minus 0.5% 299 487 685 32.75% 274 28.48% 9.32% 15.71 74.18%
Prime minus 0.5% to Prime 31 717 921 3.47% 44 4.57% 9.62% 15.04 62.82%
Total 914 509 327 100% 962 100%
Mean Prime minus 1,3%
Minimum Prime minus 2,3%
Maximum Prime plus 0,2%
Debt-to-income (DTI)
DTI
Percentage% of Total No. of Loans % of Total WA Asset Yield
WA Remaining
Maturity (years)WA Current LTV
< 5% 37 897 566 4.14% 173 17.98% 8.79% 13.53 28.79%
5,00% - 10,00% 96 300 157 10.53% 160 16.63% 8.90% 13.73 47.50%
10,00% - 15,00% 178 373 664 19.50% 195 20.27% 8.87% 13.83 59.16%
15,00% - 20,00% 163 398 454 17.87% 140 14.55% 8.92% 14.74 62.83%
20,00% - 25,00% 182 230 271 19.93% 139 14.45% 9.05% 14.92 67.71%
25,00% - 30,00% 91 914 550 10.05% 61 6.34% 9.01% 14.63 69.72%
30,00% - 35,00% 76 899 986 8.41% 45 4.68% 9.00% 14.71 69.25%
35,00% - 40,00% 51 838 575 5.67% 28 2.91% 9.00% 15.05 65.50%
40,00% - 45,00% 22 377 197 2.45% 11 1.14% 9.21% 16.22 74.97%
45,00% - 50,00% 7 141 742 0.78% 4 0.42% 9.13% 17.05 53.21%
> 50% 6 137 165 0.67% 6 0.62% 8.90% 14.65 43.07%
Total 914 509 327 100% 962 100%
Mean 15.29%
Minimum 0.00%
Maximum 100.00%
Geographic Distribution
ProvinceAggregate
Amount (ZAR)% of Total No. of Loans % of Total WA Asset Yield
WA Remaining
Maturity (years)WA Current LTV
EASTERN CAPE 33 160 611 3.63% 36 3.74% 8.99% 14.62 68.21%
FREE STATE 1 781 879 0.19% 3 0.31% 9.36% 15.27 71.12%
GAUTENG 134 289 799 14.68% 201 20.89% 8.99% 13.92 67.01%
KWAZULU-NATAL 586 813 282 64.17% 520 54.05% 8.93% 14.66 60.00%
LIMPOPO 1 124 244 0.12% 3 0.31% 8.97% 11.25 60.44%
MPUMALANGA 8 454 334 0.92% 7 0.73% 9.37% 16.04 74.65%
NORTH WEST 3 290 639 0.36% 4 0.42% 8.84% 11.99 62.80%
WESTERN CAPE 145 594 540 15.92% 188 19.54% 9.01% 14.31 60.26%
Total 914 509 327 100% 962 100%
Asset Yield
31 July 2017
Aggregate Amount
(ZAR)
Debt to Income
11

Loan purpose
Loan purposeAggregate
Amount (ZAR) % of Total % of Total WA Asset Yield
WA Remaining
Maturity (years)WA Current LTV
63 718 303 6.97% 52 5.41% 9.07% 15.18 56.27%
Renovation - additions -18 498 0.00% 3 0.31% 8.93% 15.48 -0.68%
700 815 163 76.63% 734 76.30% 8.99% 14.63 63.37%
149 994 360 16.40% 173 17.98% 8.73% 13.58 55.20%
Total 914 509 327 100% 962 100%
Seasoning
Seasoning
(Months)
Aggregate
Amount (ZAR) % of Total No. of Loans % of Total WA Asset Yield
WA Remaining
Maturity (years)WA Current LTV
0 - 60 287 966 565 31.49% 249 25.88% 9.05% 16.10 64.65%
60 - 120 553 797 082 60.56% 593 61.64% 8.98% 14.17 61.63%
120 - 180 72 745 681 7.95% 120 12.47% 8.45% 10.67 48.44%
>180
Total 914 509 327 100% 962 100%
Loans interest rate type
Interest rate
type
Aggregate
Amount (ZAR) % of Total No. of Loans % of Total WA Asset Yield
WA Remaining
Maturity (years)WA Current LTV
Prime 914 509 327 100.00% 962 100.00% 8.96% 14.50 61.53%
Total 914 509 327 100% 962 100%
Repayment type
Aggregate
Amount (ZAR) % of Total No. of Loans % of Total WA Asset Yield
WA Remaining
Maturity (years)WA Current LTV
Repayment 914 509 327 100.00% 962 100.00% 8.96% 14.50 61.53%
Total 914 509 327 100% 962 100%
Refinance - Includes take overs,
collateral security
Purchase or Completed Building Bond
Equity release - revaluation,
remortgage
Repayment type
No. of Loans
31 July 2017
12
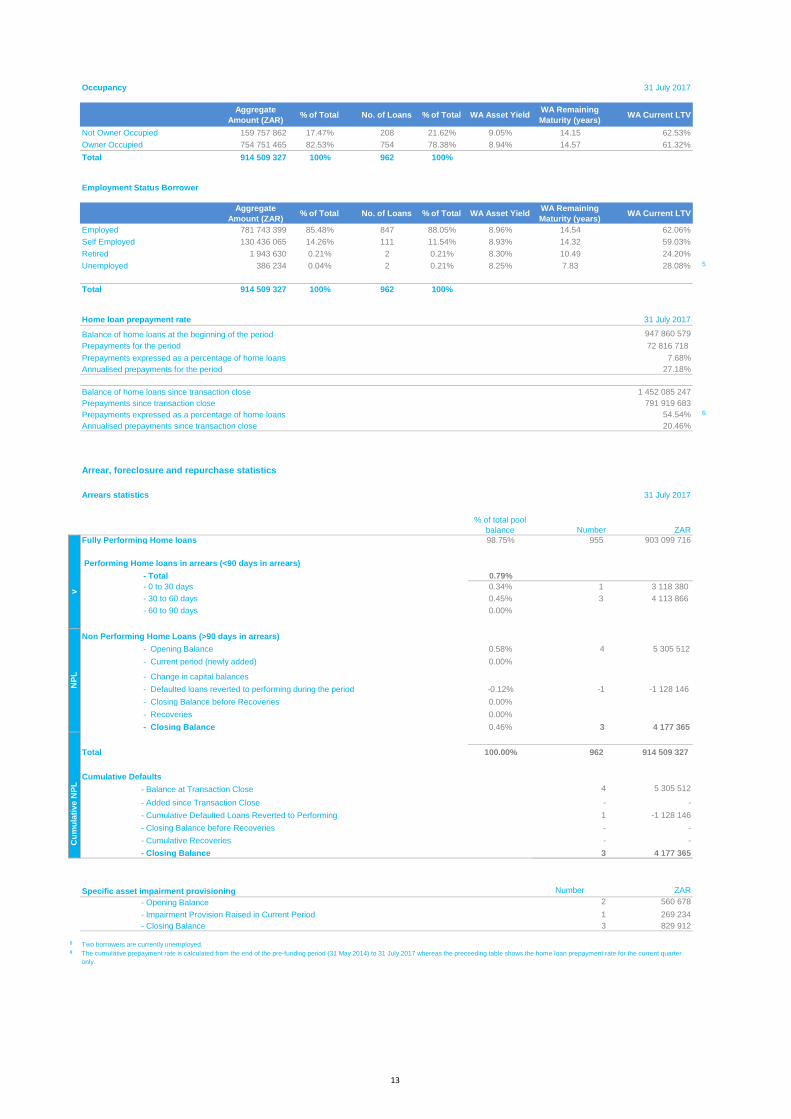
Occupancy
Aggregate
Amount (ZAR)% of Total No. of Loans % of Total WA Asset Yield
WA Remaining
Maturity (years)WA Current LTV
Not Owner Occupied 159 757 862 17.47% 208 21.62% 9.05% 14.15 62.53%
Owner Occupied 754 751 465 82.53% 754 78.38% 8.94% 14.57 61.32%
Total 914 509 327 100% 962 100%
Employment Status Borrower
Aggregate
Amount (ZAR)% of Total No. of Loans % of Total WA Asset Yield
WA Remaining
Maturity (years)WA Current LTV
Employed 781 743 399 85.48% 847 88.05% 8.96% 14.54 62.06%
Self Employed 130 436 065 14.26% 111 11.54% 8.93% 14.32 59.03%
Retired 1 943 630 0.21% 2 0.21% 8.30% 10.49 24.20%
Unemployed 386 234 0.04% 2 0.21% 8.25% 7.83 28.08% 5
Total 914 509 327 100% 962 100%
Home loan prepayment rate 31 July 2017
Balance of home loans at the beginning of the period 947 860 579
Prepayments for the period 72 816 718
Prepayments expressed as a percentage of home loans 7.68%
Annualised prepayments for the period 27.18%
Balance of home loans since transaction close 1 452 085 247
Prepayments since transaction close 791 919 683
Prepayments expressed as a percentage of home loans 54.54% 6
Annualised prepayments since transaction close 20.46%
Arrear, foreclosure and repurchase statistics
Arrears statistics
Number ZAR
Fully Performing Home loans 98.75% 955 903 099 716
Performing Home loans in arrears (<90 days in arrears)
.- Total 0.79%
0.34% 1 3 118 380
0.45% 3 4 113 866
0.00%
0.58% 4 5 305 512
0.00%
-0.12% -1 -1 128 146
0.00%
0.00%
.- Closing Balance 0.46% 3 4 177 365
100.00% 962 914 509 327
4 5 305 512
- -
1 -1 128 146
- -
- -
3 4 177 365
Specific asset impairment provisioning Number ZAR
- Opening Balance 2 560 678
- Impairment Provision Raised in Current Period 1 269 234
- Closing Balance 3 829 912
5
6
NP
L
Non Performing Home Loans (>90 days in arrears)
Cu
mu
lati
ve
NP
L
Cumulative Defaults
v
.- 60 to 90 days
.- 0 to 30 days
Total
.- Closing Balance before Recoveries
.- Recoveries
- Cumulative Defaulted Loans Reverted to Performing
.- Opening Balance
- Current period (newly added)
% of total pool
balance
31 July 2017
- Balance at Transaction Close
- Closing Balance before Recoveries
- Cumulative Recoveries
- Closing Balance
Two borrowers are currently unemployed.
The cumulative prepayment rate is calculated from the end of the pre-funding period (31 May 2014) to 31 July 2017 whereas the preceeding table shows the home loan prepayment rate for the current quarter
only.
31 July 2017
.- 30 to 60 days
- Defaulted loans reverted to performing during the period
- Change in capital balances
- Added since Transaction Close
13

31 July 2017
Possessions Number ZAR
Loans Foreclosed
- Opening Balance - -
- Current Month (Newly Added) - -
- Closing Balance - -
Total Recoveries - -
Realised Gains / Losses - -
Amounts in the Recovery Process - -
Cumulative Sold Possesions - -
Repurchases (including predecessor assets sold) ZAR
Current period 4 686 457
Aggregate Home Loan values at the time of sale -
Cumulative -
Aggregate Home Loan values at the time of sale 17 737 763
Losses Number ZAR
Opening Balance - -
Losses Recognized in Current Period - -
Closing Balance - -
Weighted Average Loss Severity in the Period - -
Cumulative Weighted Average Loss Severity - -
Principal Deficiency Ledger (PDL)7
31 July 2017
Opening
Balance
(PDL)
Addition to
PDL
Clearance from
PDL
Closing Balance
(PDL)
Interest Deferral
event (Y/N)
Subordinated Loan 119 227 926 - - - - N
FS2E1 - - - - - N
FS2D1 35 000 000 - - - - N
FS2C1 50 000 000 - - - - N
FS2B1 126 000 000 - - - - N
FS2A5 586 000 000 - - - - N 8
FS2A4 84 403 362 - - - - N
FS2A3 - - - - - N
FS2A2 - - - - - N
7
8
Sub Ledger
Outstanding Notes and
Subordinated Loan Balance
(ZAR)
The Issuer has established the Principal Deficiency Ledger which records the principal deficiency as per the transaction documentation. If an amount is recorded in this ledger, it may indicate that the relevant
Class of Notes or Subordinated Loan may not be repaid in full.
As at 21 August 2017, the entire tranches of the Class A1 notes (R80m), Class A2 notes (R150m) and Class A3 notes (R220m) were redeemed. R170.2m of the Class A4 notes have also been redeemed.
14

Trigger Events
Trigger Events OK / Breach
Servicer continues to hold the Servicer Default Reserve Rating OK
No Issuer Insolvency Event OK
No Event of Default under the Notes OK
Stop Purchase Events OK / Breach
No Servicer Event of Default OK
OK
No Issuer Trigger Event OK
OK
Counterparties and Ratings
OK / Breach
Short Term Long Term Short Term
Account Bank Investec Bank Limited A(ZA) A1(ZA) AA(ZA) A1+(ZA) OK
Derivative Counterparty Investec Bank Limited A(ZA) A1(ZA) AA(ZA) A1+(ZA) OK
Servicer Investec Bank Limited BB-(ZA) N/A AA(ZA) A1+(ZA) OK
Administrator Investec Bank Limited N/A N/A AA(ZA) A1+(ZA) OK
Current Rating
Long Term
Type Counterparty GCR Required Credit Rating
No Principal Deficiency is recorded to the Principal Deficiency Ledger relating to the relevant Class of Notes and/or Subordinated
Loan.
Issuer has sufficient funds available to pay the Purchase Price for Additional Home Loans, fund Redraws, Re Advances or Further
Advances.
15

Transaction Account and Reserves
ZAR
18 941 241
20 468 609
1 000 000
18 954 331
Other Cash 59 735 292
119 099 473
117 562 136
85 254 724
-83 717 387
119 099 473
18 941 241
-
-
18 941 241
18 024 609 9
20 468 609
-20 468 609
19 837 641
19 837 641
19 837 641
1 000 000
-
1 000 000
1 000 000
18 954 331
-
-666 924
18 287 408
18 287 408
18 287 408
976 973 875
20 August 2038
-16 671 699
17 350 304
678 605
9
Liquidity Reserve Ledger
Liquidity Reserve balance at the beginning of the Reporting Period
Total balance Transaction Account
Redraw Reserve Ledger
Mortgage Bonds Registration Costs Reserve Required Amount
Swap notional at beginning of the Reporting Period
Redraw Reserve Required Amount
Maturity Date
The calculated Capital Reserve Required Amount according to the transaction documentation amounts to R18 024 609. However, the Administrator decided to use its discretion and not released the excess
reserve.
Replenishment of Capital Reserve Required Amount from Principal Available Funds
Capital Reserve balance at the end of the Reporting Period
Required Reserve Amount
Liquidity Reserve balance at the end of the Reporting Period
Liquidity Reserve Required Amount
Mortgage Bonds Registration Costs Reserve Ledger
Capital Reserve balance at the beginning of the Reporting Period
Release of Capital Reserve to Principal Available Funds
Net swap receivable at the end of the Reporting Period
Redraw Reserve balance at the end of the Reporting Period
Release of Liquidity Reserve to Interest Available Funds
Replenishment of Liquidity Reserve Required Amount from Interest Available Funds
Mortgage Bonds Registration Costs Reserve balance at the beginning of the Reporting Period
Issuer paying leg
Issuer receiving leg
Movement in Mortgage Bonds Registration Costs Reserve
Derivative Contracts - Interest Rate Swap (Prime for Jibar)
Redraw Reserve balance at the beginning of the Reporting Period
Funding of Further Advances, Redraws and Re- advances
Release of Redraw Reserve to Principal Available Funds
Replenishment of Redraw Reserve Required Amount from Principal Available Funds
Mortgage Bonds Registration Costs Reserve balance at the end of the Reporting Period
Received on Transaction Account
Paid from Transaction Account
Transaction Account balance at 31 July 2017
Capital Reserve Ledger
Transaction Account
Transaction Account balance at 01 May 2017
Balance Redraw Reserve Ledger
Transaction Account comprises
Balance Capital Reserve Ledger
Balance Liquidity Reserve Ledger
Balance Mortgage Bonds Registration Costs Reserve Ledger
16
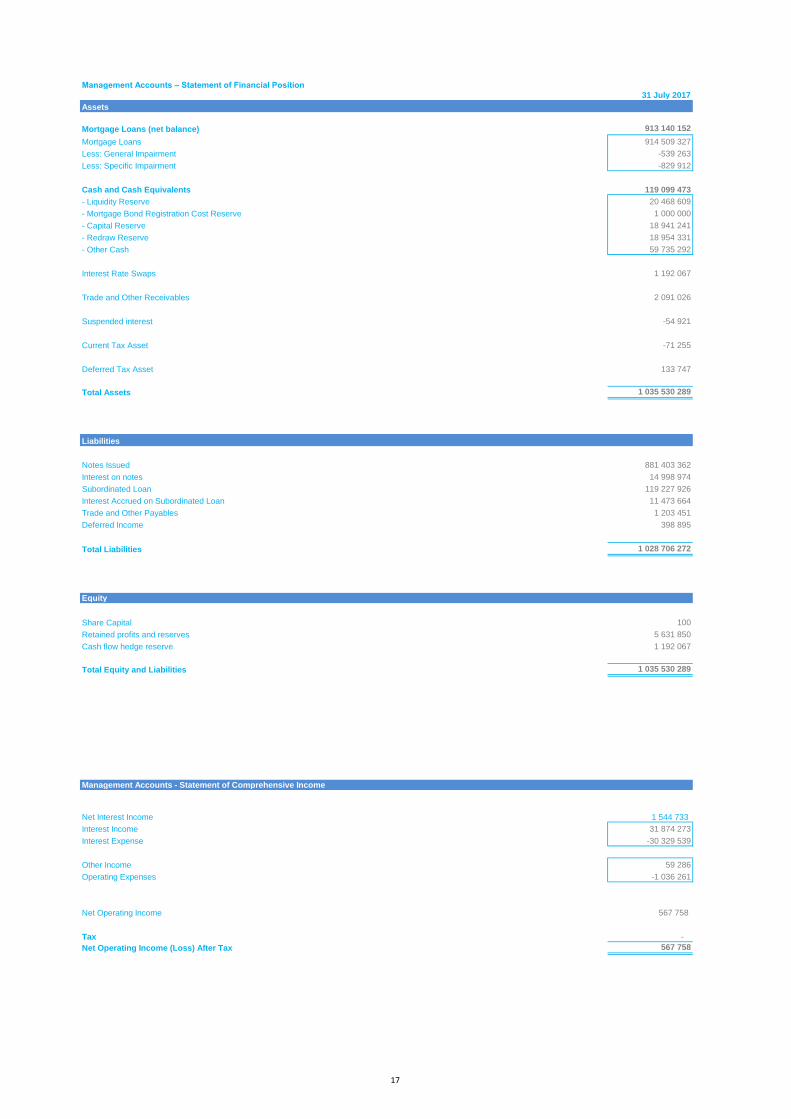
Management Accounts – Statement of Financial Position
31 July 2017
Assets
Mortgage Loans (net balance) 913 140 152
Mortgage Loans 914 509 327
Less: General Impairment -539 263
Less: Specific Impairment -829 912
Cash and Cash Equivalents 119 099 473
- Liquidity Reserve 20 468 609
- Mortgage Bond Registration Cost Reserve 1 000 000
- Capital Reserve 18 941 241
- Redraw Reserve 18 954 331
- Other Cash 59 735 292
Interest Rate Swaps 1 192 067
Trade and Other Receivables 2 091 026
Suspended interest -54 921
Current Tax Asset -71 255
Deferred Tax Asset 133 747
Total Assets 1 035 530 289
Liabilities
Notes Issued 881 403 362
Interest on notes 14 998 974
Subordinated Loan 119 227 926
Interest Accrued on Subordinated Loan 11 473 664
Trade and Other Payables 1 203 451
Deferred Income 398 895
Total Liabilities 1 028 706 272
Equity
Share Capital 100
Retained profits and reserves 5 631 850
Cash flow hedge reserve 1 192 067
Total Equity and Liabilities 1 035 530 289
Management Accounts - Statement of Comprehensive Income
Net Interest Income 1 544 733
Interest Income 31 874 273
Interest Expense -30 329 539
Other Income 59 286
Operating Expenses -1 036 261
Net Operating Income 567 758
Tax -
Net Operating Income (Loss) After Tax 567 758
17

Glossary
Terms
Advance
Current LTV Ratio
Fully Performing
Further Advance
Home Loan
Mortgage Bond
Non-Owner Occupied Ratio
Non-Performing Asset
Predecessor assets sold
Prepayments
Properties
Re-advances
Redraws
Repayments
Replacement Assets Purchase
Salaried Employee
Self-Employed Ratio
Weighted Average Debt to Income Ratio
Weighted Average Discount to the Prime Rate Ratio
Weighted Average Original Loan to Value
Weighted Average Seasoning
The aggregate of the following calculation to be made in relation to each Home Loan forming part of the Home Loan Portfolio - the Principal Balance of each Home Loan that relates to
Borrowers that are self-employed divided by the aggregate of the Principal Balances of all the Home Loans in the Home Loan Portfolio.
The amount advanced from time to time by the Redraw Facility Provider or Warehouse Facility Provider, as the case may be, to the Issuer pursuant to a Drawdown Notice.
Loan to value ratio, being the aggregate Principal Balance of a Home Loan divided by the most recent value of the Property (as determined in accordance with the servicer s customary
procedures) associated with such Home Loan at the most recent underwriting date in relation to the Home Loan.
A Participating Asset that is not in arrears, unless such arrears is as a result of an administrative or technical error;.
A Further Advance is an additional advance to a Borrower, in terms of a Home Loan Agreement, which is not a Redraw or Re-advance. Further advance should be known as the last
underwritten advance.
A loan, in each case comprising the aggregate of all advances (including Redraws, Re-advances and Further Advances) made in terms of the relevant Home Loan Agreement by a
Home Loan Lender to a Borrower which advances are secured against, the security of, inter alia a Mortgage Bond.
A mortgage bond or sectional title bond on terms acceptable to the Home Loan Lender, registered over the Property of the relevant Borrower in favour of the Home Loan Lender as
security for the obligations of such Borrower to the Home Loan Lender in relation to the Home Loan Agreement granted to such Borrower.
The aggregate of the following calculation to be made in relation to each Home Loan forming part of the Home Loan Portfolio - the Principal Balance in respect of each Home Loan that
relates to buy-to-let Properties divided by the aggregate of the Principal Balances of all the Home Loans in the Home Loan Portfolio.
A Home Loan which is 3 (three) instalments or more in arrears.
The aggregate of the following calculation to be made in relation to each Home Loan forming part of the Home Loan Portfolio - the number of months which have passed since [the
origination date] of each Home Loan [advance]; whereby the number of months for each Home Loan [advance] is multiplied by the proportion of the respective Principal Balance of each
Home Loan to the aggregate Principal Balance of all the Home Loans in the Home Loan Portfolio.
Is an asset that is purchase out of the pool as a true/ warranty buy out. No asset will replace the repurchased asset.
Principal repayments received under a Home Loan in excess of the minimum scheduled instalments which a Borrower is obliged to pay.
In relation to each Participating Asset, the fixed immovable residential property situated in South Africa, over which a Mortgage Bond is or will be registered.
A Re-advance is an advance to the relevant Borrower, in terms of the Home Loan Agreement, concluded by such Borrower, after the application of the relevant Credit Criteria, of a
Redraws are draws by the relevant Borrower, in terms of the relevant Home Loan Agreement, of a portion of the principal of such Borrower s Home Loan, provided that the amount of
such redraw is limited to principal which has previously been repaid by such Borrower in excess of the minimum scheduled instalments (i.e. a redraw of Prepayments) and which have
not already been redrawn by such Borrower before the time of such Redraw.
Repayments of principal received under a Home Loan, being the scheduled instalments received.
Is an asset that is replace by another asset that fits the replacement asset criteria (i.e. substitution)
A natural person who is paid a fixed amount of money or compensation from an employer in return for work preformed. Partners employed by any major legal, auditing or any other firm
shall be regarded as salaried employee. It is understood that the partners participate in profit share. A person who owns a business or who has majority shareholding in a business and
draws a salary from that business shall not be regarded as a salaried employee.
The aggregate of the following calculation to be made in relation to each Home Loan forming part of the Home Loan Portfolio - the prevailing percentage discount to the Prime Rate of
each Home Loan; whereby the aforementioned discount is multiplied by the proportion of the Home Loan’s respective Principal Balance to the aggregate Principal Balance of all the
Home Loans in the Home Loan Portfolio.
The aggregate of the following calculation to be made in relation to each Home Loan forming part of the Home Loan Portfolio - (a) the maximum of (I) the Principal Balance of the Home
Loan at inception plus the aggregate principal balance of other home loans that the relevant Borrower has with the Originator, or (ii) the Principal Balance of the Home Loan plus the
aggregate balance of amounts that can be redrawn in respect of the Home Loan plus the aggregate balance of amounts that can be redrawn under such other home loans that the
Borrower has with the Originator, divided by (b) the value of the Property (as determined from time to time in accordance with the Servicer’s customary procedures at the latest
underwriting date of the Home Loan) associated with such Home Loan; whereby the aforementioned calculation is multiplied by the proportion of the Home Loan’s respective Principal
Balance to the aggregate Principal Balances of all the Home Loans in the Home Loan Portfolio.
The aggregate of the following calculation to be made in relation to each Home Loan forming part of the Home Loan Portfolio - the monthly instalment amount of each Home Loan
(calculated on a time to maturity basis at the last [underwriting date] of such Home Loan) divided by the gross monthly income associated with the Borrower of such Home Loan
(calculated at the last [underwriting date] of the Home Loan); whereby the aforementioned calculation is multiplied by the proportion of the Home Loan’s respective Principal Balance to
the aggregate Principal Balances of all the Home Loans in the Home Loan Portfolio.
18