fpg consolidated financial results - みんかぶ
TRANSCRIPT

FPG ConsolidatedFinancial Results
First Half of the Fiscal Year Ending September 30, 2017October 1,2016 – March 31,2017
Financial Products Group Co., Ltd.
Tokyo Stock Exchange First Section(Code: 7148)
April 2017

Copyright Financial Products Group Co., Ltd. All Rights Reserved. 1
P3P4
P5
P7P8P9P10
P12P13P14
SummaryPerformance HighlightsTopics-Launched container investment and management
service businessTopics-Expansion of real estate business
Business OverviewTax leasing arrangement businessDistribution networkBusiness diversificationFY2017 Dividend forecast
AppendixIncome statementBalance sheet
Disclaimer
Table of Contents

SummarySummary
Copyright Financial Products Group Co., Ltd. All Rights Reserved.
FY20162Q(cumulative)
FY20172Q(cumulative) FY2017
Full-yearforecast
Progressrate% of Net
sales% of Net
salesYoY
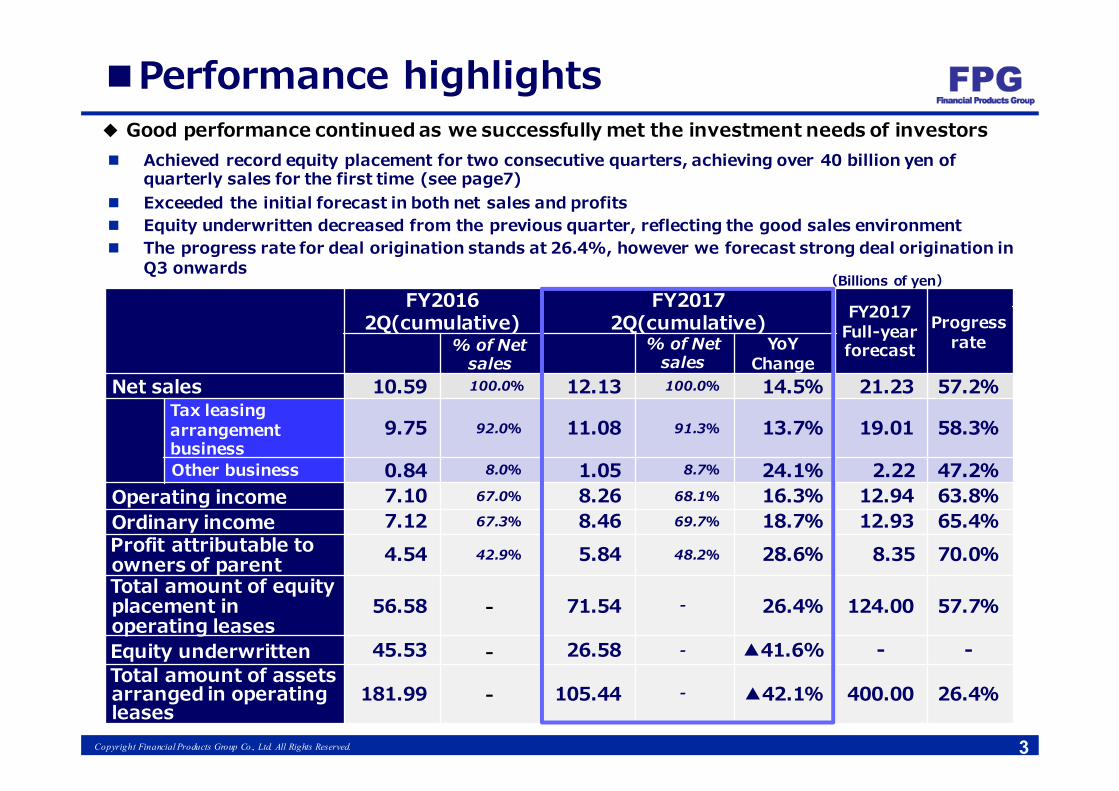
ChangeNet sales 10.59 100.0% 12.13 100.0% 14.5% 21.23 57.2%
Tax leasingarrangementbusiness
9.75 92.0% 11.08 91.3% 13.7% 19.01 58.3%
Other business 0.84 8.0% 1.05 8.7% 24.1% 2.22 47.2%Operating income 7.10 67.0% 8.26 68.1% 16.3% 12.94 63.8%Ordinary income 7.12 67.3% 8.46 69.7% 18.7% 12.93 65.4%Profit attributable toowners of parent 4.54 42.9% 5.84 48.2% 28.6% 8.35 70.0%Total amount of equity placement inoperating leases
56.58 - 71.54 - 26.4% 124.00 57.7%
Equity underwritten 45.53 - 26.58 - ▲41.6% - -Total amount of assets arranged in operating leases
181.99 - 105.44 - ▲42.1% 400.00 26.4%
3
■Performance highlights
Achieved record equity placement for two consecutive quarters, achieving over 40 billion yen of quarterly sales for the first time (see page7)
Exceeded the initial forecast in both net sales and profits Equity underwritten decreased from the previous quarter, reflecting the good sales environment The progress rate for deal origination stands at 26.4%, however we forecast strong deal origination in
Q3 onwards(Billions of yen)
◆ Good performance continued as we successfully met the investment needs of investors

Copyright Financial Products Group Co., Ltd. All Rights Reserved. 4
■Topics – Launched container investment and management service business
◆Established a marine container leasing JV(“FPG Raffles”) in Singapore
Majorinternational
shipping companies・Container investment and
management・Warehousing business
Providing container leasing projects
Container leasing
Applying BUSS Group’s know-how in container investment and management to the arrangement of container leasing transactions in which FPG has expertise.
Expanding our opportunities to arrange container leasing transactions through developing a warehousing business, which will be used to acquire and hold containers that we will subsequently use for new transactions
FPG Raffles Holdings100%
FPG75.1% 13.1% 11.8%
Container investment and management company in Germany
Buss Global Holdings Pte. Ltd.FPG’s affiliated company
FPG Asset & Investment Management B.V.
Made an investment in kind of the equity of Raffles Lease (the former name of FPG Raffles), which enabled FPG Raffles to acquire the proprietary container management system of such company
Japanese Investors
German investors
As for warehousing business, forming new companies under FPG Raffles Holdings is an option to be considered going forward.
FPG

Copyright Financial Products Group Co., Ltd. All Rights Reserved. 5
Shibuya INCS(Shibuya-ku)
Qiz Aoyama(Shibuya-ku)
Platinum Court Hiroo(Minato-ku)
■Topics – Expansion of real estate business◆Launched the second round of small lot real estate products in the
form of trust beneficiary rights 1H sales of Real estate related business exceeded its full-year sales of the previous
fiscal year due to Investors’ strong needs for small lot real estate products for asset management and inheritance and gift tax measure
FPG Shibuya Miyamasu bldg.(Shibuya-ku)
FPG Links Harajuku(Shibuya-ku)
59
157 167
274 304
0
100
200
300
400
FY2013 FY2014 FY2015 FY2016 FY2017 2Q
2H 1H
【Aug.2013~sold out】 【Mar.2014~sold out】 【Aug.2014~sold out】 【Apr.2016~sold out】 【Mar.2017~available 】
Launched Real Estate Specified Joint Enterprise products
Launched small lot real estate products in the form of trust beneficiary rights
The first Real Estate Specified JointEnterprise product
(Millions of yen)
The second Real Estate Specified JointEnterprise product
The third Real Estate Specified JointEnterprise product
The first small lot real estate productWith trust beneficiary rights
The second small lot real estate productWith trust beneficiary rights

Business OverviewBusiness Overview
Copyright Financial Products Group Co., Ltd. All Rights Reserved. 7
■Tax leasing arrangement business
FY20162Q(cumulative)
FY20172Q(cumulative)
Change FY20172Q
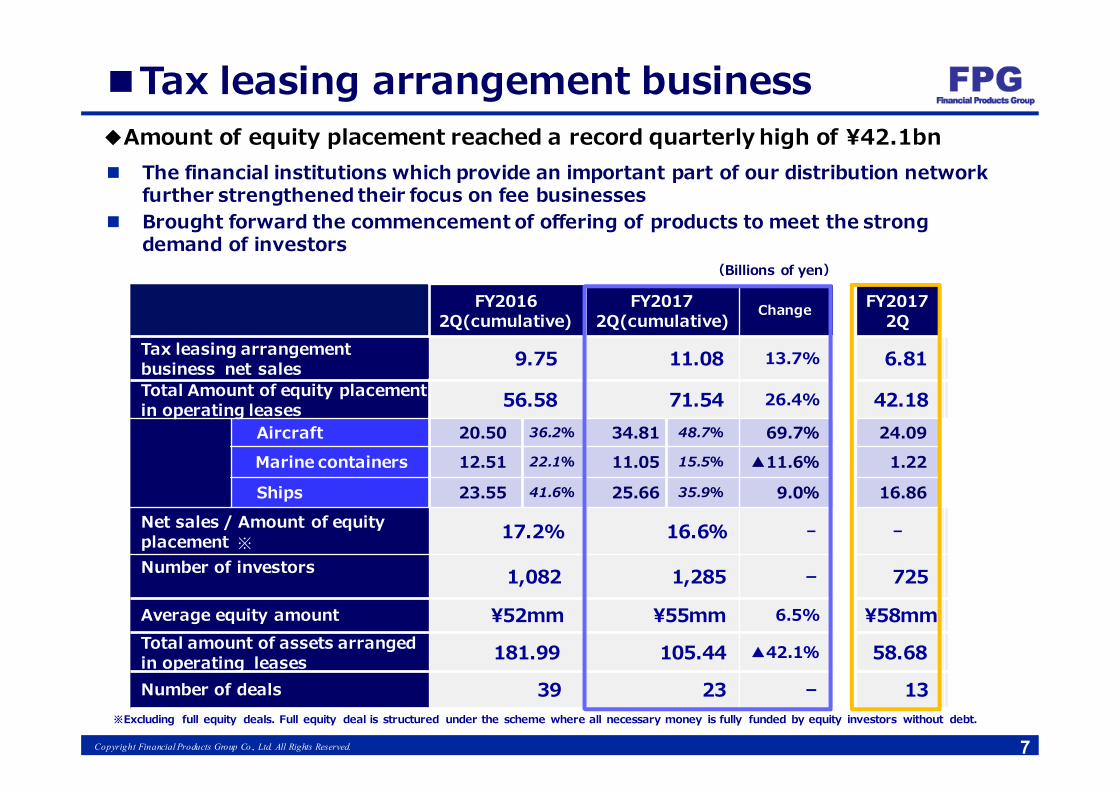
Tax leasing arrangementbusiness net sales 9.75 11.08 13.7% 6.81Total Amount of equity placement in operating leases 56.58 71.54 26.4% 42.18
Aircraft 20.50 36.2% 34.81 48.7% 69.7% 24.09Marine containers 12.51 22.1% 11.05 15.5% ▲11.6% 1.22
Ships 23.55 41.6% 25.66 35.9% 9.0% 16.86Net sales / Amount of equity placement 17.2% 16.6% - -
Number of investors 1,082 1,285 - 725
Average equity amount ¥52mm ¥55mm 6.5% ¥58mmTotal amount of assets arranged in operating leases 181.99 105.44 ▲42.1% 58.68
Number of deals 39 23 - 13※Excluding full equity deals. Full equity deal is structured under the scheme where all necessary money is fully funded by equity investors without debt.
※
(Billions of yen)
◆Amount of equity placement reached a record quarterly high of ¥42.1bn The financial institutions which provide an important part of our distribution network
further strengthened their focus on fee businesses Brought forward the commencement of offering of products to meet the strong
demand of investors

Copyright Financial Products Group Co., Ltd. All Rights Reserved. 8
(+109)
■Distribution network
2,304 2,814 3,095
102110 116
-10
10
30
50
70
90
110
130
0
500
1,0001,500
2,000
2,500
3,0003,500
4,000
FY2015 FY2016 FY20172Q
Number of businesspartnership agreementsNumber of business matchingagreements
42.43 42.05 33.48
38.23 63.93
35.87
3.51
3.43
2.18
0
30
60
90
120
FY2015 FY2016 FY20172Q
Direct contact
Introduced by financiers (banks & securities companies)
Introduced by the accounting firms
(Billions of yen)
84.17
109.41
Forecast124.00
◆Created more alliances with accounting firms and financial institutions
Regional banks 97Securities companies 19
Distribution network expanded steadily from end-FY2016. Number of partner accounting firms increased by 281, reaching 3,095 in total, while the number of partner financial institutions increased by 6, reaching 116 in total
Customer referrals remain solid as financial institutions continue to focus on fee businesses due to the negative interest rate policy of the BOJ
Concentrated efforts to strengthen and deepen our partnerships with accounting firms
Number of partnership agreements and business matching agreements
Transition of equity sales(through accounting firms and financiers)
71.54

Copyright Financial Products Group Co., Ltd. All Rights Reserved. 9
■Business diversification◆ Using out existing client base and distribution network, active promotion of
cross-selling has led to a strong expansion of our diversified businesses
(Millions of yen)
FY20162Q
FY20172Q Change
Real estate business 142 304 113.8%
Insurance brokerage business 223 303 36.1%
M&A advisory business 24 39 57.9%Aircraft investment management service 315 278 ▲11.7%
Securities business 103 117 13.2%
Others(Trust business etc) 36 6 ▲82.4%
Total 846 1,050 24.1%
Diversified businesses refers to businesses other than our main business which is the tax leasing arrangement business

Copyright Financial Products Group Co., Ltd. All Rights Reserved. 10
■ FY2017 Dividend forecast
Returning adequate profit to shareholders is one of our top priorities. Our policy is to distribute dividends in line with our profit improvement while retaining sufficient funds to ensure FPG's sustainable business expansion. We have set the target of consolidated dividend payout ratio at greater than 30%. In light of our consolidated forecast for FY2017, the year-end dividend forecast is ¥37.15 per share to enhance shareholder returns.
◆ Year-end dividend forecast of ¥37.15 per share
¥24.50
¥35.50¥37.15
36.3%
42.2% 40.0%
20.022.024.026.028.030.032.034.036.038.040.042.0
0.00
10.00
20.00
30.00
40.00
FY2015 FY2016 FY2017 (Forecast)
year-end dividend(per share)
payout ratio
Dividendincrease

AppendixAppendix

Copyright Financial Products Group Co., Ltd. All Rights Reserved.
FY2016 2Q FY2017 2Q Change
Net sales 10.59 12.13 14.5% Cost of sales 1.30 1.46 12.9%
Gross profit 9.29 10.66 14.7% SG&A cost 2.19 2.40 9.6%
Operating income 7.10 8.26 16.3% Non-operatingincome 0.51 0.68 31.3% Non-operatingexpenses 0.49 0.48 ▲2.8%
Ordinary income 7.12 8.46 18.7% Income before income taxes 6.97 8.45 21.3%
Total income taxes 2.40 2.60 8.0%
Profit attributableto owners of parent 4.54 5.84 28.6%
12
■Income statement(Billions of yen)
①Cost of sales: Including commission fees paid for client introductions and arrangement costs of tax leasing arrangement business
②Non-operating income: Including interest which we collect from investors when we sell down the equityto them in tax leasing arrangement business
③Non-operating expenses: Including commission fees and interest expenses related to fund-procurement
①
②
③
Copyright Financial Products Group Co., Ltd. All Rights Reserved.
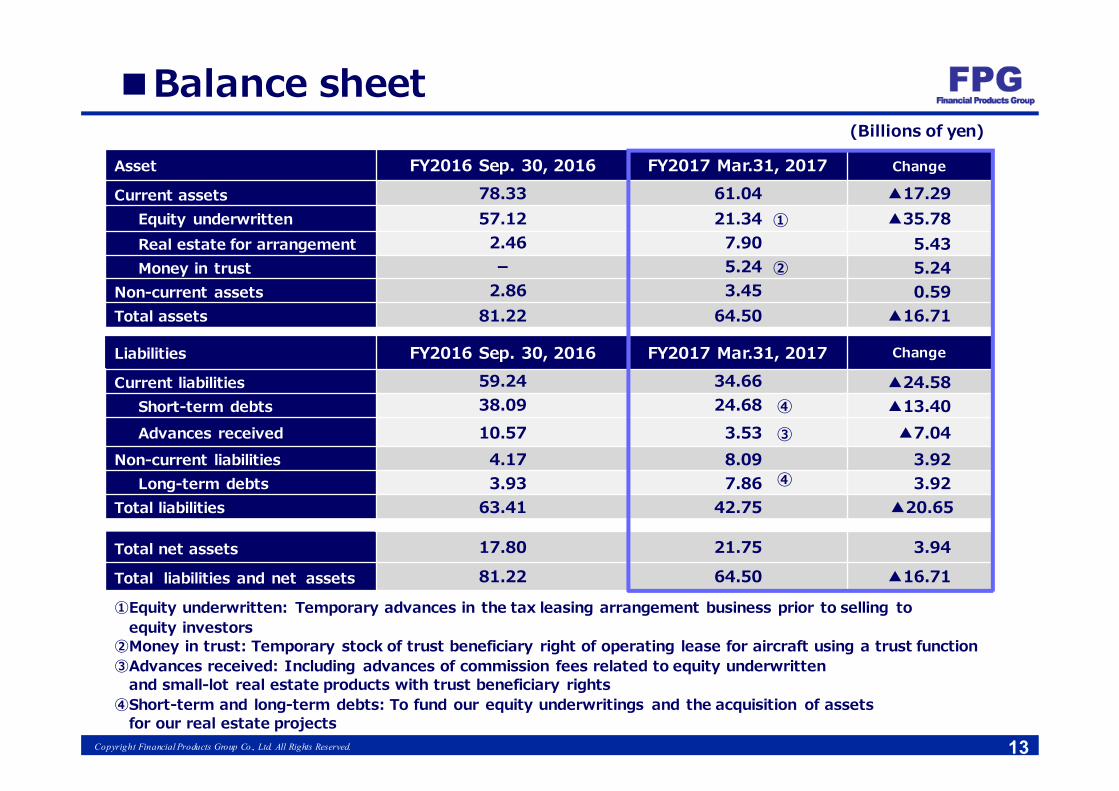
Asset FY2016 Sep. 30, 2016 FY2017 Mar.31, 2017 Change
Current assets 78.33 61.04 ▲17.29Equity underwritten 57.12 21.34 ▲35.78Real estate for arrangement 2.46 7.90 5.43Money in trust - 5.24 5.24
Non-current assets 2.86 3.45 0.59Total assets 81.22 64.50 ▲16.71
Liabilities FY2016 Sep. 30, 2016 FY2017 Mar.31, 2017 Change
Current liabilities 59.24 34.66 ▲24.58Short-term debts 38.09 24.68 ▲13.40Advances received 10.57 3.53 ▲7.04
Non-current liabilities 4.17 8.09 3.92Long-term debts 3.93 7.86 3.92
Total liabilities 63.41 42.75 ▲20.65
Total net assets 17.80 21.75 3.94
Total liabilities and net assets 81.22 64.50 ▲16.71
13
■Balance sheet(Billions of yen)
①Equity underwritten: Temporary advances in the tax leasing arrangement business prior to selling to equity investors
②Money in trust: Temporary stock of trust beneficiary right of operating lease for aircraft using a trust function③Advances received: Including advances of commission fees related to equity underwritten
and small-lot real estate products with trust beneficiary rights④Short-term and long-term debts: To fund our equity underwritings and the acquisition of assets
for our real estate projects
①
②
③
④
④
Copyright Financial Products Group Co., Ltd. All Right Reserved.
These presentation materials are for the benefit of our investors and include statements and data related to our forecast for the results, strategies, business plans, etc., of Financial Products Group Co., Ltd..
These statements and data related to our forecasts are not actual facts, but are rather forecasts that we have judged to be appropriate based on the information available at the time of presentation.
These presentation materials contain projections of performance and other projections based on information currently available and certain assumptions judged to be reasonable, and may be changed without prior notice because of changes in the economic environment and other risks and uncertainties.
【IR Inquiry 】
Disclaimer
14
Financial Products Group Co., Ltd.Corporate Planning DepartmentTEL +81-3-5288-5691URL http://www.fpg.jp/en/