fpga implementation of an ac3 decoder - diva...
TRANSCRIPT

Master of Science Thesis in Computer EngineeringDepartment of Electrical Engineering, Linköping University, 2017
FPGA Implementation of anAC3 Decoder
Dapeng Han

Master of Science Thesis in Computer Engineering
FPGA Implementation of an AC3 Decoder
Dapeng Han
LiTH-ISY-EX--17/5028--SE
Supervisor: Erik LindahlOpalum AB
Examiner: Kent Palmkvistisy, Linköpings universitet
Division of Computer EngineeringDepartment of Electrical Engineering
Linköping UniversitySE-581 83 Linköping, Sweden
Copyright © 2017 Dapeng Han

Abstract
The aim of this thesis is to explore the possibility of integrating an AC3 audio de-coding module into the company’s current product. Due to limited left resourceson the FPGA chip in the company’s current product, the focus of this thesis is tobe resource efficient. In this thesis, a system for AC3 audio decoding is designedand implemented. In order to use less logic on FPGA, PicoBlaze soft processoris used to control the whole processing flow. The system is designed and synthe-sized for a Spartan-6 FPGA which can be easily ported to the company’s currentplatform.
iii


Acknowledgments
First, I would like to thank Pär Gunnars Risberg for him giving me this thesisopportunity in Opalum AB. He has given me encouragement and support in dif-ficult moments.
I would like thank Erik Lindahl for the help with all the technical problemsand patience of answering my questions.
Thank you to all the other employees in Opalum AB for their support andencouragement, sharing their knowledge and experience and being great friends.
Thank you to my examiner Kent Palmkvist for making this thesis possible.Thank you to my friend and thesis opponent Oscar Kleback for his encourage-
ment and patience.Last but not least, I would like to thank all my friends during my study period
in Sweden for their support and company.
Oslo, April 2017Dapeng Han
v


Contents
Notation ix
1 Introduction 11.1 Background . . . . . . . . . . . . . . . . . . . . . . . . . . . . . . . 11.2 Objectives . . . . . . . . . . . . . . . . . . . . . . . . . . . . . . . . 11.3 Problems . . . . . . . . . . . . . . . . . . . . . . . . . . . . . . . . . 21.4 Previous Work . . . . . . . . . . . . . . . . . . . . . . . . . . . . . . 21.5 Limitations . . . . . . . . . . . . . . . . . . . . . . . . . . . . . . . . 31.6 Outline . . . . . . . . . . . . . . . . . . . . . . . . . . . . . . . . . . 3
2 Dolby Digital Standard 52.1 Basic Theories . . . . . . . . . . . . . . . . . . . . . . . . . . . . . . 5
2.1.1 Psychoacoustic Audio . . . . . . . . . . . . . . . . . . . . . . 52.1.2 Masking . . . . . . . . . . . . . . . . . . . . . . . . . . . . . 52.1.3 Pulse Code Modulation . . . . . . . . . . . . . . . . . . . . . 72.1.4 Number Representation . . . . . . . . . . . . . . . . . . . . 7
2.2 Overview . . . . . . . . . . . . . . . . . . . . . . . . . . . . . . . . . 82.3 Dolby Digital Encoding . . . . . . . . . . . . . . . . . . . . . . . . . 92.4 Dolby Digital Decoding . . . . . . . . . . . . . . . . . . . . . . . . . 112.5 Dolby Digital Frame Structure . . . . . . . . . . . . . . . . . . . . . 12
3 Dolby Digital Decoding Process 153.1 Overview . . . . . . . . . . . . . . . . . . . . . . . . . . . . . . . . . 15
3.1.1 Decoding Flow . . . . . . . . . . . . . . . . . . . . . . . . . . 153.2 Key Steps . . . . . . . . . . . . . . . . . . . . . . . . . . . . . . . . . 18
3.2.1 Synchronization and Error Detection . . . . . . . . . . . . . 183.2.2 Exponents Decoding . . . . . . . . . . . . . . . . . . . . . . 193.2.3 Bit Allocation . . . . . . . . . . . . . . . . . . . . . . . . . . 213.2.4 Decoding Mantissas . . . . . . . . . . . . . . . . . . . . . . . 233.2.5 Channel Coupling . . . . . . . . . . . . . . . . . . . . . . . . 253.2.6 Inverse Transform . . . . . . . . . . . . . . . . . . . . . . . . 25
4 Hardware Platform 27
vii

viii Contents
4.1 Introduction . . . . . . . . . . . . . . . . . . . . . . . . . . . . . . . 274.2 Xilinx SP601 Evaluation Board . . . . . . . . . . . . . . . . . . . . . 274.3 Xilinx ISE . . . . . . . . . . . . . . . . . . . . . . . . . . . . . . . . . 274.4 PicoBlaze Micro Controller . . . . . . . . . . . . . . . . . . . . . . . 29
4.4.1 Introduction . . . . . . . . . . . . . . . . . . . . . . . . . . . 294.4.2 Architecture . . . . . . . . . . . . . . . . . . . . . . . . . . . 294.4.3 Components and Connections . . . . . . . . . . . . . . . . . 294.4.4 Program Environment . . . . . . . . . . . . . . . . . . . . . 30
5 Implementation 335.1 Propose . . . . . . . . . . . . . . . . . . . . . . . . . . . . . . . . . . 335.2 Data Flow . . . . . . . . . . . . . . . . . . . . . . . . . . . . . . . . . 335.3 Implementation . . . . . . . . . . . . . . . . . . . . . . . . . . . . . 34
5.3.1 PicoBlaze . . . . . . . . . . . . . . . . . . . . . . . . . . . . . 345.3.2 Exponent Decoder . . . . . . . . . . . . . . . . . . . . . . . 365.3.3 Bit Allocation . . . . . . . . . . . . . . . . . . . . . . . . . . 405.3.4 Mantissa Ungroup and Mantissa Decoder . . . . . . . . . . 505.3.5 IMDCT . . . . . . . . . . . . . . . . . . . . . . . . . . . . . . 51
6 Results and Conclusion 556.1 Results . . . . . . . . . . . . . . . . . . . . . . . . . . . . . . . . . . 556.2 Conclusion . . . . . . . . . . . . . . . . . . . . . . . . . . . . . . . . 566.3 Future Work . . . . . . . . . . . . . . . . . . . . . . . . . . . . . . . 56
Bibliography 59

Notation
Abbreviations
Abbreviation Meaning
AUX auxiliary dataBRAM block random-access memory
BSI bit stream informationCRC cyclic redundancy checkDVD digital versatile discFBW full bandwidthFIFO first in first outFPGA field-programmable gate arrayHDTV high definition televisionIMDCT inverse modified discrete cosine transform
LFE low frequency effectsMCU microcontroller unitPCM pulse-code modulation
ix


1Introduction
1.1 Background
Dolby Laboratories developed the audio compression technology called DolbyDigital in 1990s. This technology makes storing and transmitting digital audiomore efficiently possible. It is also known as AC3. Nowadays it is widely used inthe audio industry all over the world.
Figure 1.1: Dolby Digital Logo [8]
Dolby Digital is first used in the Movie Batman Returns. So far, DolbyDigital has been the true standard for movie distribution and cinema equipment.Besides the movie industry, Dolby Digital can also be used in family environment.It is the audio standard for all DVDs and HDTV in North America. Even a lot ofvideo games support Dolby Digital as a feature.
1.2 Objectives
The main products of Opalum is speakers. It is commonly accepted in the soundindustry that excellent sound requires large loudspeakers. Opalum decided tochallenge the veracity of this and successfully developed a technology whichunites excellent, resonant sound with slim design. [11]
The control hub is the center of all Opalum products. It let’s you integratewith a variety of sources such as TV’s, CD-players, DVD-players, Apple TV’s,
1

2 1 Introduction
Airport Express’ and so on [11]. The hub transmits the digital audio to speakers.
1.3 Problems
The control hub does not support Dolby Digital decoding now. If the digitalaudio source is Dolby Digital, the speakers are just mute. To solve this problem,the company wants to explore the possibility to build a Dolby Digital decoder inFPGA due to the fact that there is a tiny FPGA inside the product already. If AC3decoding can be done in the current FPGA, it will save the cost for the company.
One of the problems is that the resource in the tiny FPGA is limited and theDolby Digital has a fairly complex structure, so it is to be investigated whether aDolby Digital decoder can fit into the FPGA or not.
Another problem is that the AC3 frame has a tricky structure which the for-mer information bits decide if the following information bits exist or not. Thisrequires a flexible design to handle the frame structure.
1.4 Previous Work
There are several other approaches to decode AC3 can be found online.
• In reference [10], it is a hardware/software co-design solution based anARM platform. It performs most the decoding process in software, suchas data parsing, exponent decoding, bit allocation. But it design dedicatedhardware for IMDCT calculation, because there are many floating point cal-culation while the ARM platform does not provide floating point calcula-tion instructions. If the IMDCT is done in software, it will have a bad per-form. It is a similar approach to this thesis.
• In reference [5], it is describes how to install and work with Texas Instru-ments (TI) Dolby AC3 Version 3 Decoder implementation on the C64x+platform. It also provides a detailed Application Programming Interface(API) reference and information on the sample application that accompa-nies this component. It is a software solution which can be fast integratedif the Texas Instruments platform are used.
• In reference [12], it describes the design and implementation of the AC3decoder based on an audio specific DSP core. The work includes the DSPcore design and software development. It is also a software solution withspecific designed hardware.
• In reference [2], this paper presented an SOC based HW/SW co-design ar-chitecture for multi-standard audio decoding. It is developed to supportthe audio standards of AAC LC profile, Dolby AC3, Ogg Vorbis, MPEG-1Layer 3 (MP3) and Windows Media Audio (WMA). A VLSI reconfigurablefilterbank based on CORDIC algorithm is developed to accelerate the multistandard decoding process. The architecture is also flexible for extendingsupport of new formats and standards.

1.5 Limitations 3
From the work mentioned above, it is a common opinion that the AC3 de-coding is better to be done with a hardware/software co-design solution. So thisthesis is following the same principle.
1.5 Limitations
For this thesis project, ’ATSC Standard: Digital Audio Compression (AC-3, E-AC-3)’ 2012 version is followed, which can be found in [1]. The target sample rate is48kHz. Due to limited time and the request from the company, some decodingsteps are not considered because they are not mandatory to the core function ofdecoding process. For example, Rematrixing, Dynamic Range Compression andDownmix are not implemented. Also, only uncoupling channels are considered.
1.6 Outline
• Chapter 2 and 3 explain the Dolby Digital standard and the Dolby Digitalframe structure in detail and cover the decoding process.
• Chapter 4 talks about the hardware platform used in the project and Pi-coBlaze micro controller which is a key component in decoding.
• Chapter 5 proposes a design solution for Dolby Digital decoding in FPGAby using the hardware in Chapter 4 and talks about implementation detailsand simulation results.
• Chapter 6 gives a short summary about the project and proposals for futurework.


2Dolby Digital Standard
2.1 Basic Theories
2.1.1 Psychoacoustic Audio
Human’s hearing system is a very complex system. The frequency range whichhuman ear can hear is from 20Hz to 20kHz. But the sensitivity of the human eardepends on the frequency and human ears are most sensitive to the frequencyrange 2kHz to 4kHz. For every frequency, there is a sound pressure level whichis a value meaning if the sound at this frequency can be sensed by human ears ornot. This sound pressure level can be calculated by the Equation 5.4.
Tq(f ) = 3.64(
f
1000
)−0.8
+ 6.5e−0.6( f
1000−3.3)2
+ 10−3(
f
1000
)2
(2.1)
where f is the frequancy. This equation can be found in [6] and is character-ized in Figure 2.1.
Sound with strength under the line can not be sensed by human ears. In thiscase , there is no need to transform this part of information. Therefore, this kindof information is removed from the signal in digital audio compression process.
2.1.2 Masking
Masking is another important concept in psychoacoustic audio. It refers to thecase that a sound which can be heard by human ears are not sensible due to astronger sound. This can happen in both frequency and time domain. Figure 2.2illustrates a spectral masking case.
The bigger arrow represents a strong sound at 8kHz and this sound rises thecurve from Figure 2.1. There is a weaker sound at a close frequency x and this
5

6 2 Dolby Digital Standard
Figure 2.1: Sensible Sound Strength of Human Ears[6]
Figure 2.2: Masking Example in Frequency Domain[6]
2.1 Basic Theories 7
sound is supposed to be sensed by human ears, but in this case, the sound at fre-quency x can not be heard due to the appearance of the stronger sound. So whenthe digital audio information is compressed, the sound information at frequencyx can be deleted. Because this kind of sound can not be heard, there is no need todo audio coding on them.
2.1.3 Pulse Code Modulation
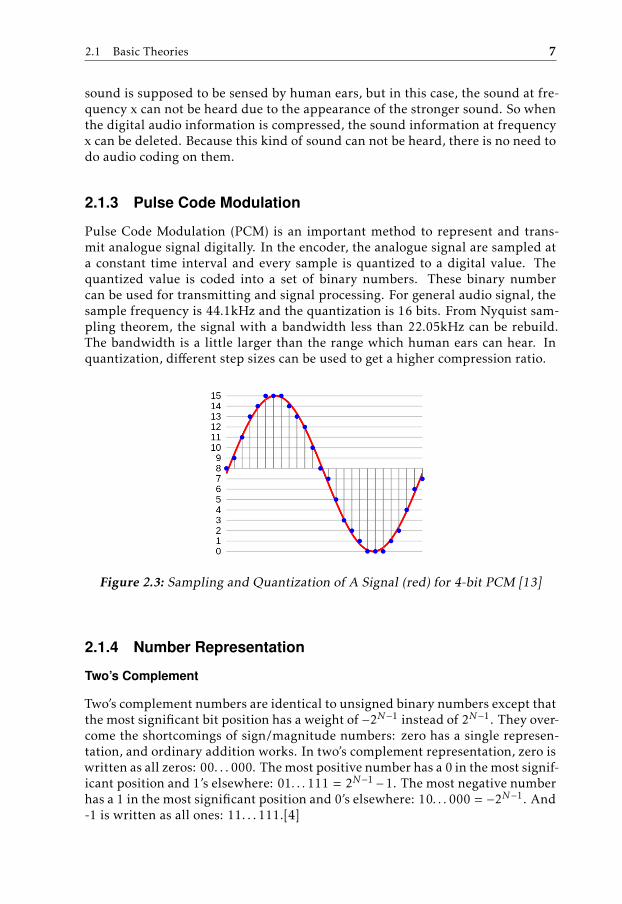
Pulse Code Modulation (PCM) is an important method to represent and trans-mit analogue signal digitally. In the encoder, the analogue signal are sampled ata constant time interval and every sample is quantized to a digital value. Thequantized value is coded into a set of binary numbers. These binary numbercan be used for transmitting and signal processing. For general audio signal, thesample frequency is 44.1kHz and the quantization is 16 bits. From Nyquist sam-pling theorem, the signal with a bandwidth less than 22.05kHz can be rebuild.The bandwidth is a little larger than the range which human ears can hear. Inquantization, different step sizes can be used to get a higher compression ratio.
Figure 2.3: Sampling and Quantization of A Signal (red) for 4-bit PCM [13]
2.1.4 Number Representation
Two’s Complement
Two’s complement numbers are identical to unsigned binary numbers except thatthe most significant bit position has a weight of −2N−1 instead of 2N−1. They over-come the shortcomings of sign/magnitude numbers: zero has a single represen-tation, and ordinary addition works. In two’s complement representation, zero iswritten as all zeros: 00. . . 000. The most positive number has a 0 in the most signif-icant position and 1’s elsewhere: 01. . .111 = 2N−1 −1. The most negative numberhas a 1 in the most significant position and 0’s elsewhere: 10. . .000 = −2N−1. And-1 is written as all ones: 11. . . 111.[4]

8 2 Dolby Digital Standard
Floating Point
Floating point represents numbers in which the binary point is not fixed, as it isfor integers. Just as in scientific notation, numbers are represented as a singlenonzero digit to the left of the binary point.
The representation of a floating-point number is shown in Figure 2.4 wheres is the sign of the floating-point number (1 meaning negative), exponent is thevalue of the exponent field and fraction.
S Exponent Fraction
Figure 2.4: Floating Point
In general, floating-point numbers are of the form(−1)S ∗ F ∗ 2E
F involves the value in the fraction field and E involves the value in the exponentfield[3] .
2.2 Overview
By taking advantages of the phenomenon in previous section, a digital compres-sion algorithm can be developed so that the total amount of information used topresent the information can be reduced. The purpose of the digital compressionalgorithm is to use the least possible digital bits to store and transmit the audiomore efficiently and at the same time the decode output sounds about the samequality as the original signal.
Dolby digital format is based on Psychoacoustics to improve the compressionperformance. Because human ear has different sensitivity to different frequencies,Dolby Digital can allocate different data amount based on the dynamic propertyof the signal. The signals with intensive spectrum and strength has more datato represent than other signals. The signals under masking take little or no data.And combined with coupling and rematrixing technology, the data stream can befurther decreased.
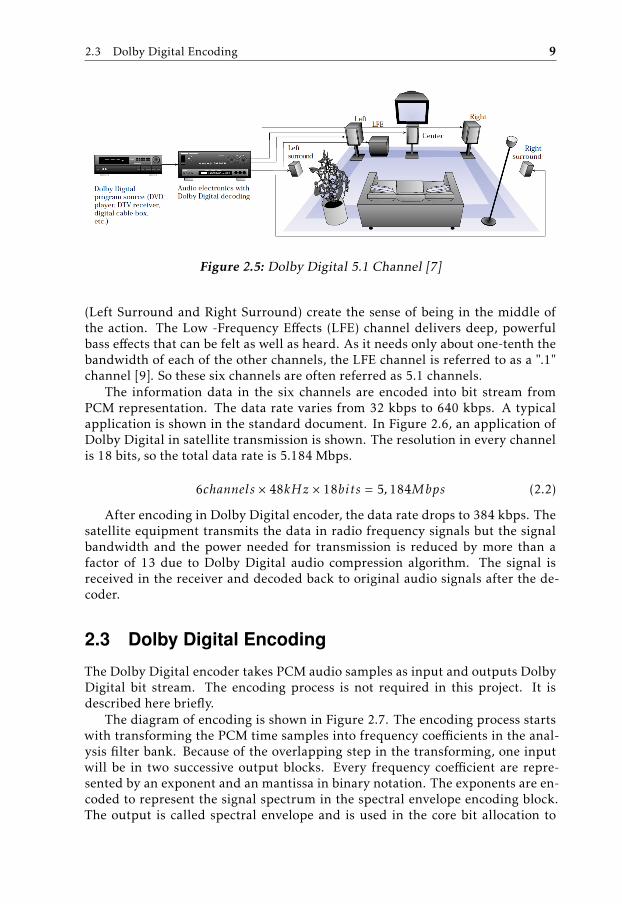
Dolby Digital supports surround sound by five full range channels, left, right,left surround, right surround, and center, with a low frequency effects (LFE) chan-nel. It is shown in Figure 2.5.
The full range channels cover the frequency band 20 - 20000 Hz and the lowfrequency effects channel covers the frequency band 20 - 120 Hz which is used toproduce low bass effects.
The three front channels (Left, Center, and Right) provide crisp, clean dia-logue and accurate placement of on-screen sounds. The twin surround channels
2.3 Dolby Digital Encoding 9
Figure 2.5: Dolby Digital 5.1 Channel [7]
(Left Surround and Right Surround) create the sense of being in the middle ofthe action. The Low -Frequency Effects (LFE) channel delivers deep, powerfulbass effects that can be felt as well as heard. As it needs only about one-tenth thebandwidth of each of the other channels, the LFE channel is referred to as a ".1"channel [9]. So these six channels are often referred as 5.1 channels.
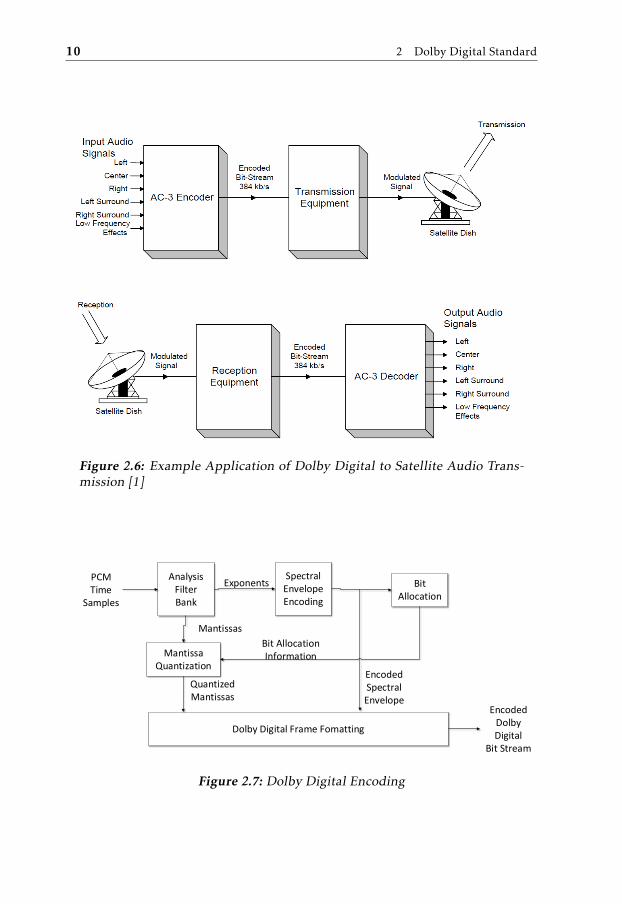
The information data in the six channels are encoded into bit stream fromPCM representation. The data rate varies from 32 kbps to 640 kbps. A typicalapplication is shown in the standard document. In Figure 2.6, an application ofDolby Digital in satellite transmission is shown. The resolution in every channelis 18 bits, so the total data rate is 5.184 Mbps.
6channels × 48kHz × 18bits = 5, 184Mbps (2.2)
After encoding in Dolby Digital encoder, the data rate drops to 384 kbps. Thesatellite equipment transmits the data in radio frequency signals but the signalbandwidth and the power needed for transmission is reduced by more than afactor of 13 due to Dolby Digital audio compression algorithm. The signal isreceived in the receiver and decoded back to original audio signals after the de-coder.
2.3 Dolby Digital Encoding
The Dolby Digital encoder takes PCM audio samples as input and outputs DolbyDigital bit stream. The encoding process is not required in this project. It isdescribed here briefly.
The diagram of encoding is shown in Figure 2.7. The encoding process startswith transforming the PCM time samples into frequency coefficients in the anal-ysis filter bank. Because of the overlapping step in the transforming, one inputwill be in two successive output blocks. Every frequency coefficient are repre-sented by an exponent and an mantissa in binary notation. The exponents are en-coded to represent the signal spectrum in the spectral envelope encoding block.The output is called spectral envelope and is used in the core bit allocation to
10 2 Dolby Digital Standard
Figure 2.6: Example Application of Dolby Digital to Satellite Audio Trans-mission [1]
Analysis FilterBank
Spectral EnvelopeEncoding
MantissaQuantization
Bit Allocation
Dolby Digital Frame Fomatting
Exponents
Mantissas
Bit Allocation Information
Encoded SpectralEnvelope
QuantizedMantissas
PCM Time
Samples
Encoded Dolby Digital
Bit Stream
Figure 2.7: Dolby Digital Encoding

2.4 Dolby Digital Decoding 11
calculate how many bits to distribute to each mantissa. These exponents andmantissas data are included in every audio blocks. Six blocks are formatted intoa Dolby Digital audio frame. The Dolby Digital bit stream consists of a sequenceof Dolby Digital audio frames.
In reality, the encoding process has more details than the diagram.
• Two cyclic redundancy check (CRC) words are contained in the frame toverify if the frame is right. One is in the end of a frame. The other one isin the header of a frame with other information like bit rate, sample rate,number of channels, synchronize word, etc.
• Analysis filter bank block is dynamically reconfigurable for audio blockswith different time or frequency characteristics.
• Exponents are encoded in spectral envelope encoding block with differenttime and frequency resolution.
• The high frequency part of the channels can be coupled together to reducethe data amount.
2.4 Dolby Digital Decoding
The decoding process is basically the inverse of the encoding process. A diagramof decoding is shown in Figure 2.8.
SynthesisFilter Bank
Bit Allocation
SpectralEnvelopeDecoding
MantissaDequantization
Dolby Digital Frame Syncronization, Error Detection, Frame Deformatting
Encoded Dolby
Digital Bit Stream
PCM Time
Samples
Encoded SpectralEnvelope
Bit AllocationInformation
Exponents
QuantizedMantissas
Mantissas
Figure 2.8: Dolby Digital Decoding
First, the decoder has to synchronize to the encoded bit stream. Then the de-coder checks if the frame is error free and if it is error free, the decoder will parsethe frame into different types like the encoded spectral envelope, the quantizedmantissas in the diagram and other side information. Then bit allocation blockuses the encoded spectral envelope information to calculate the bit allocation in-formation which is used in mantissa de-quantization block to generate mantissas.

12 2 Dolby Digital Standard
Spectral envelope outputs exponents. By using exponents and mantissas, synthe-sis filter bank outputs PCM time samples. The decoding process will be describedin more details in next chapter.
2.5 Dolby Digital Frame Structure
Dolby Digital bit stream consists of Dolby Digital frame sequence which is shownin Figure 2.9 .
Frame 1 Frame 2 Frame 3 Frame N
Figure 2.9: Dolby Digital Bit Stream
Each Dolby Digital frame can be divided into three parts, the frame head, sixaudio blocks and the frame end. The frame head contains synchronization infor-mation (SI) and bit stream information (BSI). The first 16 bits in SI are syncword,which is used to synchronize the Dolby Digital frame. It is always 0x0B77 or"0000 1011 0111 0111" in binary representation. There is a possibility that thedata in the frame is also 0x0B77. The following 16 bits are a CRC word which isused to check if the synchronized frame is correct. Fscod indicates sample rateand Frmsizcod indicates frame size. Details about the meaning of their value canbe found in [1]. The SI structure is shown in Figure 2.10.
Syncword CRC1 Fscod Frmsizcod
Figure 2.10: SI Syntax and Word Size
BSI contains all the side in formation for the whole frame, for example ifan audio reuses the previous information, if the a channel is in coupling, if thetransform is 512 point transform, etc.
SI+BSI AB0 AB1 AB2 AB3 AB4 AB5 AUX+CRC
Figure 2.11: Dolby Digital Frame Structure

2.5 Dolby Digital Frame Structure 13
Frame structure is showed in Figure 2.11. Every frame has six audio blocks.Each block contains 256 samples for every channel. In every audio block, thereare information about block switch, coupling coordinates, exponents, bit alloca-tion information, mantissas. The data in audio block 0 can be reused in the otherblocks, i.e. the data can be shared in the frame. The later audio blocks can reusethe previous data by setting certain positions. In this way, the data amount is re-duced. But for decoder, the previous data must be stored for the following blocks.Audio Block Structure is shown in Figure 2.12.
Block Switch
and Dither flag
Dynamic Range
Control
CouplingInfo
Rematrix Info
ExponentStrategy
Exponents for Each Channel
Bit Allocation
Info
Quantized Mantissas for Each Channle
Figure 2.12: Audio Block Structure
In the frame end, there are auxiliary data (AUX) and a second CRC word. AUXdata are unused data. This CRC word can be used for error detection.


3Dolby Digital Decoding Process
3.1 Overview
The decoding process flow is shown in Figure 3.1. The input data stream canbe from a transmission system such like Sony/Philips Digital Interface Format(SPDIF). The details about the transmission system is beyond the scope of thisthesis. The input data can be as a constant data stream with a certain data rate ora large amount of data in a short time. Due to this, a buffer is necessary.
3.1.1 Decoding Flow
Synchronization and Error Detection
Dolby digital synchronization word is 0x0b77 which is a 16 bit wide word. Inmany kinds of transmission, dolby digital data are often transmitted by byte or16 bit word alignment. This fact reduces the error possibility of synchronizationof the data frame and simplified the dolby digital decoder.
Unpack BSI and Side Information
In a Dolby Digital frame, there are different kinds of side information containedbefore audio blocks. The side information data is used to control and offer pa-rameters for the decoding process. It is applied to all the six blocks and everychannel in every block.
Due to the fact that the side information data is used in the following process,the data must be parsed and stored in registers from the input buffer, so it can beused when required.
15

16 3 Dolby Digital Decoding Process
Input Bit Stream
Synchronization, Error Detection
Unpack BSI,Side information
Decode Exponents
Bit Allocation
Unpack, Ungroup, Dequantize Mantissas
Decoupling
Rematrixing
Dynamic Range Compression
Inverse Transform
Window Overlap/Add
Downmix
PCM Output Buffer
Output PCM
Main Information
Packed Exponents
Packed Mantissas
Side Information
Exponent Strategies
Bit Allocation Parameters
Dither Flags
Coupling Parameters
Rematrixing Flags
Dynamic Range Words
Block Sw flags
Figure 3.1: Dolby Digital Decoding Process

3.1 Overview 17
Decode Exponents
The exponents are encoded in a certain form in a Dolby Digital frame, so theencoded form must be known. The number of exponents are determined in dif-ferent ways for different channels. There are always 7 exponents for LFE channelif this channel exists.
Second key factor in exponent decoding is the exponent strategy in every chan-nel which is explained later.
Bit Allocation
Bit allocation step decides how many bits are distributed to each mantissa. Ittakes the coded exponents and outputs the bit allocation values baps (will beexplained in section 3.2.3) for each coded mantissa.
Unpack, Ungroup, Dequantize Mantissas
In the Dolby Digital frame, the encoded mantissas are continuous bit stream. Thedecoder should take each mantissa from the stream based on baps value, sincethe baps value decides how many bits every mantissa has. Some mantissas aregrouped together to reduce the data amount. They need to be ungrouped in thedecoder. Then each mantissa need to be dequantized according to correspondingexponent.
Decoupling
In encoding process, the high frequency signal in every channel are combined to-gether in coupling channel. So during the decoding process, the decoupling steprecover the high frequency signal of every coupled channel. Only uncouplingchannels are considered in this thesis, so this step is not covered by this thesis.
Rematrixing
Rematrixing technique is only used in 2/0 mode i.e. only the left and right chan-nels are in use. If it is applied, the data from the two channels are encoded intothe sum and the difference of the two channels. In this way, Dolby Digital canreduce the data to transmit.
Dynamic Range Compression
During the decoding process, the decode can change the magnitude of the coeffi-cients based on the control and side information. This step is not mandatory andit is not covered by this thesis.
Inverse Transform
This step transform the coefficients in frequency domain to time domain.
18 3 Dolby Digital Decoding Process
Window, Overlap/Add
This step windows the output from inverse transform. The two continuous datablock should overlap and add half of each other to get the final PCM value.
Downmixing
Dolby Digital output 5.1 channels i.e. 5 FBW channels and 1 LFE channel. Insome cases, the output channel number is less than the channel number in thedata information. Downmixing is used for this kind of cases. It is not covered bythis thesis.
PCM Output Buffer
The decoding process may not match the transmission, so an output buffer isneeded.
Output PCM
The output PCM data can be used to feed into a digital to analogue converter(DAC) or other post signal processing which is covered in this thesis.
3.2 Key Steps
3.2.1 Synchronization and Error Detection
The synchronization word for Dolby Digital is 0x0B77. The decoder detects thisword to decide if it receives a frame. This word can also be a information datainside of the frame, so there is a possibility of false detection. Without byte orword alignment, the value of error possibility is 19 percent per frame. With bytealignment, the value is 2.5 percent and with 16 bits word alignment, the value is1.2 percent.
As it explained in last chapter, there are two CRC words contained in oneframe. One is at the head of a frame and the other one is at the end. They arecalled CRC1 and CRC2 respectively.
CRC1 is used to check the first58
of a frame. The result of CRC check can be
available after the first58
of a frame received. CRC2 is used to check the whole
frame.Even with CRC check, there is still a possibility of false synchronization. The
value is reliable to 0.0015 percent [1].Combining CRC check and byte alignment, the probability of false synchro-
nization word detection drops to 0.000035 percent which can satisfy the require-ment of most applications.

3.2 Key Steps 19
3.2.2 Exponents Decoding
Overview
Before the Inverse Transform step, the coefficients in time domain are repre-sented in floating point form. In the data stream, the floating point data are sep-arated and transmitted as exponents and mantissas. The exponents are encodedand packed in the Dolby Digital encoder. They are decoded in the following way.
Each Dolby Digital frame contains 6 audio blocks. The data may or may notbe shared in the whole frame. So the exponents information in Audio Block 0can be reused in the following audio blocks, Audio Block 1 to Audio Block 5.Therefore there will always be a new set of exponents for every channel - all theindependent channels, all the coupled channels, the coupling channel and thelow frequency effect channel.
The exponents are five bit wide data and they contain the information thathow many zeroes in the front of the coefficients in frequency domain. The rangeof the exponents are from 0 to 24. If an exponent is 0, it means that the corre-sponding coefficient has no zeroes in the front. For the coefficients having morethan 24 zeroes in the front, the exponent is 24.
Dolby Digital can reduce the data amount by using differential coding. In theFBW or LFE channel, the first exponent is a 4 bit wide value, so the range of thisvalue is from 0 to 15. It contains the information about how many zeroes are inthe front of the first coefficient. The following exponents information are sent asdifferential values. To get the real exponents, the decoder just needs to add thedifferential value to the previous exponent and this exponent value is used fornext exponent calculation.
Another important technique in exponent encoding and decoding is called ex-ponent strategy. By using this technique, the differential values of the exponentscan be further packed into groups which further reduces the data amount.
There are three strategies. They are called D15, D25, and D45. For FBW andLFE channels, the 4 bit absolute exponent has a value range from 0 to 15. If thevalue is larger than 15, it is set as 15. For coupling channel, the absolute value isalso 4 bit wide, but it represents a 5 bit value without least significant bit.
The exponent strategy coding in encoding process is not explained in thisthesis. It can be found in [1].
Exponent Strategy Decoding
For FBW channels, the exponent strategy is determined by 2 bit data chexpstr[ch]and for coupling channel, it is determined by 2 bit data cplexpstr. The meaningof the data are shown in Table 3.1.
For LFE channel, the exponent strategy is determined by lfeexpstr. Whenlfeexpstr is ’0’, the decoder should reuse the prior exponents. When lfeexpstr is’1’, the exponent strategy is D15.
To get the number of exponents in every channel, the channel bandwidth in-formation is needed. For the coupled channels and the channels which are not incoupling, the starting mantissa bin number is 0. [1]

20 3 Dolby Digital Decoding Process
chexpstr[ch], cplexpstr Exponent Strategy Exponents per Group00 reuse prior exponents 001 D15 310 D25 611 D45 12
Table 3.1: Meaning of chexpstr[ch], cplexpstr [1]
For the channels which are not in coupling, the end mantissa bin number is
endmant[ch] = ((chbwcod[ch] + 12) × 3) + 37 (3.1)
where chbwcod[ch] is Channel Bandwidth Code which is an unsigned integerwhich defines the upper band edge for fullbandwidth channel [ch]. [1]For the coupled channels,
endmant[ch] = cplstrtmant (3.2)
wherecplstrtmant = (cplbegf × 12) + 37 (3.3)
For the coupling channels, due to that the information in coupling channelrepresents the high frequency information in FBW channels, the starting man-tissa bin number is not 0. The coupling channel starting and ending mantissabins are defined as cplstrtmant and cplendmant. cplstrtmant can calculated inthe above equation and
cplstrtmant = ((cplendf + 3) × 12) + 37 (3.4)
where the value of cplbegf Coupling Begin Frequency Code and cplendf Cou-pling end Frequency Code can be found in the frame.
For LFE channel, if it is turned on, it always starts at 0 and ends at 7, due to itonly represents the low frequency information.
For the FBW channels, the exponents structure in a Dolby Digital frame canbe found in [1].
The group number of exponents in each channel is represented by nchgrps[ch]. It can be drived in the following equation.
nchgrps[ch] = truncate ((endmant[ch] − 1) /3) ; f orD15
= truncate ((endmant[ch] − 1 + 3) /6) ; f orD25
= truncate ((endmant[ch] − 1 + 9) /12) ; f orD45
(3.5)
For the LFE channels, the exponents structure in a Dolby Digital frame can befound in [1]. If the LFE channel is on, there are 7 exponents in one audio block.One exponent is the absolute value lfeexps[0] and the other six exponents arecombined in two groups in D15 mode.
For the coupling channel, the structure of exponents is similar to FBW chan-nel. There are differences worthy noticing.

3.2 Key Steps 21
First, the first exponent in FBW and LFE channels is a value in use while thefirst exponent in coupling channel is just a reference value i.e. it is not an actualexponent for a coefficient.
Second, the first value in coupling channel is a 4 bit wide value, but it repre-sents a 5 bit information. Because the LSB is always 0, it is not transmitted. Touse this value, the decoder must left shift the 4 bit exponent 1 bit to get an 5 bitexponent.
Decoding a set of coded grouped exponents will create a set of 5-bit absoluteexponents [1].
The exponents in a 7 bit group need to be ungrouped. There are three ex-ponents in every group. The decoder need to follow the below equations to un-group.
M1 = truncate (gexp/25) (3.6)
M2 = ((gexp%25) /5) (3.7)
M3 = (gexp%25) %5 (3.8)
M1, M2 and M3 are called mapped value and gexp is grouped exponent.To get the differential exponent value dexp, the mapped values need to be
subtracted by 2.To get the actual exponents, the decoder need to add differential value to last
exponent exp[n-1]. [1]
exp[n] = exp[n − 1] + dexp[n] (3.9)
For D25 strategy, the exp[n] is used as two successive exponents and for D45strategy, the exp[n] is used as four successive exponents.
Pseudo code can be found in reference [1].
3.2.3 Bit Allocation
Overview
Bit allocation is an very important step in Dolby Digital format. It shows theessential part of Dolby Digital as an audio compression algorithm. The bit alloca-tion utilize the model of human hearing and decide how to distribute how manybits to every coefficient.
Similar to exponents information, the bit allocation information can be sharedin one frame, i.e. the range can be one audio block using one set bit allocationinformation to six audio blocks using one set information. No matter which infor-mation sharing case, there is always a new set of bit allocation in the first audioblock.
The bit allocation can be divided into sub steps. The algorithm theory behindthe steps are not explained in this thesis. The focus is on how to process bitallocation in practice.

22 3 Dolby Digital Decoding Process
Mapping Into PSD and Integration
First, the exponents value need to be mapped to 13 bit signed log power spectraldensity function.
psd[bin] = (3072 − (exp[bin] << 7)) (3.10)
The exponents exp[bin] are always 5 bit wide and the range is from 0 to 24 asexplained before. So the range of psd[bin] is from 0 to 3072.
For PSD integration, the pseudo code can be found in [1]This step of the algorithm integrates fine-grain PSD values within each of a
multiplicity of 1/6th octave bands. The bndtab[] array gives the first mantissanumber in each band. The bndsz[] array provides the width of each band innumber of included mantissas. The masktab[], shows the mapping from man-tissa number into the associated 1/6 octave band number. These tables containduplicate information, all of which need not be available in an actual implemen-tation. They are shown here for simplicity of presentation only. The integrationof PSD values in each band is performed with log-addition. The log-addition isimplemented by computing the difference between the two operands and usingthe absolute difference divided by 2 as an address into a length 256 lookup table,latab[] [1].
Compute Excitation Function
The excitation function is computed by applying the prototype masking curveselected by the encoder (and transmitted to the decoder) to the integrated PSDspectrum (bndpsd[]). The result of this computation is then offset downward inamplitude by the fgain and sgain parameters, which are also obtained from thebit stream [1]. Pseudo code can be found in the standard document.
Compute Masking Curve
This step computes the masking (noise level threshold) curve from the excitationfunction, as shown below. The fscod and dbpbcod variables are received by thedecoder in the bit stream [1].
Apply Delta Information
The delta bit allocation in Dolby Digital is optional. It can improve the soundquality. The delta bit allocation information can be for both FBW channel andcoupling channel, not for LFE channel.
The dba information which modifies the decoder bit allocation are transmit-ted as side information. The allocation modifications occur in the form of adjust-ments to the default masking curve computed in the decoder. Adjustments canbe made in multiples of ±6 dB. On the average, a masking curve adjustment of–6 dB corresponds to an increase of 1 bit of resolution for all the mantissas in theaffected 1/6th octave band [1].

3.2 Key Steps 23
Compute Bit Allocation
The final bit allocation results are calculated in this step.The sum of all channel mantissa allocations in one syncframe is constrained
by the encoder to be less than or equal to the total number of mantissa bits avail-able for that syncframe. The encoder accomplishes this by iterating on the valuesof csnroffst and fsnroffst (or cplfsnroffst for the coupling or lfefsnroffst for lowfrequency effects channels) to obtain an appropriate result. The decoder is guar-anteed to receive a mantissa allocation which meets the constraints of a fixedtransmission bit-rate. At the end of this step, the bap[] array contains a series of4-bit pointers [1].
3.2.4 Decoding Mantissas
Overview
All mantissas are quantized to a fixed level of precision indicated by the corre-sponding bap[] [1].
Some quantized mantissa values are grouped together and encoded into acommon codeword to further reduce the data amount. In the case of the 3-levelquantizer , 3 quantized values are grouped together and represented by a 5-bitcodeword in the data stream. In the case of the 5-level quantizer, 3 quantized val-ues are grouped and represented by a 7-bit codeword. For the 11-level quantizer,2 quantized values are grouped and represented by a 7-bit codeword. [1]
bap[] Quantizer Levels Quantization Type Mantissas Bits(group bits/ num in groups)
0 0 none 01 3 symmetric 1.67 (5/3)2 5 symmetric 2.33 (7/3)3 7 symmetric 34 11 symmetric 3.5 (7/2)5 15 symmetric 46 32 asymmetric 57 64 asymmetric 68 128 asymmetric 79 256 asymmetric 810 512 asymmetric 911 1024 asymmetric 1012 2048 asymmetric 1113 4096 asymmetric 1214 16,384 asymmetric 1415 65,536 asymmetric 16
Table 3.2: Mapping of bap to Quantizer[1]

24 3 Dolby Digital Decoding Process
Expansion and Ungrouping Mantissas
Expansion of Mantissas can be divided into two cases. For bap[] value from 6 to15, the quantization type is asymmetric. To decode the mantissa back to fixedpoint presentation, the decoder just needs to right shift the mantissa by the cor-responding exponent.
transf orm_coef f icient[k] = mantissa[k] >> exponent[k] (3.11)
For bap[] value from 1 to 5, the quantization is symmetrical. The mantissas are ina coded form. The coded should be transformed to two’s complement fractionalbinary words according to certain lookup table. For example, if bap[] = 2 , thelookup table is shown in Table 3.3. Tables for other cases can be found in [1].
Mantissa Code Mantissas Value0 -4./51 -2./52 03 2./54 4./5
Table 3.3: bap[]=2 Mantissa Lookup Table[1]
Then the mantissa value from lookup tables need to right shifted accordingto the corresponding exponent to get the transform coefficient [1].
transf orm_coef f icient[k] = quantization_table[mantissa[k]] >> exponent[k](3.12)
For cases that bap[] = 1, 2 and 4, the coded mantissas are grouped togethereither two or three into a group word. In this way, Dolby Digital can furtherdecrease the data amount. To ungroup the group word, the decoder just needs tofollow the following equations.
For bap[]=1,
mantissa_code[a] = truncate (group_code/9)
mantissa_code[b] = truncate ((group_code%9) /3)
mantissa_code[c] = (group_code%9) %3
(3.13)
For bap[]=2,
mantissa_code[a] = truncate (group_code/25)
mantissa_code[b] = truncate ((group_code%25) /5)
mantissa_code[c] = (group_code%25) %5
(3.14)
For bap[]=4,
mantissa_code[a] = truncate (group_code/11)
mantissa_code[b] = group_code%11(3.15)

3.2 Key Steps 25
3.2.5 Channel Coupling
The channel coupling technique combines the high frequency part of all the chan-nels into coupling channel. In this way, Dolby Digital format can reduce the dataamount without losing much sound quality due to that human ears are not sensi-tive to high frequency sound.
If enabled, channel coupling is performed on encode by averaging the trans-form coefficients across channels that are included in the coupling channel. Eachcoupled channel has a unique set of coupling coordinates which are used to pre-serve the high frequency envelopes of the original channels. The coupling processis performed above a coupling frequency that is defined by the cplbegf value [1].
In the decoupling process, the information is transformed back to every chan-nel by multiplying the coefficients with the coupling coordinates correspondingto each channel.
Sub Band Sturcture
In every audio block, there are 256 transform coefficients for each channel. Forcoupling process, the transform coefficients between the 37th and the 252th aredivided into 18 sub bands and therefore each band contains 12 coefficients. Thefrequency range of each sub-band can be seen in [1]
3.2.6 Inverse Transform
The audio information is carried in form of a number of frequency coefficients.The purpose of inverse transform is to transform frequency coefficients into timedomain samples.
In the AC-3 transform block switching procedure, a block length of either 512or 256 samples (time resolution of 10.7 or 5.3 ms for sampling frequency of 48kHz) can be employed. Normal blocks are of length 512 samples. When a normalwindowed block is transformed, the result is 256 unique frequency domain trans-form coefficients. Shorter blocks are constructed by taking the usual 512 samplewindowed audio segment and splitting it into two segments containing 256 sam-ples each. The first half of an MDCT block is transformed separately but identi-cally to the second half of that block. Each half of the block produces 128 uniquenon-zero transform coefficients representing frequencies from 0 to fs/2, for a to-tal of 256. This is identical to the number of coefficients produced by a single512 sample block, but with two times improved temporal resolution. Transformcoefficients from the two half-blocks are interleaved together on a coefficient-by-coefficient basis to form a single block of 256 values. This block is quantized andtransmitted identically to a single long block [1].

4Hardware Platform
4.1 Introduction
The company’s current product has a FPGA inside, which is used for audio signalprocessing. There is some resource left on the FPGA which gives the possibilityto integrate an AC3 decoding unit into the current system.
4.2 Xilinx SP601 Evaluation Board
A diagram of the board can be found in Figure 4.1 [16].This board has a Spartan-6 XC6SLX16 FPGA as the main component. This
FPGA chip has 2278 logic slices and 32 DSP48A1 slices. Every Spartan-6 FPGAslice has four LUTs and eight flip-flops. Every DSP48A1 slice has an 18 x 18multiplier, an adder, and an accumulator. Also it has 32 18Kb block RAM blocks.These resource are relevant to this thesis.
A Xilinx SP601 board is provided for this thesis.
4.3 Xilinx ISE
Integrated Software Environment (ISE) is a program for synthesis and analysis ofhardware description language designs on Xilinx FPGA. This program compilesthe code and synthesizes the design. It generates a bit file that can be loaded intoan FPGA.
27

28 4 Hardware Platform
Figure 4.1: Spartan-6 FPGA SP601 Evaluation Board[15]

4.4 PicoBlaze Micro Controller 29
4.4 PicoBlaze Micro Controller
Picoblaze micro controller is an 8-bit soft processor which can be synthesized onXilinx Spartan-6 FPGA and it is free.
4.4.1 Introduction
PicoBlaze is also called KCPSM, which is in short of Constant(K) Coded Pro-grammable State Machine. It has multiple versions. The version used in thisthesis is KCPSM6. Probably its greatest strengths are that it is 100% embeddedand requires only 26 logic Slices and a Block Memory which equates to 4.3% ofthe smallest XC6SLX4 and just 0.11% of the XC6SLX150T [14].
In AC3 audio decoding process, there are many steps such as breaking the bitstream into blocks, breaking blocks into different data, and controlling the orderof different steps. These steps are sequential.
In simple terms, hardware is parallel and processors are sequential. So con-verting a small amount of hardware into a processor is often a more efficient wayto implement sequential functions such as state machines (especially complexones) or to time-share hardware resources when there are several slower tasksto be performed. It is also more natural to describe sequential tasks in softwarewhereas HDL is best at describing parallel hardware [14].
4.4.2 Architecture
PicoBlaze can execute maximum 4K instruction and it takes two clock cycles toexecute one instruction. In Spartan-6 FPGA, it can be stable working at 105MHz,which gives up to 52 MIPS performance.
PicoBlaze has 16 general purpose registers. All operations can be performedusing any register (i.e. there are no special purpose registers) so you have com-plete freedom to allocate and use registers when writing your programs[14].
PicoBlaze provides 49 instructions including ALU operations like AND, OR,ADD, SUB instructions, Compare instructions, Shift and Rotate instructions, In-put and Output, Jump and Call instructions, etc.
PicoBlaze can be reset, supports one mask-able interrupt with acknowledge,and a ‘sleep’ control can be used to suspend program execution for any period oftime to save power, wait under hardware control (e.g. Handshaking) or to enforceslower execution rate relative to the clock frequency[14].
4.4.3 Components and Connections
The components of the design can be found in Figure 4.2.From Figure 4.2, ’kcpsm6’ is the processor core and ’your_program’ is the
memory which stores your code. Due to the address signals are 12 bits width,PicoBlaze can support code with maximum 4K instructions.
Programs for PicoBlaze are stored in Block Memory in FPGAs. The size of thememory is configurable according to the size of the program or the device.

30 4 Hardware Platform
Figure 4.2: PicoBlaze Components[14]
4.4.4 Program Environment
The program for PicoBlaze needs to be written as a standard text file and thensaved with the ’.psm’ file extension.
The KCPSM6 assembler reads and assembles your program (PSM file) into theinstruction codes. It then reads an HDL template file called ’ROM_form.vhd’ (orROM_form.v) into which it inserts your assembled program and writes out theHDL file defining the program memory containing the program for use in thedesign[14]. It is shown as in Figure 4.3.
Figure 4.3: PicoBlaze Programming[14]
The assembler generates the ’your_program.vhd’ (or .v) definition of the pro-
4.4 PicoBlaze Micro Controller 31
gram memory ready to include in the ISE project.Each time the PSM file is modified, the assembler needs to run again so that
the changes are also included in the HDL program memory definition file. De-tailed steps to programming PicoBlaze can be found in [14].


5Implementation
5.1 Propose
The AC3 frame has a tricky structure. The former information bits decide if thefollowing information bits exist or not. In this case, if pure VHDL logic blocksare used to parse the frame, it will cost a lot logic resources. Due to this reason,PicoBlaze – an integrated microcontroller is used to parse the frame into data,side information, etc. and control other hardware modules in order to controlthe whole decoding flow.
Therefore, the following structure is proposed, shown in Figure 5.1.Hardware blocks are divided as shown in Figure 5.1, which is according to the
functionality of each block as described in the standard. They are not included inthe PicoBlaze because they contain data processing more than 8 bit width and op-erations which are not supported by PicoBlaze instructions, for example divisionoperation.
5.2 Data Flow
In the system, first, the bit stream is sent to a FIFO. The microcontroller PicoBlazedata from the FIFO and parses the audio blocks one by one.
After the bit allocation information in one audio block is parsed. The Pi-coBlaze will pause and enable exponent decoder to decoder packed exponentsto unpacked exponents and stores them in to unpacked exponent block ram. Bitallocation block calculate the bap information using exponent. The bap informa-tion decides how many bits are distributed to each mantissa. PicoBlaze uses thebap information to continue parsing the rest of the audio block and stores thegrouped mantissas into block ram. The mantissa decoder block generates thetransform coefficients by using exponents and mantissas. IMDCT transfers the
33

34 5 Implementation
FIFOPicoBlaze
PackedExponent
BRAM
ExponentDecoder
ExponentBRAM
Bit Allocation
BapBRAM
MantissaBRAM
MantissaUngroup
GroupedMantissa
BRAM
MantissaDecoder
TransformCoefficient
BRAM
IMDCTFIFO
Bit Stream
PCM
Figure 5.1: System structure
information from frequency domain to time domain and store the PCM data inthe output FIFO. During the whole process, PicoBlaze controls the data flow andevery block. PicoBlaze is idle during the hardware block operation and hardwareblocks are relatively fast comparing to PicoBlaze data parsing.
5.3 Implementation
5.3.1 PicoBlaze
PicoBlaze is a small 8 bit microcontroller and it can be instanced many times ina FPGA design. It costs little resources which is only 26 logic Slices in Spartan-6and a Block Memory. And it is fully embedded. To embed it to the design, it isonly required basic hardware description code for connections.
Due to the input port of PicoBlaze is 8 bit wide and the fact that the formerinformation decides if the following information exists or not, 8 bits data is readinto a register in PicoBlaze every time and shift out information bit one by one toanalyze. The whole program for the microcontroller is written in assembly code.And the input and output network are built in VHDL.

5.3 Implementation 35
PicoBlaze Assembly
The PicoBlaze does not have a C complier but it comes with a assembler. So thedecoding program is written in PicoBlaze assembly. The program is divided intothree main parts, shown in following program.
Listing 5.1: decoding.psm;===================; main program;===================
fo rev er :c a l l synchrc a l l b s ic a l l audioblockjump fo rev er
The syncword is 0x0B77 which is most significant bit transmitted first. Thesynchr subroutine is to detect synchronization, CRC value, sample rate code andframe size of this frame. The CRC word is 16 bit word which can be used to checkthe first 5/8 of the syncframe. Sample rate code is to indicate which sample rateis used, for example, ’00’ means 48kHz. Frame size is to determine how manywords inside this frame where every word is 16 bits.
The bsi subroutine is used to decode Bit Stream Information block. Thisblock contains information of coding mode which is telling information like ifsurround channels are in use or if two completely independent channels are inuse. It also contains minor information such as room type, language code, copyright etc. which is not relevant to the main functionality. Details can be found in[1].
The audioblock subroutine is the main part of the assembly code. It has astructure like following code.
Listing 5.2: decoding.psm;===================; audioblock program;===================
audioblock :load sD , 06
label_audioblock :c a l l exponentc a l l b i t _ a l l o c a t i o nc a l l mantissasub sD , 01jump nz , label_audioblockreturn

36 5 Implementation
The exponent subroutine is to extract exports data out of the audio blockalong with other auxiliary information like coupling begin frequency code, cou-pling end frequency code, coupling band structure information. The extractedexports data are stored in a BRAM and to be utilized.
The bit_allocation subroutine is to extract information data for bit allocationcalculation. Information are like slow decay code, coarse SNR offset, coupling fastleak initialization and etc. These information are outputs from PicoBlaze outputnetwork and input to bit allocation calculation block for calculation which get bitallocation information from exponents. Details can be found in [1].
The mantissa subroutine is to extract mantissa data out of the audio block.How many bits in every group mantissa are based on the bap information. Pi-coBlaze stores the grouped mantissas into block ram. After mantissa being ex-tracted from one audio block, mantissa decoder will process the mantissas andexponents into transform coefficients. And the transform coefficients are storedin a BRAM too.
PicoBlaze out_port is 8 bits wide and port_id is 8 bits wide, so PicoBlaze canoutput 8-bit values to up to 256 general purpose output ports using its OUTPUTinstructions. When PicoBlaze executes an OUTPUT instruction it sets port_idto specify which of 256 ports it wants to write the 8-bit data value present onout_port. A single clock cycle enable pulse is generated on write_strobe andhardware uses write_strobe to qualify the decodes of port_id to ensure that onlythe correct register captures the out_port value. [14]
5.3.2 Exponent Decoder
The audio data is a number of frequency coefficients. And each coefficient isrepresented by an exponent and a mantissa. Each exponent has 5 bits, but themaximum value is 24. All audio data is not shared between frames. Exponentscan be shared between blocks within one frame. So after we extract exponentsfrom the first audio block from a frame, they should be stored in a BRAM forfurther usage.
To make the coding more efficient, The first exponent of every channel is a 4bit value and it is used as a reference for following exponents. Also the followingexponents are packed further. It has 3 exponent strategies, which are D15, D25and D45, details can be found in Chapter 3.
Pseudo Code
The function of exponent decoder is to use all side information to decode packedexponents to independent unpacked exponents.
The decoding pseudo code is like following listing.

5.3 Implementation 37
Listing 5.3: Exponent Decoding [1]
/ * unpack the mapped va lu e s * /for ( grp = 0 ; grp < ngrps ; grp++){
expacc = gexp [ grp ] ;dexp [ grp * 3] = truncate ( expacc / 25) ;expacc = expacc − ( 25 * dexp [ grp * 3 ] ) ;dexp [ ( grp * 3) + 1] = truncate ( expacc / 5) ;expacc = expacc − (5 * dexp [ ( grp * 3) + 1 ] ) ;dexp [ ( grp * 3) + 2] = expacc ;
}/ * unbiased mapped va lu e s * /for ( grp = 0 ; grp < ( ngrps * 3 ) ; grp++){
dexp [ grp ] = dexp [ grp ] − 2 ;}/ * c onv e r t from d i f f e r e n t i a l s t o a b s o l u t e s * /prevexp = absexp ;for ( i = 0 ; i < ( ngrps * 3 ) ; i ++){
aexp [ i ] = prevexp + dexp [ i ] ;prevexp = aexp [ i ] ;
}/ * expand to f u l l a b s o l u t e exponent array , us ing g r p s i z e * /exp [ 0 ] = absexp ;for ( i = 0 ; i < ( ngrps * 3 ) ; i ++){
for ( j = 0 ; j < grps ize ; j ++){
exp [ ( i * grps ize ) + j +1] = aexp [ i ] ;}
}
Where:ngrps = number of grouped exponentsgrpsize = 1 for D15= 2 for D25= 4 for D45absexp = absolute exponent (exps[ch][0], (cplabsexp«1), or lfeexps[0])
Hardware Implementation
The exponent decoder is connected to BRAMs which store packed exponents andunpacked exponents. During the decoding process, the module will read outpacked exponents from BRAMs, decode according to the pseudo code, writes theresults which are the unpacked exponents into the corresponding BRAMs.

38 5 Implementation
Packed Exponents
BRAM
ExponentDecoder
clk
en
rst
nfchans[2:0]
Packed Exponents
BRAM
Packed Exponents
BRAM
Packed Exponents
BRAM
Packed Exponents
BRAM
Packed Exponents
BRAM
Packed Exponents
BRAM
Packed Exponents
BRAM
Packed Exponents
BRAM
Packed Exponents
BRAM
Packed Exponents
BRAM
Unpacked Exponents
BRAMdin_fbw0[7:0]
din_fbw1[7:0]
din_fbw2[7:0]
din_fbw3[7:0]
din_fbw4[7:0]
din_cpl[7:0]
exps_ch0_0[7:0]
...
exps_ch4_0[7:0]
dout_cpl[7:0]
dout_fbw[7:0]
dout_lfe[7:0]
addr_dout[7:0]
addr_din[7:0]
rd_fbw_en[4:0]
wr_fbw_en[4:0]
wr_lbw_en
wr_cpl_en
rd_lfe_en
rd_cpl_en
ack_bit_alloc
nchgrps0[7:0]
...
nchgrps4[7:0]
lfeexps0[7:0]
...
lfeexps2[7:0]
cplexpstr[1:0]
cplabexp[3:0]
lfeexpstr[1:0]
cplinu
Figure 5.2: Exponents Decoder
Inputs din_fbw are grouped exponents data for fbw channel and din_cpl aregrouped exponents data for cpl channel. Inputs exps_chn_0 are the first expo-nent for every fbw channel. Inputs nchgrps are the number of group exponentsin every channel. Inputs lfeexps are group exponents in lfe channel. cplinu issignal showing coupling is used or not. Output dout are ungrouped exponentsfor every channel to be stored in corresponding BRAM.
For the exponent decoder block, an FSM is implemented to control the dataflow. The exponents of coupling channel, all FSW channels and LFE channelare decoded in different states. When all exponents are done, exponent decodersends a enable signal to bit allocation module to continue the process.

5.3 Implementation 39
S0 S1
S3 S2
en = 1
en = 0
No coupling or coupling expont done
All fbw exponents
done
Lfe exponents done
Figure 5.3: Exponents Decoder FSM

40 5 Implementation
5.3.3 Bit Allocation
Bit allocation is divided into 6 steps. The results of every step are stored in blockRAM for the following calculation steps. The diagram is shown in Figure 5.4.
PSD
dat
ad
ata
ack
Pac
ked
Ex
po
nen
tsB
RA
M
Pac
ked
Ex
po
nen
tsB
RA
M
Pac
ked
Ex
po
nen
tsB
RA
M
Pac
ked
Ex
po
nen
tsB
RA
M
Pac
ked
Ex
po
nen
tsB
RA
M
Un
pac
ked
Ex
po
nen
tsB
RA
M
ack
fro
m P
icoB
laze
BR
AM
PSD
Inte
grat
ion
dat
ad
ata
BR
AM
ack
dat
a
Co
mp
ute
Exci
tati
on
Fun
ctio
n
dat
aB
RA
M
ack
dat
a
ackdat
a
Co
mp
ute
Mas
kin
g C
urv
e
dat
aB
RA
M
ack
dat
a
Ap
ply
Del
ta B
it
Allo
cati
on
dat
aB
RA
M
ack
dat
ad
ata
Co
mp
ute
Bit
A
lloca
tion
dat
aB
RA
M
ack
to P
ico
Bla
ze
dat
a
Pac
ked
Ex
po
nen
tsB
RA
M
Pac
ked
Ex
po
nen
tsB
RA
M
Pac
ked
Ex
po
nen
tsB
RA
M
Pac
ked
Ex
po
nen
tsB
RA
M
Pac
ked
Ex
po
nen
tsB
RA
M
Bap
BR
AM
ack
Figure 5.4: Bit Allocation Diagram

5.3 Implementation 41
Initialization and Exponent Mapping into PSD
Initialization step is to calculate parameters for bit allocation from the informa-tion in the data stream. For example, the start and end frequencies can be simplycomputed from the following pseudo code. More information can be found in[1].
Listing 5.4: Initialization [1]
/ * f o r fbw channe l s * /for ( ch =0; ch<nfchans ; ch++){
strtmant [ ch ] = 0 ;/ * channe l i s coup l ed * /i f ( chincpl [ ch ] ) endmant [ ch ] = 37 + (12 * cplbegf ) ;/ * channe l i s not coup l ed * /else endmant [ ch ] = 37 + (3 * ( chbwcod + 1 2 ) ) ;
}/ * f o r c oup l ing channe l * /cpls tr tmant = 37 + (12 * cplbegf ) ;cplendmant = 37 + [12 * ( cplendf + 3 ) ] ;/ * f o r l f e channe l * /l f e s t a r t m a n t = 0 ;lfeendmant = 7 ;
Exponent Mapping step is to decode exponents into power spectral densityfunction, which requires simply shift operation.
Listing 5.5: Exponent Mapping into PSD [1]
for ( bin= s t a r t ; bin<end ; bin ++){
psd [ bin ] = (3072 − ( exp [ bin ] << 7 ) ) ;}
42 5 Implementation
Psd
clk
en
rst
din_exponents[4:0]
start_bin[7:0]
end_din[7:0]
psd[12:0]
addr_dout[7:0]
wr_dout_en
en_psd_integration
addr_din[7:0]
rd_din_en
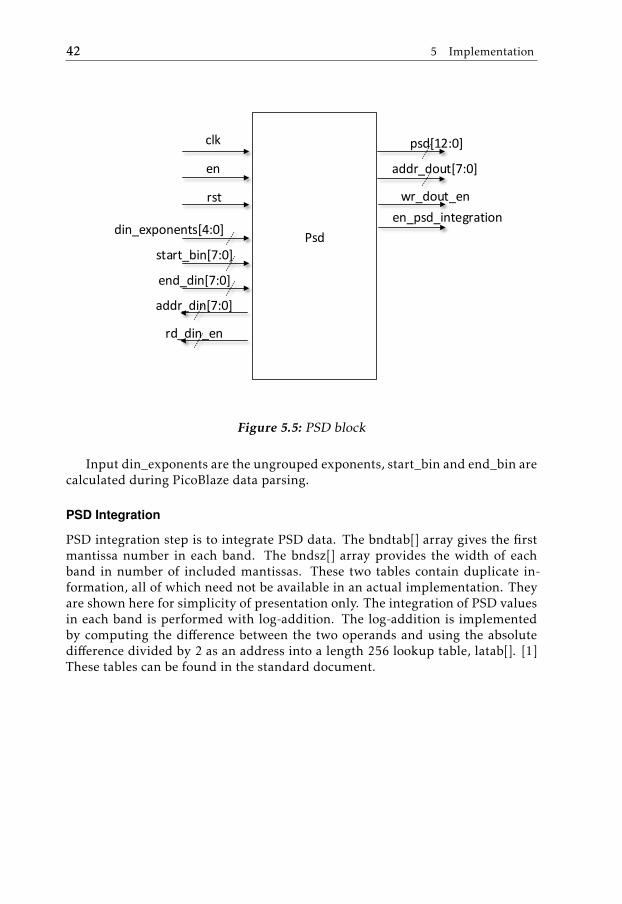
Figure 5.5: PSD block
Input din_exponents are the ungrouped exponents, start_bin and end_bin arecalculated during PicoBlaze data parsing.
PSD Integration
PSD integration step is to integrate PSD data. The bndtab[] array gives the firstmantissa number in each band. The bndsz[] array provides the width of eachband in number of included mantissas. These two tables contain duplicate in-formation, all of which need not be available in an actual implementation. Theyare shown here for simplicity of presentation only. The integration of PSD valuesin each band is performed with log-addition. The log-addition is implementedby computing the difference between the two operands and using the absolutedifference divided by 2 as an address into a length 256 lookup table, latab[]. [1]These tables can be found in the standard document.

5.3 Implementation 43
Listing 5.6: PSD Integration [1]
j = s t a r t ;k = masktab [ s t a r t ] ;do{
l a s t b i n = min ( bndtab [ k ] + bndsz [ k ] , end ) ;bndpsd [ k ] = psd [ j ] ;j ++ ;
for ( i = j ; i < l a s t b i n ; i ++){
bndpsd [ k ] = logadd ( bndpsd [ k ] , psd [ j ] ) ;j ++ ;
}k++ ;}while ( end > l a s t b i n ) ;logadd ( a , b ){
c = a − b ;address = min ( ( abs ( c ) >> 1 ) , 255) ;i f ( c >= 0){
return ( a + l a t a b ( address ) ) ;}else{
return ( b + l a t a b ( address ) ) ;}
}

44 5 Implementation
Psd_integration
clk
en
rst
din_psd[12:0]
start_mantissa[7:0]
end_mantissa[7:0]
bndpsd[12:0]
addr_dout[7:0]
wr_dout_en
en_compute_excitation_function
addr_din[7:0]
rd_din_en
Figure 5.6: PSD Integration block
Input din_psd are the output from the PSD which is stored in a BRAM. Out-put bndpsd is stored into a BRAM for next step.
Compute Excitation Function
The excitation function is computed by applying the prototype masking curveselected by the encoder (and transmitted to the decoder) to the integrated PSDspectrum (bndpsd[]). The result of this computation is then offset downward inamplitude by the fgain and sgain parameters, which are also obtained from thebit stream. [1] Pseudo Code can be found in [1].

5.3 Implementation 45
Compute excitation function
clk
en
rst
dbpbcod[1:0]
fscod[1:0]
din_bndpsd[13:0]
dout_excite[13:0]
addr_dout[7:0]
wr_dout_en
en_compute_masking_curve
addr_din[7:0]
rd_din_en
fgain[1:0]
sgain[1:0]
Figure 5.7: Compute Excitation Function block
Input dbpbcod, fscod, sgain and fgain are calculated during PicoBlaze dataparsing. Their meaning can be found in [1].
Compute Masking Curve
Compute Masking Curve is to compute the noise level threshold curve. It is touse fscod and dbpbcod parameters in the data stream to search in hth[][] hearingthreshold table.
Listing 5.7: Compute Masking Curve [1]
for ( bin = bndstr t ; bin < bndend ; bin ++){
i f ( bndpsd [ bin ] < dbknee ){
e x c i t e [ bin ] += ( ( dbknee − bndpsd [ bin ] ) >> 2) ;}mask [ bin ] = max( e x c i t e [ bin ] , hth [ fscod ] [ bin ] ) ;
}

46 5 Implementation
Compute masking curve
clk
en
rst
dbpbcod[1:0]
fscod[1:0]
din_bndpsd[13:0]
dout_mask[13:0]
addr_dout[7:0]
wr_dout_en
en_delta_bit_allocation
addr_din[5:0]
rd_din_en
fgain[1:0]
sgain[1:0]
din_excite[13:0]
Figure 5.8: Compute Masking Curve block
Input dbpbcod, fscod, sgain and fgain are calculated during PicoBlaze dataparsing. din_bndpsd and din_excite are output from previous steps.
Apply Delta Bit Allocation
The optional delta bit allocation information in the bit stream provides a meansfor the encoder to transmit side information to the decoder which directly in-creases or decreases the masking curve obtained by the parametric routine. Deltabit allocation can be enabled by the encoder for audio blocks which derive animprovement in audio quality when the default bit allocation is appropriatelymodified. The delta bit allocation option is available for each fbw channel andthe coupling channel. [1]

5.3 Implementation 47
Listing 5.8: Apply Delta Bit Allocation [1]
i f ( ( del tbae == 0) | | ( del tbae == 1 ) ){
band = 0 ;for ( seg = 0 ; seg < del tnseg +1; seg ++){
band += d e l t o f f s t [ seg ] ;i f ( del tba [ seg ] >= 4){
d e l t a = ( del tba [ seg ] − 3) << 7 ;}else{
d e l t a = ( del tba [ seg ] − 4) << 7 ;}for ( k = 0 ; k < d e l t l e n [ seg ] ; k++){
mask [ band ] += d e l t a ;band++ ;
}}
}

48 5 Implementation
Delta bit allocation
clk
en
rst
deltnseg[2:0]
deltoffst_0[5:0]
dout_mask[13:0]
addr_dout[7:0]
wr_dout_en
en_compute_bit_allocation
addr_din[5:0]
rd_din_en
din_mask[13:0]
deltoffst_7[5:0]...
deltlen_0[5:0]
deltlen_7[5:0]...
deltba_0[5:0]
deltba_7[5:0]...
Figure 5.9: Delta Bit Allocation block
Input deltnseg, deltoffst, delt etc. are calculated during PicoBlaze data pars-ing. Their meaning can be found in [1].
Compute Bit Allocation
Compute Bit Allocation is the final step in the bit allocation process, which willgenerates bap[] array. Bap[] array is used by PicoBlaze to further parse the datastream.

5.3 Implementation 49
Listing 5.9: Apply Delta Bit Allocation [1]
i = s t a r t ;j = masktab [ s t a r t ] ;do{
l a s t b i n = min ( bndtab [ j ] + bndsz [ j ] , end ) ;mask [ j ] −= s n r o f f s e t ;mask [ j ] −= f l o o r ;i f ( mask [ j ] < 0){
mask [ j ] = 0 ;}mask [ j ] &= 0x1fe0 ;mask [ j ] += f l o o r ;for ( k = i ; k < l a s t b i n ; k++){
address = ( psd [ i ] − mask [ j ] ) >> 5 ;address = min(63 , max( 0 , address ) ) ;bap [ i ] = baptab [ address ] ;i ++ ;
}j ++;
}while ( end > l a s t b i n ) ;

50 5 Implementation
Compute bit allocation
clk
en
rst
start_bin[7:0]
end_bin[7:0]
din_psd[13:0]
dout_bap[3:0]
addr_dout[7:0]
wr_dout_en
en
addr_din_psd[7:0]
rd_din_psd_en
din_mask[13:0]
addr_din_mask[5:0]
rd_din_mask_en
snroffset[13:0]
floor[13:0]
Figure 5.10: Compute Bit Allocation block
5.3.4 Mantissa Ungroup and Mantissa Decoder
For Mantissa Ungroup step, it needs to follow the following rules. For casesthat bap[] = 1, 2 and 4, the coded mantissas are grouped together either twoor three into a group word. In this way, Dolby Digital can further decrease thedata amount. To ungroup the group word, the decoder just needs to follow thefollowing equations.
For bap[]=1,
mantissa_code[a] = truncate (group_code/9)
mantissa_code[b] = truncate ((group_code%9) /3)
mantissa_code[c] = (group_code%9) %3
(5.1)
For bap[]=2,

5.3 Implementation 51
mantissa_code[a] = truncate (group_code/25)
mantissa_code[b] = truncate ((group_code%25) /5)
mantissa_code[c] = (group_code%25) %5
(5.2)
For bap[]=4,
mantissa_code[a] = truncate (group_code/11)
mantissa_code[b] = group_code%11(5.3)
For Mantissa Decoder, it basically right shift mantissa by corresponding ex-ponent to recover the fixed point form. It is divided into two cases. For bap[]value from 1 to 5, the quantization is symmetrical. The mantissas are in a codedform. The coded should be transformed to two’s complement fractional binarywords according to certain lookup table. Then the mantissa value from lookuptables need to right shifted according to the corresponding exponent to get thetransform coefficient [1].
transf orm_coef f icient[k] = quantization_table[mantissa[k]] >> exponent[k](5.4)
For bap[] value from 6 to 15, the formula changed to:
transf orm_coef f icient[k] = mantissa[k] >> exponent[k] (5.5)
Hardware Implementation
According to the bap information, the ungrouping of mantissa can be done bydividing the mantissa in the same divider in exponent decoder. The function ofthis block is to arithmetic right shift the mantissa by corresponding exponent.
5.3.5 IMDCT
The FPGA implementation diagram is based on the fast algorithm in the AC3standard document. The process for 512-sample IMDCT transform is explainedhere.1. The 256 coefficients X[k] are ready.2. Apply Pre-IFFT complex multiply.
Listing 5.10: Pre-IFFT complex multiply [1]
for ( k=0; k<N/ 4 ; k++){
Z[ k ] = (X[N/2−2*k−1]* xcos1 [ k]−X[2*k ] * xsin1 [ k ] )+ j * (X[2*k ] * xcos1 [ k]+X[N/2−2*k−1]* xsin1 [ k ] ) ;
}where
xcos1 [ k ] = −cos (2* pi * ( 8 *k + 1 ) / ( 8 *N ) ) ;xsin1 [ k ] = −s in (2* pi * ( 8 *k + 1 ) / ( 8 *N ) ) .

52 5 Implementation
3. Apply 128 point complex IFFT.
Listing 5.11: 128 point IFFT [1]
for ( n=0; n<N/ 4 ; n++){
z [ n]=0 ;for ( k=0; k<N/ 4 ; k++){
z [ n ] += Z[ k ] * ( cos (8* pi *k*n/N) + j * s in (8* pi *k*n/N) ) ;}
}
4. Post-IFFT complex multiply.
Listing 5.12: Pre-IFFT complex multiply [1]
for ( n=0; n<N/ 4 ; n++){
y [ n ] = ( zr [ n ] * xcos1 [ n ] − z i [ n ] * xsin1 [ n ] )+ j * ( z i [ n ] * xcos1 [ n ] + zr [ n ] * xsin1 [ n ] ) ;
}where
zr [ n ] = r e a l ( z [ n ] ) ;z i [ n ] = imag ( z [ n ] ) ;and xcos1 [ n ] and xsin1 [ n ] are as defined in step 2 above .
5. Compute windowed time domain samples.
Listing 5.13: Windowing [1]
for ( n=0; n<N/ 8 ; n++){
x [2*n ] = −yi [N/8+n ] * w[2*n ] ;x [2*n+1] = yr [N/8−n−1] * w[2*n+1] ;x [N/4+2*n ] = −yr [ n ] * w[N/4+2*n ] ;x [N/4+2*n+1] = yi [N/4−n−1] * w[N/4+2*n+1] ;x [N/2+2*n ] = −yr [N/8+n ] * w[N/2−2*n−1] ;x [N/2+2*n+1] = yi [N/8−n−1] * w[N/2−2*n−2] ;x [3*N/4+2*n ] = yi [ n ] * w[N/4−2*n−1] ;x [3*N/4+2*n+1] = −yr [N/4−n−1] * w[N/4−2*n−2] ;
}where
yr [ n ] = r e a l ( y [ n ] ) ;y i [ n ] = imag ( y [ n ] ) .
w[n] is the transform window sequence which can be found in [1].
6. Overlap and add.
Listing 5.14: Overlap and add [1]

5.3 Implementation 53
for ( n=0; n<N/ 2 ; n++){
pcm[ n ] = 2* ( x [ n ] + delay [ n ] ) ;delay [ n ] = x [N/2+n ) ;
}
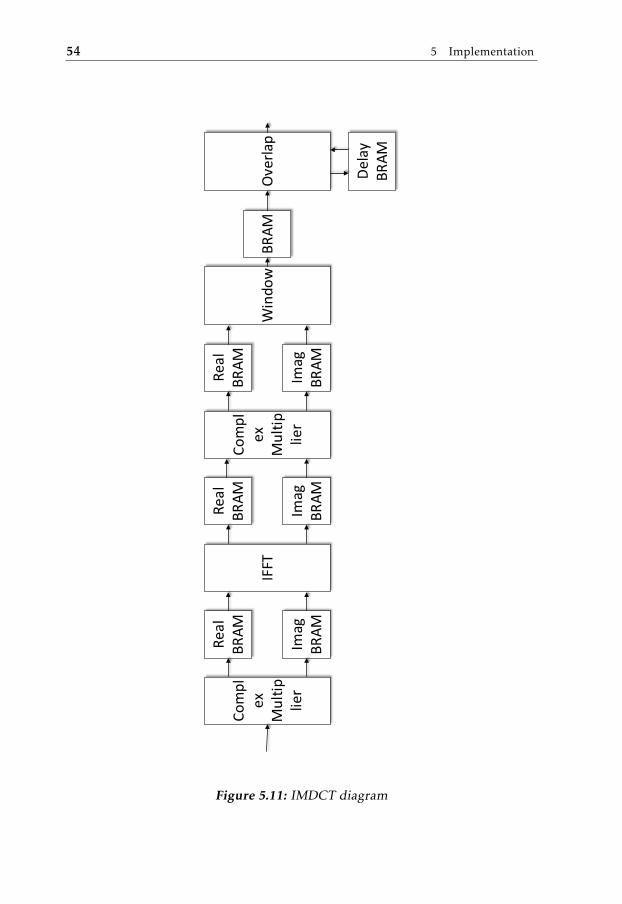
In the FPGA implementation, the complex multipliers, IFFT blocks and blockRAMs are generated by Core Generator in Xilinx ISE
The hardware structure of IMDCT is shown in Figure 5.11.This is a 512 sample IMDCT transform. All Real and Imag BRAMs sizes are
18bit*128. The size of BRAM after Window function is 18bit*512. The size ofDelay BRAM is 18bit*256.
The complex multiplier blocks consist of three main parts, one complex mul-tiplier and two ROMs. The multiplier is generated by the core generator in XilinxISE. Channel A and B are both 18 bits wide. It uses hardware multiplier in thechip and has nonblocking flow control. To use the least amount of resources, theoptimization goal is set to ’Resource’. The two ROMs are also generated by thecore generator. They contains the xcos1[k] and xsin1[k], which are used in step 2and 4. The values of xcos1[k] and xsin1[k] are calculated by using Matlab. IFFTblock is generated by the core generator in Xilinx ISE. Due to PicoBlaze can runat maximum around 100MHz on Spartan-6, the target clock frequency is set to100MHz and Implementation option is set to ’Radix-2, Burst I/O’ to save area.The Phase Factors are set to store in BRAM. The 3 multiplier structure is selectedto achieve resource optimization.
54 5 Implementation
Compl
exMultip
lier
Real
BRAM
IFFT
Imag
BRAM
Real
BRAM
Imag
BRAM
Compl
exMultip
lier
Real
BRAM
Imag
BRAM
Windo
wBRAM
Overlap
Delay
BRAM
Figure 5.11: IMDCT diagram
6Results and Conclusion
6.1 Results
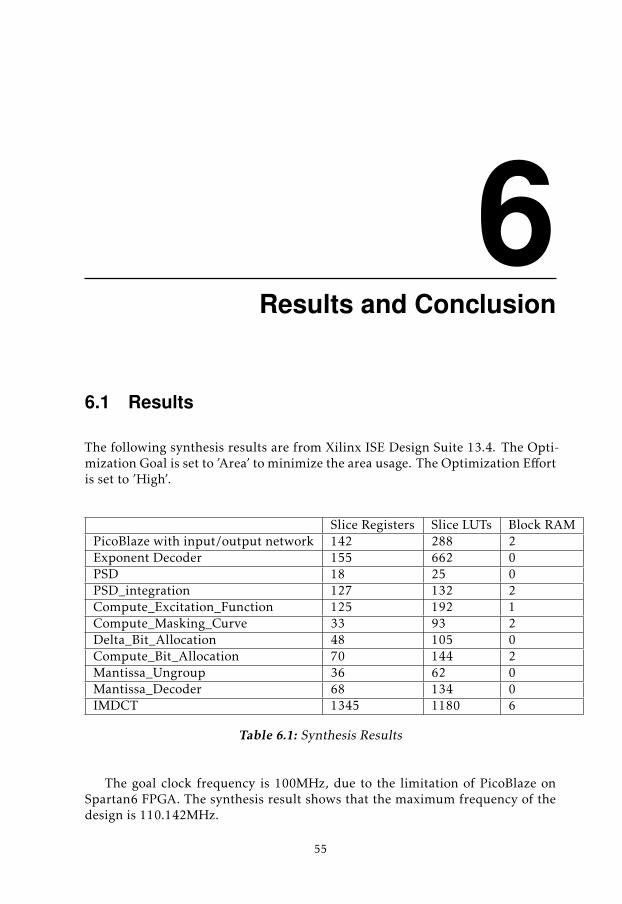
The following synthesis results are from Xilinx ISE Design Suite 13.4. The Opti-mization Goal is set to ’Area’ to minimize the area usage. The Optimization Effortis set to ’High’.
Slice Registers Slice LUTs Block RAMPicoBlaze with input/output network 142 288 2Exponent Decoder 155 662 0PSD 18 25 0PSD_integration 127 132 2Compute_Excitation_Function 125 192 1Compute_Masking_Curve 33 93 2Delta_Bit_Allocation 48 105 0Compute_Bit_Allocation 70 144 2Mantissa_Ungroup 36 62 0Mantissa_Decoder 68 134 0IMDCT 1345 1180 6
Table 6.1: Synthesis Results
The goal clock frequency is 100MHz, due to the limitation of PicoBlaze onSpartan6 FPGA. The synthesis result shows that the maximum frequency of thedesign is 110.142MHz.
55

56 6 Results and Conclusion
6.2 Conclusion
From the synthesis result, it shows that the proposed solution takes reasonablehardware resources. So the current implementation is able to fit into a tiny FPGAchip. This is not including the functions which are not considered for this project.Also the integrating to the current FPGA in the product can take extra resource.
In summary of all the work mentioned above in Chapter 1 and this thesis, itis a widely accepted opinion that the AC3 decoding is better to be done with ahardware/software co-design solution.
Also pseudo codes in AC3 standard are very similar to C. So a MCU withfloating point calculation will be very suitable for such task.
6.3 Future Work
• Implementation can be optimized. The current design may not be the bestsolution. The area/resource usage can be further decreased. For example,some BRAM can be reused during different steps. IMDCT module is cur-rently based on Xilinx core generator, but it may take less area if it is dedi-catedly designed.
• In the current implementation, PicoBlaze is stalled during hardware mod-ule operation, which is shown in Figure 6.1. There is possibility to put morehardware function into PicoBlaze, for example, Exponent Decoding, whichmakes the timing more compact.
Exponent Decoding
PicoBlazeParshing until
Packed Mantissas
Bit Allocation
PicoBlaze Parshing Packed
Mantissas
Mantissa Ungroup and
DecodingIMDCT
... ...
t
Figure 6.1: Decoding Timing Diagram
• The system needs further verification. Verification on module level hasbeen done on this thesis. But the system level verification is not done verywell. It is partly because of limited time and also because there is no reallyefficient and good method to verify.
• Dynamic range compression and down-mixing are optional. They are notincluded into this project. But it can improved the sound quality. So somefurther work can be done on that.

6.3 Future Work 57
• According to online information, there are already open source C codeprojects for AC3 decoding. So it is worth to explore the possibility to use aMCU to decode AC3 data stream, which may be more suitable.

58 6 Results and Conclusion

Bibliography
[1] ATSC. ATSC standard: Digital Audio Compression (AC-3, E-AC-3). 2012.Cited on pages 3, 10, 12, 18, 19, 20, 21, 22, 23, 24, 25, 35, 36, 37, 41, 42, 43,44, 45, 46, 47, 48, 49, 51, and 52.
[2] Ji Kong Yunfei Zhang Bin He Dajiang Zhou, Peilin Liu. An soc basedhw/sw co-design architecture for multi-standard audio decoding. IEEEAsian Solid-State Circuits Conference, 2007. Cited on page 2.
[3] John L. Hennessy David A. Patterson. Computer organization and designthe hardware software interface. 2014. Cited on page 8.
[4] Sarah L. Harris David Money Harris. Digital design and computer architec-ture. 2012. Cited on page 7.
[5] Texas Instruments. Dolby ac3 version3 decoder on c64x+. 2007. Cited onpage 2.
[6] Wu Jiaan. Modern audio coding. 2007. Cited on pages 5 and 6.
[7] Dolby Laboratories. Frequently Asked Questions about DOLBY DIGITAL.2000. Cited on page 9.
[8] Dolby Laboratories. Dolby digital logo. 2012. URL https://commons.wikimedia.org/wiki/File:Dolby-Digital.svg. Cited on page 1.
[9] Dolby Laboratories. Dolby digital. 2014. URL http://www.dolby.com/us/en/technologies/dolby-digital.html. Cited on page 9.
[10] Guoshun Lai. Hardware/software co/design of an ac-3 audio decoder on anarm-based platform. 2003. Cited on page 2.
[11] Opalum. 2014. URL http://www.opalum.com/en. Cited on pages 1and 2.
[12] Qi Tang. Dolby ac3 version3 decoder based on audio dsp core. 2009. Citedon page 2.
59

60 Bibliography
[13] Wikipedia. Pulse-code modulation. 2014. URL http://en.wikipedia.org/wiki/Pulse-code_modulation. Cited on page 7.
[14] Xilinx. PicoBlaze for Spartan-6, Virtex-6 and 7-Series (KCPSM6). Cited onpages 29, 30, 31, and 36.
[15] Xilinx. sp601 product brief. 2011. Cited on page 28.
[16] Xilinx. Getting Started with the Xilinx Spartan-6 FPGA SP601 EvaluationKit. 2011. Cited on page 27.