fr family softunetm workbench user’s manual · not be liable against you and/or any third party...
TRANSCRIPT

FUJITSU SEMICONDUCTORCONTROLLER MANUAL
FR FAMILY
SOFTUNETM WORKBENCHUSER’S MANUAL
for V6
CM71-00329-3E

FUJITSU LIMITED
FR FAMILY
SOFTUNETM WORKBENCHUSER’S MANUAL
for V6

Preface
■ What is the SOFTUNE Workbench?SOFTUNE Workbench is support software for developing programs for the FR families of microprocessors
/ microcontrollers.
It is a combination of a development manager, simulator debugger, emulator debugger, monitor debugger,
and an integrated development environment for efficient development.
■ Purpose of this manual and target readersThis manual explains the functions of SOFTUNE Workbench. This manual is intended for engineers
developing various types of products using SOFTUNE Workbench. Be sure to read this manual
completely.
■ TrademarksSOFTUNE is a trademark of FUJITSU LIMITED.
REALOS (REALtime Operating System) is a trademark of FUJITSU LIMITED.
The names of products and systems appearing in this manual are trademarks or registered trademarks of
their respective companies.
i

■ Organization of ManualThis manual consists of two chapters.
CHAPTER 1 "Basic Functions"
This chapter describes the basic functions on the SOFTUNE Workbench.
CHAPTER 2 "Dependence Functions"
This chapter describes the functions on each debugger.
Copyright ©2002-2006 FUJITSU LIMITED All rights reserved
• The contents of this document are subject to change without notice. Customers are advised to consult with FUJITSUsales representatives before ordering.
• The information, such as descriptions of function and application circuit examples, in this document are presented solelyfor the purpose of reference to show examples of operations and uses of Fujitsu semiconductor device; Fujitsu does notwarrant proper operation of the device with respect to use based on such information. When you develop equipmentincorporating the device based on such information, you must assume any responsibility arising out of such use of theinformation. Fujitsu assumes no liability for any damages whatsoever arising out of the use of the information.
• Any information in this document, including descriptions of function and schematic diagrams, shall not be construed aslicense of the use or exercise of any intellectual property right, such as patent right or copyright, or any other right ofFujitsu or any third party or does Fujitsu warrant non-infringement of any third-party's intellectual property right orother right by using such information. Fujitsu assumes no liability for any infringement of the intellectual propertyrights or other rights of third parties which would result from the use of information contained herein.
• The products described in this document are designed, developed and manufactured as contemplated for general use,including without limitation, ordinary industrial use, general office use, personal use, and household use, but are notdesigned, developed and manufactured as contemplated (1) for use accompanying fatal risks or dangers that, unlessextremely high safety is secured, could have a serious effect to the public, and could lead directly to death, personalinjury, severe physical damage or other loss (i.e., nuclear reaction control in nuclear facility, aircraft flight control, airtraffic control, mass transport control, medical life support system, missile launch control in weapon system), or (2) foruse requiring extremely high reliability (i.e., submersible repeater and artificial satellite). Please note that Fujitsu willnot be liable against you and/or any third party for any claims or damages arising in connection with above-mentioneduses of the products.
• Any semiconductor devices have an inherent chance of failure. You must protect against injury, damage or loss fromsuch failures by incorporating safety design measures into your facility and equipment such as redundancy, fireprotection, and prevention of over-current levels and other abnormal operating conditions.
• If any products described in this document represent goods or technologies subject to certain restrictions on export
under the Foreign Exchange and Foreign Trade Law of Japan, the prior authorization by Japanese government will be
required for export of those products from Japan.
ii

Reading This Manual
■ Product NamesIn this manual and this product, product name is designated as follows:
The Microsoft® Windows® 98 operating system is abbreviated to Windows 98.
The Microsoft® Windows® Millennium Edition operating system is abbreviated to Windows Me.
The Microsoft® Windows® 2000 Professional operating system is abbreviated to Windows 2000.
The Microsoft® Windows® XP Professional operating system is abbreviated to Windows XP.
iii

iv

CONTENTS
CHAPTER1 Basic Functions...............................................................................11.1 Workspace Management Function ......................................................................................... 21.2 Project Management Function................................................................................................ 31.3 Project Dependence ............................................................................................................... 51.4 Make/Build Function ............................................................................................................... 6
1.4.1 Customize Build Function............................................................................................. 71.5 Include Dependencies Analysis Function ............................................................................... 91.6 Functions of Setting Tool Options......................................................................................... 101.7 Error Jump Function ............................................................................................................. 111.8 Editor Functions.................................................................................................................... 131.9 Storing External Editors ........................................................................................................ 141.10 Storing External Tools .......................................................................................................... 161.11 Macro Descriptions Usable in Manager................................................................................ 171.12 Setting Operating Environment............................................................................................. 211.13 Debugger Types ................................................................................................................... 221.14 Memory Operation Functions ............................................................................................... 231.15 Register Operations.............................................................................................................. 241.16 Line Assembly and Disassembly .......................................................................................... 251.17 Symbolic Debugging............................................................................................................. 26
1.17.1 Referring to Local Symbols ........................................................................................ 281.17.2 Referring to C/C++ Variables ..................................................................................... 29
CHAPTER2 Dependence Functions .................................................................312.1 Simulator Debugger.............................................................................................................. 32
2.1.1 Instruction Simulation ................................................................................................. 342.1.2 Memory Simulation..................................................................................................... 352.1.3 I/O Port Simulation ..................................................................................................... 362.1.4 Interrupt Simulation .................................................................................................... 372.1.5 Reset Simulation ........................................................................................................ 382.1.6 Power-Save Consumption Mode Simulation .............................................................. 392.1.7 Break .......................................................................................................................... 40
2.1.7.1 Code Break ........................................................................................................... 412.1.7.2 Data Break ............................................................................................................ 422.1.7.3 Trace Buffer-full Break .......................................................................................... 432.1.7.4 Guarded Access Break ......................................................................................... 442.1.7.5 Forced Break......................................................................................................... 45
2.1.8 Measuring Execution Cycle Count ............................................................................. 462.1.9 Trace .......................................................................................................................... 47
2.1.9.1 Trace Sampling ..................................................................................................... 482.1.9.2 Setting Trace ......................................................................................................... 492.1.9.3 Displaying Trace Data ........................................................................................... 502.1.9.4 Display Format of Trace Data ............................................................................... 512.1.9.5 Searching Trace Data ........................................................................................... 522.1.9.6 Saving Trace Data................................................................................................. 532.1.9.7 Clearing Trace Data .............................................................................................. 54
v

2.2 Emulator Debugger (MB2197).............................................................................................. 552.2.1 Setting Operating Environment .................................................................................. 56
2.2.1.1 MCU Operation Mode ........................................................................................... 572.2.1.2 DRAM Refresh Control.......................................................................................... 582.2.1.3 Cache Flush Control.............................................................................................. 592.2.1.4 Controlling Operating Frequency .......................................................................... 60
2.2.2 Notes on Executing Program...................................................................................... 612.2.3 Command Execution while Executing Program ......................................................... 622.2.4 Break .......................................................................................................................... 63
2.2.4.1 Code Break ........................................................................................................... 642.2.4.2 Code Event Break ................................................................................................. 662.2.4.3 Data Event Break .................................................................................................. 672.2.4.4 Trace Buffer-full Break .......................................................................................... 682.2.4.5 Alignment Error Break ........................................................................................... 692.2.4.6 External Trigger Break .......................................................................................... 702.2.4.7 Forced Break......................................................................................................... 71
2.2.5 Measuring Execution Cycle Count ............................................................................. 722.2.6 Trace .......................................................................................................................... 73
2.2.6.1 Trace Data............................................................................................................. 742.2.6.2 Trace Sampling ..................................................................................................... 752.2.6.3 Setting Trace ......................................................................................................... 762.2.6.4 Displaying Trace Data ........................................................................................... 772.2.6.5 Display Format of Trace Data ............................................................................... 782.2.6.6 Searching Trace Data ........................................................................................... 792.2.6.7 Saving Trace Data................................................................................................. 802.2.6.8 Clearing Trace Data .............................................................................................. 812.2.6.9 Notes on Use of Tracing Function......................................................................... 82
2.2.7 Inaccessible Area ....................................................................................................... 842.3 Emulator Debugger (MB2198).............................................................................................. 85
2.3.1 Setting Operating Environment .................................................................................. 862.3.1.1 Monitoring Program Automatic Loading ................................................................ 872.3.1.2 MCU Operation Mode ........................................................................................... 882.3.1.3 Cache Flush Control.............................................................................................. 892.3.1.4 Controlling Operating Frequency .......................................................................... 902.3.1.5 External Memory Emulation .................................................................................. 912.3.1.6 Debug mode.......................................................................................................... 92
2.3.2 Notes on Executing Program...................................................................................... 932.3.3 Command Execution while Executing Program ......................................................... 942.3.4 Break .......................................................................................................................... 95
2.3.4.1 Code Break ........................................................................................................... 962.3.4.2 Data Break ............................................................................................................ 982.3.4.3 Code Event Break ................................................................................................. 992.3.4.4 Data Event Break ................................................................................................ 1012.3.4.5 Trace Buffer-full Break ........................................................................................ 1032.3.4.6 Alignment Error Break ......................................................................................... 1042.3.4.7 External Trigger Break ........................................................................................ 1052.3.4.8 Forced Break....................................................................................................... 1062.3.4.9 Data Monitoring Break......................................................................................... 107
2.3.5 Control by Sequencer............................................................................................... 109
vi

2.3.6 Measuring Execution Cycle Count ........................................................................... 1112.3.7 Trace ........................................................................................................................ 112
2.3.7.1 Saving Trace Data............................................................................................... 1152.3.7.2 Notes on Use of Tracing Function....................................................................... 116
2.3.8 Measuring Performance ........................................................................................... 1182.3.8.1 Performance Measurement Procedures ............................................................. 1192.3.8.2 Displaying Performance Measurement Data....................................................... 121
2.3.9 Real-time Monitoring ................................................................................................ 1222.3.10 Power-on Debugging................................................................................................ 1232.3.11 Inaccessible Area ..................................................................................................... 1242.3.12 RAM Checker ........................................................................................................... 125
2.4 Monitor Debugger ............................................................................................................... 1292.4.1 Resources Used by Monitor Program ...................................................................... 1302.4.2 Break ........................................................................................................................ 131
2.4.2.1 Software Break.................................................................................................... 1322.4.2.2 Forced Break....................................................................................................... 133
2.4.3 Measuring Execution Time....................................................................................... 1342.4.4 Inaccessible Area ..................................................................................................... 135
INDEX ................................................................................................................137
vii

viii

CHAPTER1Basic Functions
This chapter describes the basic functions on the SOFTUNE Workbench.
1.1 Workspace Management Function
1.2 Project Management Function
1.3 Project Dependence
1.4 Make/Build Function
1.5 Include Dependencies Analysis Function
1.6 Functions of Setting Tool Options
1.7 Error Jump Function
1.8 Editor Functions
1.9 Storing External Editors
1.10 Storing External Tools
1.11 Macro Descriptions Usable in Manager
1.12 Setting Operating Environment
1.13 Debugger Types
1.14 Memory Operation Functions
1.15 Register Operations
1.16 Line Assembly and Disassembly
1.17 Symbolic Debugging
1

CHAPTER1 Basic Functions
1.1 Workspace Management Function
This section explains the workspace management function of SOFTUNE Workbench.
■ Workspace SOFTUNE Workbench uses workspace as a container to manage two or more projects
including subprojects.
For example, a project that creates a library and a project that creates a target file using the
project can be stored in one workspace.
■ Workspace Management Function To manage two or more projects, workspace manages the following information:
• Project
• Active project
• Subproject
■ Project The operation performed in SOFTUNE Workbench is based on the project. The project is a set
of files and procedures necessary for creation of a target file. The project file contains all data
managed by the project.
■ Active Project The active project is basic to workspace and undergoes [Make], [Build], [Compile/Assemble],
[Start Debug], and [Include Dependencies] in the menu. [Make], [Build], [Compile/Assemble],
and [Include Dependencies] affect the subprojects within the active project.
If workspace contains some project, it always has one active project.
■ Subproject The subproject is a project on which other projects depend. The subproject target files are
linked together when creating parent project target files that have dependent relationships.
When making/building a parent project, the subproject which has a dependent relationships is
make/build first before executing the make/build for the parent project. If making and building
of the subproject is unsuccessful, the parent project of the subproject will not be made and
built.
The target file in the subproject is however not linked with the parent project when:
• An absolute (ABS)-type project is specified as a subproject.
• A library (LIB)-type project is specified as a subproject.
■ Restrictions on Storage of Two or More Projects Only one REALOS-type project can be stored in one workspace.
2
CHAPTER1 Basic Functions
1.2 Project Management Function
This section explains the project management function of SOFTUNE Workbench.
■ Project Management Function The project manages all information necessary for development of a microcontroller system.
- Project configuration
- Active project configuration
- Information on source files, include files, other object files, library files
- Information on tools executed before and after executing language tools (customize build
function)
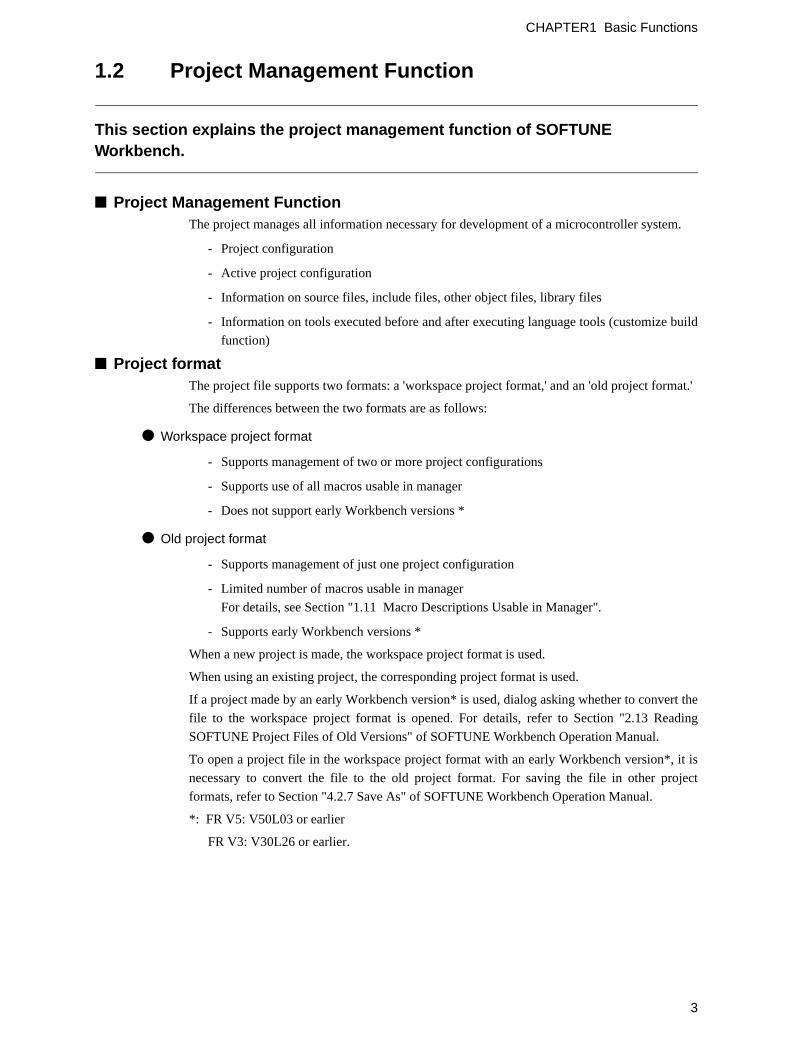
■ Project format The project file supports two formats: a 'workspace project format,' and an 'old project format.'
The differences between the two formats are as follows:
● Workspace project format
- Supports management of two or more project configurations
- Supports use of all macros usable in manager
- Does not support early Workbench versions *
● Old project format
- Supports management of just one project configuration
- Limited number of macros usable in manager
For details, see Section "1.11 Macro Descriptions Usable in Manager".
- Supports early Workbench versions *
When a new project is made, the workspace project format is used.
When using an existing project, the corresponding project format is used.
If a project made by an early Workbench version* is used, dialog asking whether to convert the
file to the workspace project format is opened. For details, refer to Section "2.13 Reading
SOFTUNE Project Files of Old Versions" of SOFTUNE Workbench Operation Manual.
To open a project file in the workspace project format with an early Workbench version*, it is
necessary to convert the file to the old project format. For saving the file in other project
formats, refer to Section "4.2.7 Save As" of SOFTUNE Workbench Operation Manual.
*: FR V5: V50L03 or earlier
FR V3: V30L26 or earlier.
3

CHAPTER1 Basic Functions
■ Project Configuration The project configuration is a series of settings for specifying the characteristics of a target file,
and making, building, compiling and assembling is performed in project configurations.
Two or more project configurations can be created in a project. The default project
configuration name is Debug. A new project configuration is created on the setting of the
selected existing project configuration. In the new project configuration, the same files as
those in the original project configuration are always used.
By using the project configuration, the settings of programs of different versions, such as the
optimization level of a compiler and MCU setting, can be created within one project.
In the project configuration, the following information is managed:
• Name and directory of target file
• Information on options of language tools to create target file by compiling, assembling and
linking source files
• Information on whether to build file or not
• Information on setting of debugger to debug target file
■ Active Project Configuration The active project configuration at default undergoes [Make], [Build], [Compile/Assemble],
[Start Debug], and [Include Dependencies].
The setting of the active project configuration is used for the file state displayed in the SRC tab
of project window and includes files detected in the [Dependencies] folder.
Note:
If a macro function newly added is used in old project format, the macro description isexpanded at the time of saving in old project format. For the macro description newlyadded, refer to Section "1.11 Macro Descriptions Usable in Manager".
4

CHAPTER1 Basic Functions
1.3 Project Dependence
This section explains the project dependence of SOFTUNE Workbench.
■ Project Dependence If target files output by other projects must be linked, a subproject is defined in the project
required in the [Project] - [Project Dependence] command. The subproject is a project on
which other projects depend.
By defining project dependence, a subproject can be made and built to link its target file before
making and building the parent project.
The use of project dependence enables simultaneous making and building of two or more
projects developed in one workspace.
A project configuration in making and building a subproject in the [Project] - [Configuration] -
[Set Build Configuration] command can be specified.
5

CHAPTER1 Basic Functions
1.4 Make/Build Function
This section explains the make/build function of SOFTUNE Workbench.
■ Make Function Make function generates a target file by compiling/assembling only updated source files from
all source files registered in a project, and then joining all required object files.
This function allows compiling/assembling only the minimum of required files. The time
required for generating a target file can be sharply reduced, especially, when debugging.
For this function to work fully, the dependence between source files and include files should be
accurately grasped. To do this, SOFTUNE Workbench has a function for analyzing include
dependence. To perform this function, it is necessary to understand the dependence of a source
file and include file. SOFTUNE Workbench has the function of analyzing include dependence.
For details, see Section "1.5 Include Dependencies Analysis Function".
■ Build Function Build function generates a target file by compiling/assembling all source files registered with a
project, regardless of whether they have been updated or not, and then by joining all required
object files. Using this function causes all files to be compiled/assembled, resulting in the time
required for generating the target file longer. Although the correct target file can be generated
from the current source files.
The execution of Build function is recommended after completing debugging at the final stage
of program development.
Note:
When executing the Make function using a source file restored from backup, the integritybetween an object file and a source file may be lost. If this happens, executing the Buildfunction again.
6

CHAPTER1 Basic Functions
1.4.1 Customize Build Function
This section describes the SOFTUNE Workbench function to set the Customize Build function.
■ Customize Build Function In SOFTUNE Workbench, different tools can be operated automatically before and after
executing the Assembler, Compiler, Linker, Librarian, Converter, or Configurator started at
Compile, Assemble, Make, or Build.
The following operations can be performed automatically during Make or Build using this
function:
• Starting the syntax check before executing the Compiler.
• After executing the Converter, starting the S-format binary Converter (m2bs.exe) and
converting Motorola S-format files to binary format files.
■ Setting Options An option follows the tool name to start a tool from SOFTUNE Workbench. The options
include any file name and tool-specific options. SOFTUNE Workbench has the macros
indicating that any file name and tool-specific options are specified as options.
If any character string other than parameters is specified, it is passed directly to the tool. For
details about the parameters, see Section "1.11 Macro Descriptions Usable in Manager".
■ Macro List The Setup Customize Build dialog provides a macro list for macro input. The build file, load
module file, project file submenus indicate their sub-parameters specified.
The environment variable brackets must have any item; otherwise, resulting in an error.
Table 1.4-1 Macro List
Macro List Macro Name
Build file %(FILE)
Load module file %(LOADMODULEFILE)
Project file %(PRJFILE)
Workspace file %(WSPFILE)
Project directory %(PRJPATH)
Target file directory %(ABSPATH)
Object file directory %(OBJPATH)
List file directory %(LSTPATH)
Project construction name %(PRJCONFIG)
Environment variable %(ENV[])
Temporary file %(TEMPFILE)
7

CHAPTER1 Basic Functions
Note:
When checking [Use the Output window], note the following:
1. Once a tool is activated, Make/Build activated until the tool is terminated.
2. The Output window must not be used with a tool using a wait state for user input whilethe tool is executing. The user can not perform input while the Output window is in use,so the tool cannot be terminated. To forcibly terminate the tool, select the tool on theTask bar and input Control - C, or Control - Z.
8

CHAPTER1 Basic Functions
1.5 Include Dependencies Analysis Function
This section describes the function of the Include Dependencies Analysis of SOFTUNE Workbench.
■ Analyzing Include Dependencies A source file usually includes some include files. When only an include file has been modified
leaving a source file unchanged, SOFTUNE Workbench cannot execute the Make function
unless it has accurate and updated information about which source file includes which include
files.
For this reason, SOFTUNE Workbench has a built-in Include Dependencies Analysis function.
This function can be activated by selecting the [Project] -[Include Dependencies] command.
By using this function, uses can know the exact dependencies, even if an include file includes
another include file.
SOFTUNE Workbench automatically updates the dependencies of the compiled/assembled
files.
Note:
When executing the [Project] - [Include Dependencies] command, the Output window isredrawn and replaced by the dependencies analysis result.
If the contents of the current screen are important (error message, etc.), save thecontents to a file and then execute the Include Dependencies command.
9

CHAPTER1 Basic Functions
1.6 Functions of Setting Tool Options
This section describes the functions to set options for the language tools activated from SOFTUNE Workbench.
■ Function of Setting Tool Options To create a desired target file, it is necessary to specify options for the language tools such as a
compiler, assembler, and linker. SOFTUNE Workbench stores and manages the options
specified for each tool in project configurations.
Tool options include the options effective for all source files (common options) and the options
effective for specific source files (individual options). For details about the option setting, refer
to Section "4.5.5 Setup Project" of SOFTUNE Workbench Operation Manual.
● Common options
These options are effective for all source files (excluding those for which individual options are
specified) stored in the project.
● Individual options
These options are compile/assemble options effective for specific source files. The common
options specified for source files for which individual options are specified become invalid.
■ Tool Options In SOFTUNE Workbench, the macros indicating that any file name and directory name are
specified as options.
If any character string other than parameters is specified, it is passed directly to the tool. For
details about the parameters, see Section "1.11 Macro Descriptions Usable in Manager". For
details about the tool options for each tool, see the manual of each tool.
10

CHAPTER1 Basic Functions
1.7 Error Jump Function
This section describes the error jump function in SOFTUNE Workbench.
■ Error Jump Function When an error, such as a compile error occurs, double-clicking the error message displayed in
the Output window, opens the source file where the error occurred, and automatically moves
the cursor to the error line. This function permits efficient removal of compile errors, etc.
The SOFTUNE Workbench Error Jump function analyzes the source file names and line
number information embedded in the error message displayed in the Output window, opens the
matching file, and jumps automatically to the line.
The location where a source file name and line number information are embedded in an error
message, varies with the tool outputting the error.
An error message format can be added to an existing one or modified into a new one.
However, the modify error message formats for pre-installed Fujitsu language tools are defined
as part of the system, these can not be modified.
A new error message format should be added when working the Error Jump function with user
registered tool. To set Error Jump, execute the [Setup] - [Error] command.
■ Syntax An error message format can be described in Syntax. SOFTUNE Workbench uses macro
descriptions as shown in the Table 1.7-1 to define such formats.
To analyze up to where %f, %h, and %* continue, SOFTUNE Workbench uses the character
immediately after the above characters as a delimiter. Therefore, in Syntax, the description
until a character that is used as a delimiter re-appears, is interpreted as a file name or a
keyword for help, or is skipped over. To use % as a delimiter, describe as %%. The [%char]
macro skips over as long as the specified character continues in parentheses. To specify "]" as a
skipped character describes it as "\]". Blank characters in succession can be specified with a
single blank character.
Table 1.7-1 Special Characters for Analyzing Error Messages
Characters Semantics
%f
%1
%h
%*
%[char]
Interpret as source file name and inform editor.
Interpret as line number and inform editor.
Become keyword when searching help file.
Skip any desired character.
Skip as long as characters in [ ] continues.
11

CHAPTER1 Basic Functions
[Example]
*** %f(%l) %h: or, %[*] %f(%l) %h:
The first four characters are "*** ", followed by the file name and parenthesized line number,
and then the keyword for help continues after one blank character.
This represents the following message:
*** C:\Sample\sample.c(100) E4062C: Syntax Error: near /int.
12

CHAPTER1 Basic Functions
1.8 Editor Functions
This section describes the functions of the SOFTUNE Workbench built-in standard editor.
■ Standard Editor SOFTUNE Workbench has a built-in editor called the standard editor. The standard editor is
activated as the Edit window in SOFTUNE Workbench. As many Edit windows as are
required can be opened at one time.
The standard editor has the following functions in addition to regular editing functions.
● Keyword marking function in C/C++/assembler source file
Displays reserved words, such as if and for, in different color.
● Error line marking function
The error line can be viewed in a different color, when executing Error Jump.
● Bookmark setup function
A bookmark can be set on any line, and instantaneously jumps to the line. Once a bookmark is
set, the line is displayed in a different color.
● Ruler, line number display function
The Ruler is a measure to find the position on a line; it is displayed at the top of the Edit
window. A line number is displayed at the left side of the Edit window.
● Automatic indent function
When a line is inserted using the Enter key, the same indent(indentation) as the preceding line
is set automatically at the inserted line. If the space or tab key is used on the preceding line,
the same use is set at the inserted line as well.
● Function to display Blank, Line Feed code, and Tab code
When a file includes a Blank, a Line Feed code, and Tab code, these codes are displayed with
special symbols.
● Undo function
This function cancels the preceding editing action to restore the previous state. When more
than one character or line is edited, the whole portion is restored.
● Tab size setup function
Tab stops can be specified by defining how many digits to skip when Tab codes are inserted.
The default is 8.
● Font changing function
The font size for character string displayed in the Edit window can be selected.
13

CHAPTER1 Basic Functions
1.9 Storing External Editors
This section describes the function to set an external editor to SOFTUNE Workbench.
■ External Editor SOFTUNE Workbench has a built-in standard editor, and use of this standard editor is
recommended. However, another accustomed editor can be used, with setting it, instead of an
edit window. There is no particular limit on which editor can be set, but some precautions
(below) may be necessary. Use the [Setup] - [Editor] command to set an external editor.
■ Precautions
● Error jump function
The Error Jump cannot move the cursor to an error line if the external editor does not have a
function to specify the cursor location when activated.
● File save at compiling/assembling
SOFTUNE Workbench cannot control an external editor. Always save the file you are editing
before compiling/assembling.
■ Setting Options When activating an external editor from SOFTUNE Workbench, options must be added
immediately after the editor name. The names of file to be opened by the editor and the initial
location of the cursor (the line number) can be specified. SOFTUNE Workbench has a set of
special parameters for specifying any file name and line number, as shown in the Table 1.9-1 .
If any other character string are described by these parameters, such character string are passed
as is to the editor.
%f (File name) is determined as follows:
1. If the focus is on the SRC tab of Project window, and if a valid file name is selected, the
selected file name becomes the file name.
2. When a valid file name cannot be acquired by the above procedure, the file name with a
focus in the built-in editor becomes the file name.
%x (project path) is determined as follows:
1. If a focus is on the SRC tab of project window and a valid file name is selected, the
project path is a path to the project in which the file is stored.
2. If no path is obtained, the project path is a path to the active project.
The specification method of the file name containing a space is different by editors. For details, refer
to the Editor Manual.
Ex.) MIFES "%f + %l"
WZ Editor "%f" /j%l
14
CHAPTER1 Basic Functions
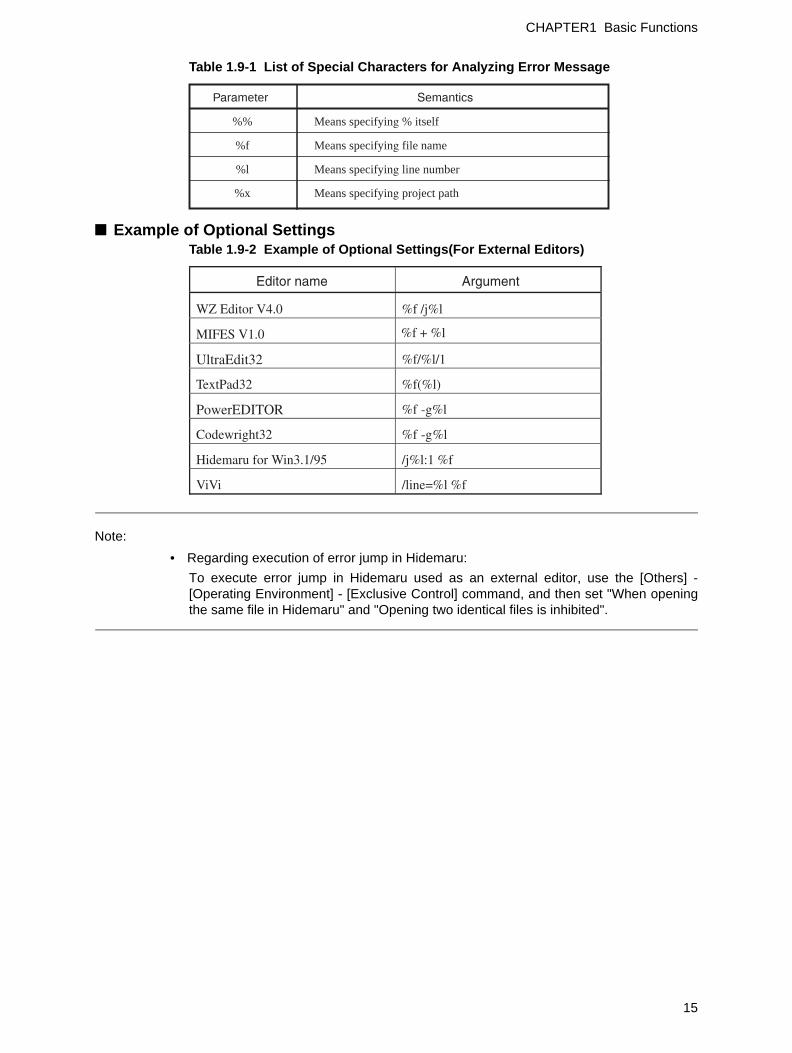
Table 1.9-1 List of Special Characters for Analyzing Error Message
■ Example of Optional Settings Table 1.9-2 Example of Optional Settings(For External Editors)
Note:
• Regarding execution of error jump in Hidemaru:
To execute error jump in Hidemaru used as an external editor, use the [Others] -[Operating Environment] - [Exclusive Control] command, and then set "When openingthe same file in Hidemaru" and "Opening two identical files is inhibited".
Parameter Semantics
%% Means specifying % itself
%f Means specifying file name
%l Means specifying line number
%x Means specifying project path
Editor name Argument
WZ Editor V4.0 %f /j%l
MIFES V1.0
UltraEdit32 %f/%l/1
TextPad32 %f(%l)
PowerEDITOR %f -g%l
Codewright32 %f -g%l
Hidemaru for Win3.1/95 /j%l:1 %f
ViVi /line=%l %f
%f + %l
15
CHAPTER1 Basic Functions
1.10 Storing External Tools
This section describes the SOFTUNE Workbench function to set an external tool.
■ External Tools A non-standard tool not attached to SOFTUNE Workbench can be used by setting it as an
external tool and by calling it from SOFTUNE Workbench. Use this function to coordinate
with a source file version management tool.
If a tool set as an external tool is designed to output the execution result to the standard output
and the standard error output through the console application, the result can be specified to the
SOFTUNE Workbench Output window. In addition, the allow description of additional
parameters each time the tool is activated.
To set an external tool, use the [Setup] - [Tool] command.
To select the title of a set tool, use the [Setup] - [Tool execution] command.
■ Setting Options When activating an external tool from SOFTUNE Workbench, options must be added
immediately after the tool name. Specify the file names, and unique options, etc.
SOFTUNE Workbench has a set of special parameters for specifying any file name and unique
tool options.
If any characters described other than these parameters, such characters are passed as it is to
the external tool.
For details about the parameters, see Section "1.11 Macro Descriptions Usable in Manager".
Note:
When checking [Use the Output window], note the following:
1. Once a tool is activated, neither other tools nor the compiler/assembler can beactivated until the tool is terminated.
2. The Output window must not be used with a tool using a wait state for user input whilethe tool is executing. The user can not perform input while the Output window is in use,so the tool cannot be terminated. To forcibly terminate the tool, select the tool on theTask bar and input Control - C, or Control - Z.
16

CHAPTER1 Basic Functions
1.11 Macro Descriptions Usable in Manager
This section explains the macro descriptions that can be used in the manager of SOFTUNE Workbench.
■ Macros SOFTUNE Workbench has special parameters indicating that any file name and tool-specific
options are specified as options.
The use of these parameters as tool options eliminates the need for options specified each time
each tool is started.
The type of macro that can be specified and macro expansion slightly vary depending on where
to describe macros. The macros usable for each function are detailed below. For the macros
that can be specified for "Error Jump" and "External Editors," see Sections "1.7 Error Jump
Function" and "1.9 Storing External Editors".
■ Macro List The following is a list of macros that can be specified in SOFTUNE Workbench.
The macros usable for each function are listed below.
• External tools: Table 1.11-1 and Table 1.11-2
• Customize build: Table 1.11-1 and Table 1.11-2
• Tool options: Table 1.11-2
The directory symbol \ is added to the option directories in Table 1.11-1 but not to the macro
directories in Table 1.11-2 .
The sub-parameters in Table 1.11-3 can be specified in %(FILE), %(LOADMODULEFILE),
%(PRJFILE) and %(WSPFILE).
The sub-parameter is specified in the form of %(PRJFILE[PATH]).
If the current directory is on the same drive, the relative path is used. The current directory is
the workspace directory for %(PRJFILE), and %(WSPFILE), and the project directory for
other than them.
Table 1.11-1 List of macros that can be specified 1
Parameter Meaning
Passed as full-path name of file. (*1)
Passed as main file name of file. (*1)
Passed as directory of file. (*1)
Passed as extension of file. (*1)
Passed as full-path name of load module file.
Passed as main file name of load module file. (*2)
Passed as directory of load module file. (*2)
Passed as extension of load module file. (*2)
Passed as directory of project file. (*2)
Passed as main file name of project file. (*2)
Passed as %.
%f
%F
%d
%e
%a
%A
%D
%E
%x
%X
%%
17
CHAPTER1 Basic Functions
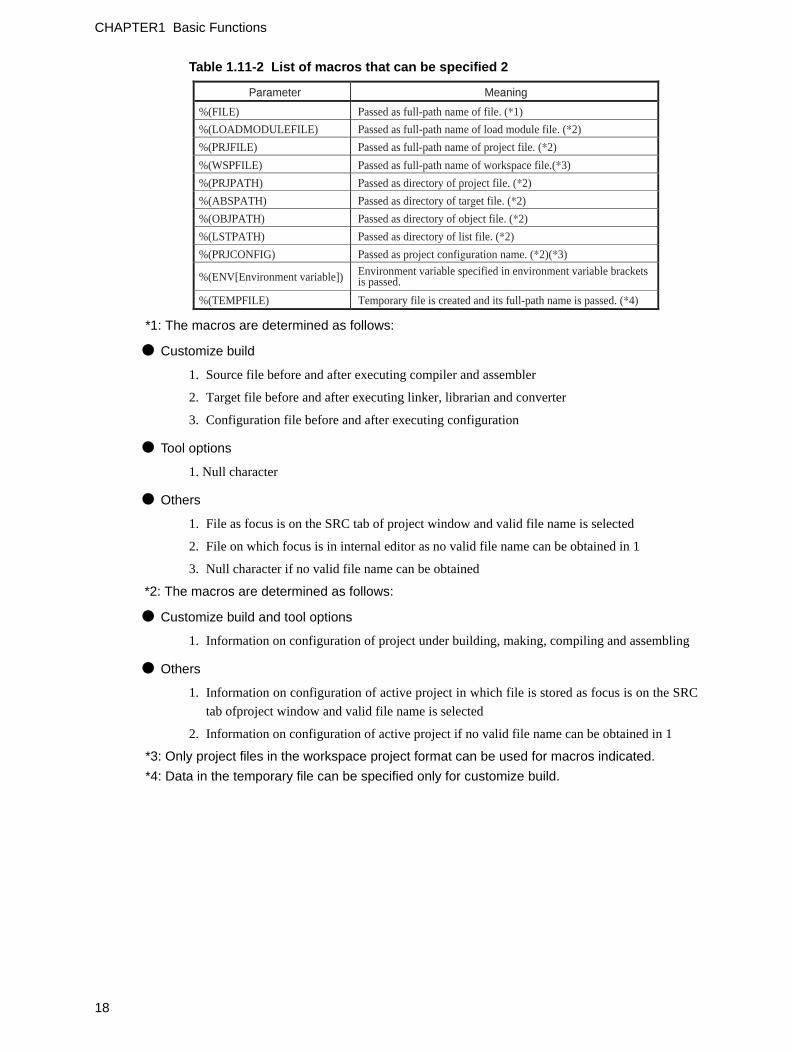
Table 1.11-2 List of macros that can be specified 2
*1: The macros are determined as follows:
● Customize build
1. Source file before and after executing compiler and assembler
2. Target file before and after executing linker, librarian and converter
3. Configuration file before and after executing configuration
● Tool options
1. Null character
● Others
1. File as focus is on the SRC tab of project window and valid file name is selected
2. File on which focus is in internal editor as no valid file name can be obtained in 1
3. Null character if no valid file name can be obtained
*2: The macros are determined as follows:
● Customize build and tool options
1. Information on configuration of project under building, making, compiling and assembling
● Others
1. Information on configuration of active project in which file is stored as focus is on the SRC
tab ofproject window and valid file name is selected
2. Information on configuration of active project if no valid file name can be obtained in 1
*3: Only project files in the workspace project format can be used for macros indicated.
*4: Data in the temporary file can be specified only for customize build.
Parameter Meaning
%(FILE) Passed as full-path name of file. (*1)
%(LOADMODULEFILE) Passed as full-path name of load module file. (*2)
%(PRJFILE) Passed as full-path name of project file. (*2)
%(WSPFILE) Passed as full-path name of workspace file.(*3)
%(PRJPATH) Passed as directory of project file. (*2)
%(ABSPATH) Passed as directory of target file. (*2)
%(OBJPATH) Passed as directory of object file. (*2)
%(LSTPATH) Passed as directory of list file. (*2)
%(PRJCONFIG) Passed as project configuration name. (*2)(*3)
%(ENV[Environment variable]) Environment variable specified in environment variable brackets is passed.
%(TEMPFILE) Temporary file is created and its full-path name is passed. (*4)
18

CHAPTER1 Basic Functions
Table 1.11-3 Lists of Sub parameters 1
*: The macro can be used only in workspace-compatible Workbench. It is not expanded in
workspace-incompatible Workbench.
Sub parameter Meaning
[PATH] Directory of file
[RELPATH] Directory of file
[NAME] Main file name of file
[EXT] Extension of file
[SHORTFULLNAME] Full path name of short file
[SHORTPATH] Directory of short file
[SHORTNAME] Main file name of short file
[FOLDER] Name of folder in which files are stored in the SRC tab of project window (Can be specified only in %(FILE).) (*)
19

CHAPTER1 Basic Functions
■ Examples of Macro Expansion If the following workspace is opened, macro expansion is performed as follows:
Workspace: C: /Wsp /Wsp.wsp
Active project: C: /Wsp /Sample /Sample.prj
Active project configuration - Debug
Object directory: C:/Wsp /Sample /Debug /Obj /
Subproject: C: /Subprj /Subprj.prj
Active project configuration – Release
Object directory: C: /Subprj /Rel ease /Obj /
Target file: C: /Subprj /Release /Abs /Subprj.abs
[Example] Macro expansion in external tools
Focus is on Subprj project in the SRC tab of project window. %a : C:/Subprj /Release /Abs /Subprj.abs %A : SUBPRJ.abs %D : C:/Subprj /Release /Abs / %E : .abs %(FILE[F OLDER]) : Source Files /Common
%(PRJFILE) : C:Subprj /Subprj.prj
Focus is not in the SRC tab of project window. %a : C:/Wsp/Sample/Debug/ Abs /Sample .abs %A : Sample .abs %D : C:/Wsp/Sample/Debug/ Abs /
%(PRJFILE) : C:/Wsp /Sample /Sample.prj
[Example] Macro expansion i n customize build
Release configuration of Subprj project is built. %(FILE) : C:/Subprj /LongNameFile.c %(FILE[PATH]) : C:/Subprj %(FILE[RELPATH]) : . %(FILE[NAME]) : LongNameFile %(FILE[EXT]) : .c %(FILE[SHORTFULLNAME]) : C:/Subprj /LongFi~1.c %(FILE[S HORTPATH]) : C:/Subprj %(FILE[SHORTNAME]) : LongFi~1 %(PRJFILE[RELPATH]) : ../Subprj %(PRJPATH) : C:/Subprj %(OBJPATH) : C:/Subprj /Release /Obj %(PRJCONFIG) : Relase %(ENV[FETOOL]) : C:/Softune %(TEMPFILE) : C:/Subprj /Relase /Opt /_fs1056.TMP
[Example] Macro expansion in tool options
Release configuration of Subprj project is build. %(FILE) : %(PRJFILE[RELPATH]) : ../Subprj %(PRJPATH) : C:/Subprj %(OBJPATH) : C:/Subprj /Release /Obj %(PRJCONFIG) : Relase %(ENV[FETOOL]) : C:/Softune
20

CHAPTER1 Basic Functions
1.12 Setting Operating Environment
This section describes the functions for setting the SOFTUNE Workbench operating environment.
■ Operating Environment Set the environment variables for SOFTUNE Workbench and some basic items for the
workspace.
To set the operating environment, use the [Setup]-[Development] command.
● Environment Variables
Environment variables are variables that are referred to mainly using the language tools
activated from SOFTUNE Workbench. The semantics of an environment variable are
displayed in the lower part of the Setup dialog. However, the semantics are not displayed for
environment variables used by tools added later to SOFTUNE Workbench.
When SOFTUNE Workbench and the language tools are installed in a same directory, it is not
especially necessary to change the environment variable setups.
● Basic setups for workspace
The following setups are possible.
• Open the previous workspace at start up
- When starting SOFTUNE Workbench, it automatically opens the last opened workspace.
• Display options while compiling/assembling
- Compile options or assemble options can be viewed in the Output window.
• Save dialog before closing workspace
- Before closing the workspace, a dialog asking for confirmation of whether or not to save
the workspace to the file is displayed. If this setting is not made, SOFTUNE Workbench
automatically saves the Project without any confirmation message.
• Save dialog before compiling/assembling
- Before compiling/assembling, a dialog asking for confirmation of whether or not to save
a source file that has not been saved is displayed. If this setting is not made, the file is
saved automatically before compile/assemble/make/build.
• Termination message is highlighted at Make/Build
- At Compile, Assemble, Make, or Build, the display color of termination messages
(Abort, No Error, Warning, Error, Fatal error, or Failing During start) can be changed
freely by the user.
Note:
Because the environment variables set here are language tools for the SOFTUNEWorkbench, the environment variables set on previous versions of SOFTUNE cannot beused. In particular, add the set values of [User Include Directory] and [Library SearchDirectory] to [Tool Options Settings].
21

CHAPTER1 Basic Functions
1.13 Debugger Types
This section describes the types of SOFTUNE Workbench debuggers.
■ Type of debugger SOFTUNE Workbench integrates three types of debugger: a simulator debugger, emulator
debugger, and monitor debugger. Any one can be selected depending on the requirement.
■ Simulator Debugger The simulator debugger simulates the MCU operations (executing instructions, memory space,
I/O ports, interrupts, reset, etc.) with software to evaluate a program.
It is used for evaluating an uncompleted system and operation of individual units, etc.
■ Emulator Debugger The emulator debugger is software to evaluate a program by controlling an Emulator from a
host through a communications line (RS-232C, LAN, USB).
Before using this debugger, the emulator must be initialized.
■ Monitor Debugger The monitor debugger evaluates a program by putting it into an evaluation system and by
communicating with a host. An RS-232C interface and an area for the debug program are
required within the evaluation system.
For further information on the MCU-related items, see Chapter 2 and later in this manual.
22

CHAPTER1 Basic Functions
1.14 Memory Operation Functions
This section describes the memory operation functions.
■ Functions for Memory Operations
● Display/Modify memory data
Memory data can be display in the Memory window and modified.
● Fill
The specified memory area can be filled with the specified data.
● Copy
The data in the specified memory area can be copied to another area.
● Compare
The data in the specified source area can be compared with data in the destination area.
● Search
Data in the specified memory area can be searched.
For further details of the above functions, refer to "3.11 Memory Window" in SOFTUNEWorkbench Operation Manual.
● Display/Modify C/C++ variables
The names of variables in a C/C++ source file can be displayed in the Watch window and
modified.
● Setting Watch point
By setting a watch point at a specific address, its data can be displayed in the Watch window.
For further details of the above functions, refer to "3.13 Watch Window" in SOFTUNEWorkbench Operation Manual.
23

CHAPTER1 Basic Functions
1.15 Register Operations
This section describes the register operations.
■ Register Operations The Register window is opened when the [View] - [Register] command is executed. The
register and flag values can be displayed in the Register window.
For further details about modifying the register value and the flag value, refer to "4.4.4
Register" in SOFTUNE Workbench Operation Manual.
The name of the register and flag displayed in the register window varies depending on each
MCU in use. For the list of register names and flag names for the MCU in use, refer to
Appendix A in SOFTUNE Workbench Operation Manual.
24

CHAPTER1 Basic Functions
1.16 Line Assembly and Disassembly
This section describes line assembly and disassembly.
■ Line Assembly To perform line-by-line assembly (line assembly), right-click anywhere in the Disassembly
window to display the short-cut menu, and select [Inline Assembly]. For further details about
assembly operation, refer to "4.4.3 Assembly" in SOFTUNE Workbench Operation Manual.
■ Disassembly To display disassembly, use the [View] - [Assembly] command. By default, disassembly can
be viewed starting from the address pointed by the current program counter (PC). However,
the address can be changed to any desired address at start-up.
Disassembly for an address outside the memory map range cannot be displayed. If this is
attempted, "???" is displayed as the mnemonic.
25

CHAPTER1 Basic Functions
1.17 Symbolic Debugging
The symbols defined in a source program can be used for command parameters (address). There are three types of symbols as follows:• Global Symbol• Static Symbol within Module (Local Symbol within Module)• Local Symbol within Function
■ Types of Symbols A symbol means the symbol defined while a program is created, and it usually has a type.
Symbols become usable by loading the debug information file.
There are three types of symbols as follows:
● Global symbol
A global symbol can be referred to from anywhere within a program. In C/C++, variables and
functions defined outside a function without a static declaration are in this category. In
assembler, symbols with a PUBLIC declaration are in this category.
● Static symbol within module (Local symbol within module)
A static symbol can be referred to only within the module where the symbol is defined.
In C/C++, variables and functions defined outside a function with a static declaration are in this
category. In assembler, symbols without a PUBLIC declaration are in this category.
● Local symbol within function
A local symbol within a function exists only in C/C++. A static symbol within a function and
an automatic variable are in this category.
• Static symbol within function
- Out of the variables defined in function, those with static declaration.
• Automatic variable
- Out of the variables defined in function, those without static declaration and parameters
for the function.
■ Setting Symbol Information Symbol information in the file is set with the symbol information table by loading a debug
information file. This symbol information is created for each module.
The module is constructed for each source file to be compiled in C/C++, in assembler for each
source file to be assembled.
The debugger automatically selects the symbol information for the module to which the PC
belongs to at abortion of execution (Called "the current module"). A program in C/C++ also
has information about which function the PC belongs to.
26

CHAPTER1 Basic Functions
■ Line Number Information Line number information is set with the line number information table in SOFTUNE
Workbench when a debug information file is loaded. Once registered, such information can be
used at anytime thereafter. Line number is defined as follows:
[Source File Name] $Line Number
27

CHAPTER1 Basic Functions
1.17.1 Referring to Local Symbols
This section describes referring to local symbols and Scope.
■ Scope When a local symbol is referred to, Scope is used to indicate the module and function to which
the local symbol to be referred belongs.
SOFTUNE Workbench automatically scopes the current module and function to refer to local
symbols in the current module with preference. This is called the Auto-scope function, and
the module and function currently being scoped are called the Current Scope.
When specifying a local variable outside the Current Scope, the variable name should be
preceded by the module and function to which the variable belongs. This method of specifying
a variable is called a symbol path name or a Search Scope.
■ Moving Scope As explained earlier, there are two ways to specify the reference to a variable: by adding a
Search Scope when specifying the variable name, and by moving the Current Scope to the
function with the symbol to be referred to. The Current Scope can be changed by displaying
the Call Stack dialog and selecting the parent function. For further details of this operation,
refer to "4.6.7 Stack" in SOFTUNE Workbench Operation Manual. Changing the Current
Scope as described above does not affect the value of the PC.
By moving the current scope in this way, you can search a local symbol in parent function with
precedence.
■ Specifying Symbol and Search Procedure A symbol is specified as follows:
C++ symbol can be specified as follows with the scope operator:
When a symbol is specified using the module and function names, the symbol is searched.
However, when only the symbol name is specified, the search is made as follows:
1. Local symbols in function in Current Scope
2. The class member which can access with the this pointer (when C++)
3. Static symbols within module in Current Scope
4. Global symbols
If a global symbol has the same name as a local symbol in the Current Scope, specify "\" or "::"
at the start of global symbol. By doing so, you can explicitly show that is a global symbol.
An automatic variable can be referred to only when the variable is in memory. Otherwise,
specifying an automatic variable causes an error.
[ [Module Name] [\Function Name] \] Symbol Name
[ [Class Name::] [Function Name] \] Symbol Name
28
CHAPTER1 Basic Functions
1.17.2 Referring to C/C++ Variables
C/C++ variables can be specified using the same descriptions as in the source program written in C/C++.
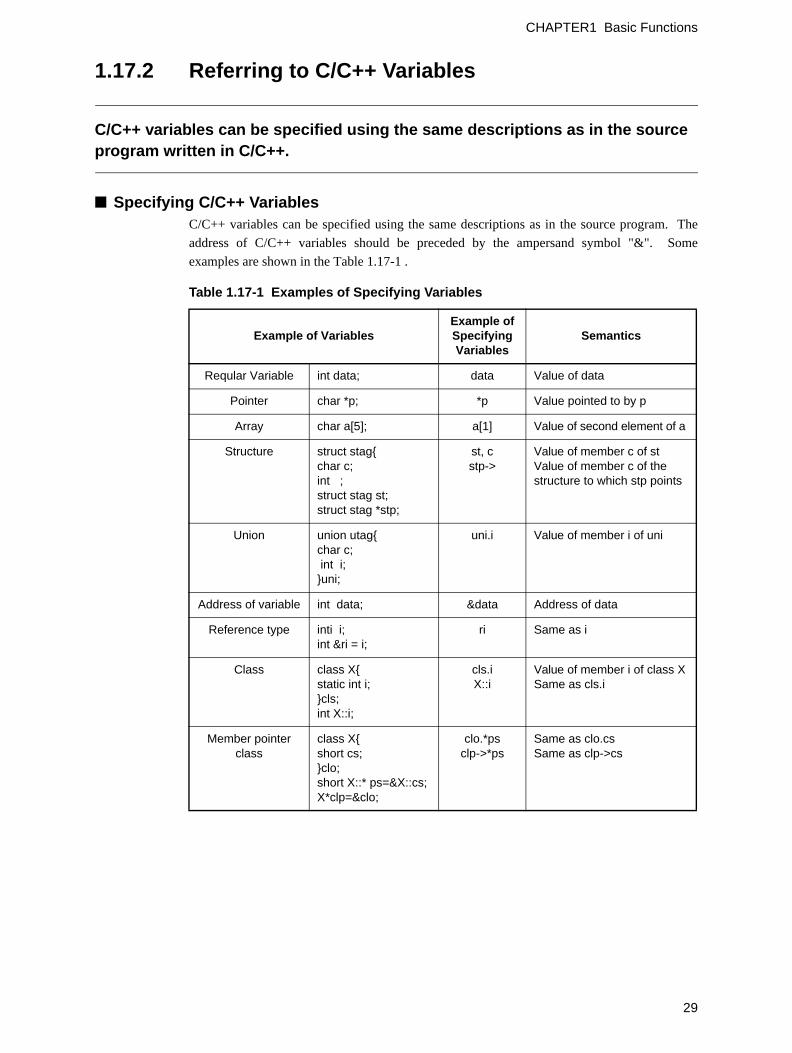
■ Specifying C/C++ Variables C/C++ variables can be specified using the same descriptions as in the source program. The
address of C/C++ variables should be preceded by the ampersand symbol "&". Some
examples are shown in the Table 1.17-1 .
Table 1.17-1 Examples of Specifying Variables
Example of VariablesExample ofSpecifyingVariables
Semantics
Reqular Variable int data; data Value of data
Pointer char *p; *p Value pointed to by p
Array char a[5]; a[1] Value of second element of a
Structure struct stag{char c;int ;struct stag st;struct stag *stp;
st, cstp->
Value of member c of stValue of member c of thestructure to which stp points
Union union utag{char c; int i;}uni;
uni.i Value of member i of uni
Address of variable int data; &data Address of data
Reference type inti i;int &ri = i;
ri Same as i
Class class X{static int i;}cls;int X::i;
cls.iX::i
Value of member i of class XSame as cls.i
Member pointer class
class X{short cs;}clo;short X::* ps=&X::cs; X*clp=&clo;
clo.*psclp->*ps
Same as clo.csSame as clp->cs
29

CHAPTER1 Basic Functions
■ Notes on C/C++ Symbols The C/C++ compiler outputs symbol information with "_" prefixed to global symbols. For
example, the symbol main outputs symbol information _main. However, SOFTUNE
Workbench permits access using the symbol name described in the source to make program
debugging described in C/C++ easier.
Consequently, a symbol name described in C/C++ and a symbol name described in assembler,
which should both be unique, may be identical.
In such a case, the symbol name in the Current Scope normally is preferred. To refer to a
symbol name outside the Current Scope, specify the symbol with the module name.
If there are duplicated symbols outside the Current Scope, the symbol name searched first
becomes valid. To refer to another one, specify the symbol with the module name.
30
CHAPTER2Dependence Functions
This chapter describes the functions dependent on each Debugger
2.1 Simulator Debugger
2.2 Emulator Debugger (MB2197)
2.3 Emulator Debugger (MB2198)
2.4 Monitor Debugger
31

CHAPTER2 Dependence Functions
2.1 Simulator Debugger
This section describes the functions of the simulator debugger.
■ Simulator Debugger The simulator debugger simulates the MCU operations (executing instructions, memory space,
I/O ports, interrupts, reset, etc.) with software to evaluate a program.
It is used to evaluate an uncompleted system, the operation of single units, etc.
There are 2 types of simulator debuggers.
• Normal simulator debugger (normal)
• High-speed simulator debugger (fast)
This high-speed simulator provides substantial reductions in simulation time due to a dramatic
review of normal simulator’s processing methods.
This can be instruction processing performance for 10MIPS when it is operated by PC
equipped with Pentium4 2.0GHz.
External I/F for simulator are equipped to high-speed simulator debugger to create peripheral
simulation modules.
Please refer to an "Appendix G" for external I/F for simulator.
■ Operating ConditionsThe high-speed simulator debugger requires much more RAM space on the host PC than that
of normal simulator debugger.
The required RAM size depends largely on your program size.
For the required available RAM space, see the table below:
Insufficient RAM space will lead to an extreme decrease in simulation speed.
Basic use Fs911s.exe 20MB
CODE size of target program per 64 KB 6MB
DATA size of target program per 64 KB 1.5MB
32

CHAPTER2 Dependence Functions
Target program size
CODE XX(KB)
DATA YY(KB)
Required RAM space (MB) = 20 + (XX / 64) * 6 + (YY / 64) * 1.5
However, RAM space larger than the above may be needed depending on program allocation.
Allocate memory space consecutive areas should be reserved as much as possible.
Example: Program with 1 MB of CODE and DATA sizes
Required RAM space (MB) = 20 + (1024 / 64) * 6 + (1024 / 64) * 1 / 5 = 140MB
■ Simulation Range The simulator debugger simulates the MCU operations (instruction operations, memory space,
interrupts, reset, low power-save mode, etc.) Peripheral I/Os, such as a timer, DMAC and serial
I/O, other than the CPU core of the actual chip are not supported as peripheral resources. I/O
space to which peripheral I/Os are connected is treated as memory space. There is a method for
simulating interrupts like timer interrupts, and data input to memory like I/O ports. For details,
see the sections concerning I/O port simulation and interrupt simulation.
• Instruction simulation
• Memory simulation
• I/O port simulation (Input port)
• I/O port simulation (Output port)
• Interrupt simulation
• Reset simulation
• Power-Save consumption mode simulation
33

CHAPTER2 Dependence Functions
2.1.1 Instruction Simulation
This section describes the instruction simulation executed.
■ Instruction Simulation This simulates the operations of all instructions supported by the FR Family. It also simulates
the changes in memory and register values due to such instructions.
34

CHAPTER2 Dependence Functions
2.1.2 Memory Simulation
This section describes the memory simulation executed.
■ Memory Simulation The simulator debugger must first secure memory space to simulate instructions because it
simulates the memory space secured in the host machine memory.
• To secure the memory area, either use the [Setup] - [Memory Map] command, or the SET
MAP command in the Command window.
• Load the file output by the Linkage Editor (Load Module File) using either the [Debug] -
[Load target file] command, or the LOAD/OBJECT command in the Command window.
■ Simulation Memory Space Memory space access attributes can be specified byte-by-byte using the [Setup] - [Memory
Map] command. The access attribute of unspecified memory space is Undefined.
■ Memory Area Access Attributes Access attributes for memory area can be specified as shown in Table 2.1-1 . A guarded access
break occurs if access is attempted against such access attribute while executing a program.
When access is made by a program command, such access is allowed regardless of the
attribute, CODE, READ or WRITE. However, access to memory in an undefined area causes
an error.
Table 2.1-1 Types of Access Attributes
Attribute Semantics
CODE Instruction operation enabled
READ Data read enabled
WRITE Data write enabled
undefined Attribute undefined (access prohibited)
35

CHAPTER2 Dependence Functions
2.1.3 I/O Port Simulation
This section describes I/O port simulation executed.
■ I/O Port Simulation (Input Port) There are two types of simulations in I/O port simulation: input port simulation, and output
port simulation. Input port simulation has the following types:
• Whenever a program reads the specified port, data is input from the pre-defined data input
source.
• Whenever the instruction execution cycle count exceeds the specified cycle count, data is
input to the port.
To set an input port, use the [Setup] - [Debug Environment] - [I/O Port] command, or the SET
INPORT command in the Command window.
Up to 4096 port addresses can be specified for the input port. The data input source can be a
file or a terminal. After reading the last data from the file, the data is read again from the
beginning of the file. If a terminal is specified, the input terminal is displayed at read access to
the set port.
A text file created by an ordinary text editor, or a binary file containing direct code can be used
as the data input file. When using a text file, input the input data inside commas (,). When
using a binary file, select the binary button in the input port dialog.
■ I/O Port Simulation (Output Port) At output port simulation, whenever a program writes data to the specified port, writing is
executed to the data output destination.
To set an output port, either use the [Setup] - [Debug Environment] - [I/O Port] command, or
the SET OUTPORT command in the Command window.
Up to 4096 port addresses can be set as output ports. Select either a file or terminal (Output
Terminal window) as the data output destination.
A destination file must be either a text file that can be referred to by regular editors, or a binary
file. To output a binary file, select the Binary radio button in the Output Port dialog.
Note:
The following method is not supported by high-speed simulator debugger.
• Whenever the instruction execution cycle count exceeds the specified cycle count,data is input to the port.
Furthermore the setting of memory map is necessary to set I/O port. When deletingmemory map, I/O port is also deleted.
36

CHAPTER2 Dependence Functions
2.1.4 Interrupt Simulation
This section describes interrupt simulation executed.
■ Interrupt Simulation This simulates the MCU operation for an interrupt request. The following types can be used to
allow an interrupt to occur.
• When the instruction is executed as many cycles as the specified cycle count while
executing a program (executing execution commands), generate an interrupt corresponding
to the specified interrupt number to reset the interrupt generating condition.
• Whenever the instruction executing cycle count exceeds the specified cycle, an interrupt
continues to be generated
The type of interrupt can be set using either the [Setup] - [Debug Environment] - [Interrupt]
command, or the SET INTERRUPT command in the Command window. If an interrupt is
masked by an interrupt-enabled flag when the interrupt generating condition is met, the
interrupt is generated after resetting the mask. When an interrupt is generated while executing
a program, an interrupt cause number is displayed on the Status Bar.
Furthermore, the simulator supports the MCU operation for interrupt requests for the following
exception processing.
• Executing undefined instruction
Note:
When an external interrupt is generated while under an interrupt mask at high-speedsimulator debugger, that interrupt factor is eliminated.
37

CHAPTER2 Dependence Functions
2.1.5 Reset Simulation
This section describes the reset simulation executed.
■ Reset Simulation The simulator debugger simulates the MCU operation when a reset signal is input to the MCU
by using either the [Debug] - [Reset of MCU] command, or the RESET command in the
Command window. This initializes registers.
38

CHAPTER2 Dependence Functions
2.1.6 Power-Save Consumption Mode Simulation
This section describes the low power-save mode simulation executed.
■ Power-Save Consumption Mode Simulation The MCU enters the power-save consumption mode in accordance with the MCU instruction
operation (Write to SLEEP bit or STOP bit of standby control register). Once in the sleep
mode or stop mode, a message ("sleep" for sleep mode, "stop" for stop mode) is displayed on
the Status Bar. The loop keeps running until either an interrupt request is generated, or the
[Debug] - [Abort] command is executed. Each cycle of the loop increments the count by 1.
During this period, I/O port processing can be operated. Writing to the standby control register
using a command is not prohibited.
39

CHAPTER2 Dependence Functions
2.1.7 Break
This Simulator Debugger provides five types of break functions. When by each break function aborts program execution, the address where a break occurred and the break factor are displayed.
■ Break Functions This Simulator Debugger provided the following five types of break functions;
- Code break
- Data break
- Trace buffer-full break
- Guarded access break
- Forced break
40
CHAPTER2 Dependence Functions
2.1.7.1 Code Break
This function causes a break by monitoring a specified address by software.A break occurs before executing an instruction at the specified address.
■ Code Break When the program reaches a break point (immediately before executing the instruction at the
memory location), the simulator debugger executes the following processes:
1. Suspend program execution (before executing instruction).
2. Checks count of arrival time. If the count of arrival time at the specified break point has not
yet been reached, the simulator resumes the program execution. If the count of arrival time
has been reached, the simulator proceeds to step 3.
3. Displays memory location where execution suspended on Status Bar.
Up to 65535 break points can be set.
When the code break occurs, the following message appears at the status bar.
Break at address by breakpoint
■ How to set Set code break as follows.
• Command
- SET BREAK
Refer to "SET BREAK" in SOFTUNE Workbench Command Reference.
• Dialog
"Code" tab in breakpoint setting dialog
Refer to "Break" in SOFTUNE Workbench Operation Manual.
• Window
Source window/disassemble window
Note:
In order to set breakpoints, it is required to set memory map to high-speed simulatordebugger.
When the memory map defined area is changed to an undefined attribute, thebreakpoints are cancelled.
41

CHAPTER2 Dependence Functions
2.1.7.2 Data Break
This function aborts the program execution when a data access (read/write) is made to a specified address.
■ Data Break When data is written or read to a data break point, the simulator debugger executes the
following processes:
1. Suspend program execution after completing instruction execution
2. Checks access count. If the access count has not yet been reached the count for the specified
data break point, the simulator resumes the program execution. If the count has been
reached, the simulator proceeds to step 3.
3. If program execution is suspended by reaching access count, on Status Bar, displays
memory location of data break point and of instruction writing to it.
4. Displays memory location executed next.
Up to 65535 data break points can be set.
When the data break occurs, the following message appears at the status bar.
Break at address by databreak at access address
■ How to set Set the data break as follows.
• Command
- SET DATABREAK
Refer to "SET DATABREAK" in SOFTUNE Workbench Command Reference.
• Dialog
Data tab in breakpoint setting dialog
Refer to "Break" in SOFTUNE Workbench Operation Manual.
Note:
There are two points to note when using data break points as follows:
• If an automatic variable within a C/C++ function is specified, a data break is set at theaddress where the automatic variable is held. Therefore, the data break remains valideven after the specified automatic variable becomes invalid (after exiting function),causing a break due to unexpected access.
• To allow access to a variable in C/C++ to cause a break, specify the variable addressby putting an ampersand symbol "&" immediately before the variable symbol.
• It is required to set memory map in order to set breakpoint for high-speed simulatordebugger.Once memory map is deleted, setup of breakpoint will also be deleted.
42

CHAPTER2 Dependence Functions
2.1.7.3 Trace Buffer-full Break
This function aborts the program execution when the trace buffer becomes full.
■ Trace Buffer-full Break This function aborts the program execution when the trace buffer becomes full.
When the trace buffer-full break occurs, the following message appears at the status bar.
Break at address by trace buffer full
■ How to set Set the trace buffer-full break as follows.
• Command
- SET TRACE/BREAK
Refer to "SET TRACE" in SOFTUNE Workbench Command Reference.
• Dialog
Trace setting dialog
Refer to "Trace" in SOFTUNE Workbench Operation Manual.
43

CHAPTER2 Dependence Functions
2.1.7.4 Guarded Access Break
A guarded access break suspends a executing program when accessing in violation of the access attribute set by using the [Setup]-[Memory Map] command, and accessing a guarded area (access-disabled area in undefined area).
■ Guarded Access Breaks A guarded access break suspends a executing program when accessing in violation of the
access attribute set by using the [Setup]-[Memory Map] command, and accessing a guarded
area (access-disabled area in undefined area).
Guarded access breaks are as follows:
1. Code Guarded
An instruction has been executed for an area having no code attribute.
2. Read Guarded
A read has been attempted from the area having no read attribute.
3. Write Guarded
A write has been attempted to an area having no write attribute.
If a guarded access occurs while executing a program, the following message is displayed on
the Status Bar and the program execution suspended.
Break at Address by guarded access {code/read/write} at Access Address
44

CHAPTER2 Dependence Functions
2.1.7.5 Forced Break
This function forcibly aborts the program execution to generate a break.
■ Forced Break This function forcibly aborts the program execution to generate a break.
When the forced break occurred, the following message appears at the status bar.
Break at address by command abort request
■ Caution The forced break cannot be generated when the MCU in the low power consumption mode or
in the hold state. If the MCU is in the low power consumption mode or in the hold state when
the strong break is requested by the [Debug]-[Abort] command during the program execution,
the [Debug] - [Abort] command is ignored. To generate a break forcibly, use the [Debug] -
[Abort] command to remove a factor by the user system or use the [Debug]-[Reset of MCU]
command to remove it. If the MCU enters the low power consumption mode or the hold state
during the program execution, the condition is displayed at the status bar.
45
CHAPTER2 Dependence Functions
2.1.8 Measuring Execution Cycle Count
This function measures the program execution cycle count and step count.
■ The measuring item Measures program execution cycle count and step counts.
1. Execution Cycle Count
The count of the instruction execution cycle is calculated based on the basic cycle count of
each instruction described in the Programming Manual.
Because no simulation was done on pipeline process or cache operation inside the chip, it may
differ from an actual chip for normal simulator debugger and/or high-speed simulator
debugger. A compensation value (a, b, c, d) , which is described in the list of an instruction in
Programming Manual, is calculated as 1.
2. Execution Step Count
Measures program execution step counts.
The measurement result can be displayed as two step counts values: the execution step counts
of the preceding program, and the total execution time of the programs (total execution step
counts before preceding program plus execution step counts of preceding program).
Measurement is performed each time a program is executed.
The counter for the program step count is H'1 to H'FFFFFFFF.
■ View of the measuring result1. "Measurement time" Dialog
[Debug] - [Time Measurement] menu
2. SHOW TIMER command
■ Clear of the measuring result1. "Measurement time" Dialog <Clear> Buttom
[Debug] - [Time Measurement] menu
2. CLEAR TIMER command
46

CHAPTER2 Dependence Functions
2.1.9 Trace
The address and status information can be sampled during program execution to record it in a trace buffer. This function is called a trace.
■ Trace Data recorded with the trace function can be used to make a detailed analysis of a program
execution history.
The trace buffer is in the form of a ring. When it becomes full, it records the next data by
automatically overwriting the buffered data at the beginning.
• Trace Sampling
• Setting trace
• Displaying trace data
• Display format of trace data
• Searching trace data
• Saving trace data
• Clearing trace data
■ Trace Data The simulator debugger can sample 1000 frames of trace data. Trace data sampling occurs at
the address of the executed instruction.
47

CHAPTER2 Dependence Functions
2.1.9.1 Trace Sampling
Trace measurements are made of a program execution status during the interval between the start and stop of program execution.
■ Trace Sampling While the trace function is enabled, data is always sampled and recorded in the trace buffer
during execution of an execution command.
The program execution aborts due to a break factor such as a breakpoint, terminating the trace.
Furthermore, when the trace buffer becomes full, a program break can be invoked. This break
is called a trace buffer full break.
■ Frame Number A number is assigned to each frame of sampled trace data. This number is called a frame
number.
The frame number is used to specify the display start position of the trace buffer.
The number 0 is assigned to the last-sampled trace data. Negative values are assigned to trace
data that have been sampled before the arrival at the triggering position.
48

CHAPTER2 Dependence Functions
2.1.9.2 Setting Trace
You must set the following two items to perform a trace. After that, trace data will be sampled with the execution of the program. You can set this from the command window.
■ Setting Trace 1. Enable the trace function
- This is done by [Setup] - [Trace] in the trace window shortcut menu. This program will
startup and will be enabled.
2. Set the trace buffer full break
- When the trace buffer is full, you can make a break. This is done using the setting dialog
boxes of the trace window shortcut menu [Setup] - [Trace].
- When starting up this program, it is setup for no breaks.
49

CHAPTER2 Dependence Functions
2.1.9.3 Displaying Trace Data
Data recorded in the trace buffer can be displayed.
■ Displaying Trace Data The trace window displays how much trace data is stored in the trace buffer. Also, you can use
the SHOW TRACE command from the command window.
50

CHAPTER2 Dependence Functions
2.1.9.4 Display Format of Trace Data
There are two display formats for displaying trace buffer data.
■ Display Format of Trace Data • Display Only Instruction Operation: (Specify Instruction)
• Display by Unit of Source Lines: (Specify Source)
■ Display Only Instruction Operation In this mode, the instruction operation is displayed in disassembly units.
■ Display by Unit of Source Lines This mode only displays source lines.
51

CHAPTER2 Dependence Functions
2.1.9.5 Searching Trace Data
The trace buffer can be searched to locate target data.
■ Searching Trace Data Specify the address information for the search purpose. This search function can be run by
clicking the Search button in the trace window.
52
CHAPTER2 Dependence Functions
2.1.9.6 Saving Trace Data
The debugger has function of saving trace data.
■ Saving Trace Data Save the trace data to the specified file.
For details on operations, refer to Sections 3.14 Trace Window, and 4.4.8 Trace in the
SOFTUNE Workbench Operation Manual; and Section 4.9 Show Trace in the SOFTUNE
Workbench Command Reference Manual.
53

CHAPTER2 Dependence Functions
2.1.9.7 Clearing Trace Data
To clear trace data, use the following command.
■ Clearing Trace Data When clearing trace data, the [Clear] command is executed from the short-cut menu in the
trace window.
54

CHAPTER2 Dependence Functions
2.2 Emulator Debugger (MB2197)
This section describes the emulator debugger functions that are available when the MB2197 is specified.
■ Emulator Debugger When choosing the emulator debugger from the setup wizard, select one of the following
emulators. Select the MB2197.
• MB2197
• MB2198
The emulator debugger for the MB2197 is software that controls an emulator from a host
computer via a communications line (RS-232C or LAN) to evaluate programs.
• DSU1
• DSU2
• DSU3
Before using the emulator debugger, it is necessary to initialize the emulator. For details, refer
to Appendix B, Monitoring Program Download, and Appendix C, LAN Interface Setup, in the
SOFTUNE Workbench Operation Manual.
55

CHAPTER2 Dependence Functions
2.2.1 Setting Operating Environment
This section explains the operating environment setup.
■ Setting Operating Environment For the emulator debugger for the MB2197, it is necessary to set the following operating
environment. Predefined default settings for all these setup items are enabled at startup.
Therefore, setup is not required when using the default settings. Adjusted settings can be used
as new default settings from the next time.
• MCU operation mode
• DRAM refresh control
• Cache flush control
• Controling Operating Frequency
56

CHAPTER2 Dependence Functions
2.2.1.1 MCU Operation Mode
The following four modes are in the MCU Operation Mode. The Internal Trace Mode and External Trace Mode are enabled only with products using the DSU3 chips. The Full Trace Mode and Real-time Mode are not enabled with products using the DSU3 chips.• Full Trace Mode• Real Time Mode• Internal Trace Mode• External Trace Mode
■ Setting MCU Operation Mode Set the MCU operation mode. There are two modes: full trace, and real-time. To set the
operation mode, use either the [Setup] - [Debug Environment] - [Debug Environment]
command, or the SET RUNMODE command in the Command window.
■ Full Trace Mode In the full trace mode, all instruction executions can be traced without omission. However, if
branching occurs more than three times within 11 cycles, operations may not be real-time due
to the wait entered to MCU as acquiring the trace data is preceded. This mode cannot be
specified with DSU3 chips.
■ Real-time Mode In the real-time mode, a program runs in real-time. However, if branching occurs more than
three times within 11 cycles, some trace data may be omitted.
This mode cannot be specified with DSU3 chips.
■ Internal Trace Mode Trace data is stored in the specialized trace memory built-in to the chip. The program is
executed at real time, but this is possible only with DSU3 chips which include that function.
■ External Trace Mode Trace data is stored in the specialized trace memory mounted on the adapter board. The
program is executed at real time.
This mode may not be specified depending on the specification of the adapter board. Check
your adapter board specification.
57

CHAPTER2 Dependence Functions
2.2.1.2 DRAM Refresh Control
This section explains DRAM refresh setup.
■ DRAM Refresh Control The operating frequency of some DSU chips is automatically divided at a break (in emulation
mode). When this happens, the register (RFCR) must be reset if the built-in DRAM refresh
function is used on the user target.
The RFCR register values for On Execution (in user mode) and On Break (in emulation mode)
can be set by using the [Setup] - [Debug Environment] - [Debug Environment] - [RFCR]
command. When the mode is switched, the values set here are used to set to the RFCR
register.
Note:
When using chips with an operating frequency that is not divided automatically at a break(in emulation mode), or when the built-in DRAM refresh function at the user target is notin use, this function causes a slowdown in debugger operation due to writing to the RFCRregister.
58

CHAPTER2 Dependence Functions
2.2.1.3 Cache Flush Control
This section explains cache flush setup.
■ Cache Flush Control When using a chip with cache memory, rewriting the memory and software break point setup
using commands is not reflected in the cache. Therefore, cache flushing must be performed
when such commands are executed. The debugger has a function to flush the cache
automatically, monitor memory rewriting, and set software break points, etc.
This function is controlled using the [Setup] - [Debug Environment] - [Debug Environment] -
[Emulation] command.
Note:
When the automatic cache flushing option is enabled, it may negatively affect theprogram speed.
59

CHAPTER2 Dependence Functions
2.2.1.4 Controlling Operating Frequency
This section explains the setting of operating frequencies.
■ Operating frequencies Set the operating frequencies of the MCU. Enable only DSU3. DSU3 ranges from 1 to 200
MHz. This setting provides the optimum communication speed between the MCU and
emulator.
This function can be controlled by the [Setup]-[Debug Environment]-[Debug Environment]-
[Frequency] command.
Notes:
1. This setting is used to set maximum operating frequencies. Actual operatingfrequencies will not be changed.
2. Actual operating frequencies exceeding these settings will cause impropercommunication with the emulator.
60

CHAPTER2 Dependence Functions
2.2.2 Notes on Executing Program
There are some precautions to observe when using program execution commands.
■ Real-time Functionality in Running Program When the MCU is in the full trace mode, there are some cases when a program cannot execute
in real-time.
The MCU operation mode can be set up by using either the [Setup] - [Debug Environment] -
[Emulation] command, or the SET RUNMODE command in the Command window.
■ Notes on Delayed Branch Instruction when executed using [Debug] - [Run] - [Step In] or [Debug] - [Run] - [Step Over] command
If a delay branch instruction is executed by the [Debug] - [Run] - [Step In] command or
[Debug] - [Run] - [Step Over] command, the program runs past the instruction at the delay slot
(instruction immediately after delay branch instruction) and breaks immediately after executing
the delay branch instruction.
■ Restrictions when Suspended by Software Break When there is a software break at the current PC location, if either the [Debug] - [Run] - [Go]
command or the Go command is executed, the emulator debugger performs one execution step
internally, and then executes the program in batch processing. In addition, when a software
break is set for the instruction to clear the T-flag, and when either the [Debug] - [Run] - [Go]
command or the Go command is executed from that address, all software breaks are
disregarded. When this happens, any interrupt is masked too.
■ Value of TBR Register Note a program null-function may occur if you specify such value for the TBR register as the
vector table overlaps to the I/O area.
■ Notes on Instruction to Clear T-Flag when Executed using [Debug] - [Run] - [Step In] or [Debug] - [Run] - [Step Over] command
If an instruction to clear the T-flag is executed using either the [Debug] - [Run] - [Step In]
command, or [Debug] - [Run] - [Step Over] command, the program will be executed in batch
processing. When this happens, all software breaks are ignored.
61

CHAPTER2 Dependence Functions
2.2.3 Command Execution while Executing Program
This section explains how perform command execution during program execution.
■ Command Execution while Executing Program When executing a program using the [Debug] - [Run] - [Go] command, the Status Bar displays
"Execute" to show that the program is running.
Certain commands can be executed in this circumstances (they vary with the type of debugger).
The execution procedures are the same, but some commands cannot be executed and some can
be executed but are subject to restrictions.
To forcibly terminate the program, use the [Debug] - [Abort] command.
Note that in the emulator debugger, memory Read/Write is re-executed while executing a
program after permitting the MCU to break once for access.
62

CHAPTER2 Dependence Functions
2.2.4 Break
This Emulator Debugger provides seven types of break functions. When by each break function aborts program execution, the address where a break occurred and the break factor are displayed.
■ Break Functions This Emulator debugger provides the following seven types of break functions;
- Code break
- Code event break
- Date event break
- Trace buffer-full break
- Alignment error break
- External trigger break
- Forced break
63
CHAPTER2 Dependence Functions
2.2.4.1 Code Break
This function aborts the program execution by monitoring a specified address by hardware or software.A break occurs before executing an instruction at the specified address.
■ Code Break This function aborts the program execution by monitoring a specified address by hardware or
software.
A break occurs before executing an instruction at the specified address.
The maximum number of points that can be set is as follow:
Hardware: 5 points
Software: 4096 points
When the code break occurs, the following message appears at the status bar.
- Hardware
Break an address by hardware breakpoint
- Software
Break at address by breakpoint
■ How to set Set the break as follows.
• Command
- SET BREAK/HARD (hardware)
- SET BREAK/SOFT (software)
Refer to "SET BREAK" in SOFTUNE Workbench Command Reference.
• Dialog
"Code" tab in breakpoint setting dialog
Refer to "Break" in SOFTUNE Workbench Operation Manual
• Window
Source window/disassemble window
64

CHAPTER2 Dependence Functions
Notes:
Hardware
The hardware break requires the following cautions:
1. Do not set any hardware break in instruction placed in a delay slot. When thehardware break is set in the instruction, a branch does not occur even if the program isreexecuted after break.
2. Be sure to set a breakpoint at the starting address of the instruction. If not so, a breakmay not occur.
3. When the program is executed from the address at which a hardware break is set, abreak occurs without executing the instruction if the immediately preceding programexecution is stopped by a factor other than the instruction break. To execute theinstruction, reexecute the program.
Software
The software break requires the following cautions:
1. A breakpoint cannot be set in any area, such as ROM, where data cannot be writtenproperly. In this case, a verify error occurs when program execution is started(continuous execution or stepwise execution is started).
2. Be sure to set a breakpoint at the starting address of the instruction. If breakpoint isset during instruction execution, the program may malfunction.
65
CHAPTER2 Dependence Functions
2.2.4.2 Code Event Break
This function used breakpoints contained in the evaluation chip. The address mask, pass count, and sequential mode can be set.
■ Code Event Break This function uses breakpoints contained in an evaluation chip. The address mask and pass
count can be set. Up to two breakpoints can be set and used in two modes.
1. OR mode (if a hit is found in either code event 1 or 2, a break occurs)
2. Sequential mode (if a hit is found in code events 1 and 2 in the order, a break occurs)
When the code event break occurs, the following message appears at the status bar.
1. OR mode
Break at address by code event break (No.: Code event number)
2. Sequential mode
Break at address by code event break (sequential)
■ How to set Set the code event break as follows.
• Command
- SET CODEEVENT
- SET SEQUENCE/ON (only in sequential mode)
Refer to "SET CODEEVENT" in SOFTUNE Workbench Command Reference.
• Dialog
"Code" tab in event setting dialog
Refer to "Event" in SOFTUNE Workbench Operation Manual
Note:
In the DSU3 chip, the code event can be used as a break factor and a tracemeasurement start factor. This mode is called a trace sampling mode. There are twotrace sampling modes.
a. Full mode: The code event is used as a break factor.
b. Trigger mode: The code event is used as a trace measurement start factor.
To use the code event as a break factor, set the full mode.
Set as follows:
Command
- SET TRACE/FULL
Refer to "SET TRACE" in SOFTUNE Workbench Command Reference.
Dialog
Trace setting dialog
Refer to "Trace" in SOFTUNE Workbench Operation Manual.
66

CHAPTER2 Dependence Functions
2.2.4.3 Data Event Break
This function uses breakpoints contained in the evaluation chip. The address mask, data size, access type, and sequential mode can be set.
■ Data Event Break This function uses breakpoints contained in the evaluation chip. The address mask, data size
(byte/half word/word), and access attributes (read/write) can be set.
Up to two breakpoints can be set and used in two modes.
1. OR mode (if a hit is found in either data event 1 or 2, break occurs)
2. Sequential mode (if a hit is found in data events 1 and 2 in this order, a break occurs)
When the data event break occurs, the following message appears at the status bar.
1. OR mode
Break at address by data event break (No: Data event number)
2. Sequential mode
Break a address by data event break (sequential)
■ How to set Set the data event break as follows.
• Command
- SET DATAEVENT
- SET SEQUENCE/ON (only in sequential mode)
Refer to "SET DATAEVENT" in SOFTUNE Workbench Command Reference.
• Dialog
"Data" tab in event setting dialog
Refer to "Event" in SOFTUNE Workbench Operation Manual
Note:
In the DSU3 chip, the data event can be used as a break factor and a trace measurementstart factor. This mode is called a trace sampling mode. There are two trace samplingmodes.
a. Full mode: The data event is used as a break factor.
b. Trigger mode: The data event is used as a trace measurement start factor.
To use the data event as a break factor, set the full mode.
Set as follows:
Command
- SET TRACE/FULL
Refer to "SET TRACE" in SOFTUNE Workbench Command Reference.
Dialog
Trace setting dialog
Refer to "Trace" in SOFTUNE Workbench Operation Manual.
67

CHAPTER2 Dependence Functions
2.2.4.4 Trace Buffer-full Break
This function aborts the program execution when the trace buffer becomes full.
■ Trace Buffer-full Break This function aborts the program execution when the trace buffer becomes full.
When the trace buffer-full break occurs, the following message appears at the status bar.
Break at address by trace buffer full
■ How to set Set the trace buffer-full break as follows.
• Command
- SET TRACE/BREAK
Refer to "SET TRACE" in SOFTUNE Workbench Command Reference.
• Dialog
Trace setting dialog
Refer to "Trace" in SOFTUNE Workbench Operation Manual.
68

CHAPTER2 Dependence Functions
2.2.4.5 Alignment Error Break
This function aborts the program execution when an instruction access or a word/half word access beyond the boundary is made to the odd address.
■ Alignment Error Break This function aborts the program execution when an instruction access or a word/half word
access beyond the boundary is made to the odd address. Whether to enable or disable the
alignment error break can be set for both instruction access and data access.
When the alignment error break occurs, the following message appears at the status bar.
1. Instruction access
Break at address by alignment error break (code)
2. Data access
Break at address by alignment error break(data)
■ How to set Set the alignment error break as follows.
• Command
- ENABLE ALIGNMENTBREAK
- DISABLE ALIGNMENTBREAK
Refer to "ENABLE ALIGNMENTBREAK" in SOFTUNE Workbench Command
Reference.
• Dialog
"Emulation" tab in debug environment setting dialog
Refer to "Debug Environment" in SOFTUNE Workbench Operation Manual.
69

CHAPTER2 Dependence Functions
2.2.4.6 External Trigger Break
This function aborts the program execution when an external signal is input from the TRIG of the Emulator.
■ External Trigger Break This function aborts the program execution when an external signal is input from the TRIG of
the Emulator.
When the external trigger break occurs, the following message appears at the status bar.
Break at address by external trigger break
■ How to set Set the external trigger break as follows.
• Command
- SET TRIGGER
Refer to "SET TRIGGER" in SOFTUNE Workbench Command Reference.
• Dialog
"Emulation" tab in debug environment setting dialog
Refer to "Debug Environment" in SOFTUNE Workbench Operation Manual.
70
CHAPTER2 Dependence Functions
2.2.4.7 Forced Break
This function forcibly aborts the program execution to generate a break.
■ Forced Break This function forcibly aborts the program execution to generate a break.
When the forced break occurred, the following message appears at the status bar.
Break at address by command abort request
Note:
The forced break cannot be generated when the MCU is in the low power consumptionmode or in the hold state. If the MCU is in the low power consumption mode or in the holdstate when the forced break is requested by the [Debug]-[Abort] command during theprogram execution, the [Debug]-[Abort] command is ignored. To generate a breakforcibly, use the [Debug]-[Abort] command to remove a factor by the user system or usethe [Debug]-[Reset of MCU] command to remove it. If the MCU enters the low powerconsumption mode or the hold state during the program execution, the condition isdisplayed at the status bar.
71

CHAPTER2 Dependence Functions
2.2.5 Measuring Execution Cycle Count
This function measures the program execution cycle count.
■ The measuring item Measures program execution cycle counts.
The measurement result can be displayed as two cycle counts values: the execution cycle
counts of the preceding program, and the total execution time of the programs (total execution
cycle counts before preceding program plus execution cycle counts of preceding program).
Measurement is performed each time a program is executed.
■ View of the measuring result1. "Measurement time" Dialog
[Debug] - [Time Measurement] menu
2. SHOW TIMER command
■ Clear of the measuring result1. "Measurement time" Dialog <Clear> Buttom
[Debug] - [Time Measurement] menu
2. CLEAR TIMER command
■ errorThe number of measurement cycles includes an error of about 20 cycles. In the Real-time
mode or Full Trace mode, it has additionally an error of about at most (*1) cycles. For time
measurement, use the Internal Trace mode or External Trace mode, which has less error.
*1: Autowait 1 : +1250
Autowait 3 : +2500
Autowait 7 : +5000
Autowait 15 : +10000
Note:
Execution cycle counts are measured in several tens of cycles at one execution. Whenmeasuring execution cycles, set for consecutive executions of many instructions todecrease the efficacy of errors.
72

CHAPTER2 Dependence Functions
2.2.6 Trace
The address and status information can be sampled during program execution to record it in a trace buffer. This function is called a trace.
■ Trace Data recorded with the trace function can be used to make a detailed analysis of a program
execution history.
The trace buffer is in the form of a ring. When it becomes full, it records the next data by
automatically overwriting the buffered data at the beginning.
• Trace data
• Trace sampling
• Setting trace
• Displaying trace data
• Display format of trace data
• Searching trace data
• Saving Trace dada
• Clearing trace data
• Notes on Use of Tracing Function
73

CHAPTER2 Dependence Functions
2.2.6.1 Trace Data
Data sampled and recorded by tracing is called trace data.
■ Trace Data You can sample the following sizes using the emulation debugger.
• Full Trace Mode: 65536 frames
• Real Time Trace Mode: 65536 frames
• Internal Trace Mode: 128 frames or 64 frames
(The number of frame is different by an evaluation chip.)
• External Trace Mode: 65536 frames
The following data is sampled.
• Address (32 bits)
• Data (32 bits)
• Status Information
- Access Data Size: Word/Halfword/Byte
- Data Types: Data Access/Instruction Execution
74

CHAPTER2 Dependence Functions
2.2.6.2 Trace Sampling
Trace measurements of the program execution status are made during the interval between the program start and stop. The DSU3 chip emulator debugger performs trace measurements until the program execution stops, using the first or second code event or first data event as a trigger for starting trace measurement.
■ Trace Sampling When the trace function is enabled, data is always sampled and recorded in the trace buffer
during the execution of an execution command.
In addition to the above function, the DSU3 chip emulator debugger has functions for starting
trace measurement during the next program execution and making trace measurements of data
access with a specified region.
• When mode switching is effected from the trace sampling mode to the trigger mode, trace
measurements start at the first or second code event hit or the first data event hit.
• When the internal trace mode or external trace mode is selected as the MCU operation
mode, data sampling is conducted only for data accesses to a specified data trace
measurement region.
The program execution aborts due to a break factor such as a breakpoint, terminating the trace.
Furthermore, when the trace buffer becomes full, a program break can be invoked. This break
is called a trace buffer full break.
■ Frame Number A number is assigned to each frame of sampled trace data. This number is called a frame
number.
The frame number is used to specify the display start position of the trace buffer.
The value 0 is assigned to the last-sampled trace data. Negative values are assigned to trace
data sampled before the arrival at the triggering position.
75

CHAPTER2 Dependence Functions
2.2.6.3 Setting Trace
To perform a trace, complete steps 1 through 3 below. When a program is executed after completion of the following steps, trace data is sampled. Trace setup can also be performed from the command window. The DSU3 chip allows the trace measurement region for data access to be specified.
■ Setting Trace 1. Enable the trace function
- This is done by [Setup] - [Trace] in the trace window shortcut menu. This program will
startup and will be enabled.
2. Set the MCU operation mode
- Execute the [Setup] - [Debug Environment] commands.
- Real time mode operates while executing, but there is a great possibility of losing trace
data. Full trace mode does not operate while executing, but there is a very low
possibility of losing trace data. If there are many divisional instructions, we recommend
that you use the full trace mode.
- With the DSU3 chip, you can specify internal trace mode or external trace mode. Using
these two modes, you can measure while operating during execution without losing trace
data.
3. Set the trace buffer full break
- When the trace buffer is full, you can make a break. This is done using the setting dialog
boxes of the trace window shortcut menu [Setup] - [Trace].
- When starting up this program, it is setup for no breaks.
- Also, on emulator debuggers using DSU3 chips, you can specify the data access area for
performing the trace measurements.
76

CHAPTER2 Dependence Functions
2.2.6.4 Displaying Trace Data
Data recorded in the trace buffer can be Displayed.
■ Displaying Trace Data The trace window displays how much trace data is stored in the trace buffer. Also, you can use
the SHOW TRACE command from the command window.
When the emulator debugger uses the DSU3 chip, it displays branch information and data
access information as trace data. To display instructions executed between branch instructions,
it is necessary to open the trace details dialog box. The same purpose can also be achieved by
executing the SHOW DETAILTRACE command from the command window.
77

CHAPTER2 Dependence Functions
2.2.6.5 Display Format of Trace Data
There are three formats for displaying trace buffer data.
■ Display Format of Trace Data • Display Only Instruction Operation: (Specify Instruction)
• Display Bus Cycles: (Specify Cycle)
• Display by Unit of Source Lines: (Specify Source)
If the DSU3 chip is being used by the emulator debugger, this displays only instruction
executions. Source line unit displays are performed using the trace details dialog box.
■ Display Only Instruction Operation In this mode, the instruction operation is displayed in disassembly units.
■ Display Bus Cycles In this mode, detailed information on all sampled instruction fetch cycles and data access
cycles is displayed.
■ Display by Unit of Source Lines This mode only displays source lines.
78

CHAPTER2 Dependence Functions
2.2.6.6 Searching Trace Data
The trace buffer can be searched to locate target data.
■ Searching Trace Data Specify the address, data, and access information for searching. The address and data can be
masked. This search function can be run by clicking the Search button in the trace window.
79

CHAPTER2 Dependence Functions
2.2.6.7 Saving Trace Data
The debugger has function of saving trace data.
■ Saving Trace Data Save the trace data to the specified file.
For details on operations, refer to Sections "3.14 Trace Window", and "4.4.8 Trace" in
SOFTUNE Workbench Operation Manual and Section "4.9 Show Trace" in SOFTUNE
Workbench Command Reference Manual.
80
CHAPTER2 Dependence Functions
2.2.6.8 Clearing Trace Data
To clear trace data, use the following command.
■ Clearing Trace Data When clearing trace data, the [Clear] command is executed from short-cut menu in the trace
window.
81

CHAPTER2 Dependence Functions
2.2.6.9 Notes on Use of Tracing Function
This section describes the precautions to observe when displaying or searching for trace data.
■ Notes on Trace Function When the emulator debugger is in use, tracing is enabled by the following:
• Output address information at fetching branch instruction
For these reasons, note the following points when displaying and searching trace data
• Since address information is not output immediately after executing a program until the
branch instruction being executed, trace data may not be established on the program
executing side.
• When displaying disassembly, data is read from memory and processed. Therefore, the
displayed data may not be correct if the instruction is rewritten after code fetching.
• When specifying a starting frame number for searching data, an instruction longer than 2
bytes (LDI: 32, LDI: 20 instructions) may not be displayed correctly when the instruction
starting address is not specified.
• In the real-time mode, partial omission of trace data may occur under the following
conditions (Output trace omission information instead) because of the real-time operation.
- When branching occurs more than three times within 11 cycles.
- When data tracing occurs more than three times in succession.
• The address is not displayed until the first branching information is found, because the trace
data immediately before starting execution has been overwritten.
• If a break occurs under conditions such as the following combination of break points has
been set up in sequence at continuous addresses (code addresses of factors in case of data
event), the trace data immediately before the break is not displayed correctly.
- When break points set in sequence from software break to either one of I-group breaks at
continuous addresses.
- When break points set in sequence from either one of I-group breaks to either one of I-
group breaks at continuous addresses.
Reference:
The I-group breaks here means the following breaks:
• Hardware break
• Code event break
• Data event break
This occurs because the address next to the actual break factor address is detected as abreak cause simply by such next address being pre-fetched.
82

CHAPTER2 Dependence Functions
• When displaying valid pass cycles or instruction, the omitted trace data frame isdisplayed as follows:
Frame where address at code fetching could not be sampled.
• At step execution by a single instruction, trace data may not be sampled correctly foreach single instruction execution. If this happens, *** Address Lost Error *** isdisplayed.
*** Address Lost Error ***
83

CHAPTER2 Dependence Functions
2.2.7 Inaccessible Area
This section explains inaccessible area.
■ Inaccessible areaThe inaccessible area is a function that suppresses access to memory when the debugger
accesses a specified memory area (using commands, windows, etc. (*1)).
However, access to memory is not suppressed using program.
The following commands are used to set an inaccessible area.
SET MAP/INACCESSIBLE: Sets an inaccessible region.
SHOW MAP/INACCESSIBLE: Displays an inaccessible region.
CANCEL MAP/INACCESSIBLE: Deletes a specified inaccessible region.
ENABLE MAP/INACCESSIBLE: Enables a specified inaccessible region.
DISABLE MAP/INACCESSIBLE: Disables a specified inaccessible region.
(*1)
Memory operation command
Assemble/disassemble command
Load/save command
Built-in Variables and Functions (%BIT, %B, %H, %W, %L, %S, %D)
Formula
Trace
Vector
Memory window
Source window
Assemble window
Watch window
Local window
Symbol window
■ Access to memory area including inaccessible areaWhen there are inaccessible regions within those that are accessed, up to memory of
inaccessible region is accessed, an error is output when the inaccessible region is reached, and
access to the memory is suspended.
84
CHAPTER2 Dependence Functions
2.3 Emulator Debugger (MB2198)
This section describes the emulator debugger functions that are available when the MB2198 is specified.
■ Emulator Debugger When choosing the emulator debugger from the setup wizard, select one of the following
emulators. Select the MB2198.
• MB2197
• MB2198
The emulator debugger for the MB2198 is software that controls an emulator from a host
computer via a communications line (RS-232C or LAN or USB) to evaluate programs.
Products targeted for debugging must have the following DSUs (debug support units):
• DSU3
• DSU4
Before using the emulator debugger, initialize the emulator. For details, refer to "Appendix B
Monitoring Program Download", and "Appendix C LAN Interface Setup", in the SOFTUNE
Workbench Operation Manual.
85

CHAPTER2 Dependence Functions
2.3.1 Setting Operating Environment
This section explains the operating environment setup.
■ Setting Operating Environment For the emulator debugger for the MB2198, set up the following operating environment.
Predefined default settings for all these setup items are enabled at startup. Therefore, setup is
not necessary when using default settings. The adjusted settings can be used as the new default
settings from the next time.
• Monitoring program automatic loading
• MCU operation mode
• Cache flush control
• Controling Operating Frequency
• External memory emulation
• Debug mode
86

CHAPTER2 Dependence Functions
2.3.1.1 Monitoring Program Automatic Loading
The emulators that are compatible with the MB2198 can update the monitoring program automatically at emulator startup.
■ Monitoring Program Automatic Loading When the MB2198 is specified, data in the emulator can be checked at the beginning of
debugging to automatically load the appropriate monitoring program and configuration binary
data into the emulator.
To specify whether or not to load the monitoring program automatically, choose [Setup] -
[Debug Environment] - [Setup Wizard].
87

CHAPTER2 Dependence Functions
2.3.1.2 MCU Operation Mode
The following four modes are in the MCU Operation Mode. The Full Trace Mode and Real-time Mode are not enabled with products using the DSU3 chips.• Full Trace Mode• Real Time Mode• Internal Trace Mode• External Trace Mode
■ Setting MCU Operation Mode Set the MCU operation mode. There are two modes: full trace, and real-time. To set the
operation mode, use either the [Setup] - [Debug Environment] - [Debug Environment]
command, or the SET RUNMODE command in the Command window.
■ Full Trace Mode In the full trace mode, all instruction executions can be traced without omission. However, if
branching occurs more than three times within 11 cycles, operations may not be real-time due
to the wait entered to MCU as acquiring the trace data is preceded. This mode cannot be
specified with DSU3 chips.
■ Real-time Mode In the real-time mode, a program runs in real-time. However, if branching occurs more than
three times within 11 cycles, some trace data may be omitted.
This mode cannot be specified with DSU3 chips.
Chips may cause an error at cycle count measurement. When measuring the cycle count, use
the internal or external trace mode.
■ Internal Trace Mode Trace data is stored in the specialized trace memory built-in to the chip. The program is
executed at real time, but this is possible only with DSU3 chips which include that function.
■ External Trace Mode Trace data is stored in the specialized trace memory mounted on the adapter board. The
program is executed at real time.
This mode may not be specified depending on the specification of the adapter board.
Check your adapter board specification.
88

CHAPTER2 Dependence Functions
2.3.1.3 Cache Flush Control
This section explains cache flush setup .
■ Cache Flush Control When using a chip with cache memory, rewriting the memory and software break point setup
using commands is not reflected in the cache. Therefore, cache flushing must be performed
when such commands are executed. The debugger has a function to flush the cache
automatically, monitor memory rewriting, and set software break points, etc.
This function is controlled using the [Setup] - [Debug Environment] - [Debug Environment] -
[Emulation] command.
Note:
When the automatic cache flushing option is enabled, it may negatively affect theprogram speed.
89
CHAPTER2 Dependence Functions
2.3.1.4 Controlling Operating Frequency
This section explains the setting of operating frequencies.
■ Operating frequencies Set the operating frequencies of the MCU. The most suitable operating frequencies vary
depending on the type of DSU. DSU3 ranges from 1 to 200 MHz and DSU4 from 1 to 266
MHz. This setting provides the optimum communication speed between the MCU and
emulator.
This function can be controlled by the [Setup]-[Debug Environment]-[Debug Environment]-
[Frequency] command.
Notes:
1. This setting is used to set maximum operating frequencies. Actual operatingfrequencies will not be changed.
2. Actual operating frequencies exceeding these settings will cause impropercommunication with the emulator.
90
CHAPTER2 Dependence Functions
2.3.1.5 External Memory Emulation
This section explains the external memory emulation function .
■ External memory emulation Some DSU4 chips can use the RAM in the adapter unit in place of the user system memory.
This function is called external memory emulation.
For the FR Family, the ‘chip select’ terminal must be specified to access memory outside the
chip. Therefore, when using the external memory emulation function, specify the chip select
number.
This function can be controlled using the [Setup]-[Debug Environment]-[Debug Environment]-
[External Memory Emulation] command. Select either ROM or RAM as the emulated memory.
For the detailed specifications and setup procedure, refer to the hardware manual for the
appropriate adapter unit.
91

CHAPTER2 Dependence Functions
2.3.1.6 Debug mode
Debug mode includes the following modes. Selectable debug mode varies with the emulator or its connection configuration. • RealTimeMemory mode • RAM Checker mode
■ Setting of debug mode This mode sets debug mode. Debug mode includes RealTimeMemory mode and RAM
Checker mode, and selectable debug mode varies with the emulator or its connection
configuration.
To set these mode, select [Environment] -> [Setup debugging environment] -> [Select Debug
Function] or by using the SET MODE command on the command window.
■ RealTimeMemory modeThis mode enables the real-time monitor function. This mode enables to display data for a
"256 bytes X 2" area in the real-time memory window without breaking the MCU at all during
program execution.
■ RAM Checker modeThis mode enables the RAM Checker function. This mode allows you to record the access
history of the monitoring address in the log file.
Notes:
1. In an environment where debug mode cannot be selected, RealTimeMemory mode isused.
2. The real-time monitor function can be used only in an environment where the externaltrace function can be used. The external trace function may not be used depending onthe specification of the adaptor board. Check the specification of the adaptor boardbefore using it.
3. The RAM Checker function can be used only in an environment where the used core isFR60Lite and the external trace function can be used. The external trace function maynot be used depending on the specification of the adaptor board. Check thespecification of the adaptor board before using it.
92

CHAPTER2 Dependence Functions
2.3.2 Notes on Executing Program
There are some precautions to observe when using program execution commands.
■ Real-time Functionality in Running Program When the MCU is in the full trace mode, there are some cases when a program cannot execute
in real-time.
The MCU operation mode can be set up by using either the [Setup] - [Debug Environment] -
[Emulation] command, or the SET RUNMODE command in the Command window.
■ Notes on Delayed Branch Instruction when executed using [Debug] - [Run] - [Step In] or [Debug] - [Run] - [Step Over] command
If a delay branch instruction is executed by the [Debug] - [Run] - [Step In] command or
[Debug] - [Run] - [Step Over] command, the program runs past the instruction at the delay slot
(instruction immediately after delay branch instruction) and breaks immediately after executing
the delay branch instruction.
■ Restrictions when Suspended by Software Break When there is a software break at the current PC location, if either the [Debug] - [Run] - [Go]
command or the Go command is executed, the emulator debugger performs one execution step
internally, and then executes the program in batch processing. In addition, when a software
break is set for the instruction to clear the T-flag, and when either the [Debug] - [Run] - [Go]
command or the Go command is executed from that address, all software breaks are
disregarded. When this happens, any interrupt is masked too.
■ Value of TBR Register Note a program null-function may occur if you specify such value for the TBR register as the
vector table overlaps to the I/O area.
■ Notes on Instruction to Clear T-Flag when Executed using [Debug] - [Run] - [Step In] or [Debug] - [Run] - [Step Over] command
If an instruction to clear the T-flag is executed using either the [Debug] - [Run] - [Step In]
command, or [Debug] - [Run] - [Step Over] command, the program will be executed in batch
processing. When this happens, all software breaks are ignored.
93

CHAPTER2 Dependence Functions
2.3.3 Command Execution while Executing Program
This section explains how perform command execution during a program execution.
■ Command Execution while Executing Program When executing a program using the [Debug] - [Run] - [Go] command, the Status Bar displays
"Execute" to show that the program is running.
Certain commands can be executed in this circumstances (they vary with the type of debugger).
The execution procedures are the same, but some commands cannot be executed and some can
be executed but are subject to restrictions.
To forcibly terminate the program, use the [Debug] - [Abort] command.
Please be aware that following functions of emulator debugger needs to break MCU once to
access and to re-executed the program.
• Reading and writing of memory during program execution.
• Setup and delete of breakpoint.
Because it takes time to pause/re-execute a program with DSU3 chip, above functions are not
equipped.
94

CHAPTER2 Dependence Functions
2.3.4 Break
This Emulator Debugger provides nine types of break functions. When by each break function aborts program execution, the address where a break occurred and the break factor are displayed.
■ Break Functions This Emulator debugger provides the following nine types of break functions;
- Code break
- Data break
- Code event break
- Data event break
- Trace buffer-full break
- Alignment error break
- External trigger break
- Forced break
- Data monitoring break
Available break functions depend on the DSU, adapter board, and chip.
*: FR60Lite does not support these functions because they are enhanced by "Code Break
(Hardware/count)", "Sequencer (31evels+restart)", and "Trace Trigger".
Table 2.3-1 Available Break Functions
DSU Adapter FR60Lite
Code break (software) ❍ ❍ ❍
Code break (hardware) ❍ ❍ ❍
Code break (hardware/count) ✕ ✕ ❍
Data break ✕ ✕ ❍
Code event break ❍ ❍ ✕ *
Data event break ❍ ❍ ✕ *
Trace buffer-full break ❍ ❍ ❍
Alignment error break ❍ ❍ ❍
External trigger break ❍ ❍ ❍
Forced break ❍ ❍ ❍
Datawatch break (hardware) ✕ ✕ ❍
Datawatch break (software) ❍ ❍ ❍
95

CHAPTER2 Dependence Functions
2.3.4.1 Code Break
This function aborts the program execution by monitoring a specified address by hardware or software.A break occurs before executing an instruction at the specified address.
■ Code Break This function aborts the program execution by monitoring a specified address by hardware or
software.
A break occurs before executing an instruction at the specified address.
Hardware has the hardware/count for which a path count can be set.
The maximum number of points that can be set is as follows:
Hardware: 5 points
Hardware/count: 2 points
Software: 4096 points
When the code break occurs, the following message appears at the status bar.
- Hardware, hardware/count
Break at address by hardware breakpoint
- Software
Break at address by breakpoint
■ How to set Set the code break as follows.
• Command
- SET BREAK/HARD (hardware)
- SET BREAK/SOFT (software)
- SET BREAK/COUNT (hardware/count)
Refer to "SET BREAK" in SOFTUNE Workbench Command Reference.
• Dialog
"Code" tab in breakpoint setting dialog
Refer to "Break" in SOFTUNE Workbench Operation Manual
• Window
Source window/disassemble window
If the user sets data monitoring conditions, the hardware and hardware/count can be used as
data monitoring break.
For the data monitoring conditions, see "Data Monitoring Break".
96

CHAPTER2 Dependence Functions
Notes:
Hardware
The hardware break requires the following cautions:
1. Do not set any hardware break in a instruction placed in a delay slot. When thehardware break is set in the instruction, a branch does not occur even if the program isreexecuted after break.
2. Be sure to set a breakpoint at the starting address of the instruction. If not so, a breakmay not occur.
3. When the program is executed from the address at which a hardware break is set, abreak occurs without executing the instruction if the immediately preceding programexecution is stopped by a factor other than the instruction break. To execute theinstruction, reexecute the program.
Software
The software break requires the following cautions:
1. A breakpoint cannot be set in any area, such as ROM, where data cannot be writtenproperly.In this case, a verify error occurs when program execution is started (continuousexecution or stepwise execution is started).
2. Be sure to set a breakpoint at the starting address of the instruction. If a breakpoint isset during instruction execution, the program may malfunction.
Hardware/count
The hardware/count break requires the following caution:
1. The hardware/count break can be used only when the FR60Lite core is used. Fordetails, see "Break."
97

CHAPTER2 Dependence Functions
2.3.4.2 Data Break
This function aborts the program execution when a data access (read/write) is made to a specified address.
■ Data Break This function aborts program execution when a data access (read/write) is made to a specified
address. Up to two breakpoints can be set.
When the data break occurs, the following message appears at the status bar.
Break at address by data break at access address
■ How to set Set the data break follows:
• Command
- SET DATABREAK
Refer to "SET DATABREAK" in SOFTUNE Workbench Command Reference.
• Dialog
"Data" tab in breakpoint setting dialog
Refer to "Break" in SOFTUNE Workbench Operation Manual
If the user sets a data monitoring condition, the data break can be used as a data monitoring
break.
For the data monitoring condition, see "Data Monitoring Break".
Note:
The data break requires the following caution:
The data break can be used only when the FR60Lite core is used. For details, see"Break".
98

CHAPTER2 Dependence Functions
2.3.4.3 Code Event Break
This function uses breakpoints contained in the evaluation chip. The address mask, pass count, and sequential mode can be set.
■ Code Event Break This function uses breakpoints contained in an evaluation chip. The address mask and pass
count can be set. Up to two breakpoints can be set and used in two modes.
1. OR mode (if a hit is found in either code event 1 or 2, a break occurs)
2. Sequential mode (if a hit is found in code events 1 and 2 in this order, a break occurs)
When the code event break occurs, the following message appears at the status bar.
1. OR mode
Break at address by code event break (No.: Code event number)
2. Sequential mode
Break at address by code event break (sequential)
■ How to set Set the code event break as follows.
• Command
- SET CODEEVENT
- SET SEQUENCE/ON (only in sequential mode)
Refer to "SET CODEEVENT" in SOFTUNE Workbench Command Reference.
• Dialog
"Code" tab in event setting dialog
Refer to "Event" in SOFTUNE Workbench Operation Manual.
Only in the OR mode, if the user sets a data monitoring condition, the code event break can be
used as a data monitoring break.
For the data monitoring condition, see "Data Monitoring Break."
99
CHAPTER2 Dependence Functions
Notes:
1. In the DSU3 chip, the code event can be used as a break factor and a tracemeasurement start factor. This mode is called a trace sampling mode. There are twotrace sampling modes.
a. Full mode: The code event is used as a break factor.
b. Trigger mode: The code event is used as a trace measurement start factor.
To use the code event as a break factor, set the full mode.
Set as follows:
Command
- SET TRACE/FULL
Refer to "SET TRACE" in SOFTUNE Workbench Command Reference.
Dialog
Trace setting dialog
Refer to “Trace” in SOFTUNE Workbench Operation Manual.
2. This function cannot be used when the FR60Lite core is used. For details, see"Break."
100

CHAPTER2 Dependence Functions
2.3.4.4 Data Event Break
This function uses breakpoints contained in the evaluation chip. The address mask, data size, access type, and sequential mode can be set.
■ Data Event Break This function uses breakpoints contained in the evaluation chip. The address mask, data size
(byte/half word/word), and access attributes (read/write) can be set.
Up to two breakpoints can be set and used in two modes.
1. OR mode (if a hit is found in either data event 1 or 2, a break occurs)
2. Sequential mode (if a hit is found in data events 1 and 2 in this order, a break occurs)
When the data event break occurs, the following message appears at the status bar.
1. OR mode
Break at address by data event break (No.: Data event number)
2. Sequential mode
Break at address by data event break (sequential)
■ How to set Set the data event break as follows.
• Command
- SET DATAEVENT
- SET SEQUENCE/ON (only in sequential mode)
Refer to "SET DATAEVENT" in SOFTUNE Workbench Command Reference.
• Dialog
"Data" tab in event setting dialog
Refer to "Event" in SOFTUNE Workbench Operation Manual
Only in the OR mode, if the user sets a data monitoring condition, the data event break can be
used as a data monitoring break.
For the data monitoring condition, see "Data Monitoring Break".
101

CHAPTER2 Dependence Functions
Notes:
1. In the DSU3 chip, the data event can be used as a break factor and a tracemeasurement start factor. This mode is called a trace sampling mode. There are twotrace sampling modes.
a. Full mode: The data event is used as a break factor.
b. Trigger mode: The data event is used as a trace measurement start factor.
To use the data event as a break factor, set the full mode.
Set as follows:
Command
- SET TRACE/FULL
Refer to "SET TRACE" in SOFTUNE Workbench Command Reference.
Dialog
Trace setting dialog
Refer to "Trace" in SOFTUNE Workbench Operation Manual.
2. This function cannot be used when the FR60Lite core is used. For details, see “Break.”
102

CHAPTER2 Dependence Functions
2.3.4.5 Trace Buffer-full Break
This function aborts the program execution when the trace buffer becomes full.
■ Trace Buffer-full Break This function aborts the program execution when the trace buffer becomes full.
When the trace buffer-full break occurs, the following message appears at the status bar.
Break at address by trace buffer full
■ How to set Set the trace buffer-full break as follows.
• Command
- SET TRACE/BREAK
Refer to "SET TRACE" in SOFTUNE Workbench Command Reference.
• Dialog
Trace setting dialog
Refer to "Trace" in SOFTUNE Workbench Operation Manual.
103
CHAPTER2 Dependence Functions
2.3.4.6 Alignment Error Break
This function aborts the program execution when an instruction access or a word/half word access beyond the boundary is made to the odd address.
■ Alignment Error Break This function aborts the program execution when an instruction access or a word/half word
access beyond the boundary is made to the odd address. Whether to enable or disable the
alignment error break can be set for both instruction access and data access.
When the alignment error break occurs, the following message appears at the status bar.
1. Instruction access
Break at address by alignment error break (code)
2. Data access
Break at address by alignment error break (data).
■ How to set Set the alignment error break as follows.
• Command
- ENABLE ALIGNMENTBREAK
- DISABLE ALIGNMENTBREAK
Refer to "ENABLE ALIGNMENTBREAK" in SOFTUNE Workbench Command Reference.
• Dialog
"Emulation" tab in debug environment setting dialog
Refer to "Debug Environment" in SOFTUNE Workbench Operation Manual.
104

CHAPTER2 Dependence Functions
2.3.4.7 External Trigger Break
This function aborts the program execution when an external signal is input from the TRIG of the Emulator.
■ External Trigger Break This function aborts the program execution when an external signal is input from the TRIG of
the Emulator.
When the external trigger break occurs, the following message appears at the status bar.
Break at address by external trigger break
■ How to set Set the external trigger break as follows.
• Command
- SET TRIGGER
Refer to "SET TRIGGER " in SOFTUNE Workbench Command Reference.
• Dialog
"Emulation" tab in debug environment setting dialog
Refer to "Debug Environment" in SOFTUNE Workbench Operation Manual.
105
CHAPTER2 Dependence Functions
2.3.4.8 Forced Break
This function forcibly aborts the program execution to generate a break.
■ Forced Break This function forcibly aborts the program execution to generate a break.
When the forced break occurred, the following message appears at the status bar.
Break at address by command aborts request
Note:
The forced break cannot be generated when the MCU is the low power consumptionmode or in the hold state. If the MCU is in low power consumption mode or in the holdstate when the strong break is requested by the [Debug]-[Abort] command during theprogram execution, the [Debug]-[Abort] command is ignored. To generate a breakforcibly, used the [Debug]-[Abort] command to remove a factor by the user system or usethe [Debug]-[Reset of MCU] command to remove it. If the MCU enters the low powerconsumption mode or the hold state during the program execution, the condition isdisplayed at the status bar.
106

CHAPTER2 Dependence Functions
2.3.4.9 Data Monitoring Break
This is a particular function that aborts the program execution when the program reaches a specified address during matching with specified data. Use conditions vary depending on the connection state of the Emulator.
■ Data Monitoring Break This is a particular function that aborts the program execution when the program reaches a
specified address during matching with specified data. There are two patterns of software and
hardware.
The figure below shows the conditions of data monitoring break.
■ Setting Number The maximum number of data monitoring breaks to be set is calculated as follows. The
number of breaks set and the break conditions differ between hardware and software.
1. Data monitoring break (hardware)
The break conditions are set by the address and data. Up to four breakpoints can be set.
The number of break to be set fluctuates because they are used with "Sequencer" and/or
"Trace Trigger."
2. Data monitoring break (software)
The break conditions can be specified by the address register and offset. These are
additional conditions to "Hardware Break," "Code Event Break," and "Data Event Break."
All "Data Monitoring Conditions" to be specified become the same.
Flow of program
Data monitoring
Specifiedaddress
When data match is not found, a break does not occers
Specified address
When data match is found, a break occers
Data matchis found
107

CHAPTER2 Dependence Functions
■ How to set Set the data monitoring break as follows.
1. Data monitoring break (hardware)
• Command
- SET BREAK/DATAWATCH
• Dialog
"Code" tab in breakpoint setting dialog
2. Data monitoring break (software)
• Command
- SET BREAKCONDITION
- SET BREAK/BREAKCONDITION
• Dialog
"Data Watch Conditions" in breakpoint detail setting dialog
Notes:
Data monitoring break (hardware)
1. This function can be used only when the FR60Lite core is used. For details, see"Break".
2. This function cannot be used when the performance mode is set as the event mode.For details, refer to "SET MODE" in SOFTUNE Workbench Command ReferenceManual.
Data monitoring break (software)
1. When setting data monitoring break (software), the monitoring function cannot beused.
108

CHAPTER2 Dependence Functions
2.3.5 Control by Sequencer
The emulator debugger for the MB2198 have a sequencer that controls events. By using this sequencer it is possible to exercise break control while focusing on a certain program flow (sequence). The break generated by this function is called a sequential break.For event setup, use the SET EVENT command.
■ Control by Sequencer The emulator debugger can have two types of sequencers depending on whether the external
trace bus interface is provided for evaluation chips. The specifications for the two types of
sequencers are summarized in Table 2.3-2 and Table 2.3-3 .
Table 2.3-3 shows the basic sequencer that is incorporated in all the DSU3/DSU4 evaluation
chips. This type of sequencer is subdivided into a code event sequencer and data event
sequencer. This function cannot be used only when the FR60Lite is used.
Table 2.3-2 shows a 3-level sequencer based on the real-time monitoring bus interface. Level
changes occur sequentially from Level 1 through Level 2 to Level 3. One event can be
specified as a sequencer restart condition.
This function can be used only when the FR60Lite is used.
Table 2.3-2 Sequencer Specifications (common)
Table 2.3-3 Sequencer Specifications (Real-time Monitoring Bus Interface Only)
Function Specifications Number of levels 2 levels One-level conditions Event-1 conditions (A pass count setting of 1
to 255 can be specified for each condition.)Restart conditions None Operation performed when conditions established Branching to next level or terminating
sequencer Other function The OR conditions can be specified
separately for code events and data events.
Function Specifications Number of levels 3 levels + restart conditions One-level conditions Event -1 conditions (A pass count setting of 1
to 16,777,215 can be specified for each condition.)
Restart conditions Event -1 conditions (A pass count setting of 1 to 16,777,215 can be specified.)
Operation performed when conditions established Branching to any level or terminating sequencer
Other function Data link function
109

CHAPTER2 Dependence Functions
The sequencer operates as shown below when it uses the real-time monitoring bus interface:
[Setup Example]
>SET SEQUENCE 1.3.2, r=4
Events 1, 3, and 2 are specified respectively for Levels 1, 2, and 3. Event 4 is specified as a
restart condition.
Note:
Sequencer (Only Real-time Monitoring Bus Interface)
1. This function can be used only when the evaluation chip is the FR60Lite.
2. There are cases when the actual code execution order and the data hit informationorder are switched, depending on the output timing of the external trace data.For that reason, if a code event and data event are closed, there are cases in whichnormal transition is impossible.
3. This function cannot be used when the performance mode is set as the event mode.For details, refer to "SET MODE" in SOFTUNE Workbench Command ReferenceManual.
Start
Event 1NO
Level 1
YES
Event 3NO
Level 2
YES
Event 2NO
Level 3
YES
Event 4
YESEvent 4
YES
Break
NO
NO
110

CHAPTER2 Dependence Functions
2.3.6 Measuring Execution Cycle Count
This function measures the program execution time.
■ The measuring itemMeasures program execution time and cycle count.
The measurement result can be displayed as two time values: the execution time of the
preceding program, and the total execution time of the programs (total execution time before
preceding program plus execution time of preceding program). Measurement is performed
each time a program is executed.
■ View of the measuring result1. "Measurement time" Dialog
[Debug] - [Time Measurement] menu
2. SHOW TIMER command
■ Clear of the measuring result1. "Measurement time" Dialog <Clear> Buttom
[Debug] - [Time Measurement] menu
2. CLEAR TIMER command
■ ErrorThe number of measurement cycles includes an error of about 20 cycles. In the Real-time
mode or Full Trace mode, it has additionally an error of about at most (*1) cycles. For time
measurement, use the Internal Trace mode or External Trace mode, which has less error.
*1: Autowait 1 : +1250
Autowait 3 : +2500
Autowait 7 : +5000
Autowait 15 : +10000
Note:
Execution cycle counts are measured in several tens of cycles at one execution. Whenmeasuring execution cycles, set for consecutive executions of many instructions todecrease the efficacy of errors.
Execution time as well as execution cycle are measured in several tens of cycles.
111

CHAPTER2 Dependence Functions
2.3.7 Trace
This section explains the trace function .
■ Trace Buffer One data unit stored in the trace buffer is called a frame.
The trace buffer capacity varies with the operation mode as shown below:
• Full Trace Mode: 65536 frames
• Real Time Trace Mode: 65536 frames
• Internal Trace Mode: 128 frames or 64 frames
(The number of frame is different by an evaluation chip.)
• External Trace Mode: 65536 frames
The trace buffer is in the form of a ring. When it becomes full, it records the next data by
automatically overwriting the oldest buffered data.
■ Trace Data Data sampled by the trace function is called trace data.
The following data are sampled:
• Address (32 bits)
• Data (32-bit; during data access only)
• Status Information
- Data type: Instruction execution/read/write
- Access data size (during data access only): Word/halfword/byte
• Access status Size: Read/write/code
• Execution time difference from next frame (in 25 ns increments)
- This data is available only when an evaluation chip with the external trace bus interface
is used with the external trace mode.
Notes:
1. The execution time display function is available only when a DSU4 evaluation chip withthe external trace bus interface is used. Furthermore, since the execution time isstored in the trace memory on the adapter unit, measurements cannot be made in theexternal trace mode in which the memory is used for trace data storage.
2. This function cannot be used when the performance mode in set as the event mode.Refer to "SET MODE" in SOFTUNE Workbench command Reference.
However, actually, the trace buffer stores the following data items:
• Code execution: Only address information for time before and after branching
• Data access: Only information for access to address range specified by trace filter function
112

CHAPTER2 Dependence Functions
■ Frame Number A number is assigned to each frame of sampled trace data. This number is called a frame
number.
The frame number is used to specify the display start position of the trace buffer. The value 0
is assigned to trace data at the triggering position for sequencer termination. Negative values
are assigned to trace data sampled before the arrival at the triggering position (Figure 2.3-1 ).
If there is no triggering position for sequencer termination, the value 0 is assigned to the last-
sampled trace data.
Figure 2.3-1 Frame Numbering at Tracing
■ Trace filter To make effective use of the limited trace buffer capacity, in addition to the code fetch
function, a trace filter function is incorporated to provide a means of acquiring information
about data accesses to a specific region.
The data trace filter function allows the following values to be specified for data access area.
In DSU4, code can be specified as an access attribute.
- Address
- Address mask
- Access attribute (read/write/code)
.
.
.
.
-3
-2
-1
0 (Trigger point)
113

CHAPTER2 Dependence Functions
■ Setting Trace Trigger When preselected conditions are met while monitoring the MCU bus operation, a trigger to
start a trace can be generated. This function is called a trace trigger.
To use the trace trigger function, specify the code (/CODE) and data access (/READ/WRITE).
Up to 4 trace triggers can be preset each for code attribute and data access attribute. However,
actually, the maximum number of trace triggers is determined as indicated below because
common hardware is shared with events.
Current trace trigger maximum count setting = 4 –
(current event count setting + current data monitoring break count setting)
Table 2.3-4 shows the trace trigger setup conditions that can be defined:
Table 2.3-4 Trace Trigger Setup Conditions
For trace trigger setup, use the following commands:
• SET TRACETRIGGER : Trace trigger setup
• CANCEL TRACETRIGGER : Trace trigger deletion
• SHOW TRACE/STATUS : Trace setup display
Figure 2.3-2 Trace Sampling Control (Trace Trigger)
Note:
Trace Trigger
1. This function can be used only when FR60Lite is used.
2. If a trace trigger is set, the trace cannot be acquired until the trace starting triggeroccurs. Disassembling and source are displayed in the trace from the jumpsdestination address of the branch instruction executed after the trace starting triggerhas occurred. Also, the branch instruction address executed just prior to the traceending trigger is displayed in the trace.
3. There are cases when the actual code execution order and the data hit informationorder are switched, depending on the output timing of the external trace data.
For that reason, if a code event and data event are closed, there are cases in whichtrace data can’t be got normally.
Condition Description
Address
Data
Access size
Status
Memory location (Address bits can be masked.)
32-bit data (Data bits can be masked.) Not applicable to codes
Byte, halfword, or word
Code/data read or data write (selectable)
Start Suspend
Program flow
Trace buffer
Resume SuspendResume
Suspend
114
CHAPTER2 Dependence Functions
2.3.7.1 Saving Trace Data
The debugger has function of saving trace data.
■ Saving Trace Data Save the trace data to the specified file.
For details on operations, refer to Sections "3.14 Trace Window", and "4.4.8 Trace" in
SOFTUNE Workbench Operation Manual; and Section "4.9 Show Trace" in SOFTUNE
Workbench Command Reference Manual.
115

CHAPTER2 Dependence Functions
2.3.7.2 Notes on Use of Tracing Function
This section describes the precautions to observe when displaying or searching for trace data.
■ Notes on Trace Function When the emulator debugger is in use, tracing is enabled by the following:
• Output address information at fetching branch instruction
For these reasons, note the following points when displaying and searching trace data
• Since address information is not output immediately after executing a program until the
branch instruction being executed, trace data may not be established on the program
executing side.
• When displaying disassembly, data is read from memory and processed. Therefore, the
displayed data may not be correct if the instruction is rewritten after code fetching.
• When specifying a starting frame number for searching data, an instruction longer than 2
bytes (LDI: 32, LDI: 20 instructions) may not be displayed correctly when the instruction
starting address is not specified.
• In the real-time mode, partial omission of trace data may occur under the following
conditions (Output trace omission information instead) because of the real-time operation.
- When branching occurs more than three times within 11 cycles.
- When data tracing occurs more than three times in succession.
• The address is not displayed until the first branching information is found, because the trace
data immediately before starting execution has been overwritten.
• If a break occurs under conditions such as the following combination of break points has
been set up in sequence at continuous addresses (code addresses of factors in case of data
event), the trace data immediately before the break is not displayed correctly.
- When break points set in sequence from software break to either one of I-group breaks at
continuous addresses.
- When break points set in sequence from either one of I-group breaks to either one of I-
group breaks at continuous addresses.
116
CHAPTER2 Dependence Functions
Reference:
The I-group breaks here means the following breaks:
• Hardware break
• Code event break
• Data event break
This occurs because the address next to the actual break factor address is detected as abreak cause simply by such next address being pre-fetched.
• When displaying valid pass cycles or instruction, the omitted trace data frame isdisplayed as follows:
Frame where address at code fetching could not be sampled.
• At step execution by a single instruction, trace data may not be sampled correctly foreach single instruction execution. If this happens, *** Address Lost Error *** isdisplayed.
*** Address Lost Error ***
117

CHAPTER2 Dependence Functions
2.3.8 Measuring Performance
It is possible to measure the time and pass count between two events. Repetitive measurement can be performed while executing a program in real-time, and when done, the data can be totaled and displayed.Using this function enables the performance of a program to be measured. To measure performance, set the event mode to the performance mode using the SET MODE command.
■ Performance Measurement Function The performance measurement function allows the time between two event occurrence to be
measured and the number of event occurrences to be counted. Up to 32767 event occurrences
can be measured.
• Measuring Time
Measuring time interval between two events.
Events can be set at 4 points (1 to 4). However, in the performance measurement mode, the
intervals, starting event number and ending event number are combined as follows. Two
intervals have the following fixed event number combination:
• Measuring Count
The specified events become performance measurement points automatically, and
occurrences of that particular event are counted.
Notes:
1. This function can be used only when FR60Lite is used.
2. This function cannot be used when the trace mode in set as the event mode.
Refer to “SET MODE” in SOFTUNE Workbench Command Reference.
3. There are cases when the actual code execution order and the data hit informationorder are switched, depending on the output timing of the external trace data.
For that reason, if a code event and data event are closed, the data on measuringperformance can’t be shown normally.
Interval Starting Event Number Ending Even Number
1 1 2
2 3 4
118

CHAPTER2 Dependence Functions
2.3.8.1 Performance Measurement Procedures
Performance can be measured by the following procedure:• Set event mode.• Set minimum measurement unit for timer.• Specify performance-buffer-full break.• Set events.• Execute program.• Display measurement result.• Clear measurement result.
■ Setting Event Mode Set the event mode to performance mode using the SET MODE command. This enables the
performance measurement function.
[Example]
>SET MODE/PERFORMANCE
>
■ Setting Minimum Measurement Unit for Timer Measuring unit of timer to be used for performance measurment is 1ns. Also, resolution of
measurement data is 25ns.
■ Setting Performance-Buffer-Full Break When the buffer for storing performance measurement data becomes full, a execution program
can be broken. This function is called the performance-buffer-full break. The performance
buffer becomes full when an event occurs 65535 times.
If the performance-buffer-full break is not specified, the performance measurement ends, but
the program does not break.
[Example]
>SET PERFORMANCE/NOBREAK ←Specifying Not Break
>
119
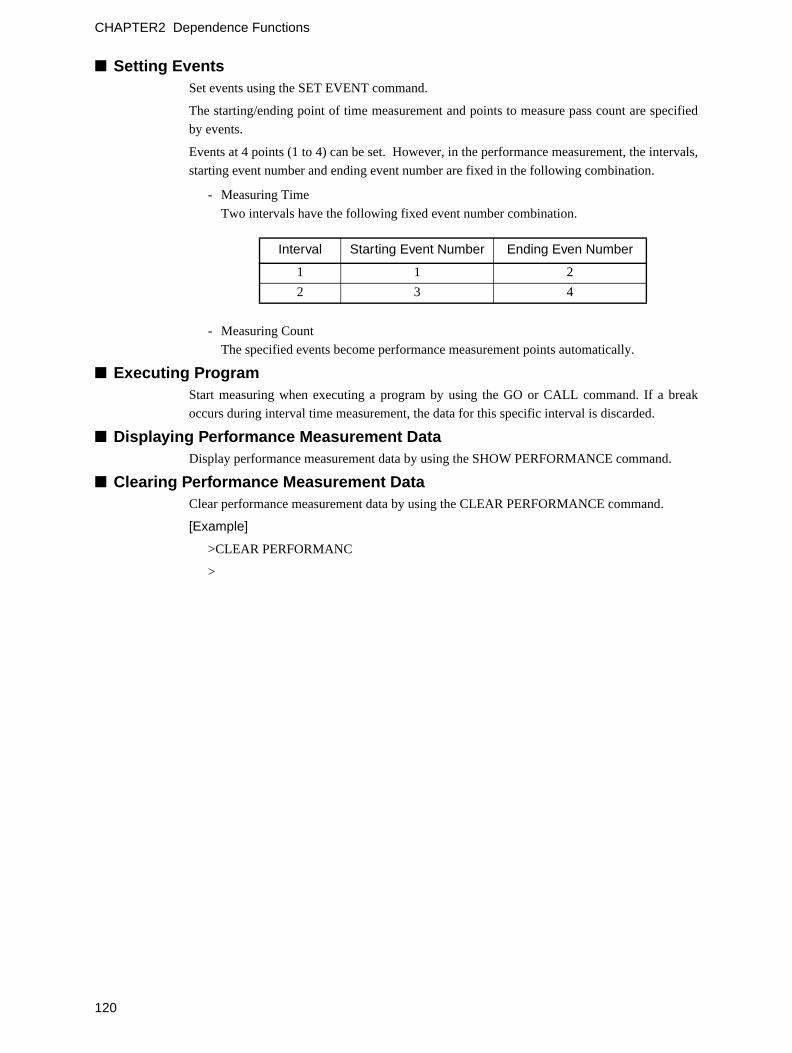
CHAPTER2 Dependence Functions
■ Setting Events Set events using the SET EVENT command.
The starting/ending point of time measurement and points to measure pass count are specified
by events.
Events at 4 points (1 to 4) can be set. However, in the performance measurement, the intervals,
starting event number and ending event number are fixed in the following combination.
- Measuring Time
Two intervals have the following fixed event number combination.
- Measuring Count
The specified events become performance measurement points automatically.
■ Executing Program Start measuring when executing a program by using the GO or CALL command. If a break
occurs during interval time measurement, the data for this specific interval is discarded.
■ Displaying Performance Measurement Data Display performance measurement data by using the SHOW PERFORMANCE command.
■ Clearing Performance Measurement Data Clear performance measurement data by using the CLEAR PERFORMANCE command.
[Example]
>CLEAR PERFORMANC
>
Interval Starting Event Number Ending Even Number
1 1 2
2 3 4
120

CHAPTER2 Dependence Functions
2.3.8.2 Displaying Performance Measurement Data
Display the measured time and measuring count by using the SHOW PERFORMANCE command.
■ Displaying Measured Time To display the time measured, specify the starting event number or the ending event number.
>SHOW PERFORMANCE/TIME
event = 1 -> 2
min time = 11637.0
max time = 17745.0
avr time = 14538.0
total
count
0
0
0
2
19
52
283
92
3
1
0
0
452
0.0 -
9000.0 -
10000.0 -
11000.0 -
12000.0 -
13000.0 -
14000.0 -
15000.0 -
16000.0 -
17000.0 -
18000.0 -
19000.0 -
8999.0
9999.0
10999.0
11999.0
12999.0
13999.0
14999.0
15999.0
16999.0
17999.0
18999.0
>SHOW PERFORMANCE/TIME 1,13000,16999,500
event = 1 -> 2
min time = 11637.0
max time = 17745.0
avr time = 14538.0
Total measuring count
Lower time limit for display
Upper time limit for display
Minimumexecution time
Maximumexecution time
Averageexecution time
Event number Count of measuring within given time interval
total
count
21
13
39
121
162
76
16
2
1
1
452
0.0 -
13000.0 -
13500.0 -
14000.0 -
14500.0 -
15000.0 -
15500.0 -
16000.0 -
16500.0 -
17000.0 -
12499.0
13499.0
13999.0
14499.0
14999.0
15499.0
15999.0
16499.0
16999.0
17499.0
The lower time limit, upper time limit and display interval can be specified. The specified time value is in 1 µs, when the minimum measurement unit is set to 1 µs by the SET TIMERSCALE command, and in 100 ns when the minimum is set to 100 ns.
121

CHAPTER2 Dependence Functions
2.3.9 Real-time Monitoring
This section explains the real-time monitoring function .
■ Command execution during program execution The function for displaying the memory contents while a program is running is called the real-
time monitoring function.
This emulator debugger has a real-time monitoring window that displays two 256-byte regions
for real-time monitoring. The real-time memory window has a function for reading data from
the actual memory and displaying it before program execution (copy function) and a function
for displaying updated data in red.
Note:
This function can be used only in the environment where an external trace function isavailable. The external trace function may not be used depending on the specification ofthe adapter board. Check your adapter board specification.
122

CHAPTER2 Dependence Functions
2.3.10 Power-on Debugging
This section explains power-on debugging.
■ Power-on debugging The MB2198 emulator provides power-on debugging function. This emulator can debug the
sequence performed immediately after target system power-on.
The power-on debugging procedure is described below:
1. Set the DIP switch on the adapter board mounted in the upper section of the emulator.
2. Power on the target board and emulator main unit.
3. Launch Workbench to start debugging.
- For debugging, set hardware breaks, etc.
4. To start power-on debugging, choose [Debug]-[Run]-[Power On Debug] command.
Input the lower volt in the power supply voltage setting dialog.
- The status bar then displays "PON".
5. Run the program.
6. Power the target board off while running and then power on again.
7. Execute debugging.
8. To quit power-on debugging, choose [Debug]-[Run]-[Power On Debug] command.
Notes:
1. The following condition is necessary to turn the target board off for power-ondebugging.
• Equal to or less than 25µs while user power supply descends from 0.9VCC to0.5VCC
• CPU frequency must higher than 1MHz
2. This function may not be used depending on the type of evaluation MCU. For details,contact Fujitsu’s sales department or support department.
123
CHAPTER2 Dependence Functions
2.3.11 Inaccessible Area
This section explains inaccessible area by the emulator debugger for the MB2198.
■ Inaccessible areaThe inaccessible area is a function that suppresses access to memory when the debugger
accesses a specified memory area (using commands, windows, etc. (*1)).
However, access to memory is not suppressed using program.
The following commands are used to set an inaccessible area.
SET MAP/INACCESSIBLE: Sets an inaccessible region.
SHOW MAP/INACCESSIBLE: Displays an inaccessible region.
CANCEL MAP/INACCESSIBLE: Deletes a specified inaccessible region.
ENABLE MAP/INACCESSIBLE: Enables a specified inaccessible region.
DISABLE MAP/INACCESSIBLE: Disables a specified inaccessible region.
(*1)
Memory operation command
Assemble/disassemble command
Load/save command
Built-in Variables and Functions (%BIT, %B, %H, %W, %L, %S, %D)
Formula
Trace
Vector
Memory window
Source window
Assemble window
Watch window
Local window
Symbol window
■ Access to memory area including inaccessible areaWhen there are inaccessible regions within those that are accessed, up to memory of
inaccessible region is accessed, an error is output when the inaccessible region is reached, and
access to the memory is suspended.
124
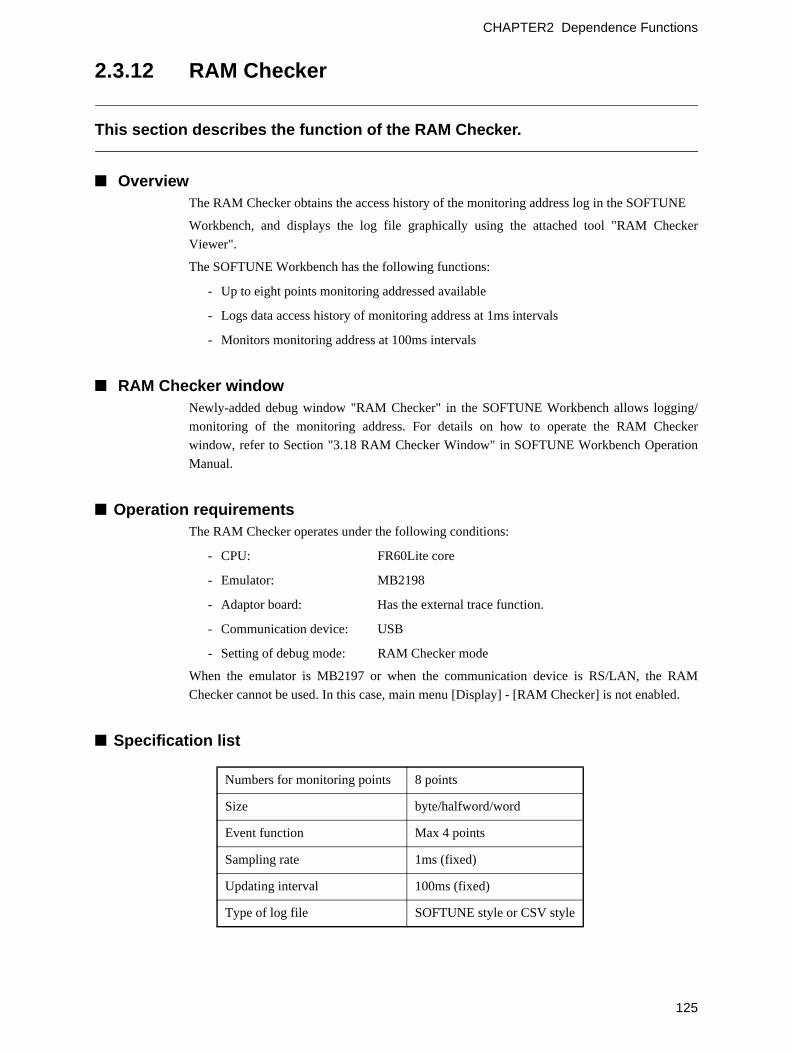
CHAPTER2 Dependence Functions
2.3.12 RAM Checker
This section describes the function of the RAM Checker.
■ OverviewThe RAM Checker obtains the access history of the monitoring address log in the SOFTUNE
Workbench, and displays the log file graphically using the attached tool "RAM Checker
Viewer".
The SOFTUNE Workbench has the following functions:
- Up to eight points monitoring addressed available
- Logs data access history of monitoring address at 1ms intervals
- Monitors monitoring address at 100ms intervals
■ RAM Checker windowNewly-added debug window "RAM Checker" in the SOFTUNE Workbench allows logging/
monitoring of the monitoring address. For details on how to operate the RAM Checker
window, refer to Section "3.18 RAM Checker Window" in SOFTUNE Workbench Operation
Manual.
■ Operation requirementsThe RAM Checker operates under the following conditions:
- CPU: FR60Lite core
- Emulator: MB2198
- Adaptor board: Has the external trace function.
- Communication device: USB
- Setting of debug mode: RAM Checker mode
When the emulator is MB2197 or when the communication device is RS/LAN, the RAM
Checker cannot be used. In this case, main menu [Display] - [RAM Checker] is not enabled.
■ Specification list
Numbers for monitoring points 8 points
Size byte/halfword/word
Event function Max 4 points
Sampling rate 1ms (fixed)
Updating interval 100ms (fixed)
Type of log file SOFTUNE style or CSV style
125

CHAPTER2 Dependence Functions
- SOFTUNE format
When displaying using the RAM Checker Viewer (SOFTUNE format recommended)
Default extension is ".SRL".
- CSV format
When other than the RAM Checker Viewer. The default extension is ".CSV".
Note:
The CSV format requires about four times the data size required for the SOFTUNEformat.
■ Using the RAM CheckerTo use the RAM Checker, set the monitoring point, log file, and logging state by GUI or
commands.
- GUI
On shortcut menu [Setting …] on the RAM Checker window, set the monitoring point.
On shortcut menu [File specification …] on the RAM Checker window, set the log file.
Check shortcut menu [Logging start …] on the RAM Checker window, to enable
the logging status of the RAM Checker.
- Commands
Use the SET RAMCHECK command to set the monitoring point.
Use the SET RAMCHECK command to set the log file.
Use the ENABLE RAMCHECK command to enable the logging status of the RAM
Checker.
When the program is stopped after executing the program with these items set, a log file is
generated. When the program is executed again, the log file is overwritten.
Note:
When file overwrite control is enabled by file setting on GUI, the log file is saved using"save as" every time the program is executed instead of being overwritten.
For details on settings of the RAM Checker, refer to Section "3.18 RAM Checker Window" in
SOFTUNE Workbench Operation Manual and Sections "4.24 SET RAMCHECK" to "4.28
"DISABLE RAMCHECK" in SOFTUNE Workbench Command Reference Manual.
■ Memory access during loggingDuring program execution, the emulator debugger reads/writes memory after causing MCU
break once to access, and then reexecuting the program. Therefore, when the emulator
debugger accesses memory, it cannot get a log at the time of the memory access correctly.
To prevent this, during logging, do not perform operation involving memory access (such as
SET MEMORY/SHOW MEMORY command operation and memory window operation).
126
CHAPTER2 Dependence Functions
■ Log fileThe following restriction is placed on the creatable log file size due to the file system to which
the log file is stored:
FAT: Up to 2GB
FAT32: Up to 4GB
NTFS: No restriction
Others: No restriction
When the file system is FAT or FAT32 and if the file size exceeds its limitation, the file name
is changed and logging continues.
Note:
When the log file exists already at this point, the log file is overwritten.
Operation example
If the file size exceeds its limitation, the log file is made as
filename.srl → filename#1.srl
If the file size exceeds its limitation again, the log file is made as
filename#1.srl → filename#2.srl
•
•
filename#N-1.srl → filename#N.srl
Notes:
1. Only internal HDD is supported for the log file storage destination. Network, externalHDD and external disk (such as CD, DVD and MO) are not supported for the log filestorage destination.
2. Storing the log file of the RAM Checker requires free disk space of 500MB or greater.When free disk space is less than 500MB, logging stops.
■ RAM Checker ViewerThe RAM Checker Viewer is a tool to graphically display the data value that changes as time
goes by. It displays data value in the following three formats:
- Bit display (image of Logic Analyzer)
- Data value display (line graph)
- Bit/data value display (simultaneous display of bit and data value)
Other display information includes CPU stop, trigger point, and data lost.
Regarding CPU stop, the STOP mode in a low power consumption mode and the power-off
state while using the power-on debug function are recorded in the log.
127

CHAPTER2 Dependence Functions
Trigger point uses event hit of the SOFTUNE Workbench. To use the trigger point, set events
in the SOFTUNE Workbench. When an event hits, its information is recorded in the log.
Data is lost due to the following two types of factors:
- Hardware
The emulator usually gets the RAM data access history at 1ms intervals. If data access
occurs to the same address twice or more within 1ms, the emulator gets only the data
accessed last. Data lost due to hardware indicates that data access is performed multiple
times.
- Software
The SOFTUNE Workbench usually gets data from the emulator at 100ms intervals.
However, it may not get data due to the effect of other applications, etc. at 100ms
intervals. In this case, although data cannot be displayed partially, the disabled time slot
is displayed graphically.
Note:
When logging stops due to break or execution stop, data lost due to software may bedisplayed for 1ms to 15ms at the end of the log. This occurs because the log afterprogram execution stops is obtained until logging stops, and so it is not an actual datalost. For details on the RAM Checker Viewer, refer to RAM Checker Viewer Manual(FswbRView.pdf) or online help information.
128

CHAPTER2 Dependence Functions
2.4 Monitor Debugger
This section describes the functions of the monitor debugger.
■ Monitor Debugger The monitor debugger performs debugging by putting the target monitor program for
debugging into the target system and by communicating with the host.
Before using this debugger, the target monitor program must be ported to the target hardware.
129

CHAPTER2 Dependence Functions
2.4.1 Resources Used by Monitor Program
The monitor program of the monitor debugger uses the I/O resources listed below. The target hardware must have these resources available for the monitor program.
■ Required Resources The following resources are required to build the monitor program into the target hardware.
UART RequiredFor communication with host computer
4800/9600/19200/38400 baud
Monitor ROM Required About 6 KB required (For further details, see Link Map.)
Work RAM Required About 2 KB required (For further details, see Link Map.)
NMI Switch Optional
Used for suspending program forcibly. If not
implemented, forced termination only can be performed
by reset, etc.
Timer OptionalUsed by SET TIMER/SHOW TIMER. Requires 32-bit
1
2
3
4
5
130

CHAPTER2 Dependence Functions
2.4.2 Break
The Monitor Debugger provides two types of break functions. When by each break function aborts program execution, the address where a break occurred and the break factor are displayed.
■ Break Functions The Monitor provides the following two types of break function;
- Software break
- Forced break
131

CHAPTER2 Dependence Functions
2.4.2.1 Software Break
A software break is a function to make a break by executing an instruction embedded in memory.The break occurs before executing the instruction at the specified address.
■ Software Break A software break is a function to make a break by executing an instruction embedded in
memory. The break occurs before executing the instruction at the specified address.
Up to 16 break points can be set.
When the software break occurs, the following message appears at the status bar.
Break at address by breakpoint
■ How to set Set the software break as follows.
• Command
- SET BREAK/SOFT
Refer to "SET BREAK" in SOFTUNE Workbench Command Reference.
• Dialog
"Code" tab in breakpoint setting dialog
Refer to "Break" in SOFTUNE Workbench Operation Manual
• Window
Source window/disassemble window
Note:
There are two points to note when using software break point.
1. Software breaks cannot be set in read only areas, such as ROM. If an attempt ismade to do so, a verify error occurs at program startup (continuous execution in batchprocessing, step execution, etc.).
2. Always set a software break at the instruction start address. Setting a software breakpoint in the middle of an instruction, may cause a software error.
132

CHAPTER2 Dependence Functions
2.4.2.2 Forced Break
This function forcibly aborts the program execution to generate a break.
■ Forced Break This function forcibly aborts the program execution to generate a break.
When the forced break occurred, the following message appears at the status bar.
Break at address by command abort request
Note:
The forced break cannot be generated when the MCU is in the low power consumptionmode or in the hold state. If the MCU is in the low power consumption mode or in thehold state when the strong break is requested by the [Debug]-[Abort] command during theprogram execution, the [Debug]-[Abort] command is ignored. To generate a breakforcibly, use the [Debug]-[Abort] command to remove a factor by the user system or usethe [Debug]-[Reset of MCU] command to remove it. If the MCU enters the low powerconsumption mode or the hold state during the program execution, the conditions isdisplayed at the status bar.
133

CHAPTER2 Dependence Functions
2.4.3 Measuring Execution Time
The program instruction execution time can be displayed by using either the [Debug]-[Time Measurement] command, or the SHOW TIMER command in the Command window.
■ Measuring Execution Time Measures program execution time.
The measurement result can be displayed as two time values: the execution time of the
preceding program, and the total execution time of the programs (total execution time before
preceding program plus execution time of preceding). Measurement is performed each time a
program is executed.
To display the execution time, use either the [Debug]-[Time Measurement] command, or the
SHOW TIMER command in the Command window. Clear the measured values using the
CLEAR TIMER command.
Measurement is in 1 µs units. The maximum measurement time is about 70 minutes. The
measurement result may have ± 10 µs error.
134
CHAPTER2 Dependence Functions
2.4.4 Inaccessible Area
This section explains inaccessible area by the monitor debugger.
■ Inaccessible areaThe inaccessible area is a function that suppresses access to memory when the debugger
accesses a specified memory area (using commands, windows, etc.*).
However, access to memory is not suppressed using program.
The following commands are used to set an inaccessible area.
SET MAP/INACCESSIBLE: Sets an inaccessible region.
SHOW MAP/INACCESSIBLE: Displays an inaccessible region.
CANCEL MAP/INACCESSIBLE: Deletes a specified inaccessible region.
ENABLE MAP/INACCESSIBLE: Enables a specified inaccessible region.
DISABLE MAP/INACCESSIBLE: Disables a specified inaccessible region.
*: Memory operation command
Assemble/disassemble command
Load/save command
Built-in Variables and Functions (%BIT, %B, %H, %W, %L, %S, %D)
Formula
Vector
Memory window
Source window
Assemble window
Watch window
Local window
Symbol window
■ Access to memory area including inaccessible areaWhen there are inaccessible regions within those that are accessed, up to memory of
inaccessible region is accessed, an error is output when the inaccessible region is reached, and
access to the memory is suspended.
135

CHAPTER2 Dependence Functions
136

INDEX
The index follows on the next page.This is listed in alphabetic order.
137

Index
Symbols
-] .................................................................................61, 93
A
Active ProjectActive Project ............................................................2Active Project Configuration ...................................4
Alignment Error BreakAlignment Error Break ...................................69, 104
AssemblyLine Assembly ........................................................25
Automatic LoadingMonitoring Program Automatic Loading .............87
AttributesMemory Area Access Attributes ..........................35
C
C/C++Notes on C/C++ Symbols .....................................30Specifying C/C++ Variables ..................................29
Cache Flush ControlCache Flush Control ........................................59, 89
CheckerRAM Checker Viewer ..........................................127RAM Checker window .........................................125Using the RAM Checker ......................................126
Code BreakCode Break .................................................41, 64, 96
Code Event BreakCode Event Break ............................................66, 99
CommandCommand Execution while Executing Program
......................................................................62, 94Command execution during program execution
..........................................................................122Branch Instruction
Notes on Delayed Branch Instruction when executed using[Debug] -[Run] -[Step In] or [Debug] - [Run] - [Step Over] command ......................................................................93, 61
BreakAlignment Error Break ...................................69, 104Code Break .................................................41, 64, 96Code Event Break ............................................66, 99Data Break ........................................................42, 98Data Event Break .................................................101Data Monitoring Break .........................................107External Trigger Break ..................................70, 105Forced Break ....................................45, 71, 106, 133Guarded Access Breaks .......................................44Restrictions when Suspended by Software Break
......................................................................61, 93Setting Performance-Buffer-Full Break .............119Software Break .....................................................132Trace Buffer-full Break ............................43, 68, 103
Break FunctionsBreak Functions ..................................40, 63, 95, 131
138

Build FunctionBuild Function ...........................................................6Customize Build Function .......................................7
Bus CyclesDisplay Bus Cycles ................................................78
CustomizeCustomize Build Function .......................................7
CyclesDisplay Bus Cycles ................................................78
E
DRAMDRAM Refresh Control ..........................................58
Data BreakData Break .........................................................42, 98
Data Event BreakData Event Break ...........................................67, 101
Data Monitoring BreakData Monitoring Break .........................................107
EditorExternal Editor ........................................................14Standard Editor .......................................................13
DebuggerEmulator Debugger ....................................22, 55, 85Monitor Debugger ...........................................22, 129Simulator Debugger .........................................22, 32Type of debugger ...................................................22
Delayed Branch InstructionNotes on Delayed Branch Instruction when
executed using[Debug] -[Run] -[Step In] or [Debug] - [Run] - [Step Over] command ......................................................................61, 93
DisassemblyDisassembly ............................................................25
Display FormatDisplay Format of Trace Data ..............................78
Emulator DebuggerEmulator Debugger ....................................22, 55, 85
ErrorError ..................................................................72, 111
Error Jump FunctionError Jump Function ..............................................11
Event ModeSetting Event Mode ..............................................119
EventsSetting Events .......................................................120
Execution TimeMeasuring Execution Time .................................134
ExpansionExamples of Macro Expansion .............................20
External EditorExternal Editor ........................................................14
External ToolExternal Tools .........................................................16
External Trace ModeExternal Trace Mode ........................................57, 88
External Trigger BreakExternal Trigger Break ...................................70, 105
External memory emulationExternal memory emulation ..................................91
G
Forced BreakForced Break ....................................45, 71, 106, 133
FrameFrame Number ..........................................48, 75, 113
Guarded Access BreaksGuarded Access Breaks .......................................44
Full Trace ModeFull Trace Mode ................................................57, 88
I
I/O Port SimulationI/O Port Simulation (Input Port) ............................36I/O Port Simulation (Output Port) .........................36
Inaccessible areaAccess to memory area including inaccessible
area ....................................................84, 124, 135Inaccessible area ...................................84, 124, 135
Include DependenciesAnalyzing Include Dependencies ..........................9
InstructionDisplay Only Instruction Operation ................51, 78Instruction Simulation ............................................34Notes on Delayed Branch Instruction when
executed using[Debug] -[Run] -[Step In] or [Debug] - [Run] - [Step Over] command ......................................................................93, 61
Notes on Instruction to Clear T-Flag when Executed using[Debug] -[Run] -[Step In] or [Debug] - [Run] - [Step Over] command ......................................................................61, 93
InternalInternal Trace Mode ...............................................57
Internal Trace ModeInternal Trace Mode .........................................57, 88
InterruptInterrupt Simulation ................................................37
M
MCUSetting MCU Operation Mode ........................57, 88
MacroExamples of Macro Expansion ............................20Macro .......................................................................17Macro List ............................................................7, 17
Make FunctionMake Function ..........................................................6
Measured TimeDisplaying Measured Time .................................121
MeasurementClearing Performance Measurement Data
..........................................................................120Displaying Performance Measurement Data
..........................................................................120Performance Measurement Function ................118Setting Minimum Measurement Unit for Timer
..........................................................................119Measuring
Clear of the measuring result .................46, 72, 111
139

Measuring Execution Time .................................134The measuring item .................................46, 72, 111View of the measuring result ..................46, 72, 111
MemoryMemory Area Access Attributes ...........................35Memory Simulation ................................................35
Memory OperationsFunctions for Memory Operations .......................23
Memory SpaceSimulation Memory Space ....................................35
Memory accessMemory access during logging ..........................126
Line AssemblyLine Assembly .........................................................25
Line NumberLine Number Information .......................................27
LinesDisplay by Unit of Source Lines .....................51, 78
Minimum Measurement UnitSetting Minimum Measurement Unit for Timer
..........................................................................119Loading
Monitoring Program Automatic Loading .............87Mode
External Trace Mode ........................................57, 88Full Trace Mode ................................................57, 88Internal Trace Mode .........................................57, 88RAM Checker mode ...............................................92RealTimeMemory mode ........................................92Real-time Mode ................................................57, 88Setting Event Mode ..............................................119Setting MCU Operation Mode ........................57, 88Setting of debug mode ..........................................92
Log fileLog file ....................................................................127
Monitor DebuggerMonitor Debugger ...........................................22, 129
Monitoring ProgramMonitoring Program Automatic Loading .............87
O
Operating ConditionsOperating Conditions .............................................32
Operating EnvironmentOperating Environment ..........................................21Setting Operating Environment ......................56, 86
Operating frequenciesOperating frequencies .....................................60, 90
Operation ModeSetting MCU Operation Mode ..............................57
Optional SettingsExample of Optional Settings ...............................15
OptionsFunction of Setting Tool Options ..........................10Setting Options .............................................7, 14, 16Tool Options ............................................................10
Q
Performance MeasurementClearing Performance Measurement Data
..........................................................................120Displaying Performance Measurement Data
..........................................................................120Performance-Buffer-Full Break
Setting Performance-Buffer-Full Break .............119Port
I/O Port Simulation (Input Port) ............................36I/O Port Simulation (Output Port) .........................36
Power-Save Consumption ModePower-Save Consumption Mode Simulation
............................................................................39Power-on debugging
Power-on debugging ............................................123Program
Command Execution while Executing Program ......................................................................62, 94
Command execution during program execution ..........................................................................122
Executing Program ..............................................120Real-time Functionality in Running Program
......................................................................61, 93Project
Active Project ............................................................2Active Project Configuration ...................................4Project ........................................................................2Project Configuration ...............................................4Project Dependence ................................................5Project Management Function ...............................3Project format ............................................................3Restrictions on Storage of Two or More Projects
..............................................................................2
S
RAMRAM Checker Viewer ..........................................127RAM Checker mode ..............................................92RAM Checker window .........................................125Using the RAM Checker ......................................126
RAM CheckerRAM Checker Viewer ..........................................127RAM Checker window .........................................125
RAM Checker modeRAM Checker mode ..............................................92
ScopeMoving Scope .........................................................28Scope .......................................................................28
RealTimeMemory modeRealTimeMemory mode ........................................92
Real-time FunctionalityReal-time Functionality in Running Program
......................................................................61, 93Real-time Mode
Real-time Mode ................................................57, 88Search Procedure
Specifying Symbol and Search Procedure ............................................................................28
140
Refresh ControlDRAM Refresh Control ..........................................58
Register OperationsRegister Operations ...............................................24
ResetReset Simulation ....................................................38
ResourcesRequired Resources ............................................130
SequencerControl by Sequencer ..........................................109
SimulationI/O Port Simulation (Input Port) ............................36I/O Port Simulation (Output Port) .........................36Instruction Simulation ............................................34Interrupt Simulation ................................................37Memory Simulation ................................................35Power-Save Consumption Mode Simulation
............................................................................39Reset Simulation ....................................................38Simulation Memory Space ....................................35Simulation Range ...................................................33
Simulator DebuggerSimulator Debugger .........................................22, 32
Specification listSpecification list ....................................................125
Software BreakRestrictions when Suspended by Software Break
......................................................................61, 93Software Break .....................................................132
Source LinesDisplay by Unit of Source Lines .....................51, 78
Standard EditorStandard Editor .......................................................13
SubprojectSubproject ..................................................................2
- ..................................................................................61, 93Storage
Restrictions on Storage of Two or More Projects ..............................................................................2
SymbolNotes on C/C++ Symbols ......................................30Setting Symbol Information ...................................26Specifying Symbol and Search Procedure
............................................................................28Types of Symbols ...................................................26
SyntaxSyntax ......................................................................11
U
TBR RegisterValue of TBR Register .....................................61, 93
T-FlagNotes on Instruction to Clear T-Flag when
Executed using[Debug] -[Run] -[Step In] or [Debug] - [Run] - [Step Over] command ......................................................................61, 93
ToolFunction of Setting Tool Options .........................10Tool Options ............................................................10
ToolsExternal Tools .........................................................16
TraceClearing Trace Data .........................................54, 81Display Format of Trace Data ........................51, 78Displaying Trace Data .....................................50, 77External Trace Mode .......................................57, 88Full Trace Mode ................................................57, 88Internal Trace Mode .........................................57, 88Notes on Trace Function ...............................82, 116Saving Trace Data ...................................53, 80, 115Searching Trace Data ......................................52, 79Setting Trace .....................................................49, 76Setting Trace Trigger ...........................................114Trace ..................................................................47, 73Trace Buffer ..........................................................112Trace Data .................................................47, 74, 112Trace Sampling ................................................48, 75Trace filter ..............................................................113
Trace BufferTrace Buffer-full Break ..........................................43
Trace Buffer-full BreakTrace Buffer-full Break ............................43, 68, 103
W
WorkspaceWorkspace ................................................................2Workspace Management Function ........................2
Z
debug modeSetting of debug mode ..........................................92
emulationExternal memory emulation ..................................91
frequenciesOperating frequencies .....................................60, 90
loggingMemory access during logging ..........................126
141

142

CM71-00329-3E
FUJITSU SEMICONDUCTOR • CONTROLLER MANUAL
FR FAMILY
SOFTUNETM WORKBENCH
USER’S MANUAL
for V6
July 2006 the third edition
Published FUJITSU LIMITED Electronic Devices
Edited Business Promotion Dept.
