frac horsepower report - coras research · frac horsepower report ... frac demand likely reaches...
TRANSCRIPT

Daniel A. CruiseSenior Research Analyst(713) [email protected] chat: cruise, daniel
Key Takeaways
1) Marketed frac utilization is now >85%2) Prices are moving meaningfully higher3) Another 3-4 million HP potentially reactivated by June4) Attrition has been disappointing5) Momentum could stall by late 2017
Frac Horsepower ReportPrices hitting an inflection

Daniel Cruise, Senior Analyst(713) 518-14202
Frac Horsepower Inventory ReportExecutive Summary
Report Takeaway. In this pressure pumping study, we take a closer look at the tightening frac market, comparing our fleet tracking data with real-time completion and frac demand. Echoing our June report, service companies have stacked too much equipment, leaving only 8-9 million horsepower to service 7-8 million in demand and resulting in an inflection in frac prices. Near term, we are anticipating price improvements of 30-50% and continued momentum through mid-2017 (PTEN and HAL best positioned). Longer term, momentum could stall in 2H17 (RES best hedge) as 7 million horsepower (16-17 million total available) eventually gets redeployed.
Marketed frac utilization is now >85%...Based on our bottom up fleet counts, we estimate that the frac market currently needs around 7-8 million horse-power, roughly 87% of the 8-9 million horsepower that is currently being marketed. Our data assumes that some “calendar white space” is inherent in the fracking business - and therefore our industry utilization tracks higher than individual company commentary.
...Resulting in a notable increase frac prices. As we laid out in our June inventory report, the reduction in marketed capacity has resulted in near-term equipment shortages in several locations. This has driven fleet reactivations and pricing increases of 5-15% (20-30% in some cases).
Over 1 MM horsepower has already been reactivated...We have counted over 20 fleets (ONE million horsepower) that have been reactivated or rede-ployed since May. These reactivations have come from large frac companies like SLB and SPN, mid-tier companies like FTS and Keane, and start-ups like ProFrac Services.
...with another 3-4 MM horsepower of reactivations likely bv mid-2017. With frac providers fielding numerous inquiries, another 3-4 million horsepower could be reactivated by mid-2017. Companies that we believe could reactivate by the summer include HAL, BJ Services, FTS, and Keane, among others.
Frac demand likely reaches 10-11 MM HP (65% of total capacity) by YE 2017. Going forward, we are anticipating frac demand to reach 10-11 million horsepower by YE 2017, roughly inline with our prior report. Although we are increasing our 2017E macro assumptions post-OPEC (now assuming rig count of 750 rigs by YE 2017 and 40% y/y spending), our frac demand forecast remains unchanged as more capital is allocated to new well drilling (and less to completion activity) and DUC backlog normalizes in early 2017 (see our Backlog report published 11/10/16).
Long-term oversupply becomes a concern by late-2017. While demand will continue to rise through 2017, industry attrition during the 2015 / 2016 downturn has disappointed. In fact, we count only 3-4 million horsepower that has been permanently retired, which suggests another 7 million horsepower could eventually be redeployed (16-17 million total horsepower available by 2018). To be more positive long-term, the industry needs to...1) have higher than $65 oil prices and/or 2) see more consolidation like the recent PTEN-SVNT deal.
Frac prices hitting an inflection

Daniel Cruise, Senior Analyst(713) 518-14203
Frac Horsepower Inventory Report2017 Recovery Will Begin With 16 Million HorsepowerSlide Takeaway. In this slide, we have summarized our data of roughly 16 million U.S. horsepower, including 9 million of actively marketed equipment. Actively marketed horsepower is defined as equipment that has worked at least once in the last 3 months, based off public well completion data and in-dustry sources. Marketed horsepower has increased by ONE million since the trough in 2Q16.
Coras Frac Inventory Report - 4Q16
Coras Frac Inventory Report (4Q16)
PermianEagle Ford
Bakken / Rockies
Marcellus / Utica
Other (Midcon, E. TX, Vert)
Active Horsepower
Hot stacked
Cold stacked
Total U.S. Horsepower
Permanently out of service*
HAL HAL 435 360 324 203 550 1,872 237 115 2,224 831 BHI BJS Newco 120 - - 34 85 239 342 769 1,350 600 SLB SLB 110 360 52 79 70 671 464 128 1,263 337 FTS FTS 200 116 - 216 336 868 366 216 1,450 150 RES RES 285 40 - - 120 445 389 97 931 - WFT WFT 95 - - - 110 205 153 462 820 150 PPS PPS 250 40 - - - 290 65 25 380 40 CJES CJES 240 80 102 - 65 487 160 253 900 300 CFW CFW - - 135 90 - 225 240 186 650 54 PTEN PTEN 212 80 - 165 - 457 444 111 1,012 - TCW Keane 203 - 32 260 45 540 82 322 944 - SSE SSE - 111 - - 118 229 190 81 500 - Liberty Liberty 115 - 217 - - 332 114 114 560 - Archer Quintana - - - - 60 60 66 139 265 125 SPN SPN 280 180 - - - 460 145 33 638 112 Rockpile Rockpile 54 - 54 - - 108 - - 108 - USWS USWS - - - 129 - 129 129 32 290 - BAS BAS 60 - - - 135 195 124 64 384 60
Other/E&Ps 500 36 26 169 400 1,131 115 103 1,350 784 Total HP (4Q16) 3,159 1,403 942 1,346 2,094 8,944 3,825 3,251 16,019 3,542
*Coras Research estimates based on age and use of equipment. Will often differ from management estimates and commentsSource: Coras Research, LLC

Daniel Cruise, Senior Analyst(713) 518-14204
Frac Horsepower Inventory ReportONE Million Horsepower (20 fleets) Back To WorkSlide Takeaway. In this slide, we walk through ONE million horsepower that has been redeployed since the trough. As shown in the table to the left, the increase in horsepower has ranged from large companies like SLB and SPN, to mid-sized names like Keane, and small start-ups like ProFrac Services. As shown in the graph to the right, the majority of the reactivated horsepower has been placed into the Midcon, Rockies, and Permian.
Marketed Horsepower - By Company Marketed Horsepower - By Basin
Marketed/Active HorsepowerPeak
NameplatePeak Active /
Marketed 2Q16 4Q16Chg From
2Q Trough
HAL 3,055 2,914 1,872 1,872 0BJS Newco 1,950 1,776 239 239 0SLB 1,600 1,544 490 671 181FTS 1,600 1,396 765 868 103RES 931 722 445 445 0WFT 970 970 310 205 -105 PPS 420 280 180 290 110CJES 1,200 1,035 429 487 58CFW 704 675 180 225 45PTEN 1,012 793 457 457 0Keane 944 614 368 540 172SSE 500 360 229 229 0Liberty 560 458 332 332 0Quintana 390 340 60 60 0SPN 750 525 348 460 112Rockpile 108 88 81 108 27USWS 290 193 161 129 -32 BAS 444 375 195 195 0Other 2,134 2,158 719 1,131 412Frac HP (000) 19,562 17,216 7,861 8,944 1,083
Source: Coras Research, LLC
-
2,000
4,000
6,000
8,000
10,000
12,000
14,000
16,000
18,000
20,000
1Q14
2Q14
3Q14
4Q14
1Q15
2Q15
3Q15
4Q15
1Q16
2Q16
3Q16
4Q16
UticaMarcellusNiobraraMid-conBakkenEagle FordPermian
Marketed/Active HP Source: Coras Research
Hors
epow
er (0
00)
ONE Million (20 fleets) in Horsepower Redeployments

Daniel Cruise, Senior Analyst(713) 518-14205
Frac Horsepower Inventory ReportTWELVE small frac companies have RE-EMERGED
Twelve small frac companies have re-emerged
Slide Takeaway. As part of the reactivations, 12 small frac companies have started back operations in the U.S. (or plan to soon) with equipment that was previously thought to be cannibalized, cut-up, international bound, or budget constrained. Meanwhile, another 20 companies have been permanently sidelined, with the majority of that horsepower being absorbed by the surviving 30 frac companies.
Updated Frac Company ListStayed alive (operationally) Re-emerged Still dead
18 Co.; 14.5 MM HP 12 Co; 1.5 MM HP 20 Co.; 5 MM HP (3 MM scrapped)
HAL Elite Well Services Compass Well ServicesBJ Services Bayou (merged w/ BJS) Cimarron AcidSLB Stingray (now TUSK) Frac Specialists LLCFTS Evolution Pro-StimRES Refinery Specialties Inc. Quasar Energy ServicesWFT TOPS Energy Services Circle ZPropetro ProFrac Services Stimulation Pumping ServicesCJES GoreN2 Python Pressure PumpingCFW PSC Torqued-UpPTEN Shack Energy Services McClintonKeane Greenfield (sold to ESES - marketing Permian) Rising Star ServicesLiberty Premier Pressure Pumping Petroplex AcidizingConsolidated SpinnakerSPN Archer Limited (for sale by Quintana)Rockpile Advanced Stimulation (sold to Endeavor)USWS Platinum (acquired by PTEN)BAS GasFrac (acquired by STEP)Tucker Trican (sold to Keane)
Sanjel (sold to Liberty)GoFrac (2 fleets acquired by SSE)HAL, BJS, SLB, CJES scrapping
Source: Coras Research, LLC

Daniel Cruise, Senior Analyst(713) 518-14206
Frac Horsepower Inventory ReportTHREE Million Horsepower Is Targeting The PermianSlide Takeaway. Of the 8-9 Million actively marketed horsepower, we count roughly 3 Million horsepower (35%) targeting the Permian between 25 differ-ent companies. Meanwhile, the Eagle Ford, Bakken/Rockies, and Marcellus/Utica have become slightly less competitive with fewer than 10 companies marketing 1-1.5MM horsepower in each region.
Permian25%
Eagle Ford18%Bakken /
Rockies13%
Marcellus / Utica15%
Other (Midcon, E. TX, Vert)
29%
Permian35%
Eagle Ford16%
Bakken / Rockies
11%
Marcellus / Utica15%
Other (Midcon, E. TX, Vert)
23%
Actively Marketed Horsepower - PEAK 2014 Actively Marketed Horsepower - CURRENT 4Q16

Daniel Cruise, Senior Analyst(713) 518-14207
Frac Horsepower Inventory ReportFrac Demand Is 7-8 MM Horsepower (87% Of Marketed HP)Slide Takeaway. In addition to tracking marketed horsepower of 8-9 million, we also calculate frac demand of 7-8 million horsepower based on our well completion activity, frac intensity, crew availability (i.e. 24-hour work) and efficiency data. Comparing marketed capacity with current demand, we esti-mate that industry utilization is tracking around 87% in 4Q. Our industry utilization data typically runs higher than what individual companies report due to our assumption of normal “calendar white space”.
HP Demanded vs Marketed1Q14 2Q14 3Q14 4Q14 1Q15 2Q15 3Q15 4Q15 1Q16 2Q16 3Q16 4Q16
Permian 3,172 3,332 3,567 3,689 3,409 2,911 2,453 2,478 2,212 2,359 2,634 2,877Eagle Ford 2,143 2,397 2,655 2,984 2,257 1,480 1,866 1,247 1,197 1,144 1,124 1,045Bakken/Rockies 1,504 1,691 1,894 1,918 1,517 1,269 933 1,004 715 607 828 877Marcellus/Utica 1,307 1,833 2,026 2,063 1,577 1,752 1,499 1,028 770 823 787 962Other/Midcon 4,036 4,138 4,265 4,028 3,227 2,152 2,245 1,944 1,753 1,415 1,847 2,012 HP Demand (000) 12,162 13,391 14,407 14,683 11,987 9,564 8,997 7,701 6,647 6,347 7,221 7,774
Large major svc 6,454 6,780 6,954 6,954 6,545 6,025 5,308 4,095 3,197 2,820 3,031 2,988Public (or once was) 4,209 4,525 4,948 5,099 4,894 4,375 4,094 3,867 3,154 2,651 2,805 3,038Large private 1,963 2,122 2,262 2,327 2,295 2,096 1,772 1,497 1,485 1,438 1,493 1,619Small private 2,343 2,596 2,771 2,836 2,533 2,166 1,867 1,598 1,198 953 1,174 1,299 HP Marketed (000) 14,969 16,022 16,935 17,216 16,267 14,662 13,041 11,058 9,035 7,861 8,503 8,944
Marketed Utilization (%) 81% 84% 85% 85% 74% 65% 69% 70% 74% 81% 85% 87%Source: Coras Research, LLC
Higher well completions and frac intensity has increased frac demand to 7.8 million horsepower
Marketed horsepower is higher than the market appreciates

Daniel Cruise, Senior Analyst(713) 518-14208
Frac Horsepower Inventory ReportMarketed Utilization Is Tight At 87%Slide Takeaway. With frac demand now roughly 8 million horsepower, we believe MARKETED utilization has increased to 87%, up from below 70% in 2015 / early 2016 and inline with MARKETED utilization in 2014. However, with only 3-4 million horsepower being retired during the 2015 / 2016 downturn, TOTAL utilization remains below 50%, suggesting that MARKETED utilization may have peaked and could begin to fall as more horsepower is deployed.
20%
30%
40%
50%
60%
70%
80%
90%
100%
1Q14
2Q14
3Q14
4Q14
1Q15
2Q15
3Q15
4Q15
1Q16
2Q16
3Q16
4Q16
Marketed utilization (%)Total utilization (%)
Utilization (Total vs Effective) Source: Coras ResearchUt
ilizat
ion
(%)
Demand has increased to almost 8 MM HP since May
2,000
4,000
6,000
8,000
10,000
12,000
14,000
16,000 Horsepower demanded
Horsepower demanded Source: Coras Research
Hors
epow
er
Marketed Utilization is now above 85%

Daniel Cruise, Senior Analyst(713) 518-14209
Frac Horsepower Inventory ReportCompletion Activity Is Improving In MOST BasinsSlide takeaway. Completion activity, the largest component of horsepower demand, has increased by 30% from 2,700 wells at the bottom in 2Q. While the Permian had been a key driver, completion activity has also surprised in both the Rockies/Bakken and Mid-con (up 30-50% off the bottom). Meanwhile, the Eagle Ford has been slow to recover as several E&Ps wrap-up DUC activity and transition to new drilling work. Going forward, we are anticipating a 40% y/y increase in horizontal completions in 2017 while frac demand could increase to 10-11 million horsepower by late 2017 (from 7-8 million currently).
Completions By Basin
-
100
200
300
400
500
600
700
800
900
Permian completions (horz only) Source: Coras Research
Wel
ls
0
500
1,000
1,500
2,000
2,500
3,000
3,500
Eagle Ford horsepower demanded Source: Coras research
Hors
epow
er (0
00)
0
500
1,000
1,500
2,000
2,500
Bakken/Rockies HP demanded Source: Coras research
Hors
epow
er (0
00)
0
500
1,000
1,500
2,000
2,500
Marcellus/Utica horsepower dmanded Source Coras research
Hors
epow
er (0
00)
Horsepower Demand By Basin
0
500
1,000
1,500
2,000
2,500
3,000
3,500
4,000
Permian horsepower demanded Source: Coras research
Horsepow
er(000)
-
200
400
600
800
1,000
1,200
Eagle Ford completions Source: Coras Research
Wel
ls
-
200
400
600
800
1,000
1,200
Bakken/Rockies completions Source: Coras Research
Wel
ls
-
100
200
300
400
500
600
700
Marcellus/Utica completions Source: Coras Research
Wel
ls

Daniel Cruise, Senior Analyst(713) 518-142010
Frac Horsepower Inventory ReportFrac Prices Hitting An InflectionSlide takeaway. As frac demand increases, tight marketed utilization could drive prices up 30-50% to $50,000/stage (fully loaded including sand, chem-icals etc) by mid-2017, in our view. Meanwhile, EBITDA margins could move into positive territory (from -5% in 3Q) as better pricing combines with im-proved utilization. On a negative note, the near term pricing momentum could stall by late 2017 as 3-4 million horsepower is reactivated by mid year and potentially 7 million horsepower by 2018.
$30,000 $40,000 $50,000 $60,000 $70,000 $80,000 $90,000
$100,000 $110,000 $120,000 $130,000
1Q08
4Q08
3Q09
2Q10
1Q11
4Q11
3Q12
2Q13
1Q14
4Q14
3Q15
2Q16
1Q17
E4Q
17E
Avg frac price (fully loaded) Source: Coras Research
$/St
age
-15%
-10%
-5%
0%
5%
10%
15%
20%
25%
Oil service average EBITDA % Source: Company filings
Frac prices could rise 30-40% over the next 6-months Higher frac prices will likely push EBITDA margins into + territory

Daniel Cruise, Senior Analyst(713) 518-142011
Frac Horsepower Inventory ReportAttrition Has Been DisappointingSlide takeaway. While near-term utilization is tight, the industry has permanently retired a disappointing 3 Million horsepower. As shown below, private companies have retired ONE million horsepower, while we estimate the large cap service companies have retired TWO million horsepower (potentially less if the new BJ Service group aggressively rebuilds stacked equipment). Meanwhile, start-ups like ProFrac Servicers are redeploying auctioned equipment into key markets with some blue-chip E&Ps. On a positive note, the recent WFT announcement will take as much as 500k of marketed horsepower imme-diately off the market, offsetting some of the near-term reactivations.
U.S. Frac Inventory SummaryActive
HorsepowerPeak
NameplateHot
StackedCold
StackedPermanently
out of service
Large cap svc 2,988 7,575 1,196 1,473 1,918 Public (or once was) 3,038 6,485 1,773 1,148 525 Large private 1,619 2,870 674 387 190 Small private 1,299 2,632 181 242 909 Frac HP (000) 8,944 19,562 3,825 3,251 3,542
Source: Coras Research, LLC
Private companies have retired a measly One Million horsepower
Horsepower Attrition Has Been Disappointing

Daniel Cruise, Senior Analyst(713) 518-142012
Frac Horsepower Inventory ReportPrice Momentum Could Stall By Late-2017Slide takeaway. Despite increasing demand, actively marketed utilization could begin to stall by mid-2017. As shown in the far right columns, our revised assumption of 750 rigs by YE 2017 implies that frac demand will increase by 30-40% over the next four quarters (50% increase in horsepower at 850 rigs). However, in both scenarios, horsepower demand will remain below 12 million horsepower, total utilization will remain at or below 70%, and marketed uti-lization could start to decline with continued redeployments.
Permian Eagle Ford Bakken/Rockies Marcellus/Utica Total U.S. Frac model (4Q17E)
2Q16 4Q16 2Q16 4Q16 2Q16 4Q16 2Q16 4Q16 2Q16 4Q16Base case (750 rigs)
Bull case (850 rigs)
Frac hours demandedStages demanded 16,829 24,861 9,224 11,291 9,339 14,409 5,534 7,205 50,525 70,506 103,012 115,017Hours per stage 4.6 4.1 3.5 3.2 2.3 2.5 4.3 3.8 3.8 3.6 3.5 3.5Frac hours required 77,876 102,104 32,285 36,131 21,479 36,022 23,650 27,671 189,997 251,515 356,691 397,925Add: Downtime/mobe 18% 18% 18% 18% 18% 18% 18% 18% 18% 18% 18% 18%Total frac hours demanded 95,425 124,966 39,560 44,221 26,320 44,088 28,979 33,866 232,810 307,829 434,267 484,468
Qtrly Hours per fleet (more 24-hr work = more 1,443 1,641 1,384 1,693 1,342 1,730 1,354 1,415 1,301 1,481 1,550 1,563
Fleets/HP demandedFleets needed 66 76 29 26 20 25 21 24 179 208 280 310HP per fleet 35,668 37,780 40,000 40,000 30,193 34,404 38,461 40,218 35,470 37,401 37,515 37,499HP needed (000) 2,359 2,877 1,144 1,045 607 877 823 962 6,347 7,774 10,509 11,621MARKETED HP 2,620 3,159 1,397 1,403 879 942 1,228 1,346 7,861 8,944 13,648 14,710MARKETED UTILIZATION (%) 90% 91% 82% 74% 69% 93% 67% 72% 81% 87% 77% 79%Nameplate Capacity 16,451 16,230 16,439 16,439Total Utilization (%) 39% 48% 64% 71%
Souce: Coras Research, LLC
Marketed utilization may have already peaked as horsepower is quickly redeployed
Total utilization could remain low through 2017

Daniel Cruise, Senior Analyst(713) 518-142013
Frac Horsepower Inventory ReportPublic Companies Taking Back ShareSlide takeaway. After being relative laggards in 3Q, the key public frac companies have gained notable share over the last few months. Specifically, data collected from public sources suggest 4Q market share has increased for PTEN, SPN (despite COG loss), and HAL to 3.7%, 4.5% and 36.5%, re-spectively. Meanwhile, market share for companies like SLB, FTSI, and Liberty have declined, partially due to less availability (i.e. less white space) of their staffed fleets (according to our utilization data).
Frac market share by frac provider
U.S. Land - Frac Market share (%)1Q14 2Q14 3Q14 4Q14 1Q15 2Q15 3Q15 4Q15 1Q16 2Q16 3Q16 4Q16
HAL 25.5% 25.3% 24.2% 22.4% 27.6% 30.0% 31.0% 32.1% 34.1% 35.9% 36.2% 36.5%BJS 12.3% 10.5% 10.7% 10.2% 7.8% 7.9% 7.0% 4.2% 3.4% 2.3% 1.9% 1.4%SLB 10.6% 10.2% 9.9% 10.7% 11.7% 10.0% 10.8% 10.3% 9.3% 11.3% 11.8% 10.3%RES 3.5% 3.1% 3.1% 3.3% 3.2% 3.3% 3.7% 4.0% 3.1% 3.0% 3.9% 4.6%WFT 5.2% 6.8% 5.9% 5.9% 4.4% 3.7% 3.5% 2.6% 3.0% 3.3% 3.3% 3.5%CJES 5.9% 5.5% 6.2% 6.2% 5.9% 5.3% 4.7% 5.5% 5.5% 5.4% 5.1% 5.6%CFW 3.3% 4.0% 3.9% 3.9% 4.7% 4.0% 3.2% 3.9% 3.9% 3.6% 2.8% 2.3%PTEN 3.4% 3.5% 3.6% 4.2% 3.4% 3.2% 3.3% 3.1% 2.9% 2.7% 2.2% 3.7%SSE 1.8% 1.8% 1.7% 1.8% 2.6% 2.9% 3.1% 2.5% 2.4% 2.7% 2.1% 2.4%SPN 4.0% 3.6% 3.5% 3.5% 3.4% 3.3% 3.9% 3.6% 3.5% 3.6% 3.5% 4.5%BAS 1.0% 1.1% 1.1% 1.2% 0.9% 0.7% 0.7% 0.8% 0.6% 0.8% 0.6% 1.4%
Source: Coras Research, LLC

Daniel Cruise, Senior Analyst(713) 518-142014
Frac Horsepower Inventory ReportPTEN & HAL Best Way To Play Current TightnessSlide takeaway. While we are pessimistic about frac supply/demand fundamentals in 2018, the near-term inflection in pricing and utilization will positively impact the U.S. focused stocks. On that note, we prefer PTEN & HAL as the best way to play the current tightness, primarily due to their geographic and customer diversification (particularly after PTENs purchase of SSE).
Coras Research Coverage & Ranking
Coras Research Ranking 17E Growth (Y/Y) 18E Growth (Y/Y) 2018E EBITDA ($MM) EV/EBITDA ('18E) CorasRank Company Ticker Coras Cons. Coras Cons. Coras Cons. % diff Coras Street
1 U.S. Silica SLCA 72% 72% 49% 50% $412 $384 7% 10.1x 10.9x2 Halliburton HAL 9% 20% 19% 27% $4,343 $5,383 -19% 12.9x 10.4x3 Patterson-UTI PTEN 31% 44% 34% 48% $332 $489 -32% 13.4x 9.1x4 Superior Energy SPN 9% 22% 31% 33% $269 $467 -42% 13.8x 8.0x5 Nabors Industries NBR 6% 14% 21% 31% $743 $1,017 -27% 10.4x 7.6x6 FairmountSantrol FMSA 93% 50% 45% 44% $422 $277 52% 6.4x 9.8x7 Helmerich & Payne HP -3% 6% 25% 48% $380 $563 -33% 22.3x 15.1x8 RPC Inc RES 38% 61% 37% 49% $261 $389 -33% 16.4x 11.0x
Source: Bloomberg, Company filings, Coras Research, LLC
Daniel Cruise, Senior Analyst(713) 518-142015
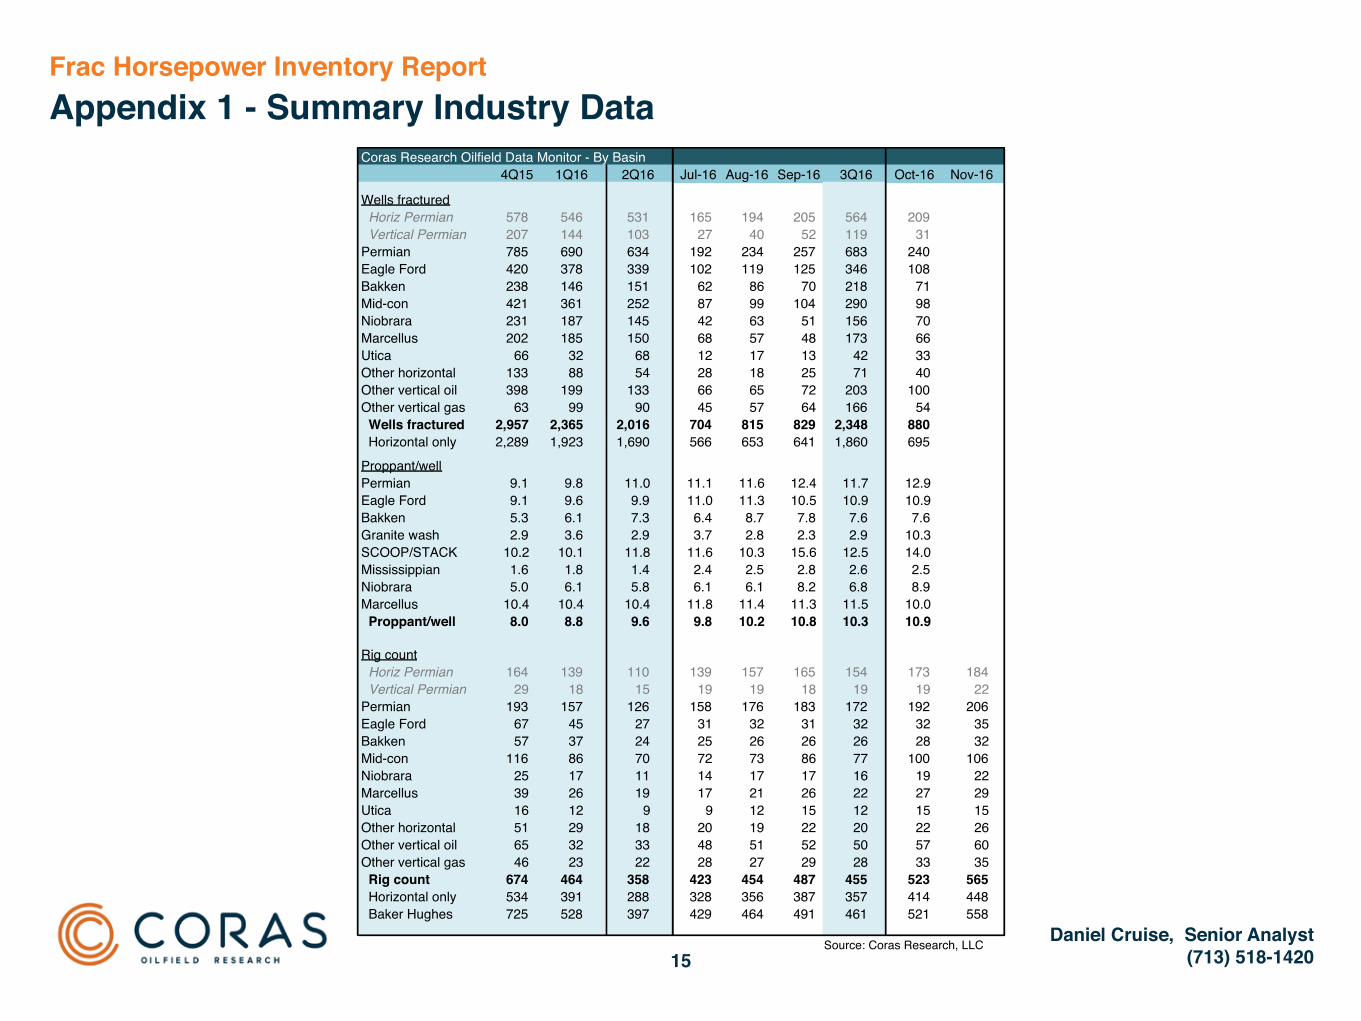
Frac Horsepower Inventory ReportAppendix 1 - Summary Industry Data
Coras Research Oilfield Data Monitor - By Basin4Q15 1Q16 2Q16 Jul-16 Aug-16 Sep-16 3Q16 Oct-16 Nov-16
Wells fractured Horiz Permian 578 546 531 165 194 205 564 209 Vertical Permian 207 144 103 27 40 52 119 31 Permian 785 690 634 192 234 257 683 240 Eagle Ford 420 378 339 102 119 125 346 108 Bakken 238 146 151 62 86 70 218 71 Mid-con 421 361 252 87 99 104 290 98 Niobrara 231 187 145 42 63 51 156 70 Marcellus 202 185 150 68 57 48 173 66 Utica 66 32 68 12 17 13 42 33 Other horizontal 133 88 54 28 18 25 71 40 Other vertical oil 398 199 133 66 65 72 203 100 Other vertical gas 63 99 90 45 57 64 166 54 Wells fractured 2,957 2,365 2,016 704 815 829 2,348 880 Horizontal only 2,289 1,923 1,690 566 653 641 1,860 695
Proppant/wellcopy paste - replace this section onlyPermian 9.1 9.8 11.0 11.1 11.6 12.4 11.7 12.9
Eagle Ford 9.1 9.6 9.9 11.0 11.3 10.5 10.9 10.9 Bakken 5.3 6.1 7.3 6.4 8.7 7.8 7.6 7.6 Granite wash 2.9 3.6 2.9 3.7 2.8 2.3 2.9 10.3 SCOOP/STACK 10.2 10.1 11.8 11.6 10.3 15.6 12.5 14.0 Mississippian 1.6 1.8 1.4 2.4 2.5 2.8 2.6 2.5 Niobrara 5.0 6.1 5.8 6.1 6.1 8.2 6.8 8.9 Marcellus 10.4 10.4 10.4 11.8 11.4 11.3 11.5 10.0 Proppant/well 8.0 8.8 9.6 9.8 10.2 10.8 10.3 10.9
Rig count Horiz Permian 164 139 110 139 157 165 154 173 184 Vertical Permian 29 18 15 19 19 18 19 19 22 Permian 193 157 126 158 176 183 172 192 206 Eagle Ford 67 45 27 31 32 31 32 32 35 Bakken 57 37 24 25 26 26 26 28 32 Mid-con 116 86 70 72 73 86 77 100 106 Niobrara 25 17 11 14 17 17 16 19 22 Marcellus 39 26 19 17 21 26 22 27 29 Utica 16 12 9 9 12 15 12 15 15 Other horizontal 51 29 18 20 19 22 20 22 26 Other vertical oil 65 32 33 48 51 52 50 57 60 Other vertical gas 46 23 22 28 27 29 28 33 35 Rig count 674 464 358 423 454 487 455 523 565 Horizontal only 534 391 288 328 356 387 357 414 448 Baker Hughes 725 528 397 429 464 491 461 521 558
Source: Coras Research, LLC

Daniel Cruise, Senior Analyst(713) 518-142016
Coras Research LLC is an independent research provider. The Company is not a member of the FINRA or the SIPC and is not a registered broker dealer or investment adviser. The Company has no other regulated or unregulated business activities which conflict with its provision of independent research. No employee or member of Coras Research LLC, or immediate family member thereof, exercises investment discretion over, or holds any position in, securities of any issuer analyzed by the Company.
Nothing contained this Report should be construed as any offer to sell, or any solicitation of an offer to buy, any security or investment. Any research or other material received should not be construed as individualized investment advice. Investment decisions should be made as part of an overall portfolio strategy and you should consult with a profes-sional financial advisor, legal and tax advisor prior to making any investment decision. Coras Research LLC shall not be liable for any direct or indirect, incidental or consequential loss or damage (including loss of profits, revenue or goodwill) arising from any investment decisions based on information or research obtained from the Company.
This Report is produced and copyrighted by Coras Research LLC, and any unauthorized use, duplication, redistribution or disclosure is prohibited by law and can result in pros-ecution. The opinions and information contained herein have been obtained or derived from sources believed to be reliable, but Coras Research LLC makes no representation as to their timeliness, accuracy or completeness or for their fitness for any particular purpose. This Report is not an offer to sell or a solicitation of an offer to buy any security. The information presented in this Report is for general information only and does not specifically address individual investment objectives, financial situations or the particular needs of any specific person who may receive this Report. Investing in any security or investment strategies discussed may not be suitable for you and it is recommended that you consult an independent investment advisor. Nothing in this Report constitutes individual investment, legal or tax advice. Coras Research LLC may issue or may have issued other reports that are inconsistent with or may reach different conclusions and opinions than those represented in this Report, and all opinions are reflective of judgments made on the original date of publication. Those reports may reflect the different assumptions, views and analytical methods of the analysts who prepared them and Coras Research LLC is under no obligation to ensure that other reports are brought to the attention of any recipient of this Report or to update or keep current the information contained in other reports so that such information is consistent with, or not contrary to, the information contained in this Report. Coras Research LLC shall accept no liability for any loss arising from the use of this report, nor shall Coras Research LLC treat all recipients of this report as customers simply by virtue of their receipt of this material. Investments involve risk and an investor may incur either profits or losses. Past performance should not be taken as an indication or guarantee of future performance. No Coras Research LLC officers, employees, agents and/or affiliates may serve as officers or directors of covered companies, or may own more than one percent of a covered company’s stock
DISCLOSURES