fractional crystallization feed envelope
TRANSCRIPT
RPP-RPT-36854, Rev. 0
Fractional Crystallization Feed Envelope
D. L. HertingCH2M HILL Hanford Group, Inc.Richland, WA 99352U.S. Department of Energy Contract DE-AC27-99RL14047
EDT/ECN:Cost Center:B&RCode:
DRF74AlO
UC:Charge Code:Total Pages: ;il, 7
Key Words: fractional, crystallization, feed, envelope, limits, evaporation, tests, process, vacuum,saturated, brine, solution, filter, cake, variables, aluminate, phosphate, sulfate, hydroxide, EDTA, HEDTA,NTA, thermodynamic, modeling, slurry, ICP, boildown, responses, bumping, frothing, filtrate, filtration,crystals, chromate, decontamination factor, sodium, recovery, saltcake
Abstract: Laboratory work was completed on a set ofevaporation tests designed to establish a feedenvelope for the fractional crystallization process. The feed envelope defines chemical concentration limitswithin which the prOcess can be operated successfully. All 38 runs in the half-factorial design matrix werecompleted successMly, based on the qualitative definition of success. There is no feed composition likelyto be derived from saltcake dissolution that would cause the fractional crystallization process to not meetacceptable performance requirements. However, some compositions clearly would provide moresuccessful operation than other compositions.
TRADEMARK DISCLAIMER. Reference herein to any specific commercial product. process, or service by trade name,trademark. manufacturer, or otherwise, does not necessarily constitute or imply Its endorsement, recommendation, orfavoring by the United States Govemment or any agency thereof or its contractors or subcontractors.
Printed In the United Slates of America. To obtain copies of this document, contact: Document Control Services,P.O. Box 950, Mailstop H6-06, Richland WA 99352, Phone (509) 372-2420: Fax (509) 376-4989.
10:
-'---,@DATE:
STA: 15
Release tamp
Approved For Public Release
A·6002·767 (REV 1)
RPP-RPT-36854Revision 0
FRACTIONAL CRYSTALLIZATION FEED ENVELOPE
D. L. HertingCH2M HILL Hanford Group, Inc.
Date PublishedMarch 2008
CH2MHILLHanford Group, Inc.
Prepared for the u.s. Department of EnergyOffice afRiver Protection
Contract No. DE-AC27-99RLI 4047
RPP-RPT-36854, Rev. 0
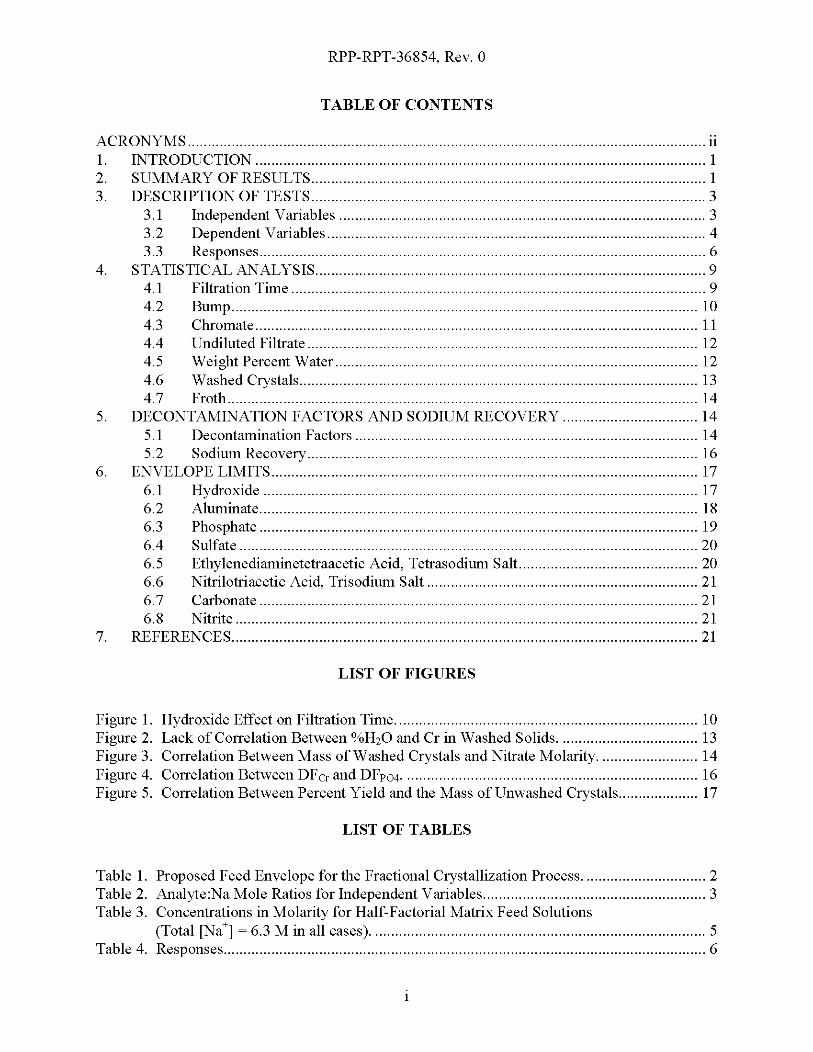
TABLE OF CONTENTS
ACRONYMS ii1. INTRODUCTION 12. SUMMARY OF RESULTS 13. DESCRIPTION OF TESTS 3
3.1 Independent Variables 33.2 Dependent Variables 43.3 Responses 6
4. STATISTICAL ANALySIS 94.1 Filtration Time 94.2 Bump 104.3 Chromate 114.4 Undiluted Filtrate 124.5 Weight Percent Water 124.6 Washed Crystals 134.7 Froth 14
5. DECONTAMINATION FACTORS AND SODIUM RECOVERY 145.1 Decontamination Factors 145.2 Sodium Recovery 16
6. ENVELOPE LIMITS 176.1 Hydroxide 176.2 Aluminate 186.3 Phosphate 196.4 Sulfate 206.5 Ethylenediaminetetraacetic Acid, Tetrasodium Salt 206.6 Nitrilotriacetic Acid, Trisodium Salt 216.7 Carbonate 216.8 Nitrite 21
7. REFERENCES 21
LIST OF FIGURES
Figure 1. Hydroxide Effect on Filtration Time 10Figure 2. Lack of Correlation Between %H20 and Cr in Washed Solids 13Figure 3. Correlation Between Mass of Washed Crystals and Nitrate Molarity 14Figure 4. Correlation Between DFcr and DFpo4 16Figure 5. Correlation Between Percent Yield and the Mass of Unwashed Crystals 17
LIST OF TABLES
Table 1. Proposed Feed Envelope for the Fractional Crystallization Process 2Table 2. Analyte:Na Mole Ratios for Independent Variables 3Table 3. Concentrations in Molarity for Half-Factorial Matrix Feed Solutions
(Total [Na+] ~ 6.3 M in all cases) 5Table 4. Responses 6

RPP-RPT-36854, Rev. 0
Table 5. Concentrations of Metals by Inductively Coupled Plasma Spectroscopy in WashedCrystals (mg/g) 7
Table 6. Calculated Cr(VI) Concentration at Different Variable Settings [sorted by calculatedCr(VI) concentration] 12
Table 7. Decontamination Factors and %Yield 15
ACRONYMS
BElDFEDTAGeorgia TechHEDTAICPNDNTA
best-basis inventorydecontamination factorethylenediaminetetraacetic acid, tetrasodium saltGeorgia Institute of TechnologyN-(2-hydroxyethyl)ethylenediaminetriacetic acid, trisodium saltinductively coupled plasma spectroscopynot determinednitrilotriacetic acid, trisodium salt
11

RPP-RPT-36854, Rev. 0
1. INTRODUCTION
Laboratory work was completed on a set of evaporation tests designed to establish a feedenvelope for the fractional crystallization process, as outlined in the test plan (Interoffice memo7S II O-DLH-07-122, "Test Plan for Envelope Limit Factorial Design Test"). The feed envelopedefines chemical concentration limits within which the process can be operated successfully.Qualitatively, successful operation is defined as
a. The solution can be evaporated under vacuum without excessive frothing or bumping(see Section 3.3 for definitions).
b. The slurry resulting from the evaporation can be separated effectively into solid andliquid streams, resulting in adequate decontamination of the crystals.
c. The amount of sodium in the recovered crystals represents a reasonable percentage of thetotal sodium in the feed solution.
The laboratory program was based on a half-factorial design matrix with six independentvariables at two levels each, resulting in 32 runs (half of26
), plus six center points for a total of38 runs. Each run consisted of vacuum evaporation of a simulated waste solution, filtration ofthe slurry resulting from the evaporation, washing of the filter cake with a saturated brinesolution, and collection and analysis of the washed filter cake. Results were subjected to astatistical analysis of the data (PNNL-17380, Analysis ofResults from the Design Envelope LimitExperiment).
The independent variables were selected based on their potential for having an impact on theprocess outcome. The six variables selected were aluminate, phosphate, sulfate, hydroxide,ethylenediaminetetraacetic acid, tetrasodium salt/N-(2-hydroxyethyl)ethylenediaminetriaceticacid, trisodium salt (EDTA/HEDTA) and nitrilotriacetic acid, trisodium salt (NTA). Section 3.1provides additional discussion on the selection of these independent variables.
2. SUMMARY OF RESULTS
All 38 runs in the half-factorial design matrix were completed successfully, based on thequalitative definition of success defined in Section 1. In other words, there is no feedcomposition likely to be derived from saltcake dissolution that would cause the fractionalcrystallization process to not meet acceptable performance requirements. However, somecompositions clearly would provide more successful operation than other compositions.
Table I shows the proposed feed envelope for the fractional crystallization process. There are nolower concentration limits for the process, i.e., the concentration of any component could be setto zero without causing process failure. The upper concentration limit for each analyte is shownin the table in two ways, analyte:Na mole ratio and analyte molarity. The analyte:Na mole ratiois more versatile in that it may be calculated for any feed solution at any concentration, but thesevalues are not "intuitive." Therefore, concentration limits are also given in molarity of eachanalyte for a solution normalized to 5 M total sodium.
I

RPP-RPT-36854, Rev. 0
Three previous feed envelope evaluations were made, one based on thermodynamic modeling(RPP-34455, Hanford Medium/Low Curie Waste Pretreatment Alternatives Project - Subtask 2.1and Subtask 2.2) and two based on laboratory testing (RPP-RPT-34136, Hanford Medium/LowCurie Waste Pretreatment Alternatives Project - Phase II, Subtask 2.5 and Subtask 2.6, andRPP-RPT-35261, Fractional Crystallization Laboratory Tests with Simulated Tank Waste).Results of the prior evaluations are incorporated into the values entered in Table I, as discussedin Section 5.
Table 1. Proposed Feed Envelope for the Fractional Crystallization Process.
Maximum Concentration(Envelope Limit)
AnalvteAnalyte:Na MolarityMole Ratio at5MNa Consequence of Exceedine: Maximum Concentration Limit
OH (042 -AI)' (2 I-AI)' Sodium vield elroos <50%CO) 0.50 2.5 None; limited onlv bv solubilitvAl 0.15 0.75 High viscositv, Door seoaration, low vieldCr04 NDb ND Unlikelv to cause oroblemsK ND ND Unlikelv to cause oroblemsP04 0.06 0.30 Increased risk of transfer pipe plugging; excessive bumping in
evaporatorS04 0.06 0.30 NoneF ND ND Higher concentrations are beneficialCI ND ND Unlikelv to cause oroblemsNO, 0.20 1.0 Sodium vield elroos <50%NO) 1.00 5.0 None~O4 ND ND Limited only by solubility(oxalate)EDTA' 0.0014 0.007 Bumoing/frothing, Door seoarationHEDTA" 0.0014 0.007 Bumoing/frothing, Door seoarationNTA' 0.00025 0.0013 Bumoing/frothing, Door seoarationa OH limit depends on AI concentration; e.g., if Al:Na mole ratio = 0.10, then OH:Na limitis 0.42 - 0.10 = 0.32; alternatively,if A! concentration~ 0.5 M (at 5 MNa), then the OH limit is 2.1-0.5 ~ 1.6 M.b ND = not determinedC EDTA = ethylenediaminetetraacetic acid, tetrasodiurn saltd HEDTA ~ N-(2-liydroxyethyl)ethylenediaminetriacetic acid, trisodium salteNTA = nitrilotriacetic acid, trisodiurn salt
The concentration limits in Table I are approximate, and are not rigid, but serve as a preliminaryguideline for feed evaluation. Both thermodynamic modeling and the results of the half-factorialtest clearly show that component interactions play an important role in determining wastebehaviors. For example, filtration time, which is one measure of the efficiency of solid/liquidseparation, increases with increasing phosphate concentration but only when the sulfateconcentration is low. The effect reverses at high sulfate concentration. This is one example of asignificant interaction, several of which were revealed by the half-factorial test results.Therefore, the attempt to describe a feed envelope by listing the maximum concentration of eachanalyte in the feed (which is exactly what is attempted in Table I) is simplistic and the valuesmust be considered approximations.
2

RPP-RPT-36854, Rev. 0
3. DESCRIPTION OF TESTS
The test matrix was based on a half-factorial design with six independent variables at two levelseach [High (+1) and Low (-I)] plus six center points (0), for a total of38 runs. Each runconsisted of a vacuum evaporation (called a boildown) of the prescribed feed solution at aconstant temperature of 60°C. The planned end point for each boildown was the point at whichthe slurry contained 30% solids. With no way to measure the percent solids in the slurrydirectly, the end point was chosen in practice by comparing the apparent slurry density againstprior baseline or practice tests using "SST Early" feed.
When the boildown end point was reached, the slurry was poured into a temperature-controlledvacuum filter (medium glass frit filter with water jacket). The filter cake was washed five timeswith small portions of a saturated brine solution. (In a few cases, the wash was performed fourtimes with a slightly larger volume of wash liquid for each wash.) The washed filter cake wascollected and analyzed for (a) percent water (%H20) by oven drying and (b) elementalconcentrations (AI, Cr, P, Na) by inductively coupled plasma spectroscopy (ICP). The ICPanalysis was not a requirement included in the test plan (7SII0-DLH-07-122) but was addedafter consultation with the customer.
3.1 INDEPENDENT VARIABLES
Six independent variables were selected based on their potential for having an impact on theprocess outcome. The six variables and their settings are shown in Table 2. The low (-I) value foreach variable was set equal to the concentration in the simulated SST Early feed solution used inprior tests (RPP-RPT-35261, RPP-RPT-34136, and others), except for the levels ofEDTA/HEDTA and NTA, which were absent in SST Early. For those variables, the low value wasset equal to one-half of the high value.
Table 2. Analyte:Na Mole Ratios for Independent Variables.
Sum of EDTA and HEDTA concentratIons, WIth eqru-rnolar amounts of each.
Variable Low (-1) Medium (0) Hi~h (+1)
Al 0.046 0.098 0.150PO, 0.007 0.0335 0.060SO, 0.022 0.031 0.040OR 0098 0.204 0.310EDTAiHEDTA 0.0014 0.0021 0.0027NTA 0.000125 0.00019 0.00025,
The high (+ I) values for the inorganic variables were derived from the best-basis inventory(BBI) information available at the time of the study. The values in Table 2 represent thepractical upper limits that would be observed in dissolved saltcake retrieved from single-shelltanks in the 200 West Area. For the organic variables (EDTA/HEDTA and NTA), the highvalues were set at one-half of the value that resulted in processing problems in a prior laboratorystudy (RPP-RPT-34136) at the Georgia Institute of Technology (Georgia Tech).
Medium (0) values in all cases were set at the midpoint between the high and low values.
3

RPP-RPT-36854, Rev. 0
3.2 DEPENDENT VARIABLES
The variable held constant in all 38 runs was the total Na concentration, which was set at theSST Early value of 6.3 M. To increase the Analyte:Na ratio of one or more of the independentvariables in Table 2, the laws of chemistry require that the Analyte:Na ratio of one or more of theremaining solution components (the dependent variables) must decrease. Several alternativemethods were evaluated for maintaining the charge balance. The method selected was todecrease all of the dependent variable concentrations in proportion to their concentrations inSST Early feed. The dependent variables were Na2C03, NaCI, Na2Cr04, NaF, KN03, NaN02,NaN03, and Na3C6Hs07 (sodium citrate). Concentrations of all the solution components areshown in molarity in Table 3.
4
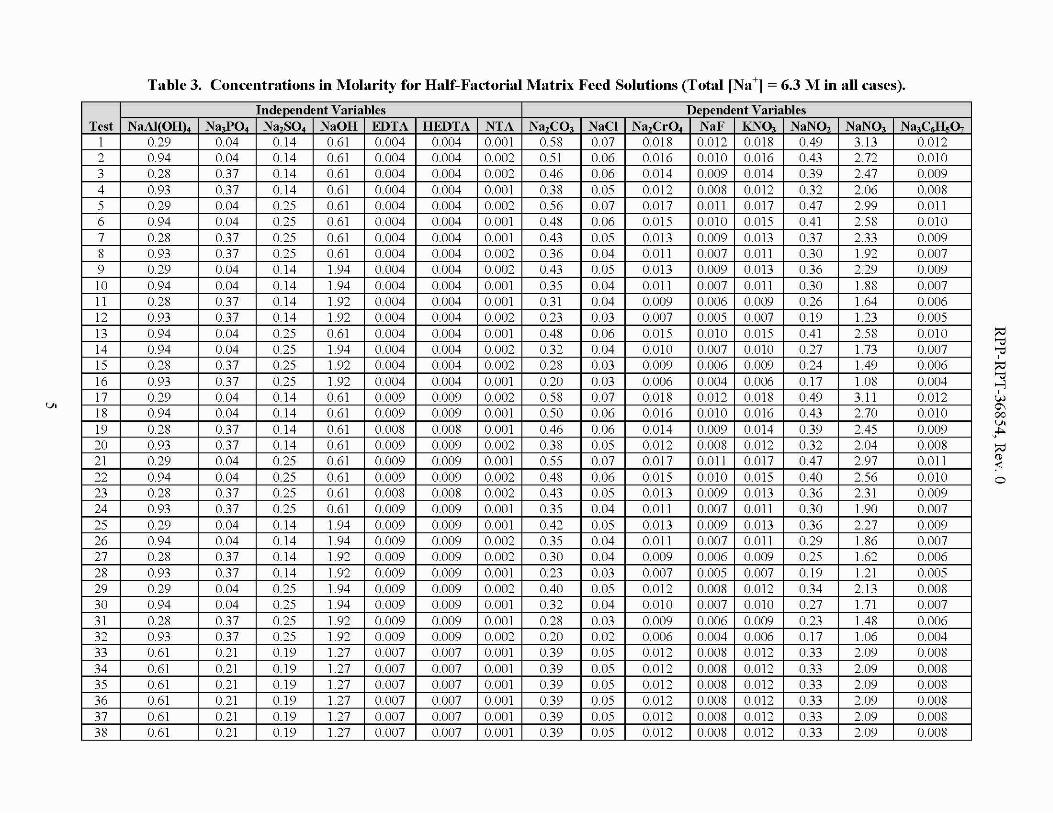
Table 3. Concentrations in Molarity for Half-Factorial Matrix Feed Solutions (Total INa+1 = 6.3 M in all cases).
Independent Variables Dependent VariablesTest NaAI(OHl, Na,PO, Na,S04 NaOH EDTA HEDTA NTA Na,CO, NaCI Na,CrO NaF KN<h NaNO, NaNO, Na,C.H,o,
I 0.29 0.04 0.14 0.61 0.004 0.004 0.001 0.58 0.07 0.018 0.012 0.018 OA9 3.13 0.0122 0.94 0.04 0.14 0.61 0.004 0.004 0.002 0.51 0.06 0.016 0.010 0.016 OA3 2.72 0.0103 0.28 0.37 0.14 0.61 0.004 0.004 0.002 OA6 0.06 0.014 0.009 0.014 0.39 2A7 0.0094 0.93 0.37 0.14 0.61 0.004 0.004 0.001 0.38 0.05 0.012 0.008 0.012 0.32 206 0.0085 0.29 0.04 0.25 0.61 0.004 0.004 0.002 0.56 0.07 0.017 0.011 0.017 OA7 2.99 0.0116 0.94 0.04 0.25 0.61 0.004 0.004 0.001 OA8 0.06 0.015 0.010 0.015 OAI 2.58 0.0107 0.28 0.37 0.25 0.61 0.004 0.004 0.001 OA3 0.05 0.013 0.009 0.013 0.37 2.33 0.0098 0.93 0.37 0.25 0.61 0.004 0.004 0.002 0.36 0.04 0.011 0.007 0.011 0.30 1.92 0.0079 0.29 0.04 0.14 1.94 0.004 0.004 0.002 OA3 0.05 0.013 0.009 0.013 0.36 2.29 0.00910 0.94 0.04 0.14 1.94 0.004 0.004 0.001 0.35 0.04 0.011 0.007 0.011 0.30 1.88 0.007II 0.28 0.37 0.14 1.92 0.004 0.004 0.001 0.31 0.04 0.009 0.006 0.009 0.26 1.64 0.00612 0.93 0.37 0.14 1.92 0.004 0.004 0.002 0.23 003 0.007 0.005 0.007 0.19 1.23 0.00513 0.94 0.04 0.25 0.61 0.004 0.004 0.001 OA8 0.06 0.015 0.010 0.015 OAI 2.58 0.01014 0.94 0.04 0.25 1.94 0.004 0.004 0.002 0.32 0.04 0.010 0.007 0.010 0.27 1.73 0.00715 0.28 0.37 0.25 1.92 0.004 0.004 0.002 0.28 003 0.009 0.006 0.009 0.24 IA9 0.00616 0.93 0.37 0.25 1.92 0.004 0.004 0.001 0.20 003 0.006 0.004 0.006 017 1.08 0.00417 0.29 0.04 0.14 0.61 0.009 0.009 0.002 0.58 0.07 0.018 0.012 0.018 OA9 3.11 0.01218 0.94 0.04 0.14 0.61 0.009 0.009 0.001 0.50 0.06 0.016 0.010 0.016 OA3 2.70 0.01019 0.28 0.37 0.14 0.61 0.008 0008 0.001 OA6 0.06 0.014 0.009 0.014 0.39 2A5 0.00920 0.93 0.37 0.14 0.61 0.009 0.009 0.002 0.38 0.05 0.012 0.008 0.012 0.32 204 0.00821 0.29 0.04 0.25 0.61 0.009 0.009 0.001 0.55 0.07 0.017 0.011 0.017 OA7 2.97 0.01122 0.94 0.04 0.25 0.61 0.009 0.009 0.002 OA8 0.06 0.015 0.010 0.015 OAO 2.56 0.01023 0.28 0.37 0.25 0.61 0.008 0008 0.002 OA3 0.05 0.013 0.009 0.013 0.36 2.31 0.00924 0.93 0.37 0.25 0.61 0.009 0.009 0.001 0.35 0.04 0.011 0.007 0.011 0.30 1.90 0.00725 0.29 0.04 0.14 1.94 0.009 0.009 0.001 OA2 0.05 0.013 0.009 0.013 0.36 2.27 0.00926 0.94 0.04 0.14 1.94 0.009 0.009 0.002 0.35 0.04 0.011 0.007 0.011 0.29 1.86 0.00727 0.28 0.37 0.14 1.92 0.009 0.009 0.002 0.30 0.04 0.009 0.006 0.009 0.25 1.62 0.00628 0.93 0.37 0.14 1.92 0.009 0.009 0.001 0.23 003 0.007 0.005 0.007 0.19 1.21 0.00529 0.29 0.04 0.25 1.94 0.009 0.009 0.002 OAO 0.05 0.012 0.008 0.012 0.34 2.13 0.00830 0.94 0.04 0.25 1.94 0.009 0.009 0.001 0.32 0.04 0.010 0.007 0.010 0.27 1.71 0.00731 0.28 0.37 0.25 1.92 0.009 0.009 0.001 0.28 003 0.009 0.006 0.009 0.23 IA8 0.00632 0.93 0.37 0.25 1.92 0.009 0.009 0.002 0.20 0.02 0.006 0.004 0.006 017 1.06 0.00433 0.61 0.21 0.19 1.27 0.007 0.007 0.001 0.39 0.05 0.012 0.008 0.012 0.33 209 0.00834 0.61 0.21 0.19 1.27 0.007 0.007 0.001 0.39 0.05 0.012 0.008 0.012 0.33 209 0.00835 0.61 0.21 0.19 1.27 0.007 0.007 0.001 0.39 0.05 0.012 0.008 0.012 0.33 209 0.00836 0.61 0.21 0.19 1.27 0.007 0.007 0.001 0.39 0.05 0.012 0.008 0.012 0.33 209 0.00837 0.61 0.21 0.19 1.27 0.007 0.007 0.001 0.39 0.05 0.012 0.008 0.012 0.33 209 0.00838 0.61 0.21 0.19 1.27 0.007 0.007 0.001 0.39 0.05 0.012 0.008 0.012 0.33 209 0.008

RPP-RPT-36854, Rev. 0
3.3 RESPONSES
Several "responses," or data measurements, were recorded for each test. Results are shown inTables 4 and 5. A description of each response follows.
Table 4. Responses.
WashedFiltration Filtrate Unwashed Crystals
Test Levelsa Frothb Bumnb Time (min) (~) Crvstals (~) (~) %H,O1 ------ 0 2 2.62 77.66 77.60 66.41 16.772 +- - - -+ 1 2 1.48 66.65 88.44 70.29 16.823 -+- - - + 1 1 2.78 72.82 8302 67.86 19.434 ++- - - - 1 1 3.83 88.91 75.90 61.86 21015 - -+- -+ 2 2 2.30 68.66 89.94 65.19 13.696 +-+- - - 1 1 2.33 81.53 80.77 64.12 15.707 -++- - - 1 0 1.57 83.30 75.95 5701 19.538 +++- -+ 1 0 2.32 108.19 63.36 54.41 20.899 - - - +-+ 2 1 1.80 87.85 6757 58.47 1702
10 +- -+- - 2 1 150 119.69 43.29 45.71 20.3011 -+-+- - 1 1 167 95.22 6158 47.54 22.9412 ++-+-+ 0 0 1.23 127.53 36.78 29.30 21.2413 +-+- - - 1 1 2.47 99.66 65.21 59.22 14.9614 +-++-+ 1 1 118 118.52 40.13 42.17 15.7915 -+++-+ 1 0 110 106.53 4401 36.98 21.8116 ++++- - 2 1 118 105.69 49.75 37.23 19.3017 - - - -++ 1 2 2.52 77.98 81.36 71.81 15.1018 +- - -+- 1 2 2.25 76.00 84.95 66.95 16.7819 -+- -+- 2 1 2.50 67.29 88.78 6909 18.7520 ++- -++ 2 2 3.70 6909 9150 68.97 22.6521 - -+-+- 2 2 2.27 67.31 84.68 68.80 14.8522 +-+-++ 1 1 2.05 79.77 81.58 70.23 15.1123 -++-++ 2 1 2.33 77.84 82.47 65.95 17.9724 +++-+- 1 0 150 86.82 72.48 55.40 19.5725 - - -++- 2 0 157 76.47 81.81 57.93 18.9926 +- -+++ 2 0 1.85 110.49 50.93 48.93 19.8627 -+-+++ 1 0 2.97 108.60 5601 39.21 25.2028 ++-++- 1 0 172 121.88 3905 42.17 20.1229 - -++++ 1 0 158 10295 5169 55.30 15.4230 +-+++- 1 1 1.37 129.61 36.53 39.54 15.2831 -++++- 1 0 193 100.68 49.74 51.59 24.5132 ++++++ 1 1 175 12194 47.16 3004 17.2133 000000 2 1 2.67 79.18 79.39 63.05 19.2634 000000 2 2 2.67 79.26 79.41 60.55 19.5735 000000 2 1 2.60 84.36 78.41 56.53 17.8736 000000 1 1 2.98 86.66 74.24 55.20 15.0637 000000 1 0 2.50 95.95 65.62 5307 17.9138 000000 1 1 2.55 95.41 67.17 53.71 18.37
a .. ... .Levels ofmdependent vanables shown as Low (-), Medium (0), HIgh (+) are gIVen In the order:Al(OH)4' P04, S04, OH, EDTA/HEDTA, NTA
t Bump and Froth defined as a= none, 1 = moderate, 2 = severe, 3 = llllcontrollable; additional detail for Froth defined in text.
6

RPP-RPT-36854, Rev. 0
Table 5. Concentrations of Metals by Inductively Coupled PlasmaSpectroscopy in Washed Crystals (mg/g).
Test AI Cr Na P1 0.185 0.039 280 0.042 1.100 0.044 245 0.093 0.145 0.034 250 17.24 OA80 0.031 275 19.55 0.355 0.055 300 0.096 1AOO 0.041 305 0.067 0.169 0.044 279 16.58 0.370 0.027 255 14.09 0.210 0.020 315 003
10 0.225 0.008 255 0.0511 0.060 0.017 275 21.812 0.080 0.008 275 18.813 OA35 0.017 265 00314 0.115 0.014 285 0.0615 0.048 0.026 270 22516 0.150 0.020 265 18.017 0.245 0038 285 0.0418 0.850 0.039 280 0.0619 0.160 0.046 290 16.220 1.200 0.055 265 19.021 0.115 0.034 290 0.0522 OA40 0.020 285 00323 0.155 0.050 290 16.824 OA50 0.050 280 19.525 0.500 0.047 275 0.1226 0.650 0.017 265 00727 0220 0.027 270 27.228 0.200 0.008 275 26.229 0.070 0.012 305 00230 0.070 0.011 275 0.0431 0.065 0.013 255 30.032 0.055 0.018 320 26.533 0.700 0.043 270 5.834 0.950 0.049 295 8.835 0.500 0.031 260 9.836 0.550 0.040 280 3.637 0.500 0.028 305 1.838 0.325 0.021 280 2.1
Bump: Bumping occurs in the slurry under evaporation when vapor bubbles within the slurrygrow so large that they throw slurry into the vapor space when they break the surface, which canlead to contamination of the condensate. There is no quantitative measurement of the extent ofbumping, so slurries were assigned the following values based on qualitative comparison to oneanother:
o~ no bumping observedI ~ moderate bumping2 ~ severe bumping3 ~ uncontrollable bumping resulting in slurry carryover into the condensate
7
RPP-RPT-36854, Rev. 0
None of the slurries exhibited uncontrollable (level 3) bumping.
Froth: Frothing occurs in the slurry under evaporation when the vapor bubbles have troubledisengaging from the liquid phase, so a bed of fluid-lined vapor bubbles forms on top of theslurry. The bed is called a "froth" if the bubbles are unstable and break readily into vapor andliquid phases when conditions are changed (e.g., when the vacuum is released), or it is called a"foam" if the bed is stable (e.g., whipped egg whites). Foaming was not observed in any of thetests. The tendency to froth was assigned a numerical value based on the level offrothmaintained during evaporation:
o~ no froth1 ~ froth maintained at bed height not exceeding approximately 2 cm2 ~ bed height exceeds 2 cm but does not extend into condenser3 ~ froth enters condenser and contaminates condensate
None of the slurries exhibited frothing at level 3. Note that, in some cases, frothing could bealleviated by changing the stirring rate in the slurry.
Filtrate: The total weight of slurry was measured at the end of each boildown by weighing theboildown pot containing the slurry. Theoretically, the weight of slurry should be nearly constantfor all tests. The actual total slurry weights ranged from 159 g to 175 g. Similarly, the weight ofslurry actually delivered to the filter, which should be relatively constant, was measured byweighing the boildown pot before and after transferring the slurry to the filter. The actual weightof slurry delivered to the filter ranged from 150 g to 172 g. The weight of filtrate (liquid phasethat passed through the filter) is not expected to be constant but is expected to vary as a result ofseveral factors that might influence the efficiency of the solid/liquid separation. The weight offiltrate was measured by weighing the receiving flask before and after the filtration. Filtrateweights varied from 67 g to 130 g. To a first approximation, the efficiency of solid/liquidseparation increases as the filtrate weight increases.
Filtration time: The slurry resulting from each boildown was poured into a heated (60°C)vacuum filter apparatus with a medium-mesh glass frit filter. A timer was started when thevacuum was applied to the filter. The timer was stopped when the filtrate production rate slowedto less than 1 drop/sec. The elapsed time was recorded in minutes. To a first approximation, theeffectiveness of the solid/liquid separation increases as the filtration time decreases. None of theslurries in the entire test matrix led to excessive filtration times or filter plugging.
Unwashed crystals: The weight ofthe filter cake after the initial filtration (unwashed crystals)was not measured directly but was calculated from the difference between the weight of theslurry delivered to the filter and the weight of the filtrate. Using this weight and theconcentration of sodium in the washed crystals, the process "'YoYield," or sodium recovery, canbe calculated.
Washed crvstals: The weight of filter cake remaining after washing with saturated brine wasmeasured directly by collecting the washed crystals in a sample jar.
8

RPP-RPT-36854, Rev. 0
Percent water: Two samples of the washed crystals from the sample jar were analyzed for %H20by oven drying. The average of the two measurements is shown in Table 4. If all of the productsalts were anhydrous, the %H20 determination would provide a direct means of measuring theeffectiveness of the solid/liquid separation, as all of the water in the washed crystals would beattributable to retained liquid phase. However, some of the solid phases include waters ofhydration, especially Na3P04·12H20·0.25NaOH, so a direct correlation is not possible. To a firstapproximation, however, increasing %H20 indicates decreasing solid/liquid separationeffectiveness.
Elemental analysis: Small aliquots of the washed crystals were dissolved in dilute nitric acid andanalyzed by ICP for concentrations of AI, Cr, Na, and P. Results are shown separately inTable 5.
4. STATISTICAL ANALYSIS
Results of the statistical analysis of the data in Table 4 and the Cr results from Table 5 arediscussed in a separate report (PNNL-17380). A model, or equation, was developed to fit eachresponse. Results are summarized here along with an empirical evaluation of what the resultsmean in terms of the feed envelope.
4.1 FILTRATION TIME
The model that best fits the responses for filtration time is shown in Equation 1, where the valuesfor the independent variables are the assigned levels -1, 0, + 1, not the molar concentrations.[The -1, 0, +1 values are used for all of the model equations in this report and in the statisticsreport where the equations originally appeared (PNNL-17380)].
[0.7162+0.0421.P04 -0.1130·504 -0.1976·0H+0.0663·EDTA ]
Filt.Time= exp+0.0223·NTA-0.0678·P04 .504 +0.0714·0H·EDTA+0.0731·EDTA·NTA
For test 1, e.g., with all variables set to their low (-1) values, Equation 1 becomes:
.. [0.7162+0.0421. (-1)-0.1130· (-1)-0.1976· (-1)+0.0663· (-1) ]Fzlt.Tzme= exp
+ 0.0223· (-1) -0.0678· (-1)· (-1) + 0.0714· (-1)· (-1) + 0.0731· (-1)· (-1)
Filt.Time ~ 2.65 min (compared to the observed 2.62 min shown in Table 4).
(1)
The single-parameter terms in the equation indicate that the filtration time tends to decrease withincreasing concentrations ofOH and S04 and decreasing concentrations ofP04, HEDTA/EDTA,and NTA. (The combined variable EDTA/HEDTA is shown in the equations as EDTA for thesake of brevity.) The interaction terms (those with two variables) modify the effects of thesingle-parameter terms. So, for example, the decrease in filtration time with increasing OHconcentration is more pronounced when EDTA is at its lowest level.
9

RPP-RPT-36854, Rev. 0
Figure 1 shows the hydroxide single-variable effect on filtration time. The general downwardtrend with increasing OR reflects the OR term in Equation 1. It is obvious from Figure 1 that thehydroxide effect alone explains only a small portion of the observed variability, although it has alarger single-parameter effect than any of the other variables.
Fi~re 1. Hydroxide Effect on Filtration Time.
4 -,----=:::,-----------------,
••
c 3 •E<Ii •E • I;:: •c0 I"'£ •u: 2
I
•
I•I
-1 0
OH Level
It seems, at first, counterintuitive that increasing OR would lead to decreased filtration timebecause increasing OR ought to correspond to higher viscosity at the boildown end point andthus slower filtration. The explanation is likely tied to the reduction in the dependent variableswith increasing OR, i.e., the decreasing concentrations of the major product salts NaN03 andNa2C03·R20.
4.2 BUMP
The data in Table 4 were used to develop a model that predicts the probability of experiencingsevere bumping (bump response ~ 2). In equation 2, the model predicts that the slurry willexperience severe bumping if the probability (PBump) exceeds 0.5.
exp[,8o +,82 ·P04 +,83 · S04 +,84 ·OH]
PBump = l+exp[,8o +,82 ·P04 +,83 · S04 +,84 ·OH]
with
,80 = -3.0494
,82 = -1.7596
,83 = -1.4686
,84 = -2.5611
10
(2)
RPP-RPT-36854, Rev. 0
The model predicts that decreasing levels of P04, S04, and OH all lead to increased probabilityof severe bumping. However, within the matrix tested there are only four combinations that leadto PBump > 0.5, those that contain low (-1) levels of all three variables, namely tests 1, 2, 17, and18.
4.3 CHROMATE
Chromate [Cr(VI)] ion is expected to remain in the liquid phase throughout the fractionalcrystallization process, much like cesium. (The simulated waste feed solutions for the factorialdesign test did not include cesium.) Therefore, any chromate present in the washed solids wouldbe a direct indication of contamination of the crystals by residual liquid.
In the original test plan (7SI1O-DLH-07-122), chromate analysis of the washed crystals wasplanned using a colorimetric test kit. Test results showed that the colorimetric test was subject toa number of interferences, including nitrite ion. Statistical analysis of the results was originallyperformed with the flawed colorimetric analytical data. It was later determined by the customerthat the samples should be analyzed for chromium (and other metals) by ICP analysis. Thestatistical analysis was then repeated using the more-accurate ICP data shown in Table 5. Theresulting model is shown in Equation 3.
where
[/30+ /31·Al + /33·S04 + /34·OH + /35.EDTA]
Cr(VI)ICP = exp+ /314 .AI· OH + /335 .S04 .EDTA
/30 ~ -3.6033/31 ~ -0.1955/33 ~ -0.0242/34 ~ -0.4147/35 ~ 0.0594/314 ~ -0.1058/335 ~ -0.1219
(3)
Due to the strong interaction terms, it is difficult to visualize the effects of the individualvariables on the Cr(VI) response in Equation 3. Table 6 shows the Cr(VI) concentration at all 16of the possible high/low combinations of the relevant variables, arranged by increasing Cr(VI)concentration, as calculated from Equation 3.
Start with the all-low combination at Cr ~ 0.039. Increasing EDTA/HEDTA only (bottom row)causes a large increase in Cr. Increasing S04 only also causes a large increase (next-to-bottomrow). Increasing Al(OH)4 only causes a slight decrease (Cr ~ 0.032). Increasing OH only causesa large decrease (Cr ~ 0.021).
The large increases in Cr with increasing EDTA1HEDTA and S04 are nullified when OH is alsoincreased. Note that the lowest eight Cr values in the table all have high OH.
For more information on the chromate results, see Section 3.5.
11

RPP-RPT-36854, Rev. 0
Table 6. Calculated Cr(VI) Concentration at Different Variable Settings[sorted bv calculated Cr(V1) concentrationl.
CalculatedAI(0H)4 S04 OH EDTAlHEDTA Cr(VI), m~/~
+1 -I +1 -I 0.011+1 +1 +1 +1 0.012+1 +1 +1 -I 0.014+1 -I +1 +1 0.016-I -I +1 -I 0.021-I +1 +1 +1 0.023-I +1 +1 -I 0.026-I -I +1 +1 0.030+1 -I -I -I 0.032+1 +1 -I +1 0035-I -I -I -I 0.039+1 +1 -I -I 0.039-I +1 -I +1 0.042+1 -I -I +1 0.046-I +1 -I -I 0.047-I -I -I +1 0.056
4.4 UNDILUTED FILTRATE
Statistical analysis of the response data for weight of filtrate resulted in Equation 4 (where"Dnd.Filtrate" stands for undiluted filtrate, which is the same as Filtrate in Table 4).
UndFiltrate= exp[4.5182+ 0.0787· Al +0.0397.504 +O.l603.0H] (4)
Equation 4 suggests that the weight of filtrate increases with increasing concentrations ofAI(OR)4, S04, and OR and is independent of P04, EDTA1REDTA, and NTA. Increasing weightof filtrate, at relatively constant slurry weight, corresponds to decreasing weight of crystals, andhence lower sodium recovery (lower %Yield). In other words, increasing AI(OR)4, S04 and ORcorresponds to decreasing NaN03 and Na2COrR20, resulting in decreasing yield. It issurprising that the equation lacks a term for P04.
4.5 WEIGHT PERCENT WATER
Equation 5 shows the model that best fits the response data for %R20. Not surprisingly, P04 isthe dominant variable. The AI-OR interaction term is interesting. When Al is high, the OR andAI-OR terms effectively cancel each other out regardless of the OR level. When Al is low, the%R20 increases with increasing OR and decreases with decreasing OR.
H,GWt'/o= 18.6334+0.0104· AI+ 2.0284·P04 -0.8315.504 +0.8956·0H-0.9050·AI·OH (5)
In theory, increasing %R20 corresponds to increasing liquid contamination, which in turn meansincreasing Cr(VI) concentration in the washed solids. The data, however, show no suchcorrelation. Figure 2 shows a plot of %R20 vs. Cr analytical results for the washed solids withone set of data points for the low-P04 runs and another set of points for the high-P04runs. The
12

RPP-RPT-36854, Rev. 0
P04 effect on %H20 is clearly evident in the figure. Just as clearly, there is no correlationbetween %H20 and Cr for either set of data points, contrary to theory.
Figure 2. Lack of Correlation Between %H20 and Cr in Washed Solids.
fC, Low PO. • High PO.0.06
•0.05 - • •
• fC,
fC,
0.04 - fC,
fC, fC,
Ol fC, •-Ol •E 0.03 - •o· • • •0.02 - fC, fC, •
fC, • fC, •fC, •0.01 - ~ ., •0.00 , ,
12 14 16 18 20 22 24 26
%H,O
4.6 WASHED CRYSTALS
The model used to fit the response data for the weight of washed crystals (Equation 6) includesterms for every variable except EDTA1HEDTA. The relationships are straightforward-increasein any variable corresponds to a decrease in the weight of washed crystals.
WashedCrystals = 55.0440- 3.3141· AI- 4.1310 ·PO. -1.9873· SO. -10.2503 ·OH
-0.3496·NTA - 2.0933·AI·OH - 4.7996·0H ·NTA(6)
The reason is fairly transparent. An increase in the level of any variable corresponds to adecrease in the levels of the major product salts, i.e., NaN03and Na2C03·H20. This is obviousfrom a plot of the weight of washed crystals as a function of, e.g., the molarity of NaN03 in thefeed solution (Figure 3). The plot would look the same, qualitatively, ifNa2C03·H20 weresubstituted for NaN03.
13

RPP-RPT-36854, Rev. 0
Figure 3. Correlation Between Mass of Washed Crystals and Nitrate Molarity.
80
,.. •70 • •(/) • ••E'" 60~ •Cl
.!!2
'" •-(/) 50>. •~
() •""0 • •Q).J::: 40 ••(/)
~ • •30 ••
20
0.5 1.0 1.5 2.0 2.5 3.0 3.5
NaN03, Molarity in Feed
4.7 FROTH
No statistical model was found that would adequately fit the response data for frothing.
5. DECONTAMINATION FACTORS AND SODIUM RECOVERY
The primary indicator of the separation effectiveness of the fractional crystallization process isthe decontamination factor (DF), which is defined as the analyte:Na ratio in the feed divided bythe analyte:Na ratio in the product (washed crystals). The primary indicator of the processefficiency is the sodium recovery, or %Yield, which is defined as the mass ofNa in theunwashed crystals relative to the mass ofNa in the feed solution, expressed as a percentage.(Any Na lost during the wash step is recycled back into the feed.)
These two "responses" were not subjected to statistical modeling because the data were notavailable at the time of the modeling. Calculation of DF and %Yield requires analysis of theproduct crystals by lCP analysis, which was performed only later in the program.
5.1 DECONTAMINATION FACTORS
Typically, the analyte used to determine DF would be a radionuclide, e.g., 137CS (DFcs). Thefeed solutions for the current study did not contain cesium, radioactive or nonradioactive, butother analytes can be used to calculate the DF providing that the analyte remains in the liquidphase throughout the process. Such analytes typically include nitrite, chloride, potassium, andchromate.
14

RPP-RPT-36854, Rev. 0
Values for DFCr, DFAI, and DFp04 (for Low-P04 runs only) were calculated from the lep resultsin Table 5 and the feed molarities in Table 3. The results are shown in Table 7 along with the%Yield results discussed in Section 5.2.
Table 7. Decontamination Factors and %Yield.
DFp04 calculated for Low-P04 runs only because the washed crystals clearly contamed sodium phosphate solIds In allMediurn-P04 and High-P04 runs.
Test Levels DFAI DFcr DFp04 % Yield1 - - - - - - 81 47 60 60.02 +- - - -+ 39 31 27 59.93 -+- - - + 91 38 (*) 57.34 ++- - - - 99 38 (*) 57.75 - -+- -+ 45 34 33 74.56 +-+- - - 38 40 46 68.17 -++- - - 88 31 (*) 58.68 +++- -+ 119 38 (*) 44.69 - - - +-+ 81 75 94 58.8
10 +- -+- - 199 124 53 30.511 -+-+- - 243 56 (*) 46.812 ++-+-+ 595 87 (*) 27.913 +-+- - - 107 83 92 47.714 +-++-+ 435 76 47 31.615 -+++-+ 302 33 (*) 32.816 ++++- - 306 31 (*) 36.417 - - - -++ 62 49 68 64.118 +- - -+- 58 40 46 65.719 -+- -+- 96 32 (*) 71.120 ++- -++ 38 20 (*) 67.021 - -+-+- 135 52 54 67.822 +-+-++ 113 77 107 64.223 -++-++ 99 28 (*) 66.124 +++-+- 108 22 (*) 56.125 - - -++- 30 28 21 62.126 +- -+++ 71 60 34 37.327 -+-+++ 65 33 (*) 41.828 ++-++- 238 86 (*) 29.729 - -++++ 234 117 143 43.630 +-+++- 689 93 74 27.831 -++++- 208 60 (*) 35.032 ++++++ 1,008 40 (*) 41.733 000000 44 27 (*) 59.234 000000 35 26 (*) 64.735 000000 59 36 (*) 56.336 000000 58 31 (*) 57.437 000000 69 48 (*) 55.338 000000 98 58 (*) 52.0
•
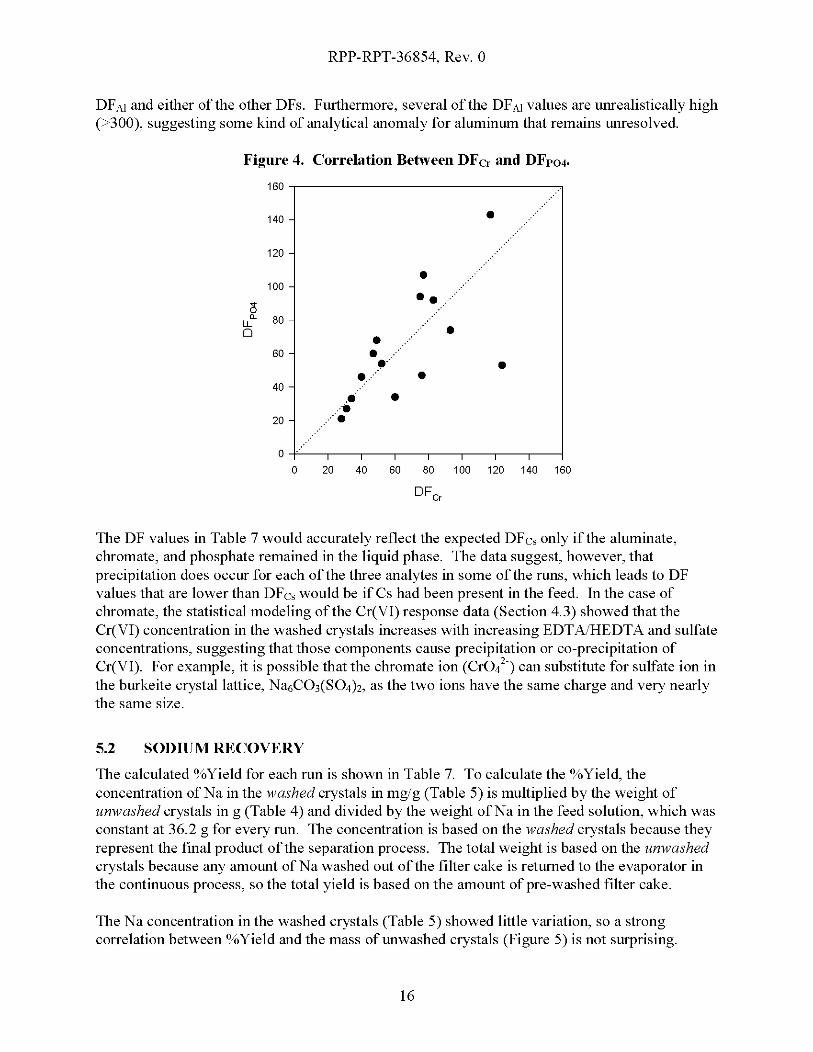
lfthe analytical results are accurate, and if the analytes in question truly did remain in the liquidphase throughout the process, then each of the analytes should give the same DF for each run,i.e., DFAl ~ DFcr ~ DFp04 for any given run. Graphical interpretation of the DF data shows atleast some correlation between DFCr and DFp04 (Figure 4). No such correlation exists between
15
RPP-RPT-36854, Rev. 0
DFAl and either of the other DFs. Furthermore, several of the DFAl values are unrealistically high(>300), suggesting some kind of analytical anomaly for aluminum that remains unresolved.
Figure 4. Correlation Between DFcr and DFp04•
•
•
•
•........ .......•......
•...... ..fi •......•
160
140
120
100
C'ic- 80LL
0
60
40
20 -
0
0 ~ ~ ~ 00 100 1~ 1~ 1~
DFc,
The DF values in Table 7 would accurately reflect the expected DFcs only if the aluminate,chromate, and phosphate remained in the liquid phase. The data suggest, however, thatprecipitation does occur for each of the three analytes in some of the runs, which leads to DFvalues that are lower than DFcs would be ifCs had been present in the feed. In the case ofchromate, the statistical modeling of the Cr(Vl) response data (Section 4.3) showed that theCr(Vl) concentration in the washed crystals increases with increasing EDTA1HEDTA and sulfateconcentrations, suggesting that those components cause precipitation or co-precipitation ofCr(Vl). For example, it is possible that the chromate ion (CrOl-) can substitute for sulfate ion inthe burkeite crystal lattice, Na6C03(S04)2, as the two ions have the same charge and very nearlythe same size.
5.2 SODIUM RECOVERY
The calculated %Yield for each run is shown in Table 7. To calculate the %Yield, theconcentration ofNa in the washed crystals in mg/g (Table 5) is multiplied by the weight ofunwashed crystals in g (Table 4) and divided by the weight ofNa in the feed solution, which wasconstant at 36.2 g for every run. The concentration is based on the washed crystals because theyrepresent the final product of the separation process. The total weight is based on the unwashedcrystals because any amount of Na washed out of the filter cake is returned to the evaporator inthe continuous process, so the total yield is based on the amount of pre-washed filter cake.
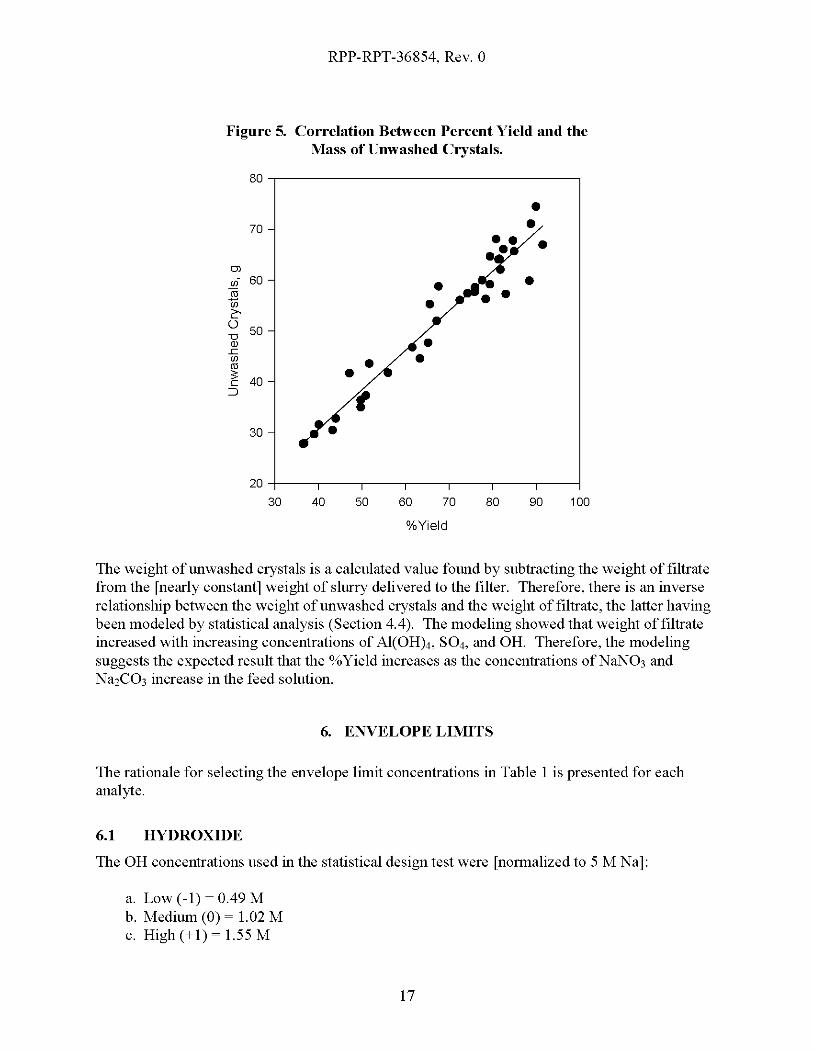
The Na concentration in the washed crystals (Table 5) showed little variation, so a strongcorrelation between %Yield and the mass of unwashed crystals (Figure 5) is not surprising.
16
RPP-RPT-36854, Rev. 0
Figure 5. Correlation Between Percent Yield and theMass of Unwashed Crystals.
80 --,------------------------,
•70 ••• ••
Ol
<If 60 • •ro • •1J) •c0 50uQ) •.c •(/) •ro5: •c 40
:::J r30
100908070605040
20 +-----,-----,--,-----,-----,-------,,---------130
O/OYield
The weight of unwashed crystals is a calculated value found by subtracting the weight of filtratefrom the [nearly constant] weight of slurry delivered to the filter. Therefore, there is an inverserelationship between the weight of unwashed crystals and the weight of filtrate, the latter havingbeen modeled by statistical analysis (Section 4.4). The modeling showed that weight of filtrateincreased with increasing concentrations of AI(OH)4, S04, and OH. Therefore, the modelingsuggests the expected result that the %Yield increases as the concentrations ofNaN03 andNa2C03 increase in the feed solution.
6. ENVELOPE LIMITS
The rationale for selecting the envelope limit concentrations in Table I is presented for eachanalyte.
6.1 HYDROXIDE
The OH concentrations used in the statistical design test were [nonnalized to 5 M Na]:
a. Low (-I) ~ 0.49 Mb. Medium (0) ~ 1.02 Mc. High (+ I) ~ 1.55 M
17

RPP-RPT-36854, Rev. 0
Statistical modeling results (Section 4) show that increasing OH concentration had both apositive impact (reduced filtration time, reduced Cr contamination) and a negative impact(increased %H20, decreased %Yield) on the process. None of the tests resulted in catastrophicfailure of the process.
Previous thermodynamic modeling (RPP-34455) proposed a limit of2.1 M for the sum oftheconcentrations of OH and Al(OH)4, based on their effects on ionic strength (%Yield) and onprevention of sodium aluminate crystallization. That limit [OH + Al(OH)4 ~ 2.1 M at 5 M totalNa] was selected to represent the OH envelope limit in Table 1.
Eight out of the 38 runs in the half-factorial matrix (runs 10, 12, 14, 16,26,28,30,32) had [OH+ Al(OH)4] concentration higher than this limit (1.55 + 0.75 ~ 2.30 M). The %Yield for thoseeight runs averaged 32.9%, compared to an average of 57.2% for the remaining 30 runs (seeTable 7). These results lend credence to the selection of the OH limit shown in Table 1.
6.2 ALUMINATE
The Al(OH)4 concentrations used in the statistical design test were [normalized to 5 M Na]:
a. Low (-1) ~ 0.23 M.b. Medium (0) ~ 0.49 M.c. High(+I)~0.75M.
Statistical modeling results (Section 4) show that increasing Al(OH)4 concentration had anegative impact on the weight of filtrate and the weight of washed crystals and had a positiveimpact on Cr(VI) concentration [increasing Al(OH)4 caused decreasing Cr(VI)]. Therefore,short of precipitating sodium aluminate, the only negative impact of increasing Al(OH)4 is itseffect on %Yield. That effect can be calculated from Equation 4 and some basic assumptions,i. e., assuming an average slurry weight of 160 g and an average Na concentration in the washedcrystals of280 mglg (28% Na). The calculated %Yield for the case where Al(OH)4, S04, andOH are all set to their middle (0) levels would be
%Yieldololo~ 100 * [wt Na in unwashed crystals] 1 (36.2 g total Na) ~ %Yield
%Yieldololo~ 100 * %Na/l00 * [wt unwashed crystals] 1 (36.2 gtotal Na) ~ %Yield
%Yieldololo~ 100 * 0.28 * [wt slurry - wt filtrate] 1(36.2 g total Na) ~ %Yield
%Yieldololo~ 100 * 0.28 * [160-exp(4.52)] 1(36.2 gtotalNa) ~ 52.7%
where "wt filtrate" comes from Equation 4 with all parameters at their middle (0) levels. A1l38runs contained 36.2 g Na in the feed.
Increasing Al(OH)4 from the middle level to its high level would decrease the %Yield to
%Yieldl/OIO~ 100 * 0.28 * [160 - exp(4.52 + 0.08)] 1 (36.2 g total Na) ~ 46.8%
18
RPP-RPT-36854, Rev. 0
Note that in previous laboratory studies and in thermodynamic modeling, 50%Yield wasconsidered the minimum acceptable yield for the process. In the current laboratory study, thefocus was on maintaining consistency (minimizing extraneous variables), and individualoutcomes like %Yield and DF may have suffered compared to what could be achieved for aparticular feed solution under alternative operating conditions. Therefore, numbers like the%Yield values just calculated are more important for examining trends than for establishingbenchmark values. In other words, the finding that the latter scenario above resulted in a %Yieldbelow 50% does not mean that the process "failed" for that combination of variables nor that0.75 M is an unacceptable level for Al(OH)4 concentration in the feed.
Previous thermodynamic modeling proposed a limit of2.1 M for the sum of the concentrationsofOH and Al(OH)4. Previous laboratory testing (RPP-RPT-35261) showed that feed solutioncontaining up to 1.2 M Al(OH)4 (normalized to 5 M total Na) could be evaporated withoutencountering the problems of high viscosity and slow filtration caused by sodium aluminatecrystallization at higher concentration.
The value for the Al(OH)4 limit in Table 1 was set equal to the high (+1) level for the factorialdesign test. This level did not cause catastrophic failure under any of the possible combinationsof the other variables in the study. Prior laboratory testing shows that higher levels of Al(OH)4can be processed under at least the one combination of other variables used for that study, so theAl(OH)4 limit in Table 1 can likely be exceeded under some scenarios.
6.3 PHOSPHATE
The P04 concentrations used in the statistical design test were [normalized to 5 M Na]:
a. Low (-1) ~ 0.035 Mb. Medium (0) ~ 0.17 Mc. High (+1) ~ 0.30 M
Statistical modeling results (Section 4) show that increasing P04 concentration had a negativeimpact on filtration time and a positive impact on bumping of the slurry (i.e., less bumping athigh P04 levels). There was no measurable impact on Cr(VI) concentration in the filter cake oron the weight of filtrate (or %Yield).
Thermodynamic modeling was not performed for P04 due to the lack of appropriatethermodynamic data for P04 salts in the database. Preliminary laboratory tests were done toestablish an upper bound for P04, and showed that P04 concentrations up to 0.37 M (normalizedto 5 M total Na) could be processed without encountering the thickened slurry problems seen athigher concentrations (RPP-RPT-35261). The Table 1 value is set equal to the High (+1) valuefrom the current study because it encompasses a broader range of other components, but again,higher values would be possible under some scenarios.
19
RPP-RPT-36854, Rev. 0
6.4 SULFATE
The S04 concentrations used in the statistical design test were [normalized to 5 M Na]:
a. Low (-1) ~ 0.11 Mb. Medium (0) ~ 0.155 Mc. High(+I)~0.20M
Statistical modeling results (Section 4) show that increasing S04 concentration had a negativeimpact on the weight of filtrate and washed crystals (i.e., decreased %Yield), but the effects wererelatively small compared to the other variables. It had a positive impact on filtration time and%H20 in the filter cake.
Thermodynamic modeling indicates that there was no upper limit to S04 concentration otherthan its solubility limit. Preliminary laboratory tests show that S04 concentrations up to 0.55 M(the solubility limit ofNa2S04 in the solution matrix used for that study, normalized to 5 M totalNa) could be processed without any difficulties being encountered (RPP-RPT-35261).
The High (+ I) level of S04 from the current factorial test encompasses all but three 200 W Areasingle-shell tanks, based on BEl data, but the value selected for Table I (0.30 M) encompassesall of the tanks and is well below the saturation limit (0.55 M) processed without difficulty in thepreliminary laboratory tests.
6.5 ETHYLENEDIAMINETETRAACETIC ACID, TETRASODIUM SALT
The EDTA/HEDTA concentrations used in the statistical design test were (sum of bothcompounds at 1: I mole ratio, normalized to 5 M total Na):
a. Low (-I) ~ 0.007 Mb. Medium (0) ~ 0.010 Mc. High(+I)~0.014M
Statistical modeling results (Section 4) show that increasing EDTA1HEDTA concentration had anegative impact on filtration time and on Cr(VI) concentration in the filter cake. It had nopositive impacts. The negative impact on Cr(VI) concentration was nullified at high OH.
No thermodynamic modeling was done on EDTA1HEDTA, and no BEl data are available. Inprevious laboratory studies at Georgia Tech (RPP-RPT-34136), EDTA/HEDTA caused extremefrothing problems at 0.028 M, twice the level of the High (+ I) setting in the current study.Therefore, the upper limit selected for Table I is set equal to the High (+1) setting of 0.014 Mcombined (EDTA + HEDTA), or 0.007 M for each compound.
20
RPP-RPT-36854, Rev. 0
6.6 NITRILOTRIACETIC ACID, TRISODIUM SALT
The NTA concentrations used in the statistical design test were [nonnalized to 5 M total Na]:
a. Low (-1) ~ 0.0006 Mb. Medium (0) ~ 0.0010 Mc. High(+I)~O.0013M
Statistical modeling results (Section 4) showed that increasing NTA concentration had a negativeimpact on filtration time and on the weight of washed crystals. It had no positive impacts.
No thennodynamic modeling was done on NTA, and no BBI data are available. In previouslaboratory studies at Georgia Tech (RPP-RPT-34136), NTA caused increased filtration timeproblems at 0.0025 M, twice the level of the High (+1) setting in the current study. Therefore,the upper limit selected for Table 1 is set equal to the High (+1) setting of 0.0013 M.
6.7 CARBONATE
Carbonate was not one of the independent variables tested in the factorial design laboratorystudy. Thennodynamic modeling suggests that there is no upper limit to its concentration in thefeed other than its solubility limit. The value shown in Table 1 (2.5 M at 5 M total Na) is theconcentration of carbonate in a pure sodium carbonate solution.
6.8 NITRITE
Nitrite was not one of the independent variables tested in the factorial design laboratory study.Thennodynamic modeling indicates that increasing N02 concentration causes loss of yield due tothe high-solubility eutectic fonned with sodium nitrate. The magnitude of the effect depends onthe evaporation temperature and the OH concentration, varying from about 0.5 M to 2.1 M N02
at 5 M total Na. The concentration limit shown in Table 1 (1.0 M at 5 M Na) is selected as anaverage conservative value that could be exceeded for specific feed compositions.
7. REFERENCES
7S110-DLH-07-122, 2007, "Test Plan for Envelope Limit Factorial Design Test" (interofficememorandum from D. L. Herting to D. W. Hamilton, July 31), CH2M HILL HanfordGroup, Inc., Richland, Washington.
PNNL-17380, 2008, Analysis ofResults from the Design Envelope Limit Experiment, PacificNorthwest National Laboratory, Richland, Washington,
RPP-34455, 2007, Hanford Medium/Low Curie Waste Pretreatment Alternatives ProjectSubtask 2.1 and Subtask 2.2, Rev. 0, CH2M HILL Hanford Group, Inc., Richland,Washington.
21

RPP-RPT-36854, Rev. a
RPP-RPT-34136, 2007, Hanford Medium/Low Curie Waste Pretreatment Alternatives ProjectPhase II, Subtask 2.5 and Subtask 2.6, Rev. 0, CH2M HILL Hanford Group, Inc.,Richland, Washington.
RPP-RPT-35261, 2007, Fractional Crystallization Laboratory Tests with Simulated Tank Waste,Rev. 0, CH2M HILL Hanford Group, Inc., Richland, Washington.
22