frames for business measurement - rutgers …raw.rutgers.edu/docs/carlab/an updated measurement...
TRANSCRIPT
An Updated Measurement Theory Perspective on Accounting1
T.J. MockUCR and U. of Maastricht
M.A. VasarhelyiRutgers University
Silvia RomeroMontclair State University
September, 2011
Abstract
Over the last five centuries, the evolution of the traditional accounting model has resulted in an ever-wider set of business practices and measurement conventions. These have served business well, but are continually losing relevance. The PCAOB’s (2011) considerationof a more informative audit report and the FASB’s (2011) reconsideration of the concepts of income illustrate, in a limited sense, discomfort with the restrictions of the traditional model. This paper considers a wider frame of business representations, discussing business measurement under the frame of measurement theory.
In this paper, we discuss a business measurement model which includes three layers: the disclosure value chain, the point measurement of each datum, and the level of desired contingency measurement. The disclosure value chain includes: 1) environmental conditions, 2) business plans, 3) lead actions that are added to the current 4) business activities measurement, and 5) subsequent events. In examining the point measurement of each datum, we argue that measures are not deterministic, but rather contingent on time, the nature of the decision being supported, the level of precision, related future events, and inherent uncertainty. Finally, the level of desired contingency measurement determines the information structure around the business processes and its measurement that is needed in each specific decision context.
The business measurement model has been stagnant for a long period, and we suggest major changes in the model through measurement theory, incorporating stochastic thinking and considering the capabilities of modern data processing. Many of these proposed changes could be implemented through a modified XBRL tagging.
1 The authors are appreciative of the comments in multiple seminars this paper was presented and the subtantive contributions of Mr. J.P.Krahel.
1

Introduction
This paper applies concepts from measurement theory and information economics to revisit critical issues in business measurement as provided by accounting information systems. The essential features of the current accounting model have remained unchanged since Luca Pacioli’s introduction of the double-entry system2 over five centuries ago.
Business measurement initially evolved from basic business needs and was geared to the internal management of manufacturing entities. While it supported basic processes such as inventory management and sales recording, it also supported summary financial reporting which facilitated performance measurement and accountability reporting to many stakeholders.
Two basic phenomena have molded the evolution of the reporting model: the ever-increasing complexity of business processes, and recent dramatic changes in information technology. At the same time, the development of modern society has increased the resources necessary for roads, police and defense; more relevant, valid, reliable and verifiable measurement of wealth, income and other attributes of enterprises, are necessary to maintain an equitable taxation system.
The effects of increased business process complexity and information technology development have permeated the business environment, forcing rapid change and the abandonment of obsolete business methods and regulations. This change is reflected in current discomfort with reporting and assurance and efforts toward redevelopment. The PCAOB’s (2011) advocation of a more informative audit report, and the FASB’s (2011) reconsideration of income concepts illustrate, in a limited sense, this discomfort with the restrictions of the traditional model.
The changing needs of three basic stakeholder types- internal management, equity owners, and taxing authorities- have stimulated the evolution of entity reporting and business measurement. While necessary and beneficial, this evolution has nevertheless been haphazard and impounded serious weaknesses that derived in cases like Enron in the 2000’s and the Ponzi scheme these days, that have generated significant costs to society.
Several weaknesses of the current model can be considered from a social welfare perspective:
A dual reporting system with tax reporting structures very different from traditional financial reporting structures, which sometimes requires duplication of efforts.
2“Summa de arithmetica geometria proportioni and proportionalita”, Luca Pacioli (1494).
2
Private entities use roads, hire people, and benefit from police and national defense, but are largely exempted from social accountability and public reporting. This exemption creates incentives for organizations to stay out of the public reporting arena, resulting in misallocation of national resources, because these entities are- by choice- neither publicly measured nor public targets for investment
Internal management reporting structures have shifted from traditional costing to complex, multi-element, predominantly non-financial reports while external reporting structures have remained essentially stagnant.
Alles and Vasarhelyi (2006) have discussed some difficult, perhaps intractable, problems of the current accounting and reporting system. All of the following problems have been extensively “addressed,” but not resolved, by standard setters:
1. Aggregation issues:–the boundaries of the business organization are fuzzy, financial statements differ across industries, and the resulting measures from aggregation and consolidation often are not homogeneous to be added (additive).
2. Reliability issues:– current methods produce numerical assignments that are unreliable, time dependent, and also not additive as they aggregate measurements with different scales. Furthermore, measurements provided lack transparent reliability. While some measures are accurate (e.g. cash) others are of questionable reliability, to the point of irrelevance (e.g. goodwill).
3. Completeness issues: There is lack of disclosure of relevant business features such as contractual obligations.
4. Valuation issues: Elements are valued based on obsolete economic situations and there is little disclosure of contingencies in these valuations.
5. Scale issues: Verbal descriptions of accounting phenomena are used even in cases where quantitative scales are feasible. For example contingencies are often neglected or qualitatively described when they could be statistically described.
Some basics of measurement theory
Mock and Grove (1979) define a measurement system as “a specified set of procedures that assigns numbers to objects and events with the objective of providing valid, reliable, relevant, and economical information for decision makers” (page 3). Formal measurement theory is based on mathematics, particularly set theory, wherein a set of numbers is assigned to different attributes of phenomena of interest via a mapping process. For example, in a dividend payment decision, a dollar value is assigned to an attribute (Cash on hand at the time of the decision) to determine how much can be distributed.
3

In this paper, we argue for a substantial extension of traditional external reporting by not only modifying the procedures of assigning values to objects, but also enhancing the declarations that describe the underlying events. This change is enabled by the presence of relevant data (e.g. purchase orders and information about existing contracts) within currently existing Enterprise Resource Planning systems (ERPs,), such as SAP and Oracle. These arguments are based partly on the following observations:
ERPs extend numeric assignments to both financial and non-financial attributes (quantitative and qualitative), demonstrating management’s need for a much more extensive set of non-financial measures. While these information structures exist in a majority of large companies, they have not been utilized to tell a more complete story of the measurement of business and income. Sample reports and updated standards are needed.
Methods of measurement implemented in ERPs are typically designed to support particular business requirements and decisions (e.g. OSHA reporting, retirement planning for employees, optimal inventory reordering), not to meet the decision needs of investors, analysts, suppliers, clients, localities or other business stakeholders. Expanding the scope of ERPs could result in a more valuable business reporting system.
The ERS vs the NRS
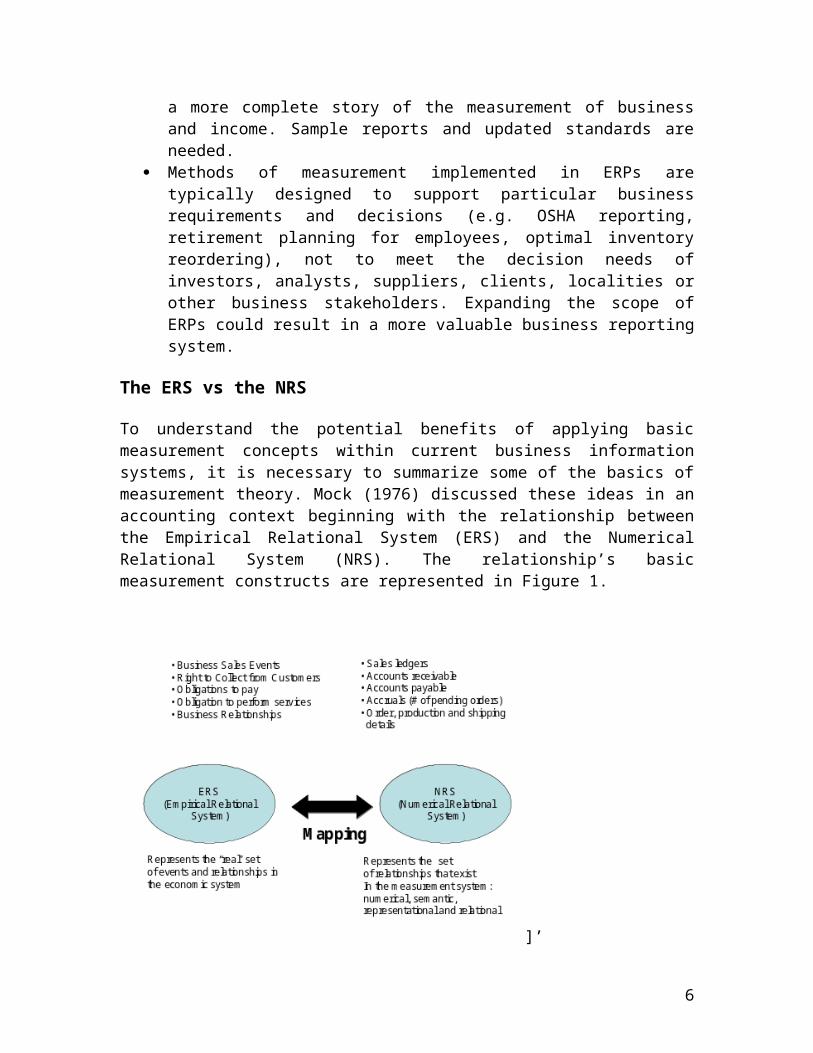
To understand the potential benefits of applying basic measurement concepts within current business information systems, it is necessary to summarize some of the basics of measurement theory. Mock (1976) discussed these ideas in an accounting context beginning with the relationship between the Empirical Relational System (ERS) and the Numerical Relational System (NRS). The relationship’s basic measurement constructs are represented in Figure 1.
4
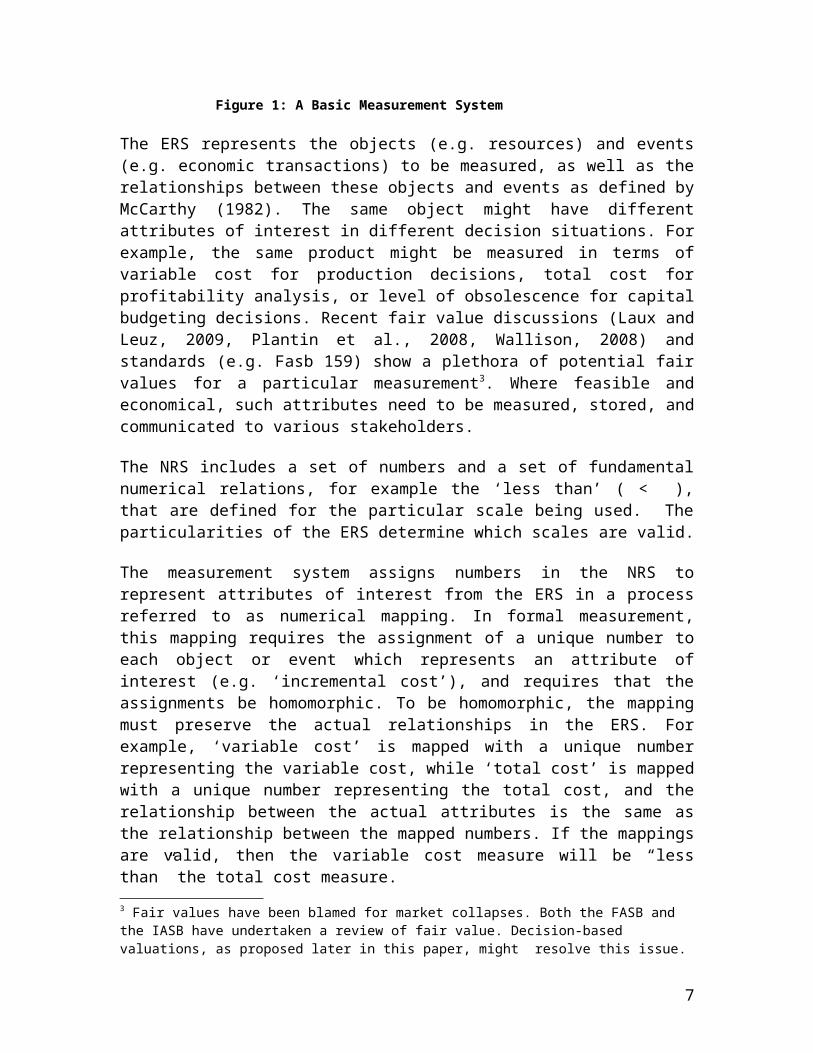
]’Figure 1: A Basic Measurement System
The ERS represents the objects (e.g. resources) and events (e.g. economic transactions) to be measured, as well as the relationships between these objects and events as defined by McCarthy (1982). The same object might have different attributes of interest in different decision situations. For example, the same product might be measured in terms of variable cost for production decisions, total cost for profitability analysis, or level of obsolescence for capital budgeting decisions. Recent fair value discussions (Laux and Leuz, 2009, Plantin et al., 2008, Wallison, 2008) and standards (e.g. Fasb 159) show a plethora of potential fair values for a particular measurement3. Where feasible and economical, such attributes need to be measured, stored, and communicated to various stakeholders.
The NRS includes a set of numbers and a set of fundamental numerical relations, for example the ‘less than’ ( < ), that are defined for the particular scale being used. The particularities of the ERS determine which scales are valid.
The measurement system assigns numbers in the NRS to represent attributes of interest from the ERS in a process referred to as numerical mapping. In formal measurement, this mapping requires the assignment of a unique number to each object or event which represents an attribute of interest (e.g. ‘incremental cost’), and requires that the assignments be homomorphic. To be homomorphic, the mapping must preserve the actual relationships in the ERS. For example, ‘variable cost’ is mapped with a unique number representing the variable cost, while ‘total cost’ is mapped with a unique number representing the total cost, and the relationship between the actual attributes is the same as the relationship between the mapped numbers. If the mappings are valid, then the variable cost measure will be “less than” the total cost measure.
3 Fair values have been blamed for market collapses. Both the FASB and the IASB have undertaken a review of fair value. Decision-based valuations, as proposed later in this paper, might resolve this issue.
5
Cost Attributes versus Value Attributes
Cost attributes form the base of the traditional external reporting structure. Mattessich (1964) states that the cost basis is the most reliable method if the purpose of accounting is the presentation of data which can be verified at a comparatively “high degree of objectivity” (Page 162). He also explains different treatments to which the measurement of marginal utility (value) has been associated in economic theory, and how the difficulties found in quantifying them led to an indirect measurement of value through the price paid for the commodity.
While cost attributes are fixed in traditional reporting, current values are dependent on factors like time and are contingent on changes in the measuring scales, as well as on circumstances (Mattessich 1964, P. 163).
Values are time-dependent
Many business measurements are time-dependent, and this dependence is only considered on an ad hoc basis. Some assets (e.g. cash) are expressed in current-day dollars, others have values that are affected by price changes, for example:
A/R and A/P includes 30, 60 and more days collectibles and discounts which are not expressed at their present value.
Inventory includes purchases over time, leading to LIFO, FIFO and standard cost valuations
All financial paper is affected by existing and changing interest rates. The longer the maturity period, the potentially stronger this effect.
Advanced financial derivatives present an even more complex effect. Retained earnings measures combine accumulated dollars of very different values.
The new business measurement model has to be formulated with these issues in mind. Even simple spreadsheet representations of company wealth and income flow can be made time dependent, providing interest rate sensitivity information.
Values are contingent on information usage
The literature has been prolific in establishing valuation bases for business, for example:
Exit value for liquidation situations ((Parker, 1975); (Chambers, 1979); (Mock & Collins, 1979))
Present value of future cash flows for investors that hold titles ((Staubus, 1971); (Ijiri, 1979); (Sloan, 1996))
Market value for trading situations, for natural resources ((Harris & Ohlson, 1987); (Barth, 1991); (Barth, 1994))
6
These alternate valuation bases are contingent on a particular view of business that in economic terms could be maintenance of capital, maintenance of purchasing power, maintenance of purchasing capacity, or value for liquidation.
Values are contingent on level of precision
Measures are of limited relevance if their measurement precision is not understood. In the physical sciences, the degree of precision of the measurement is often explicit. A weather forecast may include its level of precision, while a measure of pressure will include the measuring tool used (e.g. barometer) or the measuring units (Pascals) that indicate the precision of the measure.
When measures with different degrees of precision are combined, the resulting measure exhibits precision equal to that of the least precise component measure. However, traditional financial statements mix different precision schema, hindering assessments of precision. Figure 2 displays different assets disclosed in the balance sheet with an example of the level of precision of their measures (the levels of precision have to be determined and adjusted as they change, for example due to change in risk, and subjected to auditing). Different assets are reported and aggregated into accounts without consideration of the precision of each measure. Furthermore, assets measured with different levels of precision and using differing measures are summed into a total that is not representative of the real resources of the entity.
Figure 2 : Measurement Precision
82
Do we add them together?
Not specifiableIntangibles
75%Inventory & PP&E
95%Receivables
99%Cash
PrecisionBusiness reporting item
7

Values are related to future events
The present valuation of a future event is naturally subject to changing realities. For example a credit sale’s value is related to the probability of collection. A low quality item or an item that is outperformed by a competitor’s offer is likely to be returned instead of being paid off. During the financial crisis of 2008, entire categories of assets were devalued by third party defaults, leaving standard setters at loss for a proper valuation base.
Values are linked to a probability distribution via ERS/NRS mapping
Populations of elements in ERS data may be mapped onto a NRS via statistical distributions that can provide a more accurate description than simple point estimates. In a progressively atomized data environment, where tagged data is distributed separately from its originating environment, probabilistic descriptions may be more appropriate than deterministic ones. If these patterns are updated in real time, a more dynamic picture of the company will reduce the amount of information needed for decision-making. Most decisions will be made using data distribution profiles, not raw data, and users of financial information will be able to rely on current reports without looking back at historical information for trends.
In this scenario, a set of accounts may be represented as described in Figure 3.
Account Value Std. deviation
Distribution
Cash 13500432 450000 NormalInventory 25000800 1000810 NormalSales 15890746 20056781 Normal
Figure 3: Probabilistic representation
Relevance versus reliability
GAAP is very conservative and tremendously influenced by the public accounting profession. Public accountants, strongly pressed by the risk of litigation, have influenced the FASB4 to focus on reliability as opposed to relevance. As a result, many parts of the financial statements are only declarative of historical cost- based, which makes the accuracy and reliability of certain measurements irrelevant.
For example:
4 The FASB historically has been dominated by former members of big auditing firms. Every chair of the FASB up to the present has been an ex-partner of a major firm. The EITF that deals with secondary GAAP issues is also dominated by these firms.
8

As time passes, retained earnings becomes a pure fudge factor that balances assets with liabilities having little intrinsic meaning. It accumulates retained earnings in very different dollars say from a span of 10 to 20 years that cannot be added as having a common measurement base.
In a complex capital structure, par value is meaningless even in establishing the number of outstanding shares.
Most liability and asset papers are not fully adjusted to current market conditions on a day to day or even year to year basis, even if the instruments have a robust secondary market.
The effects of keeping unproductive cash or large amounts of short-term receivables and liabilities with no associated interest are not measured at all.
Since historical cost of investments is not representative of value, financial ratios become misleading with long-term assets purchased years before the analysis. It also reduces the comparability of statements of companies of different age (older companies, ceteris paribus, will show higher returns on investment).
Changing the primary measurement objective from verifiability (reliability) to decision relevance would carry several benefits, such as:
A retained earnings figure that represents the real accumulation of earnings adjusted for time value of currency, reflecting the relative value changes of corporate assets.
A one-number representation of capital received from the stockholders, with additional information like original exchange and fair value presented in a separate statement of capital contributions.
Measurement of all financial instruments on a continuous basis, revalued at market rates, with a separate item of owner equity reflecting this constant change.
Changes which question the underlying assumptions of the business reporting measurement model (BRMM)
Core components of the BRMM include the following:
1. If something cannot be ‘objectively’ measured, it is not disclosed. Examples include the value of contracts, social obligations, social assets, etc.
2. If a business event occurs prior to an actual ‘sale’ (defined in an accounting sense), that event is not captured, measured and reported.
3. Given the high costs of external reporting, businesses are parsimonious in what they report.
4. One report and set of measurements is provided for all external users
The technology of business measurement (sensors, ERPs, relational databases, etc.; Vasarhelyi, Alles, & Williams, 2010) has substantially changed the environment of business reporting. User needs and business motivations have likewise evolved. We are left with a business reporting model that does not acknowledge or take advantage of this evolution. For example:
9

Users of financial information represent a diversity of interested parties, but the BRMM is investor-centric. Employees, localities and business partners are highly disadvantaged in this situation.
Many variables that could not be measured before for lack of statistical methodology, historical databases, interactive communication with customers, etc. can now be easily measured (e.g. B2B websites present real-time values for many traded items).
The stakeholders’ need for prospective (not retrospective) information has changed requirements for the BRMM to include increasing levels of non-financial information, like corporate social responsibility, as they became more socially conscious.
The economics of reporting have changed. The incremental cost of new disclosures is substantially reduced as they are already incorporated into large ERP systems. As manual data manipulation is not required, the incremental cost of repeating a report from the dataflow is close to zero.
Past, present, and future
Error: Reference source not found4 places business measurement in a sequential frame where past business formulation, planning and action planning are coordinated /used with current business measurement and post-sale business actions. Time and value are intertwined due to the following factors:
All business events are time-dependent including currency (which varies in value over the years)
There is a time value of resources but this value is dependent on other factorso The ongoing basic risk-free value of resourceso The risk level of the entityo The risk level of the specific activity if separable from that of the entity
The feedback loop of monitoring and control introduces the latency (Vasarhelyi, 2006) of business administrative action (e.g. adjustment in the nature of inventories, staffing adjustments, logistic chain improvements, financing decisions, etc.)
10

Figure 4 The relativistic nature of reporting
Due to these considerations, the role of BRMM changes depending on chronological perspective:
The prospective view (PV) helps stakeholders assign valuation to the firm over the long term, decide on their level of engagement with the entity, and police the future of the entity.
The retrospective view (RV) of business aims to establish a baseline of measurement from which to project models of future business behavior (for example, to establish tax liability.)
Given the differences between these views, it is important to present them separately. Hence, from a procedural perspective, the use of tagged information with its attributes (a la e.g. XBRL5), with a macro schemata to specify the attributes as described later in this paper, may serve for this purpose.
Extending levels and flows to time related measurements
The physical sciences have shown us that examining the dynamics of processes provides substantial insight into their nature. The BRMM attempts the same by providing comparative retrospectives and some discussion of trends. Learning from physical science measurements can be applied to the BRMM in both the nature of time measures and the form of their representation.
5 www.xbrl.org.
Time as a constructive variable
Basic time
Changing currency base
Administrative feedback adjustmentloop
Time value of Money
Risk Factors
Risk Factors
Risk Factors
11

Just as researchers measure air movements, temperature, pressure, and humidity to understand the nature of tornadoes or produce forecast maps, the BRMM can provide multiple measures of past behavior (sales, costs, inventory turnover, customer satisfaction, etc.) and future trends (employee benefits, government regulations, etc.), a model can be built to understand the nature of the business and project future events.
For example, if we can measure the fixed and variable costs of an airline, airplane leases, contracts, number of cancellations, etc., we can build a model and estimate future revenue of the airline company by only having the amount of tickets sold. This model could naturally be extended to support different decisions.
The four layers of entity measurement
We divide the proposed measurement model into three layers so as to examine it within the context of measurement theory. These layers, which include declarations and procedures, are:
(1) the disclosure value chain, where different stages of organizational activity are measured, (2) the point of measurement of each datum, where the nature attributes and specification of tags is discussed, and (3) the level of desired contingency measurement, the nature of different “virtual”/subjective business events and the tradeoffs regarding their measurement are discussed.
1. The disclosure value chain (DVC)
In this section, we present a representation of the business process and discuss its different stages, the potential and benefits of their measurement, and intrinsic measurement issues.
The business activity measurement process (represented in Figure 5) has evolved to focus on entity transactions from the moment of sale, affecting mainly inventory and cash.(chart is analogous to Mccarthy, 1981) Agents performing the transaction (internal and external) were recognized to the extent that they caused cash disbursements to the company. Furthermore, the boundaries of the measurement process were confined to be the entity being considered.
12

Figure 5: The traditional business activities reporting system
The main drivers of this approach were business needs, and the main limitations were the technology, cost and complexity of the process. Based on the procedure developed by (Pacioli, 1514), which was a mix of existing practice observed in Venice and its formalization, elements such as property plant and equipment and depreciation were added to represent the increasing complexity of business. For example changing from an all-cash set of transactions to include credit necessitated the development of receivables and payables. The development of complex financial instruments- such as commercial paper, bonds, and stocks- required further adaptations. Business practice drove the development of new elements of the measurement model, with the clear sequence of business practice preceding accounting and being limited by existing technology (analytic / computational). The development of financial markets to allow better allocation of capital produced further change. The reporting malfeasance of the early 20th century created the Securities Acts of 1933 and 1934, necessitating the standardization of business measurement and the ensuing actions by the APB, FASB and other regulatory entities. However, the modified Pacioli model that was created with major technological limitations 500 years ago is still at the core of business measurement.
The increasing complexity of business processes, coupled with the development of improved computing technology, enabled the adoption of new measurement methodologies. A plethora of regulations progressively formalized existing practices into formal rules. While the regulations increased comparability, the absence of a structured plan led to the existence of anachronistic and unevenly applied rules and suboptimal business measurement.
13

In recent years, the computational basis of the measurement process evolved with the usage of integrated software such as ERPs. This development allows for multiple process measurements, integration of these measures, and most of all, nearly costless incremental capture of information. Figure 6 displays an integrated and linear view of business activities where eight levels (L0 to L7) depict key activities related to existing business measurement systems.
Figure 6: Business Activity Measurement, ERPs and Monitoring and Control
The incorporation of computational technology, the existence of improved analytic methods, and above all, the demand of more complex processes in a dynamic society (Economist, 2002) have led to the need for expansion of the business measurement model into a more comprehensive set of related measures. Figure 6Error: Reference source notfound presents an enhanced view of the business process aiming at expanding its measurement scope. Two additional issues should be noted: 1) ERPs contain enormous amounts of information of a non-financial nature, allowing for broader measurement and 2) the current model is single entity leaving open possibility of conjoint measurement6 of the supply chain.
We break the general view of business into four different stages: 1) early business stages, 2) lead actions, 3) actual business activities, and 4) consequent events.
6 Business entities have fuzzy boundaries and complex modern organizations (e.g. SPEs) add to this problem.
14

Since measures are already defined at the business activities [L3] level (with the aforementioned limitations and weaknesses), we use this level of information to illustrate the application of the measurement model.
Mock and Grove (1979) define five steps needed to analyze existing or new measurement systems:
1. Identify the decision context and related measurement needs. This step requires the identification of relevant, cost-effective information needed for decision-making (e.g. actual cash collections of the particular time journal)
2. Identify attributes of interest and postulate corresponding relationships. For example, when estimating cash collections, we must identify attributes (e.g. total sales and discount conditions) and relationships (e.g. percentage of customers who benefit from those discounts).
3. Investigate existing measurement scales from the factual view. This involves applying validity and reliability procedures to existing scales in order to ensure that the relationship between attributes in ERS is maintained in NRS. For example, historic cost is an existing scale valid to measure the sales of the period in consideration, and a ratio is an existing scale valid to measure the percentage discount applied to early collections.
4. Construct and analyze formal characteristics of new measurement scales the factual view. This step is needed whenever measurement scales for the identified attributes do not exist or need improvement. Such scales need to be evaluated using validity and reliability procedures.
5. Analyze each scale from the purposive view. The measures developed have to be evaluated in terms of information needs. Do the measures developed in steps 3 and 4 address the information needs detected in step 1?
Table 1 includes examples of information needs, corresponding attributes, and measures in the business activity level [L3]
Decision needs Attributes Measurements
Inventory needs Sales orders in units UnitsPotential cash collections Dollar value of sales Historical costNet cash available Present value of cash accounts Present valueAccounts receivable Bill? Dollar value of sales and collections Historical cost
15
Loss due to obsolescence Cost and present value of inventory H Cost/P Value
Table 1: Decision needs, attributes and measurements
Environmental Conditions [L0]
While the classic entrepreneurship literature focuses on the start of business from scratch, with environmental considerations following a business idea, a business is a dynamic entity with start and environmental facts cycles. Furthermore, environmental changes require organizations to constantly redefine themselves and understand the interactions of their components under changing conditions.
With changes in information processing technology and the progressive interlinking of societal informational clusters, questions arise regarding the desirability and feasibility of formalization of measurements in L0. The wider net of statistical and macroeconomic information at this level is provided by national governments and supplemented by lower levels of government (e.g. state and local). These information clusters are complemented by industry group information and information collected during electronic trading (Figure7). The formalization of these information clusters and their integration into organizational decision-making involves the expansion of corporate measurement systems. Among relevant environmental conditions, (L0) we find macroeconomic variables, resources available, business ideas, licenses and permits.
Figure 7: Progressive societal information clusters
NationalInformationProvisioning
cluster
OtherLocal government
InformationProvisioning
cluster
NationalInformationProvisioning
cluster
IndustryInformationProvisioning
cluster
InformationUtility
Provisioningcluster
CorporateInformationProvisioning
and utilizationcluster
16

Societal information clusters are increasingly integrated and formalized, enabling feedback loops between different types of organizational information systems. The measurement perspective will eventually formalize and integrate these information flows into earlier levels (L0).
Business plans [L1]
Business plans (L1) include financing, staffing, logistics, marketing plans, etc. These early elements of business processes are difficult to formalize and measure. Questions arise regarding:
The basic business idea Resource availability (financial, personnel, IP, etc.) Does the environment allow for this?
These are currently procedural issues since they remain difficult to quantify or measure. While it is difficult to conceive them being part of the business measurement process in a traditional sense, major environmental changes are of great importance in business and should be recorded. Some are included unsystematically on the recently expanded MD&A disclosures as well as in the corporate social responsibility reports, generating their own declaration issues.
After these near-universally applicable stages, some very specific processes occur that remain outside the scope of external reporting. These are the “lead actions” that relate closely to reportable events.
Lead actions [L2]
Lead actions are different from economic events since they represent obligations, not actual acquisitions or consumptions, as defined by Geerts and McCarthy (2002), who name them “commitments.” They are closely related to the financial measurements and if externally disclosed, would be of great value to investors. In a steady-state environment, present sales leads are closely related to future actual sales, supply contracts eventually materialize into sales, advertising can be projected into revenue, etc. If a company implements a strategy and tracks customer purchases or promotes sales of those items (e.g. by discount coupons), sales will likely increase in the future. The increase in sales will be reflected in the financial statements; however, the value added by the strategy will be overlooked in current BRM.
Many lead actions are recorded in corporate ERPs. While substantive infrastructure, planning, and management actions/decisions have to occur prior to lead triggers, these triggers, which are not part of the formal reporting system, increase book-able sales. The following information may add significant value to current reporting:
Number of sales leads
17

Supply flows from supplier managed inventory sites Advertising channels Stocking stores Creation of E-Commerce sites Staffing Conventions Sales “pitches”, proposals, responses to RFPs
The NRS in a Technological Age with the MC feedback loop [L4, L6, L7]
The traditional physical asset-based industrial organization has given way to the virtual, information-based organization, substantially changing the focus and basis of measurement. Corporate ERPs are the hub of information storage and the provisioner of information structures to run a business. In a real-time-economy7, business activities are monitored with a real-time stream of measures and compared with adaptable models8 of business behavior. Resulting meaningful variances are acted upon through a feedback loop. The right part in Figure 6 relates three levels of business activity that generate information for corporate ERPs. The feedback loop acts to control business activity and uses near-real-time data streams.
This view of the world raises some questions:
How frequently should external reporting be performed (yearly, quarterly, hourly, concurrently)?
At what business stage should reporting begin? Have the costs of reporting decreased enough to enable different forms of external
reporting for different stakeholders? Can structural equations be developed to better link the ERS and NRS so that
aberrations such as round-tripping, fictitious employees, and channel stuffing are detected and effectively prohibited?
Are current views on competitive intelligence restrictions on information outdated?
What is the basic entity of measurement of business? The business organization, the process, some other level?
The improved linkage among now-measurable items, to the point of specific identification (e.g. RFID) elements, changes the scenario of internal business measurement. The emergence of the XML standard and the consequent interoperability
7 Economist, “Real time economy How about now?” Jan 2002
8 Kogan, A., Alles, M.G., Vasarhelyi, M.A , Wu, J., Continuous Data Level Auditing Using Continuity Equations, Working Paper, Rutgers Accounting Research Center, Newark, New Jersey, 2007.
18

of processes that allows different companies and outsourcees to easily exchange data, also creates new economics and methods of data exchange.
Consequent events [L5]
While traditional business measurement focuses on currently observed events, post-sale events such as customer care present a very important view of business and very revealing for issues such as product quality and customer opinion. These variables also present feed-forward effects on sales, returns, and business planning.
2. Point measurement of data
While a schema such as the one being presented may seem cumbersome and unrealistic to current users of financial data, advancements in information technology and the information needs of business may substantively facilitate new methods of reporting. Our proposed model presents declaration issues that need to be addressed in order to disclose information that is understandable for users. In that direction, a tagged datum in some form of XML derivative language (e.g. XBRL9) may give core data enriched by a multiplicity of parameters. A more complex and representative schema for business measurement may ensue.
The tags associated with each attribute can represent different elements:
1. The measure that maps the NRS with the ERS.2. The point in time at which the measure is valid.3. The context in which the measure is valid.4. The reliability of the measure.5. Other information.
PM 1: Measurement of business variable = f(activity level; time; supported decision; level of precision; future events; probability characteristics)
For example:
Inventory = f(2,000,000; November 15 20011; liquidation for bankruptcy; 10**4;none; normal distribution estimate)
While some of these parameters may be irrelevant or immeasurable (labeled as none) the framework retains representational value.
The model can be expanded with the inclusion of likelihood estimates to deal with contracts in process, legal contingencies, sales leads, etc.
9 See http://www.xbrl.org
19
PM2: Measurement of business variable = f(activity level; time; supported decision; level of precision; conditioning future events; probability characteristics; likelihood of occurrence)
For example:
Contract = f(2,000,000; November 15 2011-2013;future sales projection; 10**4;winning the RFP; normal distribution estimate; 30%)
Taking this model further will allow for the creation of business representation models at the different levels such as represented in Figure 8.Error: Reference source not found
EnvironmentalConditionants
BusinessPlans
LeadActions
BusinessEvents
ConsequentEvents
E-commerce sales are growing 25% AA
Create a e-activity aimed at young customers
Create a web-site
Create payment mechanismsContract with FedEx for logisticsStock inventory
Sales Post sale careWarranty support
ReturnsCustomer feedback
Figure 8: Measuring the corporate business cycle
Value chains and processes have substantially changed in the real-time economy: The traditional internal value chain typically involved one company at one
location. The modern value chain has many outsourced processes performed in different countries, especially regarding the information portion of the value chain. Consequently, extrasystem measurements must be performed.
The traditional production chain contains inventories of component parts for manufacturing. Just-in-time manufacturing has changed this to a certain degree, but supplier-managed inventory, in which much of the inventory belongs to the
20

suppliers (while the company retains some liability) has changed substantially the paradigm of ownership, controls, and reporting. The fact that a company may not own the component parts in its facilities, yet retains contingent liabilities, creates complex relationships that require consolidation along the value chain.
Contractual relationships with outsourcers carry heavy termination penalties, high initial investments, and an entire set of new obligations that the traditional measurement system cannot address.
Measuring the business entity in its earlier stages is necessary to achieve useful representations. We must consider measurement parameters in order to further evaluate the needs of enterprise measurement.
3. The level of desired contingency measurement
Decision context ultimately determines the desirable information structure. For instance, bondholders will have substantive interest on the ongoing health of the company and, in the case of likely failure, on asset liquidation value.
Other contingencies, many of which not are not captured in current GAAP, are difficult to quantify and disclose. Some of these issues are discussed next.
3.1 Contractual and non-contractual obligationsExtending the reporting model to earlier levels (LO, L1 and L2) brings out what is probably the most important limitation of the BRMM: most contractual obligations are not recognized.
The business entity engages in many contracts that may or may not be disclosed in the current BRMM. Examples include:
Sales contracts / long term supply contracts Employment contracts, golden parachutes, severance payments IP acquisition costs Environmental obligations Contractual contingency requirements
The quantification and disclosure of these contracts are highly problematic. Descriptive formalization may be used to provide contractual information, subject to materiality and relevance filtering. Information technology allows for hierarchical organization of documents and extraction of key facts. Similar documents (e.g. large sales contracts) may be aggregated but not disclosed in detail to mitigate competitive disadvantage. Standards can be developed document description using meta data and hyperlinks / summarization provided at this level.
3.2 Measured and disclosed obligations
21

The gap between complex contracts and their numerical valuation is immense. Complex contracts may involve hundreds of pages of description, only one sentence of which ultimately changes the business’s economic schema. AIG has thousands of contracts and obligations but its demise, even with many very profitable units, was based on a series of simple clauses that determined a substantial increase on needed reserves if the unlikely event of it having its high credit ratings reduced.
Obligations of all types (formal and implicit, probable and less probable) may be disclosed and measured. Due to the asymmetry between information providers and users, it is impossible to anticipate modes of information usage. Links between provided information and their interpretation grow more tenuous with decreasing probability of occurrence.
Traditional accounting measurement has erred on the conservative side, showing a professional audit bias and only recording verifiable values. However, new analytic measurements and information clusters are redefining verifiability and the desirability of information inclusion into the formal reporting system. These values are not static in nature even at a discrete point in time, and their disclosure may change the a priori measurement of an event. For example, the disclosure of high levels of debt, or estimated progressive deterioration of held instruments may further deteriorate their value.
The current set of disclosures on legal contingencies add little information regarding likelihood and probability distribution. This deliberate obfuscation thwarts the feed forward effect discussed above.
Due to the information asymmetry and to the potential feed forward effect a generic rule of measurement and disclosure ensues.
“If the interpretation of the measurement is too complex or disruptive, do not create aggregate measures but pure data disclosures and leave their measurement and interpretations to the users.”(Vasarhelyi and Alles, 20006)
For example, many modern financial organizations hold a wide variety of credit default swaps, some of them publicly traded, others by private arrangement tailored to a particular issue. Although their face values are in the trillions of dollars, they are not explicitly recognized in financial statements. If they are deemed too difficult to measure, they should be standardized and disclosed through meta descriptions as described above.
3.3 Obligations that are not disclosedOrganizations often have obligations that are not disclosed to users of financial information:
Obligations with golden parachutes and future pension obligations with executives
Fines and other legal liabilities incurred but not yet due Obligations with suppliers and clients that relate to business continuity
22

3.4 Implicit obligations
Furthermore there are different types of obligations that may not fall under a traditional contractual view.
Community contributions – there is an implicit obligation of support to community related activities on an ongoing basis e.g. little league, PTA, etc.
Patriotic behavior – support country related welfare issues Political correctness – behave in a balanced manner in relation to biases Etc.
3.5 Obligations at the value chain not in the corporate structureThere are many contractual and non-contractual issues that finish up outside the corporate structure. These can involve the value chain, outsourcing and offshoring, and clients and suppliers. These relationships differ from sales contracts in that there is substantial partnership and some commingling of assets.
The Internet has enhanced integration among business partners along the value chain. While these obligations are not often contractual, they are practical as supply chain relationship must be preserved and moral. The classic example was the writedown by Cisco of substantial over an inventory value that was attributed to obligations to their suppliers.
4 Future estimatesA final type of information that does not fit well in any other category is the inclusion of future estimates in business measurements. Ultimately, business reporting is meant as guidance for future decisions. Management or other groups future estimates is a very valuable component that although criticized by many has substantive information value, if credible.
Forecasts do not fit well with the generic category of contingencies, but similar considerations may apply. Two of the most important attributes of future estimates are source (management, third party analysts, others) and probability (some type of reliability scale).
Point of measurement 2 (PM2) may be applied also to forecasts as PM3:
PM3: Measurement of forecasted business variable = f(estimated activity level; time; supported decision; level of precision; conditioning future events; probability characteristics, likelihood of occurrence, issuer of forecast, accuracy of past forecasts)
The above discussed types of obligations cover a wide range of required measure and disclosure. Overall they show that a wide range of relevant information is not presented, affecting the value of the firm.
23

Conclusions
This paper uses measurement theory to attempt to gain some insight into corporate reporting. Initially it creates a context for analysis examining the ERS and the NRS including: time dependencies, usage dependencies, level or precision, futurity, and probability of the event. Next it applies this discussion to three layers of entity measurement, proposing a view of business as a value chain and schemata for point measurement of business variables. Finally, areas of contingencies and future estimates were examined and a third point measurement schema was proposed to satisfy specific information characteristics of future estimates. These point measurement schema may serve to create a conceptual basis for an expanded view of XBRL and its tagging as a wide scope implementation of business measurement.
The overall conclusion to be drawn from this paper is that the current business measurement model is highly inadequate and progressing toward irrelevance. Business needs have evolved and current measurement solutions must do likewise. While historically, societal mechanisms have been appropriate to find measurement solutions, this is not true of recent decades, and the gap between user needs and reporting solutions has widened.
Need for research and other considerations
The standard setting process has failed to evolve with reporting technology and the evolution of the business process. Consequently we observe the wider and wider gap between corporate financial measurement and business reporting. Furthermore seems that the societal mechanisms are not able to cope with this change. The new BRMM may be like a “disruptive technology” (Christensen, 2003)10
Bibliography
Barth, M. E. (1991). Relative Measurement Errors Among Alternative Pension Asset and Liability Measures. The Accounting Review, 66(3), 433-483.
Barth, M. E. (1994). Fair Value Accounting: Evidence from Investment Securities and the Market Valuation of Banks. Accounting Review, 69(1), 1-25.
Chambers, R. J. (1979). The taxi company under cocoa. In R. R. Sterling & A. Thomas (Eds.), . Houston, Texas: Scholars Book Co.
10 Christensen, C.M., The Innovator's Dilemma: The Revolutionary Book that Will Change the Way You Do Business , Collins Business Essentials, 2003.
24

Economist. The Real Time Economy, 2002. January 31.
Geerts, G. L., & Mccarthy, W. E. (2002). An ontological analysis of the economic primitives of the extended-REA enterprise information architecture. International Journal of Accounting Information Systems, 3, 1 - 16.
Harris, T., & Ohlson, J. (1987). Accounting Disclosures and the Market’s Valuation of Oil and Gas Properties. The Accounting Review, 62(4).
Ijiri, Y. (1979). A simple sistem of cash-flow accounting. In R. R. Sterling & A. Thomas (Eds.), . Houston, Texas: Scholars Book Co.
Laux, C., & Leuz, C. (2009). The crisis of fair-value accounting: Making sense of the recent debate. Accounting, Organizations and Society, 34(6-7), 826-834. Elsevier Ltd. doi:10.1016/j.aos.2009.04.003.
Mattessich, R. (1964). Accounting and Analytical Methods. Houston, TX.
McCarthy, W. (1982). The REA Accounting Model: A Generalized Framework for Accounting Systems in a Shared Data Environment. The Accounting Review, LVII(3), 554-578.
Mock, T. (1976). Measurement and accounting information. American Accounting Association.
Mock, T., & Collins, L. G. (1979). Selection and evaluation of accounting measures for decision making from a measurement perspective. In R. R. Sterling & A. Thomas (Eds.), . Houston, Texas.
Mock, T., & Grove, H. (1979). Measurement, accounting and organizational information. New York: Wiley.
Pacioli, L. (1514). Paciolo on Accounting (Summa de Arithmetica, Geometria, Proportioni e Proportionalita: Distintio Nona - Tractatus XI, Particularis de Computis et Scripturis) translated by R. G. Brown and K. S. Johnson. McGraw-Hill.
Parker, J. (1975). Testing Comparability and Objectivity of Exit Value Accounting. The Accounting Review, 50(3), 512-524.
Plantin, G., Sapra, H., Shin, Hyun Song (2008). Marking-to-Market: Panacea or Pandora's Box? Journal of Accounting Research, 46 (2).
Sloan, R. (1996). Do Stock Prices fully reflect information in Accruals and Cashflows about future earnings earnings. Accounting Review, 71(3), 289-316.
25

Staubus, G. (1971). Activity costing and input-output accounting. Homewook, IL: R. D. Irwitt.
Vasarhelyi, M. (2006). Measuring information latency. International Journal of Digital Accounting Research, 6(11), 1-24.
Vasarhelyi, M., & Alles, M. (2006). The Galileo Disclosure Model (GDM).
Vasarhelyi, M., Alles, M. and Williams K. (2010) Continuous Assurance for the ‘Now’ Economy. Monograph prepared for the Institute of Chartered Accountants in Australia, Melbourne, Australia
Wallison, B. P. J. (2008). Fair Value Accounting : A Critique. Policy Studies, (July).
26