framework for assessing indicators of environmental
TRANSCRIPT
HAL Id: hal-00657820https://hal.archives-ouvertes.fr/hal-00657820
Submitted on 9 Jan 2012
HAL is a multi-disciplinary open accessarchive for the deposit and dissemination of sci-entific research documents, whether they are pub-lished or not. The documents may come fromteaching and research institutions in France orabroad, or from public or private research centers.
L’archive ouverte pluridisciplinaire HAL, estdestinée au dépôt et à la diffusion de documentsscientifiques de niveau recherche, publiés ou non,émanant des établissements d’enseignement et derecherche français ou étrangers, des laboratoirespublics ou privés.
Framework for assessing indicators of environmentalimpacts in the transport sector
Robert Joumard, Henrik Gudmundsson, Lennart Folkeson
To cite this version:Robert Joumard, Henrik Gudmundsson, Lennart Folkeson. Framework for assessing indicators ofenvironmental impacts in the transport sector. Transportation Research Record, SAGE Journal,2011, pp.55-63. �10.3141/2242-07�. �hal-00657820�
Transportation Research Record: J. of the TRB, No. 2242, p. 55-63. Doi 10.3141/2242-07
FRAMEWORK FOR ASSESSING INDICATORS OF ENVIRONMENTAL IMPACTS IN THE TRANSPORT SECTOR
Robert Joumard 1, Henrik Gudmundsson 2 and Lennart Folkeson 3
1 IFSTTAR (French Institute of Science and Technology for Transport, Development and Networks), Laboratory Transport and Environment, case 24, 69675 Bron cedex, (retired)
2 DTU (Technical Univ. of Denmark), Dept of Transport, Bygningstorvet 116 Vest, 2800 Kgs. Lyngby, Denmark, tel. +45 45 25 65 43, [email protected]
3 VTI, Box 8072, SE-402 78 Göteborg, Sweden, tel. +46 13 20 41 59, [email protected] Corresponding author: R. Joumard, [email protected]
Abstract
We addressed the following questions: How can environmental impacts of transport be identified? How can the impacts be represented by operational indicators? How can several indicators be jointly considered? And how can indicators be used in planning and decision making? We firstly derived a definition of “indicator of environmental impact in the transport sector”. The concept of “chain of causalities” between a source and a final target is developed, as a common reference for indicators and their assessment. We derived criteria and methods for the assessment and selection of indicators, in terms of measurement, monitoring and management. Finally, the application of the criteria is exemplified for individual indicators of seven chains of causalities and for selected aggregated indicators.
INTRODUCTION
Environmental issues attract increasing attention in decision-making processes concerning transport policies, plans, programmes and projects as well as in the development of transport technologies. Indicators are increasingly being used to assess the sustainability of transport and facilitate decision making. However, potential users of indicators are faced with a wealth of indicator sets, differing greatly in scientific underpinning and applicability in practice. Also, approaches to the development and use of indicators vary greatly between user groups. There seems to be a need for development of approaches to help decision makers and scientists to choose suitable indicator sets for various purposes.
The work reported here, based on existing knowledge, aims to contribute to the development of harmonised methods for building better environmental indicators relevant to transport. The paper presents parts of the output of a unique collaboration among a network of European scientists. The network comprised specialists in some environmental impacts (‘natural’ scientists), in decision-making processes (‘policy’ scientists) and in transport and environment planning (‘planning’ scientists) (1). The paper does not discuss in detail the actual indicators but develops a framework for the construction, assessment and use of environmental indicators. We define the term indicators, propose criteria for their assessment and selection, systematize environmental impacts and assess a selection of existing indicators.
Joumard, Gudmundsson and Folkeson 2
CONCEPT AND DEFINITION OF INDICATORS
The term ‘indicators’ can be understood and used in a number of ways. An in-depth review of the literature was conducted to identify relevant definitions of the term ‘indicator’ - see details in (2). The purpose of the review was not to select a single definition, but to help identify the key functions that indicators can play, and to reveal the extent to which context-specific factors should be allowed to influence the definition of indicators.
An indicator may be categorised in the following manner: − A marker or sentinel, indicating the presence or absence of something (3-4) − A measurement tool, indicating variations along important dimensions of the indicated
phenomenon (3-13) − A decision support tool allowing to take certain action (14-17) − A combination of the above (14, 18)
Most of the definitions consider an indicator as a measurement tool but some definitions include considerations about how such measurement tools can be used: to draw attention, to quantify objectives, to be used by decision makers, to help managers, to measure progress. The marker definition is also a measurement tool, but a simplified one. The key notion is representation. An indicator has to represent something in an adequate and simplified manner, otherwise it serves little purpose. Representation assumes connections between three elements: the item being represented, the item representing it (the indicator), and the usage domain for which the representation has to be valid and acceptable. The measurement aspect seems fundamental to any indicator. The usage domain or application is essential for indicators to be applied correctly according to the purpose.
The following simple definitions are used in the present study: − An indicator is a variable, based on measurements, representing as accurately as possible and
necessary a phenomenon of interest. − An environmental impact indicator is a variable, based on measurements, which represents an
impact of human activity on the environment as accurately as possible and necessary. − An indicator of environmental sustainability in transport is a variable, based on
measurements, which represents potential or actual impacts on the environment - or factors that may cause such impacts - due to transport, as accurately as possible and necessary.
CRITERIA FOR INDICATOR ASSESSMENT AND SELECTION
How to identify appropriate indicators or choose among possible ones (19)? According to several reviews (e.g. 20-23), often only a narrow range of indicators are used, and limited justification for the choice of particular indicators is typically given. Few systematic guidelines for choosing appropriate indicators across the area of environmentally sustainable transport systems and policies exist.
We address ways to identify, assess and select specific indicators, using criteria of indicator quality and appropriateness. ‘Criteria’ refers to the general notion of a principle or standard on which a judgment may be based. These elements have been built from an extensive compilation of existing literature. Several authors note that indicator selection should primarily be driven by
Joumard, Gudmundsson and Folkeson 3
the questions that the indicators are supposed to answer (e.g. 12, 20, 24). Most of the references were found in the area of environment, sustainability, or public health assessment (10, 25-29). Indicator criteria selection methodology seems particularly advanced in areas such as marine science (e.g. 30), agricultural research (31), and forestry management (32). Performance management literature addresses criteria to derive indicators at the level or organizations (e.g. 33). Some useful references in the transport area were also found (e.g. 34, 35).
The majority of the publications discuss indicator criteria, and provide lists of such criteria for use in the selection of indicators in various domains such as environmental assessment or sustainability. The lists include anything from 4 to over 30 criteria. Many criteria are commonly mentioned even across domains. Some studies report actual indicators that were selected based on the criteria lists, while others provide the lists as more general reviews or guidelines. It is not so common to find detailed accounts reporting how indicators were actually assessed and selected by using criteria - but see (27) or (36).
Most references provide some kind of definition of each criterion but very often the definitions are limited to only a headline or some informal comment. The definitions often appear similar but are not at all fully corresponding across references. Only few studies of the ‘criteria list’ type refer directly to more rigid definitions from for example basic scientific literature, although some studies do discuss selected criteria definitions in some depth - as for example (37). Interestingly, few if any sources define exactly what they understand by a ‘criterion’ in terms of indicator selection, although usually it is clear from the context what is meant. The main idea is to evaluate indicators with regard to some capacity expressed by the criterion. It is most often done in a qualitative way, or by using ordinal scores, rarely with more sophisticated numerical procedures - but see. e.g. (32).
It is characteristic that almost all identified references seek to distinguish and group criteria according to various functions of indicators, such as measurement and decision-making related functions. A typical distinction is between ‘scientific’ versus ‘policy related’ criteria. However, the groups are most often distinguished in a way that is quite unique to each particular reference.
A limited number of studies (27, 38-41) present systematic methodologies for the assessment and selection of indicators. In such studies application of indicator criteria is often included as a distinct step in a multi-stage process. Such references are particularly valuable for this work, even if they address other fields than transport and environment.
A few meta-reviews of indicator criteria literature were found, such as (42) for environmental monitoring, (29) for environmental assessment more generally, (27) for human health, and (more limited) (35) for sustainable transport in the UK.
Finally, three categories of criteria can be distinguished: a) Representation (or representativity), b) Operation and c) Policy application.
In the present study, the number of criteria has been limited to ten. Each criterion has been defined in a way to minimize overlaps and redundancy (see 19, pp. 126-130 for details, examples and counter-examples):
Representation (‘measurement’):
Joumard, Gudmundsson and Folkeson 4
− Validity: A valid indicator must actually measure the issue or factor it is supposed to measure (28)
− Reliability: A reliable indicator must give the same value if its measurement were repeated in the same way on the same population and at almost the same time (28)
− Sensitivity: A sensitive indicator must be able to reveal important changes in the factor of interest (28)
Operation ‘(monitoring’): − Measurability: A measurable indicator should be straight-forward and relatively inexpensive
to measure (25) − Data availability: Indicators should be based on (input) data that are readily available or can
be made available at reasonable cost and time (10) − Ethical concerns: An indicator must comply with fundamental human rights and must require
only data that are consistent with morals, beliefs or values of the population (28)
Policy application (‘management’): − Transparency: A transparent indicator is one which is feasible to understand and possible to
reproduce for intended users − Interpretability: An interpretable indicator allows an intuitive and unambiguous reading − Target relevance: A target relevant indicator must measure performance with regard to
articulated goals objectives, targets or thresholds − Actionability: An actionable indicator is one which measures factors that can be changed or
influenced directly by management or policy action
IDENTIFICATION AND STRUCTURING OF IMPACTS
The environment is often taken into account through the consideration of environmental or ecological impacts. Impacts are often described in the literature (for instance 44-54), as in public surveys conducted at a national (55) or international level (56). Their definition is typically neither clear nor precise. The lists are often heterogeneous and lack a coherent structure such as the widely accepted PSR, or DPSIR, system (Driving force, Pressure, State, Impact, Response; see (57)). For example, source indicators (such as air pollution) are mingled with state indicators (such as water quality) and impact indicators (such as visual effects). Whereas climate change, photochemical pollution and noise are almost always included in the lists, less commonly recognized features such as soil erosion, vibration, light pollution, hydrologic and hydraulic risks, odours, soiling, or low visibility are rarely mentioned. Dimming, fire risk or electromagnetic pollution are not mentioned at all in the references studied (43-56). Some impacts listed cover a wide range of environmental issues, such as air pollution, soil protection or landscape. Some lists include redundant indicators, such as both "biodiversity" and "fauna and flora", or both "population" and "human health".
One of the most typical ways to structure descriptions of the environmental issue consists of using objectives as proposed by (62) and applied by (63) to the environment. It has the main advantage of using a systemic approach, with a clear logic (geographical scale / main targets / impacts). On the same line, (64) stressed the need to define first a matrix view for a sustainable and viable city to provide a normative framework for choosing the relevant indicators. Then, they went on to define almost 200 indicators of a sustainable city for Flemish urban areas. They
Joumard, Gudmundsson and Folkeson 5
later observed that each indicator must be connected very clearly with an item of the matrix view.
It should be noted that what counts as significant environmental impacts depends on the cultural context; see e.g. (58) for Africa and (59-60) for forests and acid rain in Germany. More generally, (61) shows how the concept of environment itself differs between holistic societies, such as Totonaque, Inuit or Badui ones, and individualistic / analytic societies such as Western ones.
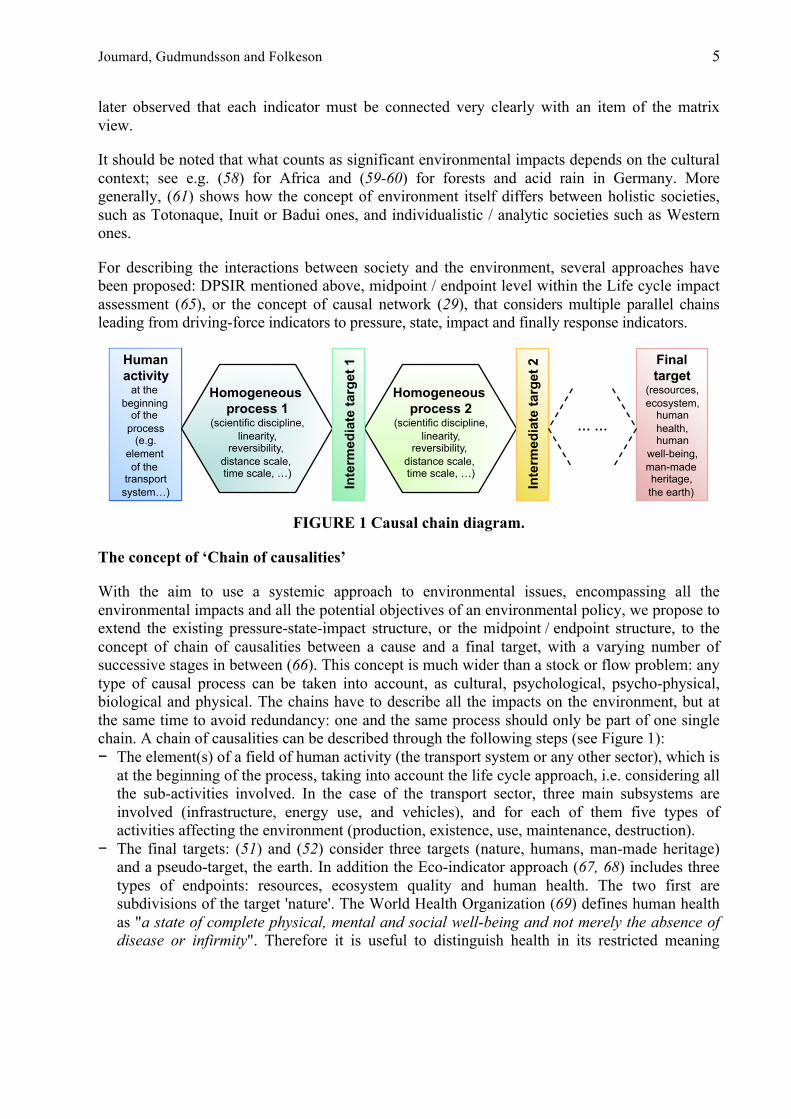
For describing the interactions between society and the environment, several approaches have been proposed: DPSIR mentioned above, midpoint / endpoint level within the Life cycle impact assessment (65), or the concept of causal network (29), that considers multiple parallel chains leading from driving-force indicators to pressure, state, impact and finally response indicators.
Human activity
at the beginning
of the process
(e.g. element of the
transport system…)
Final target
(resources, ecosystem,
human health, human
well-being, man-made heritage, the earth) In
term
edia
te ta
rget
1
Homogeneous process 1
(scientific discipline, linearity,
reversibility, distance scale, time scale, …)
Inte
rmed
iate
targ
et 2
Homogeneous process 2
(scientific discipline, linearity,
reversibility, distance scale, time scale, …)
… …
FIGURE 1 Causal chain diagram.
The concept of ‘Chain of causalities’
With the aim to use a systemic approach to environmental issues, encompassing all the environmental impacts and all the potential objectives of an environmental policy, we propose to extend the existing pressure-state-impact structure, or the midpoint / endpoint structure, to the concept of chain of causalities between a cause and a final target, with a varying number of successive stages in between (66). This concept is much wider than a stock or flow problem: any type of causal process can be taken into account, as cultural, psychological, psycho-physical, biological and physical. The chains have to describe all the impacts on the environment, but at the same time to avoid redundancy: one and the same process should only be part of one single chain. A chain of causalities can be described through the following steps (see Figure 1): − The element(s) of a field of human activity (the transport system or any other sector), which is
at the beginning of the process, taking into account the life cycle approach, i.e. considering all the sub-activities involved. In the case of the transport sector, three main subsystems are involved (infrastructure, energy use, and vehicles), and for each of them five types of activities affecting the environment (production, existence, use, maintenance, destruction).
− The final targets: (51) and (52) consider three targets (nature, humans, man-made heritage) and a pseudo-target, the earth. In addition the Eco-indicator approach (67, 68) includes three types of endpoints: resources, ecosystem quality and human health. The two first are subdivisions of the target 'nature'. The World Health Organization (69) defines human health as "a state of complete physical, mental and social well-being and not merely the absence of disease or infirmity". Therefore it is useful to distinguish health in its restricted meaning
Joumard, Gudmundsson and Folkeson 6
(absence of disease or infirmity) from so-called human well-being, because the processes are often very different. Finally we get six targets: the resources, the ecosystems, the human health in its restricted meaning, the human well-being, the man-made heritage, and the earth.
− The in-between elements, i.e. the chain of causalities between human activity and the final targets, to be described in detail. To design impact indicators, it is important to know the scientific milieu able to understand the process, and therefore to determine the scientific disciplines to be involved. It is important also to know if the process is linear or not. The reversibility is a major parameter from the sustainability point of view, where we have to distinguish the reversibility for individuals and for species. Finally the distance and time scales indicate who is concerned (local or global, short, medium or long term impact). The process can be split up into several processes, described in a homogeneous way, depending on the particular chain characteristics.
A chain of causalities can thus be defined as "a homogeneous process or a series of homogeneous processes between the transport system and a final target of the impacts on the environment". The description of all the chains allows us thus to express clearly what a potential indicator does measure and what it does not measure, and on which scientific mechanisms it should be based. The concept of chain of causalities allows us finally to give a precise definition to the expression "impact on the environment”.
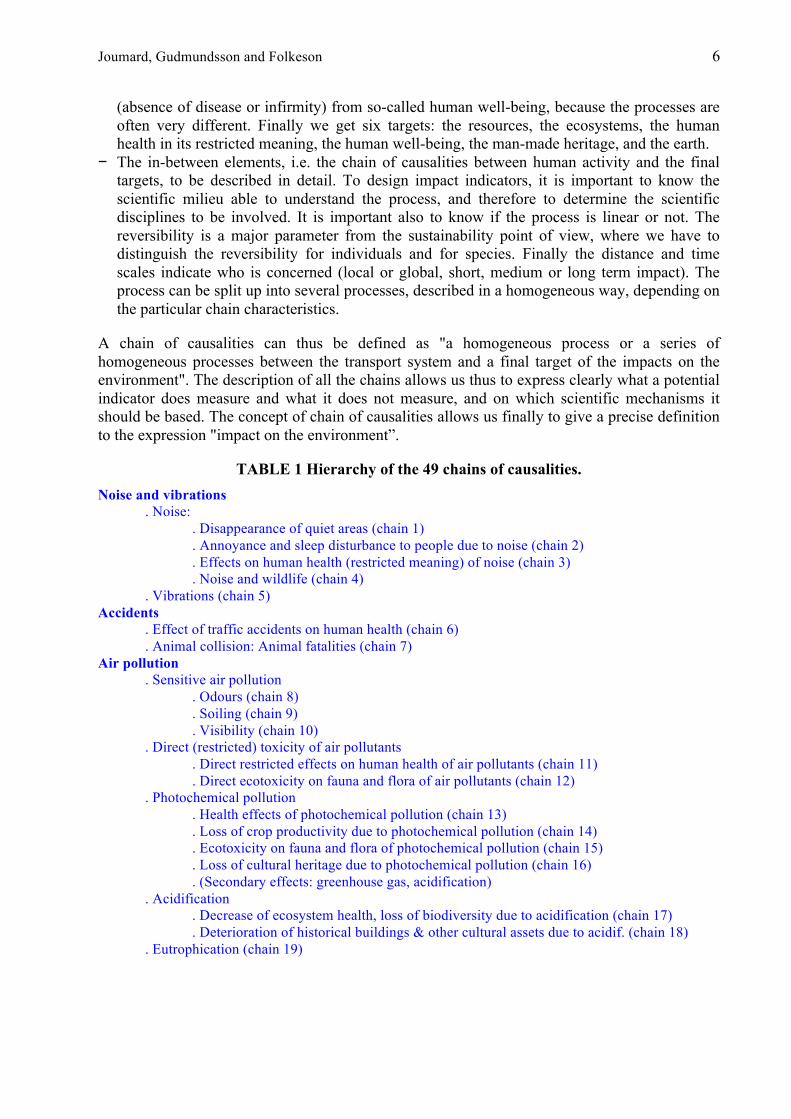
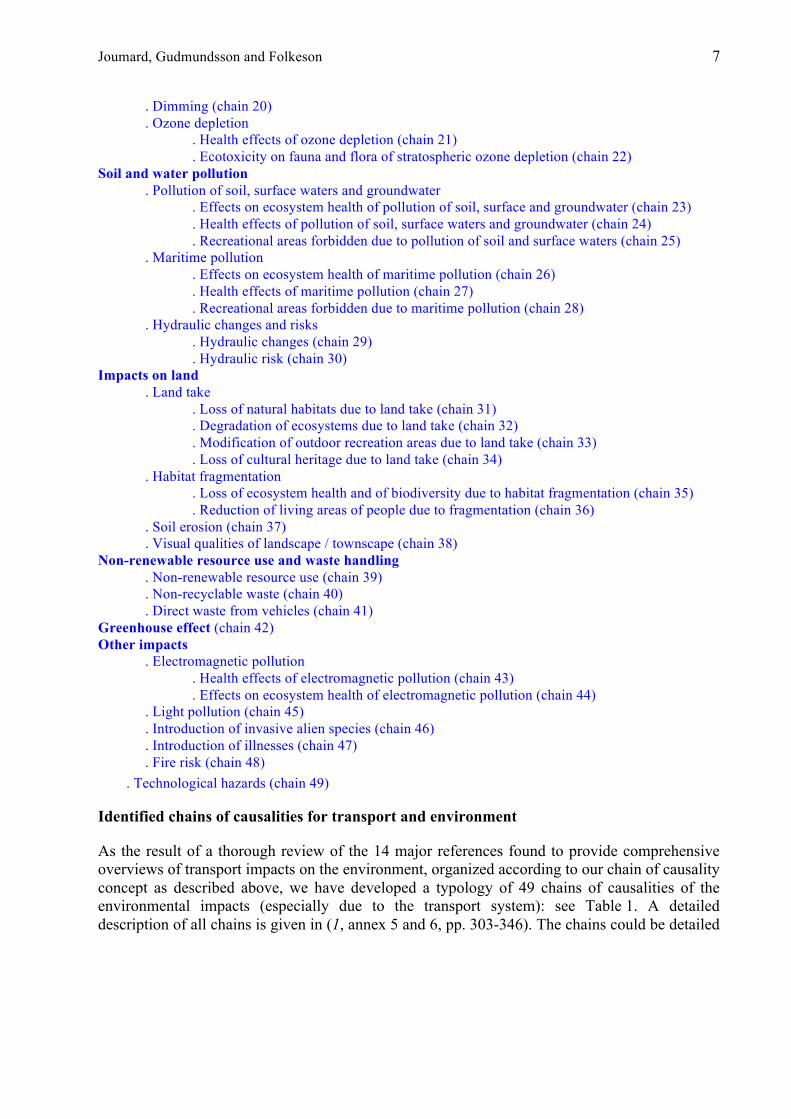
TABLE 1 Hierarchy of the 49 chains of causalities. Noise and vibrations . Noise: . Disappearance of quiet areas (chain 1) . Annoyance and sleep disturbance to people due to noise (chain 2) . Effects on human health (restricted meaning) of noise (chain 3) . Noise and wildlife (chain 4) . Vibrations (chain 5) Accidents . Effect of traffic accidents on human health (chain 6) . Animal collision: Animal fatalities (chain 7) Air pollution . Sensitive air pollution . Odours (chain 8) . Soiling (chain 9) . Visibility (chain 10) . Direct (restricted) toxicity of air pollutants . Direct restricted effects on human health of air pollutants (chain 11) . Direct ecotoxicity on fauna and flora of air pollutants (chain 12) . Photochemical pollution . Health effects of photochemical pollution (chain 13) . Loss of crop productivity due to photochemical pollution (chain 14) . Ecotoxicity on fauna and flora of photochemical pollution (chain 15) . Loss of cultural heritage due to photochemical pollution (chain 16) . (Secondary effects: greenhouse gas, acidification) . Acidification . Decrease of ecosystem health, loss of biodiversity due to acidification (chain 17) . Deterioration of historical buildings & other cultural assets due to acidif. (chain 18) . Eutrophication (chain 19)
Joumard, Gudmundsson and Folkeson 7
. Dimming (chain 20) . Ozone depletion . Health effects of ozone depletion (chain 21) . Ecotoxicity on fauna and flora of stratospheric ozone depletion (chain 22) Soil and water pollution . Pollution of soil, surface waters and groundwater . Effects on ecosystem health of pollution of soil, surface and groundwater (chain 23) . Health effects of pollution of soil, surface waters and groundwater (chain 24) . Recreational areas forbidden due to pollution of soil and surface waters (chain 25) . Maritime pollution . Effects on ecosystem health of maritime pollution (chain 26) . Health effects of maritime pollution (chain 27) . Recreational areas forbidden due to maritime pollution (chain 28) . Hydraulic changes and risks . Hydraulic changes (chain 29) . Hydraulic risk (chain 30) Impacts on land . Land take . Loss of natural habitats due to land take (chain 31) . Degradation of ecosystems due to land take (chain 32) . Modification of outdoor recreation areas due to land take (chain 33) . Loss of cultural heritage due to land take (chain 34) . Habitat fragmentation . Loss of ecosystem health and of biodiversity due to habitat fragmentation (chain 35) . Reduction of living areas of people due to fragmentation (chain 36) . Soil erosion (chain 37) . Visual qualities of landscape / townscape (chain 38) Non-renewable resource use and waste handling . Non-renewable resource use (chain 39) . Non-recyclable waste (chain 40) . Direct waste from vehicles (chain 41) Greenhouse effect (chain 42) Other impacts . Electromagnetic pollution . Health effects of electromagnetic pollution (chain 43) . Effects on ecosystem health of electromagnetic pollution (chain 44) . Light pollution (chain 45) . Introduction of invasive alien species (chain 46) . Introduction of illnesses (chain 47) . Fire risk (chain 48) . Technological hazards (chain 49)
Identified chains of causalities for transport and environment
As the result of a thorough review of the 14 major references found to provide comprehensive overviews of transport impacts on the environment, organized according to our chain of causality concept as described above, we have developed a typology of 49 chains of causalities of the environmental impacts (especially due to the transport system): see Table 1. A detailed description of all chains is given in (1, annex 5 and 6, pp. 303-346). The chains could be detailed
Joumard, Gudmundsson and Folkeson 8
further by dividing a chain into two or more chains, if it is considered as not homogeneous in terms of process or targets. In addition some chains may be missing.
Limitations to the aggregation of impacts
To be practical, the number of categories should not be plethoric. Moreover, some impacts can be merged, for instance when the scientific knowledge necessary to build indicators of different impacts is similar and when the main characteristics of the corresponding chains are also similar. In addition, chains considered as minor could be deleted. To allow users to perform such simplifications, the chain's structure has to be as detailed as possible: It is easier to merge and delete than to add processes.
Nevertheless it may be tempting to aggregate the chains of causalities further according to typical global or top-down classifications of the environment pillar of sustainable development, such as the following four types: - Related to life environment/natural resource with two main sub-categories: A1) for the well-
being, the quality of life, and A2) for the resources needed for life, the natural heritage, the conditions of a long term development
- Related to time scale with two main sub-categories: B1) for present generations – or short term, and B2) for future generations – or long term
- Related to reversibility, with two main sub-categories: C1) reversible, and C2) irreversible - Related to their local (D1) or global (D2) character
However, when we try to classify our 49 chains of causalities according to A1/A2, B1/B2, C1/C2 or D1/D2, we find that some chains cannot be differentiated according to this binary classification. For instance, most of the impacts on the ecosystems belong both to A1 and A2, and both to B1 and B2. Also, the impacts on cultural heritage concern both present and future generations. If we consider the irreversible character for the society, the dichotomy reversible/irreversible is only imaginary: several chains of causalities, and important ones indeed, are neither totally reversible nor totally irreversible. The greenhouse effect, e.g., may well be reversible, but only after centuries, and is therefore irreversible at the human scale.
Another attempt to aggregate the 49 chains aims to correspond to usual impact structures according to (44-56) and to allow a simpler presentation of the whole structure. It leads to merging them into 27 aggregated chains, and then into 8 groups (see Table 1). When we try to classify these groups according to top-down classifications, most of the 27 aggregated chains are combining detailed chains belonging to both categories: the four axes A to D are continuous rather than discrete.
The top-down approaches of the environment through simple and discrete classifications seem not to correspond to the reality of the impacts on the environment and cannot be used to characterize some chains of causalities. Reality is more complex than all-embracing approaches.
ASSESSMENT OF POTENTIAL INDICATORS WITHIN SELECTED IMPACTS
To derive indicators for each impact, a procedure is proposed where candidate indicators are identified from the literature and assessed according to the ten criteria described earlier. If no suitable indicators are found, new ones are proposed and assessed with the same criteria. Ideally
Joumard, Gudmundsson and Folkeson 9
this approach is to be undertaken in iterative series, involving subsequent circles of experts and indicator users to identify candidate indicators and assess them, to reach a robust set (19, pp. 136-139, 41).
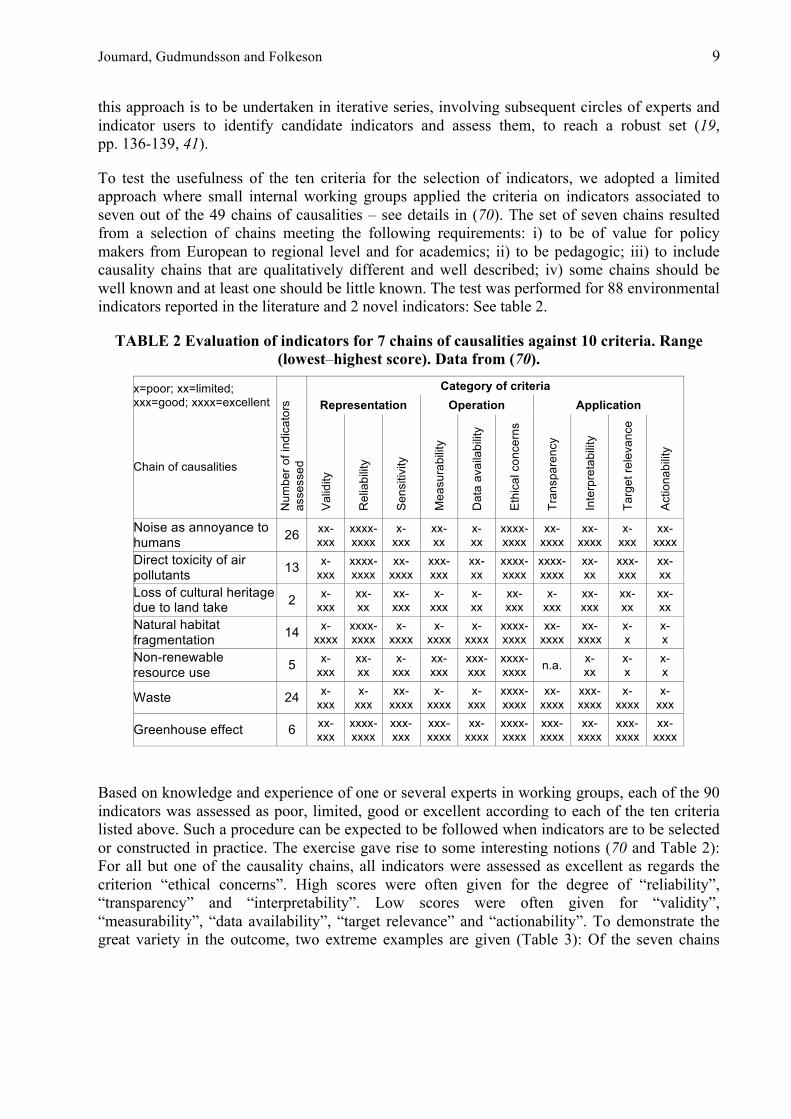
To test the usefulness of the ten criteria for the selection of indicators, we adopted a limited approach where small internal working groups applied the criteria on indicators associated to seven out of the 49 chains of causalities – see details in (70). The set of seven chains resulted from a selection of chains meeting the following requirements: i) to be of value for policy makers from European to regional level and for academics; ii) to be pedagogic; iii) to include causality chains that are qualitatively different and well described; iv) some chains should be well known and at least one should be little known. The test was performed for 88 environmental indicators reported in the literature and 2 novel indicators: See table 2.
TABLE 2 Evaluation of indicators for 7 chains of causalities against 10 criteria. Range (lowest–highest score). Data from (70).
Category of criteria x=poor; xx=limited; xxx=good; xxxx=excellent Representation Operation Application
Chain of causalities
Num
ber o
f ind
icat
ors
asse
ssed
Val
idity
Rel
iabi
lity
Sen
sitiv
ity
Mea
sura
bilit
y
Dat
a av
aila
bilit
y
Eth
ical
con
cern
s
Tran
spar
ency
Inte
rpre
tabi
lity
Targ
et re
leva
nce
Act
iona
bilit
y
Noise as annoyance to humans 26 xx-
xxx xxxx- xxxx
x- xxx
xx- xx
x- xx
xxxx- xxxx
xx- xxxx
xx- xxxx
x- xxx
xx- xxxx
Direct toxicity of air pollutants 13 x-
xxx xxxx- xxxx
xx- xxxx
xxx- xxx
xx- xx
xxxx- xxxx
xxxx- xxxx
xx- xx
xxx- xxx
xx- xx
Loss of cultural heritage due to land take 2 x-
xxx xx- xx
xx- xxx
x- xxx
x- xx
xx- xxx
x- xxx
xx- xxx
xx- xx
xx- xx
Natural habitat fragmentation 14 x-
xxxx xxxx- xxxx
x- xxxx
x- xxxx
x- xxxx
xxxx- xxxx
xx- xxxx
xx- xxxx
x- x
x- x
Non-renewable resource use 5 x-
xxx xx- xx
x- xxx
xx- xxx
xxx- xxx
xxxx- xxxx n.a. x-
xx x- x
x- x
Waste 24 x- xxx
x- xxx
xx- xxxx
x- xxxx
x- xxx
xxxx- xxxx
xx- xxxx
xxx- xxxx
x- xxxx
x- xxx
Greenhouse effect 6 xx- xxx
xxxx- xxxx
xxx- xxx
xxx- xxxx
xx- xxxx
xxxx- xxxx
xxx- xxxx
xx- xxxx
xxx- xxxx
xx- xxxx
Based on knowledge and experience of one or several experts in working groups, each of the 90 indicators was assessed as poor, limited, good or excellent according to each of the ten criteria listed above. Such a procedure can be expected to be followed when indicators are to be selected or constructed in practice. The exercise gave rise to some interesting notions (70 and Table 2): For all but one of the causality chains, all indicators were assessed as excellent as regards the criterion “ethical concerns”. High scores were often given for the degree of “reliability”, “transparency” and “interpretability”. Low scores were often given for “validity”, “measurability”, “data availability”, “target relevance” and “actionability”. To demonstrate the great variety in the outcome, two extreme examples are given (Table 3): Of the seven chains
Joumard, Gudmundsson and Folkeson 10
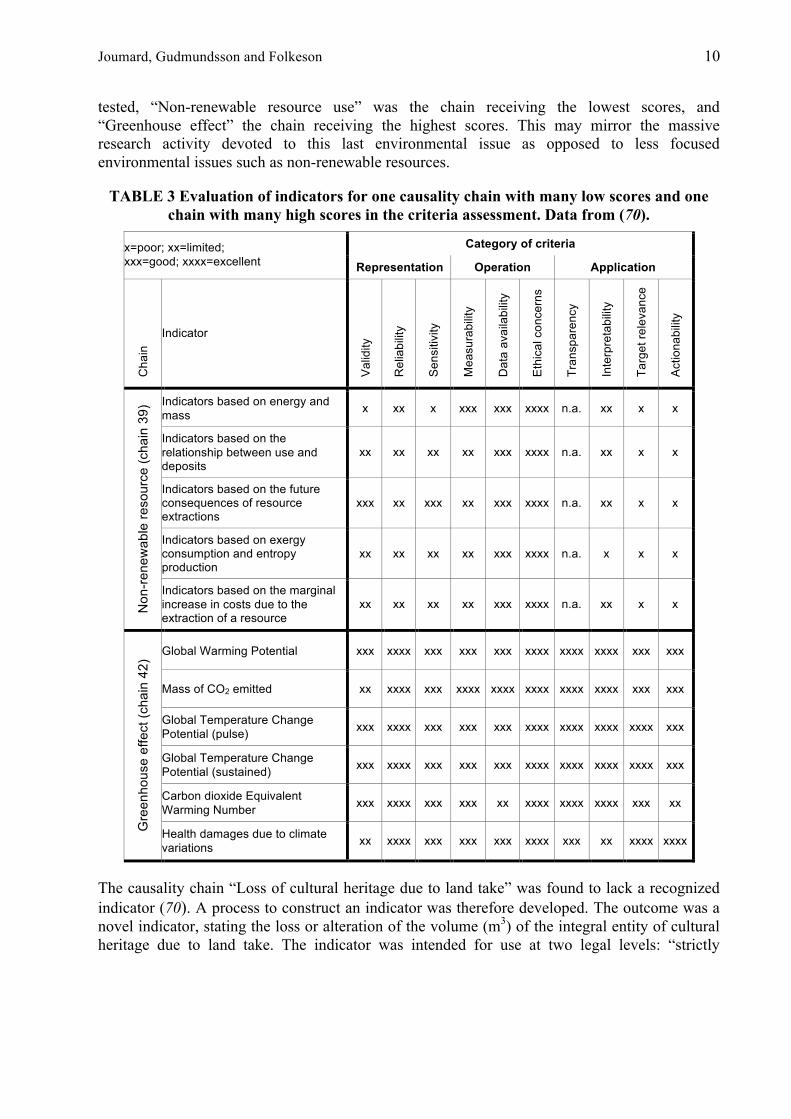
tested, “Non-renewable resource use” was the chain receiving the lowest scores, and “Greenhouse effect” the chain receiving the highest scores. This may mirror the massive research activity devoted to this last environmental issue as opposed to less focused environmental issues such as non-renewable resources.
TABLE 3 Evaluation of indicators for one causality chain with many low scores and one chain with many high scores in the criteria assessment. Data from (70).
Category of criteria x=poor; xx=limited; xxx=good; xxxx=excellent Representation Operation Application
Cha
in
Indicator
Val
idity
Rel
iabi
lity
Sen
sitiv
ity
Mea
sura
bilit
y
Dat
a av
aila
bilit
y
Eth
ical
con
cern
s
Tran
spar
ency
Inte
rpre
tabi
lity
Targ
et re
leva
nce
Act
iona
bilit
y
Indicators based on energy and mass x xx x xxx xxx xxxx n.a. xx x x
Indicators based on the relationship between use and deposits
xx xx xx xx xxx xxxx n.a. xx x x
Indicators based on the future consequences of resource extractions
xxx xx xxx xx xxx xxxx n.a. xx x x
Indicators based on exergy consumption and entropy production
xx xx xx xx xxx xxxx n.a. x x x
Non
-ren
ewab
le re
sour
ce (c
hain
39)
Indicators based on the marginal increase in costs due to the extraction of a resource
xx xx xx xx xxx xxxx n.a. xx x x
Global Warming Potential xxx xxxx xxx xxx xxx xxxx xxxx xxxx xxx xxx
Mass of CO2 emitted xx xxxx xxx xxxx xxxx xxxx xxxx xxxx xxx xxx
Global Temperature Change Potential (pulse) xxx xxxx xxx xxx xxx xxxx xxxx xxxx xxxx xxx
Global Temperature Change Potential (sustained) xxx xxxx xxx xxx xxx xxxx xxxx xxxx xxxx xxx
Carbon dioxide Equivalent Warming Number xxx xxxx xxx xxx xx xxxx xxxx xxxx xxx xx
Gre
enho
use
effe
ct (c
hain
42)
Health damages due to climate variations xx xxxx xxx xxx xxx xxxx xxx xx xxxx xxxx
The causality chain “Loss of cultural heritage due to land take” was found to lack a recognized indicator (70). A process to construct an indicator was therefore developed. The outcome was a novel indicator, stating the loss or alteration of the volume (m3) of the integral entity of cultural heritage due to land take. The indicator was intended for use at two legal levels: “strictly
Joumard, Gudmundsson and Folkeson 11
protected areas” and areas lacking absolute protection. Interestingly, the outcome of the assessment against the ten criteria often differed between the two legal levels. The indicator was not judged excellent for any of the ten criteria. The applicability of this rough, volume-based, indicator remains to be tested in practice.
It should be kept in mind that the test of the applicability of the criteria was performed by a separate expert group for each of the seven causality chains tested. Also, the test was limited due to the low number of experts involved, and hence an increased risk of dominance of subjective experience. The outcomes of the assessment do not lend themselves to any deeper comparison between causality chains. Nor were the indicators valuated in real applications. The exercise however served to demonstrate the practicability of the criteria set and the differences in ease with which various types of indicators can be selected (or constructed) in planning situations.
The same assessment was made by (71, pp. 238-245) for 7 indicators assumed to measure overall environmental sustainability and resulting from the application of methods for building aggregate or composite indicators: Ecological Scarcity method (72) for Switzerland, ReCiPe (66) for Europe, Ecological Footprint (73), Material Input per Service-unit or MIPS (74), economic approaches (stated preferences, revealed preferences, or damage oriented). Here again, all indicators were assessed as excellent as regards the criterion “ethical concerns”. All but two indicators were found good or excellent concerning “sensitivity” and “measurability”. Four of the seven indicators were assessed as “poor” or “limited” against at least five of the ten criteria. Indicators’ compliance with the criteria was low for “interpretability” (only “poor” or “limited”) and especially for “actionability” (mostly “poor”).
The conclusion of these exercises is that the tested existing indicators of environmental sustainability vary greatly in quality as assessed against the ten criteria.
CONCLUSION
Based on collaborative work in a European research network, the paper has addressed some of the key steps in the development and application of indicators of the environmental sustainability of transport systems and policies. A main concern has been to avoid falling prey to pre given ideas of how indicators of environmental sustainability for transport should be defined, for example by using only predefined policy objectives, or by adopting conventional ‘top-down’ concepts from the sustainability literature.
The first key step is the identification of the environmental impacts. For that purpose, we developed a new approach based on the concept of “chain of causalities”, a set of consecutive cause–effect relationships originating in a specific activity in the transport system (or any other human activity) and ending in a final target of each of the resulting environmental impacts. Each chain comprises one or several steps. We identified forty-nine causal chains and these should form a core of a systematic framework of environmental description and assessment for transport.
Based on the description of the context or the field of our research, we derived ten criteria for the assessment and selection of environmentally sustainable transport indicators, classified into three categories: measurement or representation, monitoring or operation, and management or
Joumard, Gudmundsson and Folkeson 12
application. Using the ten criteria, we exemplified indicator assessment for seven causality chains and a number of aggregated indicators. However, the testing of the method reported in this paper has adopted only a first and limited version of the recommended methodology. The full application would involve assessment carried out by teams representative of the expert and user communities.
Having so demonstrated a first attempt to apply the methodology, we recommend further work to build a solid and comprehensive approach for indicators of environmental sustainability in transport. This should include further scientific work in the appropriate scientific disciplines to derive indicators for impacts that have received limited attention or for emerging environmental issues. This work should be inter-disciplinary and sometimes trans-disciplinary and involve stakeholders to assess candidate indicators within each impact area. Development work can be enhanced when performed for actual policy or project applications, e.g. with regard to road, rail, sea and air transport, and with regard to building, operation and disposal of the associated transport systems. Considering Man’s mounting pressure on the environment, we believe that such work will play an essential role in making transport systems more environmentally sustainable in the future.
Also, approaches similar to the one reported here could be developed for impacts of transport on other sustainability dimensions such as economic or social outcomes. Similar approaches could also be tested on environmental impacts from other sources than transport.
References 1. Joumard, R. and H. Gudmundsson (eds). Indicators of environmental sustainability in transport: an
interdisciplinary approach to methods. INRETS report, Recherches R282, Bron, France, 2010, 422 p. http://cost356.inrets.fr/pub/reference/reports/Indicators_EST_May_2010.pdf and http://hal.archives-ouvertes.fr/hal-00492823/fr/
2. Gudmundsson, H., R. Joumard, R. Aschemann and A. Tennøy. Indicators and their functions. In (1), chap. 1, 2010, pp. 23-43.
3. McGraw-Hill Encyclopaedia of Science and Technology. 4. Webster’s Dictionary. 5. Opschoor, H. and L. Reijnders. Towards sustainable development indicators. In Kuik H. and
Verbruggen O. (eds), In search of indicators of sustainable development, Kluwer, Dordrecht, The Netherlands, 1991, pp. 7-27.
6. Gallopin, G.C. Environmental and sustainability indicators and the concept of situational indicators. A systems approach. Environmental Modeling and Assessment, 1, 1996, pp. 101-117.
7. Gallopin, G.C. Indicators and Their Use: Information for Decision Making. Introduction. 1997, pp. 13-27, In Moldan B and S. Billharz, Sustainability Indicators. Report on the project on Indicators of Sustainable Development, Wiley, Chichester, UK.
8. Bollen, K.A. Indicators: Methodology. In Smelser N. J. and Baltes B. (Eds), International Encyclopedia of the the Social and Behavioural Sciences, Elsevier, Amsterdam, 2001, pp. 7282-7287.
9. Lee, K.N. Human–Environment Relationship: Indicators. In Smelser N. J. and Baltes B. (Eds), International Encyclopedia of the Social and Behavioural Sciences, Elsevier, Amsterdam, The Netherlands, 2001, pp. 7045-7050.
10. OECD. Environmental Indicators – Development, Measurement and Use. Reference paper, OECD, Paris, 2003.
Joumard, Gudmundsson and Folkeson 13
11. OECD. Glossary of Statistical Terms. OECD Statistics Portal. [Created July 06, 2005; Last updated July 19, 2005] http://stats.oecd.org/glossary/index.htm
12. USEPA. Report of the 2005 peer review of proposed indicators for the U.S. Environmental Protection Agency’s Report on the Environment 2007 (ROE07) technical document. Final report, 2006. www.epa.gov/ncea/ROEIndicators/prcomments/pdfs/1.cover-and-introduction.pdf
13. Fernandez, H. Glossary. In Calderon E., Pronello C. and Goger T., Integrated assessment of environmental impact of traffic and transport infrastructure. COST 350 final report, Univ. Politécnica Madrid, ISBN 978-84-7493-401-4, 2009, 405 p., pp. 381-387.
14. KonSULT. the Knowledgebase on Sustainable Urban Land use and Transport.- Glossary. Non dated. www.socscinet.com/transport/konsult/public/level1/l1_gloss.htm [cited sept 22 2007]
15. Gilbert, R., N. Irwin, B. Hollingworth and P. Blais. Sustainable transportation performance indicators (STPI) project - Report on phase 3. Centre for Sustainable Transportation, Toronto, Canada, 2002, 125 p. http://cst.uwinnipeg.ca/documents/STPI%20Phase%203%20report.pdf
16. Lee, R.W., P. Wack and E. Jud. Toward Sustainable Transportation Indicators for California. MTI REPORT 02-05, Mineta Transportation Institute, San José State University, San Jose, Ca, USA, 2003.
17. Macário, R. Quality Management in Urban Mobility Systems: an integrated approach. Ph.D dissertation, Instituto Superior Técnico, Lisbon Technical Univ., 2005. http://cesur.civil.ist.utl.pt/tvc/
18. EEA. Glossary. European Environment Agency, 2009. http://glossary.eea.europa.eu/terminology/concept_html?term=environmental%20indicator
19. Gudmundsson, H., A. Tennøy and R. Joumard. Criteria and methods for indicator assessment and selection. In (1), chap. 4, 2010, pp. 103-140.
20. Jeon, CM. and A. Amekudzi. Addressing Sustainability in Transportation Systems: Definitions, Indicators, and Metrics. J. of Infrastructure Systems, March 2005, pp. 31-50.
21. May, A. D., S. Grant-Muller, G. Marsden and S. Thanos. Improving the collection and monitoring of ur-ban travel data: An international review. TRB 2008 Annual Meeting CD-ROM, Washington DC, 2008.
22. Litman, T. Well Measured: Developing Indicators for Comprehensive and Sustainable Transport Planning. Victoria Transport Policy Institute, Victoria, BC, Canada, 2008. www.vtpi.org/wellmeas.pdf
23. Goger, G., A. Karkalis and G. Arapis. A proposal for environmental indicators. In Calderon E., C. Pronello and T. Goger, Integrated assessment of environmental impact of traffic and transport infrastructure. COST 350 final report, Univ. Politécnica Madrid, ISBN 978-84-7493-401-4, chapter 4, 2009, pp. 175-274.
24. Lenz, R., I.G. Malkina-Pykh and Y. Pykh. Introduction and overview. Ecological Modelling, 130, 2000, pp. 1-11.
25. Dale, V.H. and S.C. Beyeler. Challenges in the development and use of ecological indicators. Ecological Indicators, 1, 2001, pp. 3-10.
26. Eyles, J. and C. Furgal. Indicators in environmental health: identifying and selecting common sets. Canadian J. Public Health, Vol. 93, Suppl. 1, 2002, pp. 62-67.
27. NCHOD. Compendium of Clinical and Health Indicators User Guide. National Centre for Health Out-comes Development (NCHOD), London School of Hygiene and Tropical Medicine, London, 2005. www.nchod.nhs.uk
28. WHO. Reproductive Health Indicators Reproductive Health and Research Guidelines for their generation, interpretation and analysis for global monitoring World Health Organization, Geneva, 2006.
Joumard, Gudmundsson and Folkeson 14
29. Niemeijer, D. and R.S de Groot. Conceptual framework for selecting environmental indicator sets. Ecological Indicators, vol 8, 2008, pp. 14-25.
30. Rice, J.C. and M.J. Rochet. A framework for selecting a suite of indicators for fisheries management. ICES J. Marine Sci., 62, 2005, pp. 516-527.
31. Bockstaller, C. and P. Girardin. How to validate environmental indicators. Agricultural Systems, 76, 2003, pp. 639-653.
32. Mendoza, G.A. and P. Macoun. Guidelines for Applying Multi-Criteria Analysis to the Assessment of Criteria and Indicators. Center for International Forestry Research, Jakarta, 1999. www.cgiar.org/cifor
33. Keeble, J.J., S. Topiol and S. Berkeley. Using Indicators to Measure Performance at a Corporate and Project level. J. Business Ethics, 44, 2003, pp. 149-158.
34. Zietsman, J. and L.R. Rilett. Sustainable Transportation: Conceptualization and Performance Measures. Research Report SWUTC/02/167403-1, Texas Transportation Institute, Univ. of Texas, Austin, USA, 2002, 163 p.
35. Marsden, G., C. Kelly, C. Snell and J. Forrester. Sustainable Transport Indicators: Selection and Use. DISTILLATE. Improved Indicators for Sustainable Transport and Planning. Deliverable C1. Univ. of Leeds, Univ. of York, UK, 2005.
36. EEA. Topic descriptions and quality evaluations for indicators in the EEA core set (overview, 2004). European Environment Agency, Copenhagen, 2004. http://themes.eea.europa.eu/IMS/About/EEACSITopicsAndQuality2004.pdf
37. Boyle, M., J.J. Kay and B. Pond. Monitoring in support of policy: an adaptive ecosystem approach. In Encyclopedia of Global Environmental Change, Vol. 4, ed. T Munn, Wiley, New York, 2001, pp. 116–137.
38. Hardi, P. and J.A. DeSouza-Huletey. Issues in analyzing data and indicators for sustainable Development. Ecological Modelling, 130, 2000, pp. 59-65.
39. Jackson, L. E., J.C. Kurtz and W.S. Fisher (Eds). Evaluation guidelines for ecological indicators. U.S. Environmental Protection Agency, Washington DC, 2000.
40. Rochet, M.J. and J.C. Rice. Do explicit criteria help in selecting indicators for ecosystem-based fisheries management? ICES J. Marine Sci., 62, 2005, pp. 528-39.
41. Cloquell-Ballester, V-A., V-A. Cloquell-Ballester, R. Monterde-Dıaz and M-C. Santamarina-Siurana. Indicators validation for the improvement of environmental and social impact quantitative assessment. Environ. Impact Assessm. Rev., 26, 2006, pp. 79-105.
42. Boyle, M. An Adaptive Ecosystem Approach to Monitoring: Developing policy performance indicators for Ontario Ministry of Natural Resources. Master in Environmental Studies degree from the University of Waterloo, Canada, 1998. www.nesh.ca/jameskay/ersserver.uwaterloo.ca/jjkay/grad/mboyle/th_pdf.html
43. USEPA. Indicators of environmental impacts of transportation - Highway, Rail, aviation and maritime transport. USEPA report, 230-R-96-009, Washington, USA, 1996, 268 p.
44. OECD. Environmental criteria for sustainable transport: Report on phase 1 of the project on Environmentally Sustainable Transport (EST). OECD report, OECD/GD(96), Paris, 1996, 96 p.
45. Swedish EPA. Towards an environmentally sustainable transport system. Swedish EPA report, n°4682, 1996, 52 p.
46. EC. Directive 2001/42/EC of the European Parliament and of the Council of 27 June 2001 on the assessment of the effects of certain plans and programmes on the environment. http://eur-lex.europa.eu/LexUriServ/LexUriServ.do?uri=CELEX:32001L0042:EN:HTML
47. OECD. Impact of Transport Infrastructure Investment on Regional Development, OECD, Paris, 2002. www.cemt.org/pub/pubpdf/JTRC/02RTRinvestE.pdf
Joumard, Gudmundsson and Folkeson 15
48. EEA. Paving the way for EU enlargement - Indicators of transport and environment integration - TERM 2002. European environment agency, Environmental Issue Report, N° 32, Copenhagen, 2002, 64 p. www.eea.europa.eu/publications/environmental_issue_report_2002_24
49. Borken, J. Indicators for sustainable mobility – a policy oriented approach. 1st Int. Symposium "Environment and Transport", Avignon, France, 19-20 June 2003, proceedings, n°93, Inrets ed., Arcueil, France, 2003, pp. 87-94.
50. Ahvenharju, S., T. Könnölä, R. van Grol, W. Walker, L. Klautzer, W. Röhling, R. Burg, R. de Tommasi, M. Arendt, P. Steiner, P. Bickel and G. De Ceuster. Operationalising Sustainable Transport and Mobility: The System Diagram and Indicators. SUMMA Deliverable 3, Rand Europe report, The Netherlands, 2004, 104 p.
51. Goger, T. Un indicateur d'impact environnemental global des polluants atmosphériques émis par les transports (An aggregated indicator of air pollution impacts involving transport). Thèse, Insa Lyon, 28 nov. 2006, and Inrets report, n°LTE 0633, Bron, France, 2006, 283 p. http://cost356.inrets.fr/pub/conferences/these_Goger_2006.pdf
52. Goger, T. and R. Joumard. A method of building an aggregated indicator of air-pollution impacts. 3rd int. conf. Sustainable development 2007, 25-27 April 2007, Algarve, Portugal.
53. Calderon, E., C. Pronello and T. Goger. Integrated assessment of environmental impact of traffic and transport infrastructure. COST 350 final report, Univ. Politécnica Madrid, ISBN 978-84-7493-401-4, 2009, 405 p.
54. Joumard, R. and J.P. Nicolas. Transport project evaluation methodology within the framework of sustainable development. Ecological Indicators, vol. 10, n°2, 2010, pp. 136-142. http://dx.doi.org/10.1016/j.ecolind.2009.04.002
55. Boy, P. Les représentations sociales de l'effet de serre - 8e vague d'enquête (Social representations of greenhouse – 8th survey). Report, RCB Conseil, Paris, 2007, 39 p.
56. EC. Attitudes of European citizens towards the environment. EC report, Brussels, 2008, 92 p. http://ec.europa.eu/public_opinion/archives/eb_special_en.htm#295
57. EEA. Glossary. European Environment Agency, 2009. http://glossary.eea.europa.eu/EEAGlossary/D/DPSIR
58. Esoh Elame, J. Interculturaliser le développement durable (The intercultural dimension of sustainable development). Colloque Développement durable – leçons et perspectives, Ouagadougou, Burkina Faso, 1-4 June 2004. www.francophonie-durable.org/documents/colloque-ouaga-a1-esoh.pdf
59. Roqueplo, P. Pluies acides : menaces pour l’Europe (Acid rain: Threats for Europe). Economica, Paris, 1988.
60. Brüggermeier, F.J. Le dépérissement de la forêt (Waldsterben) : construction et déconstruction d’un problème d’environnement (Forest decline (Waldsterben): construction and deconstruction of an environmental issue). In C. Bernhardt and G. Massard-Guilbaud (dir.), Le démon moderne, Presses universitaires Blaise Pascal, Clermont-Ferrand, France, 2002, pp. 75-91.
61. Lammel, A. and L. Resche-Rigon. La pollution atmosphérique comme objet cognitif : diversité des perceptions (Atmospheric pollution as cognitive object: diversity of perceptions). In L. Charles, P. Ebner, I. Roussel and A. Weill "Evaluation et perception de l’exposition à la pollution atmosphérique", collection Primequal-Predit, la Documentation Française, Paris, 2007, pp. 71-84.
62. Keeney, R.L. Value-focused thinking. A path to creative decision-making. Harvard University Press, Cambridge, London, 1992, 416 p.
63. Rousval, B. Aide multicritère à l'évaluation de l'impact des transports sur l'environnement (Multicriteria assistance in evaluating the impacts of transport on environment). PhD thesis, Univ. Paris IX Dauphine-Lamsade, Paris, 2005.
Joumard, Gudmundsson and Folkeson 16
64. Block, T., J. Van Assche, D. Vandewiele, F. De Rynck and H. Reynaert. Steden op koers ? Stadsmonitor voor Leefbare en Duurzame Vlaamse Steden, Editie 2006, Vanden Broele, Brugge, Belgium, 2007, 440 p.
65. Goedkoop, M., R. Heijungs, M. Huijbregts, A. De Schryver, J. Struijs and R. van Zelm. ReCiPe 2008 - A life cycle impact assessment method which comprises harmonised category indicators at the midpoint and the endpoint level. Report I: Characterisation. VROM, The Hague, The Netherlands, 2009, 132 p. www.lcia-recipe.net/@api/deki/files/11/=ReCiPe_main_report_final_27-02-2009_web.pdf
66. Joumard, R., H. Gudmundsson, F. Kehagia, S. Mancebo Quintana, P. Boulter, L. Folkeson, I. McCrae, M. Boughedaoui, P. Waeger and E. Calderon. Transport, environment and sustainability. In (1), chap. 2, 2010, pp. 45-78.
67. Brand, G., A. Braunschweig, A. Scheidegger and O. Schwank. Weighting in Ecobalances with the ecoscarcity method – Ecofactors 1997. BUWAL (SAFEL) Environment Series, No. 297, Bern, 1998.
68. Goedkoop, M. and R. Spriensma. The Eco-indicator 99: A damage oriented method for life cycle impact assessment, Methodology report. Report, nr 1999/36A, 3rd ed., PRé Consultants, Amersfoort, The Netherlands, 2001, 144 p. www.pre.nl/download/EI99_methodology_v3.pdf
69. WHO. Preamble to the Constitution of the World Health Organization as adopted by the International Health Conference, New York, 19-22 June, 1946; signed on 22 July 1946 by the representatives of 61 States (Official Records of the World Health Organization, no. 2, p. 100) and entered into force on 7 April 1948.
70. Folkeson, L., M. Boughedaoui, R. Joumard, E. Ortega Pérez, P. Waeger, C. Camusso, C. Pronello, G. Arapis, K. Karkalis, T. Goger, M. Chiron and S. Dimopoulou. Assessment of some indicators within an impact. In (1), chap. 5, 2010, pp. 141-189.
71. Waeger, P., E. Calderon, R. Arce, N. Kunicina, R. Joumard, J.P. Nicolas, A. Tennøy, F. Ramjerdi, M. Ruzicka, G. Arapis, S. Mancebo Quintana and E. Ortega Pérez. Methods for a joint consideration of indicators. In (1), chap. 6, 2010, pp. 191-271.
72. Frischknecht, R., R. Steiner and N. Jungbluth. The Ecological Scarcity Method – Eco-Factors 2006. A method for impact assessment in LCA. Environmental studies no. 0906. Federal Office for the Environment, Bern, 2009, 188 p.
73. Ewing, B., A. Reed, S.M. Rizk, A. Galli, M. Wackernagel and J. Kitzes. Calculation Methodology for the National Footprint Accounts, 2008. Global Footprint Network, Oakland, USA, 2008b, 17 p. http://www.footprintnetwork.org/download.php?id=508
74. Ritthoff, M., H. Rohn and C. Liedtke. Calculating MIPS: Resource productivity of products and services. Wuppertal Spezial 27e, Wuppertal Institut, Wuppertal, Germany, 2002, 53 p. www.wupperinst.org/uploads/tx_wibeitrag/ws27e.pdf