framework for e-governance to improve service delivery for
TRANSCRIPT

Framework for e-governance to improve service delivery for local authorities in South
Africa
G Muridzi
orcid.org/ 0000-0002-2362-8496
Thesis submitted for the degree Doctor of Philosophy in Business Management and Administration at the North-
West University
Promoter: Prof JA Meyer
Graduation: April 2019
Student number: 28296524

i
PREFACE
Let me take this opportunity to thank “the God of Major 1” who has made my PhD journey
possible and on this day I am saying, “I am raising my Ebenezer”.
I would like to give thanks to my family; to my mother, Frascia Muridzi, and to my sisters,
Rudo, Everjoy and Chipo, who supported me both financial and spiritually. I vividly
remember my child asking me, “Daddy what kind of learning is this? You are always busy
with your books and you have no time to rest.”
I would also like to take this opportunity to thank my late father, Garaipasi Muridzi, who used
to say to me, “education first, work later”. I remember very well way back when I completed
my Form Four and I wanted to work as a temporary teacher without having acquired any
professional qualification. My father told me that I could not go to work at that stage because
the money I was going to earn would be short-lived as I was vulnerable and could be
stopped at any given time to be replaced by a qualified teacher. His words were an
inspiration to me and from that day I developed an interest in advancing my education.
I would also like to acknowledge my supervisor, Professor Meyer, who never tired of guiding
and supporting me in shaping this thesis. I would also like to thank my PhD colleagues,
Reason and Sabelo, for the way we worked as a team and pulled each other by the hand
along the way. This journey was full of meandering, mountains and rivers. Through their
support and encouragement, I managed to complete my studies.
I would like to acknowledge with appreciation the financial support I received through the
bursary programme of the North West University, which supported me in terms of tuition fees
for the duration of my studies.
Opinions expressed and conclusions of this study are those of the author and are not
necessarily to be attributed to the North West University.
ii
ABSTRACT
E-governance is the use of Information and Communication Technologies (ICT) by the public
sector with the aim of improving information and service delivery, encouraging citizen
participation in the decision-making process and making government more accountable,
transparent and effective. There is slow usage and uptake of e-governance initiatives by
citizens despite the interactive features available on the internet. The aim of this study is to
examine and explain the uptake and usage of ICT by citizens, assess and explain the
services offered to citizens, and examine existing e-governance and e-government theories
and practice in order to draw lessons from where it is successful in order to develop e-
governance framework for service delivery for local authorities in South Africa.
The increased use of ICT as part of e-governance has given birth to new governance in
South Africa municipalities for better service delivery to citizens. This study uses the
Technology Acceptance Model, the Synthesized Stage Model and the Interactive-Service
Model to establish the uptake and usage of ICT by citizens. Mixed method research was
conducted through questionnaires and interviews from three (3) Metropolitan Municipalities
and three (3) Local District Municipalities in the Gauteng Province of South Africa. 600
questionnaires were distributed to citizens and six (6) executive members from municipalities
were interviewed.
Data collected through questionnaires was analysed using Statistical Package for the Social
Sciences software. Factor analyses were performed on internet usage and connectivity,
municipality services, service delivery output, impact of e-governance and e-governance
outcome. Data from interviews was analysed using Atlas.ti 7 and eleven (11) themes
emerged. Results of quantitative study found that respondents who participated in the study
have the same knowledge on the use of ICT tools as part e-governance. Results of
qualitative study revealed that e-governance should be looked at through the lens of a full
ecosystem that enables citizens, business and Small to Medium Enterprises to interact with
government using full range of electronic media. The study found that Metro Municipalities in
South Africa are implementing e-governance as a full ecosystem by investing in ICT through
various applications and platforms that allow citizens to access online services from
municipalities. Results indicated that Metro Municipalities in South Africa are taking a new
landscape by moving from just ‘governance’ to ‘e-governance’ by allowing public
participation through technology and engaging Public-Private-Partnership in rolling out ICT
initiatives.

iii
Results from this research contribute to the body of knowledge for low uptake and usage of
ICT by citizens at local government level in South Africa by providing an insight into the
underlying challenges. The study provides a theoretical and practical insight on factors why
local authorities are offering poor service delivery to their citizens in South Africa. The study
also assesses the relevance and validity of e-governance and e-government theories and
practice in service delivery in South Africa. The study managed to develop an e-governance
framework for improving service delivery for local authorities in South African context.
Key words: ecosystem, e-governance, Information Communication Technology, Small to
Medium Enterprises
iv
TABLE OF CONTENTS
PREFACE ................................................................................................................................... I
ABSTRACT ............................................................................................................................... II
CHAPTER 1: INTRODUCTION ................................................................................................. 1
1.1 Motivation for undertaking this study .............................................................. 1
1.2 Background to the study .................................................................................. 4
1.2.1 South African social realities ............................................................................... 4
1.2.2 South African service delivery in an economic context ........................................ 4
1.2.3 Legislative and policy context .............................................................................. 5
1.2.4 Challenges of e-governance in South Africa ........................................................ 6
1.2.5 Characteristics of municipalities involved in the study ......................................... 7
1.2.6 Rationale for selecting municipalities involved in the study .................................. 8
1.3 Problem Statement ............................................................................................ 8
1.4 Research Questions ........................................................................................ 10
1.5 Research Objectives ....................................................................................... 10
1.6 Importance and benefits of the study ............................................................ 11
1.7 Delimitation and assumptions ........................................................................ 12
1.7.1 Delimitations (Scope) ........................................................................................ 12
1.8 Assumptions ................................................................................................... 14
1.9 Definition of key terms .................................................................................... 14
1.10 Organisation of the thesis .............................................................................. 14
1.11 Chapter conclusion ......................................................................................... 14
v
CHAPTER 2: OVERVIEW AND DEBATE ON E-GOVERNANCE AND E-
GOVERNMENT ....................................................................................................................... 16
2.1 Introduction ..................................................................................................... 16
2.2 Debate on e-governance and e-government ................................................. 16
2.3 Conceptualising e-governance ...................................................................... 20
2.3.1 Major pillars of e-governance ............................................................................ 22
2.4 Overview of global e-governance in municipalities ...................................... 23
2.4.1 Best practice and benchmark in e-governance .................................................. 26
2.5 Overview of the 2016 United Nationse-government survey ......................... 31
2.6 Comparative analysis of Rutgers e-governance 2013/14 survey and
United Nations e-government 2016 survey ................................................... 33
2.7 E-governance and e-government in African Municipalities ......................... 34
2.7.1 Critique of the studies ........................................................................................ 36
2.7.2 Digital divide in Africa ........................................................................................ 36
2.8 Uptake and usage of e-governance for improved service delivery ............. 38
2.8.1 Benefits and challenges of e-governance .......................................................... 40
2.8.2 Mobile cellular technology, social media and inclusive multichannel
services ............................................................................................................. 41
2.9 E-governance initiatives in offering quality online services ........................ 43
2.10 Service delivery for municipalities in South Africa ....................................... 44
2.10.1 Generic services offered by municipalities in South Africa ................................. 44
2.11 Efforts towards smart cities by metropolitans in Gauteng Province .......... 46
2.12 Chapter conclusion ......................................................................................... 49
vi
CHAPTER 3: UNDERPINNINGS OF E-GOVERNANCE AND CONCEPTUAL
FRAMEWORK ......................................................................................................................... 50
3.1 Introduction ..................................................................................................... 50
3.2 Theories of e-governance ............................................................................... 52
3.2.1 Broadcast/wider dissemination Model ............................................................... 52
3.2.2 Critical Flow Model ............................................................................................ 55
3.2.3 Comparative Analysis Model ............................................................................. 57
3.2.4 Mobilisation and Lobby Model ........................................................................... 58
3.2.5 Interactive Service Model/Government to Citizen to Government Model
(G2C2G) ........................................................................................................... 60
3.3 Conceptual Framework ................................................................................... 65
3.4 Chapter conclusion ......................................................................................... 67
CHAPTER 4: RESEARCH METHODOLOGY.......................................................................... 69
4.1 Introduction ..................................................................................................... 69
4.2 Research methodology ................................................................................... 69
4.3 Research reasoning ........................................................................................ 69
4.4 Research paradigm (philosophy) ................................................................... 70
4.5 Research approach ......................................................................................... 72
4.5.1 Quantitative approach ....................................................................................... 72
4.5.2 Qualitative approach ......................................................................................... 73
4.5.3 Mixed method approach .................................................................................... 75
4.6 Research design ............................................................................................. 76
4.6.1 Mixed-method design ........................................................................................ 76
vii
4.8 Research strategy .......................................................................................... 78
4.7 Research process ........................................................................................... 78
4.8.1 Survey ............................................................................................................... 79
4.8.2 Case study ....................................................................................................... 80
4.9 Reasons for using mixed method design ...................................................... 81
4.10 Population ....................................................................................................... 82
4.11 Sampling .......................................................................................................... 82
4.11.1 Sampling procedure .......................................................................................... 83
4.11.2 Sampling frame ................................................................................................. 85
4.11.3 Sample size....................................................................................................... 85
4.12 Data collection ................................................................................................. 86
4.12.1 Primary data ...................................................................................................... 86
4.12.2 Secondary data ................................................................................................. 88
4.13 Data analysis ................................................................................................... 88
4.13.1 Quantitative analysis ......................................................................................... 88
4.13.2 Qualitative analysis ........................................................................................... 90
4.13.3 Content Analysis ............................................................................................... 90
4.14 Assessing and demonstrating the quality and rigour of the
research design ............................................................................................... 91
4.14.1 Triangulation ..................................................................................................... 92
4.14.2 Pre-testing ......................................................................................................... 92
4.15 Ethical consideration ...................................................................................... 93
viii
4.16 Summary of choices of research methodology for current study ................ 93
4.16.1 Research methodology ...................................................................................... 93
4.16.2 Research reasoning .......................................................................................... 93
4.16.3 Research paradigm (philosophy) ....................................................................... 94
4.16.4 Research approach ........................................................................................... 94
4.16.5 Research design ............................................................................................... 94
4.16.6 Research process ............................................................................................. 95
4.16.7 Research strategy ............................................................................................. 95
4.16.8 Reason for mixed method design ...................................................................... 95
4.16.9 Population ......................................................................................................... 95
4.16.10 Sampling ........................................................................................................... 95
4.16.11 Data collection ................................................................................................... 96
4.16.12 Data analysis ..................................................................................................... 98
4.16.13 Assessing and demonstrating the quality and rigour of the research
design ............................................................................................................... 99
4.17 Chapter conclusion ......................................................................................... 99
CHAPTER 5: QUANTITATIVE DATA ANALYSIS, PRESENTATION AND
DISCUSSION OF FINDINGS ................................................................................................. 101
5.1 Introduction ................................................................................................... 101
5.2 Descriptive statistics .................................................................................... 101
5.2.1 Demographic profile of survey respondents .................................................... 102
5.3 Exploratory analysis ..................................................................................... 107
5.3.1 Factor analysis ................................................................................................ 107
ix
5.4 Inferential analysis ........................................................................................ 119
5.4.1 Analysis of Variance (ANOVA) ........................................................................ 119
5.4.2 ANOVAs .......................................................................................................... 122
5.5 Chapter conclusion ....................................................................................... 136
CHAPTER 6: QUALITATIVE DATA ANALYSIS, PRESENTATION AND
DISCUSSION OF FINDINGS ................................................................................................. 137
6.1 Introduction ................................................................................................... 137
6.2 Profile of interview respondents .................................................................. 138
6.3 Research objectives, thematic areas and key sub themes ........................ 138
6.3.1 Presence of website ........................................................................................ 141
6.3.2 Uptake and usage of ICT................................................................................. 146
6.3.3 Interventions in speeding online services ........................................................ 150
6.3.4 Hindrances to use of online services ............................................................... 155
6.3.5 Solutions to hindrance on online services ........................................................ 158
6.3.6 Security measures........................................................................................... 164
6.3.7 Services offered by municipalities ................................................................... 167
6.3.8 Online services offered by municipalities ......................................................... 168
6.3.9 Advantages and disadvantages of ICT as part of e-governance ...................... 172
6.3.10 Staff buy-in and support .................................................................................. 181
6.3.11 Citizen Relationship ......................................................................................... 184
6.3.12 Strategies to improve online service delivery ................................................... 185
6.4 Chapter Conclusion ...................................................................................... 195
x
CHAPTER 7: E-GOVERNANCE FRAMEWORK FOR LOCAL AUTHORITIES IN
SOUTH AFRICA .................................................................................................................... 196
7.1 Introduction ................................................................................................... 196
7.2 Related literature on ICT framework and its integration in e-
governance framework ................................................................................. 196
7.3 Contribution of participants to e-governance framework for local
authorities in South Africa ............................................................................ 197
7.3.1 24/7 website .................................................................................................... 199
7.3.2 Increased security ........................................................................................... 199
7.3.3 Education and support .................................................................................... 199
7.3.4 Call-centres and Walk-in Centres .................................................................... 199
7.3.5 Managing relationships ................................................................................... 200
7.3.6 Improved communication infrastructure ........................................................... 200
7.3.7 Political buy-in ................................................................................................. 200
7.3.8 Modern Technology and right software ............................................................ 200
7.3.9 Shared software and applications .................................................................... 201
7.3.10 Public participation .......................................................................................... 201
7.4 Chapter conclusion ....................................................................................... 201
CHAPTER 8: CONCLUSIONS AND RECOMMENDATIONS ................................................ 202
8.1 Introduction ................................................................................................... 202
8.2 Conclusion of major findings - quantitative ................................................ 202
8.2.1 Demographic profile ........................................................................................ 202
8.2.2 Municipality website system quality ................................................................. 202
xi
8.2.3 Motive to seek municipality information ........................................................... 203
8.2.4 Problems encountered when accessing municipality information .................... 203
8.2.5 Relationship between access to internet and identified variables for
municipalities ................................................................................................... 203
8.2.6 Influence of age on the use of ICT as part of e-governance ............................ 204
8.2.7 Influence of level of education on the uptake and usage of ICT ....................... 205
8.2.8 Influence of occupation in understanding benefits of e-governance ................. 205
8.2.9 Influence of income on the uptake and usage of ICT ....................................... 205
8.2.10 Influence of access to internet in accessing municipality services ................... 206
8.2.11 Influence of frequency of using internet in accessing municipality online
services ........................................................................................................... 206
8.2.12 Influence of motivation of using a particular network when accessing
internet ............................................................................................................ 206
8.2.13 ANOVA – Influence of access to municipality services on type of
services, impact of e-governance and e-governance outcome ........................ 207
8.3 Conclusion of major findings – qualitative .................................................. 207
8.3.1 Presence of website ........................................................................................ 207
8.3.2 Uptake and usage of ICT................................................................................. 208
8.3.3 Hindrance to use of online services ................................................................. 209
8.3.4 Solutions to hindrance on online services ........................................................ 209
8.4 Conclusion of major findings - quantitative ................................................ 210
8.4.1 Types of services offered by municipalities ..................................................... 210
8.4.2 Standard of Services ....................................................................................... 210
xii
8.4.3 Access to online services ................................................................................ 211
8.4.4 Efficiency of services ....................................................................................... 211
8.5 Conclusion of major findings – qualitative .................................................. 211
8.5.1 Interventions in speeding online services through e-solution ........................... 211
8.5.2 Services offered by municipalities ................................................................... 212
8.6 Conclusion of major findings – Quantitative ............................................... 213
8.6.1 Convenience and level of interaction ............................................................... 213
8.6.2 Corruption ....................................................................................................... 213
8.6.3 Accountability .................................................................................................. 214
8.6.4 Influence of website security on the use of ICT in accessing municipality
services ........................................................................................................... 214
8.7 Conclusion of major findings – qualitative .................................................. 214
8.7.1 Citizens Focus Service Plan ............................................................................ 214
8.7.2 Security measures........................................................................................... 215
8.7.3 Advantages and disadvantages of ICT as part of e-governance ...................... 215
8.7.4 Staff buy-in and support .................................................................................. 216
8.7.5 Citizen relationship .......................................................................................... 217
8.7.6 Strategies to improve online service delivery ................................................... 217
8.7.7 Corporate governance ICT framework............................................................. 218
8.8 Recommendations ........................................................................................ 219
8.9 Research contribution .................................................................................. 220
8.9.1 Theoretical contributions ................................................................................. 221
xiii
8.9.2 Methodological contributions ........................................................................... 221
8.9.3 Practical contributions ..................................................................................... 222
8.10 Research limitations ..................................................................................... 222
8.11 Areas of further research .............................................................................. 224
8.12 Summary of the chapter ............................................................................... 224
REFERENCE ......................................................................................................................... 225
ANNEXURE A: A SURVEY QUESTIONNAIRE ..................................................................... 252
ANNEXURE B: INTERVIEW PROTOCOL FOR E-GOVRNANCE BY MANAGEMENT
OF MUNICIPALITY ............................................................................................................... 263
ANNEXURE C: ETHICS CLEARANCE ................................................................................. 265
ANNEXURE D: LETTER TO CONDUCT RESEARCH .......................................................... 266
ANNEXURE E: LABEL MEANING FOR QUANTITITATIVE ................................................. 267
ANNEXURE F: CODE FAMILIES FOR QUALITATIVE ......................................................... 269

xiv
LIST OF TABLES
Table 1-1: Themes of Batho Pele. .............................................................................................. 5
Table 1-2: Municipalities in Gauteng Province............................................................................ 7
Table 1-3: Research questions, research objectives, possible source of information
and theories used. ................................................................................................. 11
Table 1-4: Definitions of key terms used in this document ........................................................ 13
Table 2-1: Top in cities in digital governance 2009-2013/14 ..................................................... 25
Table 2-2: Top cities in service delivery 2013-2014 .................................................................. 26
Table 2-3: World leaders in e-government ............................................................................... 32
Table 2-4: Lowest ranked 10 countries in e-government .......................................................... 32
Table 2-5: Rutgers e-governance survey and United Nations e-government
comparative analysis ............................................................................................. 33
Table 2-6: Regional e-government leaders .............................................................................. 35
Table 2-7: World municipal e-governance ranking 2013-14 in Africa ........................................ 35
Table 2-8: Potential benefits and challenges of e-governance and e-government .................... 41
Table 2-9: Generic services offered by municipalities............................................................... 45
Table 3-1: Blending of theories. ............................................................................................... 52
Table 4-1: Reasons for using mixed design. ............................................................................ 81
Table 4-2: Population size by district municipalities and sample size ....................................... 82
Table 5-1: Respondents demographic profile. ........................................................................ 103
Table 5-2: Frequency distribution by level of education by municipality. ................................. 106
Table 5-3: KMO values for e-governance factors. .................................................................. 108
Table 5-4: Bartlett's Test of Sphericity for e-governance factors. ............................................ 109
xv
Table 5-5: Cranach's Alpha for e-governance factors. ............................................................ 110
Table 5-6: Descriptive statistics for e-governance. ................................................................. 110
Table 5-7: Likert scale - Information systems and information quality. ......................................... 111
Table 5-8: Likert scale - Type of services. ......................................................................................... 112
Table 5-9: Likert scale - Motivation for seeking municipality information. .................................... 113
Table 5-10: Likert scale - Problems encountered when accessing municipality
information. ........................................................................................................................ 114
Table 5-11: Likert scale - Standard of services. ............................................................................... 115
Table 5-12: Likert scale - Impact of e-governance. ......................................................................... 116
Table 5-13: Likert scale - e-governance outcome. ........................................................................... 118
Table 5-14: Independent samples test for gender and City of Ekurhuleni, City of
Johannesburg and City of Tshwane (Metros). ...................................................... 123
Table 5-15: Independent sample test for gender and Lesedi, Randfontein and
Westonaria (Local District Municipalities). ............................................................ 124
Table 5-16: Independent sample test for access to internet and City of Ekurhuleni, City
of Johannesburg and City of Tshwane. ................................................................ 125
Table 5-17: Independent sample test for access to internet and Lesedi, Randfontein
and Westonaria (Local District Municipalities). ..................................................... 126
Table 5-18: Influence of age, education, occupation and income on the factors. .................... 127
Table 5-19: ANOVA - Influence of municipality, access to internet, frequency of using
internet, motivation of using network, security of website and access to
municipality services on the factors. ..................................................................... 132
Table 6-1: Profile of interviewees. .......................................................................................... 139
Table 6-2: Research objectives, thematic areas and sub themes. .......................................... 139
Table 6-3: General services offered by municipalities. ........................................................... 167

xvi
Table 6-4: Advantages of ICT, quotations and supporting sources. ........................................ 173
Table 8-1: Objective 1. ......................................................................................................................... 202
Table 8-2: Objective 2. ......................................................................................................................... 210
Table 8-3: Objective 4. ......................................................................................................................... 213
xvii
LIST OF FIGURES
Figure 2-1: Definition of e-governance. Source: Misurace (2007). ............................................ 19
Figure 2-2: Pillars of e-governance. Source: Lal and Haleem (2002). ............................................ 23
Figure 3-1: Broadcasting/Wider Disseminating Model. Source: Nath (2005) ............................ 53
Figure 3-2: Four Stage Model. Source: Siau and Long (2005) ................................................. 55
Figure 3-3: Critical Flow Model. Source: Nath (2005). .............................................................. 56
Figure 3-1 4: Comparative Analysis Model. Source: Nath (2005). ............................................ 58
Figure 3-5: Mobilisation and Lobby Model. Source: Nath (2005). ............................................. 60
Figure 3-6: Service Delivery Model. Source: Nath (2005). ........................................................ 63
Figure 3-7: Technology Acceptance Model (TAM). Source: Davis, Bagozzi & Warshaw
(1989). ................................................................................................................... 63
Figure 3-8: Independents, intermittent and dependence variable ............................................. 66
Figure 3-9: Proposed Conceptual Framework. ......................................................................... 68
Figure 4-1: Strength and weaknesses of quantitative and qualitative research
approach. ............................................................................................................... 74
Figure 4-2: An overview of research design and its components. ............................................. 78
Figure 4-3: Sampling techniques. Source: Saunders, Lewis and Thornhill (2009). ................... 84
Figure 5-1: Flow diagram of quantitative analysis. .................................................................. 102
Figure 6-1: Hermeneutic unit with its components. Source: Patrova (2014) ............................... 138
Figure 7-1: e-governance framework for local authorities in South Africa. .............................. 198
xviii
LIST OF ACRONYMS
Acronym Meaning
AJA Administration Justice Act
ANOVA Analysis of Variance
CAFRAD Africa Training and Research Centre in Administration for Development
C2G Citizens to Government
CGeG Common Wealth Centre for e-governance
COJ City of Johannesburg
CRM Customer Relation Management
DOI Diffusion of Information
EDA Exploratory Data Analysis
EGDI E-government Development Index
ENaTIS Electronic National Traffic Information System
FOI Freedom of Information
G2C Government to Citizens
G2C2G Government to Citizens to Government
G2E Government to Employees
G2G Government to Government
GIS Geographical Information System
HCI Human Capital Index
HU Hermeneutic Unit
ICT Information Communication Technology
IDP Integrated Development Plan
ITU International Telecommunication Union
KMO Kaiser-Meyer-Olkin
NGO Non-Governmental Organisation

xix
OSI Online Service Index
RDP Reconstruction and Development Programme
SMART Simple, Moral, Accountable, Responsible and Transparent
SME’s Small to Medium Enterprises
SMS Short Message Services
SOTA Secure Online Transaction Algorithm
SPSS Statistical Package for the Social Sciences
SSL Secure Socket Layer
TAM Technology Acceptance Model
TII Telecommunication Infrastructure Index
URCOT Union Research Centre on Organisation and Technology
WPTPS White Paper on the Transformation of the Public Service of 1995
WTO World Trade Organisation
1
CHAPTER 1: INTRODUCTION
1.1 Motivation for undertaking this study
The purpose of this research is to develop an e-governance framework that improves
service delivery for local authorities in South Africa. This was done by assessing and
explaining what Information Communication Technology (ICT) tools can do in promoting e-
governance and improving service delivery in local authorities in South African context.
E-government as a part of e-governance refers to increase efficiency and effectiveness of
service delivery by the Government to Citizens (G2C) of different portions of society and
administrative activities through ICT (Rahman, 2016). Irafan (2017) argued that e-
governance provides an effective service delivery of different public services, which provides
easy to access services, such as online application filing, bill payments, online education,
telemedicine etc. E-governance contributes towards effectiveness, efficiency and equity in
public services that further enhances the quality of public service delivery (Pathak, Singh,
Belwal, Naz & Smith: 2008). Irafan (2017) expressed that e-governance is the way to
empower the good governance and it will allow citizens at grassroots level to interact with
the government at all levels. This study therefore seeks to improve service delivery through
the use of e-governance in local authorities.
Jain and Sharma (2007) contend that “e-governance is the public sector’s use of information
and communication technologies with the aim of improving information and service delivery,
encouraging citizen participation in the decision-making process and making government
more accountable, transparent and effective. E-governance involves new styles of
leadership, new ways of debating and deciding policy and investment, new ways of
accessing education, new ways of listening to citizens and new ways of organizing and
delivering information and services. E-governance is generally considered as a wider
concept than e-government, since it can bring about a change in the way citizens relate to
governments and to each other. E-governance can bring forth new concepts of citizenship,
both in terms of citizen needs and responsibilities. Its objective is to engage, enable and
empower the citizen (Jain & Sharma, 2007). This study therefore adopted this definition as it
has highlighted key concepts of e-governance which was considered during the designing of
the conceptual framework.
Prabhu (2012) explained that e-governance is the latest trend in the governance process all
over the world. Prabhu (2012) further argued that good governance can be enabled by e-
2
governance if appropriately implemented. Good governance will be SMART (Simple, Moral,
Accountable, Responsive and Transparent) governance which is so essential today in
countries all over the world (Prabhu, 2012). Prabhu (2012) further expressed that developed
nations of the world such as USA, the UK, Canada, Australia, and Singapore have gone in a
big way into e-governance. Developing nations like India, China, Sri Lanka, the Philippines,
Brazil have also progressed well in e-governance implementation (Prabhu, 2012). It is
therefore important for African countries such as South Africa to start and continue
embracing e-governance initiatives to improve governance and subsequently the service
delivery to citizens.
Flak, Olsen and Wolcott (2005) expressed that in South Africa and other countries, local
authorities are the government level that has the most direct contact with the citizens and
businesses and is responsible for providing an array of basic services (Flak, et al., 2005).
Flak, et.al. (2005) highlighted that over the last two decades, the South African government
has instituted several e-governance initiatives in order to try to improve the internal
processes, service delivery and the overall efficiency of local authorities. The provisions of
online public services are used increasingly in order to streamline and facilitate contact
between residents and public-sector bodies (Cernakova, 2015).This study therefore focused
its attention on six municipalities in Gauteng Province in order to understand the uptake and
usage of ICT by citizens at a local authority level in South Africa and to understand the
services being offered by such municipalities to their citizens.
The rapid advancements in ICT have led to transformations in the way businesses and
governments deliver services to customers and citizens respectively (Amagoh, 2015).The
government of South Africa has therefore committed itself to introduce ICT initiatives in
offering services to its citizens. Ntetha and Mostert (2011) further urged that South African
government has initiated several ICT initiatives to enable its departments to improve and
speed up service delivery to the public. The South African e-governance programme also
extends to local government level, where the best examples are seen implemented in the
metropolitan municipalities of Cape Town, Johannesburg, Ekurhuleni, Tshwane and
eThekwini (Cloete, 2011).Cloete (2011) further explained that government departments have
therefore been endowed with a number of ICT tools to assist in this e-governance process.
Amagoh (2015) further argued that globally, governments have embraced electronic
governance (e-governance) as the best mechanism through which they can more effectively
respond to the needs and demands of their citizens. Thus, when properly implemented, e-
3
governance should aim to bring citizens and businesses closer to government (Sun, Ku &
Shih, 2015).
Various countries have deployed different forms of e-governance, with developed countries
at higher stages of development (Amagoh, 2015). Amogoh (2015) expressed that for
developing countries (most of which are in Africa), e-governance deployment is still in its
early stages. However, adoption of more advanced forms of e-governance has the potential
to promote civic engagement by empowering citizens to interact with government officials in
a more transparent manner, thereby reducing opportunities for corruption (Bannister &
Connolly, 2015).
Despite the South African government’s well-intended reform policy and service delivery
initiatives, economic and social disparities still perpetuate (Lesame, 2014). Mda (2014)
emphasizes that the rich versus poor inequality is as glaring in 2014 as it was in 2007, when
former president Mbeki announced that South Africa is country with two economies—a
developed economy serving the rich and another undeveloped economy serving the poor.
“Democracy has failed to level the economic playing field” (Mda, 2014). While there has
been some success noted, for example South Africa was ranked 93 out of 193 United
Nations member states (United Nations e-government survey, 2014), there are a number of
areas in which inequalities prevail—the chronic digital divide is one such area (Lesame,
2009; Chisango, 2013).
The digital divide is a phenomenon linked not only to the access to new technologies, such
as computers and the internet, but also to unequal access to and usage of new technologies
(Funchs & Horak, 2008). Lesame (2014)argued that tthe issue of inequality is connected to
the topic of the digital divide because technology is one aspect of material wealth, and
wealth production is more and more often based on technology and knowledge. Lesame
(2014) suggested that in South Africa those without material wealth have no ICT access and
use, and therefore no access to education and knowledge. It is therefore the objective of this
study to develop a framework for e-governance that will take cognisance of the digital divide
that currently exists in South Africa. It is envisaged that the proposed framework will
incorporate aspects to bridge the digital divide in South Africa, such as the availability of
hotspots for free Wi-Fi, education and training and many other initiatives that will promote
uptake and usage of e-governance.
4
1.2 Background to the study
South African government has committed itself to introduce effective ICT-driven services to
the public (Ntetha & Mostert, 2011) as part of e-governance initiatives. Ntetha and Mostert
(2011) pointed out that heavy investment in both physical resources and modern ICT
infrastructure has been made, but the public is still not convinced that they have benefited to
the extent envisioned by the government and therefore the need to research further and to
develop a framework that improves service delivery in local authorities in South Africa.
1.2.1 South African social realities
The extent and effectiveness of service delivery are influenced by societal contextual
realities and the needs of the client base (Schwella, 2001).Schwella (2001) further outlined
that South Africa is often described as a world in one country, characterized by diversity,
pluralism, and inequality. Schwella (2001) demonstrated that in conjunction with diversity
and pluralism, this has contributed to the deeply divided and unequal state of South African
society. Service delivery in South Africa is therefore affected by societal context and the
diverse needs of the client base (Schwella, 2001). It is against this background that the
researcher sees it fit to find ways of examining the role of ICT as part of e-governance and to
develop a framework in a bid to improve service delivery, given the digital divide which
currently exists in South Africa.
1.2.2 South African service delivery in an economic context
Schwella (2001) reiterated that one feature of the South African economy that affects the
potential for service delivery is inadequate growth. With a growth rate of 6% set as a
benchmark in 1994, it is difficult to fulfil service delivery needs in 2015.The South African
economy was forecast to grow by 2% in 2015, with a gradual improvement to 3% by 2017
(National Treasury, 2015). National Treasury (2015) expected a budget deficit of 3.9% for
GDP in 2014/15, narrowing to 2.5% in 2017/18. This deficit can detrimentally affect service
delivery to its citizens as the government will be mandated to service its debt. R634 billion
was allocated to programmes on local development and social infrastructure, including
R145.5 billion on municipal infrastructure (National Treasury, 2015). Some of these
resources needed to be redirected towards ICT initiatives as part of local development in
order to promote the uptake and usage of ICT by citizens in accessing municipal services.
Another important factor to consider, in economic as well as social terms, is South Africa’s
highly skewed wealth distribution (Schwella, 2001). Schwella (2001) further explained that
5
the Gini coefficient, which measures income distribution in an economy, is approximately 6
for South Africa, compared with 3.7 for industrialized countries. By this measure, South
Africa can be regarded as a poor country, where half of the population lives below the
household subsistence level (Schwella, 2001). It is against this background that citizens will
thrive by getting improved service delivery through the implementation of e-governance, but
are handicapped with their current circumstances. Government intervention is therefore
required to address inequalities, which exists within societies.
1.2.3 Legislative and policy context
Since the transition to democracy in South Africa in 1994, every aspect of social service
provision has come under critical scrutiny. This has lead to policy revision through the
process of consultation and stakeholder participation (Mubangizi & Gray, 2011). Hence a
White Paper on Transforming Public Service Delivery was drafted. Krugell, Otto and Merwe
(2010) explained that in 1994 the South African Government adopted the Reconstruction
and Development Programme (RDP) as its socio-economic policy framework and spelt out
key pillars of delivery, including meeting basic needs and developing human resources.
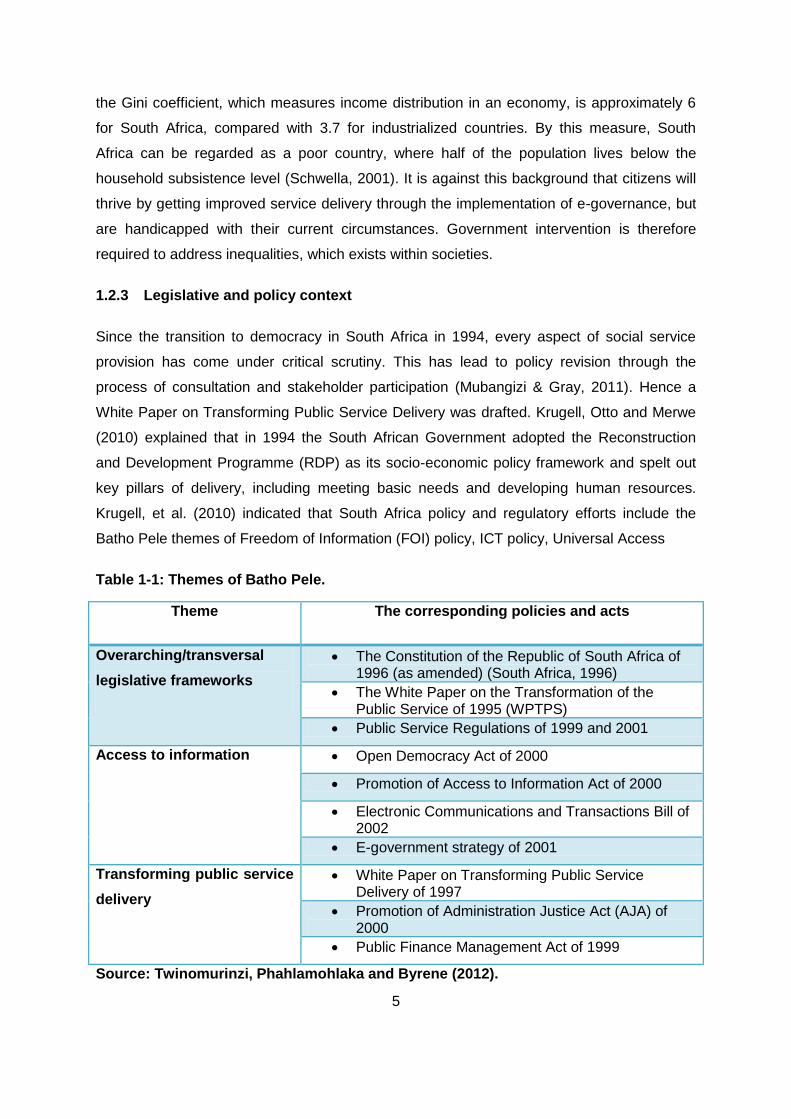
Krugell, et al. (2010) indicated that South Africa policy and regulatory efforts include the
Batho Pele themes of Freedom of Information (FOI) policy, ICT policy, Universal Access
Table 1-1: Themes of Batho Pele.
Theme The corresponding policies and acts
Overarching/transversal
legislative frameworks
The Constitution of the Republic of South Africa of 1996 (as amended) (South Africa, 1996)
The White Paper on the Transformation of the Public Service of 1995 (WPTPS)
Public Service Regulations of 1999 and 2001
Access to information Open Democracy Act of 2000
Promotion of Access to Information Act of 2000
Electronic Communications and Transactions Bill of 2002
E-government strategy of 2001
Transforming public service
delivery
White Paper on Transforming Public Service Delivery of 1997
Promotion of Administration Justice Act (AJA) of 2000
Public Finance Management Act of 1999
Source: Twinomurinzi, Phahlamohlaka and Byrene (2012).
6
policy, Vision 2014 development strategy, Universal Service and Access policy, and E-
governance Vision as listed in Table 1-1. It is against this background that the public service
delivery policies were designed and promulgated to deal with the simultaneous
transformation and quest for improved, service delivery-oriented public service in South
Africa through e-governance.
1.2.4 Challenges of e-governance in South Africa
Akula, Narasimha, and Chandrashekar (2014) expressed that local authorities in South
Africa are not fully implementing and integrating e-governance tools of ICT as a new way
forward for public management in improving service delivery. Akula, et al. (2014) further
explained that South African government has made heavy investment in both physical
resources and modern ICT infrastructure, but the public is still not convinced that they have
benefited to the extent envisioned by the government. For example Gauteng Department of
Education launched online school registration on the 11April 2016 to enable planning and
fair distribution of pupils. However, the system crashed soon after its launch due to overload
as the system could not handle more than 6000 hits per second (Times live, 2016).
Thakur and Singh (2012) explained that eThekwini municipality launched the eThekwini
Revenue Management System at an estimated cost of R250m and the costs have escalated
to R474m. The city manager has stated that the municipality will enlist the services of an
independent risk assurer, at a cost, to test the system as they cannot give a guarantee that
the new billing system would work (Thakur & Singh, 2012). Thakur and Singh (2012) gave
another example that Johannesburg City Council is experiencing similar challenges with its
ICT services, causing both business and citizens to engage in legal action over poor
services, such as inconsistent bills and disrupted services. Heeks (2002) highlighted that a
set of touch-screen kiosks were installed for remote rural communities in South Africa's
North-West Province. However, the kiosks' lack of current or local content and lack of
interactivity led to disuse, and the kiosks were removed less than one year later
(Heeks,2002).
In 2007, the electronic National Traffic Information System (eNaTIS) was implemented
(Rajapakse, Van-Der-Vyver & Hommes, 2012). Rajapakse, et al. (2012) indicated that one
month after its implementation, it was reported that the Auditor General warned the
Department of Transport that the eNaTIS system was flawed and that there was an 80
percent chance of eNaTIS failing. Rajapakse, et al. (2012) reported thatthe department,
however, went ahead and installed the R408 million systems which caused the country's
7
vehicle licensing process to stop. Rajapakse, et al. (2012) explained thatin that same year, a
High Court found that eNaTIS posed a security risk in terms of the confidentiality of citizens’
data. Rajapakse, et al. (2012) highlighted that passwords were not administered adequately
and ‘security patches’ were not installed appropriately. Although the eNaTIS system has now
been operational for five years, it still does not offer complete client satisfaction (Rajapakse,
et al., 2012). It is against this background that this research seeks to develop a secure e-
governance framework that promotes improved service delivery for local authorities in South
Africa.
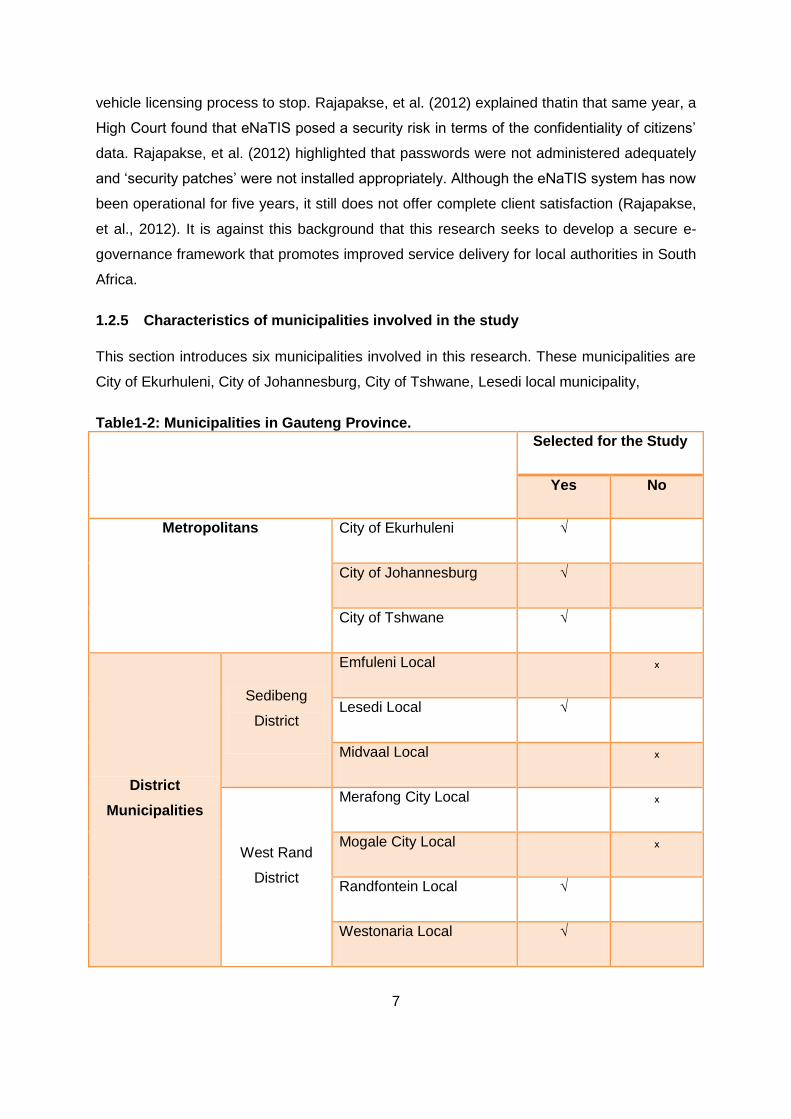
1.2.5 Characteristics of municipalities involved in the study
This section introduces six municipalities involved in this research. These municipalities are
City of Ekurhuleni, City of Johannesburg, City of Tshwane, Lesedi local municipality,
Table1-2: Municipalities in Gauteng Province.
Selected for the Study
Yes No
Metropolitans City of Ekurhuleni √
City of Johannesburg √
City of Tshwane √
District
Municipalities
Sedibeng
District
Emfuleni Local ₓ
Lesedi Local √
Midvaal Local ₓ
West Rand
District
Merafong City Local ₓ
Mogale City Local ₓ
Randfontein Local √
Westonaria Local √
8
Randfontein local municipality and Westonaria local municipality. Gauteng is divided into
three Metropolitan Municipalities, City of Ekurhuleni, City of Johannesburg and City of
Tshwane as well as two district municipalities namely Sedibeng and West Rand, which are
further subdivided into seven local municipalities. Table 1-2 shows municipalities in Gauteng
Province which were selected for the study and those which were excluded from the study.
1.2.6 Rationale for selecting municipalities involved in the study
The selected municipalities for this study are from Gauteng Province. The reason for
selecting municipalities from this province is because Gauteng Province is considered the
economic hub of South Africa and is often the first choice of destination by job seekers
across the country (Statistics South Africa, 2011). While the smallest province, Gauteng is
the province with the most populous, with 12 272 263 people (Local Government, 2016). It is
a province with a unique, African character, world-class infrastructure in the fields of
telecommunications, transportation, water and power, and with globally-competitive health
care and educational facilities (Statistics South Africa, 2011). However, the province is also
one of contrasts—home to both wealthy and poor, residents and refugees, global
corporations and emerging enterprises (Local Government, 2016). The results obtained from
this study can be generalised and replicated in other municipalities with similar status in
South Africa.
1.3 Problem Statement
There is slow uptake of e-governance initiatives by citizens despite the proliferation of ICT
tools. Kroukamp (2005) identified some of the causal factors, such as strict regulation,
security of information, digital divide, education, resistance to change, among others that can
be attributed to the slow uptake and implementation of ICT in public service offerings.
Municipalities are failing to adequately provide online services to their citizens due to factors
such as system failures (Akula, et al., 2014). The municipalities have constantly been
accused of non-transparency and red-tape procedures in disclosing information and delivery
of services to its citizens (Bawa, 2012).Aikins and Krane (2010) claimed that municipal
officials have not fully taken advantage of the interactive features of the Internet to connect
citizens to their governments. Aikins and Krane (2010) indicated that studies show that
although the internet has great potential to improve government–citizen relations, many
governments at all levels have not taken advantage of this potential to improve website
deliberative features to enhance online citizen participation in the policy process.
9
Although researchers the world over are actively researching on e-governance, it is clear
that there are currently no globally-agreed upon e-governance designs that can be
implemented in heterogeneous country contexts (Luna-Reyes & Gil-Garcia, 2011). The lack
of global design frameworks and models therefore calls for e-governance designs to be
informed by local contexts for complex and unique contextual characteristics such as legal,
institutional and regulatory frameworks, political setups, cultural, beliefs, etc., to be
intertwined into the (Bwalya & Mulula, 2015). This study add knowledge regarding
challenges faced by local authorities in South Africa in service delivery and how e-
governance through the use of ICT tools can be maximized by developing a framework
applicable to local government in improving service delivery in South African context.
Jain (2010) expressed that South African government has invested heavily in the
establishment of effective e-governance strategies for the past few years to enhance service
delivery. Jain (2010) interpreted statistics, which showed the locations of service delivery
protest and the concerns of protestors from 2007–2016 in South Africa and generalised that
protests were taking place in all the nine provinces and protestors were mostly complaining
about housing followed by electricity, water, general poor service delivery itself, sanitation,
corruption, living conditions, infrastructure to mention just a few which was also triggered by
the just ended 2016 local government elections. These service delivery protests however
have increased in the recent past in the period 2011–2017. This is however a clear
indication that there is a challenge in service delivery which could be addressed by applying
e-governance tools to improve service delivery.
Titah and Bark (2006) explained that e-governance is an emerging field or practice and it is
still in its nascent stage of development and therefore does not have a well-established
theoretical underpinnings (Titah & Bark, 2006). In this regard, Titah and Bark (2006) assert
that despite increased research interest in e-governance, the field currently lacks sound
theoretical frameworks on e-governance and service delivery and researchers are mainly
concerned with the e-government evolution life cycle such as Howard (2001) three stage
model, West (2004) four stage model of e-government development, United Nations (2001)
five stage with little on e-governance and a frameworks for improving service delivery in an
African context, therefore the need to carry out this research in a bid to develop e-
governance framework that improves service delivery to citizens at local government level in
South African context.

10
1.4 Research Questions
The following research questions were used to address the research problem and to fulfil the
purpose or aim of the research:
Why is there a low uptake and usage of ICT by citizens at a local government level in
South Africa?
Why are local authorities offering poor service delivery to their citizens in South Africa?
How can e-governance and e-government tools be applied in developing a framework for
improving service delivery for local authorities in South Africa?
1.5 Research Objectives
The objectives of this research are:
Examine and explain the uptake and usage of ICT tools for service delivery by citizens at
local government level in South Africa.
Assess and explain the services offered to citizens by local authorities in South Africa.
Examine existing e-governance and e-government theories and practice in order to draw
lessons from where it is successful and to develop e-governance framework for
improving service delivery for local authorities in South African context.
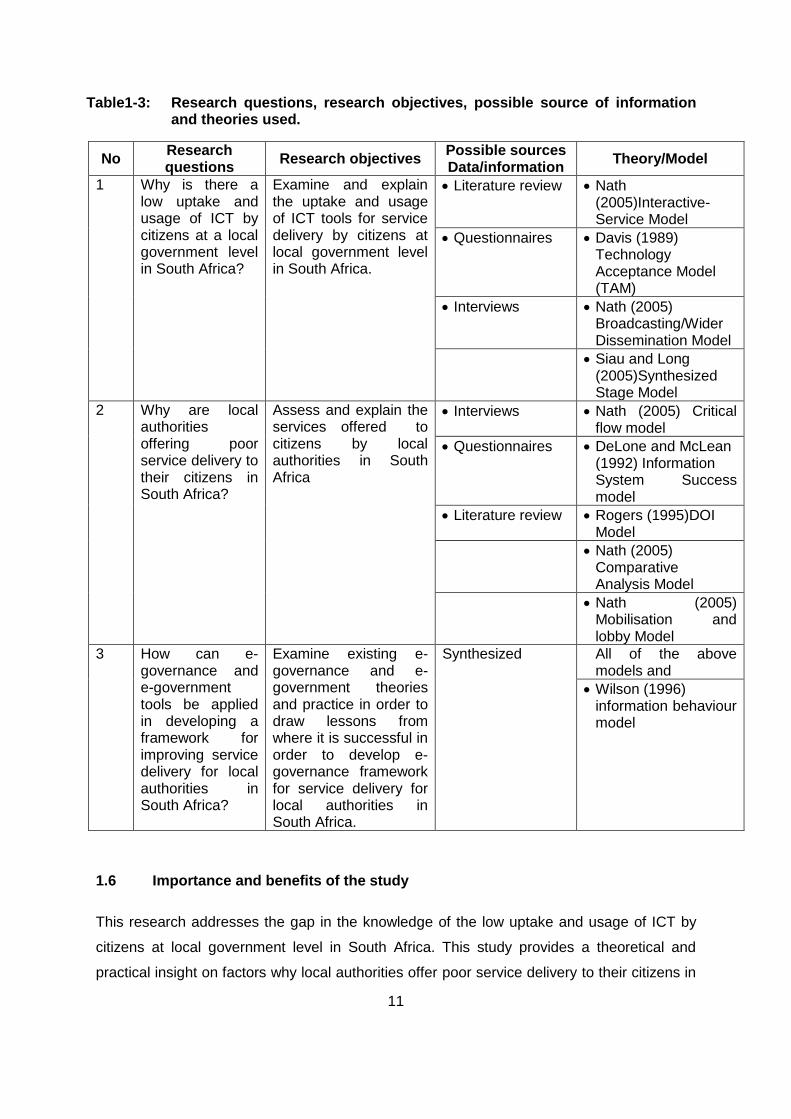
Table 1-3 summarises the linkages of research questions (1.4), research objectives (1.5),
possible sources of data and theories used.
11
Table1-3: Research questions, research objectives, possible source of information and theories used.
No Research questions
Research objectives Possible sources Data/information
Theory/Model
1 Why is there a low uptake and usage of ICT by citizens at a local government level in South Africa?
Examine and explain the uptake and usage of ICT tools for service delivery by citizens at local government level in South Africa.
Literature review Nath (2005)Interactive-Service Model
Questionnaires Davis (1989) Technology Acceptance Model (TAM)
Interviews Nath (2005) Broadcasting/Wider Dissemination Model
Siau and Long (2005)Synthesized Stage Model
2 Why are local authorities offering poor service delivery to their citizens in South Africa?
Assess and explain the services offered to citizens by local authorities in South Africa
Interviews Nath (2005) Critical flow model
Questionnaires DeLone and McLean (1992) Information System Success model
Literature review Rogers (1995)DOI Model
Nath (2005) Comparative Analysis Model
Nath (2005) Mobilisation and lobby Model
3 How can e-governance and e-government tools be applied in developing a framework for improving service delivery for local authorities in South Africa?
Examine existing e-governance and e-government theories and practice in order to draw lessons from where it is successful in order to develop e-governance framework for service delivery for local authorities in South Africa.
Synthesized All of the above models and
Wilson (1996) information behaviour model
1.6 Importance and benefits of the study
This research addresses the gap in the knowledge of the low uptake and usage of ICT by
citizens at local government level in South Africa. This study provides a theoretical and
practical insight on factors why local authorities offer poor service delivery to their citizens in
12
South Africa. This study assesses the relevance and validity of e-governance and e-
government theories and practice in service delivery in South Africa. Titah and Bark (2006)
highlighted that e-governance is an emerging field or practice and it is still in its nascent
stage of development and therefore does not have a well-established theoretical
underpinnings. In this regard, Titah and Bark (2006) asserted that despite increased
research interest in e-governance, the field currently lacks sound theoretical frameworks on
e-governance and service delivery. Researchers are mainly concerned with the e-
government evolution life cycle, such as Howard (2001) three stage model, West (2004) four
stage model of e-government development, United Nation (2001) five stage with little on e-
governance framework that improves service delivery in African context. Therefore the need
to carry out this research.
Ifinedo (2006) supported that e-governance and e-government literature tends to focus its
attention mainly on issues relating to the implementation, adoption, and effectiveness of e-
governance services from the perspective of the developed West with little or no attention
being paid to sub-Saharan Africa e-governance initiatives (Ifinedo, 2006). This research
aims to unlock and bridge the knowledge gap which exists between the information which
exists in the developed West concerning e-governance literature to make it available in
developing countries and to develop e-governance framework for improving service delivery
for local authorities in South Africa. Ifinedo (2006) further argued that the existing research
on e-governance in improving service delivery has not yet explored nor produced an account
of complex dynamics governing the early phases of e-governance tools and infrastructure
development in developing countries. This research aims to unpack these complex
dynamics by applying ICT tools in improving service delivery in an African context. This
study is important to scholars researching on e-governance by providing theoretical and
practical insight on issues of e-governance in local authorities in South Africa.
1.7 Delimitation and assumptions
1.7.1 Delimitations (Scope)
This study is in management and governance academic area and is focused on e-
governance and ICT tools and how ICT can be used to develop the e-governance framework
for improving service delivery at local government level in the South African context. The
study focused on internal processes of local authorities and services offered to citizens.
13
Table1-4: Definitions of key terms used in this document
Key term Definition applied
Cloud storage A virtual space to store mass information (Prabu &
Ganapathy, 2017).
Corporate governance ICT framework Leadership and organizational structures and
processes that ensure an organization’s IT sustains
and extends the organization’s strategy and
objectives (ITGI, 2016).
digital divide Inequities in access to the transformative potential
of communications technology, as well as the fact
that the population that has no access to the World
Wide Web is “sizeable” (Flanagan, 2016).
Ecosystem Composed of four layers -content, hardware,
software, and telecommunications (Lee, Park, &
Lee, 2018.
e-governance The public sector’s use of information and
communication technologies with the aim of
improving information and service delivery,
encouraging citizen participation in the decision-
making process and making government more
accountable, transparent and effective (Jain &
Sharma, 2007).
e-government The use of and application of information
technologies in public administration to streamline
and integrate workflows and processes, to
effectively manage data and information, enhance
public service delivery, as well as expand
communication channels for engagement and
empowerment of people (United Nations, 2014).
Smart cities The implementation and deployment of information
and communication technology (ICT) infrastructures
to support social and urban growth through
improving the economy, citizens' involvement and
government efficiency (Yeh, 2017).
Two-factor authentication Implemented for online purchases that utilize a
credit card and could help reduce if not almost
eliminate fraudulent purchases made with credit
cards (Gualdoni, Kurtz, Myzyri, & Rizvi, 2017).
14
1.8 Assumptions
The assumption for this study is that local authorities in South Africa have adopted and
implemented some form of e-governance as a way of improving delivering service to the
citizens as is witnessed by the presence of websites for the municipalities under the study.
There is also an assumption that there is a positive relationship between the application of
ICT tools and improved e-governance in local authorities.
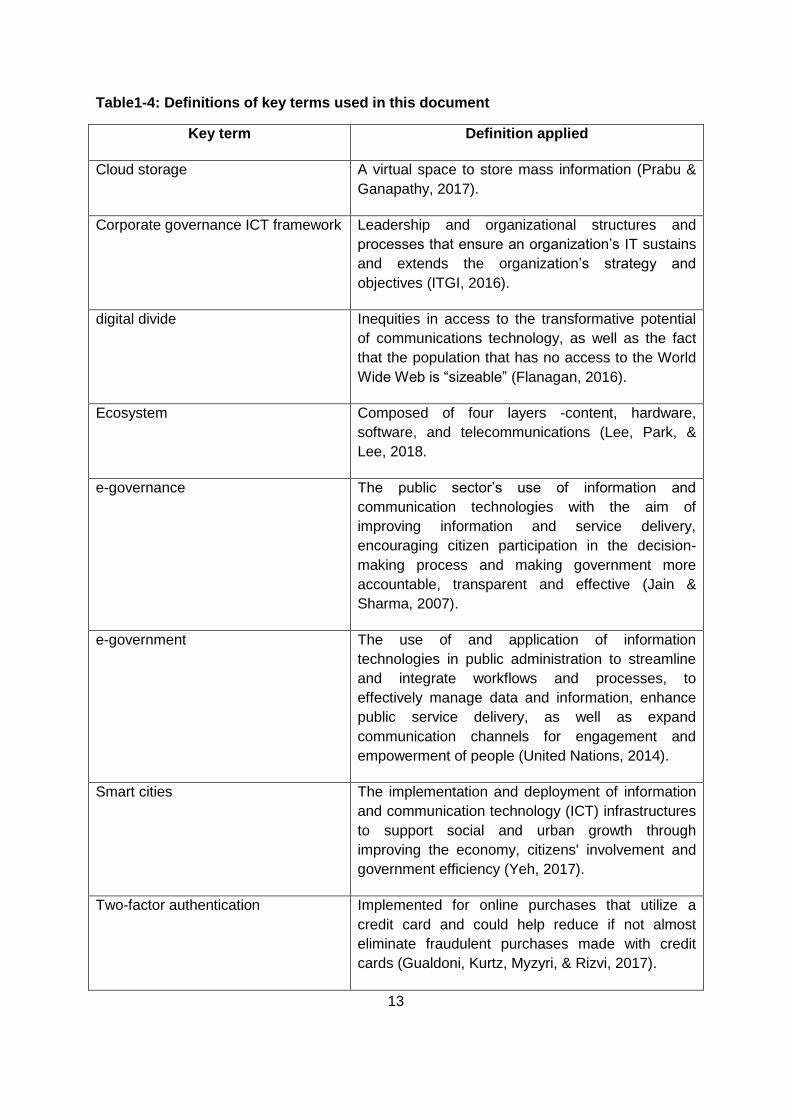
1.9 Definition of key terms
Table 1-4 provides a summary of the definitions of the most important key terms used in this
study.
1.10 Organisation of the thesis
Chapter 1 paves the way for this study by giving an introduction for this research. This is
followed by the section giving the background to the study, the problem statement and the
research objectives. Importance of the study and delimitations of the study are discussed.
The chapter ended by explaining definitions of key terms used in the research. Chapter 2
provides literature review around e-governance and e-government. An overview of e-
governance at global level, continental, regional, national and provincial level was discussed.
Mobile penetration and digital divide was also discussed in this chapter. Chapter 3 explains
the theoretical underpinnings and theoretical framework for the study. Chapter 4 discusses
the methodologies used in the study, research design, motivation for mixed methodology,
data collection tools, quantitative data analysis, qualitative data analysis, content analysis,
validity and reliability and the ethical issues. Chapter 5 sheds light on the analysis of the
study’s survey, presents and discusses the findings. Chapter 6 demonstrates and discusses
the results from interviews. Chapter 7 shows e-governance framework for improving service
delivery in local authorities in South African context. Lastly, Chapter 8 gives a summary of
the research findings, limitations, conclusions and recommendations for further studies.
1.11 Chapter conclusion
This chapter started by introducing how local authorities at governmental level have the most
direct contact with the citizens and the businesses and is responsible for providing an array
of basic services (Flak, et al., 2005). The chapter presented general background of the study
by highlighting South African social realities, legislative and policy context, the challenges of
e-governance initiatives in South Africa. Profile of municipalities involved in the study and

15
rationale for selecting these municipalities was also discussed. The chapter introduced the
problem statement, research questions and research objectives of the study. Importance
and benefits of the study as well as delimitations and assumptions of the study was
highlighted. Definition of key terms was explained. The chapter ended by giving an overview
of how the whole thesis is organised. The next chapter will discuss the literature review for
this study.
16
CHAPTER 2: OVERVIEW AND DEBATE ON E-GOVERNANCE AND E-GOVERNMENT
2.1 Introduction
This section provides a review of the literature on the e-governance issues. The literature
review was presented as follows:
Debates on e-governance and e-government, as well as the conceptualisation of e-
governance;
Use of e-governance in municipalities and e-government at global level, continental
level, regional level and country level.
The literature review is discussed in relation to objectives of the study as defined in
section 1.5.
a) Examine and explain the uptake and usage of ICT tools for service delivery by
citizens at local government level in South Africa.
b) Assess and explain the services offered to citizens by local authorities in South
Africa.
c) Examine existing e-governance and e-government theories and practice in order to
draw lessons from where it is successful and to develop e-governance framework for
improving service delivery for local authorities in South African context.
2.2 Debate on e-governance and e-government
Jain and Sharma (2007) contend that “e-governance is the public sector’s use of information
and communication technologies with the aim of improving information and service delivery,
encouraging citizen participation in the decision-making process and making government
more accountable, transparent and effective. Jain and Sharma (2007) further explained that
e-governance involves new styles of leadership, new ways of debating and deciding policy
and investment, new ways of accessing education, new ways of listening to citizens and new
ways of organizing and delivering information and services. E-governance is generally
considered as a wider concept than e-government, since it can bring about a change in the
way citizens relate to governments and to each other (Jain & Sharma, 2007). Jain and
Sharma (2007) argued that e-governance can bring forth new concepts of citizenship, both
in terms of citizen needs and responsibilities and that its objective is to engage, enable and
empower the citizen”. Mukonza (2014) elaborated that the definition touches on a wide
range of aspects of public sector governance with emphasis on how the use of ICTs
17
enhance good governance. Mukonza (2014) pointed out that the definition, however omits
that e-governance has led to serious changes in the manner in which government produces
goods and services.
As observed by Muhammad and Abu-Momtaz (2007), the introduction of ICTs in governance
has led to the replacement of two known elements of production labour and capital by
information and knowledge. It is further asserted that internet created the same break-
through as the printing press did in the fifteenth century (Muhammad & Abu-Momtaz, 2007).
It must be pointed out however that in their work, Understanding e-governance: A theoretical
approach, Muhammad and Abu-Momtaz (2007) choose to use the terms e-governance and
e-government interchangeably as if they mean one and the same thing. It is argued
therefore in this research that the two are different and any meaningful conceptualisation of
either term can only be done by drawing a clear distinction of the two.
On the other hand, e-government refers to the use of and application of information
technologies in public administration to streamline and integrate workflows and processes, to
effectively manage data and information, enhance public service delivery, as well as expand
communication channels for engagement and empowerment of people (United Nations,
2014). E-government is defined as delivering services via the internet, telephone,
community centres (self-service or facilitated by others), wireless devices or other
communication systems (Pacificcouncil, 2012). Van der Vyver (2007) separated that a stand
out difference between e-governance and e-government is that the former goes beyond the
scope of the later and e-governance does not just refer to a web site and e-mail. Van der
Vyver (2007) further argued that e-governance is in essence a change in the relationships
between government institutions and the environment, which includes business and civil
society.
Van der Vyver (2007) highlighted that e-government is a form of e-business in governance
and refers to the process and structures needed to deliver electronic services to the public
(citizens and businesses), collaborate with business partners and to conduct electronic
transactions within an organisational entity. As Mukonza (2014) observed, e-government
should be viewed as a subset of e-governance. Lal and Haleem (2002) explained that e-
government provides an opportunity to enhance user satisfaction by providing 24hr/365 days
access to government information and services, a rapidly evolving space where static
information is being replaced by online transaction and integrated government solutions. Lal
and Haleem (2002) distinguished that “e-governance is defined as the application of
electronic means in (1) the interaction between government and citizens and the government
18
and business, as well as (2) in internal government operations to simplify and improve
democratic, government and business aspects of governance”.
Mukherjee and Roy (2016) urged that the terms e-government and e-governance are closely
inter-related as both terms are used to describe government’s utilization of ICT services
afforded to the citizens. There is an argument among researchers on the correct use of the
two terms, but Visser and Hossana (2008) considered e-governance to refer to the use of
ICT to support the administration or management of government, while e-government is the
use of ICT to provide services in maintaining of government operations correctly. Visser and
Hossana (2008) concluded by saying the term e-government is used to focus on government
or public services through the use of ICT. Mukherjee and Roy (2016) explained that e-
governance is the solution to the “Good Governance” for the developing countries to
minimize corruption, provides efficient and effective quality services to their citizens. Reilly
(2002) explained that e-governance has been defined as that which, "seeks to realize
processes and structures for harnessing the potentialities of lCTs at various levels of
government and the public sector and beyond, for the purpose of enhancing good
governance.
Misurace (2007) defended a working definition of e-governance for Africa, which has also
been developed by Africa Training and Research Centre in Administration for Development
(CAFRAD) within the framework of the e-Africa Initiative for Good Governance, namely that
“the use of ICTs and especially the internet to adopt a new conception and attitude of
governing and managing where participation and efficiency are required of all the partners
linked in a network. E-governance is therefore a new way of co-ordinating, planning,
formulating and implementing decisions and operations related to governance problems.
Governments can utilise e-governance to re-invent themselves, get closer to the citizenry
and forge closer alliances and partnerships with diverse communities of interest, practice,
expertise, conviction and inter-dependence within the context of national and international
development agendas”(Misurace, 2007).
E-government is nothing more than a new label for processes that have been part of
governance for decades (Gil-Garcia, 2012).Roman (2015) indicated that the meaning of e-
government will be governed by the research context dependent on the scholars’
backgrounds, assumptions or the function being emphasized. In broad terms, e-government
is commonly defined as the use ICTs in governance (Dawes, 2008; Fountain, 2001;
Maureen-Brown, 2007). Some scholars make a clear delineation between e-government and
e-governance (Calista & Melitski, 2007;D’agostino, Schwester, Carrizales & Melitski, 2011);
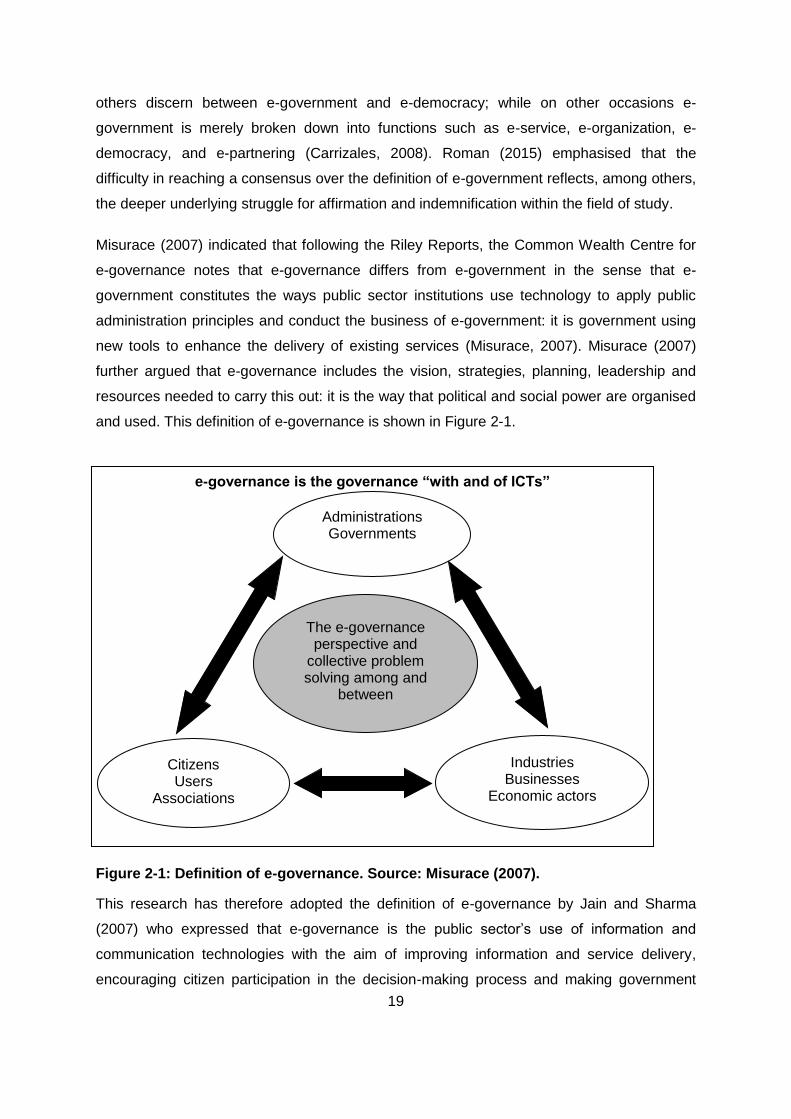
19
others discern between e-government and e-democracy; while on other occasions e-
government is merely broken down into functions such as e-service, e-organization, e-
democracy, and e-partnering (Carrizales, 2008). Roman (2015) emphasised that the
difficulty in reaching a consensus over the definition of e-government reflects, among others,
the deeper underlying struggle for affirmation and indemnification within the field of study.
Misurace (2007) indicated that following the Riley Reports, the Common Wealth Centre for
e-governance notes that e-governance differs from e-government in the sense that e-
government constitutes the ways public sector institutions use technology to apply public
administration principles and conduct the business of e-government: it is government using
new tools to enhance the delivery of existing services (Misurace, 2007). Misurace (2007)
further argued that e-governance includes the vision, strategies, planning, leadership and
resources needed to carry this out: it is the way that political and social power are organised
and used. This definition of e-governance is shown in Figure 2-1.
Figure 2-1: Definition of e-governance. Source: Misurace (2007).
This research has therefore adopted the definition of e-governance by Jain and Sharma
(2007) who expressed that e-governance is the public sector’s use of information and
communication technologies with the aim of improving information and service delivery,
encouraging citizen participation in the decision-making process and making government
e-governance is the governance “with and of ICTs”
Administrations Governments
Industries Businesses
Economic actors
Citizens Users
Associations
The e-governance perspective and
collective problem solving among and
between
20
more accountable, transparent and effective. The study also used the definition of e-
government by the United Nations (2014), which says that that e-government refers to the
use of and application of information technologies in public administration to streamline and
integrate workflows and processes, to effectively manage data and information, enhance
public service delivery, as well as expand communication channels for engagement and
empowerment of people. These definitions were used to develop framework for e-
governance, which is suitable for improving service delivery in local authorities in South
Africa. Figure 2-1 was used in this study in developing a proposed conceptual framework in
Chapter 3.
Tavares, Soares and Estevez (2016) argued that within the latest stage in digital government
evolution, context-specific public service delivery refers to specific efforts undertaken by
national, regional and local governments in delivering public services to pursue specific
public policy and sustainable development goals. Janowski (2015) explained that public
service delivery denotes specializing digital government initiatives, including their objectives,
design, operations and outcomes, to different local, sectorial and local-sectorial contexts to
ensure that outcomes of public service delivery significantly contributes to public policy and
development. Ntetha and Mostert (2011) defined service delivery as an activity or action that
satisfies the needs of a person. In other words, it is the manner in which a customer’s needs
are met. This research however used the definition of service delivery by Janowski (2015)
and Ntetha and Mostert (2015) to understand the aspects of service delivery and how it can
be enhanced through the use of ICTs tools as part of e-governance.
2.3 Conceptualising e-governance
Misurace (2007) concepualised e-governance as a growing phenomenon around the world
and is emerging as a significant discipline, initially within the field of public administration
reform, but that is now being realised as not only being a “government business”, but also
eliciting societal challenges as well. Lal and Haleem (2002) highlighted that e-governance
initiative normally starts at "computerization and "connectivity" and the initiative often gets
stuck at a point leaving the hardware grossly underutilized. Lal and Haleem (2002) further
argued that computers and connectivity are only the means to achieve e-governance and e-
governance objectives and need to be supplemented with "content" and "training" so that the
system is able to harness the benefits of e-governance. Misurace (2007) explained that the
concept of e-governance is not commonly recognised and shared worldwide. For many, e-
governance is just one more buzzword for e-government. For others, who aim at specific
identifications, e-governance is merely an indication of the impact of e-governance outside
21
the administration boundaries, in particular when private economy actors are active
stakeholders (Misurace, 2007).Three conceptualisations of e-governance have been
identified:
E-governance as customer satisfaction,
E-governance as processes and interactions, and
E-governance as a tool,
Misurace (2007) selected that the first and probably most widespread conceptualisation
refers to customer satisfaction. Misurace (2007) evaluated that the term e-governance is not
only used as being synonymous of e-government, it is moreover synonymous with satisfying
the citizens/customers by means of delivering the services through the internet. Misurace
(2007) appraised that generally this is the view of promoters of new public management who
see in the ICTs a significant contribution to, and the next step in improving service delivery
and especially customer satisfaction (Misurace, 2007). Misurace (2007) highlighted that for
this conceptualisation, the main unit of analysis is the government or rather the
administration, whose interface with the citizens the ICT are said to be going to improve.
Misurace (2007) formulated that citizens are seen here as more or less passive recipients of
digitalised information and services that is as customers. In other words at the heart of this
conceptualisation it is not the process to which the ICTs are being applied, but merely the
delivery of information and sometimes services (Misurace, 2007). This conceptualisation is
important in this study as it is a building block for the development of e-governance
framework for improving service delivery at local authority level in South Africa.
Misurace (2007) explained that in the second conceptualisation e-government is seen as a
decisional process. Misurace (2007) expressed that International Centre of e-governance
says for example, “Governance is not government, nor is it the act of governing. It is more
usefully seen as a process: the process by which institutions, organisations, companies and
societies guide themselves. It is also about how these bodies interact with each other, with
their clients and with the public. At its most basic level, it is about how society organises
itself for collective decision making, and also provides transparent mechanisms for seeing
those decisions through. E-governance is shorthand term for the use and impact of
technology, in particular ICTs, in governance systems”. Misurace (2007) argued that
considering the combination of ICTs with governance, e-government is more and more
moving towards e-governance where the concept of e-governance further encompasses e-
government. This conceptualisation is therefore important for this study. For e-governance

22
framework to be successful it is of paramount important to first of all consider the internal
processes of local authorities in order to come up with e-governance framework that will
satisfy and meet the needs of the citizens.
Misurace (2007) created the third conceptualisation which sees e-governance as a set of
tools in the hands of governance, or rather in the hands of the Administration. In other
words, the starting point here is not the state or its transformation but the possibilities that
ICTs offer (Misurace, 2007). Common Wealth Centre for e-governance (CGeG) argued that
it is the moment of governments online to deliver their services and programmes to provide
government information, and to interact with the citizens, all electronically. Misurace (2007)
highlighted that this is resulting in the formation of new relationships between the citizens
and the state. These tools are important in this research as it forms the basis for the
construction of variable/constructs for this study to determine their relationships in the
designing of e-governance framework for local authorities in South Africa.
2.3.1 Major pillars of e-governance
Lal and Haleem (2002) explained that e-governance has two dimensions. Lal and Haleem
(2002) indicated that the first is application of Information Technology for the improvement of
administration and second is application of governance to the emerging cyber society. Lal
and Haleem (2002) argued that the system of governance consists of the
ministry/departments and the parliamentary/state legislative systems, down to the elected
representatives of the village/ward. Lal and Haleem (2002) expressedtheir understanding
that it also includes the implementation consisting of officials and any other organisations
involved in the delivery of collective state administered services to the citizens. Lal and
Haleem (2002) stated that the system of e-governance is supported by five pillars:
Computers—refers to all the hardware and software requirements of governance.
Connectivity—refers to all carrier systems, bandwidth, etc.
Content—refers to the information that is exchanged between the "consumers" of the
system.
Confidence building—refers to those measures that help the citizens develop confidence
in the e-governance and encourages them to take to a-transformation.
Figure 2-2 illustrates the important pillars of e-governance, which has been also been used
in designing conceptual framework in Chapter 3.
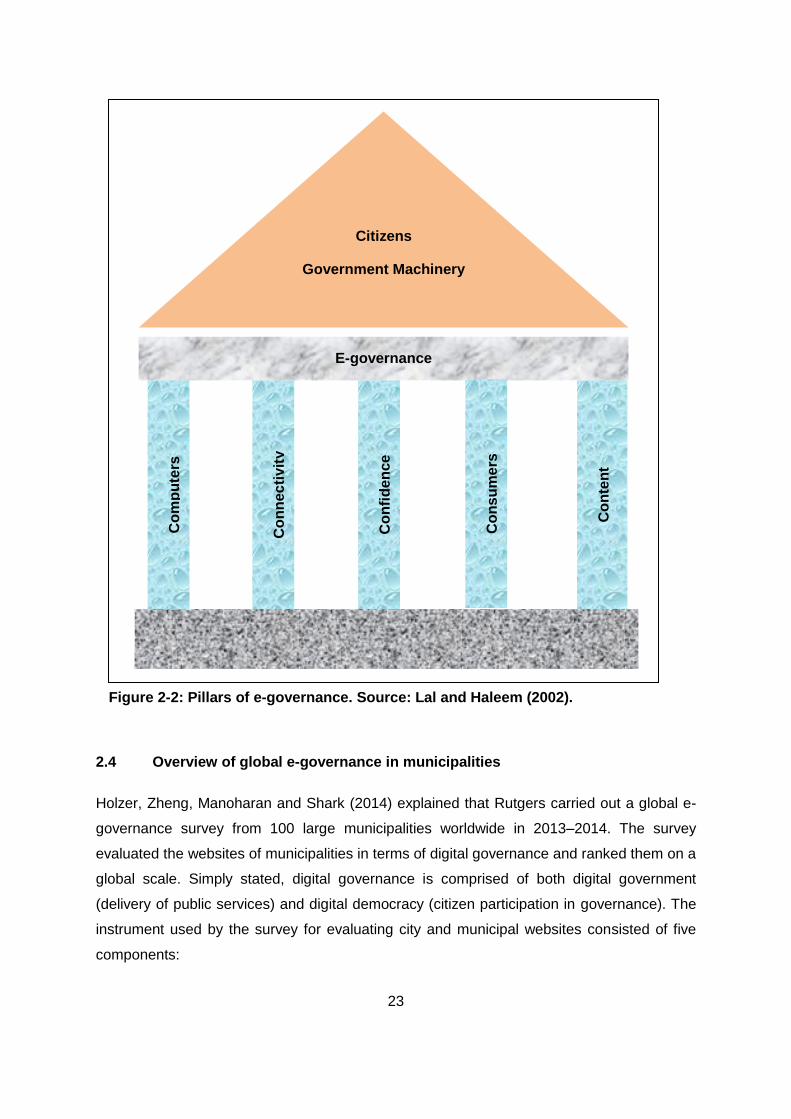
23
2.4 Overview of global e-governance in municipalities
Holzer, Zheng, Manoharan and Shark (2014) explained that Rutgers carried out a global e-
governance survey from 100 large municipalities worldwide in 2013–2014. The survey
evaluated the websites of municipalities in terms of digital governance and ranked them on a
global scale. Simply stated, digital governance is comprised of both digital government
(delivery of public services) and digital democracy (citizen participation in governance). The
instrument used by the survey for evaluating city and municipal websites consisted of five
components:
Citizens
Government Machinery
Technology
E-governance
Co
mp
ute
rs
Co
nn
ec
tiv
ity
Co
nfi
den
ce
Co
ns
um
ers
Co
nte
nt
Figure 2-2: Pillars of e-governance. Source: Lal and Haleem (2002).
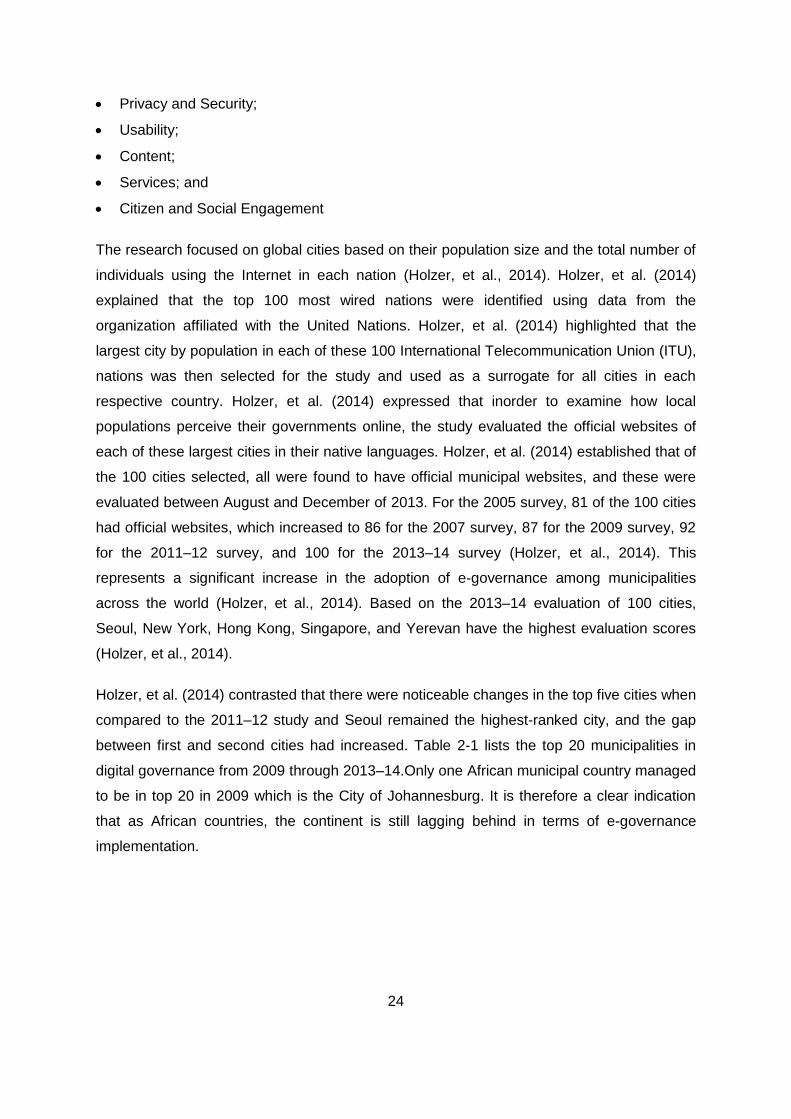
24
Privacy and Security;
Usability;
Content;
Services; and
Citizen and Social Engagement
The research focused on global cities based on their population size and the total number of
individuals using the Internet in each nation (Holzer, et al., 2014). Holzer, et al. (2014)
explained that the top 100 most wired nations were identified using data from the
organization affiliated with the United Nations. Holzer, et al. (2014) highlighted that the
largest city by population in each of these 100 International Telecommunication Union (ITU),
nations was then selected for the study and used as a surrogate for all cities in each
respective country. Holzer, et al. (2014) expressed that inorder to examine how local
populations perceive their governments online, the study evaluated the official websites of
each of these largest cities in their native languages. Holzer, et al. (2014) established that of
the 100 cities selected, all were found to have official municipal websites, and these were
evaluated between August and December of 2013. For the 2005 survey, 81 of the 100 cities
had official websites, which increased to 86 for the 2007 survey, 87 for the 2009 survey, 92
for the 2011–12 survey, and 100 for the 2013–14 survey (Holzer, et al., 2014). This
represents a significant increase in the adoption of e-governance among municipalities
across the world (Holzer, et al., 2014). Based on the 2013–14 evaluation of 100 cities,
Seoul, New York, Hong Kong, Singapore, and Yerevan have the highest evaluation scores
(Holzer, et al., 2014).
Holzer, et al. (2014) contrasted that there were noticeable changes in the top five cities when
compared to the 2011–12 study and Seoul remained the highest-ranked city, and the gap
between first and second cities had increased. Table 2-1 lists the top 20 municipalities in
digital governance from 2009 through 2013–14.Only one African municipal country managed
to be in top 20 in 2009 which is the City of Johannesburg. It is therefore a clear indication
that as African countries, the continent is still lagging behind in terms of e-governance
implementation.
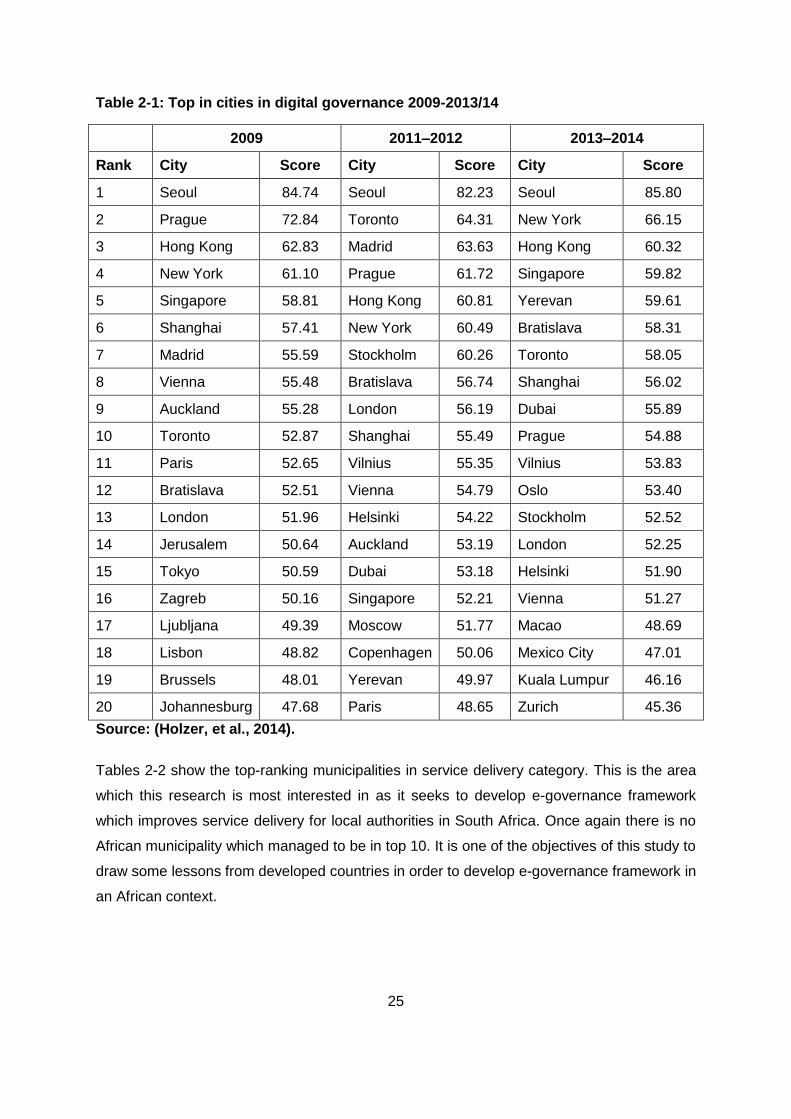
25
Table 2-1: Top in cities in digital governance 2009-2013/14
2009 2011–2012 2013–2014
Rank City Score City Score City Score
1 Seoul 84.74 Seoul 82.23 Seoul 85.80
2 Prague 72.84 Toronto 64.31 New York 66.15
3 Hong Kong 62.83 Madrid 63.63 Hong Kong 60.32
4 New York 61.10 Prague 61.72 Singapore 59.82
5 Singapore 58.81 Hong Kong 60.81 Yerevan 59.61
6 Shanghai 57.41 New York 60.49 Bratislava 58.31
7 Madrid 55.59 Stockholm 60.26 Toronto 58.05
8 Vienna 55.48 Bratislava 56.74 Shanghai 56.02
9 Auckland 55.28 London 56.19 Dubai 55.89
10 Toronto 52.87 Shanghai 55.49 Prague 54.88
11 Paris 52.65 Vilnius 55.35 Vilnius 53.83
12 Bratislava 52.51 Vienna 54.79 Oslo 53.40
13 London 51.96 Helsinki 54.22 Stockholm 52.52
14 Jerusalem 50.64 Auckland 53.19 London 52.25
15 Tokyo 50.59 Dubai 53.18 Helsinki 51.90
16 Zagreb 50.16 Singapore 52.21 Vienna 51.27
17 Ljubljana 49.39 Moscow 51.77 Macao 48.69
18 Lisbon 48.82 Copenhagen 50.06 Mexico City 47.01
19 Brussels 48.01 Yerevan 49.97 Kuala Lumpur 46.16
20 Johannesburg 47.68 Paris 48.65 Zurich 45.36
Source: (Holzer, et al., 2014).
Tables 2-2 show the top-ranking municipalities in service delivery category. This is the area
which this research is most interested in as it seeks to develop e-governance framework
which improves service delivery for local authorities in South Africa. Once again there is no
African municipality which managed to be in top 10. It is one of the objectives of this study to
draw some lessons from developed countries in order to develop e-governance framework in
an African context.
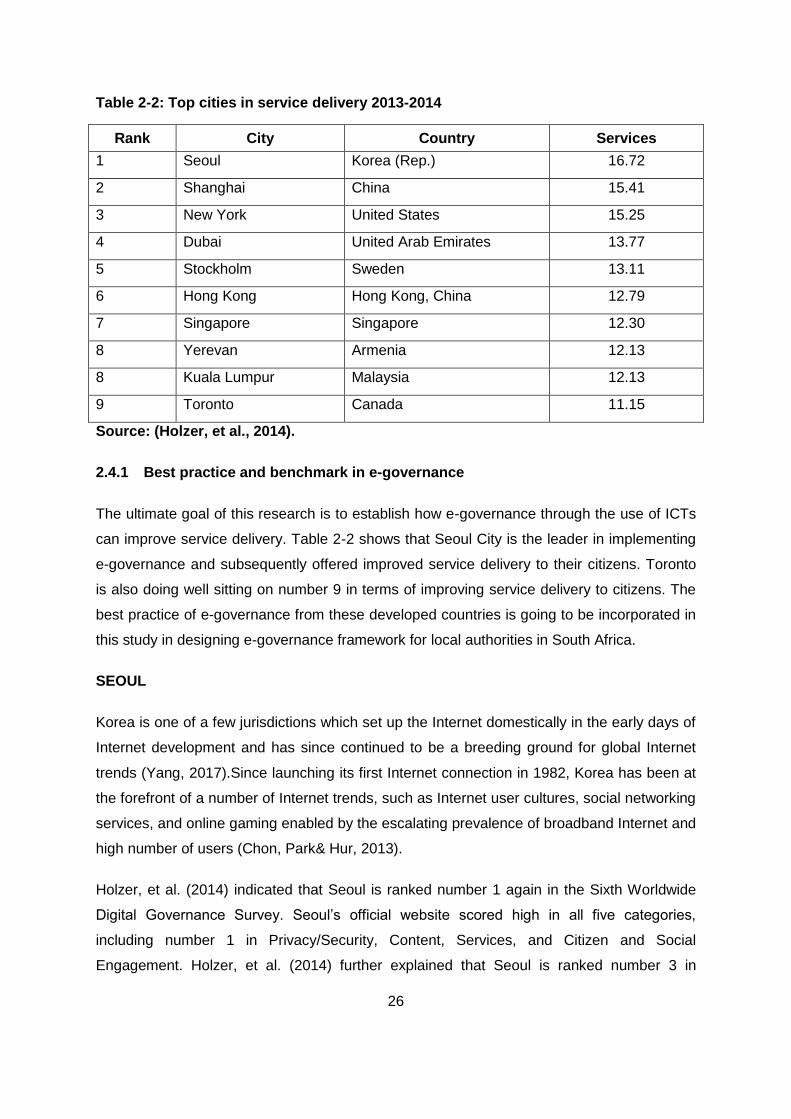
26
Table 2-2: Top cities in service delivery 2013-2014
Rank City Country Services
1 Seoul Korea (Rep.) 16.72
2 Shanghai China 15.41
3 New York United States 15.25
4 Dubai United Arab Emirates 13.77
5 Stockholm Sweden 13.11
6 Hong Kong Hong Kong, China 12.79
7 Singapore Singapore 12.30
8 Yerevan Armenia 12.13
8 Kuala Lumpur Malaysia 12.13
9 Toronto Canada 11.15
Source: (Holzer, et al., 2014).
2.4.1 Best practice and benchmark in e-governance
The ultimate goal of this research is to establish how e-governance through the use of ICTs
can improve service delivery. Table 2-2 shows that Seoul City is the leader in implementing
e-governance and subsequently offered improved service delivery to their citizens. Toronto
is also doing well sitting on number 9 in terms of improving service delivery to citizens. The
best practice of e-governance from these developed countries is going to be incorporated in
this study in designing e-governance framework for local authorities in South Africa.
SEOUL
Korea is one of a few jurisdictions which set up the Internet domestically in the early days of
Internet development and has since continued to be a breeding ground for global Internet
trends (Yang, 2017).Since launching its first Internet connection in 1982, Korea has been at
the forefront of a number of Internet trends, such as Internet user cultures, social networking
services, and online gaming enabled by the escalating prevalence of broadband Internet and
high number of users (Chon, Park& Hur, 2013).
Holzer, et al. (2014) indicated that Seoul is ranked number 1 again in the Sixth Worldwide
Digital Governance Survey. Seoul’s official website scored high in all five categories,
including number 1 in Privacy/Security, Content, Services, and Citizen and Social
Engagement. Holzer, et al. (2014) further explained that Seoul is ranked number 3 in
27
Usability and that Seoul’s website design is user-oriented and quite easy to use. Holzer, et
al. (2014) expressed that the relatively short homepage, consistent navigation and
formatting, excellent sitemap, and so on, make the website very user-friendly.
Yang (2017) argued that seeing the Internet as the future of the nation supported the
governmental decision to invest, which enabled the speedy construction of a technological
infrastructure that in return became tangible evidence for the claim that Korea had become
an Internet powerhouse.
NEW YORK
According to the International Telecommunication Union’s (Telecommunication/ICT
Indicators Database, the world top broadband economies are from Europe, Asia, and the
Pacific (International-Telecommunications-Union, 2013). Additionally, the United States
ranks 16th in broadband Internet connections, 17th in fixed broadband Internet subscriptions,
and 35th in Internet bandwidth out of 148 nations worldwide. The United States ranks 50th out
of 90 nations in cost of broadband Internet access (International Telecommunications Union,
2013).
Europe is the world’s leading region in ICT infrastructure and services and this comes as no
surprise, as the, Old Continent’ has a population that is much more homogenous and its
constant commitment to ICT values is easily understood (Dobrota, Jeremic& Markovic,
2018) United States is one of them. Holzer, et al. (2014) indicated that New York’s ranking
rose to number 2 in the Sixth Global e-governance Survey, compared to its ranking as
number 6 in 2011–12.Holzer, et al. (2014) justified that New York has continually ranked
very high in the past global surveys, reflecting its excellent performance in digital
governance. Holzer, et al. (2014) explained that in specific categories, New York ranked
number 7 in Privacy/Security, number 5 in Content, number 3 in Services, and number 7 in
Citizen and Social Engagement.
Buente (2016) in his study concluded that digital citizenship, understood as frequent home
Internet use, made a positive impact on electoral engagement in the 2008 United States
presidential election (Buente, 2016). This was therefore used as part of social engagement
by the United States government
Holzer, et al. (2014) indicated that as for citizen engagement, citizens can directly file a
complaint through the website for such matters as noise, transportation and public safety.
Holzer, et al. (2014) justify that New Yorkers are able to use social media, such as
28
Facebook, Twitter, Foursquare, Instagram, Tumblr, to connect and interact with government
officials through the website as many departments have their own social media accounts.
The website serves as a best practice for enabling the public to better engage with
government (Holzer, et al., 2014).
HONG KONG
China has witnessed rapid informationization along with its booming economic growth over
the past decade and in 2016, the number of internet users has reached 731 million, making
the internet penetration rate 53.2%, and the number of mobile phone users is 695 million
(Liu, et al., 2017).
Holzer, et al. (2014) illustrated that Hong Kong is ranked number 3 in the Sixth Worldwide
Digital Survey, compared to its ranking of number 5 in the 2011–12 survey. Holzer, et al.
(2014) argued that it has continually been ranked top 5 in the past four surveys. Holzer, et al.
(2014) separated that in specific categories, it ranked number 6 in Services, number 14 in
Content, number 8 in Privacy and Security, and number 10 in Citizen and Social
engagement.
Lee and Lio (2016) argued that Chinese government has been promoting ICT projects and
enjoying the benefits to the public and private sectors provided by the Internet. On the other
hand, the Chinese government has also invested countless resources in developing various
types of Internet monitoring and filtering software and has employed an Internet police to
monitor the activities of Internet users (Lee & Lio, 2016)
The website design of Hong Kong is similar to New York’s in that all the information and
services are well-organized based on what citizens want to know and want to do through this
website (Holzer, et al., 2014). Under different topics, such as environment, education, health
care and social services, visitors can locate the information they need efficiently. Holzer, et
al. (2014) emphasised that Hong Kong does an excellent job of sharing database with the
public through its “Data.One” portal. Holzer, et al. (2014) explained that citizens have access
to a range of public data, including geospatial, population, public transportation, water
quality, weather, etc and these data enable citizens to both better oversee government and
make better choices in their everyday lives. As to public transportation, citizens can access
to the live video or traffic condition snapshots through the website (Holzer, et al., 2014).
29
TORONTO
Toronto is also a leading municipality in e-governance. Although its ranking dropped slightly
in 2014, Toronto serves as an exemplar in many areas (Holzer, et al., 2014). Holzer, et al.
(2014) expressed that the Content and the homepage of Toronto is designed very well, with
content divided into four parts: “Living in Toronto”, “Doing Business”, “Visiting Toronto”, and
“Accessing City Hall.” Holzer, et al. (2014) went further to explain that visitors can easily find
information and services based on their goals and status, for example, residents can go
directly to the major four categories to find information on health, environment, culture and
recreation. Holzer, et al. (2014) highlighted that users can choose to subscribe to different
government events based on their needs and these events are also available through an
audio version which can be directly downloaded. The city has Facebook, Twitter, and
YouTube accounts so that the public might follow updates through social media (Holzer, et
al., 2014).
Holzer, et al. (2014) reiterated that Toronto also serves as an exemplar for opening
government performance data to the public. Holzer, et al. (2014) highlighted that data of
many kinds, such as community services, culture and tourism, finance, garbage and
recycling can be searched and downloaded, which enables citizens to better understand
government. Holzer, et al. (2014) gave examples where citizens have access to the dataset
of voter statistics for elections and the dataset of service requests from customers in the past
month. Holzer, et al. (2014) eluded that Toronto also publishes the “Performance
Management and Benchmarking Report”, which provides residents with government
performance data. The report has detailed information about performance measurements
and indicators in 33 services areas, through which citizens may know whether improvements
have been made in certain areas and thereby evaluate government performance (Holzer, et
al., 2014).
SINGAPORE
Countries, such as Singapore, which base their development and progress on ICT, are more
competitive than other countries (Zoroja, 2015). The Global Competitiveness Report
confirmed their high ranking in 2014 on the competitiveness scale where Singapore was in
second place) (World Economic Forum, 2014).
Yunis, Koong, Liu, Kwam and Tsang (2012) argued that ICT progress and usage is a key
factor in personal, economic and social development in relation to communication, business
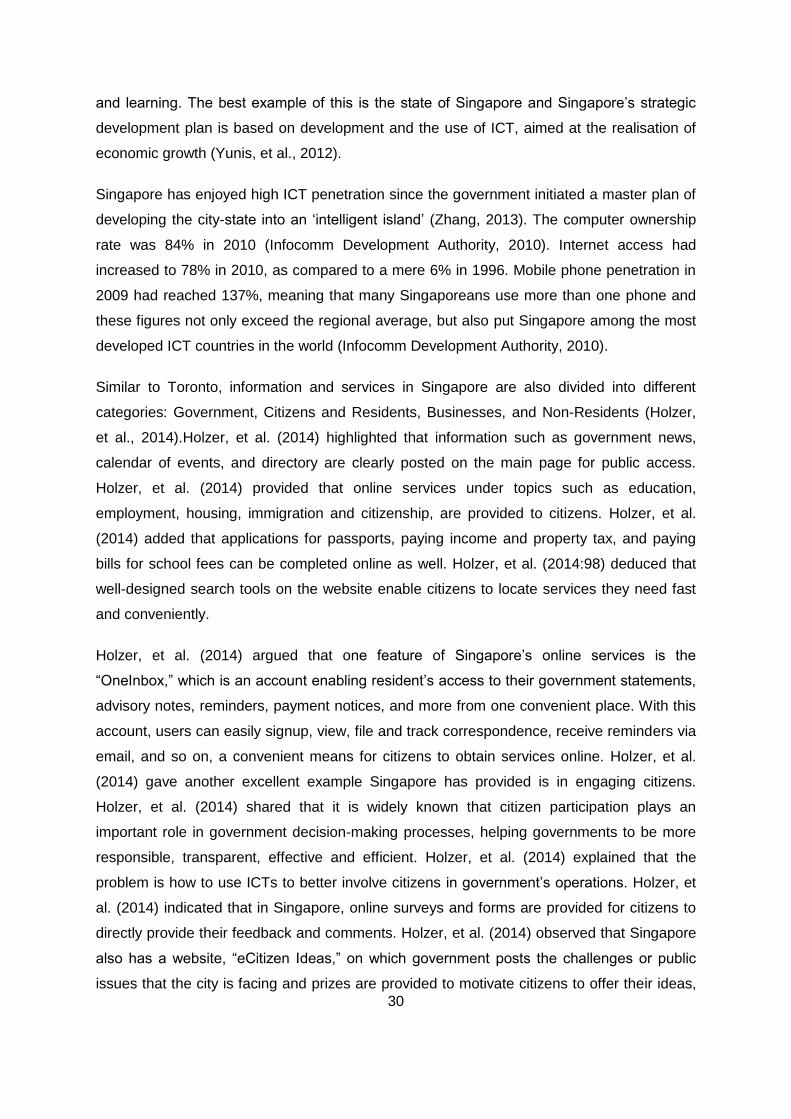
30
and learning. The best example of this is the state of Singapore and Singapore’s strategic
development plan is based on development and the use of ICT, aimed at the realisation of
economic growth (Yunis, et al., 2012).
Singapore has enjoyed high ICT penetration since the government initiated a master plan of
developing the city-state into an ‘intelligent island’ (Zhang, 2013). The computer ownership
rate was 84% in 2010 (Infocomm Development Authority, 2010). Internet access had
increased to 78% in 2010, as compared to a mere 6% in 1996. Mobile phone penetration in
2009 had reached 137%, meaning that many Singaporeans use more than one phone and
these figures not only exceed the regional average, but also put Singapore among the most
developed ICT countries in the world (Infocomm Development Authority, 2010).
Similar to Toronto, information and services in Singapore are also divided into different
categories: Government, Citizens and Residents, Businesses, and Non-Residents (Holzer,
et al., 2014).Holzer, et al. (2014) highlighted that information such as government news,
calendar of events, and directory are clearly posted on the main page for public access.
Holzer, et al. (2014) provided that online services under topics such as education,
employment, housing, immigration and citizenship, are provided to citizens. Holzer, et al.
(2014) added that applications for passports, paying income and property tax, and paying
bills for school fees can be completed online as well. Holzer, et al. (2014:98) deduced that
well-designed search tools on the website enable citizens to locate services they need fast
and conveniently.
Holzer, et al. (2014) argued that one feature of Singapore’s online services is the
“OneInbox,” which is an account enabling resident’s access to their government statements,
advisory notes, reminders, payment notices, and more from one convenient place. With this
account, users can easily signup, view, file and track correspondence, receive reminders via
email, and so on, a convenient means for citizens to obtain services online. Holzer, et al.
(2014) gave another excellent example Singapore has provided is in engaging citizens.
Holzer, et al. (2014) shared that it is widely known that citizen participation plays an
important role in government decision-making processes, helping governments to be more
responsible, transparent, effective and efficient. Holzer, et al. (2014) explained that the
problem is how to use ICTs to better involve citizens in government’s operations. Holzer, et
al. (2014) indicated that in Singapore, online surveys and forms are provided for citizens to
directly provide their feedback and comments. Holzer, et al. (2014) observed that Singapore
also has a website, “eCitizen Ideas,” on which government posts the challenges or public
issues that the city is facing and prizes are provided to motivate citizens to offer their ideas,
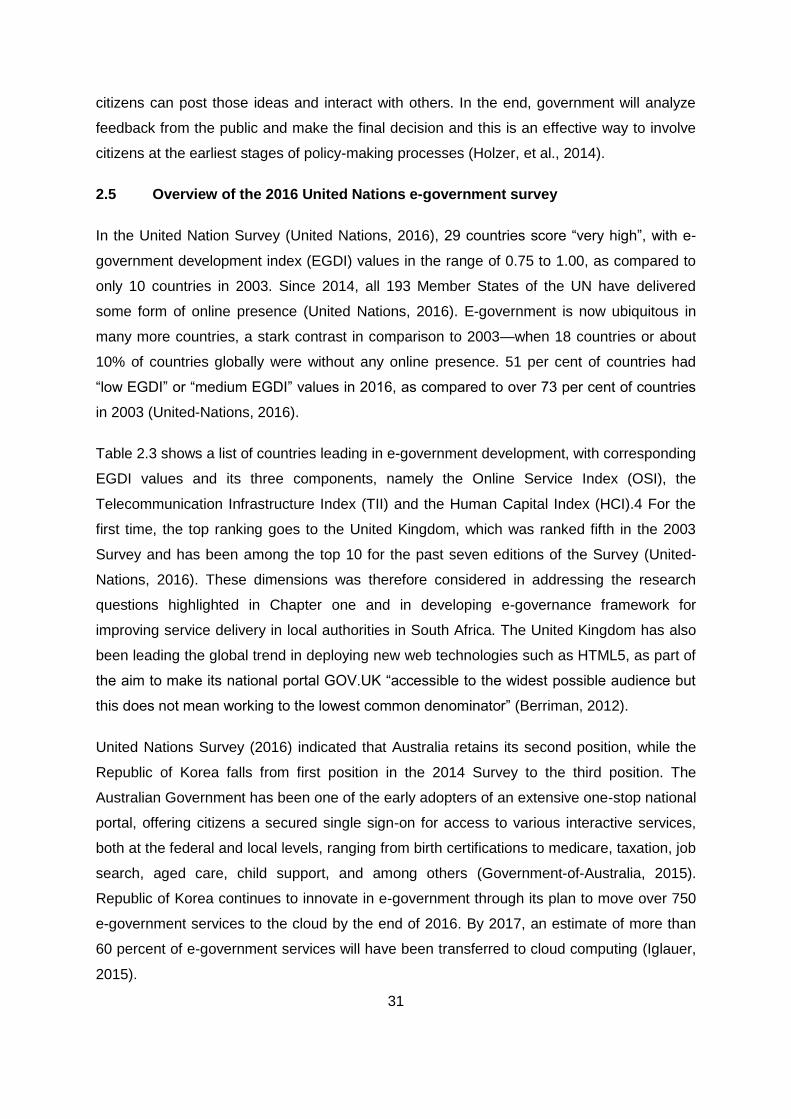
31
citizens can post those ideas and interact with others. In the end, government will analyze
feedback from the public and make the final decision and this is an effective way to involve
citizens at the earliest stages of policy-making processes (Holzer, et al., 2014).
2.5 Overview of the 2016 United Nations e-government survey
In the United Nation Survey (United Nations, 2016), 29 countries score “very high”, with e-
government development index (EGDI) values in the range of 0.75 to 1.00, as compared to
only 10 countries in 2003. Since 2014, all 193 Member States of the UN have delivered
some form of online presence (United Nations, 2016). E-government is now ubiquitous in
many more countries, a stark contrast in comparison to 2003—when 18 countries or about
10% of countries globally were without any online presence. 51 per cent of countries had
“low EGDI” or “medium EGDI” values in 2016, as compared to over 73 per cent of countries
in 2003 (United-Nations, 2016).
Table 2.3 shows a list of countries leading in e-government development, with corresponding
EGDI values and its three components, namely the Online Service Index (OSI), the
Telecommunication Infrastructure Index (TII) and the Human Capital Index (HCI).4 For the
first time, the top ranking goes to the United Kingdom, which was ranked fifth in the 2003
Survey and has been among the top 10 for the past seven editions of the Survey (United-
Nations, 2016). These dimensions was therefore considered in addressing the research
questions highlighted in Chapter one and in developing e-governance framework for
improving service delivery in local authorities in South Africa. The United Kingdom has also
been leading the global trend in deploying new web technologies such as HTML5, as part of
the aim to make its national portal GOV.UK “accessible to the widest possible audience but
this does not mean working to the lowest common denominator” (Berriman, 2012).
United Nations Survey (2016) indicated that Australia retains its second position, while the
Republic of Korea falls from first position in the 2014 Survey to the third position. The
Australian Government has been one of the early adopters of an extensive one-stop national
portal, offering citizens a secured single sign-on for access to various interactive services,
both at the federal and local levels, ranging from birth certifications to medicare, taxation, job
search, aged care, child support, and among others (Government-of-Australia, 2015).
Republic of Korea continues to innovate in e-government through its plan to move over 750
e-government services to the cloud by the end of 2016. By 2017, an estimate of more than
60 percent of e-government services will have been transferred to cloud computing (Iglauer,
2015).
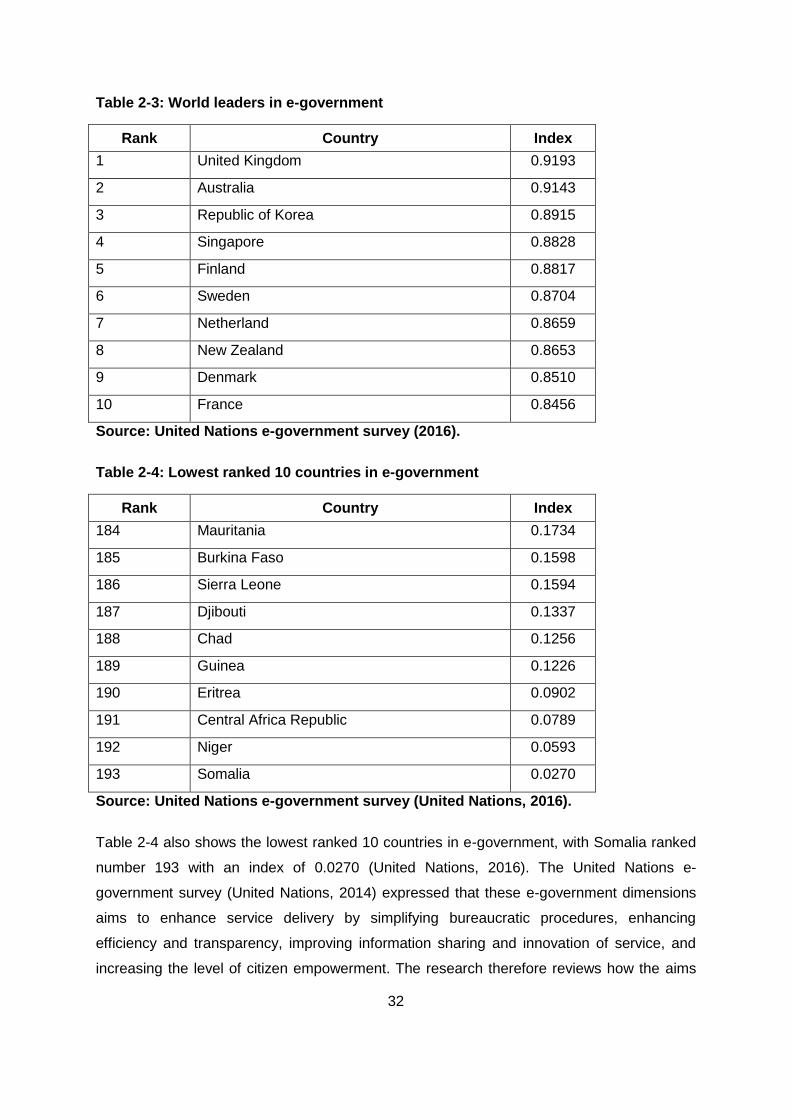
32
Table 2-3: World leaders in e-government
Rank Country Index
1 United Kingdom 0.9193
2 Australia 0.9143
3 Republic of Korea 0.8915
4 Singapore 0.8828
5 Finland 0.8817
6 Sweden 0.8704
7 Netherland 0.8659
8 New Zealand 0.8653
9 Denmark 0.8510
10 France 0.8456
Source: United Nations e-government survey (2016).
Table 2-4: Lowest ranked 10 countries in e-government
Rank Country Index
184 Mauritania 0.1734
185 Burkina Faso 0.1598
186 Sierra Leone 0.1594
187 Djibouti 0.1337
188 Chad 0.1256
189 Guinea 0.1226
190 Eritrea 0.0902
191 Central Africa Republic 0.0789
192 Niger 0.0593
193 Somalia 0.0270
Source: United Nations e-government survey (United Nations, 2016).
Table 2-4 also shows the lowest ranked 10 countries in e-government, with Somalia ranked
number 193 with an index of 0.0270 (United Nations, 2016). The United Nations e-
government survey (United Nations, 2014) expressed that these e-government dimensions
aims to enhance service delivery by simplifying bureaucratic procedures, enhancing
efficiency and transparency, improving information sharing and innovation of service, and
increasing the level of citizen empowerment. The research therefore reviews how the aims
33
for e-government aims in developed countries can be applied in developing countries such
as South Africa and how it can assist this research to come up with e-governance framework
that improves service delivery for local authorities in South Africa.
2.6 Comparative analysis of Rutgers e-governance 2013/14 survey and United
Nations e-government 2016 survey
Table 2-5 shows the comparative analysis of the surveys carried out by Holzer, Zheng,
Manoharan and Shark (2014) for Rutgers and the United Nations (2016) respectively. There
are similarities and differences in the nature of their surveys since they have used different
measurement and instruments in their evaluations. The surveys are both longitudinal in
Table 2-5: Rutgers e-governance survey and United Nations e-government comparative analysis
Rutgers e-governance survey (2013/14)
United Nations e-government survey (2016)
Research focus 100 Municipalities (global cities) All 193 United Nations member states
Nature of research Longitudinal assessment Longitudinal assessment
Research results presented
After every two years After every two years
Research interest E-governance of municipalities throughout the world
E-government readiness and e-government development status throughout the world
Measurement Scores E-government development Index (EGDI)
Instrument of evaluation Private and security Online services
Usability Telecommunication infrastructure
Content of website Human capacity
Types of online services offered
Citizens and social engagements
Survey results (highest scores)
Seoul United Kingdom
New York Australia
Hong Kong Republic of Korea
Singapore Singapore
Yerevan Finland

34
nature and are produced after every two years. The results from the surveys show that the
United Kingdom is ranked on top in the United Nation surveys, while Seoul is ranked first for
Rutgers survey.
2.7 E-governance and e-government in African Municipalities
Ntetha and Mostert (2011) recognized that the African region was still far behind the world in
almost all aspects of access to ICT for development and the regional e-government
development.
The United Nations e-government survey (United Nations, 2016) indicated that top two
performers on e-government with high EGDI values for Africa are Mauritius, ranked globally
at 58th, Tunisia at 72nd and South Africa at 76th (United Nations, 2016). In the Americas, the
United States and Canada are leading in e-government development and much emphasis
has been placed on advancing e-government in the Asian region (United Nations, 2016).
The United Nations e-government Survey (United Nations, 2016) showed that top two
performers on e-government with high EGDI values for Asian countries are The Republic of
Korea (ranked 3rd) and Singapore (4th). In Europe, the leading region, e-government is
progressing steadily across the continent. The top two e-government leaders in Europe are
the United Kingdom (ranked 1st), Finland (ranked 5th) (United Nations, 2016).In Oceania top
two performing countries are New Zealand and Australia (United-Nations, 2016).
It is this study view that regional cooperation mechanisms could be strengthened to facilitate
national development goals, particularly among those countries with no direct sea access in
order to promote e-government development. Table 2-6 illustrates the regional leaders in e-
government.
According to Holzer, Zheng, Manoharan and Shark (2014) in his Rutgers global e-
governance survey for municipalities (2013–2014), Table 2-7 shows that the City of
Johannesburg for South Africa is ranked number 1, followed by Cairo for Egypt. On the
bottom of the list is Accra for Ghana.
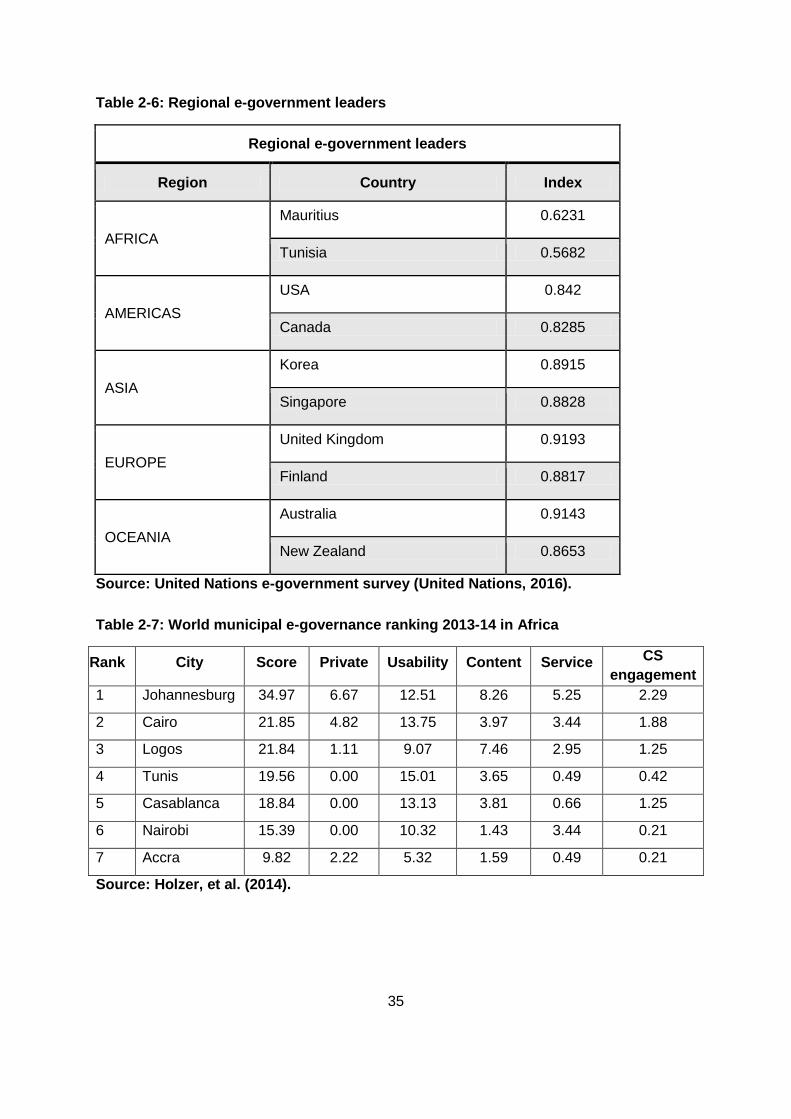
35
Table 2-6: Regional e-government leaders
Regional e-government leaders
Region Country Index
AFRICA
Mauritius 0.6231
Tunisia 0.5682
AMERICAS
USA 0.842
Canada 0.8285
ASIA
Korea 0.8915
Singapore 0.8828
EUROPE
United Kingdom 0.9193
Finland 0.8817
OCEANIA
Australia 0.9143
New Zealand 0.8653
Source: United Nations e-government survey (United Nations, 2016).
Table 2-7: World municipal e-governance ranking 2013-14 in Africa
Rank City Score Private Usability Content Service CS
engagement
1 Johannesburg 34.97 6.67 12.51 8.26 5.25 2.29
2 Cairo 21.85 4.82 13.75 3.97 3.44 1.88
3 Logos 21.84 1.11 9.07 7.46 2.95 1.25
4 Tunis 19.56 0.00 15.01 3.65 0.49 0.42
5 Casablanca 18.84 0.00 13.13 3.81 0.66 1.25
6 Nairobi 15.39 0.00 10.32 1.43 3.44 0.21
7 Accra 9.82 2.22 5.32 1.59 0.49 0.21
Source: Holzer, et al. (2014).

36
2.7.1 Critique of the studies
Currently, there are several metrics applied to measure and rank the e-readiness of various
African countries (Sigwejo & Pather, 2016). However, while these measures have provided a
source of comparative analysis between different e-government projects, they are far from
being perfect (Sigwejo & Pather, 2016).Sigwejo and Pather, (2016) gave the example that
most of these measures are diverse and difficult to compare, since they assume ‘one size
fits all’ and ignore differing environmental, cultural and contextual factors of various
countries. Sigwejo and Pather, (2016) pointed out that further criticisms of these measures
are that they are ‘first generation metrics’ designed for developed countries, as opposed to
developing countries. This study despite the criticism identified by Sigwajo and Pather
(2016) used these global surveys as a basis for developing framework for improving service
delivery at local government level in a South African context.
2.7.2 Digital divide in Africa
When Mutula (2005) evaluated the digital divide, in developing countries in general and
Africa in particular, there is a close connection to the contextual economic environment of
the respective countries. Mutula (2005) argued that Africa presents complex problems of
digital divide by virtue of its diaspora of varied cultural groups and values and gave an
example that Africa has many languages, with virtually none constituting the language of the
internet and computing. A study by (Tomas Rivera Policy Institute, 2002) in the USA
established that people with limited English-speaking skills lagged behind their English-
speaking counterparts in access to computers and the internet. During 2002, it was
estimated that English in computer-based communication stood at a high of 80 per cent
(Warschauer, 2001). Warschauer (2001) further explained that in sub-Saharan Africa, a
large proportion of indigenous people can neither read nor write in English, and as potential
users of computers they are disadvantaged. Additionally, there are shortages of resources
on the African continent, such as access to PCs, partial internet access, inadequate
telephone lines, etc. This situation is worsened by the high cost of access, inappropriate or
weak policy regimes, inefficient telecommunication services and a lack of locally created
content (Acacia, 1997; Digital-Dividends, 2001).
Fink and Kenny (2003) found that the literature identifies four “gaps” which comprises the
digital divide. These are:
i. a gap in access to use of ICTs, crudely measured by, for instance, the number
and spread of telephones and web-enabled computers;
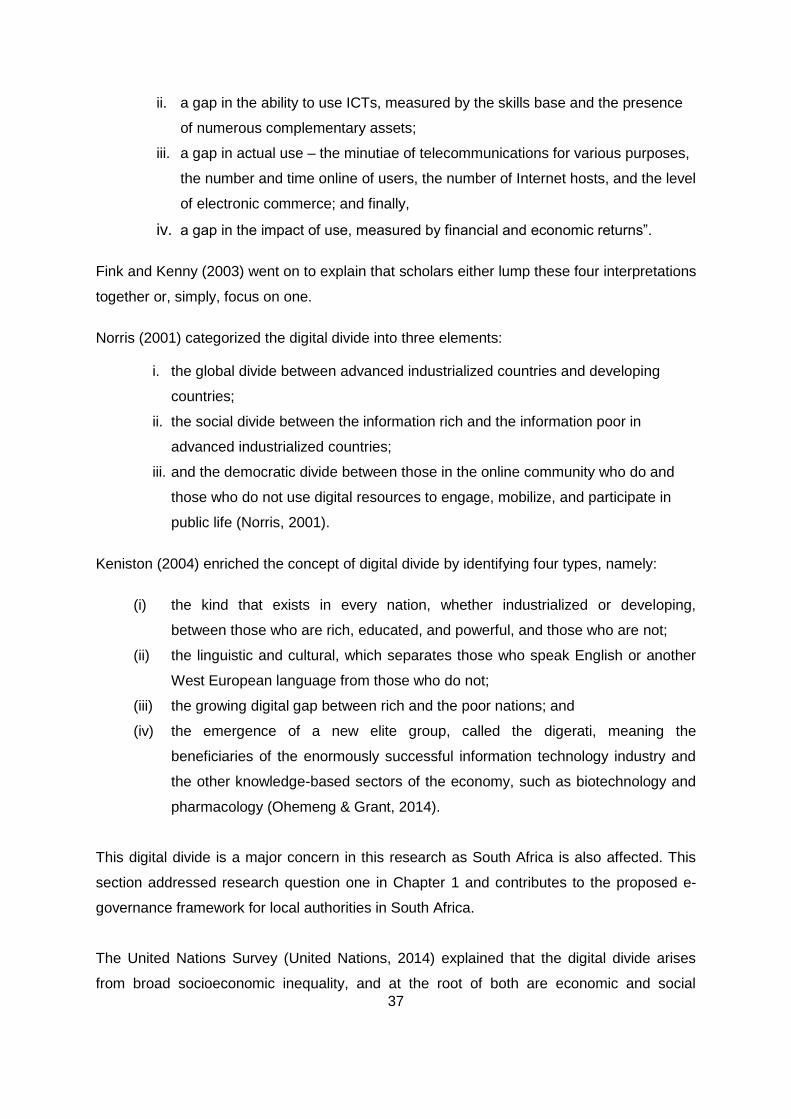
37
ii. a gap in the ability to use ICTs, measured by the skills base and the presence
of numerous complementary assets;
iii. a gap in actual use – the minutiae of telecommunications for various purposes,
the number and time online of users, the number of Internet hosts, and the level
of electronic commerce; and finally,
iv. a gap in the impact of use, measured by financial and economic returns”.
Fink and Kenny (2003) went on to explain that scholars either lump these four interpretations
together or, simply, focus on one.
Norris (2001) categorized the digital divide into three elements:
i. the global divide between advanced industrialized countries and developing
countries;
ii. the social divide between the information rich and the information poor in
advanced industrialized countries;
iii. and the democratic divide between those in the online community who do and
those who do not use digital resources to engage, mobilize, and participate in
public life (Norris, 2001).
Keniston (2004) enriched the concept of digital divide by identifying four types, namely:
(i) the kind that exists in every nation, whether industrialized or developing,
between those who are rich, educated, and powerful, and those who are not;
(ii) the linguistic and cultural, which separates those who speak English or another
West European language from those who do not;
(iii) the growing digital gap between rich and the poor nations; and
(iv) the emergence of a new elite group, called the digerati, meaning the
beneficiaries of the enormously successful information technology industry and
the other knowledge-based sectors of the economy, such as biotechnology and
pharmacology (Ohemeng & Grant, 2014).
This digital divide is a major concern in this research as South Africa is also affected. This
section addressed research question one in Chapter 1 and contributes to the proposed e-
governance framework for local authorities in South Africa.
The United Nations Survey (United Nations, 2014) explained that the digital divide arises
from broad socioeconomic inequality, and at the root of both are economic and social
38
disparities between countries, groups and individuals which impact their ability to access and
use ICT to promote well-being and prosperity. As such, the digital divide in one form or
another affects people both in developed and developing countries. The United Nations
Survey (United Nations, 2014) expressed that overall, despite some progress in providing a
portfolio of e-services and online information, efforts at mitigating the digital divide in any
meaningful way have not reaped large dividends. The United Nations Survey (United
Nations, 2014) concluded that although meaningful access to ICT has gone beyond
connectivity issues, e-government has still not yet adequately embraced human, economic
and social resources, institutional structures and governance networks, which are central to
developmental outcomes. In recent years, policy makers have progressively focused on the
link between use of new technologies, education and social inclusion, particularly of
disadvantaged and vulnerable groups (United Nations, 2014).
South Africa, similar to other developing countries, has, since the inception of democracy,
developed a range of strategic initiatives aimed at benefiting the entire population and
defeating poverty, illiteracy and unemployment (Mawela, 2016). Verdegem (2011)
highlighted the need to eradicate digital inequalities, whilst promoting the participation of all
citizens in the information society, particularly those that are currently socially
disadvantaged. This is relevant in developing countries such as South Africa, where
approximately 45.5% of the population is categorized as poor (Statistics South Africa, 2014),
coupled with an unemployment rate of 25.5%. This study therefore aims to develop e-
governance framework that will cater for the poor population who cannot afford to access
municipality services online.
2.8 Uptake and usage of e-governance for improved service delivery
Sebastian and Supriya (2013) expressed that governments and public sector organizations
around the globe are relying on information and communication technologies (ICTs) to
reform the functioning of the system and provide better service delivery mechanisms for their
citizens. Sebastian and Supriya (2013) further explained that e-governance is the effective
use of ICTs, particularly the web-based Internet applications, for better governance and
service delivery. The main objectives of the e-governance initiatives include enhanced
access to government’s services, improved service delivery and modernized day-to-day
government operations (Sebastian & Supriya, 2013).
The government uses ICT to make public administrations more efficient and effective by
cutting red tape (Mukherjee & Roy, 2016:276). Mukherjee and Roy (2016) further argued
39
that ICTs can remove unnecessary human involvement during the public service delivery
processes from the government. Mukherjee and Roy (2016) expressed that government
websites are mainly classified in two categories one-way communication and two-way
communication. One-way communication is a process where websites provide information
regulations, policies and programs to the citizens, such as downloadable forms for
government services and applications and on the other hand, two-way communication is a
system which provides policies and programs with requesting and receiving inputs from their
citizens (Mukherjee & Roy, 2016). Sigwejo and Pather (2016) emphasised that the
implementation of e-government in the current era is obligatory for the government to
function in this information age. Sigwejo and Pather (2016) further argued that the needs of
people, global competition and new demands of the information age are critical issues,
particularly in developing countries. Ismail (2008) explained that in order to enhance e-
governance services, various developing countries have launched strategic plans which,
according to Ismail (2008) are normally undertaken and implemented following the essential
step of e-readiness evaluation. However, these plans are not a guarantee of uptake of use of
e-governance services, especially in developing countries which currently have a lower
broadband-internet penetration level. It is against this background that this study aims to
come up with e-governance framework for improving service delivery at a local level in South
African given the lower Internet penetration which currently exists in Africa.
Online local government services and internal process streamlining have helped
municipalities contain and even cut costs, the squeezing of public budgets due to reduced
tax revenues has remained a huge challenge for local administrators when it comes to the
development and continued provision of modern online services and internal overhaul
(Scholl, 2014). Faced with this backdrop, local governments have been forced to look at
ways to overcome the effects of budget trimming while at the same time meeting the ever-
higher expectations of citizens and businesses for modern online services (AlAwadhi &
Scholl, 2013). Contemporary cities are characterized by the inequality reflected in uneven
geographies of quality of life conditions. When these inequalities are a matter of concern,
local governments usually assert their intention to respond to citizen’s needs and
deprivations (Martinez, et al., 2011). It is in this context that ICT tools as part of e-
governance are being incorporated in municipal cities to promote local governance by
improving quality of life and increasing efficiency and transparency in the response to
citizen’s demands and needs.
40
Mpinganjira (2012) justified that ensuring that people have access to information and
communication technologies is not adequate to guarantee that people make use of the
services provided. Use of such services often requires some technical skill on the part of
users, especially in relation to the use of computers (Mpinganjira, 2012). Mpinganjira (2012)
further argued that computer self-efficacy is one of the prerequisites necessary for one to
make use of e-services. People who are computer self-efficant have among other things a
good understanding of the three stages of data processing, namely, input, processing and
output; feel confident making selections from on-screen menus, as well as making use of
help menus or user guides when necessary (Mpinganjira, 2012). These skills are often
lacking among people who are less educated (Torkzadeh, Chang & Demirhan, 2006). Dada
(2006) identified the high illiteracy rate in Africa as one of the impediments to adoption of e-
governance services and closely related to literacy rates is the ability to read and write in
English. Dada (2006) further expressed the opinion that the content of e-government
services is usually available in English, so does not cater for the African people who can
read and write in their mother tongue. Language thus becomes another barrier to accessing
such services (Mpinganjira, 2012). These arguments will be explored further in trying to
address the research question one for this study.
2.8.1 Benefits and challenges of e-governance
In order to understand the uptake and usage of ICT as part of e-governance initiative, it is of
paramount important to have an understanding of potential benefits and challenges brought
by e-governance. Table 2-8 shows the benefits and challenges of e-governance and e-
government.
The potential benefits and challenges identified in Table 2-8 were used to determine if those
benefits and challenges identified fifteen years ago are the same as the ones collected
through questionnaires and interviews of this study.

41
Table 2-8: Potential benefits and challenges of e-governance and e-government
Benefits Associated benefits Challenges Associated challenges
Efficiency and modernisation of government
Reduced costs Re-engineering processes
Initial costs
Increased speed Staff re-skilling
Greater co-ordination Possible re-location
Reduced duplication Access
Ensuring equality of access
Customer focus
Services delivered where and when needed
Acquiring material and knowledge resources
Resource and time savings for customers
Providing alternative (‘traditional’)
Greater security/reduced abuse of the system
Information checked against multiple data
Providing alternative (‘traditional’)
delivery channels
Complete control of data by service user
Confidence in e-governance
Assuring users of privacy and security
Putting appropriate safety protocols in place
Source: Timonen, O’Donnell and Humphreys (2003).
2.8.2 Mobile cellular technology, social media and inclusive multichannel services
There is increasing expectation for easier access to more public information and public
services from anywhere, anytime through multiple channels or citizen touch-points (United
Nations, 2014). The United Nations Survey (United Nations, 2014) showed that digital
channels, with both their diversity and spread, are being increasingly adopted by almost all
countries, while counter (face-to-face service) and telephone (voice) services, have
continued to serve as fundamental channels. In a number of countries (e.g. Canada and
Australia) the problem of ‘e-exclusion’ has been tackled by combining e-government with
other, more traditional channels of service delivery. In practice, this means that services are
accessible electronically for those who want to use e-government services, but also over the
phone, or in person, for those who are not comfortable with or cannot use e-government
services (Timonen, et al., 2003).
Timonen, et al. (2003) further explained that from the service users’ point of view, it certainly
makes sense to break the organisational boundaries at the front end so that the service
42
delivery interfaces, whether electronic or conventional, increasingly resemble the one-stop
shop model. In 2014, all 193 United Nations Member States have some form of online
presence, as compared to 18 countries with no online presence in 2003 and three countries
in 2012 (United Nations, 2014). The United Nations (2014) explained that although the use
of email increased only slightly between 2012 and 2014 to just over two-thirds of countries, it
is likely to continue to grow in the future, especially for notification and information provision.
Similar uses are seen for SMS via mobile devices, although still more than 80 per cent of
countries have not yet exploited this potential mass channel which is only a slight advance
from 2012 (United Nations, 2014). As far as the use of mobile phones themselves are
concerned, there are today over 1.5 billion smart phones in use globally, and this is growing
exponentially (United Nations, 2014). The above discussion therefore implies that the use of
e-governance by citizens will increase through the use of mobile technology.
The United Nations Survey (United Nations, 2014) highlighted that between 2012 and 2014,
the number of countries offering mobile apps and mobile portals doubled to almost 50
countries, where they are often used directly to support poverty eradication, gender equality
and social inclusion, as well as promote economic development, environmental protection
and disaster management. The use of social media by governments is also increasing fast
with the number more than tripling from 2010 to 2012 and with another 50 per cent rise in
2014, so that today 118 countries use it for e-consultation and 70 for e-government generally
(United Nations, 2014). The United Nations Survey (United Nations, 2014) expressed that
both social media and mobile channels typically do not require high investment costs as they
ride on consumerisation and non-governmental platforms, but they often need a business
transformation and strong commitment in the public administration to maximise benefits. The
penetration of social media through mobile technology in South Africa can improve service
delivery to its citizens. This research therefore established if these mobile technologies are
being used to access services offered by the local authorities.
South Africa has witnessed tremendous growth in mobile phone penetration over the past
few years (Lesame, 2014). South Africa has five mobile phone operators: Vodacom, Mobile
Telephone Networks (MTN), Cell C, Virgin Mobile, and 8ta (or Heita). As in other African
countries, mobile phone penetration has surged to greater levels. A South African
Communications Minister called the growth “a mobile miracle” (Pule, 2010). Pule (2010) also
declared that mobile cellular subscriptions in South Africa were over 50 million in 2010
(South African e-skills Institute, 2012). Around 10 million phones are sold annually in South
Africa, according to Goldstuck (2012), and that smart phones accounted for five (5) million
43
by 2013. Furthermore, an internet report, by (World Wide Worx, 2012) revealed that cellular
phone banking services increased by 37 per cent, and that South Africans in urban and rural
areas aged 16 and above use mobile phone banking services for personal and business
use. The four biggest mobile phone markets in Africa are Nigeria, South Africa, Kenya, and
Ghana (South African e-skills Institute, 2012).The mushrooming of mobile phone operators
therefore make it easy for citizens to make use and access online services being offered by
local authorities.
2.9 E-governance initiatives in offering quality online services
E-service provides customers with a different experience with the interactive flow of
information. Much of research work in e-service quality takes a combination of traditional
service quality dimensions and web interface quality dimensions as its point of departure
(Field, Heim & Sinha, 2004). Field, et al. (2004) argued that e-service can play a critical role
in improving the services quality delivered to its customers as it can achieve survival,
increase satisfaction and trust and then generate the competitive success for organizations.
Dabholkar (1996) conducted research work on dimensions of e-service quality focusing on
web site design. Seven dimensions of e-service quality can be illustrated as the basic
parameters in the judgment of e-service quality, including website design, reliability, and
delivery, ease of use, enjoyment and control (Dabholkar, 1996).
Cox and Dale (2001) laid down six dimensions of online retailing service quality with the
comparison of the traditional dimensions of service quality such as website appearance,
communication, accessibility, credibility, understanding and availability. Customers reach
satisfaction decision by comparing the performance a product or service with their prior
expectations and that if performance exceeds the expectation positive disconfirmation
occurs and increases in satisfaction can be expected to take place (Yang, 2001). Saha and
Zhoa (2005) stated that providing a good service quality is a major issue for all business.
Online quality service is a key issue to maintain customer satisfaction and customer
satisfaction is collective outcome of perception, evaluation and psychological relations to the
consumption experience with a product or service (Kalsi, et al., 2009). Kalsi, et al.(2009)
have acknowledged that e-government initiatives have a direct impact on the citizens and in
which the citizens derive benefits through direct transactions with the governmental services.
Al-Tarawneh (2012) in his study on e-service quality and customer perception, provided that
responsiveness, ease of use, personalization, security; and website design have influence
on customer’s perception of e- service quality. Quality of online is therefore important in this
44
study as it determined the uptake and usage of those services by citizens. The above
discussion therefore assists in answering the research questions 1 and 2 in Chapter 1.
2.10 Service delivery for municipalities in South Africa
Municipal Systems Act of (2000), Section 32 (2) of the Municipal Systems Act requires
municipalities to have Integrated Development Plan (IDP), which is a process through which
municipalities prepare a strategic development plan which extends over a five-year period.
Municipal Systems Act of (2000), Section 32 (2) of the Municipal Systems Act explained
further that as the IDP is a legislative requirement it has a legal status and supersedes all
other plans that guide development at local government level. This study however focused
on the service delivery aspect as it is the one which informs the aspects taken into account
in the development of e-governance framework for improving service delivery in local
authorities in South Africa.
2.10.1 Generic services offered by municipalities in South Africa
Table 2-9 illustrates the general services offered by municipalities in South Africa. However,
some of these services are offered by municipalities through their websites such as
announcements of water service interruptions and electricity load shedding time table. E-
Services is an initiative by the City of Johannesburg which is (also applicable to other
Metropolitans and District local municipalities under the study) to provide online access to a
range of services for both individuals and business (City Of Johannesburg, 2014). Specific
services offered include:
Log a query or problem;
Online statements;
Once registered, customers can update their billing address online;
Submit meter readings online;
Track the progress of building plans submitted;
Fill in the online valuations form to assist the City in evaluating properties correctly; and
Access GIS mapping services.
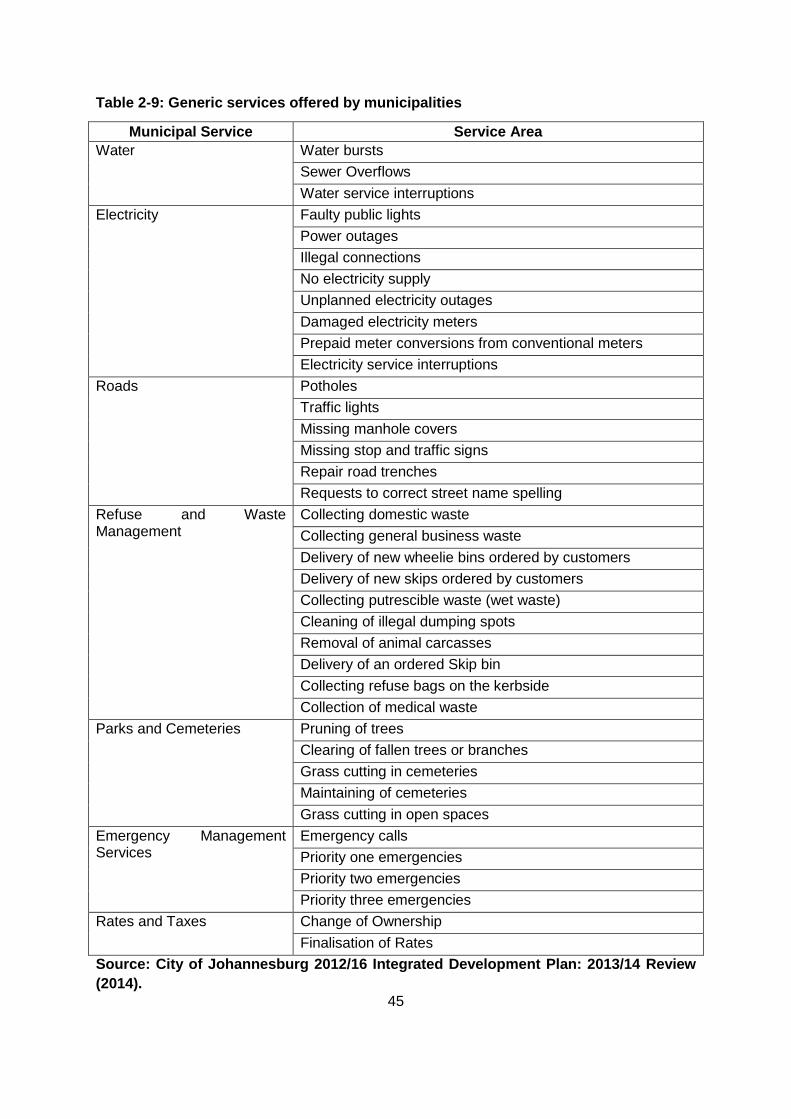
45
Table 2-9: Generic services offered by municipalities
Municipal Service Service Area Water Water bursts
Sewer Overflows
Water service interruptions
Electricity Faulty public lights
Power outages
Illegal connections
No electricity supply
Unplanned electricity outages
Damaged electricity meters
Prepaid meter conversions from conventional meters
Electricity service interruptions
Roads Potholes
Traffic lights
Missing manhole covers
Missing stop and traffic signs
Repair road trenches
Requests to correct street name spelling
Refuse and Waste Management
Collecting domestic waste
Collecting general business waste
Delivery of new wheelie bins ordered by customers
Delivery of new skips ordered by customers
Collecting putrescible waste (wet waste)
Cleaning of illegal dumping spots
Removal of animal carcasses
Delivery of an ordered Skip bin
Collecting refuse bags on the kerbside
Collection of medical waste
Parks and Cemeteries Pruning of trees
Clearing of fallen trees or branches
Grass cutting in cemeteries
Maintaining of cemeteries
Grass cutting in open spaces
Emergency Management Services
Emergency calls
Priority one emergencies
Priority two emergencies
Priority three emergencies
Rates and Taxes Change of Ownership
Finalisation of Rates
Source: City of Johannesburg 2012/16 Integrated Development Plan: 2013/14 Review
(2014).
46
2.11 Efforts towards smart cities by metropolitans in Gauteng Province
SALGA (2015) indicated that a number of factors were identified that help determine a
municipality’s readiness to create a Smart City. These include political will, social capital,
digital capability, physical infrastructure, a focus on outcomes, and meaningful public-private
partnerships (SALGA, 2015).
City of Johannesburg
City Of Johannesburg (2014) explained that a city can be defined as ‘smart’ when
investments in human and social capital, and traditional (transport) and modern (ICT)
communication infrastructure, fuel sustainable economic development and a high quality of
life, co-exists with the management of natural resources, through participatory action and
engagement. City Of Johannesburg (2014) emphased that the objective of this priority is for
Johannesburg to become a smart city, by providing services that are easy to access and
use, while being efficient and responsive in an open and transparent way; and ensuring
sustainability financially, environmentally and through quality service delivery.
The City of Johannesburg Metropolitan Municipality has embarked on a journey to transform
Johannesburg into a Smart City in terms of economy, environment, utilities, transportation,
education, health, planning, governance and people (SALGA, 2015). SALGA (2015)
indicated that the objective is to provide efficient services that are easy to access and use
(using technology as an enabler), being responsive in an open and transparent way, and
ensuring financial, environmental and quality service-delivery sustainability. SALGA (2015)
explained further that the City’s approach is holistic: it is cross-domain and multidisciplinary;
it is citizen-and people-oriented (through active engagement); it leverages local
infrastructure, connectivity and resources; and it provides an interoperable, common
underlying smart platform.
It is envisioned that wide-ranging broadband capacity will be the backbone of the new Smart
City. This has been laid down and is facilitating service-based innovations the City has
started to implement (SALGA, 2015), such as:
Affordable broadband connectivity among City-owned facilities, and access in the City
through the creation of wireless hotspots at all Rea Vaya BRT stations and in the buses,
as well as selected open spaces;
An Intelligent Operation Centre aimed at providing an integrated view of the city’s
strategic and operational issues through effective information-gathering and processing,
47
and efficient dissemination of intelligent information. This will allow for well-coordinated,
integrated and responsive service delivery, focusing on public safety in the initial phase;
Installing households with smart meters to reduce electricity losses, increase revenue,
and reduce energy consumption;
Smart transport technology aimed at addressing current and envisaged future problems
affecting travellers and freight users with regard to traffic flow, via the Intelligent Traffic
Management System;
Promoting ICT literacy via Public Access to Internet, which is aimed at enhancing and
promoting ICT literacy to all, including disadvantaged communities, via free access to
digital information;
And Universal access: Skills development via ICT Hub IT innovation and SMME
incubation, with a focus on application development in collaboration with the Universities
of Johannesburg and the Witwatersrand.
These benefits therefore can also be enjoyed by other metropolitans and District local
municipalities in South Africa if e-governance is properly implemented.
City of Tshwane
Connectivity and economic growth
City of Tshwane is a society of unequal opportunities on many fronts, often contributing to
the widening of the gap between the rich and the poor (Ramokgopa, 2014). In the current
digital economy, a lack of access to internet connectivity denies the poorest in our society
the requisite opportunities to access basic knowledge to help them change their plight
(Ramokgopa, 2014). This excludes them from participating in the mainstream economy with
disastrous consequences for the country (Ramokgopa, 2014). Ramokgopa (2014) explained
that the City of Tshwane has therefore embarked on various initiatives to alter this
undesirable situation. Ramokgopa (2014) highlighted that City of Tshwane perspective is
that access to connectivity must be viewed as a basic human right, analogous to the
provision of basic services such as water and electricity. Tremendous progress has been
made in closing the digital divide and expanding internet connectivity (Ramokgopa, 2014).
Ramokgopa (2014) expressed that City of Tshwane has made history by becoming the first
metro to roll out free Wi-Fi and indeed the announcement of the provision of this service was
made before the City of New York’s announcement – this is indeed a ground-breaking
achievement for an African city. Ramokgopa (2014) indicated that The City of Tshwane will

48
expand the project and roll out about 600 additional Wi-Fi hotspots throughout Tshwane,
prioritising institutions of learning. This unprecedented intervention will set up Tshwane as
an e-capital of excellence and a driver of country’s education aligned to the creation of a
smart city (Ramokgopa, 2014). Ramokgopa (2014) highlighted that The City has moved
away from manual business processes, which are often tedious and cause unnecessary
delays in rendering services to our people and therefore in this regard, the City of Tshwane
have taken a bold step and implemented an online transacting system, e-Tshwane. Amongst
other advantages, e-Tshwane will make services available online all hours every day and
provide a real-time update of accounts to avoid unnecessary inconvenience from cut-offs in
instances where accounts have not been paid. (Ramokgopa, 2014) indicated that over 30
000 account holders are already using the system that was launched in November 2013.
This is bold step towards the national realisation of e-governance services (Ramokgopa,
2014). This study therefore unpacked the uptake and usage of ICT tools by citizens of
Tshwane as part of e-governance by involving participants through questionnaires.
City of Ekurhuleni
SALGA (2015) explained that The City of Ekurhuleni is referred to as ‘Africa’s workshop’
because it has the largest concentration of companies producing goods and commodities on
the continent. Goods need to be moved, and this is supported by Ekurhuleni’s diverse
network of roads and rail lines (SALGA, 2015). SALGA (2015) highlighted that to keep pace
with the demands of these bulk customers, the metro has put in place a cutting edge
electronic metering-in-place system that allows businesses to track their utilisation
throughout the month. This allows them to manage consumption and keep within budget and
this will soon be reinforced by a range of new smart meters for both electricity and water,
which will improve the efficiency of metering and billing (SALGA, 2015). Some features of
the system include remote readings and automated real-time readings and Ekurhuleni has
also taken note of the need to improve its ICT network to make sure that its fibre and
wireless grid is properly connected and maintained. SALGA (2015) indicated that there are
plans to introduce an ICT operations centre, which by 2016 will provide the basis for the city
delivering WIFI service not only to its employees, but also to households and businesses.
SALGA (2015) conclude that this will put Ekurhuleni well on the path to being a Smart City
that is able to service both its business and domestic customers in a modern way.
49
2.12 Chapter conclusion
This chapter started by giving an overview of e-governance and e-government. The
concepts encapsulated in e-governance are discussed, namely; e-governance as customer
satisfaction, e-governance as a process and interaction, and e-governance as a tool. The
major pillars of e-governance, which forms the basis of this study, are defined. This is
followed by the discussion of a survey carried out by Holzer, et al. (2014) for Rutgers
2013/14 by giving an overview of global e-governance in large municipalities’ world over.
The rankings determined by the results of the United Nations e-government survey (United
Nations, 2014) on 193 United Nations member states are compared. E-governance and e-
government in African municipalities are discussed, as well as the challenge of the digital
divide in Africa. The uptake and usage of e-governance for improving service delivery is
discussed. Benefits and challenges of e-governance are also highlighted. Mobile cellular
technology, social media and inclusive multichannel service as a way of encouraging
citizens to participate in e-governance is discussed. E-governance initiatives in offering
quality online services are highlighted. Service delivery for municipalities in South Africa is
discussed with reference to the generic services offered by the municipalities in Gauteng
Province. The chapter concludes by discussing the metropolitan efforts towards smart cities
in Gauteng Province. The next chapter is going to discuss the theoretical and conceptual
framework of this study.
50
CHAPTER 3: UNDERPINNINGS OF E-GOVERNANCE AND CONCEPTUAL
FRAMEWORK
3.1 Introduction
This section highlights theories relating to e-governance and how these theories can be
integrated in order to come up with a conceptual framework for e-governance in the South
African context that will improve service delivery in local authorities.
The difference of a theoretical and conceptual framework is discussed in the literature
review. Neuman (2014) explained that a theoretical framework is a very general theoretical
system with assumptions, concepts, and specific social theories. Badenhorst (2012)
described the theoretical framework as a thread which runs through the entire research, from
the beginning until the final conclusion. This is distinguished from a conceptual framework
which is formed by the key concepts used in this research and identifies the relationships
between the key concepts. Conceptual framework therefore provides the basic outline for
analyzing the data and drawing conclusions (Badenhorst, 2012).
Prabhu (2012) indicated that models of digital governance are still evolving in developing
countries. A few generic models have shaped up, which are finding greater recognition and
are being replicated (Prabhu, 2012). Hence, the need for this research to describe a
framework for e-governance, which improves service delivery in local authorities in the South
African context. Prabhu (2012) interpreted that these models are based on the inherent
characteristics of ICT such as enabling equal access to information across the entire digital
network and de-concentration of information across the entire digital network, connecting all
sources of information. Prabhu (2012) explained that hierarchy is inherent in the government
departments hence, equity based information flow may not be always compatible with
government functioning. Therefore, appropriate administrative reforms and some
reengineering may be required before e-governance may be really implemented (Prabhu,
2012).
The process for the review of literature included decisions regarding the inclusion criteria,
the search for relevant research studies, and finally analyzing the identified articles
(Hyvärinen & Beck, 2018). In order to address research questions and objectives of the
study, the literature review on empirical studies was done on debate around e-governance
and e-government, global e-governance and e-government in municipalities, uptake and
usage of e-governance for improved service delivery, e-governance initiatives in offering
51
quality online services, service delivery for municipalities in South Africa. This study also
used the following models in understanding the topic at hand and to come up with e-
governance framework for local authorities for improving service delivery in South Africa:
Interactive-Service Model (Nath, 2005)
Technology Acceptance Model (Davis, 1989)
Broadcasting/Wider Dissemination Model (Nath, 2005)
Synthesized Stage Model (Siau &Long, 2005)
Critical Flow Model (Nath, 2005)
Information System Success Model (DeLone& McLean, 1992)
DOI Model (Rogers, 1995)
Comparative Analysis Model (Nath, 2005)
Mobilisation and Lobby Model (Nath, 2005)
Information Behaviour Model (Wilson, 1999)
The multiple models used in this study take advantage of the strength of each model in order
to come up with e-governance framework for improving service delivery at local authority
level in the South African context. These models however are not going to be discussed in
isolation, but are blended with other theories in order to come up with e-governance
framework that improves service delivery in local authorities in the South African context as
shown in Table 3-1.
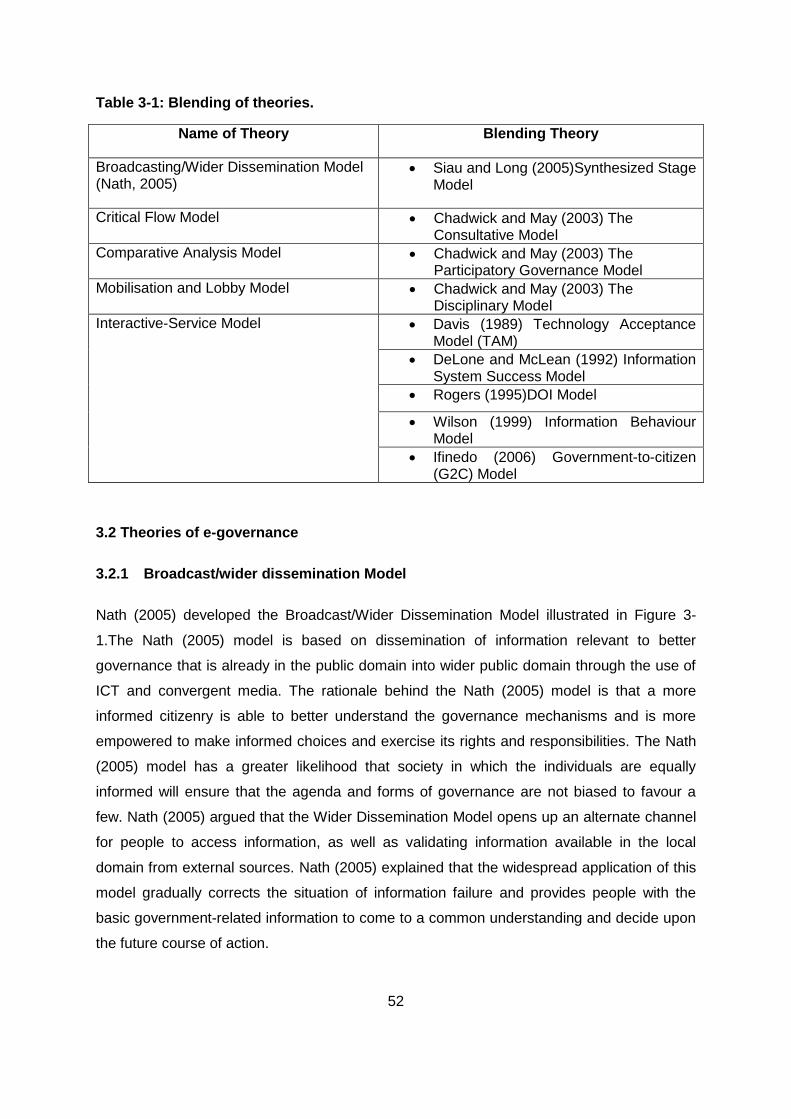
52
Table 3-1: Blending of theories.
Name of Theory Blending Theory
Broadcasting/Wider Dissemination Model (Nath, 2005)
Siau and Long (2005)Synthesized Stage Model
Critical Flow Model Chadwick and May (2003) The Consultative Model
Comparative Analysis Model Chadwick and May (2003) The Participatory Governance Model
Mobilisation and Lobby Model Chadwick and May (2003) The Disciplinary Model
Interactive-Service Model Davis (1989) Technology Acceptance Model (TAM)
DeLone and McLean (1992) Information System Success Model
Rogers (1995)DOI Model
Wilson (1999) Information Behaviour Model
Ifinedo (2006) Government-to-citizen (G2C) Model
3.2 Theories of e-governance
3.2.1 Broadcast/wider dissemination Model
Nath (2005) developed the Broadcast/Wider Dissemination Model illustrated in Figure 3-
1.The Nath (2005) model is based on dissemination of information relevant to better
governance that is already in the public domain into wider public domain through the use of
ICT and convergent media. The rationale behind the Nath (2005) model is that a more
informed citizenry is able to better understand the governance mechanisms and is more
empowered to make informed choices and exercise its rights and responsibilities. The Nath
(2005) model has a greater likelihood that society in which the individuals are equally
informed will ensure that the agenda and forms of governance are not biased to favour a
few. Nath (2005) argued that the Wider Dissemination Model opens up an alternate channel
for people to access information, as well as validating information available in the local
domain from external sources. Nath (2005) explained that the widespread application of this
model gradually corrects the situation of information failure and provides people with the
basic government-related information to come to a common understanding and decide upon
the future course of action.
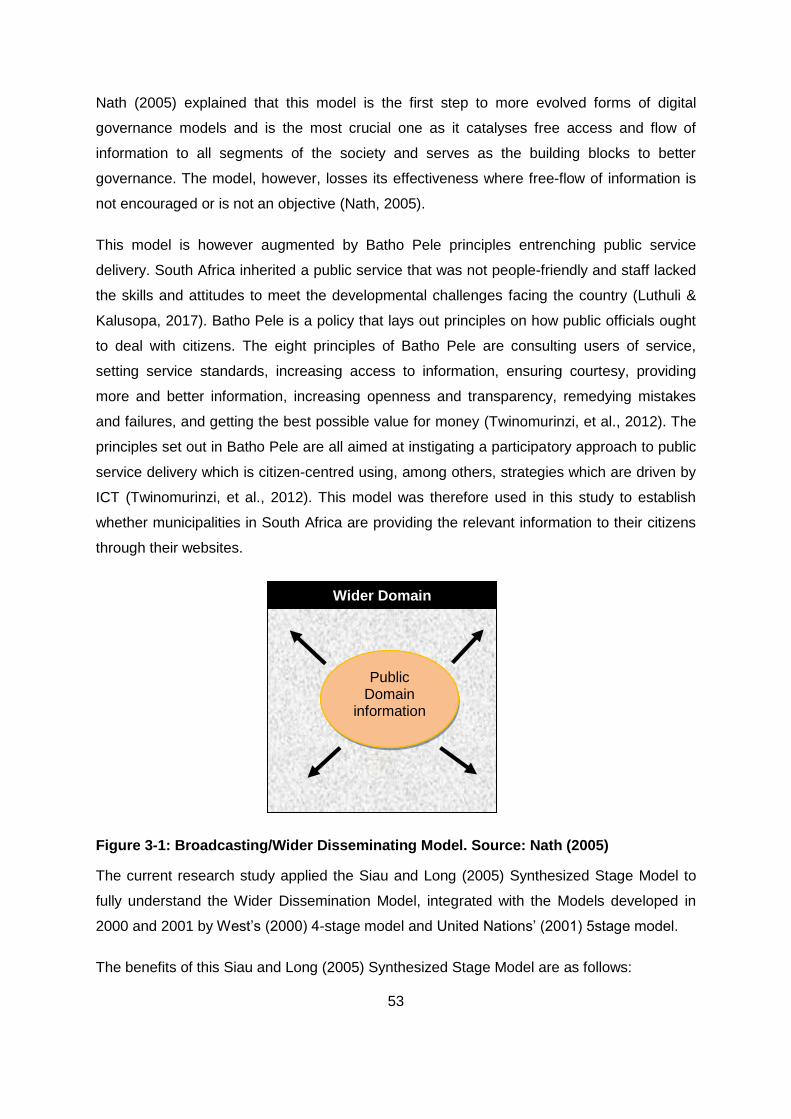
53
Nath (2005) explained that this model is the first step to more evolved forms of digital
governance models and is the most crucial one as it catalyses free access and flow of
information to all segments of the society and serves as the building blocks to better
governance. The model, however, losses its effectiveness where free-flow of information is
not encouraged or is not an objective (Nath, 2005).
This model is however augmented by Batho Pele principles entrenching public service
delivery. South Africa inherited a public service that was not people-friendly and staff lacked
the skills and attitudes to meet the developmental challenges facing the country (Luthuli &
Kalusopa, 2017). Batho Pele is a policy that lays out principles on how public officials ought
to deal with citizens. The eight principles of Batho Pele are consulting users of service,
setting service standards, increasing access to information, ensuring courtesy, providing
more and better information, increasing openness and transparency, remedying mistakes
and failures, and getting the best possible value for money (Twinomurinzi, et al., 2012). The
principles set out in Batho Pele are all aimed at instigating a participatory approach to public
service delivery which is citizen-centred using, among others, strategies which are driven by
ICT (Twinomurinzi, et al., 2012). This model was therefore used in this study to establish
whether municipalities in South Africa are providing the relevant information to their citizens
through their websites.
Figure 3-1: Broadcasting/Wider Disseminating Model. Source: Nath (2005)
The current research study applied the Siau and Long (2005) Synthesized Stage Model to
fully understand the Wider Dissemination Model, integrated with the Models developed in
2000 and 2001 by West’s (2000) 4-stage model and United Nations’ (2001) 5stage model.
The benefits of this Siau and Long (2005) Synthesized Stage Model are as follows:
Public Domain
information
Wider Domain
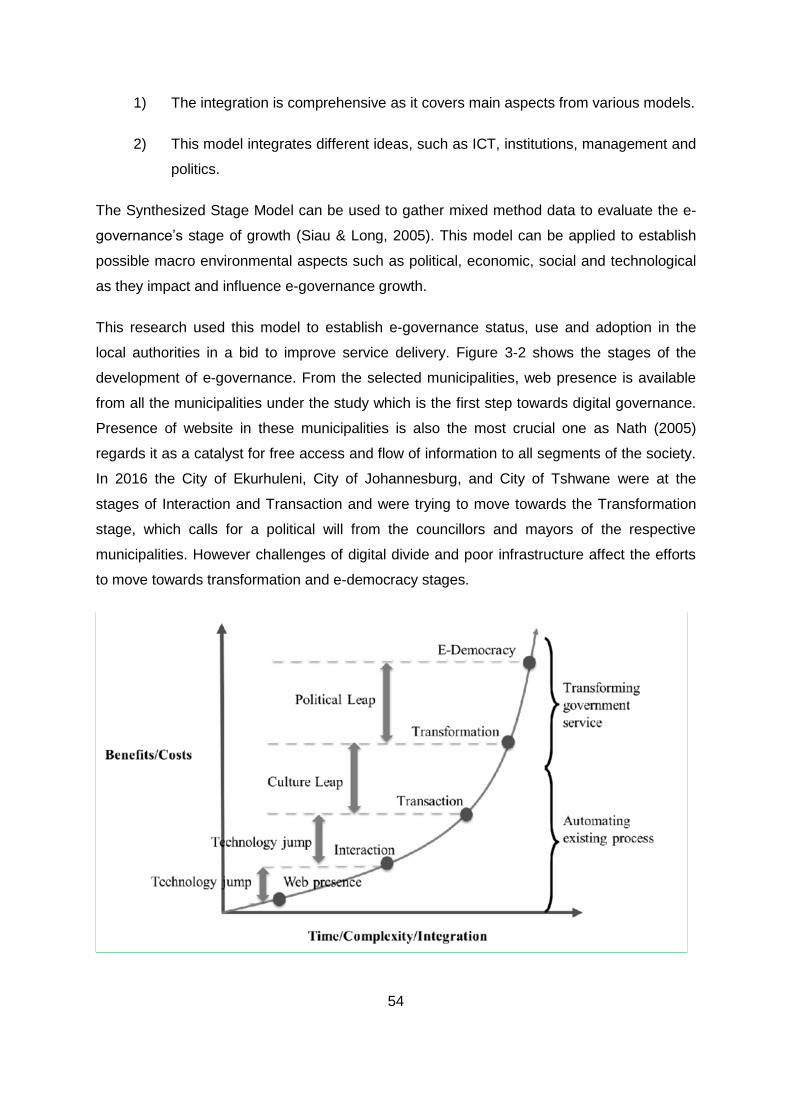
54
1) The integration is comprehensive as it covers main aspects from various models.
2) This model integrates different ideas, such as ICT, institutions, management and
politics.
The Synthesized Stage Model can be used to gather mixed method data to evaluate the e-
governance’s stage of growth (Siau & Long, 2005). This model can be applied to establish
possible macro environmental aspects such as political, economic, social and technological
as they impact and influence e-governance growth.
This research used this model to establish e-governance status, use and adoption in the
local authorities in a bid to improve service delivery. Figure 3-2 shows the stages of the
development of e-governance. From the selected municipalities, web presence is available
from all the municipalities under the study which is the first step towards digital governance.
Presence of website in these municipalities is also the most crucial one as Nath (2005)
regards it as a catalyst for free access and flow of information to all segments of the society.
In 2016 the City of Ekurhuleni, City of Johannesburg, and City of Tshwane were at the
stages of Interaction and Transaction and were trying to move towards the Transformation
stage, which calls for a political will from the councillors and mayors of the respective
municipalities. However challenges of digital divide and poor infrastructure affect the efforts
to move towards transformation and e-democracy stages.
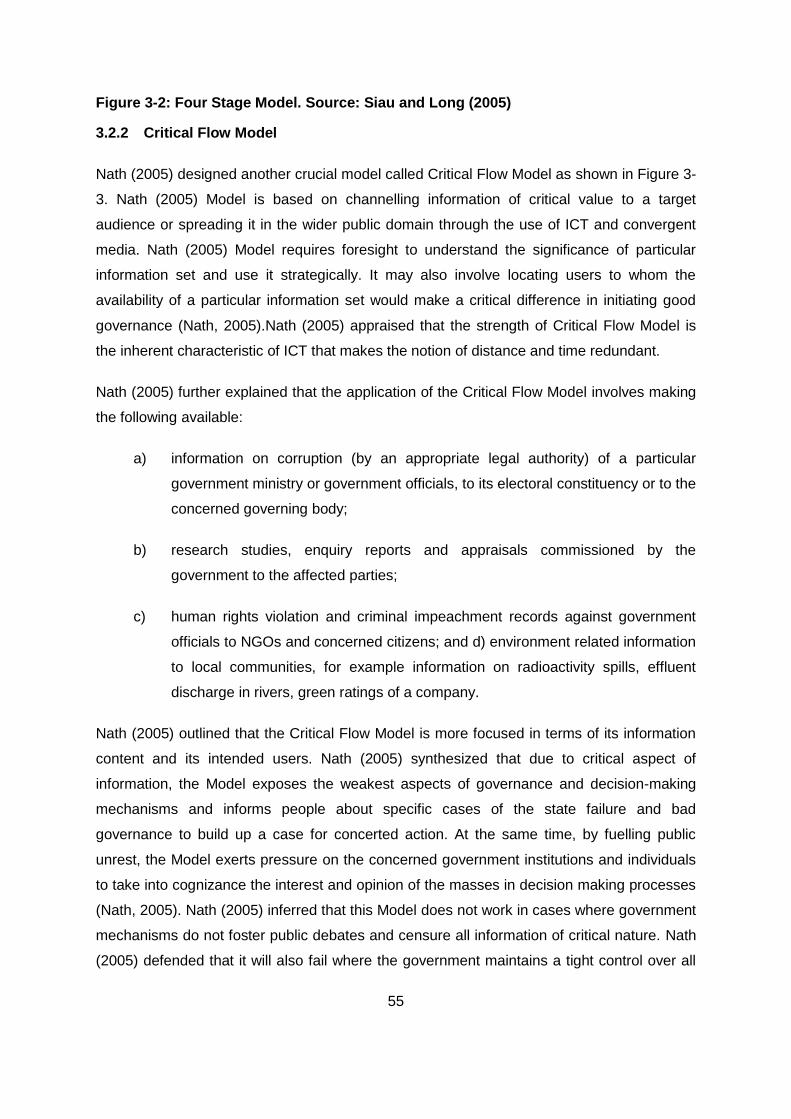
55
Figure 3-2: Four Stage Model. Source: Siau and Long (2005)
3.2.2 Critical Flow Model
Nath (2005) designed another crucial model called Critical Flow Model as shown in Figure 3-
3. Nath (2005) Model is based on channelling information of critical value to a target
audience or spreading it in the wider public domain through the use of ICT and convergent
media. Nath (2005) Model requires foresight to understand the significance of particular
information set and use it strategically. It may also involve locating users to whom the
availability of a particular information set would make a critical difference in initiating good
governance (Nath, 2005).Nath (2005) appraised that the strength of Critical Flow Model is
the inherent characteristic of ICT that makes the notion of distance and time redundant.
Nath (2005) further explained that the application of the Critical Flow Model involves making
the following available:
a) information on corruption (by an appropriate legal authority) of a particular
government ministry or government officials, to its electoral constituency or to the
concerned governing body;
b) research studies, enquiry reports and appraisals commissioned by the
government to the affected parties;
c) human rights violation and criminal impeachment records against government
officials to NGOs and concerned citizens; and d) environment related information
to local communities, for example information on radioactivity spills, effluent
discharge in rivers, green ratings of a company.
Nath (2005) outlined that the Critical Flow Model is more focused in terms of its information
content and its intended users. Nath (2005) synthesized that due to critical aspect of
information, the Model exposes the weakest aspects of governance and decision-making
mechanisms and informs people about specific cases of the state failure and bad
governance to build up a case for concerted action. At the same time, by fuelling public
unrest, the Model exerts pressure on the concerned government institutions and individuals
to take into cognizance the interest and opinion of the masses in decision making processes
(Nath, 2005). Nath (2005) inferred that this Model does not work in cases where government
mechanisms do not foster public debates and censure all information of critical nature. Nath
(2005) defended that it will also fail where the government maintains a tight control over all
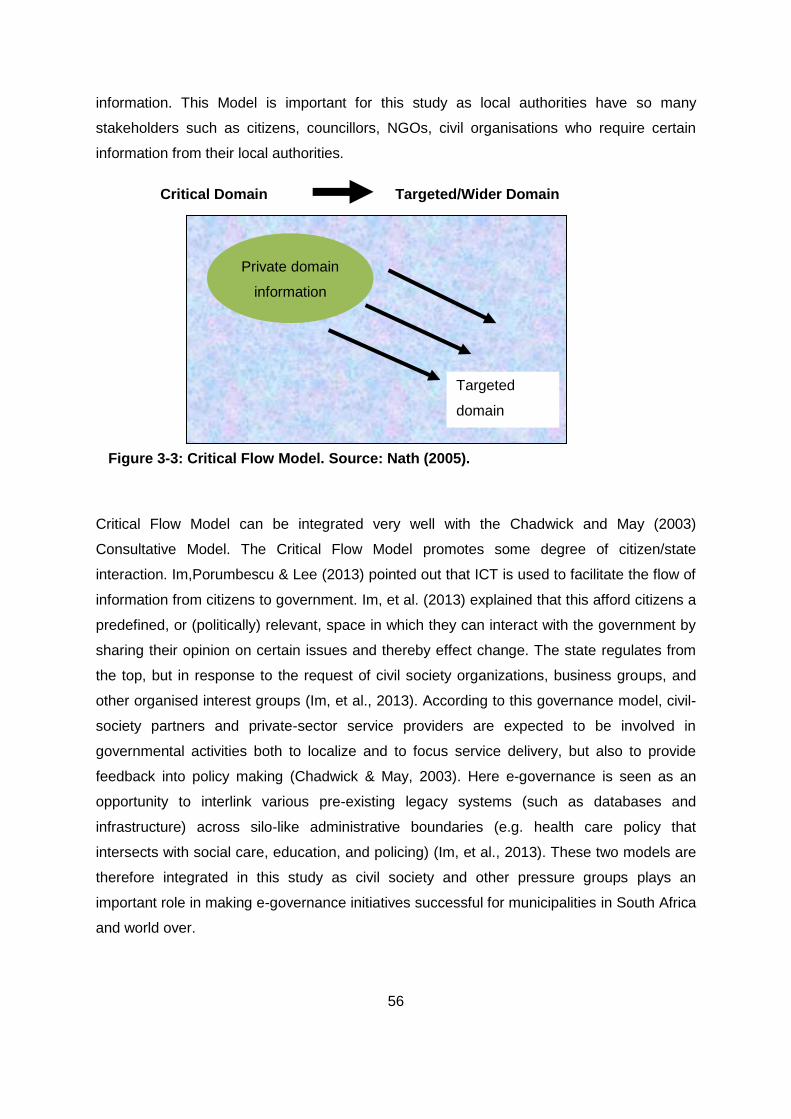
56
information. This Model is important for this study as local authorities have so many
stakeholders such as citizens, councillors, NGOs, civil organisations who require certain
information from their local authorities.
Critical Domain Targeted/Wider Domain
Critical Flow Model can be integrated very well with the Chadwick and May (2003)
Consultative Model. The Critical Flow Model promotes some degree of citizen/state
interaction. Im,Porumbescu & Lee (2013) pointed out that ICT is used to facilitate the flow of
information from citizens to government. Im, et al. (2013) explained that this afford citizens a
predefined, or (politically) relevant, space in which they can interact with the government by
sharing their opinion on certain issues and thereby effect change. The state regulates from
the top, but in response to the request of civil society organizations, business groups, and
other organised interest groups (Im, et al., 2013). According to this governance model, civil-
society partners and private-sector service providers are expected to be involved in
governmental activities both to localize and to focus service delivery, but also to provide
feedback into policy making (Chadwick & May, 2003). Here e-governance is seen as an
opportunity to interlink various pre-existing legacy systems (such as databases and
infrastructure) across silo-like administrative boundaries (e.g. health care policy that
intersects with social care, education, and policing) (Im, et al., 2013). These two models are
therefore integrated in this study as civil society and other pressure groups plays an
important role in making e-governance initiatives successful for municipalities in South Africa
and world over.
Private domain
information
Targeted
domain
Figure 3-3: Critical Flow Model. Source: Nath (2005).
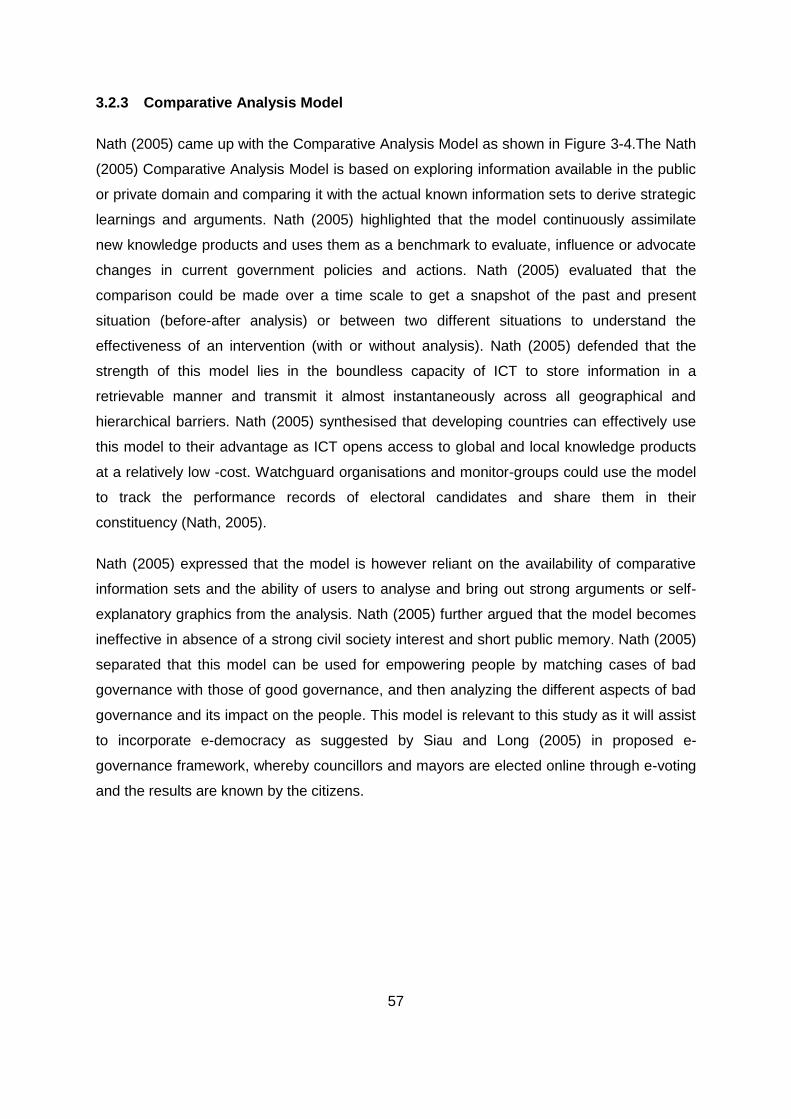
57
3.2.3 Comparative Analysis Model
Nath (2005) came up with the Comparative Analysis Model as shown in Figure 3-4.The Nath
(2005) Comparative Analysis Model is based on exploring information available in the public
or private domain and comparing it with the actual known information sets to derive strategic
learnings and arguments. Nath (2005) highlighted that the model continuously assimilate
new knowledge products and uses them as a benchmark to evaluate, influence or advocate
changes in current government policies and actions. Nath (2005) evaluated that the
comparison could be made over a time scale to get a snapshot of the past and present
situation (before-after analysis) or between two different situations to understand the
effectiveness of an intervention (with or without analysis). Nath (2005) defended that the
strength of this model lies in the boundless capacity of ICT to store information in a
retrievable manner and transmit it almost instantaneously across all geographical and
hierarchical barriers. Nath (2005) synthesised that developing countries can effectively use
this model to their advantage as ICT opens access to global and local knowledge products
at a relatively low -cost. Watchguard organisations and monitor-groups could use the model
to track the performance records of electoral candidates and share them in their
constituency (Nath, 2005).
Nath (2005) expressed that the model is however reliant on the availability of comparative
information sets and the ability of users to analyse and bring out strong arguments or self-
explanatory graphics from the analysis. Nath (2005) further argued that the model becomes
ineffective in absence of a strong civil society interest and short public memory. Nath (2005)
separated that this model can be used for empowering people by matching cases of bad
governance with those of good governance, and then analyzing the different aspects of bad
governance and its impact on the people. This model is relevant to this study as it will assist
to incorporate e-democracy as suggested by Siau and Long (2005) in proposed e-
governance framework, whereby councillors and mayors are elected online through e-voting
and the results are known by the citizens.
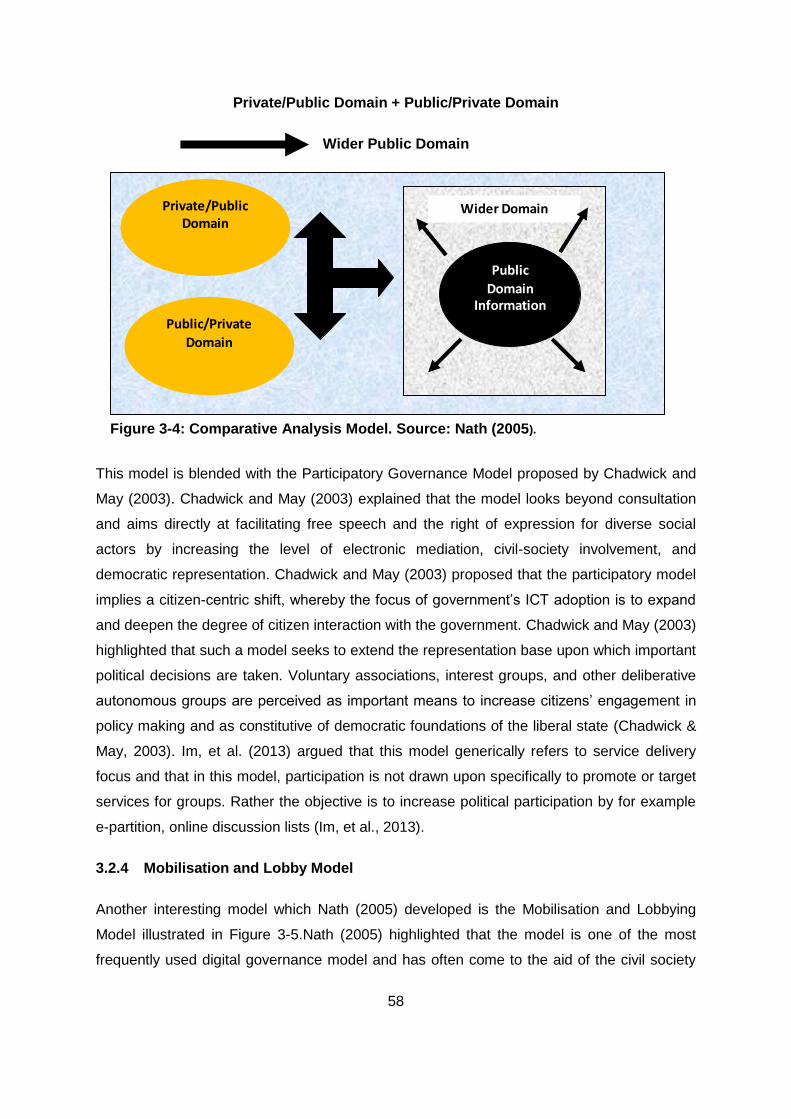
58
Private/Public Domain + Public/Private Domain
Wider Public Domain
This model is blended with the Participatory Governance Model proposed by Chadwick and
May (2003). Chadwick and May (2003) explained that the model looks beyond consultation
and aims directly at facilitating free speech and the right of expression for diverse social
actors by increasing the level of electronic mediation, civil-society involvement, and
democratic representation. Chadwick and May (2003) proposed that the participatory model
implies a citizen-centric shift, whereby the focus of government’s ICT adoption is to expand
and deepen the degree of citizen interaction with the government. Chadwick and May (2003)
highlighted that such a model seeks to extend the representation base upon which important
political decisions are taken. Voluntary associations, interest groups, and other deliberative
autonomous groups are perceived as important means to increase citizens’ engagement in
policy making and as constitutive of democratic foundations of the liberal state (Chadwick &
May, 2003). Im, et al. (2013) argued that this model generically refers to service delivery
focus and that in this model, participation is not drawn upon specifically to promote or target
services for groups. Rather the objective is to increase political participation by for example
e-partition, online discussion lists (Im, et al., 2013).
3.2.4 Mobilisation and Lobby Model
Another interesting model which Nath (2005) developed is the Mobilisation and Lobbying
Model illustrated in Figure 3-5.Nath (2005) highlighted that the model is one of the most
frequently used digital governance model and has often come to the aid of the civil society
Private/Public Domain
Public/Private
Domain
Public
Domain Information
Wider Domain
Figure 3-4: Comparative Analysis Model. Source: Nath (2005).
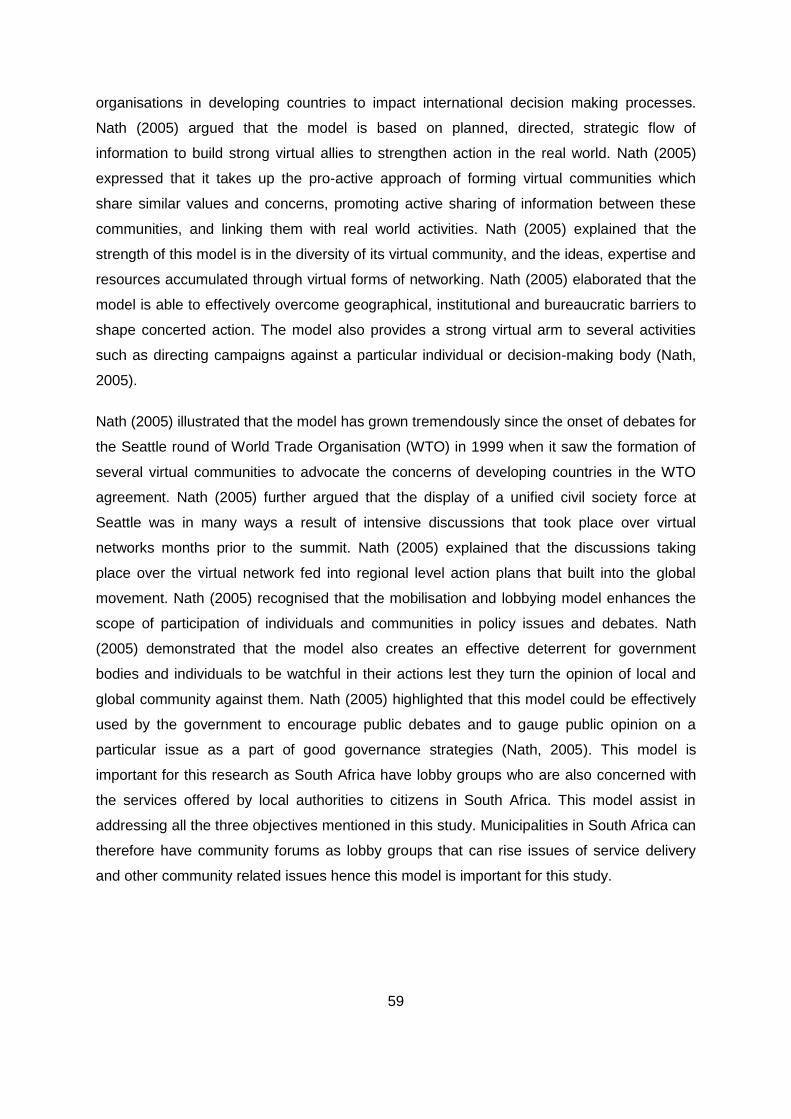
59
organisations in developing countries to impact international decision making processes.
Nath (2005) argued that the model is based on planned, directed, strategic flow of
information to build strong virtual allies to strengthen action in the real world. Nath (2005)
expressed that it takes up the pro-active approach of forming virtual communities which
share similar values and concerns, promoting active sharing of information between these
communities, and linking them with real world activities. Nath (2005) explained that the
strength of this model is in the diversity of its virtual community, and the ideas, expertise and
resources accumulated through virtual forms of networking. Nath (2005) elaborated that the
model is able to effectively overcome geographical, institutional and bureaucratic barriers to
shape concerted action. The model also provides a strong virtual arm to several activities
such as directing campaigns against a particular individual or decision-making body (Nath,
2005).
Nath (2005) illustrated that the model has grown tremendously since the onset of debates for
the Seattle round of World Trade Organisation (WTO) in 1999 when it saw the formation of
several virtual communities to advocate the concerns of developing countries in the WTO
agreement. Nath (2005) further argued that the display of a unified civil society force at
Seattle was in many ways a result of intensive discussions that took place over virtual
networks months prior to the summit. Nath (2005) explained that the discussions taking
place over the virtual network fed into regional level action plans that built into the global
movement. Nath (2005) recognised that the mobilisation and lobbying model enhances the
scope of participation of individuals and communities in policy issues and debates. Nath
(2005) demonstrated that the model also creates an effective deterrent for government
bodies and individuals to be watchful in their actions lest they turn the opinion of local and
global community against them. Nath (2005) highlighted that this model could be effectively
used by the government to encourage public debates and to gauge public opinion on a
particular issue as a part of good governance strategies (Nath, 2005). This model is
important for this research as South Africa have lobby groups who are also concerned with
the services offered by local authorities to citizens in South Africa. This model assist in
addressing all the three objectives mentioned in this study. Municipalities in South Africa can
therefore have community forums as lobby groups that can rise issues of service delivery
and other community related issues hence this model is important for this study.
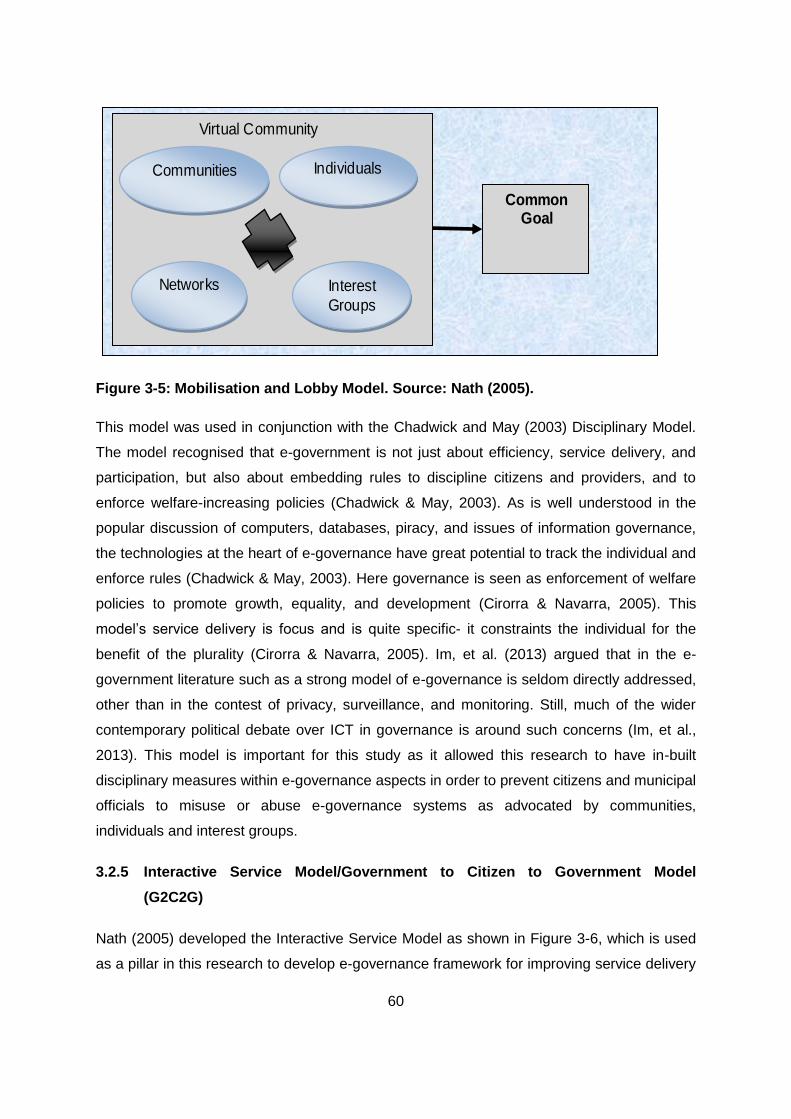
60
Figure 3-5: Mobilisation and Lobby Model. Source: Nath (2005).
This model was used in conjunction with the Chadwick and May (2003) Disciplinary Model.
The model recognised that e-government is not just about efficiency, service delivery, and
participation, but also about embedding rules to discipline citizens and providers, and to
enforce welfare-increasing policies (Chadwick & May, 2003). As is well understood in the
popular discussion of computers, databases, piracy, and issues of information governance,
the technologies at the heart of e-governance have great potential to track the individual and
enforce rules (Chadwick & May, 2003). Here governance is seen as enforcement of welfare
policies to promote growth, equality, and development (Cirorra & Navarra, 2005). This
model’s service delivery is focus and is quite specific- it constraints the individual for the
benefit of the plurality (Cirorra & Navarra, 2005). Im, et al. (2013) argued that in the e-
government literature such as a strong model of e-governance is seldom directly addressed,
other than in the contest of privacy, surveillance, and monitoring. Still, much of the wider
contemporary political debate over ICT in governance is around such concerns (Im, et al.,
2013). This model is important for this study as it allowed this research to have in-built
disciplinary measures within e-governance aspects in order to prevent citizens and municipal
officials to misuse or abuse e-governance systems as advocated by communities,
individuals and interest groups.
3.2.5 Interactive Service Model/Government to Citizen to Government Model
(G2C2G)
Nath (2005) developed the Interactive Service Model as shown in Figure 3-6, which is used
as a pillar in this research to develop e-governance framework for improving service delivery
Virtual Community
Communities Individuals
Interest
Groups
Networks
Common Goal
61
for local authorities in South Africa. Nath (2005) highlighted that Interactive-Service Model in
many ways is a consolidation of the earlier digital governance models and opens up
avenues for direct participation of individuals in the governance processes. ICT, as
mentioned earlier, have the potential to include every individual within a knowledge network
and enable interactive communication channels among them (Nath, 2005). This model fully
captures the potential of ICT and leveraged it for greater participation, efficiency and
transparency in functioning of the government as well as savings in time and costs relating
to decision-making (Nath, 2005).
The Government-to-Citizen (G2C) Model was introduced by Ifinedo (2006) as one of his four
types of broad citizen-centered groups. Interface is formed between the government and
citizens, which assists the citizens to benefit from efficient delivery of large range of public
services (Akula, et al., 2014). Akula, et al. (2014) indicated that this expands the availability
and accessibility of public services on the one hand and improves the quality of services on
the other. Ifinedo (2006) highlighted that this model refers to the service delivery that
involves the building of web pages for one-stop services for citizens. Rani (2007) reiterated
that in the G2C model the government interacts with the citizens to provide information and
various services. Rani (2007) aurged that information about government services is
published on the websites and citizens have access to information regarding procedures for
getting the job (education, e-medicine, e-registration, and e-transport) and that citizens can
submit applications and make online payments.
Rani (2007) indicated the need to have a two way interaction and suggested the model of
Citizens-to-Government (C2G), whereby citizens provide information regarding
themselves—their preferences, suggestions and complaints to the government through e-
governance (E-democracy, E-voting) (Rani, 2007).Rani (2007) indicated that citizens can
also launch complaints and redress their grievances. This is an important model which
addresses the research questions in Chapter one and is the starting point in evaluating the
usage and uptake of ICT as part of e-governance in improving service delivery in local
authorities. This model has been blended with the Interactive Service Model as it has the
characteristics of Government to Citizens to Government G2C2G.
Nath (2005) argued that the Interactive Service Model makes possible the various services
offered by the government to be directly accessible to the citizens. Nath (2005) further
expressed that it creates an interactive Government to Consumer to Government (G2C2G)
channel in various functions such as election of government officials (e-ballots); filing of tax
returns, procurement of government services, sharing of concerns and providing expertise;
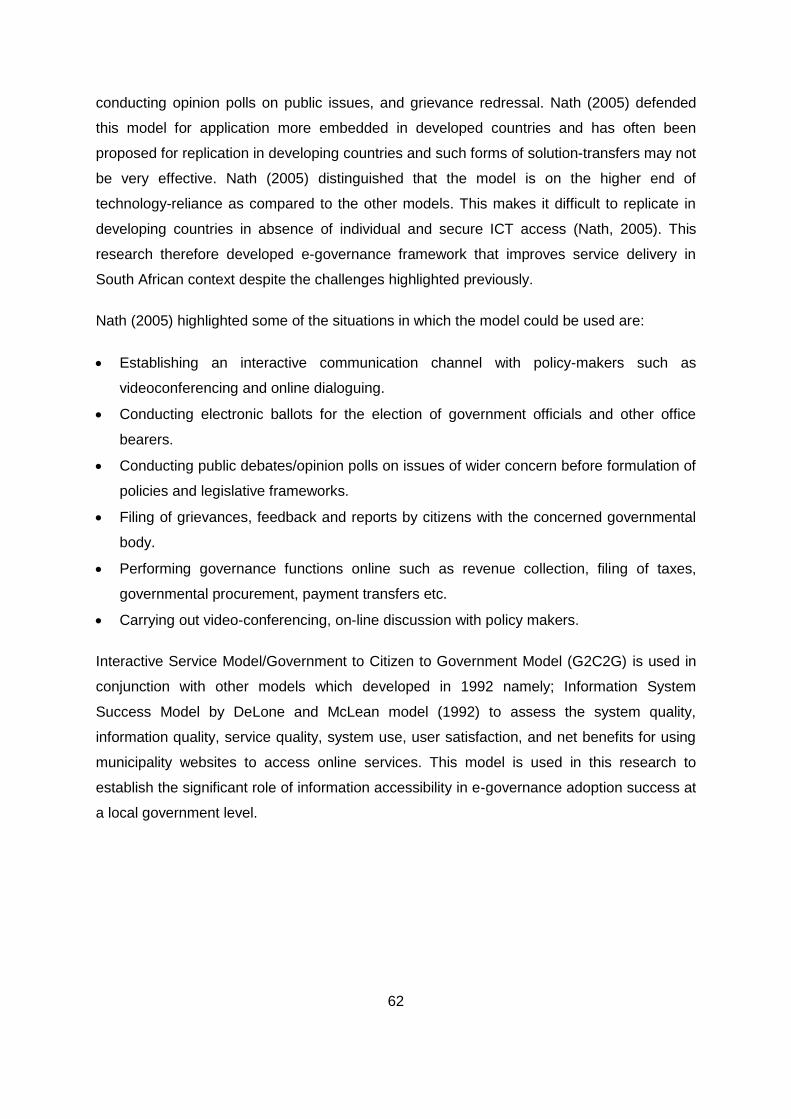
62
conducting opinion polls on public issues, and grievance redressal. Nath (2005) defended
this model for application more embedded in developed countries and has often been
proposed for replication in developing countries and such forms of solution-transfers may not
be very effective. Nath (2005) distinguished that the model is on the higher end of
technology-reliance as compared to the other models. This makes it difficult to replicate in
developing countries in absence of individual and secure ICT access (Nath, 2005). This
research therefore developed e-governance framework that improves service delivery in
South African context despite the challenges highlighted previously.
Nath (2005) highlighted some of the situations in which the model could be used are:
Establishing an interactive communication channel with policy-makers such as
videoconferencing and online dialoguing.
Conducting electronic ballots for the election of government officials and other office
bearers.
Conducting public debates/opinion polls on issues of wider concern before formulation of
policies and legislative frameworks.
Filing of grievances, feedback and reports by citizens with the concerned governmental
body.
Performing governance functions online such as revenue collection, filing of taxes,
governmental procurement, payment transfers etc.
Carrying out video-conferencing, on-line discussion with policy makers.
Interactive Service Model/Government to Citizen to Government Model (G2C2G) is used in
conjunction with other models which developed in 1992 namely; Information System
Success Model by DeLone and McLean model (1992) to assess the system quality,
information quality, service quality, system use, user satisfaction, and net benefits for using
municipality websites to access online services. This model is used in this research to
establish the significant role of information accessibility in e-governance adoption success at
a local government level.
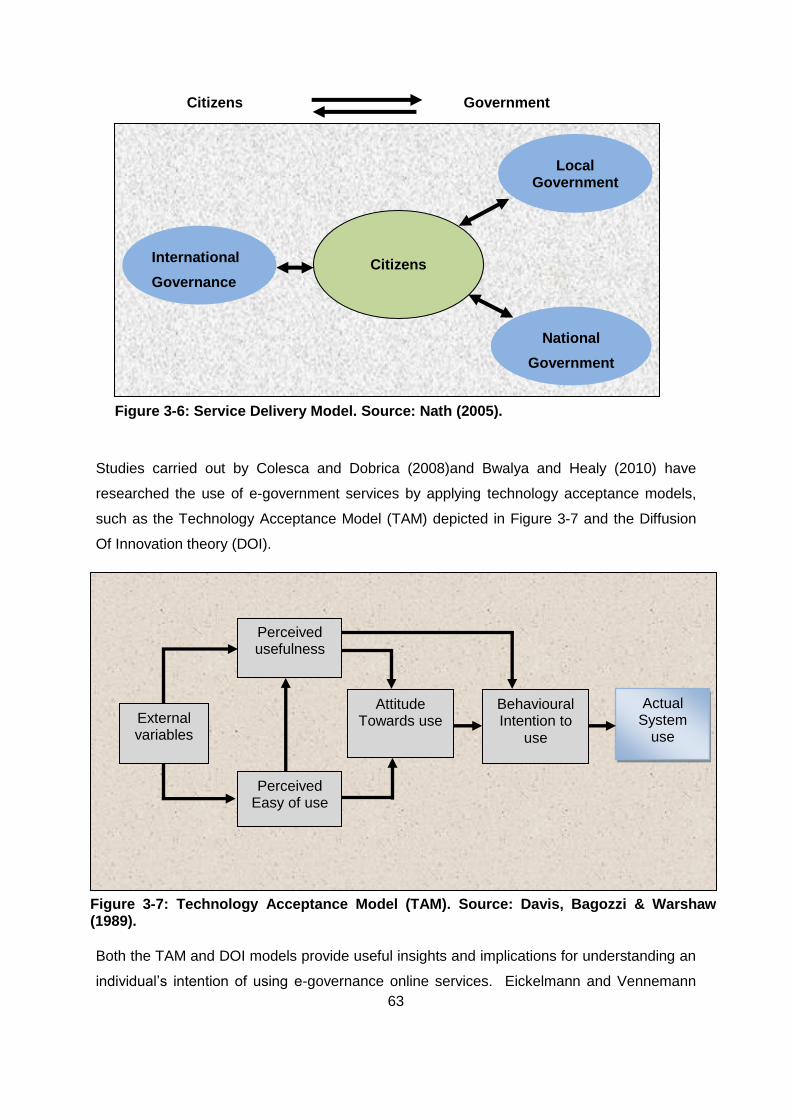
63
Citizens Government
Studies carried out by Colesca and Dobrica (2008)and Bwalya and Healy (2010) have
researched the use of e-government services by applying technology acceptance models,
such as the Technology Acceptance Model (TAM) depicted in Figure 3-7 and the Diffusion
Of Innovation theory (DOI).
Both the TAM and DOI models provide useful insights and implications for understanding an
individual’s intention of using e-governance online services. Eickelmann and Vennemann
Citizens
Local Government
International
Governance
National
Government
Figure 3-6: Service Delivery Model. Source: Nath (2005).
External variables
Perceived usefulness
Perceived Easy of use
Attitude Towards use
Behavioural Intention to
use
Actual System
use
Figure 3-7: Technology Acceptance Model (TAM). Source: Davis, Bagozzi & Warshaw (1989).

64
(2017) argued that TAM), introduced by Davis (1989), is one of the first acceptance models
to take account of the psychological factors that affect the acceptance of technology.
Eickelmann and Vennemann (2017) categorically expressed, that based on the theory of
reasoned action, the TAM models the causal relationships of perceived usefulness,
perceived ease of use, attitudes towards computer use, external variables, and behavioural
intention to use ICT in Figure 3-7. According to the TAM, two central beliefs have a direct
effect on attitudes towards ICT: ‘perceived usefulness’ and ‘perceived ease of use’.
Perceived usefulness is defined as “the subjective probability that using a specific
application system will increase a person’s job performance within an organizational
setting”(Davis, et al., 1989).Perceived ease of use refers to the extent to which a person
believes that using a certain computer system or application is free of effort (Eickelmann &
Vennemann, 2017).
Rogers (1999) identified main barriers when implementing new technologies such as e-
governance. Her results showed that the external barriers to ICTs can be grouped into three
different sub-dimensions or categories (Eickelmann & Vennemann, 2017). The first of these
is the ‘availability and accessibility category’ (Rogers, 1999), which includes the ‘limited
access to useful, relevant, and appropriate hardware and software’ (Rogers, 1999).
Eickelmann and Vennemann (2017) indicated that the second is the (lack of) technological,
technical, social, and institutional support. The third category of external barrier is
stakeholder development and this cluster subsumes all obstacles to the adoption of
technology encountered both at the individual and the institutional level (Eickelmann &
Vennemann, 2017). From an internal perspective, Rogers (1999) identified one central
barrier, namely the attitudes and beliefs of users (Eickelmann & Vennemann, 2017).
‘Attitudes toward technology and its uses in education as well as attitudes toward the level of
institutional support available play a substantial role in determining what will and will not be
considered’ (Rogers, 1999).
Furthermore, as Siegel (2008) conclude, the Technology Acceptance Model lacks insight
about the effect of motivation on technology acceptance. The models are however used in
this study to evaluate citizen adoption of e-governance by the residence of the City of
Ekurhuleni, City of Johannesburg, City of Tshwane, Lesedi local municipality, Randfontein
local municipality and Westonaria local municipality. To solve the drawbacks of these
models this research applied other models, which include the external factors and the
information needs factors not covered by e-government adoption models. The Siau and
Long (2005) Model is used in the research to explain the external factors, which are culture,
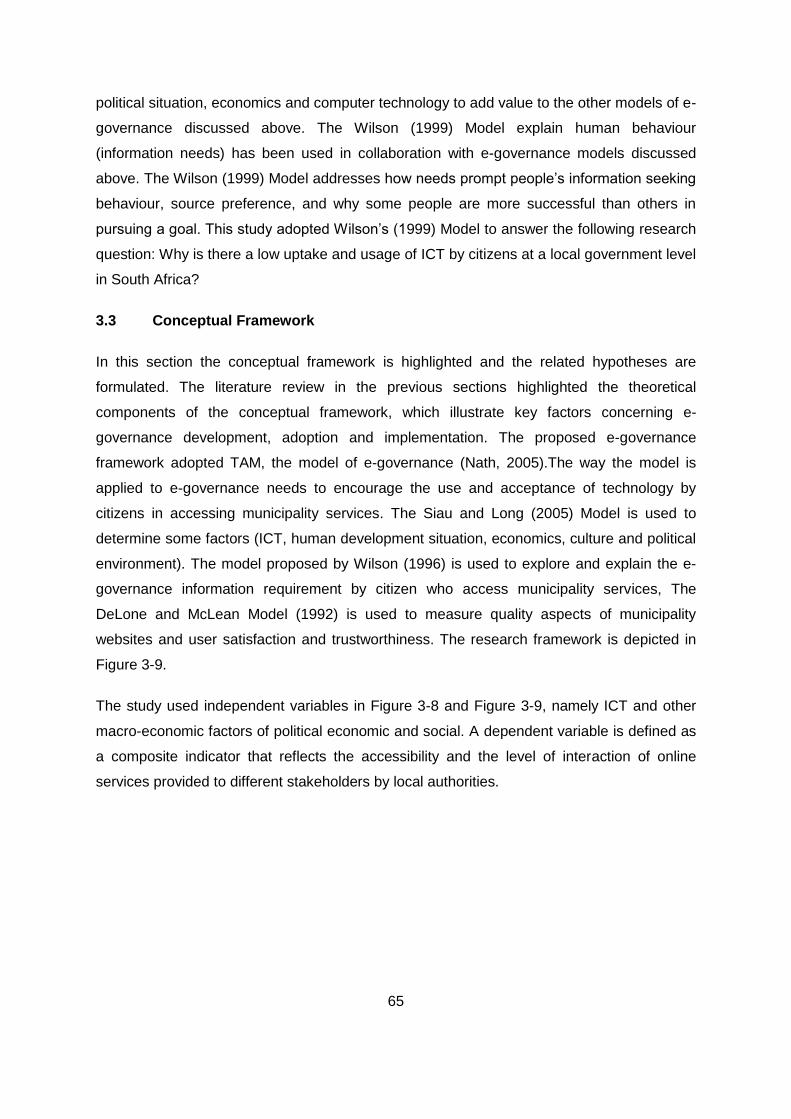
65
political situation, economics and computer technology to add value to the other models of e-
governance discussed above. The Wilson (1999) Model explain human behaviour
(information needs) has been used in collaboration with e-governance models discussed
above. The Wilson (1999) Model addresses how needs prompt people’s information seeking
behaviour, source preference, and why some people are more successful than others in
pursuing a goal. This study adopted Wilson’s (1999) Model to answer the following research
question: Why is there a low uptake and usage of ICT by citizens at a local government level
in South Africa?
3.3 Conceptual Framework
In this section the conceptual framework is highlighted and the related hypotheses are
formulated. The literature review in the previous sections highlighted the theoretical
components of the conceptual framework, which illustrate key factors concerning e-
governance development, adoption and implementation. The proposed e-governance
framework adopted TAM, the model of e-governance (Nath, 2005).The way the model is
applied to e-governance needs to encourage the use and acceptance of technology by
citizens in accessing municipality services. The Siau and Long (2005) Model is used to
determine some factors (ICT, human development situation, economics, culture and political
environment). The model proposed by Wilson (1996) is used to explore and explain the e-
governance information requirement by citizen who access municipality services, The
DeLone and McLean Model (1992) is used to measure quality aspects of municipality
websites and user satisfaction and trustworthiness. The research framework is depicted in
Figure 3-9.
The study used independent variables in Figure 3-8 and Figure 3-9, namely ICT and other
macro-economic factors of political economic and social. A dependent variable is defined as
a composite indicator that reflects the accessibility and the level of interaction of online
services provided to different stakeholders by local authorities.
66
The variables used include:
1) website availability,
2) information systems,
3) access,
4) channels of communications,
5) electronic interaction – Government to Citizens (G2C), Government to
Employees (G2E), Government to Business (G2B) and Government to
Government (G2G),
Figure 3-8: Independents, intermittent and dependence variable.
Efficiency of services
Level of convenience
Extent of accessibility
Attitude of interaction
Website availability
Website availability
Access
Literacy level
Information systems
Electronic interaction
Channels of communication
Acceptance of technology
Perception of technology
Intentions of using technology
Efficiency
Accountability
Transparency
Satisfaction level
intermittent variables
Dependence
variables
Information
Communication
Technology
Economical
Political
Social
E-governance
independent variables

67
6) literacy level,
7) acceptance of technology,
8) perceptions on technology,
9) intentions of using technology,
10) efficiency,
11) accountable,
12) transparency.
The variables are found to be related to service delivery through Spearman’s correlation
matrix and the logistic regression model is used to establish their relationships.
3.4 Chapter conclusion
This chapter covers the theories of e-governance discussed by Nath (2005), Interactive-
Service Model (Nath, 2005), Technology Acceptance Model (Davis, 1989), Synthesized
Stage Model (Siau & Long, 2005), Information System Success Model (DeLone& McLean,
1992), DOI Model (Rogers, 1995), Information Behaviour Model (Wilson, 1999). The design
of the conceptual framework is based on the definitions of e-governance and e-government,
as well as the theories of the different models discussed in this chapter. Independence,
intermittent and dependence variables are also identified and discussed. The next chapter
will discuss the research methodology used for this study.
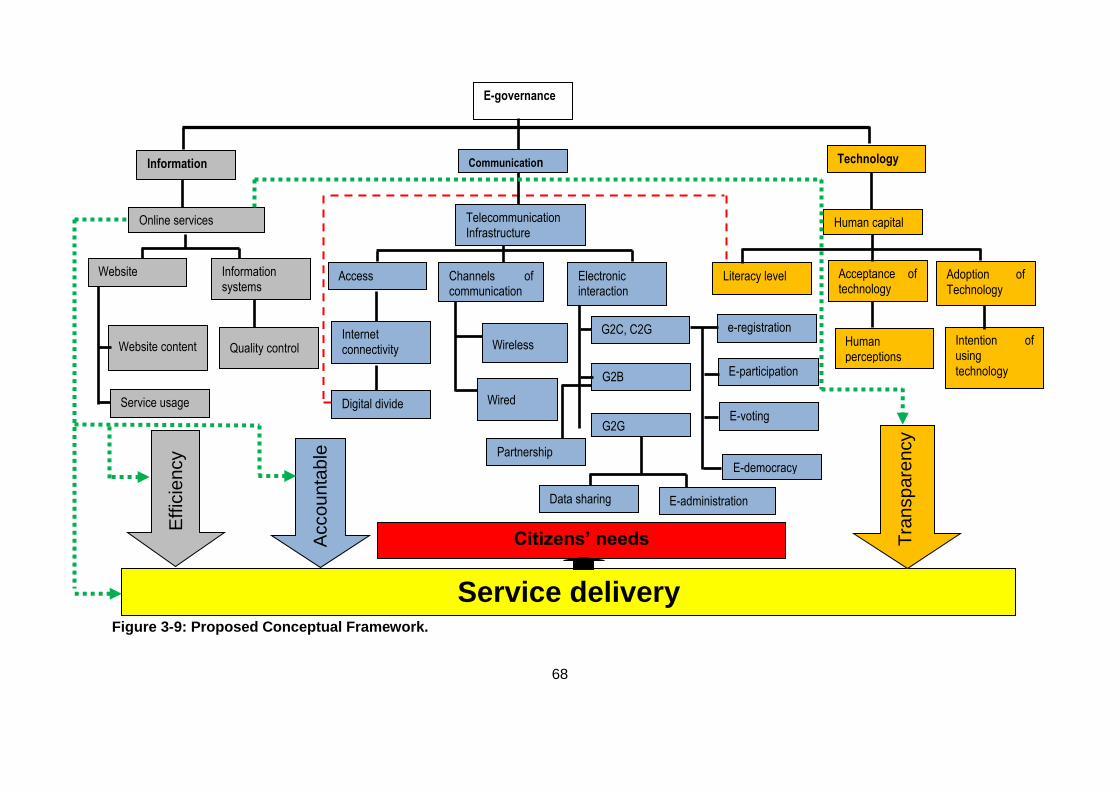
68
Figure 3-9: Proposed Conceptual Framework.
G2G
G2B
G2C, C2G Intention of using technology
Human perceptions
Wired
broadband
Partnership
Data sharing
E-democracy
E-participation
e-registration
E-administration
E-voting
Service delivery
Citizens’ needs
Service usage
Eff
icie
ncy
Tra
nsp
are
ncy
Acco
un
tab
le
Channels of communication
Electronic interaction
Communication Technology
Human capital
Literacy level
Online services Telecommunication Infrastructure
Information
Digital divide
Acceptance of technology
Access Information systems
Website Adoption of Technology
Internet connectivity Wireless
broadband
Website content Quality control
E-governance
69
CHAPTER 4: RESEARCH METHODOLOGY
4.1 Introduction
The previous two chapters discussed the research literature and underpinnings of e-
governance and a conceptual framework for the current study. This chapter highlights the
research methodology for the study and types of research approaches, research reasoning,
research paradigm, research design, research strategy, population, sampling, data collection
and data analysis. The chapter ends by discussing the quality and rigour of the research, as
well as the ethical considerations.
4.2 Research methodology
Schwandt (2001) described methodology as the theory of how inquiry should proceed and
that it involves analysis of assumptions, principles, and procedures in a particular approach
of inquiry. Lather (1991) argued that methodology of the positivism paradigm is scientific
method. This may include case study approach and experimental and control group
experiments in which researchers describe the context in detail and remodel questions for
field use (Creswell, Clark, Gutmann & Hanson, 2003). Somekh and Lewin (2005) defined
methodology, as both the collection of methods or rules by which a particular piece of
research is undertaken, and the principles, theories and values that underpin a particular
approach to research. Research methodology is a term which applies to how research is
conducted and is based on our assumptions, interests, and purposes shape which
methodology to choose (Steven, Bogdan & Devault, 2015).
The research questions posed in the research can be both descriptive and explanatory in
nature, therefore the research can have more than one purpose (Neuman, 2006;Saunders,
Lewis &Thornhill, 2009).The current study is descriptive, describing a phenomenon as it
exists, and analytical to explain why or how something is happening as far as the uptake and
use of ICT as part of e-governance in improving service delivery in local authorities is
concerned.
4.3 Research reasoning
Deductive and inductive approaches are strategies, which can be used in scientific inquiry
when testing a theory or building a theory. Deductive begins with proposing hypotheses,
proceeds into analyzing data, and finally concludes with confirmatory tests (Yom, 2015).On
the other hand, inductive research, begins with the specific observation of the empirical
70
world and develops theories or hypothesis based on the evidence collected from their
observations (Neuman, 2014).This research therefore, uses deductive and inductive thinking
in a distinctive sequence to address the objectives of the study and to come up with e-
governance framework that improves service delivery in local authorities in South Africa.
4.4 Research paradigm (philosophy)
Quantitative research attempts to uncover reality and this reasoning forms the philosophical
assumption surround the research topic of a framework of e-governance to improve service
delivery by local authorities in South Africa.Morgan (2014) indicated that it is essential to
recognize that paradigms are more than simple statements about future directions for
research. Neuman (2014) explained that a paradigm is a whole system of thinking,which
includes basic assumptions, the research question to be addressed, and the research
technique to be used.
Research philosophies can take the form of positivism, realism, interpretivism,
phenomenological and pragmatism (Saunders, et al., 2009), but the positivist and
interpretivist paradigms are used most frequently.
4.4.1 Positivism
Positivism is as a family of philosophies characterized by an extremely positive evaluation of
science and scientific method (Lincoln & Guba, 2000). The positivist researchers applied an
organised method for combining deductive logic with precise empirical observations for
individual behaviour in order to discover and confirm a set of probabilistic causal laws that
that can be used to predict general patterns of human activity (Neuman, 2014).Schwandt
(2001) further stressed that positivism is based on strict empiricism propounded that
experience is the sole basis for generating knowledge. In agreement with Merriam (2002)
mentioned knowledge is logically bounded by general laws and is observable.
4.4.2 Realism
Quantitative research worldview believes on single measurable, observable, and provable
truth (Merriam, 2002). Merriam (2002) further pointed out that quantitative researchers
attempt to uncover this reality. This reasoning therefore forms the philosophical assumption
surround the research topic of a framework of e-governance to improve service delivery by
local authorities in South Africa.
71
4.4.2 Interpretive
Interpretive paradigm assumes that social reality is the result of the subjective
interpretations of individuals (Ardalan, 2018). Ardalan (2018) highlighted that interpretive
paradigm sees the social world as a process that is created by individuals. Social reality,
insofar as it exists outside the consciousness of any individual, is regarded as being a
network of assumptions and inter subjectively shared meanings (Ardalan, 2018).Greener
(2008) argued that an interpretive paradigm uses a qualitative research method such as
discourse analysis, unstructured interviews to investigate perceptions and constructions of
reality by “actors” in organisations that is employees, managers, stakeholders etc.
4.4.4 Phenomenological
Moon and Blackman (2014) believed that researchers can put their own systems of
meaning (of reality) aside and interpret the immediate personal experience of a phenomenon
and thus give rise to a new, refreshed, or richer meaning of the phenomenon. The essence
of human experience of phenomena is only understood when the researcher separates their
experiences (Moon & Blackman, 2014).
4.4.3 Pragmatism
Pragmatism can be used as a guide, not only for top-down deductive research design, but
also for grounded inductive or abductive research (Morgan, 2007). It offers the chance to
produce a ‘‘properly integrated methodology for the social sciences’’ (Morgan, 2007) in
acknowledging the value of both quantitative and qualitative research methods and the
knowledge produced by such research in furthering this study understanding of society and
social life as far as the uptake and usage of ICT as part of e-governance by citizens in
improving service delivery. Pragmatism may thus enable this study to enjoy the complexity
and messiness of social life and revive a flagging sociological imagination (Morgan, 2007).
Pragmatism is a philosophical movement that considers beliefs and theory as being linked to
our practical engagement in the world rather than to the world as it truly is (Allen & Clough,
2015; Maul & McGrane, 2017). Morgan (2014) argued that from the perspective of
pragmatism, new paradigms create new sets of beliefs that guide new kinds of actions. At a
fundamental level, paradigms create new worldviews and social contexts that have
widespread impacts on the conduct of inquiry (Morgan, 2014). The pragmatic paradigm
prevents research from spending time in pointless debates about such concepts as truth and
72
reality and thus enabling this research to address the research questions (Tashakkori &
Teddlie, 1998). The current research study aims to achieve the pragmatic paradigm.
4.5 Research approach
There are three research approaches namely;
Quantitative approach,
Qualitative approach, and
Mixed methods.
To identify an appropriate methodology, this research considered the purpose of the
research (Neuman, 2014).The research questions, which the research has posed, are both
descriptive and explanatory; therefore the research direction is a mixed method approach.
4.5.1 Quantitative approach
Quantitative research can be defined as research that explains phenomena according to
numerical data which are analysed by means of mathematically based methods, especially
statistics (Yilmaz, 2013). From a broader perspective, it can be defined as a type of empirical
research into a social phenomenon or human problem, testing a theory consisting of
variables which are measured with numbers and analysed with statistics in order to
determine if the theory explains or predicts phenomena of interest (Gay & Airasian, 2000).
Gay and Airasian (2000) argued that research in the twentieth century, especially in the first
half of the century, was dominated by the quantitative method. Its philosophical basis of
positivism can be said to have been substituted by critical realism in the last half of the
century (Cook & Campbell, 1979). Cook and Campbell (1979) defended that qualitative
approach was developed partly as a protest against the dominance of the quantitative
tradition, and it attained its definitive breakthrough around 1970. Gay and Airasian (2000)
argued that quantitative research also focuses on proving or disproving a hypothesis based
on a large number of participants’ responses and the idea is also to generalize on larger
population by conducting analysis using sophisticated statistical tools. Kothari (2004)
distinguished that quantitative approach involves the generation of data in quantitative form
which can be subjected to rigorous quantitative analysis in a formal and rigid fashion. This
study did not therefore use this method alone, but blended it with qualitative approach in
order to fully understand and answer the research questions posed in Chapter 1.
73
The advantage of the quantitative approach is that data from large numbers of people lead
to greater breadth of understanding, as opposed to the depth of understanding possible from
qualitative methods (Francisco, Butterfoss & Capwell, 2001). Francisco, et al. (2001) argued
that strong inferences are possible with the quantitative method, especially when tight
experimental control is achieved. Quantitative methods are often more systematic than other
methods, which makes findings more likely to be replicated (Francisco, et al., 2001). On the
other hand, Francisco, et al. (2001) highlighted that the disadvantage of the quantitative
approach is that one can only prove what one already believes, that is to confirm the
hypothesis about current variables and the range or scope of knowledge may not extend to
new variables related to the intervention. With the quantitative method, one cannot
demonstrate the meaning of findings to people’s lives (Francisco, et al., 2001). However, for
the purpose of this research these limitations were overshadowed by the strengths of the
quantitative method and qualitative methods through the use of the mixed method.
4.5.2 Qualitative approach
Kothari (2004) explained that the qualitative approach to research is concerned with
subjective assessment of attitudes, opinions and behaviour. Kothari (2004) indicated that
research in such a situation is a function of researcher’s insights and impressions. Such an
approach to research generates results either in non-quantitative form or in the form which
are not subjected to rigorous quantitative analysis (Kothari, 2004). Kothari (2004) explained
that qualitative approach attempts to understand and make sense of phenomena from the
participant’s perceptive. The researcher can approach the phenomenon from an interactive,
critical, or postmodern stance (Merriam, 2002). Merriam (2002) concluded that all
quantitative research is characterised by the search for meaning and understanding, the
researcher as the primary instrument of data collection and analysis, an inductive
investigative strategy, and a richly descriptive end product. This study therefore did not use
this approach in isolation, but used it under the umbrella of the mixed approach.
Figure 4-1 illustrates the weaknesses and strengths of qualitative and quantitative research
methodology. Choosing either one type of research methodology has still embraced
negative and positive impacts of the results and output (Choy, 2014) in a bid to answer the
research questions; why is there a low uptake and usage of Information Communication
Technology by citizens at a local government level in South Africa? And why are local
authorities offering poor service delivery to their citizens in South Africa? Thus, it could be
concluded that there is no perfect between qualitative and quantitative research
methodologies (Choy, 2014). Therefore, the advantages and disadvantages of both types of
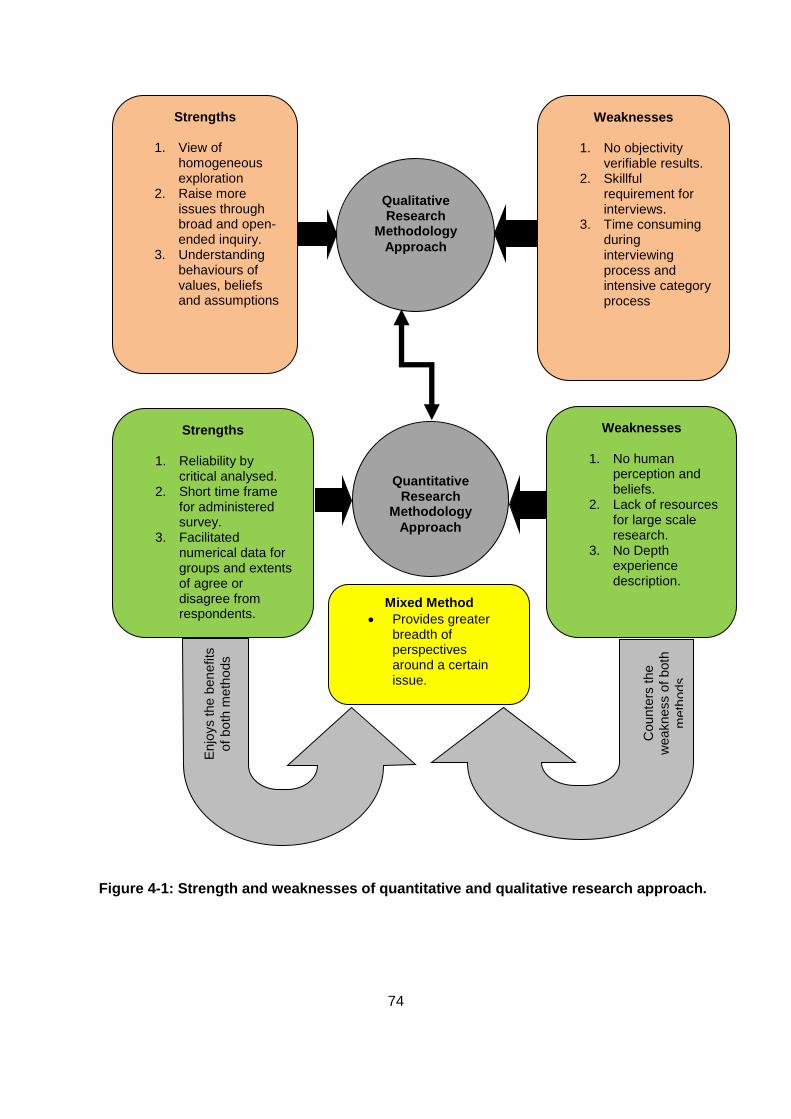
74
Figure 4-1: Strength and weaknesses of quantitative and qualitative research approach.
Strengths
1. View of homogeneous exploration
2. Raise more issues through broad and open-ended inquiry.
3. Understanding behaviours of values, beliefs and assumptions
Weaknesses
1. No objectivity verifiable results.
2. Skillful requirement for interviews.
3. Time consuming during interviewing process and intensive category process
Qualitative Research
Methodology
Approach
Strengths
1. Reliability by critical analysed.
2. Short time frame for administered survey.
3. Facilitated numerical data for groups and extents of agree or disagree from respondents.
Weaknesses
1. No human perception and beliefs.
2. Lack of resources for large scale research.
3. No Depth experience description.
Quantitative Research
Methodology
Approach
Mixed Method
Provides greater breadth of perspectives around a certain issue.
Counte
rs the
weakness o
f both
meth
ods
Enjo
ys the b
en
efits
of bo
th m
eth
ods
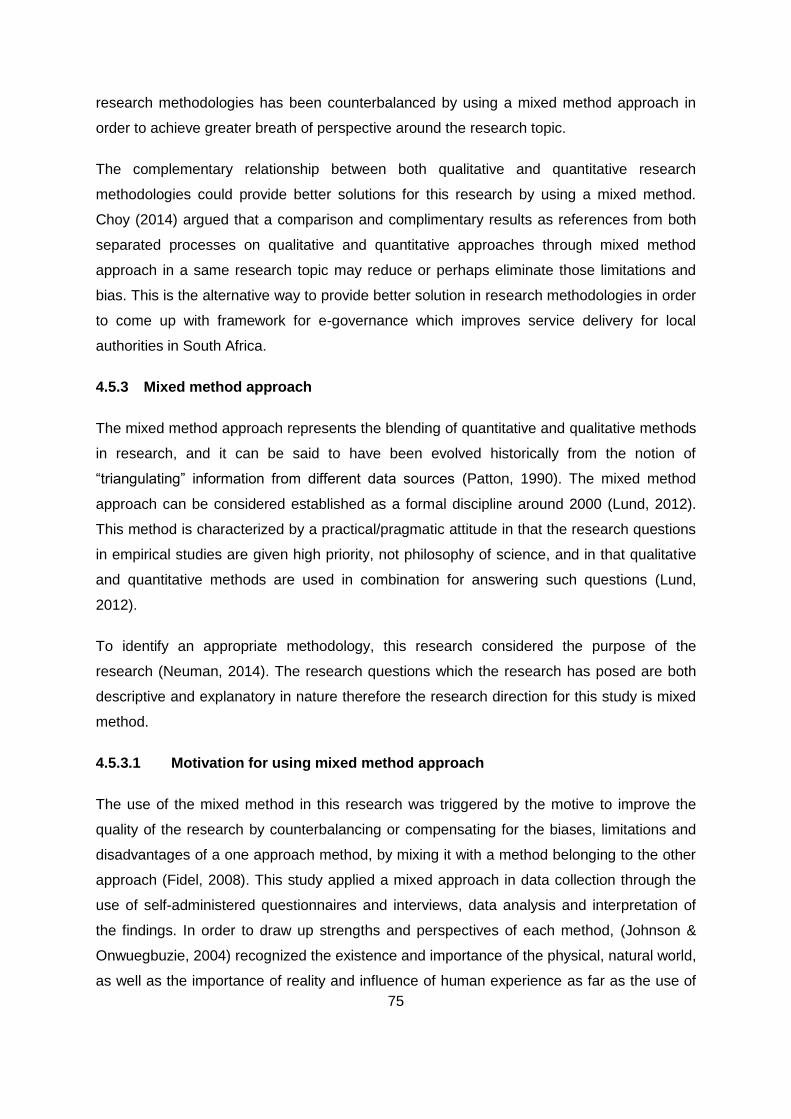
75
research methodologies has been counterbalanced by using a mixed method approach in
order to achieve greater breath of perspective around the research topic.
The complementary relationship between both qualitative and quantitative research
methodologies could provide better solutions for this research by using a mixed method.
Choy (2014) argued that a comparison and complimentary results as references from both
separated processes on qualitative and quantitative approaches through mixed method
approach in a same research topic may reduce or perhaps eliminate those limitations and
bias. This is the alternative way to provide better solution in research methodologies in order
to come up with framework for e-governance which improves service delivery for local
authorities in South Africa.
4.5.3 Mixed method approach
The mixed method approach represents the blending of quantitative and qualitative methods
in research, and it can be said to have been evolved historically from the notion of
“triangulating” information from different data sources (Patton, 1990). The mixed method
approach can be considered established as a formal discipline around 2000 (Lund, 2012).
This method is characterized by a practical/pragmatic attitude in that the research questions
in empirical studies are given high priority, not philosophy of science, and in that qualitative
and quantitative methods are used in combination for answering such questions (Lund,
2012).
To identify an appropriate methodology, this research considered the purpose of the
research (Neuman, 2014). The research questions which the research has posed are both
descriptive and explanatory in nature therefore the research direction for this study is mixed
method.
4.5.3.1 Motivation for using mixed method approach
The use of the mixed method in this research was triggered by the motive to improve the
quality of the research by counterbalancing or compensating for the biases, limitations and
disadvantages of a one approach method, by mixing it with a method belonging to the other
approach (Fidel, 2008). This study applied a mixed approach in data collection through the
use of self-administered questionnaires and interviews, data analysis and interpretation of
the findings. In order to draw up strengths and perspectives of each method, (Johnson &
Onwuegbuzie, 2004) recognized the existence and importance of the physical, natural world,
as well as the importance of reality and influence of human experience as far as the use of
76
ICT tools as part of e-governance in improving service delivery in local authorities is
concerned. A mixed method approach is used for this research for the purposes of
triangulation, sought convergence and divergence across qualitative and quantitative
approaches (Greene, et al., 1989). This study triangulated data collection methods by using
interviews and self-administered questionnaires. The study also triangulated models or
theories of e-governance models. Triangulation of data sources which include data from
citizenry of Municipalities and Executives members from Gauteng Province was done.
4.6 Research design
The research design is how the researcher intends to carry out the work (Saunders, Lewis &
Thornhill, 2007). Creswell and Plano Clark (2007) described research design as procedures
for collecting, analyzing, interpreting and reporting data in research studies. Saunders, et al.
(2007) argued that decisions on research design are based on the research purpose, and on
what best match the research problem. The research carried out for this study is descriptive
and explanatory in nature. Yin (2003) explained that the descriptive research design can be
applied when the problem is clearly structured Pickard (2007) claimed that quantitative and
qualitative methods can be applied in descriptive and explanatory research. This research
therefore followed a mixed-methods research approach in order to utilise the advantages of
both quantitative and qualitative approaches. Patton (1990) support that mixed methods
research is characterized as the research that contains elements of both qualitative and
quantitative approaches.
4.6.1 Mixed-method design
Mixed methods research is a methodology that meaningfully integrates both quantitative and
qualitative approaches and the combination of the strengths of each to answer research
questions (Valentine, 2016). The glossary of Creswell and Plano Clark’s (2007) handbook
defines mixed methods as “the collection and analysis of both qualitative and quantitative
data, mixing the two forms of data, giving priority to one or both, using procedures in a single
study or multiple phases of a program of study, framing these procedures within a
philosophical worldview or theoretical lenses, and combining procedures into specific
research designs that direct the plan for conducting the study”.
77
4.6.1.1 Types of mixed-method design
There are different types of combined designs, which are based on sequence of and
different emphasis on, using different techniques (McMurray, et al., 2004). These include:
two phases or sequential design versus simultaneous or concurrent design:
• Two phases or sequential design includes the use of methods sequentially, in
separate stages of the study (McMurray, et al. 2004).
• Concurrent or simultaneous design occurs when the researcher uses the two
methods in parallel, or simultaneously (McMurray, et al., 2004).
McMurray, et al. (2004) argued that there is dominant/less dominant and equivalent status
design. McMurray, et al. (2004) indicated that with dominant/less dominant design, it
involves more focus on one technique as a primary approach. However, in equivalent status
design, the weight of emphasis on different methods is almost equal (McMurray, et al.,
2004).
The equal status design is used in this research in order to understand and explain the
uptake and usage of ICT by citizens in improving service delivery. This design was carried
out in two phases or sequentially:
(1) an initial quantitative instrument phase using self-administered questionnaire for
citizens from the municipalities, followed by
(2) a qualitative data collection phase using interviews for executive members from
identified municipalities.
The qualitative phase builds directly on the results from the quantitative phase. In this way,
the quantitative results for the study are explained in more detail through the qualitative data
in which data was collected and analysed in a particular sequence with the purpose of
informing, integrated with, or finding from, the other method (Wisdom, 2013). Qualitative
data was embedded within equal status quantitative approach. Both quantitative and
qualitative data analysed was kept separate, and was then combined or integrated into
meta-inferences (Creswell & Plano Clark, 2007). Both data sets were used for descriptive
and explanatory purposes.
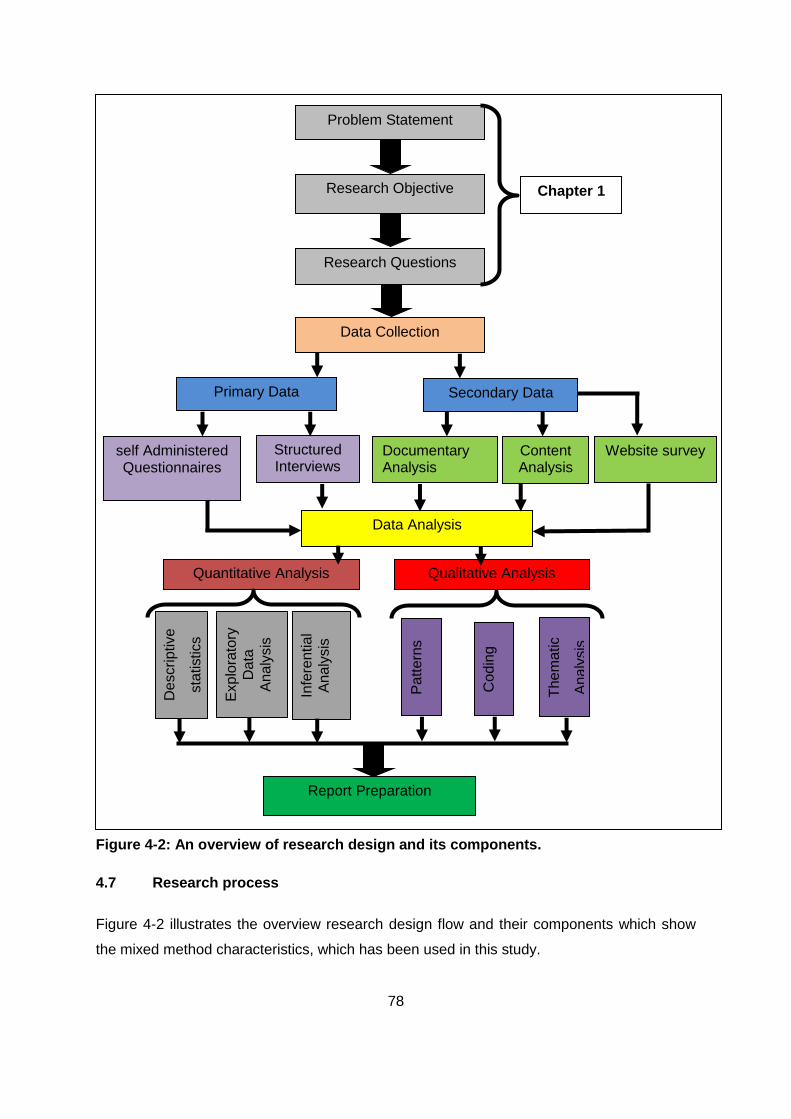
78
Source: (Salam, 2013:28, as amended Author, 2016).
4.8Research strategy
4.7 Research process
Figure 4-2 illustrates the overview research design flow and their components which show
the mixed method characteristics, which has been used in this study.
Problem Statement
Research Objective
Research Questions
Data Collection
Primary Data Secondary Data
self Administered Questionnaires
Structured Interviews
Content Analysis
Website survey
Data Analysis
Report Preparation
De
scriptive
sta
tistics
Exp
lora
tory
Da
ta
An
aly
sis
Infe
rentia
l
An
aly
sis
Documentary Analysis
The
ma
tic
An
aly
sis
Pa
tte
rns
Quantitative Analysis Qualitative Analysis
Co
din
g
Chapter 1
Figure 4-2: An overview of research design and its components.
79
4.8 Research strategy
There are various research strategies which can be used namely; experiment, survey, case
study, action research, grounded theory, ethnography and archival research.For the purpose
of this study, this research used survey and case studies.
4.8.1 Survey
Survey research uses a written questionnaire or formal interview to gather information on the
background, behaviours, beliefs, or attitudes of a large number of people (Neuman, 2014). A
survey is an investigation in which information is systematically collected. Surveys are
carried out by investigators wishing to collect descriptive information about a group of
people, often referred to as the target population (Portney & Watkins, 1993). Portney and
Watkins (1993) indicated that the survey strategy is usually associated with the deductive
approach and it is a popular and common strategy in business and management research
and is most frequently used to answer who, what, where, how much and how many
questions. It therefore tends to be used for exploratory and descriptive research (Portney &
Watkins, 1993).
Langbecker, Caffery, Gillespie and Smith (2017) highlighted that the popularity of the survey
as a method of measurement can be understood through three major strengths of this
technique. Langbecker, et al. (2017) listed that the first strengthis that confidential survey
questions are well suited to capture individuals’ experiences, perceptions and attitudes
(Langbecker, et al., 2017). Langbecker, et al.(2017) gave the second strength as pre-
existing scales can be used across studies, enabling the comparison and replication of
results. As surveys allow data to be collected from large samples for relatively low cost, they
can produce generalizable results, which provide an understanding of the views or
experiences of a population group (Langbecker, et al., 2017). Langbecker, et al. (2017) gave
the third strength as the validity and reliability of survey instruments can be assessed
through rigorous, transparent and well-accepted validation methods, providing the
researcher with confidence that the measures tap the intended constructs, and provide an
accurate measurement.
This study used questionnaires administered to a sample, which was extracted from the
population of the selected municipalities. Portney and Watkins (1993) explained that the
survey strategy allows you to collect quantitative data which you can analyse quantitatively
using descriptive and inferential statistics.
80
Survey takes two broad forms, the census and the sample survey and that in a sample
survey, a representative sample of the target population, often referred to as the study
population or study sample, is selected and questioned (Finlayson, et al., 1999). Data from
sample surveys provide descriptions of a population in the same way a census would, but
the researchers can be less confident that data is representative of the “true” population
(Finlayson, et al., 1999).This research used the sample survey for home owners to get
direction on research questions on the uptake and usage of ICTs by citizens.
4.8.2 Case study
Robson (2002) defined case study as “a strategy for doing research, which involves an
empirical investigation of a particular contemporary phenomenon within its real life context
using multiple sources of evidence”. Saunders, et al. (2009) argued that that case study also
differs from the survey strategy where, although the research is undertaken in context, the
ability to explore and understand this context is limited by the number of variables for which
data can be collected.
The case study strategy was of particular interest for this study in order to gain a rich
understanding of the context of the research and the processes being enacted (Morris &
Wood, 1991). Saunders, et al. (2009) explained that the case study strategy also has
considerable ability to generate answers to the question ‘why?’ as well as the ‘what?’ and
‘how?’ questions, although ‘what?’ and ‘how?’ questions tend to be more the concern of the
survey strategy. For this reason the case study strategy is most often used in explanatory
and exploratory research. Saunders, et al. (2009) expressed that the data collection
techniques employed may be various and are likely to be used in combination. This study
therefore include interviews, documentary analysis and questionnaires. Consequently, case
study strategy is used in this study to triangulate multiple sources of data. Triangulation
refers to the use of different data collection techniques within one study in order to ensure
that the data are telling the study what the study think they are telling the study (Saunders, et
al, 2009).
Saunders, et al (2009) highlighted that a case study strategy can also incorporate multiple
cases, that is, more than one case. The rationale for using multiple cases focuses upon the
need to establish whether the findings of the first case occur in other cases and, as a
consequence, the need to generalise from these findings (Saunders, et al., 2009). For this
reason Yin (2003) argues that multiple case studies may be preferable to a single case study
and that, where the study chooses to use a single case study, the study will need to have a
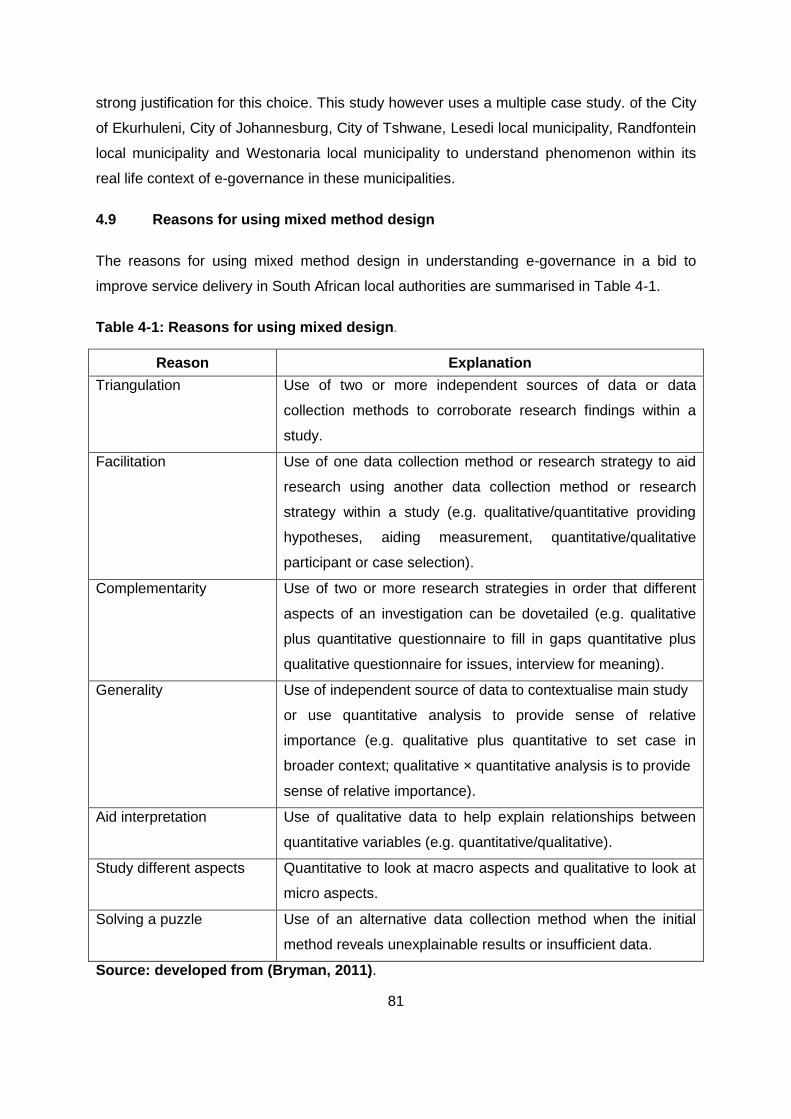
81
strong justification for this choice. This study however uses a multiple case study. of the City
of Ekurhuleni, City of Johannesburg, City of Tshwane, Lesedi local municipality, Randfontein
local municipality and Westonaria local municipality to understand phenomenon within its
real life context of e-governance in these municipalities.
4.9 Reasons for using mixed method design
The reasons for using mixed method design in understanding e-governance in a bid to
improve service delivery in South African local authorities are summarised in Table 4-1.
Table 4-1: Reasons for using mixed design.
Reason Explanation
Triangulation Use of two or more independent sources of data or data
collection methods to corroborate research findings within a
study.
Facilitation Use of one data collection method or research strategy to aid
research using another data collection method or research
strategy within a study (e.g. qualitative/quantitative providing
hypotheses, aiding measurement, quantitative/qualitative
participant or case selection).
Complementarity Use of two or more research strategies in order that different
aspects of an investigation can be dovetailed (e.g. qualitative
plus quantitative questionnaire to fill in gaps quantitative plus
qualitative questionnaire for issues, interview for meaning).
Generality Use of independent source of data to contextualise main study
or use quantitative analysis to provide sense of relative
importance (e.g. qualitative plus quantitative to set case in
broader context; qualitative × quantitative analysis is to provide
sense of relative importance).
Aid interpretation Use of qualitative data to help explain relationships between
quantitative variables (e.g. quantitative/qualitative).
Study different aspects Quantitative to look at macro aspects and qualitative to look at
micro aspects.
Solving a puzzle Use of an alternative data collection method when the initial
method reveals unexplainable results or insufficient data.
Source: developed from (Bryman, 2011).
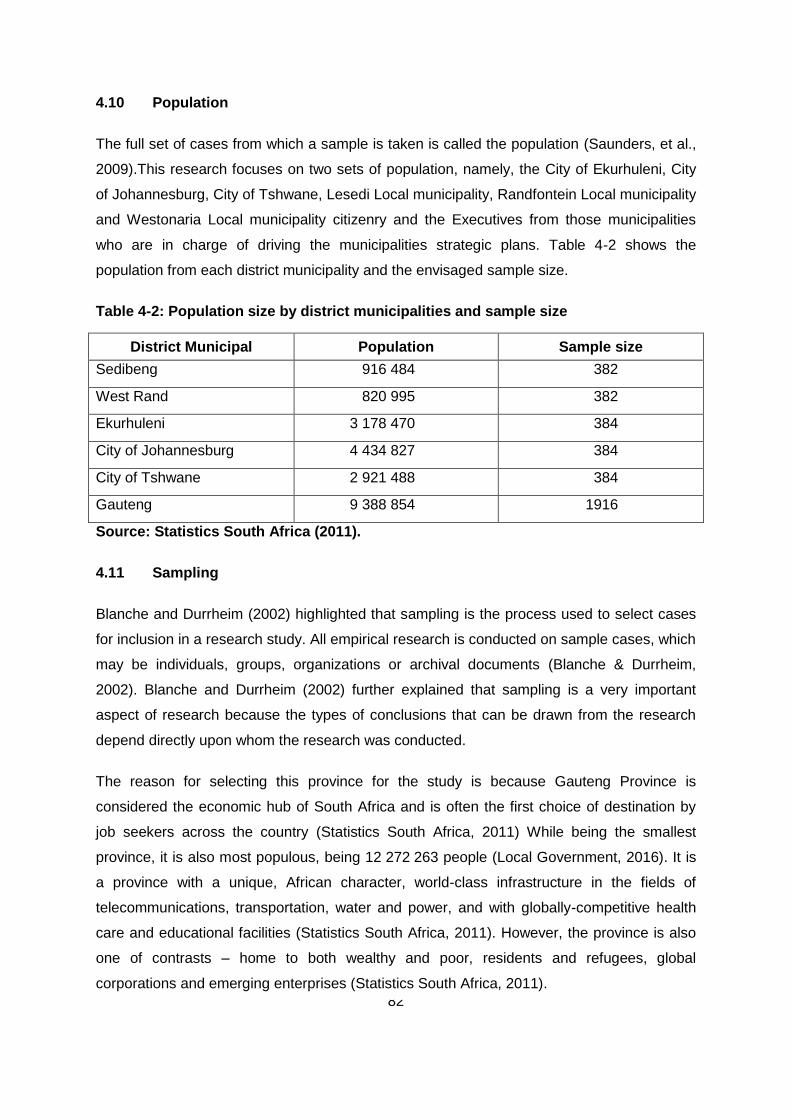
82
4.10 Population
The full set of cases from which a sample is taken is called the population (Saunders, et al.,
2009).This research focuses on two sets of population, namely, the City of Ekurhuleni, City
of Johannesburg, City of Tshwane, Lesedi Local municipality, Randfontein Local municipality
and Westonaria Local municipality citizenry and the Executives from those municipalities
who are in charge of driving the municipalities strategic plans. Table 4-2 shows the
population from each district municipality and the envisaged sample size.
Table 4-2: Population size by district municipalities and sample size
District Municipal Population Sample size
Sedibeng 916 484 382
West Rand 820 995 382
Ekurhuleni 3 178 470 384
City of Johannesburg 4 434 827 384
City of Tshwane 2 921 488 384
Gauteng 9 388 854 1916
Source: Statistics South Africa (2011).
4.11 Sampling
Blanche and Durrheim (2002) highlighted that sampling is the process used to select cases
for inclusion in a research study. All empirical research is conducted on sample cases, which
may be individuals, groups, organizations or archival documents (Blanche & Durrheim,
2002). Blanche and Durrheim (2002) further explained that sampling is a very important
aspect of research because the types of conclusions that can be drawn from the research
depend directly upon whom the research was conducted.
The reason for selecting this province for the study is because Gauteng Province is
considered the economic hub of South Africa and is often the first choice of destination by
job seekers across the country (Statistics South Africa, 2011) While being the smallest
province, it is also most populous, being 12 272 263 people (Local Government, 2016). It is
a province with a unique, African character, world-class infrastructure in the fields of
telecommunications, transportation, water and power, and with globally-competitive health
care and educational facilities (Statistics South Africa, 2011). However, the province is also
one of contrasts – home to both wealthy and poor, residents and refugees, global
corporations and emerging enterprises (Statistics South Africa, 2011).
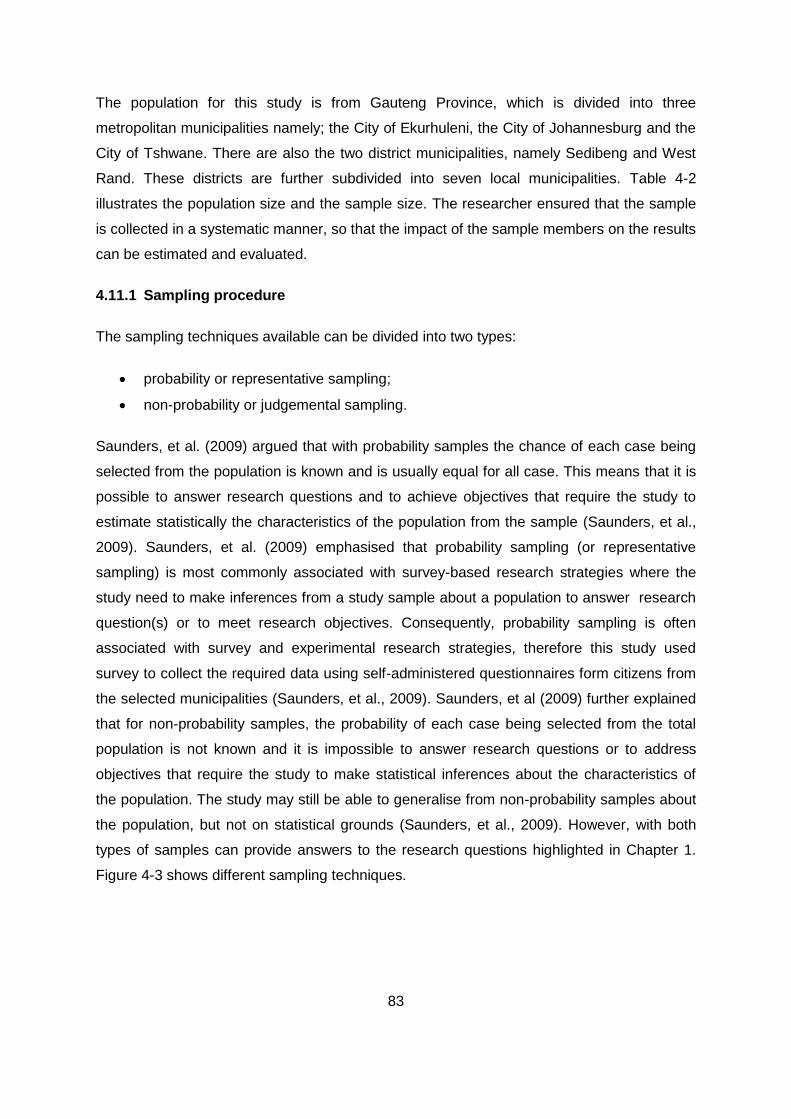
83
The population for this study is from Gauteng Province, which is divided into three
metropolitan municipalities namely; the City of Ekurhuleni, the City of Johannesburg and the
City of Tshwane. There are also the two district municipalities, namely Sedibeng and West
Rand. These districts are further subdivided into seven local municipalities. Table 4-2
illustrates the population size and the sample size. The researcher ensured that the sample
is collected in a systematic manner, so that the impact of the sample members on the results
can be estimated and evaluated.
4.11.1 Sampling procedure
The sampling techniques available can be divided into two types:
probability or representative sampling;
non-probability or judgemental sampling.
Saunders, et al. (2009) argued that with probability samples the chance of each case being
selected from the population is known and is usually equal for all case. This means that it is
possible to answer research questions and to achieve objectives that require the study to
estimate statistically the characteristics of the population from the sample (Saunders, et al.,
2009). Saunders, et al. (2009) emphasised that probability sampling (or representative
sampling) is most commonly associated with survey-based research strategies where the
study need to make inferences from a study sample about a population to answer research
question(s) or to meet research objectives. Consequently, probability sampling is often
associated with survey and experimental research strategies, therefore this study used
survey to collect the required data using self-administered questionnaires form citizens from
the selected municipalities (Saunders, et al., 2009). Saunders, et al (2009) further explained
that for non-probability samples, the probability of each case being selected from the total
population is not known and it is impossible to answer research questions or to address
objectives that require the study to make statistical inferences about the characteristics of
the population. The study may still be able to generalise from non-probability samples about
the population, but not on statistical grounds (Saunders, et al., 2009). However, with both
types of samples can provide answers to the research questions highlighted in Chapter 1.
Figure 4-3 shows different sampling techniques.
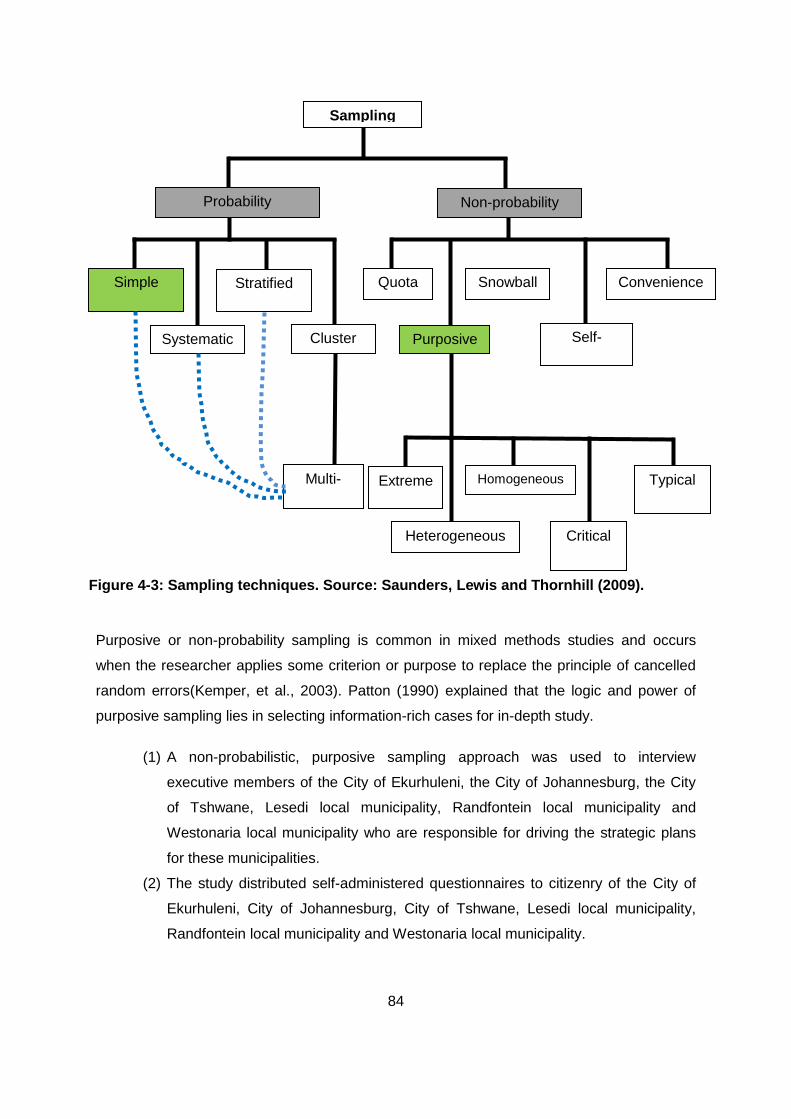
84
Purposive or non-probability sampling is common in mixed methods studies and occurs
when the researcher applies some criterion or purpose to replace the principle of cancelled
random errors(Kemper, et al., 2003). Patton (1990) explained that the logic and power of
purposive sampling lies in selecting information-rich cases for in-depth study.
(1) A non-probabilistic, purposive sampling approach was used to interview
executive members of the City of Ekurhuleni, the City of Johannesburg, the City
of Tshwane, Lesedi local municipality, Randfontein local municipality and
Westonaria local municipality who are responsible for driving the strategic plans
for these municipalities.
(2) The study distributed self-administered questionnaires to citizenry of the City of
Ekurhuleni, City of Johannesburg, City of Tshwane, Lesedi local municipality,
Randfontein local municipality and Westonaria local municipality.
Sampling
Probability Non-probability
Simple
random Systematic
Stratified
random Cluster
Quota
Purposive
Snowball Convenience
Self-
Selection
Multi-
stage
Extreme
case Heterogeneous
Homogeneous
Critical
case
Typical
case
Figure 4-3: Sampling techniques. Source: Saunders, Lewis and Thornhill (2009).
85
The study also used probabilistic, simple random sampling for selecting participants, not only
does each element of the sampling frame have a known probability of being selected, but
they each have the same probability of selection (Blanche & Durrheim, 2002). In probability
sampling, every element in the target population must have a known chance of being
selected into the sample. Probability samples ensure that the researcher has no say in the
choice of the respondents. This means the study cannot bias the selection process, and
consequently the results of the study.
4.11.2 Sampling frame
Sampling frame as a list of all elements in population (Johnson & Christensen, 2008). On the
other hand Saunders, et al. (2009) argued that the sampling frame for any probability sample
is a complete list of all the cases in the population from which your sample will be drawn.
The study involved residents under the jurisdiction of three Metropolitans, namely; City of
Ekurhuleni, City of Johannesburg and City of Tshwane and three local municipalities from
two Districts, namely Lesedi local municipality, Randfontein local municipality and
Westonaria local municipality.
4.11.3 Sample size
Deciding on an appropriate sample size to be drawn from a population of interest is an
essential aspect of planning a research study (Hayat, 2013). Consideration should be given
to the size of a realistic sample as well as to the benefits and risks associated with more or
fewer participants (Hayat, 2013). Ngulube (2005) argued that there are other factors, which
determine a sample size (Ngulube, 2005) for example, purpose of the study, population size,
practical constraints and time frame (Lenth, 2001).
The sample of this research is divided into categories of respondents, namely citizenry from
City of Ekurhuleni, City of Johannesburg, City of Tshwane, Lesedi local municipality,
Randfontein local municipality and Westonaria local municipality and the Executive members
from these metropolitans and local municipalities.
Since the research used Factor Analysis and T-test, the sample choice is dependent on
multivariate analysis conditions. One of the important condition of the analysis is that it
needs a sample whose size should be 100 or larger (Malhotra, 2006).This applies to
citizenry category of respondents who completed self-administered questionnaires. Sample
size for the executive members of the City of Ekurhuleni, City of Johannesburg, City of
86
Tshwane, Lesedi local municipality, Randfontein local municipality and Westonaria local
municipality was purposively selected because they possess the information regarding the
policies and strategies for these municipalities.
4.12 Data collection
Creswell and Poth(2018) highlighted that data collection involves much more than just
collecting the data. It means anticipating ethical issues involved in gaining permissions,
conducting a good mixed sampling strategy, developing means of recording and collecting
information, responding to issues as they arise in the field and storing the data securely
(Creswell & Poth, 2018) A number of different methods are used to collect data. The
techniques that are used for getting the required information from the sample include
personal interviews, telephone interviews, questionnaires, diaries and meters (Blanche &
Durrheim, 2002). Other data collection techniques such as observation and documentary
analysis are also worth mentioning. The current study therefore applied several data
collection method as used under the assumption that disadvantages posed in one method
was counterbalanced via advantages in another. The research used self-administered
questionnaires, structured interviews and documentary analysis in collecting data for both
quantitative and qualitative methodologies Authorisation letter to collect data from
municipalities is on Annexure D.
4.12.1 Primary data
Primary data is that which is derived from first-hand sources and this can be historical first-
hand sources, or the data derived from the respondents in survey or interview data (Bryman,
2011). For example, data derived from statistical collections such as the census can
constitute primary data and likewise, data that is derived from other researchers may also be
used as primary data, or it may be represented by a text being analysed (Flick, 2011).
4.12.1.1 Interviews
An interview is considered to be a social interaction based on a conversation (Creswell &
Poth, 2018). Creswell and Poth (2018) explained further that an interview is where
knowledge is constructed in an interaction between the interviewer and the interviewee.
There are three kinds of interviews, namely: unstructured, structured, and semi-structured.
Face-to-face interview was the original way of gathering survey information, and is still
extensively used today. This is one of the instruments the study used to gather data.The
research used structured interviews to collect data from top level managers of the City of
87
Ekurhuleni, City of Johannesburg, City of Tshwane, Lesedi local municipality, Randfontein
local municipality and Westonaria local municipality. The study developed 15 interview
questions. Annexure B shows interview protocols for Executive Managers. Face-to face
interviews have the highest response rate and permit the longest and most complex
questionnaires. The researcher controlled the sequence of questions and can use some
probes. In order to solve the challenge of response bias the research interviewed as many
top level managers as possible and asked the same questions in different ways until the
study gets to a point of saturation. Reliability, validity and practicability of the research
instruments were guaranteed by pre-testing the interview guide.
4.12.1.2 Questionnaire
A questionnaire was adopted as the appropriate data collection tool for the quantitative
research in this study. The questionnaire was constructed to include the dependent variables
as inferred from the secondary research and as specified in the research objectives of this
study. This research used a quantitative self-administered questionnaire which is based on
completely structured items with closed ended questions for different sections. These
sections sought some answers on perceptions, attitudes and opinions on the uptake and use
of ICT in improving service delivery in local authorities. Self-administered questionnaire was
distributed to the selected respondents from identified sample from the population of the City
of Ekurhuleni, City of Johannesburg, City of Tshwane, Lesedi local municipality, Randfontein
local municipality and Westonaria local municipality. Annexure A provides the English
version of the questionnaire.
A questionnaire is a self-report data collection instrument that each research participant fills
in as part of a research study (Johnson & Christensen, 2008).Three methods may be used
to collect data in surveys, namely a mail (self-administered) questionnaire, a personal face-
to-face interview and a telephone interview (Malhotra, 2004; Babbie & Mouton, 2003).
Self-administered questionnaires specifically offer two primary advantages. Firstly, self-
administered questionnaires can be distributed to a large number of respondents in a short
time, and secondly, self-administered questionnaires allow for anonymity, which increases
the probability of honest responses (Mitchell & Jolley, 2013).The advantage of administering
the questionnaire is that it would be more effective and efficient as the respondents are
spread across the province (Curwin & Slater, 2004). Onwuegbuzie and Leech (2006)
highlighted thatself-administered questionnaires are cheap and easy to administer, preserve
confidentiality, can be completed at respondent’s convenience and can be administered in a

88
standard manner (Onwuegbuzie & Leech, 2006). Onwuegbuzie and Leech (2006) argued
that the questionnaire can be designed on a Likert scale to enhance validity and reliability
(Onwuegbuzie & Leech, 2006). The study specifically chose the Likert scale as it is applied
when performing seductive-based research of quantitative in nature (Onwuegbuzie & Leech,
2006). The current research study applied the Likert scale to the constructs of e-governance
and service delivery model and how it improves service delivery. A draft questionnaire was
developed using input from literature and the research questions. This questionnaire draft
was pre-tested, modified and administered using convenience sampling in order to increase
the reliability and validity of the findings.
4.12.2 Secondary data
The study made an analysis of Integrated Development Plans (IDP), minutes of meetings,
strategic plan documents and the Statutory Acts of the City of Ekurhuleni, City of
Johannesburg, City of Tshwane, Lesedi local municipality, Randfontein local municipality
and Westonaria local municipality which governs the operation of municipalities in
understanding the role they should play in delivering services to the citizens.Secondary data
is that which is derived from the work or opinion of other researchers (Newman, 1998).
Newman (1998) gave an example that conclusions of a research article can constitute
secondary data because it is information that has already been processed by another.
Kothari (2004) added that analysis conducted on statistical surveys can constitute secondary
data. Newspapers may prove both a primary and secondary source for data, depending on
whether the reporter was actually present (Kothari, 2004).
4.13 Data analysis
Questionnaire and interview data which was gathered was analysed by applying quantitative
and qualitative methodology respectively. This research adopted sequential explanatory
strategy as discussed by Cresswell (1998) that qualitative results can be of paramount
important to give some insight and interpret the findings emanating from quantitative study.
During this stage of the research process, data collected are converted into a format that can
be used to inform the research problem.
4.13.1 Quantitative analysis
When data are processed, they need to be prepared and then analysed (Serfontein, 2010).
Data preparation was done by extracting data from questionnaires so that these can be read
and manipulated by computer software using SPSS. In this study numerical responses were
89
entered into an electronic spreadsheet file for respondents who answered the questions on
the questionnaire. For the purposes of this research, a combination of both charts and tables
are used in producing the descriptive statistics, which relate to the demographic profile of the
participants. Variables for this research are illustrated in Figure 3-8 in Chapter 3. The Factor
Analysis focused on five factors, namely Internet usage and connectivity, municipality
services, service delivery output, impact of e-governance and e-governance outcome.
4.13.1.1 Descriptive statistics
Descriptive statistics are statistics that are used to describe the characteristics of the sample
taken or in other words profile the sample taken (Gerber & Hall, 2013). Gerber and Hall
(2013) argued that no inferences can be drawn from this kind of statistical analysis, mere
profile of the data collected. Frequencies, means and standard deviations are normally
produced with these nominal biographical variables being depicted with pie/bar charts or
tables (Gerber & Hall, 2013). For the purposes of this research, tables are used in producing
the descriptive statistics, which relate to the demographic profile of the participants.
4.13.1.2 Exploratory Data Analysis (EDA)
Once data have been entered and checked for errors, the analysis of the study is ready to
start. Tukey’s (1977) exploratory data analysis (EDA) approach is useful in these initial
stages. This approach emphasises the use of diagrams to explore and understand the
collected data, emphasising the importance of using the data to guide the choices of
analysis techniques. As this study would expect, the researcher believed that it is important
to keep the research questions and objectives in mind when exploring the data.
After carrying out descriptive analysis on demographic profile, the study continued to carry
out EDA by using Factor Analysis. The Factor Analysis focused on five factors, namely
Internet usage and connectivity, municipality services, service delivery output, impact of e-
governance and e-governance outcome. EDA can also help to check for violations of the
assumptions that underpin specific statistical analysis (Howell, 1997). This type of analysis
set tone for this research as it assisted in identify key variables which concern issues of e-
governance and service delivery in local authorities.
4.13.1.3 Inferential statistics
After carrying out factor analysis, the researcher did inferential statistics by making use of T-
test using Analysis of variance (ANOVA). Inferential statistics as the method of assessing
90
the significance of the data and the results obtained (Blaxter, Hughes &Tight, 2003).
Through inferential statistics, the next step from descriptive statistics analysis was
undertaken and established statistical tools to analyse the data and interpret the results was
applied. By applying this method, conclusions can be made. Cronbach Alpha Coefficient was
therefore used to test the reliability of the factors identified.
4.13.2 Qualitative analysis
This study collected data from individual executive members of municipalities and managed
to collect volume of data in natural conversation settings. Interviews recorded from executive
members of municipalities were transcribed. In this analysis, five primary documents, namely
P1, P2, P3 and P5, from the field were considered. In this study, the researcher used an
electronic data analysis tool called Atlas.Ti 7.2. This study used Atlas.Ti to captures
categories of incidents and properties of these categories as codes and quotations
respectively and quotations are synonymous with incidents and codes or categories are
groups of incidents whose choice was informed by the theoretical sensitivity of the
researcher. In this study, the collected data was open coded and analyzed.
A qualitative data analysis tool can accept textual, graphical, audio or video materials as
input to be interpreted (Mavetera, 2011). All the analysis work from the municipalities under
study was done and was contained in a container called a Hermeneutic Unit. Mavetera
(2011) indicated that the input documents are referred to as Primary Documents (PD).
Qualitative methods, however, are interpretive and reflexive, and they generate subjective
data based on the perspectives of the interviewees (Mason, 1996). Cresswell (1998) argued
that the methodological focus of qualitative research is to draw out reports of lived
experiences through a variety of means, including in-depth interviewing or taped recordings
of conversations between individuals or groups.
4.13.3 Content Analysis
Since this research is based on ICT tools for e-governance in improving service delivery, the
study used an additional data analysis of content analysis which has been defined by
Neuendorf (2001) as the systematic, objective, quantitative analysis of message
characteristics. Content analysis comprised the existing definitions of content analysis into a
description of the method as a systematic, replicable technique for compressing many words
of text into fewer content categories based on explicit rules of coding (Stemler, 2001). As a
91
tool, content analysis has been used to analyse trends and patterns in the documents,
videos, and websites (Parylo, 2012)
Although the content can be described as words, images, videos, tools, or services, this
study focused on the websites content of the City of Ekurhuleni, City of Johannesburg, City
of Tshwane, Lesedi local municipality, Randfontein local municipality and Westonaria local
municipality. A content inventory of websites domain, of the municipalities’ vision, mission,
objectives, strategy, electronic services, other non-electronic services and websites hits by
customers was created and was revisited throughout the analysis.
4.14 Assessing and demonstrating the quality and rigour of the research design
Quality of research design can be measured using validity and reliability. Validity is defined
as the appropriateness, meaningfulness, and usefulness of the specific inferences made
from the measures (Dooley, 2001). Reliability is the degree to which observed scores are
free from errors of measurement (Dooley, 2001).
According to Yin (2002), case study researchers need to guarantee construct validity
(through the triangulation of multiple sources of evidence, chains of evidence, and member
checking), This study therefore triangulate multiple sources of evidence in terms of IDP for
different municipalities and how they are promoting the use of ICT as part of e-governance.
Various municipal websites which were used under this study and executive members who
were interviewed were validated. Internal validity (through the use of established analytic
techniques such as pattern matching) analytic techniques through the use of computer
software such as SPSS and Atlas Ti 7.2 to determine group of matching incidences, external
validity (through analytic generalization), and reliability (through case study protocols and
databases).
Stake(1995) discussed the issues regarding validation of the gathered data in a chapter
called “Triangulation.” Stake (1995) offered four strategies for triangulating data: data source
triangulation this study used questionnaires and interviews to gather data concerning the
uptake and usage of ICT by citizen in accessing municipality services. Investigator
triangulation brings alternative perspectives, backgrounds and social characteristics
(Neuman, 2014). This study interviewed executive members from municipalities with
different background and social characteristics in order to understand the e-governance
strategies which can be used to improve service delivery through ICT tools. Theory
triangulation requires using multiple theoretical perspectives to plan a study or interpret the
92
data (Neuman, 2014). In this study, various e-governance theories were triangulated to get
an understanding and evaluate which theory and theories can be used to feed into e-
governance framework that could be used in local authorities to improve service delivery
though the use of ICT. Methodological triangulation was applied in this study by mixing
qualitative and quantitative research approaches and data to get a full understanding of the
research questions for this study.
Data collected from questionnaires is deemed important to determine the degree to which it
will be reliable and internally valid. In order to determine the reliability and internal
consistency, the study used Cronbach’s Alpha to measures the internal reliability of a set of
related items (Hair, et al., 2006). This study used the following methods to enhance validity
and reliability:
4.14.1 Triangulation
Neuman (2014) defines triangulation as the idea that looks at something from multiple points
of view, which can improve accuracy. In this study, data source triangulation, investigator
triangulation, theory triangulation and methodological triangulation was used.
4.14.2 Pre-testing
Reliability and validity for the interview guide and the questionnaire used for this study was
increased by pre-testing and to check the practicability of these instruments (Kothari, 2004).
External validity deals with the findings of a study being applicable or generalizable beyond
the specific unit of analysis (Yin, 2003). Yin (2003) further argued that case study research
has drawn much criticism, especially from studies utilizing only one case. This study
addressed this criticism by using multiple case studies from six municipalities in Gauteng
Province, which could represent other municipalities with similar status in South Africa.
However, the collected data was deemed important to determine the degree to which it was
reliable and internally valid. Various methods can be used to measure reliability, but the
common measure of reliability is internal consistency. This research assessed consistency
of the entire scale by drawing on Cronbach’s Alpha (Hair, et al., 2006). Cronbach’s Alpha
measures the internal reliability of a set of related items identified in this study.
93
4.15 Ethical consideration
The research ethics for this study was guided by the ethical requirements of the North West
University for post graduate studies. See Annexure C for the ethical clearance certificate.
Ethics is defined as a set of beliefs about right and wrong behaviour in society and describes
the behaviour standards expected by a group (Reynolds, 2010). Reynolds (2010) explained
that the research survey should only be carried out in the field once informed consent from
the residents has been obtained. The researcher, however, did get consent and approval
from the citizens who participated in this study. The researcher was honest, accountable and
transparent with the community in this research process.
With the increased popularity of secondary data analysis from municipalities’ minutes and
other strategic documents the study guide against ethical issues by assuring that no harm
came to a subject through loss of anonymity. The study ensured that anonymity is
maintained by removing unnecessary identifying information prior to data analysis, and by
introducing strict data storage and handling procedures to ensure confidentiality (Finlayson,
Egan & Black, 1999).
In this study, the self-administered questionnaires were accompanied by an introductory
letter highlighting the purpose of the research. The introductory letter explained the
importance of respondents’ participation in the research. Confidentiality was also guaranteed
by assuring the participants that their information would not be made available to anyone
who is not directly involved in the study. Bailey (2007) argued that it is the researcher’s
responsibility to assure personal confidentiality of the participants.
4.16 Summary of choices of research methodology for current study
4.16.1 Research methodology
The current study is descriptive, describing a phenomenon as it exists, and analytical to
explain why or how something is happening as far as the uptake and use of ICT as part of e-
governance in improving service delivery in local authorities is concerned.
4.16.2 Research reasoning
This research uses deductive and inductive thinking in a distinctive sequence to address the
objectives of the study and to come up with e-governance framework that improves
94
4.16.3 Research paradigm (philosophy)
Quantitative research attempts to uncover reality and this reasoning forms the philosophical
assumption surround the research topic of a framework of e-governance to improve service
delivery by local authorities in South Africa.
4.16.4 Research approach
The research questions, which the research has posed, are both descriptive and
explanatory; therefore the research direction is a mixed method approach.
This study applied a mixed approach in data collection through the use of self-administered
questionnaires, from the six municipalities identified in the study and from interviews of
executive members from these municipalities, data analysis and interpretation of the
findings.
This study triangulated data collection methods by using interviews and self-administered
questionnaires. The study also triangulated models or theories of e-governance models.
Triangulation of data sources which include data from citizenry of Municipalities and
Executives members from Gauteng Province was done.
4.16.5 Research design
Explanatory research identifies and explains the role of ICT as part of e-governance in
improving service delivery in local authorities in South Africa. This research therefore
followed a mixed-methods research approach in order to utilise the advantages of both
quantitative and qualitative approaches.
The equal status design is used in this research in order to understand and explain the
uptake and usage of ICT by citizens in improving service delivery. This design was carried
out in two phases or sequentially:
(1) an initial quantitative instrument phase using self-administered questionnaire for
citizens from the municipalities, followed by
(2) a qualitative data collection phase using interviews for executive members from
identified municipalities.
Both data sets were used for descriptive and explanatory purposes.
95
4.16.6 Research process
Mixed method characteristics illustrated in Figure 4-2.
4.16.7 Research strategy
For the purpose of this study, this research used survey and case studies.
4.16.7.1 Survey
This research used the sample survey for home owners to get direction on research
questions on the uptake and usage of ICTs by citizens.
4.16.7.2 Case study
This study however uses a multiple case study. of the City of Ekurhuleni, City of
Johannesburg, City of Tshwane, Lesedi local municipality, Randfontein local municipality
and Westonaria local municipality to understand phenomenon within its real life context of e-
governance in these municipalities.
4.16.8 Reason for mixed method design
The reasons for using mixed method design in understanding e-governance in a bid to
improve service delivery in South African local authorities are summarised in Table 4-1.
4.16.9 Population
This research focuses on two sets of population, namely,
(1) the City of Ekurhuleni, City of Johannesburg, City of Tshwane, Lesedi local
municipality, Randfontein Local municipality and Westonaria Local municipality
citizenry, and
(2) the executives from those municipalities who are in charge of driving the
municipalities strategic plans. Table 4-2 shows the population from each district
municipality and the envisaged sample size.
4.16.10 Sampling
The population for this study is from Gauteng Province, which is divided into three
metropolitan municipalities namely; the City of Ekurhuleni, the City of Johannesburg and the
City of Tshwane. There are also the two district municipalities, namely Sedibeng and West
96
Rand. These districts are further subdivided into seven local municipalities. Table 4-2
illustrates the population size and the sample size. The researcher ensured that the sample
is collected in a systematic manner, so that the impact of the sample members on the results
can be estimated and evaluated.
4.16.10.1 Sampling procedure
(1) A non-probabilistic, purposive sampling approach was used to interview executive
members of the City of Ekurhuleni, the City of Johannesburg, the City of Tshwane,
Lesedi local municipality, Randfontein Local municipality and Westonaria local
municipality who are responsible for driving the strategic plans for these
municipalities.
(2) The study distributed self-administered questionnaires to citizenry of the City of
Ekurhuleni, City of Johannesburg, City of Tshwane, Lesedi local municipality,
Randfontein local municipality and Westonaria local municipality.
4.16.10.2 Sampling frame
The study involved residents under the jurisdiction of three Metropolitans, namely; City of
Ekurhuleni, City of Johannesburg and City of Tshwane and three local municipalities from
two Districts, namely Lesedi local municipality, Randfontein local municipality and
Westonaria local municipality.
4.16.10.3 Sampling size
This applies to citizenry category of respondents who completed self-administered
questionnaires. Sample size for the executive members of the City of Ekurhuleni, City of
Johannesburg, City of Tshwane, Lesedi local municipality, Randfontein local municipality
and Westonaria local municipality was purposively selected because they possess the
information regarding the policies and strategies for these municipalities.
4.16.11 Data collection
The research used self-administered questionnaires, structured interviews and documentary
analysis in collecting data for both quantitative and qualitative methodologies.
97
4.16.11.1 Primary data
The research used structured interviews to collect data from top level managers of the City
of Ekurhuleni, City of Johannesburg, City of Tshwane, Lesedi local municipality, Randfontein
local municipality and Westonaria local municipality. The study developed 15 interview
questions. Annexure B shows interview protocols for Executive Managers. Face-to face
interviews have the highest response rate and permit the longest and most complex
questionnaires. Researcher controlled the sequence of questions and can use some probes.
In order to solve the challenge of response bias the research interviewed as many top level
managers as possible and asked the same questions in different ways until the study gets to
a point of saturation. Reliability, validity and practicability of the research instruments were
guaranteed by pre-testing the interview guide.
A questionnaire was adopted as the appropriate data collection tool for the quantitative
research in this study. The questionnaire was constructed to include the dependent variables
as inferred from the secondary research and as specified in the research objectives of this
study. This research used a quantitative self-administered questionnaire which is based on
completely structured items with closed ended questions for different sections. These
sections sought some answers on perceptions, attitudes and opinions on the uptake and use
of ICT in improving service delivery in local authorities. Self-administered questionnaire was
distributed to the selected respondents from identified sample from the population of the City
of Ekurhuleni, City of Johannesburg, City of Tshwane, Lesedi local municipality, Randfontein
local municipality and Westonaria local municipality. Annexure A provides the English
version of the questionnaire.
The current research study applied the Likert scale to the constructs of e-governance and
service delivery model and how it improves service delivery. A draft questionnaire was
developed using input from literature and the research questions. This questionnaire draft
was pre-tested, modified and administered using convenience sampling in order to increase
the reliability and validity of the findings.
4.16.11.2 Secondary data
The study made an analysis of Integrated Development Plans (IDP), minutes of meetings,
strategic plan documents and the Statutory Acts of the City of Ekurhuleni, City of
Johannesburg, City of Tshwane, Lesedi local municipality, Randfontein local municipality
98
and Westonaria local municipality which governs the operation of municipalities in
understanding the role they should play in delivering services to the citizens.
4.16.12 Data analysis
This research adopted sequential explanatory strategy.
4.16.12.1 Quantitative analysis
Data preparation was done by extracting data from questionnaires so that these can be read
and manipulated by computer software using SPSS. In this study numerical responses were
entered into an electronic spreadsheet file for respondents who answered the questions on
the questionnaire. For the purposes of this research, a combination of both charts and tables
are used in producing the descriptive statistics, which relate to the demographic profile of the
participants. Variables for this research are illustrated in Figure 3-8 in Chapter 3. The Factor
Analysis focused on five factors, namely Internet usage and connectivity, municipality
services, service delivery output, impact of e-governance and e-governance outcome.
4.16.12.2 Qualitative analysis
This study collected data from individual executive members of municipalities and managed
to collect volume of data in natural conversation settings. Interviews recorded from executive
members of municipalities were transcribed. In this analysis, five primary documents, namely
P1, P2, P3 and P5, from the field were considered. In this study, the researcher used an
electronic data analysis tool called Atlas.Ti 7.2. This study used Atlas.Ti to captures
categories of incidents and properties of these categories as codes and quotations
respectively and quotations are synonymous with incidents and codes or categories are
groups of incidents whose choice was informed by the theoretical sensitivity of the
researcher. In this study, the collected data was open coded and analyzed.
4.16.12.3 Content analysis
Although the content can be described as words, images, videos, tools, or services, this
study focused on the websites content of the City of Ekurhuleni, City of Johannesburg, City
of Tshwane, Lesedi local municipality, Randfontein local municipality and Westonaria local
municipality. A content inventory of websites domain, of the municipalities’ vision, mission,
objectives, strategy, electronic services, other non-electronic services and websites hits by
customers was created and was revisited throughout the analysis.
99
4.16.13 Assessing and demonstrating the quality and rigour of the research design
Various municipal websites which were used in this study and executive members who were
interviewed were validated. Internal validity (through the use of established analytic
techniques such as pattern matching) analytic techniques through the use of computer
software such as SPSS and Atlas Ti 7.2 to determine group of matching incidences, external
validity (through analytic generalization), and reliability (through case study protocols and
databases).
Methodological triangulation was applied in this study by mixing qualitative and quantitative
research approaches and data to get a full understanding of the research questions for this
study. Data collected from questionnaires is deemed important to determine the degree to
which it will be reliable and internally valid. In order to determine the reliability and internal
consistency, the study used Cronbach’s Alpha to measures the internal reliability of a set of
related items.
4.16.13.1 Triangulation
In this study, data source triangulation, investigator triangulation, theory triangulation and
methodological triangulation was used.
4.16.13.2 Pre-testing
This study addressed this criticism by using multiple case studies from six municipalities in
Gauteng Province, which could represent other municipalities with similar status in South
Africa.
This research assessed consistency of the entire scale by drawing on Cronbach’s Alpha to
measure the internal reliability of a set of related items identified in this study.
4.17 Chapter conclusion
This chapter discussed the different research approaches, namely qualitative, quantitative
and the mixed method, as well as the motivation for selecting the mixed method for the
current study. The deductive and inductive inquiry for scientific strategy was highlighted. The
chapter discussed research philosophy of positivist, interpretivist and pragmatism. Research
design of mixed methods was discussed by comparing the dominant/less dominant versus
equal value status design. Research strategy of survey and multiple case studies was
discussed. Population for the study, sampling and sampling procedure was highlighted.

100
Sampling frame and sample size was also discussed. Data collection and data analysis was
highlighted. The chapter ended by discussing quality and rigour of the research design used
for the study. The next chapter will discuss quantitative data analysis, presentation and
discussion of the findings.
101
CHAPTER 5: QUANTITATIVE DATA ANALYSIS, PRESENTATION AND DISCUSSION
OF FINDINGS
5.1 Introduction
This chapter will focus on empirical analysis and results gathered from the study.
Quantitative data and findings from questionnaires data is reported, explained and
interpreted in order to reach conclusions. This section present result of research findings
derived from data analysis by using quantitative method. This section focuses on empirical
analysis and results emanating from data gathered from 600 respondents participating in this
study who completed questionnaires from six municipalities. Quantitative data analysis was
done using SPSS. All statistical tests were done at 5% level of significance.
This chapter has three sections. First section discusses descriptive statistics which
summarises sample data, using frequency tables and relationships between demographics.
This is followed by second section, which explains factor analysis for items which were used
to measure the role of ICT as part of e-governance in improving service delivery. Factor
analysis for these items was used to measure factors that explain the role of ICT use in
improving service delivery. Results of exploratory factor analyses were analysed. Normality
of data was assessed and Cronbach’s Alpha was used to assess reliability of constructs.
Relationships between constructs that demonstrated sufficient validity and reliability were
based on multiple independent variables and finally, gratifications was sought from using ICT
in improving service delivery were analysed using independent samples t-tests. Last section
deals with inferential analysis on the use of ICT for improving service delivery by local
authorities were explored. Figure 5-1 depicts a flow diagram of quantitative analysis.
5.2 Descriptive statistics
Demographic profile was analysed using frequency tables. Comparison was made on key
variables to assess how closely the sample characteristics resembled those of population as
a whole.
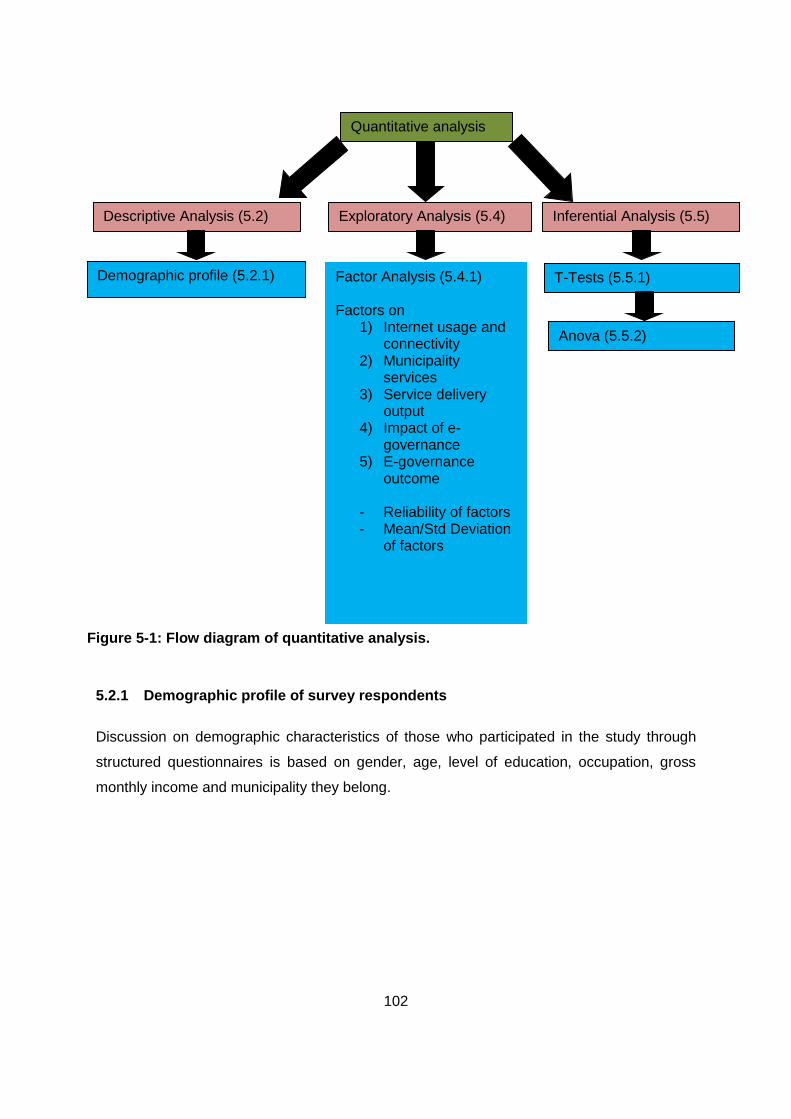
102
5.2.1 Demographic profile of survey respondents
Discussion on demographic characteristics of those who participated in the study through
structured questionnaires is based on gender, age, level of education, occupation, gross
monthly income and municipality they belong.
Quantitative analysis
Exploratory Analysis (5.4) Inferential Analysis (5.5) Descriptive Analysis (5.2)
Demographic profile (5.2.1) Factor Analysis (5.4.1) Factors on
1) Internet usage and connectivity
2) Municipality services
3) Service delivery output
4) Impact of e-governance
5) E-governance outcome
- Reliability of factors - Mean/Std Deviation
of factors
Anova (5.5.2)
T-Tests (5.5.1)
Figure 5-1: Flow diagram of quantitative analysis.
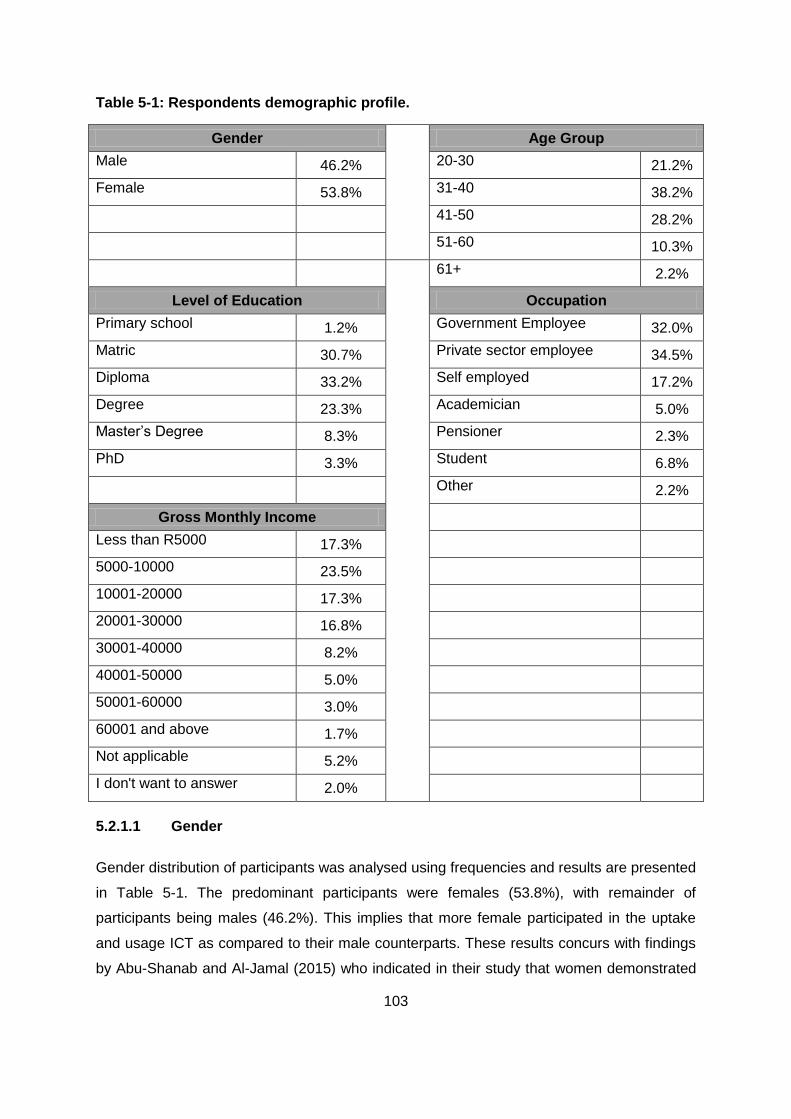
103
Table 5-1: Respondents demographic profile.
Gender Age Group
Male 46.2% 20-30 21.2%
Female 53.8% 31-40 38.2%
41-50 28.2%
51-60 10.3%
61+ 2.2%
Level of Education Occupation
Primary school 1.2% Government Employee 32.0%
Matric 30.7% Private sector employee 34.5%
Diploma 33.2% Self employed 17.2%
Degree 23.3% Academician 5.0%
Master’s Degree 8.3% Pensioner 2.3%
PhD 3.3% Student 6.8%
Other 2.2%
Gross Monthly Income
Less than R5000 17.3%
5000-10000 23.5%
10001-20000 17.3%
20001-30000 16.8%
30001-40000 8.2%
40001-50000 5.0%
50001-60000 3.0%
60001 and above 1.7%
Not applicable 5.2%
I don't want to answer 2.0%
5.2.1.1 Gender
Gender distribution of participants was analysed using frequencies and results are presented
in Table 5-1. The predominant participants were females (53.8%), with remainder of
participants being males (46.2%). This implies that more female participated in the uptake
and usage ICT as compared to their male counterparts. These results concurs with findings
by Abu-Shanab and Al-Jamal (2015) who indicated in their study that women demonstrated
104
their interest in ICT by being more active than men in using their university accounts to
access the Internet (5.9% of women as compared to 1.5% men). These results are in
contrast with a study conducted by Mbatha and Lesame (2013) who established that there
was a distinct male dominance in uptake of ICT.
These results do not agree with research done in Spain, where there is higher percentage of
ICT users among men as compared to women; men tend to be first movers to use new ICT,
and they also use it more than women (Gargallo-Castel, et al., 2010). These results differ
from research carried out in Spain because of context in which this study was conducted.
Spain is a developed country with high level of technology as compared to the level of
technology penetration in Africa. It can also be deduced that men in Spain have more time to
spend as compared to women who has more family responsibilities. This assertion have
however been overtaken by fast penetration of technology and gender equality policies
advocated in Africa. Gender however plays an important role in promotion, uptake and
usage of ICT for service delivery by citizens at local level in South Africa as both male and
female use services provided by municipalities.
5.2.1.2 Age
Furthermore, Table 5-1 shows distribution of respondents by age was measured using
frequencies. Results revealed that (21.2%) were aged between 20–30 years; (38.2%) were
between 31–40 years; (28.2%) were between 41–50 years; (10.3%) were aged between 51–
60 years; (2.2%) were older than 60 years of age. From these findings, it is clear that
majority of respondents were aged between 31–40 years, followed by those who were aged
between 41–50 years, while those older than sixty years were minority in the group. These
results imply that young people between the ages of 20–30 years who have just finished
school or university actively participate in the uptake and usage of ICT as these age groups
have time to spend with few responsibilities. This is followed by those who are in age groups
31–40. The numbers are decreasing as we move to older age groups of 31–40 years as the
group have now much financial obligations, such as bond payments for their homes, vehicle
loan repayment, and school fees. Their spending patterns shift from spending more money
and time on the usage of and uptake of ICT and time on internet because of many
responsibilities.
Findings of this study confirm those of the study by Khechine, Lakhal, Pascot and Bytha
(2014), which reveal that of young people are more likely to adopt new IT products due to
their tendency to pursue innovativeness. These findings almost concur with a study by Ayoo
105
(2001) who established that in developing countries those who are above the age of 40
years are often conservative and slow in keeping abreast of advances in ICT. Ayoo’s (2001)
study found a large number of respondents to be between the ages of 40–49 (47%), while a
significant percentage of respondents fell in the 30-39 age group (28%).
5.2.1.3 Level of education
Table 5-1 also revealed that (1.2%) of the respondents attended primary school; (30.7%)
with Matric education; ( 33.2%) with Diplomas; (23.3%) with Degrees; (8.3%) with Masters
Degrees and (3.3%) with doctoral degree (PhD). This implies that citizens with Matric
actively participate in the use and uptake of ICT. This could also mean that majority of
people who are employed in private and government institutions have Matric as their highest
qualification. Results also imply that there are few people with a doctoral degree, who
actively participate in the use and uptake of ICT. Larger number of respondents with primary
school level was from Randfontein local municipality (3.0%). Respondents with highest
qualification of PhD were found in City of Tshwane (7.0%) and Lesedi local municipality
(7.0%). These results reveal that those who are educated are in metro municipalities and
those who are not educated are found in local district municipalities, mainly because they
cannot afford the urban lifestyle.
Education appears to clearly influence adoption of e-government services. These findings
concur with Mukonza, Maserumale and Moeti (2016) who found out that percentage of
people who had used e-government and ICT services seemed to rise as level of education
rose (Mukonza, et al., 2016). Table 5-2 shows distribution of level of education by
municipality.
5.2.1.4 Occupation
Table 5-1 shows that in this study (32.0%) respondents who utilise services of municipalities
were government employees, (34.5%) were private sector employees, (17.2%) were self-
employed, (5.0%) were academicians; (2.3%) were pensioners; (6.8%) were students and
(2.2%) were in other categories. Results imply that citizens who work in private sector have
greater appreciation of uptake and usage of ICT as part of e-governance as their private
companies offer them internet access which allow access to municipality services through
their websites. Those who work in government make use of free WIFI and this encourages
them to increase their uptake and usage of ICT to access municipality services. Few
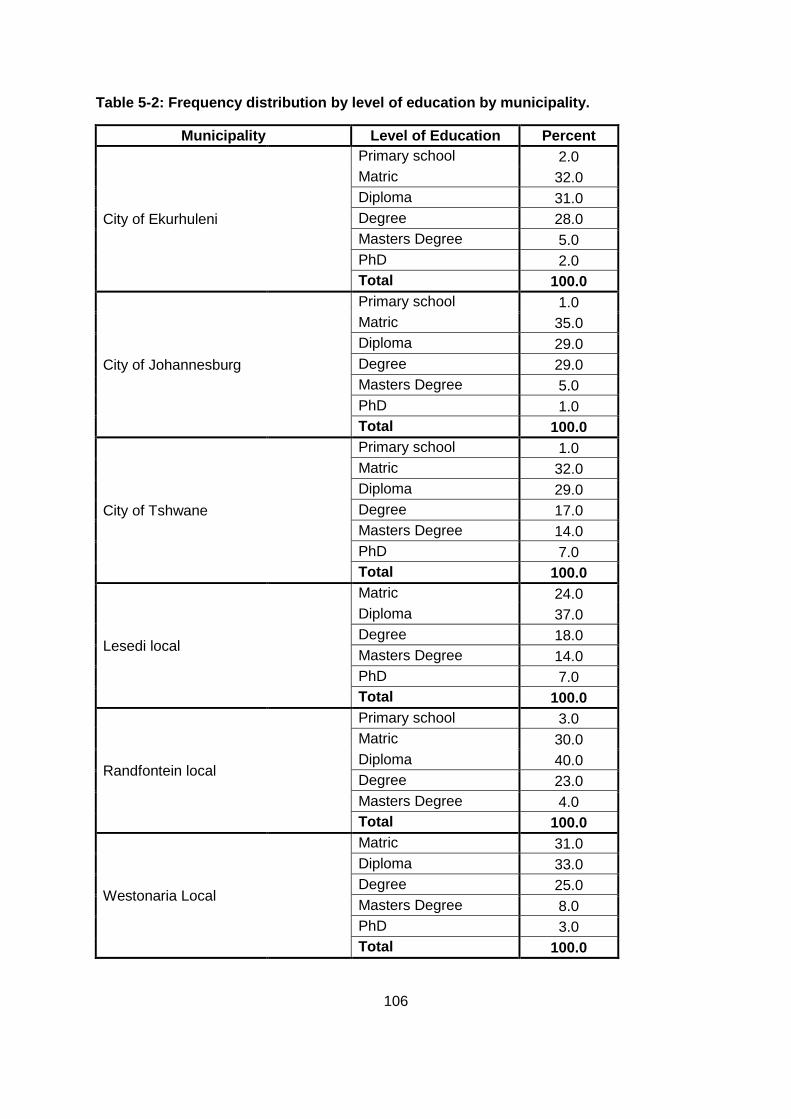
106
Table 5-2: Frequency distribution by level of education by municipality.
Municipality Level of Education Percent
City of Ekurhuleni
Primary school 2.0
Matric 32.0
Diploma 31.0
Degree 28.0
Masters Degree 5.0
PhD 2.0
Total 100.0
City of Johannesburg
Primary school 1.0
Matric 35.0
Diploma 29.0
Degree 29.0
Masters Degree 5.0
PhD 1.0
Total 100.0
City of Tshwane
Primary school 1.0
Matric 32.0
Diploma 29.0
Degree 17.0
Masters Degree 14.0
PhD 7.0
Total 100.0
Lesedi local
Matric 24.0
Diploma 37.0
Degree 18.0
Masters Degree 14.0
PhD 7.0
Total 100.0
Randfontein local
Primary school 3.0
Matric 30.0
Diploma 40.0
Degree 23.0
Masters Degree 4.0
Total 100.0
Westonaria Local
Matric 31.0
Diploma 33.0
Degree 25.0
Masters Degree 8.0
PhD 3.0
Total 100.0
107
students make use of ICT to access municipality services as these students are still staying
with parents who are responsible for paying bills.
5.2.1.5 Gross monthly income
The research found out that 17.3% fall in income bracket of less than R5 000 per month,
while 23.5% fall in income bracket of higher than R5 000–R10 000 per month as
summarized in Table 5-1.5.2% shows that income does not apply to respondents who
participated in this survey and 2.0% were not willing to disclosure their income. This
research found out that income appears to influence the use of ICT and e-governance.
These findings agree with Mukonza, Maserumale and Moeti (2016) who found out that
income also appears to influence e-government adoption; of those with a low income
(<R5 000 per month), a smaller percentage had adopted e-governance and ICT compared
to the next income group. On the other hand, a relatively high percentage of people in
medium income group had adopted the use of e-governance and ICT services. Those in
high income groups seemed to constitute a significantly low percentage of people who were
using e-governance and ICT services. This implies that high income group are preoccupied
with other things besides spending their time on issues relating to ICT and e-governance.
The results contradicts findings by Bearfield and Browman (2016) who found out that those
with higher levels of income were more likely to access government websites to get
information and to use online services than those with lower incomes. Similar differences
were found for users with higher levels of education versus those with less education
(Bearfield & Browman, 2016). These results imply that those who have resources can afford
to access municipality website and get whatever information they require and to do online
transactions. The findings therefore indicate that there is high uptake and usage of ICT by
those who are educated with high levels of income.
5.3 Exploratory analysis
5.3.1 Factor analysis
Factor analysis was carried out for the following reasons:
To establish emerging factors from the designed questionnaire.
To test the structure validity of the perceptions towards the use of ICTs in accessing
municipality services.
To explain relationships within a set of observed variables.
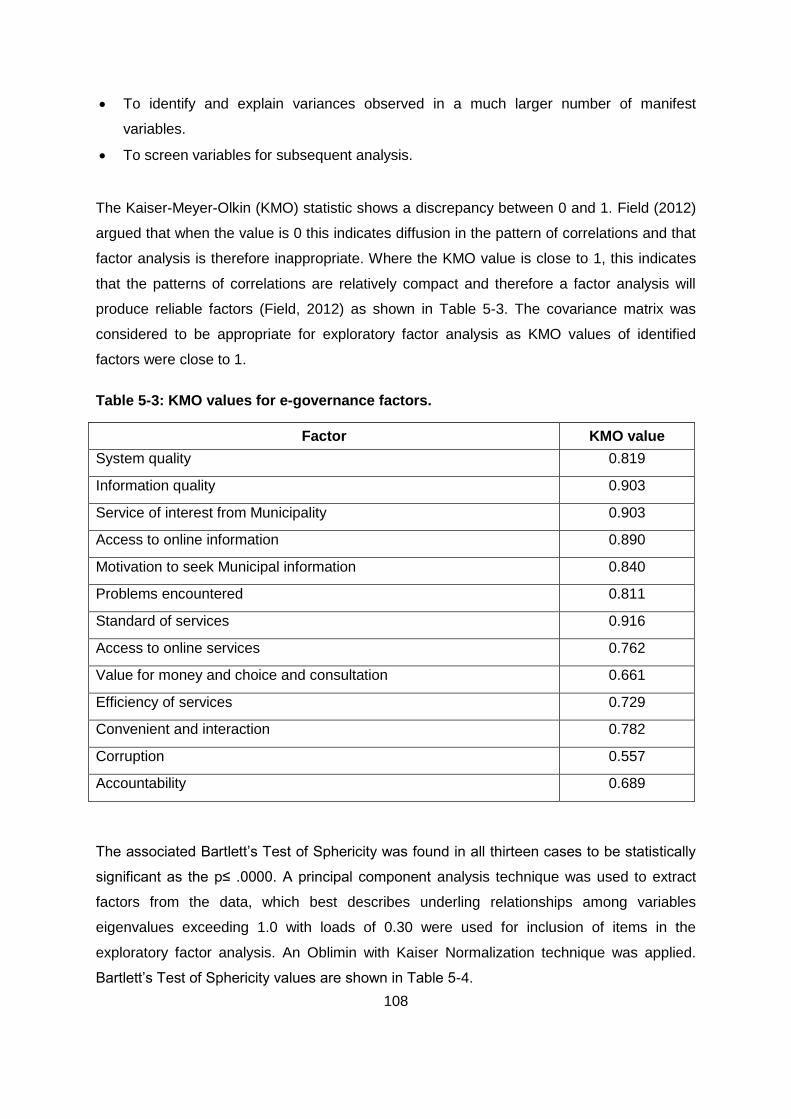
108
To identify and explain variances observed in a much larger number of manifest
variables.
To screen variables for subsequent analysis.
The Kaiser-Meyer-Olkin (KMO) statistic shows a discrepancy between 0 and 1. Field (2012)
argued that when the value is 0 this indicates diffusion in the pattern of correlations and that
factor analysis is therefore inappropriate. Where the KMO value is close to 1, this indicates
that the patterns of correlations are relatively compact and therefore a factor analysis will
produce reliable factors (Field, 2012) as shown in Table 5-3. The covariance matrix was
considered to be appropriate for exploratory factor analysis as KMO values of identified
factors were close to 1.
Table 5-3: KMO values for e-governance factors.
Factor KMO value
System quality 0.819
Information quality 0.903
Service of interest from Municipality 0.903
Access to online information 0.890
Motivation to seek Municipal information 0.840
Problems encountered 0.811
Standard of services 0.916
Access to online services 0.762
Value for money and choice and consultation 0.661
Efficiency of services 0.729
Convenient and interaction 0.782
Corruption 0.557
Accountability 0.689
The associated Bartlett’s Test of Sphericity was found in all thirteen cases to be statistically
significant as the p≤ .0000. A principal component analysis technique was used to extract
factors from the data, which best describes underling relationships among variables
eigenvalues exceeding 1.0 with loads of 0.30 were used for inclusion of items in the
exploratory factor analysis. An Oblimin with Kaiser Normalization technique was applied.
Bartlett’s Test of Sphericity values are shown in Table 5-4.
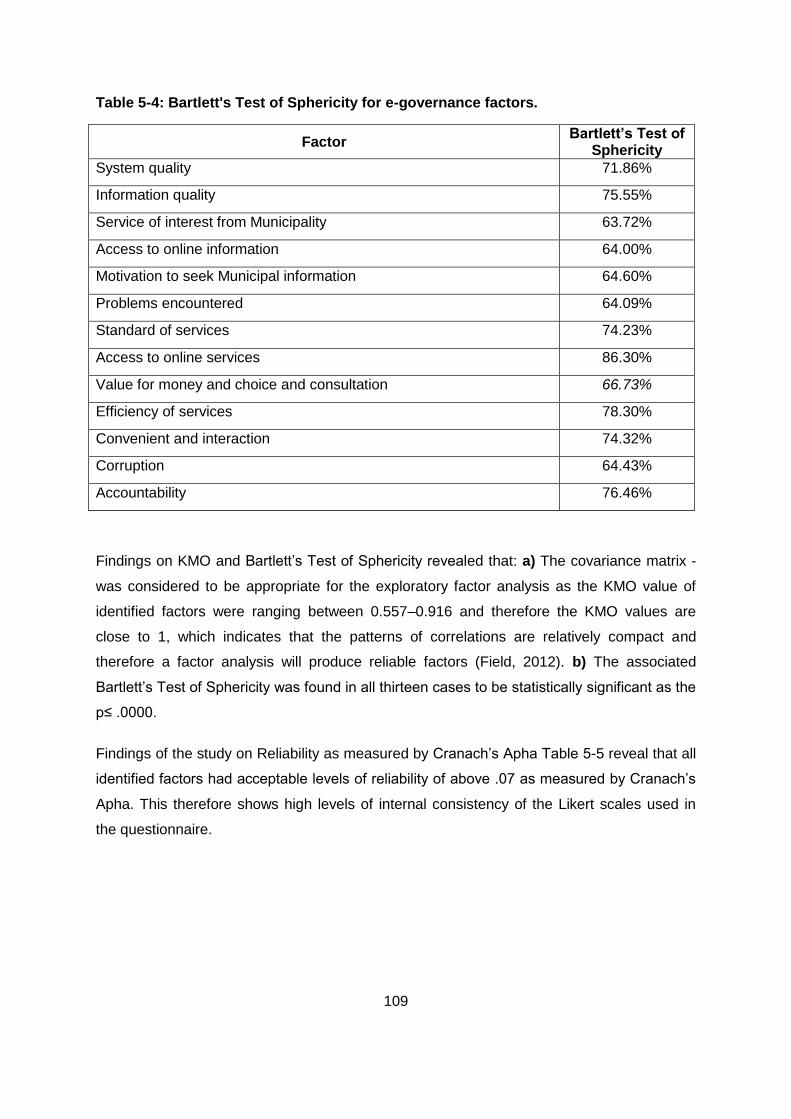
109
Table 5-4: Bartlett's Test of Sphericity for e-governance factors.
Factor Bartlett’s Test of
Sphericity System quality 71.86%
Information quality 75.55%
Service of interest from Municipality 63.72%
Access to online information 64.00%
Motivation to seek Municipal information 64.60%
Problems encountered 64.09%
Standard of services 74.23%
Access to online services 86.30%
Value for money and choice and consultation 66.73%
Efficiency of services 78.30%
Convenient and interaction 74.32%
Corruption 64.43%
Accountability 76.46%
Findings on KMO and Bartlett’s Test of Sphericity revealed that: a) The covariance matrix -
was considered to be appropriate for the exploratory factor analysis as the KMO value of
identified factors were ranging between 0.557–0.916 and therefore the KMO values are
close to 1, which indicates that the patterns of correlations are relatively compact and
therefore a factor analysis will produce reliable factors (Field, 2012). b) The associated
Bartlett’s Test of Sphericity was found in all thirteen cases to be statistically significant as the
p≤ .0000.
Findings of the study on Reliability as measured by Cranach’s Apha Table 5-5 reveal that all
identified factors had acceptable levels of reliability of above .07 as measured by Cranach’s
Apha. This therefore shows high levels of internal consistency of the Likert scales used in
the questionnaire.
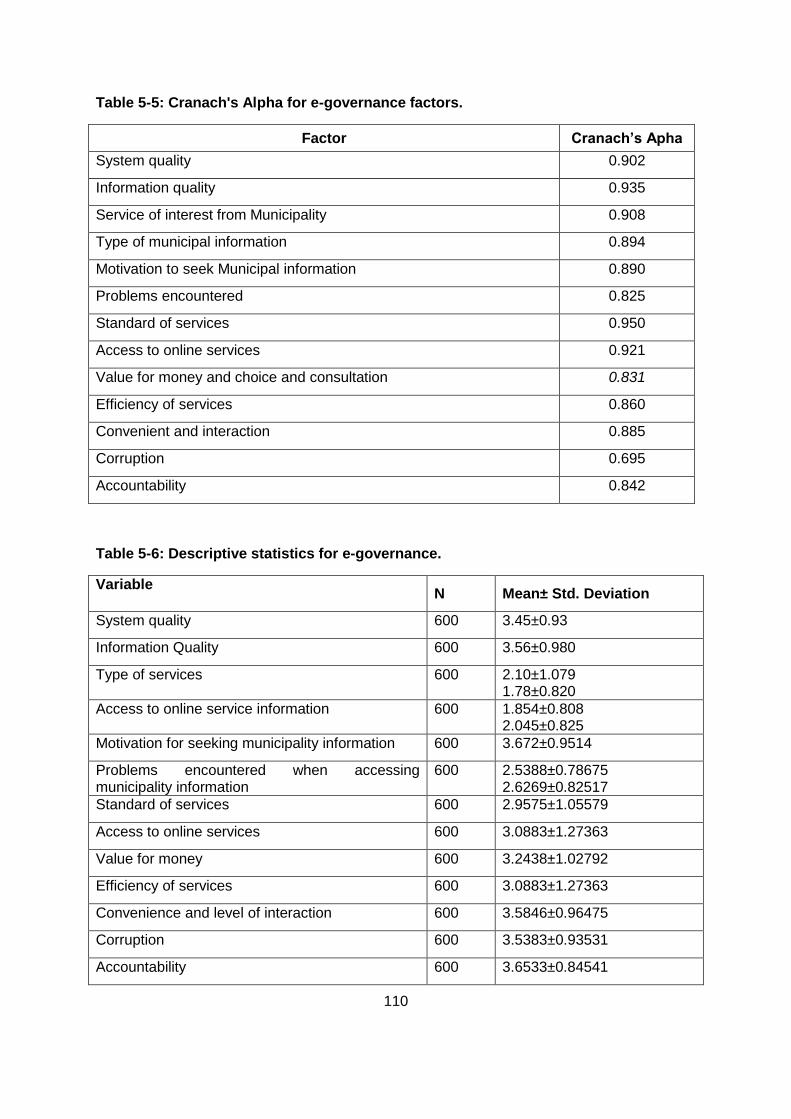
110
Table 5-5: Cranach's Alpha for e-governance factors.
Factor Cranach’s Apha
System quality 0.902
Information quality 0.935
Service of interest from Municipality 0.908
Type of municipal information 0.894
Motivation to seek Municipal information 0.890
Problems encountered 0.825
Standard of services 0.950
Access to online services 0.921
Value for money and choice and consultation 0.831
Efficiency of services 0.860
Convenient and interaction 0.885
Corruption 0.695
Accountability 0.842
Table 5-6: Descriptive statistics for e-governance.
Variable
N Mean± Std. Deviation
System quality 600 3.45±0.93
Information Quality 600 3.56±0.980
Type of services 600 2.10±1.079 1.78±0.820
Access to online service information 600 1.854±0.808 2.045±0.825
Motivation for seeking municipality information 600 3.672±0.9514
Problems encountered when accessing municipality information
600 2.5388±0.78675 2.6269±0.82517
Standard of services 600 2.9575±1.05579
Access to online services 600 3.0883±1.27363
Value for money 600 3.2438±1.02792
Efficiency of services 600 3.0883±1.27363
Convenience and level of interaction 600 3.5846±0.96475
Corruption 600 3.5383±0.93531
Accountability 600 3.6533±0.84541
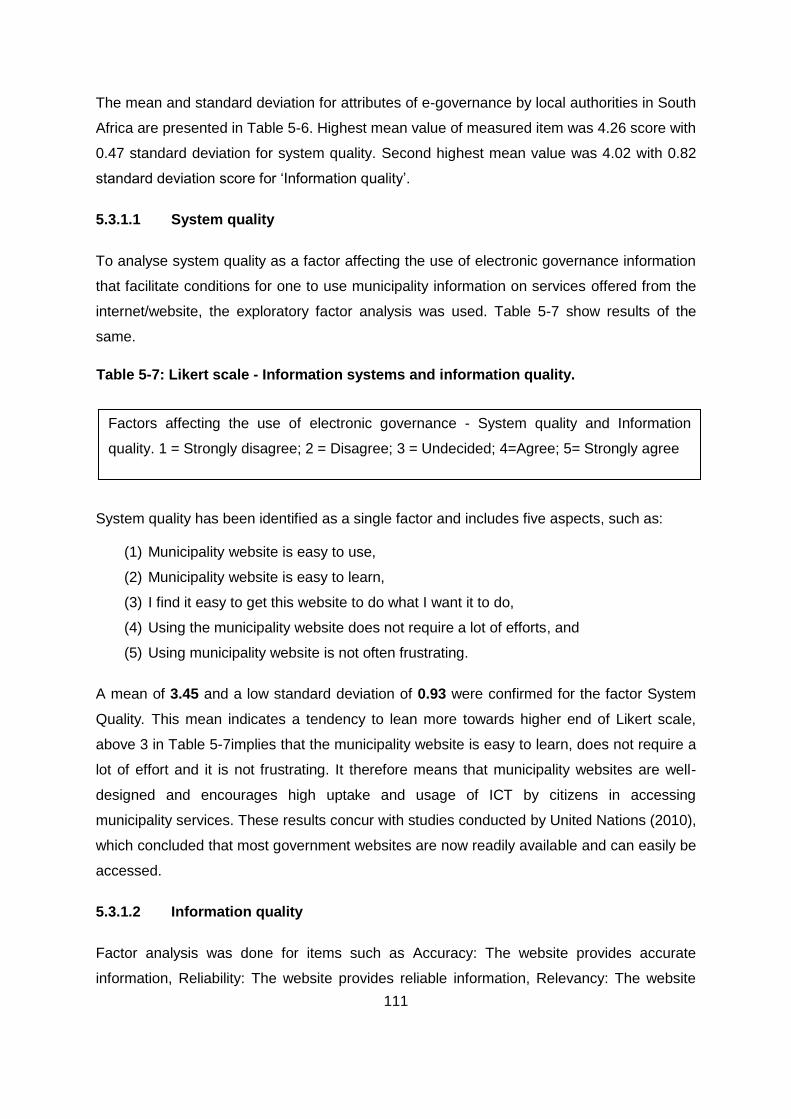
111
The mean and standard deviation for attributes of e-governance by local authorities in South
Africa are presented in Table 5-6. Highest mean value of measured item was 4.26 score with
0.47 standard deviation for system quality. Second highest mean value was 4.02 with 0.82
standard deviation score for ‘Information quality’.
5.3.1.1 System quality
To analyse system quality as a factor affecting the use of electronic governance information
that facilitate conditions for one to use municipality information on services offered from the
internet/website, the exploratory factor analysis was used. Table 5-7 show results of the
same.
System quality has been identified as a single factor and includes five aspects, such as:
(1) Municipality website is easy to use,
(2) Municipality website is easy to learn,
(3) I find it easy to get this website to do what I want it to do,
(4) Using the municipality website does not require a lot of efforts, and
(5) Using municipality website is not often frustrating.
A mean of 3.45 and a low standard deviation of 0.93 were confirmed for the factor System
Quality. This mean indicates a tendency to lean more towards higher end of Likert scale,
above 3 in Table 5-7implies that the municipality website is easy to learn, does not require a
lot of effort and it is not frustrating. It therefore means that municipality websites are well-
designed and encourages high uptake and usage of ICT by citizens in accessing
municipality services. These results concur with studies conducted by United Nations (2010),
which concluded that most government websites are now readily available and can easily be
accessed.
5.3.1.2 Information quality
Factor analysis was done for items such as Accuracy: The website provides accurate
information, Reliability: The website provides reliable information, Relevancy: The website
Factors affecting the use of electronic governance - System quality and Information
quality. 1 = Strongly disagree; 2 = Disagree; 3 = Undecided; 4=Agree; 5= Strongly agree
Table 5-7: Likert scale - Information systems and information quality.
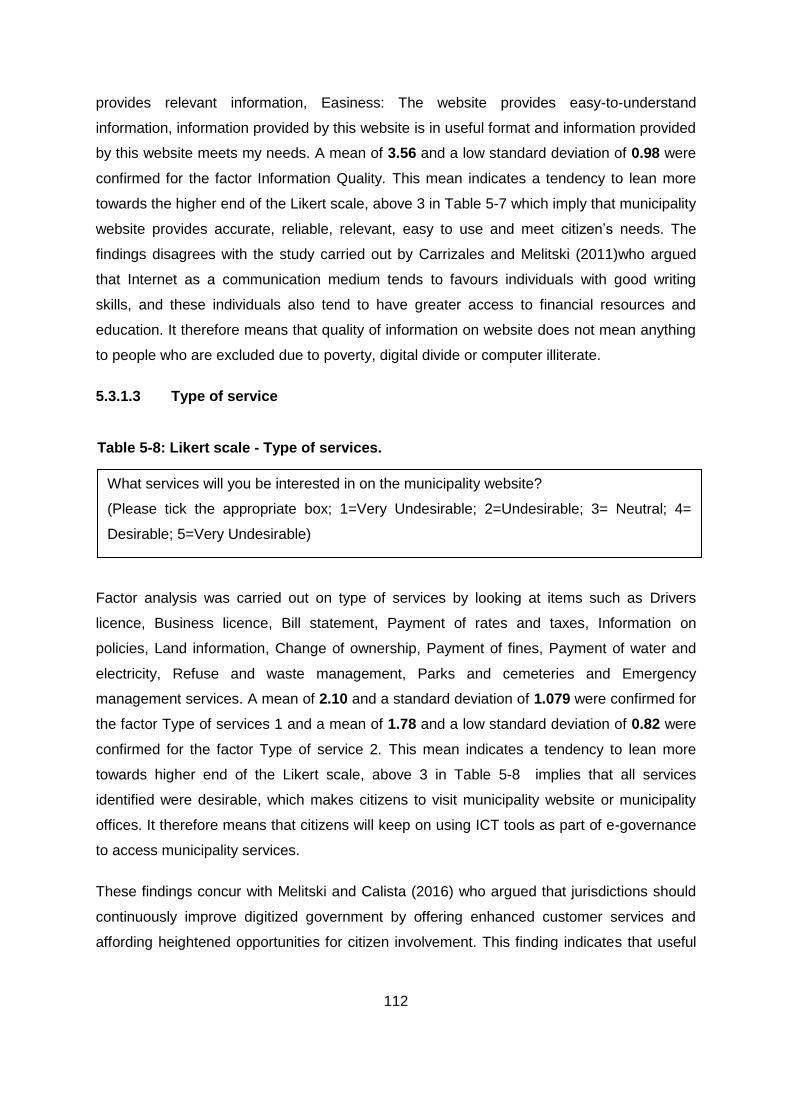
112
provides relevant information, Easiness: The website provides easy-to-understand
information, information provided by this website is in useful format and information provided
by this website meets my needs. A mean of 3.56 and a low standard deviation of 0.98 were
confirmed for the factor Information Quality. This mean indicates a tendency to lean more
towards the higher end of the Likert scale, above 3 in Table 5-7 which imply that municipality
website provides accurate, reliable, relevant, easy to use and meet citizen’s needs. The
findings disagrees with the study carried out by Carrizales and Melitski (2011)who argued
that Internet as a communication medium tends to favours individuals with good writing
skills, and these individuals also tend to have greater access to financial resources and
education. It therefore means that quality of information on website does not mean anything
to people who are excluded due to poverty, digital divide or computer illiterate.
5.3.1.3 Type of service
Factor analysis was carried out on type of services by looking at items such as Drivers
licence, Business licence, Bill statement, Payment of rates and taxes, Information on
policies, Land information, Change of ownership, Payment of fines, Payment of water and
electricity, Refuse and waste management, Parks and cemeteries and Emergency
management services. A mean of 2.10 and a standard deviation of 1.079 were confirmed for
the factor Type of services 1 and a mean of 1.78 and a low standard deviation of 0.82 were
confirmed for the factor Type of service 2. This mean indicates a tendency to lean more
towards higher end of the Likert scale, above 3 in Table 5-8 implies that all services
identified were desirable, which makes citizens to visit municipality website or municipality
offices. It therefore means that citizens will keep on using ICT tools as part of e-governance
to access municipality services.
These findings concur with Melitski and Calista (2016) who argued that jurisdictions should
continuously improve digitized government by offering enhanced customer services and
affording heightened opportunities for citizen involvement. This finding indicates that useful
What services will you be interested in on the municipality website?
(Please tick the appropriate box; 1=Very Undesirable; 2=Undesirable; 3= Neutral; 4=
Desirable; 5=Very Undesirable)
Table 5-8: Likert scale - Type of services.
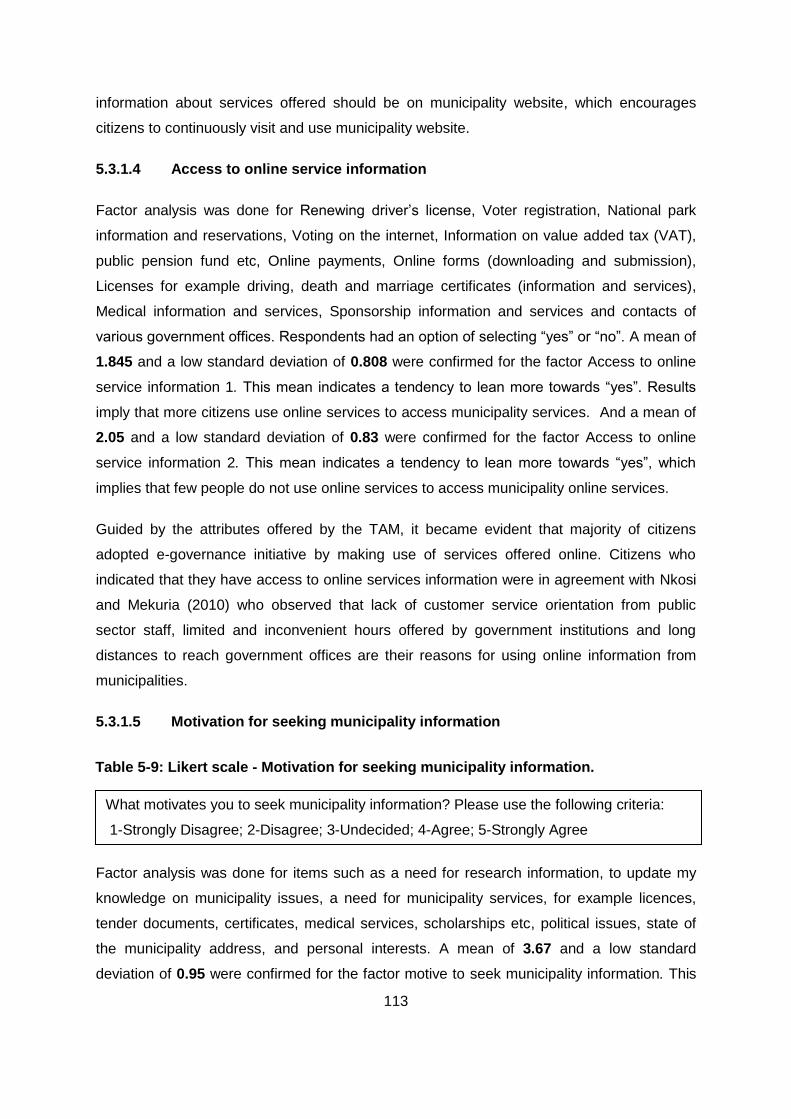
113
information about services offered should be on municipality website, which encourages
citizens to continuously visit and use municipality website.
5.3.1.4 Access to online service information
Factor analysis was done for Renewing driver’s license, Voter registration, National park
information and reservations, Voting on the internet, Information on value added tax (VAT),
public pension fund etc, Online payments, Online forms (downloading and submission),
Licenses for example driving, death and marriage certificates (information and services),
Medical information and services, Sponsorship information and services and contacts of
various government offices. Respondents had an option of selecting “yes” or “no”. A mean of
1.845 and a low standard deviation of 0.808 were confirmed for the factor Access to online
service information 1. This mean indicates a tendency to lean more towards “yes”. Results
imply that more citizens use online services to access municipality services. And a mean of
2.05 and a low standard deviation of 0.83 were confirmed for the factor Access to online
service information 2. This mean indicates a tendency to lean more towards “yes”, which
implies that few people do not use online services to access municipality online services.
Guided by the attributes offered by the TAM, it became evident that majority of citizens
adopted e-governance initiative by making use of services offered online. Citizens who
indicated that they have access to online services information were in agreement with Nkosi
and Mekuria (2010) who observed that lack of customer service orientation from public
sector staff, limited and inconvenient hours offered by government institutions and long
distances to reach government offices are their reasons for using online information from
municipalities.
5.3.1.5 Motivation for seeking municipality information
Factor analysis was done for items such as a need for research information, to update my
knowledge on municipality issues, a need for municipality services, for example licences,
tender documents, certificates, medical services, scholarships etc, political issues, state of
the municipality address, and personal interests. A mean of 3.67 and a low standard
deviation of 0.95 were confirmed for the factor motive to seek municipality information. This
What motivates you to seek municipality information? Please use the following criteria:
1-Strongly Disagree; 2-Disagree; 3-Undecided; 4-Agree; 5-Strongly Agree
Table 5-9: Likert scale - Motivation for seeking municipality information.
114
mean indicates a tendency to lean more towards the higher end of the Likert scale, above 3
(Table 5-9). The findings imply that citizens agree on what motivates them to seek
municipality information. Results confirm findings by Mbatha and Lesama (2013) who
reveals that South African government envisages that the inception of ICTs will promote and
support electronic commerce applications, economic development and educational
endeavours.
5.3.1.6 Problems encountered when accessing municipality information
Factor analysis for problems encountered when accessing municipality information was
done. Factor analysis was performed on items such as poor infrastructure makes access
difficult, information was too difficult to find, I do not have search skills, Information is
complicated to understand, Internet usage is expensive, Important information on
municipality website is located far, Language is a problem and Policy and regulation on
internet usage do not support access of information. A mean of 2.5 and a low standard
deviation of 0.77 were confirmed for the factor Problems encountered when accessing
municipality information 1. This mean indicates a tendency to lean more towards the higher
end of the Likert scale, above 3 (Table 5-10), which implies that citizens encounter serious
problems in accessing municipality information. This discourages citizens to use and accept
ICT as part of e-governance. They get frustrated by challenges they encounter in trying to
access municipality information from the website. And a mean of 2.63 and a low standard
deviation of 0.83 were confirmed for the factor Problems encountered when accessing
municipality information 2. This mean indicates a tendency to lean more towards the higher
end of the Likert scale, above 2 (Table 5-10), which implies that citizens encounter moderate
problems in accessing municipality information. This however force citizens to continue
persevere on the uptake and usage of ICT in trying to access municipality information
through their website.
These results concur with findings by Chaterera (2012) who reviewed those respondents
who participated in the study expressed dissatisfaction with technical challenges and
What problems do you encounter when you try to access this information? Tick the
appropriate answer following the criteria below:1=Not at all a problem; 2=Minor problem;
3= Moderate problem; 4= Serious problem
Table 5-10: Likert scale - Problems encountered when accessing municipality information.
115
inadequacy of information offered by government websites of Zimbabwe. Chaterera (2012)
indicated that most of these respondents reported that they did not depend on information
provided by the Zimbabwe government online, and would rather visit government offices or
make a telephone call. This implies that these challenges are common in Africa as it is still
behind in terms of ICT infrastructure. The UN E-government Survey (United Nations, 2014)
further reports that lack of access to both ICT and educational infrastructures, places major
constraints on the development of e-government in developing countries, especially in
Africa. South Africa is therefore facing such challenges. These results also agrees with
Mawela, Ochara and Twinomurinzi (2017) who identifies that South Africa have 11 official
languages and is faced with a challenge of ensuring that government caters appropriately to
its citizens in their language of choice for service delivery. Mawela, et al., (2017) found out
that local government authority assessed municipal websites and found that all municipal
websites are in English which in fact concur with the results of this study. The situation
therefore creates communication barriers with its citizens thereby causing a low uptake and
usage of ICT by citizens. This discussion addresses research object 1.
5.3.1.7 Standard of service
Factor analysis was performed on items such as Municipality website provides reliable
online services, Municipality website provides services at the times it promises, Municipality
website gives prompt online services to citizens, Municipality website is designed with
citizens’ best interest at heart, Municipality website is designed to satisfy needs of citizens,
Types of online services offered by municipality met my needs, Online services offered by
municipality are accurate and Online services offered by municipality are up-to-date. A mean
of 2.96 and a standard deviation of 1.56 were confirmed for the factor Standard of services.
This mean indicates a tendency to lean more towards the higher end of the Likert scale,
above 3 (Table 5-11), which implies that municipality offer effective standard of service to
their citizens through e-governance.
The results agrees with (Pfeffer, Baud, Martinez, & Sridharan, 2008) who believed that more
and better information can lead to more efficient planning and decision-making, and
subsequently more effective urban governance in terms of inclusion which therefore indicate
Service delivery output. Please put tick mark on respective boxes
Scale: 1=Very Ineffective; 2=Ineffective; 3= As Usual; 4=Effective; 5=Very Effective
Table 5-11: Likert scale - Standard of services.
116
that citizens interests are met. These augments addresses research objective number 2
which focus on assessing services offered by municipality.
5.3.1.8 Access to online service
Factor analysis was done for items such as Municipality is promoting access and use of
online services, Online services are better than manual services and how is feedback like
when you make an enquiry online? A mean of 3.09 and a standard deviation of 1.27 were
confirmed for the factor Access to online services. This mean indicates a tendency to lean
more towards the higher end of the Likert scale, above 3 (Table 5-11), which implies that
municipalities effectively promote access to use of online services and offer better online
services than manual and give online feedback to their citizens.
These results concur with Scholl and AlAwadhi (2015) and Scholl and Scholl (2014) who
argued that local governments can play major roles in creating smart urban spaces, for
example by making available modern and effective public administration and comprehensive
online services based on novel ICTs, which indicate that municipalities should take a leading
role in promoting access and use of online services. These augments addresses research
objective 2 which focus on assessing services offered by municipality.
5.3.1.9 Value for money
Factor analysis for value for money was done. Factor analysis was performed for items such
as Citizens are involved in budgeting process by municipality, Citizens are given opportunity
to have payment plan options for their bills, Online services offered by municipality are
priced correctly and Online services offered by municipality exceed my expectations. A
mean of 3.24 and a standard deviation of 1.03 were confirmed for the factor Value for
money. This mean indicates a tendency to lean more towards the higher end of the Likert
scale, above 3 (Table 5-11).This imply that municipalities offers effective services which are
of value to their citizens with services priced correctly. The results indicate that citizens are
encouraged to pay for their bills if services are priced correctly. These augments addresses
research objective 1 and 2 which focus on uptake and usage of ICT by citizens and object 2
for assessing services offered by municipality.
5.3.1.10 Efficiency of services
Impact of e-governance [Please put tick mark (v) on respective boxes] Scale: Very
Dissatisfied (1), Dissatisfied (2), As Usual (3), Satisfied (4), Very Satisfied (5)
Table 5-12: Likert scale - Impact of e-governance.
117
Factor analysis was performed for items such as offering of online services by municipalities
improve the speed on delivering services, efficiency of services encourages citizens to pay
their bills and queuing for services is the thing of the past. A mean of 3.09 and a standard
deviation of 1.27 were confirmed for the factor efficiency of services. This mean indicates a
tendency to lean more towards the higher end of the Likert scale, above 3 (Table 5-12)
which implies that citizens were very satisfied with efficiency of services from their
municipalities.
The results concur with (Karunasena, Deng &Singh, 2011); Weerakkody, Irani, Lee,
Osman& Hindi (2015) who reveals that the benefits expected from e-Government include
innovations that can facilitate efficient delivery of government services which creates public
value. It therefore indicates that online services saves citizen’s time in doing business with
municipality. These augments addresses research objective 1 which focus on uptake and
usage of ICT and objective 2 for assessing services offered by municipality.
5.3.1.11 Convenience and level of interaction
Factor analysis for convenience and level of interaction was done. Factor analysis was done
for items such as e-governance promote services to be offered 24/7, Distance and time is
not an issue with e-governance, e-governance promote interaction between citizens and
municipality and e-governance promotes interaction between municipality and its
stakeholders. A mean of 3.58 and a low standard deviation of 0.96 were confirmed for the
factor Convenience and level of interaction. This mean indicates a tendency to lean more
towards the higher end of the Likert scale, above 3 (Table 5-12) which implies that citizens
were very satisfied with convenience and level of interaction with their municipality.
Abasilimi and Edet (2015) highlighted the following as the benefits of e-governance: efficient
delivery of government services to the public, better interactions with business organizations,
and citizen empowerment through access to ICT. Abasilimi and Edet (2015) assertion agree
with findings of this study, as municipality allows stakeholder participation through its various
interactive platforms especially with metropolitan municipalities. These augments addresses
research objective number 1 2 and 3 which focus on uptake and usage of ICT, objective 2
for assessing services offered by municipality and objective 3 for Examining existing e-
governance theories and lessons learnt.
118
5.3.1.12 Corruption
Factor analysis was performed for items such as Middleman interference is removed,
Adjudication of tender is done electronically - no interference of human beings and Cash
transactions is eliminated. A mean of 3.54 and a standard deviation of 0.94 were confirmed
for the factor Corruption. This mean indicates a tendency to lean more towards the higher
end of the Likert scale, above 3 (Table 5-12) which implies that citizens were very satisfied
on efforts made by municipalities in addressing corruption through the use of ICT tools.
Bertot, Jaeger & Grimes(2010) in their study found out that e-government can be used as a
tool to prevent corruption. Lollar (2006) also reveal that if government’s work cannot be seen
or verified, then citizens are more likely to suspect corruption. These findings concur with the
results found in this study. It indicates that corruption can be address by promoting e-
governance in municipalities. These augments addresses research objective number 1 and
2 which focus on uptake and usage of ICT and objective 2 for assessing services offered by
municipality.
5.3.1.13 Accountability
Factor analysis for accountability was done. Factor analysis was performed for items such
as Implementation of e-governance by municipalities can make them answerable of their
action and decision towards citizens, Implementation of e-governance by municipalities
makes them answerable in their actions and decisions to stakeholders and I am able to
communicate with government officials through the government website/email/ internet. A
mean of 3.65 and a low standard deviation of 0.85 were confirmed for the factor
Accountability. This mean indicates a tendency to lean more towards the higher end of Likert
scale, above 3 (Table 5-13) which implies that citizens agree that e-governance brought
accountability in municipality.
Mawela, et al., (2017) argued that ITC is not a backroom function but is part and parcel of
trying to achieve this responsive and accountable local government. Argument by Mawela,
e-governance outcomes [Please put tick mark (v) on respective boxes] [Scale: 1=
Strongly disagree; 2= Disagree; 3= Neither agree or disagree; 4=Agree; 5=Strongly agree
Table 5-13: Likert scale - e-governance outcome.
119
et al., (2017) agree with findings of this study which established that that transparency
implies open access to government, communication from government, and implies that the
government will be held accountable for their decisions and actions through the openness of
information provided to the public. The study indicate that for successful implementation of
e-governance in local authorities, municipalities needs to incorporate aspect of accountability
in their framework that will check decisions made by municipalities in delivering services to
citizens. These augments addresses research objective number 1, 2 and 3 which focus on
uptake and usage of ICT and objective 2 for assessing services offered by municipality and
objective 3 for framework e-governance in municipalities.
5.4 Inferential analysis
Inferential analysis has been used in this study as part of sequential exploratory study. This
study used inferential analysis to make judgements on the observed difference between
groups for gender and type of services interested, type of municipal information accessed
online, motivation to seek municipality information, problems on accessing municipality
information, standard of services, choice and consultation, access to online services,
efficiency of services, convenience and interaction, accountability, transparency and
effectiveness for metro and local district municipalities. The study also used inferential
analysis to make inferences on the observed differences between groups for access to
internet and type of services interested, type of municipal information accessed online,
motivation to seek municipality information, problems on accessing municipality information,
standard of services, choice and consultation, access to online services, efficiency of
services, convenience and interaction, accountability, transparency and effectiveness for
Metro and Local District municipalities.
5.4.1 Analysis of Variance (ANOVA)
Analysis of variance (ANOVA) was employed to ascertain if there are any significant
differences in the extent to which the different variables measures e-governance in different
municipalities in dependent variables caused by individual main effects and the interaction
between these variables.
5.4.1.1 T-Tests
The objective of this study was to examine and explain the uptake and usage of ICT tools for
service delivery by citizens at selected local government municipalities in South Africa. To
this end, the influence of demographic data and service delivery data on ICT usage and
120
service delivery was analysed using t-tests and one-way ANOVA tests for Metros and Local
District Municipalities.
5.4.1.1.1 The influence of demographic characteristics on use of ICT usage for service
delivery
T-tests and one-way ANOVAs were performed to investigate whether gender and internet
access had an influence on ICT usage and service delivery for Metros and Local District
Municipalities. The aim was to establish the accessibility to municipality’s information,
standard of services, choice, consultation and value for money, access to online services,
efficiency of services, convenience and level of interaction, corruption, transparency and
effectiveness. The following null hypotheses were formulated to investigate the stated
relationships.
Hoa - There is no relationship between gender and type of services interested, type of
municipal information accessed online, motivation to seek municipality information, problems
on accessing municipality information, standard of services, choice and consultation, access
to online services, efficiency of services, convenience and interaction, accountability,
transparency and effectiveness.
Hob – There is no relationship between access to internet and type of services interested,
type of municipal information accessed online, motivation to seek municipality information,
problems on accessing municipality information, standard of services, choice and
consultation, access to online services, efficiency of services, convenience and interaction,
accountability, transparency and effectiveness.
5.4.1.1.2 Independent t-tests to assess the relationship between gender and identified
variables for each municipality
A t-tests was conducted to ascertain if there exist significant relationship between gender for
metros and local district municipalities and type of services interested, type of municipal
information accessed online, motivation to seek municipality information, problems on
accessing municipality information, standard of services, choice and consultation, access to
online services, efficiency of services, convenience and interaction, accountability,
transparency and effectiveness all had a value smaller than 1.96 and significance levels >
0.05 for City of Ekurhuleni, City of Johannesburg, Lesedi local, Randfontein local and
Westonaria local. The study rejects the null Hypotheses H0a (the notion that there is no
relationship between gender and the aforementioned variables).
121
Middleman interference is removed on tender process, Adjudication of tender is done
electronically - no interference of human beings, Cash transactions are eliminated was
statistically significantly different for City of Tshwane (t=-2.460, p=0.016), an independent
samples t-test was performed in Table 5-14.
The findings reveal that there was thus not a significant difference between female and male
with regard to type of services interested, type of municipal information accessed online,
motivation to seek municipality information, problems on accessing municipality information,
standard of services, choice and consultation, access to online services, efficiency of
services, convenience and interaction, accountability, transparency and effectiveness. All
had a value smaller than 1.96 and significance levels > 0.05 for City of Ekurhuleni, City of
Johannesburg, Lesedi local, Randfontein local and Westonaria local.
5.4.1.1.3 Independent t-tests to assess the relationship between Access to internet and
identified variables for each municipality
A t-tests was conducted to ascertain if there exist significant relationship between access to
internet and type of municipal information accessed online, motivation to seek municipality
information, problems on accessing municipality information, standard of services, choice
and consultation, access to online services, efficiency of services, convenience and
interaction, accountability, transparency and effectiveness all had a value smaller than 1.96
and significance levels > 0.05 for City of Ekurhuleni and Westonaria local and therefore, the
null hypothesis that assumes equal means could not be rejected. The study rejects the null
Hypotheses H0b (the notion that there is no relationship between access to internet
and the aforementioned variables).
In order to investigate whether differences in the means between access to internet with
regard to Problems on accessing municipality information, Convenience and interaction,
Accountability, Transparency and Effectiveness for City of Johannesburg and Type of
municipal information accessed online for City of Tshwane, Type of services interested for
Lesedi Local and Type of services, Choice and Consultation, Transparency and
Effectiveness for Randfontein were statistically significantly different, an independent
samples t-test was performed. Results are summarised in Table 5-14 and Table 5-17.
The results therefore show that there was no significant difference between access to
internet or not with regard to; Type of services interested, Type of municipal information
accessed online, Motivation to seek municipality information, Problems on accessing

122
municipality, Standard of Services, Choice and Consultation, Access to online services,
Efficiency of Services, Convenience and interaction, Accountability, Transparency and
Effectiveness. All had a value smaller than 1.96 and significance levels > 0.05 for City of
Ekurhuleni and Westonaria Local.
The results also indicate that all tested variables had a value lower than 1.96 at the 0.05
level of significance for City of Ekurhuleni and Westonaria local municipalities. The study,
therefore rejects the null hypothesis (H0b) that ‘there is no relationship between access to
internet and type of service interested, type of municipal information access online,
motivation to seek municipal information, problems on assessing municipality information,
standard of service, choice, consultation, access to online services, efficiency of service,
convenience/level of interaction, corruption, accountability, transparency/effectiveness in
municipality e-governance’.
5.4.2 ANOVAs
The analysis of demographic information provided an overview of the sample per
Municipality and assessed whether respondent profiles were similar across six
Municipalities. Type of services, Municipal information access, motivation for seeking
information, problems encountered when accessing information, standard of services,
access to online services choice and consultation and value for money, efficiency of
services, convenience, level of interaction and corruption, accountability, transparency and
efficiency measures were analysed by means of various statistical techniques. A one-way
analysis of variance (ANOVA) and the Welch robust test for equality of means were used to
test for significant variations between measures. Where applicable, post hoc tests were
conducted to ascertain nature of group differences. The findings of one-way ANOVA, Welch
test and post hoc tests are discussed in this chapter.
5.4.2.1 Influence of demographic and other e-governance variables
In order to investigate whether statically significant differences existed between the eight
variables age, education, occupation and income categories (independent variable for the
ANOVA) and motive to seek municipality information, standard of services, choice,
consultation and value for money, access to online services, efficiency of services,
convenience and level of interaction, corruption, transparency and effectiveness (dependent
variable), a one-way ANOVA was conducted. An ANOVA was the appropriate technique as
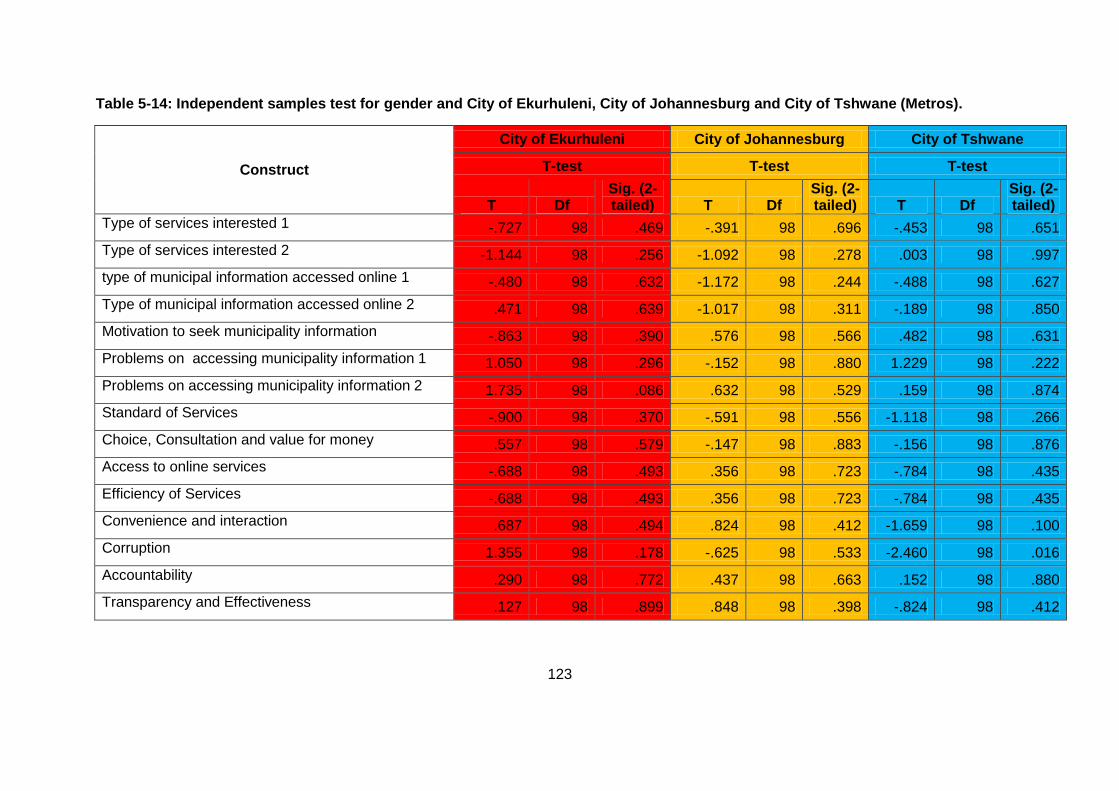
123
Table 5-14: Independent samples test for gender and City of Ekurhuleni, City of Johannesburg and City of Tshwane (Metros).
Construct
City of Ekurhuleni City of Johannesburg City of Tshwane
T-test T-test T-test
T Df Sig. (2-tailed) T Df
Sig. (2-tailed) T Df
Sig. (2-tailed)
Type of services interested 1 -.727 98 .469 -.391 98 .696 -.453 98 .651
Type of services interested 2 -1.144 98 .256 -1.092 98 .278 .003 98 .997
type of municipal information accessed online 1 -.480 98 .632 -1.172 98 .244 -.488 98 .627
Type of municipal information accessed online 2 .471 98 .639 -1.017 98 .311 -.189 98 .850
Motivation to seek municipality information -.863 98 .390 .576 98 .566 .482 98 .631
Problems on accessing municipality information 1 1.050 98 .296 -.152 98 .880 1.229 98 .222
Problems on accessing municipality information 2 1.735 98 .086 .632 98 .529 .159 98 .874
Standard of Services -.900 98 .370 -.591 98 .556 -1.118 98 .266
Choice, Consultation and value for money .557 98 .579 -.147 98 .883 -.156 98 .876
Access to online services -.688 98 .493 .356 98 .723 -.784 98 .435
Efficiency of Services -.688 98 .493 .356 98 .723 -.784 98 .435
Convenience and interaction .687 98 .494 .824 98 .412 -1.659 98 .100
Corruption 1.355 98 .178 -.625 98 .533 -2.460 98 .016
Accountability .290 98 .772 .437 98 .663 .152 98 .880
Transparency and Effectiveness .127 98 .899 .848 98 .398 -.824 98 .412
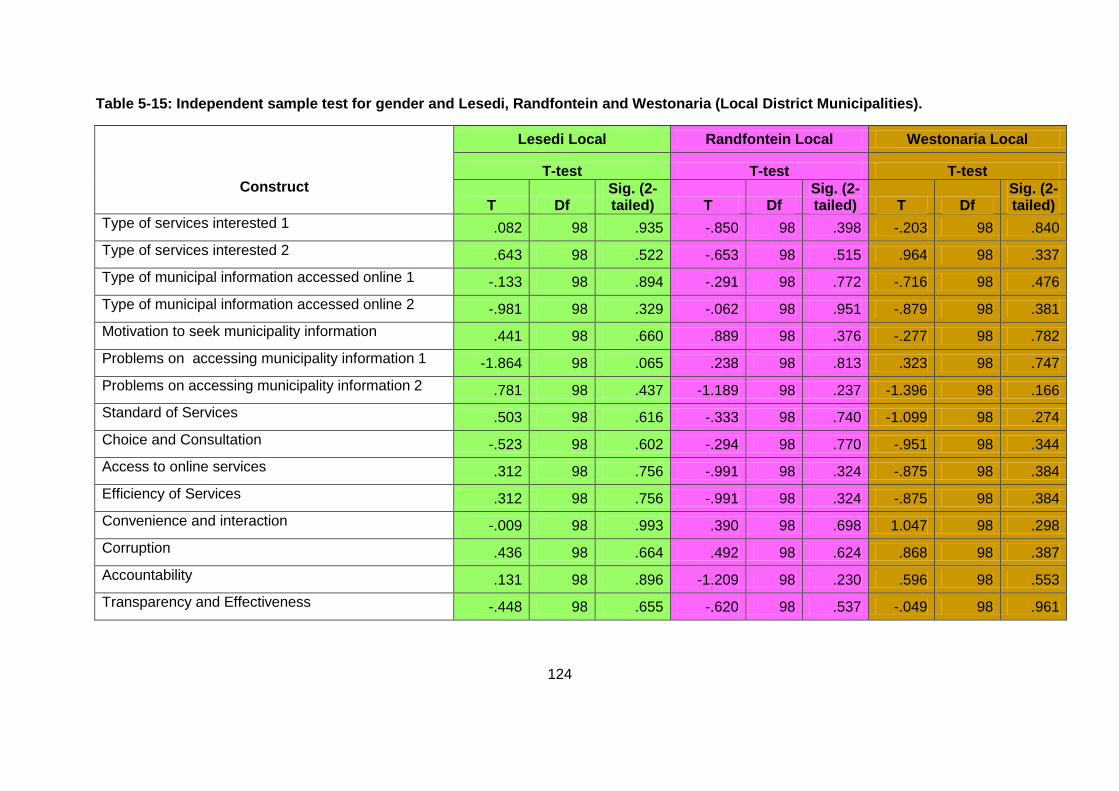
124
Table 5-15: Independent sample test for gender and Lesedi, Randfontein and Westonaria (Local District Municipalities).
Construct
Lesedi Local Randfontein Local Westonaria Local
T-test T-test T-test
T Df Sig. (2-tailed) T Df
Sig. (2-tailed) T Df
Sig. (2-tailed)
Type of services interested 1 .082 98 .935 -.850 98 .398 -.203 98 .840
Type of services interested 2 .643 98 .522 -.653 98 .515 .964 98 .337
Type of municipal information accessed online 1 -.133 98 .894 -.291 98 .772 -.716 98 .476
Type of municipal information accessed online 2 -.981 98 .329 -.062 98 .951 -.879 98 .381
Motivation to seek municipality information .441 98 .660 .889 98 .376 -.277 98 .782
Problems on accessing municipality information 1 -1.864 98 .065 .238 98 .813 .323 98 .747
Problems on accessing municipality information 2 .781 98 .437 -1.189 98 .237 -1.396 98 .166
Standard of Services .503 98 .616 -.333 98 .740 -1.099 98 .274
Choice and Consultation -.523 98 .602 -.294 98 .770 -.951 98 .344
Access to online services .312 98 .756 -.991 98 .324 -.875 98 .384
Efficiency of Services .312 98 .756 -.991 98 .324 -.875 98 .384
Convenience and interaction -.009 98 .993 .390 98 .698 1.047 98 .298
Corruption .436 98 .664 .492 98 .624 .868 98 .387
Accountability .131 98 .896 -1.209 98 .230 .596 98 .553
Transparency and Effectiveness -.448 98 .655 -.620 98 .537 -.049 98 .961
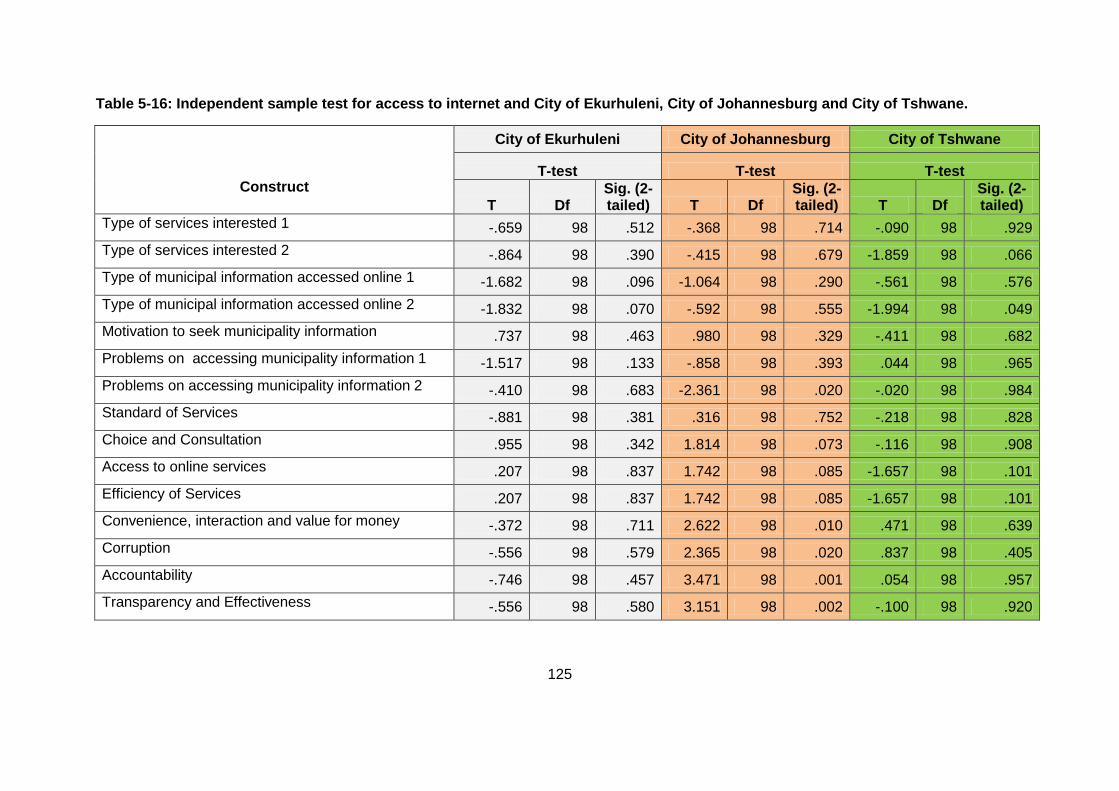
125
Table 5-16: Independent sample test for access to internet and City of Ekurhuleni, City of Johannesburg and City of Tshwane.
Construct
City of Ekurhuleni City of Johannesburg City of Tshwane
T-test T-test T-test
T Df Sig. (2-tailed) T Df
Sig. (2-tailed) T Df
Sig. (2-tailed)
Type of services interested 1 -.659 98 .512 -.368 98 .714 -.090 98 .929
Type of services interested 2 -.864 98 .390 -.415 98 .679 -1.859 98 .066
Type of municipal information accessed online 1 -1.682 98 .096 -1.064 98 .290 -.561 98 .576
Type of municipal information accessed online 2 -1.832 98 .070 -.592 98 .555 -1.994 98 .049
Motivation to seek municipality information .737 98 .463 .980 98 .329 -.411 98 .682
Problems on accessing municipality information 1 -1.517 98 .133 -.858 98 .393 .044 98 .965
Problems on accessing municipality information 2 -.410 98 .683 -2.361 98 .020 -.020 98 .984
Standard of Services -.881 98 .381 .316 98 .752 -.218 98 .828
Choice and Consultation .955 98 .342 1.814 98 .073 -.116 98 .908
Access to online services .207 98 .837 1.742 98 .085 -1.657 98 .101
Efficiency of Services .207 98 .837 1.742 98 .085 -1.657 98 .101
Convenience, interaction and value for money -.372 98 .711 2.622 98 .010 .471 98 .639
Corruption -.556 98 .579 2.365 98 .020 .837 98 .405
Accountability -.746 98 .457 3.471 98 .001 .054 98 .957
Transparency and Effectiveness -.556 98 .580 3.151 98 .002 -.100 98 .920
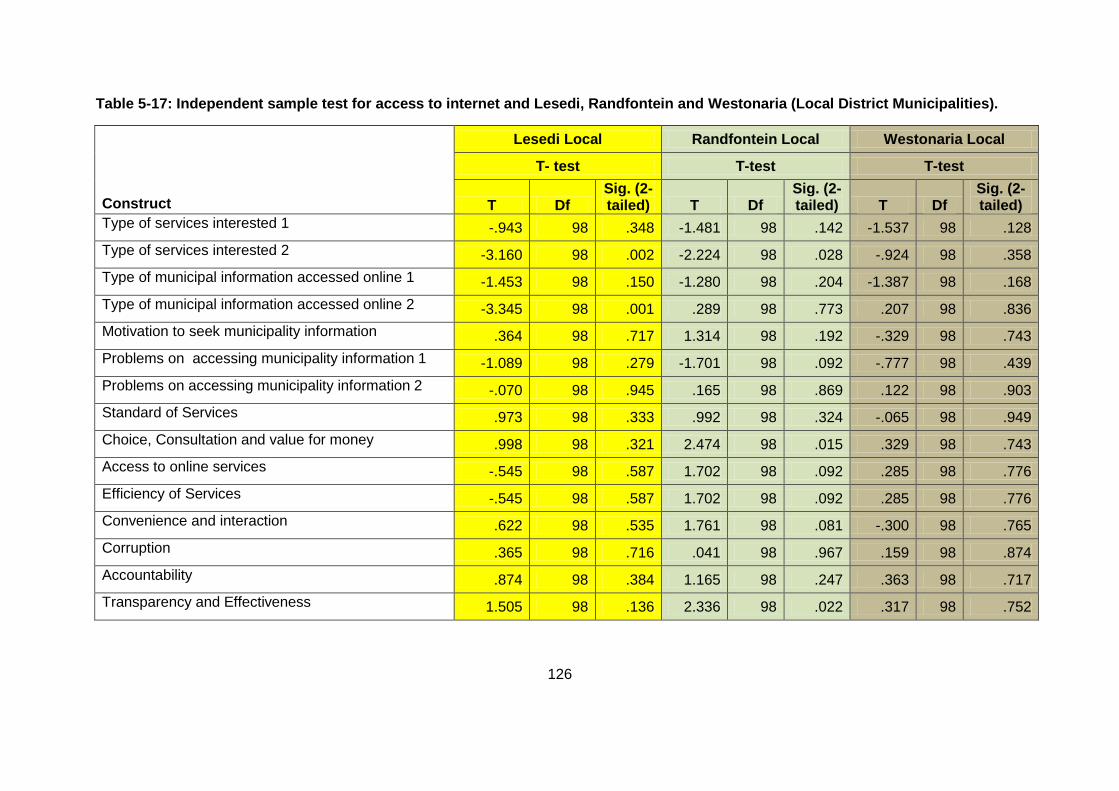
126
Table 5-17: Independent sample test for access to internet and Lesedi, Randfontein and Westonaria (Local District Municipalities).
Construct
Lesedi Local Randfontein Local Westonaria Local
T- test T-test T-test
T Df Sig. (2-tailed) T Df
Sig. (2-tailed) T Df
Sig. (2-tailed)
Type of services interested 1 -.943 98 .348 -1.481 98 .142 -1.537 98 .128
Type of services interested 2 -3.160 98 .002 -2.224 98 .028 -.924 98 .358
Type of municipal information accessed online 1 -1.453 98 .150 -1.280 98 .204 -1.387 98 .168
Type of municipal information accessed online 2 -3.345 98 .001 .289 98 .773 .207 98 .836
Motivation to seek municipality information .364 98 .717 1.314 98 .192 -.329 98 .743
Problems on accessing municipality information 1 -1.089 98 .279 -1.701 98 .092 -.777 98 .439
Problems on accessing municipality information 2 -.070 98 .945 .165 98 .869 .122 98 .903
Standard of Services .973 98 .333 .992 98 .324 -.065 98 .949
Choice, Consultation and value for money .998 98 .321 2.474 98 .015 .329 98 .743
Access to online services -.545 98 .587 1.702 98 .092 .285 98 .776
Efficiency of Services -.545 98 .587 1.702 98 .092 .285 98 .776
Convenience and interaction .622 98 .535 1.761 98 .081 -.300 98 .765
Corruption .365 98 .716 .041 98 .967 .159 98 .874
Accountability .874 98 .384 1.165 98 .247 .363 98 .717
Transparency and Effectiveness 1.505 98 .136 2.336 98 .022 .317 98 .752
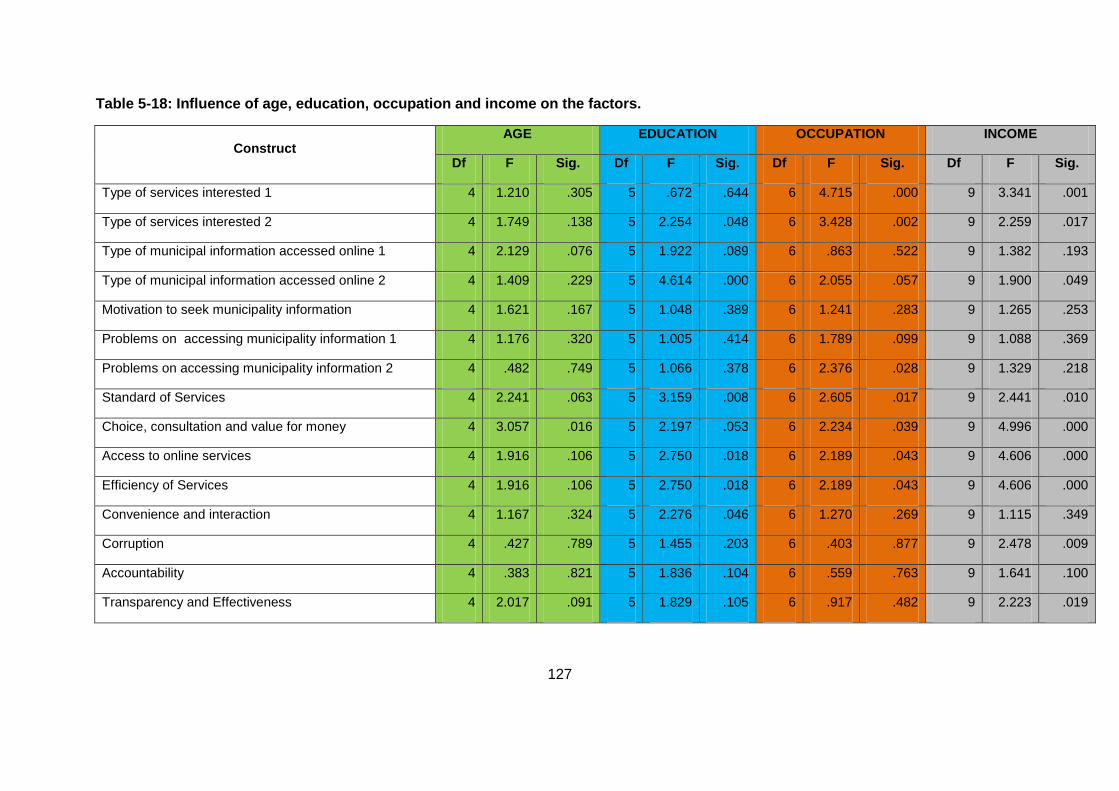
127
Table 5-18: Influence of age, education, occupation and income on the factors.
Construct AGE EDUCATION OCCUPATION INCOME
Df F Sig. Df F Sig. Df F Sig. Df F Sig.
Type of services interested 1 4 1.210 .305 5 .672 .644 6 4.715 .000 9 3.341 .001
Type of services interested 2 4 1.749 .138 5 2.254 .048 6 3.428 .002 9 2.259 .017
Type of municipal information accessed online 1 4 2.129 .076 5 1.922 .089 6 .863 .522 9 1.382 .193
Type of municipal information accessed online 2 4 1.409 .229 5 4.614 .000 6 2.055 .057 9 1.900 .049
Motivation to seek municipality information 4 1.621 .167 5 1.048 .389 6 1.241 .283 9 1.265 .253
Problems on accessing municipality information 1 4 1.176 .320 5 1.005 .414 6 1.789 .099 9 1.088 .369
Problems on accessing municipality information 2 4 .482 .749 5 1.066 .378 6 2.376 .028 9 1.329 .218
Standard of Services 4 2.241 .063 5 3.159 .008 6 2.605 .017 9 2.441 .010
Choice, consultation and value for money 4 3.057 .016 5 2.197 .053 6 2.234 .039 9 4.996 .000
Access to online services 4 1.916 .106 5 2.750 .018 6 2.189 .043 9 4.606 .000
Efficiency of Services 4 1.916 .106 5 2.750 .018 6 2.189 .043 9 4.606 .000
Convenience and interaction 4 1.167 .324 5 2.276 .046 6 1.270 .269 9 1.115 .349
Corruption 4 .427 .789 5 1.455 .203 6 .403 .877 9 2.478 .009
Accountability 4 .383 .821 5 1.836 .104 6 .559 .763 9 1.641 .100
Transparency and Effectiveness 4 2.017 .091 5 1.829 .105 6 .917 .482 9 2.223 .019
128
opposed to a t-test, because age consisted of eight categories and all dependant variables
were interval-scaled. The following is the null hypotheses used in the study.
Hoaa – There is no relationship between age, education, occupation, income and motive to
seek municipality information, standard of services offered by municipalities, choice,
consultation and value for money, access to online services, efficiency of services,
convenience and level of interaction, corruption, transparency and effectiveness on e-
governance.
5.4.2.1.1 Influence of age and other e-governance variables
In a bid to address research objectives: 1) Examine and explain the uptake and usage of ICT
tools for service delivery by citizens at local government level in South Africa. 2) Access and
explain services offered to citizens by local authorities in South Africa. The ANOVA results in
Table 5-15 above reveals that age had no influence on motive to seek municipality
information (F=1.621, p=0.167), standard of services (F=2.241, p=0.063), access to online
services (F=1.916, p=0.106), efficiency of services (F=1.916, p=0.106), convenience and
level of interaction (F=1.167, p=0.324), corruption (F=0.427, p=0.789) and transparency and
effectiveness (F=2.017, p=0.091). The results imply that age has nothing to do with motive to
seek municipal information and access to online services as major variables which
determines citizen uptake and usage of ICT tools.
On the other hand, age had a statistically significant influence on choice, consultation and
value for money (F=3.057, p=0.016). The results imply that citizens are concerned by the
choices they made when accessing municipality services and they value any service they
pay for. Therefore, the null hypotheses which deals with factors motive to seek
municipality information, standard of services offered by municipalities, access to online
services, efficiency of services, convenience and level of interaction, corruption,
transparency and effectiveness were failed to be rejected while hypotheses which deals
with choice, consultation and value for money had to be re-examined, using a post-hoc test.
Considering that age categories were not equal in terms of intervals chosen, the post-hoc
test was conducted to identify which of the age sub-group(s) showed statistically significant
differences with regard to choice, consultation and value for money. The post-hoc test for
choice, consultation and value for money did not show any statistically significant differences
in the means of age groups. Therefore, the null hypothesis for convenience and level of
interaction failed to be rejected. The post-hoc test for choice, consultation and value for
129
money showed significant differences between the age groups 20-30 years and 31-40 years,
between 41-50 years, 51-60 and 61+ years, and thus the null hypothesis for choice,
consultation and value for money was rejected.
5.4.2.1.2 Influence of level of education and other e-governance variables
In addressing the research objective: 1) Examine and explain the uptake and usage of ICT
tools for service delivery by citizens at local government level in South Africa. The ANOVA
results on Table 5-15 above indicated that level of education had influence on change of
ownership, payment of fines, payment of water and electricity, refuse and waste, parks and
cemeteries and emergency services (F=2.254, p=0.048), online forms, licences and
marriages, medical information, sponsorship information and contracts (F=4.614, p 0.000),
standard of services (F=3.159, p=0.008), access to online services and efficiency of
services (F=2.750, p=0.018), convenience and level of interaction (F=2.276, p=0.046).
These results imply that education influences the uptake and usage of ICT by citizens as it
addresses research objective 1. The results agree with Carrizels (2008) who assumes that
educational level informs attitudes and decisions with regard to the application of technology
in the e-government context.
On the other hand, level of education had no statistically significant influence on Type of
services interested 1 (F=0.672, p=0.644), Type of municipal information accessed online 1
(F=1.922, p=0.089), Motivation to seek municipality information (F=1.018, p=0.389),
Problems on accessing municipality information 1 (F=1.005, p=0.414), Problems on
accessing municipality information 2 (F=1.066, p= 0.378), Choice and Consultation
(F=2.197, p= 0.53), Middleman interference is removed on tender process, Adjudication of
tender is done electronically (F=1.455, p=0.203), Accountability (F=1.836, p=0.104) and
Transparency and Effectiveness (F=1.829, p= 0.105). The results imply that level of
education do not influence aspects or variables that are beyond their control such as
problems to do with infrastructure and technical issues in the design of municipality website
and the municipal internal processes.
5.4.2.1.3 Influence of occupation and other e-governance variables
In addressing the research objective: 1) Examine and explain the uptake and usage of ICT
tools for service delivery by citizens at local government level in South Africa. The ANOVA
results in Table 5-15 above revealed that occupation had no influence on Type of municipal
information accessed online 1 (F=0.863, p=0.522), Type of municipal information accessed
130
online 2 (F=2.055, p= 0.057), Motivation to seek municipality information (F=1.241, p=
0.283), Problems on accessing municipality information (F=1.789, p= 0.099), Convenience
and interaction (F=1.270, p= 0.269), Middleman interference is removed on tender process,
Adjudication of tender is done electronically - no interference of human beings, Cash
transactions are eliminated (F=0.403, p=0.877), Accountability (F=0.559, p=0.763),
Transparency and Effectiveness (F=0.917, p=0.482). The results imply that occupation do
not play a role on type of information accessed online, motivation to seek municipal
information and problems encountered on accessing municipal information as anyone
regardless of their occupation can access different type of information from municipality and
can encounter problems of network when trying to access online services. The results also
indicate occupation does not affect adjudication of tender as it has to do with internal
processes of municipalities. These findings address research objective 1.
On the other hand, occupation had a statistically significant influence on Type of services
interested 1 (F=4.715, p=0.000), Type of services interested 2 (F=3.428, p= 0.002),
Problems on accessing municipality information 2 (F=2.376, p= 0.028), Standard of
Services (F=2.605, p=0.017), Choice and Consultation (F=2.234, p=0.039), Access to Online
(F=2.189, p=0.43), and Efficiency of Services (F=2.189, p= 0.043). The results indicate that
occupation play a role in understanding services offered by municipalities. Students could
not be interested on services offered by municipalities as they do not have responsibility to
pay for such services. Results imply that those who are working have access to online
services and are interested on the efficiency of services offered by municipality which
encourages the uptake and usages of ICT in accessing such services. The findings
addresses research objective 1.
5.4.2.1.4 Influence of income and other e-governance variables
In a bid to address research objective: 1) Examine and explain the uptake and usage of ICT
tools for service delivery by citizens at local government level in South Africa. The ANOVA
results in Table 5-15 above indicated that income had no influence on Type of municipal
information accessed online 1 (F=1.382, p=0.193), Motivation to seek municipality
information (F=1.265, p= 0.253), Problems on accessing municipality information 1
(F=1.088, p= 0.369), Problems on accessing municipality information 2 - (F=1.329, p=
0.218), Convenience and interaction (F=1.115, p= 0.349), Accountability (F=1.641,
p=0.100). The findings imply that income does not play a role on type and motivation to seek
municipality information as well as problems in accessing municipal information and on the
convenience, interaction and accountability issues. The results indicate that these variables
131
affect everyone regardless of one’s income. These findings address research question 1 and
2.
On the other hand, income had a statistically significant influence on Type of services
interested 1 (F=3.341, p=0.001), Type of services interested 2 (F=2.259, p= 0.017), Type of
municipal information accessed online 2 (F=1.900, p=0.049), Standard of Services, Choice
and Consultation, Access to online services and Efficiency of Services (F=4.606, p= 0.000)
and Transparency and Effectiveness (F=2.223, p=0.019). It implies that income plays a role
in aspects which affects citizens directly, such as type of services offered by municipalities
as well as the efficiency of services. The finding addresses research objective 2.
5.4.2.2 Influence of municipality and other e-governance variables
In a bid to address the research objectives: 1) Examine and explain the uptake and usage of
ICT tools for service delivery by citizens at local government level in South Africa. 2) Access
and explain services offered to citizens by local authorities in South Africa. The ANOVA
results in Table 5-16 above indicated that municipality had no influence on all of the factors
from Type of services interested 1 to Transparency and Effectiveness, since their p value is
less than 0.05. The findings imply that municipality whether metro or local district
municipality do not affect the identified variables. These findings address research question
1 and 2.
5.4.2.2.1 Influence of municipality and other e-governance variables
In addressing research objective: 1) Examine and explain the uptake and usage of ICT tools
for service delivery by citizens at local government level in South Africa. The ANOVA results
in Table 5-16 above revealed that access to internet had no influence on Motivation to seek
municipality information (F=2.978, p= 0.085), Standard of Services (F=0.081, p=0.775),
Access to online services and Efficiency of Services (F=0.452, p=0.502). The results imply
that access to internet has nothing to do with motivation to seek municipal information,
standard of service as well as access to online services and efficiency.
The results agrees with the findings of Russell (2013) who found out that citizens do not use
or benefit from the internet as they have certain cultural views or have a mistrust of
government or technology. This statement therefore supports the reason as to why access
to internet had no influence on motivation to seek municipal information. These results
address research objective 1.

132
Table 5-19: ANOVA - Influence of municipality, access to internet, frequency of using internet, motivation of using network, security of website and access to municipality services on the factors.
Construct
Municipality Access to internet Frequency of using internet
Motivation of using network
Security of website Access to municipality
services
Df F Sig. Df F Sig. Df F Sig. Df F Sig. Df F Sig. Df F Sig.
Type of services interested 1 5 7.189 .000 1 4.095 .043 4 5.991 .000 3 2.077 .102 5 3.131 .008 3 .417 .741
Type of services interested 2 5 9.217 .000 1 14.376 .000 4 1.758 .136 3 2.588 .052 5 2.390 .037 3 2.940 .033
Type of municipal information accessed online 1 5 8.395 .000 1 14.629 .000 4 4.525 .001 3 2.167 .091 5 1.929 .088 3 7.752 .000
Type of municipal information accessed online 2 5 11.907 .000 1 8.973 .003 4 3.736 .005 3 6.066 .000 5 3.729 .002 3 6.645 .000
Motivation to seek municipality information 5 9.323 .000 1 2.978 .085 4 4.787 .001 3 2.127 .096 5 2.991 .011 3 .379 .768
Problems on accessing municipality information 1
5 7.308 .000 1 4.737 .030 4 1.704 .148 3 2.560 .054 5 1.219 .298 3 .573 .633
Problems on accessing municipality information 2
5 4.178 .001 1 4.474 .035 4 3.580 .007 3 1.975 .117 5 2.591 .025 3 .707 .548
Standard of Services 5 9.228 .000 1 .081 .775 4 10.123 .000 3 8.266 .000 5 2.479 .031 3 1.307 .271
Choice, consultation ad value for money 5 11.760 .000 1 9.104 .003 4 11.115 .000 3 6.529 .000 5 5.186 .000 3 .986 .399
Access to online services 5 9.441 .000 1 .452 .502 4 11.700 .000 3 7.771 .000 5 3.761 .002 3 2.345 .072
Efficiency of Services 5 9.441 .000 1 .452 .502 4 11.700 .000 3 7.771 .000 5 3.761 .002 3 2.345 .072
Convenience and interaction 5 4.238 .001 1 10.598 .001 4 6.091 .000 3 .943 .419 5 4.099 .001 3 2.845 .037
Corruption 5 7.032 .000 1 9.628 .002 4 2.882 .022 3 1.010 .388 5 1.984 .079 3 3.445 .017
Accountability 5 10.399 .000 1 19.911 .000 4 5.304 .000 3 1.394 .244 5 3.052 .010 3 4.228 .006
Transparency and Effectiveness 5 12.518 .000 1 22.714 .000 4 4.812 .001 3 1.658 .175 5 6.367 .000 3 4.433 .004
133
On the other hand, access to internet had a statistically significant influence on Type of
services interested 1 (F=4.095, p=0.043), Type of services interested 2 (F=14.376, p=
0.000), Type of municipal information accessed online 1 (F=14.629, p=0.000), Type of
municipal information accessed online 2 (F=8.973, p=0.003), Problems on accessing
municipality information 1 (F=4.737, p= 0.030), Problems on accessing municipality
information 2 (F=4.474, p= 0.035), Choice and Consultation (F=9.104, p= 0.003),
Convenience and interaction (F=10.598, p= 0.001), Corruption (F=9.628, p=0.002),
Accountability (F=19.911, p=0.000) and Transparency and Effectiveness (F=22.714,
p=0.000). The findings imply that citizens are motivated in accessing internet in order to
know the services offered by municipalities and to enjoy the benefits which come with online
services. These benefits concur with the benefits identified by Karunasena, et al. (2011);
Weerakkody, et al. (2015) when they state that the benefits expected from e-government
include innovations that can facilitate the efficient delivery of government services which
creates public value. The findings addresses research objective 1 on uptake and usage of
ICT by citizens.
5.4.2.2.2 Influence of frequency of using internet and other e-governance variables
In addressing the research objectives: 1) Examine and explain the uptake and usage of ICT
tools for service delivery by citizens at local government level in South Africa. 2) Access and
explain services offered to citizens by local authorities in South Africa. The ANOVA results in
Table 5-16 above indicated that frequency of using internet had no influence on Type of
services interested 2 (F=1.758, p= 0.136) and Problems on accessing municipality
information 1 (F=1.704, p= 0.148). The findings indicate that some citizens do not use
internet to access municipality services, instead they visit municipality offices should they
require a particular service.
On the other hand, frequency of using internet had a statistically significant influence on
Type of services interested 1 (F=5.991, p=0.000), Type of municipal information accessed
online 1 (F=4.525, p=0.001), Type of municipal information accessed online 2 (F=3.736,
p=0.005), Motivation to seek municipality information (F=4.787, p= 0.001), Problems on
accessing municipality information 2 (F=3.580, p= 0.007), Standard of Services (F=10.123,
p=0.000), Choice and Consultation (F=11.115, p= 0.000), Access to online services and
Efficiency of Services (F=11.700, p=0.000), Convenience and Interaction (F=6.091, p=
0.000), Corruption (F=2.882, p=0.022), Accountability (F=5.304, p=0.000) and Transparency
and Effectiveness (F=4.812, p=0.001). The results imply that citizens use internet to access
municipality services and they do this at different times depending on what kind of online

134
services being accessed from municipality. These findings address research objective 1 and
2.
5.4.2.2.3 Influence of motivation of using a particular network and other e-governance
variables
To address research objective: 1) Examine and explain the uptake and usage of ICT tools
for service delivery by citizens at local government level in South Africa. The ANOVA results
in Table 5-16 above revealed that motivation for using a particular network had no influence
on Type of services interested 1 (F=2.077, p=0.102), Type of services interested 2 (F=2.588,
p= 0.052), type of municipal information accessed online 1 (F=2.167, p=0.091), Motivation to
seek municipality information (F=2.127, p= 0.096), Problems on accessing municipality
information 1 (F=2.560, p= 0.054), Problems on accessing municipality information 2
(F=1.975, p= 0.117), Convenience and Interaction (F=0.943, p= 0.419), Middleman
interference is removed on tender process, Adjudication of tender is done electronically - no
interference of human beings, Cash transactions are eliminated (F=1.010, p=0.388),
Accountability (F=1.394, p=0.244), Transparency and Effectiveness (F=1.658, p=0.175). The
results indicate that citizens use different network available in the country such as MTN,
Vodacom, Cell C, Telkom to access municipality online services despite their costs and
availability of network.
Whereas motivation for using a particular network had a statistically significant influence on
Type of municipal information accessed online 2 (F=6.066, p= 0.000), Standard of Services
(F=8.266, p=0.000), Choice and (F=6.529, p=0.000), Access to online services and
Efficiency of Services (F=7.771, p=0.000). The findings imply that citizens prefer a particular
network to access online service from municipality due to its efficiency in terms of availability
of network as well as cost. These findings address research objective 1 and 2.
5.4.2.2.4 Influence of security of municipality website and other e-governance variables
To address research objectives: 1) Examine and explain the uptake and usage of ICT tools
for service delivery by citizens at local government level in South Africa. 2) Access and
explain services offered to citizens by local authorities in South Africa. The ANOVA results in
Table 5-16 above indicated that security of municipality website had no influence on Type of
municipal information accessed online 1 (F=1.929, p=0.088), Problems on accessing
municipality information (F=1.219, p=0.298) and Corruption (F=1.984, p=0.079). The findings
indicate that citizens are not worried about security on municipality website. This could
indicate that these citizens are not actively involved in transacting online with municipality
135
and therefore could not see and experience security issues associated with particular
municipality website.
On the other hand, security of municipality website had a statistically significant influence on
Type of services interested 1 (F=3.131, p=0.008), Type of services interested 2 (F=2.390, p=
0.037), Type of municipal information accessed online 2 (F=3.729, p=0.002), Motivation to
seek municipality information (F=2.991, p=0.011), Problems on accessing municipality
information 2 - (F=2.591, p=0.025), Standard of Services (F=2.479, p=0.031), Choice and
Consultation (F=5.186, p= 0.000), Access to online services and Efficiency of Services
(F=3.761, p=0.002), Convenience and Interaction (F=4.099, p= 0.001), Accountability
(F=3.052, p=0.010) and Transparency and Effectiveness (F=6.367, p=0.000).
The results imply that security is an issue to those citizens who access online services from
the municipality. On issue of privacy and security the results agrees with Hughes (2012) who
warns that while e-government enhances service delivery, it equally enhances surveillance
capability over citizens in society. Hughes (2003) further argues that electronic
communication, such as e-mail, is recorded and can be traced far more easily than ordinary
mail. The citizens who uses online services from municipality therefore requires guarantee
that their information they supply is secure and safe. The results address research objective
1.
5.4.2.2.5 Influence of access to municipality services and other e-governance variables
To address research objectives: 1) Examine and explain the uptake and usage of ICT tools
for service delivery by citizens at local government level in South Africa. 2) Access and
explain services offered to citizens by local authorities in South Africa. The ANOVA results in
Table 5-16 above indicate that access to municipality services had no influence on Type of
services interested 1 (F=0.417, p=0.741), Motivation to seek municipality information
(F=0.379, p= 0.768), Problems on accessing municipality information 1 (F=0.573, p= 0.633),
Problems on accessing municipality information 2 - (F=0.707, p= 0.548), Standard of
Services (F=1.307, p=0.271), Choice and Consultation (F=0.986, p=0.399), Access to online
services and Efficiency of Services (F=2.345, p=0.072). The results indicate that access to
municipal services is not determined by the type of services which are being offered by
municipality, problems in accessing municipality information or efficiency of services as
these citizens might not have anything to do with municipality.
On the other hand, access to municipality service had a statistically significant influence on
Type of services interested 2 (F=2.940, p= 0.033), Type of municipal information accessed
136
online 1 (F=7.752, p=0.000), Type of municipal information accessed online 2 (F=6.645,
p=0.000), Convenience and interaction (F=2.845, p=0.037), Corruption (F=3.445, p=0.017),
Accountability (F=4.228, p=0.006) and Transparency and Effectiveness (F=4.433, p=0.004).
The findings imply that citizens who access municipality services are concerned about type
of services offered by municipality and the information which is found on municipality website
as well as issues around accountability, transparency and efficiency.
The results concur with Falabi (2007) who highlighted that ICTs is used to improve
efficiency, effectiveness, transparency and accountability in the delivery of public goods and
services to the people, as well as how government institutions relate among themselves and
with citizens. This finding is congruent with Scott’s (2011) assertion that citizens expect an
open government more today than ever before and demand accountability and transparency
through direct input on the issues that affect them. Citizens who uses online services from
municipalities therefore requires to see ICT initiatives offer such benefits. These findings
address research objective 1 on the uptake and usage of ICT by citizens.
5.5 Chapter conclusion
This chapter focused on empirical analysis and results gathered from the study. Statistical
analysis of quantitative data and narrative description of qualitative data was reported in this
chapter. Findings from primary data through questionnaires and interviews were reported,
explained, interpreted and conclusions were drawn.
The section presented result of research findings derived from data analysis by using
quantitative method. The section focused on empirical analysis and results emanating from
data gathered from 600 respondents participated in this study who completed questionnaires
from six municipalities. Quantitative data analysis was done using SPSS.
The chapter presented descriptive statistics which summarises sample data, using
frequency tables and relationships between demographics. This was followed by second
section which deals with factor analysis for items used to measure the role of ICT as part of
e-governance in improving service delivery. The chapter ended by exploring inferential
analysis on the use of ICT for improving service delivery by local authorities.
137
CHAPTER 6: QUALITATIVE DATA ANALYSIS, PRESENTATION AND DISCUSSION OF
FINDINGS
6.1 Introduction
The previous chapter presented the quantitative data analysis and discussed findings. In this
chapter the findings of the qualitative data analysis, presentation and discussion are
presented. This is done by presenting and discussing emerged themes emanating from the
interviews conducted from Executive members from Metropolitan and Local district
municipalities.
With consent of the interviewees, the interviews were recorded and transcribed. Transcripts
were uploaded into electronic data analysis tool called Atlas.ti 7 (version 7.0.81).A tool was
used that can accept textual, graphical, audio or video materials as input to be interpreted.
Computer-aided techniques within the software were used to help categorise text and
identify pertinent concepts and themes (Mawela, et al. 2017). In this analysis, five primary
documents, namely P1, P2, P3, P4 and P5 from the interviews were considered.
Codes were created using open coding systems. Codes were further grouped into families of
codes, each with the number of incidents (quotations) in each family of codes – Annexure M.
A family of codes is a class of codes that relate to similar occurrences (Mavetera, 2011).
Using the network viewer in Atlas.Ti, the relationships between codes and code families
were found. The results of this process are shown as network diagrams. The network
diagram also allowed researcher to group the codes and code families further into thematic
areas. The following emerging key themes will be presented and discussed;
Presence of website.
Uptake and usage of ICT.
Interventions to use of online services.
Hindrance to use of online services.
Solutions to hindrance of online services.
Security measures.
Services offered by municipalities.
Advantages and disadvantages of ICT as part of e-governance.
Staff buy-in and support.
Citizen relationships.
Strategies to improve online service delivery.
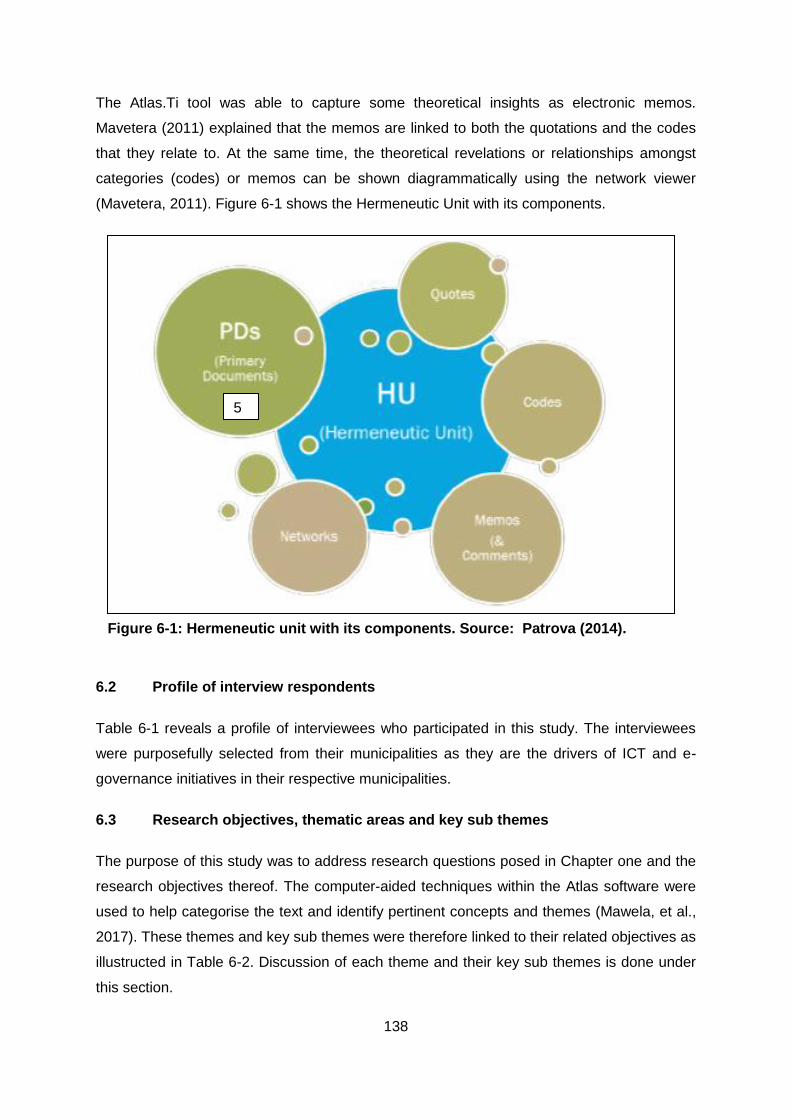
138
The Atlas.Ti tool was able to capture some theoretical insights as electronic memos.
Mavetera (2011) explained that the memos are linked to both the quotations and the codes
that they relate to. At the same time, the theoretical revelations or relationships amongst
categories (codes) or memos can be shown diagrammatically using the network viewer
(Mavetera, 2011). Figure 6-1 shows the Hermeneutic Unit with its components.
6.2 Profile of interview respondents
Table 6-1 reveals a profile of interviewees who participated in this study. The interviewees
were purposefully selected from their municipalities as they are the drivers of ICT and e-
governance initiatives in their respective municipalities.
6.3 Research objectives, thematic areas and key sub themes
The purpose of this study was to address research questions posed in Chapter one and the
research objectives thereof. The computer-aided techniques within the Atlas software were
used to help categorise the text and identify pertinent concepts and themes (Mawela, et al.,
2017). These themes and key sub themes were therefore linked to their related objectives as
illustructed in Table 6-2. Discussion of each theme and their key sub themes is done under
this section.
5
5
Figure 6-1: Hermeneutic unit with its components. Source: Patrova (2014).
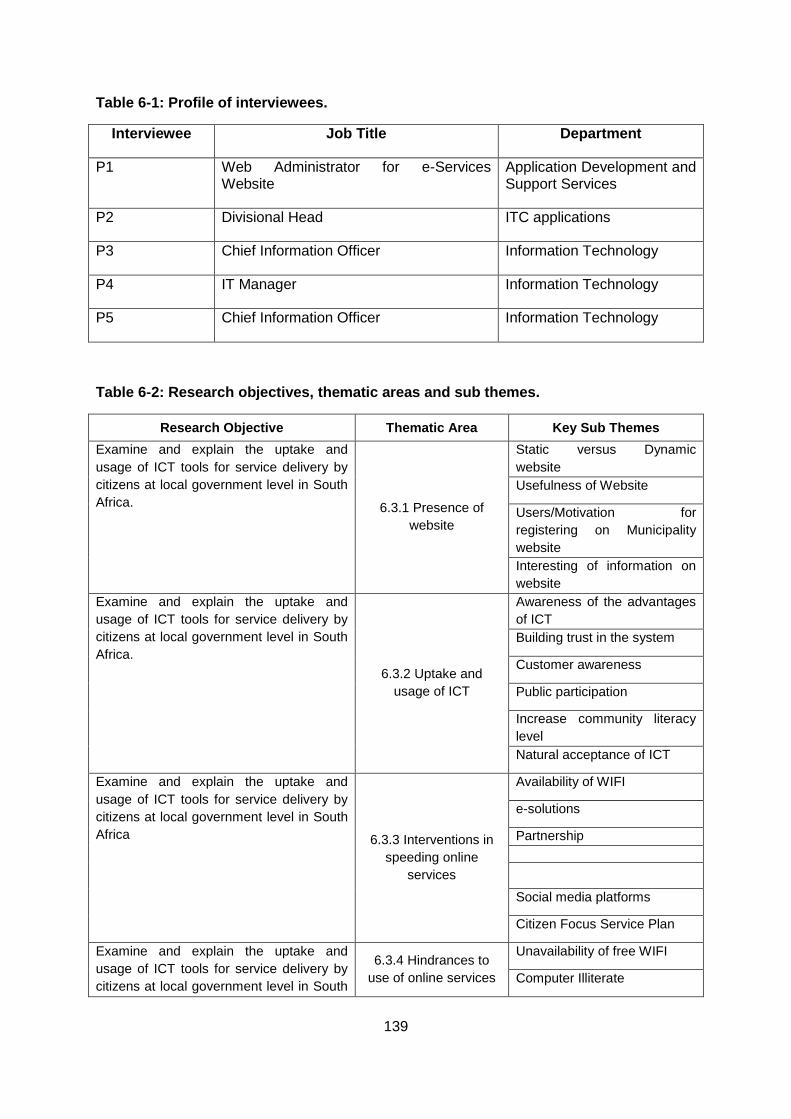
139
Table 6-1: Profile of interviewees.
Interviewee Job Title Department
P1 Web Administrator for e-Services Website
Application Development and Support Services
P2 Divisional Head ITC applications
P3 Chief Information Officer Information Technology
P4 IT Manager Information Technology
P5 Chief Information Officer Information Technology
Table 6-2: Research objectives, thematic areas and sub themes.
Research Objective Thematic Area Key Sub Themes
Examine and explain the uptake and
usage of ICT tools for service delivery by
citizens at local government level in South
Africa. 6.3.1 Presence of
website
Static versus Dynamic
website
Usefulness of Website
Users/Motivation for
registering on Municipality
website
Interesting of information on
website
Examine and explain the uptake and
usage of ICT tools for service delivery by
citizens at local government level in South
Africa.
6.3.2 Uptake and
usage of ICT
Awareness of the advantages
of ICT
Building trust in the system
Customer awareness
Public participation
Increase community literacy
level
Natural acceptance of ICT
Examine and explain the uptake and
usage of ICT tools for service delivery by
citizens at local government level in South
Africa 6.3.3 Interventions in
speeding online
services
Availability of WIFI
e-solutions
Partnership
Social media platforms
Citizen Focus Service Plan
Examine and explain the uptake and
usage of ICT tools for service delivery by
citizens at local government level in South
6.3.4 Hindrances to
use of online services
Unavailability of free WIFI
Computer Illiterate
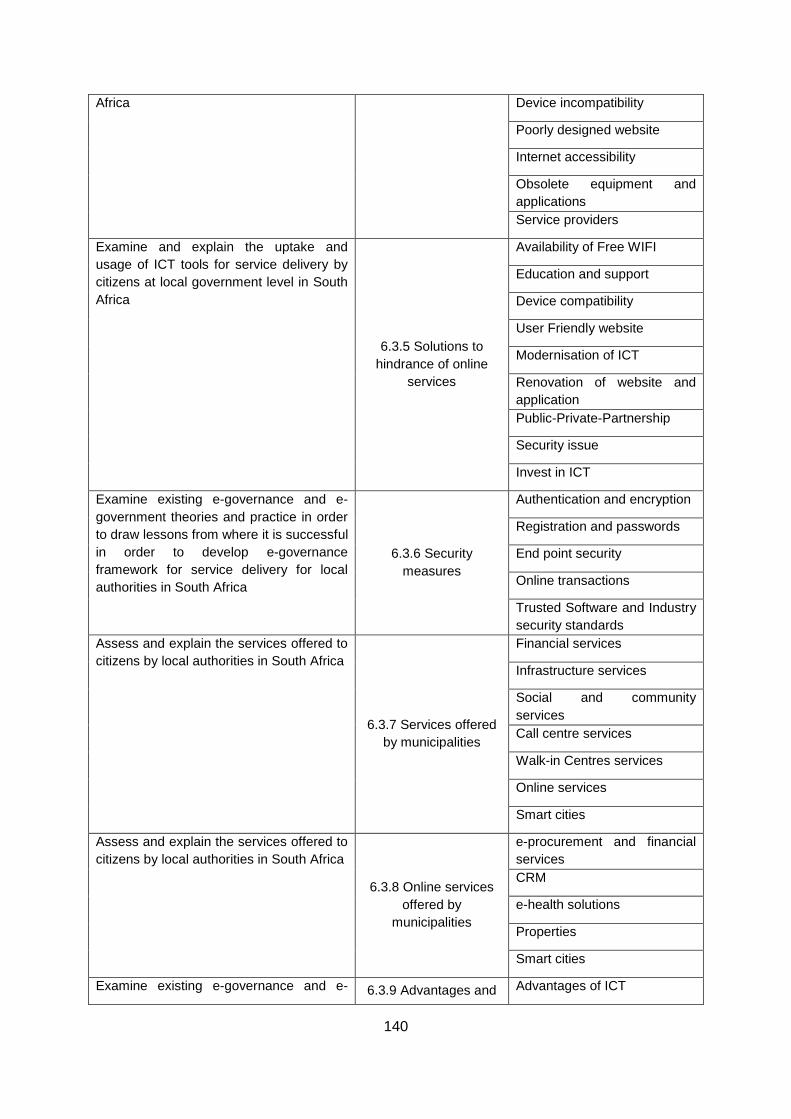
140
Africa Device incompatibility
Poorly designed website
Internet accessibility
Obsolete equipment and
applications
Service providers
Examine and explain the uptake and
usage of ICT tools for service delivery by
citizens at local government level in South
Africa
6.3.5 Solutions to
hindrance of online
services
Availability of Free WIFI
Education and support
Device compatibility
User Friendly website
Modernisation of ICT
Renovation of website and
application
Public-Private-Partnership
Security issue
Invest in ICT
Examine existing e-governance and e-
government theories and practice in order
to draw lessons from where it is successful
in order to develop e-governance
framework for service delivery for local
authorities in South Africa
6.3.6 Security
measures
Authentication and encryption
Registration and passwords
End point security
Online transactions
Trusted Software and Industry
security standards
Assess and explain the services offered to
citizens by local authorities in South Africa
6.3.7 Services offered
by municipalities
Financial services
Infrastructure services
Social and community
services
Call centre services
Walk-in Centres services
Online services
Smart cities
Assess and explain the services offered to
citizens by local authorities in South Africa
6.3.8 Online services
offered by
municipalities
e-procurement and financial
services
CRM
e-health solutions
Properties
Smart cities
Examine existing e-governance and e- 6.3.9 Advantages and Advantages of ICT
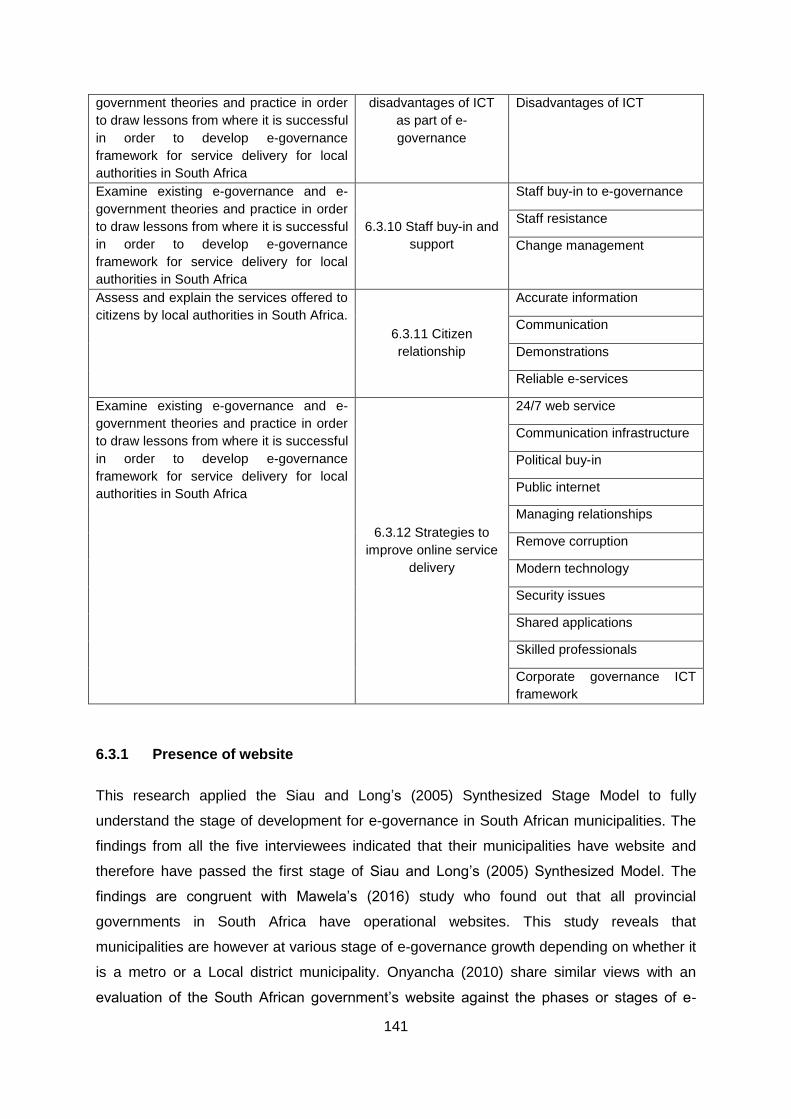
141
government theories and practice in order
to draw lessons from where it is successful
in order to develop e-governance
framework for service delivery for local
authorities in South Africa
disadvantages of ICT
as part of e-
governance
Disadvantages of ICT
Examine existing e-governance and e-
government theories and practice in order
to draw lessons from where it is successful
in order to develop e-governance
framework for service delivery for local
authorities in South Africa
6.3.10 Staff buy-in and
support
Staff buy-in to e-governance
Staff resistance
Change management
Assess and explain the services offered to
citizens by local authorities in South Africa.
6.3.11 Citizen
relationship
Accurate information
Communication
Demonstrations
Reliable e-services
Examine existing e-governance and e-
government theories and practice in order
to draw lessons from where it is successful
in order to develop e-governance
framework for service delivery for local
authorities in South Africa
6.3.12 Strategies to
improve online service
delivery
24/7 web service
Communication infrastructure
Political buy-in
Public internet
Managing relationships
Remove corruption
Modern technology
Security issues
Shared applications
Skilled professionals
Corporate governance ICT
framework
6.3.1 Presence of website
This research applied the Siau and Long’s (2005) Synthesized Stage Model to fully
understand the stage of development for e-governance in South African municipalities. The
findings from all the five interviewees indicated that their municipalities have website and
therefore have passed the first stage of Siau and Long’s (2005) Synthesized Model. The
findings are congruent with Mawela’s (2016) study who found out that all provincial
governments in South Africa have operational websites. This study reveals that
municipalities are however at various stage of e-governance growth depending on whether it
is a metro or a Local district municipality. Onyancha (2010) share similar views with an
evaluation of the South African government’s website against the phases or stages of e-
142
governance development which indicates that South Africa is probably the only African
country that is on the verge of attaining full e-governance status especially with the metro
municipalities. The following comments illustrate presence of website in municipalities.
“Yes, we do we have a public website that display general information which is called
http://www.joburg.org.za and then we have e-government, e-governance website it’s an
online website for citizens and it’s called http://services.joburg.org.za” P1
“Yes, we do have a website and by law I think all municipalities should have” P3
“Yes, the municipality does have a website, the website is www.randwestcity.gov.za”P5
Results of the study imply that municipalities in South Africa have functional websites,
which provide information to its citizens.
6.3.1.1 Static and dynamic website
The United Nations (2010) observed that citizens benefit greatly from e-service delivery
through improved access to information, improved interaction with government and more
efficient government operations. Observations by United Nation (2010) shared similar view
with the findings of this study that Metros such as City of Johannesburg have separate
website dedicated for citizens http://services.joburg.org.za. The dynamic website is operating at
interaction and transactional level with efforts towards transformation and e-democracy level
as part of transforming municipality services. On the other hand, it became evident that
Local district municipalities have static websites for disseminate information to general
public. These findings concur with (Mukonza, et al., 2016) in their observation that other
local authorities either have static websites or they do not have them at all.
In order to establish whether municipalities have active or static website, this study identified
it by number of registered users on a particular portal for municipality. Quotations below
were used to establish that.
“Here, we have got a website that is static, which do not require any registering and we
use that for general communication” P3.
Findings of the study is in agreement with Nath’s (2005) Broadcast/Wider Dissemination
Model which is based on dissemination of information through website relevant to better
governance that is already in the public domain into wider public domain through the use of
ICT and convergent media. Nath’s (2005) explained that the rationale behind the model is
that a more informed citizenry is able to better understand the governance mechanisms and
143
is more empowered to make informed choices and exercise its rights and responsibilities.
The findings imply that local district municipalities are still at early stages of e-governance
growth as they have presence of website which is static in nature which provides information
to its citizens.
6.3.1.2 Usefulness of website
For citizens to keep on visiting a particular website, it should be useful, having current and
relevant information. This section discusses various uses of municipality website. Al-Hujran,
Al-dalameh and Aloudat (2011) suggested that government should make their websites
more useful and usable. The findings of this study share same view with Al-Hujran, et al.
(2011) who suggested that websites should be useful and usable which can motivate users
to register on municipality website to access online services.
6.3.1.2.1 Communication
Findings of this study established that website for municipalities are used for communication.
Results of the study share similar sentiments with Russell (2013) who argued that e-
government has increased transparency, and enabled direct communication and access to
information by citizens. Further confirmation of the results of this study comes from Russell
(2013) who have acknowledged that communication between citizens and the government is
made more easily available through online communication and feedback tools and through
access to information and contact information for government departments and officials.
Results of this study imply that municipality use their website to disseminate information and
to get feedback from citizens. The following quotes highlight nature of communication which
took place between municipality and its citizens.
“We use website as a means of communication and any communication that we feel it
is relevant, we need to put it on the website we put it on the website as a means of
communicating to the citizens”. P2
“Well, the website is actually for communication to the city, both on council matters and
you know information that we wish our citizens to know. Council matters will be the
publishing of your IDP which is the Integrated Development Plan, publishing of tariffs,
publication of annual reports, performance reports, you know for the executive
managers, all the information that is required by law to be done plus any other
information that may be of value to citizens like all the municipality for the citizens to
know’. P3
144
The results of the study indicate that municipalities use their website to communicate
important information to citizens in order to increase accountability and transparency in
municipality operations.
6.3.1.2.2 Financial transactions
Styles and Tennyson (2007) in their study found out that larger cities and more affluent
communities were more likely to provide financial information online. Results by Styles and
Tennyson (2007) correlated their findings of transactional online financial information
available in metro municipalities with Local district municipalities where statements and
billing are offered online. The following statements support their findings:
“Customers will receive their statement almost immediately, there no delay with postal
service. Customers can also view a history of statements backdated till 2012, should
they require backdated copies. They can view your statement and manage your
account online from anywhere in the world”. P1
“it’s just the statement, the billing side of things that’s offered online. Information about
tariffs is also offered online and static information like the times offices are open and all
that”. P3
“I think from a procurement point of view, I think we are in the planning stage in terms
of introducing your e-procurement and I think those who are in business will be able to
do their business online with the municipality”. P5
The results indicate that citizens are interested in general information, financial information
and bill payments when they access municipality website in metro municipalities. In Local
district municipalities citizens visit municipal offices to get statements and general
information as their websites are not yet developed to do online transactions, such as bill
payments.
6.3.1.3 Users/Motivation for registering on municipality website
O’Donnell and Turner (2013) in their study noted that from August 2010, central civil service
e-government portal for Korea was renamed Minwon 24. O’Donnell and Turner (2013)
indicated that the Minwon 24 web portal has over 10 million registered users, or 20% of the
population, though the system covers up to four times this number with each household
needing to join to gain access to the services available on this system and this increases the
coverage of this service to approximately 40 million Koreans. O’Donnell and Turner (2013)
145
explained that outcomes from this service include increased convenience for the public,
enhanced cost efficiency and increased transparency. The findings by O’Donnell and Turner
(2013) is in contrast with results of this study as the number of users who register to use
municipality website is far less than the numbers stated in Korea as indicated in the
quotations below. Results of the study indicate that metro municipalities have interactive or
dynamic websites whereas Local district municipalities have static websites as highlighted in
the following quotation:
“And currently we have got 328 520 customers who receives their water and electricity
account by email on a monthly basis. So you can see from the amount of registered
users and the people who receive their accounts by email the majority of those users
make use of our e-services website together with the copy of our account or choose
how you like to receive your account either via Postal, email or MMS”. The City of
Johannesburg maintains a website on the Internet called (e-Services Website), the
purpose of which is to provide a facility for citizens to access online services”. P1
“I think about 40% of our users, in fact most of our users are registered there. I am not
sure about the stats but we have about 23 to 26, 26 0000 account holders and most of
them are registered in that website because they can now view their electronic
statements and it’s different from the normal Lesedi one which is specifically for
electronic statements”. P3
“So I think the number is close to 600 users”. P5
The findings from these quotations clearly indicate which municipalities have an interactive
and transactional website and which ones offer a static website. Those respondents who
provided an exact number of users registered with the municipality, without estimating are
the metros municipalities as they keep track of their users. On the other hand, those who are
not sure of the exact number of users are from Local district municipalities with the static
website.
The analysis of these results assist to identify best practices where e-governance in
municipalities is doing well so that lessons could be drawn that will assist to develop e-
governance framework for municipalities in South Africa. This framework is discussed in the
next chapter.
146
6.3.1.4 Interesting information on website
Welch (2012) expressed that the release of timely and accurate information on website
about municipality operations allows external observers to determine whether government is
operating within acceptable parameters. “Transparency enables citizens and other
stakeholders to watch government and, if transgressions are identified, challenge it through
the media, courts or other institutions” (Welch, 2012). The findings concur with Welch (2012)
findings which are supported by the following quotes.
“Customers can also submit a query online and we also have a HOW DO I? facility.
Basically, like a frequently asked question is made available to answer possible
questions asked for the citizens. This facility for instance when we receive stats is one
of the top application used for customers to gather information”. P1
“So the website coves information that relates to the activities in municipality, which
covers the activities by Mayor that covers information that citizens might require
relating to how they access municipal services”. P2
“…generic information in terms of the useful documents of the municipality ranging
from compliance documents to financial compliance and different policies around the
municipality”. P5
Citizens can therefore submit their concerns about services delivery from municipalities
through their website instead of visiting their offices.
6.3.2 Uptake and usage of ICT
6.3.2.1 Awareness of the advantages of ICT
Asgarkhani (2012) explained the benefits of e-governance, which include providing
expedient government services to citizens and businesses, improving the economy, allowing
for greater public access to information, empowering citizens, and making the government
more accountable to its citizens. The observation by Asgarkhani (2012) supported the
findings of this study in that citizens should be made aware of the advantages associated
with ICT as a way of encouraging them to uptake and use ICT tools. Further confirmation of
the results of this study comes from Bwalya (2009) who noted that low levels of awareness
are often a major problem with e-government services. Mpinganjira, (2012) shared the same
sentiments with results of this study as he outlined some of the challenges which affect
diffusion of e-governance initiative as lack of awareness of available e-government services
147
and lack of trust in government’s ability to provide secure e-service environments, as well as
poor quality of e-services provided by government. This is supported by the following quotes.
“I think they must be shown what the advantages are. I think if they are made aware of
the advantage of using e-government services are reduced costs, efficiency, better
record keeping, convenience they would generally be convinced that it is better to use
those services. Yaah, I think those are the main things, is the awareness of those
advantages”. P2
“Well, I think the most important thing will be to communicate, make people aware”. P4
The findings imply that without citizens’ awareness of the advantages of using ICT as part of
e-governance there will be low usage and uptake of ICT by citizens.
6.3.2.2 Building trust in the system
Bolgherini (2007) explained that citizens who have certain cultural views or have a mistrust
of government or technology may not be inclined to use e-government services. Their
opposition toward the adoption of e-government is derived from mistrust in technological
change that requires the use of computers to receive services normally received from direct
human exchanges (Bolgherini, 2007). Many citizens are more comfortable interacting face-
to-face with a person than they are with using a computer and if citizens have negative
feelings about the government in general, their feelings are less likely to improve just
because the government is now providing services in an automated format (Bolgherini,
2007; Horsburgh, Goldfinch, & Gauld, 2011). Mpinganjira (2012) found out that lack of skilled
people in government often results in people having doubts as to their ability to deliver
reliable and secure e-services. Results of this study concur with Bolgherini (2007)
observation in that resistance of citizens not to make payment through online systems is
because they don’t trust the system as it is open to identity theft, fraud and cyber-crime. The
following quotations share the same sentiments.
“…communicating to people, by giving them technology. That is as I said easy for
them to use that make sense by ensuring that they have trust in the system and giving
them the assurance that the systems that we are using are safe especially when it
involves their money”. P3
“The issue of transaction or payments using online system is a generic one because
it’s open to fraud and all that kind of thing so we need to be able to get the people to
trust that the platform that we are providing them is secure when we do allow them to
148
use to transact online. At the moment we are not having that transaction but it’s quite a
big issue because also it involves many actors you know the banks, you get the people
that do the payments or payment service providers”. P3
“I think constant communication with the communities, interfacing with them, pushing
this particular service to them and mostly importantly getting feedback from them and if
within whatever various platforms that would have been made available to the
communities”. P5
The results of this study imply that building trust in the system encourage citizen to do online
payments which is guaranteed through tight security measures which are put in place by
municipalities.
6.3.2.3 Customer awareness
Bwalya (2009) pointed out that the focus in e-government projects is often given to ensuring
the availability of the services and little effort is made to ensure that people are aware of the
services. Mpinganjira (2012) recommends that government make use of mass media to
inform people of government services available online as well as the benefits of e-
government services. This study share similar sentiments with Bwalya (2009) and
Mpinganjira (2012) as municipalities uses various means to make customers aware of the
online services offered by municipalities. Interviews express the following sentiments;
“Ok, the customer awareness by having road shows, Media, Television, Radio,
Advertisements” P1
“We have advertisement on papers, also we send SMSs. So, I think we were quite
successful and the response was good in people taking up, you know the use of that
website and so we have done the promotion you know the SMS via, the statements,
the printed statements and also publishing on our static website and also on the
newspapers”. P3
“I think as and when you begin to communicate more about these things and we need
to take advantage of the existing social media platforms which have revolutionalise the
digital space, slowly, slowly I think people will begin to buy into that”. P5
6.3.2.4 Public participation
Mametja (2015) hold that the introduction of e-participation, citizens’ portals, councillor
portals and e-communication programmes to accommodate those that may not be able to
149
attend public participation meetings in person but would like to actively participate in the
affairs of the municipality is necessary. The observation support the results of this study and
further confirmation of the results of the study comes from Ganiyu, Oluwafemi, Abayomi,
Olusegun and Salihu (2017) who concluded that the adoption of e-governance within the
public sector has become imperative in enhancing public participation, to observe and
assess government projects, safeguarding government accountability and transparency, as
well as transmitting information among the citizens’, business community, and government.
The following is the quote which supports the above discussion.
“What we could have here, I think we are trying to push public participation to be online
interactive session of some sort, where people would begin to interact more with the
municipality at that particular platform. And also the issue of people having to escalate
their Service delivery frustration and issues in that and instead of them having to call
the municipality come and queue at two different service points”. P5
Further confirmation of the results of this study comes from O’Donnell and Turner (2013)
who noted that e-government initiatives aim to improve government–citizen relations and
they include facilitating access to information about government policies and enabling
citizens to access services without having to engage with multiple agencies. O’Donnell and
Turner (2013) reaffirmed that the aim is to connect a series of government functions together
in a seamless manner and that services may be delivered to citizens through a variety of
channels (online, government office front counter, call centre) requiring coordination
between government agencies to ensure consistency in the messages communicated to
citizens.
The results indicate that municipalities are putting in place public participation platforms
which offer a variety of channels to promote citizen engagement and participation.
6.3.2.5 Increased community literacy level
This study found out that community literacy level is a key determinant of the uptake and
usage of ICT tools by community. The results of this study reveal that municipalities need to
put in place structures that educate community ICT skills so that they can understand how to
use ICT when accessing municipal services. The following quotation reveals the importance
of increasing community ICT level.
“I think much has to do with the level of literacy in the community out there. To
basically say I am just saying generally talking about ICT literacy. There are really
structural issues that we need to really overcome as a community before we can drive
150
people away”. P5
The findings indicate that an educated community has a high level of ICT usage and uptake
and therefore municipalities should take initiative to educate its citizens if the implementation
of e-governance is to be successful.
6.3.2.6 Natural acceptance of ICT
This study establishes that Africans are adopters of technology, although some are at
different stages of adoption. Those who first adopt technology are the early adopters and
those who took time to accept and use technology are the laggards. The following quotation
expresses the sentiment by one interviewee.
“I think in Africa we are lucky position Gibson in that ICT uptake have been a natural
thing and it has evolved. I think the statistics said in terms of the quick uptake of
technology and it has happened quite a lot in Africa and it have help us to sought of
leap frog in terms of you know being able to digital inclusion and so on”. P3
The findings indicate that Africans have appreciated technology and they are naturally
accepting it without anyone teaching them of such technology.
6.3.3 Interventions in speeding online services
Kohlborn, Weiss, Poeppelbuss, Korthaus, and Fiet (2010) established that increased
adoption of the online channel by government has been mainly driven by the need for
increased efficiency, cost effectiveness and customer satisfaction in the delivery of public
services. This study identified interventions in place to speed up online services by
municipalities.
6.3.3.1 Availability of WIFI
In order to increase the uptake and usage of ICT tools by citizens as part of e-governance,
municipalities are taking initiatives of rolling out free WIFI. The free WIFI is available in public
hot spots whereby citizens are required to register to access the WIFI. The following
quotations share similar sentiments.
“There is also Smart WIFI, email and other Online Services offered”.P1
“So the key to that is for the municipality for whatever possible to provide free WIFI to
citizens”. P3
151
The findings imply that rolling out of free WIFI will assist disadvantaged communities to have
access to internet and be able to access online services offered by municipalities.
6.3.3.2 e-solutions
6.3.3.2.1 Application for indigent
Local communities have to benefit from online services offered by municipalities.
Municipalities are therefore developing various applications that assist indigent citizen in
accessing these online services. The following quotation supports this statement.
“…as well as an app that we have developed to register indigent citizens who are
entitled to intended benefit. We use app to register citizens and to be able to track their
applications”. P2
Results of this study imply that municipalities are putting people first by coming up with
applications which help indigent citizen to access municipal online services.
6.3.3.2.2 Payment channel
Municipalities are trying by all means to maximise its revenue collection by making payment
channels available to its citizens. Results of this study established that various online
payments channels are made available especially in metro municipalities where e-
governance growth is at advanced stage. The following quotations highlight various online
payment channels available;
“We have also developed a payment channel for bill payment, electronic bill
presentment and payment we call it EsiaKoca that also enables citizens to be able to
request their bills, view them and pay them on a web portal or via a mobile device”. P2
“The financial system we are using currently is winsoft, now what winsoft is doing as
add on to the service they are creating a centralised website portal so that everybody
who is within the municipality and use winsoft could be able to log on to do the enquiry,
do request does some changes so it is on the development”. P4
The findings indicate that municipalities are coming up with various applications for
payments. The applications encourages citizens to settle their bills as they no long spend
their time in queues to make payment for their bills, instead any payment is being done
online. This applies mainly to metro municipalities whereby web portals are available for
payments. In Local district municipalities citizens are still visiting municipal offices to make
152
payments.
6.3.3.2.3 e-statement
Findings of this study establish that Local district municipalities do not have applications that
support transactional activities such as online payment channels. However there are
applications which are available which allow citizens to view and print their statement. The
interviewees have this to say;
“we have different apps in there and we will be looking at e-statement and how do we
share data with citizens and you know an app for instance that would give information
about what’s happening around Lesedi and so on”. P3
“And part of it was that e-statement but we want to integrate that to make our static
website to be more interactive”. P3
“The financial system we are using currently is winsoft, now what winsoft is doing as
add on to the service they are creating a centralised website portal so that everybody
who is within the municipality and use winsoft could be able to log on to do the enquiry,
do request does some changes so it is on the development”. P4.
The finding imply that Local district municipalities are much interested in providing e-
statements to their citizens whereas in metro municipalities it provides a platform which
allows citizens to make payments online.
6.3.3.2.4 e-health
Initiatives of trying to transform the health system in Africa are growing. The World Health
Organization (2016) defined e-Health as the use of information and communication
technologies (ICTs) for health. Kiberu, et al.(2017) highlighted that e-Health is among the
building blocks upon which modern health sectors are built. Kiberu, et al.(2017) indicated
that e-health involves combined use in the health sector of ICTs for learning, research, data
acquisition, surveillance, storage and access to patient data and clinical care even at a
distance. In developing countries, e-Health solutions have the potential to improve health
through enhancing capacity of the health workforce, especially where traditional means are
lacking (Kiberu, et al., 2017). These initiatives concur with what is happening in metro
municipalities in South Africa in promoting e-health as indicated in the following quotation.
“We developed other electronic services via our e-health solution that enables citizens
to be able to book for their clinic visits, to check for their medication”. P2
153
Findings of this study indicate that metro municipalities are in a drive to promote e-health
solution so that citizens are able to book appointment to see doctors online or to check for
the availability of medicines.
6.3.3.3 Partnership
Mpinganjira (2012) hold that partnership with reputable Information Technology companies
is important in that it allows government access to their highly skilled IT personnel. The
findings of this study however agrees with Mpinganjira (2012) on partnership and however
differs in who to partner with. This study found out that municipalities should partner with
banks and government departments in order to gain trust from citizens. Paulo (2016)
moreover believe that e-governance requires commitment of resources, willingness and
engagement among the government, private and public sectors (Paulo, 2016) which is in
agreement with the results of this study. This is supported by the following statements from
the interviews.
“Also that we partner with banks and in order for the citizens to have courage and trust
that they can do at online we are a little beat on the behind side”. P3
“I think largely owing to the fact that it’s not necessary our core mandate but we hoping
to basically partner with departments like e-government and then look at the offerings
they are doing and then check as to what is the possibility of replicating that at our
local space”. P5
The findings indicate that banks and government play a key role in facilitating online services
between citizens and municipalities.
6.3.3.4 Social media platforms
Hand and Ching (2011) examined the use of social media by local governments in the
Phoenix metropolitan areas and found that using social media at the local level government
level seems to offer promise of increased citizen engagement, reaching citizens on a
common platform, and allowing for citizen comments. Graham, (2014) argued that social
media usage enhances governments’ ability to interact with and engage citizens. Graham
(2014) further aurgued that this more open form of government public relations that social
media usage provides is particularly beneficial to local governments, as it is the local level of
government where citizens often feel the most direct access and potential importance in
governance. These findings are congruent with an interview participant remarked;
154
“I think we are encouraging them to use technology and more specifically on social
media platforms that are there. We also have a presence within those social media
platform so I think we largely encourage that but I think part of the limitation is that we
don’t have many of those e-government initiatives that we are driving from local level”.
P5
It implies that citizens have to be encouraged to use social media and local government
should take the initiative in promoting that. Studies by the Pew Research Center (2010)
found out that nearly one-third of online adults report using online social media sites to get
information about government agencies or officials. Mawela (2016) found that all
municipalities have websites and four of the eight municipalities have specific links on their
website to social media tools. It therefore indicates that municipalities are putting effort to
promote social media as a tool for effective communication which will ultimately promote the
uptake and usage of ICT. This discussion is in line with objective 1 of this study.
6.3.3.5 Citizen Focus Service Plan
Findings of this study concur with Kamblet (2003) who assert that ICT initiatives deal
particularly with the relationship between government and citizens and that citizen has a dual
role to play namely: a stakeholder and as a consumer of the services offered by the
government(Kamblet, 2003). Colesca and Dobrica (2008) further observed that governments
must become citizen-focused to ensure that e-governance will succeed. Interviews express
the following sentiments;
“The purpose of the e-Services channel is to minimize the interaction with the call
centre and facilitate and offer another channel to the citizens of Johannesburg to
interact with the City of Johannesburg (CoJ)”. P1
“we have got a master system plan which we have done which really talks about
Citizen Focus Service Delivery. So there are specific things that we are looking at in
the implementation of the master system plan”. P3
“I must say that there is no specific policies around e-governance but we would like to
put those in future”. P3
The results indicate that municipalities have in place Citizen Focus plan in their strategic
documents in the form of Citizen Focus Service delivery with the objective of increasing the
relationship between government and citizens.
155
6.3.4 Hindrances to use of online services
6.3.4.1 Unavailability of free WIFI
Results of this study found that in as much as citizens would like to access online services
from their municipality, there is a challenge of unavailability of free WIFI and given that the
cost of data is high and few people are able to afford it. The following quote support that;
“So the key to that is for the municipality for whatever possible to provide free WIFI to
citizens”. P3
The findings indicate that without free WIFI, citizens will not be able to take and use online
services made available by municipalities.
6.3.4.2 Computer illiterate
Subban, Nzimakwe and Pillay (2007) revealed that in a quick-changing society like South
Africa, is not enough to be able to read and write anymore and therefore every public
servant needs to be computer literate. Subban, et al. (2007) explained that a key challenge
that government faces is how to improve the information literacy skills of its public servants
and all its citizens. Their revelation share similar sentiments with the respondents
interviewed during this study.
“The biggest, biggest challenge is that the majority of our citizens are not computer
literate”. P2
“I think it basically drive us to a point that as and when people become ICT literate I
think they would be a huge expectation in terms of us improving those business
processes and it means that we would have to invest more resources in making sure
that our resources are able to match that demand moving forward”. P5
The results indicate that rolling out of ICT as part of e-governance in municipalities could be
successful if both public servants and its citizens are computer literate.
6.3.4.3 Device compatibility
Mbatha and Lesama (2013) in their study recommend that network facilities and computers
should be upgraded regularly, so that they can become compatible with new applications
and technology. Respondents participating in this study share similar sentiments.
“Secondly, the other major disadvantage is that while a lot of services can now be accessed
156
via the mobile devices and so forth, not many of our citizens have got smart phones so they
are mostly reliant on USSD type of phones which unfortunately cannot support the kind of
applications that we develop”. P2
“Ok, I think you know the first one is whether people have access to the internet, that’s
big one for majority of our clients. And if they do have access whether the devices they
got they will be able to locate that information in the format that is user friendly and that
you can have so thus the first part”. P3
Results of the study indicate that not all citizens have a smart phone to access the internet.
Therefore citizens are limited in accessing municipality services through such devices.
4.3.4.4 Poorly designed website
Subban, Nzimakwe and Pillay (2007) established that one of the most critical problems that
the web and the users face is information overload. This observation agrees with the findings
of this study as website for Local district municipalities are not user friendly and some with
outdated information and dead links. Further confirmation of the results of the study comes
from Paulo (2016) who noted that websites are often limited by problems related to usability,
language (inadequate translation, unfriendly user language), lack of credibility in the
message conveyed, lack of or irrelevant information and difficulties in getting the information
or services needed, among other issues. Interviewees express the following sentiments;
“...develop a website that will be friendly to all types of devices including the ones that
are, you know not like your smart phones but the normal phones and the other thing
that hinders the online use of services is if your website doesn’t learn itself to be user
friendly so you need to really understand what you need to do for usability of your
system into will be user friendly”. P3
“I think mostly it’s the stalling information that we would ordinarily find there. In that
most of the time is that number of municipality websites are just poorly designed that
sort of things you know. I think from a brander point of view, I think you agree with me
that if you visit a bad website I think the chances of you going back there they are quite
very less. So I think that becomes part of the problem”. P5
The findings imply that for municipality to increase the uptake and usage of ICT by citizens,
municipalities must design website with friendly user languages which is understood by
citizens, with credible message and relevant information.
157
6.3.4.5 Internet access
Abrahams and Newton-Reid (2008) observed that internet penetration is low due to high
access prices relative to income and broadband Internet is priced out of the range of the vast
majority of households. Proposals to create a municipal broadband market in order to
promote affordable high-speed data access are not yet implemented. Mbatha and Lesama
(2013) in their study recommends that money should be set aside for the purpose of
increasing bandwidth to provide a speedy, reliable and consistent Internet connection. Their
observation and recommendation support the results of this study as internet access is a
challenge which requires investment. This is supported by the following interviewees’
quotations:
“The last reason for me that I think is major throughout the country is internet
connectivity”. P2
“…is access speed is the problem”. P4
The findings imply that internet access is key in promoting the uptake and usage of ICT tools
as part of e-governance.
6.3.4.6 Obsolete equipment and applications
Seckel (2010) established that the ageing of the public service workforce and ever-present
fiscal pressures are creating a stronger imperative to modernize government operations
through innovative applications of technology. The results of this study support Seckel’s
(2010) observation that ageing in terms of equipment and application can affect the
implementation of ICT initiatives as part of e-governance. Sebastian and Supriya (2013)have
acknowledge that rapidly changing technologies and the high cost of new technology makes
it difficult to build an efficient telecommunication infrastructure. Sebastian and Supriya (2013)
expressed that the existing technologies become obsolete fast and it makes the developing
countries lag behind their developed counterparts on world index. This sentiment is
expressed in the following quotations:
“Currently, the website and the internal applications are faced with various challenges
calling for the modernisation of this environment. The current platform has become old
and outdated which cause the site to go down frequently”. P1
The findings indicate that municipalities should move with time in terms of equipment and
application so that online service delivery to citizens could be efficient and effective.

158
6.3.4.7 Service providers
This study found out that municipalities are not working alone in providing online service.
They are doing this with the help of different service providers in rolling out free WIFI and to
provide platforms for payments to citizens. Municipalities therefore rely on these service
providers in providing WIFI. The following are the sentiments from the interviewees;
“Although as a city we are busy rolling out WIFI, free WIFI, and we are trying to make it
cover as much foot print as possible. We still find that firstly, it’s intermittent itself
because we always rely obvious on the service providers. But secondly, to cover, it’s
not available we can’t cover all areas that require that service”. P2
“The issue of transaction or payments using online system is a generic one because
it’s open to fraud and all that kind of thing so we need to be able to get the people to
trust that the platform that we are providing them is secure when we do allow them to
use to transact online. At the moment we are not having that transaction but it’s quite a
big issue because also it involves many actors you know the banks, you get the people
that do the payments or payment service providers”. P3
The findings indicate that banks and various internet service providers play a role in
promoting the uptake and usage of ICT tools as part of e-governance by proving a channel
for payment system by citizens and in rolling out internet connectivity to citizens.
Municipalities are sometimes limited in controlling those service providers and therefore
cannot deliver to the expectations of citizens.
6.3.5 Solutions to hindrance on online services
6.3.5.1 Availability of free WIFI
This study established that availability of free WIFI through public hot spots promote the
uptake and usage of online services offered by municipalities. This is due to the fact that
South African data is still expensive and few people can afford it as compared to the one in
developed countries. The interviewees have this to say;
“It can be quite a difficult responsibility for the city because we don’t necessarily have
the right skills, we don’t necessary have the funding to do that but if we bring in the
private sector and the private sector can be able to also realise some benefits out of
that investment, then I think that would be a win-win situation that address the
broadband issue, the network issue”. P2
159
“Where the private sector is encouraged to come and built infrastructure network
infrastructure that will enable the full coverage of broadband across the city”. P2
“free WIFI, usability and easy access across all devices”. P3
“Internally, GBN (Gauteng Broadband Network) is being implemented that will help
people internet access via a very fast line”. P4
“Because from a technical point of view one would still have to argue and then say that
the issue of access broadband also plays a critical role in that to access this services
is not necessarily be free so one need to have data to do that. So I think as
government we have noted that the initiative that Gauteng Broadband Network is
doing in terms of laying Fibre out there with the ultimate goal of really making
broadband available to Communities out there”. P5
The findings of this study imply that availability of free WIFI through government initiatives
and other players can help to implement a broadband network which covers a wide
geographical area which can benefit citizens at large.
6.3.5.2 Education and Support
More educated and technology-affluent members of any society get greater access to any
ICT-related initiatives, while the underprivileged segment of the population does not enjoy
similar access. Results of this study found out that education and training plays an important
role in promoting the uptake and usage of ICT as part of e-governance. Further confirmation
of the results of the study comes from Mundy and Musa (2010) who agreed that e-
government officials need to pay attention to the cultural factors affecting e-government
adoption, and provide training that will lead to wider acceptance of e-government initiatives.
Interviewees express the following;
“As far a computer literate is concerned, yaah, that is a tough one because, although a
lot of the older people now are even, I think technology itself its evasive, it will
penetrate no matter what, because I know like initially some people like older people I
know will be quite reluctant to use phone but now they use whatsapp since its quite
common and now they use whatsapp they understand whatsapp and they do that and
it penetrates by itself but also and probably partner with other software companies and
or mobile companies to try and educate people around just being able to find their way
around these devices so that they are comfortable, they are more confident about how
and that can be encouraged”. P2
160
This study also found out that local governments use social media tools to connect with
citizens such as Facebook and Twitter and other media like televisions. One of the
participants has this to say;
“It can be even encouraged over different types of media like Television can be a way
that can be used to educate people. I have seen some technology programmes on the
T.V where they show the basic ways of how to send a message to somebody, you
know, those kinds of campaigns. And slowly I think that could improve literacy of the
population” P2
Findings of this study indicate that education and support can be done to citizens through
various media in understanding aspects of e-governance.
6.3.5.3 Device compatibility
From the quantitative survey results, this study established that citizens use various devices
to access internet. However some of these devices are not compatible with municipal
applications and therefore requires smart phones to be able to access services which are
offered online by municipalities. One of the interviewee has this to say
“As far as the use of devices is concerned which is the use of smart phones, to me I
think that’s evolution and I think with time these devices will start to be more
affordable. I can already see there are a lot of devices coming out of places like China
where they are starting to the push prices down and they are starting to come within
the affordable range of people”. P2
Findings of this study indicate that smart phones are still expensive for the citizens. This
implies that some smart phones have to be imported from other countries which could be
affordable to the majority of citizens.
6.3.5.4 User friendly website
Mpinganjira (2012) established in his study that the ease with which people are able to
navigate e-government sites, the kind of support available online, comprehensiveness,
reliability and up-to-datedness of information are factors that are closely related to service
quality perceptions. The observation by Mpinganjira (2012) concur with the findings of this
study whereby the respondents through interview highlights that free WIFI and usability and
easy access to internet is of paramount importance for the successful implementation of e-
governance. This is supported by the following quotation;
161
“…free WIFI, usability and easy access across all devices”. P3
The study indicate that easy access to internet promote the uptake and usage of ICT by
citizens in accessing online services offered by municipalities.
6.3.5.5 Modernisation of ICT
This study found out that municipalities can enjoy the benefit of using ICT in improving
service delivery through modernisation of ICT by keeping abreast with changes in
technology. The study also established that there are some benefits associated with
modernisation of ICT as indicated by one of the respondents in the following quotation
below;
“The e-Services website is part of the modernization project currently underway. And
the Project’s objective will improve Information efficiency, Reliability, Accuracy, Real-
time information access; and achieve a defined level of competencies while building
and sustaining an end-to-end ICT platform solution. It will also improve understanding
of how business processes are implemented in these Applications” P1
Results of his study indicate that improves information efficiency, reliability, accuracy, real-
time information access, high level of competencies, improved business processes is
achieved through modernization of ICT.
6.3.5.6 Renovation of website and applications
Paulo (2016) who explained that websites are often limited by problems related to usability,
language (inadequate translation, unfriendly user language), lack of credibility in the
message conveyed, lack of or irrelevant information and difficulties in getting the information
or services needed, among other issues. Municipalities are making efforts to renovate their
website and applications so that it becomes usable with relevant information. One of the
interviewee expresses the following sentiment;
“There is a project currently running and is aimed at renovating and extending the
current website and applications into a new technology to best support the needs of
the business” P1
Results of this study indicate that municipalities has to invest in renovating its website and
applications in order to get the full benefits of using its websites to deliver services to its
citizens.
162
6.3.5.7 Public Private Partnership
Kamblet (2003) hold that e-governance and ICT initiatives deal particularly with the
relationship between public departments and other institutions - other Government
departments, private sector service providers, non-profit and community organizations, and
relationship between civil society institutions. Findings of this study share similar sentiments
in believing the importance of private-public-partnership for successful implementation of e-
governance. Mamaghani (2010) also talks about the importance of public-private-partnership
for an efficient ICT project implementation. Interviewees express the following sentiments;
“I will start with the internet connectivity one because I think to me it’s a foundational
problem. I think that they must be some kind of Private-Public-Partnership. Where the
private sector is encouraged to come and built infrastructure network infrastructure that
will enable the full coverage of broadband across the city. And in turn maybe, the city
should give for that in return give the land on which those that infrastructure is
constructed for free. So there is win-win situation because for the city alone to roll out
fibre on it’s on and maintain it by the way, the maintenance is quite an issue as well”.
P2
“I think one would be issue of a partnership with sister departments like the department
of e-government and also with private sector in really pushing this”.P5
The findings imply that municipalities on their own cannot be able to provide the necessary
broadband due to high costs. Municipalities therefore require sharing cost through Public-
Private-Partnership and given that municipalities lacks some skills which might be required
to roll out fibre for internet connectivity.
6.3.5.8 Security issues
O’Donnell and Turner (2013) in their study found out that initiatives such as e-Seoul allow
citizens of Seoul in Korea to use mobile devices to access public services ‘anytime,
anywhere’. O’Donnell and Turner (2013) highlighted that website of Seoul provides a privacy
policy that is accessible on every page and that accepts data and addresses the use of
cookies or web beacons to track users. The results of this research indicate that
municipalities in South Africa are putting effort on security measures, although it is not at
high level as is seen with e-Seoul security measures. Further confirmation on the results of
this study on the issue of privacy and comes from Hughes (2012) who warns that while e-
government enhances service delivery, it equally enhances surveillance capability over
citizens in society. In addition, electronic communication, such as e-mail, is recorded and

163
can be traced far more easily than ordinary mail. One interviewee highlighted that security
should be tight in order to protect citizens personal information.
“Also another big thing there it should be aware of but it’s more of us internally to do
good is the security around these things” P3
“There is issue around also security, we need to be sure that security is cool and not
only end-point but the wide area network security and Apps security” P3
The results indicate that for citizens to be able to use and uptake ICT, security issues need
to be addressed by municipalities.
6.3.5.9 Invest in ICT
Bearfield and Bowman (2016) argued that despite the growing interest in transparency, it is
reasonable to assume that less-resourced cities would attach a lower priority to placing
information online. Bearfield and Bowman (2016) highlighted that given real constraints
imposed by fiscal stress, we expect cities with sufficient resources to be more resilient and,
therefore, have a greater commitment to transparency than less-resourced cities.
Zawada, Wallmach, Ngcobo and Mabule (2007) observed that ICTs are considered to be
both direct agents of development and also facilitators of integration, which, in turn, are likely
to promote socioeconomic development. Zawada, et al. (2007) asserts that many countries,
both developed and developing, are investing in ICTs to improve their lifestyles and business
practices. The South African government has placed a strong emphasis on ICT-sector
development through the implementation of a national ICT strategy, which proactively
addresses ICT penetration, particularly for disadvantaged segments of society (Zawada, et
al., 2007). This observation by the above authors is in contrast with the results of this study
as interviewee feel that municipalities are not giving enough budget to ICT. The following
quotation supports that;
“If we have got available budget we can buy the skills. If we don’t have the budget it’s
a problem”. P4
The results indicate that ICT initiatives are facing challenges due to budget constraints and
there is need to invest in ICT for its successful.
164
6.3.6 Security measures
Subban, Nzimakwe and Pillay (2007) likewise described that governments will need to
protect their information and systems from breaches of computer security that threaten not
only the integrity and availability of services, but also the confidence of users and the
general public in the system. The following subsections correlates with observation by
Subban, et al. (2007).
6.3.6.1 Authentication and Encryption
Kroukamp (2005) contends that security in e-government includes protecting systems and
data from hackers and viruses, ensuring the integrity of electronic records, preventing the
interception or falsification of information and being able to control the authorised sharing
and disclosure of information. Kroukamp (2005:56) share similar sentiments with the results
of this study when it established that municipalities are very careful about fraud on internet
through various authentications at various levels. Interviewees express the following
sentiments;
“When the system uses the information it is encrypted and passed through to the
various systems currently available on our e-services”. P1
“Ok, we obviously are quite very careful about fraud on internet. And to curb the risk of
those incidence, we ensure that we put sufficient authentication in place. And we
ensure that we secure all our transactions as much as possible. So in some cases like
on the EsiaKoco channel, we ensure that we have got 3 factor authentication that
make sure that a person’s information is only unique for that person and is known to
that user”. P2
“The issue of transaction or payments using online system is a generic one because
it’s open to fraud and all that kind of thing so we need to be able to get the people to
trust that the platform that we are providing them is secure when we do allow them to
use to transact online. At the moment we are not having that transaction but it’s quite a
big issue because also it involves many actors you know the banks, you get the people
that do the payments or payment service providers”. P3
“I think there are industry specific authentication methods that are basic the more
especially when people have to process issues of payment within that thing”.P5
The results indicate that citizens’ personal information is vulnerable to security threats such
165
as identity theft and fraud if proper security measures are not in place.
6.3.6.2 Registration and Password
Mundy and Musa (2010) in their study found out that in as much as obtaining feedback is
crucial, the government must guarantee the privacy and security of information provided by
individuals. The study by Mundy and Musa (2010) confirmed the results of this study of
security measures such as registering of users who login using username and password is
in place for municipalities. The following quotations for assert to that;
“Our e-Services website is password protected - Users who logon to the e-Services
website requires a username and password”. P1
“Ok, currently when users register online to get access to our e-services, they provide
certain personal information when they register”. P1
“There is always a problem, but on a new website you won’t just get access you have
to register we have to verify your registration before you get access”. P4
Findings of this study indicate that citizens gain confidence with municipality systems if their
security concerns are guaranteed which can come in the form of username and passwords.
6.3.6.3 End point security
This study established that citizen information is vulnerable to some security threats and
therefore municipalities are putting various measures in place such as secure socket layer.
The following quotations indicate some of these measures.
“We currently have Secure Socket Layers (SSL) is party used on the e-Services
website under the Accounts by e-mail section”. P1
“Internally, first of all for our security we have done security assessment and we have
got security best looking at both our internal security and website security and they
have come up with recommendations, this is just general security of the website and
the environment here, we have come up with recommendations which will be
implemented. However, we have got end point security, we have got service security,
we have got firewall securities and all those normal things that we do”. P3
The findings imply that authentication, encryption and end point security are fundamental for
the successful rolling out of ICT initiative if citizens are to increase their usage and uptake of
166
ICT. These findings address research objective1.
6.3.6.4 Online transactions
Chaterera (2012) in her study found out that participants expressed a general lack of trust in
using online transactions, particularly in financial transactions or those that involved sensitive
documents. Chaterera (2012) indicated that if security and privacy are not guaranteed,
citizens will tend to distance themselves from using e-government in fear of invasion of
privacy and misuse of the information they provided. These security concerns were also
raised in this study as highlighted in the quotations below.
“Ok, currently when users register online to get access to our e-services, they provide
certain personal information when they register”. P1
“The issue of transaction or payments using online system is a generic one because
it’s open to fraud and all that kind of thing so we need to be able to get the people to
trust that the platform that we are providing them is secure when we do allow them to
use to transact online. At the moment we are not having that transaction but it’s quite a
big issue because also it involves many actors you know the banks, you get the people
that do the payments or payment service providers”. P3
These findings imply that security measures are being put in place in metro municipalities
where they are transacting online, whereas the Local district municipalities are not yet
transacting online on a full scale basis.
6.3.6.5 Trusted Software and Industry Security Standards
Mutula and Ocholla (2010) expressed that e-government must ensure that government
processes and services observe the law and maintain their integrity in satisfying citizen
needs through the delivery of relevant, value-added and high-quality services. Their findings
agree with the following comments;
“So we need to be able to show that we are using the trusted people and with trusted
software like you know have certificates and all those things”. P3
“I think we are really guided by industry security standards to really make sure that the
traffic that would be on our website is quite secure to do business as far as bank
services”. P5
The results imply that laws should be able to protect citizens through the use of trusted
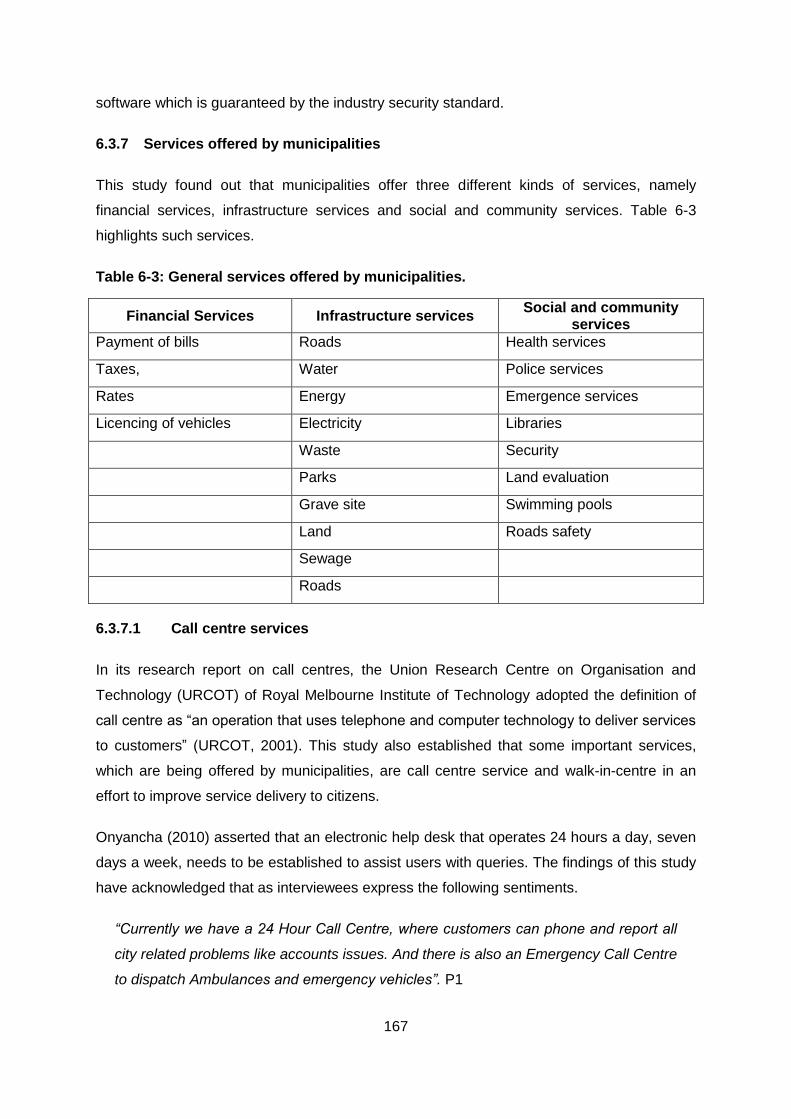
167
software which is guaranteed by the industry security standard.
6.3.7 Services offered by municipalities
This study found out that municipalities offer three different kinds of services, namely
financial services, infrastructure services and social and community services. Table 6-3
highlights such services.
Table 6-3: General services offered by municipalities.
Financial Services Infrastructure services Social and community
services Payment of bills Roads Health services
Taxes, Water Police services
Rates Energy Emergence services
Licencing of vehicles Electricity Libraries
Waste Security
Parks Land evaluation
Grave site Swimming pools
Land Roads safety
Sewage
Roads
6.3.7.1 Call centre services
In its research report on call centres, the Union Research Centre on Organisation and
Technology (URCOT) of Royal Melbourne Institute of Technology adopted the definition of
call centre as “an operation that uses telephone and computer technology to deliver services
to customers” (URCOT, 2001). This study also established that some important services,
which are being offered by municipalities, are call centre service and walk-in-centre in an
effort to improve service delivery to citizens.
Onyancha (2010) asserted that an electronic help desk that operates 24 hours a day, seven
days a week, needs to be established to assist users with queries. The findings of this study
have acknowledged that as interviewees express the following sentiments.
“Currently we have a 24 Hour Call Centre, where customers can phone and report all
city related problems like accounts issues. And there is also an Emergency Call Centre
to dispatch Ambulances and emergency vehicles”. P1
168
“The purpose of the e-Services channel is to minimize the interaction with the call
centre and facilitate and offer another channel to the citizens of Johannesburg to
interact with the City of Johannesburg (CoJ)”. P 1
The study therefore indicates that call centres plays a vital role in improving service
delivery to its citizens through ICT.
6.3.7.2 Walk-In Centres
Turpin and Ghimire (2012) revealed that telecentres are public places with computers,
internet and auxiliary services with human interactions. Turpin and Ghimire (2012) indicated
that telecentres offer an innovative approach for extending access to ICT-enabled services
in areas where there is poor network or where communities are disadvantaged and that they
can be a public place like post office, school, health post, or any physical place that provides
affordable access to the internet for variety of reasons. Findings of this study concur with
Turpin and Ghimire (2012) observation in that municipalities have public customer walk-in
centres which act as telecentres
“We have Customer Walk-in Centres where customers can go and log a query in a
specific region. There is Various Customer Pay-points, Libraries, Clinics, Waste
Management, Water, Electricity, etc”. P1
The findings imply that not every citizen can afford to buy data bundles in order to access
online services offered by municipalities. Instead some citizens rely on call centres and
public walk-in-centres to access internet in order to do transactions with municipalities.
6.3.8 Online services offered by municipalities
Carrizales (2008) defined e-services as the use of technology for external government
efficiency and effectiveness in providing services. Cloete (2003) argued that, in order for
good governance to be achieved, there has to be an acceptance of technological service-
delivery applications. Mpinganjira (2012) revealed that Government departments need to
ensure that members of the public can get a wide range of services online so as to reduce
the need for one to physically go to their offices. The revelation by Mpinganjira (2012)
concurs with the findings of this study by Mukonza, et al. (2016).
6.3.8.1 e-procurement and Financial transactions
O’Donnell and Turner (2013) in their study establish that The Home Tax Service enables
taxpayers in Korea to file tax returns, receive e-bills and process e-payments online.

169
O’Donnell and Turner (2013) further observe that with the establishment of the Korean
government’s e-procurement service, bidding for government contracts and payment for
services or supplies takes place online and enhances the transparency and effectiveness of
tax administration for both individuals and businesses. Observation by O’Donnell and Turner
(2013) concur with the result of this study as indicted in the following quotations below;
“…when there is a request for quotation or request for proposals”. P4
“I think from a procurement point of view, I think we are in the planning stage in terms
of introducing your e-procurement and I think those who are in business will be able to
do their business online with the municipality”. P5
This was also echoed by Pascual (2003) who suggested that e-procurement can open new
markets to local businesses by opening up the government process while making it more
competitive and fair.
O’Donnell and Turner (2013) further highlighted that taxpayers can receive an e-bill for the
payment of value-added taxes, global income taxes and other types of taxes. O’Donnell and
Turner (2013) explained that payment can be processed through a wire transfer by using the
e-payment service and citizens can also request up to six types of tax-related certificates
online, such as a business registration certificate or tax payment certificate. Findings of this
study share similar views by O’Donnell and Turner (2013) who stated that taxpayers receive
e-bill and can do e-payment. Interviewees express the following sentiments;
“…our e-services website is also update basically daily because we generate water
and electricity accounts and then we make it available online for citizens to access, we
provide citizens access to online services available for instance they can view and
download your water and Electricity Account online”. P1
“it’s just the statement, the billing side of things that’s offered online. Information about
tariffs is also offered online and static information like the times offices are open and all
that”. P3
“Well the website that we are planning to do will firstly be for financial information”. P4
Mukonza, Maeremule and Moetsi (2016) reaffirms that there are various services that are
considered to be e-government services. These include e-payments, using e-mails,
provision of information on websites, Short Message Services (SMS) and use of social
170
media in providing information, among others. This is in agreement with statements made by
interviewees.
“…we have the accounts by email online” P1
“Email accounts, you can request municipality your account could be emailed to you
on our website”. P4
The types of e-government services that are offered by either a national government
department or local authority are largely dependent on the type of technology available and
these appear in different forms and shapes (Asgarkhani, 2012). The statement is in
agreement with statements made by interviewees.
“Oh, unfortunately we are not at that maturity level as municipality to afford to offer
those things online, but I think we are moving towards making the services of our
electricity available online”. P5
6.3.8.2 CRM
Bovaird (2003) maintained that the drivers for organisational change are many and one of it
is through customer relationship management (CRM). Bovaird (2003) asserted that this
comes as a desire to redesign ('re-engineer') organisational processes around the needs of
service users and other stakeholders ('customers'), often through approaches such as
customer relationship management (CRM). Kamblet (2003) established that CRM is a
management approach or model that puts the customer at the core of a company's
processes and practices. Sebastian and Supriya (2013) asserted that e-governance
initiatives should be citizen-centric and demand driven. They further observed that instead of
applying a push service delivery model where the citizens are forced to consume whatever is
available, government should follow a demand-based pull model. Sebastian and Supriya
(2013) further urged that public data should be available freely for use for all and that
citizens should get an opportunity in decision-making process. Results of this study concur
with Kamblet (2003) and Sebastian and Supriya’s (2013) assertion and observation in that
metro municipality have Customer Relationship Management Services which is offered
online for citizens to consume services online. The following quotation from one of the
interviewee agrees with these observations.
“The other services which I haven’t mentioned there is obviously the how do I put it the
CRM services (Customer Relationship Management Services) and we offer that one
online as well”. P2
171
The findings imply that municipalities which are at high maturity level of e-governance such
as metro municipalities are able to offer Customer Relation Management Services which
allow its citizens to access services online as citizen service transformation.
6.3.8.3 Properties
O’Donnell and Turner (2013) in their study established that The Minwon 24 e-government
portal provides citizens with online access to application forms relating to civil matters such
as residency, land and vehicle registration. O’Donnell and Turner (2013) indicated that
overall, citizens and businesses can access over 1000 certificates and up to 4000
applications, complete tenders for government services and undertake taxation transactions.
The above results correlate with the finding of this study for metro municipalities although
number of certificates issues is less as compared to the ones issued in Korea municipalities.
The following quotation supports that;
“They can view the building plan submitted to check the progress of the building plan.
They can view the value of your property and object to the valuations the city have
given the property, we have building plans tracker, we have evaluation of properties”.
P1
Results of this study imply that ICT plays an important role in managing properties as far as
plan submission, checking progress and valuation of properties is concerned.
6.3.8.4 Smart Cities
Smart city services provide citizens with an improved living environment and increase their
overall quality of life for citizens (Yeh, 2017).Scholl and AlAwadhi (2015) revealed that local
governments can play major roles in creating smart urban spaces, for example by making
available modern and effective public administration and comprehensive online services
based on novel ICTs. Scholl and AlAwadhi’s (2015) observations concur with the results of
this study in which different applications are put in place in metro municipalities. Bhatnagar,
Jha and Singh (2011) asserted that the goal of e-governance is to create a more responsive,
productive and effective administration. Singh (2012) further urged that e-governance is
referred to as SMART governance in that it aims to use IT to improve the processes of
government functioning by bringing about simple, moral, accountable, responsive and
transparent (SMART) governance. The following quotation shares the same sentiments;
“So in our strategy we looking at and saying that you know there is a whole lot of what
is done by people in the area of called smart cities for instance they put apps for
policing, apps for air and water quality, apps for traffic management and apps for
172
transacting and all this kind of things. We are not offering these services at the
moment. However we are aware and we believe that you know when time comes I
think we will be offering that, particularly getting information from and sharing the apps
with the bigger municipalities”. P3
The results imply that metro municipalities in South Africa are moving towards becoming
smart cities with various applications in place to spearhead such initiatives. In Local district
municipalities the initiative is still behind due to limited financial resources and lack of skills
to implement that.
6.3.9 Advantages and disadvantages of ICT as part of e-governance
6.3.9.1 Advantages of ICT
AlAwadhi and Scholl (2013) found that the most prominent benefits were seen in the
improvement of services, cost savings, efficiency gains, energy conservation and information
sharing and integration. Similarly, in another study, efficiency gains, process streamlining,
cost savings, service improvements, and information sharing and integration were found to
be the most salient benefits (Scholl & Scholl, 2014). Results of this study share similar view
on the benefits of e-governance with Paulo (2016) who established that implementation of e-
governance projects brings benefits to any citizen who applies for services and information
online. Paulo (2016) hold that the most evident opportunities are the following: reduction of
long queues, 24 hours availability, efficient service, easy and fast access, reduction of
service costs by cutting the tax burden, administration bureaucracy reduction, an
administration more citizen-centred and inclusive, increased transparency in administrative
procedures and more comprehensive and accountable government actions for citizens.
Table 6-4 illustrate advantages of ICT, quotations and supporting sources.
6.3.9.1.1 Efficiency and effectiveness of services
Irafan (2017) argued that e-Governance builds the administrative efficiency: avoid lateness,
transparency, easy access, responsiveness, reduced red tape, increasing quality of service
and citizen centric delivery of services. This is in agreement with the quotations from
interviewees in Table 6-4, which also concurs with Yang (2001) who noted that some e-
government/e-governance programs have proven to be efficient, others are struggling, and
the effectiveness of e-government/e-governance programs are even harder to achieve in
situations where staff members from municipalities who are supposed to spearhead the
program lack the necessary skills especially in local municipalities as compared to the metro
municipalities. In their study, Trimi and Sheng (2008) concurred with results of this research
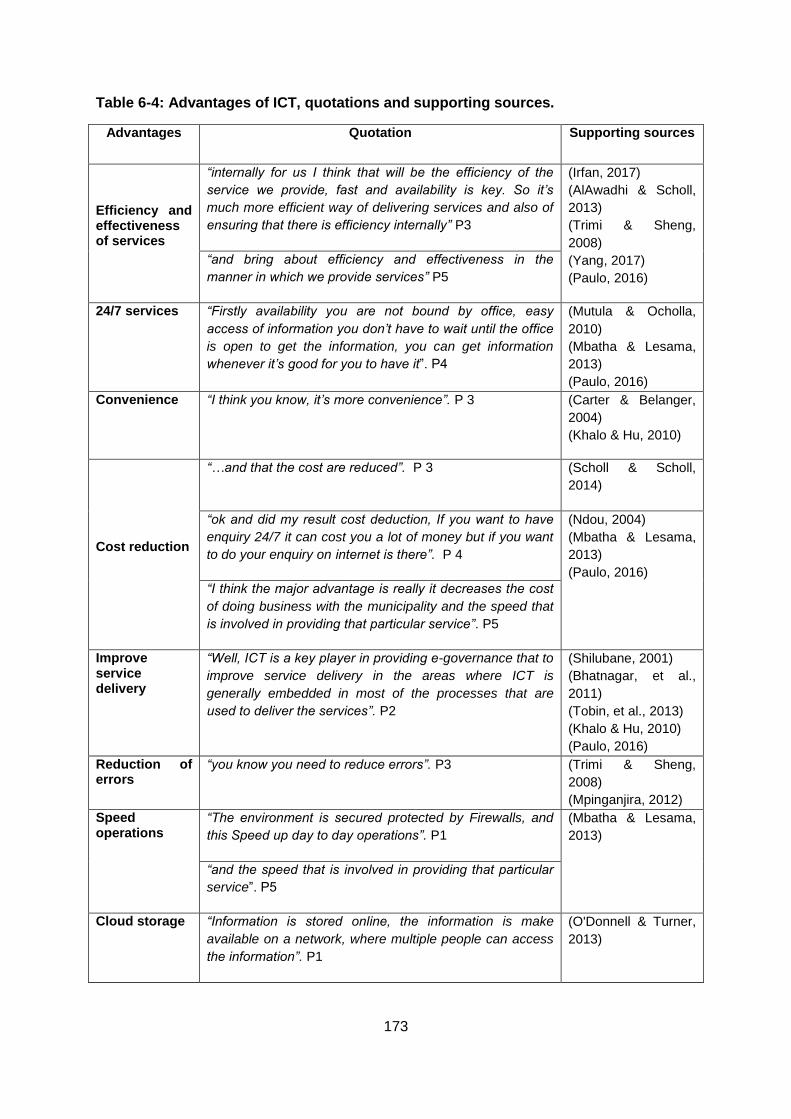
173
Table 6-4: Advantages of ICT, quotations and supporting sources.
Advantages Quotation Supporting sources
Efficiency and effectiveness of services
“internally for us I think that will be the efficiency of the
service we provide, fast and availability is key. So it’s
much more efficient way of delivering services and also of
ensuring that there is efficiency internally” P3
(Irfan, 2017)
(AlAwadhi & Scholl,
2013)
(Trimi & Sheng,
2008)
(Yang, 2017)
(Paulo, 2016)
“and bring about efficiency and effectiveness in the
manner in which we provide services” P5
24/7 services “Firstly availability you are not bound by office, easy
access of information you don’t have to wait until the office
is open to get the information, you can get information
whenever it’s good for you to have it”. P4
(Mutula & Ocholla,
2010)
(Mbatha & Lesama,
2013)
(Paulo, 2016)
Convenience “I think you know, it’s more convenience”. P 3
(Carter & Belanger,
2004)
(Khalo & Hu, 2010)
Cost reduction
“…and that the cost are reduced”. P 3 (Scholl & Scholl,
2014)
“ok and did my result cost deduction, If you want to have
enquiry 24/7 it can cost you a lot of money but if you want
to do your enquiry on internet is there”. P 4
(Ndou, 2004)
(Mbatha & Lesama,
2013)
(Paulo, 2016)
“I think the major advantage is really it decreases the cost
of doing business with the municipality and the speed that
is involved in providing that particular service”. P5
Improve service delivery
“Well, ICT is a key player in providing e-governance that to
improve service delivery in the areas where ICT is
generally embedded in most of the processes that are
used to deliver the services”. P2
(Shilubane, 2001)
(Bhatnagar, et al.,
2011)
(Tobin, et al., 2013)
(Khalo & Hu, 2010)
(Paulo, 2016)
Reduction of errors
“you know you need to reduce errors”. P3 (Trimi & Sheng,
2008)
(Mpinganjira, 2012)
Speed operations
“The environment is secured protected by Firewalls, and
this Speed up day to day operations”. P1
(Mbatha & Lesama,
2013)
“and the speed that is involved in providing that particular
service”. P5
Cloud storage “Information is stored online, the information is make
available on a network, where multiple people can access
the information”. P1
(O'Donnell & Turner,
2013)
174
when they concluded that since the 1990s, public-sector organisations across the globe
have been applying Internet technology and other ICTs innovatively so as to deliver
services, engage citizens and improve efficiency. It therefore implies that municipalities seek
to improve efficiency and effectiveness in the manner in which services are delivered to
citizens by using ICT tools as part of e-governance.
6.3.9.1.2 24/7 services
The results of this study share similar views by Mbatha and Lesame (2013) who established
that application of e-governance allows citizens to interact with government seven days a
week and twenty-four hours a day through various media such as the Internet and e-mail.
The results also support Mutula and Ocholla (2010) who found out in their study that e-
governance allows the citizen to access these services online 24/7, thus further enhancing
citizens’ trust in their governments. The interviewees express their sentiments as shown in
the above quotations in Table 6-4. Results of the study indicate that citizens would want to
have access of municipality services at any given time and it will save them of time and cost.
6.3.9.1.3 Convenience
Results of this study reveal that e-governance brings convenience to citizens as highlighted
in the quotation in Table 6-4. Findings of the study share similar view by Carter and Belanger
(2004) who noted that electronic government increases convenience and enhances
accessibility to government services. The results supports the results of Khalo and Hu
(2010) who concluded that the governments should adopt ICTs in its services so that it is
able to deliver these conveniently and efficiently to citizens. The results indicate that citizens
are concerned with convenience when they are accessing municipality services from
municipality. Convenience is one of the aspects which encourage citizens to pay their bills to
municipality as they will be seeing value in the services they are getting.
6.3.9.1.4 Cost reduction
The successful e- governance will save money and it can be helpful to develop ICT based
generation and to increase the economic growth (Alam, 2012).The results of this study share
similar sentiments in believing that the use of ICT as part of e-governance reduces costs
with Alam (2012) and Ndou (2004) who outlines some of the benefits of applying ICTs in
government departments. These are cost reduction which agrees with the quotation in Table
6-4 and efficiency gains; improved quality of service delivery to businesses and customers;
transparency, anticorruption and accountability; increases in the capacity of government;
175
network and community creation; improvements in the quality of decision making; and,
promoting the use of ICTs in other sectors of society. The results of this study correlate with
observation by Mbatha and Lesame (2013) who established that ICT have also brought
about a dramatic reduction in the cost and time involved in storing, processing and
transmitting information ‒ thus in fundamentally reshaping government ministries and society
as a whole. The results imply that one of the objectives for municipalities to is to reduce cost
through the use of ICT in their operations in delivery services to citizens.
6.3.9.1.5 Improve service delivery
According to Shilubane (2001) e-government uses technology (especially ICTs) as an
enabler to facilitate government service delivery by improving internal operations of the
government. In support of the views of the results of this study as expressed by the
interviewees’ sentiments from the quotations in Table 6-4, Tobin, Porumbescu and Lee
(2013) pointed out that ICTs greatly influence better governance and service delivery.
Further confirmation of the results of a study conducted by Khalo and Hu (2010) revealed
that the Department of Home Affairs ‒ as an essential service delivery department in South
Africa’s democracy ‒ implemented an aspect of ICTs via e-government to achieve higher
levels of service delivery to meet the needs of the citizens.
Mbatha and Lesama (2013) shared similar view that the availability of ICT tools in
government departments suggests that improved service delivery can be expected. The
results further concur with Mbatha and Lesame (2013) study who establish that the
emergence of ICT has not only revolutionised how business is conducted, but has also
transformed the delivery mechanism of governmental services. The findings imply that the
essence for municipalities to embark on e-governance is to improve service delivery to its
citizens through various ICT tools.
6.3.9.1.6 Reduction of errors
Results of this study established that the use of ICT as part of e-governance reduces errors
in the way operations are carried out by municipalities. Further confirmation of the results of
this study comes from a study conducted by Trimi and Sheng (2008) who argued that mobile
government through technology does not only reduces some logistical burdens and
decreases data-entry errors, but it also helps employees to make informed decisions and
take appropriate action. Mpinganjira (2012) noted that e-delivery of services results in a
reduction of tedious paper work often associated with traditional delivery channels. The
quotation is shown in the Table 6-4. The results imply that if statements sent to clients are
176
free from errors and reduce paper work, citizens can pay their bills and municipalities will be
able to provide services to citizens.
6.3.9.1.7 Speed operations
Results from this study reveal that the use of ICT as part of e-governance can increase the
speed of operation by municipalities. This was echoed by the interviewees in their quotations
in Table 6-4.Mbatha and Lesama (2013) also acknowledged that ICT can serve as catalysts
in the functioning of all economic and social sectors. More specifically, they can speed up –
even be an alternative to – the extension of services in areas such as health care, education,
agriculture, business and government. In support of the results of this study, Mbatha and
Lesame (2013) reaffirmed that ICT play a crucial role in speeding up the flow of information
and knowledge in the public sector and also in transforming the way in which government
and citizens interact directly. Mbatha and Leseme (2013) indicated that ICTs have proved to
be key catalysts in increasing work productivity and creativity in the public sector. The results
indicate that for municipalities to deliver efficient and effective services to its citizens, internal
processes in terms operating systems and applications software to be up to date.
6.3.9.1.8 Cloud storage
Prabu and Ganapathy (2017) expressed the opinion that cloud computing takes the
technology, services, and applications that are similar to those on the Internet and turns
them into a self-service utility. Cloud storage is therefore one component of cloud computing.
O’Donnell and Turner (2013) in their study established that major initiatives undertaken by
MOPAS include the transfer of the Korean government’s entire IT system and data to the
cloud environment by 2017. This observation by O’Donnell and Turner (2013) was found to
be important for this study as municipalities are vulnerable of losing their data through fire
and virus and if it is saved in the cloud it will be easy to recover to lost data which is saved
on internal hard drive and other external medium such as Compact Disk, memory stick,
external hard drives etc.
6.3.9.2 Disadvantages of ICT
Mzyece (2012) in his study revealed a number of common failure factors or inhibitors,
including: lack of stakeholder engagement and involvement; lack of implementation of
policies; resistance to change by the “old guard”; corruption leading to the deployment of low
quality and ultimately useless ICT solutions; lack of appropriate skills and skilled personnel;
lack of foresight and coordination; lack of supporting infrastructure; underfunding;
bureaucracy; poor work culture; high import duties on ICTs; cost of ICTs; unsustainable

177
funding(Mzyece, 2012). This study analysed positive and negative factors favouring or
hindering the adoption of e-governance in South Africa. Further confirmation of the results of
this study comes from e-government adoption model based on TAM (Davis, 1989). Negative
factors identified in the study include: exorbitant Internet connectivity costs; restricted access
(e.g. systems accessible to Internet users only); poor ICT infrastructure; unwillingness of
staff to adopt new systems; and lack of content in indigenous languages. The results of this
study share similar sentiments as highlighted by the following quotations under each
subheading.
6.3.9.2.1 Computer illiterate
Mbatha and Lesama (2013) in their study found that the availability of ICT tools in
government departments suggests that improved service delivery can be expected. Mbatha
and Lesama (2013) indicated that it should be noted that this availability does not
necessarily mean that they (ICTs) are actually being used in that their use may be hampered
by a lack of computer skills, low levels of confidence and negative perceptions in respect of
ICTs. This study supports the results by Mbatha and Lesama (2013) by reaffirming that
computer illiterate is a challenge in implementing ICT as part of e-governance. The following
quotations demonstrate such a challenge.
“The biggest, biggest challenge is that the majority of our citizens are not computer
literate”. P2
“I think it basically drive us to a point that as and when people become ICT literate I
think they would be a huge expectation in terms of us improving those business
processes and it means that we would have to invest more resources in making sure
that our resources are able to match that demand moving forward”. P5
Ntetha and Mostert (2011) study acknowledged the results of these findings by maintain
that civil servants identified a range of factors that they considered to be inhibitors to their
effective use of ICTs, particularly a lack of access or of availability of hardware and software,
and the lack of ICT education, ICT skills and knowledge regarding ICT. The results indicate
that although citizens are willing to take and use ICT, they have a challenge in that they lack
computer skills to access online municipal services.
6.3.9.2.2 Infrastructure
Mpinganjira (2012) in his findings showed that access to necessary infrastructure is not
sufficient to make one make use of e-services. The study by Sebastian and Supriya (2013)

178
reaffirmed that the ICT infrastructure still acts as the key barrier for e-governance adoption.
Sebastian and Supriya (2013) indicated that the information technology infrastructure is
composed of hardware and software that will provide secure electronic services to citizens,
businesses and employees and that the communication infrastructure includes mobile
networks, telephone networks, broadband connection and telecentres. The results of this
study support the findings of Mpinganjira (2012) and Sebastian and Supriya (2013) as
expressed by the following interviewee statements:
“The disadvantage is that obviously sometimes cannot reach all population.
Sometimes we are limited by infrastructure”.P2
The findings indicate that municipality need to invest in ICT infrastructure for the successful
rolling out of ICT projects.
6.3.9.2.3 Initial capital outlay
Habeenzu (2010) in his study outlined some of the challenges of implementing e-
governance as poorly developed ICT infrastructure owing to high costs in technology
acquisition and deployment (such as initial costs for setting up the ICT backbone
infrastructure) and high costs to access Internet-enabled ICT platforms(Habeenzu, 2010).
Results of this study concur with the findings of Habeenzu (2010) in which cost was cited as
a major hindrance to e-governance initiatives. Further confirmation of the results of this study
comes from AlAwadhi & Scholl (2016) who found that ICT self-sufficiency requires a critical
mass of resources, which limits the choices a smaller municipality might have. Clearly,
resourceful big municipalities can afford to have their in-house ICT departments and vendor
independence for their mission-critical systems. It therefore implies budget should be
allocated to ICT just like any other critical service area.
“The cost at the end of the day is not an issue because it should come down. It’s just
to get the money or capital to start doing it. But at the end of the day should reduce the
cost”. P3
“Well, the first one I said is costs”. P4
A prior study argued that larger government departments are more likely to utilize electronic
applications than smaller departments (Ahn, 2011). This is due to their access to greater
budgets, and more resources. It therefore follows that even local district municipalities need
prioritise ICT for the promotion of uptake and usage of ICT by citizens.
179
6.3.9.2.4 Lack of adoption and resistance
The widespread adoption of ICTs results in structural changes, both in the internal
organisation of the public service and in its external interfaces with the public and also with
suppliers of goods and services to government (Borins, 2007). Some staff members and
citizens therefore resist to such structural changes. These arguments are supported by the
participants’ responses as highlight in their quotations:
“…sometimes there is a lack of adoption or resistance”. P2
“The Citizens can also come and walk into a Triple C where they used to fill in a form
manually and now you are asking them maybe to type in the form and they are saying
Yoooh! I don’t know where this information will go so I don’t want to do that. Or you are
saying to them yaah you can pay your bill on the phone and they are saying what! I
would rather come with cash and pay the bill over the counter so you experience that
resistance from both sides actually and that can be quite a challenge”. P2
“On issues because they are types of initiatives there are internal focus, initiatives
efficiency, mostly that’s where you get a little beat of resistance efficiency but the
customer are always supportive depending on how you place them or explain to
them”. P3
Mbatha and Lesema (2013) believed that most new innovations (depending on their
purpose, need and acceptance) often achieve slow penetration at first, but then grow quickly
as their adoption and rate of use increases. The results of this research therefore hold that if
staff and citizens are informed of the benefits of ICT as part of e-governance their uptake
and usage will increase.
6.3.9.2.5 Security issues
Gualdoni, Kurtz, Myzyri and Rizvi (2017) argued that identity theft is a very scary and real
threat to everyone. In order to give people peace of mind a new algorithm of mitigating risk is
made available in the form of the Secure Online Transaction Algorithm (SOTA). Mpinganjira
(2012) in his study found out that lack of awareness of available e-government services and
security concerns were two factors with the highest percentage of respondents indicating
that they regarded them as important or very important challenges facing adoption of e-
government services in South Africa. The results support Mylonakis and Malioukis (2010)
who observe that online services are by nature prone to security attacks and this instils fear
on the part of targeted users. Sebastian and Supriya (2013) revealed that lack of security

180
rules and policies, threats from hackers, intruders, and viruses, absence of privacy of
personal data are the major problems in developing an effective web model for the e-
governance initiative and people feel unsafe to avail the services over the web in such
conditions. The results of this study confirm that security issues are a concern as indicated in
the following quotations:
“Also another big thing there it should be aware of but it’s more of us internally to do
good is the security around these things”. P3
“There is issue around also security, we need to be sure that security is cool and not
only end-point but the wide area network security and Apps security”. P3
The findings imply that citizens are not encouraged to uptake and use ICT initiatives as part
of e-governance until and unless security issues by municipalities are addressed.
6.3.9.2.6 Staff resistance
Paulo (2016) asserted that Chinese civil servants, generally speaking, lack expertise and
skills to fully develop, implement and monitor e-governance projects. The results of this
study correlates with observation by Paulo (2016).
“Both, Sometimes employees have been set in a certain way of implementing those
services and now you are telling them no let’s do it smarter, let’s do it quicker, let’s do
it you know in a more accountable manner and they can say NO we have been always
doing it this way so you can experience that resistance from both employees and from
the citizens”. P2
“I think most people have resistance to efficiency type of initiatives”. P3
“…you know that resistance to change issue, especially resistance to technology
which they think they do not understand. They don’t have to understand it. Understand
what the system does for you, not how do you get to that. That seems to be a block”.
P4
The results imply that is civil servants lack computer skills they will resist the change which is
brought by technology.
181
6.3.9.2.7 Unavailable network
A study by Zawada, Wallmach and Mabule (2007) established that in many countries –South
Africa included – there is great improvement in telecommunications through different mobile
cellular networks and computers, along with increased utilisation of the Internet for e-mail, e-
commerce, e-searching and videoconferencing. Their observation is in contrast with the
findings of this study as availability of network is still a challenge as highlighted by the
following quotations:
“Well, at time the network becomes unavailability or unstable which causes employees
not to be able to work”. P1
“…then the unavailability again of network problems”.P4
The results of this study imply that municipalities are faced with challenge of network
availability, which therefore affect the uptake and usage of ICT as part of e-governance in
accessing municipality services.
6.3.9.2.8 Load shedding
The findings of this study indicate that load shedding and theft of cables is a challenge in
municipalities which is affecting the uptake and usage of ICT. This is supported by the
following quotation:
“…load shedding is also a disadvantage”. P1
The findings are consistent with the findings by Komba (2015) whose observations
suggested that lack and/or unreliable electricity had a negative relationship with e-
government adoption. This is also confirmed by Lin, Fofanah and Liang (2011) in their
research of the Gambian e-government situation that, there was a direct relationship
between power availability and a citizen's ability to make use of available government
services.
6.3.10 Staff buy-in and support
6.3.10.1 Staff buy-in in e-governance
The findings of this research suggest that majority of staff support e-governance initiatives
as they are aware of advantages associated with it. These findings are in contrast with a
study contacted by Komba (2015) who found out that there is no support from the
182
government officials. These results are also in contract with previous studies by Ebrahim,
Irani and Shawi (2003) which showed that some government officials perceive e-government
as a potential threat to their power and viability because it might reduce their authority in
government and therefore, are reluctant to the idea of online transactions. These are the
supporting statements for e-governance initiatives by the interviewees. These findings do not
agree with findings of this study as the use of technology is taking over in all spheres of
government and business in this day and age. Here is what the interviewees had to say;
“I think generally they are, especially when you have made them understand what the
advantages of that are emanating from that”. P2
“Ok, I think the staff are very supportive because it makes their jobs particularly those
that are affected makes their jobs easier and I think because we are a small
municipality that is constrain of resources so we could use resources elsewhere”. P3
These quotations imply that the use of ICT as part of e-governance is no longer a threat to
staff as they have appreciated the benefits associated with it. It therefore means that staff
members accept the uptake and usage of ICT as stated in objective 1 of this study.
6.3.10.2 Staff resistance
Tankoano (2009) observed that the clientele constitutes the main obstacle faced by e-
governance. Tankoano (2009) further argued that this obstacle is linked to a lack of
sensitivity on the part of role-players; a low level of adaptation to these technologies by
individuals, administration and businesses; resistance to change; and weak existing
infrastructures. Results of this study share views similar to that of Tankoano (2009). Further
confirmation of the results of this study comes from Sebastian and Supriya (2013) who noted
that low education and ICT skills is a key barrier to the ICT adoption and use. Interviewees
express the following sentiments;
“Staff not computer literate, sometimes there is a lack of adoption or resistance”. P1
“Both, Sometimes employees have been set in a certain way of implementing those
services and now you are telling them no let’s do it smarter, let’s do it quicker, let’s do
it you know in a more accountable manner and they can say NO we have been always
doing it this way so you can experience that resistance from both employees and from
the citizens… but you are right, you will find one or two who really get resistant
because they feel that their jobs are threatened”. P2
183
“…you know that resistance to change issue, especially resistance to technology
which they think they do not understand. They don’t have to understand it. Understand
what the system does for you, not how do you get to that. That seems to be a block”.
P4
“More specifically the younger generation tend to accept the uptake and supportive to
that, I think it’s quite unfortunate and even in older generation, we don’t necessary
have that huge number which actually resist change that in terms of providing
services”. P5
The results imply that technological change could not be easily embraced by staff members
and citizens as they fear of losing their jobs and not trusting the new technology.
6.3.10.3 Change management
Bwalya and Mulula (2015) proposed that in order to incorporate change management plans
in the overall government culture and practice and encourage public service business
process re-engineering and this should include what should be done, by who, how, and
when. Bwalya and Mulula (2015) indicated that change management plan should be a
continuous plan that should be embedded into all the core clusters of the e-government
strategy. The results of this study found out that change management is lacking in
municipality e-governance strategy since the introduction of ICT is still being resisted by
some members of staff and citizens. Abdul, Hamdan, Yahya and Shanudin (2002) observe
that the rapid development of ICTs has, from time to time, changed humans’ way of life. This
observation agrees with the findings of this study as eluded by the following quotes. Abdul,
et al. (2002) further interpreted that ICTs as a discipline of science, technology, engineering
and administration that is used to manage and process information, create interaction
between humans and computers and describe the related social, economic and human
culture and the environment. The following quotations support that;
“But I think the job is easier as I said on the effectiveness, more externally focused
customer focused initiatives. So online service delivery like in any other improvement
type of technology you know it has to be explained in the right way and people
shouldn’t left with the questions on the role they will play in that space. They should
understand and it must be a positive thing in managing change”. P3
“So those issues around managing change because you know it’s normal human
behaviour”. P3
184
The findings indicate that introduction of e-governance in municipalities require to manage
change in their e-governance strategy as it affects human resources and business
processes as jobs are made easier through technology.
6.3.11 Citizen Relationship
Kent (2013) found that online interactions can allow governments to build relationships with
stakeholders, solve problems, and set forth socially responsible goals. Mzyece (2012) in his
study emphasised citizen engagement as a success factor, specifically, implementing
effective public awareness campaigns and stakeholder collaboration processes in order to,
for example, enforce citizens’ rights to access information and participation in decision-
making, pointing to the need to transition to e-governance. These findings concur with the
results of this study as highlighted in the following comments:
“Yaah I think everywhere where you open channels of communication, relationship
improves because there is certainty around many things”. P3
“I think if we can get feedback from the communities to then say these are the areas of
improvement that we need to improve on and surely make that promise to improve
around that”. P5
The findings indicate that the essence of e-governance is to improve citizen relationship.
This is done by open the channels of communication and giving timeous feedback to
citizens.
6.3.11.1 Accurate information
Mbtha and Lesema (2013) in their study found that the benefits of using ICT in government
departments is that ICT were found to provide accurate data in a timely manner and as
needed and also to provide accurate and updated information to decision makers and
investors. Their results are in agreement with the results of this study as highlighted by the
following quotation.
“So through the use we ensure that we get timely and accurate information to the
citizens”. P3
The result indicates that a municipality gains trust from their citizens by providing them with
accurate information of which they you it to make informed decisions.
185
6.3.11.2 Demonstration
Results of this study agree with Chaterera (2012) who recommends that awareness
campaigns regarding e-government services are very important in promoting e-governance
adoption. Chaterera (2012) explained that this can be done by organising exhibitions,
conferences, seminars and press releases, and by broadcasting e-government services on
national television and radio. Chaterera (2012) moreover believes that in these awareness-
enhancement programmes, citizens should be informed about the benefits to be gained
from, and the use of the services.
“Demonstrating and by creating an awareness of usability of online services available”.
P1
The findings indicate that citizens can be informed of the importance of e-governance
through demonstrations and various campaigns which can create awareness of the usability
of online services.
6.3.11.3 Reliable e-services
Mbatha and Lesema (2013) stated that money should be set aside for the purpose of
increasing bandwidth to provide a speedy, reliable and consistent Internet connection. The
statement concurs with the following quotation;
“I think that the municipality should provide reliable e-governance, e-services. The
services should be able to result in tangible benefits for the citizens and to provide the
efficiency they require and convenience is a big thing”. P2
The results indicate that reliable e-services can only be achieved by increasing the
bandwidth so that citizens can have access to internet without any disruptions or
interferences.
6.3.12 Strategies to improve online service delivery
6.3.12.1 24/7 Web service
Mutula and Ocholla (2010) revealed that e-governance maturity allows the citizen to access
services online 24/7, thus further enhancing citizens’ trust in their governments. Findings of
this study agree with those of Mutula and Ocholla (2010) as indicated in the following
quotation;
186
“24/7 Available online web service. Add more departmental services online for
customer to view and access”. P1
Results of this study indicate that 24/7 web service allows citizens to access municipal
services at the comfort of their homes at any given time thereby enhancing citizens’ trust
with their municipality.
6.3.12.2 Communication infrastructure
A research conducted by Human Sciences Research Council (2005) found that South
Africans experience many forms of poverty, including infrastructure, services and information
poverty. Information poverty refers to lack of access to and utilization of information and
communication technologies and the services that they facilitate, including electronic
transactions and Internet banking, government services online, access to online educational
content or entertainment. The South African digital divide shows major differences in ICT
access between and within provinces. The finding, however, is in disagreement with the
following comment from an interview participant;
“We would increase and really have a very strong communication infrastructure that
we can access those apps’. P3
The findings from this study imply that municipalities are moving towards improving online
service delivery by having strong communication infrastructure. The results indicate that
municipalities are trying to bridge digital divide which has been in existence for a long time
by increasing communication infrastructure in both metros and local district municipalities so
that citizens can have access to online services.
6.3.12.3 Political buy-in
Political commitment is a major precondition of the successful implementation of any e-
government initiative. Karim and Khalid (2003) argue that some governments in developing
countries do not have the commitment to implement e-governance and these governments
are also poorly equipped to develop and propose successful policies. However, Mamaghani
(2010) in his study observe that in developing countries, unstable political conditions and
inadequate policy formulation act as barrier for ICT deployment. Onyancha (2010)
recommended that government leaders show goodwill (by providing an enabling political,
social and economic environment) with regard to ICT policy formulation, and consider e-
governance as an enabler as opposed to a competitor, thereby throwing their weight behind
all initiatives that are geared towards achieving e-governance in the region. The above
187
observation by Mamaghani (2010) and recommendations by Onyancha (2010)) confirm the
results of this study as expressed by interviewee in the quotations below;
“Ok, first one is political buy in. This is a political organisation. if the politicians decide
that’s the way we go, that’s the way we go. That’s what they call democracy and they
have been elected and that’s what they are supposed to do to give direction to the
municipalities”. P4
The findings indicate that without political buy-in in e-governance initiatives, the project of
ICT in municipalities will not succeed.
6.3.12.4 Public internet
Onyacha (2010) in his study found out that the number of personal computers in Africa is low
and the growth in internet usage witnessed over the past ten years could only mean that the
African population is forced to share the relatively small number of available computers to
access information on the internet. The results of this study concur with Onyacha (2010)
findings as highlighted in the quotation below;
“Citizens who don’t have access to online services should make provision in regions
for citizens to have public access to the internet”. P1
Verneulen (2011) finds that many people in South Africa access Internet services at places
of work. It therefore follows that those without access to internet at work place are deprived
on the usage of ICT. Hence, the results imply that municipalities through its policies are
making provisions to establish public internet access to citizens so that they could be able to
access municipality services.
6.3.12.5 Managing Relationships
Kamblet (2003) argued that as a means of strengthening institutional relationships
Government partnerships should be able to strengthen relationships between the
government and other institutions such as NGO's. Kamblet (2003) indicated that this will
help in creating a strong economic, social and political format within the society. Sheridan
and Riley (2006) make the observation that e-governance and e-government denote two
distinct concepts and they see e-governance as a “wider concept that defines and assesses
the impacts technologies are having on the practice and administration of governments and
the relationships between public servants and the wider society” (Sheridan & Riley, 2006).
The results of this study agree with the interviewee who also asserts that relations should be

188
managed between government and its different stakeholders. The following quotation
supports this argument.
“…we need to have some different types of relationship management and government
managing relationships”. P3
6.3.12.6 Remove corruption
The e-Governance strategies are serving as a mechanism effort on the quality of
governance and combating corruption across the global world (Irafan, 2017). Irafan (2017)
argued that the role of information and communication technology (ICT) in serving as a
mechanism to improve effective public service delivery, better transparency and combating
corruption in developed and developing countries. The above views correlate with the results
of this finding whereby corruption is affecting the implementation of ICT and e-governance
initiatives and therefore should be costly to the perpetrators. The following quotation
demonstrates such concern.
“They need to get rid of corruption in Management”. P1
The results indicate that if corruption is not addressed it can affect the implementation of ICT
and e-governance.
6.3.12.7 Modern Technology and Right Software
Khalo and Hu (2010) assert that in response to a view of government performance and
increasing public demand for the delivery of ‘better’ services in terms of quality, accessibility
and choice, the mode of operation of government departments in South Africa has been
subject to major modernisation efforts. Komba (2015) in her study found out that the
successful adoption of e-government systems will require a widespread, common and
modern ICT infrastructure. The study findings concur with the strategies which are being put
in place by municipalities in South Africa which supports successful implementation of e-
governance initiatives. Here is a quotation which supports that;
“So this is our strategy as I said, you would look at ensuring that our desktops are
modern and up to date with right software so that we can get”. P3
The findings suggests that without modern ICT infrastructure and software there won’t be
any guarantee that e-governance initiatives will be successful.
189
6.3.12.8 Security issues
Government and people expect their data to remain secure if they were to use e-services,
and these are; cash, medical records, bank accounts, agreements, official communication,
emails, decisions, citizens’ identity information, intellectual property, etc and hacking of the
most protected government websites has taken place and data stolen and misused(Singh,
2018). Irafan (2017) indicated that the trusts, low cost service, easy access, security,
responsiveness, time saving are positive factors for administrative efficiency and e-
Governance. Singh (2018) and Irafan (2017) agree with the findings of this study as security
issues is still a concern as highlighted by the following quotations;
“Also another big thing there it should be aware of but it’s more of us internally to do
good is the security around these things”. P3
“I think here the issues around the accuracy of information and security. I think you
know, now accuracy and immediacy of Information is more for us people would want
more updated information and immediately and we are worried about obviously the
security”. P3
Municipalities are therefore required to address security issues if implementation of e-
governance is to be successful.
6.3.12.9 Shared applications
Scholl (2016) outline that ICT self-sufficiency requires a critical mass of resources, which
limits the choices a smaller municipality might have. Scholl (2016) urged that resourceful
municipalities such as big metro municipalities can afford to have their in-house ICT
departments and software independence for their mission-critical systems. Scholl (2016)
further outline that smaller municipalities have the choice of either using software leading to
dependencies on private interests, or forming collaborative alliances that pool and leverage
their resources. Scholl and AlAwadhi (2015) observed that it is both interesting and revealing
that commercial vendors consistently refuse to engage in pool agreements for their software
with smaller municipalities (Scholl, 2016). The results for this study therefore share similar
view with Scholl (2016) in that smaller municipality cannot afford big systems and
applications and therefore need to share applications with bigger municipalities.
“Well, I believe for smaller municipalities we are quite clear like we cannot afford the
big system and apps, so what we need to be looking at and this is our strategy here is
that we would go cloud apps or shared app or app shared with bigger municipalities
190
like Erkululeni or other provincial government”. P3
The results imply that Local district municipalities are struggling to fully implement e-
governance initiatives as compared to metro municipalities. Metro municipalities have large
resource base in the form of rates and taxes which they charge citizens as compared to local
district municipalities whose revenue base is constrained due to poor revenue collection
because of defaulters who are affected by high levels of poverty and unemployment.
6.3.12.10 Skilled professionals and staff training
In their study, Paterson, McGrath and Badroodien (2005) note that, in South Africa,
considerable attention has been paid to intermediate level ICT skills in light of the advantage
of ensuring that the country develops a competitive edge with a view to attracting investment
in response to national transformational prerogatives, which include growth and
employment. Mpinganjira (2012) further observe that Government employees need to be
specially trained to handle customers online and provision of prompt responses to online
queries is essential in this regard. The above observations correlate with the findings of this
study as municipalities advocate employing skilled professionals in order to deliver online
services to citizens. Mbatha and Lesema (2013) moreover believe that a number of
measures need to be put in place, for example the enactment of an enabling policy and
legislative framework to cater for skills development and the improvement of infrastructure
(that is, telecommunications). The author’s observation share similar sentiments the
interviewees who express the following;
“employ skilled professionals”. P1
“To improve the service delivery, staff needs to be trained be more professional and
productive. They need to know their product, they must not be sending from pillar to
post. Some customers when they phone call centre they are send from pillar to post”.
P1
The results therefore indicate that in order to ICT and e-governance to be successful staff
members should be skilled first so that they can also pass such skills to the citizens.
6.3.12.11 Corporate governance ICT framework
Oracle (2006) identifies weaknesses associated with conceptualising, operating and
maintaining systems of e-governance. Oracle (2006) explained that these include social
aspects (poor basic education, low literacy levels, poor IT literacy, different languages, lack
191
of public acceptance of self-service models, and shortage of skills); political aspects (low
budget allocation, absence of cyber laws, slow decision-making processes, inadequate
hierarchical structures, short-term approaches owing to elections, and inadequate integration
and reform agendas); economic aspects (a lack of investors and poor budget control); and
technological aspects (shortage of IT skills, high internet costs, heterogeneous data, lack of
IT standards and software licences)(Oracle, 2006).
6.3.12.11.1 Digital ICT Framework
Abrahams and Newton-Reid (2008) carried Community Survey and results show that
approximately half of households in Gauteng (49%) have access to a mobile phone, nearly
double the number of households that have access to landlines (28.5%). These results were
disaggregated to a municipal level and further disaggregated to a community level to
understand the trends in the penetration of ICTs, in order to design highly specific access
and delivery strategies for e-governance, connectivity and digital inclusion (Abrahams &
Newton-Reid, 2008). Results of the study agree with Abrahams and Newton-Reid (2008) in
that municipalities are taking initiatives in coming up with digital framework which connect
citizens. A further service available using mobile phones involves the provision of real-time
information to citizens on their mobile phones regarding natural disasters such as floods
under the National Disaster Management System (MOPAS, 2012). Interview participants
remarked,
“so if you think for example, if I show you this picture here which reflects digital
framework, digital ICT framework and just at high level so this picture just shows
communication layer, it shows the application layer, then it shows the analytics layer,
and then integration analytics layer. If you look at this from the bottom there we have
got things like for example safety, policing and whatever, we have got cameras, we
have got sensors that is placed around the city. They pick up information that is
analysed through the application and provided information as consumed up there. We
have got Mobile phones, we have got tablets, radios and all that, those things all
brings in information about that is used by these service security, traffic, government
which means all the administration staff when people are apply for land, when they
apply for emergency communication, health care, education, campuses and building
its being enabled through technology”. P2
“So it really changes the model of ICT and those are the key issues for smaller
municipalities”. P3
192
“I guess for large municipalities they will be the issue around architecture, around
disaster recovery, data centres and around a whole lot of things, this is for larger
municipalities”. P3
The findings imply that municipalities whether metro or local district are having an ICT
framework although at various implementation stage.
6.3.12.11.2 Full ecosystem
ICT ecosystem is composed of four layers -content, hardware, software, and
telecommunications (Lee, Park, & Lee, 2018). Sebastian and Supriya (2013) revealed that
the ecosystem of an e-governance project consists of telecommunication infrastructure,
supporting technology, policies, technical skills of the users, etc. Sebastian and Supriya
(2013) further observed that the readiness of this ecosystem is an important factor which
determines the success of these initiatives and it is important to investigate whether this
ecosystem is ready to adapt the technology. Abrahams and Newton-Reid (2008) also argued
that South African city and municipal governments can build such e-governance within a
broad development approach. Abrahams and Newton-Reid (2008) explained that
municipalities can activate e-governance programmes that enable citizens, business and
SMEs to interact with government using the full range of electronic media, through
incorporating relevant measures in growth and development strategies (GDS) and integrated
development plans (IDP). These sentiments were in agreement with interview participant
who had this to say;
“I think, you have to think about online services as a full ecosystem that supports the
full entire requirements of citizens. So when you think about how citizens will
communicate with the rest of the world. When you think about the level of inter-
relatedness of things which we call now internet of things if you look at how things are
slowly becoming interconnected you would want the citizens to be able to work in an
environment where they know that they can be able to get their services as quickly as
possible and be able to function in the rest of the world like any other citizen out there.
So I think the whole e-governance ecosystem needs to be thought of as a bigger
picture rather than just isolated incidence of Pick and Payee for my bill”. P2
It therefore implies that e-governance should be looked at through the lens of full ecosystem
that enables citizens, business and SMEs to interact with government using the full range of
electronic media. The framework which is developed in this study in the next chapter is
therefore incorporating such aspects as it addresses objective 3.
193
Application layer
Backus (2001) argued that e-governance is more than just a government website on the
internet, and that it should be thought of as the “application of electronic means in the
interaction between government and citizens and government and businesses, as well as
(the application of electronic means) in internal government operations”. The argument by
Backus (2001) concurs with the findings of this research as application allows citizens to
access municipality services through various applications. The following quote supports the
arguments.
“They pick up information that is analysed through the application and provided
information as consumed up there”. P2
Communication layer
O'Donnell and Turner (2013) state that citizens can use their smart phones to report threats
of violence, or to report missing children to the authorities and this service works in tandem
with closed-circuit television (CCTV) control towers to monitor the threats reported by
citizens. Results of this study share similar view with O’Donnell and Turner (2013) in that
citizens make use of cameras and sensors which are planted in and around municipality
areas as a surveillance mechanism. Onyancha (2010) noted that in all the proposed models
of communication, emphasis is on a two-way system of communication between the players,
that is government to citizens and citizens to government; government to business and
business to government; and citizens to business and business to citizens. Onyancha (2010)
expressed that citizens’ interaction with the business community is sometimes facilitated by
the government via the hyperlinks to businesses on a government’s website.
Onyancha (2010) have also acknowledged that Kenyan government identifies
communication within the government and communication with business and citizens as its
core e-governance activities. Some similar services and products were noted on the
government websites of a few other countries such as Republic of Tanzania, Ghana and
Malawi. The findings of this study established that South African municipalities are at
advanced stage especially with metro municipalities in providing advanced communication
platforms such as cameras and sensors. The interviewee expresses such sentiments in the
following quotation:
194
“If you look at this from the bottom there we have got things like for example safety,
policing and whatever, we have got cameras, we have got sensors that is placed
around the city”. P2
The results of this research indicated that metro municipalities in South Africa are under
surveillance to monitor criminal activities and to report any such incidences.
Analytical and Integration layer
O’Donnell and Turner (2013) revealed that there is a growing trend involves the use of smart
phones by citizens to interact with e-government services. O’Donnell and Turner (2013) also
established that some 30 million citizens possess a smart phone in Korea and citizens can
use their smart phones to alert the authorities of a road-side problem, such as illegal parking
or malfunctioning traffic lights, by emailing a photograph to the customer service section of
the relevant government agency, which then coordinates a response and reports back to the
citizen when this action has been completed. Findings of the study share similar sentiments
with O’Donnell and Turner (2013). Results of this study indicate that mobile phones, tablets
and cameras play a crucial role in the uptake and usage of ICT as part of e-governance.
Onyancha (2010) in his study found out that entertainment and news, which are the main
services provided by radio and television, appeared to be the citizens’ preferred services,
resulting in numerous people owning radios in the region. Onyancha (2010) however
revealed that, it is worth noting that governments could use this service to improve service
delivery. Onyancha (2010) explained that fast gaining in the popularity stakes are mobile
phones and personal computers. Generally, electronics (including mobile phones and
personal computers) are becoming cheaper, and therefore more people can afford them.
The results of this study share similar view by Onyancha (2010) as highlighted in the
following quotation:
“We have got Mobile phones, we have got tablets, radios and all that, those things all
brings in information about that is used by these service security, traffic, government
which means all the administration staff when people are apply for land, when they
apply for emergency communication, health care, education, campuses and building
its being enabled through technology”. P2
The results indicate that mobile phones, tablets and radios are integrated together to provide
information to citizens with regards to emergence, health care, education, campuses and
buildings.
195
6.4 Chapter Conclusion
In this chapter the findings of the qualitative data analysis are presented and discussed. .
This was done by presenting and discussing emerged themes emanating from the interviews
conducted from Executive members from Metropolitan and Local district municipalities. With
consent of the interviewees, the interviews were recorded and were transcribed. Transcripts
were uploaded into electronic data analysis tool called Atlas.ti 7 (version 7.0.81). In this
analysis, five primary documents, namely P1, P2, P3, P4 and P5 from the interviews were
considered. Codes were created using open coding systems. Codes were further grouped
into families of codes with the number of incidents (quotations) in each family of codes.
Emerging key themes and sub themes was presented and discussed.
196
CHAPTER 7: E-GOVERNANCE FRAMEWORK FOR LOCAL AUTHORITIES IN SOUTH
AFRICA
7.1 Introduction
The previous two chapters presented the results and interpretation of the quantitative and
qualitative methods. This chapter will discuss the application of an appropriate e-governance
framework for South African municipalities, whether metro or local district municipality.
Design of the e-governance framework was informed by inputs which emanate from the
results of the survey and from interviews with ICT executive members from the
municipalities. ICT executive members are the ones who spearhead ICT and e-governance
initiatives in those municipalities by taking into consideration proposed strategies which can
improve the use and uptake of using ICT and e-governance in improving services delivery.
Literature review from countries where e-governance is doing well, especially in Korea,
contributed to the development of this e-governance framework.
7.2 Related literature on ICT framework and its integration in e-governance
framework
Paulo (2016) established that the proliferation and enhanced integration of the Internet in
daily life and increased opportunities involving ICTs have pushed governments to develop a
policy framework to control access to information, services and digital devices and this
phenomenon has changed the space and time boundaries of the communication process.
Paulo (2016) further observed that the use of technology enables transparency policy
initiatives and citizen initiatives to interact with government departments. In developing an e-
governance framework, this study therefore used Paulo’s (2016) suggestion that political
buy-in is required in coming up with corporate governance ICT policy in the form of digital
ICT framework which can consider ICT as a full ecosystem with various layers attached to it.
Zheng (2013) likewise described the use of ICT supporting public services, government
administration and relationships among citizens, the private sector and the State. In addition,
Zheng (2013) explained that e-governance offers five interconnected objectives: high quality
and cost-effective government operations, enhancement of public services, increase of
citizen engagement, updated information policy framework and administrative and
institutional reform. These e-governance objectives were taken into consideration during the
designing of a framework for e-governance for South African municipalities to improve
service delivery to its citizens. Public-Private partnership and public participation was
included in e-governance framework.
197
When examining credibility of web-based information, Flanagin and Metzeger (2007)
identified three credibility aspects to look at: message, site and sponsor. Message credibility
depends on aspects of the message itself, such as information quality and accuracy. Site
credibility refers to the site features, such as visual aid or amount of information uploaded on
the website. Sponsor credibility depends on perceptions of the website sponsor (Flanagin &
Metzeger, 2007). This study took cognisance of Flanagin and Metzeger’s (2007) input in
coming up with a framework for e-governance for municipalities in South Africa of which they
highlighted that credibility of website is of paramount importance as one of the principles of
good website designed.
7.3 Contribution of participants to e-governance framework for local authorities
in South Africa
Participants in this study suggested various strategies, which can be incorporated into e-
governance framework for municipalities in South Africa to improve service delivery to its
citizens. The following are some of the aspects which were suggested:
24/7 website.
Increased security.
Education and support.
Call centres and walk-in centres.
Managing relationships.
Improved communication infrastructure.
Political buy-in.
Modern technology and right software.
Shared software and applications.
Public participation.
Figure 7-1 shows e-governance framework for local authorities to improve service delivery in
South African context.
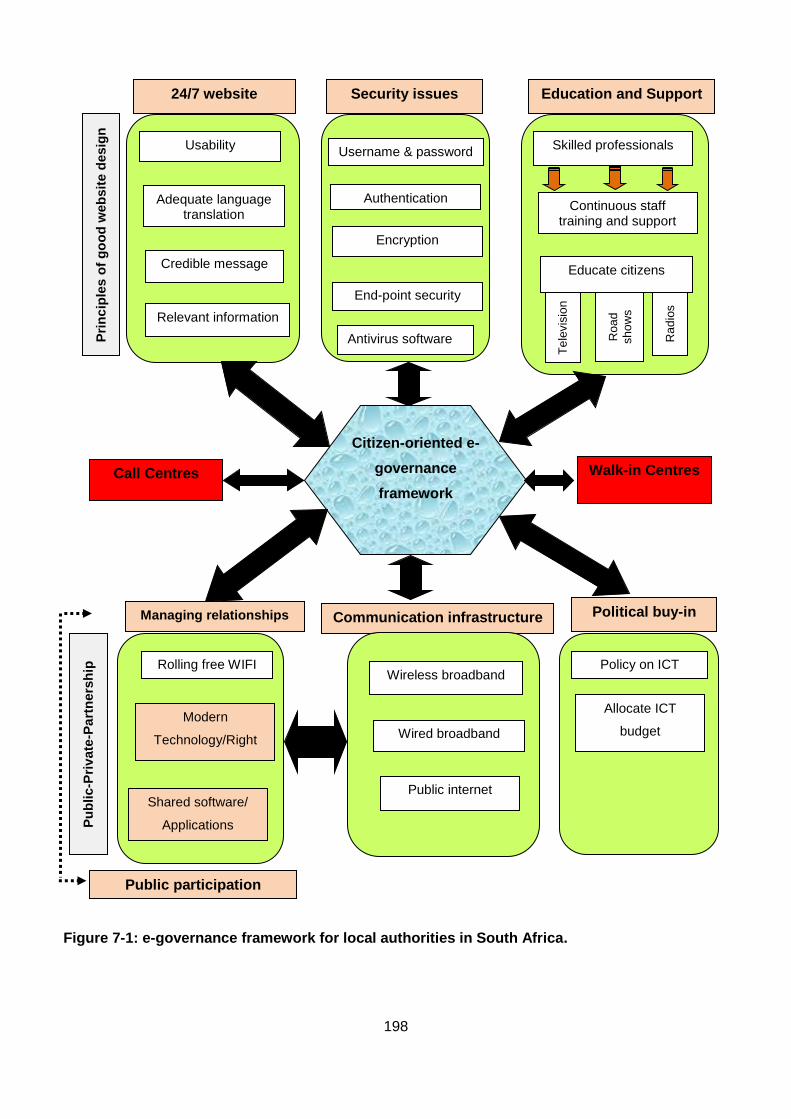
198
24/7 website Security issues Education and Support
Managing relationships
Pu
blic-P
riv
ate
-Pa
rtn
ers
hip
Communication infrastructure Political buy-in
Usability
Adequate language translation
Credible message
Relevant information
Pri
nc
iple
s o
f g
oo
d w
eb
sit
e d
esig
n
Username & password
Authentication
Encryption
End-point security
Antivirus software
Skilled professionals
Continuous staff training and support
Educate citizens
Te
levis
ion
Ro
ad
sh
ow
s
Ra
dio
s
Rolling free WIFI
Modern
Technology/Right
software
Shared software/
Applications
Wireless broadband
Wired broadband
Public internet
Policy on ICT
Allocate ICT
budget
Citizen-oriented e-
governance
framework
Call Centres Walk-in Centres
Public participation
Figure 7-1: e-governance framework for local authorities in South Africa.
199
7.3.1 24/7 website
The uptake and usage of ICT tools as part of e-governance can be increased by making
municipal website available 24/7. Citizens would like to interact and transact with
municipality at any time. The developed e-governance framework has incorporated these
aspects. Framework is also suggesting that when municipalities are designing their website
they should take into consideration good website design principles so that citizens could be
encouraged to keep on visiting municipality website for whatever reason.
7.3.2 Increased security
Confidence and trust of citizen to use a particular website is increased if there is security
around their personal information and their financial accounts. The designed framework has
therefore take into considerations all the security issues such as using unique usernames
and passwords, authentication, encryption and end point security. These measures assist to
safeguard citizens from identity theft, cyber-crimes and fraud, which subsequently increase
the uptake and usage of ICT tools as part of e-governance in accessing municipality
services through various platforms of e-services.
7.3.3 Education and support
The framework of this study found it important to have professional municipal staff members
who are abreast with the current technological changes. This could be done through staff
training, development and support. Computer illiteracy is high in South Africa and therefore
municipalities are in a position to educate citizens through various campaigns such as
television, radio, road shows and demonstrations on how to use a particular technology or
application.
7.3.4 Call-centres and Walk-in Centres
As-Saber, Hossain and Srivastava (2007) are of the opinion that call centre activities within
the e-governance framework are likely to ensure better service delivery, improved access to
information, enhanced two-way communication and encourage e-democracy through
citizen’s participation in the decision-making process. As-Saber, et al. (2007) further argued
that call centres can reduce face-to-face interaction between citizens and business with
public servants; it can also reduce administrative corruption and limit the discretionary
powers of public officials. This study therefore regards incorporating call centres and walk-in
centres in e-governance framework as fundamental to municipalities in providing services to
citizens.
200
7.3.5 Managing relationships
Municipalities in South Africa on their own are not able to provide e-governance services to
its citizens. Offering fast broadband, free WIFI, modern technology and software and shared
application require synergism through Public-Private-Partnership. This study therefore
suggested involvement of Public-Private-Partnership for successful implementation of ICT as
part of e-governance, which requires to be managed well for a win-win situation for all the
parties involved.
7.3.6 Improved communication infrastructure
Improved communication infrastructure in terms of broadband, fibre optical, 3G technology,
WIFI, servers and switches, routers, mobile radio, microwave and cameras fast internet
connectivity, security and surveillance are aspects which influence success rolling out of e-
governance for municipalities. Framework for this study includes a communication
infrastructure which allows secure, fast and cost effective internet connectivity for citizens to
enjoy the benefits of e-governance.
7.3.7 Political buy-in
Political commitment is a major precondition for successful implementation of any e-
government initiatives (As-Saber, et al., 2007). However, Karim and Khalid (2003) argued
that some governments in developing countries do not have the commitment to implement e-
governance and these governments are also poorly equipped to develop and propose
successful policies. According to UNDESA (2003), the ability of the government for
successful e-governance depends on the availability of funding. Framework for this study
advocates for municipal policy makers to develop policies that promote the uptake and
usage of ICT by allocating enough budget and resources to meet ICT initiative.
7.3.8 Modern Technology and right software
Technology changes with time and therefore requires municipality to install modern
technology in terms of servers, computers, laptops and other hardware devices, as well as
updated software. If technology is obsolete it, then performance of business processes and
internet connectivity are affected. This study therefore came up with an e-governance
framework which calls for municipalities to buy modern technology and software in order to
enjoy the benefits of using e-governance.
201
7.3.9 Shared software and applications
Smaller local district municipalities are not able to afford to buy certain software because of
their lower revenue base and therefore they need to rely on software from the bigger metro
municipalities or central government. These challenges call for municipalities to share
applications and sign user agreements to that effect. This study includes shared application
in its framework to accommodate for smaller local district municipalities to benefit from
software they could not afford on their own.
7.3.10 Public participation
Involvement of public on issues of e-governance is very important. If public are involved from
the beginning they will buy-in to e-governance implementation as they feel to have
ownership to the initiative. The study therefore includes public participation in its framework
for successful implementation of e-governance by municipalities.
7.4 Chapter conclusion
This chapter discussed the e-governance framework which can be used by municipalities in
South Africa to improve service delivery. Aspects which were included in the framework are
24/7 website, increased security, education and support, call centres and walk-in centres,
managing relationships, improved communication infrastructure, political buy-in, modern
technology and right software, shared software and applications and public participation. The
next chapter will discuss conclusions and recommendations for this study.
202
CHAPTER 8: CONCLUSIONS AND RECOMMENDATIONS
8.1 Introduction
The purpose of this chapter is to summarise the findings of the study, especially on the
uptake and usage of ICT tools by citizens with theoretical, methodological and practical
implications. Also are the major conclusions, limitations of the study and recommendations
for future research.
This section presents key conclusions on findings of 3 objectives of the study with regards to
the uptake and usage of ICT tools for service delivery by citizens at local government level in
South Africa, the services offered to citizens by local authorities in South Africa and existing
e-governance and e-government theories and practice in order to draw lessons from where it
is successful in order to develop e-governance framework for service delivery for local
authorities in South African context.
8.2 Conclusion of major findings - quantitative
8.2.1 Demographic profile
Based on demographic profile in addressing objective 1 in Table 8-1, majority of
respondents who are between the age of 31–40 (38.2%) with a diploma (33.2%) as their
highest qualification and are from Randfontein Local Municipality (40%) are currently private
sector employees (34.5%) and are earning between R5 000 to R10 000 per month (23.5%).
Based on these findings and results on demographic profile, it is concluded that
demographic profile plays a role in the uptake and usage of ICT tools in accessing
government services and that citizens who are educated and earn income are eager and
willing to use ICT to access municipal services.
8.2.2 Municipality website system quality
Respondents who participated in the study have same views (all agree) on system quality for
their municipality website that they are easy to use, easy to learn, easy to do what I want it to
do, does not require a lot of efforts and is not often frustrating. It can therefore be concluded
Objective 1: Examine and explain the uptake and usage of ICT tools for service delivery by
citizens at local government level in South Africa.
Table 8-1: Objective 1.
203
that municipality websites are well designed for metro municipalities and encourages high
uptake and usage of ICT by citizens in accessing municipality services. Whereas for local
district municipalities their website are not well developed and can only provide citizens with
information which is static in nature.
8.2.3 Motive to seek municipality information
Respondents who participated in the study have the same view of agreeing on their motive
to seek municipality information as far as the need to research information, update
knowledge on municipality issues, need for municipality service, political issues, state of the
municipality address and personal interests are concerned. The findings imply that citizens
agree on what motivates them to seek municipality information. Based on these findings and
results, it is concluded that citizens are motivated to seek information from municipalities
because of various reasons. Municipalities should therefore have such information on their
website which is required by citizens for them to keep on visiting municipal website.
8.2.4 Problems encountered when accessing municipality information
Respondents who participated in the study have the same perception on problems
encountered when accessing municipality information with regard to poor infrastructure,
which makes access difficult and that the information is too difficult to find and do not have
search skills and information is complicated to understand. Further challenges are
encountered on that the internet usage is expensive, information is located too far, language
problem and policy and regulations do not support access to information. Findings imply that
citizens encounter serious problems in accessing municipality information. Based on these
results it can be concluded that citizens are discouraged to use and accept ICT as part of e-
governance as they get frustrated by the challenges they encounter in accessing municipal
information from the website.
8.2.5 Relationship between access to internet and identified variables for
municipalities
There was no significant difference between access to internet or not with regard to the
following variables identified in this study.
Type of services interested,
Type of municipal information accessed online,
Motivation to seek municipality information,
Problems on accessing municipality,
204
Standard of Services, Choice and Consultation,
Access to online services, Efficiency of Services,
Convenience and interaction, Accountability, Transparency and Effectiveness.
All had a value smaller than 1.96 and significance levels > 0.05 for City of Ekurhuleni and
Westonaria local.
The results shows that, all the tested variables had a value lower than 1.96 at the 0.05 level
of significance for City of Ekurhuleni and Westonaria local municipalities. The study,
therefore rejects the null hypothesis (H0b) that ‘there is no relationship between access to
internet and type of service interested, type of municipal information access online,
motivation to seek municipal information, problems on assessing municipality information,
standard of service, choice, consultation, access to online services, efficiency of service,
convenience/level of interaction, corruption, accountability, transparency/effectiveness in
municipality e-governance’. Findings of this study concluded that there is a relationship
between access to internet and tested variables for City of Johannesburg, City of Tshwane,
Lesedi, Randfontein and Westonaria local district municipalities.
8.2.6 Influence of age on the use of ICT as part of e-governance
Age had no influence on motive to seek municipality information, standard of services,
access to online services, efficiency of services, convenience and level of interaction,
corruption and transparency and effectiveness, whereas age had a statistically significant
influence on choice, consultation and value for money. Findings concluded that age does not
determine how citizens make use of ICT in accessing municipal services except for making
choice, consultation and for value for money. The post-hoc test for the choice, consultation
and value for money did not show any statistically significant differences in the means of the
age groups. Based on the post-hoc test, this study concluded that choice, consultation and
value for money did not show important difference as far as age group is concerned. The
post-hoc test for choice, consultation and value for money showed significant differences
between the age groups 20–30 years and 31–40 years, between 41–50 years, 51–60 and
61+ years. Post-hoc test findings imply that choice, consultation and value for money
indicate significant differences between various age groups. Based on these findings, this
study concluded that the age groups ranging from those who have started working up to the
age group nearing their retirement age can make use of the internet and ICT tools to access
municipal services.
205
8.2.7 Influence of level of education on the uptake and usage of ICT
Level of education had influence on change of ownership, payment of fines, payment of
water and electricity, refuse and waste, parks and cemeteries and emergency services,
online forms, licences and marriages, medical information, sponsorship information and
contracts, standard of services, access to online services and efficiency of services,
convenience and level of interaction. Based on the findings, it is concluded that level of
education had influence on how citizens use ICT to access municipal services. Those who
are illiterate have low uptake and usage of ICT in accessing online municipal services, but
visit municipal offices for such services.
8.2.8 Influence of occupation in understanding benefits of e-governance
Occupation had no influence on Type of municipal information accessed online 1, Type of
municipal information accessed online 2, Motivation to seek municipality information,
Problems on accessing municipality information, Convenience and interaction, Middleman
interference is removed on tender process, Adjudication of tender is done electronically - no
interference of human beings, Cash transactions are eliminated, Accountability,
Transparency and Effectiveness. Conclusions can be drawn from the results that occupation
does not affect peoples’ understanding on the benefits of e-governance in improving service
delivery. However, occupation had a statistically significant influence on Type of services
interested 1, Type of services interested 2, Problems on accessing municipality information
2, Standard of Services, Choice and Consultation, Access to Online, and Efficiency of
Services. Based on the results, it is concluded that not all aspects relating to e-governance
could be influenced by occupation. Those people who work in offices are likely to use ICT
tools to access municipality services as they have access to internet in their work place.
8.2.9 Influence of income on the uptake and usage of ICT
Income had no influence on Type of municipal information accessed online 1, Motivation to
seek municipality information, Problems on accessing municipality information 1, Problems
on accessing municipality information 2, Convenience and interaction, Accountability. On the
other hand income had a statistically significant influence on Type of services interested 1,
Type of services interested 2, Type of municipal information accessed online 2, Standard of
Services, Choice and Consultation, Access to online services and Efficiency of Services and
Transparency and Effectiveness. Findings of the study concluded that income can affect the
uptake and usage of ICT. Citizens with income are likely to use internet and access services
from municipalities.

206
8.2.10 Influence of access to internet in accessing municipality services
Access to internet had no influence on Motivation to seek municipality information, Standard
of Services, Access to online services and Efficiency of Services. The results conclude that
access to internet has nothing to do with motivation to seek municipal information, standard
of service as well as access to online services and efficiency.
On the other hand access to internet had a statistically significant influence on Type of
services interested 1, Type of services interested 2, Type of municipal information accessed
online 1, Type of municipal information accessed online 2, Problems on accessing
municipality information 1, Problems on accessing municipality information 2, Choice and
Consultation, Convenience and interaction, Corruption, Accountability and Transparency and
Effectiveness. The findings imply that citizens are motivated to access internet to know the
services offered by municipalities and to enjoy the benefits which come with online services.
8.2.11 Influence of frequency of using internet in accessing municipality online
services
Frequency of using internet had no influence on type of services interested 2 and Problems
on accessing municipality information 1. The findings imply that some citizens do not use
internet to access municipality services, instead they visit municipality offices should they
require a particular service. On the other hand frequency of using internet had a statistically
significant influence on Type of services interested 1, Type of municipal information
accessed online 1, Type of municipal information accessed online 2, Motivation to seek
municipality information, Problems on accessing municipality information 2, Standard of
Services, Choice and Consultation, Access to online services and Efficiency of Services,
Convenience and Interaction, Corruption, Accountability and Transparency and
Effectiveness. Based on the results, it can be concluded that citizens use internet to access
municipality services at different times depending on what kind of online services being
accessed from municipality.
8.2.12 Influence of motivation of using a particular network when accessing internet
Motivation for using a particular network had no influence on Type of services interested 1,
Type of services interested 2, type of municipal information accessed online 1, Motivation to
seek municipality information, Problems on accessing municipality information 1, Problems
on accessing municipality information 2, Convenience and Interaction, Middleman
interference is removed on tender process, Adjudication of tender is done electronically - no
interference of human beings, Cash transactions are eliminated, Accountability,
207
Transparency and Effectiveness. The results indicate that citizens use different network
available in the country such as MTN, Vodacom, Cell C, Telkom to access municipality
online services despite their costs and availability of network. On the other hand motivation
for using a particular network had a statistically significant influence on Type of municipal
information accessed online 2, Standard of Services, Choice and, Access to online services
and Efficiency of Services. Based on the findings, it is concluded that citizens prefer a
particular network to access online service from municipality due to its efficiency in terms of
availability of network as well as cost. These findings address research objective 1.
8.2.13 ANOVA – Influence of access to municipality services on type of services,
impact of e-governance and e-governance outcome
Access to municipality services had no influence on Type of services interested 1, Motivation
to seek municipality information, Problems on accessing municipality information 1,
Problems on accessing municipality information 2, Standard of Services, Choice and
Consultation, Access to online services and Efficiency of Services. The results imply that
access to municipal services is not determined by the type of services which are being
offered by municipality, problems in accessing municipal information or efficiency of services
as these citizens might not have anything to do with municipality.
On the other hand access to municipality service had a statistically significant influence on
Type of services interested 2, Type of municipal information accessed online 1, Type of
municipal information accessed online 2, Convenience and interaction, Corruption,
Accountability and Transparency and Effectiveness. The findings conclude that citizens who
access municipality services are concerned about type of services offered by municipality
and the information which is found on municipality website as well as issues around
accountability, transparency and efficiency.
8.3 Conclusion of major findings – qualitative
8.3.1 Presence of website
The findings from all the five interviewees indicated that their municipalities have website.
Metros such as City of Johannesburg have separate website dedicated for citizens which are
dynamic in nature. Local district municipalities have static websites which disseminate
information to general public. Findings of this study established that website for
municipalities are used for communication. Results of this study also revealed that online
financial information which is transactional in nature is available in metro municipalities as
compared to Local district municipalities where statements and billing are offered online.
208
Results of this study revealed that the number of users who register to use municipality
website is far less than the numbers of Seoul in Korea.
Results of the study imply that municipalities in South Africa have functional websites
which provide information to its citizens. The results suggested that citizens are interested
in general information, financial information and bill payments when they access
municipality website in metro municipalities. In local district municipalities citizens visit
municipal offices to get statements and general information as their websites are not yet
developed to do online transactions such as bill payments.
Based on these findings and results, it is concluded that Local district municipalities are
still at early stages of e-governance growth (Siau & Long, 2005). Local district
municipalities have presence of website which is static in nature that only provides
information to its citizens. On the other hand metro municipalities are at advanced stage
of e-governance in transforming its services to citizens which is transactional and are
moving towards transformation to e-democracy.
8.3.2 Uptake and usage of ICT
The study found that citizens should be made aware of the advantages associated with ICT
as a way of encouraging them to uptake and use ICT tools. Resistance of citizens not to
make payment through online systems is because they don’t trust the system as it is open to
identity theft, fraud and cyber-crime. Results of this study revealed that municipalities need
to put in place structures that educate community ICT skills so that they can understand how
to use ICT when accessing municipal services. This study established that South Africans
are adopters of technology, although some are at different stages of adoption. Those who
first adopt technology are the early adopters and those who took time to accept and use
technology are the laggards. Municipalities are taking initiatives to roll out free WIFI. Free
WIFI is available in public hot spots whereby citizens are required to register to access
public WIFI. This study found that municipalities need to partner with banks and government
departments in order to gain trust from citizens. Municipalities are putting efforts to promote
social media as a tool for effective communication, which ultimately promote the uptake and
usage of ICT.
Findings of this study therefore concluded that in order for citizens to accept and use ICT
tools to access municipal services, citizens should have trust with the municipal system and
should put public hot spots with free WIFI where citizens can have access to internet and
through different social media platforms.
209
8.3.3 Hindrance to use of online services
Results of this study found that there is a challenge of unavailability of free WIFI and cost of
data is high, therefore few people can afford it. Results indicate that rolling out of ICT as part
of e-governance in municipalities could be successful if both public servants and its citizens
are computer literate. The study revealed that not all citizens do not have smart phone for
accessing internet, therefore citizens are limited in accessing municipal services through
such devices. Results of the study revealed that website for local district municipalities are
not user friendly and some have outdated information and dead links.
Results of the study show that internet access is a challenge and requires investment. This
study revealed that ageing of equipment and application affects the implementation of ICT
initiatives as part of e-governance. This study found out that municipalities are not working
alone in providing online service. They are doing this with the help of different service
providers in rolling out free WIFI and to provide platforms for online payment to citizens. The
findings suggested that municipalities have to work hard in order to remove the barriers that
hinder the use of online services by the citizens.
This study therefore concluded that there are several factors that hinders the use of online
services such as unavailability of free WIFI, public servants and citizens computer illiteracy,
lack of smart phone which can connect to internet, unfriendly website, absolute equipment
and application.
8.3.4 Solutions to hindrance on online services
This study established that availability of free WIFI through public hot spots promoted the
uptake and usage of online services offered by municipalities. Results of this study found
that education and training plays an important role in promoting the uptake and usage of ICT
as part of e-governance. Findings of this study indicated that smart phones are still
expensive for the citizens. Smart phones can be imported from other countries, which is
affordable to the majority of citizens. Study established that free WIFI and usability and easy
access to internet is of paramount important for the successful implementation of e-
governance. This study found out that municipalities can enjoy the benefit of using ICT in
improving service delivery through modernisation of ICT by keeping abreast with changes in
technology.
Findings indicated that municipalities are making efforts to renovate their website and
applications so that it becomes usable with relevant information. The findings of the study
suggest that municipalities on their own cannot be able to provide the necessary broadband
210
due to high costs. Municipalities therefore requires to share cost through Public-Private-
Partnership and given that municipalities lacks some skills which might be required to roll out
fibre for internet connectivity. The results of this study indicated that municipalities in South
Africa are putting effort on security measures, although it is not at high level as is seen with
e-Seoul security measures. The results indicated that ICT initiatives are facing challenges
due to budget constraints and there is need to invest in ICT for its success.
Based on the findings and results on the solutions that hinders online services, it can be
concluded that municipalities should make available free WIFI through public hot spots,
educate and train civil servants and citizens, importing smart phones from other countries
such as China, modernisation of ICT equipment and software, Public-Private-Partnership to
roll out broadband for internet connectivity, provide tight security measures and to invest in
ICT.
8.4 Conclusion of major findings - quantitative
8.4.1 Types of services offered by municipalities
Based on objective 2 in Table 8-2, respondents who participated in the study have the same
understanding on the Types of services 1 offered by their municipalities as far as drivers,
business licences, bill statements, payments of rates, taxes, fines water, electricity is
concerned. Respondents who participated in the study have the almost the same view on
Types of services 2 offered by their municipalities as far as information on policies and land,
refuse, waste management, parks and cemeteries and emergency management services is
concerned.
It is therefore concluded that all the services identified by respondents were desirable which
makes citizens to visit municipality website or municipality offices. It therefore implies that
citizens keep on using ICT tools as part of e-governance to access municipality services.
8.4.2 Standard of Services
Respondents who participated in the study have the same knowledge on standard of service
as far as providing reliable online services, providing services at the time it promises, gives
Objective 2: Assess and explain the services offered to citizens by Local Authorities in
South Africa.
Table 8-2: Objective 2.
211
prompt online services to citizens, website designed with citizen’s best interest at heart,
website designed to satisfy the needs of citizens, type of online services meet the needs of
citizens and is accurate and up-to-date is concerned. Conclusions can be drawn from these
results that municipalities offer effective standard of service to citizens where e-governance
is at an advanced growth stage such as metro municipalities.
8.4.3 Access to online services
Respondents who participated in the study have the same view on promotion of access and
use of online services by municipality, online services are better than manual services and
the feedback on enquiry made through online. This study concluded that municipalities
effectively promote access to the use of online services and offer better online services than
manual services to the citizen. Online feedback is also provided to their citizens through
various platforms. This is witnessed in metro municipalities where online services are
provided.
8.4.4 Efficiency of services
Respondents who participated in the study have the same perception on efficiency of
services on offering online services to improve the speed on delivering services, Efficiency of
services encourages citizens to pay their bills and queuing for services is the thing of the
past. Results imply that citizens were very satisfied with efficiency of services as provided by
municipality. Findings further concluded that online services save citizens’ time in doing
business with municipality.
8.5 Conclusion of major findings – qualitative
8.5.1 Interventions in speeding online services through e-solution
This study established that municipalities are developing various applications that assist
indigent citizen in accessing online services. Various online payments channels are made
available especially in metro municipalities where e-governance growth is at advanced
stage. Findings of this study established that local district municipalities do not have
applications that support transactional activities such as online payment channels. However,
there are applications available which allow citizens to view and print statements. Findings of
this study revealed that metro municipalities are in a drive to promote e-health solution so
that citizens are able to book appointment to see doctors online or to check for the
availability of medicines
212
Based on these findings and results on intervention in speeding online services through e-
solutions, it is concluded that municipalities are having applications for indigent citizens.
Metro municipalities have online payments channels. Local district municipalities do not have
applications that support online transactions. Metro municipalities are in a drive to promote
e-health solutions to support Department of Health’s vision and mission.
8.5.2 Services offered by municipalities
This study found that municipalities offer three different kinds of services, namely financial
services, infrastructure services and social and community services. This study also
established that some important services which are offered by municipalities are call centre
service and walk-in-centre in an effort to improve service delivery to citizens. The findings
show that not every citizen can afford to buy data bundles in order to access online services
offered by municipalities. Instead, some citizens rely on call centres and public walk-in-
centres to access internet in order to transact with municipalities. Based on the findings and
results on services offered by municipalities, it is concluded that a variety of services are
offered by municipalities and some are offered through call-centres and walk-in-centres.
8.5.2.1 Online services offered by municipalities
The study revealed that establishment of the municipals’ e-procurement service, bidding for
government contracts and payment for services or supplies takes place online and enhances
transparency and effectiveness of tax administration for both individuals and businesses.
The results found that metro municipalities in South Africa are moving towards becoming
smart cities with various applications in place to spearhead such initiatives. In local district
municipalities the initiative is still behind due to limited financial resources and lack of skills
to implement that. Results of this study indicated that e-heath solutions in municipalities are
there to improve health delivery system in South Africa in collaboration with the Department
of Health.
Results of this study indicated that ICT plays an important role in managing properties as far
as plan submission, checking progress and valuation of properties is concerned. Findings of
the study showed that municipalities which are at high maturity level of e-governance are
able to offer Customer Relation Management Services such as metro municipalities which
allow its citizens to access services online as part of citizen service transformation. Based on
these results on online services offered by municipalities, it is concluded that metro
municipalities are doing well in offering online services in comparison to the local district
municipalities. This disparity is caused by lack of investment in ICT in local district
213
municipalities.
8.6 Conclusion of major findings – Quantitative
8.6.1 Convenience and level of interaction
Based on objective 3 in Table 8-3, respondents who participated in the study have the same
perception on convenience and level of interaction on e-governance promote services to be
offered 24/7, distance and time is not an issue with e-governance, e-governance promote
interaction between citizens and municipality and e-governance promotes interaction
between municipality and its stakeholders. Findings implied that citizens are very satisfied by
offering convenience services with high level of interaction. This study concluded that
municipalities allow stakeholder participation through various interactive platforms especially
with metropolitan municipalities which was built from the concept of Chadwick and May
(2003) Participatory Governance model as discussed in Chapter 3.
8.6.2 Corruption
Respondents who participated in the study have the same view on corruption on middleman
interference is removed, Adjudication of tender is done electronically - no interference of
human beings and cash transactions is eliminated. The results concluded that corruption can
be addressed by promoting e-governance in municipalities as advocated by Chadwick and
May (2003) in their Disciplinary Model which recognizes that e-government is not just about
efficiency, service delivery, and participation, but also about embedding rules to discipline
citizens and providers, and to enforce welfare-increasing policies which was also echoed by
Nath (2005) in his Critical Flow Model in which the application of the model involves making
available information on corruption (by an appropriate legal authority) of a particular
government ministry or government officials.
Objective 3: Examine existing e-governance and e-government theories and practice in order
to draw lessons from where it is successful in order to develop e-governance framework for
service delivery for local authorities in South Africa.
Table 8-3: Objective 4.
214
8.6.3 Accountability
Respondents who participated in the study have the same view on accountability on
implementation of e-governance by municipalities which can make them answerable of their
action and decision towards citizens, implementation of e-governance by municipalities
makes them answerable in their actions and decisions to the stakeholders and I am able to
communicate with government officials through the government website/email/internet.
Conclusion of the results of this study indicated that for the successful implementation of e-
governance in local authorities, municipalities need to incorporate the aspect of
accountability in their framework that will check decisions made by municipalities in
delivering services to citizens.
8.6.4 Influence of website security on the use of ICT in accessing municipality
services
Security of the municipality website had no influence on Type of municipal information
accessed online 1, Problems on accessing municipality information and Corruption. Findings
imply that citizens are not worried about security on municipality website. This could indicate
that these citizens are not actively involved in transacting online with municipality. On the
other hand, security of municipality website had a statistically significant influence on Type of
services interested 1, Type of services interested 2, Type of municipal information accessed
online 2, Motivation to seek municipality information, Problems on accessing municipality
information 2, Standard of Services, Choice and Consultation, Access to online services and
Efficiency of Services, Convenience and Interaction, Accountability and Transparency and
Effectiveness. The results of this study concluded that security is an issue to those citizens
who access online services from the municipality.
8.7 Conclusion of major findings – qualitative
8.7.1 Citizens Focus Service Plan
The results revealed that municipalities have Citizen Focus Service Plan in their strategic
documents in the form of Citizen Focus service delivery with the objective of increasing the
relationship between government and citizens. Based on the findings and results on Citizen
Focus Service Plan, it is concluded that municipalities are committed in putting citizens first
in delivery services by taking contribution of the Interactive-Service Model as a consolidation
of the earlier digital governance models which opens up avenues for direct participation of
individuals in the governance processes.
215
8.7.2 Security measures
The results indicated that citizens’ personal information is vulnerable to security threats,
such as identity theft and fraud if proper security measures are not in place. Findings of this
study indicated that citizens have gained confidence with municipality systems if their
security concerns are guaranteed which can come in the form of unique usernames and
passwords. This study established that citizen information is vulnerable to some security
threats and therefore municipalities are putting various measures in place such as secure
socket layer.
Findings of this study concluded that security measures are being put in place in metro
municipalities as they are transacting online as compared to the local district municipalities
where they are not yet transacting online on a full scale basic. The results also imply that
laws should be able to protect citizens through the use of trusted software which is
guaranteed by the industry security standard.
8.7.3 Advantages and disadvantages of ICT as part of e-governance
8.7.3.1 Advantages of ICT
The study established that municipalities seek to improve efficiency and effectiveness in the
manner in which services are delivered to citizens by using ICT tools as part of e-
governance. Results of the study indicated that citizens would want to have access of
municipality services 24/7 - at any given time and it will save them of time and cost. The
results revealed that citizens are concerned with convenience when accessing municipality
services from municipality. Convenience is one of the aspects which encouraged citizens to
pay their bills to municipality as they will be seeing value in the services they are getting.
The results showed that municipal objective is to reduce cost through the use of ICT in their
operations in delivering service to citizens. The findings indicated that the essence for
municipalities to embark on e-governance is to improve service delivery to its citizens
through various ICT tools. The results revealed that if statements sent to clients are free
from errors, citizens are encouraged to pay their bills and municipalities are able to provide
services to citizens.
The results indicated that for municipalities to deliver efficient and effective services to its
citizen, internal processes in terms operating systems and applications software should be
up to date. Results established that municipalities are vulnerable of losing their data through
theft, fire and viruses. Cloud computing could make it possible to recover lost data which is
216
saved on internal hard drive and other external medium storage such as compact disk,
memory stick, external hard drives etc.
Based on these findings and results on the advantages of ICT, it is concluded that
municipalities could capitalise on the advantages of ICT as part of governance to encourage
citizens to use ICT tool to access municipality services. On the other hand, municipalities
themselves should take advantages of ICT to improve their business processes thereby
improve service delivery to the citizens.
8.7.3.2 Disadvantages of ICT
The results indicated that although citizens are willing to take and use ICT, they have a
challenge in that they lack computer skills to access online municipal services. The findings
revealed that municipalities need to invest in ICT infrastructure for the successful rolling out
of ICT projects. Results of the study indicated that metro municipality and local district
municipalities need to prioritise ICT for the promotion of uptake and usage of ICT by citizens.
Results of this study hold that if staff and citizens are informed of the benefits of ICT as part
of e-governance, their uptake and usage will increase. Findings of the study imply that
citizens are not encouraged to take and use ICT initiatives as part of e-governance until and
unless security issues by municipalities are addressed.
The results imply that if civil servants lack computer skills they will resist the change which is
brought by technology. The results of this study imply that municipalities are faced with
challenge of network availability which therefore affect the uptake and usage of ICT as part
of e-governance in accessing municipality services. Findings of this study indicated that load
shedding and cables theft is a challenge in municipalities which affects the uptake and
usage of ICT.
Based on the results of this study on disadvantages of ICT, it is concluded that municipalities
are faced with several challenges which need to be overcome with assistance from central
government and to partner with other players.
8.7.4 Staff buy-in and support
The study established that the use of ICT as part of e-governance is no longer a threat to
staff as they have appreciated the benefits associated with it. However, results of the study
revealed that technological change could not be easily embraced by staff members and
citizens as they fear of losing their jobs and not trusting the new technology. The findings
indicated that introduction of e-governance in municipalities require to have a change in
217
management plan for their e-governance strategy as it affects human resources and
business processes. Based on the findings on staff buy-in and support, it is concluded that
that staff members need to appreciate the benefits of implementing e-governance and
should not see that as a threat to their jobs.
8.7.5 Citizen relationship
The findings indicated that the essence of e-governance is to improve citizen relationship.
This is done by open the channels of communication and giving timeous feedback to
citizens. The results indicated that municipality gained trust from its citizens by providing
them with accurate information of which they can make informed decisions. The findings
revealed that citizens can be informed of the importance of e-governance through
demonstrations and various campaigns which can create awareness of the usability of online
services. The results showed that reliable e-services can only be achieved by increasing the
bandwidth which makes citizens to have access to internet without any disruptions or
interferences. Based on these results, it can be concluded that citizen relationship can be
promoted through various means of which municipalities need to make use of all of them if it
is to maximise its relationship with the citizens.
8.7.6 Strategies to improve online service delivery
Results of this study indicated that 24/7 web service allows citizens to access municipal
services at the comfort of their homes at any given time thereby enhancing citizens’ trust
with their municipality. The findings from this study imply that municipalities are moving
towards improving online service delivery by having strong communication infrastructure.
The results indicated that municipalities are trying to bridge digital divide which has been in
existence for a long time by increasing communication infrastructure in both metros and local
district municipalities so that citizens can have access to internet and be able to access
municipal online services.
The findings showed that without political buy-in in e-governance initiatives, the project of
ICT in municipalities will not succeed. Results of the study reveal that municipalities through
its policies are making provisions to establish public internet access to citizens so that they
can be able to access municipality services. Result of this study asserts that relations
between government and its different stakeholders should be managed if municipal are to
enjoy the benefits of using ICT as part of e-governance.
The results suggested that if corruption is not addressed it can affect the implementation of
ICT and e-governance. The findings reveal that without modern ICT infrastructure and
218
software there won’t be any guarantee that e-governance initiatives will succeed. Results of
this study indicated that in comparison to developed countries such as Korea South African
Municipalities are still behind in security as personal information for citizens is stolen or
abused by perpetrators.
Smaller municipalities cannot afford big systems and applications, therefore need to share
applications with bigger municipalities. The results imply that local district municipalities are
struggling to fully implement e-governance initiatives as compared to metro municipalities.
Metro municipalities have large resource base in the form of rates and taxes which they
charge citizens as compared to local district municipalities whose revenue base is
constrained due to poor revenue collection because of defaulters who are affected by high
levels of poverty and unemployment. Results indicated that in order for ICT and e-
governance to be successful staff members should be skilled first so that they can also pass
such skills to citizens.
Based on the results and findings on strategies to improve online service delivery, it is
concluded that e-governance framework for local authorities in South African context was
developed with ten dimensions which feeds into the citizen focus e-governance framework
as discussed in Chapter 7.The following are the ten dimensions;
24/7 website
Increased security
Education and support
Call centres and walk-in centres
Managing relationships
Improved communication infrastructure
Political buy-in
Modern Technology and right software
Shared software and applications
Public participation
8.7.7 Corporate governance ICT framework
Findings of this study imply that municipalities, whether metro or local district are having an
ICT framework although they are at various implementation stage. This study established
that e-governance should be looked at through the lens of full ecosystem that enables
citizens, business and SMEs to interact with government using the full range of electronic
media. The framework which was developed in this study incorporated such aspects as it
219
address research objective 3.
8.7.7.1 Full ecosystem layers
Findings of this research established that application layer allow citizens to access
municipality services through various applications. Findings of this study reveal that South
African municipalities are at advanced stage, especially with metro municipalities in
providing advanced communication platforms such as cameras and sensors as part of
surveillance to monitor crime in the city. Results of this study indicated that mobile phones,
tablets and cameras play a crucial role in the uptake and usage of ICT as part of e-
governance in the analytical layer. The results indicated that mobile phones, tablets and
radios are integrated together to provide information to citizens with regards to emergence,
health care, education, campuses and buildings.
Based on these findings and results on the strategies to improve e-governance to improve
online service delivery, it is concluded through various applications and integration of other
gadgets such as cameras and sensors, e-governance framework for local authorities to
improve service delivery was developed.
8.8 Recommendations
This section addresses the third research objective by recommending e-governance
framework for local authorities in South Africa. Municipalities that envisaged improving
service delivery to its citizens should utilise effective ICT tools as part of e-governance
practices. Several researches in this study confirmed that implementation of e-governance
by municipalities is more likely to improve business model, processes and service delivery to
its citizens. The findings indicate that in this information age, it is highly recommended for
leaders in local authorities in South Africa to engage in the following e-governance practices:
Municipalities should offer 24/7 web service which allows citizens to access municipal
services at the comfort of their homes at any given time. This enhances citizens’ trust with
their municipality.
In order for local authorities to move towards improving online service delivery through
strong communication infrastructure, municipalities should bridge digital divide which has
been in existence for a long time by increasing communication infrastructure in both
metros and local district municipalities for citizens to access online services through the
internet.
220
Municipalities should have political buy-in in e-governance initiatives if ICT project is to be
successful.
Municipalities through its policies should make provision for the establishment of public
internet access to its citizens through public hot spots to allow citizens access to
municipal online services.
Relations between government and its different stakeholders should be managed if
municipalities are to enjoy the benefits of using ICT as part of e-governance.
Corruption and nepotism in municipalities should be addressed by employing well
qualified personnel to implement ICT and e-governance initiatives.
Modern ICT infrastructure and software should be in place in municipalities in order to
guarantee successful implementation of e-governance initiatives.
South African municipalities are still behind as compared to security in developed
countries such as Korea as personal information for citizens is stolen or abused by
perpetrators. Municipalities should therefore prioritise security concerns by putting in
place tight authentication and encryption measures.
Smaller municipality cannot afford big systems and applications and therefore need to
share applications with bigger municipalities.
Due to citizen requirements to become computer literate in this information age,
Authorities need to make computers and information technology subjects compulsory in
the school curriculum system from an early age of primary school to get the learners to
make first contact with technology from an early age.
For ICT and e-governance to be successful, staff members should be skilled through
continuous training and support.
Municipalities whether metro or local district should have corporate governance ICT
framework/Digital ICT framework in its Integrated Development Plan (IDP).
e-governance should be looked through the lens of full ecosystem that enables citizens,
business and SMEs to interact with municipalities using the full range of electronic media.
8.9 Research contribution
This research addresses the knowledge gap in the low uptake and usage of ICT by citizens
at local government level in South Africa. This study provides a theoretical and practical
insight on factors why local authorities offering poor service delivery to their citizens in South
Africa. This study assesses the relevance and validity of e-governance and e-government
theories and practice in service delivery in South Africa. This study developed e-governance
framework for improving service delivery for local authorities in South Africa.
221
The overall study contributes to the body of ICT knowledge by unpacking ICT aspects and
tools which can be used by local authorities in improving service delivery in South African
context. Through literature review and interviews conducted, it was established that South
African municipalities had a tendency of copying and pasting e-governance frameworks from
developed countries such as South Korea. When such e-governance framework is applied in
South African context they deem to fail because these countries are at different economic
growth stages. This study therefore contribute to the body of ICT knowledge by coming up
with e-governance framework for local authorities in South African by taking into
consideration ICT challenges which the country is facing such as digital divide, computer
illiterate, cost of data, poor ICT infrastructure.
8.9.1 Theoretical contributions
This study developed e-governance framework for improving service delivery in local
authorities in South Africa. The framework was developed by taking into account input from
literature review from Chapter 2 and existing theories of e-governance from Chapter 3 and
from recommendations and suggestions made by participants during data collection in
Chapter 4 on how e-governance can be utilised to improve service delivery in South African
context. Branding of various inputs from literature review, existing theories of e-governance
and participants made it possible to develop a unique e-governance framework for local
authorities in South African context.
Contribution in the form of citizen-oriented e-governance framework was made by
incorporating ten unique aspects which improves service delivery in South African context.
The ten unique aspects which have contributed to the theory of this subject is found in the e-
governance framework as discussed in previous chapter.
8.9.2 Methodological contributions
Previous studies on e-governance have been done using either qualitative method or
quantitative method. For qualitative research method there was no objective verifiable
results and for quantitative research there was no human perception and belief on the
aspects understudy. This study however used mixed method as discussed in chapter 4 in
understanding how e-governance can improve service delivery in local authorities in South
African context by providing a greater breadth of perspectives around the usage of ICT tools
as part of e-governance. This approach has improved the results of this study by
counterbalancing or compensating for the biases, limitations and weaknesses of a one
approach method, by mixing it with a method belonging to the other approach (Fidel, 2008).
222
A mixed methods approach has been used for this study for triangulation purposes, sought
convergence and divergence across qualitative and quantitative approaches (Greene, et al.,
1989). This study triangulated data collection methods by using interviews and self-
administered questionnaires. The study also triangulated models or theories of e-
governance models. Triangulation of data sources which include data from citizenry of
Municipalities and Executives members from Gauteng Province was done.
8.9.3 Practical contributions
Implementation of e-governance framework in local authorities will greatly affect municipal
business models and processes and thereby affect the organisation structure. The
implementation of e-governance through the use of ICT tools will require organisational
change and will ultimately affect human resources of the organisation as municipality has to
down size its staff and other staff members has to be redeployed or reassigned thereby
drastically reduce the overall labour cost for municipalities. The following are the identified
practical advantages brought about by implementing e-governance initiative in municipalities
as discussed in chapter 6.
Efficiency and effectiveness of services.
24/7 services.
Convenience.
Cost reduction.
Improve service delivery.
Reduction of errors.
Speed operations.
Cloud storage.
Councillors of municipalities can have political buy-in by developing policies which promote
the usage and uptake of ICT through the Municipality Integrated Development Plan (IDP).
The developed e-governance framework for municipality is in support of the ICT Digital
Framework which municipalities should have in order to promote e-governance in local
authorities.
8.10 Research limitations
This research was carried out for municipalities in Gauteng Province. The research could
have been extended to other province but due to time and financial constraints it did not
happen. One major metro municipality – City of Tshwane which was supposed to participate
223
in this study did not respond to the researchers’ request to have its executive members
interviewed. However, their non-response and participation did not affect the outcome of this
study as citizens who access municipal services managed to participate in this study through
questionnaires. The researcher managed to gather data from two other major metro
municipalities which are City of Johannesburg and Ekurhuleni with similar status with the
one which did not participate. The results therefore can be generalise and replicate to the
non-participant metro municipality and to other similar metro municipalities with the same
status across South Africa. This study managed to interview executive members who are
the drivers of ICT from the identified municipality.
Although this study aimed to make a significant contribution to the body of knowledge on the
e-governance framework for improving service delivery in local authorities in South Africa,
certain areas still need to be explored or expanded. Based on the outcomes of this research,
the following limitations are stated and opportunities for future research on e-governance are
outlined:
This study interviewed top level management from municipalities who are the drivers of the
e-governance. This was a limitation of this study as it was possible to involve all the levels of
staff within municipality organisational structure. The results of this study could have been
different had it been that it included all the levels of staff members within the structure of
municipalities. Involvement of other staff members could have provided a different picture
and results on the e-governance practices. This study however managed to provide some
insights on how e-governance can improve service delivery to citizens. Future research
should include all the level of staff in municipal hierarchical structure to get full understanding
of their perception on the use of e-governance to deliver services to citizens.
The study selected municipalities from Gauteng Province. This province was selected
because it is considered as the economic hub of South Africa and is often the first choice of
destination by job seekers across the country. While being the smallest province, it is also
most populous, being 12 272 263 people (Local Government, 2016). It is a province with a
unique, African character, world-class infrastructure in the fields of telecommunications,
transportation, water and power, and with globally-competitive health care and educational
facilities. The study of e-governance on other provinces could have given other insights to
the use of ICT tools as part of e-governance to improve service delivery in local authorities. It
might be worth to pursue similar studies in other provinces which are not regarded as
economic hub of South Africa and draw comparative analysis of e-governance efforts in
municipalities in these different provinces. Future studies could be carried out in other
224
provinces to verify to what extent e-governance practices are being used by municipalities to
improve service delivery to its citizens.
The developed e-governance framework for municipalities is a one-size-fit-all. Further
studies should look at separating e-governance framework for metro municipalities and
Local district municipalities as they have different communication infrastructure, financial
base and ICT expertise.
8.11 Areas of further research
This research looked at framework for e-governance to improve service delivery for local
authorities in South Africa by answering research questions on;
(i) Why is there a low uptake and usage of ICT by citizens at a local government
level in South Africa?
(ii) Why are local authorities offering poor service delivery to their citizens in South
Africa?
(iii) How can e-governance and e-government tools be applied in developing a
framework for improving service delivery for local authorities in South Africa?
Further research should be carried out on the following areas;
Patterns on the uptake and usage of ICT by citizens at a local government level
using statistical modelling.
Critical evaluation of services offered by local authorities to their citizens by
benchmarking it with local authorities in other African countries.
Establishing how cloud computing and big data can be integrated in the developed
framework for improving service delivery for local authorities in South Africa.
8.12 Summary of the chapter
The chapter discussed the conclusions from the results of the demographic profile. The
major findings for municipality website system are summarised, namely quality, motive to
seek municipality information, problems encountered when accessing municipality
information, relationship between access to internet and identified variables for each
municipality, influence of access to internet on the factors, influence of frequency of using
internet on the factors, influence of motivation of using a particular network on the factors,
influence of access to municipality services on the factors were presented and discussed.
Conclusions of major findings for qualitative on presence of website, uptake and usage of
ICT, hindrances to use of online services, solutions to hindrance on online services were
presented and discussed. Conclusions of major findings for quantitative results on types of
225
services offered by municipalities, standard of services, access to online services, efficiency
of services and influence of municipality on the factors was discussed.
Conclusion of major findings for qualitative results on interventions in speeding online
services through e-solutions, services offered by municipalities, online services offered by
municipalities were discussed and their conclusions. Conclusions on major findings for
quantitative results on convenience and level of interaction, corruption, accountability,
security of municipality website on the factors and were discussed. The chapter proceeded
by discussing conclusion of major findings on qualitative on Citizens Focus Service Plan,
security measures, advantages of ICT, disadvantages of ICT, staff buy-in and support,
citizen relationship, strategies to improve online service delivery, corporate governance ICT
framework, Full ecosystem layers.
This chapter wrapped up by discussing recommendations and its implications for practice,
limitation and implications for future research, research contribution in the form of theoretical
contributions, methodological contributions, and practical contributions. The chapter ended
by discussing research limitation for the study.
REFERENCE
Abasilimi, U.D.& Edet, L. 2015. E-governance and its implementation challenges in the
Nigerian Public Service. Acta Universitatis Danubius, 7(1), pp. 30-42.
Abdul, R., Hamdan, Y., Yahya, M. & Shanudin, Z. 2002. Information technology. Malaysia:
McGraw-Hill.
Abrahams, L. & Newton-Reid, L. 2008. e-Governance for Social and Local Economic
Development: Gauteng City Region perspective. LINK Public Policy Research , Volume 9,
pp. 1-47.
Abu-Shanab, E. & Al-Jamal, N. 2015. Exploring the Gender Digital Divide in Jordan.
Gender, Technology and Development , 19(1), pp. 91-113.
Acacia. 1997. Use of information and communication technologies in IDRC projects.
[Online] Available at: http://www.idrc.ca/acacia/outputs/op-eval3.htm [Accessed 20 June
2016].
226
Ahn, M. J. 2011. Adoption of e-communication applications in US municipalities: The role of
political environment, bureaucratic structure, and the nature of applications. The American
Review of Public Administration, 41(4), pp. 428-452.
Aikins, S. & Krane, D. 2010. Are Public Officials Obstacles to Citizen-Centered E-
Government? An Examination of Municipal Administrators’ Motivations and Actions. State
and Local Government Review, 42(2), pp. 87-103.
Akula, R., Narasimha, V. & Chandrashekar, M. 2014. Technology implementation in public
sectors units of Andhra Pradesh. International journal of advanced computers, 4(2), pp.
430-490.
Alam, M. 2012. E-Governance in Bangladesh Present Problems and Possible Suggestions
for Future Development. International Journal of Applied Information Systems (IJAIS), 4(8).
AlAwadhi, S. & Scholl, H. 2013. Aspirations and realizations: The smart city of Seattle.
Wailea, Mau, HICSS.
AlAwadhi, S. & Scholl, H. J. 2016. Smart governance as key to multi-jurisdictional smart
city initiatives: The case of the eCityGov Alliance. Social Science Information, 55(2), pp.
255-277.
Al-Hujran, O., Al-dalameh, M. & Aloudat, A. 2011. The role of national culture on citizen
adoption of e-government services: An empirical study. Electronic Journal of E-government
, 9(2), p. 93–106.
Allen, P. M. & Clough, S. 2015. Philosophical commitments, empirical evidence, and
theoretical psychology. Theory & Psychology, Volume 25, pp. 3-24.
Al-Tarawneh, K. 2012. Measuring e-service quality from the customers' perspective: an
empirical study on banking services. International Research Journal of Finance and
Economics, 1(91), pp. 123-137.
Amagoh, F. 2015. Determinants of e-government diffussion in Nigeria: An examination of
theoretical models. Information Development, pp. 1-18.
Ardalan, K. 2018. Ideology: A Multi-paradigmatic Approach. Journal of Interdisciplinary
Economics, 31(1), pp. 1-18.
227
Asgarkhani, M. 2012. The effectiveness of e-services in local government: A case study. In
Bannister, F. Case studies in e-government. Academic Publishing International.
As-Saber, S. N., Hossain, K. & Srivastava, A. 2007. Electronic Government. Technology,
Society and E-Government: In Search of an Eclectic Framework, 4(2), pp. 156-178.
Ayoo, P. O. 2001. An evaluation of the effectiveness of the internet as a source of
information to industrial researchers in Nairobi, Nairobi: Moi University, Kenya.
Babbie, E. & Mouton, J. 2003. The practice of social research. South African Edition ed.
Cape Town: Oxford University Press.
Backus, M. 2001. E-governance in developing countries. IICD research brief. [Online]
Available at: http://www.ftpiicd.org/files/research/briefs/brief1.pdf
[Accessed 04 Decemebr 2017].
Badenhorst, C. 2012. Research Writing: Breaking the barriers, 4th edition. Pretoria: Van
Schaik Publishers .
Bailey, C. A. 2007. A guide to qualitative field research.. Thousands Oaks: Sage.
Bandara, W. et al. 2015. Achieving rigor in literature reviews: Insight from Qualitative Data
Analysis and too support. Association for Information Systems, pp. 1-55.
Bannister, F. & Connolly, R. 2015. The great theory hunt: Does e-government really have a
problem? Government Information Quarterly, Volume 32, pp. 1-11.
Bawa, B. 2012. An Empirical Study on Service Quality and Customer Satisfaction in
SUWIDHA (Single User-friendly Window Disposal Helpline for Applicants)—An e-
Governance Project of the Government of Punjab. Asia-Pacific Journal of Management,
8(2), pp. 165-172.
Bearfield, D. A. & Bowman, A. O. 2016. Can You Find It on the Web? An Assessment of
Municipal E-Government Transparency. American Review of Public Administration, pp. 1-
17.
Berriman, F., 2012. ‘Using HTML5 for Gov.UK’, Blog, Government Digital Service, United
Kingdom. [Online]
Available at: https://gds.blog.gov.uk/2012/02/10/using-html5-for-gov-uk/
[Accessed 18 November 2017].
228
Bertot, J., Jaeger, P.& Grimes, J. 2010. Using ICTs to create a culture of transparency:E-
government and social media as openness and anti-corruption tools for societies.
Government Information Quarterly, Volume 27, pp. 264-271.
Bhatnagar, T., Jha, A. N. & Singh, H. K. 2011. A study of information communication
technology effectiveness in select government organizations at Jharkhand State.
International Journal of Engineering Science and Technology, 3(6), pp. 4648-4655.
Blanche, M. & Durrheim, K. 2002. Research in practice: Applied methods for the social
sciences. Cape Town: University of Cape Town.
Blaxter, L., Hughes, C. & Tight, M. 2003. Analysing data, In How to research. Berkshires:
Open University Press.
Bolgherini, S. 2007. The technology trap and the role of political and cultural variables: A
critical analysis of the e-government policies. Review of Policy Research, 24(3), pp.259-
275.
Booth, A., Papaioannou, D. & Sutton, A. 2012. System approaches to a successful
literature review. London: Sage.
Borins, S. 2007. Conceptual Framework. Toronto: University of Toronto Press.
Bornman, A. 2016. Information society and digital divide in South Africa: results of
longitudinal surveys. Information,Communication & Society, 19(2), pp. 264-278.
Bovaird, T. 2003. E-Government and e-Governance: Organisational Implications, Options
and Dilemmas. Public Policy and Administration , 18(2), pp. 37-56.
Bryman, A. 2011. Introducing research methodology: A beginner's guide to doing a
research project. London: Sage.
Buente, W. 2016. Digital Citizenship or Inequality? Linking Internet Use and Education to
Electoral Engagement in the 2008 U.S. Presidential Election Campaign. Bulletin of Science,
Technology & Society, 35(5-6), pp. 145-157.
Bwalya, K.J 2009. Factors affecting adoption of e-government in Zambia. The Electronic
ournal on Information Systems in Developing Countries, 38(4), pp. 1-13.
Bwalya, K.J. & Healy, M. 2010. Harnessing e-government adoption in the SADC Region: a
conceptual underpinning. Electronic Journal of E-government, 8(1), pp. 23-32.
229
Bwalya, K.J.& Mulula, S. 2015. A conceptual framework for e-government development in
resource-constrained in countries: The case of Zambia. Information Development, pp. 1-16.
Calista, D. & Melitski, J. 2007. E-government and e-governance: Converging constructs of
public sector information and communications technologies. Public Administration Quarterly,
Volume 31, pp. 101-120.
Carrizales, T. 2008. Functions of e-government: A study of municipal practices. State and
Loca Government Review, Volume 40, pp. 12-26.
Carrizales, T. & Melitski, J. 2011. A Study of e-government and e-governance: An empirical
examination of municipal websites. PAQ Spring , pp. 1-24.
Carter, L. & Belanger, F. 2004. Citizen adoption of electronic government initiatives.
Hawaii , International Conference on System Sciences.
Cernakova, V. 2015. ICT and Innovation in the Provision of Public Services: The Case of
Slovakia. Information Technology for Development, 21(3), pp. 365-380.
Chadwick, A. & May, C. 2003. Interaction between states and citizens in the age of internet:
e-government in the United States, Britain, and European Union. Governance. An
International Journal of policy, administration, and institutions, 16(2), pp. 271-300.
Chaterera, F. 2012. Towards harnessing e-government adoption in Zimbabwe. Information
Science, 30(2), pp. 98-102.
Chisango, G. 2013. Technology challenges faced by rural women in the Eastern Cape
Province of South Africa: A Chris Hani Municipality Case Study (2012-2013) - University of
South Africa Master of Arts Thesis, Pretoria: University of South Africa.
Chon, K., Park, H. & Hur, J. 2013. A history of computer networking and the internet in
Korea. IEEE Communications Magazine, 51(2), pp. 10-15.
Choy, L. T. 2014. The Strengths and Weaknesses of Research Methodology: Comparison
and Complimentary between Qualitative and Quantitative Approaches.). IOSR Journal Of
Humanities And Social Science (IOSR-JHSS, 19(4), pp. 99-104.
Cirorra, C. & Navarra, D. 2005. Good governance, development theory and aid policy: Risks
and challenges of e-government in Jordan. Journal of Information Technology for
development, 11(2), pp. 141-59.
230
City Of Johannesburg. 2014. 2012-2016 Integrated Development Plan: 2013/14 Review,
Johannesburg: City of Johannesburg.
Cloete, F. 2003. Assessing governance with electonic policy management tools. Public
Performance and Management Review, Volume 26, pp. 276-290.
Cloete, F. 2011. E-government lessons fom South Africa 2001 to 2011 Institutions, State of
progress and measurement. Public Governance, pp. 128-142.
Colesca, S. & Dobrica, L. 2008. E-government adoption in Romania. World Academy of
Science, Engineering and Technology , pp. 140-144.
Cook, T. & Campbell, D. T. 1979. Quasi-experimentation: Design and analysis issues for
field settings. Chicago, IL: Rand-McNally.
Cox, J. & Dale, B. 2001. Service quality and e-commerce: an exploratory analysis.
Managing service quality, 11(2), pp. 121-131.
Cresswell, J. 1998. Quantitative inquiry and research design: Choosing amoung five
traditions. Thousand Oaks: Sage.
Cresswell, J. 2014. Research Design: Quantitative, Qualitative and Mixed Approaches. 4th
ed. Thousand Oaks: Sage.
Creswell, J., Clark, V., Gutmann, M. & Hanson, W. 2003. Advanced mixed methods
research designs. London: Sage.
Creswell, J. W. & Plano Clark, V. 2007. Designing and conducting mixed methods
research. Thousand Oaks, CA: SAGE.
Creswell, J. W. & Poth, C., 2018. Qualitative Inquiry Research Design: Choosing Amoung
Five Approaches. New Delhi: SAGE.
Curwin, J. & Slater, R. 2004. Quantitative Methods for Business Decisions. London:
Thomson Learning.
D’agostino, M., Schwester, R., Carrizales, T. & Melitski, J. 2011. A study of e-government
and e-governance: An empirical examination of municipal websites. Public Administration
Quarterly, Volume 35, pp. 3-25.
231
Dabholkar, P. 1996. Consumer evaluations of new technology based self service options:
an investigation of alternative modes of service quality. International Journal of Research in
Marketing, 13(1), pp. 29-51.
Dada, D. 2006. The failure of e-government in developing countries: A literature review.
The Electronic Journal of Information Systems in Developing Countries, 26(1), pp. 1-10.
Davis, F. D. 1989. Perceived usefulness, perceived ease of use, and user acceptance of
information technology: information technology usefulness and ease of use. MIS Quarterly ,
pp. 318-340.
Davis, F. D., Bagozzi, R. P. & Warshaw, P. R. 1989. User acceptance of computer
technology: A comparison of two theoretical models. Management Science, 35(8), pp. 982-
1003..
Dawes, S. 2008. The evolution and continuing challenges of e-governance. Public
Administration Review, Volume 68, pp. 86-102.
DeLone, W. & McLean, E. 1992. Information systems success: the quest for the dependent
variable. Information Systems Research, 3(1), pp. 60-95.
Digital Dividends 2001. Digital dividends web page on background to digital divide. [Online]
Available at: http://www.digitaldividend.org
[Accessed 16 June 2016].
Dobrota, M., Jeremic, V. & Markovic, A. 2012. A new perspective on the ICT Development
Index. Information Development, 18(4), pp. 271-280.
Dooley, D. 2001. Social Research Methods. 4th ed. New Jersey: Prentice Hal.
Ebrahim, Z., Irani, Z. & Shawi, S. A. A. 2003. E-government adoption: analysis of adoption
staged models. Paper presented at the 3rd European Conference on E-Government.
Dublin, s.n.
Eickelmann, B. & Vennemann, M. 2017. Teachers‘ attitudes and beliefs regarding ICT in
teaching and learning in European countries. European Educational Research Journal,
16(6), pp. 733-761.
232
Falabi, O. J. 2007. The benefits and challenges of e-government implementation in a third
world country: Lagos State as a case study. International Conference Proceedings, pp. 250-
253.
Fidel, R. 2008. Are we there yet? mixed methods research in library and information
science. Library & Information Science Research, pp. 265-272.
Fiedler, K., Walther, E., Freytag, P. & Stryczek, E. 2002. Playing mating games in foreign
cultures: conceptual framework and an experimental paradigm for inductive trivariate
inference. Journal of Experimental Social Psychology, pp. 14-30.
Field, A. 2012. Discovering statistics using IBM SPSS Statistics. 4th ed. London: Sage.
Field, J., Heim, G. & Sinha, K. 2004. Managing quality in the eservice system:Development
and application of a process model. Production and Operations Management, 13(4), pp.
291-306.
Fink, A. 2010. Conducting research literature review: from the internet to paper. Thousand
Oaks, CA: Sage Publications.
Fink, C. & Kenny, C. 2003. W(h)ither the digital divide? Info The Journal of Policy,
Regulation and Strategy for Telecommunications, 5(6), p. 15.
Finlayson, M., Egan, M. & Black, C. 1999. Secondary analysis of survey data: A research
method with potential for occupational therapists. Occupational Therapy.
Flak, L., Olsen, D. & Wolcott, P. 2005. Local E-government in Norway: Current status and
Emerging Issues. Information systems, pp. 41-84.
Flanagan, P. 2016. The digital divide: an inhibitor to integral human development. Journal
of Catholic Social Thought, 13(2), pp. 345-360.
Flanagin, A. J. & Metzeger, A. M. 2007. The role of site features, user attributes, and
information verification behaviors on the perceived credibility of web-based information.
New Media and Society, 9(2), pp. 319-342.
Flick, U. 2011. Introducing research methodology: A beginner's guide to doing a research
project. London: Sage.
Fountain, J. 2001. Building the virtual state: Information technology and institutional
change.. Washington DC: Brookings.
233
Francisco, V., Butterfoss, F. & Capwell, E. 2001. Key issues in evaluation: Quantitative and
Qualitative methods and research design. Health promotion practice, 2(1), pp. 20-23.
Fransman, M. 2007. Innovation in the New ICT Ecosystem. International journal of digital
economics, pp. 89-110.
Funchs, C. & Horak, E. 2008. Africa and the digital divide. Telematrics and Informatics,
25(2), pp. 99-166.
Ganiyu, R. A., Oluwafemi, A., Abayomi, O.C., Olusegun, O.R. & Salihu, A.N.
2017.Transformative Potentials of E-governance: The intrinsic role of Information and
Communication Technology in Reinvigorating Public Service Delivery in Nigeria. e-
governance Conference. Covenant University Conference on e-governance in Nigeria -
CUCEN, pp. 65-79
Gargallo-Castel, A., Esteban-Salvador, L. & Pérez-Sanz, J. 2010. Impact of gender in
adopting and using ICTs in Spain. Journal of Technology Management & Innovation, 5(3),
pp. 120-128.
Gay, L. & Airasian, P. 2000. Educational Research: competencies for analysing and
application. 6th ed. Upper Saddle Rive: Prentice Hall.
Gerber, H. & Hall, R. 2013. Data Analysis with a statistical package - SPSS. South Africa:
HR Statistics. SPSS.
Gil-Garcia, J. 2012. Enacting electronic government success: An integrative study of
government-widewebsites, organizational capabilities, and institutions. New York: Springer.
Goldstuck, A. 2012. Internet Matters: The Quiet Engine of the South Africa Economy.
Johannesburg: World Wide Worx.
Government-of-Australia. 2015. The Australian Public Service Big Data Strategy: Improved
understanding through enhanced data-analytics capability, s.l.: Department of Finance and
Deregulation.
Graham, M. W. 2014. Government communication in the digital age: Social media’s effect
on local government public relations. Public Relations Inquiry , 3(3), pp. 361-376.
Greene, J. C., Caracelli, V. J. & Graham, W. F. 1989. Towards a conceptual framework for
mixed-method evaluation designs. Educational Evaluation and Policy Analysis, pp. 55-274.
234
Greener, S. 2008. Business Research Methods. s.l.: Greener and Ventus.
Gualdoni, J., Kurtz, A., Myzyri, M. W. & Rizvi, S. 2017. Secure Online Transaction
Algorithm: Securing Online Transaction Using Two-Factor Authentication. Procedia
Computer Science, pp. 93-99.
Habeenzu, S. 2010. ICT Sector Performance Reviews. [Online]Available at:
http://www.researchictafrica.net/publications/ICT_Sector_Performance_Reviews_2010/Vol%
202%20Paper%2017%20-%20Zambia%20ICT%20Sector%20Perform
ance%20Review%202010.pdf
[Accessed 07 December 2017].
Hair, J., Black, W., Babin, B. & Tatham, R. 2006. Multivariate Data Analysis. New Jersey:
Prentice Hall.
Hair, J. F., Bush, R. P. & Ortinau, D. J. 2000. Marketing Research: A practical approach for
the new millennium. Boston: McGraw-Hill International.
Hand, L. C. & Ching, B. D. 2011. Y ou have one friend request: An exploration of power and
citizen engagement in local governments’ use of social media. Administrative Theory and
Praxis , Volume 33, pp. 362-382.
Hayat, M. J. 2013. Understanding Sample Size Determination in Nursing Research.
Western Journal of Nursing Research, 35(7), pp. 943-956.
Heeks, R. 2002. E-government in Africa: Promise and practice. Institute for Development
Policy and Management, pp. 13-30.
Holzer, M., Zheng, Y., Manoharan, A. & Shark, A. 2014. Digital governance in
municipalities worldwide (2013-14): A Longitudinal Assessment of Municipal Websites
Throughout the World, Rutgers School of public affairs and administration: Newark.
Horsburgh, S., Goldfinch, S. & Gauld, R. 2011. Is public trust in government associated
with trust in e-government? Social Science Computer Review, 29(2), pp.232-241.
Howard, M. 2001. Government Finance Review. E-government across the globe: how will
“e” change government?, 17(4), pp. 6-9.
Howell, D. 1997. Statistical methods for psychology 4th edition. Belmont, CA: Duxbury
Press.
235
Hughes, O. 2012. Public Management and Administration: An Introduction. 3rd ed. New
York: Palgrave Macmillan.
Human Sciences Research Council. 2005. Poverty Pockets in Gauteng: How Migration
Impacts Poverty. Pretoria: HSRC.
Hussein, A. 2009. The use of Triangulation in Social Sciences Research: Can qualitative
and quantitative methods be combined? Journal of Comparative Social Work , pp. 1-12.
Hyvärinen, H. & Beck, R. 2018. Emotions Trump Facts: The Role of Emotions in on Social
Media: A Literature Review. Hawaii, HICSS, pp. 1797-1806.
Ifinedo, P. 2006. Towards E-Government in a Sub-Saharan African Country: Impediments
and Initiatives in Nigeria. E-government, 3(1), pp. 256-279.
Iglauer, P. 2015. South Korea to Move 60% of E-Government Services to Cloud by 2017
ZDNet. [Online] Available at: http://www.zdnet.com/article/south-korea-tomove-60-of-e-
government-services-to-cloud-by-2017/[Accessed 25 November 2017].
Im, T., Porumbescu, G. & Lee, H. 2013. ICT as a buffer to change: A case study of the
Seoul Metropolitan government’s Dasan Call Center. Public Performance and Management
Review, 36(3), pp. 436-455.
Infocomm Development Authority. 2010. Annual survey on infocomm usage in households
and by individuals. [Online]
Available at:
www.ida.gov.sg/doc/Publications/Publications_Level3/Survey2010/HH2010ES.pdf
International Telecommunications Union. 2013. Committed to connecting the world.
[Online]
Available at: https://www.itu.int/en/ITU-D/Statistics/Pages/publications/default.aspx
Irafan, M. I. M. 2017. The Role of E-Governance in Administrative Efficiency and
Combating Corruption: Case of Sri Lank. Global Journal of Management and Business
Research, 17(2), pp. 39-50.
Ismail, H. A. A. 2008. Citizens’ Readiness for E-government in Developing Countries
Unpublished PhD thesis, Middlesex: Middlesex University.
236
ITGI. 2016. Board Briefing on IT Governance. [Online]
Available at: http://www.itgi.org.
[Accessed 17 March 2018].
Jain, H. 2010. Community protests in South Africa: Trends Analysis and Explanations in
Local Government. Working paper series, Issue 1.
Jain, P. & Sharma, S. 2007. e-government and e-governance. [Online] Available at:
http://www.iceg.net/2007/books/1/1 369.pdf[Accessed 13 April 2016].
Janowski, T. 2015. Digital government evolution: From transformation to contextualization.
Government Information, 32(3), pp. 221-236.
Johnson, B. & Christensen, L. 2008. Educational research: quantitative, qualitative and
mixed approaches. 3rd ed. Thousand Oaks: Sage.
Johnson, R. & Onwuegbuzie, A. 2004. Mixed methods research: a research paradigm
whose time has come. Educational Researcher, pp. 14-26.
Kalsi, N., Kiran, R. & Vaidya, S. 2009. Effective e-governance for good governance in India.
International Review of Business Research Papers, 5(1), pp. 212-229.
Kamblet, S. S. 2003. Issues in implementing customerrelationship management (CRM) in
state Government departments. Management and labour issues, 28(1), pp. 31-36.
Karim, M. R. A. & Khalid, N. M. 2003. E-government in Malaysia: Improving
responsiveness and capacity to serve. Selangor Darul Ehsan: Pelanduk Publications.
Karunasena, K., Deng, H. & Singh, M. 2011. Measuring the public value of e-government:
A case study from Sri Lanka. Transforming Government. Transforming Government: People,
Process and Policy, 5(1), pp. 81-99.
Kemper, E., Stringfield, S. & Teddlie, C. 2003. Mixed methods sampling strategies in social
science research. Thousand Oaks: Sage.
Keniston, K. 2004. Introduction: The four digital divides. In K. Keniston, & D.Kumar (Eds),
IT experience in India: Bridging the digital divide. New Delhi: SAGE .
Kent, M. L. 2013. Using social media dialogically: Public relations role in reviving
democracy. Public Relations Review , 39(4), pp. 337-345.
237
Khalo, T. & Hu, S. 2010. An analysis of e-government in the Department of Home Affairs of
South Africa. Journal of US-China Public Administration, 7(9), pp. 39-52.
Khechine, H., Lakhal, S., Pascot, D. & Bytha, A. 2014. UTAUT model for blended learning:
The role of gender and age in the intention to use webinars. Interdisciplinary Journal of E-
Learning and Learning Objects, Volume 10, pp. 33-52.
Kiberu, V. M., Mars, M. & Scott, R. E. 2017. Barriers and opportunities to implementation of
sustainable e-Health programmes in Uganda:A literature review. African Journal of Primary
Health Care & Family Medicine, pp. 1-10.
Kohlborn, T. Weiss, S., Poeppelbuss, J., Korthaus, A. & Fiet, E. 2010. Online service
delivery models: An international comparison in the public sector. Australasian, Conference
on Information Systems.
Komba, M. M. 2015. Information and e-government adoption in selected Districts of
Tanzania: Phd Thesis, Pretoria: University of South Africa.
Kothari, C. 2004. Research methodology: methods and techniques. New Age International.
Kroukamp, H. 2005. e-Governance in South Africa: are we coping? Acta Academica, 37
(2), 37(2), pp. 1-67.
Krugell, W., Otto, H. & Merwe, J. 2010. Local Municipalities and progress with the delivery
of basic services in South Africa. South Africa Journal of Economics, 78(3), pp. 307-315.
Lal, R. & Haleem, A. 2002. E-Governance: An Emerging Paradigm. The Journal of
Business Perspective, pp. 99-109.
Langbecker, D., Caffery, L. J., Gillespie, N. & Smith, A. C. 2017. Using survey methods in
telehealth research: A practical guide. Journal of Telemedicine and Telecare, 23(9), pp.
770-779.
Lather, P. 1991. Feminist reserach in eucation: Within/against. Geelong: Deakin
University.
Lee, K., Park, Y. & Lee, D. 2018. Measuring efficiency and ICT ecosystem impact:
Hardware vs.software industry. Telecommunications Policy, Volume 42, pp. 107-115.
Lee, M. H. & Lio, M. C. 2016. The impact of information and communication technology on
public governance and corruption in China. Information Development, 32(2), pp. 127-141.

238
Lenth, R. 2001. Some practical guidelines for effective sample size determination. The
American Statistician, pp. 187-193.
Lesame, N. C. 2009. The impact of information and communication technologies (ICTs) on
development: a case study of the influence of telecentres in the education of users.
Telecentres in the education.
Lesame, Z. 2014. The South African Digital Divide Access Index. Mediterranean Journal of
Social Science, 5(10), pp. 331-341.
Li, L., Worch, E., Zhou, Y. & Aguiton, R. 2015. How and Why Digital Generation Teachers
Use Technology in the Classroom: An Explanatory Sequential Mixed Methods Study.
International Journal for the Scholarship of Teaching and Learning, 9(2), pp. 1-9.
Lin, F., Fofanah, S. S. & Liang, D. 2011. Assessing citizen adoption of e-government
initiatives in Gambia: a validation of the technology acceptance model in information
systems success. Government Information Quarterly , Volume 28, pp. 271-279.
Lincoln, Y. & Guba, E. 2000. Paradigmatic controversies, contradictions, and emerging
confluences. Thousand Oaks, CA: Sage.
Liu, H., Fang, C. & Sun, S. 2017. Digital inequality in provincial China. Environment and
Planning, 49(10), pp. 2179-2182.
Local Government, 2016. The Local government handbook. [Online]
Available at: http://www.localgovernment.co.za
[Accessed 23 April 2016].
Lollar, X. 2006. Assessing China’s e-government: Information, service, transparency and
citizen outreach of government websites. Journal of Contemporary China, 15(46), pp. 31-
41.
Luna-Reyes, L. F. & Gil-Garcia, J. R. 2011. Using institutional theory and dynamic
simulation to understand complex e-government phenomena. Government Information
quarterly, Volume 28, pp. 329-345.
Lund, A. & Lund, M. 2013.Laerd Statistics - Quick Start Guide. [Online]
Available at: https:/www.statistics.laerd.com/premium/blr/logistic-regression-in-spss.php
[Accessed 13 November 2016].
239
Lund, T. 2012. Combining Qualitative and Quantitative Approches: Some Arguments for
Mixed Methods Research. Scandanavian Journal of Educational Research, 56(2), pp. 155-
165.
Luthuli, L. P. & Kalusopa, T. 2017. The management of medical records in the context of
service delivery in the public sector in KwaZulu-Natal, South Africa: the case of Ngwelezana
hospital. SA Jnl Libs & Info Sci, 83(2), pp. 1-11.
Malhotra, N. K. 2004. Marketing research.. 4th ed. Upper Saddle River, NJ: Pearson
Prentice-Hall.
Malhotra, N. K. 2006. Marketing Research: An Applied Orientation. New Jersey: Pearson
Education.
Mamaghani, F. 2010. The social and economic impact of information and communication
technology on developing countries : An analysis. International Journal of Management,
27(3), p. 607.
Mametja, C. 2015. Moving towards Good Governance and Effective Performance
Management through the Application of Smart City Principles in Local Government. IMFO ,
16(2), pp. 20-23.
Martinez, J., Pfeffer, K. & van-Dijk, T. 2011. E-government Tools, Claimed
Potentials/Unnamed Limitations The Case of Kalyan–Dombivli. Environment and
Urbanization ASIA. 2(2), pp. 223-234.
Mason, J. 1996. Qualitative researching. Thousand Oaks, CA: Sage.
Maul, A. & McGrane, J. 2017. As pragmatic as theft over honest toil: Disentangling
pragmatism from operationalism. Measurement: Interdisciplinary Research and
Perspectives , pp. 2-4.
Maureen-Brown, M. 2007. Understanding e-government benefits. American Review of
Public Administration, Volume 37, pp. 178-197.
Mavetera, N. 2011. Towards an ontology-driven software development approach: An
unended quest , Pretoria: University of Pretoria.
Mawela, T. 2016. Exploring the role of social media in the G2C relationship A South African
perspective. Information Development, pp. 1-16.
240
Mawela, T., Ochara, N. M. & Twinomurinzi, H. 2017. E-Government Implementation: A
Reflection on South African Municipalities. South African Computer Journal , 29(1), pp. 147-
171.
Mbatha, B. & Lesame, Z. 2013. Diffusion and adoption of information and communication
technologies in the public sector: the case of selected government departments in KwaZulu-
Natal. Communicare, 32(2), pp. 40-62.
McMurray, A., Pace, R. & Scott, D. 2004. Research: a commonsense approach. Southbank
Victoria: Thomson.
Mda, Z. 2014. It’s not over yet [Interview] (9 February 2014).
Melitski, J. & Calista, D. 2016. E-government and e-governance best practices in cities and
countries compared between 2003 and 2012: Fad or diffused innovation? PAQ Winter, pp.
916-948.
Merriam, S. 2002. Quantitative research in practice: example for discussion and analysis.
San Francisco: Jossey-Bass.
Misurace, G. 2007. E-governance in Africa from Theory to Action: A handbook on ICT for
local governance. Trenton : Africa World Press.
Mitchell, M. L. & Jolley, J. M. 2013. Research design explained. Belmont: Wadsworth.
Moon, K. & Blackman, D. 2014. A Guide to Understanding Social Science Researchfor Natural Scientists. Conservation Biology, 28(5), pp. 424-433 MOPAS. 2012. Ministry of Public Administration and Security. [Online] Available at: http://www.mopas.go.kr/gpms/view/english/national/ [Accessed 07 December 2017]. Morgan, D. L. 2007. Paradigms lost and pragmatism regained: Methodological implications
of combining qualitative and quantitative methods. Mixed Methods Research, pp. 48-76.
Morgan, D. L. 2014. Pragmatism as a Paradigm for Social Research. Qualitative Inquiry,
20(8), pp. 1045-1053.
Morris, T. & Wood, S. 1991. Testing the survey method: continuity and change in British
industrial relations. Work Employment and Society, 5(2), pp. 259-282.
Mpinganjira, M. 2012. Diffusion of e-govrnment services: Citizen's perspective. Public
Administration, 47(2), pp. 500-517.
241
Mubangizi, B. & Gray, M. 2011. Viewpoints puting the 'public' into public service delivery for
social welfare in South Africa. International Journal of Social Welfare, pp. 212-219.
Muhammad, M. & Abu-Momtaz, S. 2007. Understanding e-governance: A theoretical
approach. Journal of Asian Affairs, 29(4), pp. 29-46.
Mukherjee, M. & Roy, S. 2016. Application of ICT in Good Governance. International
Journal of Advanced Research in Computer Science and Software Engineerin, 6(3), pp. 276-
279.
Mukonza, R. 2014. E-governance: A new paradigm in Public Administration. Journal of
Public Administration, 49(2), pp. 499-511.
Mukonza, R. M., Maserumule, M. H. & Moetsi, K. B. 2016. A Critical Examination of
Socioeconomic and Demographic Factors as Determinants of E-government Adoption
Among Residents in Zimbabwe’s Two Local Authorities. Africa Institute of South Africa,
46(2), pp. 60-75.
Mundy, D. & Musa, B. 2010. Towards a framework for e-government development in
Nigeria. Electronic Journal of E-government, 8(2), pp. 148-161.
Municiplity System Act . 2000.
Mutula, S. M. 2005. Bridging the digital divide through e-governance A proposal for Africa’s
libraries and information centres. The Electronic Library, 23(5), pp. 591-602.
Mutula, S. & Ocholla, D. 2010. Building trust in e-government: a proposal for an integrated
model. Mousaion, 28(1), pp. 128-148.
Mylonakis, J. & Malioukis, A. 2010. Identifying and managing enterprise security risks in
online business convergence environments. Business Management Strategy, 1(1), pp. 1-8.
Mzyece, M. 2012. A critical analysis of e-government in Zambia. The African Journal of
Information and Communication, 6(12), pp. 110-127.
Nath, V. 2005. Digital Governance Models: moving towards good governance in developing
countries. [Online]
Available at: http:// www.DigitalGovernance.org
[Accessed 05 May 2016].
National Treasury. 2015. 2015 Budget Review. Pretoria(Gauteng): National Treasury.
242
Ndou, V. 2004. E-government for developing countries: opportunities and challenges. The
Electronic Journal on Information Systems in Developing Countries, 18(1), pp. 1-24.
Neuendorf, K. 2001. The Content Analysis guidebook. Thousand Oaks, CA: Sage.
Neuman, W. L. 2006. Social research methods: qualitative and quantitative approaches.
6th ed. Boston : Pearson.
Neuman, W. L. 2014. Social Research methods: Qualitative and Quantitative approaches
(7th Ed). Essex: Pearson.
Newman, I. 1998. Qualitative-quantitative research methodology: Exploring the interactive
continuum. Carbondale: Southern IIIinois University Press.
Ngulube, P. 2005. Research procedures used by Master of Information Studies students at
the University of Natal in the period 1982 – 2002 with special reference to their sampling
techniques and survey response rates: a methodological discourse. The International
Information and Library Review, pp. 127-143.
Nkosi, M. & Mekuria, F. 2010. Mobile government for improved public service provision in
South Africa. In IST-Africa, pp. 1-8.
Norris, P. 2001. Digital divide: Civic engagement, information poverty and the internet
worldwide. Cambridge: Cambridge University Press.
Ntetha, M. & Mostert, B. 2011. Availability and utilisation of information & communication
technologies for service delivery: A case study of South African Journal . Libary &
Information science, pp. 77-85.
O'Donnell, M. & Turner, M. 2013. Leading the world: Public sector reform and e-
government in Korea. The Economic and Labour Relations Review, 24(4), p. 533 –548.
Onwuegbuzie, A. & Leech, N. 2006. Enhancing the Interpretation of Significant Findings:
The role of mixed methos research. The quantitative report, pp. 770-792.
Onyancha, O. B. 2010. E-governance and E-government in Africa: A Webometrician's
Perception of the challenges, trends aand issues. Mousaion , 28(2), p. 32–63.
Oracle. 2006. E-governance challenges for government. http://www.egovcenter.in/e-
governance.
243
Pacificcouncil. 2012. E-government in Developing world. [Online]
Available at: http:/www.pacificcouncil.org
Parylo, O. 2012. Qualitative, quantitative, or mixed methods: An anayis of research design
in articles on principal professional development (1998-2008). International Journal of
multiple research approaches, 6(3), pp. 297-313.
Pascual, P. J. 2003. E-government. Asia-Pacific Development Information Programme,
United Nations Development Programme.
Paterson, A., McGrath, S. & Badroodien, A. 2005. The National Skills Survey, Pretoria:
Human Sciences Research Council.
Pathak, R.D., Singh, G., Belwal, R., Naz, R., Smithl. 2008 . E-governance, corruption and
public service delivery: A comparative study of Fiji and Ethiopia. JOAAG, 3(1).
Patrova, V. 2014. Intro to Atlas.ti Qualitative Data Analysis Software. Seatle: University of
Washington.
Patton, M. 1990. Qualitative evaluation and research methods. Newbury Park, C.A: Sage.
Paulo, M. 2016. The role of e-Governance in Europe’s image of the Chinese Communist
Party. The International Communication Gazette, 78(1-2), p. 39–63.
Pew Research Center. 2010. Government online: The internet gives citizens new paths to
government. [Online]
Available at: http://www.pewresearch.com
[Accessed 20 November 2017].
Pfeffer, K., Baud, I. S. A., Martinez, J. A. & Sridharan, N. 2008. The role of Spatial
Information Infrastructure in addressing urban deprivations in Indian cities. Edinburgh, N-
AERUS .
Pickard, A. 2007. Research method in information. London: Facet Publishing.
Portney, L. & Watkins, M. 1993. Foundations of clinical research: Applications to practice.
Norwalk: Appleton & Lange.
Prabhu, C. 2012. E-governance Concepts and case studies. 2nd ed. New Delhi: PHI
Learning Private Limited.
244
Prabu, S. & Ganapathy, G. 2017. Secured Data Storage in public Cloud Environment
through Crypto-Biometric System. International Journal of Computer Science Engineering &
Technology, Volume 7, pp. 10-14.
Pule, D. 2010. “E-Skills Key to our Future:” Opening address by South African Deputy
Minister of Communications at the E-Skills. [Online]
Available at: http://www.tradingeconomics.com/southafrica
[Accessed 12 April 2016].
Rahman, M. 2016. ‘E-Governance and Bangladesh’. [Online]
Available at: http://www.thedailystar.net/25thanniversaryspecial-part-1/e-governance-and-
bangladesh-210577
[Accessed 15 October 2016].
Rajapakse, J., Van-Der-Vyver, A. & Hommes, E. 2012. e-Government Implementations in
Developing Countries: Success and Failure, Two Case Studies. Paper presented at the
2012 IEEE 6th International Conference on Information and Automation for Sustainability.
Beijing, ICIAfS.
Ramokgopa, K. 2014. State of the Capital City Address by his workshop, the Executive
Mayor of Tshwane, Tshwane: City of Tshwane.
Rani, M. 2007. E-governance initiatives in Karnataka. An Appraisal IASSI Quarterly, 26(1),
pp. 236-249.
Reilly, K. 2002. Government, lCT & Civil Society in Central America. [Online]
Available at: http:www//katherine.reilly.net/e-governance/e-governance.doc
[Accessed 31 May 2016].
Reynolds, W. 2010. Ethics in information technology 3rd Edition. Boston, MA: Cengage
Learning.
Robson, C. 2002. Real World Research. 2nd ed. Oxford: Blackwel.
Rogers, E. 1995. Diffusion of Innovations. 4th ed. New York: The Free Press..
Rogers, P. L. 1999. Barriers to Adopting Emerging Technologies in Education. Virginia:
Richmond.
245
Roman, A. 2015. Framing the Questions of E-Government Ethics: An Organizational
Perspective. American Review of Public Administration, 45(2), pp. 216-236.
Saha, P. & Zhoa, Y. 2005. Relationship between online service quality and customer
satisfaction: A study in Internet Banking. s.l.:Lulea University.
SALGA. 2015. In.know.vation Sharing Municipal knowledge, Innovation and Excellence,
Pretoria: South Africa Local Government Association.
Saunders, M., Lewis, P. & Thornhill, A. 2007. Research Methods for Business Student (5th
ed.). London: Pearson.
Saunders, M., Lewis, P. & Thornhill, A. 2009. Research methods for business students. 6th
ed. Essex: Pearson Education Limited.
Scholl, H.J. 2014. Building sound foundations for smart city government: The case of
Munich, Germany. International Journal of e-Planning Research, 3(4), pp. 1-22.
Scholl, H. J. 2016. Smart governance as key to multi-jurisdictional smart city initiatives: The
case of the eCityGov Alliance. Social Science Information, 55(2), p. 255 –277.
Scholl, H. J. & AlAwadhi, S. 2015. Creating Smart Governance: The Key to Radical ICT
Overhaul at the City of Munich. Information Polity, 20(3), pp. 1-22.
Scholl, J. M. & Scholl, M. C. 2014. Smart governance: A roadmap for research and practice
In: Kindling M, Greifeneder E (eds) Proceedings of the 9th iConference. Berlin, Illinois Digital
Environment for Access to Learning and Scholarship (IDEALS).
Schwandt, T. 2001. Dictionary of qualitative inquiry. Thousand Oaks, CA: Sage.
Schwella, E. 2001. Public sector policy in new South Africa. Public performance &
management review, 24(4), pp. 367-388.
Scott, Z. 2011. Evaluation of Public Sector Governnance Reforms 2001–2011: Literature
Review. [Online]
Available at: http://www.gsdrc.org/docs/open/scott2011_PSGRLiteratureReview.pdf
[Accessed 20 November 2017].
Sebastian, M. P. & Supriya, K. 2013. E-governance Readiness: Challenges for India. IIM
Kozhikode Society & Management Review. 2(1), pp. 31-42.
246
Seckel, A. 2010. Citizens @ The Centre: B.C. Government 2.0 - A Transformation and
Technology Strategy for the BC Public Service. s.l.:British Columbia.
Serfontein, J. J. 2010. The Impact of Strategic Leadership on the Operational Strategy and
performance of Business Organisations in South Africa: PhD Thesis, Cape Town: University
of Stellenbosch.
Sheridan, W. & Riley, T. B. 2006. Comparing e-government vs e-governance. [Online]
Available at: Comparing e-government vs e-governance gisdevelopment
net/magazine/years/2006/aug/46_1.htm
[Accessed 04 December 2017].
Shilubane, J. 2001. E-Government: An overview. Service Delivery Review.
Siau, K. & Long, Y. 2005. Synthesizing e-government stage models- a meta-synthesis
based on meta-ethnography approach. Industrial Management and Data Systems , pp. 443-
458.
Siegel, D. 2008. Accepting and overcoming resistance to change using the motivational
and acceptance model, Orlando: University of Central Florida.
Sigwejo, A. & Pather, S. 2016. A citizen-Centric framework for assessing e-government
effectiveness. The Electronic Journal of Information Systems in Developing Countries,
74(8), pp. 1-27.
Singh, A. 2018. E-governance and Ethical Leadership. Global Encyclopedia of Public
Administration, Public Policy, and Governance, pp. 8-13.
Singh, K. 2012. Features, advantages and disadvantages of observation. India: Business
school of India.
Somekh, B. & Lewin, C., 2005. Research methods in the social sciences. Thousand Oaks:
Sage.
South Africa. 1996. The Constitution Republic of South Africa of 1996. South Africa:
Government of South Africa.
South African e-skills Institute. 2012. e-Skills Institute Newsletter, s.l.: s.n.
Stake, R. E. 1995. The art of case study research. Thousand Oaks, CA: SAGE
Publications.
247
Statistics South Africa. 2011. Manicipal fact sheet, Pretoria: Statistics South Africa.
Statistics South Africa. 2014. Quarterly labour force survey-Quarter 2 of 2014, Pretoria:
Statistics South Africa.
Stemler, S. 2001. An overview of content analysis. Practical Assessment, Research &
Evaluation, 7(17), pp. 7-17.
Steven, J., Bogdan, R. & Devault, M. 2015. Introduction to Qualitative Research
Methods.4th ed. New Jersey: John Wiley and Sons.
Styles, A. K. & Tennyson, M. 2007. The accessibility of financial reporting of U.S.
municipalities on the internet. Journal of Public Budgeting, Accounting & Financial
Management, Volume 19, pp. 56-92.
Subban, M., Nzimakwe, I. & Pillay, P. 2007. E-governance as an alternative service
delivery strategy. Journal of Public Administration, 42(5), pp. 235-246.
Sun, P., Ku, C. & Shih, D. 2015. An implementation framework for e-government.
Telematics and Informatics, Volume 32, pp. 504-520.
Tankoano, J. 2009. E-readiness in Africa: ICT infrastructures for e-governance. [Online]
Available at: http://unpan1
un.org/intradoc/groups/public/documents/CAFRAD/UNPAN006613.pdf
[Accessed 04 Decemebr 2017].
Tashakkori, A. & Teddlie, C. 1998. Mixed Methodology:Combining Qualitative and
Quantitative Approaches. Thousand Oaks CA: Sage.
Tavares, A., Soares, D. & Estevez, E. 2016. Electronic Governance for Context-Specific
Public Service Delivery: a Survey of the Literature. ICEGOV, 15(16), pp. 135-138.
Thakur, S. & Singh, S. 2012. An Exploratory Study of e-Government Activities in South
Africa. Pretoria, Unisa.
Times-live. 2016. Gauteng launches online school registration. [Online]
Available at: http://www.gdeadmissions.gov.za
[Accessed 19 April 2016].
Timonen, V., O’Donnell, O. & Humphreys, P. 2003. E-governance and decentralisation of
service delivery. E-governance, pp. 50-97.
248
Titah, R. & Bark, H. 2006. E-government adoption and acceptance: A literature review.
Electronic Government Research, 2(3), pp. 23-30.
Tobin, I. M., Porumbescu, G. & Lee, H. 2013. ICT as a buffer to change – a case study of
the Seoul Metropolitan Government’s Dasan Call Center. Public Performance &
Management Review, 36 (3), 436–455, 36(3), pp. 436-455.
Tomas Rivera Policy Institute. 2002. Information technology. [Online]
Available at: http://www.trpi.org/information_tech.html
[Accessed 20 June 2016].
Torkzadeh, G., Chang, J. C. & Demirhan, D. 2006. A contingency model of computer an
interent self-efficacy. Information and Management,, Volume 43, pp. 541-550.
Trimi, S. & Sheng, H. 2008. Emerging trends in m-government. Communications of the
ACM, 51(5), p. 53–58.
Tukey, J. W. 1977. Exploratory Data Analysis. Reading. MA. Addison: Wesley.
Turpin, T. & Ghimire, A. 2012. The Social Dynamics Underpinning Telecentres in Nepal:
Feedback and Absorptive Capacity in a National Innovation System.
Science, Technology & Society , 17(2), pp. 275-294.
Twinomurinzi, H., Phahlamohlaka, J. & Byrne, E. 2012. The small group subtlety of using
ICT for participatory governance: A South African experience. Government Information
Quarterly, Volume 29, pp. 203-211.
UNDESA. 2003. United Nations Department of Economic and Social Affairs World public
sector report 2003: E-government at the crossroads, New York: United Nations Publication.
United Nations, 2001. Benchmarking E-government- A Global Perspective. [Online]
Available at: http://www.unpan.org/egovernment.asp
[Accessed 12 November 2015].
United Nations. 2010. United Nations e-government survey: Leveraging e-government at a
time of financial and economic crisis: Department of Economic and Social Affairs, Division
for Public Administration and Development Management. New York: United Nations.
United Nations. 2014. E-government Survey, New York: United Nations.
249
United Nations. 2016. E-Government Surveys 2016: E government in support of
sustainable development, New York: United Nations.
URCOT. 2001. Call centres: what kind of future workplaces? , Melbourne: Royal Melbourne
Institute of Technology.
Valentine, D. L. 2016. Examining Bridges Between Informal and Formal Learning
Environments: A Sequential Mixed Method Design, Lincoln: University of Nebraska.
Van der Vyver. 2007. E-government Development and Diffusion: Inhibitors and facilitators
of Digital Democracy. Hershey Information Science Reference.
Verdegem, P. 2011. Social media for digital and social inclusion: Challenges for information
society 2.0 research & policies. 9(1): 28–38. Triple C. Open Access Journal for a Global
Sustainable Information Society, 9(1), pp. 28-38.
Verneulen, L. 2011. Research indicates change in internet usage. Available online. [Online]
Available at: http://www.animationsa.org/community/press-releases/liezel/research-
indicates-change internet usage
[Accessed 05 December 2017].
Visser, W. & Hossana, T. 2008. E-Government & Public Service Delivery: Enabling ICT to
put “People First”–A Case Study from South Africa. Journal of Systemics, Cybernetics and
Informatics, 6(6), pp. 36-41.
Warschauer, M. 2001. Language, identity and the internet. [Online]
Available at: http://www.lll.hawaii.edu/web/faculty/markw/lang.html
[Accessed 20 June 2016].
Webster, J. & Watson, R. T. 2002. Analysing the past to prepare for the future: Writing a
literature review. MIS Quarterly , pp. 103-133.
Weerakkody, V., Irani, Z., Lee, H.&Osman, I. 2015. E-government implementation: A bird’s
eye view of issues relating to costs, opportunities, benefits and risks. Information Systems
Frontiers, , 17(4), p. 889.
Welch, E. W. 2012. The relationship between transparent and participative government A
study of local governments in the United States. International Review of Administrative
Sciences, Volume 78, pp. 93-115.
250
West, D. 2004. E-government and the transformation of service delivery. E-government,
64(1), p. 64.
Wilson, T. 1999. Models in information behavior research. Journal of Documentation , pp.
249-270.
Wisdom, J. 2013. Mixed Methods: Integrating Quantitative and Qualitative Data Collection
and Analysis While Studying Patient-Centered Medical Home Models. AHRQ Publication,
Volume 13, pp. 2-8.
World Economic Forum. 2014. The Global Competitive‐ness Report. [Online]
Available at: http://www.wefo‐rum.org
World Health Organization. 2016. eHealth. [Online]
Available at: http://www.who.int/topics/ehealth/en
[Accessed 09 April 2018].
World Wide Worx. 2012. Internet matters: the quiet engine of the South Africa economy:.
Johannesburg: World Wide Worx. [Online]. [Online]
Available at: http://www.internetmatters.co.za
[Accessed 13 April 2016].
Yang, S. 2017. Networking South Korea: Internet, nation, and new subjects. Media,
Culture & Society, 39(5), pp. 740-749.
Yang, Z. 2001. Measuring E-Service Quality and Its linkage to customer loyalty. Mexico:
New Mexico University.
Yeh, H. 2017. The effects of successful ICT-based smart city services: From citizens'
perspectives. Government Information Quarterly, Volume 34, pp. 556-565.
Yilmaz, K. 2013. Comparison of Quantitative and Qualitative research traditions:
epistemological, theoretical, and methodological diffrences. European Journal of Education,
48(2), pp. 311-325.
Yin, R. 2002. Case study research: Design and methods. Thousand Oaks, CA: SAGE.
Yin, R. 2003. Case study research: design and method. 3rd ed. London: Sage.
Yom, S. 2015. From Methodology to Practice: Inductive Iteration in Comparative Research.
Comparative Political Studies, 48(5), pp. 616-644.
251
Yunis, M. M., Koong, K.S., Liu, L .C., Kwan, R., Tsang, P. 2012. ICT Maturity as a Driver to
Global Competitiveness: A National Level Analysis. International Journal of Accounting and
Information Management, pp. 255-281.
Zawada, B., Wallmach, K. & Mabule, M. N. 2007. Advisory report on the provision of
government information and services for socio-economic development in local South African
languages of choice, using ICT platforms, Pretoria: University of South Africa.
Zhang, W. 2013. Redefining youth activism through digital technology in Singapore. The
International Communication Gazette, 75(3), pp. 253-270.
Zheng, L. 2013. Social media in Chinese government drivers, challenges and capabilities.
Government Information Quarterly, 30(4), pp. 369-376.
Zoroja, J. 2015. Fostering Competitiveness in European Countries with ICT: GCI Agenda.
International Journal of Engineering Business Management, pp. 1-8.

252
ANNEXURE A: A SURVEY QUESTIONNAIRE
E-governance for improving service delivery in local authorities in South Africa.
SECTION 1: Demographic Information
00 Gender 01 Date Click here to enter a date.
03 Age
04 Education 05 Occupation
Specify____________
06 Monthly Gross Income
07 Your municipality
Male Female
Never Attended school Government employee
Primary School Private sector employee
Matric Self employed
Diploma Academician
Degree Pensioneer
Masters Degree Student
Phd Other
Less than R5000 R5000-R10000 R10001-R20000 R20001-R30000
R30001-R40000 R40001-R50000 R50001-R60000 R60001 and above
Not Applicable I do not want to answer
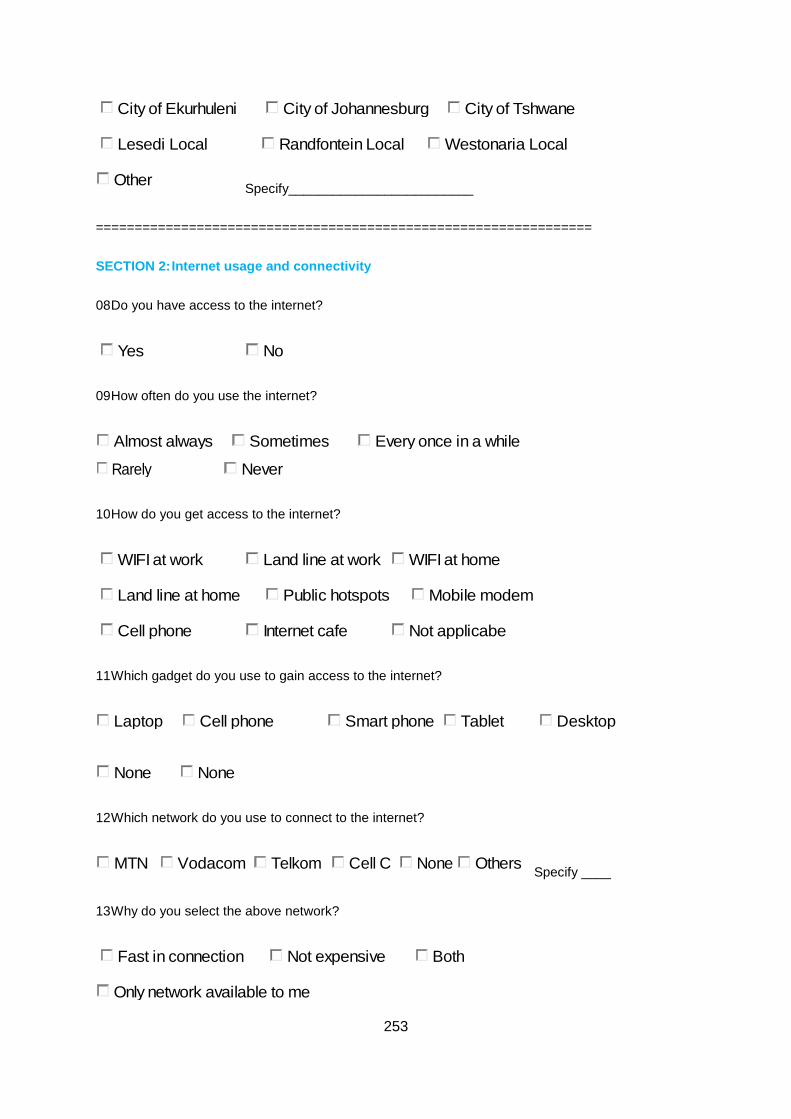
253
Specify_________________________
================================================================
SECTION 2: Internet usage and connectivity
08 Do you have access to the internet?
09 How often do you use the internet?
10 How do you get access to the internet?
11 Which gadget do you use to gain access to the internet?
12 Which network do you use to connect to the internet?
Specify ____
13 Why do you select the above network?
City of Ekurhuleni City of Johannesburg City of Tshwane
Lesedi Local Randfontein Local Westonaria Local
Other
Yes No
Almost always Sometimes Every once in a while
Rarely Never
WIFI at work Land line at work WIFI at home
Land line at home Public hotspots Mobile modem
Cell phone Internet cafe Not applicabe
Laptop Cell phone Smart phone Tablet Desktop
None None
MTN Vodacom Telkom Cell C None Others
Fast in connection Not expensive Both
Only network available to me
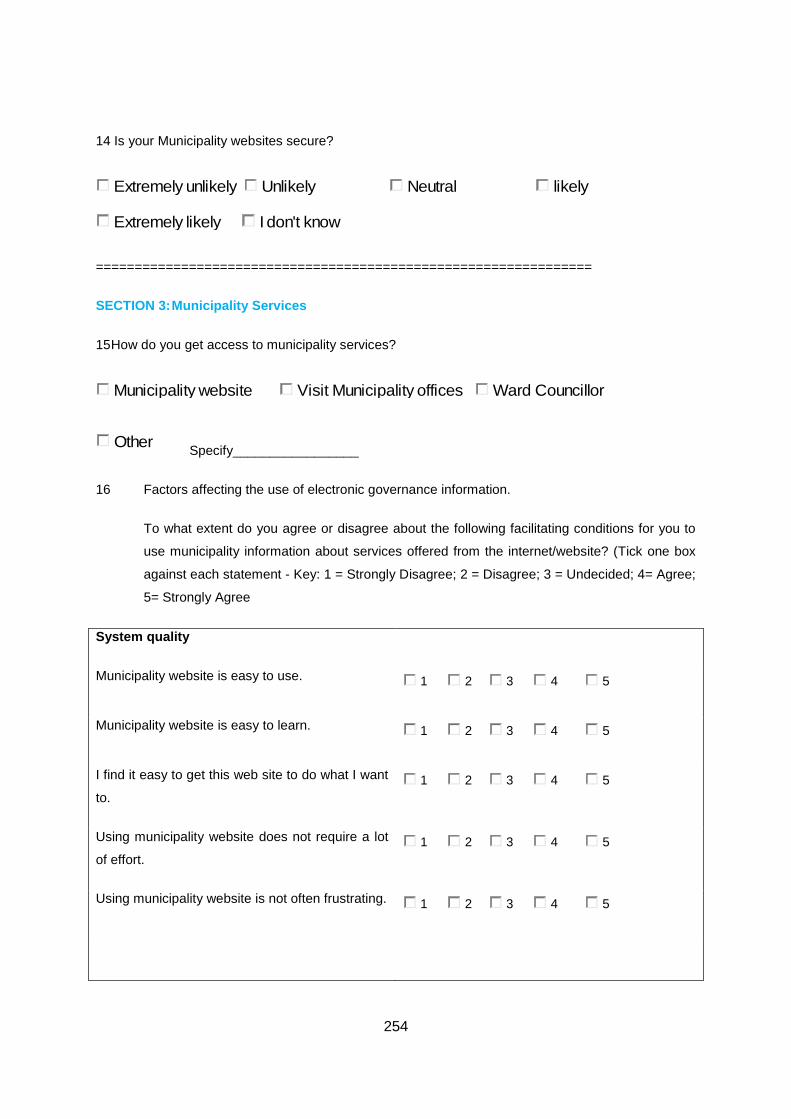
254
14 Is your Municipality websites secure?
================================================================
SECTION 3: Municipality Services
15 How do you get access to municipality services?
Specify_________________
16 Factors affecting the use of electronic governance information.
To what extent do you agree or disagree about the following facilitating conditions for you to
use municipality information about services offered from the internet/website? (Tick one box
against each statement - Key: 1 = Strongly Disagree; 2 = Disagree; 3 = Undecided; 4= Agree;
5= Strongly Agree
System quality
Municipality website is easy to use.
Municipality website is easy to learn.
I find it easy to get this web site to do what I want
to.
Using municipality website does not require a lot
of effort.
Using municipality website is not often frustrating.
Extremely unlikely Unlikely Neutral likely
Extremely likely I don't know
Municipality website Visit Municipality offices Ward Councillor
Other
1 2 3 4 5
1 2 3 4 5
1 2 3 4 5
1 2 3 4 5
1 2 3 4 5
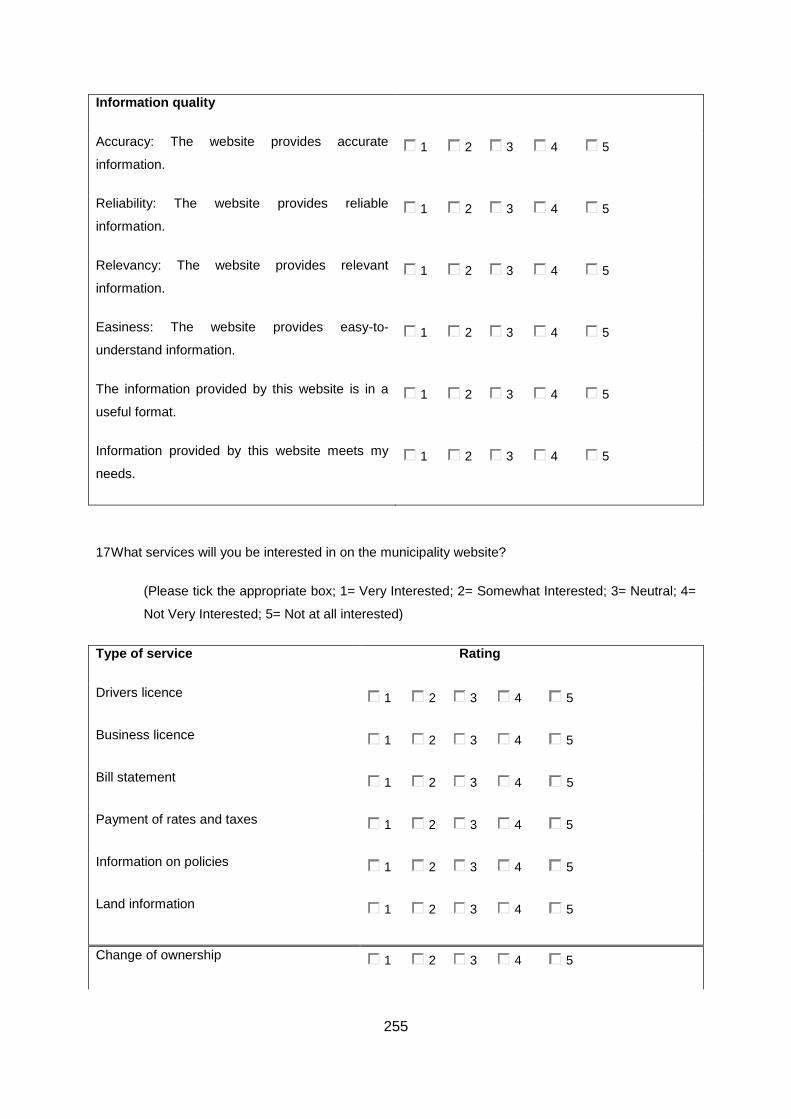
255
Information quality
Accuracy: The website provides accurate
information.
Reliability: The website provides reliable
information.
Relevancy: The website provides relevant
information.
Easiness: The website provides easy-to-
understand information.
The information provided by this website is in a
useful format.
Information provided by this website meets my
needs.
17 What services will you be interested in on the municipality website?
(Please tick the appropriate box; 1= Very Interested; 2= Somewhat Interested; 3= Neutral; 4=
Not Very Interested; 5= Not at all interested)
Type of service Rating
Drivers licence
Business licence
Bill statement
Payment of rates and taxes
Information on policies
Land information
Change of ownership
1 2 3 4 5
1 2 3 4 5
1 2 3 4 5
1 2 3 4 5
1 2 3 4 5
1 2 3 4 5
1 2 3 4 5
1 2 3 4 5
1 2 3 4 5
1 2 3 4 5
1 2 3 4 5
1 2 3 4 5
1 2 3 4 5

256
Payment of fines
Payment of water and electricity
Refuse and waste management
Parks and cemeteries
Emergency management services
18 When you use the internet to access online services information, what type of municipal
information do you access? Please tick the appropriate answer; 1=Very Important;
2=Important; 3= Neutral; 4=Less Important; 5= Not Important.
Renewing driver’s license
Voter registration
National park information and reservations
Voting on the internet
Information on value added tax (VAT), public pension
fund etc.
Online payments
Online forms (downloading and submission)
Licenses for example driving, death and marriage
certificates (information and services)
Medical information and services
1 2 3 4 5
1 2 3 4 5
1 2 3 4 5
1 2 3 4 5
1 2 3 4 5
1 2 3 4 5
1 2 3 4 5
1 2 3 4 5
1 2 3 4 5
1 2 3 4 5
1 2 3 4 5
1 2 3 4 5
1 2 3 4 5
1 2 3 4 5
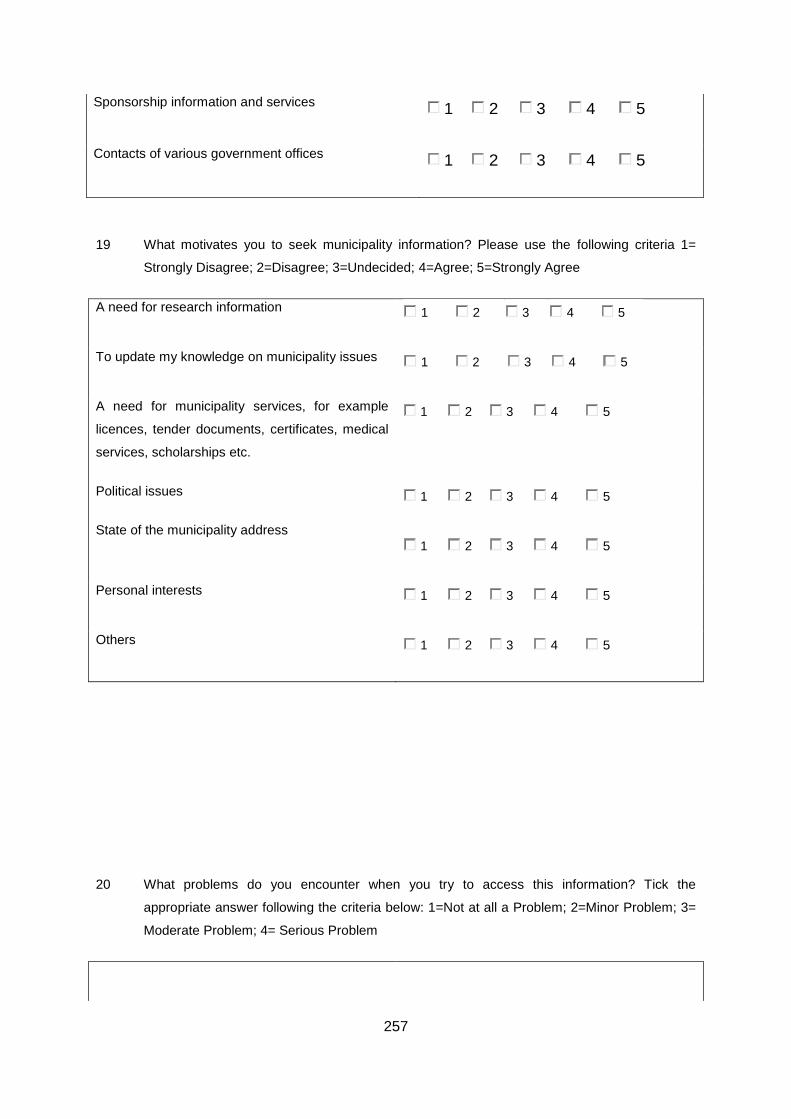
257
Sponsorship information and services
Contacts of various government offices
19 What motivates you to seek municipality information? Please use the following criteria 1=
Strongly Disagree; 2=Disagree; 3=Undecided; 4=Agree; 5=Strongly Agree
A need for research information
To update my knowledge on municipality issues
A need for municipality services, for example
licences, tender documents, certificates, medical
services, scholarships etc.
Political issues
State of the municipality address
Personal interests
Others
20 What problems do you encounter when you try to access this information? Tick the
appropriate answer following the criteria below: 1=Not at all a Problem; 2=Minor Problem; 3=
Moderate Problem; 4= Serious Problem
1 2 3 4 5
1 2 3 4 5
1 2 3 4 5
1 2 3 4 5
1 2 3 4 5
1 2 3 4 5
1 2 3 4 5
1 2 3 4 5
1 2 3 4 5
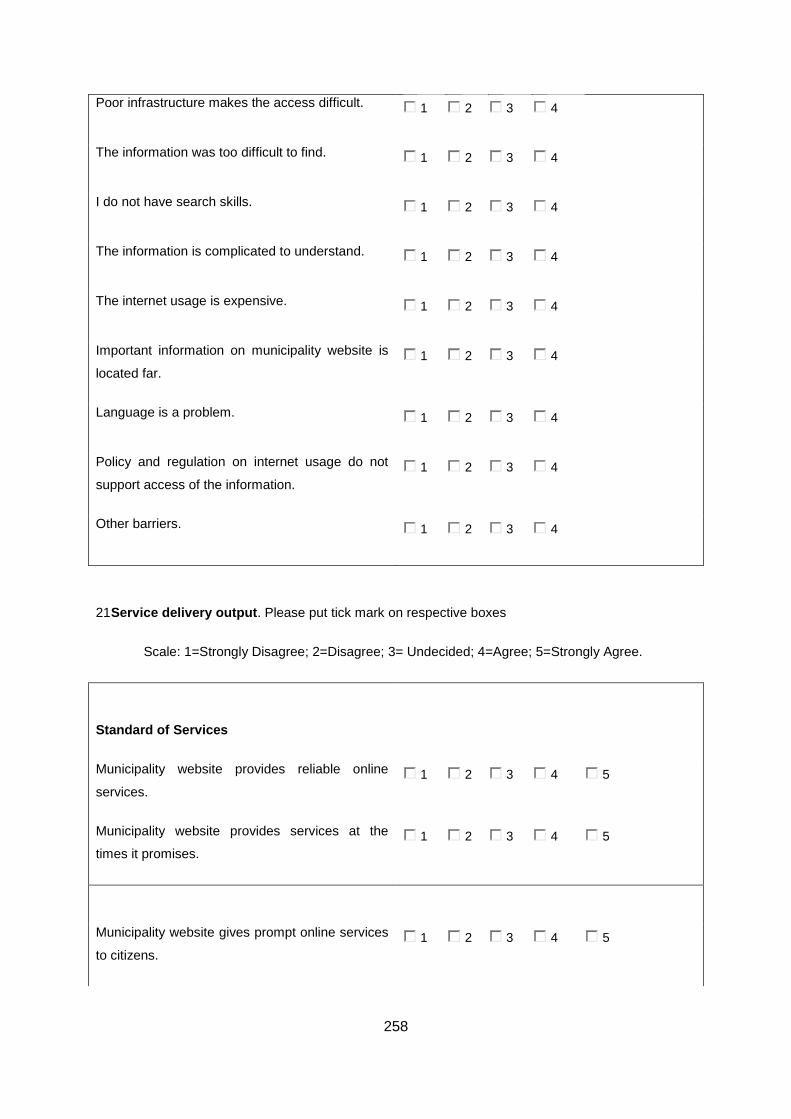
258
Poor infrastructure makes the access difficult.
The information was too difficult to find.
I do not have search skills.
The information is complicated to understand.
The internet usage is expensive.
Important information on municipality website is
located far.
Language is a problem.
Policy and regulation on internet usage do not
support access of the information.
Other barriers.
21 Service delivery output. Please put tick mark on respective boxes
Scale: 1=Strongly Disagree; 2=Disagree; 3= Undecided; 4=Agree; 5=Strongly Agree.
Standard of Services
Municipality website provides reliable online
services.
Municipality website provides services at the
times it promises.
Municipality website gives prompt online services
to citizens.
1 2 3 4
1 2 3 4
1 2 3 4
1 2 3 4
1 2 3 4
1 2 3 4
1 2 3 4
1 2 3 4
1 2 3 4
1 2 3 4 5
1 2 3 4 5
1 2 3 4 5
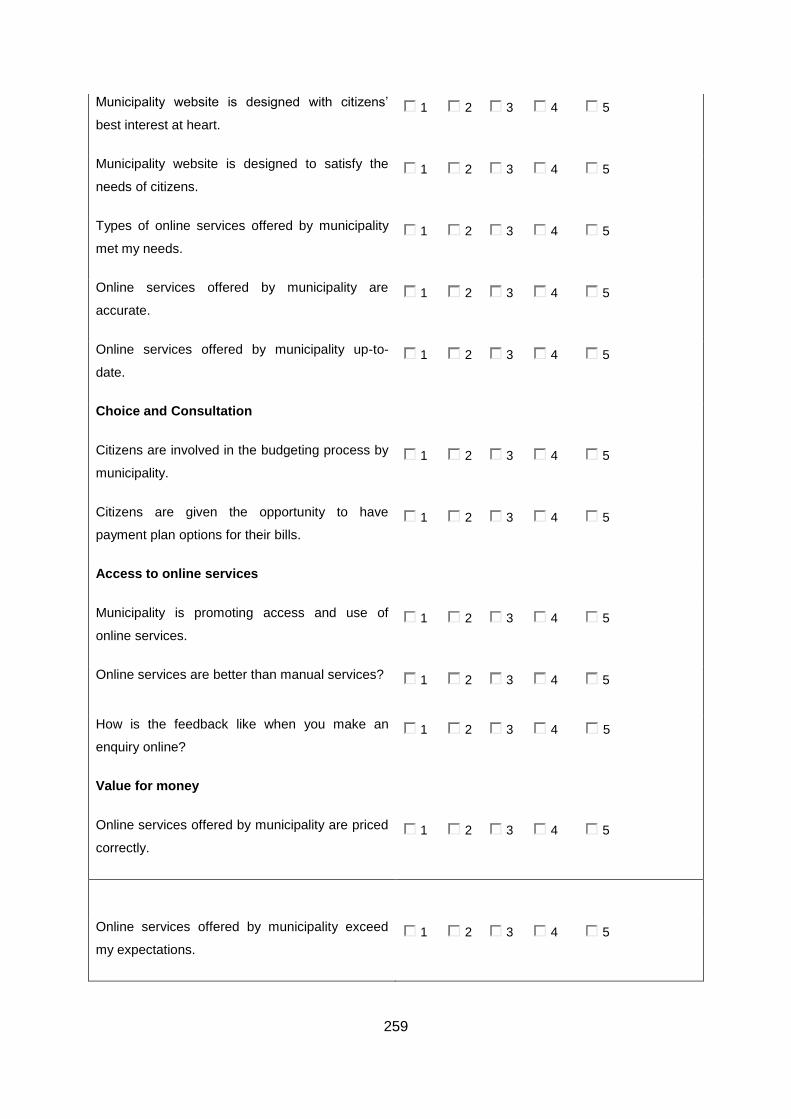
259
Municipality website is designed with citizens’
best interest at heart.
Municipality website is designed to satisfy the
needs of citizens.
Types of online services offered by municipality
met my needs.
Online services offered by municipality are
accurate.
Online services offered by municipality up-to-
date.
Choice and Consultation
Citizens are involved in the budgeting process by
municipality.
Citizens are given the opportunity to have
payment plan options for their bills.
Access to online services
Municipality is promoting access and use of
online services.
Online services are better than manual services?
How is the feedback like when you make an
enquiry online?
Value for money
Online services offered by municipality are priced
correctly.
Online services offered by municipality exceed
my expectations.
1 2 3 4 5
1 2 3 4 5
1 2 3 4 5
1 2 3 4 5
1 2 3 4 5
1 2 3 4 5
1 2 3 4 5
1 2 3 4 5
1 2 3 4 5
1 2 3 4 5
1 2 3 4 5
1 2 3 4 5
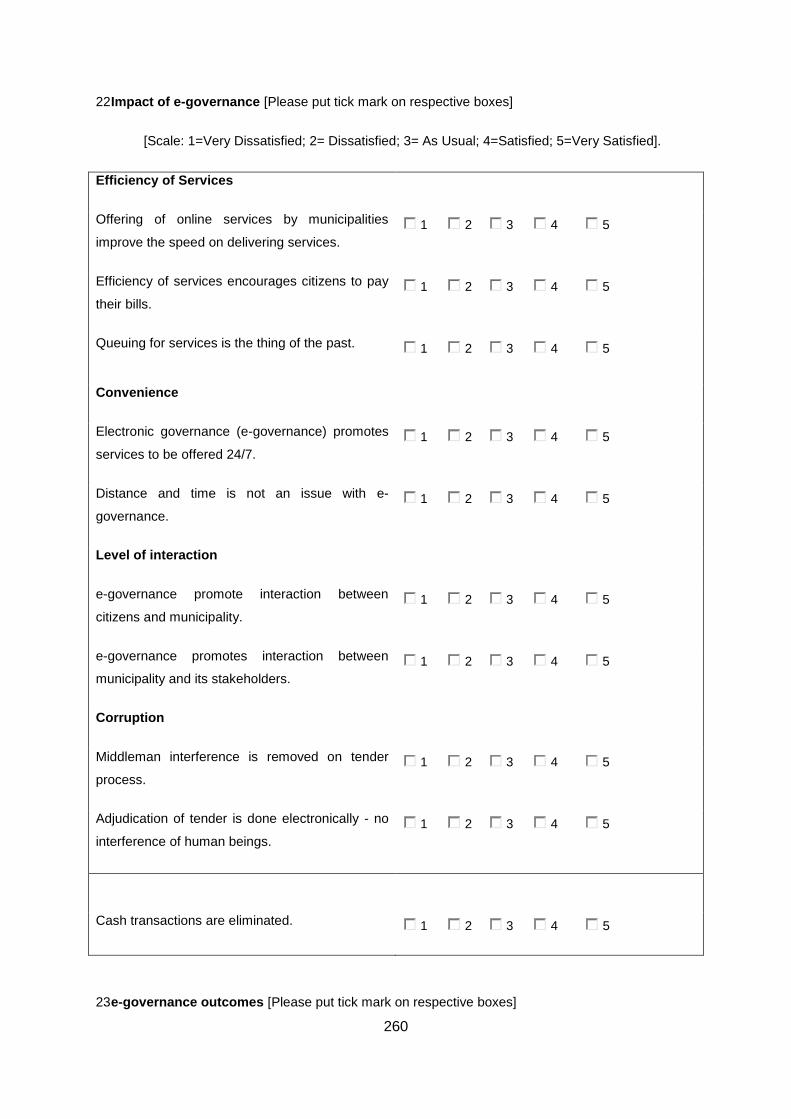
260
22 Impact of e-governance [Please put tick mark on respective boxes]
[Scale: 1=Very Dissatisfied; 2= Dissatisfied; 3= As Usual; 4=Satisfied; 5=Very Satisfied].
Efficiency of Services
Offering of online services by municipalities
improve the speed on delivering services.
Efficiency of services encourages citizens to pay
their bills.
Queuing for services is the thing of the past.
Convenience
Electronic governance (e-governance) promotes
services to be offered 24/7.
Distance and time is not an issue with e-
governance.
Level of interaction
e-governance promote interaction between
citizens and municipality.
e-governance promotes interaction between
municipality and its stakeholders.
Corruption
Middleman interference is removed on tender
process.
Adjudication of tender is done electronically - no
interference of human beings.
Cash transactions are eliminated.
23 e-governance outcomes [Please put tick mark on respective boxes]
1 2 3 4 5
1 2 3 4 5
1 2 3 4 5
1 2 3 4 5
1 2 3 4 5
1 2 3 4 5
1 2 3 4 5
1 2 3 4 5
1 2 3 4 5
1 2 3 4 5
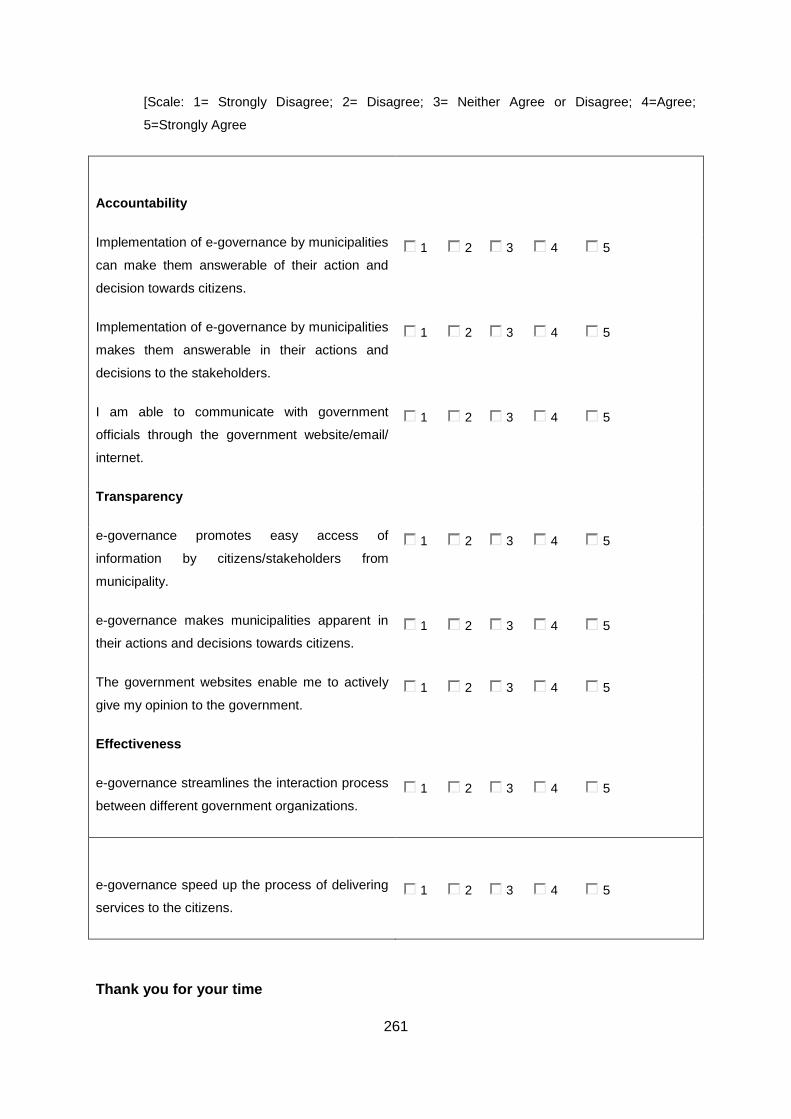
261
[Scale: 1= Strongly Disagree; 2= Disagree; 3= Neither Agree or Disagree; 4=Agree;
5=Strongly Agree
Accountability
Implementation of e-governance by municipalities
can make them answerable of their action and
decision towards citizens.
Implementation of e-governance by municipalities
makes them answerable in their actions and
decisions to the stakeholders.
I am able to communicate with government
officials through the government website/email/
internet.
Transparency
e-governance promotes easy access of
information by citizens/stakeholders from
municipality.
e-governance makes municipalities apparent in
their actions and decisions towards citizens.
The government websites enable me to actively
give my opinion to the government.
Effectiveness
e-governance streamlines the interaction process
between different government organizations.
e-governance speed up the process of delivering
services to the citizens.
Thank you for your time
1 2 3 4 5
1 2 3 4 5
1 2 3 4 5
1 2 3 4 5
1 2 3 4 5
1 2 3 4 5
1 2 3 4 5
1 2 3 4 5

262
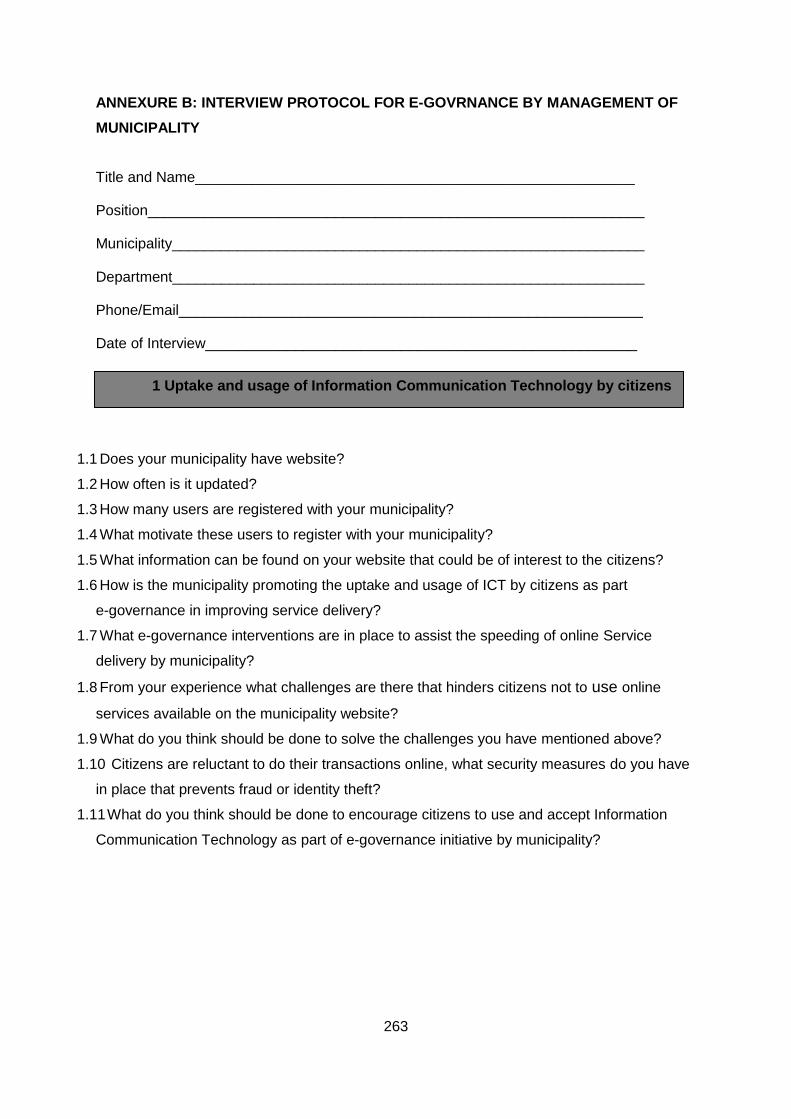
263
ANNEXURE B: INTERVIEW PROTOCOL FOR E-GOVRNANCE BY MANAGEMENT OF
MUNICIPALITY
Title and Name______________________________________________________
Position_____________________________________________________________
Municipality__________________________________________________________
Department__________________________________________________________
Phone/Email_________________________________________________________
Date of Interview_____________________________________________________
1.1 Does your municipality have website?
1.2 How often is it updated?
1.3 How many users are registered with your municipality?
1.4 What motivate these users to register with your municipality?
1.5 What information can be found on your website that could be of interest to the citizens?
1.6 How is the municipality promoting the uptake and usage of ICT by citizens as part
e-governance in improving service delivery?
1.7 What e-governance interventions are in place to assist the speeding of online Service
delivery by municipality?
1.8 From your experience what challenges are there that hinders citizens not to use online
services available on the municipality website?
1.9 What do you think should be done to solve the challenges you have mentioned above?
1.10 Citizens are reluctant to do their transactions online, what security measures do you have
in place that prevents fraud or identity theft?
1.11 What do you think should be done to encourage citizens to use and accept Information
Communication Technology as part of e-governance initiative by municipality?
1 Uptake and usage of Information Communication Technology by citizens
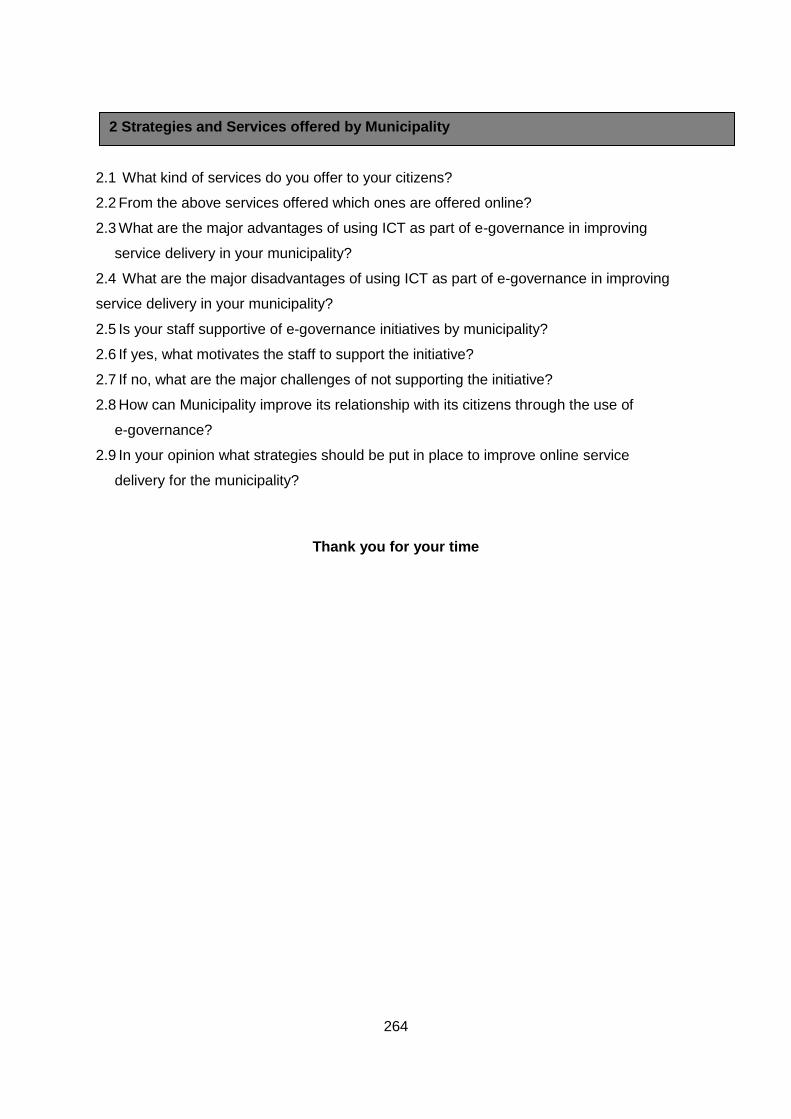
264
2.1 What kind of services do you offer to your citizens?
2.2 From the above services offered which ones are offered online?
2.3 What are the major advantages of using ICT as part of e-governance in improving
service delivery in your municipality?
2.4 What are the major disadvantages of using ICT as part of e-governance in improving
service delivery in your municipality?
2.5 Is your staff supportive of e-governance initiatives by municipality?
2.6 If yes, what motivates the staff to support the initiative?
2.7 If no, what are the major challenges of not supporting the initiative?
2.8 How can Municipality improve its relationship with its citizens through the use of
e-governance?
2.9 In your opinion what strategies should be put in place to improve online service
delivery for the municipality?
Thank you for your time
2 Strategies and Services offered by Municipality
265
ANNEXURE C: ETHICS CLEARANCE

266
ANNEXURE D: LETTER TO CONDUCT RESEARCH
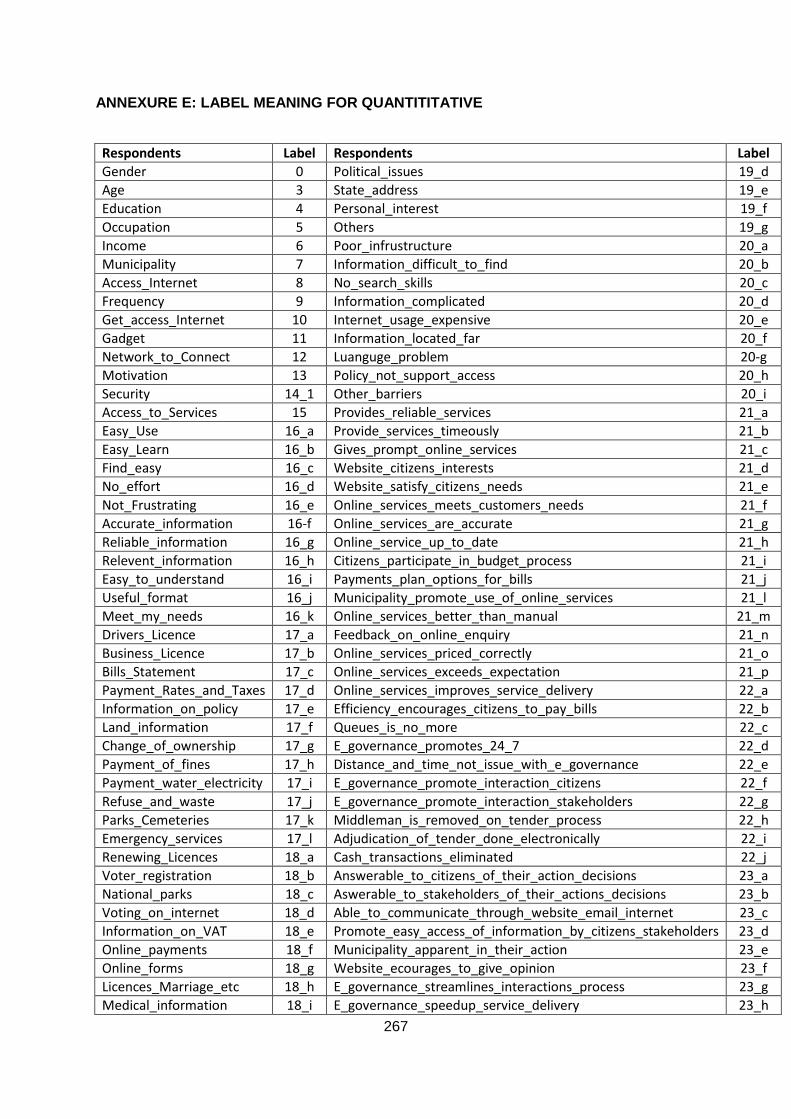
267
ANNEXURE E: LABEL MEANING FOR QUANTITITATIVE
Respondents Label Respondents Label
Gender 0 Political_issues 19_d
Age 3 State_address 19_e
Education 4 Personal_interest 19_f
Occupation 5 Others 19_g
Income 6 Poor_infrustructure 20_a
Municipality 7 Information_difficult_to_find 20_b
Access_Internet 8 No_search_skills 20_c
Frequency 9 Information_complicated 20_d
Get_access_Internet 10 Internet_usage_expensive 20_e
Gadget 11 Information_located_far 20_f
Network_to_Connect 12 Luanguge_problem 20-g
Motivation 13 Policy_not_support_access 20_h
Security 14_1 Other_barriers 20_i
Access_to_Services 15 Provides_reliable_services 21_a
Easy_Use 16_a Provide_services_timeously 21_b
Easy_Learn 16_b Gives_prompt_online_services 21_c
Find_easy 16_c Website_citizens_interests 21_d
No_effort 16_d Website_satisfy_citizens_needs 21_e
Not_Frustrating 16_e Online_services_meets_customers_needs 21_f
Accurate_information 16-f Online_services_are_accurate 21_g
Reliable_information 16_g Online_service_up_to_date 21_h
Relevent_information 16_h Citizens_participate_in_budget_process 21_i
Easy_to_understand 16_i Payments_plan_options_for_bills 21_j
Useful_format 16_j Municipality_promote_use_of_online_services 21_l
Meet_my_needs 16_k Online_services_better_than_manual 21_m
Drivers_Licence 17_a Feedback_on_online_enquiry 21_n
Business_Licence 17_b Online_services_priced_correctly 21_o
Bills_Statement 17_c Online_services_exceeds_expectation 21_p
Payment_Rates_and_Taxes 17_d Online_services_improves_service_delivery 22_a
Information_on_policy 17_e Efficiency_encourages_citizens_to_pay_bills 22_b
Land_information 17_f Queues_is_no_more 22_c
Change_of_ownership 17_g E_governance_promotes_24_7 22_d
Payment_of_fines 17_h Distance_and_time_not_issue_with_e_governance 22_e
Payment_water_electricity 17_i E_governance_promote_interaction_citizens 22_f
Refuse_and_waste 17_j E_governance_promote_interaction_stakeholders 22_g
Parks_Cemeteries 17_k Middleman_is_removed_on_tender_process 22_h
Emergency_services 17_l Adjudication_of_tender_done_electronically 22_i
Renewing_Licences 18_a Cash_transactions_eliminated 22_j
Voter_registration 18_b Answerable_to_citizens_of_their_action_decisions 23_a
National_parks 18_c Aswerable_to_stakeholders_of_their_actions_decisions 23_b
Voting_on_internet 18_d Able_to_communicate_through_website_email_internet 23_c
Information_on_VAT 18_e Promote_easy_access_of_information_by_citizens_stakeholders 23_d
Online_payments 18_f Municipality_apparent_in_their_action 23_e
Online_forms 18_g Website_ecourages_to_give_opinion 23_f
Licences_Marriage_etc 18_h E_governance_streamlines_interactions_process 23_g
Medical_information 18_i E_governance_speedup_service_delivery 23_h

268
Sponsorship_information 18_j Contracts 18_k Research_information 19_a Update_knowledge 19_b Need_for_service 19_c
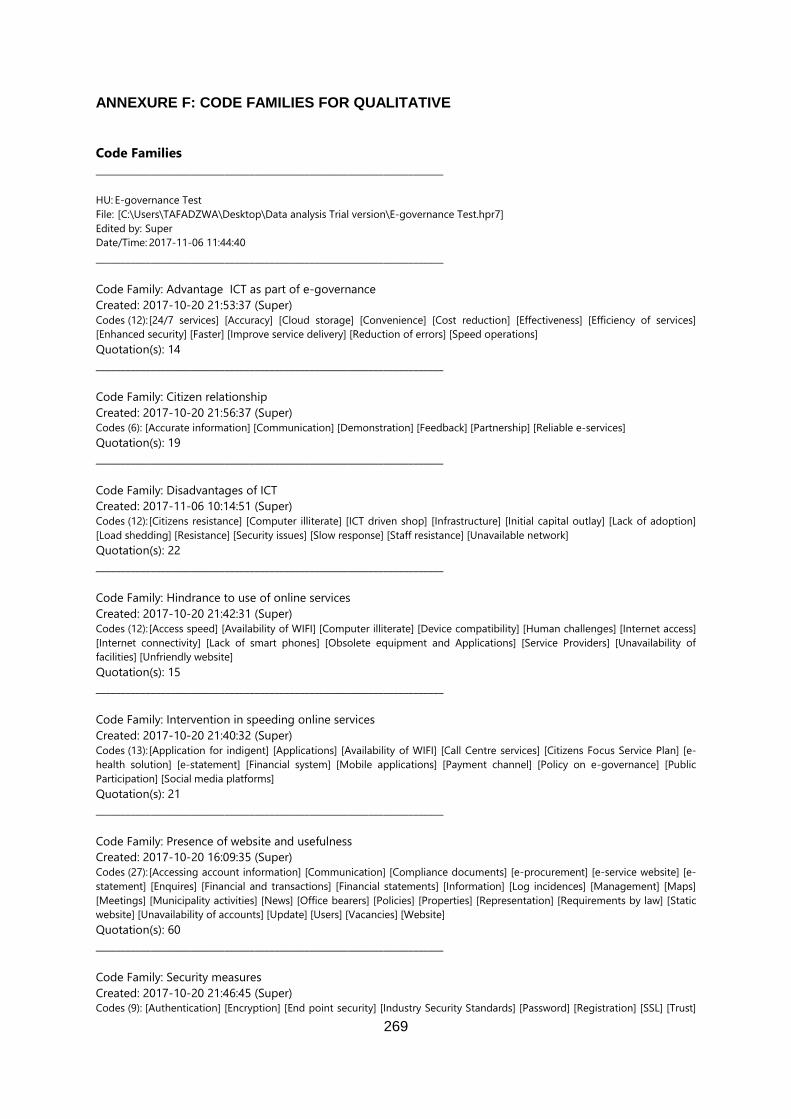
269
ANNEXURE F: CODE FAMILIES FOR QUALITATIVE
Code Families
______________________________________________________________________
HU: E-governance Test
File: [C:\Users\TAFADZWA\Desktop\Data analysis Trial version\E-governance Test.hpr7]
Edited by: Super
Date/Time: 2017-11-06 11:44:40
______________________________________________________________________
Code Family: Advantage ICT as part of e-governance
Created: 2017-10-20 21:53:37 (Super)
Codes (12): [24/7 services] [Accuracy] [Cloud storage] [Convenience] [Cost reduction] [Effectiveness] [Efficiency of services]
[Enhanced security] [Faster] [Improve service delivery] [Reduction of errors] [Speed operations]
Quotation(s): 14
______________________________________________________________________
Code Family: Citizen relationship
Created: 2017-10-20 21:56:37 (Super)
Codes (6): [Accurate information] [Communication] [Demonstration] [Feedback] [Partnership] [Reliable e-services]
Quotation(s): 19
______________________________________________________________________
Code Family: Disadvantages of ICT
Created: 2017-11-06 10:14:51 (Super)
Codes (12): [Citizens resistance] [Computer illiterate] [ICT driven shop] [Infrastructure] [Initial capital outlay] [Lack of adoption]
[Load shedding] [Resistance] [Security issues] [Slow response] [Staff resistance] [Unavailable network]
Quotation(s): 22
______________________________________________________________________
Code Family: Hindrance to use of online services
Created: 2017-10-20 21:42:31 (Super)
Codes (12): [Access speed] [Availability of WIFI] [Computer illiterate] [Device compatibility] [Human challenges] [Internet access]
[Internet connectivity] [Lack of smart phones] [Obsolete equipment and Applications] [Service Providers] [Unavailability of
facilities] [Unfriendly website]
Quotation(s): 15
______________________________________________________________________
Code Family: Intervention in speeding online services
Created: 2017-10-20 21:40:32 (Super)
Codes (13): [Application for indigent] [Applications] [Availability of WIFI] [Call Centre services] [Citizens Focus Service Plan] [e-
health solution] [e-statement] [Financial system] [Mobile applications] [Payment channel] [Policy on e-governance] [Public
Participation] [Social media platforms]
Quotation(s): 21
______________________________________________________________________
Code Family: Presence of website and usefulness
Created: 2017-10-20 16:09:35 (Super)
Codes (27): [Accessing account information] [Communication] [Compliance documents] [e-procurement] [e-service website] [e-
statement] [Enquires] [Financial and transactions] [Financial statements] [Information] [Log incidences] [Management] [Maps]
[Meetings] [Municipality activities] [News] [Office bearers] [Policies] [Properties] [Representation] [Requirements by law] [Static
website] [Unavailability of accounts] [Update] [Users] [Vacancies] [Website]
Quotation(s): 60
______________________________________________________________________
Code Family: Security measures
Created: 2017-10-20 21:46:45 (Super)
Codes (9): [Authentication] [Encryption] [End point security] [Industry Security Standards] [Password] [Registration] [SSL] [Trust]
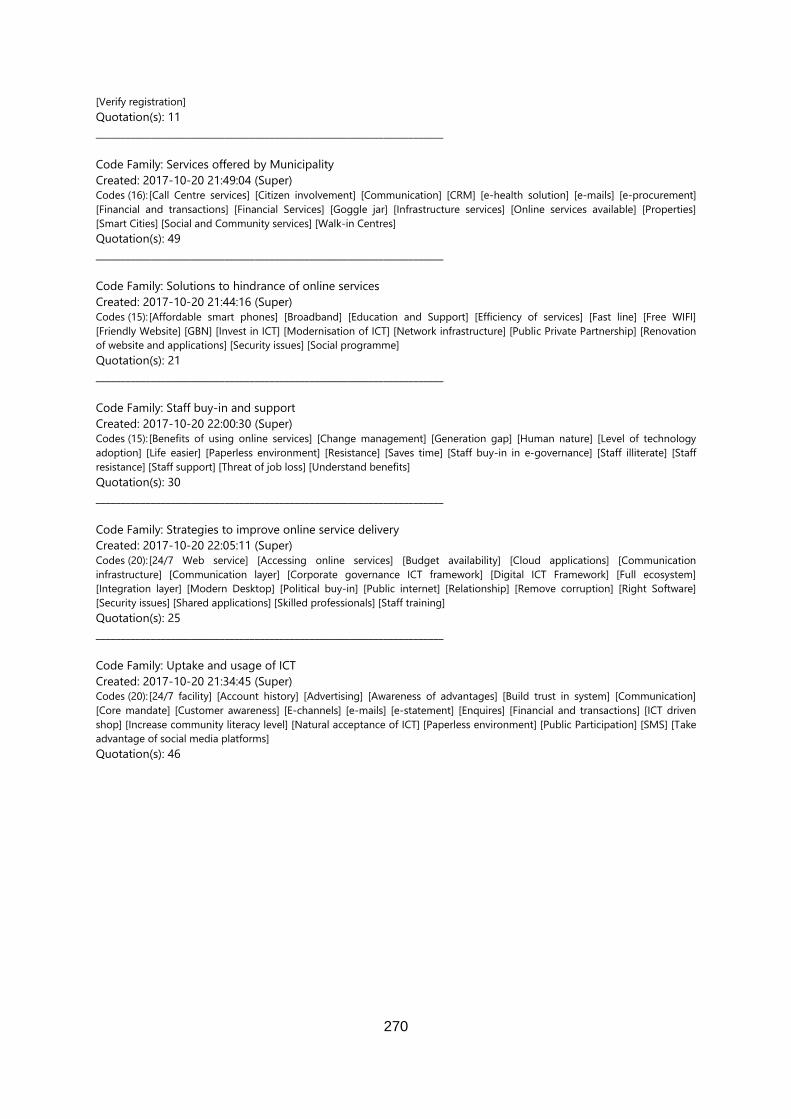
270
[Verify registration]
Quotation(s): 11
______________________________________________________________________
Code Family: Services offered by Municipality
Created: 2017-10-20 21:49:04 (Super)
Codes (16): [Call Centre services] [Citizen involvement] [Communication] [CRM] [e-health solution] [e-mails] [e-procurement]
[Financial and transactions] [Financial Services] [Goggle jar] [Infrastructure services] [Online services available] [Properties]
[Smart Cities] [Social and Community services] [Walk-in Centres]
Quotation(s): 49
______________________________________________________________________
Code Family: Solutions to hindrance of online services
Created: 2017-10-20 21:44:16 (Super)
Codes (15): [Affordable smart phones] [Broadband] [Education and Support] [Efficiency of services] [Fast line] [Free WIFI]
[Friendly Website] [GBN] [Invest in ICT] [Modernisation of ICT] [Network infrastructure] [Public Private Partnership] [Renovation
of website and applications] [Security issues] [Social programme]
Quotation(s): 21
______________________________________________________________________
Code Family: Staff buy-in and support
Created: 2017-10-20 22:00:30 (Super)
Codes (15): [Benefits of using online services] [Change management] [Generation gap] [Human nature] [Level of technology
adoption] [Life easier] [Paperless environment] [Resistance] [Saves time] [Staff buy-in in e-governance] [Staff illiterate] [Staff
resistance] [Staff support] [Threat of job loss] [Understand benefits]
Quotation(s): 30
______________________________________________________________________
Code Family: Strategies to improve online service delivery
Created: 2017-10-20 22:05:11 (Super)
Codes (20): [24/7 Web service] [Accessing online services] [Budget availability] [Cloud applications] [Communication
infrastructure] [Communication layer] [Corporate governance ICT framework] [Digital ICT Framework] [Full ecosystem]
[Integration layer] [Modern Desktop] [Political buy-in] [Public internet] [Relationship] [Remove corruption] [Right Software]
[Security issues] [Shared applications] [Skilled professionals] [Staff training]
Quotation(s): 25
______________________________________________________________________
Code Family: Uptake and usage of ICT
Created: 2017-10-20 21:34:45 (Super)
Codes (20): [24/7 facility] [Account history] [Advertising] [Awareness of advantages] [Build trust in system] [Communication]
[Core mandate] [Customer awareness] [E-channels] [e-mails] [e-statement] [Enquires] [Financial and transactions] [ICT driven
shop] [Increase community literacy level] [Natural acceptance of ICT] [Paperless environment] [Public Participation] [SMS] [Take
advantage of social media platforms]
Quotation(s): 46