franchise business economic outlook for 2014 · franchise business economic outlook, 2014: may 2014...
TRANSCRIPT
No portion of this report may be reproduced, reused, or otherwise distributed in any form without prior written consent.
Franchise Business Economic Outlook for 2014
Prepared for:
International Franchise Association Educational Foundation
By:
IHS Economics
May 30, 2014

No portion of this report may be reproduced, reused, or otherwise distributed in any form without prior written consent.
About IHS Economics IHS Economics is one of the leading economic analysis and forecasting firms in the world. With over 600 economists and industry specialists in 25 offices worldwide, IHS Economics offers market intelligence for over 200 countries and coverage of over 170 industries that helps more than 3,800 clients to monitor, analyze, and interpret conditions affecting their business. IHS Economics has an established track record for providing rigorous, objective forecast analysis and data to businesses, governments, and industry associations around the world.
About IHS (www.ihs.com) IHS (NYSE: IHS) is a leading source of information and insight in critical areas that shape today’s business landscape, including energy and power; design and supply chain; defense, risk, and security; environmental, health and safety, and sustainability; country and industry forecasting; and commodities, pricing and cost. IHS has been in business since 1959 and became a publicly traded company on the New York Stock Exchange in 2005. Headquartered in Englewood, Colorado, United States, IHS employs more than 5,500 people in more than 30 countries around the world.
For more information, contact:
John Reynolds President, IFA Educational Foundation
Alisa Harrison Vice President, Communications and Media Relations
James Gillula Managing Director, IHS Economics
For press information, contact:
Jim Dorsey Senior Manager Media Relations, IHS
[email protected] (C) Copyright 2014. IFA Educational Foundation. ALL RIGHTS RESERVED.
All information contained herein is obtained by IHS Economics from sources believed by it to be accurate and reliable. All forecasts and predictions contained herein are believed by IHS Economics to be as accurate as the data and methodologies will allow. Because of the possibilities of human and mechanical error, however, as well as other factors such as unforeseen and unforeseeable changes in political and economic circumstances beyond IHS Economics control, the information herein is provided “as is” without warranty of any kind, and IHS Economics, AND ALL THIRD-PARTY PROVIDERS, MAKE NO REPRESENTATIONS OR WARRANTIES EXPRESS OR IMPLIED TO ANY SUBSCRIBER OR ANY OTHER PERSON OR ENTITY AS TO THE ACCURACY, TIMELINESS, COMPLETENESS, MERCHANTABILITY, OR FITNESS FOR ANY PARTICULAR PURPOSE OF ANY OF THE INFORMATION OR FORECASTS CONTAINED HEREIN.

No portion of this report may be reproduced, reused, or otherwise distributed in any form without prior written consent.
Table of Contents
EXECUTIVE SUMMARY .................................................................................................................................. 1
Franchise Business Index .......................................................................................................................... 3
INTRODUCTION ............................................................................................................................................. 5
THE ECONOMIC OUTLOOK ............................................................................................................................ 6
OUTLOOK FOR FRANCHISE BUSINESS ........................................................................................................... 8
Outlook Summary ..................................................................................................................................... 8
Establishments by Business Line ............................................................................................................. 14
Employment by Business Line ................................................................................................................. 15
Output by Business Line .......................................................................................................................... 17
Franchise Businesses' Contribution to GDP ............................................................................................ 18
Distribution by Sector ............................................................................................................................. 18
Output per Employee .............................................................................................................................. 20
APPENDIX .................................................................................................................................................... 22
Composition of Franchise Business Lines ............................................................................................... 22
Methodology ........................................................................................................................................... 23
IHS Economics Page 1 No portion of this report may be reproduced, reused, or otherwise distributed in any form without prior written consent.
EXECUTIVE SUMMARY
This report presents an update of the IHS Economics forecast of the franchise sector of the U.S. economy
in 2014. First-quarter real GDP growth was just revised downward to show a decline of 1.0%. The
weather was a factor in this poor GDP performance, but a sharp inventory correction and anomalies in
investment and exports that boosted fourth-quarter 2013 growth also contributed. The latest economic
reports indicate a rebound is underway, and our second-quarter forecast shows 3.5% growth. Full-year
2014 GDP growth is now projected at 2.4% – slightly below the forecast in our March report on the
franchise business sector.
Although the macroeconomic outlook is a little weaker in areas (especially housing), the franchise sector
appears to be leading the economy’s rebound. The Franchise Business Index slowed to a gain of only
0.1% in January and declined by 0.2% in February, but March and April showed increases of 0.4% and
0.5%, respectively, driven by solid employment gains and an improvement in small business optimism.
We have revised our forecast of franchise employment growth in 2014 up 0.2% compared to our March
report. The franchise output forecast is now 0.1% higher.
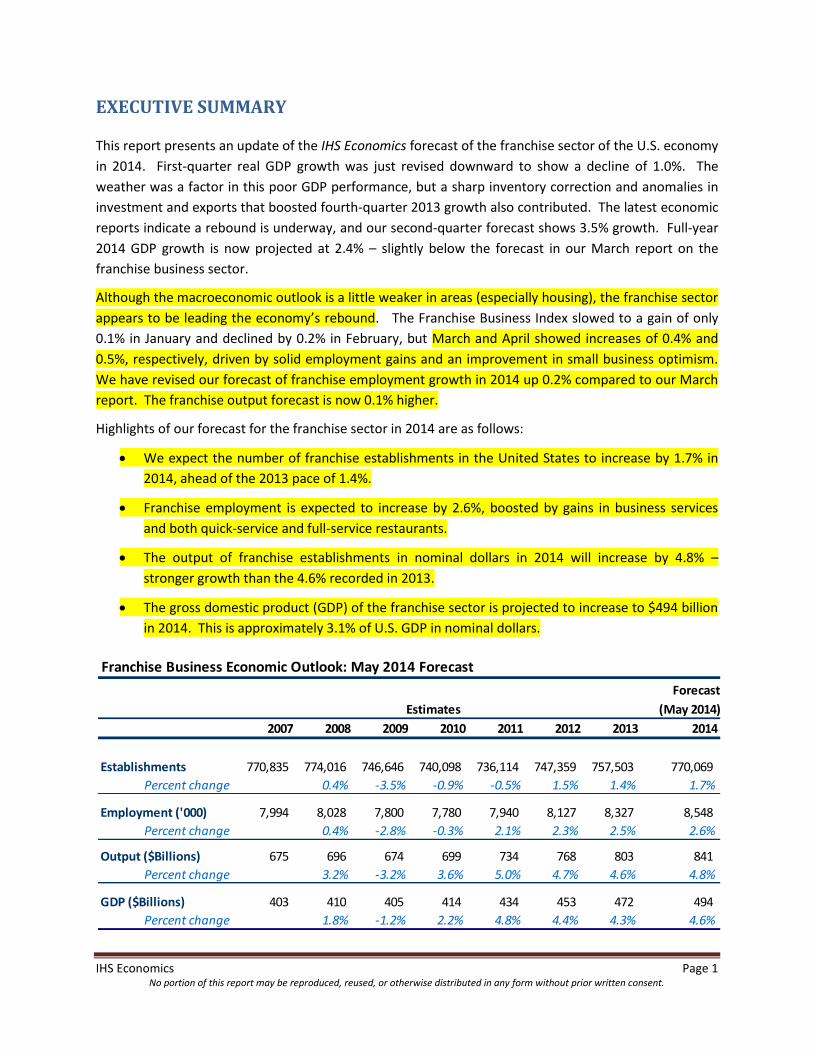
Highlights of our forecast for the franchise sector in 2014 are as follows:
We expect the number of franchise establishments in the United States to increase by 1.7% in
2014, ahead of the 2013 pace of 1.4%.
Franchise employment is expected to increase by 2.6%, boosted by gains in business services
and both quick-service and full-service restaurants.
The output of franchise establishments in nominal dollars in 2014 will increase by 4.8% –
stronger growth than the 4.6% recorded in 2013.
The gross domestic product (GDP) of the franchise sector is projected to increase to $494 billion
in 2014. This is approximately 3.1% of U.S. GDP in nominal dollars.
Franchise Business Economic Outlook: May 2014 Forecast
Forecast
(May 2014)
2007 2008 2009 2010 2011 2012 2013 2014
Establishments 770,835 774,016 746,646 740,098 736,114 747,359 757,503 770,069
Percent change 0.4% -3.5% -0.9% -0.5% 1.5% 1.4% 1.7%
Employment ('000) 7,994 8,028 7,800 7,780 7,940 8,127 8,327 8,548
Percent change 0.4% -2.8% -0.3% 2.1% 2.3% 2.5% 2.6%
Output ($Billions) 675 696 674 699 734 768 803 841
Percent change 3.2% -3.2% 3.6% 5.0% 4.7% 4.6% 4.8%
GDP ($Billions) 403 410 405 414 434 453 472 494
Percent change 1.8% -1.2% 2.2% 4.8% 4.4% 4.3% 4.6%
Estimates

IHS Economics Page 2 No portion of this report may be reproduced, reused, or otherwise distributed in any form without prior written consent.
With the more complete data for 2013 that are now available, we have also revised our estimates of the
franchise sector in 2013. Employment and output growth were both revised upward by 0.1% and now
show 2013 growth rates of 2.5% and 4.6%, respectively.
Our analysis is based on a grouping of franchise businesses into 10 broad business lines. The growth
outlook differs among the groups, with output growth in 2014 ranging from a low of 3.7% in Retail Food
to 5.6% in Real Estate. Other highlights of the industry forecast for 2014 are:
Business Services will lead the franchise business lines in employment and establishment growth
and rank third in output growth.
Forecasts of the employment and output of the Real Estate business line have been revised
downward, given the weaker housing market recovery, but Real Estate businesses will still rank
first in output growth.
Employment and output of the Lodging business line will pick up in 2014, and Lodging
businesses will rank second in output growth.
Table/Full-Service Restaurants – after lagging the Quick-Service Restaurants business line in
2013 – will show stronger output growth in 2014 (up 5.1%) and will post modest employment
gains.
-4%
-2%
0%
2%
4%
6%
8%
2008 2009 2010 2011 2012 2013 2014
Establishments
Employment
Output
GDP
Franchise Business Growth by Year, 2008-2014: May 2014 Forecast
IHS Economics Page 3 No portion of this report may be reproduced, reused, or otherwise distributed in any form without prior written consent.
Franchise Business Index
The estimates of output, employment and the number of businesses in the franchise industry reported
here provide valuable measures of the size and growth of the industry. But, because the key data inputs
required to make these estimates are published only on an annual basis, the estimates are made only at
an annual frequency. A more timely reading of the business environment for franchise operations in the
U.S. is provided by the Franchise Business Index (FBI) – a monthly index of franchise activity that was
developed for IFA by IHS. The FBI combines indicators of the growth or decline of industries where
franchise activity has historically been concentrated with measures of the demand for franchise business
services and the general business environment. The components of the Index are:
Employment in Franchise Businesses (ADP)
Number of Self Employed (BLS)
Unemployment Rate (BLS)
Retail Sales of Franchise-Intensive Industries (Census Bureau)
Small Business Optimism Index (NFIB)
Small Business Credit Conditions Index (NFIB)
Growth of the FBI slowed to 0.1% in January and the February data show a decline of 0.2%, but much of
that weakness could have been weather-related. The FBI was up 0.4% in March and 0.5% in April, led by
solid employment growth and an improvement in the small business optimism component of the index
in both months. The retail sales of franchise-intensive industries were down slightly in April, but this
followed a strong rebound in March after weak winter sales.
On a year-over-year basis, the FBI was up 2.6% in April.
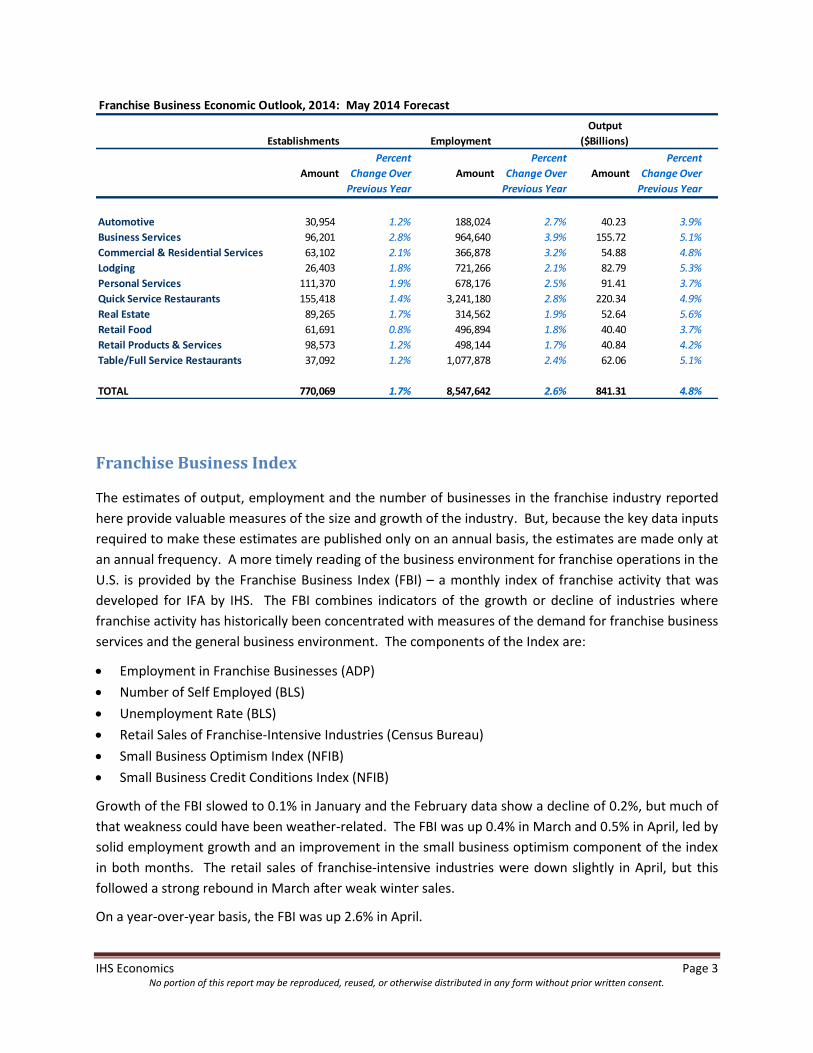
Franchise Business Economic Outlook, 2014: May 2014 Forecast
Establishments Employment
Amount
Percent
Change Over
Previous Year
Amount
Percent
Change Over
Previous Year
Amount
Percent
Change Over
Previous Year
Automotive 30,954 1.2% 188,024 2.7% 40.23 3.9%
Business Services 96,201 2.8% 964,640 3.9% 155.72 5.1%
Commercial & Residential Services 63,102 2.1% 366,878 3.2% 54.88 4.8%
Lodging 26,403 1.8% 721,266 2.1% 82.79 5.3%
Personal Services 111,370 1.9% 678,176 2.5% 91.41 3.7%
Quick Service Restaurants 155,418 1.4% 3,241,180 2.8% 220.34 4.9%
Real Estate 89,265 1.7% 314,562 1.9% 52.64 5.6%
Retail Food 61,691 0.8% 496,894 1.8% 40.40 3.7%
Retail Products & Services 98,573 1.2% 498,144 1.7% 40.84 4.2%
Table/Full Service Restaurants 37,092 1.2% 1,077,878 2.4% 62.06 5.1%
TOTAL 770,069 1.7% 8,547,642 2.6% 841.31 4.8%
Output
($Billions)

IHS Economics Page 4 No portion of this report may be reproduced, reused, or otherwise distributed in any form without prior written consent.
February March April 12-month
2014 2014 2014 April-April
Franchise Business Index 111.1 111.6 112.1
Percent Change -0.2% 0.4% 0.5% 2.6%
95
100
105
110
115
Ap
r-0
0
Oct
-00
Ap
r-0
1
Oct
-01
Ap
r-0
2
Oct
-02
Ap
r-0
3
Oct
-03
Ap
r-0
4
Oct
-04
Ap
r-0
5
Oct
-05
Ap
r-0
6
Oct
-06
Ap
r-0
7
Oct
-07
Ap
r-0
8
Oct
-08
Ap
r-0
9
Oct
-09
Ap
r-1
0
Oct
-10
Ap
r-1
1
Oct
-11
Ap
r-1
2
Oct
-12
Ap
r-1
3
Oct
-13
Ap
r-1
4
Jan
20
00
= 1
00
Franchise Business Index
Source: IHS Economics, May 2014
This release of the Franchise Business Index reflects the results of a benchmark review and revision of the data sources and methods used to calculate the index. The changes introduced are as follows:
The employment component of the index for the period April 2011 to the present are now based on data from ADP’s monthly National Franchise Report, adjusted to exclude estimated employment gains of product distribution businesses, which are not considered business format franchises. Prior to April 2011, this index component continues to be measured by a weighted average of employment in franchise-intensive industries.
The retail sales component of the FBI was expanded to include restaurant sales.
The credit conditions component of the FBI, which is drawn from an index published monthly by the NFIB, was revised to incorporate a less volatile form of the published index.
Weighting of the six components was revised to reflect changes in the volatility of all components and in the subjective assessment of the importance of each component.
These changes affect the entire historical series of the index, January 2000 to April 2014. Complete data on the revised FBI and a more detailed description of these changes is provided in the Franchise Business Index: Sources and Methods document.
IHS Economics Page 5 No portion of this report may be reproduced, reused, or otherwise distributed in any form without prior written consent.
INTRODUCTION
This report presents an updated forecast of basic indicators of the franchise sector of the U.S. economy
in 2014 prepared for the International Franchise Association Educational Foundation by IHS Economics.
The following section presents a summary of the current IHS forecast of the U.S. economy in 2014, with
attention to economic indicators that relate to sectors of the economy where there is a significant
concentration of franchising.
We then present an overview of our estimates and forecasts of franchising for 10 business lines: 1
1. Automotive
2. Business Services
3. Commercial and Residential Services
4. Lodging
5. Personal Services
6. Quick Service Restaurants
7. Table/Full Service Restaurants
8. Real Estate
9. Retail Food
10. Retail Products and Services
For each of the 10 business format lines, the projections include revised estimates for 2007–13 and an
updated forecast for 2014 of:
Franchise establishments2
Franchise employment3
Franchise nominal output4
1 This report does not include estimates for product-distribution franchises, such as automotive and truck dealers,
gasoline service stations without convenience stores, and beverage bottlers.
2 An establishment is a single physical location at which business is conducted or services or industrial operations
are performed. A business may consist of more than one establishment. An establishment may be owned by the franchisor or the franchisee. 3 Positions filled by part-time and full-time employees or by self-employed individuals.
4 Nominal output is the gross value of goods and services produced -- a concept that is comparable with "sales" for
most industries. In government input-output accounts, the output of goods-producing industries is measured by the value of shipments. For most other industries, output is measured by receipts or revenues from goods and services sold. A special case is the output of the wholesale and retail industries, which is measured generally as the difference between receipts or revenues and the cost of goods sold—this difference is referred to as "margin."
IHS Economics Page 6 No portion of this report may be reproduced, reused, or otherwise distributed in any form without prior written consent.
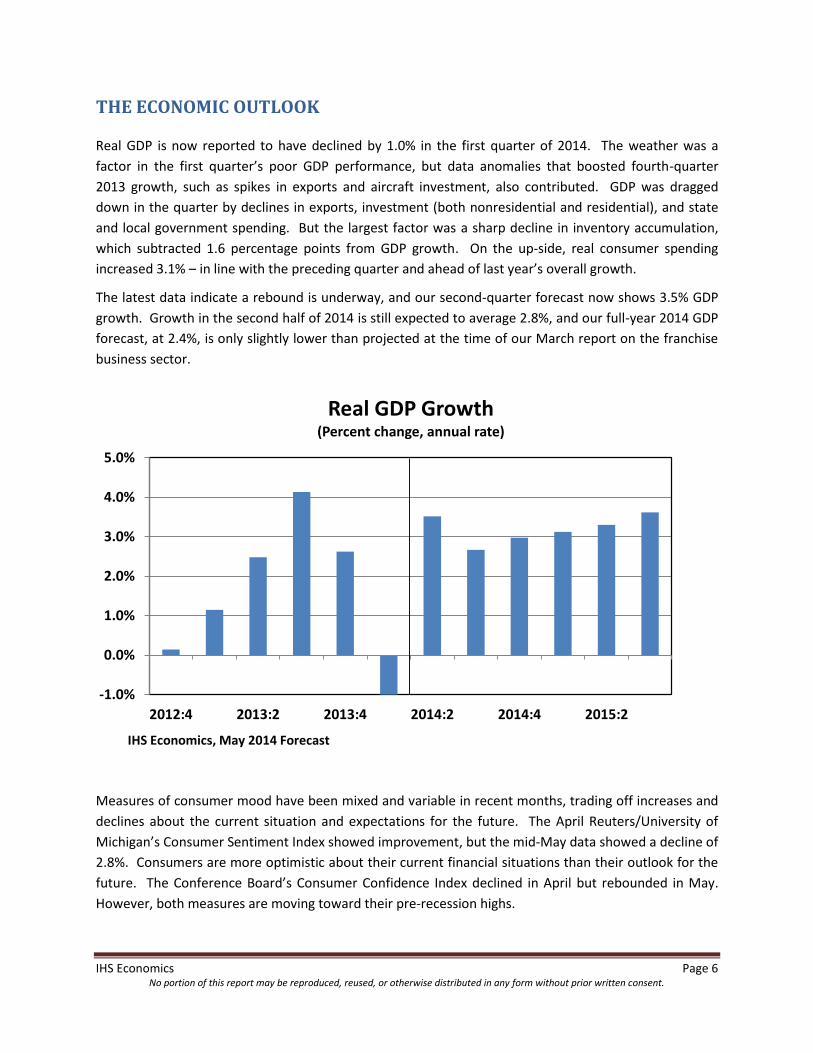
THE ECONOMIC OUTLOOK
Real GDP is now reported to have declined by 1.0% in the first quarter of 2014. The weather was a
factor in the first quarter’s poor GDP performance, but data anomalies that boosted fourth-quarter
2013 growth, such as spikes in exports and aircraft investment, also contributed. GDP was dragged
down in the quarter by declines in exports, investment (both nonresidential and residential), and state
and local government spending. But the largest factor was a sharp decline in inventory accumulation,
which subtracted 1.6 percentage points from GDP growth. On the up-side, real consumer spending
increased 3.1% – in line with the preceding quarter and ahead of last year’s overall growth.
The latest data indicate a rebound is underway, and our second-quarter forecast now shows 3.5% GDP
growth. Growth in the second half of 2014 is still expected to average 2.8%, and our full-year 2014 GDP
forecast, at 2.4%, is only slightly lower than projected at the time of our March report on the franchise
business sector.
Measures of consumer mood have been mixed and variable in recent months, trading off increases and
declines about the current situation and expectations for the future. The April Reuters/University of
Michigan’s Consumer Sentiment Index showed improvement, but the mid-May data showed a decline of
2.8%. Consumers are more optimistic about their current financial situations than their outlook for the
future. The Conference Board’s Consumer Confidence Index declined in April but rebounded in May.
However, both measures are moving toward their pre-recession highs.
-1.0%
0.0%
1.0%
2.0%
3.0%
4.0%
5.0%
2012:4 2013:2 2013:4 2014:2 2014:4 2015:2
Real GDP Growth(Percent change, annual rate)
IHS Economics, May 2014 Forecast

IHS Economics Page 7 No portion of this report may be reproduced, reused, or otherwise distributed in any form without prior written consent.
Consumers escalated their debt levels in March by the largest total in more than a year, consistent with
the strong month for retail sales. Total nonmortgage debt now stands at its highest level ever relative to
disposable income. Revolving debt growth, mostly credit cards, remains subdued as consumers work to
keep their personal finances in order following the recession. But non-revolving debt continues to
increase relative to disposable income, propelled largely by rising student-loan debt.
Since our March report on franchise businesses, we have boosted our forecast of total employment
growth in 2014 slightly, and with it the growth of real consumer spending. Employment is now expected
to increase by 1.8% and consumer spending by 2.7%. Spending on durables should make a good
comeback in the second quarter, and services will be strongest in the second half of the year.
An important element of the somewhat softer GDP growth forecast for year is reduced expectations for
housing market performance. Recent data show that new and existing home sales remain weak, as do
housing starts. Moreover, this weakness is seen in parts of the United States that had “good” winter
weather, eliminating the weather as the sole causal factor.
There are several possible factors delaying the housing recovery: higher input prices for builders;
stringent lending standards put in place by mortgage lenders, reducing the potential customer pool; a
relative lack of distressed properties for sale, which had helped drive sales in recent years; and a
reduction in job mobility, as the rate of employment growth remains subdued. We now project a small
decline instead of a small increase in existing home sales in 2014, and the forecast for housing starts for
the year has been reduced to just over 1 million.
The Economic Outlook for 2014
(Annual percent change) 2010 2011 2012 2013 2014
Real Gross Domestic Product 2.5 1.8 2.8 1.9 2.4
Total Nonfarm Employment -0.7 1.2 1.7 1.7 1.8
Accommodations and Food Services -0.2 2.7 3.2 3.5 2.5
Personal Services -0.7 0.6 1.3 0.6 0.8
Real Disposable Income 1.1 2.4 2.0 0.7 2.0
Real Personal Consumption 2.0 2.5 2.2 2.0 2.7
Food Services 1.4 4.1 3.4 2.5 1.6
Accommodations 2.4 3.6 4.7 4.7 3.8
Personal Services 0.7 0.9 1.5 -1.1 0.8
Retail Sales (nominal dollars) 5.5 7.5 5.1 4.2 3.2
Existing Home Sales -3.4 2.3 8.9 8.9 -2.2
Com'l & Indus. Loans Outstanding, Com'l.Banks -5.4 9.3 13.0 7.3 8.5
IHS Economics, May 2014 Forecast

IHS Economics Page 8 No portion of this report may be reproduced, reused, or otherwise distributed in any form without prior written consent.
OUTLOOK FOR FRANCHISE BUSINESS
Outlook Summary
Although franchise business activity in the first two months of the year was likely constrained by poor
weather, more recent data indicate that the pace of hiring by franchise businesses has picked up and
small business confidence is improving. We have boosted our forecasts of employment and output
growth of the franchise sector in 2014 by 0.2% and 0.1%, respectively. By most measures, the franchise
sector continues to grow at rates that exceed the economy-wide growth of industries where franchises
are concentrated.
With the more complete data for 2013 that are now available, we have also revised our estimates of the
franchise sector in 2013. Employment and output growth were both revised upward slightly and now
show 2013 growth rates of 2.5% and 4.6%, respectively.
We continue to project 2014 to be a stronger year than 2013 for the franchise sector, and franchises will
continue to outperform within their industries.
We expect a 1.7% increase in the number of franchise businesses in 2014, which is in line with
the growth of overall business formation across the economy.
We expect employment in franchise establishments to increase 2.6% in 2014 – exceeding the
2013 pace. Total private sector employment is projected to rise 2.1% in 2014.
The output of franchise establishments in nominal dollars will increase 4.8% in 2014 – up from
4.6% in 2013.
Franchise Business Economic Outlook: May 2014 Forecast
Forecast
(May 2014)
2007 2008 2009 2010 2011 2012 2013 2014
Establishments 770,835 774,016 746,646 740,098 736,114 747,359 757,503 770,069
Percent change 0.4% -3.5% -0.9% -0.5% 1.5% 1.4% 1.7%
Employment ('000) 7,994 8,028 7,800 7,780 7,940 8,127 8,327 8,548
Percent change 0.4% -2.8% -0.3% 2.1% 2.3% 2.5% 2.6%
Output ($Billions) 675 696 674 699 734 768 803 841
Percent change 3.2% -3.2% 3.6% 5.0% 4.7% 4.6% 4.8%
GDP ($Billions) 403 410 405 414 434 453 472 494
Percent change 1.8% -1.2% 2.2% 4.8% 4.4% 4.3% 4.6%
Estimates
IHS Economics Page 9 No portion of this report may be reproduced, reused, or otherwise distributed in any form without prior written consent.
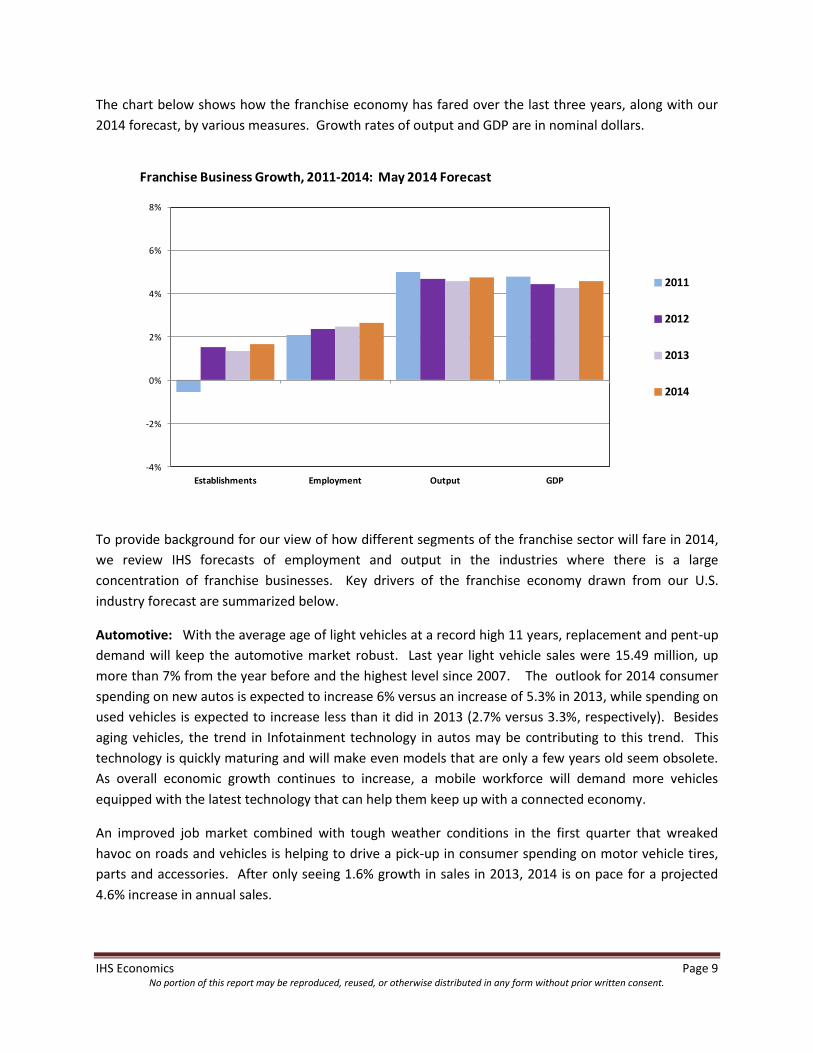
The chart below shows how the franchise economy has fared over the last three years, along with our
2014 forecast, by various measures. Growth rates of output and GDP are in nominal dollars.
To provide background for our view of how different segments of the franchise sector will fare in 2014,
we review IHS forecasts of employment and output in the industries where there is a large
concentration of franchise businesses. Key drivers of the franchise economy drawn from our U.S.
industry forecast are summarized below.
Automotive: With the average age of light vehicles at a record high 11 years, replacement and pent-up
demand will keep the automotive market robust. Last year light vehicle sales were 15.49 million, up
more than 7% from the year before and the highest level since 2007. The outlook for 2014 consumer
spending on new autos is expected to increase 6% versus an increase of 5.3% in 2013, while spending on
used vehicles is expected to increase less than it did in 2013 (2.7% versus 3.3%, respectively). Besides
aging vehicles, the trend in Infotainment technology in autos may be contributing to this trend. This
technology is quickly maturing and will make even models that are only a few years old seem obsolete.
As overall economic growth continues to increase, a mobile workforce will demand more vehicles
equipped with the latest technology that can help them keep up with a connected economy.
An improved job market combined with tough weather conditions in the first quarter that wreaked
havoc on roads and vehicles is helping to drive a pick-up in consumer spending on motor vehicle tires,
parts and accessories. After only seeing 1.6% growth in sales in 2013, 2014 is on pace for a projected
4.6% increase in annual sales.
-4%
-2%
0%
2%
4%
6%
8%
Establishments Employment Output GDP
2011
2012
2013
2014
Franchise Business Growth, 2011-2014: May 2014 Forecast

IHS Economics Page 10 No portion of this report may be reproduced, reused, or otherwise distributed in any form without prior written consent.
Spending on replacement parts and accessories for commercial vehicles will be limited by efforts to
replace an old fleet with new state-of-the art equipment. For major fleets, it just does not make
economic sense to continue to run old equipment that costs more and more to maintain, is subject to
more frequent breakdowns, and is less fuel efficient. However, with the economy developing a more
favorable tilt and freight flows and vocational market activities increasing, it will also behoove fleets and
individual owner operators to step up their equipment maintenance. With this as a backdrop, we
expect sales of commercial motor vehicle parts and accessories to expand steadily, albeit modestly, in
the years ahead.
Commercial and Residential Services: Residential construction remains in a strong recovery. Housing
starts in 2013 were 929,000 units – up from 783,000 in 2012. The pace of housing starts has slowed, but
starts in 2014 are still expected to be up 10% to 1.024 million units. Growth in nonresidential building
construction, in real terms, slowed to 1.3% in 2013 from an increase of 12.7% the year before. Look for
this year to see a 3.9% improvement. However, construction of commercial structures is expected to
grow by 7.2% this year. This will benefit architectural, project management and contracting firms. Once
put in place, it will also bolster activity among providers of facility support, building maintenance and
repair, and waste disposal services. Because of the strength of the residential and commercial
construction market, the output of franchise businesses in the commercial and residential services
business line expanded by 4.3% in 2013 and should grow at a faster-paced 4.8% in 2014.
Table/Full Service Restaurants: After strong increases of over 6% in both 2011 and 2012, consumer
spending on food services (food consumed away from home) increased by less than 5% in 2013. Full
service restaurant sales grew faster than quick service sales during 2011 and 2012, aided by the fact that
they cater more to upper-income consumers, who increased their economic position at faster rates
relative to middle- or lower-income consumers during these early years of the recovery when the
-24%
-18%
-12%
-6%
0%
6%
12%
18%
2008 2009 2010 2011 2012 2013 2014
Light Vehicles Sales Growth

IHS Economics Page 11 No portion of this report may be reproduced, reused, or otherwise distributed in any form without prior written consent.
unemployment rate was still above 8%. However, as the job market has improved at the lower end of
the spectrum, higher incomes have helped all consumers spend more on food away from home. In
2013, sales of full service restaurants industry-wide (franchise and non-franchise) were up only 2.0% in
2013, while quick service restaurant sales growth improved to 6.5%.
In 2014, full service restaurants are again expected to grow at a faster pace of 5.2%. This should help
sales for franchise full service restaurants, which are projected to grow 5.1% – up from 3.2% in 2013.
Quick Service Restaurants: Although quick service restaurants lagged behind full service establishments
in 2011-2012, this reversed in 2013. As the unemployment rate fell to 6.7% by year-end 2013 and
payroll employment increased 1.7%, both the output and employment of quick service restaurants
increased at a faster rate than full service restaurants. Within the franchise sector, we estimate that
quick service restaurant sales increased by 6.5% in 2013, while full service restaurant saw only a 3.2%
rise. In conjunction with the improving economy, the fast-growing fast-casual chains helped fuel this
trend reversal. These restaurants are meeting the demand for the more upscale food experience of
traditional full service restaurants, while still having the time-saving convenience of fast food service.
Employment at franchise quick service restaurants grew 3.5% in 2013, while table service restaurant
employment was up 1.6%. We expect the continued modest pace of employment and income growth,
particularly at the lower- and middle-income levels, to work in favor of quick service restaurants in 2014.
Employment gains in the overall economy should continue at a 1.8% rate in 2014, as the unemployment
rate is expected to fall to 6.5%. Franchise quick service restaurant sales in nominal dollars should see an
increase of 4.9% in 2014.
-4%
-2%
0%
2%
4%
6%
8%
10%
2009 2010 2011 2012 2013
Full Service Restaurants Quick Service Restaurants
Industry-wide Restaurant Sales Growth
IHS Economics Page 12 No portion of this report may be reproduced, reused, or otherwise distributed in any form without prior written consent.
Retail Food: Retail food sales overall (franchise and non-franchise) slowed from 3.2% growth in 2012 to
3.0% growth in 2013. This year an improving economy as well slightly higher food prices will see retail
food sales grow at an annual 3.8% clip. In line with sales forecast, top-line consumer spending on food to
be consumed at home increased 3.6% in 2012, but during 2013 it saw a significantly slower 2.4% growth
rate. Better economic conditions that provide consumers with a bit more disposable income (increasing
2.0% in 2014 after growth of only 0.7% in 2013) will help an increasingly health conscious population
afford a product mix that favors food choices that are often slightly higher priced. Total spending on
retail food is expected to increase by 3.8% during 2014.
Similarly, after increasing 3.2% in 2013, franchise sales in the retail food business line should grow by
3.7% in 2014.
Lodging: Consumer spending on accommodations increased 7.0% in 2012 and 6.2% during 2013.
Current low interest rates, an improving economy and traveler demand for more amenities while on the
road has spurred investment in hotels in recent years. This increase in supply should help mute overall
price increases and encourage travelers, who increasingly need to travel for business in a global
economy, to spend more in total on lodging. Consumer spending on lodging is slated to expand by 7.4%
in 2014.
Similarly, after increasing 3.7% in 2013, sales of the Lodging franchise business line should grow by 5.3%
in 2014.
Real Estate: Existing home sales were 4.7 million units in 2012, an 8.9% increase from the year before.
During 2013 5.1 million units were sold – another 8.9% increase. Single family new home sales were
368,000 during 2012, 20% higher than the year before. Last year, sales reached 430,000 – nearly 17%
more. Additionally, average existing single family home prices rose 5% in 2012 and more than 8% in
2013. New single family home prices rose over 8% during 2012 and 12% in 2013. These statistics reflect
a solid recovery of the real estate market. But since early fall of 2013, the pace of recovery has slowed
significantly, and growth rates of both sales volumes and prices are expected to be more moderate this
year. We expect new homes to see healthy growth of 8.6% in sales and 1.8% in average prices.
However, average existing home prices are expected to rise only 3.7%, and the volume of existing
homes sold is expected to contract 2.2% this year. Both of these indicators have been revised
downward since our March forecast.
In line with this slowdown of the housing market recovery, we expect sales of franchise businesses in
the Real Estate business line to slow from a pace near 8% in 2012-2013 to 5.6% in 2014.
Retail Products and Services: The Consumer Sentiment Index continues to improve from 76.5 in 2012
to 79.2 in 2013 and is expected to be at 85.5 for 2014. This rise in consumer confidence in the economy
should help bolster the retail products and service sector. However, the rise in sentiment will bolster
the automotive retail and full-service retail sectors the most in 2014. Department store chains will
continue to struggle, contracting 2.4% in 2014 after a 4.5% decline in 2013, as more and more retail
purchases are made online.
IHS Economics Page 13 No portion of this report may be reproduced, reused, or otherwise distributed in any form without prior written consent.
Sales among franchise businesses in the Retail Products and Services business line – after slowing a bit
from 4.2% growth in 2012 to 3.3% in 2013 – are expected to return to 4.2% growth in 2014.
Business Services: Cash balances are strong for most major corporations, but businesses remain
cautious when it comes to spending on both equipment and services. However, with economic growth
picking up, outdated equipment will feel the strain. Microsoft’s discontinuance of support for its XP
operating system this past spring, along with the growth in the Cloud service technology sector, will also
help accelerate demand for equipment and service upgrades, rather than continuing to take a wait-and-
see approach. Additionally, with the modest expansion in manufacturing and other business activities
anticipated for this year, and expectations for capital expenditure programs to pick-up, there should be
a wide range of business services set to see gains. Services, such as legal, accounting, architectural and
engineering, computer systems design, management and technical consulting, scientific research and
development and advertising and related services, should all see a pick-up in growth this year. Those
businesses servicing the residential construction, motor vehicle, and unconventional energy industries
are likely to post the strongest sales gains in 2014.
Franchise business services output grew 3.9% in 2013, following a 3.8% increase in 2012. Output growth
is slated to jump to 5.1% in 2014.
Personal Services: Employment and income are the primary drivers behind the demand for personal
services. Despite a slow recovery in these areas, encouragement exists in the fact that growth still
continues to improve at a steady pace. Unemployment averaged 7.4% last year – still high, but a
marked improvement from 2010, when unemployment hovered around 10%. Employment this year is
expected to grow by 1.8%, 0.1 percentage points faster than last year. Additionally, personal income is
expected to grow 3.8% this year after growing 2.8% last year. These trends will help increase demand
for personal services as more individuals shift from producing their own services to working away from
home and contracting with others for those services. The housing market and durable goods (e.g.,
autos) have captured most of the attention of the consumer during the recovery, while consumer
spending on services, on a current dollar basis, grew at a slower rate in 2013 – 3.8% in 2012 and 3.2%
during 2013. We expect top-line consumer services spending to increase by 4.8% in 2014. Spending on
many categories of personal services economy-wide fell in 2013 but will share in the improved growth
outlook for 2014.
We estimate that franchise-operated personal service business revenue expanded by 3.2% in 2013,
following a 3.8% increase in 2012. Revenues are set to expand by 3.7% in 2014.
IHS Economics Page 14 No portion of this report may be reproduced, reused, or otherwise distributed in any form without prior written consent.
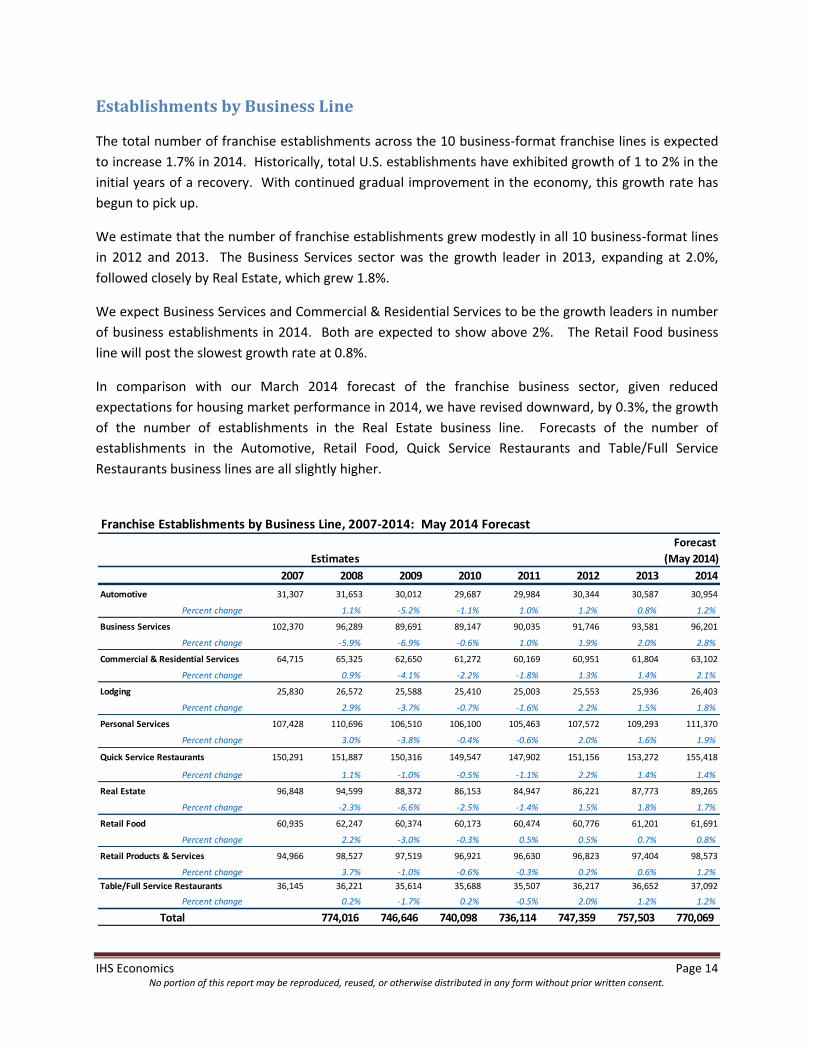
Establishments by Business Line
The total number of franchise establishments across the 10 business-format franchise lines is expected
to increase 1.7% in 2014. Historically, total U.S. establishments have exhibited growth of 1 to 2% in the
initial years of a recovery. With continued gradual improvement in the economy, this growth rate has
begun to pick up.
We estimate that the number of franchise establishments grew modestly in all 10 business-format lines
in 2012 and 2013. The Business Services sector was the growth leader in 2013, expanding at 2.0%,
followed closely by Real Estate, which grew 1.8%.
We expect Business Services and Commercial & Residential Services to be the growth leaders in number
of business establishments in 2014. Both are expected to show above 2%. The Retail Food business
line will post the slowest growth rate at 0.8%.
In comparison with our March 2014 forecast of the franchise business sector, given reduced
expectations for housing market performance in 2014, we have revised downward, by 0.3%, the growth
of the number of establishments in the Real Estate business line. Forecasts of the number of
establishments in the Automotive, Retail Food, Quick Service Restaurants and Table/Full Service
Restaurants business lines are all slightly higher.
Franchise Establishments by Business Line, 2007-2014: May 2014 Forecast
Forecast
Estimates (May 2014)
2007 2008 2009 2010 2011 2012 2013 2014
Automotive 31,307 31,653 30,012 29,687 29,984 30,344 30,587 30,954
Percent change 1.1% -5.2% -1.1% 1.0% 1.2% 0.8% 1.2%
Business Services 102,370 96,289 89,691 89,147 90,035 91,746 93,581 96,201
Percent change -5.9% -6.9% -0.6% 1.0% 1.9% 2.0% 2.8%
Commercial & Residential Services 64,715 65,325 62,650 61,272 60,169 60,951 61,804 63,102
Percent change 0.9% -4.1% -2.2% -1.8% 1.3% 1.4% 2.1%
Lodging 25,830 26,572 25,588 25,410 25,003 25,553 25,936 26,403
Percent change 2.9% -3.7% -0.7% -1.6% 2.2% 1.5% 1.8%
Personal Services 107,428 110,696 106,510 106,100 105,463 107,572 109,293 111,370
Percent change 3.0% -3.8% -0.4% -0.6% 2.0% 1.6% 1.9%
Quick Service Restaurants 150,291 151,887 150,316 149,547 147,902 151,156 153,272 155,418
Percent change 1.1% -1.0% -0.5% -1.1% 2.2% 1.4% 1.4%
Real Estate 96,848 94,599 88,372 86,153 84,947 86,221 87,773 89,265
Percent change -2.3% -6.6% -2.5% -1.4% 1.5% 1.8% 1.7%
Retail Food 60,935 62,247 60,374 60,173 60,474 60,776 61,201 61,691
Percent change 2.2% -3.0% -0.3% 0.5% 0.5% 0.7% 0.8%
Retail Products & Services 94,966 98,527 97,519 96,921 96,630 96,823 97,404 98,573
Percent change 3.7% -1.0% -0.6% -0.3% 0.2% 0.6% 1.2%
Table/Full Service Restaurants 36,145 36,221 35,614 35,688 35,507 36,217 36,652 37,092
Percent change 0.2% -1.7% 0.2% -0.5% 2.0% 1.2% 1.2%
Total 774,016 746,646 740,098 736,114 747,359 757,503 770,069

IHS Economics Page 15 No portion of this report may be reproduced, reused, or otherwise distributed in any form without prior written consent.
Employment by Business Line
All 10 business-format franchise lines posted gains in employment over each of the last three years, and
we expect this pattern to continue in 2014. Total franchise employment in 2013 was revised up by 0.1%,
primarily due to upward revisions in the Business Services and Personal Services business lines. We
estimate total franchise employment grew 2.5% in 2013, and we expect a 2.6% increase in 2014. As the
chart on the following page depicts, franchise employment growth has gradually accelerated over the
last three years.
The Quick Service Restaurants business line led franchise employment growth in the last two years, with
3.2% growth in 2012 and 3.5% in 2013. We expect QSR employment growth to slow to 2.8% in 2014 and
be surpassed by both the Business Services (3.9%) and Commercial and Residential Services (3.2%)
business lines. Employment growth in the Table/Full Service Restaurants business line slowed to 1.6% in
2013, but we expect its employment to pick up to 2.4% in 2014.
We have revised our 2014 forecast of employment growth in the Real Estate business line downward by
0.3%. But recent employment trends have led us to boost 2014 growth rates compared to our March
forecast for several business lines, including Automotive, Business Services, Retail Food, and both
restaurant business lines.
-4%
-3%
-2%
-1%
0%
1%
2%
3%
4%
2008 2009 2010 2011 2012 2013 2014
Franchise Business Establishments Growth: May 2014 Forecast

IHS Economics Page 16 No portion of this report may be reproduced, reused, or otherwise distributed in any form without prior written consent.
Franchise Employment by Business Line, 2007-2014: March 2014 Forecast
Forecast
Estimates (May 2014)
2007 2008 2009 2010 2011 2012 2013 2014
Automotive 181,845 184,826 174,889 173,546 177,885 180,198 183,081 188,024
Percent change 1.6% -5.4% -0.8% 2.5% 1.3% 1.6% 2.7%
Business Services 1,016,222 955,080 889,721 874,087 883,702 903,143 928,431 964,640
Percent change -6.0% -6.8% -1.8% 1.1% 2.2% 2.8% 3.9%
Commercial & Residential Services 354,940 357,475 343,531 336,317 342,034 347,849 355,502 366,878
Percent change 0.7% -3.9% -2.1% 1.7% 1.7% 2.2% 3.2%
Lodging 677,744 696,878 671,702 674,953 691,827 699,437 706,431 721,266
Percent change 2.8% -3.6% 0.5% 2.5% 1.1% 1.0% 2.1%
Personal Services 623,315 642,204 618,069 622,864 635,321 647,392 661,635 678,176
Percent change 3.0% -3.8% 0.8% 2.0% 1.9% 2.2% 2.5%
Quick Service Restaurants 2,888,554 2,919,701 2,887,550 2,882,638 2,951,821 3,046,279 3,152,899 3,241,180
Percent change 1.1% -1.1% -0.2% 2.4% 3.2% 3.5% 2.8%
Real Estate 323,974 316,969 295,954 290,329 294,974 301,168 308,697 314,562
Percent change -2.2% -6.6% -1.9% 1.6% 2.1% 2.5% 1.9%
Retail Food 472,945 483,138 468,868 468,172 473,790 481,844 488,108 496,894
Percent change 2.2% -3.0% -0.1% 1.2% 1.7% 1.3% 1.8%
Retail Products & Services 452,929 468,973 464,036 468,883 476,385 483,531 489,817 498,144
Percent change 3.5% -1.1% 1.0% 1.6% 1.5% 1.3% 1.7%
Table/Full Service Restaurants 1,001,184 1,003,208 985,999 988,044 1,012,745 1,036,038 1,052,615 1,077,878
Percent change 0.2% -1.7% 0.2% 2.5% 2.3% 1.6% 2.4%
Total 7,993,651 8,028,452 7,800,319 7,779,833 7,940,484 8,126,879 8,327,216 8,547,642
-4%
-2%
0%
2%
4%
6%
2008 2009 2010 2011 2012 2013 2014
Franchise Business Employment Growth: May 2014 Forecast

IHS Economics Page 17 No portion of this report may be reproduced, reused, or otherwise distributed in any form without prior written consent.
Output by Business Line
All 10 franchise business lines posted output gains in each of the last three years, led by Real Estate
which had an average annual increase of 7.9% in 2012-2013. We have revised our 2014 output forecast
for the Real Estate business line down 0.2% compared to our March forecast, but it remains the output
growth leader in 2014 with a 5.6% gain. The Lodging and Business Services business lines are both
expected to see a pick-up in growth in 2014, and they will rank second and third, respectively, in output
growth.
The Table/Full Service Restaurants franchise business line was a strong performer in 2011 and 2012,
with growth averaging over 6%, but the Quick Service Restaurants business line moved ahead in 2013
with output growth of 6.5%. We do not expect the QSR business line to repeat this rapid output growth
in 2014, although its employment gains will continue to be strong. We now expect both franchise
restaurant business lines to have output growth near 5% in 2014.
Eight of the 10 franchise business lines will show acceleration in output growth in 2014 compared with
2013, with growth slowing only in the Real Estate and Quick Service Restaurants business lines.
Franchise Output by Business Line, 2007-2014: May 2014 Forecast
Forecast
Estimates (May 2014)
($billions) 2007 2008 2009 2010 2011 2012 2013 2014
Automotive 30.21 33.59 31.16 33.56 36.32 37.62 38.72 40.23
Percent change 11.2% -7.2% 7.7% 8.2% 3.6% 2.9% 3.9%
Business Services 131.77 134.09 128.62 132.61 137.38 142.60 148.16 155.72
Percent change 1.8% -4.1% 3.1% 3.6% 3.8% 3.9% 5.1%
Commercial & Residential Services 45.00 48.42 46.32 46.55 48.23 50.20 52.36 54.88
Percent change 7.6% -4.3% 0.5% 3.6% 4.1% 4.3% 4.8%
Lodging 65.26 67.98 62.79 67.62 72.83 75.82 78.62 82.79
Percent change 4.2% -7.6% 7.7% 7.7% 4.1% 3.7% 5.3%
Personal Services 74.29 76.18 74.43 77.85 82.29 85.42 88.15 91.41
Percent change 2.5% -2.3% 4.6% 5.7% 3.8% 3.2% 3.7%
Quick Service Restaurants 164.67 171.41 173.55 179.51 187.48 197.23 210.05 220.34
Percent change 4.1% 1.2% 3.4% 4.4% 5.2% 6.5% 4.9%
Real Estate 52.62 49.12 44.83 42.18 42.82 46.16 49.85 52.64
Percent change -6.7% -8.7% -5.9% 1.5% 7.8% 8.0% 5.6%
Retail Food 31.80 34.66 31.92 34.12 36.47 37.75 38.96 40.40
Percent change 9.0% -7.9% 6.9% 6.9% 3.5% 3.2% 3.7%
Retail Products & Services 30.11 31.59 31.89 34.19 36.41 37.94 39.19 40.84
Percent change 4.9% 1.0% 7.2% 6.5% 4.2% 3.3% 4.2%
Table/Full Service Restaurants 48.79 49.20 48.78 50.64 53.48 57.22 59.05 62.06
Percent change 0.8% -0.8% 3.8% 5.6% 7.0% 3.2% 5.1%
Total 696.24 674.30 698.84 733.71 767.97 803.12 841.31
IHS Economics Page 18 No portion of this report may be reproduced, reused, or otherwise distributed in any form without prior written consent.
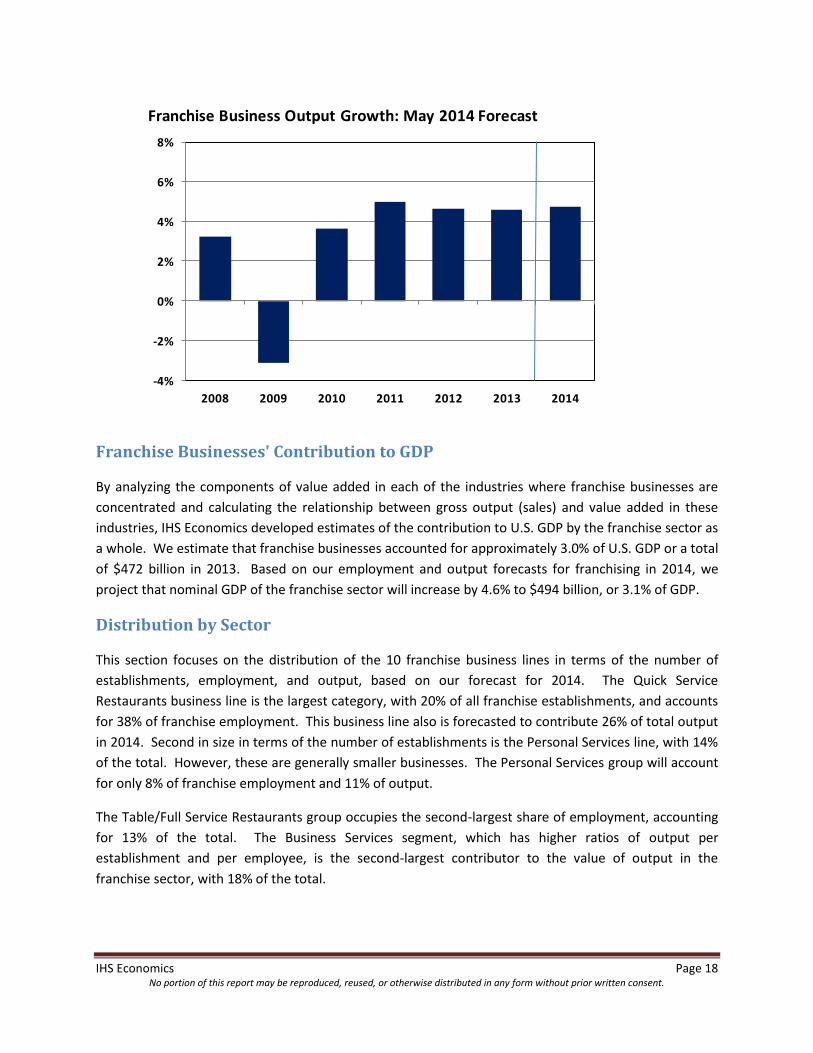
Franchise Businesses' Contribution to GDP
By analyzing the components of value added in each of the industries where franchise businesses are
concentrated and calculating the relationship between gross output (sales) and value added in these
industries, IHS Economics developed estimates of the contribution to U.S. GDP by the franchise sector as
a whole. We estimate that franchise businesses accounted for approximately 3.0% of U.S. GDP or a total
of $472 billion in 2013. Based on our employment and output forecasts for franchising in 2014, we
project that nominal GDP of the franchise sector will increase by 4.6% to $494 billion, or 3.1% of GDP.
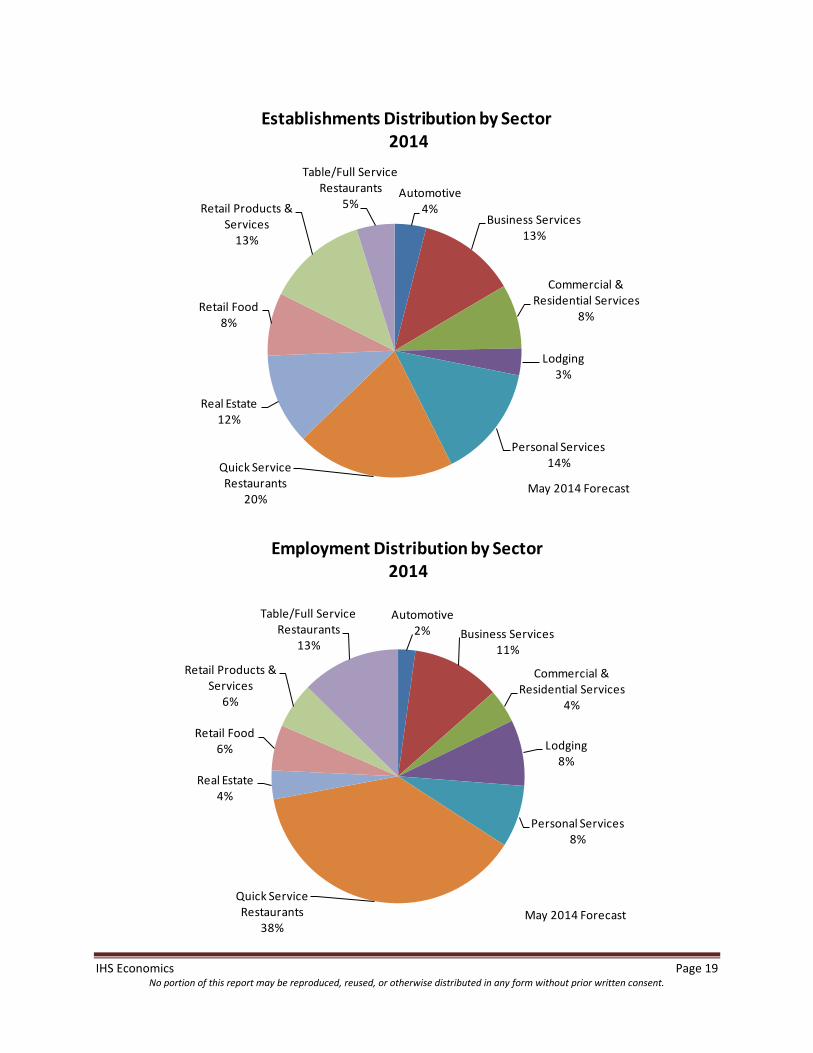
Distribution by Sector
This section focuses on the distribution of the 10 franchise business lines in terms of the number of
establishments, employment, and output, based on our forecast for 2014. The Quick Service
Restaurants business line is the largest category, with 20% of all franchise establishments, and accounts
for 38% of franchise employment. This business line also is forecasted to contribute 26% of total output
in 2014. Second in size in terms of the number of establishments is the Personal Services line, with 14%
of the total. However, these are generally smaller businesses. The Personal Services group will account
for only 8% of franchise employment and 11% of output.
The Table/Full Service Restaurants group occupies the second-largest share of employment, accounting
for 13% of the total. The Business Services segment, which has higher ratios of output per
establishment and per employee, is the second-largest contributor to the value of output in the
franchise sector, with 18% of the total.
-4%
-2%
0%
2%
4%
6%
8%
2008 2009 2010 2011 2012 2013 2014
Franchise Business Output Growth: May 2014 Forecast
IHS Economics Page 19 No portion of this report may be reproduced, reused, or otherwise distributed in any form without prior written consent.
Automotive4%
Business Services13%
Commercial & Residential Services
8%
Lodging3%
Personal Services14%Quick Service
Restaurants20%
Real Estate12%
Retail Food8%
Retail Products & Services
13%
Table/Full Service Restaurants
5%
Establishments Distribution by Sector2014
May 2014 Forecast
Automotive2% Business Services
11%
Commercial & Residential Services
4%
Lodging8%
Personal Services8%
Quick Service Restaurants
38%
Real Estate4%
Retail Food6%
Retail Products & Services
6%
Table/Full Service Restaurants
13%
Employment Distribution by Sector2014
May 2014 Forecast

IHS Economics Page 20 No portion of this report may be reproduced, reused, or otherwise distributed in any form without prior written consent.
Output per Employee
On average, output per employee in franchise businesses is estimated to be $96,446 per worker in 2013
and is forecast to grow to $98,426 in 2014. This output-per-worker ratio varies within the 10 franchise
business lines from a low of $57,580 (Table/Full Service Restaurants) to a high of $213,936 (Automotive)
in 2014.
The average output per worker in the franchise sector has grown since 2007, and will continue to rise
through 2014, increasing at a compound annual growth rate of 2.2% since 2007. The productivity
pattern of franchise businesses during and after the recession is consistent with other U.S. industries,
where revenues initially fell at a greater rate than worker lay-offs, and later rose at a faster pace
because employers started to rehire workers only slowly. In 2009, the average productivity dipped
slightly amidst the global recession, but then rose by nearly 4% in 2010. We estimate that franchise
sector productivity gained 2.9% in 2011 and 2.3% in 2012. Productivity growth continued to show
modest gains in 2013 with a 2.1% increase, and is forecast to grow 2.1% in 2014. The Automotive
business line is the fastest-growing segment in terms of output per worker, with a compound annual
growth rate of 4.1% during the period 2007-2013. The Real Estate sector recovered the slowest through
2013, but gained 5.6% in 2012 and 5.4% in 2013.
Automotive5%
Business Services18%
Commercial & Residential Services
7%
Lodging10%
Personal Services11%
Quick Service Restaurants
26%
Real Estate6%
Retail Food5%
Retail Products & Services
5%
Table/Full Service Restaurants
7%
Output Distribution by Sector2014
May 2014 Forecast

IHS Economics Page 21 No portion of this report may be reproduced, reused, or otherwise distributed in any form without prior written consent.
Franchise Productivity by Business Line, 2007-2014: May Forecast
Forecast
Estimates (May 2014)
(Dollars per worker) 2007 2008 2009 2010 2011 2012 2013 2014
Automotive 166,120 181,720 178,197 193,404 204,158 208,793 211,465 213,936
Percent change 9.4% -1.9% 8.5% 5.6% 2.3% 1.3% 1.2%
Business Services 129,668 140,397 144,563 151,710 155,461 157,895 159,585 161,428
Percent change 8.3% 3.0% 4.9% 2.5% 1.6% 1.1% 1.2%
Commercial & Residential Services 126,786 135,461 134,835 138,416 141,002 144,329 147,295 149,578
Percent change 6.8% -0.5% 2.7% 1.9% 2.4% 2.1% 1.6%
Lodging 96,285 97,543 93,477 100,190 105,273 108,397 111,294 114,782
Percent change 1.3% -4.2% 7.2% 5.1% 3.0% 2.7% 3.1%
Personal Services 119,192 118,627 120,430 124,994 129,528 131,943 133,234 134,794
Percent change -0.5% 1.5% 3.8% 3.6% 1.9% 1.0% 1.2%
Quick Service Restaurants 57,009 58,707 60,102 62,273 63,514 64,745 66,622 67,983
Percent change 3.0% 2.4% 3.6% 2.0% 1.9% 2.9% 2.0%
Real Estate 162,432 154,972 151,469 145,293 145,151 153,254 161,478 167,341
Percent change -4.6% -2.3% -4.1% -0.1% 5.6% 5.4% 3.6%
Retail Food 67,241 71,730 68,074 72,879 76,984 78,347 79,816 81,306
Percent change 6.7% -5.1% 7.1% 5.6% 1.8% 1.9% 1.9%
Retail Products & Services 66,485 67,368 68,733 72,920 76,437 78,470 80,019 81,986
Percent change 1.3% 2.0% 6.1% 4.8% 2.7% 2.0% 2.5%
Table/Full Service Restaurants 48,736 49,042 49,477 51,248 52,805 55,231 56,101 57,580
Percent change 0.6% 0.9% 3.6% 3.0% 4.6% 1.6% 2.6%
Total 84,384 86,721 86,445 89,827 92,401 94,497 96,446 98,426

IHS Economics Page 22 No portion of this report may be reproduced, reused, or otherwise distributed in any form without prior written consent.
APPENDIX
Composition of Franchise Business Lines
1. Automotive: Includes motor-vehicle parts and supply stores, tire dealers, automotive equipment
rental and leasing, and automotive repair and maintenance.
2. Commercial and Residential Services: Includes building, developing, and general contracting; heavy
construction; special trade contractors; facilities support services; services to buildings and dwellings;
and waste management and remediation services.
3. Quick Service Restaurants: Includes limited-service eating places, cafeterias, fast-food restaurants,
beverage bars, ice cream parlors, pizza-delivery establishments, carryout sandwich shops, and carryout
service shops with on-premises baking of donuts, cookies, and bagels.
4. Table/Full Service Restaurants: Establishments primarily engaged in providing food services to
patrons who order and are served while seated (i.e., waiter/waitress services) and pay after eating
5. Retail Food: Includes food and beverage stores; convenience stores; food-service contractors;
caterers; retail bakeries; and beer, wine, and liquor stores; as well as gas stations with convenience
stores.
6. Lodging: Includes hotels, motels, and other accommodations.
7. Real Estate: Includes lessors of buildings, self-storage units, and other real estate; real estate agents
and brokers; and property management and other related activities.
8. Retail Products and Services: Includes furniture and home furnishings stores, electronics and
appliance stores, building-material and garden-equipment and supplies dealers, health and personal-
care stores, clothing and general merchandise stores, florists and gift stores, consumer-goods rentals,
photographic services, and book and music stores.
9. Business Services: Includes printing, business transportation, warehousing and storage, data-
processing services, insurance agencies and brokerages, office administrative services, employment
services, investigation and security services, tax-preparation and payroll services, and heavy equipment
leasing.
10. Personal Services: Includes educational services, health care, entertainment and recreation,
personal and laundry services, veterinary services, loan brokers, credit intermediation and related
activities, and personal transportation.
IHS Economics Page 23 No portion of this report may be reproduced, reused, or otherwise distributed in any form without prior written consent.
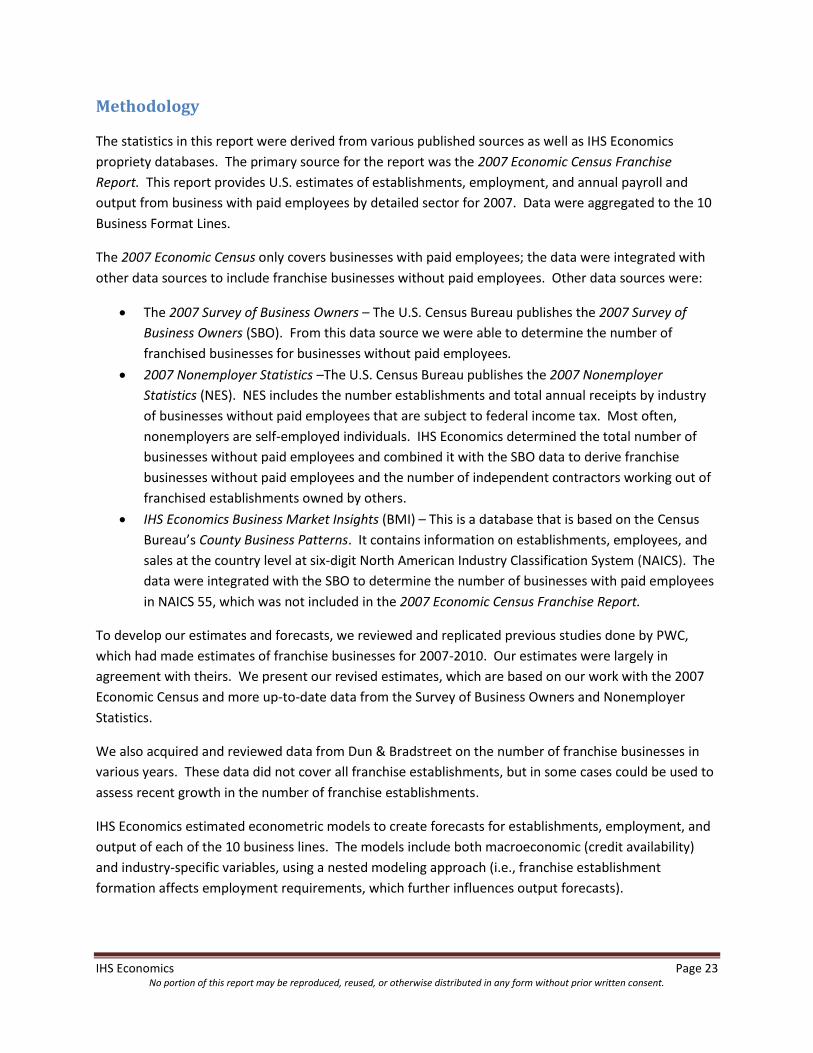
Methodology
The statistics in this report were derived from various published sources as well as IHS Economics
propriety databases. The primary source for the report was the 2007 Economic Census Franchise
Report. This report provides U.S. estimates of establishments, employment, and annual payroll and
output from business with paid employees by detailed sector for 2007. Data were aggregated to the 10
Business Format Lines.
The 2007 Economic Census only covers businesses with paid employees; the data were integrated with
other data sources to include franchise businesses without paid employees. Other data sources were:
The 2007 Survey of Business Owners – The U.S. Census Bureau publishes the 2007 Survey of
Business Owners (SBO). From this data source we were able to determine the number of
franchised businesses for businesses without paid employees.
2007 Nonemployer Statistics –The U.S. Census Bureau publishes the 2007 Nonemployer
Statistics (NES). NES includes the number establishments and total annual receipts by industry
of businesses without paid employees that are subject to federal income tax. Most often,
nonemployers are self-employed individuals. IHS Economics determined the total number of
businesses without paid employees and combined it with the SBO data to derive franchise
businesses without paid employees and the number of independent contractors working out of
franchised establishments owned by others.
IHS Economics Business Market Insights (BMI) – This is a database that is based on the Census
Bureau’s County Business Patterns. It contains information on establishments, employees, and
sales at the country level at six-digit North American Industry Classification System (NAICS). The
data were integrated with the SBO to determine the number of businesses with paid employees
in NAICS 55, which was not included in the 2007 Economic Census Franchise Report.
To develop our estimates and forecasts, we reviewed and replicated previous studies done by PWC,
which had made estimates of franchise businesses for 2007-2010. Our estimates were largely in
agreement with theirs. We present our revised estimates, which are based on our work with the 2007
Economic Census and more up-to-date data from the Survey of Business Owners and Nonemployer
Statistics.
We also acquired and reviewed data from Dun & Bradstreet on the number of franchise businesses in
various years. These data did not cover all franchise establishments, but in some cases could be used to
assess recent growth in the number of franchise establishments.
IHS Economics estimated econometric models to create forecasts for establishments, employment, and
output of each of the 10 business lines. The models include both macroeconomic (credit availability)
and industry-specific variables, using a nested modeling approach (i.e., franchise establishment
formation affects employment requirements, which further influences output forecasts).