frank mobley, phd · send comments regarding this burden estimate or any other aspect of this...
TRANSCRIPT
AFRL-RH-WP-TR-2017-0043
DE-DOPPLERIZATION OF ACOUSTIC MEASUREMENTS
Frank Mobley, PhD
711 HPW/RHCB Wright-Patterson AFB OH
August 2017
Interim Report
DISTRIBUTION STATEMENT A. Approved for public release: distribution unlimited.
STINFO COPY
AIR FORCE RESEARCH LABORATORY
711 HUMAN PERFORMANCE WING, AIRMAN SYSTEMS DIRECTORATE,
WRIGHT-PATTERSON AIR FORCE BASE, OH 45433 AIR FORCE MATERIEL COMMAND
UNITED STATES AIR FORCE
NOTICE AND SIGNATURE PAGE
Using Government drawings, specifications, or other data included in this document for any purpose other than Government procurement does not in any way obligate the U.S. specifications, or other data does not license the holder or any other person or corporation: or convey any rights or permission to manufacture, use, or sell any patented invention that may relate to them.
This report was cleared for public release by the 88th Air Base Wing Public Affairs Office and is available to the general public, including foreign nationals. Copies may be obtained from the Defense Technical Information Center (DTIC) (http://www.dtic.mil).
AFRL-RH-WP-TR-2017-0043 HAS BEEN REVIEWED AND IS APPROVED FOR PUBLICATION IN ACCORDANCE WITH ASSIGNED DISTRIBUTION STATEMENT.
//signed// //signed// JOHN HALL DAVID PANBOON, MAJOR, USAF Program Manager Chief, Battlespace Acoustics Branch Battlespace Acoustics Branch Warfighter Interface Division //signed// KRISTOFFER A. SMITH-RODRIQUEZ, LTCOL, USAF Acting Chief, Warfighter Interface Division Airman Systems Directorate 711 Human Performance Wing
This report is published in the interest of scientific and technical information exchange, and its publication does not constitute the Government’s approval or disapproval of its ideas or findings.
REPORT DOCUMENTATION PAGE Form Approved OMB No. 0704-0188
The public reporting burden for this collection of information is estimated to average 1 hour per response, including the time for reviewing instructions, searching existing data sources, searching existing data sources, gathering and maintaining the data needed, and completing and reviewing the collection of information. Send comments regarding this burden estimate or any other aspect of this collection of information, including suggestions for reducing this burden, to Department of Defense, Washington Headquarters Services, Directorate for Information Operations and Reports (0704-0188), 1215 Jefferson Davis Highway, Suite 1204, Arlington, VA 22202-4302. Respondents should be aware that notwithstanding any other provision of law, no person shall be subject to any penalty for failing to comply with a collection of information if it does not display a currently valid OMB control number. PLEASE DO NOT RETURN YOUR FORM TO THE ABOVE ADDRESS.
1. REPORT DATE (DD-MM-YY) 2. REPORT TYPE 3. DATES COVERED (From - To) 10-08-2017 Interim 26 June 2016 – 17 July 2107
4. TITLE AND SUBTITLE DE-DOPPLERIZATION OF ACOUSTIC MEASUREMENTS
5a. CONTRACT NUMBER In-House
5b. GRANT NUMBER 5c. PROGRAM ELEMENT NUMBER
63456F/635327 6. AUTHOR(S)
Frank Mobley 5d. PROJECT NUMBER
5e. TASK NUMBER
5f. WORK UNIT NUMBER
H0P3 (53271604) 7. PERFORMING ORGANIZATION NAME(S) AND ADDRESS(ES) 8. PERFORMING ORGANIZATION
711 HPW/RHCB 2610 Seventh Street Wright-Patterson AFB OH 45433
REPORT NUMBER
9. SPONSORING/MONITORING AGENCY NAME(S) AND ADDRESS(ES) 10. SPONSORING/MONITORING Air Force Materiel Command Air Force Research Laboratory 711 Human Performance Wing Airman Systems Directorate Warfighter Interface Division Battlespace Acoustics Branch Wright-Patterson Air Force Base, OH 45433
AGENCY ACRONYM(S) 711 HPW/RHCB 11. SPONSORING/MONITORING AGENCY REPORT NUMBER(S) AFRL-RH-WP-TR-2017-0043
12. DISTRIBUTION/AVAILABILITY STATEMENT DISTRIBUTION STATEMENT A. Approved for public release: distribution unlimited.
13. SUPPLEMENTARY NOTES 88 ABW Cleared 05/22/2017; 88ABW-2017-2524. This is an In-House report developed under an In-House contract for topic De-Doppleization of Acoustic Measurements. Report contains color.
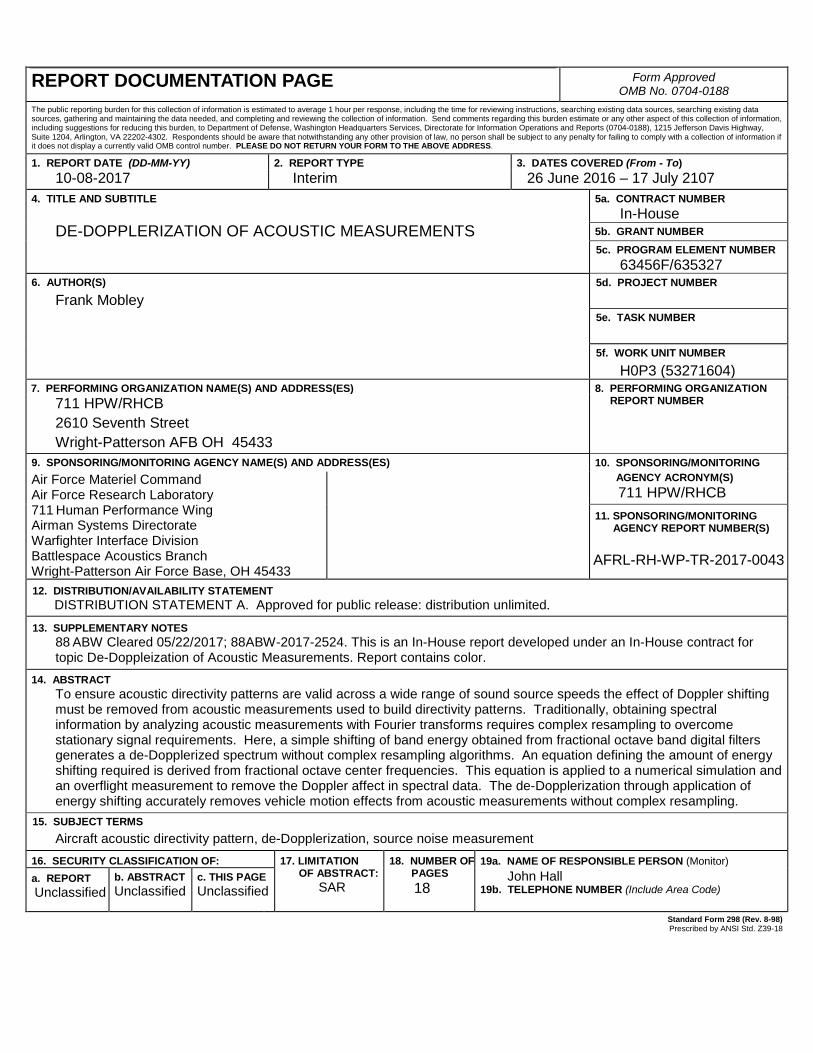
14. ABSTRACT To ensure acoustic directivity patterns are valid across a wide range of sound source speeds the effect of Doppler shifting must be removed from acoustic measurements used to build directivity patterns. Traditionally, obtaining spectral information by analyzing acoustic measurements with Fourier transforms requires complex resampling to overcome stationary signal requirements. Here, a simple shifting of band energy obtained from fractional octave band digital filters generates a de-Dopplerized spectrum without complex resampling algorithms. An equation defining the amount of energy shifting required is derived from fractional octave center frequencies. This equation is applied to a numerical simulation and an overflight measurement to remove the Doppler affect in spectral data. The de-Dopplerization through application of energy shifting accurately removes vehicle motion effects from acoustic measurements without complex resampling.
15. SUBJECT TERMS Aircraft acoustic directivity pattern, de-Dopplerization, source noise measurement
16. SECURITY CLASSIFICATION OF: 17. LIMITATION OF ABSTRACT:
SAR
18. NUMBER OF PAGES
18
19a. NAME OF RESPONSIBLE PERSON (Monitor) a. REPORT Unclassified
b. ABSTRACT Unclassified
c. THIS PAGE Unclassified
John Hall 19b. TELEPHONE NUMBER (Include Area Code)
Standard Form 298 (Rev. 8-98)
Prescribed by ANSI Std. Z39-18
i
Table of Contents
LIST OF FIGURES ...........................................................................................................ii 1 INTRODUCTION .......................................................................................................... 2
2 FRACTIONAL OCTAVE BAND SHIFTING (FOBS) ..................................................... 3
2.1 Definition of Doppler shift frequency ...................................................................... 3
2.2 Definition of Fractional Octave Band Shifting ........................................................ 4
3 VALIDATION OF FOBS ............................................................................................... 6
3.1 Simulated acoustic source motion ......................................................................... 6
3.2 de-Dopplerization of acoustic measurements ........................................................ 7
4 DISCUSSION ............................................................................................................. 10
5 CONCLUSIONS ......................................................................................................... 11
6 References ................................................................................................................. 12
ii
LIST OF FIGURES
FIGURE 1. FOBS DUE TO OVERFLIGHT CONDITIONS ............................................................. 6 FIGURE 2. CONTROL DATA FOR THE SIMULATION, WITHOUT THE DOPPLER SHIFT MODIFYING THE
FREQUENCY OF THE SIMULATED SOURCE ...................................................................... 8 FIGURE 3. RESULTANT SPECTROGRAM FROM 500 HZ ACOUSTIC SIMULATION ......................... 8 FIGURE 4. CORRECTED SOUND PRESSURE LEVEL FOR 500 HZ OF THE ACOUSTIC SIMULATION . 9 FIGURE 5. THE ORIGINAL SPECTROGRAM FROM THE UH-1 I MEASUREMENT (A) AND THE FOBS
CORRECTED SPECTROGRAM (B) ................................................................................... 9 FIGURE 6. DIFFERENCE BETWEEN THE CONTROL 500 HZ TRACE AND FOBS 500 HZ TRACE
OVER THE SIMULATION TIME ....................................................................................... 10 FIGURE 7. COMPARISON OF THE ∆𝑛𝑛 AND THE LIMITS ON THE LINEAR COEFFICIENTS .............. 11
1 DISTRIBUTION STATEMENT A. Approved for public release. Cleared, 88PA, Case #2017-2524.
Summary
To ensure acoustic directivity patterns are valid across a wide range of sound source speeds the effect of Doppler shifting must be removed from acoustic measurements used to build directivity patterns. Traditionally, obtaining spectral information by analyzing acoustic measurements with Fourier transforms requires complex resampling to overcome stationary signal requirements. Here, a simple shifting of band energy obtained from fractional octave band digital filters generates a de-Dopplerized spectrum without complex resampling algorithms. An equation defining the amount of energy shifting required is derived from fractional octave center frequencies. This equation is applied to a numerical simulation and an overflight measurement to remove the Doppler affect in spectral data. The de-Dopplerization through application of energy shifting accurately removes vehicle motion effects from acoustic measurements without complex resampling.
2 DISTRIBUTION STATEMENT A. Approved for public release. Cleared, 88PA, Case #2017-2524.
1 INTRODUCTION
Construction of directivity patterns for acoustic emissions of airborne aircraft has been studied1–6. Within spherical harmonic noise directivity pattern descriptions, no investigation of Doppler shifting is presented and the directivity patterns are only valid for the airspeeds at which the pattern is measured. In order to provide a more general description of the acoustic directivity patterns, de-Dopplerization is explored, specifically for application with spherical harmonic directivity patterns.
Doppler shifting is a well-known frequency modification effect observed whenever an object emitting periodic energy is moving relative to an observer. Morse provided a detailed discussion of the effects of the Doppler shift on sound energy7 resulting in two conditions: 1) compression of wavefronts leading to a higher observed frequency; and 2) expansion of wavefronts leading to a lower observed frequency. These two phenomena were classified by the rate of change of the direction vector pointing from the source to the observer8. If the vector length is shrinking, the wavefronts are compressing. Conversely, if the vector length is increasing the wavefronts are expanding. No Doppler shift is observed if the vector length is constant. The compression and expansion of the wavefronts occur due to motion of the observer or the acoustic source, but this analysis examines only the stationary observer case.
Previous efforts using a fixed array to record acoustic emissions, resulting from the motion of the acoustic source only, have been reported9–17. A number of techniques were previously used to remove Doppler effects from acoustic measurements. Among the most common method is a complex resampling of the acoustic waveform to preserve the ability to employ narrow band Fourier analysis11.
In each of these instances, the determination of the sound pressure level (SPL) or power spectral density (PSD) is accomplished through a Fourier transform. Due to the coarseness of the fractional octave representation and smearing that occurs within the spectrum11, digital filtering techniques were not considered by these earlier applications. Fourier transform methods assume a stationary signal18,19, and the motion of the acoustic source violates that assumption. Use of Fourier transform methods require a time corrected signal9,11,12,15,19–21. The general tenet of these methods is a sliding adjustment to the measured signal’s sample rate.
Kelly12,21 examines the effect of Dopplerized measurements on analysis of aircraft flyover noise in the Fourier transform paradigm. His analysis ignores the stationary requirement with a quasi-stationary source assumption. Kelly also attempts to gain a general understanding of the noise source directivity by accounting for certain acoustic losses, but does not examine a full directivity pattern characterization.
Howell11 infers that without removal of the Doppler shift, spectral levels are incorrect and often blurred in narrow band analyses of moving sources. Removing the Doppler shift corrects the spectral level in non-stationary sources and sharpens the
3 DISTRIBUTION STATEMENT A. Approved for public release. Cleared, 88PA, Case #2017-2524.
resolution of the frequency representation. Howell’s de-Dopplerization11 process requires accurate measurement of aircraft location to resample the time signal to account for the compression and expansion of acoustic wavefronts. Correcting the time history in this manner however only adjusts the signal for the source location.
Kook20 examines the de-Dopplerization problem for a slightly different measurement activity: defining the location and magnitude of noise on the sides of automobiles during standardized pass-by tests. Kook reports on a beamforming array methodology that attempts to create the stationary acoustic profile from a moving source and stationary microphone array. As with the efforts of Howell11 and Kelly12,21, Kook recognizes the measured signal contains Dopplerized acoustic signals. Kook employs a re-sampling technique similar to Howell11.
Unlike the characterization methods described above, metrics describing the human auditory system’s response to acoustic stimuli utilize fractional octave spectral levels22. Since the Air Force Research Laboratory (AFRL) is concerned with human audition, a new method to remove the Doppler shift based on adjusting the fractional octave band number is defined. This fractional octave band shifting (FOBS) determines the amount of energy within a fractional octave that is shifted to adjacent bands due to Doppler effect. The numerical calculation of this shifting is accomplished through a simple formula derived from the fractional octave center frequency. FOBS is shown to accurately remove the Doppler effect in a numerical simulation and a real measurement without complex resampling or addressing acoustic losses.
2 FRACTIONAL OCTAVE BAND SHIFTING
2.1 Definition of Doppler shift frequency
Definition of the fractional octave band shifting requires an examination first of the definition of the Doppler frequency shift. Textbooks7,8 define this frequency shift between a stationary observer and moving source as:
𝑓𝑓′ = 𝑓𝑓 11 ∓ 𝑣𝑣𝑠𝑠𝑐𝑐0
. (1)
where the ‘-‘ sign is when the source is approaching; ‘+’ when the source is moving away; and 𝑐𝑐0 is the reference speed of sound. More generally, the Doppler frequency is described as a dot product of a unit vector pointing from the source to the receiver and the velocity vector13,21:
𝑓𝑓′ = 𝑓𝑓 11−𝑀𝑀��⃗ (𝜏𝜏)∙𝑛𝑛�⃗ (𝜏𝜏)
= 𝑓𝑓 11−�𝑀𝑀��⃗ �|𝑛𝑛�⃗ | cos𝜗𝜗
= 𝑓𝑓 11−𝑀𝑀cos𝜗𝜗
, (2)
where 𝑀𝑀 = 𝑣𝑣/𝑐𝑐0 is the MACH vector magnitude and 𝜗𝜗 is the angle between the MACH vector and the unit vector pointing (𝑛𝑛�⃗ (𝜏𝜏)) from the source to the receiver. By translating
4 DISTRIBUTION STATEMENT A. Approved for public release. Cleared, 88PA, Case #2017-2524.
Kelly’s coordinate system to a source center of mass coordinate system23 Eqn. 2 becomes:
𝑓𝑓′ = 𝑓𝑓 11−𝑀𝑀cos𝜃𝜃 sin𝜑𝜑
. (3)
The angles 𝜃𝜃 and 𝜑𝜑 are the spherical angles defined by the canonical transformations of the vector pointing from the source to the receiver where: 𝜃𝜃 = tan−1(𝑦𝑦 𝑥𝑥⁄ ), 𝜑𝜑 =cos−1(𝑧𝑧 𝑅𝑅⁄ ) and 𝑅𝑅 is the radial distance between the source and observer.
2.2 Definition of Fractional Octave Band Shifting
Glegg suggests that the time delay inherent in acoustic measurements of moving sources can be addressed through digital filters with time varying coefficients17. Howell uses digital filters to correct for external acoustic losses11. From Howell11 and Glegg17, filtering methods are not susceptible to the stationary requirement of Fourier transforms.
Definition of FOBS starts with the definition of the center frequency of a fractional octave filter. For example, one-third-octave (TOB) filter shapes are defined along with center and edge frequencies24, where the center frequencies are represented by:
𝑓𝑓 = 1000 ∙ 2(𝑛𝑛−30)
3� 𝐻𝐻𝑧𝑧 , (4)
where n is the TOB band number (n = 10 → 10 Hz, n = 20 → 100 Hz, n = 30 → 1 kHz, and n = 40 → 10 kHz). Inversion of Eqn. 4 defines the TOB band number (base-2 logarithms are used for simplification purposes):
𝑛𝑛 = 3 �𝑙𝑙𝑙𝑙𝑙𝑙2 �𝑓𝑓
1000� /𝑙𝑙𝑙𝑙𝑙𝑙2(2)� + 30 . (5)
FOBS employs the fractional band shift defined by the difference in the band number of Eqn. 5 due to Doppler effects:
Δ𝑛𝑛 = 𝑛𝑛 − 𝑛𝑛′ = 3 �𝑙𝑙𝑙𝑙𝑙𝑙2�
𝑓𝑓1000�
𝑙𝑙𝑙𝑙𝑙𝑙2(2) � − 3 �𝑙𝑙𝑙𝑙𝑙𝑙2�
𝑓𝑓′
1000�
𝑙𝑙𝑙𝑙𝑙𝑙2(2) � . (6)
Define the Doppler shift multiplier as 𝜒𝜒 = 1/(1 −𝑀𝑀 cos 𝜃𝜃 sin𝜑𝜑) and Eqn. 6 becomes
Δ𝑛𝑛 = 3𝑙𝑙𝑙𝑙𝑙𝑙2(2) �𝑙𝑙𝑙𝑙𝑙𝑙2 �
𝑓𝑓𝑓𝑓′�� = 3 �𝑙𝑙𝑙𝑙𝑙𝑙2 �
𝑓𝑓𝑓𝑓 𝜒𝜒�� . (7)
The final FOBS equation is
Δ𝑛𝑛 = −r[𝑙𝑙𝑙𝑙𝑙𝑙2(1 −𝑀𝑀 cos 𝜃𝜃 sin𝜑𝜑)] , (8)
where r is the fractional octave resolution. For example, the one-third-octave representation is Δ𝑛𝑛𝑇𝑇𝑇𝑇𝑇𝑇 = −3[𝑙𝑙𝑙𝑙𝑙𝑙2(1 −𝑀𝑀 cos 𝜃𝜃 sin𝜑𝜑)], and Δ𝑛𝑛𝑇𝑇𝑇𝑇𝑇𝑇𝑇𝑇 = −12[𝑙𝑙𝑙𝑙𝑙𝑙2(1 −𝑀𝑀 cos 𝜃𝜃 sin𝜑𝜑)] is the twelfth octave band resolution formula.
5 DISTRIBUTION STATEMENT A. Approved for public release. Cleared, 88PA, Case #2017-2524.
Unlike Fourier transforms, which possess constant bandwidth, factional octave bands possesses logarithmically increasing bandwidth with increasing center frequencies. The fractional octave bandwidth for any given center frequency is represented by:
𝐵𝐵𝐵𝐵 = 𝑓𝑓 �21 2𝑟𝑟⁄ − 2−1 2𝑟𝑟⁄ � , (9)
where r is the fractional number used in Eqn. 8. If the frequency variables in Eqn. 7 are replaced with corresponding 𝐵𝐵𝐵𝐵 variables, the multiplicative factor in Eqn. 9 divides out leaving Eqn. 8.
Employing Eqn. 8 to de-Dopplerize a measured data set is accomplished by first obtaining the sound pressure level spectrum at a chosen resolution through application of digital filter bank. This spectrum is defined at a measurement time, or time of arrival for acoustic energy at the receiver. The spherical angles used in Eqn. 8 are determined at emission time. In other research efforts the emission time is referred to as the retarded time2,3 and is defined as 𝑡𝑡𝑒𝑒𝑒𝑒𝑒𝑒𝑒𝑒𝑒𝑒𝑒𝑒𝑙𝑙𝑛𝑛 = 𝑡𝑡𝑎𝑎𝑟𝑟𝑟𝑟𝑒𝑒𝑎𝑎𝑎𝑎𝑙𝑙 − 𝑅𝑅 𝑐𝑐⁄ , where R is the propagation distance and c is the adiabatic speed of sound. A corresponding 𝑡𝑡𝑎𝑎𝑟𝑟𝑟𝑟𝑒𝑒𝑎𝑎𝑎𝑎𝑙𝑙 for each Δ𝑛𝑛 is determined, and this is interpolated to the acoustic measurement time to define the band shift. An example of this Δ𝑛𝑛 for a flyover measurement, calculated at 1/12 OB, is shown in Fig. 1. Notice that the band shift represents the shifting required to restore the original signal. Thus the Δ𝑛𝑛 is negative for the approaching, forcing a shifting from higher to lower frequency and positive for receeding.
Now that the band shift for a single spectrum is obtained, a proportional distribution of the energy within the spectrum is determined. For example, the Δ𝑛𝑛 value in Fig. 1 at 𝑡𝑡𝑎𝑎𝑟𝑟𝑟𝑟𝑒𝑒𝑎𝑎𝑎𝑎𝑙𝑙 = 830 𝑚𝑚𝑚𝑚𝑛𝑛 equals -2.8059. This value represents the number of frequency bands that must be shifted at any specific frequency to compensate for the Doppler effect. At this time, the aircraft is still approaching the observer location and the frequencies are compressed due to the Doppler shift. To compensate, the energy of the sound pressure level spectrum is shifted to lower frequencies by nearly three bands.

6 DISTRIBUTION STATEMENT A. Approved for public release. Cleared, 88PA, Case #2017-2524.
Figure 1. FOBS due to overflight conditions
FOBS employs two temporary spectra: one shifted three bands �𝑆𝑆𝑆𝑆𝑆𝑆⌊∆𝑛𝑛⌋+1� and one shifted two bands �𝑆𝑆𝑆𝑆𝑆𝑆⌊∆𝑛𝑛⌋� to a lower frequency (here ⌊∆𝑛𝑛⌋ is the integer floor of ∆𝑛𝑛). The correct spectrum is partway between these two spectra and is a linear combination of the acoustic pressure within the two temporary spectra.
𝑆𝑆𝑆𝑆𝑆𝑆 = (∆𝑛𝑛 − ⌊∆𝑛𝑛⌋) ∙ 𝑆𝑆𝑆𝑆𝑆𝑆⌊∆𝑛𝑛⌋ + �1 − (∆𝑛𝑛 − ⌊∆𝑛𝑛⌋)� ∙ 𝑆𝑆𝑆𝑆𝑆𝑆⌊∆𝑛𝑛⌋+1 (10)
3 VALIDATION OF FOBS
3.1 Simulated acoustic source motion
To test the validity of the FOBS method, a noise source simulation is employed. The simulation places a 500 Hz acoustic source 500 m away from a simulated receiver. The acoustic source moves in a straight line toward the receiver at constant velocity of v = 50 m/s. The received waveform is calculated once per period at a sample rate of 48 kHz, with the amplitude modified by the spherical spreading loss only. After computing a single period waveform, the acoustic source is moved along the straight line for the length of that period �𝑙𝑙𝑝𝑝𝑒𝑒𝑟𝑟𝑒𝑒𝑙𝑙𝑝𝑝 = 𝑇𝑇 ∙ 𝑣𝑣�, and then the frequency is updated. This continues until
7 DISTRIBUTION STATEMENT A. Approved for public release. Cleared, 88PA, Case #2017-2524.
the virtual source is 500 m away from the receiver. The source moves a total of 1000 m during the simulation.
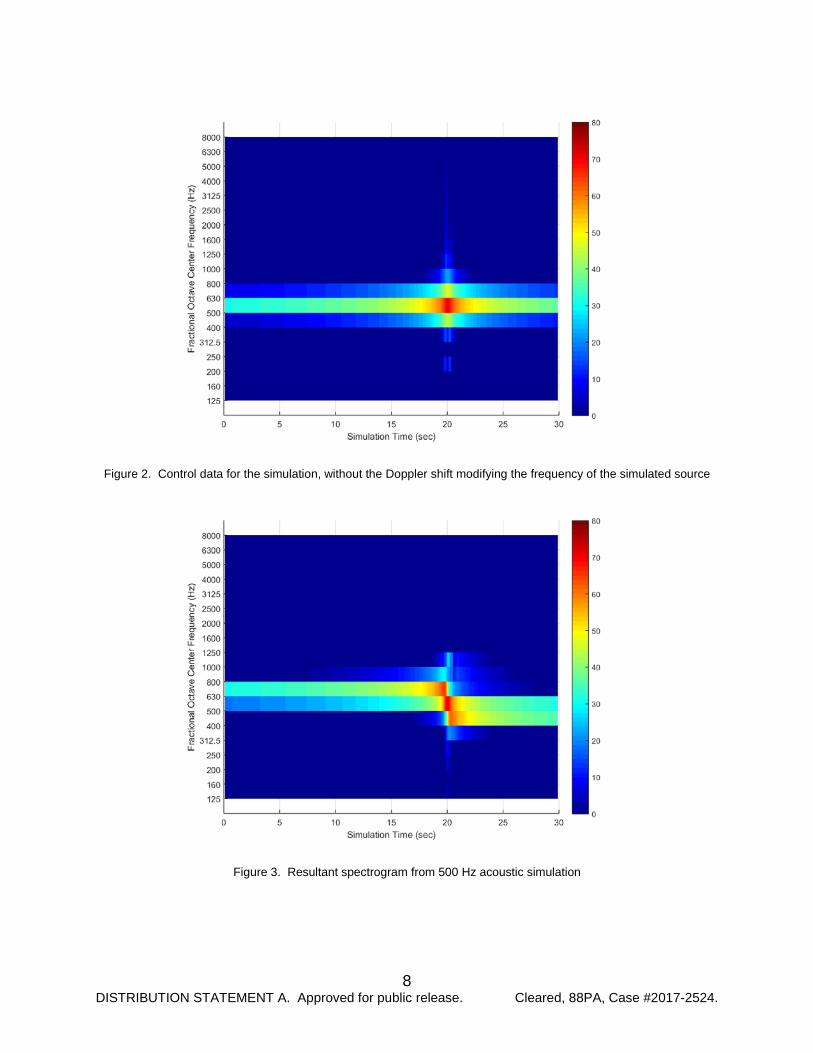
Two simulations are generated with this period-by-period method. The first is the control, where the frequency is constant throughout the simulation. The second simulation modifies the frequency each period with Eqn. 3. In both simulations the period is dynamically calculated based on the frequency to ensure that the transition between periods occurs at a zero thus producing no auditory artifacts. The sound source position is modified by the period and constant speed. Spectrograms for both signals are shown in Figs. 2 and 3 and are calculated with a one-third-octave band filter bank employing Butterworth digital filters.
To examine the results of the FOBS correction, Fig. 4 shows the 500 Hz trace from the control (black trace). The 500 Hz trace from the FOBS method is displayed in red. Finally, the original 500 Hz trace from Fig. 3 is displayed to show the magnitude of the corrections produced by FOBS. The difference between the control (black) and corrected (red) data at the peak is zero. This is directly due to the polar angle (θ) equaling zero, resulting in Δ𝑛𝑛 = −3[𝑙𝑙𝑙𝑙𝑙𝑙2(1)] = 0.
3.2 de-Dopplerization of acoustic measurements
Definition of the acoustic levels during an overflight measurement requires de-Dopplerization11,21. However, use of fractional octave analysis and spherical harmonics is not addressed in methods requiring de-Dopplerized measurements4,5,25. Presented here is data collected from a UH-1 Iroquois aircraft measurement which has been employed for testing enhancements to spherical harmonic source construction5.
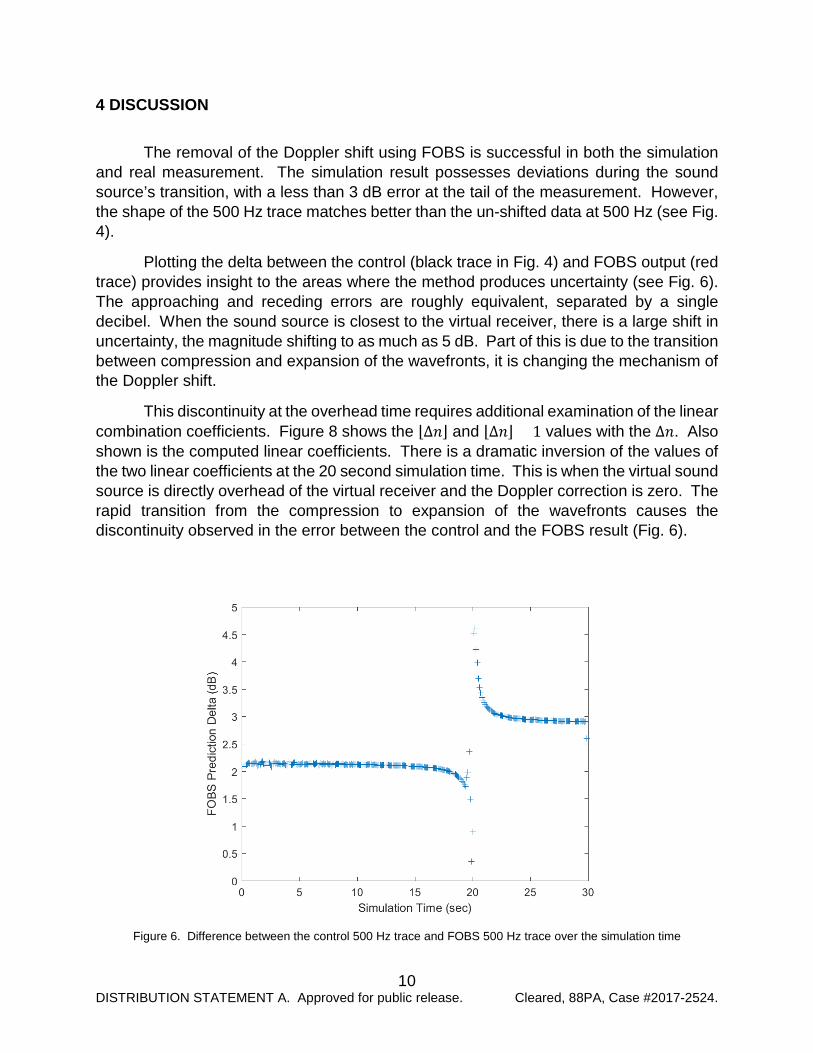
Source construction employs a large outdoor acoustic array26 similar to the array used by Swiss Federal Laboratories4. The one-twelfth-octave resolution sound pressure level time history is shown in Fig. 5A for one microphone and one pass. The tonal nature of the signature is evident from this spectrogram. It is also noticed that the tonal lines possess a clear Doppler shift due to the aircraft’s 100 knots indicated airspeed.
8 DISTRIBUTION STATEMENT A. Approved for public release. Cleared, 88PA, Case #2017-2524.
Figure 2. Control data for the simulation, without the Doppler shift modifying the frequency of the simulated source
Figure 3. Resultant spectrogram from 500 Hz acoustic simulation
9 DISTRIBUTION STATEMENT A. Approved for public release. Cleared, 88PA, Case #2017-2524.
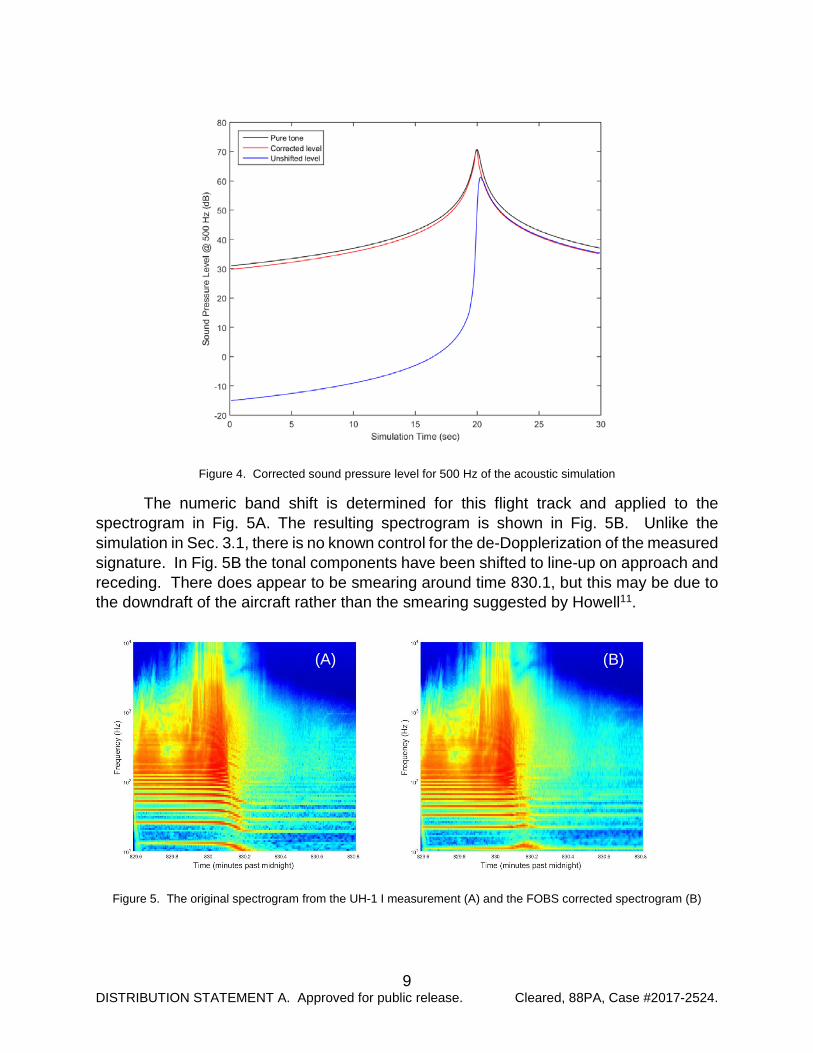
Figure 4. Corrected sound pressure level for 500 Hz of the acoustic simulation
The numeric band shift is determined for this flight track and applied to the spectrogram in Fig. 5A. The resulting spectrogram is shown in Fig. 5B. Unlike the simulation in Sec. 3.1, there is no known control for the de-Dopplerization of the measured signature. In Fig. 5B the tonal components have been shifted to line-up on approach and receding. There does appear to be smearing around time 830.1, but this may be due to the downdraft of the aircraft rather than the smearing suggested by Howell11.
Figure 5. The original spectrogram from the UH-1 I measurement (A) and the FOBS corrected spectrogram (B)
(A) (B)
10 DISTRIBUTION STATEMENT A. Approved for public release. Cleared, 88PA, Case #2017-2524.
4 DISCUSSION
The removal of the Doppler shift using FOBS is successful in both the simulation and real measurement. The simulation result possesses deviations during the sound source’s transition, with a less than 3 dB error at the tail of the measurement. However, the shape of the 500 Hz trace matches better than the un-shifted data at 500 Hz (see Fig. 4).
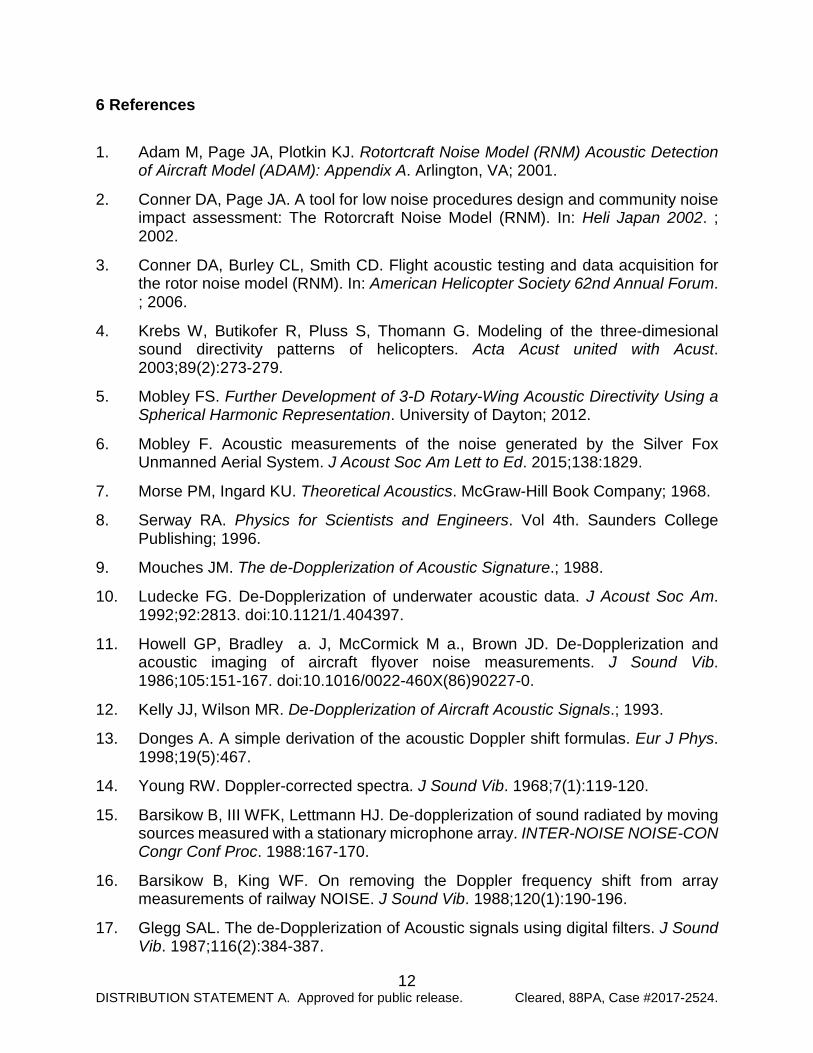
Plotting the delta between the control (black trace in Fig. 4) and FOBS output (red trace) provides insight to the areas where the method produces uncertainty (see Fig. 6). The approaching and receding errors are roughly equivalent, separated by a single decibel. When the sound source is closest to the virtual receiver, there is a large shift in uncertainty, the magnitude shifting to as much as 5 dB. Part of this is due to the transition between compression and expansion of the wavefronts, it is changing the mechanism of the Doppler shift.
This discontinuity at the overhead time requires additional examination of the linear combination coefficients. Figure 8 shows the ⌊∆𝑛𝑛⌋ and ⌊∆𝑛𝑛⌋ + 1 values with the ∆𝑛𝑛. Also shown is the computed linear coefficients. There is a dramatic inversion of the values of the two linear coefficients at the 20 second simulation time. This is when the virtual sound source is directly overhead of the virtual receiver and the Doppler correction is zero. The rapid transition from the compression to expansion of the wavefronts causes the discontinuity observed in the error between the control and the FOBS result (Fig. 6).
Figure 6. Difference between the control 500 Hz trace and FOBS 500 Hz trace over the simulation time

11 DISTRIBUTION STATEMENT A. Approved for public release. Cleared, 88PA, Case #2017-2524.
Figure 7. Comparison of the ∆𝑛𝑛 and the limits on the linear coefficients
5 CONCLUSIONS
Removal of Doppler shifting effects is vital to accurate representation of acoustic signals. Analysis using Fourier transformations requires sound source to be stationary, which is obviously not possible during over-flight conditions.
The effects of acoustics on humans is more accurately represented through fractional octave analysis. Digital filters are independent of the stationary requirement of Fourier transforms. A method to shift energy into adjacent fractional octave bands is shown effective in a simple simulation and field measurements. The fractional octave band shifting (FOBS) method removes the complex resampling proposed for use with Fourier transforms, and is applied to any fractional octave bandwidth.
FOBS removes the shifting caused by the Doppler shifting in an over-flight of a UH-1 Iroquois. The simplicity of the FOBS method makes it more applicable to acoustic measurements over the complex resampling of the waveform.
12 DISTRIBUTION STATEMENT A. Approved for public release. Cleared, 88PA, Case #2017-2524.
6 References
1. Adam M, Page JA, Plotkin KJ. Rotortcraft Noise Model (RNM) Acoustic Detection of Aircraft Model (ADAM): Appendix A. Arlington, VA; 2001.
2. Conner DA, Page JA. A tool for low noise procedures design and community noise impact assessment: The Rotorcraft Noise Model (RNM). In: Heli Japan 2002. ; 2002.
3. Conner DA, Burley CL, Smith CD. Flight acoustic testing and data acquisition for the rotor noise model (RNM). In: American Helicopter Society 62nd Annual Forum. ; 2006.
4. Krebs W, Butikofer R, Pluss S, Thomann G. Modeling of the three-dimesional sound directivity patterns of helicopters. Acta Acust united with Acust. 2003;89(2):273-279.
5. Mobley FS. Further Development of 3-D Rotary-Wing Acoustic Directivity Using a Spherical Harmonic Representation. University of Dayton; 2012.
6. Mobley F. Acoustic measurements of the noise generated by the Silver Fox Unmanned Aerial System. J Acoust Soc Am Lett to Ed. 2015;138:1829.
7. Morse PM, Ingard KU. Theoretical Acoustics. McGraw-Hill Book Company; 1968.
8. Serway RA. Physics for Scientists and Engineers. Vol 4th. Saunders College Publishing; 1996.
9. Mouches JM. The de-Dopplerization of Acoustic Signature.; 1988.
10. Ludecke FG. De-Dopplerization of underwater acoustic data. J Acoust Soc Am. 1992;92:2813. doi:10.1121/1.404397.
11. Howell GP, Bradley a. J, McCormick M a., Brown JD. De-Dopplerization and acoustic imaging of aircraft flyover noise measurements. J Sound Vib. 1986;105:151-167. doi:10.1016/0022-460X(86)90227-0.
12. Kelly JJ, Wilson MR. De-Dopplerization of Aircraft Acoustic Signals.; 1993.
13. Donges A. A simple derivation of the acoustic Doppler shift formulas. Eur J Phys. 1998;19(5):467.
14. Young RW. Doppler-corrected spectra. J Sound Vib. 1968;7(1):119-120.
15. Barsikow B, III WFK, Lettmann HJ. De-dopplerization of sound radiated by moving sources measured with a stationary microphone array. INTER-NOISE NOISE-CON Congr Conf Proc. 1988:167-170.
16. Barsikow B, King WF. On removing the Doppler frequency shift from array measurements of railway NOISE. J Sound Vib. 1988;120(1):190-196.
17. Glegg SAL. The de-Dopplerization of Acoustic signals using digital filters. J Sound Vib. 1987;116(2):384-387.
13 DISTRIBUTION STATEMENT A. Approved for public release. Cleared, 88PA, Case #2017-2524.
18. Oppenheim A V, Shafer RW. Discrete-Time Signal Processing. Englewood Clifs, New Jersey,: Prentice Hall; 1989.
19. Verhas HP. A restoration procedure for (non-stationary) signals from moving sources. J Sound Vib. 1983;89(4):487-497.
20. Kook H, Moebs GB, Davies P, Bolton JS. An efficient procedure for visualizing the sound field radiated by vehicles during standardized passby tests. J Sound Vib. 2000;233(1):137-156.
21. Kelly JJ. Signal processing of aircraft flyover noise. J Sound Vib. 1993;160(3):485-501.
22. Harris CM, ed. Handbook of Acoustical Measurements and Noise Control. Acoustical Society of America; 1998.
23. Cai G, Chen BM, Lee TH. Unmanned Rotorcraft System. Springer; 2011.
24. Institute ANS. Octave-band and fractional-octave-band analog and digital filters. 2009.
25. Mobley F. Interpolation of aircraft source noise directivity patterns modeled by spherical harmonics. In: 170th Meeting of the Acoustical Society of America. Vol 25. ; 2016:45003. doi:10.1121/2.0000193.
26. Dowing M, McKinley R, Hall J, Mobley F, James M. Aeroacoustic research complex for aircraft source noise characterization. J Acoust Soc Am. 2008;123(5):3126.
14 DISTRIBUTION STATEMENT A. Approved for public release. Cleared, 88PA, Case #2017-2524.
SYMBOLS, ABBREVIATIONS, & ACRONYMS
711 HPW/RHCB Air Force Research Laboratory, Human Performance Wing, Human Effectiveness Directorate, Warfighter Interface Division, Battlespace Acoustics Branch
dB Decibel FOBS FRACTIONAL OCTAVE BAND SHIFTING Hz Hertz m Meter