fraser forum - february 2010
DESCRIPTION
Fraser Forum is a monthly review of public policy in Canada, with articles covering taxation, education, health care policy, and a wide range of other topics. Forum writers are economists, Institute research analysts, and selected authors, including those from other public policy think tanks. The focus of this issue is health care.TRANSCRIPT

A Fraser Institute review of public policy in Canada
Fraser ForumCa
nadi
an P
ublic
atio
n M
ail S
ales
Pro
duct
Agr
eem
ent N
umbe
r 400
6926
9.
February 2010$3.95
How much do we really pay?
Spend more, wait less?
Leaving Canada for treatment
Regulating alternative medicines
The rising cost ofCanadianhealth care


Fraser Forum
The Fraser Institute’s vision is a free and prosperous world where individuals benefit from greater choice, competi-tive markets, and personal responsibility. Our mission is to measure, study, and communicate the impact of competitive markets and government interventions on the welfare of indi-viduals. Founded in 1974, we are an independent research and educational organization with locations throughout North America, and international partners in over 70 countries. Our work is financed by tax deductible contributions from thousands of individuals, organizations, and foundations. In order to protect its independence, the Institute does not accept grants from government or contracts for research.
For additional copies, or to become a supporter and receive Fraser Forum, write or call the Fraser Institute, 4th Floor, 1770 Burrard Street, Vancouver, BC V6J 3G7 Telephone: (604) 688-0221; Fax: (604) 688-8539; Toll-free: 1-800-665-3558 (ext. 580–book orders; ext. 586–development)
Copyright © 2010 Fraser Institute ISSN 0827-7893 (print version) | ISSN 1480-3690 (online version) Printed and bound in Canada.
Return undeliverable Canadian addresses to:Fraser Institute, 4th Floor, 1770 Burrard StreetVancouver, BC V6J 3G7
The contributors to this publication have worked inde-pendently and opinions expressed by them are, therefore, their own and do not necessarily reflect the opinions of the supporters, trustees, or other staff of the Fraser Institute. This publication in no way implies that the Fraser Institute, its trustees, or staff are in favour of, or oppose the passage of, any bill; or that they support or oppose any particular political party or candidate.
Fraser Institute Board of Trustees Hassan Khosrow-shahi (Chairman), Edward Belzberg (Vice Chairman), Mark W. Mitchell (Vice Chairman), Gwyn Morgan (Vice Chair-man), Salem Ben Nasser Al Ismaily, Louis-Philippe Amiot, Gordon Arnell, Charles Barlow, Everett Berg, T. Patrick Boyle, Peter Brown, Joseph Canavan, Alex Chafuen, Elizabeth Chaplin, Derwood Chase, Jr., James Davidson, John Dielwart, Stuart Elman, Greg Fleck, Shaun Francis, Ned Goodman, Arthur Grunder, John Hagg, Paul Hill, Stephen Hynes, David Laidley, Robert Lee, Brandt Louie, David MacKenzie, Hubert Marleau, James McGovern, Eleanor Nicholls, Roger Phillips, Herb Pinder, Jr., R. Jack Pirie, Conrad Riley, Gavin Semple, Roderick R. Senft, Anthony Sessions, William Siebens, Anna Stylianides, Arni Thorsteinson, Michael Walker, Catherine Windels, Brett J. Skinner (President), Peter Cowley (Senior Vice President, Operations), Michael Perri (Secretary-Treasurer)
www.fraserinstitute.org Fraser Forum 02/10 1
PublisherChief Editor
Managing EditorEditorial Advisor
Coordinating EditorContributing Editors
Art Direction and Cover DesignCover Photo
Production and LayoutCopyediting
Media RelationsAdvertising Sales
Fraser InstituteBrett J. SkinnerKristin FryerKristin McCahonNadeem EsmailAmela KarabegovićDiane KatzFred McMahonBill RayFotoliaKristin FryerMirja van HerkDean PelkeyAdvertising In PrintTel: (604) 681-1811E-mail: info@advertising inprint.com
From the editor
I was out for a walk a few days ago when I came across a billboard advertising a free laptop computer. I was intrigued but skeptical; there had to be some sort of catch. Sure enough, there was: the
computer was free only with a three-year contract for internet servic-es. In other words, the computer wasn’t really free at all. I would still have to pay for it, albeit indirectly through the internet service fees.
This computer deal reminds me of the way we pay for most gov-ernment services, which are financed through general tax revenues. Because we do not pay for them directly, many of these services—for example, roads and public schools—seem free, and it is often difficult for us to find out how much we are actually paying for them. This, in turn, makes it difficult for us to determine whether we are getting good value for our money.
This disconnect between govern-ment services and their true cost is particularly true of health care in Canada. Since a trip to the doctor or the hospital is free at the point of service, it is easy for consumers to greatly underestimate the cost of the care they receive.
So just how much do we really pay?In 2008/2009, the provinces spent between 28.8% (Saskatche-
wan) and 46.4% (Ontario) of total available revenues on health care; all told, Canadian governments spent nearly $121.6 billion of our tax dollars on publicly funded care (“How much do we really pay?” pg. 14). This means that the average unattached (single) Canadian paid approximately $3,228 for public health care insurance, while an average family consisting of two adults and two children paid about $9,100 for public health care insurance.
These spending levels are incredibly high—and growing unsus-tainably. Over the last 10 years, government health spending has outpaced revenue growth in six of the 10 provinces. If Ontario, for example, does not change its spending habits, health spending will consume 50% of all available revenues by 2014 and 75% of all rev-enues by 2038 (“Health care at a crossroads,” pg. 10).
Considering how much Canadians spend on their health care system, one would expect us to have a world-class system. And yet wait times for treatment are far too long (16.1 weeks in 2009) and access to advanced medical technology is relatively poor.
These conditions are driving many Canadians to seek out health care elsewhere. In 2009, just over 41,000 Canadians received non-emergency medical treatment outside Canada, a notable increase over 2008 (“Leaving Canada for medical care,” pg. 18).
Spending more public money on our health care system will not fix these problems. Statistical analysis shows that past increases in government spending on health care had no effect on reducing wait times (“Spend more, wait less?” pg. 16). This data is consistent with standard economic theory, which suggests that publicly financed sys-tems are simply missing the appropriate economic incentives to direct resources to where they are needed.
Canadians must demand better. It’s time for us to stop paying more while getting less.
Kristin Fryer ([email protected])
Paying more, getting less

2 Fraser Forum 02/10 www.fraserinstitute.org
ContentsFraser Forum
1 From the editor
4 Forum authors
5 How to beat Africa’s health crisisPhilip Stevens
The current state-centric model of delivering health care in Africa is not working. It’s time to examine other options.
8 Key Concepts: Creative destructionNick Schulz
Capitalism is inherently creative and destructive: it creates new ways of doing things and in the process destroys the old ways.
10 Health care at a crossroadsMark Rovere and Brett J. Skinner
Under its current structure, Ontario’s health care system is financially unsustainable.
12 The benefits of congestion pricingCharles Lammam
Congestion pricing is one way to allocate scarce road space more efficiently and reduce the costs of congestion.
24 The times are a-changin’Charles Lammam
Alberta, traditionally considered to have the best investment climate in Canada, is losing ground to Saskatchewan and British Columbia.
10Health care in crisis
12Congestion pricing
29Check the numbers

www.fraserinstitute.org Fraser Forum 02/10 3
27 Scrap the Parliamentary Budget OfficeNiels Veldhuis and Charles Lammam
The government should stop funding an institution that duplicates work already being done by the private sector.
29 Check the numbersB. D. McCullough and Ross McKitrick with Diane Katz
An excerpt from a recent Fraser Institute report, which underscores the need for transparency and accountability in academic research.
14 How much do we really pay?Nadeem Esmail and Milagros Palacios
In 2009, the average Canadian family consisting of two adults and two children paid about $9,100 for public health care insurance.
16 Spend more, wait less?Bacchus Barua and Nadeem Esmail
Statistical analysis suggests that increases in health care spending appear to have no effect on wait times for treatment and may even increase wait times.
18 Leaving Canada for medical careNadeem Esmail
In 2009, just over 41,000 Canadians received non-emergency medical treatment outside Canada, a notable increase over 2008.
21 Unnatural regulationCynthia Ramsay
The Natural Health Products Regulations were put in place five years ago, but the government has yet to provide any evidence that the regulations have improved Canadians’ access to safe, effective, and high-quality natural health products.
THE RISING COST OF HEALTH CARE

4 Fraser Forum 02/10 www.fraserinstitute.org
Forum Authors
Featured Authors
Diane Katz (diane.katz@fra serinstitute.org) is the Di-rector of Risk, Environment, and Energy Policy Studies at the Fraser Institute. She has an M.A. from the Uni-versity of Michigan.
Charles lammam (charles.lam [email protected]) is a Policy Analyst in the Fiscal Studies Depart-ment at the Fraser Institute. He is completing an M.A. in public policy at Simon Fraser University.
B. D. mCCullough is a Professor of Decision Sciences at Drexel University in Philadelphia.
ross mCKitriCK is a Senior Fellow at the Fraser Institute and an Associate Professor at the University of Guelph.
Cynthia ramsay is a Vancouver-based consultant spe-cializing in health economics. She is also the owner and publisher of the Jewish Independent.
marK rovere ([email protected]) is a Senior Policy Analyst, Bio-Pharma and Health Policy,
at the Fraser Institute. He holds an M.A. in political science from the University of Windsor.
niCK sChulz is the Editor-in-Chief of The American and DeWitt Wallace Fellow at the American Enterprise In-stitute.
Brett J. sKinner ([email protected]) is the President of the Fraser Institute and the Director of Bio-Pharma and Health Policy research. He obtained his Ph.D. in public policy and political science from the University of Western Ontario.
PhiliP stevens is the Director of Policy with the Inter-national Policy Network in the United Kingdom. He holds degrees from the London School of Economics and Durham University.
niels velDhuis ([email protected]) is the Director of Fiscal Studies and Vice President, Ca-nadian Policy Research, at the Fraser Institute. He has an M.A. in economics from Simon Fraser University.
Contributors
BaCChus Barua ([email protected]) is a an intern at the Health Policy Research Centre at the Fraser Institute. He is currently pursuing an M.A. in economics at Simon Fraser University.
naDeem esmail is a Senior Fellow and a former Director of Health System Performance Studies at the Fraser Institute. He holds an M.A. in economics from the University of British Columbia.
milagros PalaCios ([email protected]) is a Senior Economist with the Fraser Institute’s Fiscal Studies Department. She holds an M.Sc. in economics from the University of Concepcion in Chile.

Foto
lia
www.fraserinstitute.org Fraser Forum 02/10 5
Nearly 10 years after the UN’s Millennium Develop-ment Goals were launched to great fanfare, many of the poorest countries remain in the grip of
health crises (WHO, 2008). Though foreign aid for health care quadrupled between 1990 and 2007,1 it has had an imperceptible effect on eradicating the diseases that most often afflict the poorest countries—diseases such as pneu-monia, chest infections, HIV, and malaria. Predictably, a panoply of UN agencies and other aid agencies have re-sponded to this failure with calls for even more increases in government health aid (Oxfam International, 2009b).
That the latest “big push” in foreign aid is failing to have much impact is unsurprising. Since the early 2000s, OECD governments have channelled increasing levels of funds—either bilaterally or via multilateral funding insti-tutions—to governments in poor countries in the hope that these governments will then spend the money on im-proving health (Ravishankar et al., 2009). But this strat-egy is increasingly being exposed as a wasteful failure (El-liott, 2009, May 1). Thus, it is now time to examine other ways of delivering health care in poor countries—ways that do not rely entirely on dysfunctional governments.
Problems with state-run systems
Since becoming independent, many African countries have, for a variety of ideological and practical reasons, taken the position that the state should be the dominant provider of health care. Foreign donors have been keen supporters of this aspiration towards state-provided uni-versal health care. Many Western government aid agen-cies and influential NGOs have sympathized with the view of many African governments that market-driven health care is impossible because of considerations such as “eq-uity” and the fact that patients are likely to be taken ad-vantage of by more knowledgeable medical practitioners
(Oxfam Interna-tional, 2009a).
As a result, the majority of official Develop-ment Assistance for Health (DAH) is transferred directly to governments for spending on health pri-orities, either bilaterally or via multilateral bodies such as the Global Fund to Fight AIDS, Tuberculosis and Malaria. In 2006, 10% of Africa’s health spending was fi-nanced by foreign aid, and this figure is much higher in some countries (International Finance Corporation, 2007).
Unfortunately, this spending is not having much im-pact, as any visitor to the average state-owned clinic in Africa could attest. On a recent trip to Lagos, Nigeria, I visited a clinic that served a population equivalent to that of a London borough (around 1 million people). There were shortages of basic supplies such as bandages and sterile gauze and the clinic could supply no medicines. There was only one (exhausted) nurse employed full-time, who could often do no more than offer advice and reas-surance to sick patients. This admittedly anecdotal expe-rience is just one example among thousands of similar situations throughout the poorest countries. According to the World Health Organization, an estimated 30% of the world’s population lacks regular access to existing drugs, and this figure rises to over 50% in the poorest parts of Africa and Asia (WHO, 2003).
Government-provided health care is in such a par-lous state largely because local ministries of health do not have the capacity, expertise, logistical skills, or in-centives to deliver a complex service like health care to every citizen. Many ministries are like bottomless pits in
PhiliP stevens
How to beat Africa’s health crisis

6 Fraser Forum 02/10 www.fraserinstitute.org
terms of how they handle donations. Although advances in resource tracking within the health systems of devel-oping countries have been made recently, many of these countries lack sufficient auditing procedures and public expenditure management systems (Powell-Jackson and Mills, 2007), making it extremely difficult for donors to see how their money has been spent.
This lack of financial accountability creates an en-vironment in which corruption can thrive, particularly in countries that suffer from a weak rule of law. Health care systems in these countries are plagued by corruption, which can include direct embezzlement at the ministe-rial level, local medical staff selling “free” drugs on the grey market, institutionalized absenteeism, and illegal payments to health care personnel that allow patients to jump queues or obtain treatment (Lewis, 2006).
When some aid money does make it to local clinics, it is most often the educated urban classes who benefit, rather than the rural poor for whom the aid is really in-tended (Filmer, 2003). Because of these failings, the aver-age cost of saving a life through government health care in less developed countries is US$50,000 to $100,000; in contrast, the cost of treating the most significant causes of child mortality is an estimated $10 to $4,000 per saved life in developing countries (Filmer and Pritchett, 1999). Children in these countries are not receiving cheap, life-saving treatments for diarrhoea (Oral Rehydration Ther-apy) and other basic interventions such as vaccinations, which can save lives for a few cents (Black, 2003).
A major problem with the current approach to foreign aid is that it focuses on inputs, rather than out-puts. It is much easier, politically, for donors to tell their electorates about the number of mosquito bed nets and drugs they have paid for, and the amount of money they have disbursed, while paying less attention to the results achieved through that money. Recent external evalua-tions of the Global Fund and the United States Agency for International Development have shown that while they have been good at disbursing funds, neither body could provide any substantive evidence that the disease burden of poor countries had declined because of their activities (US GAO, 2007; Global Fund, 2009).
The current state-centric model of delivering health care is clearly not working. As William Easterly (2006), author of The White Man’s Burden, put it, “The status quo—large international bureaucracies giving aid to large national government bureaucracies—is not getting money to the poor.”
Rethinking foreign aid
Since most OECD countries remain committed in prin-ciple to spending 0.7% of their GDP on foreign aid, it is
now time for policy makers to radically rethink the way this money is spent. Fortunately, an alternative to the current system already exists in the form of an enormous and diverse private sector within Africa and other lower-income regions.
According to International Finance Corporation and World Bank figures, between one-third and one-half of the US$16.7 billion spent on health care in sub-Saharan Africa in 2005 was spent in the private sector, often by the poorest people who cannot get government services (International Finance Corporation, 2007). In Madhya Pradesh, India, 75% of all health care is provided by the private sector (De Costa and Diwan, 2007). This huge capacity is generally ignored by donors, who for ideo-logical reasons prefer to work directly with governments. Meanwhile, these same governments do next to nothing to harness this massive capacity, leaving the poor to pay for health care out of their own pockets.
Donors could make a real difference by using their money to offer competitive contracts for the delivery of health services. Non-profit groups, governments, and, crucially, the private sector should all be competing to deliver a wide range of services, such as primary care and hospital management. This competitive stimulus would give health care providers a powerful incentive to im-prove standards and drive down costs, and would be far more effective than simply subsidizing state-run health care. Ministries of health would then have the resources to concentrate on activities for which government is bet-ter qualified, such as standard-setting, monitoring, and regulation.
This has already happened in Cambodia, where NGOs have competed to provide health services to the rural poor since 1999, after the near destruction of the health system during the civil war. Under private delivery, immunization coverage rose from 19% to 40% and equity was improved (Schwartz and Bhushan, 2004). Coverage and standards have improved so rapidly that the gov-ernment has expanded the program to cover one in 10 Cambodians.
In 2005, The Lancet published a review comparing 10 different contracting programs around the world and found that most private contractors out-performed the government in cost, quality, and coverage. In a number of countries, including Bangladesh, Guatemala, Haiti, India, Bolivia, Madagascar, and Senegal, contracting with non-governmental entities resulted in “rapid improvements” (Loevinsoehn and Harding, 2005). The practice of using public money to fund private delivery of health services is not new and has long been in place in socially democratic countries such as Norway and Sweden.
This practice is particularly effective at helping to reduce the inequity that often results from monopolis-tic government provision. Many of the communities

www.fraserinstitute.org Fraser Forum 02/10 7
most under-served in state-run systems are both poor and rural. Contracts could be framed in such a way as to target specific geographical areas, and be loaded to give specific benefits to providers that serve poorer so-cio-economic groups. Once a headache for bureaucrats in health ministries, the poor could suddenly provide a business opportunity.
Inevitably, there has been much opposition to these developments, mainly from ideological opponents of the private sector such as Oxfam International (2009a). Their main argument is that public systems are better suited to provide equitable health care and that relying on the private sector is risky and unproven. Nevertheless, for the last 50 years, their favoured model of state-provided health care has failed. It is time to try something new.
Fortunately, the world is moving on quickly and a formal resolution on the role of the private sector was nearly included in this year’s World Health Assembly in Geneva, until it was sidelined by more pressing discus-sions about swine flu. If major aid agencies such as the Canadian International Development Agency get behind this development, it could transform the way we spend foreign aid. For too long, aid has been wasted by govern-ments. Contracting to the private sector may mean that we will finally see some results.
Note
1 Official Development Aid for Health (DAH) increased from US$5.6 billion in 1990 to US$21.8 billion in 2007 (Ravishankar et al., 2009).
References
Black, R. (2003). Where and Why Are 10 Million Children Dying Every Year? The Lancet 361: 2226–34.
DeCosta, A., and V. Diwan (2007). Where is the Public Health Sector? Public and Private Sector Healthcare Provision in Madhya Pradesh, India. Health Policy 84, 2–3 (December): 269–76.
Easterly, William (2006). The White Man’s Burden. Oxford University Press.
Elliott, Larry (2009, May 1). World Bank Admits Most Health Aid Fails. The Guardian. <http://www.guardian.co.uk/business/2009/may/01/world-bank-health-aid-poverty>.
Filmer, D. (2003). The Incidence of Public Expenditures in Health and Education. Background note for World Development Report 2004: Making Services Work for Poor People. World Bank. <http://www-wds.worldbank.org/external/default/WDSContentServer/IW3P/IB/2003/10/20/000160016_2
0031020130801/additional/310436360_20050276022932.pdf>.
Filmer, D., and L. Pritchett (1999). The Impact of Public Spending on Health: Does Money Matter? Social Science and Medicine 49, 10 (November): 1309–23.
Global Fund to Fight AIDS, Tuberculosis and Malaria [Global Fund] (2009). The Five Year Evaluation of the Global Fund. Global Fund to Fight AIDS, Tuberculosis and Malaria. <http://www.theglobalfund.org/en/terg/evaluations/5year/>.
International Finance Corporation (2007). The Business of Health in Africa: Partnering with the Private Sector to Im-prove People’s Lives. International Finance Corporation.
Lewis, Maureen (2006). Corruption and Governance in Pub-lic Health Care Systems. Center for Global Development Working Paper No. 78. Center for Global Development.
Loevinsoehn, Benjamin, and April Harding (2005). Buying Results? Contracting for Health Service Delivery in De-veloping Countries. The Lancet 366: 676–81.
Oxfam International (2009a). Blind Optimism: Challenging the Myths about Private Health Care in Poor Countries. Briefing Paper No. 125. Oxfam International. <http://www.oxfam.org.uk/resources/policy/health/downloads/bp125_blind_optimism_private_health_care.pdf>.
Oxfam International (2009b). Your Money or Your Life? Will Leaders Act Now to Save Lives and Make Health Care Free in Poor Countries? Oxfam International.
Powell-Jackson, Timothy, and Anne Mills (2007). A Review of Health Resource Tracking in Developing Countries. Health Policy and Planning 22, 6: 353–62.
Ravishankar, Nirmala, Paul Gubbins, Rebecca J. Cooley, Katherine Leach-Kemon, Catherine M. Michaud, Dean T. Jamison, and Christopher J.L. Murray (2009). Financing of Global Health: Tracking Development Assistance for Health from 1990 to 2007. The Lancet 373, 9681: 2113–24.
Schwartz, J. Brad, and Indu Bhushan (2004). Improving Equi-ty in Immunization through a Public Private Partnership in Cambodia. Bulletin of the World Health Organization 82: 661–67.
US Government Accountability Office [GAO] (2007). Global Health: USAID Supported a Wide Range of Child and Ma-ternal Health Activities, but Lacked Detailed Spending Data and a Proven Method for Sharing Best Practices. US GAO.
World Health Organization [WHO] (2003). Medicines Strategy Report, 2002-2003. WHO.
World Health Organization [WHO] (2008). Monitoring Achievement of the Health-related Millennium Develop-ment Goals. WHO. <http://apps.who.int/gb/ebwha/pdf_files/A61/A61_15-en.pdf>.

KEY CONCEPTSFo
tolia
8 Fraser Forum 02/10 www.fraserinstitute.org
Creative destruction refers to the manner in which free markets tend to replace certain products and processes with higher quality products and
more efficient production methods. Capitalism creates new ways of doing things and in the process destroys the old ways.
The phrase “creative destruction” was first popularized by Joseph Schumpeter, an economist. He developed the notion in his book Capitalism, Socialism and Democracy (1942/2008) in a six-page chapter titled “The Process of Creative Destruction.” Schumpeter laboured for much of his career to explain the fundamental nature of capitalism and the market economy. The process of creative destruc-tion was, in Schumpeter’s view, capitalism’s “essential fact”:
The opening up of new markets, foreign or domestic, and the organizational development from the craft shop and factory to such concerns as US Steel il-lustrate the same process of industrial mutation—if I may use that biological term—that increasingly revolutionizes the economic system from within, incessantly destroying the old one, in-cessantly creating a new one. This process of Creative Destruction is the essential fact about capitalism. It is what capitalism consists in and what every capital-ist concern has got to live in.
When Schumpeter popularized this phrase, politicians, economists, and the public were very concerned about monopolies and concentrated economic power. Indus-trial-scale capitalism was not very popular around the world during the 1930s and 1940s. Schumpeter was try-ing to focus attention on the essentially dynamic char-acter of capitalism and the futility of examining it at a single point in time.
In Schumpeter’s view, a firm’s economic strength emerges over time and from continued technological advance-ment and organizational restructuring. Creative destruc-tion means that the establishment of new techniques,
business models, technologies, and markets can destroy an established monopolist’s dominant position.
For Schumpeter, the entrepreneur is the oft-overlooked heart of the economic system. Through the “element of personal initiative,” the entrepreneur is able to unleash
“the perennial gale of creative destruction” that propels economies forward, brings new technology to the market, and saps established firms of their economic power.
Schumpeter took great pains to describe the defining characteristics of the capitalist system so as to explain its benefits: generating wealth, innovation, and new products. The dynamic itself was important, not just the end result. For Schumpeter, the order of the word couplet—“creative” followed by “destruction”—was significant. Creativity preceded destruction. Destruction occurs only after gen-erative acts yield innovations and technological advances. For this reason, Schumpeter believed that the destruction inherent to the capitalist system was a worthy price to pay
for economic progress.
As Schumpeter biog-rapher Thomas K. Mc-Craw has pointed out,
history contains many examples of leaders who have tried to reverse the sequence, believing that destruction could give rise to creativity. During the Cultural Revolution in China in the 1960s, Mao Zedong exhorted the revo-lutionaries to “destroy first, and construction will look after itself.” The economic (and human) consequences of following this logic ultimately proved disastrous.
Schumpeter knew that this process of creative destruction would give rise to enmity among competitors. Incumbent firms would feel threatened by new technologies and new ways of doing business. These firms would likely appeal to the government to prevent new creations that could threaten their economic power from coming to the market.
While the significance of Schumpeter’s analysis of capital-ism was under-appreciated in his own day, he has enjoyed a kind of rediscovery over the last quarter century. Today,
“creative destruction” is a well-known phrase that is used
niCK sChulz
CREATIVE DESTRUCTION

www.fraserinstitute.org Fraser Forum 02/10 9
to describe the economic dynamism that is most closely associated with the American economy but is also evi-dent around the world.
In hindsight, it is rather easy to see Schumpeterian cre-ative destruction in action. During the twentieth century, horse-drawn carriages gave way to automobiles; tele-graphs gave way to telephones. Today, we can see creative destruction most clearly in the technology industry as entrepreneurs create new technologies that destroy pre-vious ways of doing business. Not long ago IBM’s domi-nance in computers was undermined by Microsoft and its personal computing technologies. Today, Microsoft’s dominance is challenged by the innovations of Google and other firms we have not heard of yet.
But if it is easy for us to comprehend creative destruction today it is largely due to the analytical lens Schumpeter brought to the study of dynamic capitalism. Building on Schumpeter’s insights, scholars are now extending his analysis to make our understanding of capitalism more complete. For example, Columbia University’s Amar Bhide has documented the process of “nondestructive creation” at work in modern capitalist systems. Accord-ing to this view, new products and technologies are often used to satisfy new wants and desires and do not im-mediately displace existing goods and technologies. For example, “thirty years ago, the only diagnostic techniques that people used to use were X-rays,” Bhide notes. “We still use a lot of X-rays. But then we had CT scans, then PET scans, and now we have MRIs. And with each of these innovations, we now can diagnose diseases that you wouldn’t have been able to diagnose previously. So it’s not that MRIs simply substituted for X-rays. In fact, most MRIs are used to do things that X-rays could not do. An X-ray could not show you a tumor in your back because of the soft tissue. So an MRI is largely an example of nondestructive creation.”
While creative destruction can reduce the demand for labour in certain areas, it does not lead to widespread and abrupt spikes in unemployment. Significant innova-tions are refined and perfected over time, which gives the labour market time to adjust and adapt accordingly. For example, kerosene replaced whale blubber as a lantern fuel, but it did not put whalers out of business overnight. Similarly, the first personal computers did not immedi-ately replace typewriters. Because replacing an existing product and method of business with a new one is ex-pensive, transitions happen over time.
*Key Concepts is a series of essays on the fundamentals of economics and markets. In addition to appearing in Fraser Forum, these essays will form the basis of a live Ask the Professor discussion, held at www.fraserinstitute.org each month.
Please join us on February 25 at 11:00 am Pacific time for an online discussion of this essay with Nick Schulz.
We see creative destruction happening all the time, but we must remember that new innovations may only change relative market share rather than absolute demand for a specific product or service. Bhide provides one example of this phenomenon:
Over 30 years after the introduction of minicomput-ers and more than 20 years after the introduction of microcomputers, the mainframe remains an impor-tant category. Total worldwide revenues of large-scale computer processors (or mainframes) amounted to $16 billion in 1997 compared to $16.2 billion in 1982. But because total demand grew from $38 billion to $183 billion, mainframes’ share of the total computer market dropped considerably, from 42% to about 9%.
Other examples abound. The development of the inter-net has pressured traditional newspapers but has not de-stroyed them overnight. Laser eye surgery has satisfied many customers but eyeglass shops are still prevalent. Re-cent scholarship such as Bhide’s provides a more nuanced view of Schumpeter’s important insight that capitalism is a dynamic and evolutionary process.
Suggestions for further reading
Baumol, William, Bob Litan, and Carl Schramm (2007). Good Capitalism, Bad Capitalism, and the Economics of Growth and Prosperity. Yale University Press.
Bhide, Amar (2000). The Origin and Evolution of New Busi-nesses. Oxford University Press.
Christiansen, Clayton (2003). The Innovator’s Dilemma. Harp-er Collins Business.
McGraw, Thomas (2007). Prophet of Innovation. Harvard University Press.
Schumpeter, Joseph (1942/2008). Capitalism, Socialism and Democracy. Harper.
Foto
lia

Foto
lia
10 Fraser Forum 02/10 www.fraserinstitute.org
The recession has left Ontario’s finances in a state of disarray; its Ministry of Finance is projecting a re-cord deficit of $24.7 billion for the 2009/2010 fiscal
year (Canadian Press, 2009, Oct. 22). Tax increases and/or cutbacks in public goods and services appear to be inevitable. This spells trouble for Ontario’s public health care system, which was financially unsustainable even before the recession began. On the other hand, the dismal financial situation in the province has created an optimal opportunity for Ontario to introduce significant health care reforms.
The most recent data show that over the last 10 years (1999/2000 to 2008/2009) provincial government health expenditures grew at an average annual rate of 7.3% (Sta-tistics Canada, 2009). At the same time, gross domestic product (GDP) in Ontario grew at an average annual rate of only 4.5%, while the province’s total available revenue from all sources (TAREV) grew at an average rate of 5.6% annually (Statistics Canada, 2009). This is problematic because it means that government spending on health care has consistently grown faster than the province’s ability to pay for it.
The Ontario government is quickly running out of money. Last year (2008/2009), government health ex-penditures in Ontario accounted for 46.4% of TAREV (Statistics Canada, 2009). Figure 1 shows that, based on the most recent 10-year trends in government health care spending and total available revenue, provincial health care expenditures will consume 50% of TAREV by 2014 and 75% of TAREV by 2038 if Ontario does not change the way in which it currently finances health care (Skin-ner and Rovere, 2009).
Figure 1 also shows the years in which government health care spending will consume 75% and 100% of total “own-source” revenue—the revenue the province
generates for itself primarily through taxes, excluding revenue transferred from other provinces or from the federal government. These projections indicate that if Ontario does not significantly restructure the way it finances health care, then health care spending will consume 75% and 100% of the province’s own-source revenue by 2019 and 2030, respectively.
Recent economic circumstances have made the situ-ation much worse than indicated in figure 1. The most recent one-year trend data show that government health expenditures in Ontario are on pace to consume 50% of all provincial revenue by this year (2010) (Skinner and Rovere, 2009).
As health care costs consume a larger share of pro-vincial revenues, spending on other government servic-es will have to be reduced. The alternative is to reduce health care funding in order to preserve funding for other government services. Yet, Ontario has banned private sources of funding for health care. This means that, in the absence of meaningful reform, the government can only address the problem by raising taxes, cutting health care services, or both. Neither would be good for Ontario’s patients and taxpayers.
The reality is that if the province does not legalize private health care financing, then we will quickly find ourselves reliving the 1990s when severe cutbacks in health care spending were made in an attempt to con-trol spiralling costs. Wait times increased, the availabil-ity of medical technology declined, and it became more difficult for Ontarians to find a regular family physician (Esmail and Walker, 2008; Chan, 2002).
If the Ontario government continues to be the sole funder and provider of health care, then Ontarians can expect to pay more for their health care services in the future while getting much less in return. Governments
marK rovere anD Brett J. sKinner
Will Ontario taxpayers continue to pay more and get less?
Health care at a crossroads

Figure 1: Ontario − projected government health expenditures (GHEX), total available revenue (TAREV), and total available own-source revenue (OAREV), based on 10-year trends in GHEX, TAREV,
and OAREV, 1999/2000 to 2008/2009
Source: Skinner and Rovere, 2009.
0
100,000
200,000
300,000
400,000
500,000
2040203520302025202020152010
Mill
ion
s of
cur
rent
dol
lars
GHEX=75% OAREV
GHEX=50% TAREV
GHEX=100% OAREV
GHEX=75% TAREV
www.fraserinstitute.org Fraser Forum 02/10 11
must stop using health care as a political pawn and should introduce sound incremental reforms that will improve the sustainability of our health care system.
The province should require flat percentage-based co-payments for all publicly funded medical goods and services.1 Ontario should also recognize the right of pa-tients to pay for and be insured privately for all types of medical goods and services. Finally, medical providers (for-profit and non-profit) should be allowed to compete for the delivery of publicly insured health services. By taking advantage of for-profit and non-profit health ser-vice providers in the private sector, the province would be able to reduce government health expenditures while improving medical care. Medical providers would have the necessary incentives to compete both on price and service, inevitably benefiting both taxpayers and patients.
These policies are consistent with existing practice in most European countries (Esmail and Walker, 2008). Further, economic research shows that cost-sharing2 re-duces health care expenditures without causing adverse health outcomes, as long as individuals with chronic con-ditions (especially those who are poor) are exempt from paying for certain preventative medical services out of pocket (Newhouse et al., 1993).
Taking advantage of market incentives by making patients directly responsible for a portion of their publicly funded health care costs will ease health care inflation. Moreover, legalizing private insurance options for health care will allow patients to have control over their medical
insurance benefits and will shift costs off taxpayers.
Under its current structure, Ontario’s health care system is financially unsustainable. Un-less patients and providers are given appropriate incentives such as cost-sharing, we can ex-pect Ontario’s health care ser-vices to continue to deteriorate.
Notes
1 Instead of a fixed user fee for medical services, a percentage-based co-payment (also referred to as “co-insurance”) provides pa-tients with the price signals they need to choose between various treatments. As a result, the alloca-tion of medical resources will fol-low demand instead of a centrally planned formula.
2 The Rand Health Insurance Ex-periment used multiple types of
cost-sharing mechanisms and found that co-insurance (per-centage-based co-payments) had the most significant effect on reducing utilization.
References
Canadian Press (2009, October 22). QuickList of Provincial and Federal Finances. Yahoo! News Canada. <http://ca.news.yahoo.com/s/capress/091022/national/provincial_finances_quicklist>.
Chan, Benjamin T.B. (2002). From Perceived Surplus to Per-ceived Shortage: What Happened to Canada’s Physician Workforce in the 1990s? Canadian Institute for Health Information.
Esmail, Nadeem, and Michael Walker (2008). How Good Is Canadian Health Care? 2008 Report: An International Comparison of Health Systems. Fraser Institute.
Newhouse, Joseph P., and the Insurance Experiment Group (1993). Free for All? Lessons from the RAND Health Insur-ance Experiment. Harvard University Press.
Skinner, Brett J., and Mark Rovere (2009). Paying More Getting Less: Measuring the Sustainability of Government Health Spending in Canada (2009 Report). Fraser Institute. <www.fraserinstitute.org>.
Statistics Canada (2009). Financial Management System (FMS) 2009. Statistics Canada.
TAREV
OAREV
GHEX

12 Fraser Forum 02/10 www.fraserinstitute.org
If you drive regularly or commute to work, you have likely experienced road congestion. Road congestion not only causes frustration among drivers, but it also
costs the economy in terms of lost time and unnecessary transportation costs, which are borne by both individuals and businesses. In Canada, the total annual cost of con-gestion in major urban areas is estimated to be between $2.3 billion and $3.7 billion (in 2002 dollars), with more than 90% of that cost coming from the value of lost time for drivers and passengers (Transport Canada, 2006). Fortunately, there is a way to allocate scarce road space more efficiently and reduce the costs of road congestion: making use of the price system.
Many economists have long advocated congestion pricing to reduce road congestion because it gives drivers an incentive to change their behaviour. With congestion pricing, drivers pay a fee to use a road, usually in the form of a toll, which varies according to the time of day the road is used. For instance, drivers pay a higher fee during peak periods when road capacity is scarce (i.e., during rush hour) and a lower fee during non-peak pe-riods when capacity is in excess (i.e., in the late evening). When faced with paying a fee, fewer drivers use the road during peak periods and congestion is reduced.
Congestion fees (tolls) no longer need to be collected at toll booths as modern toll systems collect fees elec-tronically, requiring no stoppages in traffic. Vehicles are outfitted with wireless radio frequency transponders that are read by overhead antennas that detect and bill drivers according to use. Drivers without a transponder get their license plate photographed and receive a bill in the mail, which typically requires them to pay a higher fee.
A number of studies confirm the effectiveness of congestion pricing. A recent report by the Congressional Budget Office (CBO), the US agency that reviews congres-sional budgets and other legislative initiatives with bud-getary implications, provides a comprehensive evaluation of congestion pricing. The report, which examines both the benefits and challenges of congestion pricing, is im-portant because it draws conclusions based on real-world
evidence rather than theory. The evidence summarized by the CBO comes from several reputable sources and is based mainly on the results of congestion pricing in Lon-don, New York, New Jersey, California, and Minnesota. The report found that congestion pricing reduces conges-tion,1 shortens travel times, makes travel times more con-sistent, and increases the efficient use of highway capacity.
For example, congestion pricing in London reduced traffic within the Central London charging zone by 15% and reduced congestion by 30%. Congestion pricing also reduced travel times for trips entering and exiting the congested zone by 14% and reduced the variability of trip times by 30%.2 All told, London’s congestion pric-ing scheme produces benefits to society amounting to an estimated US$122 million per year (net of costs).3
Congestion pricing has also been successful in the United States. Following the introduction of congestion pricing, traffic in the peak morning period on the bridges and tunnels of the Port Authority of New Jersey and New York declined by 7%, while traffic in the peak afternoon period fell by 4%. Similarly, traffic and travel times on California’s State Route 91 declined after congestion pric-ing was instituted. After accounting for the value of driv-ers’ travel time, congestion pricing on Route 91 reduced congestion enough to generate a net savings of more than US$2 per trip. These savings amount to an estimated US$12 million per year (net of costs) in benefits to society.4
The CBO noted that nationwide implementation of congestion pricing in the United States could provide an-nual benefits to society (net of costs) estimated conserva-tively at US$19 billion.5 In addition, calculations by the US Department of Transportation suggest that widespread
Charles lammam
The benefits of congestion pricing
Foto
lia

www.fraserinstitute.org Fraser Forum 02/10 13
implementation of congestion pricing could reduce the amount of investment needed to maintain the US highway system at its current physical condition and operational performance by more than 25% (Department of Transpor-tation, Federal Highway Administration, 2007).
While congestion pricing has the potential to produce substantial benefits, some challenges may impede its adop-tion, including concerns about the unequal distribution of benefits and costs among low- and high-income drivers,6 increased congestion on other (non-priced) roads, and the high cost of building and operating congestion pric-ing systems. However, the CBO found that many of these concerns are either misplaced or can be mitigated.
For example, despite the argument that congestion pricing hurts low-income drivers, the CBO’s summary of the findings of public opinion surveys indicates broad levels of support for congestion pricing across all income groups in areas where it has been introduced. The surveys also show that the public prefers tolls over tax increases for the funding of new roads.
While not discussed explicitly by the CBO, tolls pro-vide an important revenue stream to fund and maintain new transportation infrastructure, making it possible to increase road capacity. However, in situations where tolls are added to existing infrastructure, governments should ensure that taxes are reduced by an equal magnitude to avoid double-charging drivers. That way drivers can de-cide voluntarily whether to pay for the privilege of using a particular road.
The concern that congestion pricing increases con-gestion on alternative (non-priced) routes appears mis-placed. The CBO report points to studies finding that drivers generally changed their travel decisions in re-sponse to congestion pricing without increasing conges-tion at alternative times or on alternative routes or modes.
Finally, to mitigate the concern about the high cost of administering and collecting congestion fees, the CBO recommended the use of interoperable electronic fee col-lection systems. Interoperable systems would allow driv-ers to use a single transponder for multiple electronic toll collection systems. This would facilitate coordination and allow different systems to operate together without imposing high costs on users.
Overall, the CBO’s report suggests that congestion pricing is an effective tool for reducing traffic congestion. The significant benefits of using the price system to allocate road space include reduced congestion, shorter and more consistent travel times, and more efficient use of highway capacity. Importantly, congestion pricing can save peo-ple and businesses the cost of time lost while drivers are stuck in traffic. Since the practical challenges impeding the adoption of congestion pricing are relatively minor and can be overcome, perhaps it’s time to seriously consider expanding the use of congestion pricing in Canada.
Notes
1 The CBO noted that a 10% increase in a congestion fee gen-erally reduces traffic congestion by up to 5% and shifts traffic away from the periods with the highest charges.
2 The reduction in the variability of travel time is especially important since highway users place a high value on reliable travel time. In some cases, the value they place on reliable travel time may be greater than the value they place on reduc-tions in travel time (CBO, 2009).
3 The estimated net social benefit of congestion pricing in Cen-tral London accounts for the cost incurred by people who are inconvenienced by the congestion charge and switch to public transportation as a result.
4 Regarding California’s Route 91, the CBO does not state whether the net social benefit calculation accounts for the costs incurred by people who are diverted from the priced roadway.
5 This conservative estimate of the net social benefit of nation-wide implementation of congestion pricing in the US com-pares the economic benefits due to time savings and reduced accidents to the loss of economic value to highway users who are diverted to other times of day, other routes, or other modes, as well as the costs of toll collection and administration.
6 Since a given congestion fee represents a larger proportion of income for a low-income driver than for a high-income driver, these fees are said to be regressive. However, this ar-gument also applies to other forms of highway user fees such as fuel taxes, which can be even more inequitable. With fuel taxes, lower-income people often fund the mobility of higher-income people. Higher-income individuals are more likely to be able to afford new, better-mileage cars and will therefore pay less gasoline tax. People who are less able to afford a new-er, more fuel-efficient car end up subsidizing those higher-income individuals. In addition, with fuel taxes, automobile drivers end up subsidizing the mobility of for-profit trucking firms who impose most of the wear on highways.
References
Congressional Budget Office [CBO] (2009). Using Pric-ing to Reduce Traffic Congestion. Congress of the United States. <http://www.cbo.gov/ftpdocs/97xx/doc9750/03-11-CongestionPricing.pdf>.
Department of Transportation, Federal Highway Ad-ministration (2007). 2006 Status of the Nation’s Highways, Bridges, and Transit: Conditions and Per-formance. United States Government. <http://www.fhwa.dot.gov/policy/2006cpr/pdfs/esblue.pdf>.
Transport Canada (2006). The Cost of Urban Conges-tion in Canada. Government of Canada. <http://www.gatewaycouncil.ca/downloads2/Cost_of_Con gestion_TC.pdf>.

THE RISING COST OF HEALTH CARE FocusForum
14 Fraser Forum 02/10 www.fraserinstitute.org
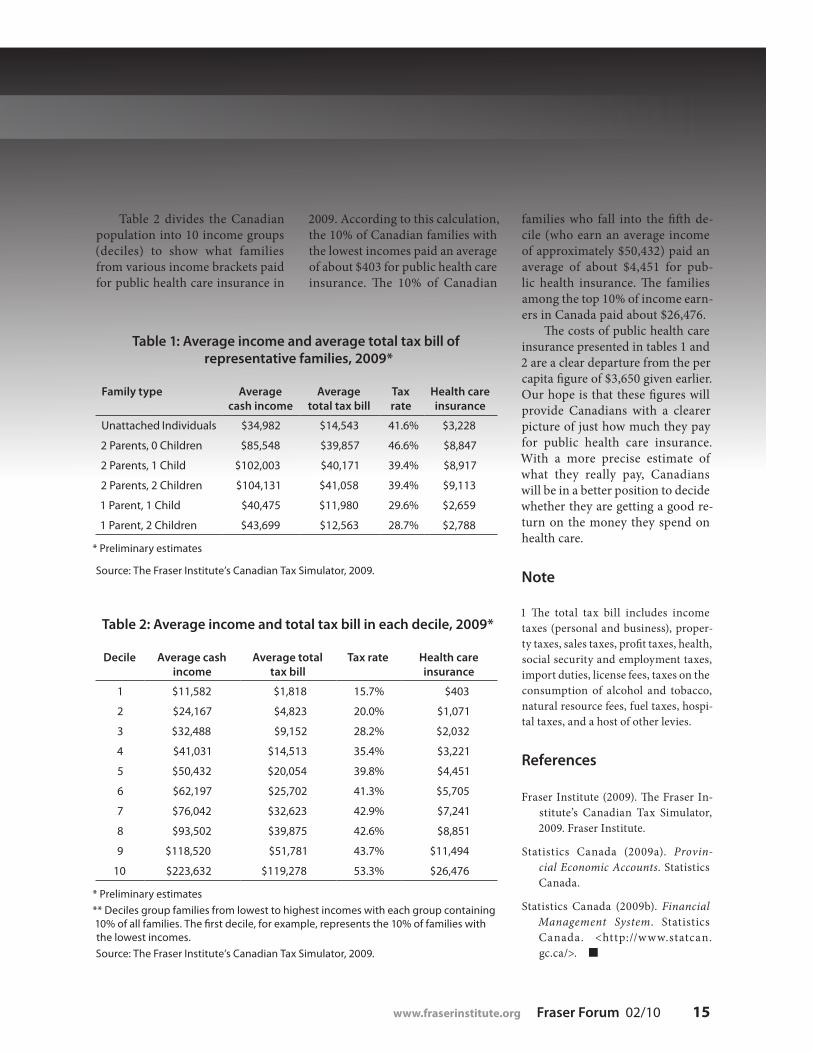
Canadians often misunder-stand the true cost of their public health care system.
This is partly because health care consumption is free at the point of use, leading many to grossly under-estimate the actual cost of the care delivered. Furthermore, health care is financed through general govern-ment revenues rather than through a dedicated tax, further blurring the true dollar cost of the service. In ad-dition, health spending numbers are often presented in aggregate, which results in a number so large that it becomes almost meaningless to the average Canadian. For instance, consider that nearly $121.6 billion of our tax dollars was spent on public-ly funded health care in 2008/2009 (Statistics Canada, 2009b). If Cana-dians understood the true cost of their publicly funded health care system, they would be able to better assess whether they were receiving
value for their money.A more informative measure of
the cost of our health care system is health spending on a per capita basis. The $121.6 billion spent on health care in 2008/2009 works out to approximately $3,650 per Cana-dian. This would be the cost of the public health care insurance plan if every Canadian resident paid an equal share. But some Canadians are children and dependents and thus are not taxpayers, and Canadians certainly do not pay equal amounts in taxes each year. Given the nature of our tax system, higher income earners bear a greater proportion of the tax burden than lower income earners and thus contribute propor-tionally more to our public health care system.
In order to more precisely esti-mate the cost of public health care insurance for the average Canadian family in 2009, we must determine
how much tax an average family pays to all three levels of govern-ment. The percentage of the fam-ily’s total tax bill1 that pays for public health insurance is then assumed to match the share of total government tax revenues (including natural re-source revenues) dedicated to health care (24.5% in 2008/2009) (Statistics Canada, 2009a, 2009b; calculations by authors). Table 1 shows six Cana-dian family types, the estimated av-erage income for those family types in 2009, and their estimated dollar contribution to health care.
In 2009, the average unattached (single) individual, who earned slightly less than $35,000, paid approximately $3,228 for public health care insurance. An average Canadian family consisting of two adults and two children (earning a little more than $104,100) paid about $9,100 for public health care insurance.
naDeem esmail anD milagros PalaCios
How much do we really pay?The price of public health insurance
$9,113
Foto
lia
www.fraserinstitute.org Fraser Forum 02/10 15
families who fall into the fifth de-cile (who earn an average income of approximately $50,432) paid an average of about $4,451 for pub-lic health insurance. The families among the top 10% of income earn-ers in Canada paid about $26,476.
The costs of public health care insurance presented in tables 1 and 2 are a clear departure from the per capita figure of $3,650 given earlier. Our hope is that these figures will provide Canadians with a clearer picture of just how much they pay for public health care insurance. With a more precise estimate of what they really pay, Canadians will be in a better position to decide whether they are getting a good re-turn on the money they spend on health care.
Note
1 The total tax bill includes income taxes (personal and business), proper-ty taxes, sales taxes, profit taxes, health, social security and employment taxes, import duties, license fees, taxes on the consumption of alcohol and tobacco, natural resource fees, fuel taxes, hospi-tal taxes, and a host of other levies.
References
Fraser Institute (2009). The Fraser In-stitute’s Canadian Tax Simulator, 2009. Fraser Institute.
Statistics Canada (2009a). Provin-cial Economic Accounts. Statistics Canada.
Statistics Canada (2009b). Financial Management System. Statistics Canada. <http://www.statcan.gc.ca/>.
Table 1: Average income and average total tax bill of representative families, 2009*
Family type Average cash income
Average total tax bill
Tax rate
Health care insurance
Unattached Individuals $34,982 $14,543 41.6% $3,228
2 Parents, 0 Children $85,548 $39,857 46.6% $8,847
2 Parents, 1 Child $102,003 $40,171 39.4% $8,917
2 Parents, 2 Children $104,131 $41,058 39.4% $9,113
1 Parent, 1 Child $40,475 $11,980 29.6% $2,659
1 Parent, 2 Children $43,699 $12,563 28.7% $2,788
* Preliminary estimates
Source: The Fraser Institute’s Canadian Tax Simulator, 2009.
Table 2: Average income and total tax bill in each decile, 2009*
Decile Average cash income
Average total tax bill
Tax rate Health care insurance
1 $11,582 $1,818 15.7% $403
2 $24,167 $4,823 20.0% $1,071
3 $32,488 $9,152 28.2% $2,032
4 $41,031 $14,513 35.4% $3,221
5 $50,432 $20,054 39.8% $4,451
6 $62,197 $25,702 41.3% $5,705
7 $76,042 $32,623 42.9% $7,241
8 $93,502 $39,875 42.6% $8,851
9 $118,520 $51,781 43.7% $11,494
10 $223,632 $119,278 53.3% $26,476
* Preliminary estimates
** Deciles group families from lowest to highest incomes with each group containing 10% of all families. The first decile, for example, represents the 10% of families with the lowest incomes.
Source: The Fraser Institute’s Canadian Tax Simulator, 2009.
Table 2 divides the Canadian population into 10 income groups (deciles) to show what families from various income brackets paid for public health care insurance in
2009. According to this calculation, the 10% of Canadian families with the lowest incomes paid an average of about $403 for public health care insurance. The 10% of Canadian

Forum THE RISING COST OF HEALTH CAREFocus
16 Fraser Forum 02/10 www.fraserinstitute.org
Despite the economic downturn, health care spending grew nearly 5% per Cana-dian between 2008 and 2009, according to esti-
mates by the Canadian Institute for Health Information (CIHI, 2009a). Some Canadians may believe that increas-ing health spending will protect or even improve their access to health care services, but a closer look suggests that they are mistaken.
Past research on the relationship between public health expenditures and wait times for health care in Canada suggests that either no relationship exists or that a positive relationship exists where more spending is re-lated to longer wait times.
Martin Zelder first examined the relationship be-tween health expenditures and wait times in a study published in 2000. His analysis examined wait times and public expenditures between 1993 and 1998 and controlled for the percentage of elderly persons in the population, per capita disposable income, the political party in power, and the frequency of health sector strikes. His analysis revealed that provinces that spent more on health care per person had neither shorter nor longer weighted median wait times than provinces that spent less. In addition, provinces that spent more did not have higher rates of surgical specialist services (consultations plus procedures) and actually had lower rates of proce-dures and major surgeries (for the complete results of this analysis, see Zelder, 2000).
A follow-up study in 2003 using a similar methodolo-gy (controlling for the elderly population and GDP) found that increased health expenditures were actually corre-lated with increases in wait times, unless those spending increases were targeted at physician or pharmaceutical expenditures, in which case increased health expenditures
were correlated with decreases in wait times1 (Esmail, 2003).
As several years have passed since these studies were published and notable reductions in wait times have occurred in some provinces in recent years, it is worthwhile to revisit the relationship between wait times and spending to deter-mine if the addition of several years of data leads to different conclusions.
Revisiting these studies involves comparing total wait times for health care, published in the Fraser Institute’s annual Waiting Your Turn surveys, with public expenditures on health care in Canada from 1993 to 2009,2 using a statistical technique known as regression analysis. In addition to the comparison of wait times and health expenditures, our analysis controls for the effects of GDP and the age of the population on wait times. Increases in income (i.e., GDP) can be expected to in-crease the demand for health care services and thus to have some effect on wait times. Similarly, the impact of natural deterioration on health care demand (i.e., older people re-quire more care) can be expected to have some effect on wait times. The re-gression analysis also controls for the effect of last period waiting
Spend more, wait less?
BaCChus Barua anD naDeem esmail
Foto
lia
www.fraserinstitute.org Fraser Forum 02/10 17
Table 1: Variables
Variable Definition
TWAIT Total waiting time from referral by GP to treatment (weeks)
TS Total public health expenditure per capita ($1997)
PS Public physician spending per capita ($1997)
P65 Proportion of provincial population over the age of 65 (%)
AR(1) Total waiting time in the previous year
RGDP Real GDP per capita ($1997)
Table 3: Regression results Dependent Variable: TWAIT
Variable Coefficient T-Statistic
C -2.115529 -0.168238
TS-PS 0.006402 3.860793**
PS -0.017312 -2.520425**
RGDP 8.75E-05 0.670227
P65 0.974542 1.449657
AR(1) 0.764481 9.094601**
Details and weighted statistics:
Adjusted R-Squared, 0.809992
Method: Pooled EGLS (cross-section weights)
Total pool (balanced) observations: 150 (15 years x 10 provinces) We lose 1 year due to the inclusion of the AR(1) term.
White cross-section standard errors and covariance (d.f. corrected)
** This variable is significant at the 5% level.
Table 2: Regression results Dependent Variable: TWAIT
Variable Coefficient T-Statistic
C 0.426187 0.027817
TS 0.002527 1.666514*
RGDP 8.58E-05 0.577240
P65 0.692271 0.875946
AR(1) 0.818335 9.904563**
Details and weighted statistics:
Adjusted R-Squared, 0.797040
Method: Pooled EGLS (cross-section weights)
Total pool (balanced) observations: 150 (15 years x 10 provinces) We lose 1 year due to the inclusion of the AR(1) term.
White cross-section standard errors and covariance (d.f. corrected)
* This variable is significant at the 10% level.
** This variable is significant at the 5% level.
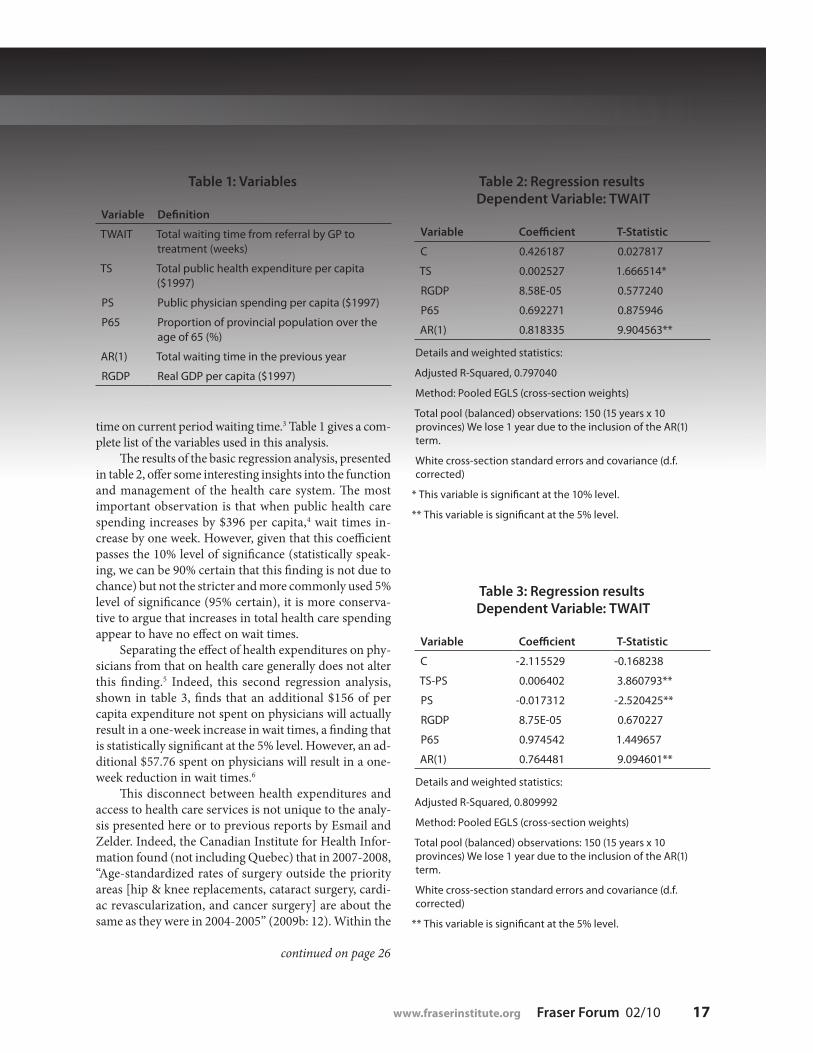
time on current period waiting time.3 Table 1 gives a com-plete list of the variables used in this analysis.
The results of the basic regression analysis, presented in table 2, offer some interesting insights into the function and management of the health care system. The most important observation is that when public health care spending increases by $396 per capita,4 wait times in-crease by one week. However, given that this coefficient passes the 10% level of significance (statistically speak-ing, we can be 90% certain that this finding is not due to chance) but not the stricter and more commonly used 5% level of significance (95% certain), it is more conserva-tive to argue that increases in total health care spending appear to have no effect on wait times.
Separating the effect of health expenditures on phy-sicians from that on health care generally does not alter this finding.5 Indeed, this second regression analysis, shown in table 3, finds that an additional $156 of per capita expenditure not spent on physicians will actually result in a one-week increase in wait times, a finding that is statistically significant at the 5% level. However, an ad-ditional $57.76 spent on physicians will result in a one-week reduction in wait times.6
This disconnect between health expenditures and access to health care services is not unique to the analy-sis presented here or to previous reports by Esmail and Zelder. Indeed, the Canadian Institute for Health Infor-mation found (not including Quebec) that in 2007-2008, “Age-standardized rates of surgery outside the priority areas [hip & knee replacements, cataract surgery, cardi-ac revascularization, and cancer surgery] are about the same as they were in 2004-2005” (2009b: 12). Within the
continued on page 26

Forum THE RISING COST OF HEALTH CAREFocusFo
tolia
, iSt
ock
ph
oto
18 Fraser Forum 02/10 www.fraserinstitute.org
naDeem esmail
In recent years, a number of companies aiming to provide Canadians with easier access to medically necessary treatments outside Canada have appeared
in Canada and elsewhere. Of course, leaving Canada for medically necessary treatment is nothing new—Ca-nadians have been doing so for many years, either in response to the unavailability of certain treatments in Canada or in response to long wait times for medically necessary treatment. This has left many wondering ex-actly how many Canadians receive treatment outside Canada each year.
While data on this topic are difficult to come by, it is possible to estimate the number using the results of the Fraser Institute’s Waiting Your Turn survey and the counts of procedures completed each year in Canada, which are provided by the Canadian Institute for Health Information (CIHI).1 While the computations below are approximate, they are the most complete estimates available in Canada today, and they should provide some insight into how many Canadians are choosing to seek care outside Canada. The calculations also provide some
insight into the number of Canadians who might choose to stay in Canada and pay for treatment in their home province, if only that province’s government would devi-ate from the status quo and allow them to do so.
Methodology
Each year, the Fraser Institute’s Waiting Your Turn survey asks physicians across Canada, in 12 major medical spe-cialties, the question, “Approximately what percentage of your patients received non-emergency medical treat-ment in the past 12 months outside Canada?” (emphasis in original). The answers to this question are averaged for each of the specialties studied in Waiting Your Turn for each province, producing a table that reports the average percentage of patients receiving treatment out-side Canada (Esmail, 2009: table 11). In 2009, 1.0% of all patients in Canada were estimated to have received non-emergency medical treatment outside Canada, an increase from 0.8% in 2008.
Leaving Canada for
medicalcare

www.fraserinstitute.org Fraser Forum 02/10 19
Combining these percentages with the number of procedures performed in each province and in each medi-cal specialty gives a rough estimate of the number of Ca-nadians who actually received treatment outside Canada. Two data-related issues must be noted before discussing the estimate. First, the number of procedures performed in Canada is not readily available from the Canadian In-stitute for Health Information (CIHI). Notably, Alberta and Quebec do not provide complete discharge abstract data (DAD) to the CIHI, which is the source for the proce-dures counts data used in Waiting Your Turn. The authors of Waiting Your Turn address this concern by making a pro-rated estimate of procedures using older hospitaliza-tion data. These estimated procedure counts fill in for the actual number of procedures in Alberta and Quebec.
Second, there is a temporal mismatch between the timing of the Fraser Institute’s Waiting Your Turn survey and the CIHI’s annual DAD release. Specifically, proce-dure counts data used for Waiting Your Turn are typically one year behind (e.g., the 2009 edition of Waiting Your Turn used procedure counts from 2007/2008). While the
calculation below uses the temporally mismatched pro-cedures counts to provide up-to-date information, pre-vious calculations adjusting for the temporal mismatch show that it does not appear to materially affect the trend witnessed in the overall count of Canadians. However, it does, as expected, affect the actual counts of Canadians (Esmail, 2007).2
The counts of the number of patients receiving treat-ment outside Canada each year that are produced by this methodology are likely to underestimate the actual number of patients being treated outside Canada. This is the result of a few factors. First, and most importantly, these numbers are based on specialist responses, which means that patients who leave Canada without consulting
Table 1: Estimated number of patients receiving treatment outside Canada, 2009
BC AB SK MB ON QC NB NS PE NL CAN
Plastic surgery 33 34 3 0 80 49 6 73 0 0 279
Gynaecology 136 90 72 33 1,701 214 15 0 5 35 2,300
Ophthalmology 517 498 40 0 1,182 961 123 0 — 19 3,341
Otolaryngology 115 276 0 47 465 277 10 5 — 0 1,194
General surgery 1,190 625 102 25 2,216 1,391 11 80 0 0 5,638
Neurosurgery 128 0 — 0 408 97 16 0 — — 648
Orthopaedic surgery 196 226 25 24 1,355 149 21 27 3 11 2,038
Cardiovascular surgery 55 57 99 — 96 92 0 0 0 — 399
Urology 599 412 0 26 2,064 438 23 110 — 54 3,727
Internal medicine 382 776 22 216 1,945 857 33 70 0 82 4,383
Radiation oncology 6 16 — 0 82 11 15 — — 1 132
Medical oncology 87 80 — — 191 74 11 4 0 — 448
Residual* 1,883 2,264 344 307 8,725 2,305 213 231 7 197 16,478
Total 5,327 5,354 707 678 20,510 6,917 497 601 15 400 41,006
* The residual count was produced using the average provincial percentage of patients receiving treatment outside Canada and the residual count of procedures produced in Waiting Your Turn.
Source: Esmail, 2009; calculations by author.

Forum THE RISING COST OF HEALTH CAREFocus
20 Fraser Forum 02/10 www.fraserinstitute.org
a specialist are not likely to be included in the count shown in table 1. Second, the counts are based on the number of procedures estimated to have been performed in Canada, which is less than the total number of patients consulted and less than the total number of Canadians who would have required treatment, including those who left Canada to seek it.
An estimated count of patients leaving Canada
The products of the percentage of patients receiving non-emergency treatment outside of Canada and the number of patients treated in Canada as estimated in Waiting Your Turn are shown in table 1.
A significant number of Canadians—an estimated 41,006 in total—received treatment outside Canada in 2009. There was a notable increase in the overall number of patients receiving treatment outside Canada between 2008 and 2009. Specifically, an estimated 33,492 Cana-dians were estimated to have received treatment outside Canada in 2008 compared to 41,006 in 2009. Increases in the estimated number of patients going outside Canada for treatment were seen in British Columbia (4,831 to 5,327), Manitoba (449 to 678), Ontario (15,424 to 20,510), Quebec (4,567 to 6,917), and Prince Edward Island (6 to 15). Conversely, Alberta (5,510 to 5,354), Saskatchewan (821 to 707), New Brunswick (669 to 497), Nova Scotia (742 to 601), and Newfoundland and Labrador (473 to 400) all saw decreases in the estimated number of pa-tients treated outside Canada.
This national increase in the estimated number of patients treated outside Canada occurred at the same time as a national decrease in the median wait time for medically necessary treatment. Specifically, the national median wait time for treatment after consultation with a specialist was 8.7 weeks in 2008 and 8.0 weeks in 2009. However, the same is not true among all of the provinces. From 2008 to 2009, wait times fell in British Columbia,
Saskatchewan, Manitoba, Ontario, Quebec, Nova Sco-tia, and Prince Edward Island, but rose in Alberta, New Brunswick, and Newfoundland and Labrador.
Conclusion
In 2009, an estimated 41,006 Canadians received non-emergency medical treatment outside Canada. This esti-mate is a noteworthy figure and is likely to be an under-estimate of the actual number of patients who received treatment outside Canada that year. This number repre-sents a significant potential economic loss to Canada. If the provinces were willing to allow private financing of medically necessary care, Canadians likely could have captured the dollars spent by many of the patients who went abroad.
Notes
1 This includes estimates for some provinces that do not pro-vide comparable data to the CIHI.
2 Specifically, the Canadian counts with the temporal mis-match for 2004, 2005, and 2006 were 49,392, 44,022, and 39,282, respectively. Accounting for the mismatch, the counts for 2004 and 2005 were 47,011 and 45,776, respectively (Es-mail, 2007).
References
Esmail, Nadeem (2007). Receiving Medical Treatment Out-side of Canada. Fraser Forum (February): 5–8.
Esmail, Nadeem (2009). Waiting Your Turn: Hospital Waiting Lists in Canada (19th ed.). Fraser Institute.
Hazel, Maureen, and Nadeem Esmail (2008). Receiving Medi-cal Treatment Outside of Canada. Fraser Forum (Decem-ber/January): 16–18.

www.fraserinstitute.org Fraser Forum 02/10 21
Since January 1, 2010, all natural health products for sale in Canada have had to comply with all of the Natural Health Products Regulations (NHPR).
Under the regulations, natural health products (NHPs) are considered a sub-category of drugs and must undergo pre-market evaluation and receive product li-censes from the Natural Health Products Directorate (NHPD) to be marketed in Canada. Prior to the regu-lations, NHPs were considered either a food or a drug, depending on the product, which meant that regulation was either much less onerous (foods) or was based on a previously established model (drugs).
The road to the NHPR began in 1997 when the federal government set up a Standing Committee on Health to conduct a review of the issues surrounding the manufacture, distribution, and use of NHPs. Included in the committee’s 53 recommendations was the creation of a new regulatory authority. The NHPD was created in 1999 and the regulations were implemented in 2004. Products that had drug identification numbers when the NHPR came into effect were permitted to maintain them, if so desired, and to be sold for six years before obtaining a NHP product license (Health Canada, 2008). But, by now, they must have a natural product number (NPN) or they will be pulled off the shelves. NHPs pre-viously treated as foods were required to have an NPN by January 1, 2010.
Sales of at least some of these products will stop in 2010 because of regulatory delays, while other products may disappear from the Canadian market altogether.
The NHPD has an enduring backlog. From January 2004 to September 30, 2009, the NHPD received 41,872 product license applications; 30,464 were completed, of which just under 52% (15,790) received licenses, while the others were either refused by NHPD or withdrawn by the applicant (NHPD, 2009b). In the second quarter of 2009, the NHPD was still processing applications from as far back as 2004 (NHPD, 2009b).
Some critics of the NHPD claim that most of the products approved to date have been single-ingredient products (i.e., the easiest to evaluate), and yet only about half of the products submitted to the NHPD have been granted licenses (Buckley, 2008). It is estimated that 60% to 75% of NHPs will ultimately disappear from the market because of the NHPR (Buckley, 2008). Other products will either be withdrawn from, or will never come to, the mar-ket because of the cost and time required to go through the regulatory process, which becomes more onerous as the product composition becomes more complicated.
The public safety argument
One of the rationales behind creating the directorate and the regulations was the need to increase the safety of Canadians. In 2004, sales of NHPs amounted to about $4.3 billion and numbered around 40,000 to 50,000 prod-ucts (Health Canada, 2004). A 2006 survey on the use of complementary and alternative medicine (CAM) found that more than one-half of Canadians had used at least
Unnatural regulation
Cynthia ramsay
It’s time to abolish the Natural Health Products Directorate
Fotolia

Forum THE RISING COST OF HEALTH CAREFocus
22 Fraser Forum 02/10 www.fraserinstitute.org
one alternative therapy in the year prior to the survey, a four percentage-point increase over the rate of use in 1997 (Esmail, 2007). The size of the industry and the in-creased use of NHPs in Canada were the main reasons given for broadening the regulatory framework covering these products.
However, there is little evidence to support the pub-lic safety argument. Survey data and studies indicate that Canadians are responsible users of NHPs, the vast major-ity of which are self-care products (i.e., they do not re-quire the buyer to see a health practitioner). For example, more Canadians agreed (46%) than disagreed (24%) that many claims made by the manufacturers of natural health products are unproven, but few agreed (12%) that they were advised against using NHPs or that NHPs were harmful to use (14%) (Ipsos Reid, 2005: 9).
Furthermore, surveys show that unwanted side ef-fects or reactions to NHPs are not common. Only 12% of NHP users surveyed in 2005 reported experiencing unwanted side effects or reactions to NHPs (Ipsos Reid, 2005: 9). In a 2006 survey, the participants who said that they had experienced an adverse drug reaction (ADR) most often experienced it as a result of taking a prescrip-tion drug (68%), while 6% said their ADR was the result of taking a nonprescription drug; 4% attributed their ADR to a natural health product and 4% to an interaction between two or more different types of products (Decima Research, 2006: 37).
Worldwide, there are relatively few adverse reactions to NHPs. If the incidence of adverse reactions and death from NHPs in Canada is similar to that in the United States and the United Kingdom, then each year in Canada there are two to six deaths caused by NHPs and 39 to 55 adverse reactions (Ramsay, 2009). By comparison, each year between 9,250 and 23,750 people in Canada expe-rience a preventable adverse event in hospital and later die—more than the number who die from breast cancer, motor vehicle and other transport accidents, and HIV combined (CIHI, 2007). In 2005, more than 2,300 Cana-dians died from falls, 205 from complications following medical and surgical care, and 122 from exposure to the forces of nature (Statistics Canada, 2005).
Indeed, the NHPR are completely unnecessary as regulations already exist to protect Canadians from unsafe production facilities and bad actors. The Cana-dian Food and Drug Act prohibits the sale of foods and drugs containing any poisonous or harmful substances or which are adulterated or processed under unsanitary conditions, and it is illegal to advertise any food or drug in a false, misleading, or deceptive manner.
The NHPR are not only tackling a nonexistent safety issue and reducing choice for Canadians seeking NHPs, but they are doing so at a substantial cost. For example, one study that examined just 12 companies found that the new regulations have cost those companies and the Canadian economy more than $440 million1 (Stiefel-meyer et al., 2008). This figure includes the employment that would have been created had rejected and not-yet-approved NHPs been permitted to be made or sold here; it does not include the more than $90 million spent on the NHPD as of fiscal year 2008/2009 (NHPD, 2009a).
Conclusion
The Natural Health Products Regulations were put in place five years ago, but the Natural Health Products Di-rectorate has yet to provide any evidence that the regula-tions have improved Canadians’ access to safe, effective, and high-quality natural health products. Since the cost of regulating NHPs seems to far outweigh the benefits, the Natural Health Products Directorate should be abol-ished. Once the NHPD is abolished, independent groups could verify the safety and quality of NHPs and their manufacturers, distributors, and other parties in the pro-cess. The quality of NHPs would likely be more actively monitored and standards more aggressively maintained because of competition between certifying organizations.
Note
1 This calculation includes “direct costs, opportunity costs to the food manufacturing companies looking to develop new
It is estimated that 60% to 75% of NHPs will ultimately disappear from the market because of the Natural Health Products Regulations.

www.fraserinstitute.org Fraser Forum 02/10 23
food products and/or market products with health claims, po-tential lost sales for retailers because of lack of product avail-ability and potential lost sales for primary producers. Overall opportunity costs to the economy were also examined; these losses include the food manufacturers and all upstream in-dustries’ output (lost sales), wages and salaries, foregone taxes, and employment that would have been created due to the eco-nomic activity” (Stiefelmeyer et al., 2008: 2).
References
Buckley, Shawn (2008). Disappearing Natural Health Products a Life and Death Issue. Health Action Magazine (Summer).
Canadian Institute for Health Information [CIHI] (2007). HSMR: A New Approach for Measuring Hospital Mortal-ity Trends in Canada. CIHI.
Canadian Standards Association [CSA] (2009). Health Care—Learn More. CSA. <http://www.csa.ca/cm/standards?packedargs=categor y%3D123818897388 9%26tabid%3D1239125088507>, as of June 28, 2009.
Certified General Accountants Association of Canada (2006). Tackling Compliance: Small Business and Regulation in Canada: Views of Publicly Traded Small and Medium-sized Entities (SMEs) and Accounting Practitioners (SMPs) in Canada. Certified General Accountants Association of Canada.
Decima Research (2006). Final Report: 2006 General Public Opinion Survey on Key Issues Pertaining to Post-Market Surveillance of Marketed Health Products in Canada. Health Canada.
Esmail, Nadeem (2007). Complementary and Alternative Medicine in Canada: Trends in Use and Public Attitudes 1997-2006. Fraser Forum (July/August): 19–22.
Health Canada (2004). Drugs and Health Products: Questions from Retailers. Health Canada. <http://www.hc-sc.gc.ca/dhp-mps/prodnatur/faq/question_retailers-detaillants-eng.php>, as of May 27, 2009.
Health Canada (2008). Compliance Policy for Natural Health Products. Health Canada. <http://www.hc-sc.gc.ca/dhp-mps/prodnatur/legislation/pol/complian-conform_pol-eng.php#tphp>, as of July 31, 2009.
Ipsos Reid (2005). Baseline Natural Health Products Survey Among Consumers: Final Report. Health Canada.
Natural Health Products Directorate [NHPD] (2009a). E-mail correspondence with author, March 2, 2009.
Natural Health Products Directorate [NHPD] (2009b). Status of Applications Quarterly Report: Quarter 2 (July 1, 2009 to September 30, 2009). Health Canada. <http://www.hc-sc.gc.ca/dhp-mps/prodnatur/report-rapport/qar_tri_2-09-eng.php>, as of November 25, 2009.
Ramsay, Cynthia (2009). Unnatural Regulation: Complemen-tary and Alternative Medicine Policy in Canada. Fraser Institute.
Statistics Canada (2005). CANSIM Table 102-0540: Deaths, by Cause, Chapter XX: External Causes of Morbidity and Mor-tality (V01 to Y89), Age Group and Sex, Canada, Annual (Number). Statistics Canada. <http://cansim2.statcan.gc.ca/cgi-win/cnsmcgi.exe?Lang=E&RootDir=CII/&ResultTemplate=CII/CII___&Array_Pick=1&ArrayId=1020540>, as of June 7, 2009.
Stiefelmeyer, Kate, Larry Martin, and Maria Klimas (2008). Food Regulatory Systems: Canada’s Performance in the Global Marketplace: A Case Study Approach. Food and Consumer Products of Canada, Agriculture and Agri-Food Canada.
iSto
ckp
hot
o

24 Fraser Forum 02/10 www.fraserinstitute.org
The results of the Canadian Provincial Investment Climate: 2009 Report, an annual Fraser Institute publication that empirically assesses and ranks
Canada’s provinces on the attractiveness of their invest-ment climates, can be summed up by an excerpt from Bob Dylan’s popular song, “The Times They Are A-Changin’ ”: “The order is rapidly fadin’ and the first one now will later be last … for the times they are a-changin’ .”
Indeed, this year’s report shows that Alberta, tradi-tionally considered to have the best investment climate in Canada, is losing some ground to Saskatchewan and British Columbia, which have recently made improve-ments to their investment climates.
The Canadian Provincial Investment Climate report looks at areas of public policy that affect business invest-ment (see Palacios et al., 2009). The core of the report is an index composed of seven major areas identified by leading Canadian investment managers as the most im-portant in terms of contributing to provincial investment climates: corporate income tax, fiscal prudence, personal income tax, transportation infrastructure, corporate cap-ital tax, labour market regulation, and overall burden of regulation. The index measures and calculates scores for each area using objective, empirical data (table 1).
As in 2008, the western provinces dominated the overall index’s top rankings in 2009. Alberta topped the rankings with a score of 8.5 out of 10.0. Saskatchewan and BC ranked second and third, scoring 6.6 and 6.0 out of 10.0, respectively. Ontario and Quebec—Canada’s two most populous provinces—ranked 5th and 8th overall, scoring 4.9 and 3.3 out of 10.0, respectively.
While Alberta is still first, the gap between it and Saskatchewan and BC has narrowed, reflecting an ero-sion of the so-called “Alberta advantage”—traditionally
understood to be a combination of low taxes and small government. While Alberta has become complacent in re-cent years, Saskatchewan and BC have actively taken steps to introduce policies that encourage business investment.
For example, Saskatchewan recently improved its in-vestment climate by making its business tax system more competitive.1 Since 2005, the province has reduced the general corporate income tax rate by almost one-third from 17% to 12%, and has eliminated the corporate capi-tal tax on non-financial institutions.
Similarly, BC has improved incentives for invest-ment through a more competitive business tax system by reducing the corporate income tax rate from 16.5% in 2001 to the current rate of 11%; a further reduction to 10% is planned for 2011, making it equal with Alberta’s rate.2 BC also eliminated the corporate capital tax on non-financial institutions in 2002 and will remove this tax on financial institutions in 2010. Prior to 2010, Alberta was the only province with no corporate capital tax on either institution, but this distinction will be shared with BC and Ontario as of July 1 this year.
Furthermore, in 2001 BC introduced a historic 25% across-the-board cut to personal income tax rates, which has had and will continue to have a significant impact on economic growth in the province (Dahlby and Fe-rede, 2008).3 All personal income tax rates, except the top marginal rate, were reduced by an additional 5% in 2007.
If Alberta wants to retain its advantage, then it would do well to learn a lesson from Ontario, a prov-ince that allowed its investment climate to deteriorate through economic complacency and questionable policy choices. Not many years ago, Ontario was rated the best province in Canada for investment, receiving high praise from Canadian investment managers (Clemens, 2002).
Charles lammam
Saskatchewan and British Columbia improve their investment climates
The times are a-changin’
Foto
lia

www.fraserinstitute.org Fraser Forum 02/10 25
But since 2003, Canada’s most populous province has fallen down the ranks as it has moved away from what made it successful.
For example, Ontario increased its corporate income tax rate from 12.5% to 14.0% shortly after 2003, just as other provinces were making aggressive reductions. On-tario also delayed the planned elimination of its corporate capital tax. The government’s decision to increase person-al income taxes in 2004 was similarly misguided: while other provinces were making cuts, Ontario cancelled the planned elimination of the surtax on personal income and introduced the Ontario Health Premium.
These policy decisions degraded Ontario’s investment climate at a time when the province desperately needed investment to mitigate the effects of a rising Canadian dol-lar and a declining manufacturing sector.4 The increased personal income taxes and capital taxes also discouraged work effort, savings, investment, and entrepreneurship in the province (Palacios and Harischandra, 2008).
While Ontario has suffered greatly from past policy decisions, the Ontario government seems to have realized its errors and is beginning to take remedial action. In fact, Ontario’s budget for 2009 constituted a complete U-turn on tax policy (Lammam and Veldhuis, 2009).5
Business investment is critical to a jurisdiction’s eco-nomic success. It provides the resources for businesses to purchase new equipment and machinery, expand exist-ing facilities, and embark on new development ventures. Business investment is essential for improving worker productivity and it ultimately enables people to enjoy higher living standards.
For the Alberta government, the way forward is clear: take heed of Ontario’s experience and avoid eco-nomic decline by taking steps to improve the province’s investment climate while building on existing advantag-es. Doing so will ensure a prosperous economic future.
Notes
1 See Veldhuis, Palacios, Lammam, and Gainer (2009) for an overview of the improvements to Saskatchewan’s tax system.
2 See Veldhuis, Lammam, and Palacios (2009) for a discus-sion of BC’s tax changes and other changes to the province’s investment climate since 2001.
3 University of Alberta professor Bev Dahlby, one of Canada’s leading economists, and Ergete Ferede recently assessed the economic impacts of the 2001 tax cuts in BC and found that they had a profound impact on economic growth and will continue to do so in the future (Dahlby and Ferede, 2008). Specifically, they found that BC’s corporate income tax rate reductions will increase per capita GDP by 18% compared to the level that would have occurred without the tax cuts, and that the personal income tax rate reductions will increase per capita GDP by 7.6% compared to the level that would have prevailed in the absence of the cuts.
4 See Clemens et al. (2005) for a discussion of the poor policy choices made by the Ontario government in the areas of fiscal prudence and labour market regulation.
5 For example, one of the key reforms included in the budget was the harmonization of the provincial sales tax with the fed-eral goods and services tax. Another reform was the gradual
Table 1: Canadian Provincial Investment Climate Index, 2009, scores and rankings (out of 10), overall and by component
Overall Corporate income tax
Fiscal prudence
Personal income tax
Transporta-tion infra-structure
Corporate capital tax
Labour market
regulation
Burden of regulation
Score Rank Score Rank Score Rank Score Rank Score Rank Score Rank Score Rank Score Rank
AB 8.5 1 10.0 1 8.8 1 10.0 1 5.7 7 10.0 1 5.3 1 9.5 2
SK 6.6 2 6.7 4 7.7 2 5.5 3 5.1 9 9.0 2 3.2 4 9.2 3
BC 6.0 3 8.3 2 6.5 4 7.6 2 3.6 10 8.5 3 2.8 6 4.4 6
NL 5.4 4 3.3 7 7.6 3 2.7 9 5.7 7 5.8 6 2.8 6 10.0 1
ON 4.9 5 3.3 7 4.6 6 5.4 4 6.8 2 6.4 5 3.4 2 4.7 5
MB 4.7 6 5.8 5 4.8 5 2.4 10 6.7 3 4.6 8 1.8 9 6.8 4
NB 4.4 7 5.8 5 1.7 9 5.4 4 6.7 3 6.6 4 2.8 6 1.7 9
QC 3.3 8 6.8 3 0.6 10 4.7 6 6.3 5 2.8 9 1.3 10 0.0 10
NS 3.3 8 0.0 9 3.3 7 3.7 8 8.2 1 2.0 10 3.3 3 2.6 7
PE 3.2 10 0.0 9 2.3 8 3.9 7 6.1 6 5.1 7 3.0 5 2.5 8
Source: Palacios et al., 2009.

26 Fraser Forum 02/10 www.fraserinstitute.org
reduction of the general corporate income tax rate from the current rate of 14% to 10% by 2013.
References
Clemens, Jason (2002). Investment Managers Survey: Provin-cial Investment Climates. Fraser Forum (May): 29–31.
Clemens, Jason, Niels Veldhuis, and Amela Karabegović (2005). Blame Ontario’s Leadership. Fraser Forum (October): 3–4.
Dahlby, Bev, and Ergete Ferede (2008). Assessing British Co-lumbia’s Incentive-Based Tax Cuts. Studies in Economic Prosperity. Fraser Institute.
Lammam, Charles, and Niels Veldhuis (2009). Ontario’s U-turn on Tax Policy. Fraser Forum (May): 26–28.
Palacios, Milagros, Alex Gainer, Charles Lammam, and Niels Veldhuis (2009). Canadian Provincial Investment Climate: 2009 Report. Fraser Institute.
Palacios, Milagros, and Kumi Harischandra (2008). The Im-pact of Taxes on Economic Behavior. In Jason Clemens (ed.), The Impact and Cost of Taxation in Canada: The Case for Flat Tax Reform (Fraser Institute): 3–31.
Veldhuis, Niels, Charles Lammam, and Milagros Palacios (2009). BC’s Economic Turnaround. Fraser Forum (May): 35–36. <http://www.fraserinstitute.org/newsandevents/commentaries/6653.aspx>.
Veldhuis, Niels, Milagros Palacios, Charles Lammam, and Alex Gainer (2009). Saskatchewan Prosperity: Building on Success. Fraser Institute.
priority areas, rates of surgery climbed by 7% between 2004-2005 and 2005-2006, and then essentially stopped growing to 2007-2008 (CIHI, 2009b). Importantly, these non-increases occurred at the same time as provincial health spending per Canadian grew by about 9% (after accounting for inflation) between 2004 and 2007 (CIHI, 2009a; calculations by authors).
This preliminary analysis reveals a troubling state of dysfunction in Canada’s health care systems. While one might reasonably expect access to health care to improve with increases in funding, there actually appears to be no improvement or possibly even a deterioration in access as funding increases. There is clearly something very wrong with Medicare.
Notes
1 The finding for physicians was statistically significant at the 5% level, while the finding for pharmaceuticals was not.
2 As the structure of Canada’s health care systems—first-dol-lar coverage/no cost sharing, a near public monopoly on fund-ing, and monopolistic public delivery of hospital care—has not changed since Zelder’s analysis in 2000, it is reasonable to examine the relationship between spending and waiting for the entire timeframe for which data are available.
3 Readers should note that this is an actual AR(1) process; it is not a lagged variable.
4 The TS coefficient measures the degree to which any increase in spending affects the total wait time. Given a coefficient of 0.002527, we can determine that a $395.73 increase in spend-ing will result in a one week increase in wait times.
5 While most health care services are funded on a global budget basis, physicians are paid predominantly on a fee-for-service basis in Canada. As a result, increases in physician expenditure can be expected to directly increase the volume of services delivered to some extent.
6 Unlike the 2003 analysis by Esmail, we did not separate the effect of expenditures on drugs from total expenditures on health care as we found drug spending to be highly correlated with physician spending in our dataset.
References
Canadian Institute for Health Information [CIHI] (2009a). National Health Expenditure Trends, 1975-2009. CIHI.
Canadian Institute for Health Information [CIHI] (2009b). Surgical Volume Trends, 2009: Within and Beyond Wait Time Priority Areas. CIHI.
Esmail, Nadeem (2003). Spend and Wait? Fraser Forum (March): 25–26.
Statistics Canada (n.d.). CANSIM Table 051-0001 - Estimates of Population, by Age Group and Sex for July 1, Canada, Provinces and Territories, Annual (Persons Unless Other-wise Noted). Statistics Canada.
Statistics Canada (2009). Provincial and Territorial Economic Accounts: Data Tables. Catalogue No. 13-018-XWE, Vol. 2, No. 2. <http://www.statcan.gc.ca/bsolc/olc-cel/olc-cel?catno=13-018-X&lang=eng>.
Zelder, Martin (2000). Spend More, Wait Less? Fraser Forum (August).
Spend more, wait less?Continued from page 17

www.fraserinstitute.org Fraser Forum 02/10 27
In November 2009, the Parlia-mentary Budget Office (PBO) released its update on the fed-
eral government’s finances, which noted that the federal budget “is not structurally balanced over the me-dium term” (PBO, 2009: 6). In other words, the PBO believes that the federal deficit is not solely a func-tion of the economic downturn and that the government will remain in deficit once the economy rebounds. To combat this deficit, the govern-ment will have to cut spending and/or increase taxes.
Ironically, the day after the PBO released its updated fiscal and eco-nomic forecasts, Kevin Page, head of the PBO, warned that his office may have to shut down if it does not re-ceive the $2.8 million it needs for op-erations this year (Argitis, 2009, Nov. 3)—a more than 50% increase from last year’s budget of $1.8 million.
The federal government is al-ready facing an estimated $56 billion deficit for 2009/2010, and further deficits amounting to $109 billion are expected over the next five years (Canada, Department of Finance, 2009a). In this context, the PBO’s funding request provides an inter-esting case study in how the govern-ment should examine its programs
and activities going forward. That is, should the federal government continue to fund the PBO or shut it down?
Back in 1994, then-finance min-ister Paul Martin was dealing with a relatively more severe (as percent-age of the economy) deficit of $38.5 billion (Canada, Department of Fi-nance, 2009b), and he decided that this deficit would be dealt with by
“cutting spending—not raising taxes” (Martin, 1995: 7). To cut spending, the Liberal government initiated a comprehensive review of every gov-ernment department using a series of “tests.” The most important one was whether government involve-ment was necessary. If the current government used this test on the PBO, the decision would be simple: it’s time for the PBO to go.
The PBO was created by the Conservatives in 2006 as part of the accountability reforms implemented following the sponsorship scandal. The PBO’s mandate was to provide Parliament with independent anal-yses of the federal government’s finances, trends in the Canadian economy, and the cost of federal proposals.1
But do we really need another government agency to do much of
the same work as several private sector organizations? What func-tion does the PBO perform that the private sector cannot or does not provide?
Private sector organizations such as TD Economics, Global In-sight, Dale Orr Economic Insight, and others regularly produce fiscal projections based on government budgets, many of which are avail-able online for free. In other words, there is healthy competition in the private sector for the production of economic and fiscal forecasts. This competition ensures that no one organization’s forecasts dominate, which also serves the purpose of dis-ciplining wildly inaccurate figures.
For instance, in October 2009, TD Economics released its budget forecasts for the next five years and warned that “in order to gradually reduce and then eliminate the fed-eral deficit by 2015-16, total spend-ing growth would need to be con-strained to 3% per year on average
… a tall order” (Burleton and Drum-mond, 2009: 4).
Similarly, Dale Orr Economic Insight warned that “under rea-sonable economic and fiscal fore-casts, under the growing out option, with no significant tax increases or
Scrap the Parliamentary Budget Office
niels velDhuis anD Charles lammam
Foto
lia

28 Fraser Forum 02/10 www.fraserinstitute.org
spending cuts to accelerate deficit elimination, we could not expect the deficit to be eliminated before 2018” (Dale Orr Economic Insight, 2009: 1).
These messages mirror those provided in the PBO’s November update.
However, proponents of the PBO, including several prominent academic economists who recently signed a petition extolling its vir-tues, argue that the PBO is valuable because it produces independent, detailed, and credible fiscal projec-tions.2 But that presupposes that the private sector’s projections are not independent, detailed, or credible.
It is possible that the federal government’s own estimates may be influenced by political motives, but in the early 1990s Paul Martin initi-ated reforms to eliminate the federal government’s reliance on internal economic forecasts for budgeting purposes (Watson, 2009, July 9). He began by abolishing the finance ministry’s forecasting department. Martin also started a practice that continues to this day: relying on an average of private sector forecasts when preparing budget numbers.
Indeed, these reforms have minimized the government’s ability to fudge budget numbers for politi-cal advantage, and they are part of the reason that a recent study pub-lished by the International Mon-etary Fund concluded that “fiscal forecasting in Canada is governed by one of the strongest institutional frameworks relative to benchmark countries,” noting that “One par-ticular strength is the explicit use of macroeconomic projections from a wide range of private forecasters for the preparation of the budget” (Mühleisen et al., 2005: 3).
The practice of using an aver-age of private sector forecasts is also used by the PBO, which regularly surveys the private sector and pub-lishes average forecasts of key eco-nomic data in its updates.
In addition to the multitude of private organizations supplying economic forecasts and fiscal pro-jections, some organizations go to great lengths to scrutinize the ac-curacy of the government’s budget numbers and assess its fiscal policies and programs. These include think tank institutions (including the Fraser Institute), non-profits, lob-byist groups, and professional and academic economists. In a sense, the government already has multiple
“watchdogs” helping to keep it honest and disciplined.
Some will say that the PBO is non-partisan and independent, un-like other government organizations that have their own political incen-tives. But public choice economics shows us that we should not expect the PBO to behave any differently than any other government-financed organization.3 In fact, some observ-ers have accused the PBO of being politically active (Milke, 2009, Nov. 8), which is contrary to its mandate.
But even assuming that the PBO is truly non-partisan and inde-pendent, its efforts are of little prac-tical value in the Canadian political context, given the institutional en-vironment. Unlike the United States, where the PBO’s counterpart the Congressional Budget Office (CBO) is more influential, Canada has a parliamentary system. As in many parliamentary systems, the Cana-dian legislature has limited pow-ers to change a submitted budget (Mühleisen et al., 2005). In general, parliamentarians can only approve or reject the incumbent govern-ment’s spending proposal, while the legislatures in the United States are free to change any aspect of a budget proposal. Analysis performed by the CBO is therefore more likely to be used effectively by individual mem-bers of Congress to adjust proposals accordingly.
At a time when Canadians are leaving more than $150 billion in debt to the next generation of
taxpayers, we owe it to them to at least try to be responsible. Before the government grants Page’s request for an increased budget allocation—or such a request from any other gov-ernment agency for that matter—we ought to ask whether government involvement is necessary. In the case of the PBO, the answer is no.
Notes
1 For more information about the PBO, see PBO (n.d.).
2 For access to this petition and argu-ments in favour of the PBO, please see Milligan (2009).
3 Please see Clemens et al. (2007) for an overview of public choice theory and several examples of government fi-nanced organizations that consistently fail to meet stated objectives.
References
Argitis, Theophilos (2009, November 3). Budget Watchdog Says Funding Too Low to Do Job. National Post.
Burleton, Derek, and Don Drummond (2009). The Coming Era of Fiscal Restraint. TD Economics. <http://www.td.com/economics/special/db1009_fiscal.pdf>.
Canada, Department of Finance (2009a). Update of Economic and Fiscal Projections, September 2009. Government of Canada. <http://www.fin.gc.ca/ec2009/pdf/bac-eng.pdf>.
Canada, Department of Finance (2009b). Fiscal Reference Tables, Oc-tober 2009. Government of Canada. <http://www.fin.gc.ca/frt-trf/2009/frt09_e.pdf>.
Clemens, Jason, Charles Lammam, Milagros Palacios, and Niels Veld-huis (2007). Government Failure in Canada, 2007 Edition: A Review of the Auditor General’s Reports, 1992-2006. Fraser Institute. <http://www.fraserinstitute.org/Commerce.Web/

Foto
lia
www.fraserinstitute.org Fraser Forum 02/10 29
For all the claims of a scientific “consensus,” it is now more evident than ever that proof of a link between human activity and global warming simply does not
exist. This was underscored recently when thousands of e-mails from the University of East Anglia Climatic Re-search Unit in England were posted online by an anony-mous whistle-blower. The e-mails contained numerous references to statistical tricks and data manipulations that were used by researchers to support the core tenets of global warming theory.
The e-mail scandal has accelerated a decline in the pro-portion of people who buy the alarmist theory about global warming. But this is not the first time such deception has been uncovered. Between 2003 and 2005, Stephen McIntyre and Ross McKitrick published a series of papers showing that the infamous “hockey stick” graph, used widely as evidence of human-caused global warming, was based on faulty data and statistical techniques and could not be rep-licated using the methods described in the original papers.
In their attempt to verify some of the key research claims of the global warming alarmists, McIntyre and
McKitrick witnessed a disturbing deterioration in the standards of scientific scholarship and academic due diligence. Their experience is chronicled on the follow-ing pages (pp. 30–32) in an excerpt from the 2009 Fraser Institute report Check the Numbers: The Case for Due Dili-gence in Policy Formation.
The study presents other examples of erroneous aca-demic studies that have had very costly consequences for taxpayers. The lessons to be drawn from such incidents are absolutely clear. As McKitrick and Check the Num-bers co-author B.D. McCullough note, “When a piece of academic research takes on a public role, such as be-coming the basis for public policy decisions, practices that obstruct independent replication, such as refusal to disclose data, or the concealment of details about computational methods, prevent the proper function-ing of the scientific process and can lead to poor public decision making.”
—Diane Katz, Director of Risk, Environment, and Energy Policy
product_files/GovernmentFailure inCanada2007.pdf>.
Dale Orr Economic Insight (2009). The Path to Deficit Elimination:
“Growing Out” is Too Risky. Dale Orr Economic Insight. <http://w w w.economicinsight.ca/econ omic_docs/2009oct_deficitelim inationtoorisky.pdf>.
Martin, Paul (1995). Budget Speech (February 27, 1995). Government of Canada, Department of Finance.
Milke, Mark (2009, November 8). Con-servatives Versus Fiscal Account-ability. Calgary Herald.
Milligan, Kevin (2009). Open Letter in Support of the OPBO. Blog (July 16). Support the OPBO. <http://supporttheopbo.blogspot.com/ 2009/07/open-letter-in-support-of-opbo.html>.
Mühleisen, Martin, Stephan Dan-ninger, David Hauner, Kornélia Krajnyák, and Bennett Sutton (2005). How Do Canadian Budget Forecasts Compare with Those of Other Industrial Countries? IMF Working Paper WP/05/06. Inter-national Monetary Fund. <http://www.imf.org/external/pubs/f t/wp/2005/wp0566.pdf>.
Parliamentary Budget Office [PBO] (n.d.). About the PBO. Parliament of Canada. <http://www2.parl.gc.ca/Sites/PBO-DPB/AboutUs.aspx?Language=E>.
Parliamentary Budget Office [PBO] (2009). Economics and Fiscal As-sessment Update (November 2, 2009). Office of the Parliamentary Budget Officer. <http://www2.parl.gc.ca/Sites/PBO-DPB/documents/EFAU_November_2009.pdf>.
Watson, William (2009, July 9). The Parliamentary Budget Office May Be a Forecaster Too Far. National Post.
Check the numbersRecent climate scandal underscores the need for academic due diligence

Foto
lia
30 Fraser Forum 02/10 www.fraserinstitute.org
The Mann, Bradley, and Hughes (1998; 1999) “hock-ey stick” graph, shown in figure 1, was a key piece of evidence used by the Intergovernmental Panel
on Climate Change in its 2001 Third Assessment Report to conclude that humans are causing climate change (Work-ing Group I, IPCC, 2001, ch. 2, fig. 2.7c and ch. 2, fig. 2.20). The graph has a striking visual effect, suggesting the Earth’s climate (represented by the average northern hemisphere temperature) was stable for nine centuries prior to industrialization, then underwent a rapid warm-ing in the 20th century. The hockey stick graph appeared five times in the Third Assessment Report, each time in an unusually large and colorful format compared to other data series. It was widely reproduced on government web sites around the world and played an influential role in the debates that took place in many countries between 2001 and 2004 over whether to ratify the Kyoto Protocol.
One of the key selling points of the hockey stick graph (as emphasized in the 2001 IPCC report) was its supposedly robust computational methodology and the high level of statistical significance it supposedly attained in multiple tests. However, in the underlying paper itself (Mann, Bradley, and Hughes, 1998), while mention was made of two tests, called the R2 and RE statistics, only the RE scores were reported. The RE (Reduction of Er-ror) score is a somewhat obscure test of the fit between a model and its data. Since there are no standard tables for it, significance benchmarks must be computed for each study using a simulation procedure called Monte Carlo analysis.
The data behind the hockey stick was not available on line as of 2003, nor was the methodology clearly
described in the underlying articles. In April 2003, a To-ronto businessman named Stephen McIntyre decided to try to replicate the graph, and contacted the lead author (Michael Mann) to ask for the data. Mann initially said that they were not all in one place and it would take a while to gather them up, but eventually he provided a text file containing the data set.
Over the next six months McIntyre and coauthor McKitrick studied the data and implemented the meth-ods described in the original paper, concluding that the original results could not be reproduced. After several attempts to clarify methodological points Mann cut off all further inquiries. After McIntyre and McKitrick pub-lished a paper in late 2003 detailing numerous problems in the data and methods (McIntyre and McKitrick, 2003), Mann released a new version of his data set and some hitherto undisclosed details of his methodology. How-ever, the new version of the data set conflicted with the description in the original paper. McIntyre and McK-itrick filed a materials complaint with Nature, which was reviewed and upheld, leading to an order for Mann to publish a correct data listing. This appeared in July 2004, six years after the original publication. Mann et al. published a corrigendum and a new data archive (Mann, Bradley, and Hughes, 2004) but were not required, and indeed refused, to supply either their code or a complete mathematical description of their methods, despite the claim (Mann, Bradley, and Hughes, 1998: 779) that the principal contribution of their study was their “new sta-tistical approach” to analyze global climatic patterns.
The “new statistical approach” turned out to involve a standard method popular among applied statisticians
B. D. mCCullough anD ross mCKitriCK
Excerpted from Check the Numbers: The Case for Due Diligence in Policy Formation
The “hockey stick” graph

www.fraserinstitute.org Fraser Forum 02/10 31
and available in every sta-tistical software package, called “principal com-ponents analysis” (PCA). Mann, however, wrote his own PCA code in Fortran, despite the fact that well-debugged and polished ver-sions of the algorithm were readily available in existing statistical packages. Mann’s PCA code did not give the same answer as SAS, SPSS, or other statistical packages would have.
McIntyre and McK-itrick subsequently pub-lished two more studies (McIntyre and McKitrick, 2005a; 2005b) diagnosing the main error in Mann’s method. Prior to the PCA step, the proxy data were transformed in such a way as to inflate the weight assigned to proxies with upward slopes in the 20th century.
Figure 2, top panel, shows the first principal component of the larg-est data network (North American tree rings) as computed using Mann’s method. The strong hock-ey stick shape drives the final result (figure 1), and its overall influence on the result was said to be justi-fied because, in PCA, the first principal component represents the dominant pattern in the data. The bottom panel of figure 2 shows the first principal component of the same tree ring data set when computed using a correct method, on the centered covariance matrix. Using correct meth-ods, the hockey stick shape falls to the fourth principal component and is only associated with a small but con-troversial series of tree ring records from the western United States (the “bristlecone pines,” 16 of over 400 proxy series) which prior researchers (as well as the 1995 IPCC report) had warned were invalid for the study of past climate changes.
The influence of the faulty PC method was not ac-counted for in the Monte Carlo algorithm, yielding an incorrect critical value for the RE score. The corrected critical value (McIntyre and McKitrick, 2005a) showed that the reconstruction was invalid for projecting tem-peratures back 600 years. Also, McIntyre and McKitrick (2005a) reported that the R2 value confirmed the revised RE score but had not been reported. They also showed that the characteristic hockey stick shape disappeared from the result with the removal of the bristlecone pines
Figure 1: The hockey stick graph from the IPCC Third Assessment Report
Figure 2
Top: First principal component of North American tree ring network as computed by Mann et al. (1998)
Bottom: same, but computed using standard algorithm

32 Fraser Forum 02/10 www.fraserinstitute.org
from the data set. And they reported that the exact form of the hockey stick graph could not be replicated, nor could portions of the data set be identified without the code, since they were constructed by splicing segments of PCs together at truncation points that were only dis-closed in the code itself. Since Mann refused to release most of his computer code there was no way to sort out the remaining discrepancies.
The US National Science Foundation, which had funded the research, refused a request in 2003 from McIntyre to compel Mann to release his code. Likewise, Nature would not compel release of the code, accepting instead a verbal description of the algorithm for the cor-rigendum. In June 2005, the US House Committee on En-ergy and Commerce intervened to demand Mann release his code. This prompted letters of protest from, among others, the American Meteorological Society, the Ameri-can Geophysical Union, and the American Association for the Advancement of Science, none of whom had ever objected to Mann’s refusal to disclose his data and code in the first place. Mann released an incomplete portion of his code in July 2005, seven years after his paper had been published. Among other things, the code revealed that Mann et al. had calculated the insignificant R2 statistics, but had failed to report it. Also, files found on Mann’s FTP site showed that he had re-run his analysis specifically excluding the bristlecone pine data, which yielded the result that the hockey sick shape disappeared, but this result was also not reported.
In the context of private sector due diligence, a fail-ure to disclose adverse performance is a misrepresenta-tion. It is no less serious in scientific contexts.
In 2005, the House Science Committee asked the National Research Council (NRC) to investigate the con-troversy over the hockey stick. Prior to beginning its work, the NRC revised its terms of reference to exclude any spe-cific assessment of Mann’s work. The Energy and Com-merce Committee then asked Edward Wegman, Professor of Statistics at George Mason University and Chairman of the National Academy of Sciences Committee on Theo-retical and Applied Statistics, to assemble a separate panel to assess Mann’s methods and results. The NRC report ended up critiquing the hockey stick anyway, noting that it failed key statistical significance tests (National Research Council, 2006: 91), relied on invalid bristlecone data for its shape (pp. 50, 106-7), used a PC technique that biased the shape (p. 106), and, like other proxy reconstructions that followed it, systematically underestimated the associ-ated uncertainties (p. 107). The Wegman panel report was published in July 2006 (Wegman et al., 2006). It upheld the findings of McIntyre and McKitrick (p. 4). Among other things, the panel reported that, despite downloading the materials from Mann’s web site, they were unable to replicate the hockey stick results (p. 29).
The hockey stick episode illustrates, among other things, the inability or unwillingness of granting agen-cies, academic societies, and journals to enforce disclo-sure to a degree sufficient for the purposes of replication. Government intervention in this case resulted in release of essential code. Unless granting agencies and journals deal with this issue forcefully, policy makers should be prepared to accept a responsibility to act if their decisions are going to be based on the findings of unreplicated aca-demic research.
References
Intergovernmental Panel on Climate Change [IPCC] (2001). Climate Change 2001: The Scientific Basis. Cambridge Uni-versity Press.
Mann, Michael, Raymond Bradley, and Malcolm Hughes (1998). Globalscale Temperature Patterns and Climate Forcings over the Past Six Centuries. Nature 392: 779–787.
Mann, Michael, Raymond Bradley, and Malcolm Hughes (1999). Northern Hemisphere Temperatures During the Past Millennium: Inferences, Uncertainties and Limita-tions. Geophysical Research Letters 26: 759–762.
Mann, Michael, Raymond Bradley, and Malcolm Hughes (2004). Corrigendum. Nature 430 (July 1) (105): 391–396.
McIntyre, Stephen, and Ross McKitrick (2003). Corrections to the Mann et. al. (1998) proxy data base and northern hemispheric average temperature series. Energy and En-vironment 14, 6: 751–771.
McIntyre, Stephen, and Ross McKitrick (2005a). Hockey sticks, principal components and spurious significance. Geophys-ical Research Letters 32(3) L0371010.1029/2004GL021750 12 (February 2005).
McIntyre, Stephen, and Ross McKitrick (2005b). The MM critique of the MBH98 northern hemisphere climate in-dex: update and implications. Energy and Environment 16: 69–99.
National Research Council (2006). Surface temperature re-constructions for the past 1200 years. National Academies Press.
Wegman, Edward et al. (2006). Ad hoc report on the “hock-ey stick” global climate reconstruction. US House of Representatives Committee on Energy and Commerce (July).
This excerpt is taken from Check the Numbers: The Case for Due Diligence in Policy Formation by B.D. McCullough and Ross McKitrick. The full report is available at www.fraserinstitute.org.