fraud detection in mobile money transactions using machine
TRANSCRIPT
Creative Components Iowa State University Capstones, Theses and Dissertations
Fall 2019
Fraud Detection in Mobile Money Transactions Using Machine Fraud Detection in Mobile Money Transactions Using Machine
Learning Learning
Haimeng Kang
Follow this and additional works at: https://lib.dr.iastate.edu/creativecomponents
Part of the Business Analytics Commons
Recommended Citation Recommended Citation Kang, Haimeng, "Fraud Detection in Mobile Money Transactions Using Machine Learning" (2019). Creative Components. 402. https://lib.dr.iastate.edu/creativecomponents/402
This Creative Component is brought to you for free and open access by the Iowa State University Capstones, Theses and Dissertations at Iowa State University Digital Repository. It has been accepted for inclusion in Creative Components by an authorized administrator of Iowa State University Digital Repository. For more information, please contact [email protected].

Fraud Detection in Mobile Money Transactions Using Machine Learning
by
Haimeng Kang
A creative component submitted to the graduate facility
in partial fulfillment of the requirements for the degree of
MASTER OF SCIENCE
Major: Information Systems
Program of Study Committee:
Dr. Anthony M. Townsend, Major Professor
The student author, whose presentation was approved by the program of the study committee, is solely responsible for the content of the report. The Graduate College
will ensure this report is globally accessible and will not permit alteration after a degree is conferred.
Iowa State University
Ames, Iowa
2019

Abstract – This study explores an effective data mining system for fraud detection in mobile
financial transactions. Attempting two broad-used supervised machine learning models, random
forest and gradient boosting, the study aims to test and compare their applicability in the
detection of fraudulent records. Both classification models were developed using a synthetic
dataset of mobile money transactions, which was generated based on a sample of real
transactions extracted from an international mobile money service company.
Keywords: fraud detection; classification; random forest; gradient boosting; confusion matrix; F1-score
I. Introduction
With the continuous development of technologies, as well as the emergence of new
communication channels, mobile money service has been increasingly popular. The service acts
as a convenient tool for trades between customers and merchants, by converting cash into
“electronic money”. Electronic money can be used to pay goods or services to merchants,
transited to bank accounts, or transferred between users, etc. [1] All these functions can be
achieved with only a few operations on cellular phones.
Despite of the convenience, electronic payment service has been a target for financial deception
for several years. Between 2015 and 2016, a single criminal gang already spent more than $1.5
million on fraudulent purchases via Apple Pay [2]; in 2015, fraudsters attacked hundreds of
PayPal accounts and caused a $1 million fraud scheme [3]. It was estimated that losses due to
online payment fraud will increase double yearly rates by 2020 [4]. Therefore, a detection system
for such crimes are crucial for banks, mobile application companies and mobile service users.
While studies in this field are needed, such research are often hindered by the scarcity of public
fraudulent transaction data. This is mainly caused by the intrinsically private nature of financial
records. To solve this problem, Phua, C. et al. [5] mentioned synthetic data that matches closely
to authentic data could be an alternative; Barse, et al. [6] believed synthetic dataset is able to
train and adapt a system, which can be utilized on actual data; Rieke, R. et al. [7] used simulated

logs based on real transactions to capture abnormal mobile payments. Consequently, the
synthetic data approach is also used in this paper.
The objective of the study is to construct and validate an accurate detecting model for fraudulent
mobile money payments. To build a proper probing system, the study adopted supervised
learning, where known normal and fraud cases were used to train the models to learn their
characteristics. The basic idea is to partition the raw data frame into two subsets, training set and
validation set. The former trains random forest and gradient boosting with labeled data, making
the systems exploit the patterns of legal and illegal transactions, thus systems are able to predict
which class a new observation belongs to. Models will then be applied to the validation set, to
verify both methods and their accuracies will be evaluated and compared.
The research is constructed as follows: Section II gives a review of related works in the region of
mobile transaction detection. Section III introduces the resource and structure of dataset, the
characteristics of classification models, as well as the measurement of accuracy. Section IV
involves exploratory data analysis, training and validation, as well as the classification results.
Section V gives explanations for the results and final conclusions.
II. Literature Review
A general review of the fraud detection could be found in the research from Bolton, R. J. et al.
[8] and Phua, C. et al. [5]. In the past 20 years, to meet the needs of the market, numbers of
detecting tools have been developed and published. Previous efforts have addressed supervised
algorithms, including neural networks, Decision Tree, Support Vector Machines (SVM), logistic
regression and so on. For example, decision tree or random forest was adopted in Xuan, S. et.al.
[9], Liu, C. et al. [10], and Sahin, Y. G., & Duman, E. [11].
The following are some detailed introductions. Xuan, S. et.al. [9] employed two kinds of random
forest: Random-tree-based random forest and CART-based random forest, and applied them on a
real-life credit card transaction dataset in China. They chose precision rate, recall rate and F-
score to measure the two algorithms’ predictive veracity.
Liu, C. et al. [10] took financial ratios as the independent variables to judge if a payment is legit
or not. They not only adopted random forest, but also used four statistic models, including both

parametric and non-parametric models. Random forest was concluded to have the highest
accuracy.
Sahin, Y. G., & Duman, E. [11] was the very first study that compared the predicting accuracy of
decision tree and SVM. It employed ID3, C5.0 and C&RT from decision tree algorithms, and
found out that in general, decision tree methods have the better predicting capability. The
performances of both methodologies were assessed with suspicion scores, which is the
probability of the credit card payment to be fraudulent.
III. Research Methodology
3.1. Data
The dataset selected in the experiment is from Kaggle.com. It is composed of 6,362,620
transaction records, which were all generated by a financial mobile money simulator called
PaySim. PaySim is able to imitate real-life financial records, and created this synthetic dataset
based on a sample of real transactions from a one-month financial log of a mobile money service
company. The name of the company was not revealed, yet it was stated to be an international
organization providing services to cellular phone users, in order to let them use electronic wallets
on phones to transfer money with each other.
The data provider has shrunk this synthetic dataset to ¼ of the size of the original dataset. There
are 11 attributes in total, including 7 independent variables representing the features of a
transaction, 1 dependent variable standing for the status of a transaction, and 3 variables that are
not considered as relevant influencers, which will be dropped in section V.
A list of all variables is demonstrated as Table 1. For clarification purposes, some of the
variables are explained with more details in the following paragraphs.
Table 1. Summary of Variables
Variable Name Format Example Description
1 step 5 Each step is an hour of time in real world. The largest number for step is 744 (the 30th day)
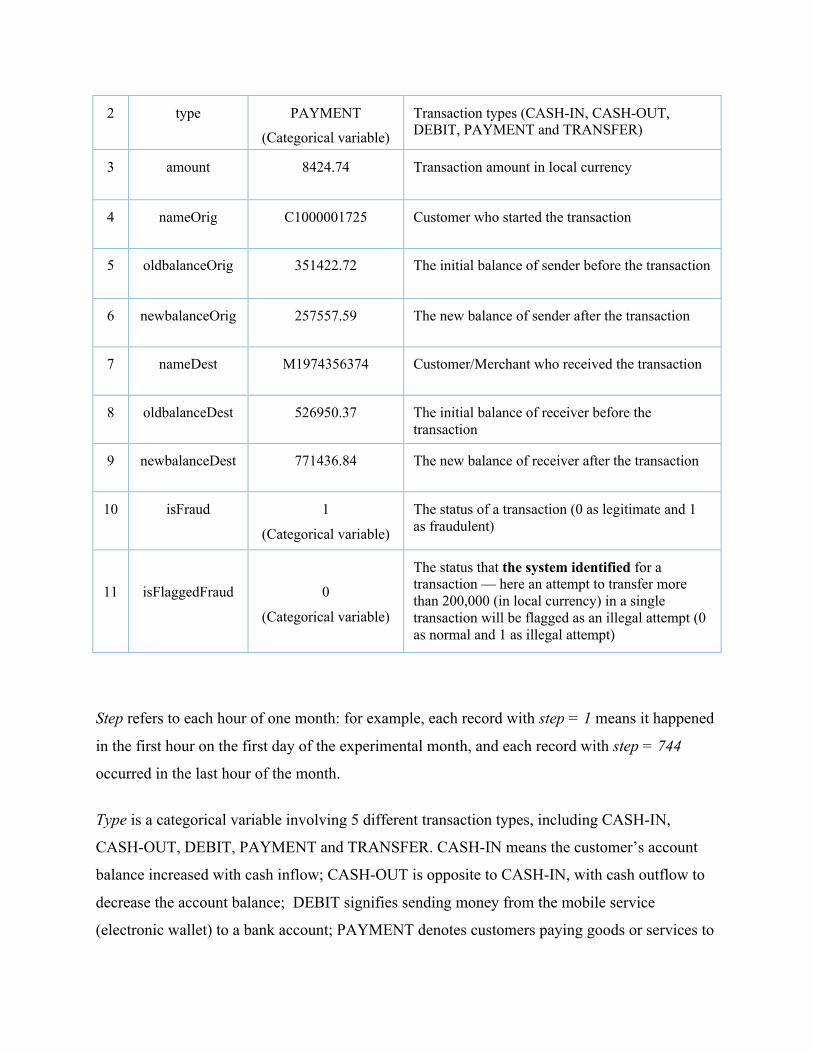
2 type PAYMENT
(Categorical variable)
Transaction types (CASH-IN, CASH-OUT, DEBIT, PAYMENT and TRANSFER)
3 amount 8424.74 Transaction amount in local currency
4 nameOrig C1000001725 Customer who started the transaction
5 oldbalanceOrig 351422.72 The initial balance of sender before the transaction
6 newbalanceOrig 257557.59 The new balance of sender after the transaction
7 nameDest M1974356374 Customer/Merchant who received the transaction
8 oldbalanceDest 526950.37 The initial balance of receiver before the transaction
9 newbalanceDest 771436.84 The new balance of receiver after the transaction
10 isFraud 1
(Categorical variable)
The status of a transaction (0 as legitimate and 1 as fraudulent)
11
isFlaggedFraud
0
(Categorical variable)
The status that the system identified for a transaction — here an attempt to transfer more than 200,000 (in local currency) in a single transaction will be flagged as an illegal attempt (0 as normal and 1 as illegal attempt)
Step refers to each hour of one month: for example, each record with step = 1 means it happened
in the first hour on the first day of the experimental month, and each record with step = 744
occurred in the last hour of the month.
Type is a categorical variable involving 5 different transaction types, including CASH-IN,
CASH-OUT, DEBIT, PAYMENT and TRANSFER. CASH-IN means the customer’s account
balance increased with cash inflow; CASH-OUT is opposite to CASH-IN, with cash outflow to
decrease the account balance; DEBIT signifies sending money from the mobile service
(electronic wallet) to a bank account; PAYMENT denotes customers paying goods or services to

merchants, which will reduce customer’s account balances and increase merchants’ account
balances; TRANSFER is the process of transferring money between users.
isFlaggedFraud is an additional attribute that the mobile service system used for controlling
massive transfers. According to the definition, when there was an attempt to transfer more than
200,000 units (in local currency) in a single transaction, isFlaggedFraud would be set to 1;
otherwise it would be 0. It doesn’t have a definite relation with isFraud.
3.2. Methods
Determining the transaction status can be regarded as a classification problem in supervised
learning. The basic idea is to:
1. Partition the data into two subsets: training set and validation set. Training set is used to
train the model, by letting it learn the pattern between independent variables and
dependent variable; in other words, teach it how to use independent variables to predict
the outcome variable (in this case, the binary class).
2. After the model has predicting capability, it will be applied to the inputs in validation
sample and predict the outputs. We will then compare the predicted outcomes with the
actual outcomes to evaluate its performance.
As stated earlier, the supervised learning algorithms employed in this study are random forest
and gradient boosting.
3.2.1. Decision tree
Since random forest and boosted trees are both extensions of decision tree, we will explain this
concept firstly. Decision tree, or more specifically, classification tree, is a data-driven method to
classify records into mutually exclusive subgroups.
Fig. 1 is an illustration of decision tree. Assuming root node — the first independent variable —
as X1, and the cutoff value as t1, starting from the root node, each node is split into two successor
nodes. The left node contains data that are less than or equal to t1, while the right node includes
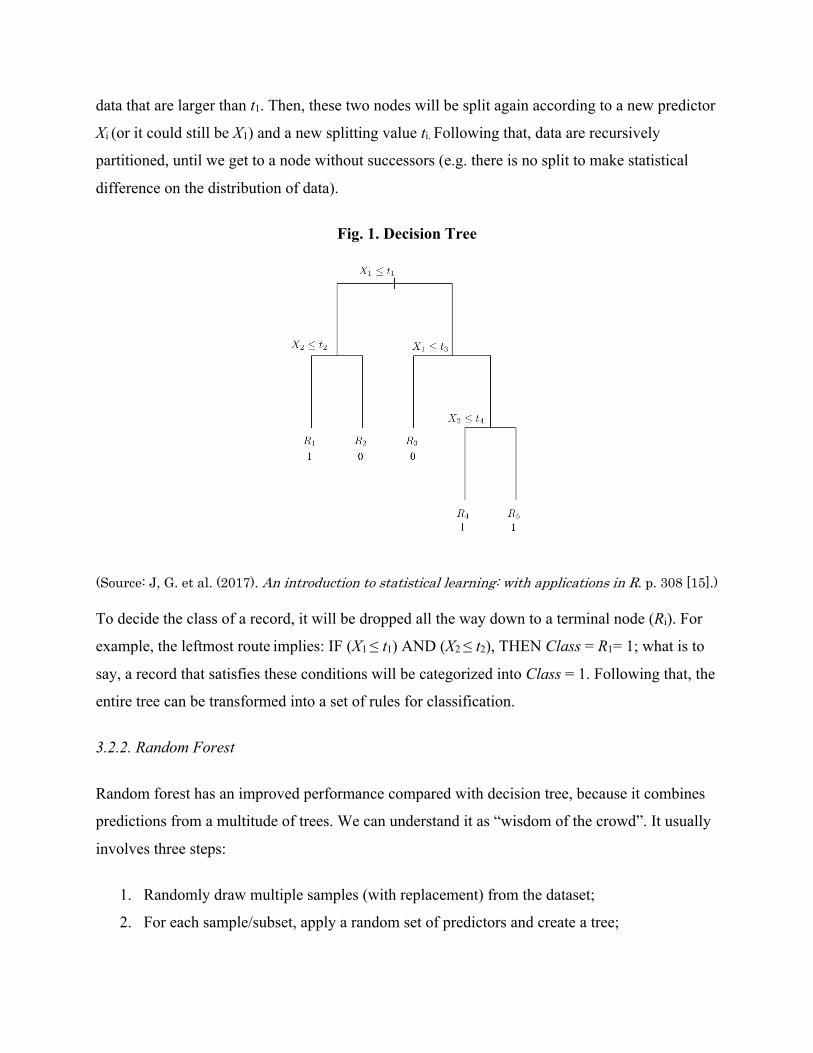
data that are larger than t1. Then, these two nodes will be split again according to a new predictor
Xi (or it could still be X1) and a new splitting value ti. Following that, data are recursively
partitioned, until we get to a node without successors (e.g. there is no split to make statistical
difference on the distribution of data).
Fig. 1. Decision Tree
(Source: J, G. et al. (2017). An introduction to statistical learning: with applications in R. p. 308 [15].)
To decide the class of a record, it will be dropped all the way down to a terminal node (Ri). For
example, the leftmost route implies: IF (X1 ≤ t1) AND (X2 ≤ t2), THEN Class = R1= 1; what is to
say, a record that satisfies these conditions will be categorized into Class = 1. Following that, the
entire tree can be transformed into a set of rules for classification.
3.2.2. Random Forest
Random forest has an improved performance compared with decision tree, because it combines
predictions from a multitude of trees. We can understand it as “wisdom of the crowd”. It usually
involves three steps:
1. Randomly draw multiple samples (with replacement) from the dataset;
2. For each sample/subset, apply a random set of predictors and create a tree;

3. Collect classification decisions from all the trees and select the class with the highest
number of votes.
Fig. 2. Random Forest
(Source: Chen, L. (2019). Medium.com, Towards Data Science. [13].)
3.2.3. Gradient Boosting
The second approach that uses multiple trees to improve is boosting. Boosting is an iterative
process in which each tree focuses on the misclassifications of the previous tree, so as to avoid
repeating mistakes. In this way, every tree is enhanced comparing with the previous one (Fig. 3).
The classification result of gradient boosting is also a combination of predictions from each
decision tree.
Fig. 3. Boosted Trees
(Source: Chen, L. (2019). Medium.com, Towards Data Science. [13].)
3.2.4. Confusion Matrix
Confusion matrix is an easy way to assess a classifier’s performance, by estimating both correct
and incorrect classification rates. The upper left cell and lower right cell represent the total

number of correct classifications, while the other two calculate the records that were
misclassified.
In confusion matrix, accuracy is defined as accuracy = !"#$&'()*)+$,!"#$-$./*)+$!'*/01$2'"3(
.
Fig. 4. Confusion Matrix
3.2.5. Precision, Recall, and F-1 Score
However, accuracy itself is not enough for the performance evaluation. In this study, a false
negative is far more costly than a false positive: a false positive means putting a legal record into
the fraud class C1, which can be at most consider as oversensitive and requires some extra
examination; a false negative, on the other hand, is putting a fraudulent record into the legit class
C2, which is serious and can cause loss for the company and its users.
Consequently, we need three new metrics for the assessment.
Precision: It counts out of all the records that are predicted as positive, how many of them are
actually positive. The formula is Precision = !"#$&'()*)+$!"#$&'()*)+$,4/0($&'()*)+$
.
Recall (also termed as Sensitivity): It counts out of all the actual positive records, how many of
them are correctly classified as positive. The formula is Recall = !"#$&'()*)+$!"#$&'()*)+$,4/0($-$./*)+$
.

F1-Score: It is a measure that seeks a balance between Precision and Recall. But unlike
accuracy, it doesn’t concentrate much on true negative (the total number of legal records that
were classified correctly). The formula is F1-score = 2x &"$2)()'891$2/00&"$2)()'8,1$2/00
.
IV. Experiment and Analysis
4.1. Exploratory Data Analysis
4.1.1. isFraud
There is no mismatched or missing value in the dataset. However, as shown in Fig. 4, the records
are highly imbalanced in the two classes, with only 8213 fraudulent cases (0.13%) and 6,354,407
(99.87%) legitimate cases. To mitigate the effect caused by skewness, stratified sampling can be
adopted to create subsamples (section 4.2), in which fraudulent and non-fraudulent transactions
will be equally distributed.
Fig. 4. Distribution of Two Classes
(6e+06 represents the number of legit transactions is 6x10=)
4.1.2 type

type is a categorical variable with 5 possible values: CASH-IN, CASH-OUT, DEBIT,
PAYMENT and TRANSFER. To explore each type value is crucial or not for the research, the
distribution of fraud cases in all the types is shown in Fig. 5.
Fig. 5. Number of fraudulent transactions in each type
It turns out all the fraudulent records were either CASH_OUT or TRANSFER. To simply later
analysis, we decided to only keep these two types and the other three were left out. A dummy
data frame was created to extract type.CASH_OUT and type.TRANSFER, which were combined
with all the other variables.
4.1.3 oldbalanceOrig & oldbalanceDest
Fig. 6 is the distribution of legit and fraudulent records in oldbalanceOrig and oldbalanceDest.
The left box plot indicates fraudulent transactions were more likely to appear in accounts with
higher oldbalanceOrig, which means accounts with higher initial balance are more tend to be

attacked. As for the right box plot, it implies that accounts with lower initial balance are more
likely to be the receivers involved in a fraud.
Fig. 6. Distribution of Fraudulent and Non-fraudulent Records
4.1.4 nameOrig & nameDest
nameOrig and nameDest are ID numbers for customers or merchants. Theoretically, if they have
any relation with isFraud, it could be the frequency of the occurrence of ID numbers — IDs that
show up frequently may have higher possibility of participating in frauds. To figure out whether
the hypothesis is correct or not, all the IDs which appeared more than once were picked out and
listed with their corresponding account status. Fig. 7 shows the first 14 rows in one of the two-
column tables, which contains nameDest with frequency ≥ 2 and isFraud.

Fig. 7. The first 14 rows in nameDest - isFraud table
Observing the two tables we just created, the frequency of nameOrig or nameDest doesn’t
appear to have a significant relationship with account status. For example, all the receiver IDs
appeared over 100 times had never joined in a single fraud, yet some ID numbers that only
showed up for a few times were proved to participated in frauds. The occurrences of ID numbers
were random and have neither a positive nor a negative relation with isFraud, thus nameOrig or
nameDest are omitted from later analysis.
4.1.5 isFlaggedFraud
The definition of isFlaggedFraud seems to be inconsistent with the data. As stated in the
description of dataset, in order to control large transfers from one account to another, the system
will mark the single transactions with more than 200,000 transferred as isFlaggedFraud =1.
Nonetheless, isFlaggedFraud can remain 0 despite the condition was met, and there were only
16 “isFlaggedFraud = 1” out of over 6 million entries.

Fig. 8 is a correlation matrix with color-coding, which demonstrates the correlation coefficients
among variables. It is easy tell that there is no significant correlation between isFlaggedFraud
and any predictor variable, thus this column will be dropped from the dataset.
Fig. 8. Correlation Matrix I
4.1.6. Significance of independent variables
The dataset now has 9 variables: type.CASH_OUT, type.TRANSFER, step, amount,
oldbalanceOrig, newbalanceOrig, oldbalanceDest, newbalanceDest, and isFraud. To figure out
the relationships between isFraud and the 9 variables, we chose to draw another color matrix
containing all the correlation coefficients (Fig. 9). It appears type.TRANSFER, step, and amount
have relative high correlations with isFraud.

Fig. 9. Correlation Matrix II
4.2. Training and Validation
After the exploratory data analysis in section 4.1, there are still 6,362,620 entries in total, with
8213 of them being illegal.
The legit class is significantly high in this imbalanced dataset; if we use such a set to train
models, they will tend to automatically classify new observations into the legit class, because
they would then be correct over 99% of the time. To deal with this issue, we could use
undersampling, the method of downweighting the majority class relative to the rare class, to
create an equally distributed set for training. As for the validation set, records in it could remain
imbalanced distributed, since that is the pattern of real-life mobile transactions.
The steps in undersampling include:
1. Separate the two classes of records into two distinct sets, legit set and fraud set;

2. Randomly select 4106 records (50%) from the legit set and 4106 records (0.65%) from
the fraud set, and combine them to form the training set;
3. Put the rest of fraudulent transactions (4107 records) into validation set;
4. To remain the original ratio of fraud vs. non-fraud cases (8213 : 6354407), randomly
select 3,176,817 records from the remaining legal records, and put them into the
validation set.
4.3. Test 4.3.1. Random Forest
After attempting various numbers of trees to grow, as well as different numbers of variables to
be randomly sampled as candidates at splits, 50 trees and 5 variables were believed to be ideal
options. Applying the model on the validation set, we got a confusion matrix as Fig. 10.
According to the confusion matrix, the overall accuracy is 0.9898, Recall (Sensitivity) is 0.9898,
and Precision (Pos Pred Value) is 1.00000. F1-score is 2 x>90.9898>,0.9898
= 0.99487.

Fig. 10. Confusion Matrix for Random Forest
4.3.2. Gradient Boosting
Similar to random forest, we used 50 trees for training the boosting model and achieved the
confusion matrix in Fig. 11.
According to the confusion matrix, the overall accuracy is 0.9924, Recall (Sensitivity) is 0.9924,
and Precision (Pos Pred Value) is 1.0000. F1-score is 2 x >90.9924>,0.9924
= 0.99619.

Fig. 11. Confusion Matrix for Boosted Trees
V. Discussion and Future Work
According to the F-scores we got in section 4.3, both models achieved high accuracy, and
boosted tree has a relative better performance. The accuracies are higher than expected, and we
consider part of the reason could be the synthetic nature of the dataset. In future work, we can try
to find more real-life transaction records to test the tree models, and adopt other methodologies,
like logistic regression or k-means clustering.
In section 4.1.2, we found out all the fraudulent records belonged to either CASH_OUT or
TRANSFER. CASH-OUT represents outflow of a customer’s account balance, and when there
are abnormal outflows, they usually happen when customers lose complete access and control to
their accounts [12]. Such situation can be caused by SIM phishing swap, fake support calls to
obtain pin code, phone lost, etc. [12]. As for TRANSFER, it refers to the transfer of money
between user’s accounts. Fraudsters take advantage of it by financial deception, like frauds
which make customers believe they need to firstly pay deposits to receive a large amount of

money prizes. However, in real life, there should also be some illegal records in the other three
transaction types, which can be left for future research.
There are actually two fraud detecting methodologies: misuse detection and anomaly detection.
Misuse detection refers to deciding a new observation belongs to which class of the two;
anomaly detection is using historical data to build profile for normal transactions behaviors, thus
models can identify a record when it deviates from the normal patterns [10]. In this study we
chose to only focus on the misuse detection, because anomaly detection requires amounts of
successive sample data. In the future, with more collected data, we may attempt the anomaly
detection as well and make a comparison between the two methods.

References
[1] Rieke, R., Coppolino, L. & Hutchison, A., Prieto, E., & Gaber, C. (2012). Security and Reliability Requirements for Advanced Security Event Management. 171-180.
[2] Brewster, T. (2019). Forbes.com. https://www.forbes.com/sites/thomasbrewster/2019/03/27/millions-are-being-lost-to-apple-pay-fraudwill-apple-card-come-to-the-rescue/#3f3ab127622f [3] Rogers, Z. (2015). Local12.com. https://local12.com/news/local/paypal-scam-1-million-fraud-scheme [4] Y. Gmbh & K. G. Co. (2016). "Global online payment methods: Full year 2016", Tech. Rep. https://www.ystats.com/wp-content/uploads/2017/03/20170101_Product-Brochure-Order-Form_Global-Online-Payment-Methods_Full-Year-2016.pdf [5] Phua, C., Lee, V., Smith, K., & Gayler, R. (2010). A comprehensive survey of data mining-based fraud detection research. arXiv preprint arXiv:1009.6119. [6] Barse, E. L., Kvarnstrom, H., & Jonsson, E. (2003, December). Synthesizing test data for fraud detection systems. In 19th Annual Computer Security Applications Conference, 2003. Proceedings. (pp. 384-394). IEEE. [7] Rieke, R., Zhdanova, M., Repp, J., Giot, R., & Gaber, C. (2013, September). Fraud detection in mobile payments utilizing process behavior analysis. In 2013 International Conference on Availability, Reliability and Security (pp. 662-669). IEEE. [8] Bolton, R. J., & Hand, D. J. (2002). Statistical fraud detection: A review. Statistical science, 235-249. [9] Xuan, S., Liu, G., Li, Z., Zheng, L., Wang, S., & Jiang, C. (2018, March). Random forest for credit card fraud detection. In 2018 IEEE 15th International Conference on Networking, Sensing and Control (ICNSC) (pp. 1-6). IEEE. [10] Liu, C., Chan, Y., Alam Kazmi, S. H., & Fu, H. (2015). Financial fraud detection model: Based on random forest. International journal of economics and finance, 7(7). [11] Sahin, Y. G., & Duman, E. (2011). Detecting credit card fraud by decision trees and support vector machines. [12] Lopez-Rojas, E. A. (2016). Applying Simulation to the Problem of Detecting Financial Fraud (Doctoral dissertation, Blekinge Tekniska Högskola). Minh, H. (2018). Medium.com, James Tech Blog. https://medium.com/james-blogs/handling-imbalanced-data-in-classification-problems-7de598c1059f (accessed 29 October 2019).
[13] Chen, L. (2019). Medium.com, Towards Data Science. https://towardsdatascience.com/basic-ensemble-learning-random-forest-adaboost-gradient-boosting-step-by-step-explained-95d49d1e2725
[14] Shmueli, G., Bruce, P. C., Yahav, I., Patel, N. R., & Lichtendahl Jr., K. C. (2017). Data Mining for Business Analytics: Concepts, Techniques, and Applications in R, Kenneth C. ISBN 10: 1118879368, ISBN 13: 9781118879368. Wiley. p. 126-132, & p.144, & p. 205-233.
[15] James, G., Witten, D., Hastie, T., & Tibshirani, R. (2017). An introduction to statistical learning: with applications in R. Springer Verlag. p. 308.