fraunhofer institute for solar energy … production from solar and wind in germany in 2014...
TRANSCRIPT

© Fraunhofer ISE
Electricity production from solar and wind in Germany in 2014
FRAUNHOFER INSTITUTE FOR SOLAR ENERGY SYSTEMS ISE
Prof. Dr. Bruno Burger Fraunhofer Institute for Solar Energy Systems ISE Freiburg, Germany December 29, 2014 www.ise.fraunhofer.de

© Fraunhofer ISE
2
New record in wind power production
Wind power achieved a new record of 29.7 GW in peak power production at Friday, 12th of December 2014. The daily wind energy production was 562 GWh. Both figures represent new records. The last records of 5th of December 2013 with a maximum power of 26.3 GW and a daily energy of 485 GWh have been exceeded by 13% resp. 16%.
Photovoltaic power reached a maximum of 4.9 GW at the same day.
The maximum total power from solar and wind was about 34 GW, which is well below the maximum of 14.4.2014 when a total production of 38.8 GW was reached.
In order to provide sufficient space for the wind power in the grid, nuclear power plants have reduced their base load generation by about 10%, lignite plants by about 30%.

© Fraunhofer ISE
3
Date of maximum total and peak wind power production (in GW and GWh): Friday 12th of December
Graph: Bruno Burger, Fraunhofer ISE; Data: EEX Transparency Platform
min. power max. power daily energy
Solar 0 GW 4.9 GW 20 GWh
Wind 19.0 GW 29.7 GW 562 GWh
Conventional > 100 MW 34.0 GW 44.5 GW 935 GWh
00 02 04 06 08 10 12 14 16 18 20 22
60,000
50,000
40,000
30,000
20,000
10,000
h
MWday: 12.12.2014
Actual production

© Fraunhofer ISE
4
AGENDA
Annual energies
Monthly energies
Weekly energies
Daily energies
Annual power curves
Monthly power curves
Weekly power curves
Exemplary daily power curves

© Fraunhofer ISE
5
Installed power at October 29, 2014
Graph: B. Burger, Fraunhofer ISE; data: Bundesnetzagentur and AGEE (Biomass, Hydropower)
wind power: 35.062 GW onshore; 616 MW offshore
40
30
20
10
GW
Biomass
Net installed capacity rating
Brown Coal Hard CoalUranium Gas Wind Solar Hydro power
year 2014
35.678 GW
12.068 GW
21.206 GW
27.853 GW 28.439 GW
5.619 GW
38.124 GW
8.153 GW

© Fraunhofer ISE
6
Electricity production First eleven months 2014
Graph: B. Burger, Fraunhofer ISE; data: European Stock Exchange EEX, energetic corrected values
year 2014
Electricity production: first eleven months 2014
TWh
100
120
140
80
60
40
20
BiomassBrown Coal Hard CoalUranium Gas Wind Solar Hydro power
83.3 TWh
129.3 TWh
90.7 TWh
29.0 TWh42.6 TWh
32.4 TWh48.6 TWh
16.8 TWh

© Fraunhofer ISE
7
Absolute change in electricity production First eleven months 2014 versus first eleven months 2013
Graph: B. Burger, Fraunhofer ISE; data: Statistisches Bundesamt (2013), European Stock Exchange EEX (2014)
TWh
Change in electricity production: first eleven months 2014 versus first eleven months 2013
2.0
4.0
6.0
-8.0
-2.0
-4.0
-6.0
BiomassBrown Coal Hard CoalUranium Gas Wind Solar Hydro power
-4.0 TWh
-0.1 TWh
-6.5 TWh
-0.2 TWh
+2.2 TWh
+5.4 TWh
-6.7 TWh-11.3 TWh

© Fraunhofer ISE
8
Relative change in electricity production First eleven months 2014 versus first eleven months 2013
Graph: B. Burger, Fraunhofer ISE; data: Statistisches Bundesamt (2013), European Stock Exchange EEX (2014)
+10%
+20%
+30%
+40%
-40%
-10%
-20%
-30%
Relative change in electricity production: first eleven months 2014 versus first eleven months 2013
BiomassBrown Coal Hard CoalUranium Gas Wind Solar Hydro power
-11.1%
-0.1%
-18.4%
-0.4%-3.0%
-28.6%
+12.6%+7.4%

© Fraunhofer ISE
9
Export and import balance since 2001
The export surplus in 2013 was approx. 33.8 TWh.
Graph: B. Burger, Fraunhofer ISE; Data: BMWi Energiedaten (-2013); DESTATIS (2014)
-40
Electricity Export and Import Balance
year 2001-2014
Legend:Import (DESTATIS)
surplusExport surplus(DESTATIS)
Import (Entso-e)
surplusExport (Entso-e)
surplus
2001 2002 2003 2004 2005 2006 2007 2008 2009 2010 2011 2012 20142013
TWh
-20
-10
-30
Imp.
Expo
rt

© Fraunhofer ISE
10
AGENDA
Annual energies
Monthly energies
Weekly energies
Daily energies
Annual power curves
Monthly power curves
Weekly power curves
Exemplary daily power curves

© Fraunhofer ISE
11
Monthly Production Solar
Graph: B. Burger, Fraunhofer ISE; data: EEX Transparency Platform
Monthly Production Solar
year 2014
January February March April May June July August Sept. October Nov. Dec.
TWh
5.0
6.0
7.0
4.0
3.0
2.0
1.0

© Fraunhofer ISE
12
Monthly Production Wind
Graph: B. Burger, Fraunhofer ISE; data: EEX Transparency Platform
Monthly Production Wind
year 2014
5.0
6.0
7.0
4.0
3.0
2.0
1.0
TWh
January February March April May June July August Sept. October Nov. Dec.

© Fraunhofer ISE
13
Monthly Production Conventional > 100 MW
Graph: B. Burger, Fraunhofer ISE; data: EEX Transparency Platform
40
30
20
10
TWh
Monthly Production Conventional > 100 MW
year 2014
January February March April May June July August Sept. October Nov. Dec.

© Fraunhofer ISE
14
Monthly Production Solar and Wind
Graph: B. Burger, Fraunhofer ISE; data: EEX Transparency Platform
Monthly Production Solar and Wind
year 2014
5.0
6.0
7.0
4.0
3.0
2.0
1.0
TWh
January February March April May June July August Sept. October Nov. Dec.
Legend: Wind Solar

© Fraunhofer ISE
15
Monthly Production Solar, Wind and Conventional
Graph: B. Burger, Fraunhofer ISE; data: EEX Transparency Platform
40
30
20
10
TWh
Monthly Production Solar, Wind and Conventional
year 2014
January February March April May June July August Sept. October Nov. Dec.
Legend: Conventional > 100 MW Wind Solar

© Fraunhofer ISE
16
Monthly Production Hydro Power
Graph: B. Burger, Fraunhofer ISE; data: Statistisches Bundesamt (DESTATIS), European Stock Exchange (EEX)
Monthly Production Run of River
year 2014
5.0
6.0
7.0
4.0
3.0
2.0
1.0
TWh
January February March April May June July August Sept. October Nov. Dec.
Hydro Power (EEX)Legend: Hydro Power (DESTATIS)

© Fraunhofer ISE
17
Monthly Production Biomass
Graph: B. Burger, Fraunhofer ISE; data: Statistisches Bundesamt (DESTATIS)
Monthly Production Biomass
year 2014
5.0
6.0
7.0
4.0
3.0
2.0
1.0
TWh
January February March April May June July August Sept. October Nov. Dec.
Biomass (Prognosis)Legend: Biomass (DESTATIS)

© Fraunhofer ISE
18
Monthly Production Uranium
Graph: B. Burger, Fraunhofer ISE; data: Statistisches Bundesamt (DESTATIS), European Stock Exchange (EEX)
Monthly Production Uranium
year 2014
10.0
12.0
14.0
8.0
6.0
4.0
2.0
TWh
January February March April May June July August Sept. October Nov. Dec.
Uranium (EEX)Legend: Uranium (DESTATIS)

© Fraunhofer ISE
19
Monthly Production Brown Coal
Graph: B. Burger, Fraunhofer ISE; data: Statistisches Bundesamt (DESTATIS), European Stock Exchange (EEX)
Monthly Production Brown Coal
year 2014
10.0
12.0
14.0
8.0
6.0
4.0
2.0
TWh
January February March April May June July August Sept. October Nov. Dec.
Brown Coal (EEX)Legend: Brown Coal (DESTATIS)

© Fraunhofer ISE
20
Monthly Production Hard Coal
Graph: B. Burger, Fraunhofer ISE; data: Statistisches Bundesamt (DESTATIS), European Stock Exchange (EEX)
Monthly Production Hard Coal
year 2014
10.0
12.0
14.0
8.0
6.0
4.0
2.0
TWh
January February March April May June July August Sept. October Nov. Dec.
Hard Coal (EEX)Legend: Hard Coal (DESTATIS)

© Fraunhofer ISE
21
Monthly Production Gas
Graph: B. Burger, Fraunhofer ISE; data: Statistisches Bundesamt (DESTATIS), European Stock Exchange (EEX)
Monthly Production Gas
year 2014
5.0
6.0
7.0
4.0
3.0
2.0
1.0
TWh
January February March April May June July August Sept. October Nov. Dec.
Gas (EEX)Legende: Gas (DESTATIS)

© Fraunhofer ISE
22
Monthly Production
Graph: B. Burger, Fraunhofer ISE; data: Statistisches Bundesamt (DESTATIS), European Stock Exchange (EEX)
40
30
20
10
TWh
Monthly Production
year 2014
January February March April May June July August Sept. October Nov. Dec.
Legend: Uranium Brown Coal Hard Coal GasHydro Wind SolarPumped StorageBiomass

© Fraunhofer ISE
23
Electricity Export and Import
Graph: B. Burger, Fraunhofer ISE; data: Statistisches Bundesamt (DESTATIS); Entso-e
Electricity Export and Import
TWh
January February March April May June July August Sept. October Nov. Dec.
year 2014
5.0
6.0
7.0
4.0
3.0
2.0
1.0
Legend: Import (DESTATIS) Import (Entso-e)Export (DESTATIS) Export (Entso-e)

© Fraunhofer ISE
24
Export and Import Balance
Graph: B. Burger, Fraunhofer ISE; data: Statistisches Bundesamt (DESTATIS); Entso-e
The export surplus from January to September was approx. 20 TWh.
Electricity Export and Import Balance
1.0
2.0
-4.0
-5.0
-1.0
-2.0
-3.0
TWh
April May June July August Sept. October Nov.
year 2014
Legend:Import (DESTATIS)
surplusExport surplus(DESTATIS)
Import (Entso-e)
surplusExport (Entso-e)
surplus
Dec.January February March
Impo
rtEx
port

© Fraunhofer ISE
25
Histogram: Export and Import Balance
Graph: B. Burger, Fraunhofer ISE; data: Statistisches Bundesamt (DESTATIS); Entso-e
The maximal export surplus power was 16 GW
The maximal import surplus power was 11 GW
Jahr 2014
Impo
rt
Import power
Expo
rt
Export power
-4 -2 0 2 4 6 8 10
TWh
GW
Legende:
12 14 16 18-10-12-14-16-18-20 -8 -6
Electricity Export and Import Balance over Export and Import Power
1.0
2.0
-4.0
-5.0
-1.0
-2.0
-3.0
Import (DESTATIS)
surplusExport surplus(DESTATIS)

© Fraunhofer ISE
26
AGENDA
Annual energies
Monthly energies
Weekly energies
Daily energies
Annual power curves
Monthly power curves
Weekly power curves
Exemplary daily power curves

© Fraunhofer ISE
27
Weekly Production Solar
The maximal weekly solar electricity production was 1.26 TWh in calendar week 23
The minimal weekly production was 0.06 TWh in calendar week 49
Graph: B. Burger, Fraunhofer ISE; solar data: EEX Transparency Platform
41 8 12 16 20 24 28 32 36 40 44 48 52
2.5
2.0
1.5
1.0
0.5
TWh
Weekly Production Solar
year 2014
Calendar Week

© Fraunhofer ISE
28
Weekly Production Wind
The maximal weekly wind electricity production was 2.8 TWh in calendar week 51
The minimal weekly production was 0.32 TWh in calendar week 40
Graph: B. Burger, Fraunhofer ISE; data: EEX Transparency Platform
41 8 12 16 20 24 28 32 36 40 44 48 52
TWh
2.5
2.0
1.5
1.0
0.5
year 2014
Weekly Production Wind
Calendar Week

© Fraunhofer ISE
29
Weekly Production Conventional > 100 MW
The maximal weekly electricity production from conventional sources was 8.8 TWh in calendar week 49
The minimal weekly production was 5.05 TWh in calendar week 33
Graph: B. Burger, Fraunhofer ISE; data: EEX Transparency Platform
10
8
6
4
2
TWh
41 8 12 16 20 24 28 32 36 40 44 48 52
Weekly Production Conventional > 100 MW
year 2014
Calendar Week
© Fraunhofer ISE
30
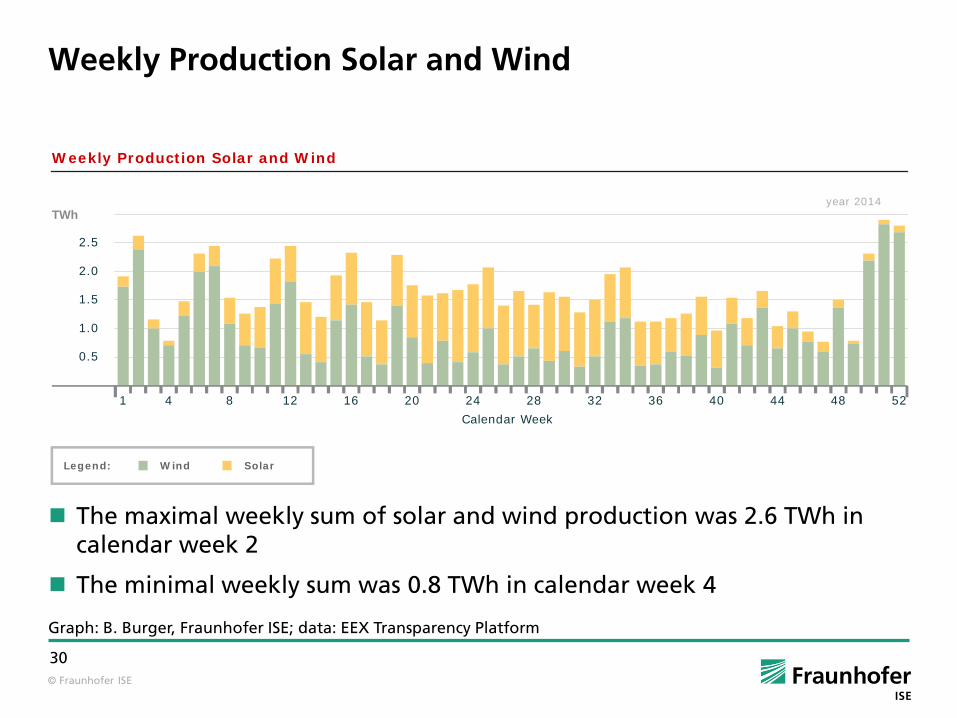
Weekly Production Solar and Wind
The maximal weekly sum of solar and wind production was 2.6 TWh in calendar week 2
The minimal weekly sum was 0.8 TWh in calendar week 4
Graph: B. Burger, Fraunhofer ISE; data: EEX Transparency Platform
41 8 12 16 20 24 28 32 36 40 44 48 52
TWh
2.5
2.0
1.5
1.0
0.5
Weekly Production Solar and Wind
year 2014
Legend: Wind Solar
Calendar Week

© Fraunhofer ISE
31
Weekly Production Solar, Wind and Conventional
Graph: B. Burger, Fraunhofer ISE; data: EEX Transparency Platform
10
8
6
4
2
TWh
41 8 12 16 20 24 28 32 36 40 44 48 52
year 2014
Weekly Production Solar, Wind and Conventional > 100 MW
Legend: Conventional > 100 MW Wind Solar
Calendar Week

© Fraunhofer ISE
32
Weekly Production Hydro
Graph: B. Burger, Fraunhofer ISE; data: EEX Transparency Platform
41 8 12 16 20 24 28 32 36 40 44 48 52
year 2014
2.5
2.0
1.5
1.0
0.5
TWh
Weekly Production Run of River
Calendar Week

© Fraunhofer ISE
33
Weekly Production Uranium
Graph: B. Burger, Fraunhofer ISE; data: EEX Transparency Platform
41 8 12 16 20 24 28 32 36 40 44 48 52
year 2014
2.5
2.0
1.5
1.0
0.5
TWh
Weekly Production Uranium
Calendar Week

© Fraunhofer ISE
34
Weekly Production Brown Coal
Graph: B. Burger, Fraunhofer ISE; data: EEX Transparency Platform
41 8 12 16 20 24 28 32 36 40 44 48 52
year 2014
2.5
2.0
1.5
1.0
0.5
TWh
Weekly Production Brown Coal
Calendar Week

© Fraunhofer ISE
35
Weekly Production Hard Coal
Graph: B. Burger, Fraunhofer ISE; data: EEX Transparency Platform
41 8 12 16 20 24 28 32 36 40 44 48 52
year 2014
2.5
2.0
1.5
1.0
0.5
TWh
Weekly Production Hard Coal
Calendar Week

© Fraunhofer ISE
36
Weekly Production Gas
Graph: B. Burger, Fraunhofer ISE; data: EEX Transparency Platform
41 8 12 16 20 24 28 32 36 40 44 48 52
year 2014
2.5
2.0
1.5
1.0
0.5
TWh
Weekly Production Gas
Calendar Week

© Fraunhofer ISE
37
Weekly Production
Graph: B. Burger, Fraunhofer ISE; data: EEX Transparency Platform
10
8
6
4
2
TWh
41 8 12 16 20 24 28 32 36 40 44 48 52
Weekly Production
year 2014
Calendar Week
Legend: Uranium Brown Coal Hard Coal GasHydro Wind SolarBiomass
© Fraunhofer ISE
38
AGENDA
Annual energies
Monthly energies
Weekly energies
Daily energies
Annual power curves
Monthly power curves
Weekly power curves
Exemplary daily power curves
© Fraunhofer ISE
39
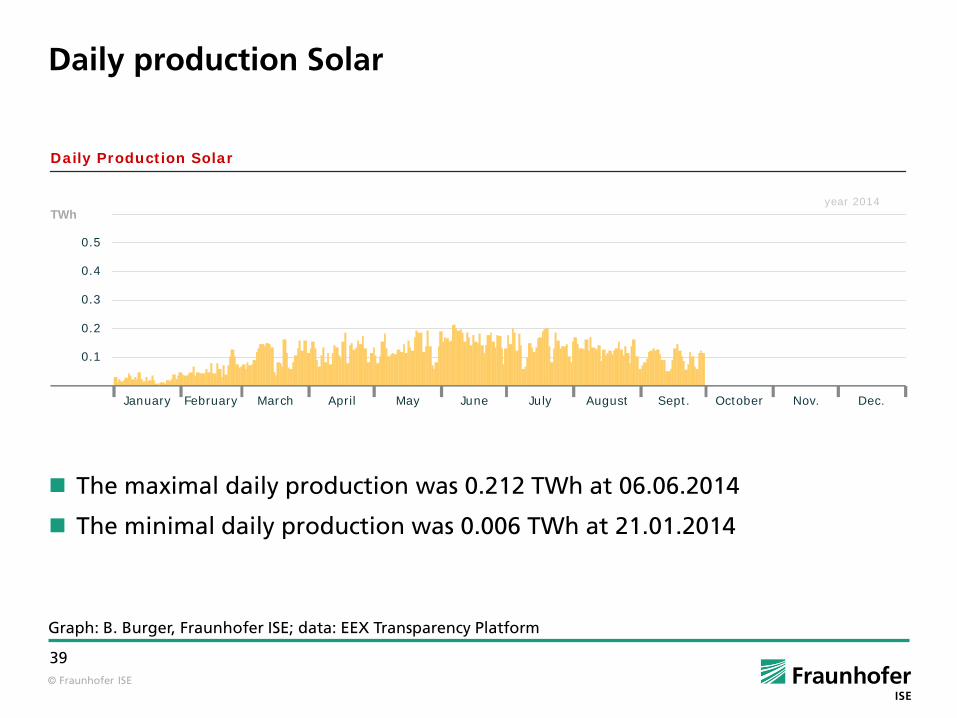
Daily production Solar
The maximal daily production was 0.212 TWh at 06.06.2014
The minimal daily production was 0.006 TWh at 21.01.2014
Graph: B. Burger, Fraunhofer ISE; data: EEX Transparency Platform
Daily Production Solar
0.4
0.5
0.3
0.2
0.1
TWh
January February March April May June July August Sept. October Nov. Dec.
year 2014

© Fraunhofer ISE
40
Daily production Wind
The maximal daily production was 0.543 TWh at 16.03.2014
The minimal daily production was 0.011 TWh at 16.07.2014
Graph: B. Burger, Fraunhofer ISE; data: EEX Transparency Platform
Daily Production Wind
0.4
0.5
0.3
0.2
0.1
TWh
January February March April May June July August Sept. October Nov. Dec.
year 2014
© Fraunhofer ISE
41
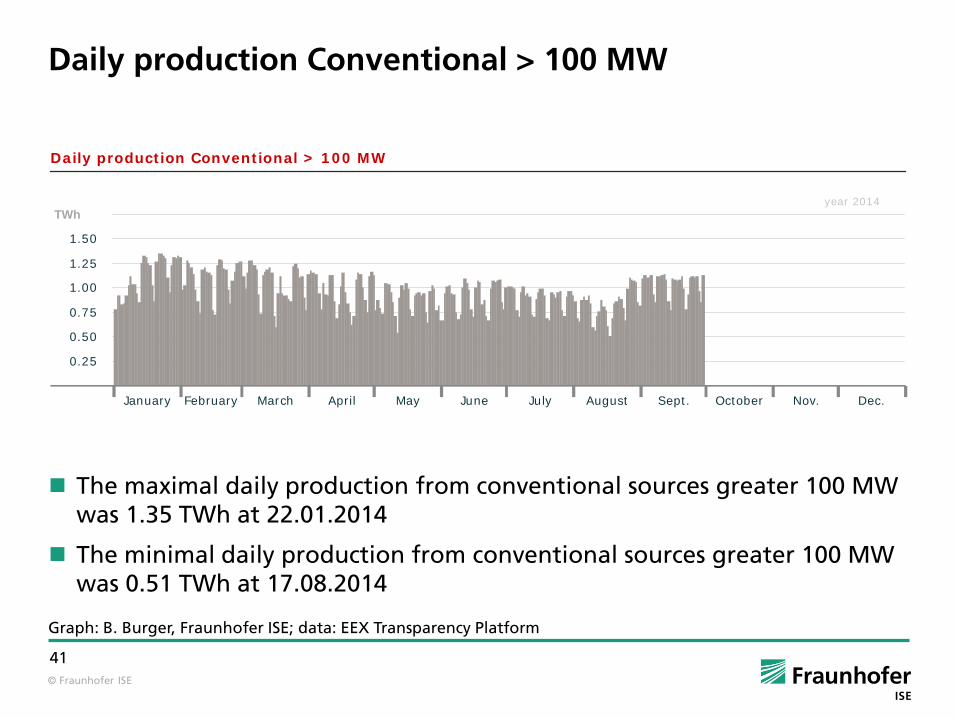
Daily production Conventional > 100 MW
The maximal daily production from conventional sources greater 100 MW was 1.35 TWh at 22.01.2014
The minimal daily production from conventional sources greater 100 MW was 0.51 TWh at 17.08.2014
Graph: B. Burger, Fraunhofer ISE; data: EEX Transparency Platform
Daily production Conventional > 100 MW
1.50
1.25
1.00
0.75
0.50
0.25
TWh
January February March April May June July August Sept. October Nov. Dec.
year 2014

© Fraunhofer ISE
42
Daily production Solar and Wind
The maximal daily sum of Solar and Wind production was 0.58 TWh at 16.03.2014
The minimal daily sum of Solar and Wind production was 0.022 TWh at 21.01.2014
Graph: B. Burger, Fraunhofer ISE; data: EEX Transparency Platform
Daily Production Solar and Wind
0.4
0.5
0.3
0.2
0.1
TWh
January February March April May June July August Sept. October Nov. Dec.
year 2014
Legend: Wind Solar

© Fraunhofer ISE
43
Daily production Solar, Wind and Conventional
Graph: B. Burger, Fraunhofer ISE; data: EEX Transparency Platform
Daily production Solar, Wind and Conventional > 100 MW
TWh
January February March April May June July August Sept. October Nov. Dec.
Legend: Conventional > 100 MW Wind Solar
year 2014
1.50
1.25
1.00
0.75
0.50
0.25

© Fraunhofer ISE
44
AGENDA
Annual energies
Monthly energies
Weekly energies
Daily energies
Annual power curves
Monthly power curves
Weekly power curves
Exemplary daily power curves

© Fraunhofer ISE
48
Power Solar versus Wind
Graph: B. Burger, Fraunhofer ISE; data: EEX Transparency Platform
The maximal sum of Solar and Wind power is smaller than the installed power of solar or wind
year 2014
Solar versus Wind Power
Wind
Sola
r
35 GW
30 GW20 GW
15 GW10 GW
5 GW25 GW
25
30
20
15
5
10
GW
25 30201550 10 GW

© Fraunhofer ISE
49
Planned versus actual production Solar
Graph: B. Burger, Fraunhofer ISE; data: EEX Transparency Platform
Planned versus actual production solar
Plan
ned
prod
uctio
n so
lar
Actual production solar
year 2014
25
25
30
30
20
20
15
15
5
50
10
10
GW
GW
+5 GW
+10 G
W
-5 GW
-10 G
W

© Fraunhofer ISE
50
Planned versus actual production Wind
Graph: B. Burger, Fraunhofer ISE; data: EEX Transparency Platform
Planned versus actual production wind
Plan
ned
prod
uctio
n w
ind
Actual production wind
year 2014
+5 GW
-5 GW
+10 G
W
-10 G
W
25
30
20
15
5
10
GW
25 30201550 10 GW

© Fraunhofer ISE
51
Planned versus actual production Conventional
Graph: B. Burger, Fraunhofer ISE; data: EEX Transparency Platform
Planned versus actual production conventional
Plan
ned
prod
uctio
n co
nven
tiona
l
Actual production conventional
year 2014
60
80
70
80
60
50
40
30
400
20
10
20
GW
GW
+10 G
W
-10 G
W

© Fraunhofer ISE
52
Planned versus actual production Solar + Wind
Graph: B. Burger, Fraunhofer ISE; data: EEX Transparency Platform
Planned versus actual production solar + wind
Plan
ned
prod
uctio
n so
lar +
win
d
Actual production solar + wind
year 2014
+5 G
W
-5 GW
+10 G
W
-10 G
W
40
35
30
25
20
15
10
5
GW
30 40200 10 GW

© Fraunhofer ISE
53
Electricity Production: Uranium, Coal and Gas
Graph: B. Burger, Fraunhofer ISE; data: EEX Transparency Platform
10,000
15,000
5,000
15,000
20,000
15,000
15,000
20,000
10,000
10,000
10,000
5,000
5,000
5,000
MW
Real Production
Legend: Uranium Brown Coal Hard Coal
January February March April May June July August Sept. October Nov. Dec.
Gas
dislpayed year: 2014

© Fraunhofer ISE
54
Electricity Production: Run of River, Pumped Storage and Seasonal Storage
Graph: B. Burger, Fraunhofer ISE; data: EEX Transparency Platform
Real Production
dislpayed year: 2014
4,000
6,000
2,000
6,000
6,000
4,000
4,000
2,000
2,000
MW
Legende:
January February March April May June July August Sept. October Nov. Dec.
Run of River Pumped Storage Seasonal Store

© Fraunhofer ISE
55
Uranium: Available capacity, non-usability and utilisation
Graph: B. Burger, Fraunhofer ISE; data: EEX Transparency Platform
10,000
5,000
60%
80%
100%
15,000
15,000
40%
10,000
20%
5,000
year 2014MW
Uranium
Planned and unscheduled non-usability
Available generation capacity
Utilisation of available generation capacity
January February March April May June July August Sept. October Nov. Dec.

© Fraunhofer ISE
56
Brown Coal: Available capacity, non-usability and utilisation
Graph: B. Burger, Fraunhofer ISE; data: EEX Transparency Platform
60%
80%
100%
40%
20%
year 2014MW
Brown Coal
January February March April May June July August Sept. October Nov. Dec.
10,000
5,000
15,000
15,000
10,000
5,000
Planned and unscheduled non-usability
Available generation capacity
Utilisation of available generation capacity

© Fraunhofer ISE
57
Hard Coal: Available capacity, non-usability and utilisation
Graph: B. Burger, Fraunhofer ISE; data: EEX Transparency Platform
60%
80%
100%
40%
20%
year 2014MW
Hard Coal
10,000
5,000
15,000
15,000
10,000
5,000
Planned and unscheduled non-usability
Available generation capacity
Utilisation of available generation capacity
January February March April May June July August Sept. October Nov. Dec.

© Fraunhofer ISE
58
Gas: Available capacity, non-usability and utilisation
Graph: B. Burger, Fraunhofer ISE; data: EEX Transparency Platform
60%
80%
100%
40%
20%
year 2014MW
Gas
10,000
5,000
15,000
15,000
10,000
5,000
Planned and unscheduled non-usability
Available generation capacity
Utilisation of available generation capacity
January February March April May June July August Sept. October Nov. Dec.

© Fraunhofer ISE
59
Electricity Export and Import
Graph: B. Burger, Fraunhofer ISE; data: Entso-e
15,000
5,000
10,000
-5,000
-10,000
-15,000
MW
February March April May June July August Sept. October Nov. Dec.
Export and Import
Legend: ImportExport
year 2014
January

© Fraunhofer ISE
60
Electricity Export and Import Balance
Graph: B. Burger, Fraunhofer ISE; data: Entso-e
15,000
5,000
10,000
-5,000
-10,000
-15,000
MW
February March April May June July August Sept. October Nov. Dec.
Export and Import Balance
Legend: Import surplusExport surplus
year 2014
January

© Fraunhofer ISE
61
Electricity Export and Import France, Switzerland and Poland
Graph: B. Burger, Fraunhofer ISE; data: Entso-e
2,500
2,500
-2,500
-2,500
2,500
-2,500
FR DE→
DE FR→
CH DE→
DE CH→
PL DE→
DE PL→
Export and Import
Legend:
January February March April May June July August Sept. October Nov. Dec.
year 2014
ImportExport

© Fraunhofer ISE
62
Electricity Export and Import Denmark and Austria
Graph: B. Burger, Fraunhofer ISE; data: Entso-e
DK1 DE→
DE DK1→
DK2 DE→
DE DK2→
AT DE→
DE AT→
Export and Import
year 2014
January February March April May June July August Sept. October Nov. Dec.
2,500
2,500
-2,500
-2,500
2,500
-2,500
Legend: ImportExport

© Fraunhofer ISE
63
Electricity Export and Import Czech Republic, the Netherlands and Sweden
Graph: B. Burger, Fraunhofer ISE; data: Entso-e
CZ DE→
DE CZ→
NL DE→
DE NL→
SE DE→
DE SE→January February March April May June July August Sept. October Nov. Dec.
year 2014
2,500
2,500
-2,500
-2,500
2,500
-2,500
Export and Import
Legend: ImportExport
© Fraunhofer ISE
64
AGENDA
Annual energies
Monthly energies
Weekly energies
Daily energies
Annual power curves
Monthly power curves
Monthly power curves for conventional, wind and solar
Monthly power curves with export and import
Detailed monthly power curves
Diurnal power courses
Weekly power curves
© Fraunhofer ISE
65
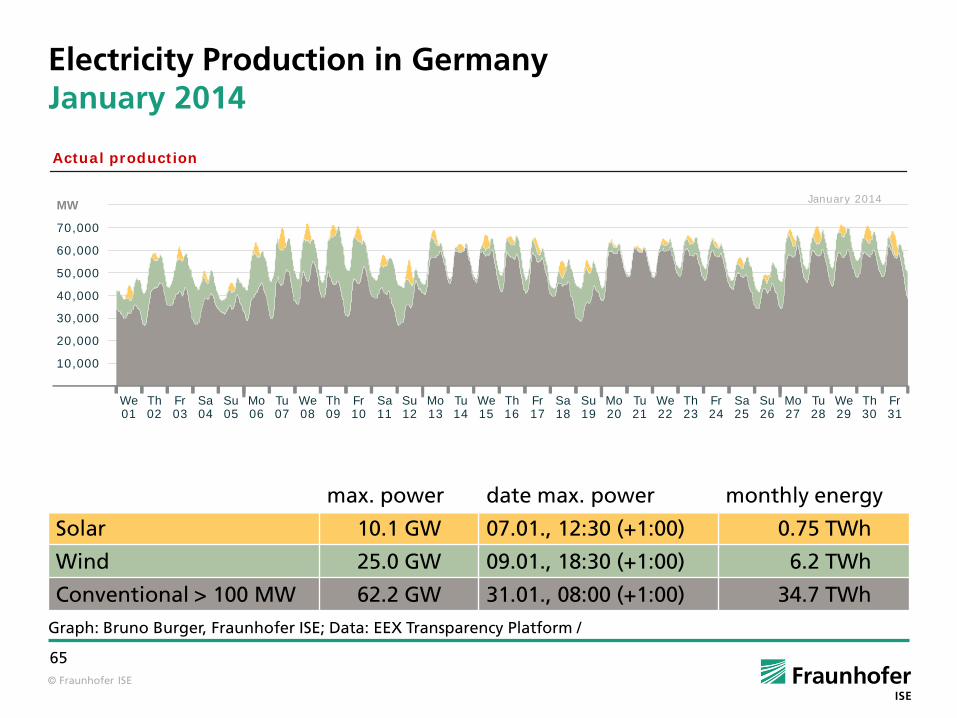
Electricity Production in Germany January 2014
Graph: Bruno Burger, Fraunhofer ISE; Data: EEX Transparency Platform /
max. power date max. power monthly energy
Solar 10.1 GW 07.01., 12:30 (+1:00) 0.75 TWh
Wind 25.0 GW 09.01., 18:30 (+1:00) 6.2 TWh
Conventional > 100 MW 62.2 GW 31.01., 08:00 (+1:00) 34.7 TWh
Actual production
January 2014
Th02
We01
Th09
Th16
Th23
Fr03
Fr10
Fr17
Fr24
Sa04
Sa11
Sa18
Sa25
Su05
Su12
Su19
Su26
Mo06
Mo13
Mo20
Mo27
Tu07
Tu14
Tu21
Tu28
We08
We15
We22
We29
Th30
Fr31
60,000
70,000
MW
50,000
40,000
30,000
20,000
10,000

© Fraunhofer ISE
66
Electricity Production in Germany February 2014
Graph: Bruno Burger, Fraunhofer ISE; Data: EEX Transparency Platform /
max. power date max. power monthly energy
Solar 20.4 GW 24.02., 12:00 (+1:00) 1.64 TWh
Wind 25.6 GW 07.02., 16:00 (+1:00) 6.14 TWh
Conventional > 100 MW 60.4 GW 17.02., 18:00 (+1:00) 30.8 TWh
Actual production
February 2014
60,000
70,000
MW
50,000
40,000
30,000
20,000
10,000
So02
Sa01
So09
So16
So23
Mo03
Mo10
Mo17
Mo24
Tu04
Tu11
Tu18
Tu25
We05
We12
We19
We26
Th06
Th13
Th20
Th27
Fr07
Fr14
Fr21
Fr28
Sa08
Sa15
Sa22

© Fraunhofer ISE
67
Electricity Production in Germany March 2014
Graph: Bruno Burger, Fraunhofer ISE; Data: EEX Transparency Platform /
max. power date max. power monthly energy
Solar 23.0 GW 20.03., 12:15 (+1:00) 3.31 TWh
Wind 24.8 GW 16.03., 02:30 (+1:00) 4.59 TWh
Conventional > 100 MW 60.3 GW 24.03., 19:00 (+1:00) 32.4 TWh
So02
Sa01
So09
So16
So23
So30
Mo03
Mo10
Mo17
Mo24
Mo31
Tu04
Tu11
Tu18
Tu25
We05
We12
We19
We26
Th06
Th13
Th20
Th27
Fr07
Fr14
Fr21
Fr28
Sa08
Sa15
Sa22
Sa29
Actual production
March 2014
60,000
70,000
MW
50,000
40,000
30,000
20,000
10,000

© Fraunhofer ISE
68
Electricity Production in Germany April 2014
Graph: Bruno Burger, Fraunhofer ISE; Data: EEX Transparency Platform /
max. power date max. power monthly energy
Solar 24.2 GW 17.04., 13:00 (+2:00) 3.67 TWh
Wind 23.9 GW 14.04., 14:45 (+2:00) 3.55 TWh
Conventional > 100 MW 54.3 GW 01.04., 08:00 (+2:00) 29.3 TWh
Actual production
April 2014
60,000
70,000
MW
50,000
40,000
30,000
20,000
10,000
We02
Tu01
We09
We16
We23
We30
Th03
Th10
Th17
Th24
Fr04
Fr11
Fr18
Fr25
Sa05
Sa12
Sa19
Sa26
Su06
Su13
Su20
Su27
Mo07
Mo14
Mo21
Mo28
Tu08
Tu15
Tu22
Tu29

© Fraunhofer ISE
69
Electricity Production in Germany May 2014
Graph: Bruno Burger, Fraunhofer ISE; Data: EEX Transparency Platform /
max. power date max. power monthly energy
Solar 23.5 GW 20.05., 12:45 (+2:00) 4.11 TWh
Wind 21.7 GW 11.05., 13:00 (+2:00) 3.70 TWh
Conventional > 100 MW 48.4 GW 13.05., 08:00 (+2:00) 27.1 TWh
displayed month: May 2014
Actual production
60,000
70,000
MW
50,000
40,000
30,000
20,000
10,000
Fr02
Th01
Fr09
Fr16
Fr23
Fr30
Sa03
Sa10
Sa17
Sa24
Su04
Su11
Su18
Su25
Mo05
Mo12
Mo19
Mo26
Tu06
Tu13
Tu20
Tu27
We07
We14
We21
We28
Th08
Th15
Th22
Th29
Sa31

© Fraunhofer ISE
70
Electricity Production in Germany June 2014
Graph: Bruno Burger, Fraunhofer ISE; Data: EEX Transparency Platform /
max. power date max. power monthly energy
Solar 24.24 GW 06.06., 13:00 (+2:00) 4.84 TWh
Wind 13.7 GW 19.06., 18:45 (+2:00) 2.47 TWh
Conventional > 100 MW 50.3 GW 11.06., 08:00 (+2:00) 27.4 TWh
Actual production
June 2014
60,000
70,000
MW
50,000
40,000
30,000
20,000
10,000
Mo02
Su01
Mo09
Mo16
Mo23
Mo30
Tu03
Tu10
Tu17
Tu24
We04
We11
We18
We25
Th05
Th12
Th19
Th26
Fr06
Fr13
Fr20
Fr27
Sa07
Sa14
Sa21
Sa28
Su08
Su15
Su22
Su29

© Fraunhofer ISE
71
Electricity Production in Germany July 2014
Graph: Bruno Burger, Fraunhofer ISE; Data: EEX Transparency Platform /
max. power date max. power monthly energy
Solar 23.6 GW 19.07., 13:00 (+2:00) 4.42 TWh
Wind 9.5 GW 23.07., 19:15 (+2:00) 2.34 TWh
Conventional > 100 MW 48.6 GW 08.07., 11:00 (+2:00) 27.7 TWh
Actual production
We02
Tu01
We09
We16
We23
We30
Th03
Th10
Th17
Th24
Th31
Fr04
Fr11
Fr18
Fr25
Sa05
Sa12
Sa19
Sa26
Su06
Su13
Su20
Su27
Mo07
Mo14
Mo21
Mo28
Tu08
Tu15
Tu22
Tu29
July 2014
60,000
70,000
MW
50,000
40,000
30,000
20,000
10,000

© Fraunhofer ISE
72
Electricity Production in Germany August 2014
Graph: Bruno Burger, Fraunhofer ISE; Data: EEX Transparency Platform /
max. power date max. power monthly energy
Solar 22.0 GW 28.08., 12:30 (+2:00) 3.90 TWh
Wind 20.0 GW 18.08., 13:15 (+2:00) 3.33 TWh
Conventional > 100 MW 51.5 GW 26.08., 09:00 (+2:00) 25.5 TWh
Actual production
August 2014
60,000
70,000
MW
50,000
40,000
30,000
20,000
10,000
Sa02
Fr01
Sa09
Sa16
Sa23
Sa30
Su03
Su10
Su17
Su24
Mo04
Mo11
Mo18
Mo25
Tu05
Tu12
Tu19
Tu26
We06
We13
We20
We27
Th07
Th14
Th21
Th28
Fr08
Fr15
Fr22
Fr29
So31

© Fraunhofer ISE
73
Electricity Production in Germany September 2014
Graph: Bruno Burger, Fraunhofer ISE; Data: EEX Transparency Platform /
max. power date max. power monthly energy
Solar 20.8 GW 17.09., 13:30 (+2:00) 2.89 TWh
Wind 14.6 GW 22.09., 12:45 (+2:00) 2.45 TWh
Conventional > 100 MW 57.2 GW 30.09., 19:00 (+2:00) 31.4 TWh
September 2014
Actual production
60,000
70,000
MW
50,000
40,000
30,000
20,000
10,000
Tu02
Mo01
Tu09
Tu16
Tu23
Tu30
We03
We10
We17
We24
Th04
Th11
Th18
Th25
Fr05
Fr12
Fr19
Fr26
Sa06
Sa13
Sa20
Sa27
Su07
Su14
Su21
Su28
Mo08
Mo15
Mo22
Mo29

© Fraunhofer ISE
74
Electricity Production in Germany October 2014
Graph: Bruno Burger, Fraunhofer ISE; Data: EEX Transparency Platform /
max. power date max. power monthly energy
Solar 18.7 GW 03.10., 13:30 (+2:00) 1.96 TWh
Wind 21.5 GW 22.10., 03:30 (+2:00) 3.8 TWh
Conventional > 100 MW 61.3 GW 29.10., 17:00 (+1:00) 34.5 TWh
Actual production
October 2014
60,000
70,000
MW
50,000
40,000
30,000
20,000
10,000
Th02
We01
Th09
Th16
Th23
Fr03
Fr10
Fr17
Fr24
Sa04
Sa11
Sa18
Sa25
Su05
Su12
Su19
Su26
Mo06
Mo13
Mo20
Mo27
Tu07
Tu14
Tu21
Tu28
We08
We15
We22
We29
Th30
Fr31

© Fraunhofer ISE
75
Electricity Production in Germany November 2014
Graph: Bruno Burger, Fraunhofer ISE; Data: EEX Transparency Platform /
max. power date max. power monthly energy
Solar 14.0 GW 01.11., 12:00 (+1:00) 0.97 TWh
Wind 19.8 GW 03.11., 19:00 (+1:00) 3.99 TWh
Conventional > 100 MW 62.3 GW 20.11., 17:00 (+1:00) 34.3 TWh
November 2014
Actual production
60,000
70,000
MW
50,000
40,000
30,000
20,000
10,000
So02
Sa01
So09
So16
So23
Mo03
Mo10
Mo17
Mo24
Tu04
Tu11
Tu18
Tu25
We05
We12
We19
We26
Th06
Th13
Th20
Th27
Fr07
Fr14
Fr21
Fr28
Sa08
Sa15
Sa22
So30
Sa29

© Fraunhofer ISE
76
AGENDA
Annual energies
Monthly energies
Weekly energies
Daily energies
Annual power curves
Monthly power curves
Monthly power curves for conventional, wind and solar
Monthly power curves with export and import
Detailed monthly power curves
Diurnal power courses
Weekly power curves
© Fraunhofer ISE
77
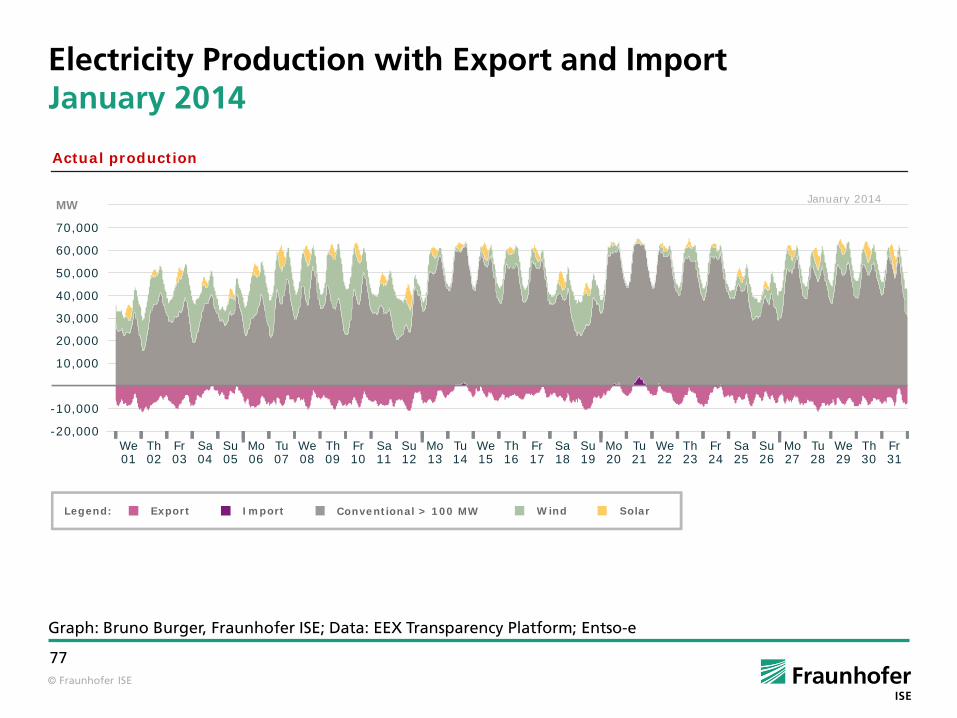
Electricity Production with Export and Import January 2014
Graph: Bruno Burger, Fraunhofer ISE; Data: EEX Transparency Platform; Entso-e
MW
-10,000
-20,000
Legend: WindImport SolarExport
Actual production
January 2014
60,000
70,000
50,000
40,000
30,000
20,000
10,000
Th02
We01
Th09
Th16
Th23
Fr03
Fr10
Fr17
Fr24
Sa04
Sa11
Sa18
Sa25
Su05
Su12
Su19
Su26
Mo06
Mo13
Mo20
Mo27
Tu07
Tu14
Tu21
Tu28
We08
We15
We22
We29
Th30
Fr31
Conventional > 100 MW

© Fraunhofer ISE
78
Electricity Production with Export and Import February 2014
Graph: Bruno Burger, Fraunhofer ISE; Data: EEX Transparency Platform; Entso-e
MW
-10,000
-20,000
Legend: WindImport SolarExport
Actual production
February 2014
60,000
70,000
50,000
40,000
30,000
20,000
10,000
Conventional > 100 MW
So02
Sa01
So09
So16
So23
Mo03
Mo10
Mo17
Mo24
Tu04
Tu11
Tu18
Tu25
We05
We12
We19
We26
Th06
Th13
Th20
Th27
Fr07
Fr14
Fr21
Fr28
Sa08
Sa15
Sa22

© Fraunhofer ISE
79
Electricity Production with Export and Import March 2014
Graph: Bruno Burger, Fraunhofer ISE; Data: EEX Transparency Platform; Entso-e
MW
-10,000
-20,000
Legend: WindImport SolarExport
Actual production
March 2014
60,000
70,000
50,000
40,000
30,000
20,000
10,000
Conventional > 100 MW
So02
Sa01
So09
So16
So23
So30
Mo03
Mo10
Mo17
Mo24
Mo31
Tu04
Tu11
Tu18
Tu25
We05
We12
We19
We26
Th06
Th13
Th20
Th27
Fr07
Fr14
Fr21
Fr28
Sa08
Sa15
Sa22
Sa29

© Fraunhofer ISE
80
Electricity Production with Export and Import April 2014
Graph: Bruno Burger, Fraunhofer ISE; Data: EEX Transparency Platform; Entso-e
MW
-10,000
-20,000
Legend: WindImport SolarExport
Actual production
April 2014
60,000
70,000
50,000
40,000
30,000
20,000
10,000
Conventional > 100 MW
We02
Tu01
We09
We16
We23
We30
Th03
Th10
Th17
Th24
Fr04
Fr11
Fr18
Fr25
Sa05
Sa12
Sa19
Sa26
Su06
Su13
Su20
Su27
Mo07
Mo14
Mo21
Mo28
Tu08
Tu15
Tu22
Tu29

© Fraunhofer ISE
81
Electricity Production with Export and Import May 2014
Graph: Bruno Burger, Fraunhofer ISE; Data: EEX Transparency Platform; Entso-e
MW
-10,000
-20,000
Legend: WindImport SolarExport
Actual production
May 2014
60,000
70,000
50,000
40,000
30,000
20,000
10,000
Conventional > 100 MW
Fr02
Th01
Fr09
Fr16
Fr23
Fr30
Sa03
Sa10
Sa17
Sa24
Su04
Su11
Su18
Su25
Mo05
Mo12
Mo19
Mo26
Tu06
Tu13
Tu20
Tu27
We07
We14
We21
We28
Th08
Th15
Th22
Th29
Sa31

© Fraunhofer ISE
82
Electricity Production with Export and Import June 2014
Graph: Bruno Burger, Fraunhofer ISE; Data: EEX Transparency Platform; Entso-e
MW
-10,000
-20,000
Legend: WindImport SolarExport
Actual production
June 2014
60,000
70,000
50,000
40,000
30,000
20,000
10,000
Conventional > 100 MW
Mo02
Su01
Mo09
Mo16
Mo23
Mo30
Tu03
Tu10
Tu17
Tu24
We04
We11
We18
We25
Th05
Th12
Th19
Th26
Fr06
Fr13
Fr20
Fr27
Sa07
Sa14
Sa21
Sa28
Su08
Su15
Su22
Su29

© Fraunhofer ISE
83
Electricity Production with Export and Import July 2014
Graph: Bruno Burger, Fraunhofer ISE; Data: EEX Transparency Platform; Entso-e
MW
-10,000
-20,000
Legend: WindImport SolarExport
Actual production
July 2014
60,000
70,000
50,000
40,000
30,000
20,000
10,000
Conventional > 100 MW
We02
Tu01
We09
We16
We23
We30
Th03
Th10
Th17
Th24
Th31
Fr04
Fr11
Fr18
Fr25
Sa05
Sa12
Sa19
Sa26
Su06
Su13
Su20
Su27
Mo07
Mo14
Mo21
Mo28
Tu08
Tu15
Tu22
Tu29

© Fraunhofer ISE
84
Electricity Production with Export and Import August 2014
Graph: Bruno Burger, Fraunhofer ISE; Data: EEX Transparency Platform; Entso-e
MW
-10,000
-20,000
Legend: WindImport SolarExport
Actual production
August 2014
60,000
70,000
50,000
40,000
30,000
20,000
10,000
Conventional > 100 MW
Sa02
Fr01
Sa09
Sa16
Sa23
Sa30
Su03
Su10
Su17
Su24
Mo04
Mo11
Mo18
Mo25
Tu05
Tu12
Tu19
Tu26
We06
We13
We20
We27
Th07
Th14
Th21
Th28
Fr08
Fr15
Fr22
Fr29
So31

© Fraunhofer ISE
85
Electricity Production with Export and Import September 2014
Graph: Bruno Burger, Fraunhofer ISE; Data: EEX Transparency Platform; Entso-e
Actual production
Tu02
Mo01
Tu09
Tu16
Tu23
Tu30
We03
We10
We17
We24
Th04
Th11
Th18
Th25
Fr05
Fr12
Fr19
Fr26
Sa06
Sa13
Sa20
Sa27
Su07
Su14
Su21
Su28
Mo08
Mo15
Mo22
Mo29
MW
-10,000
September 2014
60,000
70,000
50,000
40,000
30,000
20,000
10,000
Legend: WindImport SolarExport Conventional > 100 MW

© Fraunhofer ISE
86
Electricity Production with Export and Import October 2014
Graph: Bruno Burger, Fraunhofer ISE; Data: EEX Transparency Platform; Entso-e
MW
-10,000
-20,000
Legend: WindImport SolarExport
Actual production
October 2014
60,000
70,000
50,000
40,000
30,000
20,000
10,000
Th02
We01
Th09
Th16
Th23
Fr03
Fr10
Fr17
Fr24
Sa04
Sa11
Sa18
Sa25
Su05
Su12
Su19
Su26
Mo06
Mo13
Mo20
Mo27
Tu07
Tu14
Tu21
Tu28
We08
We15
We22
We29
Th30
Fr31
Conventional > 100 MW

© Fraunhofer ISE
87
Electricity Production with Export and Import November 2014
Graph: Bruno Burger, Fraunhofer ISE; Data: EEX Transparency Platform; Entso-e
Actual production
MW
-10,000
November 2014
60,000
70,000
50,000
40,000
30,000
20,000
10,000
Legend: WindImport SolarExport Conventional > 100 MW
So02
Sa01
So09
So16
So23
Mo03
Mo10
Mo17
Mo24
Tu04
Tu11
Tu18
Tu25
We05
We12
We19
We26
Th06
Th13
Th20
Th27
Fr07
Fr14
Fr21
Fr28
Sa08
Sa15
Sa22
So30
Sa29

© Fraunhofer ISE
88
AGENDA
Annual energies
Monthly energies
Weekly energies
Daily energies
Annual power curves
Monthly power curves
Monthly power curves for conventional, wind and solar
Monthly power curves with export and import
Detailed monthly power curves
Diurnal power courses
Weekly power curves
© Fraunhofer ISE
89
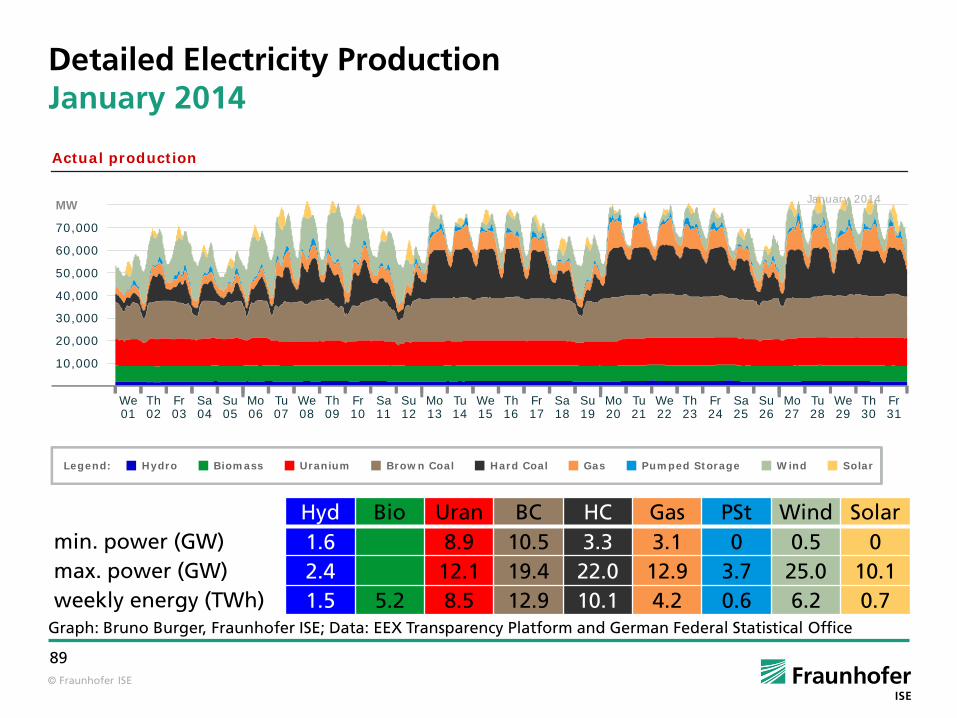
Detailed Electricity Production January 2014
Graph: Bruno Burger, Fraunhofer ISE; Data: EEX Transparency Platform and German Federal Statistical Office
Hyd Bio Uran BC HC Gas PSt Wind Solar min. power (GW) 1.6 8.9 10.5 3.3 3.1 0 0.5 0 max. power (GW) 2.4 12.1 19.4 22.0 12.9 3.7 25.0 10.1 weekly energy (TWh) 1.5 5.2 8.5 12.9 10.1 4.2 0.6 6.2 0.7
Actual production
Legend: Uranium Brown Coal Hard Coal GasHydro Wind SolarPumped StorageBiomass
MW
Th02
We01
Th09
Th16
Th23
Fr03
Fr10
Fr17
Fr24
Sa04
Sa11
Sa18
Sa25
Su05
Su12
Su19
Su26
Mo06
Mo13
Mo20
Mo27
Tu07
Tu14
Tu21
Tu28
We08
We15
We22
We29
Th30
Fr31
60,000
70,000
50,000
40,000
30,000
20,000
10,000
January 2014

© Fraunhofer ISE
90
Detailed Electricity Production February 2014
Graph: Bruno Burger, Fraunhofer ISE; Data: EEX Transparency Platform and German Federal Statistical Office
Hyd Bio Uran BC HC Gas PSt Wind Solar min. power (GW) 0.9 8.6 9.4 2.5 2.8 0 0.5 0 max. power (GW) 1.9 12.1 18.9 21.0 11.4 4.3 25.6 20.4 weekly energy (TWh) 1.1 4.2 8.1 11.3 8.3 3.2 0.6 6.1 1.6
Actual production
Legend: Uranium Brown Coal Hard Coal GasHydro Wind SolarPumped StorageBiomass
MW
60,000
70,000
50,000
40,000
30,000
20,000
10,000
February 2014
So02
Sa01
So09
So16
So23
Mo03
Mo10
Mo17
Mo24
Tu04
Tu11
Tu18
Tu25
We05
We12
We19
We26
Th06
Th13
Th20
Th27
Fr07
Fr14
Fr21
Fr28
Sa08
Sa15
Sa22

© Fraunhofer ISE
91
Detailed Electricity Production March 2014
Graph: Bruno Burger, Fraunhofer ISE; Data: EEX Transparency Platform and German Federal Statistical Office
Hyd Bio Uran BC HC Gas PSt Wind Solar min. power (GW) 0.8 8.5 7.7 2.1 2.3 0 0 0 max. power (GW) 2.0 12.1 19.4 20.9 12.5 5.0 24.8 23.0 weekly energy (TWh) 1.0 4.1 8.4 12.4 8.5 3.0 0.6 4.6 3.3
So02
Sa01
So09
So16
So23
So30
Mo03
Mo10
Mo17
Mo24
Mo31
Tu04
Tu11
Tu18
Tu25
We05
We12
We19
We26
Th06
Th13
Th20
Th27
Fr07
Fr14
Fr21
Fr28
Sa08
Sa15
Sa22
Sa29
Actual production
March 2014
60,000
70,000
MW
50,000
40,000
30,000
20,000
10,000
Legend: Uranium Brown Coal Hard Coal GasHydro Wind SolarPumped StorageBiomass

© Fraunhofer ISE
92
Detailed Electricity Production April 2014
Graph: Bruno Burger, Fraunhofer ISE; Data: EEX Transparency Platform and German Federal Statistical Office
Hyd Bio Uran BC HC Gas PSt Wind Solar min. power (GW) 1.5 7.7 9.2 2.3 2 0 0.1 0 max. power (GW) 2.6 11.6 18.2 20.8 6.7 3.9 23.9 24.2 weekly energy (TWh) 1.3 3.8 7.3 11.2 8.5 2.4 0.6 3.6 3.7
Actual production
April 2014
60,000
70,000
MW
50,000
40,000
30,000
20,000
10,000
We02
Tu01
We09
We16
We23
We30
Th03
Th10
Th17
Th24
Fr04
Fr11
Fr18
Fr25
Sa05
Sa12
Sa19
Sa26
Su06
Su13
Su20
Su27
Mo07
Mo14
Mo21
Mo28
Tu08
Tu15
Tu22
Tu29
Legend: Uranium Brown Coal Hard Coal GasHydro Wind SolarPumped StorageBiomass

© Fraunhofer ISE
93
Detailed Electricity Production May 2014
Graph: Bruno Burger, Fraunhofer ISE; Data: EEX Transparency Platform and German Federal Statistical Office
Hyd Bio Uran BC HC Gas PSt Wind Solar min. power (GW) 2.0 6.3 7.3 2.3 1.6 0 0.3 0 max. power (GW) 4.2 9.5 17.3 18.6 4.5 3.5 21.7 23.5 weekly energy (TWh) 2.5 4.0 6.0 10.7 8.1 2.0 0.6 3.7 4.1
Legend: Uranium Brown Coal Hard Coal GasHydro Wind SolarPumped StorageBiomass
May 2014
Actual production
60,000
70,000
MW
50,000
40,000
30,000
20,000
10,000
Fr02
Th01
Fr09
Fr16
Fr23
Fr30
Sa03
Sa10
Sa17
Sa24
Su04
Su11
Su18
Su25
Mo05
Mo12
Mo19
Mo26
Tu06
Tu13
Tu20
Tu27
We07
We14
We21
We28
Th08
Th15
Th22
Th29
Sa31

© Fraunhofer ISE
94
Detailed Electricity Production June 2014
Graph: Bruno Burger, Fraunhofer ISE; Data: EEX Transparency Platform and German Federal Statistical Office
Hyd Bio Uran BC HC Gas PSt Wind Solar min. power (GW) 2.7 7.2 10.3 2.5 1.5 0 0.1 0 max. power (GW) 4.2 10.2 17.5 17.9 4.3 3.6 13.7 24.2 weekly energy (TWh) 2.7 3.6 6.7 11 7.4 1.6 0.5 2.5 4.8
Actual production
June 2014
60,000
70,000
MW
50,000
40,000
30,000
20,000
10,000
Mo02
Su01
Mo09
Mo16
Mo23
Mo30
Tu03
Tu10
Tu17
Tu24
We04
We11
We18
We25
Th05
Th12
Th19
Th26
Fr06
Fr13
Fr20
Fr27
Sa07
Sa14
Sa21
Sa28
Su08
Su15
Su22
Su29
Legend: Uranium Brown Coal Hard Coal GasHydro Wind SolarPumped StorageBiomass

© Fraunhofer ISE
95
Detailed Electricity Production July 2014
Graph: Bruno Burger, Fraunhofer ISE; Data: EEX Transparency Platform and German Federal Statistical Office
Hyd Bio Uran BC HC Gas PSt Wind Solar min. power (GW) 2.0 6.9 7.1 2.4 1.9 0 0 0 max. power (GW) 3.7 9.2 16.1 17.2 6.1 3.9 9.5 23.6 weekly energy (TWh) 2.5 3.6 6.2 10.5 8.4 2.0 0.5 2.3 4.4
Actual production
We02
Tu01
We09
We16
We23
We30
Th03
Th10
Th17
Th24
Th31
Fr04
Fr11
Fr18
Fr25
Sa05
Sa12
Sa19
Sa26
Su06
Su13
Su20
Su27
Mo07
Mo14
Mo21
Mo28
Tu08
Tu15
Tu22
Tu29
July 2014
60,000
70,000
MW
50,000
40,000
30,000
20,000
10,000
Legend: Uranium Brown Coal Hard Coal GasHydro Wind SolarPumped StorageBiomass

© Fraunhofer ISE
96
Detailed Electricity Production August 2014
Graph: Bruno Burger, Fraunhofer ISE; Data: EEX Transparency Platform and German Federal Statistical Office
Hyd Bio Uran BC HC Gas PSt Wind Solar min. power (GW) 1.9 7.5 6.1 1.5 1.5 0 0.1 0 max. power (GW) 3.2 11.9 16.9 16.3 4.3 4.4 20.0 22.0 weekly energy (TWh) 1.9 3.7 7.4 10.2 5.3 2.2 0.7 3.3 3.9
Actual production
August 2014
60,000
70,000
MW
50,000
40,000
30,000
20,000
10,000
Legend: Uranium Brown Coal Hard Coal GasHydro Wind SolarPumped StorageBiomass
Sa02
Fr01
Sa09
Sa16
Sa23
Sa30
Su03
Su10
Su17
Su24
Mo04
Mo11
Mo18
Mo25
Tu05
Tu12
Tu19
Tu26
We06
We13
We20
We27
Th07
Th14
Th21
Th28
Fr08
Fr15
Fr22
Fr29
So31

© Fraunhofer ISE
97
Detailed Electricity Production September 2014
Graph: Bruno Burger, Fraunhofer ISE; Data: EEX Transparency Platform and German Federal Statistical Office
Hyd Bio Uran BC HC Gas PSt Wind Solar min. power (GW) 1.5 6.9 11.0 2.7 2.0 0 0.1 0 max. power (GW) 2.6 11.8 17.6 19.4 7.9 4.0 14.6 20.8 weekly energy (TWh) 1.5 3.7 7.5 11.5 8.8 2.6 0.7 2.5 2.9
Actual production
September 2014
60,000
70,000
MW
50,000
40,000
30,000
20,000
10,000
Legend: Uranium Brown Coal Hard Coal GasHydro Wind SolarPumped StorageBiomass
Tu02
Mo01
Tu09
Tu16
Tu23
Tu30
We03
We10
We17
We24
Th04
Th11
Th18
Th25
Fr05
Fr12
Fr19
Fr26
Sa06
Sa13
Sa20
Sa27
Su07
Su14
Su21
Su28
Mo08
Mo15
Mo22
Mo29

© Fraunhofer ISE
98
Detailed Electricity Production October 2014
Graph: Bruno Burger, Fraunhofer ISE; Data: EEX Transparency Platform and German Federal Statistical Office
Hyd Bio Uran BC HC Gas PSt Wind Solar min. power (GW) 0.9 9.1 8.8 2.3 1.3 0 0.1 0 max. power (GW) 2.5 12 19.8 23.9 10.1 4.6 21.5 18.7 weekly energy (TWh) 1.3 4.2 8.9 13.0 9.9 3.0 0.6 3.8 2.0
Actual production
Legend: Uranium Brown Coal Hard Coal GasHydro Wind SolarPumped StorageBiomass
MW
Th02
We01
Th09
Th16
Th23
Fr03
Fr10
Fr17
Fr24
Sa04
Sa11
Sa18
Sa25
Su05
Su12
Su19
Su26
Mo06
Mo13
Mo20
Mo27
Tu07
Tu14
Tu21
Tu28
We08
We15
We22
We29
Th30
Fr31
60,000
70,000
50,000
40,000
30,000
20,000
10,000
October 2014

© Fraunhofer ISE
99
Detailed Electricity Production November 2014
Graph: Bruno Burger, Fraunhofer ISE; Data: EEX Transparency Platform and German Federal Statistical Office
Hyd Bio Uran BC HC Gas PSt Wind Solar min. power (GW) 0.5 9.0 13.0 2.8 2.9 0 0.1 0 max. power (GW) 3.2 12.5 19.8 24.9 12.7 5.0 19.8 14.0 weekly energy (TWh) 1.6 4.3 8.6 13.0 10.9 3.9 0.7 4.0 1.0
Actual production
60,000
70,000
MW
50,000
40,000
30,000
20,000
10,000
So02
Sa01
So09
So16
So23
Mo03
Mo10
Mo17
Mo24
Tu04
Tu11
Tu18
Tu25
We05
We12
We19
We26
Th06
Th13
Th20
Th27
Fr07
Fr14
Fr21
Fr28
Sa08
Sa15
Sa22
So30
Sa29
Legend: Uranium Brown Coal Hard Coal GasHydro Wind SolarPumped StorageBiomass
November 2014

© Fraunhofer ISE
100
AGENDA
Annual energies
Monthly energies
Weekly energies
Daily energies
Annual power curves
Monthly power curves
Monthly power curves for conventional, wind and solar
Monthly power curves with export and import
Detailed monthly power curves
Diurnal power courses
Weekly power curves

© Fraunhofer ISE
101
Diurnal courses
Graph: Bruno Burger, Fraunhofer ISE; Data: EEX Transparency Platform /
10,000
10,000
15,000
15,000
20,000
5,000
5,000
MW
January February March April May June July August Sept. October Nov. Dec.
Legend: Wind Solar
Diurnal courses
dislpayed year: 2014

© Fraunhofer ISE
102
Diurnal courses
Graph: Bruno Burger, Fraunhofer ISE; Data: EEX Transparency Platform /
Diurnal courses
year 2014
January February March April May June July August Sept. October Nov. Dec.
Legend: Conventional > 100 MW Wind Solar
MW
60,000
70,000
50,000
40,000
30,000
20,000
10,000

© Fraunhofer ISE
103
Diurnal courses with Export and Import
Graph: Bruno Burger, Fraunhofer ISE; Data: EEX Transparency Platform /
Diurnal courses
January February March April May June July August Sept. October Nov. Dec.
year 2014MW
-10,000
-20,000
60,000
70,000
50,000
40,000
30,000
20,000
10,000
Legend: WindImport SolarExport Conventional > 100 MW

© Fraunhofer ISE
104
Detailed diurnal courses
10,000
5,000
15,00020,000
5,000
10,000
15,00020,000
10,000
10,000
5,000
5,000
5,000
5,000
MW
Diurnal courses
Dec.January February March April May June July August Sept. October Nov.
Legend: Uranium Brown Coal Hard Coal GasHydro Wind SolarPumped StorageBiomass
year 2014
© Fraunhofer ISE
105
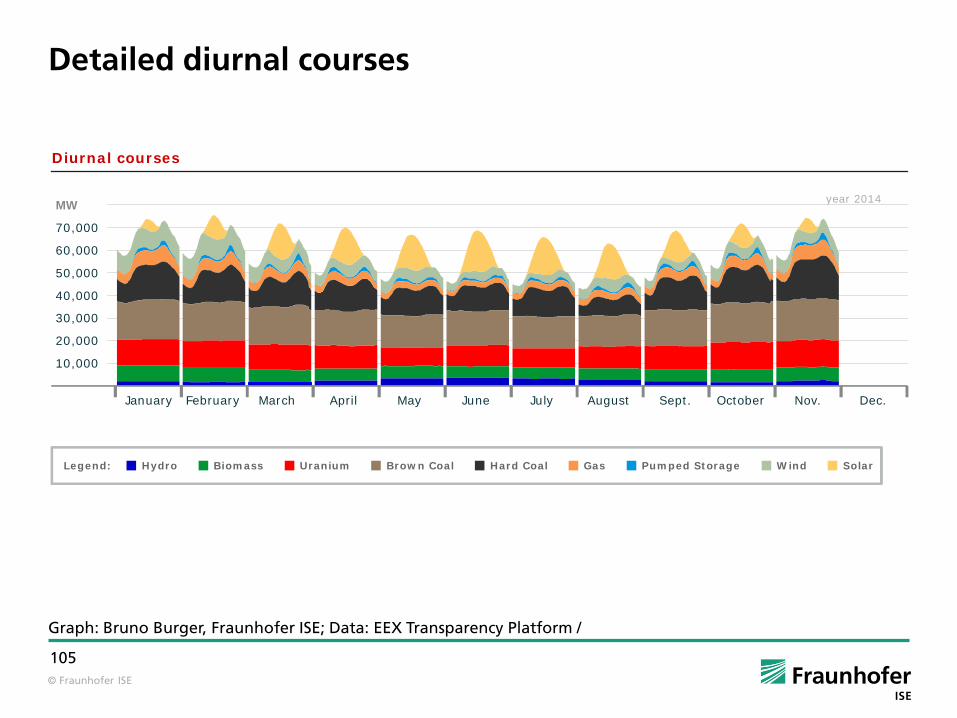
Detailed diurnal courses
Graph: Bruno Burger, Fraunhofer ISE; Data: EEX Transparency Platform /
Diurnal courses
year 2014
January February March April May June July August Sept. October Nov. Dec.
Legend: Uranium Brown Coal Hard Coal GasHydro Wind SolarPumped StorageBiomass
MW
60,000
70,000
50,000
40,000
30,000
20,000
10,000

© Fraunhofer ISE
106
AGENDA
Annual energies
Monthly energies
Weekly energies
Daily energies
Annual power curves
Monthly power curves
Weekly power curves
Weekly power curves for conventional, wind and solar
Weekly power curves with export and import
Detailed weekly power curves
Exemplary daily power curves

© Fraunhofer ISE
107
Electricity Production in Germany: Calendar Week 1
Graph: Bruno Burger, Fraunhofer ISE; Data: EEX Transparency Platform
max. power date max. power weekly energy
Solar 10.6 GW 30.12., 12:30 (+1:00) 0.2 TWh
Wind 19.0 GW 03.01., 23:00 (+1:00) 1.7 TWh
Conventional > 100 MW 45.2 GW 02.01., 17:00 (+1:00) 6.0 TWh
Mo30.12.
Tu31.12.
We01.01.
Th02.01.
Fr03.01.
Sa04.01.
Su05.01.
displayed week: CW 1; 2014
Actual production
60,000
70,000
MW
50,000
40,000
30,000
20,000
10,000

© Fraunhofer ISE
108
Electricity Production in Germany: Calendar Week 2
Graph: Bruno Burger, Fraunhofer ISE; Data: EEX Transparency Platform
max. power date max. power weekly energy
Solar 10.1 GW 07.01., 12:30 (+1:00) 0.23 TWh
Wind 25.0 GW 09.01., 18:30 (+1:00) 2.4 TWh
Conventional > 100 MW 54.6 GW 08.01., 17:00 (+1:00) 6.9 TWh
Mo06.01.
Tu07.01.
We08.01.
Th09.01.
Fr10.01.
Sa11.01.
Su12.01.
displayed week: CW 2; 2014
Actual production
MW
60,000
70,000
50,000
40,000
30,000
20,000
10,000

© Fraunhofer ISE
109
Electricity Production in Germany: Calendar Week 3
Graph: Bruno Burger, Fraunhofer ISE; Data: EEX Transparency Platform
max. power date max. power weekly energy
Solar 7.7 GW 18.01., 12:30 (+1:00) 0.16 TWh
Wind 16.2 GW 10.01., 09:00 (+1:00) 1.0 TWh
Conventional > 100 MW 61.2 GW 14.01., 18:00 (+1:00) 8.2 TWh
Mo13.01.
Tu14.01.
We15.01.
Th16.01.
Fr17.01.
Sa18.01.
Su19.01.
displayed week: CW 3; 2014
Actual production
MW
60,000
70,000
50,000
40,000
30,000
20,000
10,000

© Fraunhofer ISE
110
Electricity Production in Germany: Calendar Week 4
Graph: Bruno Burger, Fraunhofer ISE; Data: EEX Transparency Platform
max. power date max. power weekly energy
Solar 4.1 GW 25.01., 12:30 (+1:00) 0.08 TWh
Wind 11.8 GW 26.01., 21:45 (+1:00) 0.71 TWh
Conventional > 100 MW 61.3 GW 22.01., 18:00 (+1:00) 8.6 TWh
Mo20.01.
Tu21.01.
We22.01.
Th23.01.
Fr24.01.
Sa25.01.
Su26.01.
displayed week: CW 4; 2014
Actual production
60.000
70.000
MW
50.000
40.000
30.000
20.000
10.000

© Fraunhofer ISE
111
Electricity Production in Germany: Calendar Week 5
Graph: Bruno Burger, Fraunhofer ISE; Data: EEX Transparency Platform
max. power date max. power weekly energy
Solar 8.9 GW 01.02., 12:30 (+1:00) 0.24 TWh
Wind 16.7 GW 01.02., 08:30 (+1:00) 1.23 TWh
Conventional > 100 MW 62.2 GW 31.01., 08:00 (+1:00) 8.5 TWh
Mo27.01.
Tu28.01.
We29.01.
Th30.01.
Fr31.01.
Sa01.02.
Su02.02.
displayed week: CW 5; 2014
Actual production
60.000
70.000
MW
50.000
40.000
30.000
20.000
10.000

© Fraunhofer ISE
112
Electricity Production in Germany: Calendar Week 6
Graph: Bruno Burger, Fraunhofer ISE; Data: EEX Transparency Platform
max. power date max. power weekly energy
Solar 13.2 GW 06.02., 13:00 (+1:00) 0.32 TWh
Wind 25.6 GW 07.02., 16:00 (+1:00) 2.0 TWh
Conventional > 100 MW 59.7 GW 03.02., 09:00 (+1:00) 7.5 TWh
Mo03.02.
Tu04.02.
We05.02.
Th06.02.
Fr07.02.
Sa08.02.
Su09.02.
displayed week: CW 6; 2014
Actual production
60.000
70.000
MW
50.000
40.000
30.000
20.000
10.000

© Fraunhofer ISE
113
Electricity Production in Germany: Calendar Week 7
Graph: Bruno Burger, Fraunhofer ISE; Data: EEX Transparency Platform
max. power date max. power weekly energy
Solar 14.1 GW 14.02., 11:30 (+1:00) 0.35 TWh
Wind 22.4 GW 16.02., 10:00 (+1:00) 2.1 TWh
Conventional > 100 MW 58.3 GW 13.02., 18:00 (+1:00) 7.3 TWh
Mo10.02.
Tu11.02.
We12.02.
Th13.02.
Fr14.02.
Sa15.02.
Su16.02.
displayed week: CW 7; 2014
Actual production
60.000
70.000
MW
50.000
40.000
30.000
20.000
10.000

© Fraunhofer ISE
114
Electricity Production in Germany: Calendar Week 8
Graph: Bruno Burger, Fraunhofer ISE; Data: EEX Transparency Platform
max. power date max. power weekly energy
Solar 16.5 GW 23.02., 12:30 (+1:00) 0.45 TWh
Wind 12.7 GW 20.02., 21:45 (+1:00) 1.1 TWh
Conventional > 100 MW 60.4 GW 17.02., 18:00 (+1:00) 8.0 TWh
Mo17.02.
Tu18.02.
We19.02.
Th20.02.
Fr21.02.
Sa22.02.
Su23.02.
displayed week: CW 8; 2014
Actual production
60.000
70.000
MW
50.000
40.000
30.000
20.000
10.000

© Fraunhofer ISE
115
Electricity Production in Germany: Calendar Week 9
Graph: Bruno Burger, Fraunhofer ISE; Data: EEX Transparency Platform
max. power date max. power weekly energy
Solar 20.4 GW 24.02., 12:00 (+1:00) 0.57 TWh
Wind 12.0 GW 24.02., 19:30 (+1:00) 0-7 TWh
Conventional > 100 MW 58.9 GW 26.02., 18:00 (+1:00) 8.1 TWh
Mo24.02.
Tu25.02.
We26.02.
Th27.02.
Fr28.02.
Sa01.03.
Su02.03.
displayed week: CW 9; 2014
Actual production
60.000
70.000
MW
50.000
40.000
30.000
20.000
10.000

© Fraunhofer ISE
116
Electricity Production in Germany: Calendar Week 10
Graph: Bruno Burger, Fraunhofer ISE; Data: EEX Transparency Platform
max. power date max. power weekly energy
Solar 21.9 GW 09.03., 12:45 (+1:00) 0.72 TWh
Wind 11.6 GW 08.03., 23:15 (+1:00) 0.66 TWh
Conventional > 100 MW 59.5 GW 04.03., 19:00 (+1:00) 7.8 TWh
Mo03.03.
Tu04.03.
We05.03.
Th06.03.
Fr07.03.
Sa08.03.
Su09.03.
displayed week: CW 10; 2014
Actual production
60.000
70.000
MW
50.000
40.000
30.000
20.000
10.000

© Fraunhofer ISE
117
Electricity Production in Germany: Calendar Week 11
Graph: Bruno Burger, Fraunhofer ISE; Data: EEX Transparency Platform
max. power date max. power weekly energy
Solar 22.1 GW 12.03., 12:15 (+1:00) 0.8 TWh
Wind 24.8 GW 16.03., 02:30 (+1:00) 1.44 TWh
Conventional > 100 MW 57.9 GW 12.03., 19:00 (+1:00) 7.2 TWh
Mo10.03.
Tu11.03.
We12.03.
Th13.03.
Fr14.03.
Sa15.03.
Su16.03.
displayed week: CW 11; 2014
Actual production
60.000
70.000
MW
50.000
40.000
30.000
20.000
10.000

© Fraunhofer ISE
118
Electricity Production in Germany: Calendar Week 12
Graph: Bruno Burger, Fraunhofer ISE; Data: EEX Transparency Platform
max. power date max. power weekly energy
Solar 23.0 GW 20.03., 12:15 (+1:00) 0.63 TWh
Wind 20.5 GW 20.03., 21:45 (+1:00) 1.81 TWh
Conventional > 100 MW 52.1 GW 18.03., 19:00 (+1:00) 6.6 TWh
Mo17.03.
Tu18.03.
We19.03.
Th20.03.
Fr21.03.
Sa22.03.
Su23.03.
displayed week: CW 12; 2014
Actual production
60.000
70.000
MW
50.000
40.000
30.000
20.000
10.000

© Fraunhofer ISE
119
Electricity Production in Germany: Calendar Week 13
Graph: Bruno Burger, Fraunhofer ISE; Data: EEX Transparency Platform
max. power date max. power weekly energy
Solar 22.8 GW 29.03., 12:30 (+1:00) 0.92 TWh
Wind 9.6 GW 26.03., 22:00 (+1:00) 0.55 TWh
Conventional > 100 MW 60.3 GW 24.03., 19:00 (+1:00) 7.6 TWh
Mo24.03.
Tu25.03.
We26.03.
Th27.03.
Fr28.03.
Sa29.03.
Su30.03.
displayed week: CW 13; 2014
Actual production
60.000
70.000
MW
50.000
40.000
30.000
20.000
10.000

© Fraunhofer ISE
120
Electricity Production in Germany: Calendar Week 14
Graph: Bruno Burger, Fraunhofer ISE; Data: EEX Transparency Platform
max. power date max. power weekly energy
Solar 21.6 GW 02.04., 13:00 (+2:00) 0.79 TWh
Wind 6.7 GW 03.04., 20:30 (+2:00) 0.41 TWh
Conventional > 100 MW 54.3 GW 01.04., 08:00 (+2:00) 7.5 TWh
Mo31.03.
Tu01.04.
We02.04.
Th03.04.
Fr04.04.
Sa05.04.
Su06.04.
displayed week: CW 14; 2014
Actual production
60.000
70.000
MW
50.000
40.000
30.000
20.000
10.000

© Fraunhofer ISE
121
Electricity Production in Germany: Calendar Week 15
Graph: Bruno Burger, Fraunhofer ISE; Data: EEX Transparency Platform
max. power date max. power weekly energy
Solar 20.2 GW 12.04., 13:15 (+2:00) 0.8 TWh
Wind 20.2 GW 08.04., 16:00 (+2:00) 1.2 TWh
Conventional > 100 MW 52.7 GW 10.04., 08:00 (+2:00) 6.7 TWh
Mo07.04.
Tu08.04.
We09.04.
Th10.04.
Fr11.04.
Sa12.04.
Su13.04.
displayed week: CW 15; 2014
Actual production
60.000
70.000
MW
50.000
40.000
30.000
20.000
10.000

© Fraunhofer ISE
122
Electricity Production in Germany: Calendar Week 16
Graph: Bruno Burger, Fraunhofer ISE; Data: EEX Transparency Platform
max. power date max. power weekly energy
Solar 24.2 GW 17.04., 13:00 (+2:00) 0.91 TWh
Wind 23.9 GW 14.04., 14:45 (+2:00) 1.4 TWh
Conventional > 100 MW 52.7 GW 16.04., 08:00 (+2:00) 6.2 TWh
Mo14.04.
Tu15.04.
We16.04.
Th17.04.
Fr18.04.
Good Friday
Sa19.04.
Su20.04.
Easter Sunday
displayed week: CW 16; 2014
Actual production
60.000
70.000
MW
50.000
40.000
30.000
20.000
10.000

© Fraunhofer ISE
123
Electricity Production in Germany: Calendar Week 17
Graph: Bruno Burger, Fraunhofer ISE; Data: EEX Transparency Platform
max. power date max. power weekly energy
Solar 23.2 GW 25.04., 12:45 (+2:00) 0.95 TWh
Wind 7.7 GW 25.04., 22:00 (+2:00) 0.5 TWh
Conventional > 100 MW 52.7 GW 24.04., 08:00 (+2:00) 6.7 TWh
Mo21.04.
Easter Monday
Tu22.04.
We23.04.
Th24.04.
Fr25.04.
Sa26.04.
Su27.04.
displayed week: CW 17; 2014
Actual production
60.000
70.000
MW
50.000
40.000
30.000
20.000
10.000

© Fraunhofer ISE
124
Electricity Production in Germany: Calendar Week 18
Graph: Bruno Burger, Fraunhofer ISE; Data: EEX Transparency Platform
max. power date max. power weekly energy
Solar 17.9 GW 04.05., 14:00 (+2:00) 0.78 TWh
Wind 7.0 GW 02.05., 15:00 (+2:00) 0.37 TWh
Conventional > 100 MW 53.9 GW 30.04., 08:00 (+2:00) 6.6 TWh
Mo28.04.
Tu29.04.
We30.04.
Th01.05.
May Day
Fr02.05.
Sa03.05.
Su04.05.
displayed week: CW 18; 2014
Actual production
60.000
70.000
MW
50.000
40.000
30.000
20.000
10.000

© Fraunhofer ISE
125
Electricity Production in Germany: Calendar Week 19
Graph: Bruno Burger, Fraunhofer ISE; Data: EEX Transparency Platform
max. power date max. power weekly energy
Solar 22.4 GW 05.05., 13:15 (+2:00) 0.87 TWh
Wind 21.7 GW 11.05., 13:00 (+2:00) 1.41 TWh
Conventional > 100 MW 48.4 GW 07.05., 08:00 (+2:00) 6.2 TWh
Mo05.05.
Tu06.05.
We07.05.
Th08.05.
Fr09.05.
Sa10.05.
Su11.05.
displayed week: CW 19; 2014
Actual production
60.000
70.000
MW
50.000
40.000
30.000
20.000
10.000

© Fraunhofer ISE
126
Electricity Production in Germany: Calendar Week 20
Graph: Bruno Burger, Fraunhofer ISE; Data: EEX Transparency Platform
max. power date max. power weekly energy
Solar 19.6 GW 16.05., 12:30 (+2:00) 0.92 TWh
Wind 14.7 GW 12.05., 10:45 (+2:00) 0.84 TWh
Conventional > 100 MW 48.4 GW 13.05., 08:00 (+2:00) 6.4 TWh
Mo12.05.
Tu13.05.
We14.05.
Th15.05.
Fr16.05.
Sa17.05.
Su18.05.
displayed week: CW 20; 2014
Actual production
60.000
70.000
MW
50.000
40.000
30.000
20.000
10.000

© Fraunhofer ISE
127
Electricity Production in Germany: Calendar Week 21
Graph: Bruno Burger, Fraunhofer ISE; Data: EEX Transparency Platform
max. power date max. power weekly energy
Solar 23.5 GW 20.05., 12:45 (+2:00) 1.19 TWh
Wind 11.9 GW 22.05., 01:00 (+2:00) 0.39 TWh
Conventional > 100 MW 45.5 GW 23.05., 08:00 (+2:00) 6.1 TWh
Mo19.05.
Tu20.05.
We21.05.
Th22.05.
Fr23.05.
Sa24.05.
Su25.05.
displayed week: CW 21; 2014
Actual production
60.000
70.000
MW
50.000
40.000
30.000
20.000
10.000

© Fraunhofer ISE
128
Electricity Production in Germany: Calendar Week 22
Graph: Bruno Burger, Fraunhofer ISE; Data: EEX Transparency Platform
max. power date max. power weekly energy
Solar 20.9 GW 31.05., 12:15 (+2:00) 0.83 TWh
Wind 10.5 GW 27.05., 18:45 (+2:00) 0.79 TWh
Conventional > 100 MW 47.5 GW 27.05., 10:00 (+2:00) 5.9 TWh
Mo26.05.
Tu27.05.
We28.05.
Th29.05.
Corpus Christi
Fr30.05.
Sa31.05.
Su01.06.
displayed week: CW 22; 2014
Actual production
60.000
70.000
MW
50.000
40.000
30.000
20.000
10.000

© Fraunhofer ISE
129
Electricity Production in Germany: Calendar Week 23
Graph: Bruno Burger, Fraunhofer ISE; Data: EEX Transparency Platform
max. power date max. power weekly energy
Solar 24.2 GW 06.06., 13:00 (+2:00) 1.26 TWh
Wind 11.8 GW 05.06., 14:15 (+2:00) 0.42 TWh
Conventional > 100 MW 46.0 GW 04.06., 08:00 (+2:00) 6.3 TWh
Mo02.06.
Tu03.06.
We04.06.
Th05.06.
Fr06.06.
Sa07.06.
Su08.06.
Whit Sunday
displayed week: CW 23; 2014
Actual production
60.000
70.000
MW
50.000
40.000
30.000
20.000
10.000

© Fraunhofer ISE
130
Electricity Production in Germany: Calendar Week 24
Graph: Bruno Burger, Fraunhofer ISE; Data: EEX Transparency Platform
max. power date max. power weekly energy
Solar 23.1 GW 09.06., 13:00 (+2:00) 1.2 TWh
Wind 12.0 GW 13.06., 17:30 (+2:00) 0.59 TWh
Conventional > 100 MW 50.3 GW 11.06., 08:00 (+2:00) 6.3 TWh
Mo09.06.
Whit Monday
Tu10.06.
We11.06.
Th12.06.
Fr13.06.
Sa14.06.
Su15.06.
displayed week: CW 24; 2014
Actual production
60.000
70.000
MW
50.000
40.000
30.000
20.000
10.000
© Fraunhofer ISE
131
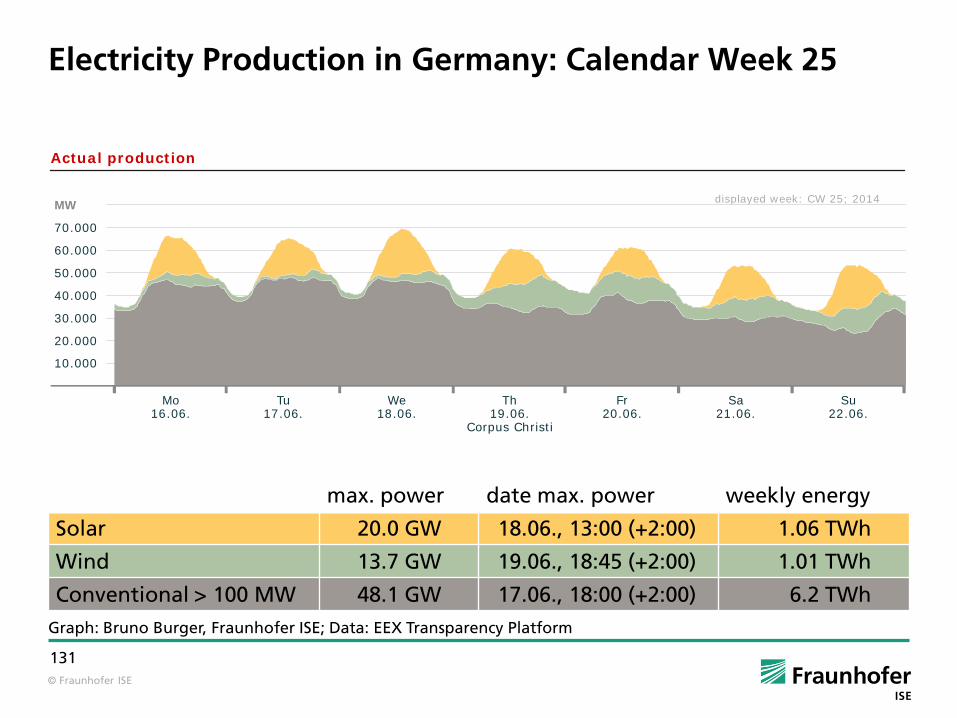
Electricity Production in Germany: Calendar Week 25
Graph: Bruno Burger, Fraunhofer ISE; Data: EEX Transparency Platform
max. power date max. power weekly energy
Solar 20.0 GW 18.06., 13:00 (+2:00) 1.06 TWh
Wind 13.7 GW 19.06., 18:45 (+2:00) 1.01 TWh
Conventional > 100 MW 48.1 GW 17.06., 18:00 (+2:00) 6.2 TWh
Mo16.06.
Tu17.06.
We18.06.
Th19.06.
Corpus Christi
Fr20.06.
Sa21.06.
Su22.06.
displayed week: CW 25; 2014
Actual production
60.000
70.000
MW
50.000
40.000
30.000
20.000
10.000

© Fraunhofer ISE
132
Electricity Production in Germany: Calendar Week 26
Graph: Bruno Burger, Fraunhofer ISE; Data: EEX Transparency Platform
max. power date max. power weekly energy
Solar 22.0 GW 23.06., 13:30 (+2:00) 1.03 TWh
Wind 6.5 GW 23.06., 11:45 (+2:00) 0.37 TWh
Conventional > 100 MW 48.0 GW 27.06., 08:00 (+2:00) 6.9 TWh
Mo23.06.
Tu24.06.
We25.06.
Th26.06.
Fr27.06.
Sa28.06.
Su29.06.
displayed week: CW 26; 2014
Actual production
60.000
70.000
MW
50.000
40.000
30.000
20.000
10.000

© Fraunhofer ISE
133
Electricity Production in Germany: Calendar Week 27
Graph: Bruno Burger, Fraunhofer ISE; Data: EEX Transparency Platform
max. power date max. power weekly energy
Solar 23.0 GW 03.07., 13:30 (+2:00) 1.14 TWh
Wind 8.0 GW 05.07., 16:15 (+2:00) 0.52 TWh
Conventional > 100 MW 47.2 GW 30.06., 08:00 (+2:00) 6.5 TWh
Mo30.06.
Tu01.07.
We02.07.
Th03.07.
Fr04.07.
Sa05.07.
Su06.07.
displayed week: CW 27; 2014
Actual production
60.000
70.000
MW
50.000
40.000
30.000
20.000
10.000

© Fraunhofer ISE
134
Electricity Production in Germany: Calendar Week 28
Graph: Bruno Burger, Fraunhofer ISE; Data: EEX Transparency Platform
max. power date max. power weekly energy
Solar 17.4 GW 11.07., 13:45 (+2:00) 0.77 TWh
Wind 8.1 GW 07.07., 02:15 (+2:00) 0.64 TWh
Conventional > 100 MW 48.6 GW 08.07., 11:00 (+2:00) 6.2 TWh
Mo07.07.
Tu08.07.
We09.07.
Th10.07.
Fr11.07.
Sa12.07.
Su13.07.
displayed week: CW 28; 2014
Actual production
60.000
70.000
MW
50.000
40.000
30.000
20.000
10.000

© Fraunhofer ISE
135
Electricity Production in Germany: Calendar Week 29
Graph: Bruno Burger, Fraunhofer ISE; Data: EEX Transparency Platform
max. power date max. power weekly energy
Solar 23.6 GW 19.07., 13:00 (+2:00) 1.2 TWh
Wind 7.9 GW 19.07., 23:45 (+2:00) 0.44 TWh
Conventional > 100 MW 46.2 GW 16.07., 08:00 (+2:00) 6.1 TWh
Mo14.07.
Tu15.07.
We16.07.
Th17.07.
Fr18.07.
Sa19.07.
Su20.07.
displayed week: CW 29; 2014
Actual production
60.000
70.000
MW
50.000
40.000
30.000
20.000
10.000

© Fraunhofer ISE
136
Electricity Production in Germany: Calendar Week 30
Graph: Bruno Burger, Fraunhofer ISE; Data: EEX Transparency Platform
max. power date max. power weekly energy
Solar 21.3 GW 23.07., 12:45 (+2:00) 0.96 TWh
Wind 9.5 GW 23.07., 19:15 (+2:00) 0.60 TWh
Conventional > 100 MW 46.2 GW 16.07., 08:00 (+2:00) 6.1 TWh
Mo21.07.
Tu22.07.
We23.07.
Th24.07.
Fr25.07.
Sa26.07.
Su27.07.
displayed week: CW 30; 2014
Actual production
60.000
70.000
MW
50.000
40.000
30.000
20.000
10.000

© Fraunhofer ISE
137
Electricity Production in Germany: Calendar Week 31
Graph: Bruno Burger, Fraunhofer ISE; Data: EEX Transparency Platform
max. power date max. power weekly energy
Solar 20.2 GW 01.08., 12:00 (+2:00) 0.93 TWh
Wind 5.2 GW 30.07., 15:45 (+2:00) 0.30 TWh
Conventional > 100 MW 46.0 GW 30.07., 11:00 (+2:00) 5.8 TWh
Mo28.07.
Tu29.07.
We30.07.
Th31.07.
Fr01.08.
Sa02.08.
Su03.08.
Actual production
60.000
70.000
MW
50.000
40.000
30.000
20.000
10.000
displayed week: CW 31; 2014

© Fraunhofer ISE
138
Electricity Production in Germany: Calendar Week 32
Graph: Bruno Burger, Fraunhofer ISE; Data: EEX Transparency Platform
max. power date max. power weekly energy
Solar 21.1 GW 08.08., 12:45 (+2:00) 0.98 TWh
Wind 16.8 GW 09.08., 12:30 (+2:00) 0.51 TWh
Conventional > 100 MW 42.3 GW 07.08., 08:00 (+2:00) 5.6 TWh
Mo04.08.
Tu05.08.
We06.08.
Th07.08.
Fr08.08.
Sa09.08.
Su10.08.
Actual production
60.000
70.000
MW
50.000
40.000
30.000
20.000
10.000
displayed week: CW 32; 2014

© Fraunhofer ISE
139
Electricity Production in Germany: Calendar Week 33
Graph: Bruno Burger, Fraunhofer ISE; Data: EEX Transparency Platform
max. power date max. power weekly energy
Solar 17.8 GW 12.08., 13:45 (+2:00) 0.83 TWh
Wind 18.8 GW 17.08., 14:30 (+2:00) 1.13 TWh
Conventional > 100 MW 41.6 GW 13.08., 09:00 (+2:00) 5.1 TWh
Mo11.08.
Tu12.08.
We13.08.
Th14.08.
Fr15.08.
Sa16.08.
Su17.08.
Actual production
60.000
70.000
MW
50.000
40.000
30.000
20.000
10.000
displayed week: CW 33; 2014

© Fraunhofer ISE
140
Electricity Production in Germany: Calendar Week 34
Graph: Bruno Burger, Fraunhofer ISE; Data: EEX Transparency Platform
max. power date max. power weekly energy
Solar 19.1 GW 21.08., 12:00 (+2:00) 0.89 TWh
Wind 20.0 GW 18.08., 13:15 (+2:00) 1.18 TWh
Conventional > 100 MW 42.7 GW 21.08., 20:00 (+2:00) 5.6 TWh
Mo18.08.
Tu19.08.
We20.08.
Th21.08.
Fr22.08.
Sa23.08.
Su24.08.
Actual production
60.000
70.000
MW
50.000
40.000
30.000
20.000
10.000
displayed week: CW 34; 2014

© Fraunhofer ISE
141
Electricity Production in Germany: Calendar Week 35
Graph: Bruno Burger, Fraunhofer ISE; Data: EEX Transparency Platform
max. power date max. power weekly energy
Solar 22.0 GW 28.08., 12:30 (+2:00) 0.76 TWh
Wind 5.9 GW 30.08., 13:30 (+2:00) 0.36 TWh
Conventional > 100 MW 51.5 GW 26.08., 09:00 (+2:00) 7.0 TWh
Mo25.08.
Tu26.08.
We27.08.
Th28.08.
Fr29.08.
Sa30.08.
Su31.08.
Actual production
60.000
70.000
MW
50.000
40.000
30.000
20.000
10.000
displayed week: CW 35; 2014

© Fraunhofer ISE
142
Electricity Production in Germany: Calendar Week 36
Graph: Bruno Burger, Fraunhofer ISE; Data: EEX Transparency Platform
max. power date max. power weekly energy
Solar 18.4 GW 06.09., 12:30 (+2:00) 0.75 TWh
Wind 7.3 GW 03.09., 23:00 (+2:00) 0.38 TWh
Conventional > 100 MW 53.2 GW 04.09., 09:00 (+2:00) 7.3 TWh
Mo01.09.
Tu02.09.
We03.09.
Th04.09.
Fr05.09.
Sa06.09.
Su07.09.
Actual production
60.000
70.000
MW
50.000
40.000
30.000
20.000
10.000
displayed week: CW 36; 2014

© Fraunhofer ISE
143
Electricity Production in Germany: Calendar Week 37
Graph: Bruno Burger, Fraunhofer ISE; Data: EEX Transparency Platform
max. power date max. power weekly energy
Solar 17.4 GW 08.09., 12:45 (+2:00) 0.58 TWh
Wind 10.5 GW 12.09., 15:00 (+2:00) 0.59 TWh
Conventional > 100 MW 53.8 GW 11.09., 08:00 (+2:00) 7.2 TWh
Mo08.09.
Tu09.09.
We10.09.
Th11.09.
Fr12.09.
Sa13.09.
Su14.09.
Actual production
60.000
70.000
MW
50.000
40.000
30.000
20.000
10.000
displayed week: CW 37; 2014

© Fraunhofer ISE
144
Electricity Production in Germany: Calendar Week 38
Graph: Bruno Burger, Fraunhofer ISE; Data: EEX Transparency Platform
max. power date max. power weekly energy
Solar 20.8 GW 17.09., 13:30 (+2:00) 0.73 TWh
Wind 10.7 GW 21.09., 23:45 (+2:00) 0.53 TWh
Conventional > 100 MW 53.7 GW 15.09., 09:00 (+2:00) 7.2 TWh
Mo15.09.
Tu16.09.
We17.09.
Th18.09.
Fr19.09.
Sa20.09.
Su21.09.
Actual production
60.000
70.000
MW
50.000
40.000
30.000
20.000
10.000
displayed week: CW 38; 2014

© Fraunhofer ISE
145
Electricity Production in Germany: Calendar Week 39
Graph: Bruno Burger, Fraunhofer ISE; Data: EEX Transparency Platform
max. power date max. power weekly energy
Solar 18.2 GW 28.09., 12:45 (+2:00) 0.66 TWh
Wind 14.6 GW 22.09., 12:45 (+2:00) 0.89 TWh
Conventional > 100 MW 53.3 GW 23.09., 19:00 (+2:00) 7.2 TWh
Mo22.09.
Tu23.09.
We24.09.
Th25.09.
Fr26.09.
Sa27.09.
Su28.09.
Actual production
60.000
70.000
MW
50.000
40.000
30.000
20.000
10.000
displayed week: CW 39; 2014

© Fraunhofer ISE
146
Electricity Production in Germany: Calendar Week 40
Graph: Bruno Burger, Fraunhofer ISE; Data: EEX Transparency Platform
max. power date max. power weekly energy
Solar 18.7 GW 03.10., 13:30 (+2:00) 0.65 TWh
Wind 9.3 GW 04.10., 21:00 (+2:00) 0.32 TWh
Conventional > 100 MW 57.6 GW 01.10., 19:00 (+2:00) 7.6 TWh
Actual production
60.000
70.000
MW
50.000
40.000
30.000
20.000
10.000
displayed week: CW 40; 2014
Mo29.09.
Tu30.09.
We01.10.
Th02.10.
Fr03.10.
German Unification Day
Sa04.10.
Su05.10.

© Fraunhofer ISE
147
Electricity Production in Germany: Calendar Week 41
Graph: Bruno Burger, Fraunhofer ISE; Data: EEX Transparency Platform
max. power date max. power weekly energy
Solar 13.1 GW 12.10., 13:45 (+2:00) 0.45 TWh
Wind 18.7 GW 07.10., 15:15 (+2:00) 1.08 TWh
Conventional > 100 MW 57.0 GW 10.10., 19:00 (+2:00) 7.6 TWh
Mo06.10.
Tu07.10.
We08.10.
Th09.10.
Fr10.10.
Sa11.10.
Su12.10.
displayed week: CW 41; 2014
Actual production
60.000
70.000
MW
50.000
40.000
30.000
20.000
10.000
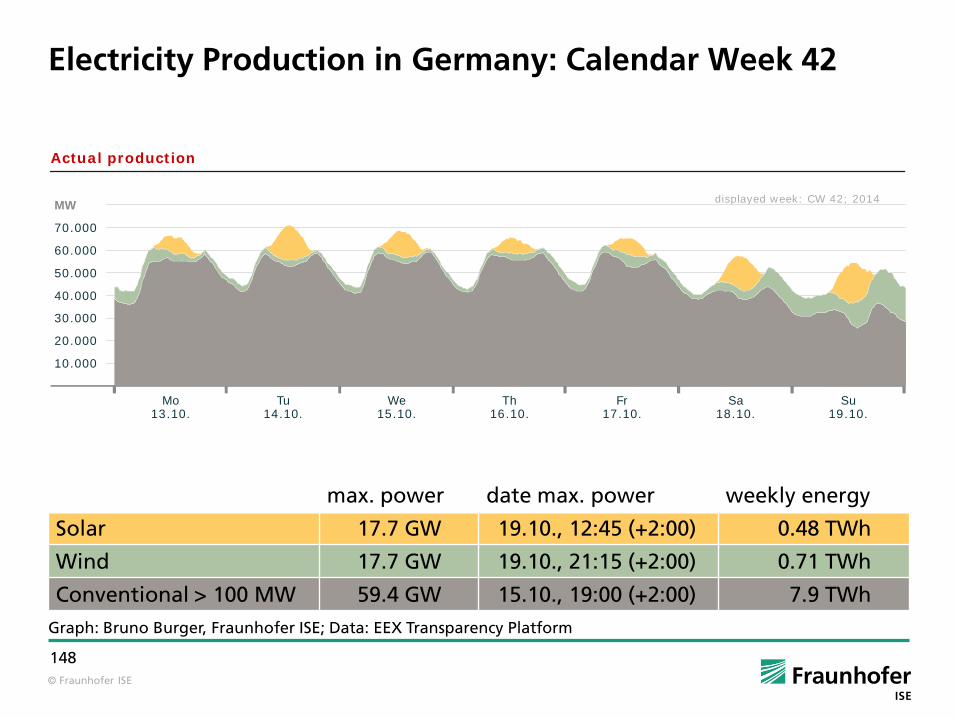
© Fraunhofer ISE
148
Electricity Production in Germany: Calendar Week 42
Graph: Bruno Burger, Fraunhofer ISE; Data: EEX Transparency Platform
max. power date max. power weekly energy
Solar 17.7 GW 19.10., 12:45 (+2:00) 0.48 TWh
Wind 17.7 GW 19.10., 21:15 (+2:00) 0.71 TWh
Conventional > 100 MW 59.4 GW 15.10., 19:00 (+2:00) 7.9 TWh
Mo13.10.
Tu14.10.
We15.10.
Th16.10.
Fr17.10.
Sa18.10.
Su19.10.
displayed week: CW 42; 2014
Actual production
60.000
70.000
MW
50.000
40.000
30.000
20.000
10.000

© Fraunhofer ISE
149
Electricity Production in Germany: Calendar Week 43
Graph: Bruno Burger, Fraunhofer ISE; Data: EEX Transparency Platform
max. power date max. power weekly energy
Solar 11.5 GW 24.10., 12:30 (+2:00) 0.30 TWh
Wind 21.5 GW 22.10., 03:30 (+2:00) 1.35 TWh
Conventional > 100 MW 59.7 GW 23.10., 18:00 (+2:00) 7.35 TWh
Mo20.10.
Tu21.10.
We22.10.
Th23.10.
Fr24.10.
Sa25.10.
Su26.10.
Actual production
displayed week: CW 43; 2014
60.000
70.000
MW
50.000
40.000
30.000
20.000
10.000
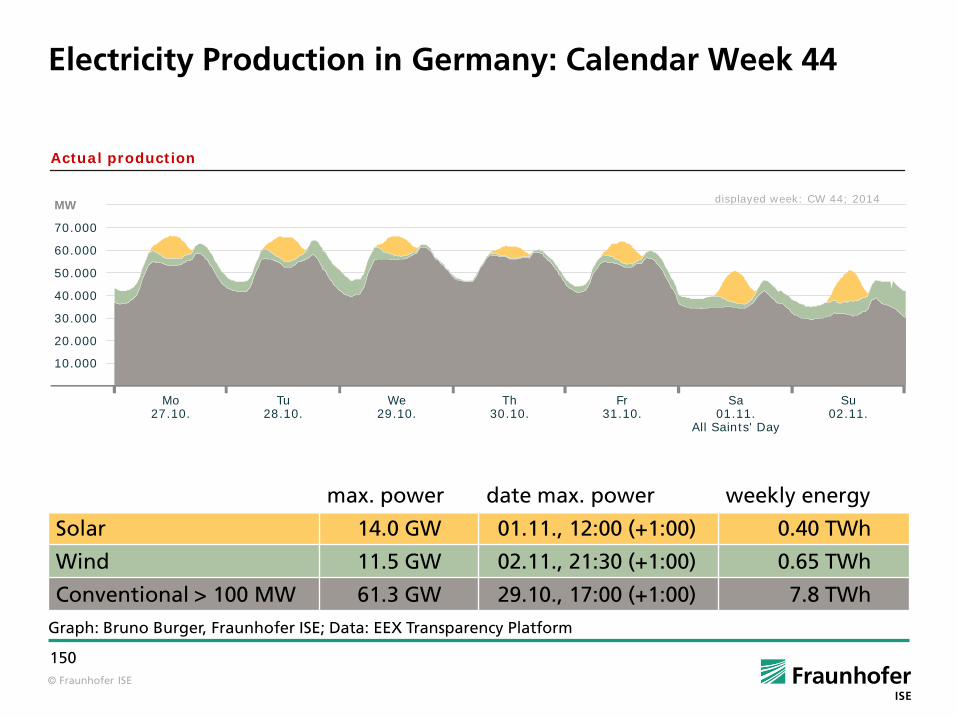
© Fraunhofer ISE
150
Electricity Production in Germany: Calendar Week 44
Graph: Bruno Burger, Fraunhofer ISE; Data: EEX Transparency Platform
max. power date max. power weekly energy
Solar 14.0 GW 01.11., 12:00 (+1:00) 0.40 TWh
Wind 11.5 GW 02.11., 21:30 (+1:00) 0.65 TWh
Conventional > 100 MW 61.3 GW 29.10., 17:00 (+1:00) 7.8 TWh
Mo27.10.
Tu28.10.
We29.10.
Th30.10.
Fr31.10.
Sa01.11.
All Saints' Day
Su02.11.
Actual production
displayed week: CW 44; 2014
60.000
70.000
MW
50.000
40.000
30.000
20.000
10.000

© Fraunhofer ISE
151
Electricity Production in Germany: Calendar Week 45
Graph: Bruno Burger, Fraunhofer ISE; Data: EEX Transparency Platform
max. power date max. power weekly energy
Solar 12.9 GW 08.11., 12:00 (+1:00) 0.30 TWh
Wind 19.8 GW 03.11., 19:00 (+1:00) 1.0 TWh
Conventional > 100 MW 61.4 GW 05.11., 18:00 (+1:00) 7.8 TWh
Mo03.11.
Tu04.11.
We05.11.
Th06.11.
Fr07.11.
Sa08.11.
Su09.11.
Actual production
displayed week: CW 45; 2014
60.000
70.000
MW
50.000
40.000
30.000
20.000
10.000

© Fraunhofer ISE
152
Electricity Production in Germany: Calendar Week 46
Graph: Bruno Burger, Fraunhofer ISE; Data: EEX Transparency Platform
max. power date max. power weekly energy
Solar 7.0 GW 11.11., 11:45 (+1:00) 0.17 TWh
Wind 10.0 GW 14.11., 19:30 (+1:00) 0.78 TWh
Conventional > 100 MW 62.1 GW 12.11., 18:00 (+1:00) 8.3 TWh
Mo10.11.
Tu11.11.
We12.11.
Th13.11.
Fr14.11.
Sa15.11.
Su16.11.
Actual production
displayed week: CW 46; 2014
60.000
70.000
MW
50.000
40.000
30.000
20.000
10.000

© Fraunhofer ISE
153
Electricity Production in Germany: Calendar Week 47
Graph: Bruno Burger, Fraunhofer ISE; Data: EEX Transparency Platform
max. power date max. power weekly energy
Solar 9.1 GW 23.11., 12:15 (+1:00) 0.19 TWh
Wind 12.0 GW 23.11., 19:30 (+1:00) 0.58 TWh
Conventional > 100 MW 62.3 GW 20.11., 17:00 (+1:00) 8.4 TWh
Mo17.11.
Tu18.11.
We19.11.
Th20.11.
Fr21.11.
Sa22.11.
Su23.11.
Actual production
displayed week: CW 47; 2014
60.000
70.000
MW
50.000
40.000
30.000
20.000
10.000

© Fraunhofer ISE
154
Electricity Production in Germany: Calendar Week 48
Graph: Bruno Burger, Fraunhofer ISE; Data: EEX Transparency Platform
max. power date max. power weekly energy
Solar 6.2 GW 25.11., 12:00 (+1:00) 0.15 TWh
Wind 15.3 GW 28.11., 09:15 (+1:00) 1.36 TWh
Conventional > 100 MW 59.8 GW 26.11., 17:00 (+1:00) 8.15 TWh
Mo24.11.
Tu25.11.
We26.11.
Th27.11.
Fr28.11.
Sa29.11.
Su30.11.
Actual production
displayed week: CW 48; 2014
60.000
70.000
MW
50.000
40.000
30.000
20.000
10.000

© Fraunhofer ISE
155
Electricity Production in Germany: Calendar Week 49
Graph: Bruno Burger, Fraunhofer ISE; Data: EEX Transparency Platform
max. power date max. power weekly energy
Solar 3.1 GW 07.12., 11:45 (+1:00) 0.06 TWh
Wind 15.4 GW 07.12., 19:45 (+1:00) 0.73 TWh
Conventional > 100 MW 63.3 GW 03.12., 17:00 (+1:00) 8.78 TWh
Mo01.12.
Tu02.12.
We03.12.
Th04.12.
Fr05.12.
Sa06.12.
Su07.12.
Actual production
displayed week: CW 49; 2014
60.000
70.000
MW
50.000
40.000
30.000
20.000
10.000

© Fraunhofer ISE
156
Electricity Production in Germany: Calendar Week 50
Graph: Bruno Burger, Fraunhofer ISE; Data: EEX Transparency Platform
max. power date max. power weekly energy
Solar 5.8 GW 08.12., 12:15 (+1:00) 0.12 TWh
Wind 29.7 GW 12.12., 13:30 (+1:00) 2.18 TWh
Conventional > 100 MW 60.7 GW 09.12., 09:00 (+1:00) 7.67 TWh
Mo08.12.
Tu09.12.
We10.12.
Th11.12.
Fr12.12.
Sa13.12.
Su14.12.
Actual production
displayed week: CW 50; 2014
60.000
70.000
MW
50.000
40.000
30.000
20.000
10.000

© Fraunhofer ISE
157
Electricity Production in Germany: Calendar Week 51
Graph: Bruno Burger, Fraunhofer ISE; Data: EEX Transparency Platform
max. power date max. power weekly energy
Solar 4.6 GW 21.12., 12:15 (+1:00) 0.09 TWh
Wind 27.7 GW 20.12., 13:00 (+1:00) 2.82 TWh
Conventional > 100 MW 58.2 GW 16.12., 08:00 (+1:00) 6.92 TWh
Mo15.12.
Tu16.12.
We17.12.
Th18.12.
Fr19.12.
Sa20.12.
Su21.12.
Actual production
displayed week: CW 51; 2014
60.000
70.000
MW
50.000
40.000
30.000
20.000
10.000

© Fraunhofer ISE
158
Electricity Production in Germany: Calendar Week 52
Graph: Bruno Burger, Fraunhofer ISE; Data: EEX Transparency Platform
max. power date max. power weekly energy
Solar 4.6 GW 23.12., 12:15 (+1:00) 0.11 TWh
Wind 28.9 GW 22.12., 12:45 (+1:00) 2.68 TWh
Conventional > 100 MW 44.3 GW 28.12., 18:00 (+1:00) 5.36 TWh
Mo22.12.
Tu23.12.
We24.12.
Christmas Eve
Th25.12.
Christmas Day
Fr26.12.
Boxing Day
Sa27.12.
Su28.12.
Actual production
displayed week: CW 52; 2014
60.000
70.000
MW
50.000
40.000
30.000
20.000
10.000

© Fraunhofer ISE
159
AGENDA
Annual energies
Monthly energies
Weekly energies
Daily energies
Annual power curves
Monthly power curves
Weekly power curves
Weekly power curves for conventional, wind and solar
Weekly power curves with export and import
Detailed weekly power curves
Exemplary daily power curves

© Fraunhofer ISE
160
Electricity Production in Germany: Calendar Week 1
Graph: Bruno Burger, Fraunhofer ISE; Data: EEX Transparency Platform
displayed week: CW 1; 2014
Actual production
Legend: WindImport SolarExport Conventional > 100 MW
Mo31.12.
Tu01.01.
We02.01.
Th03.01.
Fr04.01.
Sa05.01.
Su06.01.
MW
-10,000
-20,000
60,000
70,000
50,000
40,000
30,000
20,000
10,000

© Fraunhofer ISE
161
Electricity Production in Germany: Calendar Week 2
Graph: Bruno Burger, Fraunhofer ISE; Data: EEX Transparency Platform
displayed week: CW 2; 2014
Actual production
Mo07.01.
Tu08.01.
We09.01.
Th10.01.
Fr11.01.
Sa12.01.
Su13.01.
Legend: WindImport SolarExport Conventional > 100 MW
MW
-10,000
-20,000
60,000
70,000
50,000
40,000
30,000
20,000
10,000

© Fraunhofer ISE
162
Electricity Production in Germany: Calendar Week 3
Graph: Bruno Burger, Fraunhofer ISE; Data: EEX Transparency Platform
displayed week: CW 3; 2014
Actual production
Legend: WindImport SolarExport Conventional > 100 MW
MW
-10,000
-20,000
60,000
70,000
50,000
40,000
30,000
20,000
10,000
Mo13.01.
Tu14.01.
We15.01.
Th16.01.
Fr17.01.
Sa18.01.
Su19.01.

© Fraunhofer ISE
163
Electricity Production in Germany: Calendar Week 4
Graph: Bruno Burger, Fraunhofer ISE; Data: EEX Transparency Platform
displayed week: CW 4; 2014
Actual production
Legend: WindImport SolarExport Conventional > 100 MW
MW
-10,000
-20,000
60,000
70,000
50,000
40,000
30,000
20,000
10,000
Mo20.01.
Tu21.01.
We22.01.
Th23.01.
Fr24.01.
Sa25.01.
Su26.01.

© Fraunhofer ISE
164
Electricity Production in Germany: Calendar Week 5
Graph: Bruno Burger, Fraunhofer ISE; Data: EEX Transparency Platform
displayed week: CW 5; 2014
Actual production
Legend: WindImport SolarExport Conventional > 100 MW
MW
-10,000
-20,000
60,000
70,000
50,000
40,000
30,000
20,000
10,000
Mo27.01.
Tu28.01.
We29.01.
Th30.01.
Fr31.01.
Sa01.02.
Su02.02.

© Fraunhofer ISE
165
Electricity Production in Germany: Calendar Week 6
Graph: Bruno Burger, Fraunhofer ISE; Data: EEX Transparency Platform
displayed week: CW 6; 2014
Actual production
Legend: WindImport SolarExport Conventional > 100 MW
MW
-10,000
-20,000
60,000
70,000
50,000
40,000
30,000
20,000
10,000
Mo03.02.
Tu04.02.
We05.02.
Th06.02.
Fr07.02.
Sa08.02.
Su09.02.

© Fraunhofer ISE
166
Electricity Production in Germany: Calendar Week 7
Graph: Bruno Burger, Fraunhofer ISE; Data: EEX Transparency Platform
displayed week: CW 7; 2014
Actual production
Legend: WindImport SolarExport Conventional > 100 MW
MW
-10,000
-20,000
60,000
70,000
50,000
40,000
30,000
20,000
10,000
Mo10.02.
Tu11.02.
We12.02.
Th13.02.
Fr14.02.
Sa15.02.
Su16.02.

© Fraunhofer ISE
167
Electricity Production in Germany: Calendar Week 8
Graph: Bruno Burger, Fraunhofer ISE; Data: EEX Transparency Platform
displayed week: CW 8; 2014
Actual production
Legend: WindImport SolarExport Conventional > 100 MW
MW
-10,000
-20,000
60,000
70,000
50,000
40,000
30,000
20,000
10,000
Mo17.02.
Tu18.02.
We19.02.
Th20.02.
Fr21.02.
Sa22.02.
Su23.02.

© Fraunhofer ISE
168
Electricity Production in Germany: Calendar Week 9
Graph: Bruno Burger, Fraunhofer ISE; Data: EEX Transparency Platform
Mo24.02.
Tu25.02.
We26.02.
Th27.02.
Fr28.02.
Sa01.03.
Su02.03.
displayed week: CW 9; 2014
Actual production
MW
-10,000
-20,000
60,000
70,000
50,000
40,000
30,000
20,000
10,000
Legend: WindImport SolarExport Conventional > 100 MW

© Fraunhofer ISE
169
Electricity Production in Germany: Calendar Week 10
Graph: Bruno Burger, Fraunhofer ISE; Data: EEX Transparency Platform
displayed week: CW 10; 2014
Actual production
MW
-10,000
-20,000
60,000
70,000
50,000
40,000
30,000
20,000
10,000
Legend: WindImport SolarExport Conventional > 100 MW
Mo03.03.
Tu04.03.
We05.03.
Th06.03.
Fr07.03.
Sa08.03.
Su09.03.

© Fraunhofer ISE
170
Electricity Production in Germany: Calendar Week 11
Graph: Bruno Burger, Fraunhofer ISE; Data: EEX Transparency Platform
displayed week: CW 11; 2014
Actual production
MW
-10,000
-20,000
60,000
70,000
50,000
40,000
30,000
20,000
10,000
Legend: WindImport SolarExport Conventional > 100 MW
Mo10.03.
Tu11.03.
We12.03.
Th13.03.
Fr14.03.
Sa15.03.
Su16.03.

© Fraunhofer ISE
171
Electricity Production in Germany: Calendar Week 12
Graph: Bruno Burger, Fraunhofer ISE; Data: EEX Transparency Platform
displayed week: CW 12; 2014
Actual production
MW
-10,000
-20,000
60,000
70,000
50,000
40,000
30,000
20,000
10,000
Legend: WindImport SolarExport Conventional > 100 MW
Mo17.03.
Tu18.03.
We19.03.
Th20.03.
Fr21.03.
Sa22.03.
Su23.03.

© Fraunhofer ISE
172
Electricity Production in Germany: Calendar Week 13
Graph: Bruno Burger, Fraunhofer ISE; Data: EEX Transparency Platform
displayed week: CW 13; 2014
Actual production
MW
-10,000
-20,000
60,000
70,000
50,000
40,000
30,000
20,000
10,000
Legend: WindImport SolarExport Conventional > 100 MW
Mo24.03.
Tu25.03.
We26.03.
Th27.03.
Fr28.03.
Sa29.03.
Su30.03.

© Fraunhofer ISE
173
Electricity Production in Germany: Calendar Week 14
Graph: Bruno Burger, Fraunhofer ISE; Data: EEX Transparency Platform
displayed week: CW 14; 2014
Actual production
MW
-10,000
-20,000
60,000
70,000
50,000
40,000
30,000
20,000
10,000
Legend: WindImport SolarExport Conventional > 100 MW
Mo31.03.
Tu01.04.
We02.04.
Th03.04.
Fr04.04.
Sa05.04.
Su06.04.

© Fraunhofer ISE
174
Electricity Production in Germany: Calendar Week 15
Graph: Bruno Burger, Fraunhofer ISE; Data: EEX Transparency Platform
displayed week: CW 15; 2014
Actual production
MW
-10,000
-20,000
60,000
70,000
50,000
40,000
30,000
20,000
10,000
Legend: WindImport SolarExport Conventional > 100 MW
Mo07.04.
Tu08.04.
We09.04.
Th10.04.
Fr11.04.
Sa12.04.
Su13.04.

© Fraunhofer ISE
175
Electricity Production in Germany: Calendar Week 16
Graph: Bruno Burger, Fraunhofer ISE; Data: EEX Transparency Platform
displayed week: CW 16; 2014
Actual production
MW
-10,000
-20,000
60,000
70,000
50,000
40,000
30,000
20,000
10,000
Legend: WindImport SolarExport Conventional > 100 MW
Mo14.04.
Tu15.04.
We16.04.
Th17.04.
Fr18.04.
Good Friday
Sa19.04.
Su20.04.
Easter Sunday

© Fraunhofer ISE
176
Electricity Production in Germany: Calendar Week 17
Graph: Bruno Burger, Fraunhofer ISE; Data: EEX Transparency Platform
displayed week: CW 17; 2014
Actual production
MW
-10,000
-20,000
60,000
70,000
50,000
40,000
30,000
20,000
10,000
Legend: WindImport SolarExport Conventional > 100 MW
Mo21.04.
Easter Monday
Tu22.04.
We23.04.
Th24.04.
Fr25.04.
Sa26.04.
Su27.04.

© Fraunhofer ISE
177
Electricity Production in Germany: Calendar Week 18
Graph: Bruno Burger, Fraunhofer ISE; Data: EEX Transparency Platform
displayed week: CW 18; 2014
Actual production
MW
-10,000
-20,000
60,000
70,000
50,000
40,000
30,000
20,000
10,000
Legend: WindImport SolarExport Conventional > 100 MW
Mo28.04.
Tu29.04.
We30.04.
Th01.05.
May Day
Fr02.05.
Sa03.05.
Su04.05.

© Fraunhofer ISE
178
Electricity Production in Germany: Calendar Week 19
Graph: Bruno Burger, Fraunhofer ISE; Data: EEX Transparency Platform
displayed week: CW 19; 2014
Actual production
MW
-10,000
-20,000
60,000
70,000
50,000
40,000
30,000
20,000
10,000
Legend: WindImport SolarExport Conventional > 100 MW
Mo05.05.
Tu06.05.
We07.05.
Th08.05.
Fr09.05.
Sa10.05.
Su11.05.

© Fraunhofer ISE
179
Electricity Production in Germany: Calendar Week 20
Graph: Bruno Burger, Fraunhofer ISE; Data: EEX Transparency Platform
displayed week: CW 20; 2014
Actual production
MW
-10,000
-20,000
60,000
70,000
50,000
40,000
30,000
20,000
10,000
Legend: WindImport SolarExport Conventional > 100 MW
Mo12.05.
Tu13.05.
We14.05.
Th15.05.
Fr16.05.
Sa17.05.
Su18.05.

© Fraunhofer ISE
180
Electricity Production in Germany: Calendar Week 21
Graph: Bruno Burger, Fraunhofer ISE; Data: EEX Transparency Platform
displayed week: CW 21; 2014
Actual production
MW
-10,000
-20,000
60,000
70,000
50,000
40,000
30,000
20,000
10,000
Legend: WindImport SolarExport Conventional > 100 MW
Mo19.05.
Tu20.05.
We21.05.
Th22.05.
Fr23.05.
Sa24.05.
Su25.05.

© Fraunhofer ISE
181
Electricity Production in Germany: Calendar Week 22
Graph: Bruno Burger, Fraunhofer ISE; Data: EEX Transparency Platform
displayed week: CW 22; 2014
Actual production
MW
-10,000
-20,000
60,000
70,000
50,000
40,000
30,000
20,000
10,000
Legend: WindImport SolarExport Conventional > 100 MW
Mo26.05.
Tu27.05.
We28.05.
Th29.05.
Corpus Christi
Fr30.05.
Sa31.05.
Su01.06.

© Fraunhofer ISE
182
Electricity Production in Germany: Calendar Week 23
Graph: Bruno Burger, Fraunhofer ISE; Data: EEX Transparency Platform
displayed week: CW 23; 2014
Actual production
MW
-10,000
-20,000
60,000
70,000
50,000
40,000
30,000
20,000
10,000
Legend: WindImport SolarExport Conventional > 100 MW
Mo02.06.
Tu03.06.
We04.06.
Th05.06.
Fr06.06.
Sa07.06.
Su08.06.
Whit Sunday
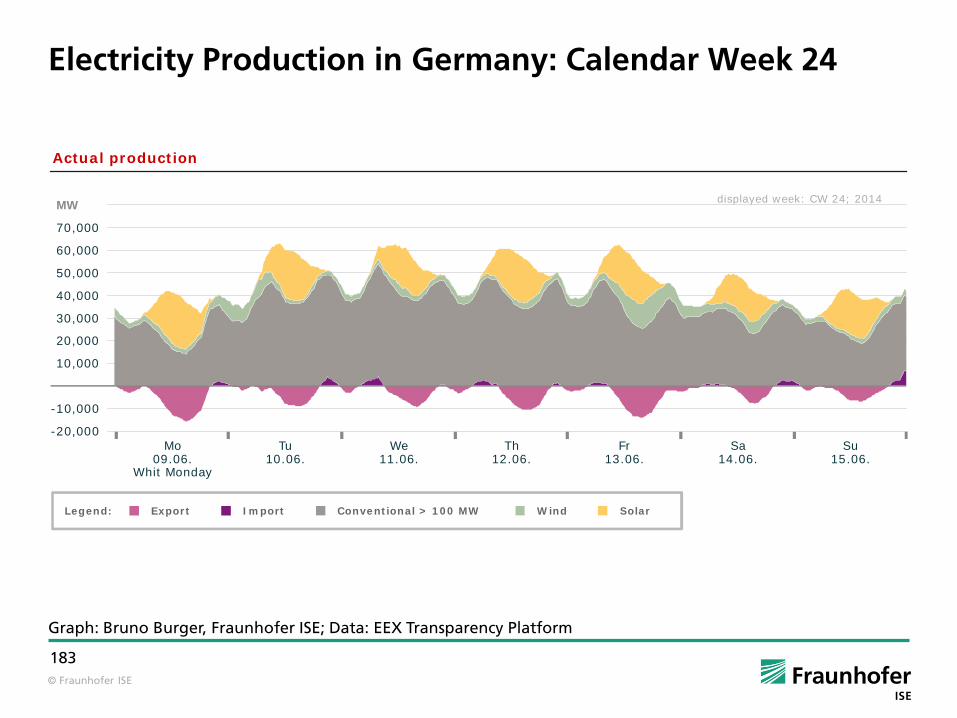
© Fraunhofer ISE
183
Electricity Production in Germany: Calendar Week 24
Graph: Bruno Burger, Fraunhofer ISE; Data: EEX Transparency Platform
displayed week: CW 24; 2014
Actual production
MW
-10,000
-20,000
60,000
70,000
50,000
40,000
30,000
20,000
10,000
Legend: WindImport SolarExport Conventional > 100 MW
Mo09.06.
Whit Monday
Tu10.06.
We11.06.
Th12.06.
Fr13.06.
Sa14.06.
Su15.06.

© Fraunhofer ISE
184
Electricity Production in Germany: Calendar Week 25
Graph: Bruno Burger, Fraunhofer ISE; Data: EEX Transparency Platform
displayed week: CW 25; 2014
Actual production
MW
-10,000
-20,000
60,000
70,000
50,000
40,000
30,000
20,000
10,000
Legend: WindImport SolarExport Conventional > 100 MW
Mo16.06.
Tu17.06.
We18.06.
Th19.06.
Corpus Christi
Fr20.06.
Sa21.06.
Su22.06.

© Fraunhofer ISE
185
Electricity Production in Germany: Calendar Week 26
Graph: Bruno Burger, Fraunhofer ISE; Data: EEX Transparency Platform
displayed week: CW 26; 2014
Actual production
MW
-10,000
-20,000
60,000
70,000
50,000
40,000
30,000
20,000
10,000
Legend: WindImport SolarExport Conventional > 100 MW
Mo23.06.
Tu24.06.
We25.06.
Th26.06.
Fr27.06.
Sa28.06.
Su29.06.

© Fraunhofer ISE
186
Electricity Production in Germany: Calendar Week 27
Graph: Bruno Burger, Fraunhofer ISE; Data: EEX Transparency Platform
displayed week: CW 27; 2014
Actual production
MW
-10,000
-20,000
60,000
70,000
50,000
40,000
30,000
20,000
10,000
Legend: WindImport SolarExport Conventional > 100 MW
Mo30.06.
Tu01.07.
We02.07.
Th03.07.
Fr04.07.
Sa05.07.
Su06.07.

© Fraunhofer ISE
187
Electricity Production in Germany: Calendar Week 28
Graph: Bruno Burger, Fraunhofer ISE; Data: EEX Transparency Platform
displayed week: CW 28; 2014
Actual production
MW
-10,000
-20,000
60,000
70,000
50,000
40,000
30,000
20,000
10,000
Legend: WindImport SolarExport Conventional > 100 MW
Mo07.07.
Tu08.07.
We09.07.
Th10.07.
Fr11.07.
Sa12.07.
Su13.07.

© Fraunhofer ISE
188
Electricity Production in Germany: Calendar Week 29
Graph: Bruno Burger, Fraunhofer ISE; Data: EEX Transparency Platform
displayed week: CW 29; 2014
Actual production
MW
-10,000
-20,000
60,000
70,000
50,000
40,000
30,000
20,000
10,000
Legend: WindImport SolarExport Conventional > 100 MW
Mo14.07.
Tu15.07.
We16.07.
Th17.07.
Fr18.07.
Sa19.07.
Su20.07.

© Fraunhofer ISE
189
Electricity Production in Germany: Calendar Week 30
Graph: Bruno Burger, Fraunhofer ISE; Data: EEX Transparency Platform
displayed week: CW 30; 2014
Actual production
MW
-10,000
-20,000
60,000
70,000
50,000
40,000
30,000
20,000
10,000
Legend: WindImport SolarExport Conventional > 100 MW
Mo21.07.
Tu22.07.
We23.07.
Th24.07.
Fr25.07.
Sa26.07.
Su27.07.

© Fraunhofer ISE
190
Electricity Production in Germany: Calendar Week 31
Graph: Bruno Burger, Fraunhofer ISE; Data: EEX Transparency Platform
displayed week: CW 31; 2014
Actual production
MW
-10,000
-20,000
60,000
70,000
50,000
40,000
30,000
20,000
10,000
Legend: WindImport SolarExport Conventional > 100 MW
Mo28.07.
Tu29.07.
We30.07.
Th31.07.
Fr01.08.
Sa02.08.
Su03.08.

© Fraunhofer ISE
191
Electricity Production in Germany: Calendar Week 32
Graph: Bruno Burger, Fraunhofer ISE; Data: EEX Transparency Platform
displayed week: CW 32; 2014
Actual production
MW
-10,000
-20,000
60,000
70,000
50,000
40,000
30,000
20,000
10,000
Legend: WindImport SolarExport Conventional > 100 MW
Mo04.08.
Tu05.08.
We06.08.
Th07.08.
Fr08.08.
Sa09.08.
Su10.08.

© Fraunhofer ISE
192
Electricity Production in Germany: Calendar Week 33
Graph: Bruno Burger, Fraunhofer ISE; Data: EEX Transparency Platform
displayed week: CW 33; 2014
Actual production
MW
-10,000
-20,000
60,000
70,000
50,000
40,000
30,000
20,000
10,000
Legend: WindImport SolarExport Conventional > 100 MW
Mo11.08.
Tu12.08.
We13.08.
Th14.08.
Fr15.08.
Sa16.08.
Su17.08.

© Fraunhofer ISE
193
Electricity Production in Germany: Calendar Week 34
Graph: Bruno Burger, Fraunhofer ISE; Data: EEX Transparency Platform
displayed week: CW 34; 2014
Actual production
MW
-10,000
-20,000
60,000
70,000
50,000
40,000
30,000
20,000
10,000
Legend: WindImport SolarExport Conventional > 100 MW
Mo18.08.
Tu19.08.
We20.08.
Th21.08.
Fr22.08.
Sa23.08.
Su24.08.

© Fraunhofer ISE
194
Electricity Production in Germany: Calendar Week 35
Graph: Bruno Burger, Fraunhofer ISE; Data: EEX Transparency Platform
displayed week: CW 35; 2014
Actual production
MW
-10,000
-20,000
60,000
70,000
50,000
40,000
30,000
20,000
10,000
Legend: WindImport SolarExport Conventional > 100 MW
Mo25.08.
Tu26.08.
We27.08.
Th28.08.
Fr29.08.
Sa30.08.
Su31.08.

© Fraunhofer ISE
195
Electricity Production in Germany: Calendar Week 36
Graph: Bruno Burger, Fraunhofer ISE; Data: EEX Transparency Platform
displayed week: CW 36; 2014
Actual production
MW
-10,000
-20,000
60,000
70,000
50,000
40,000
30,000
20,000
10,000
Legend: WindImport SolarExport Conventional > 100 MW
Mo01.09.
Tu02.09.
We03.09.
Th04.09.
Fr05.09.
Sa06.09.
Su07.09.

© Fraunhofer ISE
196
Electricity Production in Germany: Calendar Week 37
Graph: Bruno Burger, Fraunhofer ISE; Data: EEX Transparency Platform
displayed week: CW 37; 2014
Actual production
MW
-10,000
-20,000
60,000
70,000
50,000
40,000
30,000
20,000
10,000
Legend: WindImport SolarExport Conventional > 100 MW
Mo08.09.
Tu09.09.
We10.09.
Th11.09.
Fr12.09.
Sa13.09.
Su14.09.

© Fraunhofer ISE
197
Electricity Production in Germany: Calendar Week 38
Graph: Bruno Burger, Fraunhofer ISE; Data: EEX Transparency Platform
displayed week: CW 38; 2014
Actual production
MW
-10,000
-20,000
60,000
70,000
50,000
40,000
30,000
20,000
10,000
Legend: WindImport SolarExport Conventional > 100 MW
Mo15.09.
Tu16.09.
We17.09.
Th18.09.
Fr19.09.
Sa20.09.
Su21.09.

© Fraunhofer ISE
198
Electricity Production in Germany: Calendar Week 39
Graph: Bruno Burger, Fraunhofer ISE; Data: EEX Transparency Platform
displayed week: CW 39; 2014
Actual production
MW
-10,000
-20,000
60,000
70,000
50,000
40,000
30,000
20,000
10,000
Legend: WindImport SolarExport Conventional > 100 MW
Mo22.09.
Tu23.09.
We24.09.
Th25.09.
Fr26.09.
Sa27.09.
Su28.09.

© Fraunhofer ISE
199
Electricity Production in Germany: Calendar Week 40
Graph: Bruno Burger, Fraunhofer ISE; Data: EEX Transparency Platform
displayed week: CW 40; 2014
Actual production
MW
-10,000
-20,000
60,000
70,000
50,000
40,000
30,000
20,000
10,000
Legend: WindImport SolarExport Conventional > 100 MW
Mo29.09.
Tu30.09.
We01.10.
Th02.10.
Fr03.10.
German Unification Day
Sa04.10.
Su05.10.

© Fraunhofer ISE
200
Electricity Production in Germany: Calendar Week 41
Graph: Bruno Burger, Fraunhofer ISE; Data: EEX Transparency Platform
displayed week: CW 41; 2013
Actual production
displayed week: CW 41; 2014
Actual production
MW
-10,000
-20,000
60,000
70,000
50,000
40,000
30,000
20,000
10,000
Legend: WindImport SolarExport Conventional > 100 MW
Mo06.10.
Tu07.10.
We08.10.
Th09.10.
Fr10.10.
Sa11.10.
Su12.10.

© Fraunhofer ISE
201
Electricity Production in Germany: Calendar Week 42
Graph: Bruno Burger, Fraunhofer ISE; Data: EEX Transparency Platform
displayed week: CW 41; 2013
Actual production
displayed week: CW 42; 2014
Actual production
MW
-10,000
-20,000
60,000
70,000
50,000
40,000
30,000
20,000
10,000
Legend: WindImport SolarExport Conventional > 100 MW
Mo13.10.
Tu14.10.
We15.10.
Th16.10.
Fr17.10.
Sa18.10.
Su19.10.

© Fraunhofer ISE
202
Electricity Production in Germany: Calendar Week 43
Graph: Bruno Burger, Fraunhofer ISE; Data: EEX Transparency Platform
displayed week: CW 41; 2013
Actual production
displayed week: CW 43; 2014
Actual production
MW
-10,000
-20,000
60,000
70,000
50,000
40,000
30,000
20,000
10,000
Legend: WindImport SolarExport Conventional > 100 MW
Mo20.10.
Tu21.10.
We22.10.
Th23.10.
Fr24.10.
Sa25.10.
Su26.10.

© Fraunhofer ISE
203
Electricity Production in Germany: Calendar Week 44
Graph: Bruno Burger, Fraunhofer ISE; Data: EEX Transparency Platform
displayed week: CW 41; 2013
Actual production
displayed week: CW 44; 2014
Actual production
MW
-10,000
-20,000
60,000
70,000
50,000
40,000
30,000
20,000
10,000
Legend: WindImport SolarExport Conventional > 100 MW
Mo27.10.
Tu28.10.
We29.10.
Th30.10.
Fr31.10.
Sa01.11.
All Saints' Day
Su02.11.

© Fraunhofer ISE
204
Electricity Production in Germany: Calendar Week 45
Graph: Bruno Burger, Fraunhofer ISE; Data: EEX Transparency Platform
displayed week: CW 41; 2013
Actual production
displayed week: CW 45; 2014
Actual production
MW
-10,000
-20,000
60,000
70,000
50,000
40,000
30,000
20,000
10,000
Legend: WindImport SolarExport Conventional > 100 MW
Mo03.11.
Tu04.11.
We05.11.
Th06.11.
Fr07.11.
Sa08.11.
Su09.11.

© Fraunhofer ISE
205
Electricity Production in Germany: Calendar Week 46
Graph: Bruno Burger, Fraunhofer ISE; Data: EEX Transparency Platform
Mo10.11.
Tu11.11.
We12.11.
Th13.11.
Fr14.11.
Sa15.11.
Su16.11.
displayed week: CW 41; 2013
Actual production
displayed week: CW 46; 2014
Actual production
MW
-10,000
-20,000
60,000
70,000
50,000
40,000
30,000
20,000
10,000

© Fraunhofer ISE
206
Electricity Production in Germany: Calendar Week 47
Graph: Bruno Burger, Fraunhofer ISE; Data: EEX Transparency Platform
Mo17.11.
Tu18.11.
We19.11.
Th20.11.
Fr21.11.
Sa22.11.
Su23.11.
displayed week: CW 41; 2013
Actual production
displayed week: CW 47; 2014
Actual production
MW
-10,000
-20,000
60,000
70,000
50,000
40,000
30,000
20,000
10,000
Legend: WindImport SolarExport Conventional > 100 MW

© Fraunhofer ISE
207
Electricity Production in Germany: Calendar Week 48
Graph: Bruno Burger, Fraunhofer ISE; Data: EEX Transparency Platform
displayed week: CW 41; 2013
Actual production
displayed week: CW 48; 2014
Actual production
MW
-10,000
-20,000
60,000
70,000
50,000
40,000
30,000
20,000
10,000
Legend: WindImport SolarExport Conventional > 100 MW
Mo24.11.
Tu25.11.
We26.11.
Th27.11.
Fr28.11.
Sa29.11.
Su30.11.

© Fraunhofer ISE
208
Electricity Production in Germany: Calendar Week 49
Graph: Bruno Burger, Fraunhofer ISE; Data: EEX Transparency Platform
displayed week: CW 41; 2013
Actual production
displayed week: CW 49; 2014
Actual production
MW
-10,000
-20,000
60,000
70,000
50,000
40,000
30,000
20,000
10,000
Legend: WindImport SolarExport Conventional > 100 MW
Mo01.12.
Tu02.12.
We03.12.
Th04.12.
Fr05.12.
Sa06.12.
Su07.12.

© Fraunhofer ISE
209
Electricity Production in Germany: Calendar Week 50
Graph: Bruno Burger, Fraunhofer ISE; Data: EEX Transparency Platform
displayed week: CW 41; 2013
Actual production
displayed week: CW 50; 2014
Actual production
MW
-10,000
-20,000
60,000
70,000
50,000
40,000
30,000
20,000
10,000
Legend: WindImport SolarExport Conventional > 100 MW
Mo08.12.
Tu09.12.
We10.12.
Th11.12.
Fr12.12.
Sa13.12.
Su14.12.
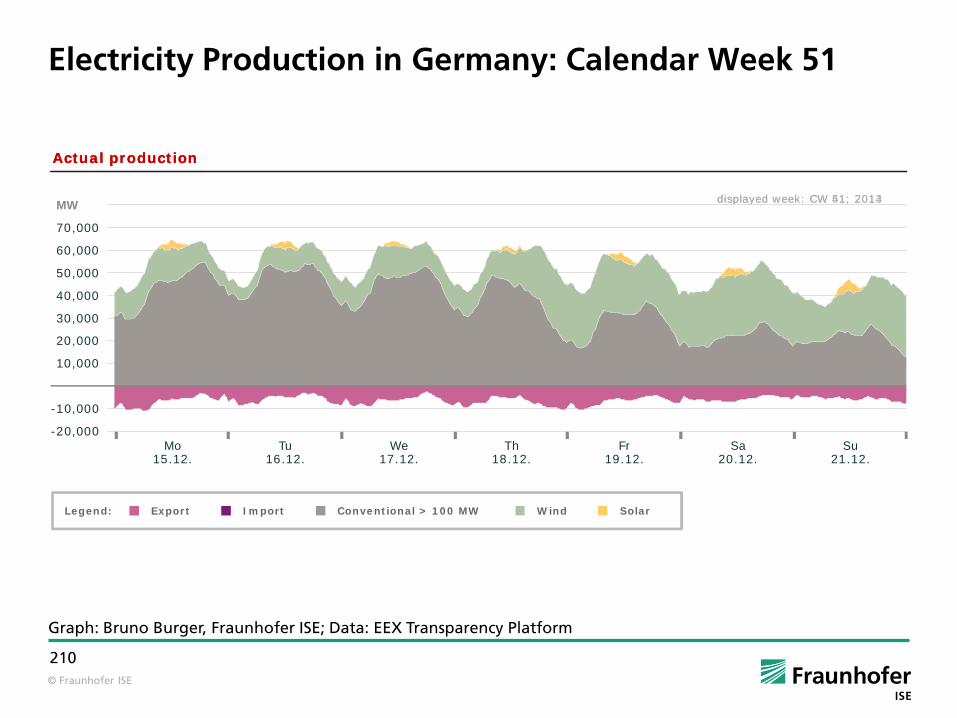
© Fraunhofer ISE
210
Electricity Production in Germany: Calendar Week 51
Graph: Bruno Burger, Fraunhofer ISE; Data: EEX Transparency Platform
displayed week: CW 41; 2013
Actual production
displayed week: CW 51; 2014
Actual production
MW
-10,000
-20,000
60,000
70,000
50,000
40,000
30,000
20,000
10,000
Legend: WindImport SolarExport Conventional > 100 MW
Mo15.12.
Tu16.12.
We17.12.
Th18.12.
Fr19.12.
Sa20.12.
Su21.12.

© Fraunhofer ISE
211
Electricity Production in Germany: Calendar Week 52
Graph: Bruno Burger, Fraunhofer ISE; Data: EEX Transparency Platform
This diagram was not built, since the import/export data of Entso-e and Amprion for the Netherlands is not available.

© Fraunhofer ISE
212
AGENDA
Annual energies
Monthly energies
Weekly energies
Daily energies
Annual power curves
Monthly power curves
Weekly power curves
Weekly power curves for conventional, wind and solar
Weekly power curves with export and import
Detailed weekly power curves
Exemplary daily power curves

© Fraunhofer ISE
213
Electricity Production in Germany: Calendar Week 1
Graph: Bruno Burger, Fraunhofer ISE; Data: EEX Transparency Platform
Hyd Bio Uran BC HC Gas PSt Wind Solar min. power (GW) 1.4 10.2 10.5 3.3 3.1 0 4.1 0 max. power (GW) 1.8 12.1 16.8 12.5 5.1 3.1 19.0 10.6 weekly energy (TWh) 0.3 1.1 2.0 2.5 0.9 0.6 0.1 1.7 0.2
displayed week: CW 1; 2014
Actual production
Legend: Uranium Brown Coal Hard Coal GasHydro Wind SolarPumped StorageBiomass
Mo30.12.
Tu31.12.
We01.01.
Th02.01.
Fr03.01.
Sa04.01.
Su05.01.
60,000
70,000
MW
50,000
40,000
30,000
20,000
10,000

© Fraunhofer ISE
214
Electricity Production in Germany: Calendar Week 2
Graph: Bruno Burger, Fraunhofer ISE; Data: EEX Transparency Platform
Hyd Bio Uran BC HC Gas PSt Wind Solar min. power (GW) 1.6 8.9 10.5 3.5 3.1 0 4.1 0 max. power (GW) 1.9 12.1 18.8 19.1 7.6 3.3 25.0 10.1 weekly energy (TWh) 0.3 1.2 1.8 2.7 1.7 0.8 0.1 2.4 0.2
displayed week: CW 2; 2014
Actual production
Mo06.01.
Tu07.01.
We08.01.
Th09.01.
Fr10.01.
Sa11.01.
Su12.01.
Legend: Uranium Brown Coal Hard Coal GasHydro Wind SolarPumped StorageBiomass
60,000
70,000
MW
50,000
40,000
30,000
20,000
10,000

© Fraunhofer ISE
215
Electricity Production in Germany: Calendar Week 3
Graph: Bruno Burger, Fraunhofer ISE; Data: EEX Transparency Platform
Hyd Bio Uran BC HC Gas PSt Wind Solar min. power (GW) 1.6 9.9 11.7 3.5 3.3 0 0.5 0 max. power (GW) 2.0 10.8 19.4 21.9 10.3 3.2 16.1 7.7 weekly energy (TWh) 0.3 1.2 1.8 3.1 2.6 0.9 0.1 1.0 0.2
displayed week: CW 3; 2014
Actual production
Mo13.01.
Tu14.01.
We15.01.
Th16.01.
Fr17.01.
Sa18.01.
Su19.01.
Legend: Uranium Brown Coal Hard Coal GasHydro Wind SolarPumped StorageBiomass
60,000
70,000
MW
50,000
40,000
30,000
20,000
10,000

© Fraunhofer ISE
216
Electricity Production in Germany: Calendar Week 4
Graph: Bruno Burger, Fraunhofer ISE; Data: EEX Transparency Platform
Hyd Bio Uran BC HC Gas PSt Wind Solar min. power (GW) 1.6 10.6 15.6 5.8 3.6 0 0.5 0 max. power (GW) 2.2 12.1 19.3 22.0 12.9 3.6 11.8 4.1 weekly energy (TWh) 0.3 1.2 2.0 3.1 2.9 1.2 0.2 0.7 0.1
displayed week: CW 4; 2014
Actual production
Mo20.01.
Tu21.01.
We22.01.
Th23.01.
Fr24.01.
Sa25.01.
Su26.01.
Legend: Uranium Brown Coal Hard Coal GasHydro Wind SolarPumped StorageBiomass
60,000
70,000
MW
50,000
40,000
30,000
20,000
10,000

© Fraunhofer ISE
217
Electricity Production in Germany: Calendar Week 5
Graph: Bruno Burger, Fraunhofer ISE; Data: EEX Transparency Platform
Hyd Bio Uran BC HC Gas PSt Wind Solar min. power (GW) 1.3 11.0 14.9 4.7 3.5 0 1.4 0 max. power (GW) 1.8 12.1 19.4 21.7 12.3 3.7 16.7 8.9 weekly energy (TWh) 0.3 1.2 2.0 3.0 2.6 1.1 0.2 1.2 0.2
Mo27.01.
Tu28.01.
We29.01.
Th30.01.
Fr31.01.
Sa01.02.
Su02.02.
displayed week: CW 5; 2014
Actual production
60.000
70.000
MW
50.000
40.000
30.000
20.000
10.000
Legend: Uranium Brown Coal Hard Coal GasHydro Wind SolarPumped StorageBiomass
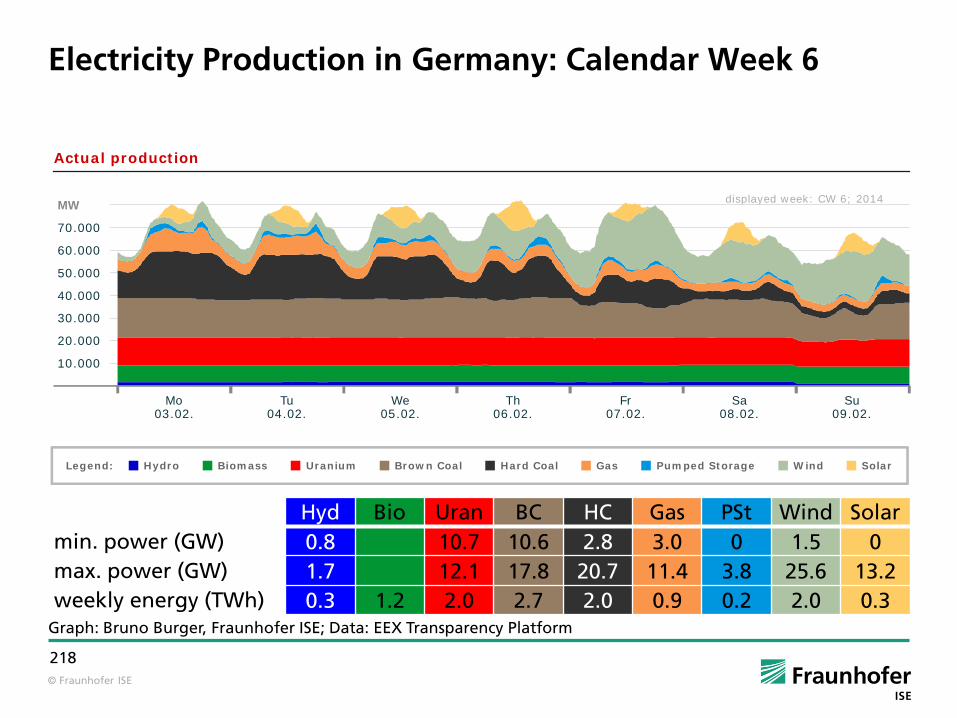
© Fraunhofer ISE
218
Electricity Production in Germany: Calendar Week 6
Graph: Bruno Burger, Fraunhofer ISE; Data: EEX Transparency Platform
Hyd Bio Uran BC HC Gas PSt Wind Solar min. power (GW) 0.8 10.7 10.6 2.8 3.0 0 1.5 0 max. power (GW) 1.7 12.1 17.8 20.7 11.4 3.8 25.6 13.2 weekly energy (TWh) 0.3 1.2 2.0 2.7 2.0 0.9 0.2 2.0 0.3
displayed week: CW 6; 2014
Actual production
60.000
70.000
MW
50.000
40.000
30.000
20.000
10.000
Legend: Uranium Brown Coal Hard Coal GasHydro Wind SolarPumped StorageBiomass
Mo03.02.
Tu04.02.
We05.02.
Th06.02.
Fr07.02.
Sa08.02.
Su09.02.
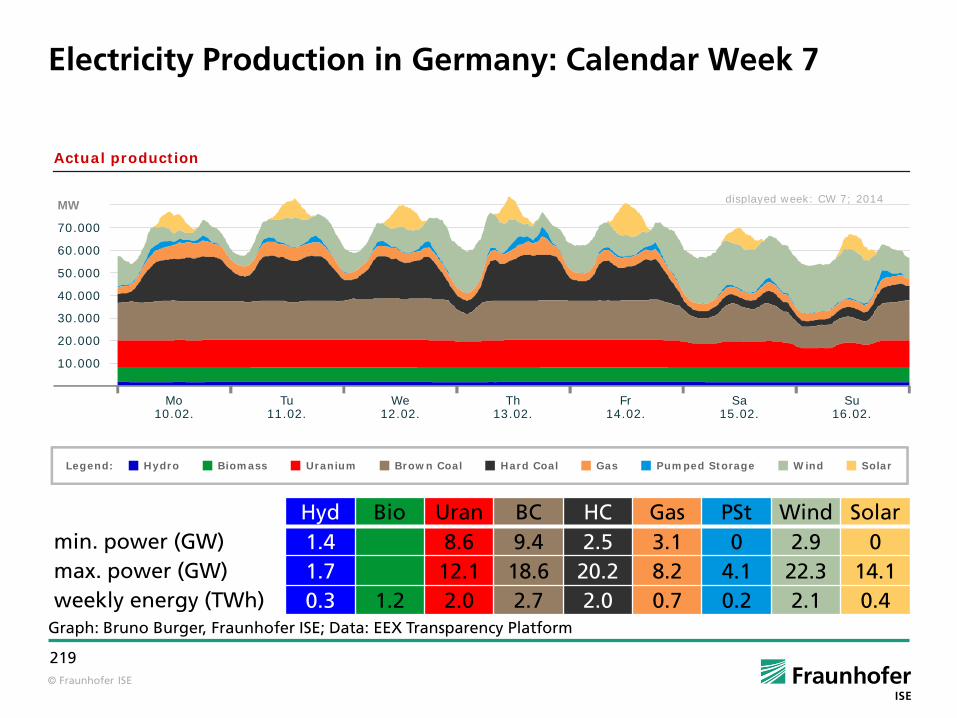
© Fraunhofer ISE
219
Electricity Production in Germany: Calendar Week 7
Graph: Bruno Burger, Fraunhofer ISE; Data: EEX Transparency Platform
Hyd Bio Uran BC HC Gas PSt Wind Solar min. power (GW) 1.4 8.6 9.4 2.5 3.1 0 2.9 0 max. power (GW) 1.7 12.1 18.6 20.2 8.2 4.1 22.3 14.1 weekly energy (TWh) 0.3 1.2 2.0 2.7 2.0 0.7 0.2 2.1 0.4
Actual production
60.000
70.000
MW
50.000
40.000
30.000
20.000
10.000
Legend: Uranium Brown Coal Hard Coal GasHydro Wind SolarPumped StorageBiomass
Mo10.02.
Tu11.02.
We12.02.
Th13.02.
Fr14.02.
Sa15.02.
Su16.02.
displayed week: CW 7; 2014

© Fraunhofer ISE
220
Electricity Production in Germany: Calendar Week 8
Graph: Bruno Burger, Fraunhofer ISE; Data: EEX Transparency Platform
Hyd Bio Uran BC HC Gas PSt Wind Solar min. power (GW) 1.4 9.8 12.0 3.0 3.1 0 1.9 0 max. power (GW) 1.7 12.1 18.9 21.0 8.2 4.3 12.7 16.5 weekly energy (TWh) 0.3 1.1 2.0 2.9 2.2 0.8 0.2 1.1 0.4
Actual production
60.000
70.000
MW
50.000
40.000
30.000
20.000
10.000
Legend: Uranium Brown Coal Hard Coal GasHydro Wind SolarPumped StorageBiomass
displayed week: CW 8; 2014
Mo17.02.
Tu18.02.
We19.02.
Th20.02.
Fr21.02.
Sa22.02.
Su23.02.

© Fraunhofer ISE
221
Electricity Production in Germany: Calendar Week 9
Graph: Bruno Burger, Fraunhofer ISE; Data: EEX Transparency Platform
Hyd Bio Uran BC HC Gas PSt Wind Solar min. power (GW) 0.7 10.5 14.4 3.9 2.8 0 0.5 0 max. power (GW) 1.5 12.1 18.8 20.1 9.1 3.5 12.0 20.4 weekly energy (TWh) 0.2 1.0 2.0 3.0 2.3 0.8 0.1 0.7 0.6
Mo24.02.
Tu25.02.
We26.02.
Th27.02.
Fr28.02.
Sa01.03.
Su02.03.
displayed week: CW 9; 2014
Actual production
60.000
70.000
MW
50.000
40.000
30.000
20.000
10.000
Legend: Uranium Brown Coal Hard Coal GasHydro Wind SolarPumped StorageBiomass

© Fraunhofer ISE
222
Electricity Production in Germany: Calendar Week 10
Graph: Bruno Burger, Fraunhofer ISE; Data: EEX Transparency Platform
Hyd Bio Uran BC HC Gas PSt Wind Solar min. power (GW) 0.9 9.1 10.4 2.1 3.0 0 0.3 0 max. power (GW) 1.6 10.8 19.4 20.9 9.7 3.2 11.6 21.9 weekly energy (TWh) 0.2 1.0 1.8 3.0 2.2 0.8 0.1 0.7 0.7
Mo03.03.
Tu04.03.
We05.03.
Th06.03.
Fr07.03.
Sa08.03.
Su09.03.
displayed week: CW 10; 2014
Actual production
60.000
70.000
MW
50.000
40.000
30.000
20.000
10.000
Legend: Uranium Brown Coal Hard Coal GasHydro Wind SolarPumped StorageBiomass

© Fraunhofer ISE
223
Electricity Production in Germany: Calendar Week 11
Graph: Bruno Burger, Fraunhofer ISE; Data: EEX Transparency Platform
Hyd Bio Uran BC HC Gas PSt Wind Solar min. power (GW) 1.0 8.5 7.7 2.1 3.1 0 0.04 0 max. power (GW) 1.4 11.9 19.1 20.4 8.7 4.0 24.8 22.1 weekly energy (TWh) 0.2 1.0 1.9 2.5 2.1 0.7 0.1 1.4 0.8
Mo10.03.
Tu11.03.
We12.03.
Th13.03.
Fr14.03.
Sa15.03.
Su16.03.
displayed week: CW 11; 2014
Actual production
60.000
70.000
MW
50.000
40.000
30.000
20.000
10.000
Legend: Uranium Brown Coal Hard Coal GasHydro Wind SolarPumped StorageBiomass

© Fraunhofer ISE
224
Electricity Production in Germany: Calendar Week 12
Graph: Bruno Burger, Fraunhofer ISE; Data: EEX Transparency Platform
Hyd Bio Uran BC HC Gas PSt Wind Solar min. power (GW) 1.2 10.5 9.4 3.3 2.8 0 0.5 0 max. power (GW) 1.8 12.0 19.2 15.6 4.3 4.5 20.5 23.0 weekly energy (TWh) 0.2 0.9 2.0 2.7 1.3 0.6 0.1 1.8 0.6
displayed week: CW 12; 2014
Actual production
60.000
70.000
MW
50.000
40.000
30.000
20.000
10.000
Legend: Uranium Brown Coal Hard Coal GasHydro Wind SolarPumped StorageBiomass
Mo17.03.
Tu18.03.
We19.03.
Th20.03.
Fr21.03.
Sa22.03.
Su23.03.
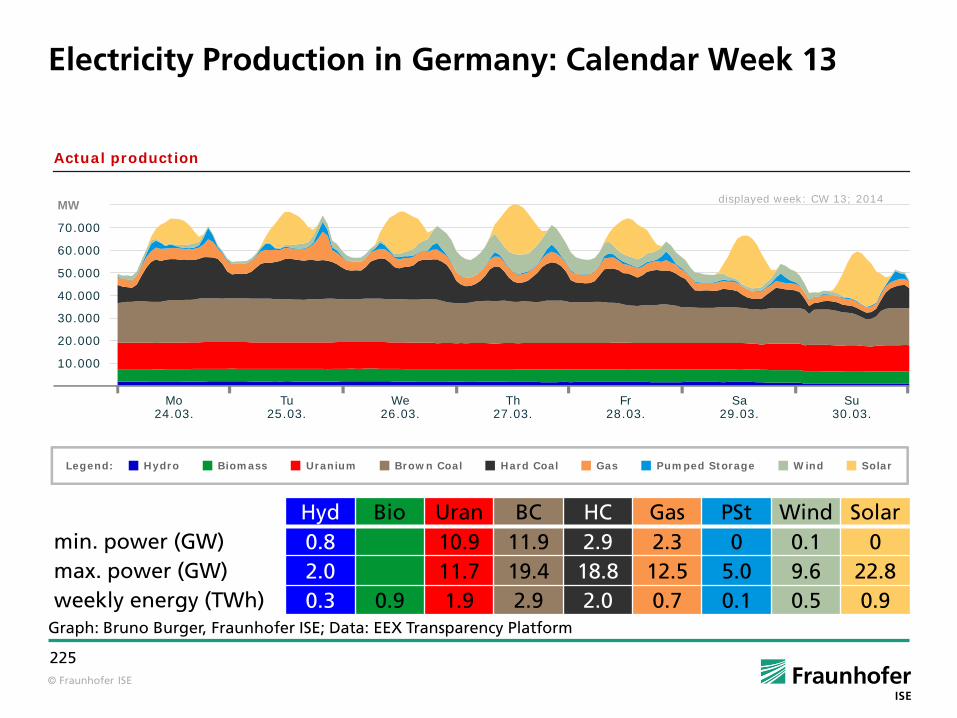
© Fraunhofer ISE
225
Electricity Production in Germany: Calendar Week 13
Graph: Bruno Burger, Fraunhofer ISE; Data: EEX Transparency Platform
Hyd Bio Uran BC HC Gas PSt Wind Solar min. power (GW) 0.8 10.9 11.9 2.9 2.3 0 0.1 0 max. power (GW) 2.0 11.7 19.4 18.8 12.5 5.0 9.6 22.8 weekly energy (TWh) 0.3 0.9 1.9 2.9 2.0 0.7 0.1 0.5 0.9
displayed week: CW 13; 2014
Actual production
60.000
70.000
MW
50.000
40.000
30.000
20.000
10.000
Legend: Uranium Brown Coal Hard Coal GasHydro Wind SolarPumped StorageBiomass
Mo24.03.
Tu25.03.
We26.03.
Th27.03.
Fr28.03.
Sa29.03.
Su30.03.

© Fraunhofer ISE
226
Electricity Production in Germany: Calendar Week 14
Graph: Bruno Burger, Fraunhofer ISE; Data: EEX Transparency Platform
Hyd Bio Uran BC HC Gas PSt Wind Solar min. power (GW) 1.4 9.6 12.4 3.6 2.4 0 0 0 max. power (GW) 1.7 11.7 18.0 18.3 5.7 3.8 6.7 21.6 weekly energy (TWh) 0.3 0.9 1.9 2.7 2.2 0.6 0.2 0.4 0.8
displayed week: CW 14; 2014
Actual production
60.000
70.000
MW
50.000
40.000
30.000
20.000
10.000
Legend: Uranium Brown Coal Hard Coal GasHydro Wind SolarPumped StorageBiomass
Mo31.03.
Tu01.04.
We02.04.
Th03.04.
Fr04.04.
Sa05.04.
Su06.04.

© Fraunhofer ISE
227
Electricity Production in Germany: Calendar Week 15
Graph: Bruno Burger, Fraunhofer ISE; Data: EEX Transparency Platform
Hyd Bio Uran BC HC Gas PSt Wind Solar min. power (GW) 1.0 8.8 10.3 2.2 2.5 0 0.1 0 max. power (GW) 2.5 10.7 16.4 18.5 6.6 3.9 20.2 20.2 weekly energy (TWh) 0.3 0.9 1.7 2.5 1.9 0.6 0.1 1.1 0.8
displayed week: CW 15; 2014
Actual production
60.000
70.000
MW
50.000
40.000
30.000
20.000
10.000
Legend: Uranium Brown Coal Hard Coal GasHydro Wind SolarPumped StorageBiomass
Mo07.04.
Tu08.04.
We09.04.
Th10.04.
Fr11.04.
Sa12.04.
Su13.04.

© Fraunhofer ISE
228
Electricity Production in Germany: Calendar Week 16
Graph: Bruno Burger, Fraunhofer ISE; Data: EEX Transparency Platform
Hyd Bio Uran BC HC Gas PSt Wind Solar min. power (GW) 1.96 7.68 9.21 2.21 2.03 0 0.27 0 max. power (GW) 2.44 10.68 17.53 17.79 3.76 2.99 23.9 24.23 weekly energy (TWh) 0.38 0.89 1.72 2.55 1.32 0.49 0.14 1.42 0.91
displayed week: CW 16; 2014
Actual production
60.000
70.000
MW
50.000
40.000
30.000
20.000
10.000
Legend: Uranium Brown Coal Hard Coal GasHydro Wind SolarPumped StorageBiomass
Mo14.04.
Tu15.04.
We16.04.
Th17.04.
Fr18.04.
Good Friday
Sa19.04.
Su20.04.
Easter Sunday

© Fraunhofer ISE
229
Electricity Production in Germany: Calendar Week 17
Graph: Bruno Burger, Fraunhofer ISE; Data: EEX Transparency Platform
Hyd Bio Uran BC HC Gas PSt Wind Solar min. power (GW) 1.97 8.78 12.54 2.54 2.19 0 0.2 0 max. power (GW) 2.75 10.24 17 19.66 4.2 3.34 7.7 23.2 weekly energy (TWh) 0.39 0.89 1.63 2.61 2.0 0.52 0.12 0.5 0.95
displayed week: CW 17; 2014
Actual production
60.000
70.000
MW
50.000
40.000
30.000
20.000
10.000
Legend: Uranium Brown Coal Hard Coal GasHydro Wind SolarPumped StorageBiomass
Mo21.04.
Easter Monday
Tu22.04.
We23.04.
Th24.04.
Fr25.04.
Sa26.04.
Su27.04.

© Fraunhofer ISE
230
Electricity Production in Germany: Calendar Week 18
Graph: Bruno Burger, Fraunhofer ISE; Data: EEX Transparency Platform
Hyd Bio Uran BC HC Gas PSt Wind Solar min. power (GW) 2.04 7.98 12.94 2.8 2.34 0.01 0.1 0 max. power (GW) 2.6 8.87 17.28 20.84 6.72 3.37 7.04 17.88 weekly energy (TWh) 0.39 0.9 1.46 2.72 1.82 0.57 0.13 0.37 0.78
displayed week: CW 18; 2014
Actual production
60.000
70.000
MW
50.000
40.000
30.000
20.000
10.000
Legend: Uranium Brown Coal Hard Coal GasHydro Wind SolarPumped StorageBiomass
Mo28.04.
Tu29.04.
We30.04.
Th01.05.
May Day
Fr02.05.
Sa03.05.
Su04.05.

© Fraunhofer ISE
231
Electricity Production in Germany: Calendar Week 19
Graph: Bruno Burger, Fraunhofer ISE; Data: EEX Transparency Platform
Hyd Bio Uran BC HC Gas PSt Wind Solar min. power (GW) 2.1 6.69 7.34 2.3 2.26 0.04 0.28 0 max. power (GW) 3.67 8.8 17.33 18.61 4.44 2.75 21.74 22.4 weekly energy (TWh) 0.51 0.9 1.44 2.45 1.84 0.5 0.13 1.41 0.87
displayed week: CW 19; 2014
Actual production
60.000
70.000
MW
50.000
40.000
30.000
20.000
10.000
Legend: Uranium Brown Coal Hard Coal GasHydro Wind SolarPumped StorageBiomass
Mo05.05.
Tu06.05.
We07.05.
Th08.05.
Fr09.05.
Sa10.05.
Su11.05.

© Fraunhofer ISE
232
Electricity Production in Germany: Calendar Week 20
Graph: Bruno Burger, Fraunhofer ISE; Data: EEX Transparency Platform
Hyd Bio Uran BC HC Gas PSt Wind Solar min. power (GW) 3.27 7.13 11.69 2.51 2.24 0.05 0.58 0 max. power (GW) 3.82 9.54 15.88 18.6 4.55 3.53 14.72 19.62 weekly energy (TWh) 0.6 0.9 1.42 2.45 2.14 0.48 0.12 0.84 0.92
displayed week: CW 20; 2014
Actual production
60.000
70.000
MW
50.000
40.000
30.000
20.000
10.000
Legend: Uranium Brown Coal Hard Coal GasHydro Wind SolarPumped StorageBiomass
Mo12.05.
Tu13.05.
We14.05.
Th15.05.
Fr16.05.
Sa17.05.
Su18.05.

© Fraunhofer ISE
233
Electricity Production in Germany: Calendar Week 21
Graph: Bruno Burger, Fraunhofer ISE; Data: EEX Transparency Platform
Hyd Bio Uran BC HC Gas PSt Wind Solar min. power (GW) 3.2 6.32 11.51 2.83 1.81 0.06 0.29 0 max. power (GW) 4.17 7.57 14.69 18.03 4.3 3.46 11.86 23.51 weekly energy (TWh) 0.63 0.9 1.24 2.21 2.11 0.43 0.16 0.39 1.19
displayed week: CW 21; 2014
Actual production
60.000
70.000
MW
50.000
40.000
30.000
20.000
10.000
Legend: Uranium Brown Coal Hard Coal GasHydro Wind SolarPumped StorageBiomass
Mo19.05.
Tu20.05.
We21.05.
Th22.05.
Fr23.05.
Sa24.05.
Su25.05.

© Fraunhofer ISE
234
Electricity Production in Germany: Calendar Week 22
Graph: Bruno Burger, Fraunhofer ISE; Data: EEX Transparency Platform
Hyd Bio Uran BC HC Gas PSt Wind Solar min. power (GW) 3.02 7.14 11.21 2.51 1.62 0.04 0.49 0 max. power (GW) 4.19 7.88 16.25 16.43 3.53 3.39 10.45 20.94 weekly energy (TWh) 0.64 0.89 1.3 2.38 1.57 0.38 0.14 0.79 0.83
Legend: Uranium Brown Coal Hard Coal GasHydro Wind SolarPumped StorageBiomass
Mo26.05.
Tu27.05.
We28.05.
Th29.05.
Corpus Christi
Fr30.05.
Sa31.05.
Su01.06.
displayed week: CW 22; 2014
Actual production
60.000
70.000
MW
50.000
40.000
30.000
20.000
10.000

© Fraunhofer ISE
235
Electricity Production in Germany: Calendar Week 23
Graph: Bruno Burger, Fraunhofer ISE; Data: EEX Transparency Platform
Hyd Bio Uran BC HC Gas PSt Wind Solar min. power (GW) 2.95 7.71 11.75 2.49 1.58 0 0.08 0 max. power (GW) 3.84 9.12 15.49 17.13 3.2 2.53 11.82 24.24 weekly energy (TWh) 0.6 0.83 1.47 2.47 1.78 0.35 0.13 0.42 1.26
Legend: Uranium Brown Coal Hard Coal GasHydro Wind SolarPumped StorageBiomass
Mo02.06.
Tu03.06.
We04.06.
Th05.06.
Fr06.06.
Sa07.06.
Su08.06.
displayed week: CW 23; 2014
Actual production
60.000
70.000
MW
50.000
40.000
30.000
20.000
10.000

© Fraunhofer ISE
236
Electricity Production in Germany: Calendar Week 24
Graph: Bruno Burger, Fraunhofer ISE; Data: EEX Transparency Platform
Hyd Bio Uran BC HC Gas PSt Wind Solar min. power (GW) 3.29 8.72 11.14 3.15 1.5 0 0.96 0 max. power (GW) 4.05 10.21 16.32 17.79 4.26 3.61 11.95 23.11 weekly energy (TWh) 0.66 0.83 1.66 2.51 1.65 0.38 0.14 0.59 1.2
Mo09.06.
Whit Monday
Tu10.06.
We11.06.
Th12.06.
Fr13.06.
Sa14.06.
Su15.06.
displayed week: CW 24; 2014
Actual production
60.000
70.000
MW
50.000
40.000
30.000
20.000
10.000
Legend: Uranium Brown Coal Hard Coal GasHydro Wind SolarPumped StorageBiomass

© Fraunhofer ISE
237
Electricity Production in Germany: Calendar Week 25
Graph: Bruno Burger, Fraunhofer ISE; Data: EEX Transparency Platform
Hyd Bio Uran BC HC Gas PSt Wind Solar min. power (GW) 2.47 6.55 10.26 2.43 1.56 0 0.7 0 max. power (GW) 3.93 10.21 17.5 16.63 2.97 2.92 13.68 20.0 weekly energy (TWh) 0.56 0.83 1.59 2.7 1.44 0.35 0.11 1.01 1.06
Mo16.06.
Tu17.06.
We18.06.
Th19.06.
Corpus Christi
Fr20.06.
Sa21.06.
Su22.06.
displayed week: CW 25; 2014
Actual production
60.000
70.000
MW
50.000
40.000
30.000
20.000
10.000
Legend: Uranium Brown Coal Hard Coal GasHydro Wind SolarPumped StorageBiomass

© Fraunhofer ISE
238
Electricity Production in Germany: Calendar Week 26
Graph: Bruno Burger, Fraunhofer ISE; Data: EEX Transparency Platform
Hyd Bio Uran BC HC Gas PSt Wind Solar min. power (GW) 2.76 8.79 14.49 3.3 1.85 0 0.35 0 max. power (GW) 4.05 9.21 16.79 17.71 2.91 2.21 6.46 21.95 weekly energy (TWh) 0.61 0.83 1.54 2.66 2.07 0.42 0.12 0.37 1.03
Mo23.06.
Tu24.06.
We25.06.
Th26.06.
Fr27.06.
Sa28.06.
Su29.06.
displayed week: CW 26; 2014
Actual production
60.000
70.000
MW
50.000
40.000
30.000
20.000
10.000
Legend: Uranium Brown Coal Hard Coal GasHydro Wind SolarPumped StorageBiomass

© Fraunhofer ISE
239
Electricity Production in Germany: Calendar Week 27
Graph: Bruno Burger, Fraunhofer ISE; Data: EEX Transparency Platform
Hyd Bio Uran BC HC Gas PSt Wind Solar min. power (GW) 3.62 8.46 11.96 3.06 1.98 0 0.88 0 max. power (GW) 4.22 9.19 15.97 17.86 3.71 2.94 7.99 23 weekly energy (TWh) 0.66 0.82 1.53 2.43 1.9 0.42 0.12 0.52 1.14
Mo30.06.
Tu01.07.
We02.07.
Th03.07.
Fr04.07.
Sa05.07.
Su06.07.
displayed week: CW 27; 2014
Actual production
60.000
70.000
MW
50.000
40.000
30.000
20.000
10.000
Legend: Uranium Brown Coal Hard Coal GasHydro Wind SolarPumped StorageBiomass

© Fraunhofer ISE
240
Electricity Production in Germany: Calendar Week 28
Graph: Bruno Burger, Fraunhofer ISE; Data: EEX Transparency Platform
Hyd Bio Uran BC HC Gas PSt Wind Solar min. power (GW) 3.61 7.46 7.09 2.83 1.9 0.11 0.95 0 max. power (GW) 4.33 9.03 15.32 16.82 5.35 3.95 8.12 17.42 weekly energy (TWh) 0.69 0.82 1.44 2.13 1.73 0.44 0.13 0.64 0.77
displayed week: CW 28; 2014
Actual production
60.000
70.000
MW
50.000
40.000
30.000
20.000
10.000
Legend: Uranium Brown Coal Hard Coal GasHydro Wind SolarPumped StorageBiomass
Mo07.07.
Tu08.07.
We09.07.
Th10.07.
Fr11.07.
Sa12.07.
Su13.07.

© Fraunhofer ISE
241
Electricity Production in Germany: Calendar Week 29
Graph: Bruno Burger, Fraunhofer ISE; Data: EEX Transparency Platform
Hyd Bio Uran BC HC Gas PSt Wind Solar min. power (GW) 3.45 7.36 12.39 2.41 1.98 0 0.02 0 max. power (GW) 4.16 8.93 16.13 16.44 4.37 3.0 7.92 23.62 weekly energy (TWh) 0.66 0.82 1.35 2.41 1.74 0.47 0.13 0.44 1.2
displayed week: CW 29; 2014
Actual production
60.000
70.000
MW
50.000
40.000
30.000
20.000
10.000
Legend: Uranium Brown Coal Hard Coal GasHydro Wind SolarPumped StorageBiomass
Mo14.07.
Tu15.07.
We16.07.
Th17.07.
Fr18.07.
Sa19.07.
Su20.07.

© Fraunhofer ISE
242
Electricity Production in Germany: Calendar Week 30
Graph: Bruno Burger, Fraunhofer ISE; Data: EEX Transparency Platform
Hyd Bio Uran BC HC Gas PSt Wind Solar min. power (GW) 3.47 6.85 13.03 3.89 1.86 0 0.24 0 max. power (GW) 4.27 7.81 16 16.22 6.09 3.79 9.54 21.34 weekly energy (TWh) 0.68 0.82 1.3 2.49 1.96 0.55 0.12 0.6 0.96
displayed week: CW 30; 2014
Actual production
60.000
70.000
MW
50.000
40.000
30.000
20.000
10.000
Legend: Uranium Brown Coal Hard Coal GasHydro Wind SolarPumped StorageBiomass
Mo21.07.
Tu22.07.
We23.07.
Th24.07.
Fr25.07.
Sa26.07.
Su27.07.

© Fraunhofer ISE
243
Electricity Production in Germany: Calendar Week 31
Graph: Bruno Burger, Fraunhofer ISE; Data: EEX Transparency Platform
Hyd Bio Uran BC HC Gas PSt Wind Solar min. power (GW) 1.9 7.67 11.44 2.3 1.52 0.06 0.21 0 max. power (GW) 3.41 9.15 15.63 17.2 3.37 3.24 5.23 20.17 weekly energy (TWh) 0.52 0.83 1.48 2.39 1.83 0.4 0.12 0.3 0.93
Mo28.07.
Tu29.07.
We30.07.
Th31.07.
Fr01.08.
Sa02.08.
Su03.08.
displayed week: CW 31; 2014
Actual production
60.000
70.000
MW
50.000
40.000
30.000
20.000
10.000
Legend: Uranium Brown Coal Hard Coal GasHydro Wind SolarPumped StorageBiomass

© Fraunhofer ISE
244
Electricity Production in Germany: Calendar Week 32
Graph: Bruno Burger, Fraunhofer ISE; Data: EEX Transparency Platform
Hyd Bio Uran BC HC Gas PSt Wind Solar min. power (GW) 3.13 8.05 9.41 1.32 2.02 0 0.13 0 max. power (GW) 3.59 9.1 15.02 14.23 4.15 4.36 16.84 21.08 weekly energy (TWh) 0.58 0.83 1.49 2.27 1.26 0.5 0.14 0.51 0.98
Mo04.08.
Tu05.08.
We06.08.
Th07.08.
Fr08.08.
Sa09.08.
Su10.08.
displayed week: CW 32; 2014
Actual production
60.000
70.000
MW
50.000
40.000
30.000
20.000
10.000
Legend: Uranium Brown Coal Hard Coal GasHydro Wind SolarPumped StorageBiomass

© Fraunhofer ISE
245
Electricity Production in Germany: Calendar Week 33
Graph: Bruno Burger, Fraunhofer ISE; Data: EEX Transparency Platform
Hyd Bio Uran BC HC Gas PSt Wind Solar min. power (GW) 2.42 7.53 6.09 1.72 1.8 0 0.83 0 max. power (GW) 3.57 10.38 14.91 10.85 4.32 4.19 18.81 17.81 weekly energy (TWh) 0.54 0.83 1.58 2.02 0.89 0.47 0.17 1.13 0.83
Mo11.08.
Tu12.08.
We13.08.
Th14.08.
Fr15.08.
Sa16.08.
Su17.08.
Actual production
60.000
70.000
MW
50.000
40.000
30.000
20.000
10.000
displayed week: CW 33; 2014
Legend: Uranium Brown Coal Hard Coal GasHydro Wind SolarPumped StorageBiomass

© Fraunhofer ISE
246
Electricity Production in Germany: Calendar Week 34
Graph: Bruno Burger, Fraunhofer ISE; Data: EEX Transparency Platform
Hyd Bio Uran BC HC Gas PSt Wind Solar min. power (GW) 1.9 9.33 9.1 1.96 1.96 0.03 1.16 0 max. power (GW) 2.21 10.48 15.34 9.71 4.1 4.31 19.98 19.09 weekly energy (TWh) 0.36 0.83 1.74 2.29 1.01 0.48 0.17 1.18 0.89
Actual production
60.000
70.000
MW
50.000
40.000
30.000
20.000
10.000
displayed week: CW 34; 2014
Legend: Uranium Brown Coal Hard Coal GasHydro Wind SolarPumped StorageBiomass
Mo18.08.
Tu19.08.
We20.08.
Th21.08.
Fr22.08.
Sa23.08.
Su24.08.

© Fraunhofer ISE
247
Electricity Production in Germany: Calendar Week 35
Graph: Bruno Burger, Fraunhofer ISE; Data: EEX Transparency Platform
Hyd Bio Uran BC HC Gas PSt Wind Solar min. power (GW) 1.86 10.01 14.19 2.23 2.13 0.07 0.45 0 max. power (GW) 2.06 11.88 16.88 16.29 4.1 3.49 5.9 21.96 weekly energy (TWh) 0.34 0.83 1.97 2.62 1.65 0.55 0.16 0.36 0.76
Actual production
60.000
70.000
MW
50.000
40.000
30.000
20.000
10.000
displayed week: CW 35; 2014
Legend: Uranium Brown Coal Hard Coal GasHydro Wind SolarPumped StorageBiomass
Mo25.08.
Tu26.08.
We27.08.
Th28.08.
Fr29.08.
Sa30.08.
Su31.08.

© Fraunhofer ISE
248
Electricity Production in Germany: Calendar Week 36
Graph: Bruno Burger, Fraunhofer ISE; Data: EEX Transparency Platform
Hyd Bio Uran BC HC Gas PSt Wind Solar min. power (GW) 1.99 9.05 15.01 3.23 2.3 0.05 0.08 0 max. power (GW) 2.4 11.8 17.56 16.76 7.63 3.72 7.33 18.44 weekly energy (TWh) 0.36 0.87 1.9 2.82 1.87 0.59 0.16 0.38 0.75
Actual production
60.000
70.000
MW
50.000
40.000
30.000
20.000
10.000
displayed week: CW 36; 2014
Legend: Uranium Brown Coal Hard Coal GasHydro Wind SolarPumped StorageBiomass
Mo01.09.
Tu02.09.
We03.09.
Th04.09.
Fr05.09.
Sa06.09.
Su07.09.

© Fraunhofer ISE
249
Electricity Production in Germany: Calendar Week 37
Graph: Bruno Burger, Fraunhofer ISE; Data: EEX Transparency Platform
Hyd Bio Uran BC HC Gas PSt Wind Solar min. power (GW) 1.69 6.94 13.65 3.69 2.32 0 0.66 0 max. power (GW) 2.16 10.54 17.28 17.73 7.12 3.39 10.46 17.42 weekly energy (TWh) 0.33 0.87 1.62 2.69 2.08 0.62 0.15 0.59 0.58
Actual production
60.000
70.000
MW
50.000
40.000
30.000
20.000
10.000
displayed week: CW 37; 2014
Legend: Uranium Brown Coal Hard Coal GasHydro Wind SolarPumped StorageBiomass
Mo08.09.
Tu09.09.
We10.09.
Th11.09.
Fr12.09.
Sa13.09.
Su14.09.

© Fraunhofer ISE
250
Electricity Production in Germany: Calendar Week 38
Graph: Bruno Burger, Fraunhofer ISE; Data: EEX Transparency Platform
Hyd Bio Uran BC HC Gas PSt Wind Solar min. power (GW) 1.65 8.98 13.09 3.39 1.5 0 0.14 0 max. power (GW) 2.07 10.56 17.25 18.3 7.4 3.99 10.73 20.81 weekly energy (TWh) 0.32 0.87 1.72 2.68 1.98 0.56 0.17 0.53 0.73
Actual production
60.000
70.000
MW
50.000
40.000
30.000
20.000
10.000
displayed week: CW 38; 2014
Legend: Uranium Brown Coal Hard Coal GasHydro Wind SolarPumped StorageBiomass
Mo15.09.
Tu16.09.
We17.09.
Th18.09.
Fr19.09.
Sa20.09.
Su21.09.

© Fraunhofer ISE
251
Electricity Production in Germany: Calendar Week 39
Graph: Bruno Burger, Fraunhofer ISE; Data: EEX Transparency Platform
Hyd Bio Uran BC HC Gas PSt Wind Solar min. power (GW) 1.31 10.04 10.97 2.65 2.03 0 0.4 0 max. power (GW) 1.86 10.67 17.19 18.84 7.93 3.98 14.57 18.18 weekly energy (TWh) 0.27 0.86 1.78 2.49 2.04 0.59 0.13 0.89 0.66
Actual production
60.000
70.000
MW
50.000
40.000
30.000
20.000
10.000
displayed week: CW 39; 2014
Legend: Uranium Brown Coal Hard Coal GasHydro Wind SolarPumped StorageBiomass
Mo22.09.
Tu23.09.
We24.09.
Th25.09.
Fr26.09.
Sa27.09.
Su28.09.

© Fraunhofer ISE
252
Electricity Production in Germany: Calendar Week 40
Graph: Bruno Burger, Fraunhofer ISE; Data: EEX Transparency Platform
Hyd Bio Uran BC HC Gas PSt Wind Solar min. power (GW) 1.41 10.4 15.43 2.93 1.75 0 0.06 0 max. power (GW) 2.03 11.93 17.37 19.42 9.6 4.58 9.31 18.69 weekly energy (TWh) 0.28 0.92 1.93 2.79 2.11 0.69 0.15 0.32 0.65
Actual production
60.000
70.000
MW
50.000
40.000
30.000
20.000
10.000
displayed week: CW 40; 2014
Legend: Uranium Brown Coal Hard Coal GasHydro Wind SolarPumped StorageBiomass
Mo29.09.
Tu30.09.
We01.10.
Th02.10.
Fr03.10.
German Unification Day
Sa04.10.
Su05.10.

© Fraunhofer ISE
253
Electricity Production in Germany: Calendar Week 41
Graph: Bruno Burger, Fraunhofer ISE; Data: EEX Transparency Platform
Hyd Bio Uran BC HC Gas PSt Wind Solar min. power (GW) 1.15 11.52 15.75 3.61 2.3 0 0.47 0 max. power (GW) 1.54 11.96 17.93 19.54 6.56 4.21 18.73 13.09 weekly energy (TWh) 0.24 0.95 2.01 2.84 2.04 0.56 0.15 1.08 0.45
Actual production
60.000
70.000
MW
50.000
40.000
30.000
20.000
10.000
displayed week: CW 41; 2014
Legend: Uranium Brown Coal Hard Coal GasHydro Wind SolarPumped StorageBiomass
Mo06.10.
Tu07.10.
We08.10.
Th09.10.
Fr10.10.
Sa11.10.
Su12.10.

© Fraunhofer ISE
254
Electricity Production in Germany: Calendar Week 42
Graph: Bruno Burger, Fraunhofer ISE; Data: EEX Transparency Platform
Hyd Bio Uran BC HC Gas PSt Wind Solar min. power (GW) 0.81 9.63 11.27 2.31 1.29 0 1.21 0 max. power (GW) 1.55 11.97 18.74 19.64 10.06 4.24 17.65 17.69 weekly energy (TWh) 0.22 0.95 2.0 2.99 2.21 0.74 0.14 0.71 0.48
Actual production
60.000
70.000
MW
50.000
40.000
30.000
20.000
10.000
displayed week: CW 42; 2014
Legend: Uranium Brown Coal Hard Coal GasHydro Wind SolarPumped StorageBiomass
Mo13.10.
Tu14.10.
We15.10.
Th16.10.
Fr17.10.
Sa18.10.
Su19.10.

© Fraunhofer ISE
255
Electricity Production in Germany: Calendar Week 43
Graph: Bruno Burger, Fraunhofer ISE; Data: EEX Transparency Platform
Hyd Bio Uran BC HC Gas PSt Wind Solar min. power (GW) 1.14 9.07 8.76 3.13 1.96 0 1.6 0 max. power (GW) 2.19 12.02 19.4 23.91 7.12 4.62 21.46 11.54 weekly energy (TWh) 0.31 0.96 2.01 2.88 2.2 0.6 0.13 1.35 0.3
Actual production
60.000
70.000
MW
50.000
40.000
30.000
20.000
10.000
displayed week: CW 43; 2014
Legend: Uranium Brown Coal Hard Coal GasHydro Wind SolarPumped StorageBiomass
Mo20.10.
Tu21.10.
We22.10.
Th23.10.
Fr24.10.
Sa25.10.
Su26.10.

© Fraunhofer ISE
256
Electricity Production in Germany: Calendar Week 44
Graph: Bruno Burger, Fraunhofer ISE; Data: EEX Transparency Platform
Hyd Bio Uran BC HC Gas PSt Wind Solar min. power (GW) 1.21 10.91 13.55 2.82 3.01 0 0.31 0 max. power (GW) 2.33 11.99 19.82 22.65 9.86 4.36 11.51 13.99 weekly energy (TWh) 0.33 0.97 2 3.09 2.3 0.82 0.15 0.65 0.4
Actual production
60.000
70.000
MW
50.000
40.000
30.000
20.000
10.000
displayed week: CW 44; 2014
Legend: Uranium Brown Coal Hard Coal GasHydro Wind SolarPumped StorageBiomass
Mo27.10.
Tu28.10.
We29.10.
Th30.10.
Fr31.10.
Sa01.11.
All Saints' Day
Su02.11.
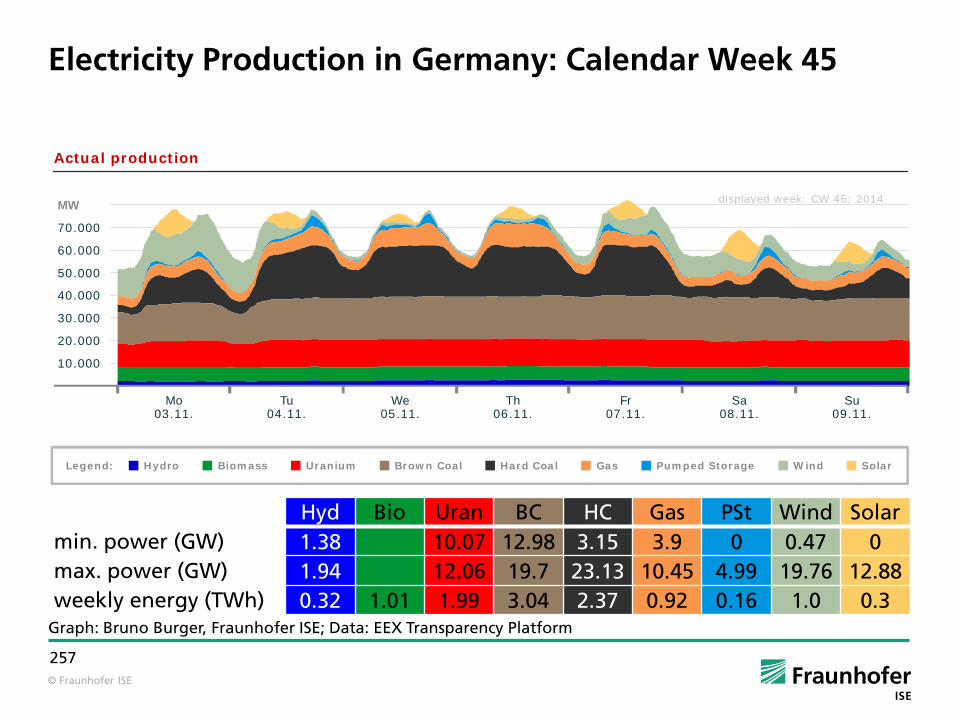
© Fraunhofer ISE
257
Electricity Production in Germany: Calendar Week 45
Graph: Bruno Burger, Fraunhofer ISE; Data: EEX Transparency Platform
Hyd Bio Uran BC HC Gas PSt Wind Solar min. power (GW) 1.38 10.07 12.98 3.15 3.9 0 0.47 0 max. power (GW) 1.94 12.06 19.7 23.13 10.45 4.99 19.76 12.88 weekly energy (TWh) 0.32 1.01 1.99 3.04 2.37 0.92 0.16 1.0 0.3
Actual production
60.000
70.000
MW
50.000
40.000
30.000
20.000
10.000
displayed week: CW 45; 2014
Legend: Uranium Brown Coal Hard Coal GasHydro Wind SolarPumped StorageBiomass
Mo03.11.
Tu04.11.
We05.11.
Th06.11.
Fr07.11.
Sa08.11.
Su09.11.

© Fraunhofer ISE
258
Electricity Production in Germany: Calendar Week 46
Graph: Bruno Burger, Fraunhofer ISE; Data: EEX Transparency Platform
Hyd Bio Uran BC HC Gas PSt Wind Solar min. power (GW) 0.37 10.94 14.8 4.95 2.88 0.01 0.06 0 max. power (GW) 2.16 12.05 19.82 24.89 9.0 3.79 9.99 7.04 weekly energy (TWh) 0.34 1.01 2.03 3.12 2.82 0.81 0.18 0.78 0.17
Actual production
60.000
70.000
MW
50.000
40.000
30.000
20.000
10.000
displayed week: CW 46; 2014
Legend: Uranium Brown Coal Hard Coal GasHydro Wind SolarPumped StorageBiomass
Mo10.11.
Tu11.11.
We12.11.
Th13.11.
Fr14.11.
Sa15.11.
Su16.11.

© Fraunhofer ISE
259
Electricity Production in Germany: Calendar Week 47
Graph: Bruno Burger, Fraunhofer ISE; Data: EEX Transparency Platform
Hyd Bio Uran BC HC Gas PSt Wind Solar min. power (GW) 0.97 11.26 16.49 4.2 3.32 0.02 0.11 0 max. power (GW) 2.07 12.2 19.54 23.72 12.66 3.54 12,0 9.11 weekly energy (TWh) 0.34 1.01 2.03 3.07 2.88 1.06 0.16 0.58 0.19
Actual production
60.000
70.000
MW
50.000
40.000
30.000
20.000
10.000
displayed week: CW 47; 2014
Legend: Uranium Brown Coal Hard Coal GasHydro Wind SolarPumped StorageBiomass
Mo17.11.
Tu18.11.
We19.11.
Th20.11.
Fr21.11.
Sa22.11.
Su23.11.

© Fraunhofer ISE
260
Electricity Production in Germany: Calendar Week 48
Graph: Bruno Burger, Fraunhofer ISE; Data: EEX Transparency Platform
Hyd Bio Uran BC HC Gas PSt Wind Solar min. power (GW) 1.17 9.02 15.1 5.37 3.43 0 1.07 0 max. power (GW) 1.86 12.52 18.93 23.83 10.35 4.18 15.28 6.23 weekly energy (TWh) 0.31 1.01 1.97 2.96 2.65 0.99 0.17 1.36 0.15
Actual production
60.000
70.000
MW
50.000
40.000
30.000
20.000
10.000
displayed week: CW 48; 2014
Legend: Uranium Brown Coal Hard Coal GasHydro Wind SolarPumped StorageBiomass
Mo24.11.
Tu25.11.
We26.11.
Th27.11.
Fr28.11.
Sa29.11.
Su30.11.

© Fraunhofer ISE
261
Electricity Production in Germany: Calendar Week 49
Graph: Bruno Burger, Fraunhofer ISE; Data: EEX Transparency Platform
Hyd Bio Uran BC HC Gas PSt Wind Solar min. power (GW) 1.4 11.44 15.36 5.81 4.52 0.01 0.65 0 max. power (GW) 2.02 12.11 18.43 23.85 17.36 4.19 15.43 3.13 weekly energy (TWh) 0.35 1.0 2.04 2.91 3.19 1.52 0.19 0.73 0.06
Actual production
60.000
70.000
MW
50.000
40.000
30.000
20.000
10.000
displayed week: CW 49; 2014
Legend: Uranium Brown Coal Hard Coal GasHydro Wind SolarPumped StorageBiomass
Mo01.12.
Tu02.12.
We03.12.
Th04.12.
Fr05.12.
Sa06.12.
Su07.12.

© Fraunhofer ISE
262
Electricity Production in Germany: Calendar Week 50
Graph: Bruno Burger, Fraunhofer ISE; Data: EEX Transparency Platform
Hyd Bio Uran BC HC Gas PSt Wind Solar min. power (GW) 0.86 7.92 13.02 5.9 4.13 0 1.45 0 max. power (GW) 1.58 11.97 19.55 22.4 14.81 4.39 29.69 5.83 weekly energy (TWh) 0.23 1.0 1.79 2.67 2.43 1.09 0.14 2.18 0.12
Actual production
60.000
70.000
MW
50.000
40.000
30.000
20.000
10.000
displayed week: CW 50; 2014
Legend: Uranium Brown Coal Hard Coal GasHydro Wind SolarPumped StorageBiomass
Mo08.12.
Tu09.12.
We10.12.
Th11.12.
Fr12.12.
Sa13.12.
Su14.12.

© Fraunhofer ISE
263
Electricity Production in Germany: Calendar Week 51
Graph: Bruno Burger, Fraunhofer ISE; Data: EEX Transparency Platform
Hyd Bio Uran BC HC Gas PSt Wind Solar min. power (GW) 0.27 6.57 7.35 2.96 3.65 0.01 5.32 0 max. power (GW) 1.48 12.08 19.93 21.65 12.34 3.27 27.68 4.6 weekly energy (TWh) 0.12 1.0 1.86 2.49 1.95 0.95 0.15 2.82 0.09
Actual production
60.000
70.000
MW
50.000
40.000
30.000
20.000
10.000
displayed week: CW 51; 2014
Legend: Uranium Brown Coal Hard Coal GasHydro Wind SolarPumped StorageBiomass
Mo15.12.
Tu16.12.
We17.12.
Th18.12.
Fr19.12.
Sa20.12.
Su21.12.

© Fraunhofer ISE
264
Electricity Production in Germany: Calendar Week 52
Graph: Bruno Burger, Fraunhofer ISE; Data: EEX Transparency Platform
Hyd Bio Uran BC HC Gas PSt Wind Solar min. power (GW) 0.19 8.34 5.98 2.71 3.73 0.02 0.84 0 max. power (GW) 0.38 12.06 18.58 10.34 7.63 3.95 28.85 4.45 weekly energy (TWh) 0.08 1.0 1.95 1.98 0.96 0.85 0.16 2.68 0.11
Actual production
60.000
70.000
MW
50.000
40.000
30.000
20.000
10.000
displayed week: CW 52; 2014
Legend: Uranium Brown Coal Hard Coal GasHydro Wind SolarPumped StorageBiomass
Mo22.12.
Tu23.12.
We24.12.
Christmas Eve
Th25.12.
Christmas Day
Fr26.12.
Boxing Day
Sa27.12.
Su28.12.

© Fraunhofer ISE
265
AGENDA
Annual energies
Monthly energies
Weekly energies
Daily energies
Annual power curves
Monthly power curves
Weekly power curves
Exemplary daily power curves

© Fraunhofer ISE
266
Date of maximum total and peak solar power production (in GW and GWh): Friday 6th of June
Graph: Bruno Burger, Fraunhofer ISE; Data: EEX Transparency Platform
min. power max. power daily energy
Solar 0 GW 24.2 GW 212 GWh
Wind 0.75 GW 4.5 GW 65 GWh
Conventional > 100 MW 33.3 GW 42.1 GW 934 GWh
00 02 04 06 08 10 12 14 16 18 20 22
60,000
50,000
40,000
30,000
20,000
10,000
h
MW06.06.2014
Actual production

© Fraunhofer ISE
267
Date of maximum total and peak wind power production (in GW and GWh): Friday 12th of December
Graph: Bruno Burger, Fraunhofer ISE; Data: EEX Transparency Platform
min. power max. power daily energy
Solar 0 GW 4.9 GW 20 GWh
Wind 19.0 GW 29.7 GW 562 GWh
Conventional > 100 MW 34.0 GW 44.5 GW 935 GWh
00 02 04 06 08 10 12 14 16 18 20 22
60,000
50,000
40,000
30,000
20,000
10,000
h
MWday: 12.12.2014
Actual production

© Fraunhofer ISE
268
Date of maximum peak wind plus solar power production (in GW): Monday 14th of April
Graph: Bruno Burger, Fraunhofer ISE; Data: EEX Transparency Platform
min. power max. power daily energy
Solar 0 GW 14.3 GW 107 GWh
Wind 8.7 GW 23.9 GW 454 GWh
Conventional > 100 MW 29.3 GW 38.8 GW 823 GWh
00 02 04 06 08 10 12 14 16 18 20 22
60,000
50,000
40,000
30,000
20,000
10,000
h
MW
Actual production
day: 14.04.2014 Maximum power
Solar + Wind = 37,8 GW

© Fraunhofer ISE
269
Date of maximum total and peak conventional power production (in GW and GWh): Wednesday 3rd of Decemb.
Graph: Bruno Burger, Fraunhofer ISE; Data: EEX Transparency Platform
min. power max. power daily energy
Solar 0 GW 1.23 GW 5.5 GWh
Wind 0.96 GW 1.84 GW 31.2 GWh
Conventional > 100 MW 48.3 GW 63.8 GW 1371 GWh
00 02 04 06 08 10 12 14 16 18 20 22
60,000
50,000
40,000
30,000
20,000
10,000
h
MWday: 03.12.2014
Actual production

© Fraunhofer ISE
270
Changes in 2014
Run of River and pumped storage with natural feeder were summarized for hydropower.
Biomass was added. It includes the production of solid biogenic substances, liquid biogenic materials, biogas, sewage gas, landfill gas and the biogenic share of waste.

© Fraunhofer ISE
271
Thank you for your Attention!
Fraunhofer Institute for Solar Energy Systems ISE
Prof. Dr. Bruno Burger
www.ise.fraunhofer.de